Embed Size (px)
Citation preview
ANALYIS OF THE 2010 NATIONAL BUDGET AND ECONOMIC POLICY
STATEMENT OF THE GOVERNMENT OF GHANA TO DETERMINE GAPS AND
OPPORTUNITIES FOR WOMEN AND CHILDREN
MARCH 2010
ISODEC-UNICEF Collaboration

2
Table of Contents Page
EXECUTIVE SUMMARY .......................................................................................................................... 6
CHAPTER ONE ........................................................................................................................................... 8
1.0 Introduction ......................................................................................................................................... 8
1.1 Macroeconomic Overview and Analysis ............................................................................................ 9
1.2.0 Forthcoming Medium Term Development Framework and the Selected Sectors (Education,
Health, Water and Sanitation; and Social Welfare and Social Protection) ............................................. 10
1.2.1 Education ....................................................................................................................................... 10
1.2.2 Health ............................................................................................................................................. 11
1.2.3 Water and Sanitation ...................................................................................................................... 11
1.2.4 Social Welfare and Social Protection ............................................................................................. 12
CHAPTER TWO: EDUCATION SECTOR ANALYSIS .......................................................................... 14
2.0 Introduction ....................................................................................................................................... 14
2.1 Education Financing: Trends in education sector budget and expenditure ....................................... 14
2.2 Composition of allocations and expenditure in education sector budget .......................................... 16
2.3 Geographical distribution of allocations and actual expenditures .................................................... 17
2.4 Policy initiatives in the 2010 education budget ................................................................................ 20
CHAPTER THREE: HEALTH SECTOR ANALYSIS ............................................................................. 22
3.0 Introduction ....................................................................................................................................... 22
3.1 Health Sector Financing for 2010 ..................................................................................................... 22
3.2 Key Women and Children Related Programmes in the 2010 Budget ......................................... 23
3.2.1 Child Health and Nutrition ............................................................................................................. 24
3.2.2 Mortality in Ghana ......................................................................................................................... 24
3.2.3 Maternal Mortality ......................................................................................................................... 25
3.3 Budget Space for Children and Women Health ................................................................................ 25

3
3.4 Poverty Reduction Spending on Primary Health Care ...................................................................... 26
CHAPTER FOUR: WATER AND SANITATION .................................................................................... 28
4.0 Introduction ....................................................................................................................................... 28
4.1 The 2010 Budget and Allocations to the Ministry of Water Resources Works and Housing ........... 28
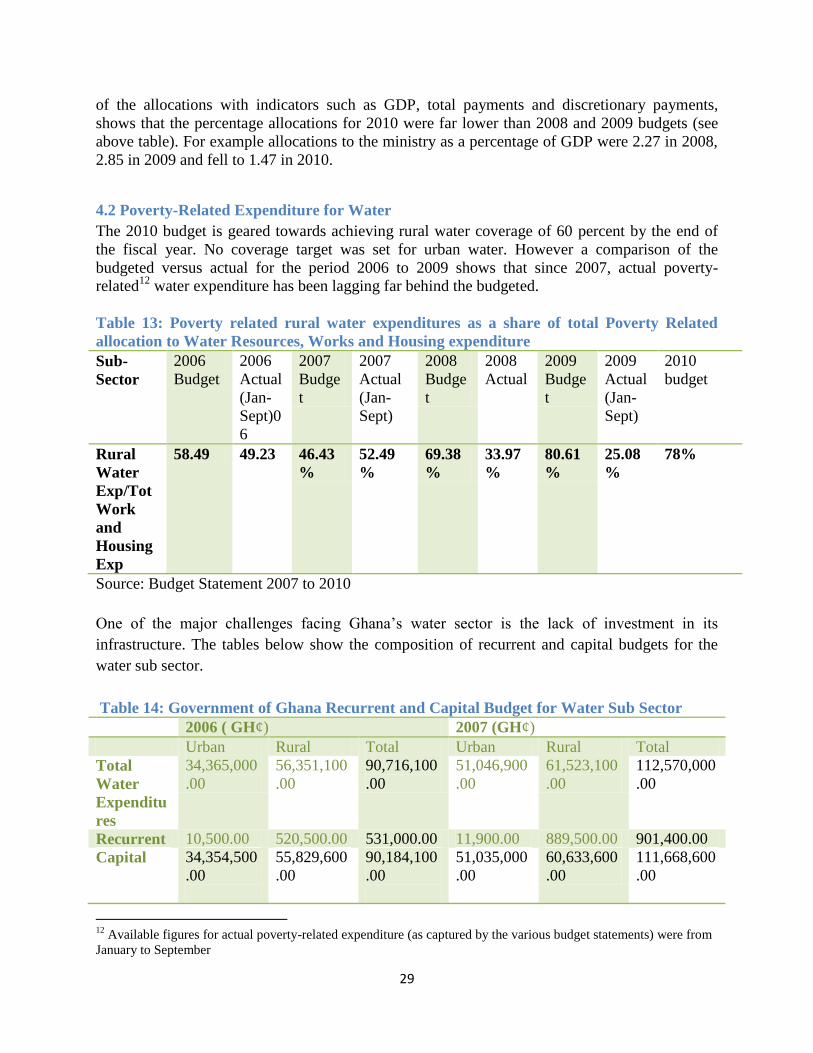
4.2 Poverty-Related Expenditure for Water ............................................................................................ 29
4.3 Urban Water Supply ......................................................................................................................... 30
4.4 Rural Water Provisioning ................................................................................................................. 31
Source: Actual expenditure of CWSA from 2006 to 2008 ..................................................................... 32
4.5 Specific Programmes for Water and Sanitation in 2010 Budget ...................................................... 32
CHAPTER FIVE: SOCIAL PROTECTION AND SOCIAL WELFARE AND THE 2010 BUDGET ..... 34
5.0 Introduction ....................................................................................................................................... 34
5.1 Social Protection Programmes in the Ghanaian Economy ............................................................... 34
5.2 Social Protection and the 2010 Budget ............................................................................................. 35
5.3 Budgetary Allocations to the Ministry of Employment and Social Welfare and the Ministry of
Women and Children Affairs .................................................................................................................. 35
5.4 Allocations to the Department of Social Welfare ............................................................................. 36
CHAPTER SIX: COMPARISON OF BUDGET LINE ITEMS OF KEY MDAs ................................. 40
6.0 Introduction ....................................................................................................................................... 40
6.1 The Concept of Allocative and Operational Efficiency ................................................................ 40
6.2 Trends in spending by Line item (recurrent and capital expenditure) .............................................. 40
6.2.1 Education and Health Sectors .................................................................................................... 40
6.2.2 Employment and Social Welfare ............................................................................................... 42
6.2.3 Trends in GoG Allocations to Investment and Services ............................................................ 42
6.2.4 Allocation and Expenditure for 2008 Education Budget Compared .......................................... 43
6.3.5 Allocation and expenditure for 2008 health budget compared .................................................. 44
7.0 Conclusion and Recommendations ....................................................................................................... 46
4
REFERENCES ....................................................................................................................................... 48
List of Tables Page
Table 1: Summary of Actual Education Expenditure (2006-2008) ............................................. 14
Table 2: Summary of Education Budget and Expenditure (2008-2010) ...................................... 14
Table 3: User Fees in the Education Sector (In millions of GH¢) ................................................ 15
Chart 3: User Fees in the Education Sector .................................................................................. 15
Table 4: Trends in regional allocation and expenditure: basic education .................................... 17
Table 5: Per Pupil Actual Spending by Region at the Basic Level (2006 – 2009) in Ghana cedis
....................................................................................................................................................... 19
Table 6: Health Expenditure for 2006-2010 ................................................................................. 23
Table 7: Functional CHPS Zones in the Country ......................................................................... 23
Table 8: under-five mortality in Ghana ........................................................................................ 25
Table 9: Increase in Health User Fees (GH¢ million) .................................................................. 26
Table 10: Poverty Reduction Spending on Primary Health Care ................................................. 27
Table 11: Allocation to Ministry of Water Resources Works and Housing (2008 – 2010) ......... 28
Table 12: Poverty related rural water expenditures as a share of total Poverty Related allocation
to Water Resources, Works and Housing expenditure ................................................................. 29
Table 13: Government of Ghana Recurrent and Capital Budget for Water Sub Sector ............... 29
Table 14: Government of Ghana Recurrent and Capital Budget for Water Sub Sector ............... 30
Table 15: Government of Ghana Recurrent and Capital Budget for Water Sector (in Percentage)
....................................................................................................................................................... 30
Table 19: GoG allocations to the MWWH by line item .............................................................. 32
Table 20: Allocations to Ministry of Woman and Children Affairs and the Ministry of
Employment and Social Welfare .................................................................................................. 36
Table 22 : Percentage of Actual Release to Budgeted for the Department of Social Welfare .... 37

5
Table 23: Regional Breakdown of 2010 Budgetary Allocation for the Department of Social
Welfare (GH¢) .............................................................................................................................. 37
List of Figures
Figure 1: Trends in percentage of total expenditure fro each level .............................................. 17
Figure 2: Trends in Child mortality in Ghana ............................................................................... 25
Figure 3: Composition of Actual Expenditure for Ghana Water Company Limited .................... 31
Figure 4: Actual Expenditure of CWSA from 2006 to 2008 ........................................................ 31
Figure 5: Budgeted and Actual Releases to the Department of Social Welfare from for 2007 and
2008............................................................................................................................................... 37
Figure 6: GOG Allocations to Personnel Emolument .................................................................. 41
Figure 7: Central Government Allocation to Investment and services ......................................... 43
Figure 8: Deviations between allocations and expenditure in 2008-Ministry of Education: ....... 44
Figure 9: Deviation between allocation and expenditure for MOH budget in 2008 .................... 45

6
EXECUTIVE SUMMARY
This analysis of the 2010 national budget looks at the gaps and opportunities for promoting
women and children rights through the budget. Sectors considered for the analysis include
Education, Health, Water and Sanitation, Social Protection and Social Welfare because of their
critical roles in promoting the rights of women and children. The national budget remains the
most important document through which policies and programmes are executed by governments
and an analysis of the budget reveals government‟s commitment to achieving the rights of
children and women in the country. The analysis adopted a rights based framework drawing on
key policy documents such as the forthcoming Medium Term Development Framework
(MTDF), the Constitution of Ghana and international conventions of which Ghana has signed
onto and ratified.
A good macroeconomic framework is fundamental for promoting rights of women and children.
For instance the projected real GDP growth rate of 6.5 percent, as indicated in the 2010 budget,
is commendable but the quality of the growth and the sector in which the growth is generated is
crucial. Also, Government‟s target of inflation for the year is an average inflation of less than
10.5 percent and end period inflation of 9.2 percent. There is a trade-off between inflation and
unemployment.
The education sector analysis reveals that in the year 2008, the Ministry of Education overspent
its overall budget by about 37.5 percent. A breakdown of the components of the budget indicates
that expenditure from Government of Ghana (GoG) funds1 shot up by about 38.5 percent of the
budget in 2008. The development perhaps indicates that there was an attempt on the part of
government to shield the education sector from the impact of the economic crisis. Analysis of
the amount spent by economic - line - item also shows that there was a budget overrun with
respect to payment of wages and salaries. Government spent approximately 96 percent of the
GoG funds on wages and salaries as against a planned 91 percent. Regional allocations showed
that the highest and lowest beneficiaries of the basic education spending per child for the period
2006 to 2009 were consistently Greater Accra and Volta regions respectively.
Also the health sector analysis reveals that health expenditure as a percentage of a number of
budget indicators such as GDP, total payments, total discretionary expenditure, among others,
has been falling over the years. The situation is not different for the 2010 budget and calls for
government attention to the health sector for the required level of services and investments to be
provided.
Again, the analysis reveals that not only do most of the Community-Based Health Planning and
Services (CHIPS) functional zones lack basic facilities like electricity, but also the functional
zones are not commensurate with the population in the district. In order to bridge the regional
disparity in accessing health care, there is also the need for Government to improve maternal and
1 Government of Ghana (GoG) funds constituted about 70% of the total education sector financing in 2008
7
child health in areas with fewer facilities. The 2010 budgetary statement about the establishment
of a new ambulance station in every district is very laudable idea, nonetheless, government
should make this a priority in rural areas especially.
Furthermore, it was observed that Primary Health Care (PHC) expenditure takes the highest
portion of total health expenditure. For instance actual 2007 PHC spending was 50.90 percent,
more than half of total health expenditure. However this rate has reduced over the years.
For Water and sanitation the 2010 budget is geared towards achieving rural water coverage of 60
percent by the end of the fiscal year. No coverage target was set for urban water provision.
However a comparison of the budgeted versus actual for the period 2006 to 2009 shows that
since 2007, actual poverty-related water expenditure has been lagging far behind the budgeted.
One of the major challenges facing Ghana‟s water sector is the lack of investment in its
infrastructure.
The analysis shows that allocations to the Ministry of Employment and Social Welfare (MESW)
and Ministry of Woman and Children Affairs (MOWAC) for 2010 saw a drop from the 2009
budgeted figure. The former‟ budget dropped by over 10 percent whiles the latter saw a
marginal drop of about 0.3 percent in nominal terms. Furthermore, assessing the allocations to
MOWAC and MESW with budget indications such as GDP, total payments and total discretional
payments shows a drop in all cases for the two ministries for the 2010 budget as compared to the
2009 budget.
The analysis calls for equity in terms of sectoral (education, health, water and sanitation etc) and
regional allocations to ensure balanced development of the country. To a significant extent, the
2010 budget statement reflects the issues that have been raised in the MTDF. The challenge lies
with the implementation of these programmes and also effective monitoring of the process to
ensure that the objectives of these programmes are achieved.

8
CHAPTER ONE
1.0 Introduction
On November 18th 2009, the Minister of Finance and Economic Planning presented the 2010
Budget Statement and Economic Policy to Parliament on behalf of the President as required by
the Constitution of Ghana. The budget was presented at a time the world economy was
recovering from the food, energy and financial crises that had engulfed the globe in 2007/2008.
This analysis looks at gaps and opportunities for women and children within the 2010 national
budget. Sectors considered for the analysis include Education, Health, Water and Sanitation,
Social Protection and Social Welfare. The national budget remains the most important document
through which policies and programmes are executed by governments and an analysis of the
budget reveals government‟s commitment to achieving the rights of children and women in the
country. With barely five years to the Millennium Development Goals (MDGs) deadline, there is
the need to examine government‟s efforts towards the realization of these goals. Ghana‟s
achievement of the MDGs holds the potential for transforming the lives of most women and
children in the country.
The food crisis, as mentioned above, sparked a number of protests in some countries. Some of
these countries include Burkina Faso, Cote d‟Ivoire, Haiti, and Bangladesh, just to mention a
few. The rising food prices eroded the ability of families to make a decent living. The energy
crisis has also increased the need for alternative sources of energy. As a result of this, there is an
increased demand for arable lands for the cultivation of crops for bio-fuel. This has a number of
implications for poverty reduction. Some of the implications are: increased vulnerability for
households that are food insecure, unemployment, malnutrition. Over the years investment in
agriculture has been low and reducing, according to the 2008 World Development Report.
Public spending on agriculture, according to the World Bank, as a share of gross domestic
product (GDP) in agriculture-based countries (mostly in Sub-Saharan Africa) was significantly
less than (4 percent in 2004) in the transforming countries (mostly in Asia); during the
agricultural growth spurt in the 1980s (10 percent). According to the Bank, current levels of
agricultural spending in Sub-Saharan Africa are insufficient for sustained growth.
The implication of these for development globally and the sub region are enormous. The
financial meltdown led to a weak aggregate demand and hence less demand for exports.
Fortunately for Ghana unlike most commodity prices, the price of cocoa moved sharply upwards
from the first quarter of 2009 at an average price of US$2,597 per tonne to US$3,360 in October
2009. The price surge appears to be driven by a shortfall in production in Cote d‟Ivoire; the
world‟s largest producer according to the National Budget Statement for 2010. However, there
has been a fall in remittances and investment which has implication for poverty reduction in the
country2.
2 National Budget Statement for 2010

9
1.1 Macroeconomic Overview and Analysis
In the light of the above, a macroeconomic framework should aim at mitigating the challenges
posed by developments at the global and regional levels. Also, government should work towards
maximizing returns on investments or protecting the vulnerable from these external shocks. Key
variables in macroeconomic analysis are: inflation, unemployment, Gross Domestic Product and
its rate of growth, deficits and gross international reserves. In 2009 the following were the targets
for the government: a real GDP of 5.9 percent, an average inflation of 15.3 percent which was
revised by the Bank of Ghana to 19.1 percent. Also an end period of inflation of 12.5 was also
revised to 14.5 percent. An overall budget deficit equivalent to 9.4 percent of GDP was targeted.
Performance on the macroeconomic front was mixed in 2009. According to the Ghana Statistical
Service, the actual GDP growth rate by September 2009 was 4.7 percent. This fell short of the
5.9 percent target. However the growth rate achieved was higher than the average in most Sub-
Saharan African countries, which was projected to be around 1.1 percent (Budget statement for
Ghana, 2010). End-period inflation declined from a peak of 20.6 in April to 18.0 percent by
October 2009. Gross international reserves rose from US$2,036.2 million at the end of 2008 to
US$2,317.1 million at the end of September 2009. This translates into a 2.4 months cover for
imports of goods and services.
The following macroeconomic targets were outlined in the 2010 budget and economic policy
statement of the Government of the Ghana:
A real GDP growth rate of 6.5 percent
An average inflation of less than 10.5 percent
End of period inflation of 9.2 percent
Gross international reserves of not less than 2.5 months of import cover for goods and
services.
The impact of macroeconomic policies on women and children are varied. A real GDP growth
rate of 6.5 percent is commendable but as already pointed out the quality of the growth and the
sector in which the growth is generated is crucial. Most women are engaged in the informal
sector like agriculture and petty trading. Investment in agriculture has the potential to increase
food security. However, when growth is driven by the mining sector, among others, it can lead to
jobless growth. The importance of the agriculture sector was emphasized by the Word Bank in
its World Development Report for 2008. The Bank drew the world‟s attention to the importance
of agriculture because of its special features for poverty reduction in Africa.
Also the government‟s target of inflation for the year is an average inflation of less than 10.5
percent and end period inflation of 9.2 percent. There is a trade-off between inflation and
unemployment. Achieving low inflation has normally meant cuts in government expenditures in
some sectors which have effects on employment and poverty reduction. It must be stated that the

10
macroeconomic fundamentals are necessary requirements but not sufficient for growth. Efforts
must be made by Government to ensure equity in resource allocation to stimulate growth in the
pro-poor sectors.
1.2.0 Forthcoming Medium Term Development Framework and the Selected Sectors
(Education, Health, Water and Sanitation; and Social Welfare and Social Protection)
In undertaking budget analysis, one of the criteria in assessing budgets is its consistency with
other policy documents. The budget, which is the rolling annual plan, should interact well with
the medium term development framework and other national documents such as the
Constitution. Needless to say the medium term development framework should be informed by a
long term development framework or a perspective plan. This portion of the analysis looks at
how the policy matrix of the forth coming Medium Term Development Framework relates with
the annual work programmes of the sectors mentioned above.
1.2.1 Education
In the 2010 budget the focus of Government is on the implementation of the Education Strategic
Plan developed under the Ghana Poverty Reduction Strategy (GPRS II)3. This Plan has areas
which are of importance in ensuring quality education for children. The plan, among other
things, seeks to address the challenges in management, structure and content of education in
Ghana. In terms of the interaction between the forthcoming Policy Matrix of the National
Development Planning Commission (NDPC) and the sector programmes it can be stated that it is
satisfactory. This is so because most of the strategies outlined in the policy matrix are reflected
in the budget statement.
At the preschool level, government indicated that it intends to construct 200 No. 3 - Unit
Classroom Blocks with ancillary facilities. According to the 2010 budget this will be done in
collaboration with District Assemblies and other non-state actors. This reflects the strategies
outlined in the Policy Matrix outlined by NDPC in its forthcoming Medium Term Development
Framework (MTDF). The policy matrix states, among other things, of accelerating the
integration of pre-school education into the FCUBE programme. It also intends to strengthen
enrollment drives in communities and collaborate with the private sector to ensure school
enrollment. All these are reflected in the National Budget Statement.
At the primary and Junior High School levels, the government can be commended for the high
level of consistency and clarity of objectives in its programmes. The provision of school
uniforms in public schools especially in deprived communities is highly commendable. The
policy by Government to award the contracts under this programme to local companies goes
further to provide employment for people especially women who are involved in the production
3 A new plan ESP 2010 – 2020 is being reviewed by the current government
11
of cotton for the local industry. Other social programmes such as the school feeding programmes
will help increase enrollments and also provide market avenues for local producers provided
procurements follow the dictates of the policy thrust of the school feeding programme. Mention
can also be made of the free exercise books for all public schools and the provision of basic
schools with water and sanitation facilities.
One important issue of concern is the persistent gender disparities in school enrollment and
geographical disparity in access to quality education. The policy objective under this issue,
according to the MTDF, is to bridge the gender gap in access to education. In the 2010 budget,
government intends to provide financial support to gender related activities to increase the
enrolment and retention of pupils especially the girl child. The education sector is further
discussed in chapter two.
1.2.2 Health
The Goal 4 and 5 of the Millennium Development Goals seek to reduce child mortality and
improve maternal health respectively. The MTDF acknowledges gaps in access to health care
between urban and rural as well as the rich and poor. These have implications for poverty
reduction. The policy objective of Government then should be to improve maternal health and
reduce child mortality and also address the imbalances in terms of health care delivery. In year
2010 Government intends to continue with improvement of health outcomes by channeling
resources in the following areas: malnutrition, emergency services, private sector collaboration
and the National Health Insurance Scheme. Other areas are primary health care and integrated
health planning at the district levels.
The policy of addressing malnutrition forms part of efforts at achieving the MDGs in Ghana.
Essential nutrition actions will be implemented in all regions with emphasis on complementary
and supplementary feeding of infants, children, pregnant women, nursing mothers and People
Living with HIV/AIDS (PLHIV). Technical support will also be provided to enhance the
nutritional aspect of the School Feeding Programme (Budget Statement 2010). All these
programs are consistent with the policy matrix of MTDF. The critical area of engagement will be
the monitoring of these programmes to ensure that they are well implemented to improve the
health of women and children.
1.2.3 Water and Sanitation
Water and Sanitation are key ingredients in integrated human development. Goal 7 of the MDGs
calls for improvement in the delivery of water to citizens of states party to the Millennium
Declaration in 2000. Addressing water and sanitation challenges through the national budget
process is crucial and calls for a change at the policy level that will increase the budget allocation
for water and sanitation activities.
The issues of water and sanitation are captured in the MTDF. Currently the issue identified is the
inadequate access to sanitation facilities and the poor service delivery. The policy objective will
be to accelerate the provision of adequate sanitation in the country within the next four years.
12
According to the MTDF some of the strategies that will be used are: promoting the construction
of and use of low cost domestic latrines, enforce laws on the provision of sanitation facilities by
landlords and landladies and also integrate hygiene education into water and sanitation delivery.
The 2010 budget intends to improve upon the water coverage. For instance the budget states that
for Government to achieve the target of 60.0 per cent rural water coverage in the year 2010, the
focus will be on increasing the provision of safe and potable water in rural communities through
sinking boreholes and also training water and sanitation committees, District Water and
Sanitation Teams.
1.2.4 Social Welfare and Social Protection
Social welfare and social protection are very crucial in ensuring that all citizens participate in the
national life of the country especially the vulnerable and socially excluded. Social protection is a
component of social development and it looks at both the absolute and vulnerability of the
poorest as well as the needs of currently non-poor for security in the face of shocks and life-style
events. The public response required might be by state or non-state actors or a combination of
both.
In the policy matrix of the forthcoming MTDF, the key focus area will be improving and
expansion in social protection. According to the policy document, key issues of concern are:
limited job opportunities for graduates from the country‟s universities, and other tertiary
institutions, increasing vulnerability of the unemployed men and women aged between 15 and 24
years. It is instructive to note that the working age is 18 years and above and so the definition of
the working age in the policy document is incorrect. The policy objective under this area is to
provide employment opportunities in all sectors. A key strategy will be to develop housing and
public works schemes and enhance current employment strategies like the Youth in Agriculture
Programme and the National Youth Employment Programme
Other issues of concern are how the growth process does not embrace the participation of all
citizens due to reasons such as disability, old age or ill health. These may act as hindrances to
how these categories of people effectively influence and benefit from the growth process. To
address these concerns MTDF calls for increased budgetary allocation to the Ministry of
Employment and Social Welfare, and social intervention programmes such as the Livelihoods
Empowerment against Poverty Programme (LEAP), School Feeding Programme, Capitation
Grant and Free Maternal Care. Also, the MTDF seeks protection of children in difficult
circumstances and eliminating child labour.
The 2010 Budget intends to expand the coverage of the Livelihoods Empowerment against
Poverty Programme to cover 40 000 households in 100 Districts nationwide. Other programmes
are the National Plan of Action for the Elimination of Worst Forms of Child Labour and the
National Programme for the Elimination of Worst Forms of Child Labour in Cocoa (NPECLC).
These programmes intend to end the abuse of children rights in the programme areas. Also,

13
issues of disability are not left out in the national budget. The Disability Council will finalize
work on the Strategic Plan to give direction to its work and help prioritize its agenda and submit
the Legislative Instrument to Cabinet and Parliament for approval. The Council will also
establish links with its constituents to strengthen cohesion and unity of purpose among Persons
with Disability (2010 Budget Statement; pg 167).
The budget process is an important route through which women and children‟s issues can be well
anchored. In the 2010 budget, Government intends to continue gender mainstreaming and gender
responsive budgeting to cater for the welfare of women and children. All PPMED/Budget staff
of MDAs and key staff of all MMDAs will be trained to have capacity in Gender Responsive
Budgeting (GRB). The expected impact is that the Annual Sector Budgets of MDAs and
MMDAs will adequately address gender inequality, ensuring that the welfare of women and
children are taken care of.
To a significant extent, the 2010 budget statement reflects the issues that have been raised in the
MTDF. The challenges lie with the implementation of these programmes and also effective
monitoring to ensure that the objectives of these programmes are achieved.

14
CHAPTER TWO: EDUCATION SECTOR ANALYSIS
2.0 Introduction
The section briefly discusses issues in the education sector raised in the 2010 budget statement. It
looks at trends in the education budget in relation to total budget and GDP. It also reviews the
composition of the sector budget within the context of addressing the current challenges facing
Ghana‟s education sector. The analysis also looks at geographical allocation and disbursement of
funds to the regions.
2.1 Education Financing: Trends in education sector budget and expenditure
A look at the table below indicates that actual education spending as a percentage of the total
GDP has been on the rise since 2006. The 2008 figure is about 9.9 percent which is in excess
of three percentage points over the Education for All Initiative minimum. On the contrary,
education expenditure as a share of total payments as well as the total discretionary payment
has been on the decline since 2006. The budgeted figures for 2009 and the current year show a
further decline.
Table 1: Summary of Actual Education Expenditure (2006-2008)
2006 2007 2008
Actual Education Expenditure as a % of GDP 8.3 9.1 9.9
Actual Education Expenditure as a % of Total Payments 22.0 20.9 18.2
Actual Education Expenditure as a % of Total
Discretionary Expenditure
30.9 29.3 24.2
Nominal Growth in Actual Education Expenditure 29.4 33.7 36.6
Real Growth in Actual Education Expenditure (Base=FY
2007)
10.8 19.6 17.2
Source: Computed from Education Sector Annual Review 2009 Education Sector Performance
Report 2009 (Preliminary Report) and MOFEP 2008 Fiscal Tables
Table 2: Summary of Education Budget and Expenditure (2008-2010)
2008
Actual
2009
Budget
2010
Budget
Education Expenditure as a % of GDP 9.9 9.1 9.9
Education Expenditure as a % of Total Payments 18.2 20.9 18.2
Education Expenditure as a % of Total Discretionary Exp. 24.2 29.3 24.2
Source: Education Sector Annual Review 2009, and National budgets (2009 and 2010)

15
The education sector is also to be affected by the 2010 budget initiative of increase in user fees.
The table below shows that the projected increase of user fees for the education sector for 2010
is about 50 percent from that of 2009. Given that user fees in education have been a major barrier
for the poor in accessing secondary and tertiary education, government needs to revisit this
initiative. Benefit incidence analysis using the GLSS 2 (1989), 3 (1992) and 5 (2006) in the
education sector shows that the benefits of secondary and tertiary education to the poorest
quintile (poorest 20 percent based on expenditure categorization) has been reducing over the
period (ISODEC, 2009). Secondary education reduced from 16.8 percent in 1989, to 14.9 percent
in 1992 and 13.48 percent in 2006. At the tertiary level, the benefit incidence for the poorest
quintile has reduced from 7.6 percent in 1989 to 6 percent in 1992 and then to only 1.86 percent
in 2006. The benefit incidence of tertiary education for the richest quintile benefits has been 50
percent in 1989, falling to 45.2 percent in 1992 but picking up strongly with a value of 58.3
percent in 20054.
The concern therefore is that further increases in user fees in 2010 could prevent poor children
from progressing to higher levels of education.
Table 3: User Fees in the Education Sector (In millions of GH¢)
2006 2007 2008 2009 Budget 2010 Budget
Collection 76.3 108.27 163.44 180.45 270.93
% increase
or previous
year
41.90 50.96 10.41 50.14
Chart 4: User Fees in the Education Sector
4 Benefit incidence analysis is derived from the Ghana Living Standard Surveys (GLSS), the latest one was
conducted in 2005/2006.

16
2.2 Composition of allocations and expenditure in education sector budget
The education sector receives the highest chunk of government budgetary support in Ghana. The
discretionary budget for 2010 is GH¢1,266,056,673, about 14 percent increase over the 2009
figure of GH¢1,107,132,235. About 95 percent of government of Ghana (GOG) education
budget for 2010 will be channeled to wages and salaries. The share of investment is only 0.3
percent while that for service and administration is 2 percent and 2.6 percent respectively5. The
trend is not very different for the two previous years. Details are discussed in chapter six.
It could also be observed from figure 1: below that the largest proportion of total education
expenditure is allocated to primary education. This is followed by tertiary education although the
trend shows a decline between the period 2006 and 2008, with Junior High School spending
almost mirroring the decline. Pre-school expenditure forms the smallest proportion.
5 It is important to note however that the Ghana Education Trust Fund (2.5% of Value Added Tax) and District
Assembly Common Fund (7% of total tax revenue) are other important sources of funding for education.
17
Figure 1: Trends in percentage of total expenditure for each level
Trend in Percentage of Total Expenditure for Each Level
0
5
10
15
20
25
30
35
40
2006 2007 2008Year
Pe
rce
nta
ge
Pre-school
Primary
JHS
SHS
Tertiary
Source: Education Sector Performance report, 2009
2.3 Geographical distribution of allocations and actual expenditures
The table below shows allocations and actual spending of funds from the Ghana Education
Service for the period 2006 to 2009. The figures cover basic education spending (that is pre-
school, primary and Junior High) for the ten regions of Ghana. Except for 2006, total expenditure
exceeded allocations for the period under review. The total budget overrun for all ten regions
were 4.31 percent in 2007, 49.2 percent in 2008 and 18.84 percent in 2009. According to official
sources, the excess spending was financed from the Consolidated Fund. Resources going to the
regions for basic education have increased substantially since 2007. The increase in 2008 was
about 94 percent over the amount spent in 2007 however, the increase in 2009 normalized to
about 11 percent of the previous year‟s figure.
Table 5: Trends in regional allocation and expenditure6: basic education
Region 2006 20077
Allocation Actual Deviation Allocation Actual Deviation
Ashanti 59,758,179.76 71,308,053.98 19.33 95,551,140.98 86,308,459.63 -9.67
B/A 38,490,142.95 41,066,102.29 6.69 60,709,294.30 52,497,898.73 -13.53
Central 30,361,603.26 34,823,777.35 14.70 42,143,855.10
Eastern 45,577,066.99 56,180,511.41 23.26 72,615,957.27 65,680,515.17 -9.55
6 Districts are first asked to prepare their budgets. Upon approval, disbursements are then made. In some instances
portion of funds meant for certain districts are kept at source to finance capital projects. 7 Gaps in the data presented were not because money was not allocated nor spent but rather because the books
containing the figures could not be readily traced

18
Gt.
Accra
51,745,805.10 36,594,936.38 -29.28 43,199,609.10 48,158,723.42 11.48
Northern 24,631,861.42 19,530,790.39 -20.71 20,357,903.52
U/E 10,787,886.92 7,646,835.31 -29.12 9,376,046.92
U/W 7,293,759.06 7,468,618.07 2.40 8,332,457.91
Volta 32,662,175.60 8,664,596.74 -73.47 52,002,037.06 10,592,240.31 -79.63
Western 29,457,670.85 27,215,613.92 -7.61 32,115,029.53 28,097,110.80 -12.51
Total
Al
330,766,151.91 310,499,835.84 -6.13 356,195,068.24 371,545,211.51 4.31
Source: GES Accounts, 2010
Region 2008 2009
Allocation Actual Deviation Allocation Actual Deviation
Ashanti 103,947,752.0
0
167,058,102.2
1 60.71 137,690,382
.00
186,786,533.5
6 35.6569216
B/A 66,688,327.00 101,614,596.8
7 52.37 87,842,938.
00
113,614,593.1
1 29.33833464
Central 52,935,332.00 81,573,376.27 54.10 70,008,302.
00
91,206,639.98
30.27974879
Eastern 78,873,617.00 127,130,784.9
0 61.18 102,987,416
.00
142,144,070.2
7 38.02081438
Gt.
Accra
47,087,328.00 93,215,717.03 97.96 62,771,967.
00
104,223,862.2
6 66.03568
Northern 42,691,016.00 39,404,627.80 -7.70 58,498,010.
00
44,058,047.67 -
24.68453599
U/E 18,515,103.00 18,148,216.42 -1.98 20,291,397.97
U/W 12,794,462.00 16,128,252.21 26.06 17,265,482.
00
18,032,889.66
4.444750862
Volta 55,656,963.00 20,502,272.57 -63.16 73,072,271.
00
22,923,452.22 -
68.62906831
Western 42,117,363.00 54,384,587.88 29.13 66,421,535.
00
60,807,039.68 -
8.452823802
Total 481,307,263.0
0
719,160,534.1
6
49.42 676,558,303
.00
804,088,526.3
8 18.84984972
19
Figure 2: Deviation between basic education and actual expenditure
Source: GES Accounts, 2010
The highest and lowest beneficiaries of the basic education spending for the period under review
were consistently the Greater Accra and Volta regions respectively. However in 2006 Eastern
was the highest beneficiary.
Table 6: Per Pupil Actual Spending by Region at the Basic Level (2006 – 2009) in Ghana
cedis
2006 2007 2008 2009
Ashanti 90.1684 101.9596 187.1129 203.4355
Brong Ahafo 84.02151 100.5018 183.2224 196.8211
Central 76.06036 85.19693 156.367 173.8574
Eastern 111.9256 120.4201 217.204 236.4323
Gt. Accra 105.6143 120.6626 218.9339 245.4203
Northern 43.30965 41.70086 71.81046 75.6116
Upper East 31.50216 36.37793 63.64847 69.11922
Upper West 41.63666 49.12282 84.74281 89.41515
Volta 21.25337 24.68058 44.85381 48.49933
Western 57.73151 54.0031 96.86953 103.3306
National 71.57598 79.50756 143.1773 155.0811
Source: Author Calculated from EMIS data and GES Accounts
20
Source: EMIS data and GES Accounts
Further, analysis of the per-pupil spending by region shows wide disparities. Unfortunately
however, the more endowed regions in the country, according to the latest Ghana Living
Standards Survey (GLSS V), tend to benefit the most. The Greater Accra, Eastern and Ashanti
regions have consistently received the highest share of per pupil spending at the basic level. The
three Northern regions and Volta region, which are among the poorest regions in the country
according to the GLSS V, received the lowest per pupil spending in 2009. The per-pupil
spending in the Volta region was about one fifth that of the Greater Accra region in 2009. It
would be important for the sector ministry to address these disparities in the current year‟s
expenditure.
2.4 Policy initiatives in the 2010 education budget
Ghana has achieved improvements in access and participation at all levels of the educational
system. The biggest challenge is the quality of education and the widening disparity in the
provision of public education, specifically basic education, across the districts in Ghana. A major
concern with respect to basic education is the inadequacy of infrastructure as well as qualified
teachers especially in deprived schools.
Current statistics show that as of 2008 over 28 percent of all basic schools in the country were in
need of major repairs8. Also the 2010 budget mentions that a total of about 5230 basic schools in
the country have classes under trees. About 45 percent of these schools are kindergartens, which
have children below six years of age enrolled. The government plans to construct about 165
school buildings for schools under trees for the year 2010. It must be noted that given the number
of schools under trees and plans to construct 165 school building this year, going by the current
pace it will take the government about 32 years to keep children from studying under trees
(Assuming that the probability of getting new schools operating under trees in the future is held
8 EMIS 2008/2009

21
constant). It is however gratifying to note that the 2010 budget gives a special focus to deprived
areas in the construction programme.
The 2010 budget also mentions that the construction of school buildings will generate economic
activity and employment in the respective communities. It is expected that this initiative will
provide a minimum of 14,700 direct jobs for masons, carpenters and other artisans. The 2010
budget also mentions a new policy of providing free education up to the tertiary level for
children with disability. This initiative comes as a big relief to families of children with disability
but also the children themselves, who usually drop out of school due to, the prohibitive cost of
higher education.
An assessment of the availability of trained teachers indicates that there has been a decline
especially at the primary level. The percentage of trained teachers decreased by 5 percentage in
2006/2007, to 2.7 percentage in 2007/2008, and a further 1 percentage in 2008/2009. Another
challenge is the disparity in the distribution of trained teachers in the country. The 2010 budget
mentions that teacher upgrading and deployment will be pursued to help address the issue.
Teachers who work in rural areas and would want to pursue distance education would benefit
from a GH¢100 government subsidy annually. It is however not very likely that these incentives
would significantly influence the number of teachers accepting postings to rural areas.
It can be concluded that even though there is some progress in the education sector more needs
to be done in achieving equity in the sector. For instance the per pupil subsidy at the basic level
in poorer regions are far lower than in more endowed regions in the country. Again, disparities
continue to exist with the distribution of trained teachers. Furthermore, the bulk of GoG spending
in the education sector is channeled to wages and salaries.

22
CHAPTER THREE: HEALTH SECTOR ANALYSIS
3.0 Introduction
This chapter looks at the health issues raised in the 2010 budget statement. It assesses allocation
of resources to programmes that seek to promote the interest of women and children‟s health.
Health, nutrition, and environmental sanitation are linked to the general state of development in
the country.
Ghana‟s health service has decentralized its operations to some extent at the district level, even
though it is not fully integrated into the District Assembly structure in terms of planning,
budgeting and expenditure. It runs from the national level through to the regional, district, sub-
district and community health systems; and it is built on a system of Primary Health Care (PHC).
The health of women and children can be improved with the right interventions specifically
strengthening the health system by improving access, quality, efficiency and financing. Although
there has been steady progress in some areas of the MDGs, especially poverty reduction and
education, challenges in the areas of child health/child mortality, maternal mortality, gender
equality and worsening income inequalities need to be given special attention.
3.1 Health Sector Financing for 2010
The Health sector budget serves as one of the major entry points for promoting the rights of
women and children. Through its programmes on Maternal and Child Health the 2010 budget
underscores the need for government to protect and where possible, expand social expenditure.
This is very crucial for the health sector because as has been the case of the previous two years
budgets, the health sector has received cuts in expenditure, particularly for investments
expenditure. For instance in 2008 actual health investment expenditure was over 59 percent less
than what was budgeted at the beginning of the year. Furthermore, the actual health investment
expenditure in 2008 fell short by about 38 percent of what was actually spent in 2007. Also in
2007, actual health investment expenditure fell short by about 21 percent of what was actually
spent in 2006 in nominal terms.
The table below shows that health expenditure as a percentage of a number of budget indicators
has been falling over the years. The situation is not different for the 2010 budget and calls for
government attention to the health sector for the required level of services and investments to be
provided. The total discretionary budget for the Ministry of Health for 2010 is GH¢726,871,441
of which over 28 percent will be realized from internally generated funds for the year. The
breakdown of the total GOG budget for 2010 shows that over 94 percent will be spent on wages
and salaries, with only about 2 percent, 1.8 percent and 1.7 percent of total GOG budget going to
health investment, services and administration respectively. The low level of spending,
especially investment spending, in the health sector may be inimical to promoting maternal and
child health.

23
Table 7: Health Expenditure for 2006-2010
Description of expenditure 2006
Actual
2007
Actual
2008
Actual
2009
Budget
2010
Budget
Discretionary Health Expenditure as a %
of GDP
4.36 4.03 3.50 2.55 2.80
Discretionary Health Expenditure as a %
of Total Payments
11.59 9.26 6.31 5.58 5.99
Discretional Health Expenditure as a % of
Total Discretionary Expenditure
16.28 12.96 8.39 13.15 11.04
Source: 2010 Budget and 2009 Health Review Report
3.2 Key Women and Children Related Programmes in the 2010 Budget
Government intends to bridge the disparity in access to health care and nutrition services in the
Country‟s health delivery system. Over the years, the sector has been beset with issues of large
gaps in accessing health care between urban and rural areas as well as rich and poor. To achieve
this objective the sector intends to improve the Community Based Health Planning and Services
(CHPS), improve rural access to health care through the provision of incentives for rural public
and private medical practice as well as provide qualified specialists to Regional and District
Hospitals. This will provide some relief for the rural women and children.
The 2010 budget outlines some plans to construct 29 additional health compounds to improve
access to health. The CHPS system is designed to improve health care access; to bridge equity
gaps in accessing quality health services and to remove non-financial constraints to health care
delivery. CHPS is the operational outcome of the Ghana Health Service (GHS) “Close-to-client”
system of primary health care delivery. Unlike the typical facility-based health care delivery,
CHPS is a Community-based Community-involved care system that enables District Health
Management Teams (DHMT) to adapt & develop approaches to community health care that are
consistent with local traditions, sustainable with available resources, and compatible with
prevailing needs. Below is list of functional zones in the Country.
Table 8: Functional CHPS Zones in the Country
NUMBER OF CHPS ZONES BY REGION FROM 2000-2008
REGION FUNCTIONAL
ZONES
POPULATION
COVERED DISTRICT
POPULATION
Upper East 82 295,257 1,059,222
Upper West 29 84,969 560,697
Northern 34 149,082 1,793,731
Brong Ahafo 7 36,498 488,263
Ashanti 8 42,337 472,192
Volta 37 145,506 1,051,865
Eastern 54 221,282 1,677,186
Western 43 280,108 1,179,969
Central 46 210,551 1,841,365
Greater Accra 5 47,229 412,587

24
Source: In-depth review of the Community-Based Health Planning and Services (CHPS)
programme; MOH Health summit 2009
The above table shows a clear picture that most of these available functional zones do not
commensurate with the population in the district. Another major concern is the fact that most of
the CHPS facilities lack the basic facilities such as electricity to provide the needed primary
health care.
In order to bridge the regional disparity in accessing health care, there is also the need for
Government to improve maternal and child health in areas with fewer facilities. The 2010 budget
mentioned the establishment of a new ambulance station in every district, a very laudable idea
and we call on government to make this a priority in especially the rural areas to improve access
to health.
3.2.1 Child Health and Nutrition
Malnutrition places children at increased risk of morbidity and mortality and has also been
shown to be related to impaired mental development. Children‟s nutritional status is a reflection
of their overall health. When children have access to adequate food, they are not exposed to
repeated illness; they reach their growth potential and are considered well nourished (MICS
2008)9.
The 2010 budget outlines some measures to achieve the health-related MDGs, for which
nutrition will be a major focus of the health sector. The budget states that essential nutrition
actions will be implemented in all regions with emphasis on complementary and supplementary
feeding of infants, children, pregnant women, nursing mothers and People Living with HIV
(PLHIV) technical support to the nutritional aspect of the School Feeding Programme‟. We call
on government to give additional attention to the Northern regions with the aim of improving the
child health situation.
3.2.2 Mortality in Ghana
Information on infant and child mortality is useful in identifying segments of the population that
are at high risk so that programmes can be targeted at such areas. Childhood mortality rates are
also basic indicators of a country's socio-economic level and quality of life. From the table
below, one of the major causes of under-five mortality is malaria constituting about 33%. The
proportion of under-fives sleeping under Insecticide-Treated Nets (ITNs) reduced from 55 per
cent in 2007 to 40.5 per cent in 2008, according to the 2010 budget. The 2008 GDHS estimates
ITNs used by children under-five at 28 per cent. This situation accounts for the rate of child
mortality rate
9 MICS stands for Multiple Indicator Cluster Survey

25
Table 9: under-five mortality in Ghana
Figure 3: Trends in Child mortality in Ghana
Source: GDHS 2008 Source: MDG Monitoring Report 2008
According to the 2010 budget, improvements are now being registered with under-five mortality,
which had shown a worrying trend since 1998 when it registered 109 per 1,000, increasing to
111 per 1,000 in 2003 (see Figure 1). Government is anticipating that by 2015 child mortality
rates would have declined further to 40 per 1000 live births. To make this target a reality,
Government should continue to intensify its strategies for child mortality, especially with the
combination of a number of interventions that would reduce the mortality rate.
3.2.3 Maternal Mortality
In 2007, the Ghana Maternal Health Survey estimated maternal mortality from household deaths
to be as high as 580 per 100,000 live births. The most common maternal health intervention
coverage covers tetanus vaccination and information on birth preparedness. Research has shown
that certain interventions exert a positive impact on maternal health and these interventions
should not be implemented as stand-alone efforts or programs but rather form part of an overall
package of essential services to improve maternal health.
3.3 Budget Space for Children and Women Health
The situation of children and women‟s health explained above, even though improving, still falls
short of Ghana‟s obligation under the Convention on the Right of the Child (CRC) and the
Convention on the Elimination of forms Discrimination against Women (CEDAW) which calls
for every State party to the treaties to ensure maximum protection and survival of children and
women. This requires increased primary health access, as delayed health care has been noted as
one of the causes of infant and maternal mortality.
Among the new initiatives in the 2010 budget to improve revenue generation is the increase of
user fees of which the health sector will be affected. As indicated earlier, over 28 percent of total
health budget for 2010 is to be realized from internally generated funds through user charges.
This situation can serve as a barrier for poor women and children in accessing adequate health
Cause of death Share of deaths %
Malaria 33
Neonatal 29
Pneumonia 15
Diarrhoea 12
HIV/AIDS 6
Measles 3
Injury 3

26
care. Information on the table below shows that the expected increase in revenue from user fees
for 2010 is over 94 percent. Government should consider its stance on increased user fees in the
health sector as this will further prevent poor children and women from accessing adequate
health care. This could worsen the situation of maternal and child health in the country.
Table 10: Increase in Health User Fees (GH¢ million)
2006 2007 2008 2009
Budget
2009 (Jan
– Aug
2010
Budget
Health Centers User Fees 61.65 64.12 80.84 103.48 98.82 201.22
% Yearly increase 4.01 26.08 28.01 94.45
Source: 2010 National Budget
Other interventions which have not been provided in the 2010 budget but which can facilitate
child survival include extending the policy on free education for children with disability,
mentioned in the 2010 budget, to include free health services for children with disability. Article
23 (3) of the CRC provides for the recognition of the special needs of a disabled child, assistance
extended (special care) shall be provided free of charge, whenever possible, taking into account
the financial resources of the parents or others caring for the child.
Again, 2010 budget mentions that financial support was provided for 250 PLHIV Associations to
assist with treatment costs, payment of NHIS, and nutritional needs. However it indicated
nothing about PLHIV who fall out of these associations, and regrettably they are mainly poor
women and children who hardly associate with these associations due to cultural barriers.
Government should consider alternative means of reaching them with support on their nutritional
and treatment needs.
3.4 Poverty Reduction Spending on Primary Health Care
One of the main sources for pro-poor spending are from the HIPC funds. These are released to
support mainly social development projects across the country. The 2010 budget outlines that the
2009 HIPC funds were mainly used to support construction of maternity and children‟s block at
Komfo Anokye Teaching Hospital (KATH) which was about GH¢1.4 million and malaria
clinical trials which was about GH¢0.5 million whilst GH¢1.0 million was used to support the
provision of healthcare from the Members of Parliament (MPs) share of the HIPC.10
The amount
that was used in funding construction of facilities for children and women could have been
augmented with some of the funds which had gone to the MPs share of HIPC funds since the
former directly affects the welfare of children and women. The figure below gives a trend of pro-
poor spending in the health sector.
10
2010 national budget

27
Table 11: Poverty Reduction Spending on Primary Health Care
Source: APR 2008/ Budget 2008-2010
From the figure above, it could be observed that primary health care expenditure takes the
highest portion of total health expenditure. For instance actual 2007 PHC spending was 50.90
percent about half of total health expenditure. However this rate has reduced over the years.

28
CHAPTER FOUR: WATER AND SANITATION
4.0 Introduction
The issues of water and sanitation cannot be delinked as they reinforced each other. Target 10 of
Goal 7 of the Millennium Development Goals seeks to halve by 2015 the proportion of people
without sustainable access to safe drinking water and basic sanitation. With reference to the
Millennium Declaration there has been some progress in potable water supply globally11
.
According to the report, access globally has increased from 73 percent in 1990 to 80 percent in
2004, but only Latin America and South Asia are considered on track to meet the MDGs. By
contrast, global progress on sanitation has lagged, increasing only from 35 percent in 1990 to 50
percent in 2004 and three regions (East Asia and the Pacific, Latin America and the Middle East
and Northern Africa) according to the same report.
Water provision in Ghana is handled by two institutions: Ghana Water Company Limited, which
is solely for urban water and the Community Water and Sanitation Agency (CWSA) for rural
water and basic sanitation. The current coverage for urban water is estimated around 58 percent
(2009 budget statement) while that for rural water is about 57 percent. Information obtained from
the Ministry of Education shows that close to 50% of all public schools do not have toilet
facilities. Similarly, close to 40% of all public schools do not have access to safe drinking water.
This analysis looks at the share of water and sanitation to overall Government allocation trends,
recent expenditures and how these relate to GDP trends. It also highlights key women and
children related issues and also looks at the spatial distributions of the services rendered.
4.1 The 2010 Budget and Allocations to the Ministry of Water Resources Works and
Housing
Expenditure on rural water as a percentage of total allocation to the Ministry of Water Resources,
Works and Housing on average is about 50 percent. In the 2010 the allocation is 78 percent.
Table 12: Allocation to Ministry of Water Resources Works and Housing (2008 – 2010)
2008 2009 2010
Budget Allocations 161384653 285929547 178008902
As a % of Total
payments
2.27 2.85 1.47
As a % of GDP 0.99 1.32 0.69
As a % of
Discretionary
Payments
2.91 4.15 2.16
Again, the above table gives the allocations to MWWH for 2008 to 2010. It shows that there was
a sharp drop in budget allocation for 2009 as against 2010. The allocation for the Ministry for
2010 was only about 62 percent of the allocation for 2009 in nominal terms. Further assessment
11
Global Monitoring Report on the MDGs, 2007
29
of the allocations with indicators such as GDP, total payments and discretionary payments,
shows that the percentage allocations for 2010 were far lower than 2008 and 2009 budgets (see
above table). For example allocations to the ministry as a percentage of GDP were 2.27 in 2008,
2.85 in 2009 and fell to 1.47 in 2010.
4.2 Poverty-Related Expenditure for Water
The 2010 budget is geared towards achieving rural water coverage of 60 percent by the end of
the fiscal year. No coverage target was set for urban water. However a comparison of the
budgeted versus actual for the period 2006 to 2009 shows that since 2007, actual poverty-
related12
water expenditure has been lagging far behind the budgeted.
Table 13: Poverty related rural water expenditures as a share of total Poverty Related
allocation to Water Resources, Works and Housing expenditure
Sub-
Sector
2006
Budget
2006
Actual
(Jan-
Sept)0
6
2007
Budge
t
2007
Actual
(Jan-
Sept)
2008
Budge
t
2008
Actual
2009
Budge
t
2009
Actual
(Jan-
Sept)
2010
budget
Rural
Water
Exp/Tot
Work
and
Housing
Exp
58.49 49.23 46.43
%
52.49
%
69.38
%
33.97
%
80.61
%
25.08
%
78%
Source: Budget Statement 2007 to 2010
One of the major challenges facing Ghana‟s water sector is the lack of investment in its
infrastructure. The tables below show the composition of recurrent and capital budgets for the
water sub sector.
Table 14: Government of Ghana Recurrent and Capital Budget for Water Sub Sector
2006 ( GH¢) 2007 (GH¢)
Urban Rural Total Urban Rural Total
Total
Water
Expenditu
res
34,365,000
.00
56,351,100
.00
90,716,100
.00
51,046,900
.00
61,523,100
.00
112,570,000
.00
Recurrent 10,500.00 520,500.00 531,000.00 11,900.00 889,500.00 901,400.00
Capital 34,354,500
.00
55,829,600
.00
90,184,100
.00
51,035,000
.00
60,633,600
.00
111,668,600
.00
12
Available figures for actual poverty-related expenditure (as captured by the various budget statements) were from
January to September
30
Source: Budget Statement from 2006 to 2009
Table 15: Government of Ghana Recurrent and Capital Budget for Water Sub Sector
Source: Budget Statement 2006 to 2009
Table 16: Government of Ghana Recurrent and Capital Budget for Water Sector (in
Percentage)
2006 2007 2008
Urban Rural Urban Rural Urban Rural
Recurrent as a
percentage of
total expenditure
0.03 0.92 0.02 1.45 2.02 0.03
Capital as a
percentage of
total expenditure
99.97 99.08 99.98 98.55 97.98 99.97
Source: Own Computation from budget allocations
4.3 Urban Water Supply
Currently, there are about 92 urban water systems in Ghana. A water system is usually made up
of head works or a treatment plant and a distribution network of pipes. As at 2007 the projected
demand for water per day for all the 81 water systems that existed was 916,435m3. This means,
assuming that there are 30 days in each month; the projected demand for the year was about
329,916,600m3
(ISODEC, 2009). However actual production level for 2007 was however
217,910,993m3, meaning a deficit of about 34 percent. Using the same logic, and based on actual
water production of 222,844,423.37 in 2008, the deficit in supply was about 35.3 percent (Ibid).
Quite apart from the deficit in supply of urban water, there are also challenges with water quality
and loss of water produced (what is usually referred to as non-revenue water).
2008 GH¢ 2009 (Budgeted) GH¢
Urban Rural Total Urban Rural Total
Total
Water
Expenditu
res
39,019,843.
00
47,171,329.
00
86,191,172.
00
104,231,139.
00
108,532,153.
00
212,763,292.
00
Recurrent 11,900.00 955,135.00 967,035.00 NA NA NA
Capital 39,007,943.
00
46,216,194.
00
85,224,137.
00
NA NA NA
31
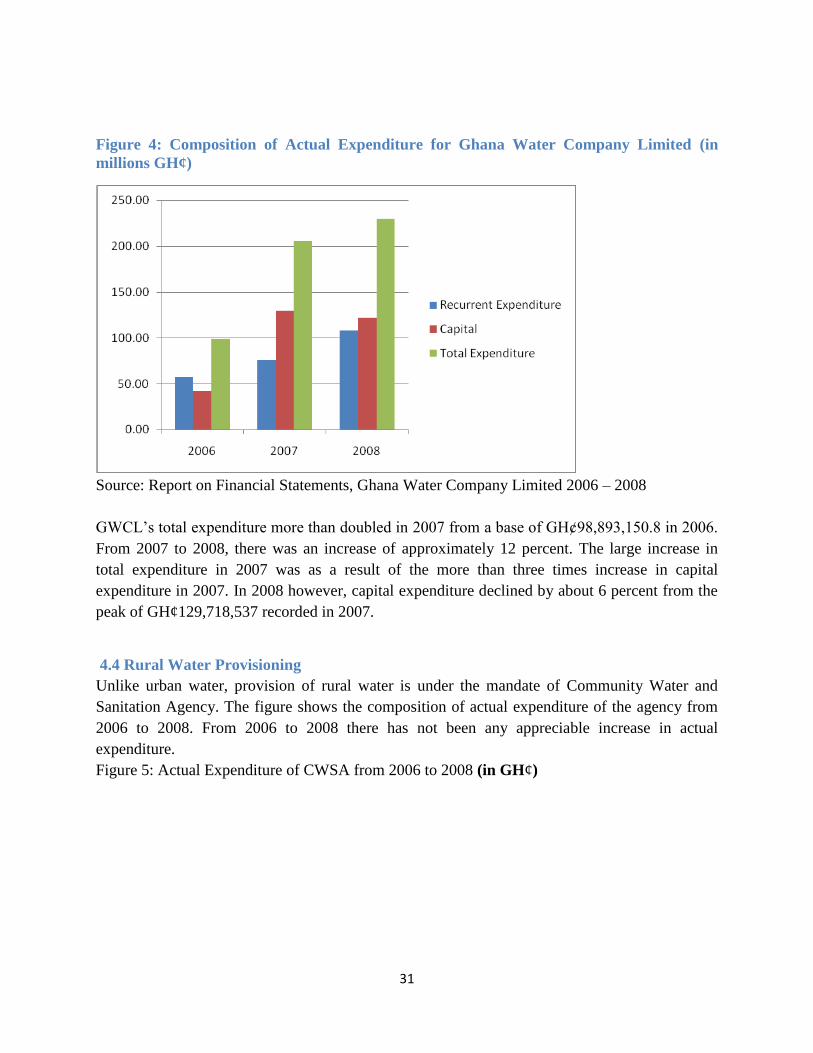
Figure 4: Composition of Actual Expenditure for Ghana Water Company Limited (in
millions GH¢)
Source: Report on Financial Statements, Ghana Water Company Limited 2006 – 2008
GWCL‟s total expenditure more than doubled in 2007 from a base of GH¢98,893,150.8 in 2006.
From 2007 to 2008, there was an increase of approximately 12 percent. The large increase in
total expenditure in 2007 was as a result of the more than three times increase in capital
expenditure in 2007. In 2008 however, capital expenditure declined by about 6 percent from the
peak of GH¢129,718,537 recorded in 2007.
4.4 Rural Water Provisioning
Unlike urban water, provision of rural water is under the mandate of Community Water and
Sanitation Agency. The figure shows the composition of actual expenditure of the agency from
2006 to 2008. From 2006 to 2008 there has not been any appreciable increase in actual
expenditure.
Figure 5: Actual Expenditure of CWSA from 2006 to 2008 (in GH¢)
32
Source: Actual expenditure of CWSA from 2006 to 2008
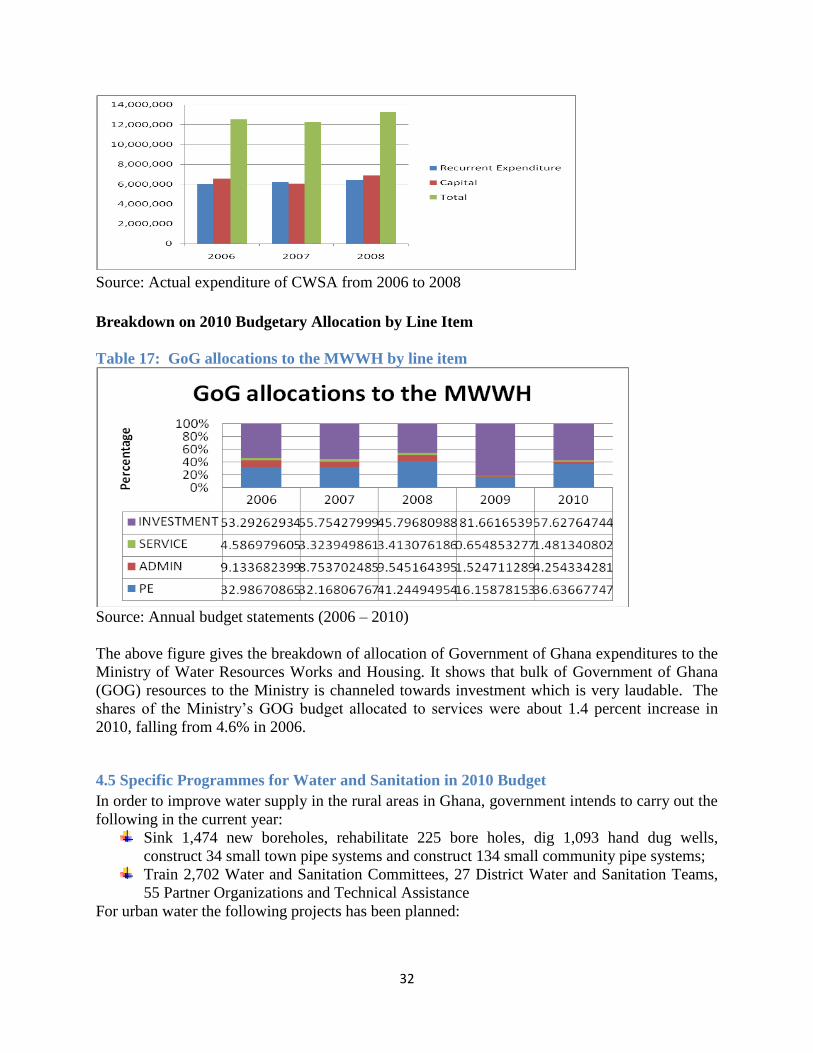
Breakdown on 2010 Budgetary Allocation by Line Item
Table 17: GoG allocations to the MWWH by line item
Source: Annual budget statements (2006 – 2010)
The above figure gives the breakdown of allocation of Government of Ghana expenditures to the
Ministry of Water Resources Works and Housing. It shows that bulk of Government of Ghana
(GOG) resources to the Ministry is channeled towards investment which is very laudable. The
shares of the Ministry‟s GOG budget allocated to services were about 1.4 percent increase in
2010, falling from 4.6% in 2006.
4.5 Specific Programmes for Water and Sanitation in 2010 Budget
In order to improve water supply in the rural areas in Ghana, government intends to carry out the
following in the current year:
Sink 1,474 new boreholes, rehabilitate 225 bore holes, dig 1,093 hand dug wells,
construct 34 small town pipe systems and construct 134 small community pipe systems;
Train 2,702 Water and Sanitation Committees, 27 District Water and Sanitation Teams,
55 Partner Organizations and Technical Assistance
For urban water the following projects has been planned:
33
Construction of the 40 million gallons per day Kpong Water Expansion II, 4mgd Abesim
water project, 4mgd Koforidua water project, 2mgd Bolgatanga water project, 3mgd Wa
water project and 2.5mgd Damango water project;
Undertake the Berekum water supply expansion as well as the Winneba distribution
network; and
Rehabilitation of minor and low capacity treatment plants in various parts of the country.
34
CHAPTER FIVE: SOCIAL PROTECTION AND SOCIAL WELFARE AND THE 2010
BUDGET
5.0 Introduction
This section looks at social protection and social welfare as articulated in the 2010 budget
statement. The role of social protection in every economy is increasingly becoming important as
the world economy recovers from the three pronged financial, food and fuel crises. In Ghana,
information on the contribution of government services and community personal and social
services to GDP growth pointed to a contraction at the end of 2009. Government service
contribution to GDP in 2008 went as high as 9.7 percent from 6 percent in 2007. However the
provisional outturn for 2009 is 3 percent according to the 2010 budget. Also community and
personal social services contribution to growth has remained stagnant since 2007. These
indicators are some pointers of the impact of the global crises on the Ghanaian economy.
5.1 Social Protection Programmes in the Ghanaian Economy
Current social protection policies and programmes in Ghana include: the Agriculture subsidy
programme. The President in his 2010 state of the Nation‟s address indicated the government‟s
intention of extending the agriculture subsidy policy to all farmers. Other social protection
policies are social transfers such as the LEAP, Capitation Grants to basic schools, school
feeding, supplementary feeding, health exemptions; National Health Insurance Scheme social
security and pension schemes (for formal sector workers) However only few women are
currently benefiting from the government pension scheme (SSNIT statistics indicate that
pensions are skewed in favour of men as only 10% of women (5,881) were on formal pension by
December 2003).
Notwithstanding these programmes that have been implemented, over the years a number of
challenges have been identified which are common to these programmes. The gaps include:
limited coverage, inadequate support to informal sector, weak targeting mechanisms in some
interventions, weak institutional capacity, low cost efficiency and effectiveness, limited
recognition of gender considerations, over concentration on protection and lack of coordination
among implementing agencies13
The National Social Protection Strategy (NSPS) was developed in 2007 to address the challenges
that previous social protection programmes have faced. The NSPS notes that “uncoordinated
delivery and poor targeting of most of the existing interventions have resulted in limited
coverage and impact” (p10), it aims to target systematically the “extreme poor” in Ghana,
estimated at about 18% of the population based on the GLSS V. The main instrument for
achieving this is a Livelihoods Empowerment Against Poverty (LEAP), social grants
programme, which took off in 2008 with cash transfers to selected poor households...
13
FAC Working Paper No. SP04: Agriculture and Social Protection in Ghana.
35
5.2 Social Protection and the 2010 Budget
The 2010 budget mentions some socially friendly programmes such as:
Allocation of GH¢12 million for the Livelihood Empowerment against Poverty
Programme for 2010 as against GH¢7.5 million in 2009. The coverage of the LEAP is
projected to increase to cover 40,000 households in 100 Districts Nationwide. The budget
also mentions that selected MDAs will be strengthened with equipment and logistics to
implement identified LEAP programmes. Further, an operational review of the LEAP is
expected to be conducted to inform government decisions on the way forward with the
programme.
Allocation of GH¢25million to the Savannah Accelerated Development Authority
Allocation of GH¢30 million to the Rural Electrification Programme and SHEP4
Allocation of GH¢21.8 million as Scholarships for students from deprived regions
Allocation of GH¢15 million National Youth Employment Programme and
Provide funds for the organization of training courses for special school staff
Notwithstanding the above mentioned programmes, budgetary allocations to these programmes
in the 2010 budget shows a shortfall of what is required for fully implementing such
programmes. The National Social Protection Strategy indicates that the total cost of the LEAP
scheme is about US$23- 27M p.a. (c.0.21 percent GDP), of which 80-90 percent would be the
grants themselves. However, the allocation in the 2010 budget for the LEAP (GH¢12 million) is
just about one third of what the National Social Protection Strategy projects require. It must be
mentioned that work is in progress regarding collating and analyzing the data and information for
expanding the LEAP coverage.
5.3 Budgetary Allocations to the Ministry of Employment and Social Welfare and the
Ministry of Women and Children Affairs
Information on allocations to the Ministry of Employment and Social Welfare (MESW) and
Ministry of Woman and Children Affairs (MOWAC) shows that the budget allocation for 2010
saw a drop from the 2009 budgeted figure (see table below). The drop in the 2010 budget for the
former was over 10 percent the allocation in 2009 in nominal terms while that of the latter was a
fall of about 0.3 percent of the allocation of 2009. Further, assessing the allocations to MOWAC
and MESW with budget indications such as GDP, Total Payments and Total Discretional
Payments shows a drop in all cases for the two ministries for the 2010 budget as compared to the
2009 budget.
Concerns have been raised that the current fiscal and monetary approach adopted by the
government and the Central Bank respectively, does not aid in providing the required framework
for social protection. An ISSER and ODI study (2009) notes that „whether Ghana can mitigate
the effects of the crisis depends on the ability to use monetary and fiscal policy to avoid being
pro-cyclical and to cushion the effects of the crisis.

36
Table 18: Allocations to Ministry of Woman and Children Affairs and the Ministry of
Employment and Social Welfare
MESE MOWAC
2008 2009 2010 2008 2009 2010
Percentage of
GDP
0.13 0.15 0.126 0.04 0.032
Percentage of
Total
Payments
0.30 0.33 0.270 0.10 0.070
Percentage of
Discretional
Payments
0.48 0.398 0.14 0.103
Source: Author generated from 2009 and 2010 National Budgets
A breakdown of the 2010 GOG budget for MESW shows that about 95 percent will be channeled
to wages and salaries with only 1.9 percent and 0.8 percent spent on services and investment
respectively. The drop in budget allocation for the MESW for 2010 specifically arises from a
drop in allocation to services and investment in the ministry for 2010 as compared to 2009. In
2009 GH¢363677 was allocation to services from the GOG component of the budget however it
has dropped to GH¢300930 for 2010. Further with regards to investment GH¢895826 was
allocated from the GOG budget component for the MESW but this has fallen to only
GH¢125887 in 2010. This is very worrying given the level of services the Ministry has to
provide, especially for poor women and children and persons with disabilities in the country.
5.4 Allocations to the Department of Social Welfare
The Department of Social Welfare (DSW) is a prime institution with responsibility for
promoting children‟s rights at the district level. However, low level of resources and capacity
facing the Department is a major hindrance to the implementation of its programmes for
promoting children rights in the country. The tables below show that DSW received less than 50
percent of the total budgeted amount for the department since 2007. For example in 2007, only
25 percent of the budgeted amount for services in the department of social welfare was actually
released. Also in 2008, only 20 percent of the budgeted amount for investment in the department
of social welfare was released. It is especially worrying that in most cases the services and
investment component of the budget are affected, which are also the components needed for the
actual provision of services.
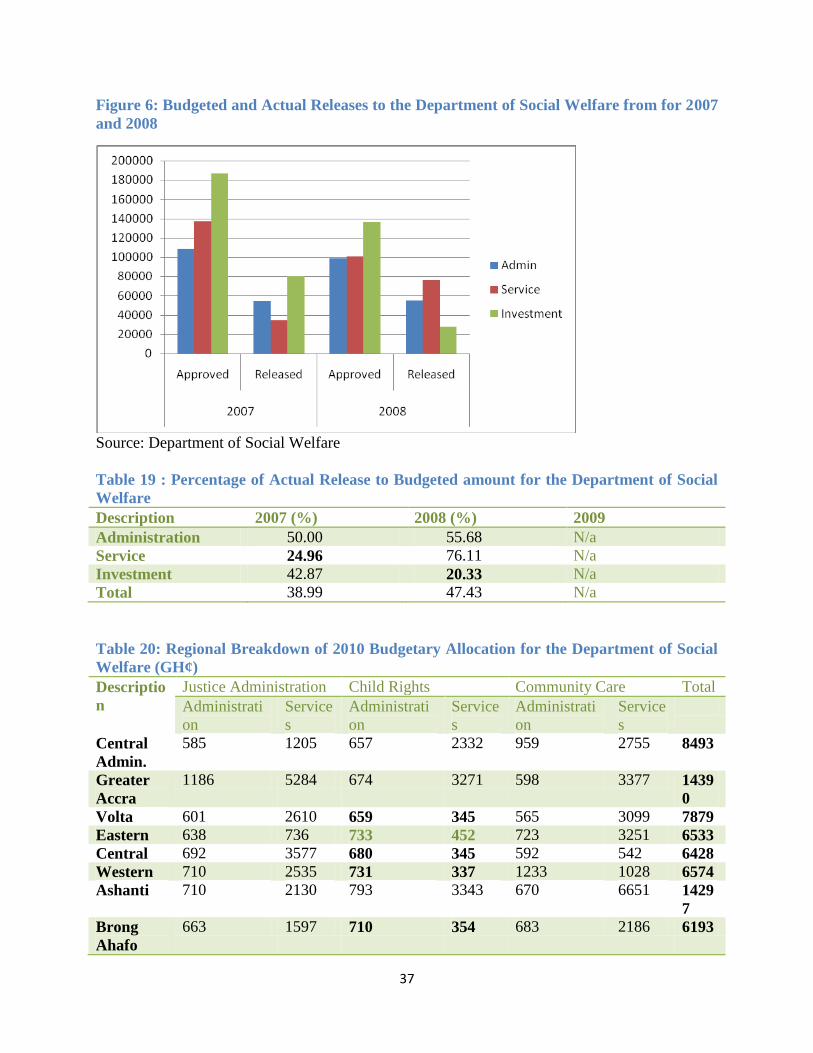
37
Figure 6: Budgeted and Actual Releases to the Department of Social Welfare from for 2007
and 2008
Source: Department of Social Welfare
Table 19 : Percentage of Actual Release to Budgeted amount for the Department of Social
Welfare
Description 2007 (%) 2008 (%) 2009
Administration 50.00 55.68 N/a
Service 24.96 76.11 N/a
Investment 42.87 20.33 N/a
Total 38.99 47.43 N/a
Table 20: Regional Breakdown of 2010 Budgetary Allocation for the Department of Social
Welfare (GH¢)
Descriptio
n
Justice Administration Child Rights Community Care Total
Administrati
on
Service
s
Administrati
on
Service
s
Administrati
on
Service
s
Central
Admin.
585 1205 657 2332 959 2755 8493
Greater
Accra
1186 5284 674 3271 598 3377 1439
0
Volta 601 2610 659 345 565 3099 7879
Eastern 638 736 733 452 723 3251 6533
Central 692 3577 680 345 592 542 6428
Western 710 2535 731 337 1233 1028 6574
Ashanti 710 2130 793 3343 670 6651 1429
7
Brong
Ahafo
663 1597 710 354 683 2186 6193

38
Northern 734 1608 768 2684 772 2165 8731
Upper
East
599 1014 730 474 624 1439 4880
Upper
West
592 1465 575 425 583 1433 5073
General
Admin.
0 - 0 - 0 0
The above table gives the regional breakdown for 2010 Budgetary Allocations of the Department
of Social Welfare. The allocations are for three major programmes: Justice Administration, Child
Rights and Community Care. Allocations to these social protection programmes, in general, are
very low, given the level of services required to be provided. The Greater Accra Region will be
receiving the highest allocation from the department followed by the Ashanti Region. The Upper
West and Upper East regions will be receiving the lowest allocations from the Department of
Social Welfare for 2010. This situation is however worrying since the two upper regions are also
the two poorest in the country. One will have expected that more services will be provided in the
poorest regions to assist in mitigating the effects of their poverty situation.
The 2010 budget mentioned that work on-going for the guidelines in the disbursement of the 2%
allocation to persons with disabilities from the District Assembly Common Fund. We
recommend that as part of the usage of this resource for 2010, allocations will be made for a
countrywide registration of all children with disabilities to ensure that they are captured in
national data for planning at the district and national level. Also this will ensure that the policy in
the 2010 budget of free education for all children with disability will be realized fully as the
DWS has not been able to register all children with disabilities in the country due to lack of
resources for that exercise.
The 2010 budget also indicates that MESW will continue with its effort in eliminating child
labour. The programme of elimination of child labour has been given prominence to the cocoa
sector because of the international nature of the crop, however we call on government to focus
on all sectors as the Convention on the Rights of the Child (CRC) calls for State parties in
working towards child protection in all circumstances and not only for specific sectors. Also it
will be necessary for the MESW and MOWAC to work actively with the Ministry of Food and
Agriculture in tackling extensively child labour issues in food crop farms and the fishery sector.
The 2010 budget indicates that Ministry of Women and Children Affairs will be implementing a
number of programmes in 2010 including the following:
Enhance Gender mainstreaming and Gender Responsive Budgeting (GRB) in MDAs and
MMDAs through capacity building for more MDAs and MMDAs. All PPMED/Budget
staff of MDAs and key staff of all MMDAs will be trained to have capacity in GRB.
Collection of Sex disaggregated data in 20 pilot districts
Reduce feminized poverty through alternative livelihood schemes, targeting poor women,
the vulnerable and marginalized groups
Institute measures to address women‟s reproductive health, infant and maternal mortality,
child trafficking, child labour, streetism and other social issues of national concern
39
For the Ministry of Women and Children Affairs to be more effective in improving the lives of
children and women and increasing gender and children issues in the budget, it will be necessary
for its work to be closely aligned with other ministries, given that the budget allocation for
MOWAC in 2010 is very little, about 0.13 percent of total discretionary expenditure in 2010.
Concluding on the 2010 budget and Social protection, it is realized that even though the
government mentions programmes for social protection in the 2010 budget, allocations to such
programmes are inadequate. For example the allocation to the LEAP programme for 2010 is only
about one third of the required to fully implement the programme for 2010. Also the actual
releases to the department of social welfare is just about half of the budgeted amount.

40
CHAPTER SIX: COMPARISON OF BUDGET LINE ITEMS OF KEY MDAs
6.0 Introduction
Budgetary allocations to Ministries Department Agencies (MDAs) provide important
information regarding what government priorities are for a particular financial year.
Consequently, analysis of planned spending signals what is to be expected for a particular sector.
Although under-spending in particular sectors and budget overruns in others are prominent in
Ghana‟s budget process, the exercise of analyzing allocations is still relevant as it provides
feedback on the extent of alignment of government priorities with planned spending and/or
actual spending patterns.
This section takes a look at issues of allocation and operational efficiency among five key
ministries whose work matter to promoting the welfare of women and children. They include the
Ministry of Education; Health; Water Resources, Works and Housing; Employment and Social
Welfare and Women and Children‟s Affairs.
6.1 The Concept of Allocative and Operational Efficiency
Allocation efficiency refers to the optimal allocation of resources (inputs) to achieve objectives
(outputs) that are beneficial to society. It involves comparing the cost incurred in producing an
extra unit of an item, with its benefit. Allocation efficiency also means that resources are
allocated to particular ends in line with pre-determined priorities that reflect the needs of the
intended beneficiaries. Operational efficiency, on the other hand requires that quality is assured
in the provision of goods and services while minimizing cost. The use of the concept in public
expenditure management asks the question about whether expenditures have delivered value for
money.
The appropriate conceptual framework for the measurement of efficiency is subject to debate
however the discussions that follow attempt to raise some general issues around how resources
have been allocated in the 2010 national budget and the extent to which they are balanced among
various ends that reflect the needs of Ghanaians. A comparison of the four budget line items
(personal emoluments, administration, services and investment) provides some information on
allocation and operational efficiency of government spending but obviously not the full picture.
6.2 Trends in spending by Line item (recurrent and capital expenditure)
6.2.1 Education and Health Sectors
The share of salaries and wages in total Government of Ghana (GoG) spending has been
increasing consistently since 2008 for key sector ministries such as health and education. In the
case of the Ministry of Education, it rose from about 91.7% in 2008 to 95.1% in 2010.

41
Figure 7: GOG Allocations to Personnel Emolument
Source: Budget Statements for 2008-2010
Similarly, the share of GoG allocations that went to the health sector increased from about 89.1
percent in 2008 to 94.3 percent in 2010 in nominal terms. The health and education sectors have
borne this characteristic for many years with part of the reason being the need to hire more
personnel to see to the increasing demand for education and health services due to population
pressure, migration dynamics and other factors. While this can be understood, a number of issues
arise from these trends which are discussed below.
Firstly, there is a concern that the war against „ghost names‟ in the government payroll records is
far from over. There are alleged cases regarding the existence of names of personnel on
government payroll who have retired or have left the public service. While government human
resource management policy aims at ensuring equity in the distribution of education and health
personnel throughout the country, the reality leaves much to be desired. About 70 percent of all
doctors in the country are found in the Greater Accra and Ashanti regions whiles 4.2 percent are
found in the three northern regions.14
In the last few months for example, Directors of Health
services in northern Ghana expressed worry about the refusal of medical personnel to accept
postings to their areas. This phenomenon is also witnessed in the education sector where teachers
refuse postings to deprived areas. Efforts have been made to provide incentives to personnel who
accept such postings but they seem not to be attractive enough.
14
Ministry of Health, 2008: Annual Programme of Work
42
Another challenge has to do with ensuring a balance in recurrent spending, that is, among
salaries and wages, administration and investment spending. If for instance, health personnel in
district hospitals and Community Health Planning and Services (CHPS) compounds are
complaining about lack of basic infrastructure, medical equipment and drugs to work with then
there is a prima facie case to take another look at allocative efficiency within the sector. This is
even more important in the face of the current declining shares of total actual health expenditure
in total GDP. Total health expenditure as a percentage of GDP has fallen from 4.36 percent in
2006 to 3.5 percent in 200815
.
6.2.2 Employment and Social Welfare
What is quite interesting to notice in the figure above is the increase in GoG allocations to
personnel emoluments for the Ministry of Employment and Social Welfare. It rose from 79.1
percent in nominal terms in 2008 to about 95 percent in 2010, thus slightly exceeding the shares
for the health sector. A further breakdown of the 2010 GOG budget shows that only about 1.9
percent and 0.8 percent would be spent on services and investment respectively. In the face of
the 2008 global food, financial and energy crises, attention to issues of social protection has
increased both globally and locally. In Ghana, the introduction of the Livelihood Empowerment
against Poverty (LEAP) has been one of the major government responses. The challenge,
though, is ensuring that the key role being played by the Department of Social Welfare (DSW) is
not undermined as a result of reducing allocation to services and investment expenditure. Such a
trend would hinder the ability of the Department and its decentralized units to offer required
services to poor women and children as well as persons with disability.
6.2.3 Trends in GoG Allocations to Investment and Services
Expenditure on investment and services are crucial to producing the required goods and services
in the various sectors. The provision of in-service training, construction of buildings,
procurement of equipment and drugs, special care and support for the vulnerable (e.g. pregnant
women, persons with disability and children), are to a large extent dependent on the amount of
resources available for investment and services. From the figure below GoG allocations to the
Ministry of Education for investment has been less than one percent and on the decline since
2008: from 0.64 percent to 0.34 percent in 2010. In contrast, the figure was as high as 81.66
percent in 2009 for the Ministry of Water Resources, Works and Housing, easing to about 57.62
percent in 2010. GoG allocations to MOWAC‟s investment budget averaged about 26 percent
from 2008 to 2010 although the figure dropped to 23.63 percent in 2010.
Allocation of GoG funds for services at MOWAC experienced a very significant decline in 2009
(31.2 percent in 2008 to 14.5 percent in 2009) but recovered in 2010, recording a value of 30.97
percent in nominal terms. This figure is unusually high when compared to the four other
15
Budget and Economic Policy Statements of the Government of Ghana (2006 to 2008).

43
ministries under review whose shares for the 2008 to 2010 period were generally less than 5
percent.
Figure 8: Central Government Allocation to Investment and services
It is important to note that GoG funding is complemented by other sources of funding such as
Internally Generated Funds, HIPC funds, Multilateral Debt Relief Initiative and Donor support.
These funds usually cover non-wage expenditure, that is, services and investment. Internally
Generated Funds however include administrative expenditure. There are instances where donor
support exceeds GoG allocations. For instance in the 2009 budget, donor support to the Ministry
of Water Resources, Works and Housing was about close to five times (474 percent) that of GoG
allocations. When all other domestic sources of funds are added to GoG allocations, the figure
reduces to about 323 percent.
Again, looking at the table format (in appendix 8A of the 2010 budget) used in capturing
expenditure allocations by line item show that allocations from statutory sources were left out. It
is hoped that this would be corrected in subsequent budgets to conform to the format used in the
2009 budget statement (Appendix 4 B).
6.2.4 Allocation and Expenditure for 2008 Education Budget Compared
In 2008, the year that saw the beginning of the global economic crisis, the Ministry of Education
overspent its overall budget by about 37.5 percent. A breakdown of the components of the
Source: National Budget and Economic Policy Statement 2008 - 2010

44
budget indicates that expenditure from GoG funds16
shot up by about 38.5 percent of the budget.
The development perhaps indicates that there was an attempt on the part of government to shield
the education sector from the impact of the crisis. Analysis of the amount spent by economic
line item also shows that there was a budget overrun with respect to payment of wages and
salaries. Government spent approximately 96 percent of the GoG funds on wages and salaries as
against a planned 91 percent. Consequently, expenditure on administration, services and
investment fell short of the planned amounts.
Figure 9: Deviations between allocations and expenditure in 2008-Ministry of Education:
From the above investment suffered most from the shortfall in spending, followed by services.
6.3.5 Allocation and expenditure for 2008 health budget compared
Total GoG expenditure outturn in 2008 exceeded the budget by just about 6 percent which is in
sharp contrast with the 37.5 percent recorded for the education sector. Like the education sector,
expenditure on wages and salaries exceeded the budget while expenditure on administration,
services and investment fell short of their respective budgeted amounts. Deviations from
budgeted amounts were highest for the investment component, which recorded a shortfall of
about 68 percent
16
Government of Ghana (GoG) funds constituted about 70% of the total education sector financing in 2008

45
Figure 10: Deviation between allocation and expenditure for MOH budget in 2008
46
7.0 Conclusion and Recommendations
The analysis of the 2010 budget seeks to advance the interest of women and children in sectors
such as education, health, water and sanitation, social protection and social welfare. Based on the
analysis the following are recommended for improving the delivery of services that seek to
advance the interest of women and children:
Classification of MDA expenditure allocations should follow the 2009 format as that
provides details on both discretionary sources as well as statutory sources of the
budgetary allocations. The 2010 budget is limiting in this regard (See appendix 4 B of
2009 budget and compare to appendix 8A of 2010 budget).
Effective expenditure controls should be put in place to ensure that some sectors and
regions do not unduly exceed their budget expenditure to the detriment of others
Allocation to the services component of programmes of the Department of Social
Welfare should be increased for the required level of services to be provided;
For the DSW, it is recommend that as part of the usage of this resource for 2010,
allocations will be made for a countrywide registration of all children with disabilities to
ensure that they are captured in national data for planning at the district and national
level.
For the Ministry of Women and Children Affairs to be more effective in improving the
lives of children and women and increasing gender and children issues in the budget, it
will be necessary for its work to be closely aligned with other ministries, given that the
budget allocation for MOWAC in 2010 is very little (about 0.13% of total discretionary
expenditure in 2010).
Improving water services and uses are essential for increasing hygiene and sanitation
service levels that affect productive lives of people, enhance enrolment and retention of
girls in school, enhance women‟s dignity and ability to lead, reduce morbidity and
mortality, reduce pre and post-natal risks and prevent vector and water borne diseases.
Health, nutrition and food production are also dependent on availability of water in
adequate quantities and good quality
Although the composition of total spending for GWCL and CWSA favour investment
and services, Ghana‟s ability to meet the GPRS II and MDG targets on water and
sanitation would require additional investment to close the gap in access. In the case of
the urban sector, effective monitoring is required to ensure that the objectives of the
management contract are fulfilled before the contract expires in 2010. Effective
monitoring is also required in order to deal with poor water quality, ensure the quick
repair of broken down infrastructure and the reduction of non-revenue water through
leakages and illegal connections.
Further, analysis of the per pupil education spending by region shows wide disparities in
regional spending. Ironically, the well endowed regions in the country (see GLSS V),

47
tend to benefit the most. The Greater Accra, Eastern and Ashanti regions has consistently
received the highest share of per pupil spending at the basic level. The three Northern
regions and Volta region, which are among the poorest regions in the country according
to the GLSS V, received the lowest per pupil spending in 2009. Government should look
at the equity considerations in allocation.
In order to bridge the regional disparity in accessing health care, there is also the need for
Government to improve maternal and child health in areas with fewer facilities. The 2010
budget mentioned the establishment of a new ambulance station in every district, a very
laudable idea and we call on government to make this a priority in especially the rural
areas to improve access to health

48
REFERENCES
1. Al-Hassan R and Poulton C (2009), Agriculture and Social Protection in Ghana. FAC
Working Paper No SP04
2. Aryeetey Ernest et al (2009), The Global Financial Crises – Implications for Ghana
3. Finance records, Accessed 25th
March 2010,
http://www.financerecords.org/topics/Allocative-
efficiency?PHPSESSID=0diu7ea9soasmnotipf0c67414Republic of Ghana. 2004. The
Budget Statement and Economic Policy of the Government of Ghana for the 2004
Financial Year
4. ISODEC, 2009. Programme Budgeting in Education, Water and Health Sectors in
Ghana
5. ISODEC, 2009. Benefit Incidence Analysis in the Education, Water and Health Sectors
in Ghana
6. Ministry of Education Youth and Sports: Preliminary Education Sector Performance
Report, 2009
7. Ministry of Employment and Social Welfare (2007), National Social Protection
Strategy (NSPS) World Food Programme (2009), Assessing the Impact of the Global
Economic and Financial Crises on Vulnerable Households in Ghana.
8. Republic of Ghana. 2005. The Budget Statement and Economic Policy of the
Government of Ghana for the 2005 Financial Year
9. Republic of Ghana. 2006. The Budget Statement and Economic Policy of the
Government of Ghana for the 2006 Financial Year
10. Republic of Ghana. 2007. The Budget Statements and Economic Policy of the
Government of Ghana for the 2007 Financial Year
11. Republic of Ghana. 2008. The Budget Statement and Economic Policy of the
Government of Ghana for the 2008 Financial Year
12. Republic of Ghana. 2009. The Budget Statement and Economic Policy of the
Government of Ghana for the 2009 Financial Year
13. Republic of Ghana. 2010. The Budget Statement and Economic Policy of the
Government of Ghana for the 2010 Financial Year
14. World Economic Outlook for 2009: International Monetary Fund