Embed Size (px)
Citation preview

BOTSWANA BUDGET BRIEF 2018
National
Population projections indicate that the window for Botswana to take ad-vantage of the demographic dividend is nearly closed. The relatively small-er labour force should be able to care for the growing dependent popula-tion. It is imperative that the Government continue to prioritize invest-ments in developing human capital (healthcare, education, jobs and skills).
The large variations in development expenditure performance across the sectors might point to serious inefficiencies in key public finance manage-ment processes. Over the past three years, credibility of the development budget varied by more than 30 per cent in some sectors. There is need to strengthen budgeting and planning processes around infrastructure-related investments.
The current fiscal year will run a 2.3 per cent budget deficit, although con-strained in forthcoming years is projected to lead to a surplus, and in the medium term, budget broadly balanced. In environments of budget con-traction, the Government must safeguard spending on social sectors.
Government revenue is projected to decline further to around 30 per cent of GDP over the next five years. Despite the negative revenue outlook, there are many opportunities to ensure adequate funding for social sec-tors, including reducing tax exemptions and concessions, increasing tax rates on certain items, like personal and corporate income tax, and expe-diting efforts to enhance tax collection capacity and minimize evasion (e.g. VAT collection).
Current investments are not delivering strong results, as indicated by the high prevalence of malnutrition and stunting among children, for example. The Government should prioritize improving the value for money of spending on current programs, which first requires comprehensive assess-ment, such as through Public Expenditure Reviews and other diagnostic tools.
Another major focus area is a move from incremental budgeting to perfor-mance-based budgeting. Strong senior level political support is required to initiate strategic reforms, including the adoption of performance-based budgeting practices and better data management information systems.
Highlights
The budget briefs explore the extent to which the public budget addresses the needs of children under 18 years in Botswana. Their main objectives are to synthesize complex budget information so that stakeholders easily understand it and to put forth key messages to in-form financial decision-making processes.

BOTSWANANATIONALBUDGETBRIEF2018
2
the long term can be broadly divided into two periods: a period of rapid, mineral-led growth in the first 25 years after independence in 1966 and much slower, more diversified growth over the past 25 years (Figure 2). During NDP 10 (2009-2016) the actual average rate of growth was around 3.9 per cent per annum, which is substantially below the Vision 2016 growth target of 7.5 per cent.
1. Macroeconomic context
The framework for development planning in Botswana is contained in the National Development Plans . Botswana’s Vision 2036 is the second national vision that aims to transform the country from an upper middle-income to a high-income country. The vision aligns Botswana’s national agenda with the global agenda for sustainable development and the principles of Africa Agenda 2063. It has four pillars: (i) sustainable economic development; (ii) human social development; (iii) sustainable environment and (iv) governance, peace and security (Figure 1).
The current eleventh National Development Plan for 2017-2023 (NDP 11) is the first medium term plan towards the implementation of the country’s Vision 2036. NDP 11 provides projected economic growth rates over the six-year period, at the sectoral level, as well as fiscal projections – a kind of extended Medium-Term Fiscal Framework (MTFF). NDPs are prepared by the Ministry of Finance and Economic Development (MFED), based on inputs from all ministries. For NDP 11, a new consultative process was introduced with Thematic Working Groups (TWGs), one for each Vision Pillar, including representatives from government, civil society and the private sector. NDPs are approved by Cabinet before being presented to Parliament for final (legal) approval.
The government’s financial assets are managed by the Pula Fund which is entrusted to the Bank of Botswana (BOB). The government invests directly in the Fund and its assets are accounted for in the Government Investment Account, which represents government’s ownership of the Pula Fund. The major purpose of the Fund is to invest proceeds from non-renewable resources (minerals) for the benefit of future generations. The government cannot withdraw more than its share of the Pula Fund to finance the budget. The Pula Fund cannot be used in any quasi-fiscal/ off-budget operation to finance investment, or the purchase of goods and services outside the government budget framework. The legal specifications for such activities are detailed in the BOB’s Act (CAP 55:01).
On average, Botswana has achieved annual real GDP growth of around 4.6 per cent over the past two decades (Figure 2). Botswana’s economic growth over

BOTSWANANATIONALBUDGETBRIEF2018
3
Botswana’s real GDP growth tends to be quite volatile and driven by large swings in the performance of the mining sector, particularly in diamond mining (Figure 3). Fluctuations in the global market for diamonds, in terms of prices and volumes, have a significant impact on GDP through mining production. In 2015, the country’s economic woes were exacerbated by declining commodity prices and weak demand for diamonds. Thus, Botswana experienced a negative annual GDP growth for the first time since 2009. In 2016, real GDP growth recovered to 4.3 per cent. The economy grew 2.4 per cent in 2017,1 easing from a 4.3 per cent expansion in the previous period. According to the IMF, in 2018, economic growth is expected to rebound macroeconomic environment, and higher government spending. The growth is forecasted to remain in the range of 4.1 to 5.5 per cent over the next six years.
The structure of Botswana’s economy has changed considerably in the last three decades. The share of mining as a percentage of GDP has been falling steadily from a peak of 53 per cent in the 1989 to around 18 per cent in 2017 (Figure 4). Production of diamonds appears to have levelled off, and most likely Botswana will maintain its production output at or around current levels for the foreseeable future. The contribution of diamonds to GDP is expected to
further decline as the rest of the economy grows and diversifies. While Botswana produces other minerals such as copper, nickel, soda ash, gold, coal, these industries are relatively small in economic terms when compared to diamond mining.
Much of the growth in employment comes from the public sector. The mining sector employs capital intensive production methods and creates few jobs (about 2.6 per cent of total employment). The government has grown largely based on mineral revenues and the public sector, including public enterprises. The public service sector is the major employer in the country, accounting for over 53 per cent of formal employment.2 Around half of total employment is outside of the public sector, including in agriculture, the informal sector, or government schemes (Ipelegeng Program), all of which generally provide relatively low incomes.
Unemployment is a major concern especially amongst the youth in Botswana. According to Statistics Botswana, in 2015/16, the unemployment rate stood at 17.7 per cent, which is too high for an upper-middle income country. About 40 per cent of the economically active young population (15-24 years) are unemployed (Figure 5). Substantial gender inequality persists. The gender unemployment gap –
1 IMF Staff Report for the 2018 Article IV Consultation, 16 August 2018. 2 The public sector includes central and local governments, as well as parastatals.

BOTSWANANATIONALBUDGETBRIEF2018
4
defined as the difference between female and male unemployment rates – remains positive, where women are more likely to be unemployed. Since 2008, both the female and male participation rate steadily increased and stabilised at around 80-85 per cent.
Inflation has remained within range of 3-6 per cent since mid-2013. During the period between 2005 and 2009 average annual inflation rate fluctuated
between 5 and 15 per cent. Since 2014 the average annual inflation rate fluctuated between 2.6 and 4.6 per cent. The lower inflation rate is due to a combination of lower global and regional inflation and a change in exchange rate policy (Figure 6-a).
Although the Bank of Botswana does not have a formal inflation target, it uses monetary policy to influence inflation so that it remains range-bound between 3 and 6 per cent.3 In 2016, inflation dropped to 3 per cent which is the lowest annual rate
3 According to the 2018 Monetary Policy Statement, the primary objective is to achieve price stability, which is defined as a sustainable level of inflation (p.2).

BOTSWANANATIONALBUDGETBRIEF2018
5
ever recorded. The Bank of Botswana attributes low inflation in 2016 to repressed domestic demand as well as favourable external price pressures. The determinants of Botswana inflation include external (South African and global) inflation, exchange rates, as well as domestic demand pressures. Figure 6-b above shows the trend of the purchasing power of the Pula5, which has deteriorated over time. For example, goods that would have been bought at P1.00 in 2003 would cost P2.55 in 2017.
Takeaways: Although mining is no longer seen as a major driver of
long-term growth, it remains the largest sector of the economy.
In 2008 and 2011, when inflation rose across the globe on the back of high food and fuel prices, Botswana allowed the high global prices to pass through to the domestic economy.
Despite its strong economic performance, the Botswana economy has been unable to create sufficient formal employment for its growing population.
2. Social development trends
Compared to other African countries, Botswana’s population growth rate reached a peak relatively early on in its post-independence development. Botswana has a total population of approximately 2.2 million. The annual population growth rate is currently estimated at around 1.8 percent. Population growth was adversely affected by the HIV/AIDS pandemic in the 1990s and 2000s, when the mortality rate rose rapidly. However, with better access to health services, the mortality rate has improved. Population growth is projected to decline steadily and fall below 1 per cent in the late 2030s, with the total population expected to reach 3.8 million towards the end of the century, based on current demographic projections. Rural-urban migration has continued steadily, driven by limited economic opportunities in rural areas and perceived opportunities in towns. Approximately 63 per cent of the total population lived in urban areas in 2011,5 with approximately 400,000 people living in and around the capital, Gaborone.6
Botswana has a relatively young population and the potential to reap a demographic dividend from declining dependency ratios. At independence in 1966, the median age of the population was 16 years,
4 I.e. how much a fixed quantity of goods would cost over a given period. 5 The proportion of the population living in cities, towns, and urban villages. 6 Based on the results of the 2011 Population and Housing Census.
BOTSWANANATIONALBUDGETBRIEF2018
6
but had risen to 24 years by 2015. The growth rate of the child population (0-17 years) has also fallen sharply, down to an estimated 0.6 per cent in 2015. The proportion of the population under 18 has fallen from a peak of 55 per cent in 1970 to 37 per cent in 2017. The dependency ratio is projected to fall further to 44.6 by 2039 (Figure 7). The demographic composition of the population has also changed over time (lower fertility and mortality rates), which is causing a reversal of the country’s dependency ratio.
Economic growth has largely been pro-poor. The headcount poverty rate has declined steadily over the years. By 2015/16, 16.3 per cent of the population lived in households with incomes under the national poverty line, suggesting that growth has largely been pro-poor. This is due to a combination of employment growth, welfare provision and social transfers, rural/agricultural development, and demographic changes.7 Especially, sizable social spending and public programmes for farmers contributed to significant declines in poverty rates in
7 World Bank (2015) Botswana Poverty Assessment.
BOTSWANANATIONALBUDGETBRIEF2018
7
Takeaways: Despite pro-poor economic growth and reduction of
poverty, Botswana remains among the most unequal countries in the world.
The government needs to develop and prioritise a package of evidence-based policy solutions that helps to close economic disparities.
the 1990s.8 Nonetheless, if the poverty rate is measured using the international USD1.25 a day standard, then 13.4 per cent of the population lived in poverty in 2009/10; a figure much higher than other comparable middle-income countries.9 Rural areas and urban villages10 have experienced the largest reduction in poverty rates. Despite this progress, Botswana is one of the most unequal countries in the world, with a Gini coefficient of 52.2 in 2015/16. Many people live just above the poverty line and are at risk of falling back into poverty.11
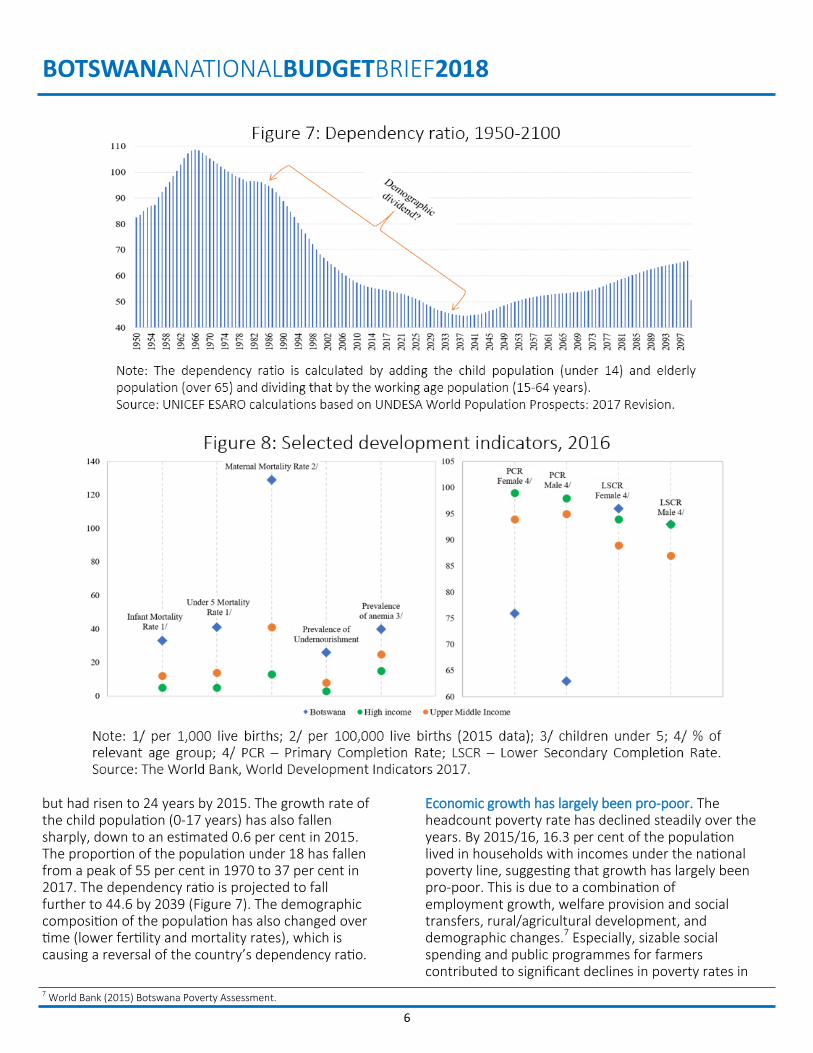
In comparison with 1990, Botswana has made noteworthy progress in the areas of health, education and general welfare of the population. Despite this achievement, progress in reducing infant, under 5 and maternal mortality over the last three decades has been slow. Due to HIV/AIDs, Botswana’s mortality rates are still higher that the average in upper middle-income countries (Figure 8). Likewise, Botswana ranks near the top of the lower middle-income countries in terms of prevalence of undernourishment (26 per cent) and anaemia among children under 5 (49 per cent.)
3. Aggregate spending trends and priorities
The Government of Botswana plays a major economic role through its spending, which has historically been over 40 per cent of GDP although it is now closer to 35 per cent (Figure 9). Total revenues averaged 36 per cent of GDP over the past five years, with a downward trend, and are expected to decline further to around 30 per cent of GDP over the next five years. The overall levels of anticipated revenue and spending during NDP 11 are shown in Figure 10.
Deficits are projected during the first half of NDP 11, followed by budget surpluses during the second half
of the Plan’s time horizon. This means that over the Plan’s timeframe revenue and spending are roughly in balance. However, the projected budget surpluses are to be achieved by aggressively cutting spending in the second half of NDP 11 to around 30 per cent of GDP. While this may seem pessimistic, it is in line with the experience of other upper middle-income countries, where government revenues are typically in the range of 25-30 per cent of GDP.
The budget is broadly divided into recurrent and development (non-recurrent, capital) spending. Almost half of the recurrent budget is made up of the payment for wages and salaries to government employees (Figure 10). Interest on government debt is relatively small (1.5 per cent of total spending over the past six years). An important principle of spending has been the Sustainable Budgeting rule being applied by the government, whereby revenues derived from minerals must be reinvested in the accumulation of other assets,12 but should not be used to finance recurrent spending. The development budget accounts for 28 per cent of total planned government spending during NDP 11.
Public investments have grown significantly in recent years, even when factoring in changing price levels . In nominal terms, in 2018/19, total spending equalled P58.4 billion, which is about 40 per cent of the 2013/14 fiscal year expenditure. When adjusting for inflation, the rise in spending is less impressive but still strong, jumping nearly 22 per cent in the period of 2013/14 to 2017/18, which is around 3.1 per cent real annual growth. Over the past three years, allocations to defence (16 per cent), housing, urban and regional development (14 per cent) and health (7 per cent) substantially increased. Meanwhile, other areas experienced no change (education) or slight decline (food and social welfare programmes) in spending.
Education and health rank tops in Botswana’s budget priorities. An analysis of functional allocation reveals some interesting insights about trends in priority expenditure.13 In general, education has taken the largest share, averaging 22 per cent between 2014/15 and 2018/19, followed by general public
8 IMF Staff Report for the 2018 Article IV Consultation, 16 August 2018. 9 World Bank (2015) Botswana Poverty Assessment, p.33. 10 Urban villages are settlements on tribal land, which fall under district council. Urban villages vary in size, with populations from 5,000 upwards. 11 World Bank (2015) Botswana Poverty Assessment, p.9.
12 Physical (social and economic) infrastructure, human capital, or financial assets. Source: NDP 11. 13 Priority expenditure for children consist of sub-sets of the following 3 “institutional” expenditure categories: education (excludes spending on universities/post-secondary bursaries); health; and social development.

BOTSWANANATIONALBUDGETBRIEF2018
8

BOTSWANANATIONALBUDGETBRIEF2018
9
administration at 18 per cent and health at 11 per cent. The share of spending allocated to health has increased significantly over time, rising from a historical average of around 5 per cent in the 1980s and 1990s to its current levels, to a large extent reflecting the impact of HIV/AIDS and the costs of dealing with it. Spending on priority social welfare provision remains around 3-4 per cent of government spending in recent years.
In recent years there has been a shift back towards defence spending, which seems likely to continue during NDP11. A simple indicator of prioritisation within the government budget can be gained from considering the ratio of defence spending to health and education spending (Figure 11). Following an upsurge in defence spending in the late 1980s, there was a long-term decline in this ratio, with slower growth in defence spending than in education and health spending.
However, since the 2015/16 fiscal year, the share of defence expenditure in total government spending grew 3 per cent on average. The NDP 11 outlines government intention in relation to priority
Takeaways: In Botswana, the relative size of fiscal revenues has
been declining, as mineral revenue growth has slowed down.
The Sustainable Budgeting rule does not provide any guidance as to how investment should be divided between different types of asset accumulation. Other rules or principles are required to determine the appropriate mix of investment in physical assets, human capital and financial assets.
Since 2013/14, defence spending doubled, mainly due to allocation of a huge chunk of the country’s development budget towards military hardware and equipment.
Despite the high levels of spending on infrastructure, there are major concerns about the quality of service provision in Botswana.
expenditure over the next five years. While the NDP 11 does not provide details of how the overall level of spending is to be allocated between functions or ministries, there is a ministerial breakdown of planned development spending, which provides some indication of priorities, and again highlights the emphasis on defence expenditure.

BOTSWANANATIONALBUDGETBRIEF2018
10
4. Budget credibility and execution
Expenditure performance tends to be reasonably good on the recurrent budget, compared to the development budget, and the amount of underspending has been declining (Figure 12). If recurrent budgets are not spent, they are lost to the spending department, and future budget provisions are likely to be reduced accordingly. If development budgets are underspent, the amount can be carried
forward if the total expenditure on the project is within the Total Estimated Cost (TEC) for the project approved in the NDP.
Budget execution rates differ across the three areas of priority child-focused spending. In general, health and education recurrent spending rates are close to 100 per cent14. This would suggest a level of maturity in the management of the budget within these sectors, although serious inefficiencies in key public finance
14 Results over 100% generally suggest that a supplementary budget was issued during the fiscal year.

BOTSWANANATIONALBUDGETBRIEF2018
11
5. Financing the national budget
Botswana finances priority expenditure on children (education, health and social development) mainly from tax and non-tax revenue. In general, the burden of the spending cuts has fallen more on non-priority spending than on priority spending. Part of the reason for this is that the government of Botswana has adopted a conservative fiscal stance, which minimises the use of external debt. Essentially, priority spending has been largely maintained in the face of diminishing fiscal resources. Non-priority non-interest spending has been stable in the range of 21-23 per cent of GDP.
The overall contribution of mineral revenues has declined, although minerals remain the largest single revenue source. In the five years from 1986/87 to 1990/91, mineral revenues averaged 27 per cent of GDP, whereas over the past five years, mineral revenues averaged 12 per cent of GDP (Figure 14). Revenues from the SACU15 provide the second-largest source of revenue for the government (above 9 per cent of GDP), which is largely dependent upon South African imports and SACU common external tariff rates, and the country’s share of intra-SACU trade. Domestic revenues (VAT and non-mining
Takeaways: There is scope for dealing with underspending on
capital projects, which is generally due to poor project planning and execution.
Data on social protection spending is less comprehensive than data on spending in education and health. The government may consider improving the basis for the classification of spending into recurrent and non-recurrent expenditures.
management processes remain a concern. Nonetheless, it appears that the Government is struggling to spend its development budget.
Actual capital expenditure on health infrastructure varies considerably across the four-year period (Figure 13) and might indicate a lack of capacity and serious inefficiencies in the management of infrastructure expenditure in this sector. Regarding social protection, there is not enough information to separate the recurrent and development expenditure. Nevertheless, the large variations across the years might point to weaknesses in the budget and budget execution processes.
15 Receipts are determined according to a formula agreed between the five SACU members (South Africa, Botswana, Lesotho, Namibia and Swaziland) in 2002.

BOTSWANANATIONALBUDGETBRIEF2018
12
income tax), although growing slightly, are not sufficient to compensate for lower mineral revenues, even after the offset from higher SACU revenues. In addition, SACU revenues are expected to decline over the medium term, as South Africa’s economy slows.
The country receives little ODA, and there is no foreign commercial borrowing, so international capital markets have a limited influence. Botswana is one of few African countries to have investment grade credit ratings from two of the major international ratings agencies, which the government seeks to maintain. Borrowing is legally constrained by the limits imposed by the Stocks, Bonds and Treasury Bills Act, which states that government debt and government guaranteed debt must not exceed 20 per cent of GDP for each category of domestic debt and external (foreign) debt (hence 40 per cent of GDP in total). In principle, both domestic and foreign borrowing could be increased, and as at March 2018 the government’s cash balances at the Bank of Botswana amounted to P30.1 billion, equivalent to 17 per cent of GDP and 53 per cent of total government spending16.
While Botswana’s cash balances still exceed the level of debt, the Net Financial Asset (NFA) position has been deteriorating over time (Figure 15). At the peak, in the late 1990s, Botswana’s NFA position was
equivalent to almost 100 per cent of GDP. However, it has since deteriorated dramatically, and in March 2017 NFA was equivalent to only 3 per cent of GDP. This has been mainly driven by two developments: the establishment and funding of a new government pension scheme in the early 2000s; and the global financial crisis of 2008-2010, to which the government responded with a large fiscal stimulus, leading to budget deficits financed by cash drawdowns and additional borrowing. The newly created Financial Stability Council (FSC) aims at tightening oversight coordination. In February 2018, the Bank of Botswana (BOB) announced establishment of the high-level Council that primarily comprises the MFED, BOB and the Non-Bank Financial Institutions Regulatory Authority (NBFIRA) and focuses on coordinated macro-prudential monitoring, analysis and response with respect to any financial system imbalances or distress.
Deficits in the first half of NDP 11 are to be balanced by surpluses in the second half (Figure 16). The Government seems to have taken a decision to halt the deterioration of the NFA position, so, for instance, deficits in the first half of NDP 11 are to be balanced by surpluses in the second half. Furthermore, NDP 11 includes an intention to introduce a new fiscal rule, such that 40 per cent of mineral revenues will be saved, and the remaining 60
16 Bank of Botswana, Botswana Financial Statistics, July 2018.

BOTSWANANATIONALBUDGETBRIEF2018
13
per cent allocated to development spending. The implication is that a significant budget surplus (equivalent to at least 40 per cent of mineral revenues) must be run each year to rebuild financial assets. According to the NDP 11, this will be achieved in the final year of the Plan.
As an upper-middle income country, Botswana receives relatively little external support. In the last
three fiscal years, external grants amounted to 0.3 per cent of government revenues, and 0.1 per cent of GDP. External support was significantly higher between 2004 and 2012, with substantial funding received in the form of support for HIV/AIDS programmes. As at December 2017, external debt (excluding guarantees) amounted to 14.6 per cent of GDP and domestic debt amounted to 5.7 per cent of GDP (Figure 17). External debt is almost entirely from

BOTSWANANATIONALBUDGETBRIEF2018
14
Takeaways: Despite increased SACU revenues in recent years (as
share of total revenue and grants), government revenue from mining has enabled Botswana to finance the national budget almost entirely from domestic means.
The depletion of the public sector's cash balances offers challenges for the Botswana economy in the medium and long term.
6. The budget calendar and PFM reform
In Botswana, the budget process is well-established, and domestically driven. The budget cycle comprises four main stages, which begin each year in June and run through to February three years later (Figure 18). The budget preparation process operates on an interactive basis between MFED and spending ministries. In June/July each year, baseline budget projections are prepared by each ministry, which cover the medium term (three years). Based on these baseline budget projections, as well as macroeconomic forecasts, MFED prepares the
Budget Strategy Paper (BSP) and the Medium-Term Expenditure Framework (MTEF), which is presented for Cabinet approval in August. BSP discussion sessions (dipitso) are usually held with wide range of stakeholders.
The approval process begins late November when the budget estimates agreed by the Estimates Committee are submitted to Cabinet by the Minister of Finance and Economic Development. The budget must be approved by the end of March. Budget implementation begins in April, the start of the new fiscal year. Once the fiscal year is completed, final expenditure numbers are prepared and submitted to the Auditor-General. Final expenditure figures are usually available in October or November. These are then included in the Budget Books17 to be presented to Parliament.
The World Bank supported Public Expenditure Review 2010 (PER) provided several budget reform proposals, which were broadly accepted by government. The PER recommended a fundamental re-evaluation of Botswana’s PFM system, and a move away from the long-standing system based on NDPs and dual budgeting. MFED is taking measures to improve the budgeting process in terms of relating spending to
official multilateral or bilateral sources and is on concessional or preferential terms. There is no commercial external debt.
17 The Financial Statements, Tables and Estimates of Revenue and the Estimates of Expenditure.

BOTSWANANATIONALBUDGETBRIEF2018
15
prioritised needs and performance. The ministries are required to prioritise their proposed projects before they are presented for consideration. Another major focus area is a move from incremental budgeting to performance-based budgeting.
Botswana’s score of 8 (out of 100) on the 2017 Open Budget Index is substantially lower than the global average of 42 for the 115 countries (Figure 19). Botswana’s score is in part affected by the change in definition of “publicly available”. From OBS 2017 online availability is considered a basic standard for the publication of government information. In terms of public participation in budgeting, Botswana’s score indicates that it provides few opportunities for the public to engage in the budget process. In May 2018, the MFED with support of UNICEF developed a plan to improve Botswana’s score on the forthcoming OBS 2019. Botswana has set an ambitious target – to be the country with the largest improvement ever on the survey, going from 8 in 2017 to the mid-80s in 2019. The MFED’s official website (http://www.finance.gov.bw) is operational since August 2018.
Despite the apparent strength of Botswana’s fiscal position, there are several fiscal challenges that will need to be addressed over the coming years:
• Declining revenues: The current trend of declining revenues as a share of GDP, which is expected to continue in the medium to long term, as the relative share of the diamond sector becomes smaller. It reflects gradual replacement of a highly profitable and highly taxed activity (diamond mining) by activities with lower rates of profit, and lower rates of taxation.
• Reduction of accumulated reserves: The government’s financial assets, accumulated during the lengthy period of mineral-led growth have been gradually depleted. This has not been the result of a deliberate strategy, but reserves have essentially been used to cushion part of the adjustment to structurally lower revenues.
• Low domestic revenue mobilisation: Botswana needs to improve domestic revenue mobilisation. Most fiscal revenues are derived from diamond exports and SACU revenues, with domestic revenues contributing a relatively small share.
• Spending inefficiencies: There is a need to improve the efficiency of public spending. While Botswana was once renowned for having an efficient public finance system, this has deteriorated in recent years. There are concerns about the quality of spending, both regarding wastage and decisions (where and how public funds should be spent.)

BOTSWANANATIONALBUDGETBRIEF2018
16
Takeaways: Enforcement of the requirement to implement prioritisation decisions requires the development of better technical skills in
both MFED and other ministries.
The current practice is for MFED to publish data tables (in pdf format) is not user friendly and require time-consuming efforts to extract data. Publishing data files in user friendly formats (e.g. MS Excel) would significantly facilitate budget analyses by non-government actors, and contribute to putting budget transparency into practice.
A much stronger information base is needed to measure performance and value-for-money which are essential for introduction of performance-based budgeting.
United Nations Children’s Fund (UNICEF), Botswana
Plot 27, Dalale House, Matsitama Road, Gaborone, Botswana Tel: 3951909 or 3952752 | Fax: 3951233 Follow us on Facebook, Twitter YouTube and at www.unicef.org