Embed Size (px)
Citation preview

DIPLOMARBEIT
Titel der Diplomarbeit
ANALYSIS OF THE EFFECTS OF siRNA-MEDIATED
KNOCK-DOWN OF GLUCOCORTICOID TARGET GENES
IN PRIMARY ERYTHROID PROGENITOR CELLS
Verfasserin
MICHELA PARTH
angestrebter akademischer Grad
Magistra der Naturwissenschaften (Mag.rer.nat.)
Wien, 2011
Studienkennzahl lt. Studienblatt: A 441
Studienrichtung lt. Studienblatt: Diplomstudium Genetik – Mikrobiologe (Stzw)
Betreuerin / Betreuer: Ao. Univ.-Prof. Mag. Dr. Ernst Müllner

Introduction
2

Introduction
3
Für meine Eltern, die mir alles
in meinem Leben ermöglicht haben

Introduction
4

Introduction
5
TABLE OF CONTENT
1. INTRODUCTION 6
1.1 Human Hematopoiesis 9
1.1.2 Hematopoietic stem cells and their niches 11
1.2 Human erythropoiesis 15
1.2.1 Erythropoiesis takes place in erythroblastic islands 16
1.3 Erythroid cells in culture 20
1.3.1 Growth factors for in vitro proliferation 22
1.4 Clinical use of HSCs 16 1.5 Glucocorticoid Receptor (GR) 24
1.5.1 Glucocorticoid signaling 24
1.5.2 Glucocorticoid Receptor and erythropoiesis 26
1.5.3 Glucocorticoid Receptor target genes 27 1.6 Apoptotic pathways 29
1.6.1 The extrinsic pathway 30
1.6.2 The intrinsic pathway 32
1.6.3 NF-kB activation inhibits apoptosis 33
1.7 Cell-surface markers for human erythroid progenitor cells 31 1.8 RNA interference (RNAi) pathway 37
1.8.1 The electroporation method 38
2. MATERIALS AND METHODS 40
2.1 Working with erythroid progenitor cells (hEPCs) 40
2.1.1 Isolation of mononuclear blood cells via a Ficoll-gradient 40
2.1.2 Isolation of mononuclear blood cells without a Ficoll-gradient 41
2.1.3 Determination of cell number by CASY 42
2.1.4 Outgrowth of hEPCs from cord blood mononuclear cells 43
2.1.5 Freezing erythroid progenitor cells 44
2.1.6 Thawing erythroid progenitor cells 44
2.1.7 Histological staining of erythroid cells with benzidine 45
2.2 Flow Cytometry (FACS) 46
2.2.1 Propidium-Iodide staining 46
2.2.2 Propidium-Iodide and Annexin-V staining 46
2.2.3 Fixing cells for FACS-analysis 47
2.2.4 Surface marker staining 48
2.3 Electroporation 49
2.3.1 Different siRNAs used for electroporation 50
2.4 Cell Isolation Kits 53
2.4.1 Dead Cell Removal 53
2.4.2 CD34+ Isolation 54 2.5 Working with Proteins 56
2.5.1 Protein Isolation 56
2.5.2 Western Blot analysis 57
I

Introduction
6
2.6 Working with RNA 63
2.6.1 RNA Isolation 63
2.6.2 cDNA synthesis 63
2.6.3 Real Time PCR (Q-PCR) 64
3. RESULTS 66
3.1 Isolation and outgrowth of mononuclear cells from cord blood 66
3.2 Optimization of the electroporation method 68
3.2.1 Best Voltage and Capacity settings 68
3.2.2 Best siRNA- concentration 69
3.2.3 Stability and time-course of the knock-down 71
3.2.4 Best time constant and electroporation volume 74
3.3 Raf-1: serine/threonine kinase 1 75
3.3.1 Effects of the Raf-1 knock-down on proliferation rate 77
3.3.2 Effects of the Raf-1 knock-down on the Casy profiles 78
3.3.3 Effects of the Raf-1 knock-down on the cell morphology 80
3.3.4 Effects of Raf-1 knock-down on pERK- and Caspase-3 levels 82
3.4 Tis11d: Zinc Finger Protein 36 like 2 84
3.4.1 Effect of the Tis11d knock-down on cell morphology 85
3.4.2 Effect of the Tis11d knock-down on cell volume and cell size 88
3.4.3 Effect of the Tis11d knock-down on cell viability 90
3.4.4 Effect of the Tis11d knock-down on Caspase-3 levels 92
3.4.5 Effect of the Tis11d knock-down on TNFα-levels 94
3.5 Fkbp51: FK506-binding protein 51 96
3.5.1 Effect of FKBP51 knock-down on cell morphology 96
3.5.2 Effect of FKBP51 knock-down on cell volume and cell size 100
3.5.3 Effect of FKBP51 knock-down on cell viability 102
3.5.4 Effect of FKBP51 knock-down on NF-kB levels 103 3.6 Tis11d knock-down leads to FKBP51 downregulation 105
4. DISCUSSION 105
4.1 Raf-1 106
4.1.1 Raf-1 knock-down in hEPCs led to more spontaneous differentiation 107 4.2 TIS11d 110
4.2.1 Downregulation of Tis11d in primary hEPCs induces apoptosis 112
4.2.2 Targets of Tis11-like proteins 112
4.2.3 Tis11d might have anti-apoptotic effects in hEPCs 116
4.3 FKBP51 116
4.3.1 Downregulation of FKBP51 in primary hEPCs induces apoptosis 120
4.3.2 FKBP51 is involved in the NF-kB pathway 121
4.3.3 FKBP51 might be involved in the JAK/STAT pathway 122
4.4 Glucocorticoids prevent apoptosis in hEPCs 125
5. REFERENCES 128
CURRICULUM VITAE
II

Introduction
7
Zusammenfassung
Hämatopoetische Stammzellen haben die Fähigkeit zur Selbsterneuerung und
können zu den unterschiedlichen adulten Blutzellentypen differenzieren. Unter
Erythropoese versteht man den Prozess, in dem myeolide Vorläuferstammzellen
zu kernlosen hämoglobinisiereten Erythrocyten differenzieren. Hematopoese und
Erythropoese sind komplexe Abläufe, welche einer strengen Kontrolle unterliegen
müssen, da eine Störung des Gleichgewichts zwischen Selbsterneuerung,
Differenzierung und Zellteilung zu ernsten Krankheitsbildern führen kann.
Steroidhormone, wie z.B. Glukokortikoide, spielen in der Kontrolle über die
Entscheidung der Selbsterneuerung und Differenzierung zu erythroiden
Vorläuferzellen eine essentielle Rolle. Glukokortikoide sind außerdem noch in
verschiedensten Abläufen im Körper involviert, so regulieren sie z.B. den Fett- und
Eiweißmetabolismus, und sind beteiligt in der Kontrolle bestimmter Funktionen des
zentralen Nervensystems, sowie des Immunsystems. Glukokortikoide entfalten
ihre Wirkung durch Bindung an den nukleären Glukokortikoid-Rezeptor (GR).
Dieser agiert nach erfolgter Aktivierung als Transkriptionsfaktor und moduliert auf
diese Weise direkt oder indirekt die Gentranskription verschiedenster Zielgene.
In meiner Diplomarbeit hab ich die Funktion folgender drei GR-Zielgene analysiert:
Raf-1, Tis11d, FKBP51. Alle Experimente wurden in einem primären erythroiden
Zellkultur-System durchgeführt, wobei die erythroiden Vorläuferzellen aus
humanem Nabelschurblut isoliert wurden. Ziel meiner Diplomarbeit war es eine
verlässliche und reproduzierbare Transfektions-Methode zu etablieren, mit deren
Hilfe ich die Expression aller drei GR-Zielgene durch Elektroporation mit siRNAs
erfolgreich vermindern konnte. Ziel der Runterregulierung war es, dadurch die
Funktion derselben Gene herauszufinden. Dafür wurden morphologische
Veränderungen in den Zellen, Effekte auf deren Viabilität und auf andere
Signalwege analysiert. Im Laufe meiner Arbeit konnte ich zeigen, dass eine
verminderete Expression von Tis11d und FKBP51 eine erhöhte Apoptose zur
Folge hatte. Daraus konnte geschlossen werden, dass Tis11d und FKBP51
womöglich in anti-apoptotischen Mechanismen in erythroiden Vorläuferzellen
involviert sind. Doch die genauen molekularbiologischen Hintergründe, sowie die
möglich involvierten Signalwege müssen noch ausführlicher untersucht werden.
III

Introduction
8
Abstract
Hematopoietic stem cells (HSCs) are able to self-renew and to differentiate into all
mature blood cell types, during erythropoiesis early erythroid progenitor cells
differentiate into enucleated red blood cells (RBC). Hematopoiesis and
erythropoiesis are complex processes, which have to be under strict control,
disturbance of the balance between self-renewal, proliferation and differentiation
results in severe diseases.
Steroid hormones, such as glucocorticoids, have been shown to be one of the key
regulators of the decision between self-renewal and differentiation into erythroid
progenitor cells. Glucocorticoids have been demonstrated to be involved in the
regulation of numerous other physiological and developmental processes
throughout the body, such as regulation of lipid and protein metabolism, regulation
of central nervous system functions and modulation of the immune system.
Glucocortiocids bind to their nuclear receptor (GR), which then functions as a
transcription factor and induces expression or inhibition of various target genes.
Glucocorticoid Receptor functions are essential for survival, since mice lacking the
GR die at birth and show defects on several organs (Cole et al., 1995).
In my diploma thesis I studied the function of the three different glucocorticoid
target genes: Raf-1, Tis11d and FKBP51. All of the experiments were performed in
a primary erythroid cell culture system, derived from umbilical cord blood.
During my diploma thesis I established a reliable and reproducible method for
transfection of human EPCs by electroporation. With this method I could
successfully knock down all three target genes by electroporation with
complementary siRNAs. Downregulation of Raf-1, Tis11d and FKBP51 gave us
insights into their function and the mechanisms in which they are involved during
erythroid cell proliferation and spontaneous differentiation. Morphological changes,
effects on the cell viability and changes in downstream signaling after the knock-
down were analysed. While there were no remarkable effects after the Raf-1
knock-down, we could show that downregulation of Tis11d and FKBP51 led to an
increase of apoptosis. This indicates that both GR-target genes are involved in
anti-apoptotic mechanisms within erythroid progenitor cells. The exact regulation
of the survival pathway needs further investigation.
IV
Introduction
9
1. Introduction
1.1 Human Hematopoiesis
Hematopoiesis is the process where all types of blood cells of the hematopoietic
system, the white leuko- and lymphocytes and the red blood cells, are formed from
hematopoietic stem cells (HSCs) (see figure 1 and 2) (Tsiftsoglou et al., 2009).
The red colour of the blood is the result of the accumulated hemoglobin in the
erythrocytes. Erythrocytes are responsible for the oxygen transport through the
body. As oxygen transport is a stressful process and is causing damage to the
erythrocytes, the lifespan of erythrocytes is limited to approximately 90 to 120 days.
Therefore it is essential for the organism to produce new red blood cells
throughout the whole life of an individual. This is achieved by differentiation of
hematopoietic stem cells into progenitor cells and finally into mature enucleated
erythrocytes (Orkin and Zon, 2008).
HSCs are able to perform self-renewal, which means that a cell can divide into
two daughter cells, where one cell is able to differente and the other cell is
maintained in the undifferentiated stem cell-like state. Due to its ability of self-
renew, one single hematopoietic stem cell could generate an entire hematopoietic
system and thereby maintain hematopoiesis for the lifetime of one individual (Orkin
and Zon, 2008; Renstrom et al., 2009).
The processes of self renewal and differentiation have to be strictly and tightly
controlled, and a failure in the regulation of HSCs can lead to a variety of diseases,
such as leukaemia or anaemia (Carlesso and Cardoso, 2010). (Carlesso and
Cardoso)
Primitive and definitive haematopoiesis
Human hematopoiesis can be divided into primitive and definitive hematopoiesis.
From week 3-6 of gestation, hematopoiesis takes place in the yolk sac (primitive
erythropoiesis), wheareas from week 6-22 the fetal liver functions as the primary
site of hematopoiesis; after this period the bone marrow becomes the predominant

Introduction
10
and lifelong site of blood-cell- production (definitive haematopoiesis, see figure 1)
(Bonifer et al., 1998; Palis and Yoder, 2001).
Figure 1: Human hematopoiesis
Hematopoiesis begins in the bone marrow, where a pluripotent long-term HSC
gives rise to a short-term HSC, which turns into a multipotent hematopoietic
progenitor cell. Such multipotent hematopoietic progenitor cells then undergo
several steps of differentiaton and generate the common myeloid progenitor
(CMP) and the common lymphoid progenitor (CLP), which can differentiate into
T- and B- lymphocytes, natural killer cells and dendritic cells.
The common myeloid progenitor cells turn into granulocyte-myeloid progenitors
(GMP) and into megakaryocytic/erythroid progenitors (MEP), which can
differentiate into erythroid burst forming unit-erythroid (BFU-E) and colony
forming unit-erythroid (CFU-E). The CFU-Es then mature into enucleated
erythrocytes (red blood cells, RBCs); (picture taken from Tsiftsoglou et al., 2009).

Introduction
11
Figure 2: Maturation and differentiation in human hematopoiesis Hematopoietic stem cells (HSC) give rise to all types of blood cells of the hematopoietic system. Blood cells can be classified into two main groups: lymphoid cells (T, B, and natural killer cells) and myeloid cells (granulocytes, monocytes, erythrocytes and megakaryocytes). (picture taken from: Alexander Fleming, Biomedical Sciences Research Center: www.fleming.gr/en/investigators/Strouboulis/index.htm)

Introduction
12
1.1.2 Hematopoietic stem cells and their niches
HSCs are able to self-renew and to differentiate into blood cells of multiple
lineages (see figure 1 and figure 2). The fate of stem cells is controlled by a
specific microenvironment, the stem cell niche (Renstrom et al., 2009). In adults
the niche of HSC is the bone marrow microenvironment, which provides intrinsic
and extrinsic factors crucial for the maintainance the stem cell properties of HSCs.
The stem cell niche is a highly organized three-dimensional microenvironment,
which consists of different cell types (the HSCs and other niche cells), soluble
factors derived from the niche cells (Lin, 2002) and the extracellular matrix, formed
mainly by fibronectin and collagen (Arai et al., 2005).
Within the stem cell niche cell-cell-interactions and interactions between the
HSCs and the extracellular matrix take place. Such interactions are essential for
the balance between self-renewal, differentiation and cell-cycle quiescence (see
figure 4) (Wilson and Trumpp, 2006).
The HSC niche consists of two parts: the vascular niche and the osteoblastic
niche (Yin and Li, 2006). The vascular niche supports the differentiation into
hematopoietic progenitor cells, whereas the osteoblastic niche maintains HSC in a
quiescent state with slow cycling or in G0-state. By keeping HSC in a quiescent
state it is ensured that their potential for long-term hematopoiesis is maintained
and premature exhaustion of HSCs is prevented (Shiozawa et al., 2008). In the
osteoblastic and vascular niche cytokine signaling pathways such as Ang-1/Tie2,
THPO/Mpl (see figure 3) and SCF/cKIT play an important role in the regulation
and maintainance of HSCs (Arai et al., 2009).
Angiopoietin-1 (Ang-1) is a ligand for the Tie2 receptor on the surface of HSCs.
By binding to its receptor, Angiopoetin-1 activates Tie2 and thereby promotes the
interaction of HSCs with the extracellular matrix of the niche. Thereby it induces
adhesion of HSCs to fibronectin and collagen, which keeps the HSCs within the
niche. The Tie2/Ang-1 signaling promotes quiescence, apoptosis protection as
well as tight adhesion. By preventing cell division of HSCs, Ang-1 maintains the
long-term blood-repopulating activity (Arai et al., 2005).

Introduction
13
Thrombopoetin (THPO) is produced in the osteoblastic island, THPO and its
receptor Mpl maintain HSCs quiescence. It has been demonstrated that inhibiton
of the Trombopoetin/Mpl signaling-pathway reduces the interactions of HSCs to
the niche and this susequentely results in reduction of the quiescent HSC
population (Arai et al., 2009).
Stem cell factor (SCF) is one of the most important hematopoietic growth factors.
It is produced by fibroblasts and endothelial cells within the niche and it stimulates
the proliferation of primitive hematopoietic cells. SCF binds to its receptor c-kit,
which is expressed on the surface of HSCs. The SCF/c-kit signaling plays an
important role in migration, survival, proliferation and differentiation of HSC in the
bone marrow niche (Nakamura et al., 2004). It has been reported that loss of SCF
leads to hematopoietic failure (Bernstein et al., 1991) and that SCF might
therefore have an essential role in the control of HSC activation and the
mobilization of HSCs from the niche into the blood stream (Heissig et al., 2002;
Yin and Li, 2006).
Under stress and injury, the c-kit ligand is converted into soluble Kit ligand (s-kit),
it can bind to SCF with the same affinity as c-kit. Thereby s-kit inhibits the ability of
SCF to bind to the HSC. This inhibition stimulates the entry of HSCs into the cell
Figure 3: The HSC niche Cytokine signaling pathways such as THPO/Mpl and Ang-1/Tie2 between HSCs and osteblastic niche cells promote cell adhesion, which contributes to HSC quiescence.
(taken from: Arai et al., 2009)

Introduction
14
cycle, the mobilization to the vascular niche and the differentiation. The
Mechanisms that regulate the HSCs mobilization are not fully understood up to
now (Nakamura et al., 2004).
Figure 4: Niches for HSCs in adult bone marrow
The niche in the bone marrow (a,b) can be divided into two parts: the osteoblastic niche and the vascular niche (c). While the vascular niche supports the differentiation into hematopoietic progenitor cells and the mobilization into the blood stream (d), the osteoblastic niche keeps the balance between self-renewal and cell-cycle quiescence. (e) In the osteoblatic niche the HSCs adhere to the niche cells through the adhesion molecules and through factors produced by osteoblasts so that the HSCs are kept in a quiescence state. Picture taken from: (Shiozawa et al., 2008)

Introduction
15
1.2 Human erythropoiesis
During erythropoesis, early erythroid progenitor cells differentiate into enucleated
red blood cells (RBC) (Palis, 2008). Eryhtropoiesis is a process of multiple stages
and depends on the correct balance between cell proliferation, differentiation and
apoptosis (Orkin and Zon, 2008; Weissman, 2000). The disruption of this
equilibrium/balance leads to haematological diseases like aplastic anaemia and
thalassemia (Testa, 2004).
Figure 5 a):
Erythropoiesis is a process of multiple differentiation
steps , see figure 5 a) and figure 5 b):
The myeolid stem cell gives rise to the pronormoblast.
When the cytoplasm becomes more basophilic due to
the presence of ribosomes, the pronormoblast has
turned into a basophilic normoblast.
During the ongoing development the nucleus shrinks,
the cell becomes smaller and begins to produce
hemoglobin. At this stage the cell is called
polychromatophilic normoblast.
When the nucleus moves to the periphery of the cell and
the cytoplasm becomes more eosinophilic, the cell
converts into an orthochromatic normoblast.
When the orthochromatic normoblast extrudes its
nucleus, it enters the blood circulation as a
reticulocyte. Reticulocytes were named after the
characteristic reticular networks of polyribosomes which
they contain. After 1-2 days reticulocytes loose their
polyribosomes and become mature red blood cells
(erythrocytes).
Mature erytrhocytes are biconcave disks without
nucleus, mitochondria and other organelles and their
main function is to bind oxygen through the
accumulated hemoglobin (Tsiftsoglou et al., 2009).
Picture taken and modified from: http://sakurako.iza.ne.jp/blog/entry/1362003/

Introduction
16
Figure 5 b): The differentiation steps in erythropoiesis Hematopoietic stem cell becomes commited (pronormoblat) and differentiates into early basophilic normoblast, which contains ribosomes (phase 1), then the the basophilic normoblast (or early erythroblast) accumulates iron and hemoglobin (phase 2) and finally ejects organelles and the nucleus (phase 3) and is released into blood stream as a reticulocyte, where it differentiates into a mature erythrocyte. Picture from taken from: http://legacy.owensboro.kctcs.edu/gcaplan/anat2/notes/Notes6%20Blood%20Cells.htm
When erythrocytes differentiate starting from HSC, the cells undergo characteristic
changes: The nucleus of hematopoietic stem cells is big and contains open
chromatin. When HSC mature into red blood cells, the chromatin of the nucleus
condenses and the cytoplasmic matrix increases in amount, the cytoplasm turns
from basophilic to acidophilic due to the decrease in the amount of RNA and DNA,
the nucleus decreases in size and is finally extruded. In the process of maturation
a basophilic pronormoblast is converted from a cell with a large nucleus and a
volume of 900 fL to an enucleated disc with a volume of 95 fL (Testa, 2004).
1.2.1 Erythropoiesis takes place in erythroblastic islands
Erythropoiesis takes place in the bone marrow in the so called erythroblastic
islands (Allen and Dexter, 1982). Erythroblastic islands are microenvironmental
compartments, where erythroblasts proliferate and differentiate into mature
reticulocytes (Bessis, 1958). Those islands consist of a central macrophage
surrounded by developing erythroblasts of various differentiation stages (see
figure 6) (Bessis, 1958; Tsiftsoglou et al., 2009).
The number of erythroblasts surrounding the macrophages can vary from 5 to 30
erythroblasts per island. Erythroblastic islands are distributed over the entire bone
marrow and are not localized to specific regions (Chasis, 2006).

Introduction
17
The central macrophage has been shown to function as a “nurse” cell, as it is
providing the iron for the hemoglobin synthesis and other nutrients needed for
erythropoiesis (Bessis and Breton-Gorius, 1962). It gives proliferative and survival
signals to the erythroblasts and takes up the nuclei from the enucleated
orthochromatic normoblasts by phagocytosis (Chasis, 2006; Skutelsky and Danon,
1972). There is also evidence that macrophages are promoting the enucleation
itself. The cultivation of erythroblasts in the absence of macrophages leads to
decreased erythroid cell proliferation, maturation and enucleation as well as
increased apoptosis (Chasis and Mohandas, 2008).
Macrophages secrete several cytokines, which stimulate the differentiation and
proliferation, like for example insulinlike growth factor-1 (IGF-1), that has been
shown to stimulate growth of erythroblasts (Kurtz et al., 1982).
In macrophages also the mRNA of erythropoetin (EPO) has been detected (Rich
et al., 1988), which suggests that they could provide EPO to the surrounding
erythroblasts and thereby stimulate differentiation and inhibit apoptosis.
Within the erythroblastic islands erythropoesis is regulated by positive and
negative feedback loops, which occur by soluble factors. Such soluble factors are
for example SCF, EPO and VEGF, which activate erythropoiesis via positive
feedback mechanisms, whereas IL-6, TGF-ß, TNF-α and IFN- are inhibiting
erythropoiesis and promoting cell death of erythroblasts. IL-6, for example, is
inhibiting the iron release from the central macrophage in the erythroblastic island
(Tsiftsoglou et al., 2009).
Also the cell-cell interactions between the erythroblasts and the central
macrophages trigger intracellular signaling pathways, which then lead to changes
in differentiation-, proliferation- and apoptosis- related processes (Chasis and
Mohandas, 2008). And components of the extracellular matrix, like fibronectin
and laminin influence terminal differentiation and migration of erythroid cells by
interacting with fibronectin receptors on the surface of erythroblasts (Chasis and
Mohandas, 2008).

Introduction
18
Erythroblastic islands
a)
b)
Figure 6: Erythropoiesis occures in erythroblastic islands
a) Developing erythro-blasts of different stages of maturation surround a central macrophage, which is providing iron for the hemoglobin synthesis, takes up extruded nuclei from differentiating normo-blasts and thereby stimu-lates the differentiation into reticulocytes. (Chasis and Mohandas, 2008) b) Scanning electron micrograph of an isolated erythroblastic islands. Arrow shows enucleating erythroblast. (Chasis and Mohandas, 2008)

Introduction
19
1.3 Clinical use of HSCs
During postnatal life HSCs populate a very small compartment, less than 0,05%
up to 0,5% of the cells in the bone marrow consist of HSCs (Gunsilius et al.,
2001), it is estimated that 1 in 10,000 bone marrow cells and 1 in every 100.000
blood cells are hematopoietic stem cells. HSCs can be used to treat bone marrow
failure and aplastic anaemia by transplantation of HLA-identical allogeneic
hematopoietic progenitors (Congdon, 1957; Kondo et al., 2003). The source of
HSCs for transplantation can be the bone marrow, but also autologous HSCs
isolated from peripheral blood can be used for restoration of hematopoiesis in
patients with malignant diseases after chemotherapy (Gunsilius et al., 2001).
Another clinical use in the future could be the use of genetically modified HSC to
cure metabolic defects even at embryonal stage, but this method is still under
investigation and is still far away from clinical use. After transplantation of
allogeneic or autologous HSCs, hematopoiesis can be restored and maintained by
a small number of clones. Besides bone marrow and mobilised peripheral blood, in
the last years umbilical cord blood was found to be a good source of
hematopoietic stem cells.
.
Figure 7: Clinical use of HSCs isolated from umbilical cord blood (picture taken from: www.vivocell.org)

Introduction
20
Compared to the bone marrow, the use of mobilized blood stem cells from the
peripheral blood or the cord blood has the advantage of a more rapid
hematopoietic recovery, therefore they are slowly replacing the bone marrow as
alternative source of stem cells. The umbilical cord blood is richer in stem cells
with a higher proliferative potential than bone marrow or peripheral blood
(Gunsilius et al. 2001). But the drawback is that just a limited number of HSCs can
be isolated from a single umbilical cord blood sample. The required amount of
HSC for transplantation is 2x10⁶ CD34+ cells/kg body weight. In umbilical cord
blood, the percentage of CD34 + stem cells is about 1% of the mononucleated
cells. Therefore, the minimum cell dose required for restoration of haematopoiesis
in adult patients can usually not be reached using HSCs from a single umbilical
cord blood sample. One solution for the problem of too low HSC numbers isolated
from one cord blood could be the in vitro expansion of HSCs leading to cell
numbers that are high enough for the transplantation in adults. Therefore CD34+
cells could be cultivated for seven to 14 days in a liquid culture system with a
combination of various cytokines (e.g. SCF, IL-3, IL-6, EPO) and then re-infused to
the patients. But it has been reported that expansion of HSC in vitro led also to
differentiation of the cells, whereby the stem cell potential and the life-long self-
renewal capacity of the expanded cells got lost (Gunsilius et al., 2001).

Introduction
21
1.4 Erythroid cells in culture
Although up to know the expansion of HSCs is not optimised yet, the cultivation of
primary erythroid progenitor cells isolated from human cord blood is a valuable
model system for the study of hematopoiesis in vitro or ex vivo. Mononuclear cells
can be isolated from human cord blood samples, expanded in serum free medium
to human erythroid progenitor cells (hEPCs) and subsequentlty induced for
terminal erythroid differentiation (Dolznig et al., 2005; Leberbauer et al., 2005).
The so expanded EPCs show renewal and differentiation characteristics, which
are similar to the in vivo situation. In comparison to other primary model systems,
which often suffer from insufficient cell numbers or from heterogeneity of cell
populations, the EPCs can be expanded to high numbers keeping a homogeneous
cell population.
Steady state erythropoiesis involves just a limitied number of differentiation
divisions and is controlled mainly by Erythropoietin (EPO). Stress erythropoiesis
in vivo is induced by hypoxia or anaemia and is co-regulated by erythropoietin,
stem cell factor and glucocorticoids. Ex vivo expanded erythroid progenitor cells
mimic the process of stress erythropoiesis, as they are cultivated in serum free
medium, which is supplementd with those factors, which are active in stress
erythropoiesis: low EPO, SCF and DEX (Dolznig et al., 2005; Kolbus et al., 2003).
In this model system, cells retain the proerythroblast phenotype, but can also be
induced to terminally differentiate, if the renewal factors are replaced by
differentiation factors: high EPO, Insulin (Dolznig et al., 2005).
This in vitro expansion system can be used as a model to study molecular and
cellular events of hematopoiesis and additionally used to find the best conditions
to enable an in vitro expansion of hematopoietic stem cells to high numbers of
progenitor cells, which then could be used for transfusion in patients suffering from
hematological disorders.

Introduction
22
1.4.1 Growth factors for in vitro proliferation
For in vitro expansion of human erythroid progenitor cells, the mononuclear cells
isolated from cord blood samples can be cultivated in serum free medium,
supplemented with a factor mix of EPO, SCF, DEX, IGF-1 and Lipids.
EPO- Erythropoietin
Epo is one of the most important factors in the regulation of erythropoiesis, it is
produced mainly in the fetal liver and the adult kidney. EPO binds to its receptor
(EpoR), which is a member of the hematopoietic cytokine receptor superfamily,
whereby the receptor undergoes a conformational change and activates several
pathways. Signal transduction by EPO is mediated through the EpoR/Jak2/Stat
signalling cascade (Miura et al., 1994; Witthuhn et al., 1993). It has been reported
that EPO protects erythroid progenitor cells from apoptosis by activating
antiapoptotic proteins like Bcl-X(L) (Dolznig et al., 2002) and that it is essential for
terminal differentiation by stimulating hemoglobin synthesis (Dorn et al., 2008).
EPO-deficient mice or mice lacking the EpoR die at the embryonic stage of
abscence of definitive erythrocytes (Lin et al., 1996).
SCF- stem cell factor
SCF is an important proliferation factor that plays an essential role in
hematopoiesis: it promotes proliferation of erythroid progenitor cells by stimulating
DNA synthesis (Dorn et al., 2008). SCF is a member of the type III superfamily of
receptor tyrosine kinases. It is expressed mainly in hematopoietic progenitor cells,
B- and T- cell progenitors, mast cells and germ cells (Tsiftsoglou et al., 2009).
In mice deficient for the receptor of SCF, c-Kit, erythrocytes are generated, but
these KO-mice die at birth because of severe anaemia and their bone marrow
contains a reduced number of erythroid progenitors (Broxmeyer et al., 1991;
Nocka et al., 1990).
SCF and EPO are both required for the proliferation and survival of erythroid
progenitor cells in vitro. During terminal erythroid differentiation, the stem cell
receptor c-kit is downregulated, whereas EPO becomes the essential survival
factor. If EPO and SCF were added simultaneously to an in vitro culture of hEPCs,

Introduction
23
it has been shown that the proliferative effects were additive, which suggests that
SCF and EPO might cooperate with each other. Importantly, when EPO was
added alone and in higher concentrations, differentiation was induced (Muta et al.,
1995; Muta et al., 1994).
DEX- Dexamethasone
Addition of glucocorticoids, like Dexamethasone (DEX), is required to ensure
optimal proliferation rates of in vitro cultures with low spontaneous differentiation.
Dexamethasone regulates a variety of developmental processes by binding to the
glucocorticoid receptor (GR) and thereby activating the glucocorticoid receptor
pathway. Leberbauer et al. could demonstrate that dexamethasone stimulates
proliferation and blocks spontaneous differentiation of erythroid progenitors
(Leberbauer et al., 2005). In vivo the GR is required for stress erythropoiesis. It
has been reported that GR-deficient- mice are viable, show normal erythropoiesis,
but show no stress-induced erythrpoiesis in spleen, which means they could not
respond to hypoxia or blood loss with increased erythroblast renewal (Bauer et al.,
1999). In chicken and mouse erythroblasts, the activated GR cooperates with the
activated EpoR and c-kit (SCF receptor). This cooperation keeps erythroid
progenitor cells in an immature state and induces long-term proliferation (Wessely
et al., 1997). A similar effect of glucocorticoids has been described in human
erythroblasts (von Lindern et al., 1999).
IGF-1- Interleukin-growth factor-1
Panzenböck et al. demonstrated that addition of Interleukin-growth-factor-1
(IGF-1) to the serum-free cultures also stimulates proliferation and inhibits
differentiation of hEPCs. IGF-1 appears not to be a crucial growth factor, but it
does further improve the proliferation conditions (Panzenbock et al., 1998).
Lipids
In addition, cholesterol-rich Lipids were found to be essential for the extended
proliferation of human EPCs. Addition of Lipids extended the proliferation periode
from 30 to 45 days (Leberbauer et al., 2005).

Introduction
24
Addition of fetal bovine serum (FBS) was shown to limit the expansion of
erythroid progenitor cells compared to serum-free medium, even when the crucial
factors like EPO, SCF and DEX were provided (Leberbauer et al., 2005).
In summary, a combination of EPO, SCF, IGF-1, DEX and Lipids in serum free
media are the best culture conditions to reach optimal proliferation rates of human
erythroid progenitor cells.
1.5 Glucocorticoid Receptor (GR)
Glucocorticoids have an important function in multiple physiological and
developmental processes. By binding to its receptor (GR), glucocorticoids
modulate the activity of various target genes, which then influence the
differentiation and proliferation of e. g. hematopoietic stem cells.
The GR cooperates with the activated EpoR (EPO Receptor), and c-Kit (SCF
Receptor) to maintain erythroid cells in an immature state, inhibit terminal
differentiation and to maintain the long-term proliferation potential of these cells
(Dolznig et al., 2006; Srivastava et al., 2006).
The Glucocorticoid Receptor is a steroid hormone receptor that belongs to the
nuclear receptor superfamily of transcription factors (Revollo and Cidlowski, 2009).
Glucocorticoids are the most widely prescribed pharmaceuticals worldwide and
key drugs for treating disesases like hematological cancers (leukemia,
inflammatory states). The GR has a DNA binding domain (DBD) with which it can
interact directly with target genes that contain a glucocorticoid response element
(GREs) or a negative glucocorticoid response element (nGREs) in their promotor
region, see figure 8 (Wessely et al., 1997).
The Glucocorticoid Receptor is a ligand-regulated transcription factor, which in
abscence of glucocorticoids is situated in the cytoplasm in an inactive form, where
it is associated with the heat shock protein 90 chaperone complex, that keeps the
receptor inactive (Paakinaho et al.).

Introduction
25
Figure 8: The Glucocorticoid Signaling Glucocorticoid signaling induces changes in gene expression. When Glucocorticoids bind to the GR, the ligand-bound-GR-complex dissociates and translocates into the nucleus, where it can activate or inhibit gene expression by protein-protein interaction with Transcription factors, like STAT5 or NFkB or by directly binding to DNA with their DNA binding domain via GRE or nGREs (GRE=Glucocorticoid Response Elements) (nGREs=negative Glucocorticoid Response Elements); (picture taken from: (Revollo and Cidlowski, 2009).
Introduction
26
1.5.1 Glucocorticoid signaling
When the ligand (different glucocorticoids) binds to its receptor (GR), the receptor
is activated, and dissociation of the Ligand-bound-GR-complex is induced (Amaral
et al., 2009; Stellacci et al., 2009). The activated receptor then translocates to the
nucleus, where it acts as a transcription factor and influences gene expression in
two ways:
It can either activate or inactivate gene expression:
→ by protein-protein interaction: it associates directly with transcription factors,
like STAT5 or NF-kB, and thereby activates or inhibits the transcription of specific
target genes.
→ by direct DNA binding: it can directly bind to target genes on DNA level by
associating with high affinity to short DNA sequences (DNA binding sites: via
GREs and nGREs) (Revollo and Cidlowski, 2009).
1.5.2 Glucocorticoid Receptor and erythropoiesis
The Glucocorticoid Receptor is a key regulator of the decision between self
renewal and differentiation of erythroid progenitors.
Dexamethasone in combination with SCF and EPO, has been shown to down-
regulate GATA-3 expression and to up-regulate the expression of GATA-1
(Srivastava et al., 2006).
GATA-1 and GATA-3 are members of the GATA gene family. Members of this
family are expressed at very early stages of hematopoiesis and are key regulators
of proliferation and survival of early hematopoietic cells under the influence of
factors such as glucocorticoids, SCF and EPO (Srivastava et al., 2006). In media
lacking a GR ligand or containing a GR antagonist, erythroid progenitors faile to
self-renew (Wessely et al., 1997). In avians glucocorticoids were shown to
stimulate the formation of erythroid colonies in vitro. In the presence of
glucocorticoids lower concentrations of erythropoietin are required to induce
maximal erythroid cell proliferation (Udupa et al., 1986).

Introduction
27
1.5.3 Glucocorticoid Receptor target genes
In a microarray screen performed with RNA from EPCs stimulated with
Dexamethasone (alone or in combination with different factors), several target
genes of the GR have been identified, as they were either upregulated or
downregulated in the prescence of DEX (Kolbus et al., 2003; Rubiolo et al., 2006)
and data not shown). The most prominent upregulated GR-targets genes were:
Raf-1, Tis11d and FKBP51.
Raf-1
Raf-1 is a 74 kDa serine/threonine kinase that is located in the cell cytoplasm
and is activated by phosphorylation (Muszynski et al., 1997). The Raf kinases are
key signal transducers that are activated by mitogens or oncogenes.
During differentiation of primary mouse erythroblasts Raf-1 has been
demonstrated to be downregulated (Kolbus et al., 2002).
Raf-1 deficient mouse embryos are anaemic, and die at midgestation with
anomalies in the placenta and fetal liver, which contained lower numbers of
erythroid progenitors than the wild type livers (Mikula et al., 2001). The in vivo and
in vitro studies with genetically modified fibroblasts and hematopoietic cells
(Kolbus et al., 2002; Mikula et al., 2001), revealed that in summary in the mouse
system the main functions of Raf-1 are:
→ the inhibition of apoptosis
→ the stimulation of proliferation and
→ the regulation of erythroid maturation by delaying erythroid differentiation
through inhibition of caspase activation.
Tis11d
Also Tis11d, a zinc-finger-like protein and member of the TTP protein family,
has been shown to be a GR- target gene in erythroid progenitor cells. Members of
the Tis11-family of proteins contain two tandemly repeated zinc finger motifs, by
which they can bind to adenine-urididine rich elements in different mRNAs. They

Introduction
28
have been reported to induce degradation of a variety of different mRNAs,
containing AU-rich elements in the 3’ untranslated region (Baou et al., 2009).
Since many mRNA transcripts contain AREs, it is possible that glucocorticoid
signaling regulates the expression of many genes in this manner (Revollo and
Cidlowski, 2009). Little is known about the function of Tis11d in humans and
generally in erythropoiesis. Glucocorticoids have been reported to induce TIS11
mRNA and protein in lung epithelial cells and this induction may be important for
the glucocorticoid mediated control of inflammatory gene expression (Smoak and
Cidlowski, 2006). It has been demonstrated that fetal liver cells isolated from
Zfp36l2 knock-out mice (Zfp36l2 is the synonym for Tis11d in the mouse system)
were unable to reconstitute the hematopoietic systems in lethally irradiated WT-
mice, which suggests that Zfp36l2 might be required for self-renewal and
maintenance of adult HSCs (Stumpo et al., 2009). These studies demonstrate that
Zfp36l2 plays an important role in definitive hematopoiesis during mouse
development, but little is known about the specific function of Tis11d in human
erythropoiesis.
FKBP51
FKBP51 (FK506-binding protein 51) is a 51 kDA co-chaperone protein, which
belongs to the immunophilin protein family and is a component of the heat shock
protein 90 chaperone complex (HSP90 complex). This immunophilin has
isomerase activity, which performs important biological functions in the cell. The
immunophilin family is a highly homologous multigene family, which is containing
at least 5 other proteins, that can bind to the protein FK506 (Park et al., 2007;
Romano et al.). In a recent genome-wide profiling of human lung biopsies,
FKBP51 has been identified as the most highly glucocorticoid-induced gene
(Woodruff et al., 2007). FKBP51 is expressed in various human cell tissues,
mainly in brain, muscle, liver and thymus (Vermeer et al., 2003). Overexpression
of FKBP51 limits the Glucocorticoid Receptor signaling. In human A549 lung
cancer cells, glucocorticoid (Dex) exposure led to a rapid accumulation of FKBP51
mRNA (Paakinaho et al.). The specific function of FKBP51 in hematopoietic cells
is not fully understood up to now, but it is estimated that it may play an important
role in cell survival, proliferation and differentiation (Giraudier et al., 2002).

Introduction
29
1.6 Apoptotic pathways
Apoptosis or programmed cell death is a highly regulated process, which allows a
cell to self-degrade. Cell death is a fundamental cellular response that plays an
important role in development and homeostasis of multicellular organisms.
As shown in figure 9 below, apoptosis involves specific morphological and
biochemical changes within the cell, such as cytoplasm condensation, nucleus
shrinkage, nuclear chromatin condensation, loss of mitochondral membrane
potential and DNA fragmentation. These processes are then followed by breakage
of the cells into membrane-bound apoptotic bodies, that contain a variety of
cytoplasmic organelles and nuclear fragments, which finally are engulfed by
surrounding cells (Testa, 2004; Van Herreweghe et al., 2010). The apoptotic
process can be divided into three phases: initiation, integration/decision and
degradation. The initiation stage is heterogenous and depends on the type of
apoptosis-inducing stimulus. During the integration phase caspases and
mitochondrial effectors are activated, while in the execution stage the cell is
broken into cell fragments.
Figure 9: Morphological changes within the cell during the apoptotic process (picture taken from: www.scq.ubc.ca/apoptosis)

Introduction
30
The cysteinyl aspartate proteinases, called Caspases play a central role in the
regulation and control of apoptosis. They are a group of evolutionarily conserved
proteases, which can be found in nearly all animal cells. In recent years it has
been shown that Caspases are not only involved in apoptosis, but also in other
cellular processes. High levels of Caspase activation lead to apoptosis, whereas
low levels of activated Caspases have been shown to play a role in cell
proliferation and differentiation of erythroid cells and macrophages (Droin et al.,
2008). Caspases are synthesized within a cell as inactive percursors: the
Procaspases. The inactive percursors can be activated by cleavage into a big and
a small subunit. Caspases can be classified into Initiator Caspases (Caspase-2, -
8, -9, -10) and Effector Caspases (Caspase-3, -4, -5, -6, -7, -11, -12, -13).
Initiator Caspases function as activators of Effector Caspases. Caspase-8 for
example promotes cleavage and thereby activation of various downstream
Caspases, such as Caspase-3, -6 and -7. Activated Effector Caspases in turn
induce degradation of regulatory proteins within the cell (Amaral et al., 2009; Van
Herreweghe et al., 2010).
When cells undergo apoptosis several pathways can be involved. In mammalian
cells the apoptotic response is mediated either by an instrinsic or extrinsic pathway.
Both pathways are Caspase-dependent, but different Caspases are involved.
The extrinsic pathway is initiated through the stimulation of transmembrane death
receptors, such as TNF-Receptor1 (TNF-R1) or Fas, which are located on the
surface of the cell membrane, wheareas the intrinsic pathway is initiated through
the release of signalling factors by mitochondria within the cell.
1.6.1 The extrinsic pathway
In the extrinsic pathway (see figure 10 and 11), soluble ligands, such as FasL or
TNF-α, bind to their transmembrane death receptors. For example TNF-α binds
to the TNF-R1 and FasL binds to the Fas-Receptor. The binding of TNF-α to the
TNF-R1 induces a conformational change of the receptor. This conformational
change leads to recruitement of RIP1 (protein serine-threonine kinase 1) and
binding of the adaptor protein TRADD (TNF-receptor associated via death domain)
to the death domain (DD) of the receptor on the cytoplasmic side (see figure 10).

Introduction
31
Subsequently, TRADD recruites FADD (Fas-associated via death domain),
another adaptor protein, which binds to the TRADD/RIP-complex on the death
domain of the receptor. FADD then induces recruitement of the Procaspase-8 (an
Effector Caspase) to form the death-inducing signal complex (DISC).
At a high concentration, the Procaspase-8 induces its autoproteolytic activation
and is further activated by dimerisation into the active Caspase-8 form. This
activation is sufficient to induce apoptosis. In the extrinsic pathway, the activated
Caspase-8 directly activates the Effector Caspase Caspase-3, which initiates the
degradation of the cell and thereby induces apoptosis (Amaral et al., 2009; Van
Herreweghe et al., 2010).
Figure 10: The extrinsic
and instrinsic pathway
If TNF-α binds to its receptor
TNF-R, a conformational
change of the receptor is
induced and the
RIP1/TRADD/FADD complex
is build. By binding to this
complex the Caspase-8 is
activated and apoptosis is
induced either through the
extrinsic or intrinsic pathway.
In the extrinsic pathway
Caspase-8 induces direct
Caspase-3 activation, where-
as in the intrinsic pathway
Caspase-3 activation is
induced after activation of
proteins of the BCL-2-family.
Picture taken and modified
from:
(Rahman and McFadden,
2006).

Introduction
32
1.6.2 The intrinsic pathway
The intrinsic pathway (see figure 11) is regulated by proteins of the BCL-2-family,
such as BAX (Bcl-2-associated X protein) and BAK (Bcl-2- antagonist/killer),
which are activated by BID (BH3 interacting domain death agonist). These pro-
apoptotic proteins are crucial in regulating a wide range of apoptotic stimuli. The
antiapoptotic members of the BCL-2-family like Bcl-2, are mainly localized in the
outer mitochondrial membrane, wheareas proapoptotic members, such as BAX
and BAK are situated in the cytosol as inactive percursors. After induction of
apoptosis, BAK and BAX undergo conformational changes, oligomerize and
translocate from the cytosol to the outer mitochondrial membrane.
The intrinsic pathway is triggered by cellular stress or activated Caspase-8. Active
Caspase-8 can cleave BID to tBID, which in turn activates BAX and BAK. Active
BAX binds to its receptors in the outer membrane of the mitochondria. The
insertion of BAX in the mitochondrial outer membrane is required for the pore
formation, which results in mitochondrial outer mebrane permeability (MOMP).
This permeability induces the release of cytochrome c and other mitochondrial
factors. Cytochrom c then binds to the subunit of APAF-1 (apoptotic peptidase
activating factor 1), which induces conformational change of APAF-1 and thereby
its activation through hydrolysis of ATP.
A complex of seven activated APAF-1-molecules is forming the so called
apoptosome, which binds to the Procaspase-9 (Initiator Caspase) and induces its
activation. The so activated Caspase-9 is interacting with the apoptosome, and
thereby inducing the activation of Procaspase-3 or -7 by proteolytic cleavage.
Activated Caspase-3 and -7 are then inducing cell degradation and apoptosis by
cleavage of many proteins from different cellular compartments, leading finally to
the cellular disintegration (Amaral et al., 2009; Van Herreweghe et al., 2010).

Introduction
33
1.6.3 NF-kB activation inhibits apoptosis
Binding of TNF-α to its receptor, can either induce apoptosis through the extrinsic
or intrinsic pathway, or activate NF-kB (nuclear factor kappa B) (see figure 11).
The transcription factor NF-kB plays a critical role in inflammation, control of cell
death pathways and cell proliferation. There are 5 known members of the NF-kB
family: NF-kB1 (p50/p105), NF-kB2 (p52/p100), c-Rel, RelB and RelA (p65). All
different members are distinguished by the Rel homology domain, the part of the
protein that controles the DNA binding. They form various homodimers and
heterodimers bound to DNA (Adli et al., ; Bouwmeester et al., 2004).
The transcriptional activity of NF-kB is controlled by its intracellular localization.
NF-kB is located as an inactive form in the cytoplasm, where it is associated with
the inhibitor proteins IkBs. In most mammalian cells, IkBα and IkB-β represent
the two major forms of the IkB family. The phosphorylation of the serine residues
of the IkB proteins leads to the proteolysis by the 26S proteasome, which results in
the liberation of NF-kB and its translocation into the nucleus.
It has been demonstrated that the NF-kB pathway can be induced by TNF-α
(Bouwmeester et al., 2004). Thus, RIP-1, which together with TRADD is bound to
the death domain of the activated TNF-R1, leads to direct association of TRAF2.
The binding of TRAF2 to the RIP-1/TRADD/TNF-R1 complex is crucial for the
activation of the NF-kB pathway. TRAF2 recruits the multicomponent protein
kinase IKKαβ, which is then activated and phosphorylated by RIP1. IKK can be
activated by phosphorylation in response to a variety of stimuli not only by the
TNF-R (see chapter 4.3 of this study). pIKKαβ in turn phosphorylates IkB-α, which
leads to degradation of IkBα and NF-kB release.
NF-kB translocates to the nucleus and thereby accumulates and mediates the
transcription of anti-apoptotic factors and of a variety of proteins, which are
involved in cell survival and proliferation (Komura et al., 2005; Merkhofer et al.).

Introduction
34
Figure 11: TNF-α mediated pathways If TNF-α binds to its receptor TNF-R1, either apoptosis can be induced or NF-kB is activated. After building of the RIP1/TRADD/FADD complex either Caspase-8 is activated and apoptosis is induced through the extrinsic or intrinsic pathway, or NF-kB is activated, through phosphorilation of IKK, which in turn phosphorilates IKB and induces release of NF-kB into the nucleus, where it can stimulate the expression of different pro-apoptotic genes. (Picture taken
and modified from: Krakstad and Chekenya, 2010). (Krakstad and Chekenya)

Introduction
35
1.7 Cell-surface markers for human erythroid progenitor cells
Figure 12: Characterization of hEPCs (d14) regarding their surface markers by FACS analysis (picture taken with the consent of Dr. Mario Mairhofer)
Erythroid progenitor cells can be distinguished by their surface markers:
depending on their stage of differentiation they express different types of markers.
In humans CD34 was described as a marker for hematopoietic stem cells
(Gangenahalli et al., 2006). CD34 expression has been found in immature stem
cells and committed progenitors. One to three percent of cells in the bone marrow
express CD34, whereas in the peripheral blood CD34+ cells are extremely rare
(less than 0,1%). In umbilical cord blood around 1% of the mononuclear cells
express CD34. With the increase of differentiation the expression level of CD34
decreases (Baum, Christopher 2009, Genetic Modification of Hematopoietic Stem
Cells. Methods in Molecular Biology, volume 506, Springer Protocols, page 13.).
In the present study, cultures of hEPCs isolated from umbilical coord blood are
used. These cells are negative for CD34, but express high levels of CD71, CD36,
CD29, CD44, CD117 and CD235a.
R1
CD36 CD71 CD117 CD33
CD133
CD44
CD31
CD235a CD29 CD45 CD30 CD14

Introduction
36
CD71 (the transferrin receptor) is expressed on many proliferating cells, but the
very strong, homogeneous expression is characteristic for erythroid cells. The
transferrin receptor CD71 is needed for the iron transport into proliferating cells,
and it is lost when hEPCs differentiate into mature erythrocytes (Leberbauer et
al., 2005).
CD36 is a receptor for thrombospondin and is a very early marker for erythroid
maturation, it is found on the surface of erythroid progenitors, but also on
monocytes and platelets, but not on lymphocytes and granulocytes.
CD29, also known as integrin-ß-1, is a transmembrane glycoprotein, which
forms heterodimers with integrin alpha subunits. It can mediate a variety of
cellular responses including adhesion, proliferation and differentiation.
CD44 is it is a cell adhesion receptor that binds to components of the
extracellular matrix and is widley expressed on hematopoietic and non-
hematopoietic cells. Bone marrow derived progenitor cells, which are
expressing CD44, have been shown to be able to repopulate the thymus
(Rajasagi et al., 2009).
CD117, the c-KIT receptor, is a tyrosine kinase receptor. High CD117
expression is typical for erythroid progenitors. As already mentioned SCF and
its receptor play an essential role in the proliferation and differentiation of HSCs
and hEPCs. Leberbauer et al. reported that freshly isolated mononuclear cells
from human cord blood expressed very low CD117 levels, while around d14 of
the cell culture almost 100% of the cells were CD117 positive (Leberbauer et
al., 2005).
CD235a, also known as Glycophorin A, is a transmembrane glycoprotein that
is expressed on mature erythrocytes and erythroid precursors (Auffray et al.,
2001). It is a marker for erythroid differentiation, the more differentiated the
cells are, the higher Glycophorin A expression is.

Introduction
37
1.8 RNA interference (RNAi) pathway
In this study the Glucocorticoid Receptor target genes were downregulated by a
knock-down approach via electroporation with siRNA- oligonucleotides. Silencing
of a target mRNA by siRNAs is a powerful tool to study gene function. siRNAs are
double-stranded RNA (dsRNA) molecules of 21-23 nucleotides with characteristic
2-nucleotide overhanging 3’ ends (Tulac et al., 2004). Through the electroporation-
method target genes can be silenced post- transcriptionally by sequence-specific
mRNA degradation. Normally siRNAs act as intermediates in the RNA
interference pathway (RNAi) (see figure 13), which is active in the cells to protect
mammalian cells from infection by a variety of viruses (Zamore and Aronin, 2003).
Therefore the ribonuclease Dicer generates siRNAs by cleaving long dsRNAs. In
the RNA-interference pathway siRNA strands associate with another set of
proteins to form a protein-enzyme complex, called RNA-induced silencing
complex (RISC).
Figure 13: RNA- interference pathway (picture taken from: http://hades1.bioquant.uni-heidelberg.de/rnai.html)
RISC directs the protein-enzyme
complex to mRNAs which are
complementary to the siRNA strand.
After binding to the mRNA, RISC
induces mRNA-degradation by
cutting it once. After cleavage the
RISC-complex binds to the next
complementary mRNA and begins
with a new cycle of mRNA-
cleavage. With this mechanism
siRNAs are able to induce
degradation of complementary
mRNAs, which has made siRNAs to
an important tool for knock-down
induction of various target genes
(Zamore and Aronin, 2003).

Introduction
38
1.8.1 The electroporation method
siRNAs can be introduced into cells by electroporation. In the 1970s it has been
demonstrated for the first time that applying electrical pulses to cells enabeles
increased uptake of biological materials into cells. Nowadays, electroporation has
become an important tool for nucleic acid delivery into various cells.
By the application of a brief, controlled electrical pulse on the cells, a temporarily
enhanced permeability of pores in the cell membrane is created (see figure 14).
During this short periode of time (some milisecoconds), in which these pores exist,
a significant quantitiy of the biomolecules of the sorrounding medium is taken up
into the cells. After some miliseconds the pores in the membrane reseal and the
cell membrane returns to its original state. Introducing siRNAs (small interfering
RNAs) into cells by electroporation has become an important and powerful tool to
study gene function.
(For more information about electroporation: www.iovio.com/technology/howelectroporationworks.htm)
Figure 14: The phenomenon of electroporation By applying an electrical pulse on cells, the cell membrane becomes porouse for a short periode of time. Thereby DNA-fragments or siRNAs can be introduced into cells. (picture taken from: www.iovio.com/technology/howelectroporationworks.htm)
Cell membrane
before pulsing
Cell membrane
during pulsing
Cell membrane after pulsing
(cell returns to
original state)

Introduction
39
Aim of this work:
Human erythroid progenitor cells (hEPCs) undergo renewal in response to
erythropoietin (EPO), stem cell factor (SCF) and glucocorticoids.
Glucocorticoids are a class of steroid hormones that regulate a variety of essential
biological functions. They have anti-inflammatory and immunosuppressive
properties and have been shown to mediate apoptosis. Glucocorticoids repress or
activate gene expression by binding to their nuclear receptor, the Glucocorticoid
Receptor. Interaction of glucocorticoids with their receptor leads to activation and
translocation of GR into the nucleus, where it acts as a transcription factor and
modulates the activity of different target genes by binding to the DNA regulatory
DNA binding sites. Thereby the GR can influence several developmental and
biological processes.
Aim of this work is to study the function of different glucocorticoid target genes. In
previous work with mouse EPCs and in a microarray screen where EPCs were
stimulated with DEX alone or in combination with EPO, SCF and GR inhibitors,
Raf-1, Tis11d and FKBP51, among others, have been identified to be
glucocorticoid target genes (Kolbus et al., 2003; Rubiolo et al., 2006) and data not
shown.
We chose to analyse the functions of these three GR-target genes in human
primary erythroid progenitor cells by a transient, siRNA-mediated knock-down
approach. During my diploma thesis I established a reliable and reproducible
method for transfection of human EPCs by electroporation. With this method I
could successfully downregulate all three target genes by siRNA electroporation.
Thus I studied the effects of the knock-downs on proliferation, spontaneous
differentiation and cell viability in primary hEPCs from different cord blood donors.
The obtained results give us insights into the function of these specific GR-target
genes and the mechanisms in which they are involved during erythroid cell
proliferation and differntiation.

Materials and Methods
40
2. Materials and Methods
2.1 Working with human erythroid progenitor cells (hEPCs) 2.1.1 Isolation of mononuclear blood cells via a Ficoll-gradient Mononuclear cells were isolated from human umbilical cord blood by a Ficoll-
gradient. Cord blood was obtained in heparin-vials from General Hospital Vienna,
Medical University of Vienna, Department of Obstetrics and Gynaecology after
signing of an informed cosent, that has been approved by the local Ethical
Comission.
Approximatley 15mL of human cord blood were transfered into a sterile
50mL-tube and mixed well with 30mL PBS (blood-PBS-ratio: 1:2).
Then 15ml of a Ficoll-paque solution (Biocoll, Biochrom AG) was overlayed
carefully with 15mL of the diluted blood in a 50mL- tube
The step gradient was centrifuged for 20 minutes at 1660rpm (300xg) at
room temperature (important: without break).
Note: Ficoll induces aggregation of erythrocytes by which they completely
sediment through the Ficoll solution and are therefore located at the bottom
of the 50mL-tube. While Granulocytes were situated in the layer
immediatley above the erythrocytes, the mononuclear white blood cells
(erythroid progenitors, lymphocytes, platelets and monocytes) were
localized in the interface between the plasma and the Ficoll due to their
lower density.
This interface was collected in a preferably small volume, mixed with PBS
(1:2) and centrifuged for 5 minutes with 1200rpm (250xg). (This time with
break).
The pellet was then resuspended in approximatley 2,5mL of PBS, filled up
with 1x erylysis-Buffer 1/25 (v/v) to 50mL
The mixture was incubated for 15-20 minutes at room temperature to
remove also the rest of the red blood cells by erylysis. (10x Erylysis Buffer:
89,9g Annoniumchlorid, 10g KHCO3 (Kaliumhydrogencarbonat), 0,37g
EDTA, add A.d. up to 1000mL (pH 7,3), sterile filtratated)

Materials and Methods
41
After incubation, the cell suspension was centrifuged at 1200rpm (250xg)
for 5minutes and the cell pellet was resuspended in 10mL PBS.
After counting the cells by a CASY cell analyzer, the suspesion was
centrifuged at 1200rpm for 5minutes
The cell pellet then was either frozen in 10x106 cell- aliquotes or was
resuspended in an appropriate amount of 1x proliferation-medium and kept
in culture (at a cell density of approximatly 8x10⁶ cells/mL up to 1x10⁷
cells/mL).
2.1.2 Isolation of mononuclear blood cells without a Ficoll-gradient Mononuclear cells could also be isolated from human cord blood without Ficoll-
gradient:
Therefore 2,5 to 3mL of cord blood were transferred into a sterile 50mL-
tube and filled up with 1x erylysis-Buffer 1/25 (v/v) to 50mL
The tubes were incubated for 15-20 minutes at room temperature. During
this time lysis of red blood cells takes place and therefore the suspension
loses its viscosity and its dark red colour turns into light red.
Then the cell suspension was centrifuged for 10 minutes at 1200rpm (250xg)
The supernatant was removed and the different cell pellets of one cord
blood were first resuspended in 10mL PBS, transferred into a 50mL-tube
and filled up with PBS to 50mL.
After mixing well, the cell-suspension was washed 2 times with 50mL PBS
by centrifuging at 1200rpm (250xg) for 5 minutes.
Then the cell pellet was resuspended in 10mL PBS and 50µl of the cell
suspension were taken out for cell counting by the electronic cell counter
(CASY-1, Schärfe-System).
Materials and Methods
42
After having established the amount of isolated mononuclear cells, the suspension
was centrifuged again for 5 minutes at 1200rpm (250xg) and the cell pellet was
then either frozen in 10x106 cell- aliquotes or resuspended in the appropiate
amount of 1x proliferation media and kept in culture (at a cell density of
approximatly 8x10⁶ cells/mL up to 1x10⁷ cells/mL).
10x Erylysis Buffer: 89,9g Ammoniumchlorid
10g KHCO3 (Kaliumhydrogencarbonat)
0,37g EDTA, add A.d. up to 100mL (pH 7,3)
→ sterile filtered
2.1.3 Determination of cell number by CASY
To monitor number and size of cultured cells, they were characterized every day
with a CASY cell analyzer (Schärfe-System, Reutlingen, Germany).
Therefore the cell suspension was gently resuspended and 50µl of cell
suspension were diluted 1:100 with CASYton (Schärfe-System Reutlingen,
Germany) and an aliquot of 200µl of the mixture was then measured by the
CASY cell analyzer.
The measurement was performed with a 60µm capillary, since the
evaluated cells had a diameter between 5 and 15µm, depending on their
differtiation stage.
The CASY- counts and -profliles are used as quality control to compare
different preparations of EPCs.
With the obtained data the proliferation rates were calculated, moreover
also the spontaneous differentiation or apoptosis could be detected and
overall the outgrowth of hEPCs out of mononuclear cells was monitored.

Materials and Methods
43
2.1.4 Outgrowth of hEPCs from cord blood mononuclear cells
After isolation from human cord blood samples, mononuclear cells were cultivated
for ten days at 37°C, 5% CO2 and 100% humidity in serum free StemSpan
medium (StemCellTechnologies) supplemented with the following factors:
Epo (Erythropoietin) 2U/mL Jannsen-Cilag
DEX (Dexamethasone) 1µM/mL Sigma-Aldrich
IGF-1 (Interleukin-growth-factor-1) 40ng/mL Sigma-Aldrich
SCF (Stem cell factor) 100ng/mL Peprotech/Sigma
Cholesterol-rich lipid mix 20µg/mL Sigma-Aldrich
This 1x proliferation-medium was also used for long-term cultivation, after the
cultures have reached homogeneity (>95% erythroid cells) by day 6-10. Partial
medium changes were performed every 24h to ensure optimal factor supply. After
outgrowth of EPCs, the cell counts were adjusted to 1x10⁶ cells/mL daily.
After isolation from human cord blood the cell suspension was heterogenous, as
besides the rare erythroid and multipotent progenitor cells, it was mainly
containing other types of mononuclear cells (granulocytes, B- and T-leukocytes,
monocytes).
During the first six days in culture those other cell types died off and around day 6
erythroid progenitor cells began to accumulate.
Cells were counted every day by the CASY-cell-analyzer and as soon as the plate
contained more than 2x10⁶ cells, the culture was kept at a cell density of 1x10⁶
cells/mL.
Around d10 cell aliquots of 10x106 hEPCs were frozen in cryotubes and stored in
liquid nitrogen or cells were kept in culture till around d12 to d14, when they were
ready for experiments.

Materials and Methods
44
2.1.5 Freezing erythroid progenitor cells
The cell-suspension was centrifuged in a sterile plastic centrifuge-tube at
1200rpm (250g) for 5minutes
The cell pellet was then resuspended in freezing medium (either FCS and
10% of DMSO or FILOCETH medium (Fischer Scientifics). DMSO protects
the cell membranes during the freezing process.
Preferentially aliquots of 10x106cells were frozen in cryotubes in 1mL
freezing medium.
The cells were cooled down slowly to -80°C, either in an isopropanol box
(Mr. Frosty), which provides a cooling rate of -1°C/ minute to prevent cell
damage by a too quick freezing process.
Cell-aliquots were transfered into a liquid N2 tank on the next day.
2.1.6 Thawing erythroid progenitor cells
Cell aliquots were thawed quickly in a 37°C wather bath (approximatly 3-
5minutes)
Then the cell suspension was transferred into a sterile plastic centrifuge-
tube, where 10ml of pre-warmed StemSpan medium (without proliferation
factors) were added drop by drop, while gently shaking the tube.
The cell suspension was centrifuged for 5minutes at 1200rpm (250g) to
remove all of the DMSO, which is toxic for the cells at high concentrations.
The supernatant was therefore removed and the cell pellet was
resuspended in pre-warmed serum free StemSpan media supplemented
with 1x proliferation factors and transfered into a culture-dish at a cell
density of 1x10⁶ cells/mL.

Materials and Methods
45
2.1.7 Histological staining of erythroid cells with benzidine
50-100µl of the cell suspension were cyto-centrifuged onto a glass-slide (150xg for
7minutes) and stained according the following protocol. The glass slides were
stained as described in the protocol below:
The methanol is fixing and permeabilizing the cells on the slide, the benzidine is
reacting with the accumulated haemoglobin in the cytoplasm. H2O2 is then
interacting with the bound benzidine, which leads to a brown staining of
haemoglobinized cells. The Diff. Quick RED solution is staining the cytoplasm and
the Diff. Quick BLUE solution the nuclei.
The H2O2 solution was always prepaired fresh (75mL Ethanol, 75mL H2O, 2,5mL
hydrogen peroxide. The dried slides were mounted with Entellan (Merck) and a
cover slip and analysed under the microscope.
Working steps Time
Incubation in methanol
4min
Incubation in 1% benzidine solution
(2g O-Diamisidine dissolved in 200mL MetOH) 2min
Incubation in H2O2 solution (fresh!)
1,5 min
Washing in milliQ water
0,5 min
Stain with Diff. Quick RED (I)
4min
Stain with Diff. Quick BLUE (II)
35 sec
Washing in milliQ water
40sec
Dry by air
/

Materials and Methods
46
2.2 Flow Cytometry (FACS)
FACS (Fluorescence Activated Cell Sorting) is a powerful method to study and
purify cells and has wide applications in immunology, cell biology and in other
branches of biology. Cells can be stained with specific fluorescently labeled
antibodies or other proteins (Annexin-V). During meassurement the cells pass
through one or more laser beams and cells, to which specific fluorescently labeled
antibodies or proteins have bound, are stimulated by the laser light and thereby
they emit light at various frequencies. Photomultiplier tubes convert this light to
electrical signals and cell data is collected. Thereby cells can for example be
sorted and counted according to specific surface markers, or proteins expressed
on their surface (like Annexin-V).
2.2.1 Propidium-Iodide staining
Propidiumiodide (PI) is a standard flow cytometric viability probe. PI can be used
to distinguish viable from non viable cells. Viable cells with intact membranes
exclude PI, whereas the membrane of dead and damaged cells is permeable to PI.
PI-Staining:
100.000 cells were transferred into FACS tubes
The suspension was washed two times with 1x PBS (250xg, for 5minutes)
The cells then were resuspended in 500µl PBS+1%FCS
5µl of PI were added immediatly before the meassurment
The cells were vortexed and meassured by FACS
2.2.2 Propidium-Iodide and Annexin-V staining
When cells undergo apoptosis they show certain morphological chages, like for
example loss of plasma membrane asymmetry, condensation of the cytoplasm
and nucleus. Loss of plasma membrane asymmetry is one of the earliest features.
In apoptotic cells the phospholipid phosphatidylserine (PS) is translocated from the
inner to the outer leaflet of the plasma membrane and the cells are therefore

Materials and Methods
47
exposing PS to the cellular environment. Annexin-V is a 35-36kDa phospholipid-
binding protein and in the analyses, this Annexin-V protein was flourescently
labelled, can bind to the PS positive cells and can be used for flow cytometric
analysis. Therefore Annexin-V positive cells can be identified as the cells
undergoing apoptosis at an early stage.
Annexin-V- Staining:
100.000 cells were transfered into FACS-tubes
The cell suspenstion was washed twice with 1mL 1xPBS (1250xg, 5minutes)
the cells were resuspended in 100µl 1x Annexin-V binding buffer (BD
Bioscience)
Then 5µl of Annexin-V solution were added
The mixture was incubated for 15minutes at room temperature (in the dark)
Then 400µl of 1x Annexin-V binding buffer were added
5µl of Propidiumiodide (PI) were added (directly before the meassurment)
vortexed and meassured by FACS
Informations about AnnexinV- and PI- staining: datasheet and homepage of BD
Bioscience.
2.2.3 Fixing cells for FACS-analysis If meassurement by FACS analysis couldn’t be performed immediately, cells were
fixed as following:
1x10⁵ to 2x10⁶ cells/mL were transferred into FACS tubes
centrifuged at 1200 rpm (250xg) for 5 minutes
cell pellet was resuspended in 2mL 1x PBS
centrifuged at 1200 rpm (250xg) for 5 minutes
cell pellet was resuspended in 4% Paraformaldehyd (PFA= 500µl PBS
mixed with 500µl 8% PFA)
cell suspension was incubated for 15minutes at room temperature
stored at 4°C (note: fixed cells can be stored at 4°C for approximatley
2weeks)
Materials and Methods
48
2.2.4 Surface marker staining
To characterize the hEPCs in culture, the expression of specific surface markers
was analysed. The different markers can be stained with specific antibodies and
subsequentely analyzed by FACS-measurements.
For each meassurement approximatley 500.000 cells are needed, therefore
the appropriate amount of the cell suspension is resuspended and
transferred into a sterile 50mL plastic tube.
Mixed with 10mL of 1x PBS and centrifuged for 5minutes at 1200rpm
(250xg)
The cell pellet is resuspended with the appropriate amount of 1x
PBS+1%FCS (50mL PBS and 500µl FCS). (NOTE: 500.000 cells are
resususpended in 100µl of PBS+1%FCS, if you had 20 different
approaches, the pellet was resuspended in 2mL)
100µl of the cell suspenstion (approximatley 500.000 cells) was transfered
into a FACS-tube
10µl of the specific antibody was added to each tube (2µl of the antibody to
100.000 cells as recommended by the manufacturer)
after short vortexing the mixture was incubated for 30 minutes at 4°C
then it was centrifuged for 5 minutes at 1200rpm (250xg) and the cell pellet
was resuspended in 500µl of PBS+1%FCS
the samples were ready to be measured by FACS

Materials and Methods
49
2.3 Electroporation The electroporation was performed as mentioned below:
After thawing, the cells were first kept in culture for 2-3days to enable the cells to
recover from the stressful freezing- and thawing-process. We mainly performed
the electroporation with hEPCs cultured for 12-14 days.
Per approach, always 2x10⁶ cells were electroporated in a volume of 200µl of
Opti-MEM(R) medium with the optimized settings 300V and 150µF. (Note: Opti-
MEM(R) is a low-salt medium Transfection Reagent from Invitrogen). The cells first
had to be washed and prepared for the electroporation.
The cell suspension was resuspended and counted with the CASY cell
analyzer
Per approach always 2x10⁶ cells were needed, depending on the cell-
concentration the amount of the cell suspension needed for one experiment
was calculated (for example: For 6 approaches 12x106 cells (2x10⁶cells x 6)
were needed, if cell density was 1x10⁶ cells/ml, 12mL of cell suspension
was used)
The appropriate amount of the suspension was transferred into a sterile
50mL tube. (Note: As through the washing steps some cells will get lost,
instead of 12mL→ 13 to 13,5mL were taken).
The cell suspension was filled up to 50mL with ice cooled Opti-MEM(R)
Centrifuged at 1200rpm (250xg) for 5minutes
The cell pellet was resuspended in 50mL of ice cooled Opti-MEM(R) and
centrifuged again for 5minutes at 1200rpm (250xg).
In the meanwhile 1x proliferation media was prepared and prewarmed at
37°C in the waterbath
The sterile electroporation cuvettes were labeled and placed on ice (the
temperature of the cuvettes influences the time-constant)
Then the cell pellet was resuspended in the appropriate amount of Opti-
MEM(R), 200µl per approach.

Materials and Methods
50
(Note: 2x10⁶ cells per approach were electroporated in a volume of 200µl of
Opti-MEM(R), therefore if you had 6 approaches (12x106 cells), the pellet
was resuspended in 1200µl Opti-MEM(R) (6 x 200µl), but to counteract the
pipetting errors, 220µl per approach were used)
200µl of the cell suspension was transferred into a sterile 15mL tube and
mixed with the appropriate amount of siRNA (for example: if final
concentration was 400nM, 4µl of siRNA (20µM stock) were added to 200µl
of Opti-MEM(R))
The mixture was gently vortexed and transferred into an ice cold
electroporation cuvette
Each approach was electroporated with 300V and 150µF
The actual Volts and the timeconstant (msec) was noted after each impulse
Immediately after electroporation the cells were mixed with 2mL prewarmed
1x proliferation medium and transferred to a 6well plate (1x10⁶ cells/mL)
24h after the electroporation a total media change was performed
2.3.1 Different siRNAs used for electroporation
To ensure that the experimental outcome is true and reproducible, it is
recommended to use at least 3 types of control samples in every electroporation
experiment:: a positive control, a negative control and an untreated control.
Positive controls show the efficiency of siRNA delivery into the cells and negative
controls distinguish sequence-specific silencing from non-specific effects.
Untreated samples determine the level of cell viability.
Positive controls: Lamin A/C, GAPDH, FITC and Cell Death siRNA
Lamin A/C: (siGLO Lamin A/C Control siRNA, Dharmacon(R))
Lamin A/C- and GAPDH- siRNAs are positive silencing controls for human cells.
Lamins are nuclear filament-type proteins, which are involved in the nuclear
stability and chromatin structure (Tulac, Dosiou et al. 2004).

Materials and Methods
51
GAPDH: (StealthTM RNAi GAPDH Positive Control, Invitrogen)
GAPDH (Glyceraldehyde 3-phosohate dehydrogenase) is an enzyme involved in
glycolysis and serves to break down glucose for energy and carbon molecules.
As Lamin A/C and GAPDH are non-essential in the cells, the knock-down of Lamin
A/C or GAPDH does not induce any effects in the cells and their knock-down
should therefore not affect cell viability or result in any other phenotype. This
makes the Lamin AC- siRNA and the GAPDH- siRNA to a good positive control in
experiments with siRNA-mediated knock-down.
FITC: (BLOCK-ITTM Fluorescent Oligo, Invitrogen)
The BLOCK-iT TM Fluorescent Oligo is a fluorescein-labeled double-stranded
RNA duplex with the same length and charge as a standard siRNA. The sequence
of the FITC siRNA is not homologous to any known gene and is therefore a non-
silencing oligonucelotide, which is not inducing any knock-down in the cells. It can
be used as a control for the transfection efficiency, because due to the
fluorescence signal of FITC, the transfection efficiency can be analyzed by flow
cytometry (FACS). The fluorescent signal is localized in the nucleus and is
therefore a signal for efficient uptake. The higher the fluorescent signal is, the
higher also the transfection efficiency.
Cell Death control: (AllStars Hs Cell Death Control siRNA, QIAGEN)
AllStars Hs Cell Death Control siRNA is a mix of siRNAs targeting human genes
that are essential for cell survival. Knock-down of these genes induces cell death.
Therefore this siRNA mix can be used in every electroporation as a positive
control and as a control for transfection efficiency. 24h to 96h after electroporation
the transfected cells undergo apoptosis, therefore the transfection efficiency can
be estimated by simply observing the cells under the microscope or in the CASY
cell analyzer, without to make time-consuming FACS analysis.

Materials and Methods
52
Negative controls: Low, med and high GC-siRNAs
Low-, med- and high- GC: (StealthTM RNAi Negative Control, Invitrogen)
StealthTM RNAi Negative Control siRNAs serve as a negative control for the RNAi
response. For each electroporation a control siRNA with a similar GC content as
the target siRNA was used. Thereby it could be shown that the effects of the
knock-downs were specific and not just induced by the uptake of an unspecific
siRNA oligo.
Low GC: (StealthTM RNAi Negative Control, Invitrogen) → 36% GC-content
Med GC: (StealthTM RNAi Negative Control, Invitrogen) → 48% GC-content
High GC: (StealthTM RNAi Negative Control, Invitrogen) → 68% GC-content
siRNAs for the Glucocorticoid-Receptor targets:
RAF-1: (Invitrogen, validated)
Raf-1-1 GGA GUA ACA UCA GAC AAC UCU UAU U
Raf-1-2 AAU AAG AGU UGU CUG AUG UUA CUC C
Tis11d: (Invitrogen, non validated)
Tis11d-1: forward: 5’ CCG CCU UCU ACG AUG UCG ACU UCU U 3’ reverse: 5’ AAG AAG UCG ACA UCG UAG AAG GCG G 3’ Tis11d-2: forward: 5’ ACC UGA ACA ACA UGC UGG ACA AGA A 3’ reverse: 5’ UUC UUG UCC AGC AUG UUG UUC AGG U 3’ Tis11d-3 forward: 5’ CGC ACC UUU CAU ACC AUC GGC UUC U 3’ reverse: 5’ AGA AGC CGA UGG UAU GAA AGG UGC G 3’
Fkbp51 : (Invitrogen, non validated)
Fkbp51-1: forward: 5’ ACC AAA GCU GUU GAA UGC UGU GAC A 3’ reverse: 5’ UGU CAC AGC AUU CAA CAG CUU UGG U 3’ Fkbp51-2: forward: 5’ CCA GUC AUG AUA GAA AUG AAC CAU U 3’ reverse: 5’ AAU GGU UCA UUU CUA UCA UGA CUG G 3’ Fkbp51-3: forward: 5’ GGA UGC CAA GGA AGA GGC CAA UAA A 3’ reverse: 5’ UUU AUU GGC CUC UUC CUU GGC AUC C3’

Materials and Methods
53
2.4 Cell Isolation Kits
2.4.1 Dead Cell Removal
After electroporation, dead cells can be romoved from the cell suspension by the
“MACS (R) Dead Cell Removal Kit” (Miltenyi Biotec). Dead Cell Removal
MicroBeads recognize Annexin-V in the plasma membrane of apoptotic and dead
cells. Using antibodies against Annexin-V, dead and early apoptoic cells can be
romoved from the cell suspension.
1x Binding Buffer was prepared by dilution of 20x Binding Buffer Stock
solution (250µl of 20x Binding Buffer was diluted with 4,75mL of sterile H2O)
Cell suspension was collected and centrifuged for 5minutes at 300xg
Supernatant was removed completely and cell pellet was resuspended in
100µl of Dead Cell Removal MicroBeads per approximately 107 cells (for
fewer cells same volume is used)
Mixed well and incubated for 15minutes at room temperature (Note: During
this incubation time the magnetically labeled Dead Cell Removal
MicroBeads bind to the dead and apoptotic cells)
The Column was placed in magnetic field and prepared by rinsing with
500µl of 1x Binding Buffer
The Cell suspension was applied onto the column (500-1000µl)
Rinse the column 4 x with 500µl of 1x Binding Buffer
The magnetically labeled dead cells are retained in the column, while the
unlabeled living cells pass through and are collected in a sterile 15mL
plastic tube.
50µl of collected cell suspension was taken for cell count by the CASY cell
analyzer
Centrifuged 1200 rpm (250xg) for 5minutes
Cell pellet was resuspended in appropriate 1x proliferation factor medium to
reach a cell density of 1x10⁶ cells/mL.
Note: Approximately half of the cells are lost during this process

Materials and Methods
54
2.4.2 CD34+ Isolation
Out of mononuclear cells the CD34+ cells can be isolated by the “CD34
MicroBead Kit” (MACS Miltenyi Biotec). The CD34 antigen is a transmembrane
glycoprotein expressed on human hematopoietic stem and progenitor cells. The
CD34 MicroBead Kit contains MicroBeads, which are directly conjugated to CD34
antibodies. Thereby CD34-expressing hematopoietic cells can be magnetically
labelled and isolated by applying them on a column within a magnetic field,
whereby the magnetically labeled CD34+ cells are retained. When column is
placed out of the magnetic field, the bound CD34+ cells can be eluted:
Mononuclear cells are isolated or cell aliquots are thawed and resuspended
in 10mL RPMI-medium containing 2mM EDTA
Cell suspension is centrifuged for 5 minutes with 250 x g (1200 rpm)
Supernatant is removed completely and cell pellet is washed with 10mL
PBS+ 2mM EDTA
Centrifuge for 5 minutes with 250 x g (1200rpm)
Supernatant is removed completely and cell pellet is resuspended in 300µl
of buffer (per 108 cells) (BUFFER: PBS+0,5% bobine serum albumin (BSA)
and 2mM EDTA)
Add 100 µl of FcR Blocking Reagent for up to 108 total cells
100µl of CD34 MicroBeads (for up to 108 total cells) are added, mixed well
and incubated for 30minutes at 4°C (Note: CD34+ cells are bound to the
magnetically labeled MicroBeads)
Cells were washed by adding 5-10mL of buffer and centrifuged at 300xg for
10minutes, the cell pellet was resuspended in 500µl of buffer for 108 total
cells
The column was placed in the magnetic field and prepared by rising with
500µl of buffer
Cell suspension was applied on the column, and the column was washed 3
x with 500µl of buffer. The flow-through can be collected (Note: the
magnetically labeled Lin+ cells (CD34+) are retained within the column
while the unlabeled Lin- cells pass through)

Materials and Methods
55
Column is removed from the magnetic field and placed on a sterile 15mL
plastic tube
1mL of buffer was pipetted onto the column and the the magnetically
labeled CD34+ cells (now not longer bound within the magnetic field) are
eluted by pushing the plunger into the column
10mL of PBS are added, cell suspension was counted and centrifuged
1200 rpm (250xg) for 5minutes, cell pellet was resuspended in appropriate
1x proliferation factor medium to reach a cell density of 1x10⁶ cells/mL.
By FACS analysis the purity of CD34+ cells can be measured

Materials and Methods
56
2.5 Working with Proteins
To analyse changes on the protein level, Western blot analysis was performed.
between 5x10⁵ to 1x10⁶ cells were transferred into an Eppendorf tube
centrifuged for 5minutes at 250xg
the supernatant was completely removed
the cell pellet was washed once with 1ml PBS
centrifuged for 5min at 250xg
The washed cell pellet was shock-frozen in liquid nitrogen and stored at -
80°C.
2.5.1 Protein Isolation The pellet was lysed with 110µl to 130µl Tx100-Lysisbuffer depending on it’s size.
The lysis steps were as follows:
→ mixing well by vortexing (for ca. 30sec)
→ incubating on ice for 10minutes
→ mixing well by vortexing (for ca. 30sec)
→ incubating on ice for 10minutes
Tx100 Lysisbuffer: 150mM NaCl
10mM Tris pH 7,4
1% Triton X-100
0,1%SDS
1mM EDTA
Before use to 10mL of the Tx100 Lysisbuffer there was added:
1 pastille of PhosSTOP Phosphatase inhibitor cocktail (ROCHE)
1 pastille of cOmplete Mini, EDTA free, Protease inhibitor coctail (ROCHE)
5µl of Okadaic Acid (1:2000) (stock: 100µM)
After shaking 1mL aliquots of the Lysisbuffer were stored at -80°C.

Materials and Methods
57
Protein concentration was measured by the Pierce(R) BCA Protein Assay Kit
(Thermo Scientific).
Therefore the BCA protein-assay-reagent A was diluted 1:50 with BCA
protein-assay-reagent B.
Six dilutions of BSA were measured together with the samples to determine
the standard curve (2mg/ml, 1mg/ml, 0,5mg/ml, 0,2mg/ml, 0,1mg/ml and
0,05mg/ml).
200µl of the BCA-Protein-Assay-Reagent-mix were added to 10µl of each of
the standard-concentrations (in triplicates) on a 96-well plate.
This mixture was incubated at 37°C for 30minutes, where its colour turned from
green to dark- or light- violett depending on the protein-concentration. The
absorbance was measured photometrically at 650nm. The protein-concentrations
of the samples were computed with the help of the BSA standard curve.
The isolated proteins were mixed with 5x protein loading buffer and incubated at
95°C for 5minutes to denature the proteins further sonificated at the ultrasonic-
bath for 20minutes to shear the DNA in total cell lysates.
10µg to 20µg of the isolated proteins were loaded on a polyacrylamid gel for
Western Blot analysis.
2.5.2 Western Blot analysis
Western Blot analysis is a standard method to determine the expression of various
proteins by using specific antibodies; the method consists basically of the following
steps:
After protein-isolation the proteins were seperated by denaturing
polyacrylamide gel electrophoresis (SDS-PAGE)
The separated proteins were transferred from the polyacrylamide gel to a
PVDF-membrane (Millipore)
The proteins bound to the membrane were analyzed with specific
antibodies

Materials and Methods
58
SDS gel electrophoresis SDS PAGE is a classical method for separation of proteins in an electric field
according to the molecular weight. SDS-polyacrylamide gel consists of two parts: a
lower part (separating gel), where the proteins are seperated, and an upper part
(stacking gel), where the proteins are accumulated before entering the separating
gel.
Solutions for SDS-PAGE 5x sample buffer: 0,1M Tris-Cl
5% SDS
17% Glycerol
5% mercaptoethanol
1/100 volume of a 0,5% bromophenolblue
solution
Separating Gel-buffer: 36,34 g Tris
4mL 20% SDS
150mL A.d. pH 8,8
add A.d. to reach a volume of 200mL
Stacking Gel-buffer: 6,08 g Tris
2mL 20% SDS
50mL A.d. pH 6,8
add A.d. to reach a volume of 100mL
10x Running Buffer for 1000mL: 1,9 M Glycin (142,6g)
250 mM Tris-Base (30,3g)
1% SDS (50mL)
1x Running Buffer for 1000mL : 100mL 10x Running Buffer
900mL A.d

Materials and Methods
59
10x Blotting Buffer for 1000mL: 1,9 M Glycin (142,6g)
250 mM Tris-Base (30,3g)
10% Methanol (100mL)
1x Blotting Buffer for 1000mL: 100mL 10x Blotting Buffer
200mL Methanol
700mL A.d.
10x TBS Buffer for 1000mL: 1,5 M NaCl
100mM Tris, pH 7,4 or 8
1x TBS-T Buffer for 100mL: 100mL 10x TBS Buffer
900mL A.d.
0,05 % Tween 20 (500µl)
Stripping Buffer: 2% SDS
62,5 mM Tris, pH 6,8
to 50mL Stripping Buffer add 390µl ß-
Mercaptoethanol (prepare always fresh)
Materials and Methods
60
Two 10% polyacrylamid-separating gels were prepared as follows:
milliQ water 8,97 mL
Polyacrylamid (30%) 7,53 mL
Separating Gel-buffer 5,7 mL
APS (10%) (Ammonium-peroxidisulfate) 336µl
TEMED (Tetramethylethylendiamine) 15µl
Two stacking gels were prepared as follows:
milliQ water 3 mL
Polyacrylamid (30%) 0,9 mL
Stacking Gel-buffer 1,33 mL
APS (10%) 52,5 µl
TEMED 7,5 µl
First, the components of the running gel were mixed carefully, then poured and
Isopropanol was added on the top to eliminate air-bubbles.
After the gel polymerized, the isopropanol was removed and the stacking gel
mixture was poured on the running gel (a comb was placed immediately between
the two glass plates).
Depending on the size of the respecitve proteins, the concentration of acrylamide
of the running gel can be decreased or increased. For proteins between 40kD and
80kD like for example Lamin A/C, Gapdh, Raf-1, Tis11d, FKBP51 a 10% gel were
used and if we wanted to analyse smaller protein-fragments of for example
Caspase-3, we used a 12% gel.
Depending on the amount of isolated proteins 10µg of protein and 5µl of the
marker (PageRuler prestained protein ladder, Fermentas) were loaded. The
electrophoresis was performed in the 1x PAGE-Running buffer and the proteins
were separated with:
50Volt , 100mA, 50W: till proteins run through the stacking in the separating gel
70Volt, 100mA, 50W: till the proteins run to the middle of the separating gel
100-130V, 100mA, 50W: till the proteins run to the end of the separating gel

Materials and Methods
61
Western transfer
The proteins were transferred from the polyacrylamid gel to the PVDF-membrane
(Millipore), which is highly hydrophobic and therefore first had to be activated by
incubation in methanol for 10minutes.
The transfer was performed in blotting buffer for:
→ 1,5hour, 400mA, 100V, 50W, on ice
→ 15-16hours (over night), 90mA, 30-35V, 50W, at +4°C
Antibody incubation
The membrane was first stained for 5minutes with Ponceau S, which is an
unspecific protein stain, thereby blotting-problems (like airbubbles) or
unequal loading can be assessed immediately.
The dye was washed away at first with water and then with TBS-T buffer
until the membrane was completely clear from the Ponceau staining.
The membrane was blocked for 1h at room temperature with 5% dry low fat
milk powder in 1xTBS-T to block unspecific antibody binding to the PVDF-
membrane.
Then the membrane was washed 3times with TBS-T for 5minutes.
The first antibody was diluted to the appropriate concentration and
depending on the antibody it was either incubated over night at 4°C or for
1hour at room temperature with the membrane.
After the first antibody-incubation the membrane was washed again 3times
with 10mL TBS-T for 10-15 minutes each and then incubated with the
appropriate secundary antibody diluted in TBS-T for 1hour at room
temperature.
This was followed by another three washing steps with 1x TBS-T.
The membrane was transferred into a transparent plastic foil and 400-800µl
of equal amounts of the chemoluminescence ECL solution 1 and 2 (Thermo
Scientific) was distributed eaqually over the membrane.
A light sensitive X-ray film (GE Healthcare) was put in an exposure box
together with the membrane, exposed for appropriate time (from 20sec-
20minutes, depending on the intensity of the signal) and then developed.

Materials and Methods
62
In the presented work the following antibodies (in the indicated dilutions) were
used:
All of the membranes were blocked always with 5% dry low fat milk and washed
with TBS-T.
First antibody Company Second antibody
Lamin A/C
(1:200, in TBS-T)
Santa Cruz
Biotech.
Mouse (1:25.000, in TBS-T)
Tis11d
(1:200, 1%BSA in TBS-T)
Santa Cruz
Biotech.
Rabbit (1:20.000, in TBS-T)
Fkbp51
(1:1000, 1%BSA in TBS-T)
Santa Cruz
Biotech.
Goat (1:30.000, in TBS-T)
Gapdh
(1:1000, in TBS-T)
Cell Signalling Rabbit (1:20.000, in TBS-T)
Raf-1
(1:1000,1%BSA in TBS-T)
Cell Signalling Mouse (1:25.000, in TBS-T)
Caspase3
(1:1000,5%milk in TBS-T)
Cell Signalling Rabbit (1:20.000, in TBS-T)
pERK
(1:1000, 1%BSA in TBS-T)
Cell Signalling Rabbit (1:20.000, in TBS-T)
panERK
(1:5000, 1%BSA in TBS-T)
BD Biosciences Mouse (1:25.000, in TBS-T)
Actin
(1:10.000 in TBS-T)
Cell Signalling Mouse (1:25.000, in TBS-T)
pIKK α/ß (1:1000, 1%BSA in TBS-T)
Cell Signalling (NF-kappa B Pathway sampler Kit
Rabbit (1:2000 in TBS-T,of KIT)
pNFKB
(1:1000, 1%BSA in TBS-T)
Cell Signalling (NF-kappa B Pathway sampler Kit
Rabbit (1:2000 in TBS-T,of KIT)
NFKB
(1:1000, 1%BSA in TBS-T)
Cell Signalling (NF-kappa B Pathway sampler Kit
Rabbit (1:2000 in TBS-T,of KIT)
pIKB-α
(1:1000, 1%BSA in TBS-T)
Cell Signalling (NF-kappa B Pathway sampler Kit
Rabbit(1:2000 in TBS-T,of KIT)
IKB-α
(1:800, 1%BSA in TBS-T)
Cell Signalling (NF-kappa B Pathway sampler Kit
Mouse(1:2000 in TBS-T,of KIT)

Materials and Methods
63
2.6 Working with RNA To analyse the knock-down efficiency on mRNA-level we performed Q-PCR,
therefore first the RNA was isolated, reverse transcribed into cDNA and then a
Real-Time PCR was done.
2.6.1 RNA Isolation The RNA extraction was performed with the “RNA-Easy Mini Kit 250” (Qiagen), the
extraction of the RNA was performed according to the protocol provided with the
kit. The amount of isolated RNA was analysed with the nanodrop-method
photometer.
2.6.2 cDNA synthesis
The cDNA synthesis was performed with the “First Strand cDNA Synthesis Kit”
(Fermentas), for each cDNA synthesis 500ng of total RNA were reverse
transcribed into cDNA as described:
Total RNA 500ng (1 to 11µl depending on the RNA concentation)
Random hexamer primer 1µl
DEPC-treated water to 12µl
Total volume 12µl
After adding all of the components, the mixture was vortexed, spinned down and
incubated for 5minutes at 65°C and then on ice. To this mixture 8µl of the
Mastermix were added to reach a total volume of 20µl.
Mastermix:
5x reaction buffer 4µl
RiboLockTM RNase Inhibitor (20 U/µl) 1µl
10mM dNTP mix 2µl
M-MuLV Reverse Transcriptase (20 U/µl) 1µl__
Total Volume 20µl

Materials and Methods
64
The mixture then was incubated for 5minutes at 25°C and then at 42°C for
60minutes. To terminate the reaction the mixture was heated at 70°C for 5minutes.
2.6.3 Real Time PCR (Q-PCR) The amplified cDNA was diluted 1:1 with RNAse free water (20µl cDNA+20µl
RNAse free water). The Real Time PCR was done in triplicates, the PCR mixture
included:
Diluted cDNA (1:1) 2 µl
2x Power SYBR Green Master Mix* 5 µl
forward primer (10pmol) 0,5 µl
reverse primer (10pmol) 0,5 µl
RNAse free water ____2 µl____
Total volume 10 µl
*(Applied Biosystems)
To determine the optimal Annealing Temperature: (G+C) x 4°C + (A+T) x 2°C – 5°C
(calculate the mean value of the 2 primers).
RT-PCR conditions:
Stages Temperature
Time
Stage 1
50°C 2 minutes
Stage 2
95°C 10 minutes
Stage 3 (40 cycles)
95°C 15 sec
End
60°C 1 minute

Materials and Methods
65
In the present study following primer pairs were used for the Q-PCR : LAMIN A/C: (SIGMA)
LAMIN A/C: forward: 5’ GAC TCA GTA GCC AAG GAG CG 3’ reverse: 5’ GCA GCT ATC AGG TCA CCC TC3’ GAPDH : (SIGMA)
GAPDH: forward: 5’ CCT GTT CGA CAG TCA GCC G 3’ reverse: 5’ CGA CCA AAT CCG TTG ACT CC3’ Raf-1 : (SIGMA)
Raf-1: forward: 5’ CTG GGA CTC CAC TAT CAC CA 3’ reverse: 5’ GCA CTG TAG CAC CAA AGT AC 3’ Tis11d : (SIGMA)
Tis11d: forward: 5’ TGT GCA AGA CAG AGA GAA ATC CC 3’ reverse: 5’ GAG TGC CGT CGG AGG AAT C 3’ Fkbp51 : (SIGMA)
Fkbp51: forward: 5’ CCG CAA GTT CTA CTC CAT CC 3’ reverse: 5’ CCT TGG CTG ACT CAA ACT CG3’ hCSNK1d : (SIGMA) (houskeeper)
hCSNK1d: forward: 5’ AGG AGA AGA GGT TGC CAT CAA G 3’ reverse: 5’ TCC ATC ACC ATG ACG TTG TAG TC 3’ ß-2-Microglobulin (B2M): (SIGMA) (housekeeper)
B2M: forward: 5’ GGG TTT CAT CCA TCC GAC ATT G 3’ reverse: 5’ TGG TTC ACA CGG CAG GCA TAC C3’

Results
66
3. RESULTS
3.1 Isolation and outgrowth of mononuclear cells from cord blood
All of our experiments were performed with human erythroid progenitor cells.
Therefore mononuclear cells were isolated from human umbilical cord blood
according the protocols in Materials and Methods and as demonstrated in figure
15 below:
After isolation, mononuclear cells were expanded under defined culture conditions
to erythroid progenitor cells (hEPCs). Figure 16 shows the outgrowth of EPCs from
mononuclear cells. Therefore daily cell aliquots of mononuclear cells were
cytocentrifuged onto glass slides and stained by histological stainings (as
described in Materials and Methods), also cell counts were performed every day
by the CASY-cell-analyzer.
At d0 the cytospins showed mainly a heterogeneous cell suspension with different
types of mononuclear cells, whereas at d10 the cell suspension was more
homogeneous due to the accumulated progenitor cells. Also the CASY-profiles,
shown in the right panel of figure 16, changed, they are giving you informations of
the cell-count and the cell-size. While at d0 the peak was around 7µm, at d10 a
Figure 15: Isolation of mononuclear cells from human cord blood through a Ficoll-gradient (picture taken from: Ernst Müllner)
Expansion
in culture
Maturation in culture /
in vivo

Results
67
clear shift towards bigger size (around 10µm) was observed, which indicates that
the smaller already differentiated cells (erythrocytes, granulocytes, macrophages)
died off and the undifferentiated bigger EPCs accumulated. Therefore we could
show that around d10 out of the heterogeneous culture at d0, a homogeneous
culture of erythroid progenitors (hEPCs) grew out. The cells were kept in culture till
around d12 to d14, when they were ready for experiments.
hematological
staining (x40): CASY- profile: Light-microscope
(x40):
+ DEX EPO SCF IGF-1 Lipids
Figure 16: Outgrowth of hEPCs from mononuclear cells: After isolation from human umbilical cord blood, mononuclear cells are expanded under defined culture conditions to erythroid progenitor cells (hEPC’s) in serum free StemSpan medium supplemented with Epo (2U/mL), SCF (100ng/mL), DEX (10-6M), IGF-1 (40ng/mL) and a cholesterol-rich lipid mix (20µg/mL). Here are shown pictures of the cell suspension at d0, immediately after isolation of the mononuclear cells and at d10 after cultivation: the picture on the left is showing an exposure with the light-microscope (x40), in the picture in the middle are demonstrated the cytospins(x40) and the picture on the right panel shows the Casy-profiles.

Results
68
3.2 Optimization of the electroporation method
In order to be able to downregulate specific glucocorticoid target genes, the
settings for transfection of siRNAs into the cells by electroporation had to be
optimized. Several variables can be changed in order to determine the ideal
electroporation conditions. Every cell type requires different electroporation
settings, which have to be determined empirically. The pulse length, temperature,
cell density, voltage- and capacity- settings and the siRNA- concentration are all
critical parameteres, which have to be optimized at the beginning to determine the
best conditions to achieve a high knock-down efficiency, a high cell viability and a
high transfection efficiency at the same time.
3.2.1 Best Voltage and Capacity settings
The voltage- and capacity- settings critically determine cell survival and
transfection rate. If the voltage-settings (field strength: V/cm) are high enough, it
induces permeabilization of the membrane and allows an uptake of molecules
from the surrounding media (Jordan et al., 2008). This event is depending on
several factors, like cell diameter and temperature. In general smaller cells require
higher voltages than larger cells. But higher voltage-settings can also promote cell
damage. Therefore it is essential to determine the best settings, by which a high
knock-down efficiency and also a high cell viability are achieved at the same time.
For this purpose 2x10⁶ cells were electroporated with a non- silencing fluoresently
labeled siRNA (FITC) with different voltage- and capacity- settings. The
transfection efficiency and cell viability was then analysed by Flow Cytometry. The
results of the obtained FACS-data are shown in figure 17. Our data revealed that
the higher the voltage- and capacity settings were, the higher the transfection-
efficiency was. When cells were electroporated for example with 950µF or with
400V, over 90% of the hEPCs were transfected, but just 20% of the cells survived
the procedure. And at the same time when the settings were below 300V or 150µF,
cell viability was over 95%, but just 25% of the cells were transfected.

Results
69
Best Voltage settings:
dead cells
transfected cells
Best Capacity settings:
From this data we concluded that 300V and 150µF resulted to be the best settings
to achieve a high transfection efficiency (over 60%) and also a high cell viability
(over 90%) at the same time. Note: Transfection efficiency is slightly under-
estimated by flow cytometric analysis because the signal intensity for the FITC-
labeled oligo is very low, and therefore, the peaks of control and transfected cells
always showed an overlap. When the cells were transfected with FITC-siRNA by
electroporation, transfection efficiency was always higher than 75%.
Applied Voltage settings: 1: 200V, 150µF
2: 250V, 150µF
3: 300V, 150µF
4: 350V, 150µF
5: 400V, 150µF
Figure 17: Best voltage and capacity settings 2x10⁶ cells were electroporated with a non- silencing fluoresently labeled siRNA (FITC) with different voltage- and capacity- settings. The transfection efficiency and cell viability was then analyzed by Flow Cytometry (FACS).
Applied Capacity settings: 1: 25µF, 300V
2: 50µF, 300V
3:100µF, 300V
4: 200µF, 300V
5: 400µF, 300V
6: 600µF, 300V
7: 950µF, 300V 0
20
40
60
80
100
1 2 3 4 5 6 7
% o
f c
ell
s
0
20
40
60
80
100
1 2 3 4 5
% o
f c
ells

Results
70
3.2.2 Best siRNA- concentration
Transfection of siRNA can result in off-target effects, in which siRNAs do not just
induce the degradation of homologous mRNAs, but they can affect also the
expression of partially homologous or even non homologous genes. Those off-
target effects can be avoided by using lowest effective siRNA concentrations. But
on the other side, if siRNA-concentration is too low, knock-down may be
undetectable. To find out the lowest siRNA- concentration, by which off-target
effects are reduced and at the same time a high a knock-down efficiency and a
low cytotoxicity is still guaranteed, hEPCs (d15) were electroprated with different
amounts of LAMIN A/C- siRNA (siRNA concentration varies from 100nM to 1,6µM),
one approach electroporated without siRNA and one approach not electroporated
at all served as a control.
(A) (B)
(C)
0
20
40
60
80
100
livin
g c
ells
(%
)
Figure 18: Best siRNA-concentration
(A) LAMINA/C knock-down was analysed 48h after electroporation by Western blot analysis. (B) The knock-down efficiency was quantified relative to beta-actin. (C) Cell viability was measured 48h after the electroporation by FACS- analysis.

Results
71
As shown in figure 18 the knock-down efficiency was analysed 48h after the
electroporation by Westernblotting and quantified relative to beta-actin. The cell
viability was measured by FACS-analysis. Our data revealed that a siRNA-
concentration of 400nM seemed to be sufficient to achieve a knock-down
efficiency of 75% and a cell viability of approximately 80% (48h after the
electroporation).
3.2.3 Stability and time-course of the knock-down
Electroporation with siRNAs is resulting in a transient not stable knock-down. If
cells proliferate the amount of the uptaken siRNA in the cytoplasm decreases,
which leads again to an increase of the expression level after a certain periode of
time (72h to 96h). To determine the stability of the knock-down after the
electroporation, 2x10⁶ cells (d15) were electroporated with 2 different siRNAs:
LAMIN A/C- and GAPDH-siRNA (siRNA- concentration: 100nM and 400nM).
Knock-down efficiency and cell viability was analysed 24h to 96h after the
electroporation (by Western Blotting, Q-PCR and FACS analysis). One approach
electroporated without siRNA and one approach electroporated with the non-
coding FITC-siRNA served as a control.
Cell viability 24h to 96h after electroporation
As shown in the upper panel of figure 19 the cell viability seemed not to be
affected by the siRNA- concentration or the type of siRNA, as cell viability didn’t
differ between the approaches electroporated with a concentration of 100nM or
400nM, nor we could detect differences in cell viability, when cells were
electroporated with different types of siRNAs. Cell viability was always around 90%
in all of the appraoches, even 96h after the electroporation.

Results
72
0
20
40
60
80
100
to 24h 48h 72h 96h
% k
no
ck
-do
wn
0
20
40
60
80
100
to 24h 48h 72h 96h
% k
no
ck
-do
wn
(A) Cell viability 24h to 96h after electroporation
(B) Knock-down: 24h Knock-down: 48h
Knock-down: 72h Knock-down: 96h
(C) Q-PCR: Lamin-AC knock-down Q-PCR: Gapdh knock-down
FITC 1
00
Lamin AC
Actin
Gapdh
no siR
na
Lamin
10
0
Lamin
40
0
Gap
dh
10
0
Gap
dh
40
0
FITC 4
00
FITC 4
00
FITC 1
00
Gap
dh
40
0
Gap
dh
10
0
Lamin
40
0
Lamin
10
0
no siR
na
Lamin AC
Actin
Gapdh
0
10
20
30
40
50
60
70
80
90
100
24h 48h 72h 96h
% P
I neg
ativ
e ce
lls
no siRNA
Lamin 100nM
Lamin 400nM
Gapdh 100nM
Gapdh 400nM
FITC 100nM
FITC 400nM
Figure 19: Time-course of the knock-down 2x10⁶ cells (d15) were electroporated with 2 different siRNAs: LAMIN A/C- and GAPDH-siRNA at a concentration of 100nM and 400nM. One approach electroporated without siRNA and one approach electroporated with the non-coding FITC-siRNA served as a control. (A) 24h to 96h after electroporation the cell viability was analysed by flow cytometry, whereas the knock-down was analysed on protein-level by Westernblot-analysis (B) and on mRNA-level by Q-PCR 24h to
96h (C).
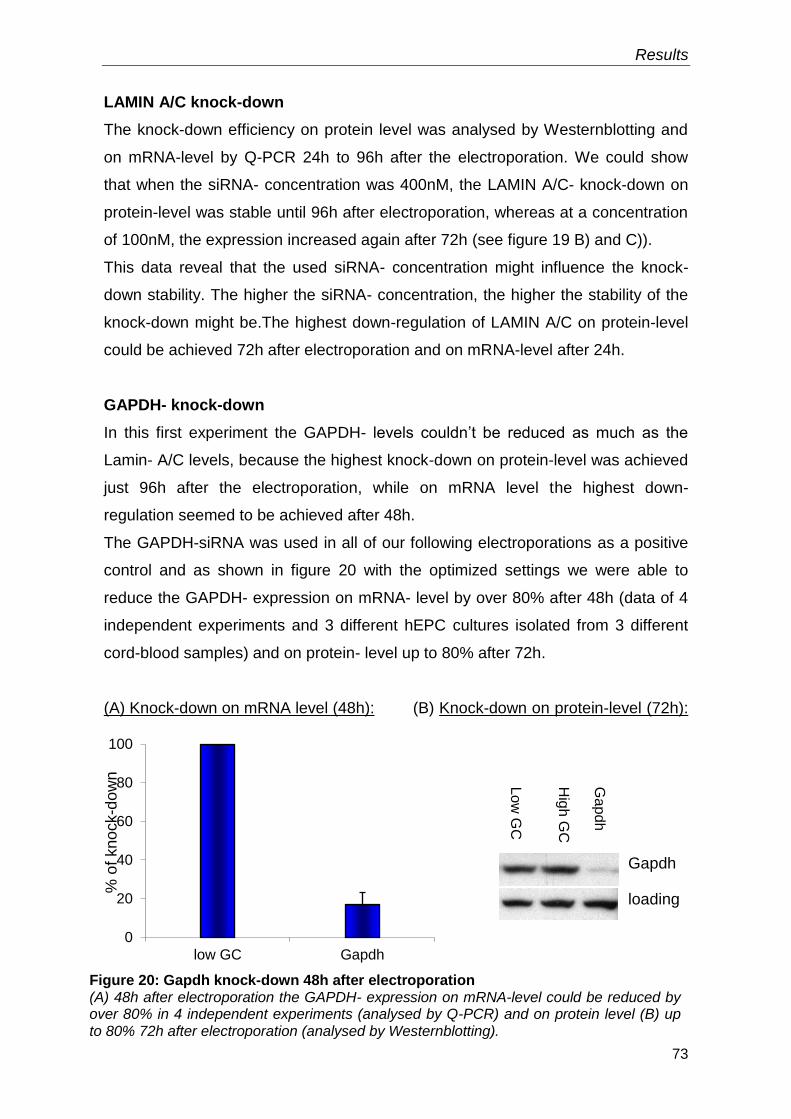
Results
73
LAMIN A/C knock-down
The knock-down efficiency on protein level was analysed by Westernblotting and
on mRNA-level by Q-PCR 24h to 96h after the electroporation. We could show
that when the siRNA- concentration was 400nM, the LAMIN A/C- knock-down on
protein-level was stable until 96h after electroporation, whereas at a concentration
of 100nM, the expression increased again after 72h (see figure 19 B) and C)).
This data reveal that the used siRNA- concentration might influence the knock-
down stability. The higher the siRNA- concentration, the higher the stability of the
knock-down might be.The highest down-regulation of LAMIN A/C on protein-level
could be achieved 72h after electroporation and on mRNA-level after 24h.
GAPDH- knock-down
In this first experiment the GAPDH- levels couldn’t be reduced as much as the
Lamin- A/C levels, because the highest knock-down on protein-level was achieved
just 96h after the electroporation, while on mRNA level the highest down-
regulation seemed to be achieved after 48h.
The GAPDH-siRNA was used in all of our following electroporations as a positive
control and as shown in figure 20 with the optimized settings we were able to
reduce the GAPDH- expression on mRNA- level by over 80% after 48h (data of 4
independent experiments and 3 different hEPC cultures isolated from 3 different
cord-blood samples) and on protein- level up to 80% after 72h.
(A) Knock-down on mRNA level (48h): (B) Knock-down on protein-level (72h):
0
20
40
60
80
100
low GC Gapdh
Figure 20: Gapdh knock-down 48h after electroporation (A) 48h after electroporation the GAPDH- expression on mRNA-level could be reduced by over 80% in 4 independent experiments (analysed by Q-PCR) and on protein level (B) up to 80% 72h after electroporation (analysed by Westernblotting).
Gapdh
loading
Low
GC
Hig
h G
C
Gapdh
% o
f kno
ck-d
ow
n

Results
74
3.2.4 Best time constant and electroporation volume
Other important paramenters which have to be considered for a successful
electroporation are pulse length and temperature. The pulse applied to the cells
can be a square or an exponential wave (Jordan et al., 2008). The time constant is
defined as the duration of the decay of the exponential wave, it is the product of
the capacitance settings and the resistance of the sample (resistance is
dependend on the ionic composition of the electroporation buffer). Therefore the
higher the capacitance settings, the higher also the time-constant and the lower
the cell viability was.
In our experiments, the cuvettes were always placed on ice before the
electroporation, as we detected that the lower the temperature of the
electroporation cuvettes was, the higher also the time-constant was. We observed
that a time-constant around 10 msec to 13 msec was optimal to achieve a high
viability and a high knock-down efficiency.
We always electroporated 2x10⁶ cells in a volume of 200µl and we found that also
the electroporated volume seems to be a crucial factor for the knock-down
success. If volume was higher than 200µl (for example 600µl) the time-constant
decreased dramatically from 12msec to 3msec. This short pulse was definitely too
short to allow the siRNA to enter the cells, therefore also no knock-down could be
achieved (data not shown).
In summary the best electroporation settings for hEPCs were:
Voltage- and capacity settings: 300V and 150µF
Cell density: 2x10⁶ cells
sufficient siRNA concentration: 400nM
electroporation volume: 200µl (to ensure a time-constant around 12msec)
precooled electroporation cuvettes
low salt transfection medium (Opti-MEM (R))

Results
75
3.3 Raf-1: serine/threonine kinase 1
To study the function of Raf-1 in human EPCs, downregulation of Raf-1 was
performed with two validated Raf-1- siRNAs (Raf-1-1 and Raf-1-2). For this
experiment three different negative controls were used: One approach not
electroprated (no elpo), one approach electroporated without siRNA (no oligo) and
one approach electroporated with the non-coding siRNA (low GC-siRNA). To
control the electroporation efficiency, one approach was electroporated with the
Gapdh-siRNA under the same conditions. The Gapdh-expression on protein-level
could be reduced by over 80% (analysed by Western-Blotting 48h after
electroporation, shown in figure 21).
48h afer the electroporation the down-regulation of Raf-1 on protein-level was
analysed by Western-Blotting. The Raf-1 protein- level could be reduced by over
90% with both Raf-1 siRNAs (Raf-1-1 nd Raf-1-2), as demonstrated in figure 21
(A). This result was obtained with both used siRNAs.
The Raf-1 levels could be reduced not only on protein-level, but also on mRNA-
level, which was analysed by Q-PCR (shown in figure 21 (B)).
A) Raf-1 knock-down on protein-level (48h)
no o
ligo
low
GC
Raf-1
-1
Gap
dh
Raf-1
-2
no elp
o
Figure 21: Raf-1 knock-down 2x10⁶ cells per approach were electroporated with 2 different Raf-1 siRNAs (Raf-1-1 and Raf-1-2). As a positive control the Gapdh-siRNA was used; the non-coding low GC-siRNA and two approaches either not electroporated (no elpo) or electroporated without siRNA (no oligo) served as negative controls. 48h after electroporation the downregulation was analysed on protein-level by Westernblot-analysis (A) and on mRNA-level by Q-PCR (B).
0
20
40
60
80
100
no oligo low gc Raf1-1 Raf1-2
% k
no
ck
do
wn
Actin
Raf-1
Gapdh
B) Raf-1 knock-down on mRNA-level (48h)

Results
76
0
20
40
60
80
100
low gc no oligo Raf1-1 Raf1-2
siRNA
% k
no
ck
do
wn
Effects of the Raf-1 knock-down
As it has has been reported that Raf-1-deficient mouse erythroblasts differentiate
much faster than the wild-type erythroblasts (Kolbus et al., 2002), we expected
more spontaneous differentiation and a lower proliferation-rate of human EPCs
after reduction of Raf-1. In the second round of experiments, the Raf-1 protein
levels could be reduced by over 65% and the mRNA-levels by over 60% 48h after
the electroporation, as demonstrated in figure 22 (B).
The Gapdh-siRNA was used as a positive control; the non-coding low GC-siRNA
and one approach electroporated without siRNA (no oligo) served as negative
controls. The Gapdh-expression on protein-level could be reduced by over 85%
(analysed by Western-Blotting after 48h, shown in figure 22 (A)).
(A) Knock-down on protein level (48h) (B) Knock-down on mRNA-level (48h)
Figure 22: Raf-1 knock-down on protein- and on mRNA-level 2x10⁶ cells per approach were electroporated with 2 different Raf-1 siRNAs (Raf-1-1 and Raf-1-2). The Gapdh-siRNA was used as a positive control; the non-coding low GC-siRNA and one approach electroporated without siRNA (no oligo) served as negative controls. Knock-down has been analysed on protein level by (A) Western Blot- and on mRNA level by (B) Q-PCR- analysis 48h after electroporation.
When compared to mouse EPCs, human EPCs show more spontaneous
differentiation. Additionally the spontaneous differentiation was also increased
when the hEPCs were cultivated at densities higher than 1x10⁶ cells/ml.
Thus we tried to enhance the expected effects of the Raf-1 knock-down by
keeping the Raf-1 deficient cells at higher cell-densities.
no o
ligo
low
GC
Gap
dh
Raf-1
-1
Raf-1
-2
Raf-1
Actin
Gapdh

Results
77
As the data of our first Raf-1 knock-down experiment revealed that the highest
knock-down of Raf-1 could be achieved 48h after the electroporation, this
timepoint was used for seeding the electroporated cells in three different
concentrations (in triplicates of 100µl each), the cumulative cell number was
analysed from 48 to 120 hours after the electroporation. The three different used
concentrations were:
→ 1x10⁶ cells/ml
→ 2x10⁶ cells/ml
→ 4x10⁶ cells/ml
The cytospins, the Casy-counts and -profiles of different timepoints (72h to 120h)
gave us insights of the effects of the Raf-1 downregulation.
3.3.1 Effects of the Raf-1 knock-down on proliferation rate
While we couldn’t detect significant differences in the proliferation rate at a cell
density of 1x10⁶ and 2x10⁶ cells/ml, we could demonstrate that Raf-1 deficient
cells proliferated slower compared to the cells electroporated with the lowGC-
control, when they were cultivated at a cell-density of 4x10⁶ cells/ml.
As demonstrated in figure 23 the highest difference between cells with reduced
Raf-1 levels and the controls according the cumulative cell numbers, was at the
timepoint of 96h after the electroporation. At later time points, e.g. 120hours after
the electroporation the cell numbers of the Raf-1 approaches were again similar to
those of the control. We didn’t analyse wheater the Raf-1 knock-down was still
present 120h after the electroporation, so it is possible that at this timepoint the
Raf-1 protein levels were increased again and thereby the inhibitory effects on the
proliferation got lost.
Imortantly, it should be noticed that the different approaches were not adjusted
daily to their specific cell-concentration (1x10⁶, 2x10⁶ and 4x10⁶ cells/mL), as the
sample volume of 100µl was too small. Therefore all of the approaches (for each
siRNA in three different concentrations in triplicates) were fed every day by simply
adding 100µl of fresh proliferation medium.

Results
78
0
1
2
3
4
5
48h 72h 96h 120h
0
0,5
1
1,5
2
2,5
3
3,5
48h 72h 96h 120h
cu
mu
lati
ve c
ell n
um
ber
Effects of the Raf-1 knock-down on proliferation rate
Proliferation-rate after Raf-1 knock-down (with three different cell densities)
Raf-1-1-siRNA
Raf-1-2-siRNA
low GC siRNA
Thereby the cell-concentrations were diluted every day step by step and 120h
after electroporoation the cell density might have been much lower than 4x10⁶
cells/ml. This could also explain why the effects on the proliferation were
diminished or reverted 120h after electroporation.
Figure 23: Effects of the Raf-1 knock-down on proliferation 48h after electroporation with 2 different Raf-1-siRNAs (Raf-1-1 and Raf-1-2) and lowGC-siRNA as a control, the cells were seeded at the 3 different indicated concentrations (1x10⁶ cells/ml, 2x10⁶ cells/ml, 4x10⁶ cells/ml) and the proliferation rate was analysed by Casy-counts at 3 different timepoints: 72h, 96h and 120h after electroporation.
0
2
4
6
8
48h 72h 96h 120h
cu
mu
lati
ve c
elln
um
ber
1x10⁶ cells/ml: 2x10⁶ cells/ml:
4x10⁶ cells/ml:

Results
79
3.3.2 Effects of the Raf-1 knock-down on the Casy profiles
The cell suspensions were analysed daily by the CASY-cell analyser starting from
24 to 120 hours after electroporation. We could detect a difference between the
CASY-profiles (cell size distribution) of the cells with reduced Raf-1 levels and the
control cells. Figure 24 shows the CASY-profiles of the different cells at the
indicated time points. 24h after electroporation, cells electroporated with the Raf-1-
siRNAs did not show remarkable differences compared to the control cells.
Importantly, 120 hours after electroporation a clear shift towards smaller cell size
could be observed and also a defined peak of differentiated cells could be noticed
in the profiles of Raf-1 deficient cells. The decrease in size and is one hallmark of
differentiation (see figure 24).
24h after electroporation:
low GC: Raf-1-2: Raf-1-1:
120h after electroporation:
low GC: Raf-1-2: Raf-1-1:
Figure 24: Casy Profiles 24h and 120h after electroporation After electroporation with 2 different Raf-1-siRNAs (Raf-1-1 and Raf-1-2) and lowGC-siRNA as a control, cell numbers were analysed daily (24h to 120h after the electroporation) by the CASY-cell analyser. CASY-profiles show cell-size distribution.

Results
80
3.3.3 Effects of the Raf-1 knock-down on the cell morphology
The cell morphology of the different cells was analysed via cytocentrifugation onto
glass slides and subsequent staining with benzidine and hematological dyes
(cytospins). Such cytospins were perfomed and analysed with each approach in
the accordant cell concentration.
We found that the cytospins of Raf-1 deficient cells showed more differentiated
cells relative to the control cells; this effect was noticed at low cell densities (1x10⁶
cells/mL) (see figure 25 (A)). Against the effects detected on the proliferation rate,
the cytospins of Raf-1 deficient cells seeded at higher concentrations showed no
significant difference in differentiation compared to the control cells (low-GC). The
shown experiment was performed with EPC culture (isolated from cord blood),
with an innately high spontaneous differentiation. Thus, at higher concentrations
(2x10⁶ cells/mL and 4x10⁶ cells/mL) the levels of differentiating cells were also
increased in the control cells (see figure 25 (B) and (C)).
Cell concentration:
1x10⁶ cells/mL
lowGC: x40 Raf-1-1: x40
Raf-1-2: x40
A)

Results
81
Figure 25: Raf-1 deficient cells show higher spontaneous differentiation 48h after electroporation with 2 different Raf-1-siRNAs (Raf-1-1 and Raf-1-2) and lowGC-siRNA as a control, the cells were seeded at 3 different concentrations (A) 1x10⁶ cells/ml, (B) 2x10⁶ cells/ml, (C) 4x10⁶ cells/ml). 24h to 120h after the electroporation cell aliquotes were cyto-centrifuged onto glass slides and stained. Here are shown the cytospins of the time-point 120h after the electroproation.
Cell concentration:
4x10⁶ cells/mL
lowGC: x40
Raf-1-2: x40
Raf-1-1: x40
C)
B)
Cell concentration:
2x10⁶ cells/mL
lowGC: x40 Raf-1-1: x40
Raf-1-2: x40

Results
82
Nevertheless, we could show that the reduction of Raf-1 resulted in an increase of
spontaneously differentiated cells when seeded at a concentration 1x10⁶cells/mL.
The cells with lower Raf-1 protein levels show a decrease in size and an increased
hemoglobin accumulation, two parameters which are typical signs for terminal
differention (see figure 25 (A)).
3.3.4 Effects of Raf-1 knock-down on pERK- and Caspase-3 levels
In the mouse erythroid cells Raf-1 has been demonstrated to stimulate ERK
activation and thereby to inhibit Caspase activation, which is involved in the
differentiation processes (Rubiolo et al., 2006).
To analyse whether Raf-1 has a similar function in human cells, we analysed the
phosphorylation of ERK- and the cleavage of Procaspase-3 on protein level in the
electroporated cell. Electroporation was performed in 2 different EPC- cultures
isolated from 2 different cord blood donors (LT11 and CB14). Cells were
electroprated with 2 different Raf-1 siRNAs (Raf-1-1- and Raf-1-2- siRNA); and the
non coding lowGC-siRNA and one approach electroporated without siRNA served
as negative controls. The knock-down efficiency and the pERK- and Procaspase-
3- levels were analysed by Westernblotting 72h or 96h after electroporation (figure
26).
As demonstrated on the left panel of figure 26, when Raf-1 knock-down was
performed in cord blood LT11, 72h after electroporation, the pERK levels were
slightly reduced (in the approach electroporated with Raf-1-2-siRNA), whereas the
Procaspase-3 levels remained unchanged. Furthermore, in the approach
electroporated with the Raf-1-1 siRNA, where the knock-down was even stronger
compared to the Raf-1-2 oligo, the pERK levels were not reduced, but Caspase-3
(which is correlating with reduced Procaspase-3) was slightly activated.
On the other hand in the Raf-1 knock-down performed in cord blood CB14 (see
right panel of figure 26), the pERK-levels were slightly reduced compared to the
lowGC-control and the Caspase-3 was activated (shown is the reduction of
Procaspase-3), especially in the approach electroporated with Raf-1-2 –siRNA.

Results
83
Effects of Raf-1 knock-down on pERK- and Caspase-3 levels
Raf-1 knock-down in LT11 (72h): Raf-1 knock-down in CB14 (96h):
Thus, we could detect in the human system similar effects as reported in the
mouse system. Unfortunately, when the Raf-1 knock-down was performed in other
EPC cultures from a different donor, the effects could not be reproduced: there
were no effects on the phosphorylation of ERK or on the cleavage of Procaspase-
3.
pERK
Raf-1
Procaspase-3
Gapdh
no
olig
o
Ra
f-1-2
Ra
f-1-1
Figure 26: Effect of Raf-1 knock-down on pERK and Caspase-3 levels Electroporation was performed in 2 different EPC cultures from 2 different cord blood donors (LT11 and CB14). Cells were electroporated with 2 different Raf-1 siRNAs (Raf-1-1- and Raf-1-2- siRNA); the non coding lowGC-siRNA and one approach electroporated without siRNA (no oligo) served as negative controls. The knock-down efficiency and the effects on the pERK- and Procaspase-3- levels were analysed by Westernblotting 72h or 96h after electroporation.
pERK
Raf-1
Procaspase-3
Gapdh
no
olig
o
low
GC
Raf-1
-1
Ra
f-1-2

Results
84
0
0,2
0,4
0,6
0,8
1
Tis11d TTP Tis11b
Ex
pre
ss
ion
-le
ve
l of
Tis
11
-lik
e p
rote
ins
(re
lati
ve
to
Tis
11
d-l
ev
els
=1
)
3.4 Tis11d: Zinc Finger Protein 36 like 2
In a microarray screen Tis11d has been identified as a glucocorticoid target gene.
Tis11d is a zinc-finger-like protein and member of the Tis11-family. The Tis11-
family consists of four mammalian members: TTP, Tis11b, Tis11d and Zfp36L3
(expressed only in rodents) (Baou et al., 2009).
We analysed the expression levels of all of the three Tis11-like proteins in human
EPCs on mRNA-level by Q-PCR and as shown in figure 27, we found that Tis11d
was the highest expressed zinc-finger-like protein in erythroid cells. While the
Tis11b-expression was extremly low, TTP showed intermediate expression levels.
To study the function of Tis11d in hEPCs we performed a Tis11d knock-down with
three different Tis11d-siRNAs (Tis11d-1, -2, -3).
The two non-coding low GC- and high-GC-siRNAs and one approach without
siRNA (no oligo) served as negative controls. 72h after the electroporation we
showed an over 80% decrease of the Gapdh protein level when using Gapdh-
siRNA as a positive control (figure 28). With the siRNA Tis11d-2, the Tis11d
protein-levels could be reduced by over 70% on protein-level 72 hours after
electroporation as shown in figure 28 (A). Importantly also the mRNA-levels were
reduced by over 60% after 72h in the samples treated with the siRNA Tis11d-2, as
demonstrated in figure 28 (B).
Figure 27: Expression levels of Tis11-like proteins in human EPCs
The levels of Tis11d, TTP and Tis11b were analysed by Q-PCR in hEPCs (d14).

Results
85
A) Knock-down on protein-level (72h) B) Knock-down on mRNA-level (72h)
3.4.1 Effect of the Tis11d knock-down on cell morphology
In the cell samples in which Tis11d- levels were reduced, we noticed an increase
of apoptotic cells in cytospin preparations 96h after the electroporation. As
mentioned above, when cells undergo apoptosis specific morphological changes
within the cell can be observed: cytoplasm condensation, nucleus shrinkage,
nuclear chromatin condensation, breakage of the cells into membrane-bound
apoptotic bodies, which are containing a variety of cytoplasmic organelles and
nuclear fragments. As shown in figure 29, in the cytospins of the Tis11d-deficient
cells exactly these morphological changes could be observed: When Tis11d was
knocked down, more cells with condensed and fragmented nuclei and apoptotic
body formations could be detected, those cells are pointed out in the cytospins
shown in the figures below by black arrows. The dead and apoptotic cells were
counted and are shown as % of total cells (figure 29 (B)). In the approaches where
Tis11d has been knocked down, an increase of approximatley 16% of dead and
apoptotic cells relative to the low-GC control was determined.
0
20
40
60
80
100
low GC high GC Tis11D-1 Tis11D-2 Tis11D-3
siRNA
% k
no
ckd
ow
n
Figure 28: Tis11d knock-down 72h after electroporation 2x10⁶ cells per approach were electroporated with 3 different Tis11d- siRNAs (Tis11d-1, -2, -3). The Gapdh-siRNA was used as a positive control; the non-coding low GC-, and high GC-siRNAs and one approach electroporated without siRNA (no oligo) served as negative controls. 72h after electroporation the knock-down was analysed on protein-level by Westernblot-analysis (A) and on mRNA-level by Q-PCR (B).
Knock-down was analyzed by Westernblotting (A) and Q-PCR (B).
no o
ligo
Tis11
d-1
Tis11
d-2
Tis11
d-3
low
GC
high
GC
Gap
dh
Tis11d
Gapdh

Results
86
A)
B)
living cells:
apoptotic cells:
The experiment was repeated with another batch of EPCs from a different donor,
and we observed a reproducible increase in apoptotic cells only in the approach,
where Tis11d was effectively downregulated. Electroporation was performed with
3 different Tis11d- siRNAs (Tis11d-1, -2, -3). The non-coding low-GC-siRNA, the
apoptosis-inducing siRNA and one approach electroporated without siRNA (no
oligo) served as negative controls. Figure 30 (A) shows the cytospins of the
different approaches, in which the black arrows point out the cells with the
condensed and fragmented nuclei. Dead and apoptotic cells were counted and
compared to the total cell number and shown as a % of cells in figure 30 (B).
Figure 29: Increase of apoptotic cells 96h after Tis11d-knock-down (A) 96h after electroporation cell aliquots were cyto-centrifuged onto glass-slides and stained as described (microscope: x40). Black arrows point out the cells with condensed and fragmented nuclei and apoptotic body formations during apoptosis. (B) Dead and living cells were counted and are shown as % of total cells.
low GC-siRNA: x40 Tis11d-siRNA: x40
% o
f c
ell
s
91
75
9
25
0
20
40
60
80
100
low GC Tis11d

Results
87
88 8682
7685
12 1418
2415
0
20
40
60
80
100
low GC no oligo Tis11d-1 Tis11d-2 Tis11d-3
% o
f cells
Figure 30: Increase of apoptotic cells 72h after Tis11d-knock-down (A) 72h after electroporation with 3 different Tis11d-siRNAs and lowGC-siRNA and apoptosis-inducing siRNA as controls, cell aliquots were cyto-centrifuged onto glass-slides and stained (microscope: x40). The knock-down was achieved with the Tis11d-2 siRNA. In this approach were more dead and apoptotic cells were detectable, pointed out by black arrows. (B) Dead and living cells were counted and are shown as % of total cells.
low GC-siRNA: 40x no siRNA: x40
Tis11d-1-siRNA: 40x Tis11d-2-siRNA: 40x
Apoptosis inducing siRNA: 40x Tis11d-3-siRNA: x40
living cells:
apoptotic cells:
B)
A)
Tis11d-1-siRNA: 40x

Results
88
The most efficient downregulation of Tis11d was achieved with the Tis11d-2-
siRNA and as shown in figure 30 exactly in this approach approximately 24%
apoptotic cells could be determined, whereas in the low GC control sample only 12
% of the cells were apoptotic. The cells electroporated with the low GC- control or
with the ineffective Tis11d-siRNAs, which didn’t reduce the expression of Tis11d,
showed mainly big cells with a large nucleus and a high amount of cytoplasm,
whereas the cells with reduced Tis11d protein levels showed an increased amount
of dead cells with small, dark and fragmented nuclei and a condensed cytoplasm
(evaluated in figure 30 (A)).
3.4.2 Effect of the Tis11d knock-down on cell volume and cell size
When cells undergo apoptosis a condensation of the cytoplasm occurs, before the
nucleus becomes defragmented. To analyse this morphological changes, an
additional electroporation was performed and the mean cell volume and the mean
cell diameter of the different approaches were analysed 24h to 96h after
electroporation by the CASY Cell Analyser. The Casy-measurements give
information about the cell count and the cell size.
The electroporation was performed with the Tis11d-2 siRNA. Gapdh-siRNA and an
apoptosis-inducing siRNA were used as positive controls, and the non-coding low
GC-siRNA served as a negative control.
We observed that cells with lower Tis11d levels show a decrease in the mean cell
volume and in the mean cell diameter after the electroporation, as shown in figure
31. The decrease of cell size is as high as in the approach electroproated with the
apoptosis-inducing-siRNA, where over 80% of the cells died 96h after the
electroporation.

Results
89
550
600
650
700
750
800
d0 24h 48h 72h 96h
different time-points
me
an
ce
ll v
olu
me
(fl
)
1 low GC
2 Gapdh
3 Apoptose
5 Tis11d
Effect of Tis11d knock-down on mean cell volume and mean cell diameter:
A) Decrease in mean cell volume 24h-96h after the electroporation
B) Decrease in mean cell diameter 24h-96h after the electroporation
Figure 31: Decrease of mean volume (fl) and mean diameter (µm) 24h to 96h after the electroporation with Tis11d-2-, lowGC-, GAPDH-, and apoptosis inducing –siRNA, the cells were counted daily by the CASY-cell analyzer. The Casy-profile gives you the cell count and as well the cell size (the mean cell volume (A) and (B) mean cell diameter).
9,8
10
10,2
10,4
10,6
10,8
11
d0 24h 48h 72h 96h
different time-points
1 low GC
2 Gapdh
3 Apoptose
5 Tis11d
me
an
cel
dia
mete
r (µ
m)

Results
90
3.4.3 Effect of the Tis11d knock-down on cell viability
By comparing the cells treated with the positive control for apoptosis with the
effects obtained with the reduction of Tis11d, we could prove that downregulation
of Tis11d induces apoptosis.
To verify the apoptosis-inducing function, we performed further Tis11d knock-
downs with three different hEPC- cultures and analysed the cell viability by FACS
analysis. Thus, mononuclear cells were isolated from three different cord bloods
(CB14, LT8 and LT9) and cultivation of EPC was performed as described in
Materials and Methods until day 14, when the electroporation was performed with
two Tis11d- siRNAs (Tis11d-1 and Tis11d-2). The non-coding low GC-siRNA
served as a negative- and the Gapdh-siRNA as a positive- control. The
downregulation on protein-level was analysed 96h after the electroporation by
Western-Blotting.
The knock-down efficiency of Tis11d and Gapdh on protein-level varied depending
on the used cord blood sample. As shown on the left panel of figure 32 the highest
Tis11d knock-down could be achieved in EPCs isolated from the cord blood CB14,
in which 96h after the electroporation the Tis11d levels could be reduced by over
80%, whereas in EPCs isolated from the cord blood LT8 and LT9 the knock-down
efficiency was lower. 96h after the electroporation the cell viability of each
approach was measured by an Annexin-V-staining by FACS-analysis, and the
results are shown in the right panel of Figure 32.
As shown in figure 32, we found that a reduction of Tis11d-protein levels resulted
in an increase of dead and apoptotic cells, measured as Annexin-V-positive cells
in all of the three different hEPC cultures.
In the approaches where Tis11d has been down-regulated efficiently (depending
on the cord blood, either with the Tis11d-1- or Tis11d-2- siRNA), nearly a two- fold
higher amount of dead and apoptotic cells was measured.

Results
91
A) Tis11d knock-down in CB14 (96h)
B) Tis11d knock-down in LT8 (96h)
C) Tis11d knock-down in LT9 (96h)
Figure 32: Tis11d knock-down induces apoptosis Tis11d knock-down was performed in 3 different EPC cultures isolated from 3 different cord blood samples (A) CB14, (B) LT8, (C) LT9. The non-coding lowGC-siRNA and Gapdh-siRNA were used as controls. 96h after the electroporation the knock-down was analysed by Western Blotting, as shown on the left panel of the figure. In each approach the cell viability was measured by an Annexin-V-staining by FACS analysis and is shown on the right panel of the figure.
Effect of Tis11d knock-down on cell viability
Tis11d
Gapdh lo
w G
C
Tis
11d
-2
Tis11d
Gapdh
Gapdh
Stomatin
Tis11d
Tis
11
d-1
Tis
11
d-2
Ga
pd
h
low
GC
0
0,2
0,4
0,6
0,8
1
1,2
1,4
1,6
1,8
low GC Gapdh Tis11d-1 Tis11d-2
different siRNAs
An
nexin
V-p
osit
ive c
ells
(rela
tive t
o G
ap
dh
=1)
0
0,2
0,4
0,6
0,8
1
1,2
1,4
1,6
1,8
2
low GC Gapdh Tis11d-2 Tis11d-3
different siRNAs
An
nexin
V-p
osit
ive c
ells
(rela
tive t
o G
ap
dh
=1)
0
0,2
0,4
0,6
0,8
1
1,2
1,4
1,6
1,8
low GC Tis11d
siRNAs
An
ne
xin
V-p
os
itiv
e c
ells
(re
lati
ve
to
lo
wG
C=
1)

Results
92
0
0,2
0,4
0,6
0,8
1
1,2
1,4
1,6
1,8
low GC Tis11d
In figure 33 the cell viability data of those 3 different experiments are taken
together and illustrated with the according standard deviation. In summary the
downregulation of Tis11d led to an 1,7 fold increase of Annexin-V-positive cells,
when compared to the cells transduced with lowGC-siRNA (relative to lowGC=1).
A performed student's t-test showed that the differences are statistically significant
(the p-value was 0,027).
3.4.4 Effect of the Tis11d knock-down on Caspase-3 levels
When cells undergo apoptosis several pathways can be involved. To analyse if the
apoptotic effect, seen after the Tis11d knock-down (shown on the left panel of
figure 32), is mediated either by intrinsic or extrinsic pathways, the levels of
Procaspase-3, -8 and BAX were analysed by Westernblotting. (Results are shown
in figure 34).
When Tis11d levels are reduced, we saw that Caspase-3 is activated, while the
pERK-levels are reduced. We analysed the levels of the Procaspase-3 (figure 34),
whose downregulation correleates with Caspase-3 activation.
Figure 33: Tis11d knock-down induces apoptosis Tis11d knock-down led to an increase of Annexin-V-positive cells (relative to lowGC=1). Data of three independent experiments, performed with 3 different EPC-cultures, isolated from 3 different cord blood samples.
An
ne
xin
-V p
osti
ive c
ells
(re
lati
ve t
o l
ow
GC
=1)

Results
93
Effect of the Tis11d knock-down on Caspase-3 levels
A) First Tis11d knock-down in CB14 (96h) B) Tis11d knock-down in LT8 (96h)
C) Second Tis11d knock-down in CB14 (72h)
Surprisingly the BAX-levels were also down-regulated after reduction of Tis11d
(figure 34 A). The Westernblot results concerning the caspase-8 are not conclusiv,
since the used antibody gave too high background levels (data not shown).
Figure 34: Downstream effects of the Tis11d-knock-down Tis11d knock-down was performed in 3 independent experiments, with two different hEPC-cultures (isolated from two different cord blood samples CB14 and LT8). 96h and 72h after the electroporation the knock-down efficiency of Tis11d was analysed by Westernblotting. Here are shown the downstream effects of the Tis11d downregulation on the pERK-, Procaspase-3- and Bax-levels. Downregulation of Procaspase-3, correlates with activation of Caspase-3.
Tis11d
Procaspase-3
Gapdh
low
GC
Ga
pd
h
Tis
11
d-1
Tis
11
d-2
Tis
11
d-3
Tis11d
Procaspase-3
Gapdh
low
GC
Tis
11d
-2
Tis
11d
-1
Tis
11d
-3
Ga
pd
h
Tis
11
d-1
Tis
11
d-2
pERK
Procaspase-3
BAX
Tis11d
Stomatin

Results
94
0
20
40
60
80
100
Gapdh Tis11d-1 Tis11d-2
TN
F-a
levels
(re
lati
ve t
o G
ap
dh
=100)
0
50
100
150
200
250
300
Gapdh Tis11d-1 Tis11d-2
TN
F-a
levels
(re
lati
ve t
o G
ap
dh
=100)
3.4.5 Effect of the Tis11d knock-down on TNFα-levels
Members of the Tis11-protein-family have been reported to be able to bind to
ARE- containing mRNAs and subsequently induce their degradation (Lai et al.,
1999). Tristetraprolin (TTP) is the most studied member of this family and it has
been shown in several publications that TTP can bind directly to the AU-rich
element in the TNF-α mRNA and thereby induce its degradation (Carballo et al.,
1998; Lai et al., 1999; Lai et al., 2000; Stumpo et al., 2009).
To analyse whether downregulation of Tis11d affects expression of TNF-α, we
measured the mRNA-level of TNF-α by real-time PCR (Q-PCR) in cells with
reduced Tis11d levels (see figure 35).
(A) normalised to the housekeeper (B) not normalised to the housekeeper
(C) Tis11d knock-down (96h)
Figure 35: TNF-α levels after Tis11d-knock-down Electroporation was performed with 2 different Tis11d-siRNAs. Gapdh-siRNA was used as a positive control. 96h after the electroproatin the Tis11d knock-down was analysed by Westernblotting (C). The TNF-α mRNA-levels in the approaches electroproated with the 2 different Tis11d-siRNAs, and the Gapdh-siRNA were analysed by Q-PCR (A) and (B). (A) On the left panel of the figure are shown the TNF-alpha mRNA-levels when normalised to the housekeeper CSNK1d and on the right panel of the figure are shown (B) the Q-PCR results of the TNF-alpha levels evaluated according the dCT-values.
Gapdh
Stomatin
Tis11d
Tis
11
d-1
Tis
11
d-2
Ga
pd
h
TN
F-α
levels
(re
lati
ve
to
Gap
dh
=1
00
)
TN
F-α
levels
(r
ela
tiv
e t
o G
ap
dh
=10
0)

Results
95
When the Q-PCR-data were evaluated relative to the housekeeper CSNK1d
(Casein kinase I isoform delta) (see figure 35 (A)), we could not detect a difference
of TNF-α mRNA expression after the Tis11d knock-down (figure 35 (C)).
But if the TNF- α levels were determined only according the dCT-values we could
demonstrate a nearly 3-fold increase of TNF-α mRNA in the absence of Tis11d, as
shown on the right panel of Figure 35 (figure 35 (B and C)).
As secreted TNF-α protein could also be responsible for the increased apoptosis;
we tried to measure the amount of TNF- α in the supernatant of the erythroid cells.
Therefore the supernatant of the different approaches of the Tis11d knock-down
was collected and the TNF- α levels were analysed by ELISA (Enzyme- linked
immunosorbent assay).
Unfortunately we could not detect TNF-α in the analysed samples. Probably the
TNF-α levels of the tested samples were below the limit of detection of the assay,
which was in the range of 10 pmol TNF-α (data not shown). Although we could
show that the mRNA for TNF-α is present in these cells, we couldn’t measure
TNF-α in our samples. Additionally, we can not exclude that soluble TNF-α is not
produced in hEPCs.

Results
96
3.5 Fkbp51: FK506-binding protein 51
To study the function of FKBP51 in primary hEPCs we performed a knock-down
with three different Fkbp51-siRNAs (Fkbp51-1, Fkbp51-2, and Fkbp51-3). The
non-coding low GC-, med- and high GC-siRNAs were used as negative controls.
The knock-down efficiency was analysed 72h after the electroporation by
Westernblotting, as shown in figure 36 (A). With all three siRNAs the expression of
FKBP51 could be reduced by over 90% on protein-level (data of the FKBP51
knock-down induced by the Fkbp51-1-siRNA are not shown). Importantly also the
mRNA-levels were reduced by over 60% to 75% with all three siRNAs 72h after
electroporation, as shown in Figure 36 B).
(A) Knock-down on protein-level (72h) (B) Knock-down on mRNA-level (72h)
3.5.1 Effect of FKBP51 knock-down on cell morphology
When FKBP51- levels were reduced we again observed an increase of apoptotic
cells. This effect was further analysed using cytospins. In the appraoches where
FKBP51 has been knocked down, a two fold increase of apoptotic cells relative to
the low GC control could be detected, as shown in figure 37. The cytospins of the
cells with reduced FKBP51-levels showed more cells with a condensed nucleus
and cytoplasm. The apoptotic cells are indicated by black arrows.
0
20
40
60
80
100
low GC med GC Fkbp51-1 Fkbp51-2 Fkbp51-3
% k
no
ck
do
wn
siRNA Figure 36: FKBP51 knock-down 72h after electroporation 2x10⁶ cells per approach were electroporated with 3 different FKBP51- siRNAs (FKBP51-1, -2, -3). The non-coding low GC-, and high GC- siRNAs were used as negative controls. 72h after electroporation the knock-down was analysed on protein-level by Westernblot-analysis (A) and on mRNA-level by Q-PCR (B).
low
GC
me
d G
C
hig
h G
C
Fkbp
51-2
Fkbp
51-3

Results
97
9
18
0
10
20
30
40
50
60
70
80
90
100
low GC FKBP51siRNAs
% o
f cell
sIncrease of apoptotic cells with reduced FKBP51 levels
(A)
(B)
living cells:
apoptotic cells:
The experiment was repeated with another batch of EPCs from a different cord
blood sample (LT11), and we observed a reproducible increase in apoptotic cells
in both approaches, where FKBP51 was effectively knocked down (data not
shown).
Low GC-siRNA: x40 Fkbp51-siRNA: x40
Figure 37: Increase of apoptotic cells 96h after FKBP51-knock-down (A) 96h after electroporation cell aliquots were cyto-centrifuged onto glass-slides and stained (microscope: x40. Black arrows point out the cells with condensed and fragmented nuclei and apoptotic body formations after downregulation of the FKBP51-levels. (B) Dead and living cells were counted and are here shown as a % of cells.

Results
98
Electroporation was performed with 2 different FKBP51- siRNAs (FKBP51-1, -2).
The non-coding low GC-siRNA and one approach electroporated without siRNA
(no oligo) served as negative controls. Knock-down efficiency was analysed by
Westernblotting 72h after the electroporation and the results are shown in figure
38. With both used FKBP51-siRNAs we could significantly reduce the protein
levels of FKBP51.
FKBP51 knock-down in LT11 (72h):
Figure 39 shows the morphological analysis of the different approaches. The cells
electroporated with the low GC- control showed mainly big cells with a large
nucleus and a high amount of cytoplasm, whereas the cells with reduced FKBP51
protein showed an increased amount of cells with small, dark and fragmented
nuclei and a condensed cytoplasm, all hallmarks of apoptosis. The dead cells are
pointed out by black arrows (figure 39 (A)).
Dead and apoptotic cells were counted and are shown as a % of cells in figure 39
(B). In both approaches, where FKBP51 levels were reduced, approximately 24%
of apoptotic cells could be determined, whereas in the low GC control sample only
12% of the cells were apoptotic. Thus, reduced FKBP51 leads to a two-fold
increase of apoptosis in erythroid cells.
Figure 38: FKBP51- knock-down in
LT11
FKBP51 knock-down was performed in EPCs of a different cord blood sample (LT11) with two different FKBP51-siRNAs (FKBP51-1 and FKBP51-2), the non-coding low GC-siRNA was used as a control. Knock-down efficiency was analysed by Westernblotting 72h after the electroporation.
low
GC
Fkb
p51-1
Fkb
p51-2
Fkbp51
Gapdh

Results
99
88 86
77 76
12 14
23 24
0
20
40
60
80
100
low GC no oligo Fkbp51-1 Fkbp51-2
% o
f c
ells
Increase of apoptotic cells with reduced FKBP51 levels
(A)
(B)
no-siRNA: 40x lowGC-siRNA: 40x
Figure 39: Increase of apoptotic cells in FKBP51 deficient cells 72h after electroporation with 2 different Fkbp51-siRNAs, cell aliquots were cyto-centrifuged onto glass-slides and stained (microscope: x40). LowGC-siRNA and one approach electroporated without siRNA served as negative controls. (A) In the cytospins of FKBP51-deficient cells more dead and apoptotic cells were detectable. Dead cells are pointed out by black arrows. (B) Dead and living cells were counted and are shown as % of total cells.
Fkbp51-2-siRNA: 40x
living cells:
apoptotic cells:
Fkbp51-1-siRNA: 40x

Results
100
9,8
9,9
10
10,1
10,2
10,3
10,4
10,5
10,6
10,7
24h 48h 72h 96h
1 low GC
2 Gapdh
3 Apoptose
7 Fkbp51
3.5.2 Effect of FKBP51 knock-down on cell volume and cell size
The mean cell volume and the mean cell diameter) of the cells were analysed 24h
to 96h after the electroporation of the different approaches by the CASY-cell
counter. We found that the cells with reduced FKBP51 showed a decrease in the
mean volume and in the mean diameter at the analysed time points shown in
figure 40 (A) and (B). Condensation of nuclei and cytoplasm during apoptosis is
leading to reduced cell volume (measured by mean volume and diameter; see
figure 40). Thus we found again that the reduction of the FKBP51 protein leads to
induced apoptosis in hEPCs.
A) Decrease in mean cell volume 24h-96h after the electroporation
B) Decrease in mean cell diameter 24h-96h after the electroporation
Figure 40: Decrease of mean volume (fl) and mean diameter (µm) 24h to 96h after the electroporation with FKBP51-1-siRNA (lowGC-siRNA, Gapdh-siRNA and apoptosis-inducing siRNA were used as controls), the different approaches were counted and the mean volume (A) and the mean diameter (B) were analysed by the CASY-cell counter. The casy profiles show cell count and cell size.
me
an
ce
ll d
iam
ete
r (µ
m)
500
550
600
650
700
750
800
d0 24h 48h 72h 96h
me
an
vo
lum
e (
fl)
1 low GC
2 Gapdh
3 Apoptose
7 Fkbp51
me
an
cell c
ell v
olu
me
(fl
)

Results
101
Effect of FKBP51- knock-down on cell viability
(A) Knock-down in CB14 (96h)
(B) Knock-down in LT8 (96h)
(C) Knock-down in LT11 (72h)
Figure 41: FKBP51 knock-down induces apoptosis FKBP51 knock-down was performed in 3 different EPC cultures isolated from 3 different cord blood samples ((A) CB14, (B) LT8, (C) LT11). The non-coding lowGC-siRNA was used as a control. 96h or 72h after the electroporation the knock-down was analysed by Western Blotting, as shown on the left panel of the figure. Cell viability was measured by FACS analysis (Annexin-V-staining) and is shown on the right panel of the figure.
0
0,2
0,4
0,6
0,8
1
1,2
1,4
1,6
no elpo low GC FKBP51-1 FKBP51-2
An
ne
xin
V p
os
itiv
e c
ell
s
(re
lati
ve
to
no
elp
o=
1)0
0,2
0,4
0,6
0,8
1
1,2
1,4
1,6
low GC Fkbp51
different siRNAs
An
nexin
V-p
osit
ive c
ell
s
(rela
tive t
o l
ow
GC
=1)
0
0,2
0,4
0,6
0,8
1
1,2
1,4
1,6
1,8
low GC Fkbp51
different siRNAs
An
nexin
V-p
osit
ive c
ells
(rela
tive t
o G
ap
dh
=1)
Fkbp51
Gapdh
no
elp
o
Fkb
p51-1
Fkbp51
Gapdh
low
GC
Ga
pd
h
Fkb
p51-1
low
GC
Fkb
p51-1
Fkb
p51-2
Fkbp51
Gapdh

Results
102
0
0,2
0,4
0,6
0,8
1
1,2
1,4
1,6
low GC FKBP51
3.5.3 Effect of FKBP51 knock-down on cell viability
To analyse whether the reduction of FKBP51 is inducing apoptosis, further
FKBP51 knock-downs were performed with three different hEPC- cultures isolated
from 3 different cord blood samples (CB14, LT8, LT11) and cell viability was
analysed by flow cytometry.
Electroporation was performed with two FKBP51- siRNAs (FKBP51-1 and
FKBP51-2). The non-coding lowGC-siRNA and one approach electroporated
without siRNA (no oligo) served as negative- controls. The downregulation on
protein-level was analysed 96h and 72h after the electroporation by Western-
Blotting (shown in left panel of figure 41). The knock-down efficiency of FKBP51
and Gapdh on protein-level varied depending on the cord blood sample and the
analysed time-point (72h or 96h). We saw that a reduction of FKBP51-expression
also resulted in an increase of AnnexinV-positive cells (right panel of figure 41). In
the approach with the maximal FKBP51 reduction, an increase of apoptotic and
death cells of up to 1,6 (relative to lowGC=1) could be measured (see right panel
of figure 41).
In figure 42 the cell viability data of those 3 different experiments were taken
together and are illustrated with the according standard deviation. In summary the
downregulation of FKBP51 led to an 1,55 fold increase of Annexin-V-positive cells,
when compared to the cells transduced with lowGC-RNA (relative to lowGC=1).
A performed student's t-test showed that the differences are statistically significant
(p-value was 0,004).
.
Figure 42: FKBP51 knock-down induces apoptosis
FKBP51 knock-down led to an 1,55 fold increase of Annexin-V-positive cells (relative to lowGC=1). Data of three independent experiments, performed with three different EPC-cultures, isolated from three different cord blood samples.
An
ne
xin
-V p
osti
ive
cells
(re
lati
ve t
o l
ow
GC
=1)

Results
103
3.5.4 Effect of FKBP51 knock-down on NF-kB levels
FKBP51 is a multifunctional protein and its expression is induced by
glucocorticoids. It has been reported that FKBP51 might be implicated in the
regulation of NF-kB activation and that FKBP51 links the glucocorticoid signaling
to the NF-kB signaling pathway (Komura et al., 2005; Park et al., 2007; Romano et
al.). When FKBP51 was overexpressed in megakaryocytes of human idiopathic
myelofibrosis (IMF) patients, Komura et al. could demonstrate that this
overexpression led to resistance to apoptosis. And at the same time
overexpression of FKBP51 in this hematopoietic cell line, induced a sustained NF-
kB activation. But this relationship between FKBP51 overexpression and a
constitutive NF-kB activation in megakaryocytes needs further approval (Komura
et al., 2005).
Therefore, also in our studies we analysed the effects of the FKBP51
downregulation on the NF-kB levels in primary human erythroid progenitor cells.
FKBP51 knock-down was performed in three independent experiments with
different FKBP51 siRNAs (FKBP51-1,-2,-3) in 2 various EPC cultures (LT11 and
CB14) isolated from 2 different cord blood samples. The non-coding lowGC-, med-
GC-siRNAs and one approach not electroporated at all (no elpo) served as
negative controls. The knock-down efficiency of FKBP51 varied depending on the
EPC culture and on the analysed time-point. 72h and 96h after electroporation the
downstream effects of the FKBP51 downregulation on the phosphorylated and
unphosphorylated IKKα/β-, IKBα-, NF-kB- and the Procaspase-3- levels were
analysed by Westernblotting.
As shown in Figure 43, we could demonstrate that in hEPCs the phosphorylation
of NF-kB and as well the unphosphorylated NF-kB-levels were reduced after
FKBP51 downregulation. Additional to the NF-kB- levels, we found that the pIKKα-
and pIKBα- levels were downregulated, whereas Caspase-3 levels seemed not be
affected (see Figure 43). These effects could be reproduced several times (data
not shown).

Results
104
Downstream effects of FKBP51 knock-down
(A) FKBP51 knock-down in LT11 (72h) (B) FKBP51 knock-down in CB14 (72h)
(C) FKBP51 knock-down in CB14 (96h)
Figure 43: Fkbp51 knock-down led to downregulation of pNFkB levels FKBP51 knock-down was performed in three independent experiments with different FKBP51 siRNAs (FKBP51-1,-2, -3) in 2 EPC cultures ((A) LT11 and CB14 (B) and (C)) isolated from 2 different cord blood samples. The non-coding lowGC- and med-GC-siRNA and one approach not electroporated at all (no elpo) served as negative controls. The downstream effects of the FKBP51 downregulation on the phosphorylated and unphosphorylated IKKα/β-, NFkB-, the IKBα-, and the Procaspase-3- levels were analysed by Westernblotting 72h or 96h after electroporation.
Fkbp51
pNF-kB
pERK
Procaspase-3
Gapdh
Tis
11
d-3
Fkb
p51-1
Fkb
p51-2
low
GC
pIKKα/β
pIKKα/β
me
d G
C
hig
h G
C
Fkb
p51-2
Fkb
p51-3
FKBP51
Gapdh
pIKBα
pNF-kB
IKKα/β
NF-kB
IKBα
Fkbp51
Gapdh
no
elp
o
Fkb
p51-1
pNF-kB
pIKBα
pIKKα/β
NF-kB

Results
105
0
20
40
60
80
100
120
med GC Tis11d-2 Fkbp51-1
FK
BP
51
mR
NA
lev
els
(%
)
(re
lati
ve
to
me
d G
C=
10
0)
3.6 Tis11d knock-down leads to FKBP51 downregulation
After we performed a Tis11d knock-down and FKBP51 knock-down together in
one experiment, we could show that reduction of the Tis11d levels, led also to a
downregulation of FKBP51.
In this experiment the non-coding medGC-siRNA was used as a control and the
knock-down efficiency on mRNA level was analysed 96h after the electroporation
by Q-PCR shown in figure 44. We could show that Tis11d knock-down led also to
a dramatically decrease of FKBP51 on mRNA level and on protein level (data not
shown). FKBP51 levels were reduced up to 85% in the approach, where Tis11d
has been knocked down. A possible interaction between those two GR-target
genes is estimated.
Figure 44: FKBP51 mRNA levels after Tis11d and FKBP51 electroporation Electroporation was performed with Tis11d- and FKBP51-siRNAs, medGC-siRNA was used as a control. The FKBP51 mRNA levels were analysed by Q-PCR and shown in % relative o medGC-siRNA.
FK
BP
51 m
RN
A l
evels
(%
) (r
ela
tiv
e t
o m
ed
GC
=10
0)

Discussion
106
4. DISCUSSION
4.1 Raf-1
The family of Raf kinases consists of 3 different isoforms: A-Raf, B-Raf and Raf-1,
which are expressed during the embryonic development. The 3 Raf isoformes are
regulated differentially by upstream activators and show differences in their ability
to activate MEK (Mikula et al., 2001). The best studied Raf isoform is Raf-1, which
has been shown to be implicated in mechanisms regulating proliferation,
differentiation and survival of mouse erythroblasts, by preventing apoptosis and
and promoting proliferation.
Mikula et al. reported that Raf-1 deficient mouse embryos are anaemic, have
hypocellular livers and die at E12.5 due to hepatoblast failure. Raf-1 deficient fetal
livers contained fewer erythroid progenitors than WT livers (Mikula et al., 2001).
Additionally it has been shown that during differentiation of primary mouse
erythroblasts Raf-1 protein is degraded and that overexpression of Raf-1 can
delay terminal erythroyid differentiation by inhibiting activation of Caspases
(Kolbus et al., 2002). Thus, the anaemic phenotype of the embryos lacking Raf-1
could be linked to the premature differentiation of erythroblasts.
Furthermore it has been reported that Raf-1-deficient mouse erythroblasts
differentiated much faster than the wild-type erythroblasts. In the cytospins of Raf-
1 deficient cells immature, mature and hemoglobinized cells could be found,
whereas the control cells consisted mainly of large and undifferentiated cells.
When differentiation was initiated (by high EPO and insulin) in erythroblasts, cells
lacking Raf-1, showed a dramatic increase of nucleated and enucleated
erythrocytes with accelerated differentiation compared to WT cells (Kolbus et al.,
2002).
Those in vivo and in vitro studies revealed that in the mouse system Raf-1 seems
to be involved in the regulation of differentiation and proliferation of erythroid
progenitor cells.

Discussion
107
4.1.1 Raf-1 knock-down in hEPCs led to more spontaneous differentiation
Little is known about the function of Raf-1 in human erythropoesis. Thus, in our
study we analysed whether Raf-1 is also implicated in the differentiaton and
proliferation process of human erythroid cells by using Raf-1 knock-down
approaches in primary human erythroid progenitor cells.
We could show that cells with reduced protein levels of Raf-1 proliferated slower
when compared to control cells. This effect was better detectable, when the cells
were cultivated at higher cell densities. When the cell morphology was analysed
via cytospins, Raf-1 knock down cells showed more spontaneously differentiated
cells. The CASY profiles of Raf-1 downregulated cell-cultures were shifted to the
left, indicating a decrease in cell size which is characteristic for terminal erythroid
differentiation. Unfortunately, in the experiments performed in the presented study,
the difference between the control cells and the cells with low Raf-1 levels were
not as prominent as in the mouse system. This could be due to the fact that the
used control cells showed an increased spontaneous differentiation, which may
superimpose the effect of Raf-1 downregulation.
In erythroid cells Caspases are not only involved in apoptotic mechanisms, but
they have been shown to play an important non-apototitc role in the differentiation
mechanisms. Carlile et al. for example demonstrated that reduction of Caspase
activity during early human erythropoiesis resulted in a block of erythroid
maturation. Without Caspase activation human erythroblasts did not develop
beyond the pronormoblast stage (Carlile et al., 2009). Caspases are activated by
Fas, which is a member of the tumor necrosis factor family of receptors. As Raf-1
downregulation has been shown to correlate with up-regulation of Fas in the
erythroid progenitors, it has been concluded that Raf-1 might therefore be involved
indirectly in Fas activation (Rubiolo et al., 2006). Furthermore Raf-1 has also been
shown to act as a MEK/ERK activator.
Figure 45 is showing a scheme of the current hypothesis of the function of Raf-1 in
mouse erythroblasts reported by Rubiolo et al. According to this model in the
mouse system ERK and Raf-1 are involved in a positive feedback loop.

Discussion
108
Working model in the mouse system:
When Raf-1 is present: → caspase dependend differentiation is inhibited
When Raf-1 is absent: → caspase dependend differentiation is activated
Figure 45: Raf-1 stimulates proliferation and inhibits differentiation in mouse erythroid cells Glucocorticoids maintain the Raf-1 expression, which in order stimulates ERK acivation and thereby inhibits FAS. In this way Caspases activation is inhibited and EPCs undergo renewal. When the renewal stimulus is absent, Raf-1 is degraded, and ERK can not be activated. Thus Fas is present and induces Caspase activation and thereby induces differentiation (Rubiolo et al., 2006).

Discussion
109
Raf-1 is required for ERK activation and activated ERK on the other hand
maintains Raf-1 expression. Activated ERK inhibits FAS and thereby also the
Caspase activation, whereby Caspase-mediated differentiation is repressed. This
suggests, that in prescence of Raf-1, erythroblasts are maintained in an immature
state (renewal). When Raf-1 is knocked down, the renewal stimulus is absent, as
ERK can’t be activated and therefore Fas is present and induces Caspase
activation and thereby differentiation.
Also in our studies the downstream effects of the Raf-1 knock-down in hEPCs
were analysed in the human system. According to the findings in the mouse
system, in absence of Raf-1 we expected a downregulation of the pERK levels
and an activation of the Caspase-3 levels. Caspase activation would explain the
slight increase of spontaneous differentiation in our experiments.
But again the effects were not as prominent as in the mouse system, the Caspase-
3 activation was very low and we didn’t notice remarkable effects on the
phosphorylatian of ERK (pERK). Then there was the discrepancy that Caspase
activation and pERK downregulation could not be detected in the same approach,
either the Caspase-3 levels were affected or the pERK levels were downregulated.
And even more remarkable was that in some experiments we couldn’t detect any
effects on both, the Caspase-3 and the pERK-levels, although Raf-1 has been
knocked down efficiently. Furthermore the effects of the knock-down on the
spontaneous differentiation were not reproducible, as the effects couldn’t be
reported in other experiments, where Raf-1 has been knocked down.
Those findings therefore argue against the hypothesis that in human erythroid
system Raf-1 has the same role in differentiation processes as reported in the
mouse system.

Discussion
110
4.2 TIS11d
As mentioned above Tis11d is a zinc-finger-like protein and member of the Tis11-
family. The Tis11-family consists of four mammalian members:
- TTP (Tristetraprolin)
- Tis11b (ZFP36l1 in the mouse system)
- Tis11d (ZFP36l2 in the mouse system)
- Zfp36L3
The fourth family member Zfp36L3 has been shown to be expressed only in
rodents and in the mouse placenta, but has not yet been detected in human
tissues so far. Characteristics of Tis11- like proteins are two tandem repeat zinc
finger regions. The Tis11-like proteins have been shown to induce degradation of
specific mRNAs (see figure 46). Through their zinc finger regions they are able to
bind to the adenine-uridine (AU) rich elements (ARE) in the 3’-untranslated region
of mRNAs and thereby they first promote deadenylation, then decapping and
finally degradation of a variety of different mRNAs containing AU-rich elements
(Baou et al., 2009; Wilusz et al., 2001).
A)Deadenylation
C) 5’-3’ mRNA decay
degraded mRNA
B)Decapping
C) 3’-5’ mRNA decay
Figure 46: Members of the Tis11- family induce mRNA degradation Through their zinc finger region Tis11-like proteins bind to adenine-uridine (AU) rich elements of mRNAs and thereby promote deadenylation, decapping and finally degradation of mRNA (picture taken from: Baou et.al., 2009).
Discussion
111
Interestingly, such AREs are also found at the 3’ end of each of the mRNAs of the
Tis11- proteins, which suggests that they might regulate themselves by a negative
feedback loop. The Tis11 family of proteins have an important role in
posttranscriptional gene regulation and in the control of a variety of developmental
and functional processes (Baou et al., 2009; Johnson et al., 2000).
Little is known about the function of Tis11d in humans in general or specifically in
erythropoiesis. In adult mouse tissues Tis11d is expressed at high levels in thymus,
spleen, lung, uterus, ovary, small and large intestine, fat and bone marrow and
lower levels in heart, kidney, eye, fetal liver, brain and skeletal muscle (Ino et al.,
1995).
After we analysed the expression levels of all of the three Tis11-like proteins in
human EPCs, we found that Tis11d was the highest expressed zinc-finger-like
protein in erythroid cells. The high expression level of Tis11d in erythroid cells
indicates that Tis11d is the most prominent member of the three Tis11 like family
genes, and plays the most important role in these cells.
Tis11b knock-out mice are embryonically lethal; they die in utero between day E8
and E13, probably due to defective extraembryonic vasculogenesis (Bell et al.,
2006).
Stumpo et al. demonstrated that in the mouse system Tis11d is involved in
erythropoiesis and hematopoiesis. Zfp36l2 knock-out mice appeared normal until
birth, but two weeks after birth they died of severe anemia. These knock-out mice
showed significantly reduced levels of red and white blood cells, hemoglobin,
hematocrit and platlets in peripheral blood analysis. Bone marrow analysis showed
decreased myeloid and megakaryocyte cell populations. Loss of Zfp36l2 also led
to a decreased level of hematopoietic progenitor cells (HPCs) and hematopoietic
stem cells. Zfp36l2-/- fetal liver cells were unable to reconstitute the hematopoietic
systems in lethally irradiated mice, which suggests that Zfp36l2 might be required
for self-renewal and maintenance of adult HSCs. By performing colony forming
assays out of fetal liver cells from Zfp36l2 deficient cells, a significant lower
number of erythroid BFU-E (burst formung units) and CFU-GM (granulocyte
macrophage units) was observed (Stumpo et al., 2009). These studies indicate
that Tis11d plays an important role in erythropoiesis and in definitive
hematopoiesis during mouse development.
Discussion
112
4.2.1 Downregulation of Tis11d in primary hEPCs induces apoptosis
In our studies the downregulation of Tis11d in primary hEPCs resulted in an
apoptotic phenotype. We could demonstrate that compared to the control cells,
Tis11d-deficient cells showed an increase of approximatley 12% of dead
/apoptotic cells in the cytospins 72h to 96h after the electroporation. Data of three
independent experiments with three different hEPCs-cultures (isolated from three
different cord blood samples) revealed that the downregulation of Tis11d led to an
up to 1,7 fold increase of Annexin-V-positive cells, when compared to the cells
transduced with lowGC-siRNA (relative to lowGC=1).
Apoptosis can be mediated either by the instrinsic or extrinsic pathway (see
chapter 1.6). As already mentioned the extrinsic pathway is initiated through the
stimulation of the transmembrane death receptors, such as TNF-α-Receptor,
wheareas the intrinsic pathway is initiated through the release of signal factors by
mitochondria within the cell. In the extrinsic pathway Caspase-8 is directly inducing
the cleavage of Procaspase-3 leading to the active form Caspase-3. And in the
intrinsic pathway the activated Caspase-8 is first activating BID, which in turn
activates BAK and BAX. Both pathways have at the end of the signalling cascade,
an activated Caspase-3, which then induces apoptosis by cleaving several
proteins in various cellular compartments.
We could show that in every approach where Tis11d has been downregulated, the
Procaspase-3 levels were decreased most probably by cleavage, leading to
activation of Caspase-3. This clearly demonstrated that the cells undergo
apoptosis. We also could show that the BAX-levels were down-regulated in the
cells with reduced Tis11d levels, which was quite surprisingly, as we expected
either no effect on the BAX levels, if cells die through the extrinsic pathway, or an
upregulation of BAX if apoptosis is induced through the intrinsic pathway. Thus it
remains still unclear whether the erythroid cells undergo apoptosis through the
intrinsic or the extrinsic pathway.

Discussion
113
4.2.2 Targets of Tis11-like proteins
Studies from TTP-, Tis11b- and Tis11d- knock-out mice revealed a lot of different
mRNA- targets of Tristetraprolin in humans (see figure 47), but little is known
about specific Tis11d- mRNA targets. The reported Tis11d- targets in humans are
(Baou et al., 2009):
→ TNF-α (Tumor Necrosis Factor alpha)
→ GM-CSF (granulocyte-monocyte colony-stimulating factor)
→ IL-3 (interleukin-3)
The most studied member of the Tis11-family is Tristetraprolin (TTP). As shown
in figure 47 the most prominent mRNA- target of TTP in humans is the tumor
necrosis factor alpha (TNF-α).
In 1998 Carballo et al. reported a possible interaction of TTP and TNF-α in studies
of TTP-deficient mice. TTP-deficient mice appeared normal at birth, but after two
weeks they were suffering of syndroms of infammatory arthritis, autoimmunity, and
extramedullary hematopoiesis, which were typical syndroms of TNF-α- excess
(Taylor et al., 1996). These findings suggested that TNF-α seemed to be target of
Tristetraprolin and that TTP might induce degradation of TNF-α-mRNA. Abscence
of TTP led to abnormal accumulation of TNF-α- mRNA and protein. It has also
been demonstrated that macrophages isolated from TTP-/- fetal livers secreted
five-times more TNF-α compared to the control cells (Carballo et al., 1998).
Furthermore, the cellular levels of TNF-α-mRNA were two times higher compared
to the wild-type macrophages. The half-life of the TNF-α mRNA in macrophages
increased from 12 minutes (WT) up to 39 minutes in macrophages lacking TTP.
Therefore they could show that TTP regulates the amount of TNF-α mRNA
postranscriptionally and not by inhibiting gene expression. This TNF-α
accumulation was responsible for the development of a systemic inflammatory
syndrome characterized by arthritis, skin lesions, autoimmunity and myeloid
hyperplasia (Carballo et al., 1998; Lai et al., 1999; Taylor et al., 1996).

Discussion
114
Figure 47: Human Tis11 family members and their reported mRNA targets Tristetraprolin is the most studied member of this family, with the most known mRNA-targets in humans. For Tis11d there are just 3 known mRNA-targets reported in humans: TNF-α, GM-CSF and IL-3. (Baou et. al., 2009)

Discussion
115
TNF-α affects a number of different cell types and it is mainly produced by
activated macrophages and lymphocytes. TNF-α can act either directly or
indirectly by inducing other cells to produce cytokines, like hematopoietic growth
factors. In hematopoiesis TNF-α acts as a positive and as a negative regulator of
myeloid cell proliferation and differentiation (Rusten and Jacobsen, 1995).
It has been demonstrated that TNF-α suppresses erythropoiesis by inhibiting the
generation of Glycophorin-A+ cells derived from CD34+ cells (Xiao et al., 2002).
TNF-α therefore inhibits the differentation of CD34+ cells into mature eryhthroid
cells. It has been reported that TNF-α maintains erythropoiesis in vivo and in vitro
by constraining the proliferative capacity of mature erythroid progenitor cells (Li et
al., 1989). When CD34+ cells were treated with TNF-α, this resulted in inhibition of
growth of BFU-E and CFU-E-cultures, which suggests that TNF-α not only inhibits
the differentiation but also the proliferation of hEPCs (Xiao et al., 2002).
As it has been reported that TNF-α is also one of the Tis11d-targets as shown in
figure 47, and that TTP-knock-down in the mouse system led to an accumulation
of TNF-α, we also expected that the absence of Tis11d in erythroid cells would
lead to an accumulation of TNF-α since the TNF-α-mRNA can’t be degraded
anymore. TNF-α accumulation would lead to an increased Caspase-8 activation
and in turn also to an increased Caspase-3 activation, exactly what we found after
the downregulation of Tis11d by siRNA.
Unfortunatley we couldn’t detect any significant effects of Tis11d on the TNF-α
levels, neither on mRNA-level, nor in the supernatant of different appraoches,
since the TNF-α levels were below the detection limit.
According the protocols described in Materials and Methods, a partial medium
change and an adjustment of the cell number to a concentration of 1x10⁶ cells/mL
was performed daily. Therefore every day part of the supernatant was discarded.
This could be a possible explanation why the TNF-α content was below the
detection limit of the ELISA assay and couldn’t be measured. Thus, in further
experiments the single proliferation-factors should be added in the appropriate
concentration directly to the cell suspenstion, without performing a partial medium
change. Thereby a possible TNF- α accumulation in the supernatant could be
achieved, which would be high enough for measuring by an ELISA assay.

Discussion
116
On the other side, another possibility could be that in human erythroid cells no
soluble TNF-α is produced. It could also be that Tis11d is even involved in other
than the expected signaling pathways and thus Tis11d has no effect on the TNF-α
levels at all. Figure 48 shows a possible model on how Tis11d could be involved in
the apoptosis protection in primary human erythroid cells.
DEGRADATION
Tis11d TNF-α mRNA degradation
NO Caspase-8 activation
NO Caspase-3 activation
NO apoptosis
4.2.3 Tis11d might have anti-apoptotic effects in hEPCs
In summary we could show that the reduction of Tis11d siRNA induces apoptosis
in human EPCs. As it has been reported that Tis11 proteins are involved in the
deadenylation and destabilization of a variety of different mRNAs, we suggest that
the reduction of Tis11d may lead to an abnormal stabilization of one or more
mRNAs, whose protein products may have a direct or indirect affect on apoptosis
induction in erythroid cells.
Figure 48: Possible ivolvement of Tis11d in apoptosis-protection When Tis11d is present TNF-α is degraded and Caspases are not activated. Without activated caspases, apoptosis is not induced.

Discussion
117
But as we couldn’t demonstrate any effect on the TNF-α levels, maybe Tis11d acts
on the stability of other ARE-containing mRNAs. A lot of mRNAs encoding
cytokins, transcription factors, apoptosis regulators contain AU- rich elements
(ARE) at their 3’ untranslated region. It is estimated that approximatley 8% of
mRNAs may contain AREs (Bakheet et al., 2003). As the Tis11d knock-down
induces apoptosis, the unknown mRNA-target is probably directly or indirectly
involved in the induction of apoptosis. On the other hand, when Tis11d is inducing
the degradation of this unknown target, it implies that Tis11d might be responsible
for apoptosis protection in human erythroid progenitor cells.
As already mentioned, studies with Tis11d knockout mice revealed an involvment
of Tis11d in erythropoiesis and in definitive haematopoiesis (Stumpo et al., 2009).
During my diploma thesis, I could also show that Tis11d plays an essential role in
human erythroid progenitor cells. The exact function of Tis11d in humans still
needs to be further investigated.
Analysis using microarrays showed that in Tis11d deficient mice, Cxc11-mRNA
was upregulated (Stumpo et al., 2009). In mice Cxc11 is a homolog of human IL-8,
which is a chemokine that has been shown to play a critical role in stem cell
survival, development and homeostasis (Romagnani et al., 2004). Thus, IL-8 could
be a possible target of Tis11d in human cells, and IL-8 could be also involved in
the apoptotic process.
Further studies are required, to find out the mechansism behind the observed
induction of apoptotis. Microarray analyses of Tis11d deficient cells could reveal
other upregulated mRNAs, which may be involved in apoptosis or other regulatory
mechansisms.
Discussion
118
4.3 FKBP51
In a recent genome-wide profiling of human lung biopsies, FKBP51 has been
identified as the most highly glucocorticoid-induced gene (Woodruff et al.,
2007). Glucocorticoids bind to the GR, a transcription factor, which is situated in
the cytoplasm in absence of glucocorticoids. In the cytoplasm the GR is
associated with the heat shock protein 90 chaperone (HSP90), which keeps the
receptor in an inactive form (Paakinaho et al., 2010). (Paakinaho et al.).
FK506-binding protein 51 is a multifunctional co-chaperone protein and a
component of the GR complex, as it can bind to the HSP90 chaperone protein.
FKBP51 is also a member of the HSP90 steroid receptor complex, which is a
cellular chaperone protein that is preventing protein aggregation. The HSP90
steroid receptor complex maintains the GR in a conformation able to bind to
steroids (Rees-Unwin et al., 2007).
As depicted in figure 49, during the formation of the GR complexes, FKBP51
competes with its homolog FKBP52 for binding to HSP90 (Davies et al., 2002).
When FKBP51 and FKBP52 are bound to the GR-complex, they differentially
modulate the interaction of glucocorticoids with the GR. It has been reported that
FKBP51 decreases the affinity of the glucocorticoids for binding to their receptor
(Park et al., 2007).
Davies et al. demonstrated that replacement of FKBP51 by FKBP52 in the GR
complex induces the translocation of the activated GR complex into the nucleus,
where it leads to the activation or the inactivation of specific target genes. Thereby
glucocorticoids can influcence metabolic and developmental processes (Davies et
al., 2002).
The FKBP51 expression in response to glucocorticoids has been studied in
several cell types and tissues in vivo and in vitro. In mononuclear cells isolated
from peripheral blood it has been demonstrated that dexamethasone-treatment of
individuals led to a 30-fold increase of FKBP51 mRNA (Vermeer et al., 2004).
J. Park et al. infected chickens with the Newcastle disease virus (NDV), which is a
highly immunogenic virus that induces glucocorticoid secretion, to study the
glucocorticoid-dependent- FKBP51 expression. He observed a 130-fold induction
of FKBP51-mRNA levels in the liver of NDV-infected chickens. Thereby he

Discussion
119
demonstrated that glucocorticoids are the main cause of systemic induction of
FKBP51 (Park et al., 2007).
It is suggested that FKBP51 is involved in the negative feedback regulation of the
GR signaling, which means that at high levels of glucocorticoids, the expression of
FKBP51 is stimulated, whereas high levels of FKBP51 limit the GR activation.
Figure 49: FKBP51 is involved in the GR-complex-activation (picture taken and modified from: Davies et al., 2002).
It has been reported in several publications that the multifunctional FKBP51 might
be implicated in the control of apoptosis (Bouwmeester et al., 2004; Giraudier et
al., 2002; Komura et al., 2005).
Giraudier et al. demonstrated that overexpression of FKBP51 induced a resistance
to apoptosis with no effect on proliferation. In this study, FKBP51 was
overexpressed in human megakaryocytes derived from CD34+ cells and after the
overexpression apoptosis was induced by cytokine deprivation. This resulted in a
Glucocorticoids bind to their
receptor (GR) and activate it
HSP90 and FKBP51 keep the GR in an
inactive state
FKBP51 is replaced by FKBP52 and active GR-complex translocates to
the nucleus
nucleus
In the nucleus the GR acts as a transcription factor and influences
the expression of
variouse target genes

Discussion
120
significant increase in survival of CD34+ cells. Cells remained alive for more than
five days, whereas 50% of the control cells died after two days of cytokine
deprivation. Relative to the control cells, the number of Annexin-V-positive cells
was remarkley increased in cells overexpressing FKBP51. This resistance to
apoptosis was further confirmed by analysing the Procaspase-3 levels: cells
overexpressing FKBP51 showed less Caspase-3 activation relative to the control
cells (Giraudier et al., 2002).
Down-regulation of the FKBP51 levels in malignant melanoma cells by siRNAs led
to induction of apoptosis. Romano et al. could demonstrate that after irradiation of
FKBP51-downregulated malignant melanoma cells this resulted in massive
apoptosis in vivo and in vitro. Cell death was measured by Annexin-V-analysis.
They could clearly show that irradiation of cells induced a remarkable increase of
Annexin-V-positive cells compared to the control cells. Typical biochemical
markers for appoptosis, such as cleaved Caspase-9 and -3 were observed in
irradiated cells, where FKBP51 has been knocked down. The same results could
be reported in vivo: When nude mice (tumor-xenograft mice) were treated with a
single dose of FKBP51- siRNA before the irradiation, this resulted in an extensive
apoptosis. All those data demonstrated that FKBP51 has a relevant role in
counteracting apoptotis (Romano et al., 2010). (Romano et al.).
4.3.1 Downregulation of FKBP51 in primary hEPCs induces apoptosis
In accordance with the published data, also in our studies we could show that
reduction of the FKBP51 levels in primary hEPCs resulted in an apoptotic
phenotype. In the cytospins of cells with reduced FKBP51 levels a two fold higher
amount of dead and apoptotic cells was observed. This induction of apoptosis
could be reproduced in a second independent experiment. Measuring the
Annexin-V-positive cells, we obtained similar results in even three independent
experiments using erythroid cultures of three different cord blood samples. The
reduction of FKBP51 led to a 1,55 fold increase of Annexin-V- positive cells when
compared to the lowGC- control (lowGC=1).

Discussion
121
4.3.2 FKBP51 is involved in the NF-kB pathway
Glucocorticoid-mediated FKBP51 expression has been demonstrated to play a
central role in the activaton of the NF-kB-pathway (Bouwmeester et al., 2004;
Komura et al., 2005; Romano et al.).
Park et al. demonstrated that expression of FKBP51 in NDV (Newcastle disease
virus) infected chickens results in induction of an NF-kB luciferase reporter gene
even in abscence of glucocorticoids. This supported the existance of an FKBP51-
mediated NF-kB activation pathway (Park et al., 2007).
As already mentioned in chapter 1.6.3, NF-kB is located in the cytoplasm as an
inactive form, where it is associated with its inhibitor IkBα. IkBα can be
phosphorylated by an active IKKα, which leads to the degradation of IkBα by a
proteasome. Thereby NF-kB is released and translocates into the nucelus, where
it stimulates the expression of multiple antiapoptotic genes, like Bcl-2, Bcl-XL and
BFL1.
Romano et al. reported that FKBP51 knockdown in malignant melanoma cells
prevented the translocation of NF-kB into the nucleus. In FKBP51-silenced cells
the lack of NF-kB induction permitted the activation of the apoptotic machinery,
leading to the cellular suicide. The downregulation of FKBP51 induced by siRNA,
inhibited the activation of NF-kB by tumor necrosis factor alpha, demonstrating
that FKBP51 is a key regulator of the NF-kB pathway (Romano et al., 2010). (Romano et al.).
In 2005 Komura et al. compared the NF-kB activation in the factor dependendent
UT7/Mpl cell line overexpressing FKBP51 (UT7/FKBP51) with the WT-cell-line
(UT7/Mpl). They could show that overexpression of FKBP51 led to constitutive NF-
kB activation after cytokine deprivation and a strong reduction of the cytoplasmic
IKBα in comparison with the wild-type cell line (Komura et al., 2005).
Our analysis on the levels of the components of the NF-kB pathway in hEPCs after
reduction of FKBP51 showed a decrease of the phosphorylation of NF-kB- and the
phosphorylation of IKK-α/β.
Recently it has been reported that FKBP51 is also an essential co-factor for IKKα,
the inhibitor of IkBα (Bouwmeester et al., 2004).
Therefore in our case, in absence of FKBP51, IKKα could not any longer be
phosphorylated, whereas IkBα would not be degraded and thus NF-kB would
Romano et al., 2010).

Discussion
122
remain in its inactive form in the cytoplasm and could therefore no longer be
released into the nucleus to inhibit apoptosis.
This scheme would fit exactly with our results (reduced pNF-kB and pIKK α/β-
levels). The data of our study demonstrate that also in erythroid cells FKBP51 is
involved in the NF-kB activation and that it might act as well as a cofactor of IKKαβ,
since also these levels were down-regulated in the abscence of FKBP51.
4.3.3 FKBPP51 might be involved in the JAK/STAT pathway
FKBP51 can not only phosphorylate IKKαβ and thereby induce the activation of
NF-kB, it has also been shown to be able to inhibit Calcineurin (CaN) (Baughman
et al., 1995; Nair et al., 1997).
Calcineurin is a calcium-calmodulin-regulated serine/threonine phosphatase,
which has been reported to dephosphorylate IkBs (Frantz et al., 1994). Thus,
Calcineurin regulates the NF-kB pathway by dephosphorylating IkB and preventing
its degradation by the proteasome and thereby promoting apoptosis. It has been
shown that overexpression of FKBP51 in a UT-7/Mpl cell line induced the
resistance to apoptosis through inhibition of the calcineurin signal transduction
pathway (Giraudier et al., 2002). FKBP51 regulates Calcineruin activity either
alone or by binding to an unknown cellular protein.
On the other side Calcineurin is also involved in the control of the JAK/STAT
pathway, as it has been shown to dephosphorylate STAT3 (Liang et al., 1999).
It has been demonstrated that overexpression of FKBP51 in pathologic
megacaryoctes from IMF patients (idiopathic myelofibrosis) induced a sustained
activation of the JAK2/STAT5 pathway and a sustained activation of STAT5
(Komura et al., 2003). This STAT5 activation was associated with a persistent Bcl-
XL expression and an absence of Caspase-3 cleavage after cytokine deprivation.
It was also reported that in this FKBP51-overexpressing cell-line, STAT5 was
dephosphorylated much slower, which was related to a persistent JAK2
phosphorylation. Calcineurin may act directly or indirectly on JAK2
phosphorylation to modify the STAT5 phosphorylation state.

Discussion
123
Figure 50 shows a possible model for downstream signaling of FKBP51, it
hypothesizes how FKBP51 might inhibit apoptosis: either through inhibition of
Calcineurin or through IKK-αβ activation.
When FKBP51 is present:
In presence of FKBP51 Calcineurin is inhibited and can’t lead to
dephosphorylation of JAK2. Active JAK2 in turn phosphorylates STAT5 or STAT3,
which act as transcription factors and induce the expression of antiapoptotic genes
like Bcl-2, which protect cells from apoptosis.
When FKBP51 is absent:
On the other hand, in the absence of FKBP51, Calcineurin is no longer inhibited
and leads to dephosphorylation of JAK2 and IkB, which blocks NF-kB. Inactive
JAK2 in turn can’t phosphorylate STAT5/STAT3, which thus can no longer
stimulate the expression of antiapoptotic genes, whereby cells undergo apoptosis.
The role of the Calcineurin pathway in the myeloid lineages is poorly understood.
In our studies in primary human erythroid progenitor cells we didn’t yet analyse the
relation of FKBP51 to Calcineurin and the JAK/STAT pathway. We would expect
that the absence of FKBP51 would lead to an increase of Calcineurin, -if it is even
expressed in hEPCs-, and therefore decreased levels of phosphorylated STAT3,
JAK2 and STAT5 and as well as decreased expression of the antiapoptotic genes
Bcl-2, Bcl-XL and BFL1 are expected. The decrease of the NF-kB-levels could
already be demonstrated, but in further studies the expression of Bcl-2, Bcl-XL and
BFL1 should be analysed.

Discussion
124
FKBP51
CaN
JAK2
NF-kB
STAT5
STAT3
IkB
IKK-αβ
NF-kB
BFL1
IkB
NF-kB
Bcl-XL Bcl-2
de-phosphorylates IkB and stimulates
inhibiton of NF-kB
phosphorylates
IkB
inhibits calcineurin and thereby inhibits
apoptosis
activates IKK-αβ and thereby inhibits
apoptosis
activated NF-kB translocates into
nucleus
phosphorylated IkB does no longer
inhibit NF-kB
NF-kB induces expression of anti-apoptotic
genes
phosphorylates STAT3 or
STAT5
de- phosphorylates JAK2 directly
or indirectly
mig
ht
als
o d
irectl
y
dep
ho
sp
ho
ryla
te S
TA
T3
act as transcription factors and induce expression of
antiapoptotic genes
Figure 50: Possible model for downstream signaling of FKBP51 FKBP51 might inhibit apoptosis either through Calcineurin inhibition or IKK-αβ activation.
P

Discussion
125
Another issue in our experiments was that the seen apoptotic phenotype (1,5- fold
increase of apoptotic cells relative to the control) was not as prominent as in other
reported FKBP51-silenced cells (Romano et al., 2010). In further experiments
apoptosis could therefore be induced by factor deprivation -as reported in
experiments with other factor dependent cell lines (Giraudier et al., 2002) - to
further excite the effects of the FKBP51 knock-down in erythroid cells.
Taken together, we could show that the reduction of FKBP51 in primary human
erythroid progenitor cells leads to an increase of apoptosis. FKBP51 seems to be
involved in apoptosis protection, which might be mediated through IKKαβ-
interaction and subsequent NF-kB activation. Whether FKBP51 in hEPCs is also
involved in the JAK/STAT-pathway and is interacting with Calcineurin remains still
unclear. Further studies will be required in which also the expression of the
antiapoptotic genes (Bcl-2, Bcl-XL and BFL1) are analysed.

Discussion
126
4.4 Glucocorticoids prevent apoptosis in hEPCs
Glucocorticoids are steroid hormones involved in several developmental and
biological processes. Binding of glucocorticoids to their Receptor leads to
activation and translocation of the GR into the nucleus, where it regulates different
target genes.
Nuclear steroid receptors, such as the GR, were reported to modulate apoptosis in
different cell types (Amaral et al., 2009). It has been demonstrated that GR
supress spontaneous apoptosis of neutrophils and TNF-α mediated apoptosis of
mouse fibroblasts (Pagliacci et al., 1993). Also in fibrosarcoma development the
GR has been shown to inhibit apoptosis by transcriptionally activating the
antiapoptotic gene Bcl-XL (Gascoyne et al., 2003). Even in human mammary
epithelial cell lines, GR can activate several survival pathways (Moran et al., 2000).
Furthermore, GR are involved in both, the induction and prevention of apoptosis
depending on the cell type. Several studies were performed to identify GC-induced
genes by microarray analyses, but the menchanism how exactly many of the
target genes modulate apoptosis remains still unclear.
In my diploma thesis I analysed the function of three different GR-targets genes:
Raf-1, Tis11d and FKBP51 by siRNA mediated knock-down (downregulation).
While there were no remarkable effects after the Raf-1 downregulation, the
reduction of Tis11d and FKBP51 led to an increase of apoptotis. Thus, the latter
GR-targets seem to be involved in anti-apoptotic mechanisms of erythroid
progenitor cells.
How both regulate the survival pathway reamains still unclear. We propose that
Tis11d leads to the destabilisation of one or more mRNAs, whose protein products
may have a direct or indirect affect on apoptosis induction in erythroid cells.
Whether the mRNA target involved in the apoptotic process, is TNF-alpha, as we
first assumed, needs further investigation. There is strong evidence that the
antiapoptotic effect of FKBP51 is mediated either through inhibition of the
calcineurin activity, or over a glucocorticoid-dependent-FKBP51-induced-NF-kB
signaling pathway.

Discussion
127
As we could show that Tis11d knock-down at the same time led also to a
dramatically decrease of FKBP51 on mRNA level, a possible interaction of those
two GR target genes, both involved in antiapoptotic mechanisms, could be feasible.
We found out that the 3’-untranslated region of the FKBP51 mRNA contains four
adenine-uridine (AU) rich elements (ARE), which have been reported to be the
binding side of Tis11d. But if Tis11d is capable to bind to FBKP51 and thereby to
induce its degradation needs to be analysed. Thus, the absence of Tis11d should
lead to an accumulation and not to a down-regulation of FKBP51. This possible
interaction is still entirely speculative and requires further experiments and
analysis.
In summary we could show that in human erythroid progenitor cells glucocorticoids
are involved in the antiapoptotic mechanism.

References
128
5. REFERENCES
Adli, M., Merkhofer, E., Cogswell, P., and Baldwin, A.S. IKKalpha and IKKbeta each function to regulate NF-kappaB activation in the TNF-induced/canonical pathway. PLoS One 5, e9428.
Allen, T.D., and Dexter, T.M. (1982). Ultrastructural aspects of erythropoietic differentiation in long-term bone marrow culture. Differentiation 21, 86-94.
Amaral, J.D., Sola, S., Steer, C.J., and Rodrigues, C.M. (2009). Role of nuclear steroid receptors in apoptosis. Curr Med Chem 16, 3886-3902.
Arai, F., Hirao, A., and Suda, T. (2005). Regulation of hematopoietic stem cells by the niche. Trends Cardiovasc Med 15, 75-79.
Arai, F., Yoshihara, H., Hosokawa, K., Nakamura, Y., Gomei, Y., Iwasaki, H., and Suda, T. (2009). Niche regulation of hematopoietic stem cells in the endosteum. Ann N Y Acad Sci 1176, 36-46.
Auffray, I., Marfatia, S., de Jong, K., Lee, G., Huang, C.H., Paszty, C., Tanner, M.J., Mohandas, N., and Chasis, J.A. (2001). Glycophorin A dimerization and band 3 interaction during erythroid membrane biogenesis: in vivo studies in human glycophorin A transgenic mice. Blood 97, 2872-2878.
Bakheet, T., Williams, B.R., and Khabar, K.S. (2003). ARED 2.0: an update of AU-rich element mRNA database. Nucleic Acids Res 31, 421-423.
Baou, M., Jewell, A., and Murphy, J.J. (2009). TIS11 family proteins and their roles in posttranscriptional gene regulation. J Biomed Biotechnol 2009, 634520.
Bauer, A., Tronche, F., Wessely, O., Kellendonk, C., Reichardt, H.M., Steinlein, P., Schutz, G., and Beug, H. (1999). The glucocorticoid receptor is required for stress erythropoiesis. Genes Dev 13, 2996-3002.
Baughman, G., Wiederrecht, G.J., Campbell, N.F., Martin, M.M., and Bourgeois, S. (1995). FKBP51, a novel T-cell-specific immunophilin capable of calcineurin inhibition. Mol Cell Biol 15, 4395-4402.
Bell, S.E., Sanchez, M.J., Spasic-Boskovic, O., Santalucia, T., Gambardella, L., Burton, G.J., Murphy, J.J., Norton, J.D., Clark, A.R., and Turner, M. (2006). The RNA binding protein Zfp36l1 is required for normal vascularisation and post-transcriptionally regulates VEGF expression. Dev Dyn 235, 3144-3155.
Bernstein, A., Forrester, L., Reith, A.D., Dubreuil, P., and Rottapel, R. (1991). The murine W/c-kit and Steel loci and the control of hematopoiesis. Semin Hematol 28, 138-142.
Bessis, M. (1958). [Erythroblastic island, functional unity of bone marrow]. Rev Hematol 13, 8-11.
Bessis, M.C., and Breton-Gorius, J. (1962). Iron metabolism in the bone marrow as seen by electron microscopy: a critical review. Blood 19, 635-663.

References
129
Bonifer, C., Faust, N., Geiger, H., and Muller, A.M. (1998). Developmental changes in the differentiation capacity of haematopoietic stem cells. Immunol Today 19, 236-241.
Bouwmeester, T., Bauch, A., Ruffner, H., Angrand, P.O., Bergamini, G., Croughton, K., Cruciat, C., Eberhard, D., Gagneur, J., Ghidelli, S., et al. (2004). A physical and functional map of the human TNF-alpha/NF-kappa B signal transduction pathway. Nat Cell Biol 6, 97-105.
Broxmeyer, H.E., Maze, R., Miyazawa, K., Carow, C., Hendrie, P.C., Cooper, S., Hangoc, G., Vadhan-Raj, S., and Lu, L. (1991). The kit receptor and its ligand, steel factor, as regulators of hemopoiesis. Cancer Cells 3, 480-487.
Carballo, E., Lai, W.S., and Blackshear, P.J. (1998). Feedback inhibition of macrophage tumor necrosis factor-alpha production by tristetraprolin. Science 281, 1001-1005.
Carlesso, N., and Cardoso, A.A. Stem cell regulatory niches and their role in normal and malignant hematopoiesis. Curr Opin Hematol 17, 281-286.
Carlile, G., Smith, D.H., and Wiedmann, M. (2009). A non-apoptotic role for Fas/FasL in erythropoiesis. FEBS Lett.
Chasis, J.A. (2006). Erythroblastic islands: specialized microenvironmental niches for erythropoiesis. Curr Opin Hematol 13, 137-141.
Chasis, J.A., and Mohandas, N. (2008). Erythroblastic islands: niches for erythropoiesis. Blood 112, 470-478.
Cole, T.J., Blendy, J.A., Monaghan, A.P., Krieglstein, K., Schmid, W., Aguzzi, A., Fantuzzi, G., Hummler, E., Unsicker, K., and Schutz, G. (1995). Targeted disruption of the glucocorticoid receptor gene blocks adrenergic chromaffin cell development and severely retards lung maturation. Genes Dev 9, 1608-1621.
Congdon, C.C. (1957). Bone marrow transplantation in animals exposed to whole-body radiation. J Cell Physiol Suppl 50, 103-108.
Davies, T.H., Ning, Y.M., and Sanchez, E.R. (2002). A new first step in activation of steroid receptors: hormone-induced switching of FKBP51 and FKBP52 immunophilins. J Biol Chem 277, 4597-4600.
Dolznig, H., Grebien, F., Deiner, E.M., Stangl, K., Kolbus, A., Habermann, B., Kerenyi, M.A., Kieslinger, M., Moriggl, R., Beug, H., et al. (2006). Erythroid progenitor renewal versus differentiation: genetic evidence for cell autonomous, essential functions of EpoR, Stat5 and the GR. Oncogene 25, 2890-2900.
Dolznig, H., Habermann, B., Stangl, K., Deiner, E.M., Moriggl, R., Beug, H., and Mullner, E.W. (2002). Apoptosis protection by the Epo target Bcl-X(L) allows factor-independent differentiation of primary erythroblasts. Curr Biol 12, 1076-1085.
Dolznig, H., Kolbus, A., Leberbauer, C., Schmidt, U., Deiner, E.M., Mullner, E.W., and Beug, H. (2005). Expansion and differentiation of immature mouse and human hematopoietic progenitors. Methods Mol Med 105, 323-344.
Dorn, I., Lazar-Karsten, P., Boie, S., Ribbat, J., Hartwig, D., Driller, B., Kirchner, H., and Schlenke, P. (2008). In vitro proliferation and differentiation of human CD34+ cells from peripheral blood into mature red blood cells with two different cell culture systems. Transfusion 48, 1122-1132.

References
130
Droin, N., Cathelin, S., Jacquel, A., Guery, L., Garrido, C., Fontenay, M., Hermine, O., and Solary, E. (2008). A role for caspases in the differentiation of erythroid cells and macrophages. Biochimie 90, 416-422.
Frantz, B., Nordby, E.C., Bren, G., Steffan, N., Paya, C.V., Kincaid, R.L., Tocci, M.J., O'Keefe, S.J., and O'Neill, E.A. (1994). Calcineurin acts in synergy with PMA to inactivate I kappa B/MAD3, an inhibitor of NF-kappa B. EMBO J 13, 861-870.
Gangenahalli, G.U., Singh, V.K., Verma, Y.K., Gupta, P., Sharma, R.K., Chandra, R., and Luthra, P.M. (2006). Hematopoietic stem cell antigen CD34: role in adhesion or homing. Stem Cells Dev 15, 305-313.
Gascoyne, D.M., Kypta, R.M., and Vivanco, M.M. (2003). Glucocorticoids inhibit apoptosis during fibrosarcoma development by transcriptionally activating Bcl-xL. J Biol Chem 278, 18022-18029.
Giraudier, S., Chagraoui, H., Komura, E., Barnache, S., Blanchet, B., LeCouedic, J.P., Smith, D.F., Larbret, F., Taksin, A.L., Moreau-Gachelin, F., et al. (2002). Overexpression of FKBP51 in idiopathic myelofibrosis regulates the growth factor independence of megakaryocyte progenitors. Blood 100, 2932-2940.
Gunsilius, E., Gastl, G., and Petzer, A.L. (2001). Hematopoietic stem cells. Biomed Pharmacother 55, 186-194.
Heissig, B., Hattori, K., Dias, S., Friedrich, M., Ferris, B., Hackett, N.R., Crystal, R.G., Besmer, P., Lyden, D., Moore, M.A., et al. (2002). Recruitment of stem and progenitor cells from the bone marrow niche requires MMP-9 mediated release of kit-ligand. Cell 109, 625-637.
Ino, T., Yasui, H., Hirano, M., and Kurosawa, Y. (1995). Identification of a member of the TIS11 early response gene family at the insertion point of a DNA fragment containing a gene for the T-cell receptor beta chain in an acute T-cell leukemia. Oncogene 11, 2705-2710.
Johnson, B.A., Geha, M., and Blackwell, T.K. (2000). Similar but distinct effects of the tristetraprolin/TIS11 immediate-early proteins on cell survival. Oncogene 19, 1657-1664.
Jordan, E.T., Collins, M., Terefe, J., Ugozzoli, L., and Rubio, T. (2008). Optimizing electroporation conditions in primary and other difficult-to-transfect cells. J Biomol Tech 19, 328-334.
Kolbus, A., Blazquez-Domingo, M., Carotta, S., Bakker, W., Luedemann, S., von Lindern, M., Steinlein, P., and Beug, H. (2003). Cooperative signaling between cytokine receptors and the glucocorticoid receptor in the expansion of erythroid progenitors: molecular analysis by expression profiling. Blood 102, 3136-3146.
Kolbus, A., Pilat, S., Husak, Z., Deiner, E.M., Stengl, G., Beug, H., and Baccarini, M. (2002). Raf-1 antagonizes erythroid differentiation by restraining caspase activation. J Exp Med 196, 1347-1353.
Komura, E., Chagraoui, H., Mansat de Mas, V., Blanchet, B., de Sepulveda, P., Larbret, F., Larghero, J., Tulliez, M., Debili, N., Vainchenker, W., et al. (2003). Spontaneous STAT5 activation induces growth factor independence in idiopathic myelofibrosis: possible relationship with FKBP51 overexpression. Exp Hematol 31, 622-630.

References
131
Komura, E., Tonetti, C., Penard-Lacronique, V., Chagraoui, H., Lacout, C., Lecouedic, J.P., Rameau, P., Debili, N., Vainchenker, W., and Giraudier, S. (2005). Role for the nuclear factor kappaB pathway in transforming growth factor-beta1 production in idiopathic myelofibrosis: possible relationship with FK506 binding protein 51 overexpression. Cancer Res 65, 3281-3289.
Kondo, M., Wagers, A.J., Manz, M.G., Prohaska, S.S., Scherer, D.C., Beilhack, G.F., Shizuru, J.A., and Weissman, I.L. (2003). Biology of hematopoietic stem cells and progenitors: implications for clinical application. Annu Rev Immunol 21, 759-806.
Krakstad, C., and Chekenya, M. Survival signalling and apoptosis resistance in glioblastomas: opportunities for targeted therapeutics. Mol Cancer 9, 135.
Kurtz, A., Jelkmann, W., and Bauer, C. (1982). A new candidate for the regulation of erythropoiesis. Insulin-like growth factor I. FEBS Lett 149, 105-108.
Lai, W.S., Carballo, E., Strum, J.R., Kennington, E.A., Phillips, R.S., and Blackshear, P.J. (1999). Evidence that tristetraprolin binds to AU-rich elements and promotes the deadenylation and destabilization of tumor necrosis factor alpha mRNA. Mol Cell Biol 19, 4311-4323.
Lai, W.S., Carballo, E., Thorn, J.M., Kennington, E.A., and Blackshear, P.J. (2000). Interactions of CCCH zinc finger proteins with mRNA. Binding of tristetraprolin-related zinc finger proteins to Au-rich elements and destabilization of mRNA. J Biol Chem 275, 17827-17837.
Leberbauer, C., Boulme, F., Unfried, G., Huber, J., Beug, H., and Mullner, E.W. (2005). Different steroids co-regulate long-term expansion versus terminal differentiation in primary human erythroid progenitors. Blood 105, 85-94.
Li, X.F., Anderson, J., Hutzler, D., and Roodman, G.D. (1989). Hemin-induced erythroid differentiation changes the sensitivity of K562 cells to tumor necrosis factor-alpha. Exp Hematol 17, 1059-1062.
Liang, H., Venema, V.J., Wang, X., Ju, H., Venema, R.C., and Marrero, M.B. (1999). Regulation of angiotensin II-induced phosphorylation of STAT3 in vascular smooth muscle cells. J Biol Chem 274, 19846-19851.
Lin, C.S., Lim, S.K., D'Agati, V., and Costantini, F. (1996). Differential effects of an erythropoietin receptor gene disruption on primitive and definitive erythropoiesis. Genes Dev 10, 154-164.
Lin, H. (2002). The stem-cell niche theory: lessons from flies. Nat Rev Genet 3, 931-940.
Merkhofer, E.C., Cogswell, P., and Baldwin, A.S. Her2 activates NF-kappaB and induces invasion through the canonical pathway involving IKKalpha. Oncogene 29, 1238-1248.
Mikula, M., Schreiber, M., Husak, Z., Kucerova, L., Ruth, J., Wieser, R., Zatloukal, K., Beug, H., Wagner, E.F., and Baccarini, M. (2001). Embryonic lethality and fetal liver apoptosis in mice lacking the c-raf-1 gene. EMBO J 20, 1952-1962.
Miura, O., Nakamura, N., Quelle, F.W., Witthuhn, B.A., Ihle, J.N., and Aoki, N. (1994). Erythropoietin induces association of the JAK2 protein tyrosine kinase with the erythropoietin receptor in vivo. Blood 84, 1501-1507.

References
132
Moran, T.J., Gray, S., Mikosz, C.A., and Conzen, S.D. (2000). The glucocorticoid receptor mediates a survival signal in human mammary epithelial cells. Cancer Res 60, 867-872.
Muszynski, K.W., Ruscetti, F.W., Gooya, J.M., Linnekin, D.M., and Keller, J.R. (1997). Raf-1 protein is required for growth factor-induced proliferation of primitive hematopoietic progenitors stimulated with synergistic combinations of cytokines. Stem Cells 15, 63-72.
Muta, K., Krantz, S.B., Bondurant, M.C., and Dai, C.H. (1995). Stem cell factor retards differentiation of normal human erythroid progenitor cells while stimulating proliferation. Blood 86, 572-580.
Muta, K., Krantz, S.B., Bondurant, M.C., and Wickrema, A. (1994). Distinct roles of erythropoietin, insulin-like growth factor I, and stem cell factor in the development of erythroid progenitor cells. J Clin Invest 94, 34-43.
Nair, S.C., Rimerman, R.A., Toran, E.J., Chen, S., Prapapanich, V., Butts, R.N., and Smith, D.F. (1997). Molecular cloning of human FKBP51 and comparisons of immunophilin interactions with Hsp90 and progesterone receptor. Mol Cell Biol 17, 594-603.
Nakamura, Y., Tajima, F., Ishiga, K., Yamazaki, H., Oshimura, M., Shiota, G., and Murawaki, Y. (2004). Soluble c-kit receptor mobilizes hematopoietic stem cells to peripheral blood in mice. Exp Hematol 32, 390-396.
Nocka, K., Buck, J., Levi, E., and Besmer, P. (1990). Candidate ligand for the c-kit transmembrane kinase receptor: KL, a fibroblast derived growth factor stimulates mast cells and erythroid progenitors. EMBO J 9, 3287-3294.
Orkin, S.H., and Zon, L.I. (2008). Hematopoiesis: an evolving paradigm for stem cell biology. Cell 132, 631-644.
Paakinaho, V., Makkonen, H., Jaaskelainen, T., and Palvimo, J.J. Glucocorticoid receptor activates poised FKBP51 locus through long-distance interactions (2010). Mol Endocrinol 24, 511-525.
Pagliacci, M.C., Migliorati, G., Smacchia, M., Grignani, F., Riccardi, C., and Nicoletti, I. (1993). Cellular stress and glucocorticoid hormones protect L929 mouse fibroblasts from tumor necrosis factor alpha cytotoxicity. J Endocrinol Invest 16, 591-599.
Palis, J. (2008). Ontogeny of erythropoiesis. Curr Opin Hematol 15, 155-161.
Palis, J., and Yoder, M.C. (2001). Yolk-sac hematopoiesis: the first blood cells of mouse and man. Exp Hematol 29, 927-936.
Panzenbock, B., Bartunek, P., Mapara, M.Y., and Zenke, M. (1998). Growth and differentiation of human stem cell factor/erythropoietin-dependent erythroid progenitor cells in vitro. Blood 92, 3658-3668.
Park, J., Kim, M., Na, G., Jeon, I., Kwon, Y.K., Kim, J.H., Youn, H., and Koo, Y. (2007). Glucocorticoids modulate NF-kappaB-dependent gene expression by up-regulating FKBP51 expression in Newcastle disease virus-infected chickens. Mol Cell Endocrinol 278, 7-17.
Rahman, M.M., and McFadden, G. (2006). Modulation of tumor necrosis factor by microbial pathogens. PLoS Pathog 2, e4.

References
133
Rajasagi, M., Vitacolonna, M., Benjak, B., Marhaba, R., and Zoller, M. (2009). CD44 promotes progenitor homing into the thymus and T cell maturation. J Leukoc Biol 85, 251-261.
Rees-Unwin, K.S., Craven, R.A., Davenport, E., Hanrahan, S., Totty, N.F., Dring, A.M., Banks, R.E., G, J.M., and Davies, F.E. (2007). Proteomic evaluation of pathways associated with dexamethasone-mediated apoptosis and resistance in multiple myeloma. Br J Haematol 139, 559-567.
Renstrom, J., Kroger, M., Peschel, C., and Oostendorp, R.A (2009). How the niche regulates hematopoietic stem cells. Chem Biol Interact 184, 7-15.
Revollo, J.R., and Cidlowski, J.A. (2009). Mechanisms generating diversity in glucocorticoid receptor signaling. Ann N Y Acad Sci 1179, 167-178.
Rich, I.N., Vogt, C., and Pentz, S. (1988). Erythropoietin gene expression in vitro and in vivo detected by in situ hybridization. Blood Cells 14, 505-520.
Romagnani, P., Lasagni, L., Annunziato, F., Serio, M., and Romagnani, S. (2004). CXC chemokines: the regulatory link between inflammation and angiogenesis. Trends Immunol 25, 201-209.
Romano, S., D'Angelillo, A., Pacelli, R., Staibano, S., De Luna, E., Bisogni, R., Eskelinen, E.L., Mascolo, M., Cali, G., Arra, C., et al (2010). Role of FK506-binding protein 51 in the control of apoptosis of irradiated melanoma cells. Cell Death Differ 17, 145-157.
Rubiolo, C., Piazzolla, D., Meissl, K., Beug, H., Huber, J.C., Kolbus, A., and Baccarini, M. (2006). A balance between Raf-1 and Fas expression sets the pace of erythroid differentiation. Blood 108, 152-159.
Rusten, L.S., and Jacobsen, S.E. (1995). Tumor necrosis factor (TNF)-alpha directly inhibits human erythropoiesis in vitro: role of p55 and p75 TNF receptors. Blood 85, 989-996.
Shiozawa, Y., Havens, A.M., Pienta, K.J., and Taichman, R.S. (2008). The bone marrow niche: habitat to hematopoietic and mesenchymal stem cells, and unwitting host to molecular parasites. Leukemia 22, 941-950.
Skutelsky, E., and Danon, D. (1972). On the expulsion of the erythroid nucleus and its phagocytosis. Anat Rec 173, 123-126.
Smoak, K., and Cidlowski, J.A. (2006). Glucocorticoids regulate tristetraprolin synthesis and posttranscriptionally regulate tumor necrosis factor alpha inflammatory signaling. Mol Cell Biol 26, 9126-9135.
Srivastava, A.S., Kaushal, S., Mishra, R., Lane, T.A., and Carrier, E. (2006). Dexamethasone facilitates erythropoiesis in murine embryonic stem cells differentiating into hematopoietic cells in vitro. Biochem Biophys Res Commun 346, 508-516.
Stellacci, E., Di Noia, A., Di Baldassarre, A., Migliaccio, G., Battistini, A., and Migliaccio, A.R. (2009). Interaction between the glucocorticoid and erythropoietin receptors in human erythroid cells. Exp Hematol 37, 559-572.
Stumpo, D.J., Broxmeyer, H.E., Ward, T., Cooper, S., Hangoc, G., Chung, Y.J., Shelley, W.C., Richfield, E.K., Ray, M.K., Yoder, M.C., et al. (2009). Targeted disruption of Zfp36l2,

References
134
encoding a CCCH tandem zinc finger RNA-binding protein, results in defective hematopoiesis. Blood 114, 2401-2410.
Taylor, G.A., Carballo, E., Lee, D.M., Lai, W.S., Thompson, M.J., Patel, D.D., Schenkman, D.I., Gilkeson, G.S., Broxmeyer, H.E., Haynes, B.F., et al. (1996). A pathogenetic role for TNF alpha in the syndrome of cachexia, arthritis, and autoimmunity resulting from tristetraprolin (TTP) deficiency. Immunity 4, 445-454.
Testa, U. (2004). Apoptotic mechanisms in the control of erythropoiesis. Leukemia 18, 1176-1199.
Tsiftsoglou, A.S., Vizirianakis, I.S., and Strouboulis, J. (2009). Erythropoiesis: model systems, molecular regulators, and developmental programs. IUBMB Life 61, 800-830.
Tulac, S., Dosiou, C., Suchanek, E., and Giudice, L.C. (2004). Silencing lamin A/C in human endometrial stromal cells: a model to investigate endometrial gene function and regulation. Mol Hum Reprod 10, 705-711.
Udupa, K.B., Crabtree, H.M., and Lipschitz, D.A. (1986). In vitro culture of proerythroblasts: characterization of proliferative response to erythropoietin and steroids. Br J Haematol 62, 705-714.
Van Herreweghe, F., Festjens, N., Declercq, W., and Vandenabeele, P. Tumor necrosis factor-mediated cell death: to break or to burst, that's the question (2010). Cell Mol Life Sci 67, 1567-1579.
Vermeer, H., Hendriks-Stegeman, B.I., van der Burg, B., van Buul-Offers, S.C., and Jansen, M. (2003). Glucocorticoid-induced increase in lymphocytic FKBP51 messenger ribonucleic acid expression: a potential marker for glucocorticoid sensitivity, potency, and bioavailability. J Clin Endocrinol Metab 88, 277-284.
Vermeer, H., Hendriks-Stegeman, B.I., van Suylekom, D., Rijkers, G.T., van Buul-Offers, S.C., and Jansen, M. (2004). An in vitro bioassay to determine individual sensitivity to glucocorticoids: induction of FKBP51 mRNA in peripheral blood mononuclear cells. Mol Cell Endocrinol 218, 49-55.
von Lindern, M., Zauner, W., Mellitzer, G., Steinlein, P., Fritsch, G., Huber, K., Lowenberg, B., and Beug, H. (1999). The glucocorticoid receptor cooperates with the erythropoietin receptor and c-Kit to enhance and sustain proliferation of erythroid progenitors in vitro. Blood 94, 550-559.
Weissman, I.L. (2000). Stem cells: units of development, units of regeneration, and units in evolution. Cell 100, 157-168.
Wessely, O., Deiner, E.M., Beug, H., and von Lindern, M. (1997). The glucocorticoid receptor is a key regulator of the decision between self-renewal and differentiation in erythroid progenitors. EMBO J 16, 267-280.
Wilson, A., and Trumpp, A. (2006). Bone-marrow haematopoietic-stem-cell niches. Nat Rev Immunol 6, 93-106.
Wilusz, C.J., Wormington, M., and Peltz, S.W. (2001). The cap-to-tail guide to mRNA turnover. Nat Rev Mol Cell Biol 2, 237-246.

References
135
Witthuhn, B.A., Quelle, F.W., Silvennoinen, O., Yi, T., Tang, B., Miura, O., and Ihle, J.N. (1993). JAK2 associates with the erythropoietin receptor and is tyrosine phosphorylated and activated following stimulation with erythropoietin. Cell 74, 227-236.
Woodruff, P.G., Boushey, H.A., Dolganov, G.M., Barker, C.S., Yang, Y.H., Donnelly, S., Ellwanger, A., Sidhu, S.S., Dao-Pick, T.P., Pantoja, C., et al. (2007). Genome-wide profiling identifies epithelial cell genes associated with asthma and with treatment response to corticosteroids. Proc Natl Acad Sci U S A 104, 15858-15863.
Xiao, W., Koizumi, K., Nishio, M., Endo, T., Osawa, M., Fujimoto, K., Sato, I., Sakai, T., Koike, T., and Sawada, K. (2002). Tumor necrosis factor-alpha inhibits generation of glycophorin A+ cells by CD34+ cells. Exp Hematol 30, 1238-1247.
Yin, T., and Li, L. (2006). The stem cell niches in bone. J Clin Invest 116, 1195-1201.
Zamore, P.D., and Aronin, N. (2003). siRNAs knock down hepatitis. Nat Med 9, 266-267.

136
DANKSAGUNG:
Mein Dank gilt vor allem Dr. Mario Mairhofer, welcher mich als hervorragender und
liebenswerter Betreuer durch meine ganze Arbeit hindurch begleitet hat und mir
immer mit Rat und Tat zur Seite stand, wenn ich ihn gebraucht hab. Besonderer
Dank auch an Univ.Doz.Dr. Andrea Kolbus für die Betreuung und stetige Korrektur
meiner Diplomarbeit, sowie für die Möglichkeit, an diesem interessanten Thema in
ihrer Arbeitsgruppe forschen zu können. In diesem Zusammenhang möchte ich
mich auch bei der gesamten Arbeitsgruppe Endokrinologie für ihre wertvollen
Tipps und das produktive Arbeitsklima bedanken.
Nicht zuletzt möchte ich mich bei meinen Eltern für die finanzielle sowie auch für
die mentale Unterstützung in all meinen Lebensbereichen bedanken. Großer Dank
gilt auch meinem Freund, sowie all meinen Freunden, die ich oft mit meinen
faszinierenden Forschungsergebnissen gelangweilt habe. Vielen Dank für Eure
Unterstützung!

137
Curriculum Vitae:
Persönliche Daten: Vorname: Michela Nachname: Parth Geschlecht: weiblich Geburtsdatum: 22.09.1983 Geburtsort: Schlanders Kontaktdaten: Straße: Staudgasse 56/4 Wohnort: 1180 Wien Email: [email protected] Universitäre Ausbildung: Studium: 2002 – 2011: Studium der Biologie mit Fachrichtung Genetik in
Wien 10. 2008 – 03. 2009: Auslandsaufenthalt an der Universität in Leicester,
England, im Rahmen des Erasmusprogrammes Schulische Ausbildung: 1997 – 2002: Realgymnasium Schlanders - wissenschaftliche
Fachrichtung 1994 – 1997: Mittelschule in Laas 1989 – 1994: Volksschule in Laas Praktika: Oktober 2009 – Dezember 2009: Praktikum im Gynäkologisch - Endokrinologischen
Forschungslabor der Universitätsklinik für Frauen-heilkunde, Medizinische Universität Wien
Jänner 2009 - März 2009: Praktikum im Krebsforschungslabor der University of Leicester (UK) bei Prof. Nick Barlev
Sommer 2008: Praktikum im Labor für Molekularbiologie am Land- und Forstwirtschafltichen Versuchszentrum Laimburg, Provinz Bozen
2002- 2006: Während des Studiums diverse Praktika in bio-chemischen und molekularbiologischen Labors
Sprachliche Kenntnisse: Deutsch: Muttersprache Italienisch: gut, Diplom: Zweisprachigkeitsprüfung A Englisch: gut, Diplom: First Certificate, Level C