Embed Size (px)
Citation preview

Analysis of the impact of employment on re-offending following release from custody, using Propensity Score Matching Ministry of Justice March 2013

Contents Executive Summary i
1. Introduction 1
1.1 Background 1
1.2 Challenges to analysis 2
1.3 Analysis outline 3
1.4 Defining employment and re-offending 1.5 Rationale for modelling offenders with
different sentence lengths separately
4 5
2. Data and Methodology 7
2.1 Method overview 7
2.2 Main assumptions required for Propensity Score Matching
8
2.3 Data 10
2.4 Criteria for inclusion in the sample 12
2.5 Descriptive Statistics 15
2.6 Logistic regression modelling 19
2.7 Assessing propensity scores 20
2.8 Matching process 20
2.9 Assessing match quality 22
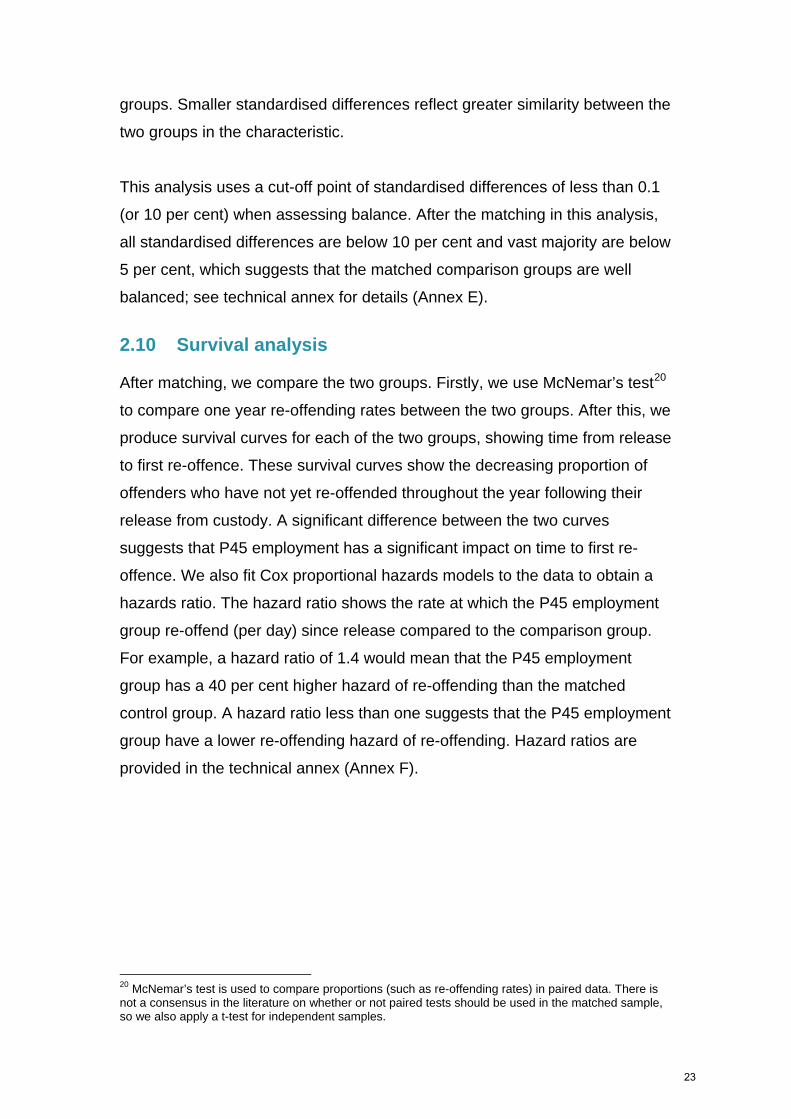
2.10 Survival analysis 23
3. Results 24
3.1 Main findings 24
3.2 Sensitivity Analysis 28
4. Conclusions 32
4.1 Summary 32
4.2 Additional research questions 33
References 36
Technical Annex 38

Executive Summary This report presents analysis which aims to identify the impact (if any) that
employment (measured by having a PAYE employment spell notified by a
P45) has on reducing re-offending.
The analysis compares the re-offending rates for offenders who get P45
employment in the year following their release from custody with a matched
comparison group of offenders with no P45 employment. The rate being
used for comparison is the proven one year re-offending rate. The
matched comparison group was selected using Propensity Score
Matching. Matching enables us to more confidently estimate the impact of
P45 employment post-custody on re-offending by minimising the differences
between the offenders who did and did not get P45 employment on other
characteristics. A limitation here is that the data used for matching is
restricted to that which is available in existing systems, and there remains a
possibility that the difference after matching reflects differences in underlying
characteristics which are not recorded, rather than employment.
The analysis uses linked data from the Ministry of Justice’s (MoJ) data
linking project which brings together data on offenders from across the
Criminal Justice System. This is supplemented by data on the employment
and benefit status of offenders from the MoJ / DWP / HMRC data share.
This has led to a rich data set with information on offenders’ criminal and
labour market histories and offender attitudes and criminogenic needs (such
as drug or alcohol misuse). The attitudinal variables were only available from
OASys data, so only offenders with a valid OASys assessment (which tend
to be the more serious offenders) were included in the analysis, due to the
value of including these variables. This means that we cannot generalise
the findings to the wider offender population.
In this analysis, P45 employment is used as a proxy for wider definitions of
employment. The available data does not include information on self-
employment, and has only partial coverage of employment where earnings
are below the tax threshold, and has some further issues with data quality.
i

The comparison group will include offenders who got other forms of
employment (non-P45 employment).
Re-offending is measured as any offence committed in the 12 months after
release from custody which receives a court conviction, caution, reprimand or
warning in the 12 month period or within a further six month waiting period.
This means that there will be many undetected or unrecorded offences not
picked up in the analysis.
This analysis shows the following statistically significant results for offenders
included in our sample:
Offenders who got P45 employment at some point in the year after
being released from custody were less likely to re-offend than similar
offenders who did not get P45 employment.
For custodial sentences of less than one year, the one year proven
re-offending rate was 9.4 percentage points lower for those who
found P45 employment after release than for the matched comparison
group.
For sentences lasting one year or more, the one year re-offending
rate was 5.6 percentage points lower for those who found P45
employment than for the matched comparison group.
The time from release until first re-offence was longer for offenders
who got P45 employment than for the matched comparison group,
who did not get P45 employment.
Identifying the impact of employment on re-offending is a challenging
undertaking, because apparent associations between employment and (re-)
offending will be due in part to underlying factors influencing both
employment and re-offending, rather than a direct causal link. Additionally,
the influence runs in both directions, with offending affecting employment as
well as the reverse and there are limitations to this analysis which are
highlighted in this report. However, the magnitude of the estimates of the
reduction in re-offending and their statistical significance, alongside the
ii

results of the sensitivity analysis we have conducted, means we are
confident that P45 employment has a positive impact on reducing re-
offending. We would be very interested in your feedback on our
methodology and any suggestions for further analysis.
Key terminology OASys assessment - this assessment is used by prisons and probation services to measure the risks and needs of offenders under their supervision. Proven one year re-offending rate - any offence committed in the 12 months after release from custody which receives a court conviction, caution, reprimand or warning in the 12 month period or within a further six month waiting period. P45 employment data – employment data derived from P45 forms sent to HMRC from employers. MoJ – Ministry of Justice DWP – Department for Work and Pensions HMRC – Her Majesty’s Revenue and Customs NOMS – National Offender Management Service
iii

1. Introduction 1.1 Background
There is a large body of research suggesting employment may reduce the
likelihood of re-offending, however offenders leaving custody face significant
barriers to finding and staying in work. To ensure that offenders receive
specialist support as soon as possible after release from custody, the
Department for Work and Pensions and the Ministry of Justice are fast-
tracking offenders leaving custody into the Work Programme. From early
2012, Jobcentre Plus advisers have started to take claims for Jobseeker’s
Allowance in prison, to start entitlement on release and to facilitate mandatory
referral to the Work Programme. In addition, any prison leaver claiming
Jobseeker’s Allowance within 13 weeks of leaving custody will now also have
a mandatory referral to the Work Programme1. The MoJ are also committed
to working with businesses to significantly increase work activity undertaken
by offenders in custody, which in addition to repaying society, aims to ensu
offenders are motivated to work and return to their lives outside prison, better
prepared for employment
re
2.
Although it is thought that employment has a positive effect on offenders, it is
difficult to make firm conclusions about the direct impact of employment on re-
offending from the majority of the published literature. Many studies do not
isolate the impact of employment from the other characteristics associated
with increased likelihood of employment, such as criminal history and prior
employment and benefit history.
Additionally, many do not consider the timing of employment and re-
offending. If we want to look at causality, then we need to focus only on
offenders who start an employment spell prior to any re-offences. There is
therefore still a need to improve our understanding of the links between
employment and re-offending.
1 For more information on the Work Programme, see www.dwp.gov.uk/policy/welfare-reform/the-work-programme/ 2 For further details of work in prisons see: www.one3one.justice.gov.uk/
1

After release from custody, offenders tend to have employment levels well
below the general population. Two years after release from custody in 2008,
15 per cent of offenders were in P45 employment, with 29 per cent of
offenders starting a P45 employment spell at some point in the two years
following their release from custody (Ministry of Justice, 2011a). Linked to
this, offenders also typically have higher levels of out-of-work benefits receipt
than in the general population. Two years after release from custody in 2008,
47 per cent of offenders were receiving a DWP out-of-work benefit3, with 75
per cent of offenders starting a new claim to an out-of-work benefit at some
point in the two years following their release4. This compares to just 12
percent of the general working-age population (16-64 years) in receipt of an
out-of-work benefit at any one time5. In addition to the direct effects of their
ex-offender status (such as employer discrimination due to criminal record),
studies suggest that the barriers to work for offenders include a range of other
factors such as health problems; substance misuse; housing problems and
homelessness; poor basic skills; low levels of qualifications, self-confidence
and motivation to find work; and lack of work experience (Metcalf, Anderson
and Rolfe, 2001).
1.2 Challenges to analysis
Re-offending rates are substantially higher for offenders who do not enter P45
employment after release from custody than for those who do. In the sample
used in this analysis (see Section 2.4 for further details of who this includes),
the re-offending rate is more than twice as high for offenders without a P45
employment spell after release compared to those who do enter P45
employment. Table 1 shows that for offenders given sentences less than one
year, the re-offending rate is 69 per cent for those who do not enter P45
employment after release; compared to 32 per cent for offenders who do
enter P45 employment. For custodial sentences of one year or more, the re-
3 Out-of-work benefits are defined as Employment and Support Allowance, Incapacity Benefit, Severe Disablement Allowance, Passported Incapacity Benefit, Jobseeker’s Allowance and Income Support. 4 See Annex G for more background information on the P45 employment and benefit status of offenders. 5 From NOMIS query; using England and Wales data at November 2008, www.nomisweb.co.uk/
2

offending rate for offenders who do not enter P45 employment is 43 per cent,
compared to 18 per cent for offenders who do enter P45 employment.
Table 1: Re-offending rates by P45 employment status in the year after release from custody in 2008 (based on sample used in this analysis).
One year proven re-offending rate Length of custodial sentence P45 employment spell
after release No P45 employment spell
after release Less than one year 32% 69% 1 year or more 18% 43%
Many of the factors associated with employment are also known to be
associated with re-offending. For example, an alcohol misuse problem is
associated with likelihood of employment, but also with the likelihood of re-
offending. This makes it difficult to separate out the effect of employment on
re-offending from the effects of those other associated characteristics.
When offenders who enter P45 employment do not re-offend, we cannot be
sure that this was directly due to being in employment. Although we can
observe whether an offender re-offends after entering employment, we cannot
observe the ‘counterfactual’ outcome that would have occurred had they not
found P45 employment. In order to understand the direct impact of P45
employment we need to estimate this counterfactual outcome; what we would
expect the re-offending rate to be if these offenders had not found P45
employment after leaving custody.
1.3 Analysis outline The purpose of this analysis is to evaluate the effect (if any) of P45
employment in reducing proven re-offending, and its effectiveness in
increasing the time from release until first proven re-offence. This analysis
only includes offenders released from custody in 20086, so that we have
enough data to track offenders for a full year after release. The analysis uses
data from the MoJ/DWP/HMRC data share and from MoJ’s internal data
6 i.e. before the roll-out of the Work Programme. This means that any effects of the Work Programme will not be picked up in this analysis.
3

linking project, which provides a rich and relatively new source of information
we would like to exploit more fully.
We start with the cohort of all offenders released from custody in 2008 who
had an OASys assessment, and select from this cohort the subset of
offenders who enter P45 employment in the year following release from
custody. We then compare them to a matched group of offenders to estimate
what their re-offending rate would be if they had not entered P45 employment.
Offenders released from custody for sentences less than twelve months and
for sentences of twelve months or more are analysed separately. It is possible
that the factors important in predicting employment, and perhaps re-offending,
are very different for these two groups (or at least have different relative
importance); especially as offenders with longer sentences are further away
from the labour market; as their most recent employment spell will be longer
ago.
1.4 Defining employment and re-offending Employment: Employment information used in this study comes from HMRC
P45 employment data which is included in the MoJ/DWP/HMRC data share.
The employment data we currently have access to does not include self-
employment or certain cases where earnings are below the tax threshold7.
This means that offenders who do not have a P45 employment record are not
necessarily unemployed. In this analysis, any P45 employment spell lasting
more than one day is considered an employment spell8. Only P45
employment spells which occur prior to the first re-offence are included in the
analysis, so we can isolate the impact of P45 employment on the likelihood of
re-offending.
Re-offending: Measuring true re-offending levels is difficult because only a
proportion of crime is detected and sanctioned. However, methods aimed at
measuring true re-offending, such as self-report studies, are often unreliable
7 See DWP’s Impacts and Costs and Benefits of the Future Jobs Fund (2012) for further information on the P45 data. 8 We also considered using ‘stable employment’, such as a P45 employment spell lasting at least six months, but a sample of that description would include very few re-offenders through its design.
4

as they rely on offenders being honest about their offences. In this analysis,
we use the definition of ‘proven re-offending’ used in the MoJ’s Re-offending
National Statistics publications. ‘Proven re-offending’ is where an offender is
convicted at court or receives a caution for an offence committed within the
follow-up period (12 months) and then disposed of within either this follow-up
period, or waiting period (a further 6 month period)9.
Only recordable offences (which cover all offences which may be tried in a
Crown Court and also the most serious summary offences) are counted as re-
offences in this analysis; consistent with MoJ’s re-offending statistics.
1.5 Rationale for modelling offenders with different sentence lengths separately This analysis looks at all offenders released from custodial sentences ending
in 2008 who had an OASys assessment. This leads to a high heterogeneity of
participant characteristics, as the characteristics of an offender committing an
offence receiving a disposal of just a few days in prison are likely to be very
different to the characteristics of an offender sentenced to many years in
prison. It is likely that the factors crucial to predicting employment, and
perhaps re-offending, are different for these two groups and that the relative
importance of each factor will also differ.
Offences resulting in longer custodial sentences tend to be more serious.
Those offenders receiving longer custodial sentences are also further
removed from the labour market than those with very short custody spells,
although this doesn’t mean these offenders are less likely to get employment
on release. Additionally, many of the offenders with sentences of one year or
more are released on licence and supervised by the probation service, which
may reduce the likelihood of re-offending. Therefore, offenders with custodial
sentences of less than one year are only matched with other offenders with
custodial sentences of less than one year and offenders with custodial
sentences of one year or more are only matched with offenders with custodial
sentences of one year or more.
9See Ministry of Justice (2011b) for further details.
5

By ‘hard matching’ on sentence length group, we gain a more useful
counterfactual; we can say things about the links between P45 employment
and re-offending for offenders receiving custody sentences of less than one
year, or for offenders receiving custody sentences of one year or more.
6

2. Data and Methodology 2.1 Method overview The method used for this analysis is summarised in Figure 1 below.
Figure 1: Stages in propensity score matching
Quantifying the impact of employment on re-offending is difficult, because
offenders who enter P45 employment typically have different characteristics
and different likelihoods of re-offending to those who do not (see Section 2.5
of this report for descriptive statistics). Factors which predict whether an
offender gains P45 employment are likely to also impact on re-offending itself.
In general, when assessing the impact of an intervention, the ideal is random
allocation. With a sufficient sample size, the random allocation process would
enable us to assume that all the relevant characteristics, both observed and
unobserved, of the two groups at the point of release from custody are
7

balanced. Because of this, we could then be confident that any difference in
re-offending rates between the two groups would be due to the impact of P45
employment. However, assigning offenders an employment spell at random
would not be feasible or ethical.
The next best option is matching. In exact matching, the aim is to create a
group of similar offenders by matching on single characteristics that
distinguish the two groups. For this to give us an unbiased estimate of the
impact, we would need to match on every variable which influences both
whether an offender will enter P45 employment and their likelihood of re-
offending. This leads to what is termed the ‘dimensionality problem’ – it
becomes unfeasible to match on every single characteristic, as we would
struggle to find suitable individuals for the comparison group who are a match
on every single characteristic. Since it is not possible to randomly allocate or
carry out exact matching, the method we use here is called Propensity Score
Matching (PSM). This works by aggregating all of the available covariates
associated with employment and re-offending into one score, which we use in
the matching. For more information on Propensity Score Matching, see
Bryson, Dorsett and Purdon, 2002.
2.2 Main assumptions required for PSM Sometimes, the characteristics of individuals in the P45 employment group
are so different from the characteristics of those who are not that it is not
possible to find a suitable individual from the comparison group for matching.
We can only carry out PSM where there is a ‘region of common support’;
meaning that there is substantial overlap between the characteristics of
employed and non-employed offenders. In practice, this means that some
offenders in the treatment (P45 employment) group with very high propensity
scores (i.e. very high probability of getting P45 employment after release) and
some offenders in the comparison group with very low propensity scores (i.e.
very low probability of getting P45 employment after release) need to be
excluded from the analysis. If more than just a small proportion of the sample
is excluded, findings will not be representative of the original data. This is not
a problem in this analysis; we could not find a suitable match for just 3 per
8

cent of offenders with a P45 employment spell during the year following their
release from custody.
The key assumption (the ‘Conditional Independence Assumption’) made in
PSM is that the observable data available to us capture all factors influencing
whether an offender enters employment as we can only match on
characteristics we can observe. For this assumption to be plausible, we need
to be able to control for all characteristics affecting both employment and re-
offending.
There are likely to be many other unobserved variables, which to varying
extents, also play a role in whether an offender enters P45 employment. For
example, it would be extremely helpful it we could include a variable in the
matching which looked at whether or not the offender was actively looking for
work. Unfortunately this variable is not available.
It is impossible to prove that we have met the Conditional Independence
Assumption, so we can never be completely certain that the estimates of the
effect are unbiased. However, the advantage of having a rich data set
(including the OASys variables) is that some of the variables which we have
observed will indirectly capture the influence of variables we have not
observed. For example, although we have not been able to observe
personality type, life experience, or the actual qualifications received, we
believe that by controlling for criminal history, age, attitude to employment,
labour market history etc. the model will capture some of their influence by
proxy. Given the richness of the dataset used, the majority of factors affecting
likelihood of gaining P45 employment will be captured. Additionally, in the
sensitivity analysis, we test whether there would still be an observed effect of
P45 employment if there was an unmeasured variable (not captured in the
data) that increased the odds of entering P45 employment after release. This
was not found to affect the main findings.
9
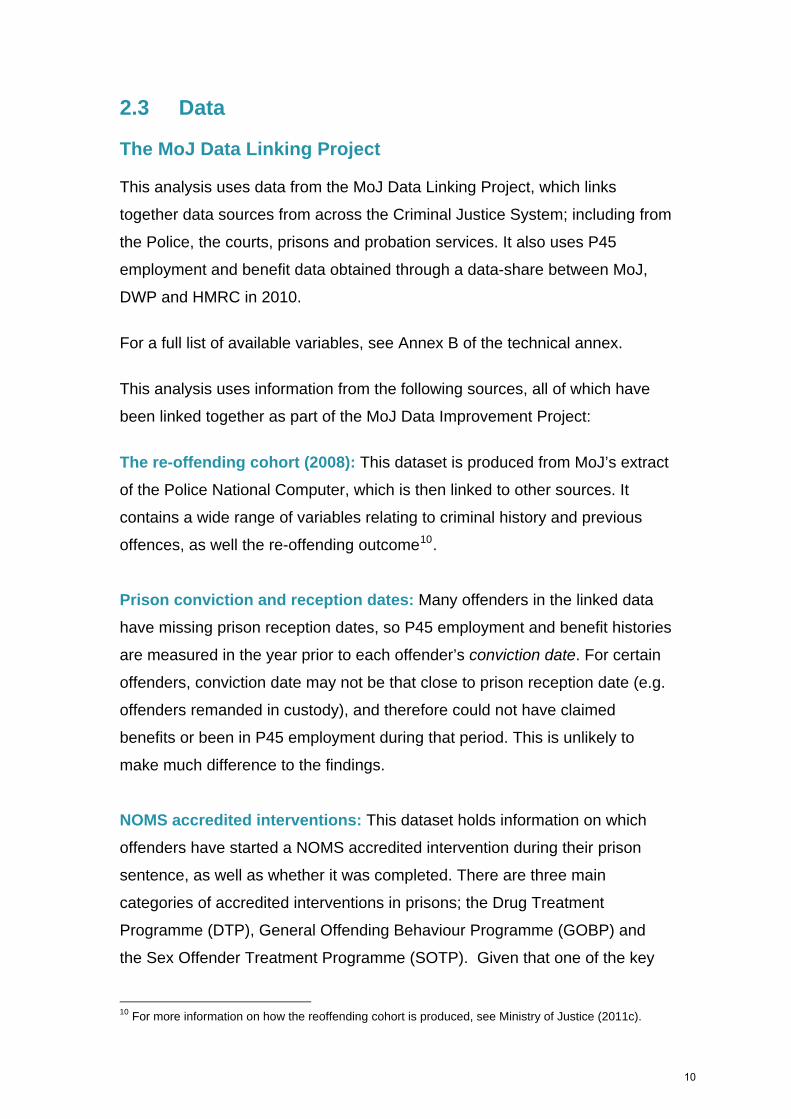
2.3 Data The MoJ Data Linking Project This analysis uses data from the MoJ Data Linking Project, which links
together data sources from across the Criminal Justice System; including from
the Police, the courts, prisons and probation services. It also uses P45
employment and benefit data obtained through a data-share between MoJ,
DWP and HMRC in 2010.
For a full list of available variables, see Annex B of the technical annex.
This analysis uses information from the following sources, all of which have
been linked together as part of the MoJ Data Improvement Project:
The re-offending cohort (2008): This dataset is produced from MoJ’s extract
of the Police National Computer, which is then linked to other sources. It
contains a wide range of variables relating to criminal history and previous
offences, as well the re-offending outcome10.
Prison conviction and reception dates: Many offenders in the linked data
have missing prison reception dates, so P45 employment and benefit histories
are measured in the year prior to each offender’s conviction date. For certain
offenders, conviction date may not be that close to prison reception date (e.g.
offenders remanded in custody), and therefore could not have claimed
benefits or been in P45 employment during that period. This is unlikely to
make much difference to the findings.
NOMS accredited interventions: This dataset holds information on which
offenders have started a NOMS accredited intervention during their prison
sentence, as well as whether it was completed. There are three main
categories of accredited interventions in prisons; the Drug Treatment
Programme (DTP), General Offending Behaviour Programme (GOBP) and
the Sex Offender Treatment Programme (SOTP). Given that one of the key
10 For more information on how the reoffending cohort is produced, see Ministry of Justice (2011c).
10

aims of interventions is to reduce re-offending and prepare for life after
release, it is important to control for any interventions carried out during an
offender’s sentence.
Offender Assessment System (OASys): OASys assessments are carried
out by probation officers/offender managers, during a lengthy interview with
the offender. They are used for identifying and classifying offending related
needs and for assessing the risk of harm to self and to others, as well as to
assess the likelihood of the offender being reconvicted11.
The OASys assessments also include a calculation of each offender’s OGRS
(Offender Group Reconviction Scale) score, using risk factors such as age,
gender and criminal history.
Employment and benefits data The extract of the Police National Computer held by the MoJ has also been
matched with administrative datasets from DWP and HMRC, to provide
information about offenders’ benefit and P45 employment history, as well as
whether they have subsequent P45 employment spells in the year following
release from prison. From this, we can track offenders’ journeys through the
employment and benefits system and through the Criminal Justice System, to
improve our knowledge of how the two systems are interlinked12.
Our employment measure, a P45 employment record starting within 360 days
of release from custody, is taken from the DWP / MoJ / HMRC data share.
Information from the data share on labour market history and benefit receipt
were also good predictors of whether offenders enter P45 employment after
their release from prison, as well as being associated with likelihood to re-
offend.
The MoJ / DWP / HMRC data share contains benefit and P45 employment
histories for the 3.6 million offenders who received at least one caution or
11 See Risk of Harm Guidance and Training Resources: 2.2 Core Risk Assessment Tool: OASys 12 See Ministry of Justice (2011a) for more detailed information.
11

conviction in England or Wales between 2000 and 2010 and who were
successfully matched to DWP/HMRC data13.
There are some data quality issues with the P45 data. Around one third of the
P45 employment spells have estimated start or end dates. Where the start or
end date is unknown, a date within that tax year has been randomly allocated
instead. This is a particular concern for this analysis in cases where the
randomly allocated start date pushes the employment spell into the tracking
period (one year after release from custody), or out of it. As part of the
sensitivity analysis, we show that when all of the P45 employment spells
where the start date has been estimated are dropped, the effect size is still
fairly consistent with our main finding.
Out-of-work benefits: We derive variables from the DWP / MoJ / HMRC data
reflecting the number of weeks in the year prior to conviction an offender
received out-of-work benefits. Out-of-work benefits are defined as
Employment and Support Allowance (ESA), Incapacity Benefit (IB), Severe
Disablement Allowance (SDA), Passported Incapacity Benefit (PIB),
Jobseeker’s Allowance (JSA) and Income Support (IS).
Job density: NOMIS14 publishes data on the job density of each Local
Authority. Job density is defined as the number of jobs in an area divided by
the resident population aged 16-64 in that area. For example, a job density of
1.0 would mean there is one job for every resident aged 16-64. We created a
variable indicating standardised15 job density for each offender, based on
their Local Authority’s 2008 job density score. Local Authority for each
offender is taken from the latest offence information provided on the PNC, so
there will be some cases where the offender is no longer living in that Local
uthority.
A
13 For more information about the matching process in the data share, see Ministry of Justice (2011a). 14 NOMIS is a service provided by the ONS, which provides labour market statistics. 15 Transformed, so that scale becomes unimportant. Its mean becomes zero and its standard deviation becomes one.
12

2.4 Criteria for inclusion in the sample
criteria:
from custody). Not all offenders
ariables missing (this only reduces the sample
ending in 2008, only their first spell is
included in the analysis.
ffenders were in
e original sample and reasons for their removal (Annex A).
Figure 2: Employment spells included in the analysis.
For inclusion in the sample, offenders must fit the following
Release from a custodial sentence during 2008
Inclusion in the MoJ/DWP/HMRC data share
A relevant OASys record (within twenty days prior to sentencing
date and one week after release
receive an OASys assessment
No other matching v
by a small amount)
Each offender is only included once in the sample. If an offender
has multiple prison spells
See the technical annex for a flow chart showing how many o
th
Criteria for including P45 employment spells
= P45 employment spell
13

Figure 2 shows the selection criteria for whether a P45 employment spell
would be counted in the analysis. We have not included offenders in
scenarios 2 and 5 in the employed group in the analysis, because although
occasionally it is valid to be in P45 employment while in custody, this is rare.
We consider that P45 employment spells continuing through prison and after
release are more likely to represent mis-recording than to represent a job
being held open throughout the sentence, which is more likely to look like a
new spell starting after custody. We should investigate this assumption in
more detail in further analysis.
In the matching, we only consider an offender to have a valid P45
employment spell for the analysis if the spell starts between their release from
custody and their first re-offence. For employment to influence re-offending,
changes in re-offending must occur after the P45 employment spell starts.
Restricting analysis to offenders with an OASys record We only include offenders with valid OASys assessments in the analysis. Not
all offenders receive an electronic OASys assessment; OASys records were
only obtained for around half of the original sample. OASys assessment
records were only used in the analysis if the assessment was carried out
within 20 days of the conviction date and before the release date. If multiple
OASys assessments were carried out within this window, then the
assessment closest to the release date was used. This is to ensure that the
OASys assessment reflects the characteristics of the offender as close to the
point of leaving prison as possible. OASys assessments include several areas
where the assessor offers a subjective rating of the scale of the offender’s
problems in a particular aspect of their life (‘no problems’, ‘some problems’ or
‘significant problems’). This does mean it is possible for probation officers to
assess offenders with similar problems differently on these scales.
The rich data surrounding motivations and attitudes provided in OASys
assessments is very valuable. There is a section which asks questions about
education, training and employability, which should significantly improve the
14

quality of our matching, as should the area relating to whether the offender
received income from previous criminal activity. The larger the number of
available pre-release characteristics, the greater the likelihood that we can
capture all of the major factors influencing whether an offender enters P45
employment, which is why this analysis has been restricted to only include
offenders with a valid OASys assessment.
Offenders receiving an OASys assessment The characteristics of offenders with OASys assessments differ slightly from
those who do not. Custodial sentences of under 12 months do not require an
OASys assessment to be carried out; although it often is. Additionally,
offenders under the age of 18 are not usually given OASys assessments; the
Youth Justice Board has a separate tool, Asset, used for juveniles sentenced
to Detention and Training Orders.
However, limiting the analysis to those offenders receiving an OASys
assessment will affect the degree to which the findings can be generalised to
the wider offender population, as those offenders with an OASys assessment
tend to have more complex needs than those who do not. They are more
likely to have committed violent offences, more likely to have received
benefits prior to sentencing and slightly more likely to re-offend. Overall
though, we think that the value gained from including OASys data overrides
the reduction in generalisability.
2.5 Descriptive Statistics
In this section we show that the basic characteristics of those offenders in our
sample who do have a P45 employment spell after being released from
custody (either in the year after release, or before the first re-offence for those
offenders who re-offended) are different from those who do not, prior to
matching. All figures use the sample created for this analysis; so do not
include offenders without a valid OASys assessment or with key matching
variables missing.
15

Custodial sentences less than one year There are differences in characteristics between the two groups, with those
offenders who do not get P45 employment after release from custody having
more previous convictions, greater problems with drug misuse and spending
less time in P45 employment prior to custody.
Table 2: Descriptive statistics for offenders sentenced to a custodial
sentence of under 12 months
AThe mean is the average, a measure of the "typical" value of a data set and the standard deviation (SD) measures how spread out the values are. A high standard deviation means that the values are widely spread.
P45 employment after release
No P45 employment after release
Number of offenders in the cohort: 2,360 12,190
One year proven re-offending: 32% 69% Male: 94% 88% Some problems in attitude towards employment: 23% 41% Serious problems in attitude towards employment: 5% 14% At least some problems with alcohol misuse: 64% 62% At least some problems with drug misuse: 39% 64% Mean (SD)A: Mean (SD): Age at date of index offence: 28.4 ( 9.6) 29.8 ( 9.4) Previous Court Convictions: 19.0 (26.4) 38.5 (37.8)
Weeks in P45 employment in year prior to custody: 15.4 (20.6) 4.3 (12.6)
Weeks receiving an out-of-work benefitin year prior to custody: 13.6 (18.6) 24.8 (21.9)
In the sample used to create the propensity scores, 16 per cent of offenders
sentenced to a custodial sentence of under 12 months started a P45
employment spell during the year following release, with 84 per cent of
offenders not in P45 employment. Offenders with a P45 employment spell
after release from custody have lower re-offending rates in the year following
release. 32 per cent of offenders with P45 employment on release from
16

custody re-offended within one year of their release16; 69 per cent of
offenders who did not enter P45 employment re-offended within one year.
Offenders who have a P45 employment spell after release from custody spent
more weeks in P45 employment in the year prior to custody and fewer weeks
receiving an out-of work benefit and tend to have a more positive attitude
towards employment. Offenders with a P45 employment spell spent an
average of 15.4 weeks in P45 employment and 13.6 weeks in receipt of an
out-of-work benefit in the year prior to custody; compared to an average of 4.3
weeks in P45 employment and 24.8 weeks receiving an out-of-work benefit
for offenders who do not have a P45 employment spell after release. 28 per
cent of offenders who enter P45 employment in the year following release
have at least some problems with their attitude towards employment,
compared to 55 per cent of offenders who do not find P45 employment.
Those offenders who find P45 employment after release typically have fewer
court convictions than those who do not. Offenders who find employment
have an average of 19 previous convictions; those who do not find P45
employment have on average 39 previous convictions.
Drug misuse is much more prevalent among offenders who do not enter P45
employment. 39 per cent of offenders who do have a P45 employment spell
after release admit to a drug misuse problem in their OASys assessment. 64
per cent of offenders with no P45 employment in the year following release
admit to problems with drug and alcohol misuse. Alcohol misuse levels are
broadly similar between the two groups.
A higher proportion of offenders who enter P45 employment after release are
male (94 per cent) than those who do not (88 per cent male). The average
(mean) age at ‘index offence’ (the offence leading to the custodial sentence)
is 30 for offenders who find P45 employment; 28 for those who do not.
16 Only includes employment spells occurring prior to first re-offence.
17

Sentences of one year or more
Table 3 shows that there are also fairly similar differences in characteristics
between offenders who get P45 employment after release and those who do
not, after release from custodial sentences of one year or more.
Table 3: Descriptive statistics for custodial sentences of one year or
more
P45 employment after release
No P45 employment after release
Number of offenders in the cohort: 3,753 12,320 One year proven re-offending: 18% 43% Male: 94% 94% Some problems in attitude towards employment: 22% 35% Serious problems in attitude towards employment: 4% 10% Alcohol Misuse: 54% 54% Drug Misuse: 46% 63% Mean (SD): Mean (SD): Age at date of index offence: 30.6 (10.8) 31.4 (10.4) Previous Court Convictions: 19.0 (26.4) 32.1 (34.9)
Weeks in P45 employment in year prior to custody: 13.2 (19.4) 4.9 (13.4)
Weeks receiving an out-of-work benefit in year prior to custody: 12.8 (18.2) 18.7 (20.4)
23 per cent of offenders sentenced to custodial sentences of 12 months or
more who are included in our sample started a P45 employment spell during
the year following release. This is noticeably higher than for those with shorter
custodial sentences. Before matching, the one year re-offending rate is much
higher for offenders who do not enter P45 employment; 18 per cent of those
with P45 employment on release from custody do re-offend compared with 43
per cent of those who do not enter P45 employment in the year following
release.
18

Offenders sentenced to a custodial sentence of 12 months or more who have
a P45 employment spell after release spent more weeks in P45 employment
in the year prior to custody and fewer weeks receiving an out-of work benefit
than those offenders who did not get P45 employment. They also tend to
have a more positive attitude towards employment. Offenders with a P45
employment spell spent an average of 13.2 weeks in P45 employment and
12.8 weeks in receipt of an out-of-work benefit in the year prior to custody;
compared to an average of 4.9 weeks in P45 employment and 18.7 weeks
receiving an out-of-work benefit for offenders who do not have a P45
employment spell after release. 26 per cent of offenders who do find P45
employment after release have at least some problems in their attitude toward
employment, compared to 45 per cent of those who do not find P45
employment after release.
Offenders on longer custodial sentences who start P45 employment in the
year following release from custody tend to have fewer previous convictions.
Offenders who do not find P45 employment after release have an average of
32 previous convictions; whereas offenders who do find P45 employment
have an average of 19 previous convictions.
There is also a strong negative association between drug misuse problems
and finding P45 employment. 46 per cent of offenders who do find P45
employment have admitted to problems with drug misuse (in OASys
assessment); 63 per cent of offenders who do not enter P45 employment
admit to problems with drug misuse. Alcohol misuse levels are similar across
the two groups.
2.6 Logistic regression modelling
We create the propensity score used to create the matched comparison group
using regression modelling. We entered the variables expected to predict
likelihood of starting a P45 employment spell after release into a logistic
19

regression model17 to obtain a single score for each offender based on their
characteristics, reflecting their ‘propensity to gain P45 employment after
release’. The propensity score is the expected probability of entering P45
employment after release; given an offender’s observed characteristics.
This is the score we use in the matching. Our aim is to find a suitable
comparison group where the only difference between the two groups is that
offenders in the comparison group did not enter P45 employment after
release. See the technical annex (Annex C) for further details of the model.
2.7 Assessing propensity scores There is a large region of common support; where the propensity scores for
the employment and no employment groups overlap. After matching, the
distribution of propensity scores for the ‘treatment’ (P45 employment) group
and comparison group are very similar. For histograms showing the overlap in
propensity scores before matching, as well as after matching, see the
technical annex (Annex D).
2.8 Matching process There are a number of possible matching options available; after trying
several different matching options, this study uses 1:1 Nearest Neighbour
matching with a calliper of 0.2 of the standard deviation of the logit of the
propensity score18, although a range of callipers were explored to test the
sensitivity of the calliper size. Matching is carried out without replacement,
which means that each comparison group member only appears once in the
sample.
17 Logistic regression is a type of predictive model that can be used when the target variable is a categorical variable with two categories. Here, the two categories represent an offender entering P45 employment after release and not entering P45 employment after release. 18 As suggested by Austin, P.C. (2011) and Faries, Leon, Hao and Obenchain (2010).
20

Figure 3: The matching process
Person A – There are two potential matches in the comparison group within
the calliper range. The offender with the nearest propensity score to Person A
also meets the additional criteria of not having re-offended before the start of
person A’s first P45 employment start, so is used as the matched comparison.
Person B – No match is found for Person B as there are no offenders in the
comparison group within the calliper range.
Person C – There are 2 potential matches within the comparison group. The
offender with the closest propensity score does not however meet the
additional criteria, as he/she has re-offended before the start of Person C’s
first P45 employment start. The next closest offender does meet this
additional criteria and is therefore used for the match.
21

One complication in this analysis is that selection into the P45 employment
group is a function of offenders not having re-offended for long enough to
search for and start work. This means that the outcome measure (whether
re-offended) indirectly affects whether someone is in the treatment group
(gains P45 employment). To get around this problem, we have also added in
an extra criterion to the matching process.
A match is only considered valid if the possible comparison group member
has not re-offended before the start of their matched case’s first P45
employment start. If the possible comparison member has re-offended
before this point, the next best comparison member is chosen instead (next
closest propensity score). This is a slightly similar approach to the pseudo
start date method used in several DWP papers using PSM19.
For both groups of offenders (offenders serving short custodial sentences,
and those serving longer custodial sentences), a suitable match from the
comparison group was found for 97 per cent of offenders. This gives matched
groups of 2,298 employed and 2,298 non-employed offenders released from
custody for a sentence of less than 12 months and matched groups of 3,622
employed and 3,622 non-employed offenders released from custody for a
sentence of 12 months or more.
2.9 Assessing match quality
After matching, we check that covariates at an aggregate level balance across
the two groups (treatment (those who get P45 employment) and comparison).
Where matching is robust, the only difference in characteristics between the
two groups should be that one group enter P45 employment after release and
the other does not. Whether the two groups are balanced is assessed through
comparing the standardised differences for each covariate across the two
19 For example see Early Impacts of the European Social Fund 2007-13; published by the Department for Work and Pensions (2011).
22
groups. Smaller standardised differences reflect greater similarity between the
two groups in the characteristic.
This analysis uses a cut-off point of standardised differences of less than 0.1
(or 10 per cent) when assessing balance. After the matching in this analysis,
all standardised differences are below 10 per cent and vast majority are below
5 per cent, which suggests that the matched comparison groups are well
balanced; see technical annex for details (Annex E).
2.10 Survival analysis After matching, we compare the two groups. Firstly, we use McNemar’s test20
to compare one year re-offending rates between the two groups. After this, we
produce survival curves for each of the two groups, showing time from release
to first re-offence. These survival curves show the decreasing proportion of
offenders who have not yet re-offended throughout the year following their
release from custody. A significant difference between the two curves
suggests that P45 employment has a significant impact on time to first re-
offence. We also fit Cox proportional hazards models to the data to obtain a
hazards ratio. The hazard ratio shows the rate at which the P45 employment
group re-offend (per day) since release compared to the comparison group.
For example, a hazard ratio of 1.4 would mean that the P45 employment
group has a 40 per cent higher hazard of re-offending than the matched
control group. A hazard ratio less than one suggests that the P45 employment
group have a lower re-offending hazard of re-offending. Hazard ratios are
provided in the technical annex (Annex F).
20 McNemar’s test is used to compare proportions (such as re-offending rates) in paired data. There is not a consensus in the literature on whether or not paired tests should be used in the matched sample, so we also apply a t-test for independent samples.
23

3 Results 3.1 Main findings
Offenders in our sample with a P45 employment spell within one year
following their release from custody were significantly less likely to re-offend
than those offenders who did not get P45 employment. For custodial
sentences of less than one year, offenders with a P45 employment spell had
a proven re-offending rate 9.4 percentage points lower than the matched
comparison group. For custodial sentences of one year or more, offenders
entering P45 employment after release had a proven re-offending rate 5.6
percentage points lower than the matched comparison group; see Figure 4
below.
Figure 4: One year proven re-offending rates after matching. Custodial sentences less than one year and sentences of one year or more.
0%
5%
10%
15%
20%
25%
30%
35%
40%
45%
Custodial sentences less than one year
Custodial sentences of one year or more
On
e ye
ar p
rove
n r
e-o
ffen
din
g r
ate
P45 employment (treatment group)No P45 employment(comparison group)
These findings apply to P45 employment only. This analysis does not allow us
to say anything about the impact of employment below the tax threshold or
self-employment. Although we know that the comparison group members do
not have a P45 employment spell within one year of their release, this
24
analysis does not provide any other information about their status. They may
be in education or training, in low-paid/self -employment, receiving out-of-work
benefits, or various other possibilities.
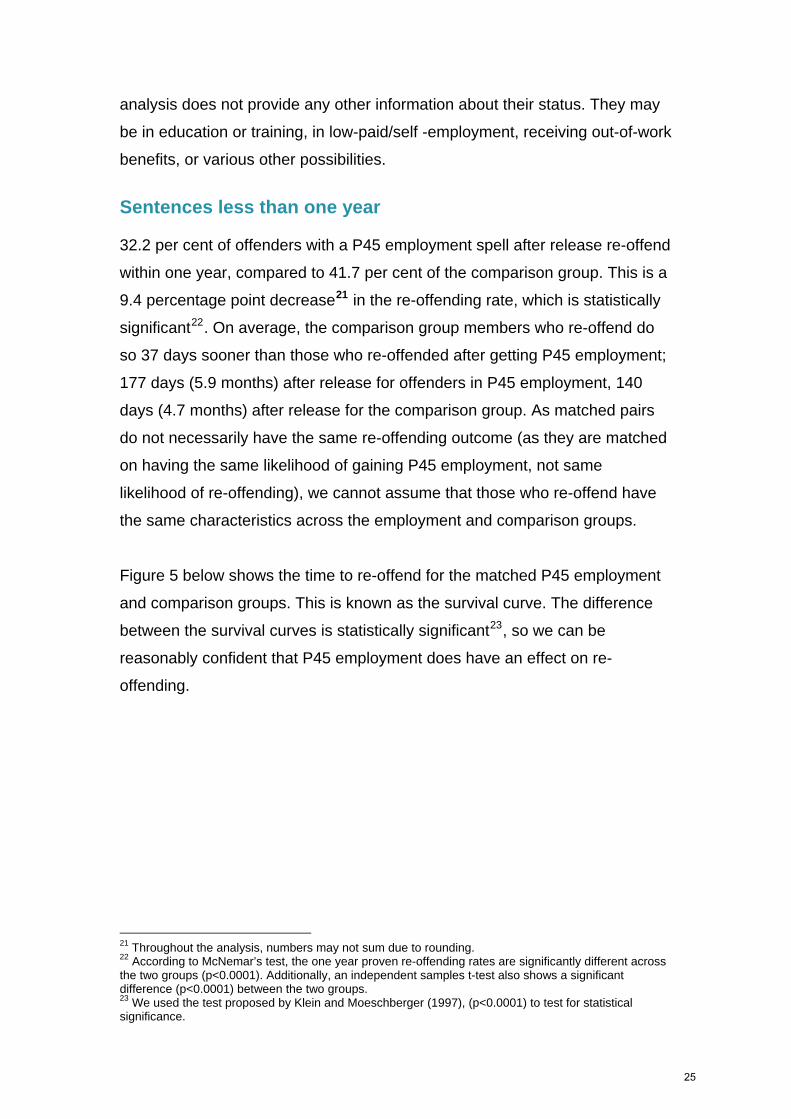
Sentences less than one year 32.2 per cent of offenders with a P45 employment spell after release re-offend
within one year, compared to 41.7 per cent of the comparison group. This is a
9.4 percentage point decrease21 in the re-offending rate, which is statistically
significant22. On average, the comparison group members who re-offend do
so 37 days sooner than those who re-offended after getting P45 employment;
177 days (5.9 months) after release for offenders in P45 employment, 140
days (4.7 months) after release for the comparison group. As matched pairs
do not necessarily have the same re-offending outcome (as they are matched
on having the same likelihood of gaining P45 employment, not same
likelihood of re-offending), we cannot assume that those who re-offend have
the same characteristics across the employment and comparison groups.
Figure 5 below shows the time to re-offend for the matched P45 employment
and comparison groups. This is known as the survival curve. The difference
between the survival curves is statistically significant23, so we can be
reasonably confident that P45 employment does have an effect on re-
offending.
21 Throughout the analysis, numbers may not sum due to rounding. 22 According to McNemar’s test, the one year proven re-offending rates are significantly different across the two groups (p<0.0001). Additionally, an independent samples t-test also shows a significant difference (p<0.0001) between the two groups. 23 We used the test proposed by Klein and Moeschberger (1997), (p<0.0001) to test for statistical significance.
25

Figure 5: Survival curves showing time to first re-offence for offenders released from custody after a sentence of less than one year. Offenders who enter P45 employment and matched comparison group
Interpreting the survival curve chart For example, 100 days after release from prison, 91 per cent of offenders who
have a P45 employment spell after release have not yet committed a re-
offence; compared to 82 per cent of offenders in the matched comparison
group. Or conversely, 100 days after release from prison, 9 per cent of
offenders who have a P45 employment spell after release have re-offended;
compared to 18 per cent of the matched comparison group.
After matching, there were 380 (17 per cent of total sample after matching)
matched pairs where both the treatment and control group members re-
offended within one year of release, 979 (43 per cent) matched pairs where
neither offender re-offended, 361 pairs (16 per cent) where the P45 employed
pair member re-offended but the comparison member did not, and 578 pairs
(35 per cent) where the comparison group member re-offended but the
employed member did not (see table in Annex F).
26

Sentences of one year or more The direction of the impact is the same as for those with sentences less than
one year, but the difference is smaller. The one-year proven re-offending
rates were 18.8 per cent for offenders in our sample with a P45 employment
spell on release and 24.4 per cent for the comparison group; a total
percentage point difference of 5.6 per cent, which is statistically significant24.
On average, the comparison group members who re-offended did so 34 days
sooner than those in P45 employment who re-offended; 206 days (6.9
months) after release for offenders in P45 employment, 172 days (5.7
months) after release for the comparison group. Figure 6 below shows the
survival curves for re-offending for the P45 employment group and the
comparison group. The difference between the survival curves is statistically
significant25.
Figure 6: Survival curves showing time to first re-offence for offenders released from custody after a sentence of one year or more. Offenders who enter P45 employment and matched comparison group
24 According to McNemar’s test, the one year proven re-offending rates are significantly different across the two groups (p<0.0001). Additionally, an independent samples t-test also shows a significant difference (p<0.0001) between the two groups. 25 We used the test proposed by Klein and Moeschberger (1997), (p<0.0001) to test for statistical significance
27

There were 204 matched pairs (6 per cent of total matched pairs) where the
offender in both the treatment and control group re-offended within one year
of release, 2,262 matched pairs (62 per cent) where neither offender re-
offended, 476 pairs (13 per cent) where the P45 employed pair member re-
offended but the comparison member did not, and 680 pairs (19 per cent)
where the comparison group member re-offended but the employed member
did not.
3.2 Sensitivity Analysis Given the limitations and caveats to this analysis it is important to conduct
sensitivity analysis to check that our findings are as robust as possible. This
section examines the sensitivity of the model and analysis to changes in its
input.
We have carried out three separate sensitivity tests.
- Part I looks at whether the effect of P45 employment on re-offending
would still be statistically significant if there was an unmeasured
variable which increased the odds of P45 employment by up to 25 per
cent.
- Part II shows the revised re-offending rate if all P45 employment
spells with randomly allocated start dates are removed from the
modelling
- Part III shows the impact of removing all offenders from the control
group who have a P45 employment spell within one year of release,
but after their first re-offence
Part I: Sensitivity to unobserved variables Although our data is very rich, there will still be some characteristics
associated with entering P45 employment which we cannot observe or
measure and so are not included in the matching process. We assessed how
sensitive the effect of P45 employment on re-offending is to unmeasured
variables. More details on this can be found in the technical annex (Annex F).
28
Custodial sentences of less than one year Even if there was an unmeasured binary variable that increased the odds of
entering P45 employment after release by up to 25 per cent, and if this
variable was almost perfectly associated with re-offending, the statistical
significance of the observed treatment effect would still be less than 0.05
(see table in Annex F), which means that our findings would still show a
statistically significant impact of P45 employment on re-offending. There is no
way of testing how large the influence of unobserved variables might be, or
how likely it is that there are unobserved variables, but the richness of the
dataset used should minimise this as we are already controlling on a wide
range of characteristics (including attitudinal characteristics).
Custodial sentences of one year or more If there was an unmeasured binary variable that increased the odds of
entering P45 employment after release by up to 25 per cent, the statistical
significance of the observed treatment effect would still be less than 0.05
which means that our findings would still show a statistically significant impact
of P45 employment on re-offending.
Part II: Impact of including employment spells with randomly allocated start dates We included P45 employment spells with randomly allocated start dates in the
main analysis because they still reflect genuine P45 employment spells – it is
just that we are not sure when exactly these employment spells occur in the
year. The majority of cases with a randomly allocated start date are unlikely to
be incorrectly included / excluded from the group used in analysis, because
the start date should be in the correct tax year and we know the spell end
date. However, to test whether including randomly allocated start dates has a
large impact on the effect size, we re-ran the matching after removing all P45
employment spells with randomly allocated start dates. From Table 4, we can
see that removing randomly allocated spells does reduce the size of the
effect, but not by a large amount. The effect size is still statistically significant
(McNemar’s test; p<.0001).
29

Table 4: Impact of removing P45 employment spells with randomly
allocated start dates
Main findings Sensitivity test - Removing randomly allocated P45 spells
Re-offending rate:
P45 employment (Treatment group)
Comparison group
Effect size (percentage point change in re-off rate)
P45 employment
Comparison group
Effect size
Sentences less than one year
32.2% 41.7% 9.4 ppt changeA
39.6% 7.8 ppt change
No. matched pairs (2,298 pairs)
31.8%
(1,869 pairs) Sentences one year or more
18.8% 24.4% 5.6 ppt change
18.5% 22.7% 4.3 ppt change
No. matched pairs (3,622 pairs) (3,102 pairs) A ppt = percentage point
Part III: Impact of removing all offenders with P45 employment spells after first re-offence from comparison group In the main analysis, any offender in the sample who did not have a P45
employment spell before the end of the one year tracking period or before
their first re-offence could be used as a possible comparison group member.
We were concerned that a large number of offenders in the matched
comparison group may in fact have a P45 employment spell within one year
of release, but after their first re-offence. Table 5 below shows the impact of
removing offenders from the comparison group who have a P45 employment
spell within a year following release but after their first re-offence. The effect
size is smaller, but still statistically significant (McNemar’s test; p<.0001).
Table 5: Impact of removing offenders with a P45 employment spell after first re-offence from comparison pool
Main findings Removing offenders with a P45 employment spell after re-offence from comparison
Re-offending rate:
P45 employment
Comparison group
Effect size (percentage point change in re-off rate)
P45 employment
Comparison group
Effect size
Sentences less than one year
32.2% 41.7% 9.4 ppt change
39.1% 6.7 ppt change
No. matched pairs (2,298 pairs)
32.4%
(2,274 pairs) Sentences one year or more
18.8% 24.4% 5.6 ppt change
18.9% 22.8% 3.9 ppt change
No. matched pairs (3,622 pairs) (3,609 pairs)
30

Further sensitivity analysis
Additional sensitivity analysis looking at the effect of removing the OASys
data to see whether the effect of P45 employment on re-offending can be
generalised to the wider offender population is something we could consider
as further analysis.
31

4. Conclusions
4.1 Summary
The purpose of this analysis has been to estimate the effect P45 employment
has on re-offending. It was designed to expand the evidence base on
employment and what works in reducing re-offending.
Within the sample used in this analysis, the re-offending rate is lower for
offenders who enter P45 employment than for the matched comparison
group. The effect of P45 employment was statistically significant for offenders
of either sentence length group, however P45 employment appears to have a
larger impact (in terms of reducing re-offending) on offenders with custodial
sentences of less than one year than custodial sentences of greater than a
year. Offenders with a P45 employment spell following release who re-
offended also took longer on average to re-offend. The findings of this
analysis are consistent in direction with the results from previous internal
Ministry of Justice research. While we can be confident in the direction of the
effect (that employment reduces re-offending), the effect size cannot
necessarily be generalised to the wider offender population, as we restricted
analysis to offenders with an OASys assessment.
Offenders with a P45 employment spell lasting more than one day were
considered ‘in employment’ in this analysis. We do not have data on cash-in-
hand employment, self-employment or certain types of employment below the
tax threshold, so these are not included here. There is a chance that some
offenders in the matched comparison group may fall into one of these other
employment groups. They may also be in education or training, or receiving
benefits.
The impact estimates were produced using propensity score matching.
Findings will only reflect the true impact of P45 employment if offenders in the
P45 employment group and the matched comparison group are well-matched
on all characteristics relating to P45 employment. If there are characteristics
32

which differ between the two groups and which impact on P45 employment,
but which we haven’t been able to measure, then the estimate of the effect of
P45 employment on re-offending will be biased.
We cannot be sure that we have captured every important variable when
calculating the propensity scores. We have minimised bias as much as
possible through using a very rich data source and the sensitivity analysis is
reassuring, however we are unlikely to have controlled for everything which
affects whether an offender enters P45 employment or re-offends. For
example, parenthood is often cited as an important factor in desistance, but
whether an offender has children is not a variable we have in our data.
Additionally, many ex-prisoners do not have a permanent address and
therefore cannot provide these details when looking for employment. Ideally
we would know more about whether those who get P45 employment soon
after their release from prison are those who have secured accommodation.
We also cannot capture work that prisoners do inside prison, although this
information may become available in future.
4.2 Additional research questions
Impact of P45 employment on offenders without employment This analysis focuses on offenders leaving custody who gain P45 employment
and estimates their re-offending rates had they not found P45 employment. It
does not estimate the inverse; the effect gaining P45 employment would have
on re-offending for offenders who do not find P45 employment.
We were unable to estimate this using propensity score matching, because
there was not enough overlap in the low region of propensity scores (i.e. there
were not enough offenders who had a P45 employment spell after release,
but who had low enough propensity scores to act as a suitable comparison
group member). A greater understanding of offenders with a low propensity to
enter P45 employment would be interesting however, as offenders with very
low propensity scores are likely to be ‘harder to help’ and therefore more
33

persistent re-offenders. Further analysis is needed to assess the impact of
P45 employment on this group.
Assessing the stability of the results over time This analysis only includes offenders released from custody in 2008. Once we
have more recent data available, it would be worthwhile to assess whether the
impact is similar across years. 2008 was the start of the recession, so it may
be that this has an additional effect on selection into P45 employment. In
addition, more recent data would include offenders who had started the Work
Programme, which may change the effect size, as it aims to give additional
support to offenders claiming Jobseeker’s Allowance.
Analysis of impacts of subsets of offenders We cannot generalise our findings to the whole offender population because
this analysis looks at custodial sentences only and we excluded those
offenders who were not found on the MoJ/DWP/HMRC data share and those
who did not have a valid OASys assessment.
We had hoped to also look at the impact of P45 employment on re-offending
for offenders serving their sentence in the community. However, propensity
score matching was not found to be a suitable technique, as there was not a
large enough region of common support between those offenders who
entered P45 employment and the possible comparison group members. We
think that this is because employment history before sentence almost
perfectly predicts whether an offender has a P45 employment spell after
sentence. This is not the case with custodial sentences; possibly because a
custodial sentence usually requires an offender to leave their current
employment and seek new employment after release. Therefore there is a
greater element of chance in whether an offender finds work, for offenders
released from custody. Offenders who serve their sentence in the community
are more likely to be able to continue in their current employment. We would
welcome any comments on how we could reliably estimate the impact
34

employment has on re-offending for other groups of offenders – not just those
serving custodial sentences.
Nature of employment spells It would be useful to have more detail on the nature of offenders’ employment
spells. The P45 data does not include certain types of employment spells and
some of these may never be available as, by their nature, they won’t be
recorded on administrative systems, but further analysis could feasibly
incorporate the length of P45 spell into the analysis and other types of
employment. Data on whether the offender finds their work satisfying and
reasons for termination of the employment would also add value.
There is scope to improve this analysis in future as MoJ are working with
DWP and HMRC to get the legal and ethical approval for a regular data share
which aims to obtain more information about the employment status of
offenders (potentially including information on tax credits, number of hours
worked and on earnings, all of which would add value to further analysis).
Re-offending measure This analysis focuses on the one year re-offending rate and on time from
release to first re-offence. It does not include information about the severity or
frequency of re-offending. If an offender has a custodial sentence for a violent
assault, and is later reconvicted for another violent assault, that outcome
might be considered worse than a reconviction for shoplifting. Similarly,
although the re-offending rate does not take frequency of re-offending into
account, this could be included in further analysis.
As this analysis is exploratory, we would welcome ideas and expert advice on
how best to exploit this rich source of data in looking at the relationship
between employment and re-offending. One possibility may be optimal
matching; comparing offenders’ life-histories and transitions between different
states (employment, benefits, interventions, time in custody, offences) to look
at how each of these might impact on re-offending.
35

References Austin, P. (2011). Optimal caliper widths for propensity-score matching when estimating differences in means and differences in proportions in observational studies. Pharmaceutical Statistics Mar-Apr;10(2):150-61. Crutchfield, R.D., and Pitchford. S.R. (1997). Work and Crime: The Effects of Labor Stratification. Social Forces 76:93-118. Bryson, A., Dorsett, R., and Purdon, S., (2002). The use of Propensity Score Matching in the Evaluation of Active Labour market Policies research.dwp.gov.uk/asd/asd5/WP4.pdf Department for Work and Pensions (2011). Early Impacts of the European Social Fund 2007-13. In-house research no. 3. research.dwp.gov.uk/asd/asd5/ih2011-2012/ihr3.pdf Department for Work and Pensions (2012). Impacts and Costs and Benefits of the Future Jobs Fund. statistics.dwp.gov.uk/asd/asd1/adhoc_analysis/2012/impacts_costs_benefits_fjf.pdf Faries, D., Leon, A., Haro, J. and Obenchain, R. (2010); Analysis of Observational Health Care Data Using SAS. SAS Institute. Freeman, R. B. (1983). "Crime and Unemployment." In Crime and Public Policy, edited byJames Q. Wilson. San Francisco, Calif.: Institute for Contemporary Studies Press. Klein, J. P. and Moeschberger, M. L. (1997). Survival Analysis. New York: Springer. Metcalf H., Anderson T. and Rolfe H. (2001) Barriers to employment for offenders and ex-offenders (DWP Research Report No 155) Leeds: CDS research.dwp.gov.uk/asd/asd5/155summ.asp Ministry of Justice (2011a) Offending, employment and benefits – emerging findings from the data linkage project. London: Ministry of Justice. Ministry of Justice (2011b). Proven re-offending statistics: definitions and measurement. Ministry of Justice (2011c) 2011 Compendium of re-offending statistics and analysis. Ministry of Justice Statistical Bulletin. London: Ministry of Justice. NOMIS official labour market statistics, http://www.nomisweb.co.uk/ Risk of Harm Guidance and Training Resources: 2.2 Core Risk Assessment Tool: OASys hlsweb.dmu.ac.uk/pgcpd/engroh435final/roh/2-basic_riskassessment/02_02.htm
36

SAS Institute Inc. (2012). A unified approach to measuring the effect size between two groups using SAS. Proceedings of the SAS® Global Forum 2012 Conference; paper 335. Cary, NC: SAS Institute Inc. Witte, A.D., and Tauchen H. (1994). Work and Crime: An Exploration Using Panel Data. Public Finance, 49:155-67.
37

Technical Annex Annex A: Flow charts showing reasons for offenders’ exclusions from the sample. Custodial sentences less than one year
Final sample
14,550 offenders
Internal linked data (Re-offending Cohort,
interventions, prison data)
37,960 offenders*
Not found on MoJ / DWP / HMRC data share or sentence length unknown, 3,292 offenders
No valid OASys assessment available, 20,012 offenders Other key matching
variables unavailable, 106 offenders
Percentage of original sample used in analysis:
38%
Employment and benefits data, DWP
and HMRC
* These figures are in line with those in the proven re-offending publications. See 2008 figures in table 19A in the statistical tables at www.justice.gov.uk/statistics/reoffending/proven-re-offending.
38

Custodial sentences of one year or more
Final sample
16,073 offenders
Not found on data share or sentence length unknown, 1,815 offenders
No valid OASys assessment available, 10,889 offenders
Other key matching variables unavailable, 665 offenders
Percentage of original sample used in analysis:
55%
Internal linked data (Re-offending Cohort,
interventions, prison data) Employment and
benefits data, DWP and HMRC
29,442 offenders*
* These figures are in line with those in the proven re-offending publications. See 2008 figures in table 19A in the statistical tables at www.justice.gov.uk/statistics/reoffending/proven-re-offending.
39

Annex B: Available variables for creating the comparison group
The table below shows the variables available for matching and their possible
values. Not all of these proved significant in the final models but all were used
to assess balance in the matched sample. Index offence is the offence
leading to the custodial sentence.
Variables available for matching process and possible values
Variable Type Values
Personal/Demographic information
Gender Categorical Male; Female
Age at date of index offence (and age squared) Numerical Integer values
Government Office Region Categorical
12 UK regions. Series of binary variables. (NB data only covers Prisons and Probation Services in England and Wales but some Scottish offenders included)
Ethnicity Categorical Series of binary variables: White, Black, Asian, Other, Unknown
Criminal history and contact with CJS
Index offence Categorical 13 broad categories, e.g. 'robbery', 'sexual offences'
Sentence length for index offence Numerical Continuous variable (no. days)
Offender has received an accredited intervention while in custody Categorical Binary variable. Values are No / Yes
Offender has undertaken the Drug Treatment Programme Categorical Binary variable. Values are No / Yes
Offender has undertaken the Sex Offender Treatment Programme Categorical Binary variable. Values are No / Yes
Offender has undertaken the General Offending Behaviour Programme Categorical Binary variable. Values are No / Yes
Age at first contact with CJS (and age squared) Numerical Integer values
Copas rate (including PNDs)26 Numerical Continuous variable
Number of previous violent offences27 Numerical Continuous variable
Number of previous robbery offences Numerical Continuous variable
Number of previous public order offences Numerical Continuous variable
Number of previous sexual offences Numerical Continuous variable
Number of previous sexual offences (child) Numerical Continuous variable
Number of previous burglary offences (domestic burglaries) Numerical Continuous variable
Number of previous burglary offences (other burglaries) Numerical Continuous variable
Number of theft offences Numerical Continuous variable
Number of handling offences Numerical Continuous variable
Number of previous fraud and forgery offences Numerical Continuous variable
26 The Copas rate controls for the rate at which an offender has built up convictions throughout their criminal career. The higher the rate, the more convictions an offender has in a given amount of time, and the more likely it is that an offender will re-offend within one year. The Copas rate formula is
27 All previous offence variables exclude Penalty Notices for Disorder.
40

Number of previous drink driving offences Numerical Continuous variable
Number of previous criminal damage offences Numerical Continuous variable
Number of previous drug offences (import/export/ production/supply) Numerical Continuous variable
Number of previous drug offences (possession/small scale supply) Numerical Continuous variable
Number of previous absconding or bail offences Numerical Continuous variable
Number of previous offences which resulted in a conviction Numerical Continuous variable
Number of previous offences which resulted in a caution Numerical Continuous variable
Number of previous offences committed in the year prior to index date Numerical Continuous variable
Benefit and labour market history
Job density in offender's Local Authority Continuous Continuous variable (standardised)
Number of weeks in P45 employment in year prior to sentence Numerical Values of 0-52
Number of weeks receiving Jobseeker’s Allowance in year prior to sentence Numerical Values of 0-52
Number of weeks receiving Employment & Support Allowance in year prior to sentence Numerical Values of 0-52
Number of weeks receiving Incapacity Benefit in year prior to sentence Numerical Values of 0-52
Number of weeks receiving Passported Incapacity Benefit in year prior to sentence Numerical Values of 0-52
Number of weeks receiving Severe Disablement Allowance in year prior to sentence Numerical Values of 0-52
Number of weeks receiving Income Support in year prior to sentence Numerical Values of 0-52
Number of weeks receiving a DWP out-of-work benefit in year prior to sentence Numerical Values of 0-52
Number of weeks on a DWP employment programme in year prior to sentence Numerical Values of 0-52
OASys assessment variables
'Accommodation' criminogenic needs score Numerical Continuous variable
'Education, training and employability' criminogenic needs score Numerical Continuous variable
'Relationships' criminogenic needs score Numerical Continuous variable
'Lifestyle and associates' criminogenic needs score Numerical Continuous variable
'Drug misuse' criminogenic needs score Numerical Continuous variable
'Alcohol misuse' criminogenic needs score Numerical Continuous variable
'Thinking and behaviour' criminogenic needs score Numerical Continuous variable
'Attitude' criminogenic needs score Numerical Continuous variable
Work Skills Categorical 2 binary vars, reflecting No Problems / Some Problems / Significant Problems
Attitude to Employment Categorical 2 binary vars, reflecting No Problems / Some Problems / Significant Problems
Financial Situation Categorical 2 binary vars, reflecting No Problems / Some Problems / Significant Problems
Financial Management Categorical 2 binary vars, reflecting No Problems / Some Problems / Significant Problems
Illegal income from criminal activity Categorical 2 binary vars, reflecting No Problems / Some Problems / Significant Problems
OASys re-offending predictor Numerical Continuous variable
OASys violence predictor Numerical Continuous variable
41

Annex C: Creating the comparison group - logistic regression model The tables below show the variables that were used in the logistic regression
model used in creating the matched control group. Many more variables were
available for use (see annex B), but these are the ones that were important in
predicting P45 employment after release from custody. From the model
outputs we can see how different offender and offence characteristics affect
whether an offender enters P45 employment on release from custody. In
general, a positive coefficient means that that offender or offence
characteristic increases the likelihood of entering P45 employment, and
conversely, a negative coefficient means that that offender or offence
characteristic decreases the likelihood of entering P45 employment. So, for
example, offenders with more weeks in P45 employment in the year prior to
custody are more likely to get employment after release, since ‘number of
weeks in P45 employment in year prior to custody’ has a positive co-efficient.
Some variables may have a more complex relationship with employment,
however. Although receiving a NOMS accredited intervention while in custody
appears to have a negative impact on an offender’s chances of gaining P45
employment, it is likely that this variable is actually capturing something else,
i.e. the type of offender who is given a NOMS accredited intervention; most
likely those who are ‘harder to help’28.
28 For help in interpreting logistic regression outputs, see www.ats.ucla.edu/stat/sas/dae/logit.htm
42

Parameter Co-
efficient Standard
Error
WaldChi-
Square Pr >
ChiSq
Intercept -0.0643 0.28460 0.0511 0.8212
Age at date of first contact with CJS 0.0214 0.00474 20.425 <.0001
Age at date of index offence -0.0609 0.01550 15.4447 <.0001
Age at date of index offence, squared 0.00033 0.000215 2.3591 0.1246
Previous offences: Burglary (non-domestic) 0.0323 0.011600 7.7119 0.0055
Previous offences: Theft -0.0104 0.00526 3.9455 0.047
Previous offences: Fraud and Forgery 0.0367 0.00907 16.3427 <.0001
Previous offences: Drink driving offences 0.0856 0.0251 11.5824 0.0007
Total number of previous convictions -0.0051 0.0021 5.9625 0.0146
Total number of convictions in year prior to index offence -0.0347 0.00788 19.4545 <.0001
Copas rate -0.2729 0.0576 22.4396 <.0001
Number of weeks receiving Jobseeker's Allowance in year prior to custody 0.0248 0.0104 5.6524 0.0174
Number of weeks in P45 employment in year prior to custody 0.0221 0.00156 200.0271 <.0001
Number of weeks spent on a DWP employment programme 0.00589 0.00248 5.6243 0.0177
Number of weeks receiving Incapacity Benefit in year prior to custody 0.00725 0.0105 0.4795 0.4886
Number of weeks receiving Income Support in year prior to custody 0.00766 0.0107 0.514 0.4734 Number of weeks receiving Out Of Work benefits in year prior to custody -0.0181 0.0104 3.0529 0.0806
Whether received an intervention while in custody -0.3294 0.151 4.7602 0.0291
Whether attended the General Offending Behaviour Programme -0.4429 0.3046 2.1144 0.1459
No problems with financial management 0.225 0.0697 10.409 0.0013
Serious problems with work skills -0.1173 0.0897 1.7113 0.1908
No problems with employment history -0.1183 0.0814 2.1132 0.146
No problems with attitude to employment 0.1606 0.0752 4.563 0.0327
Female -0.2761 0.1049 6.9255 0.0085
Burglary -0.2983 0.1287 5.371 0.0205
Index Offence: Other Indictable offence -0.1386 0.0735 3.5533 0.0594
Ethnicity: Asian -0.2118 0.1142 3.4408 0.0636
GOR: London -0.212 0.0893 5.633 0.0176
GOR: South East 0.1507 0.076 3.9342 0.0473
GOR South West 0.2312 0.1084 4.5511 0.0329
Criminogenic Needs Score: Accommodation -0.0146 0.00882 2.732 0.0984
Criminogenic Needs Score: Education, Training and Employability -0.146 0.0242 36.3054 <.0001
Criminogenic Needs Score: Drug Misuse -0.036 0.0114 9.9739 0.0016
Parameter Co-
efficient Standard
Error
WaldChi-
Square Pr >
ChiSq
Intercept 0.7154 0.2335 9.389 0.0022
Age at date of first contact with CJS, squared 0.000165 0.000051 10.3973 0.0013
Age at date of index offence -0.0427 0.0107 15.8545 <.0001
Age at date of index offence, squared 0.000231 0.000145 2.5364 0.1113
Previous offences: Sexual (child) 0.0303 0.018 2.829 0.0926
Previous offences: Fraud and Forgery 0.0131 0.0073 3.2228 0.0726
Previous offences: Drink driving offences 0.0386 0.024 2.5829 0.108
Previous offences: Criminal damage -0.0286 0.0119 5.8049 0.016
Total number of previous cautions 0.0181 0.0138 1.7298 0.1884
Total number of previous convictions -0.00028 0.00122 0.0527 0.8185
Total number of convictions in year prior to index offence -0.0113 0.00697 2.6355 0.1045
Copas rate -0.1323 0.044 9.0413 0.0026
Job density 0.0499 0.0204 5.9914 0.0144
Number of weeks receiving Jobseeker's Allowance in year prior to custody 0.00234 0.00169 1.931 0.1647
Weeks in P45 employment in year prior to custody 0.019 0.00124 233.9851 <.0001
Number of weeks spent on a DWP employment programme 0.00726 0.0022 10.8695 0.001
Number of weeks receiving Income Support in year prior to custody -0.00862 0.00259 11.1059 0.0009
Attended Drug Treatment Programme while in custody -0.1779 0.081 4.829 0.028
No problems with financial management 0.094 0.0578 2.6415 0.1041
No problems with work skills -0.105 0.0634 2.7388 0.0979
Illegal income from criminal activity: Some problems -0.1506 0.0526 8.2133 0.0042
No problems with unemployment -0.2676 0.0672 15.855 <.0001
Index offence: Drug offences 0.1633 0.0638 6.5519 0.0105
Index offence: Fraud and Forgery 0.311 0.1290 5.8177 0.0159
Index offence: Robbery 0.218 0.0664 10.7858 0.0010
Index offence: Sexual offences -0.1323 0.0915 2.0923 0.1480
Index offence: Violence 0.1287 0.0553 5.4245 0.0199
Ethnicity: Black -0.1183 0.0724 2.6741 0.1020
Ethnicity: Other (Not White, Black or Asian) 0.4522 0.2300 3.8661 0.0493
GOR: London -0.2337 0.0690 11.4799 0.0007
GOR: North East -0.2154 0.0922 5.4603 0.0195
GOR: North West -0.1102 0.0571 3.7269 0.0535
GOR: South West 0.1775 0.0913 3.7771 0.0520
GOR: Wales -0.1586 0.0924 2.9472 0.0860
GOR: West Midlands -0.1585 0.0685 5.3483 0.0207
Total criminogenic needs score -0.0436 0.0183 5.6555 0.0174
Criminogenic Needs Score: Education, Training and Employability -0.1953 0.0207 89.2392 <.0001
Criminogenic Needs Score: Drug Misuse -0.0237 0.0104 5.2379 0.0221
Criminogenic Needs Score: Alcohol Misuse 0.0326 0.0107 9.3022 0.0023
Criminogenic Needs Score: Atittudes -0.0396 0.0123 10.3005 0.0013
Logistic regression model predicting P45 employment after release foroffenders with sentences of less than one year.
Logistic regression model predicting P45 employment after release for offenders with sentences of one year or more.
43
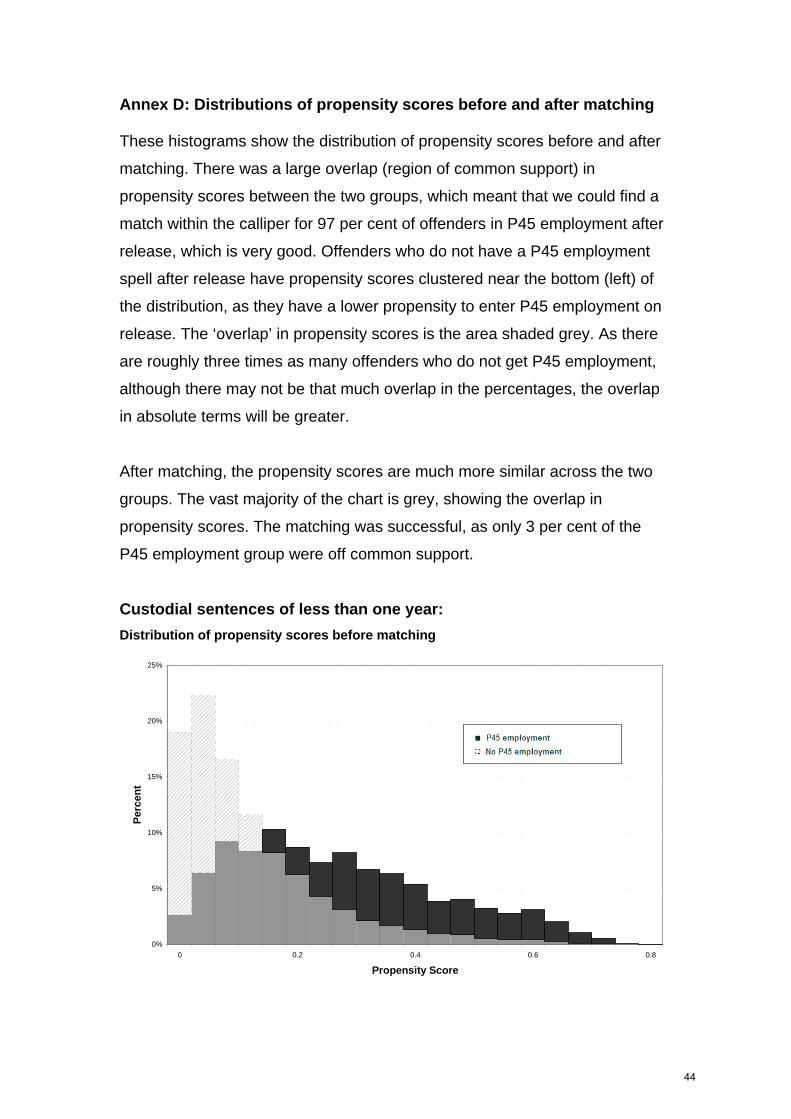
Annex D: Distributions of propensity scores before and after matching These histograms show the distribution of propensity scores before and after
matching. There was a large overlap (region of common support) in
propensity scores between the two groups, which meant that we could find a
match within the calliper for 97 per cent of offenders in P45 employment after
release, which is very good. Offenders who do not have a P45 employment
spell after release have propensity scores clustered near the bottom (left) of
the distribution, as they have a lower propensity to enter P45 employment on
release. The ‘overlap’ in propensity scores is the area shaded grey. As there
are roughly three times as many offenders who do not get P45 employment,
although there may not be that much overlap in the percentages, the overlap
in absolute terms will be greater.
After matching, the propensity scores are much more similar across the two
groups. The vast majority of the chart is grey, showing the overlap in
propensity scores. The matching was successful, as only 3 per cent of the
P45 employment group were off common support.
Custodial sentences of less than one year:
Distribution of propensity scores before matching
0%
5%
10%
15%
20%
25%
0 0.2 0.4 0.6 0.8
Propensity Score
Per
cen
t
44

Distribution of propensity scores after matching
0%
2%
4%
6%
8%
10%
12%
0 0.2 0.4 0.6 0.8
Propensity Score
Per
cen
t
Custodial sentences of one year or more: Distribution of propensity scores before matching
0%
2%
4%
6%
8%
10%
12%
14%
16%
18%
20%
0 0.2 0.4 0.6 0.8
Propensity Score
Pe
rce
nt
45

Distribution of propensity scores after matching
0%
2%
4%
6%
8%
10%
12%
0 0.2 0.4 0.6 0.8
Propensity Score
Per
cen
t
46

Annex E: Assessing balance after matching After the matching, it is important to assess how similar the two groups
(treatment (in P45 employment on release) and control (no P45 employment
on release)) are. This helps us gauge the quality of the matching. The two
groups should be identical on all characteristics except for P45 employment
on release. Standardised differences between the treatment and control group
of less than 10 per cent in each variable tell us that the groups are well-
balanced after the matching. The chart below shows all variables and their
standardised differences after matching. The tables below give variable
means and standardised differences before and after matching.
Glossary for chart: CJS Criminal Justice System CNS Criminogenic Needs Score Drugs (I/E/P/S) Import, Export, Production, Supply Drugs (P/SSS) Possession, Small Scale Supply DTP Drug Treatment Programme GOBP General Offending Behaviour
Programme P45 emp. P45 employment SOTP Sex Offender Treatment Programme
47

Characteristics before and after matching: sentences less than one year
0% 20% 30% 40% 50% 60% 70% 80%
CNS: Education, Training and EmployabilityOASys re-offending predictor
Weeks P45 emp. year prior to custodyCopas rate
Previous Offences: total convictionsTotal CNS
CNS: Drug MisuseAttitude to employment - No Problems
Weeks out-of-work benefits in year prior to custodyPrevious Offences: Theft
Employment History - Serious ProblemsEmployment History - No Problems
Previous Offences: Absconding/Bail OffencesCNS: Lifestyle and Associates
Previous Offences:year prior to custodyWeeks IB in year prior to custody
CNS: Health and Other ConsiderationsAttitude to employment - Some Problems
Previous Offences: Drugs (P/SSS)Illegal income - Serious problems
Previous Offences: HandlingFinancial Management - No Problems
CNS: AccommodationPrevious Offences: Violence
CNS: RelationshipsFinancial Situation - No Problems
Attitude to employment - Serious ProblemsIndex Offence: Theft and Handling
OASys violence predictorPrevious Offences: Domestic Burglary
Previous Offences: Other BurglaryAge at first contact with the CJS
Previous Offences: Criminal DamageCNS: Attitudes
Weeks IS in year prior to custodyFinancial Situation - Serious Problems
Previous Offences: Public OrderFinancial Management - Serious ProblemsAge at first contact with the CJS, squaredAny NOMS Accr. Intervention in custody
Illegal income - some problemsDTP in custody
FemalePrevious Offences: Robbery
Index Offence: ViolencePrevious Offences: Drugs (I/E/P/S)
Age at date of index offencePrevious Offences: Fraud and Forgery
Index Offence: Summary motoring offenceFinancial Management - Some Problems
Index Offence: BurglaryAge at date of index offence, squared
GOBP in custodyPrevious Offences: result in caution
Index Offence: Fraud and forgeryWeeks JSA year prior to custody
Financial Situation - Some ProblemsIndex Offence: Common Assault
GOR: East MidlandsGOR: London
Weeks ESA in year prior to custodyGOR: South EastGOR: North East
Index Offence: Other Indictable offenceGOR: East of England
Index Offence: Sexual OffenceEthnicity: Asian
Previous Offences: SexualCNS:Alcohol Misuse
GOR: North WestGOR: South West
GOR: Yorkshire and the HumberStandardized Job Density in Local Authority
Ethnicity: OtherIndex Offence: Robbery
Previous Offences: Drink DrivingIndex Offence: Drug Offences
GOR: WalesGOR: West Midlands
Index Offence: Public Order OffenceWeeks DWP Programme year prior to custody
Index Offence: Other summary offenceEmployment History - Some Problems
Index Offence: Criminal DamageEthnicity: Black
Previous Offences: Sexual (Child)10%
Absolute standardised differences
48

Characteristics of offenders before and after matching: sentences less than one year
Before Matching After Matching
No P45 P45 absolute No P45 P45 absolute
Employment (Control group)
Employment (Treatment group)
standardised difference
Employment (Control group)
Employment (Treatment group)
standardised difference
N: 12,190 2,360 2,298 2,298
Female 11.60% 6.40% 18% 6.60% 6.40% 1%
Black 7.70% 7.60% 0% 7.90% 7.70% 1%
Asian 4.30% 5.30% 5% 5.70% 5.40% 2%
Other 0.50% 0.80% 3% 1.00% 0.70% 3%
Criminal History:
Age at first contact with the CJS 17.5 19.5 27% 19.7 19.4 4%
Age at first contact with the CJS, squared 348.7 454.7 23% 462.6 447.8 3%
Age at date of index offence 29.8 28.4 15% 29.1 28.5 7%
Age at date of index offence, squared 978.6 901.5 12% 945.6 902.4 6%
Index Offence: Burglary 6.3% 3.7% 12% 4.0% 3.8% 1%
Index Offence: Common Assault 11.1% 13.6% 8% 14.8% 13.7% 3%
Index Offence: Criminal Damage 2.8% 2.7% 1% 2.3% 2.7% 2%
Index Offence: Drug Offences 3.2% 3.6% 2% 3.4% 3.5% 1%
Index Offence: Fraud and forgery 1.8% 3.2% 9% 3.6% 3.1% 3%
Index Offence: Other Indictable offence 13.2% 15.2% 6% 15.6% 15.0% 2%
Index Offence: Other summary offence 6.0% 5.7% 1% 5.1% 5.7% 2%
Index Offence: Public Order Offence 2.3% 2.5% 2% 2.7% 2.6% 1%
Index Offence: Robbery 0.6% 0.8% 3% 0.7% 0.8% 2%
Index Offence: Sexual Offence 0.7% 1.1% 5% 1.6% 1.2% 4%
Index Offence: Summary motoring offence 8.4% 12.5% 13% 12.6% 12.5% 0%
Index Offence: Theft and Handling 27.3% 15.0% 30% 12.8% 15.3% 7%
Index Offence: Violence 12.0% 17.5% 16% 17.1% 17.3% 1%
Mean number of previous offences:
Previous Offences: Violence 3.5 2.4 31% 2.3 2.4 4%
Previous Offences: Robbery 0.3 0.1 18% 0.1 0.1 1%
Previous Offences: Public Order 2.0 1.2 24% 1.1 1.2 2%
Previous Offences: Sexual 0.1 0.0 5% 0.1 0.0 4%
Previous Offences: Sexual (Child) 0.1 0.1 0% 0.1 0.1 1%
Previous Offences: Domestic Burglary 1.1 0.5 29% 0.5 0.5 2%
Previous Offences: Other Burglary 1.6 0.8 28% 0.8 0.8 1%
Previous Offences: Theft 8.8 2.9 53% 2.6 3.0 6%
Previous Offences: Handling 1.0 0.4 33% 0.4 0.4 0%
Previous Offences: Fraud and Forgery 1.1 0.7 14% 0.7 0.7 0%
Previous Offences: Drink Driving 0.5 0.6 3% 0.5 0.6 5%
Previous Offences: Criminal Damage 2.1 1.4 27% 1.4 1.4 1% Previous Offences: Drugs (Import/Export/Production/Supply)
0.1 0.1 15% 0.1 0.1 6%
Previous Offences: Drugs (Possession/Small Scale Supply)
1.5 0.8 37% 0.9 0.8 5%
Previous Offences: Absconding or Bail Offences 3.5 1.9 45% 1.8 1.9 3%
Previous Offences that resulted in a caution 1.5 1.3 11% 1.3 1.3 0% Previous Offences that resulted in a court conviction 38.5 19.4 61% 18.8 19.8 4%
Previous Offences in year prior to custody 4.9 3.0 43% 2.8 3.1 9%
Copas rate -0.4 -0.9 63% -0.9 -0.9 7%
49

Interventions: Received the Drug Treatment Programme in custody 6.50% 2.50% 20% 2.20% 2.50% 2% Received the General Offending Behaviour Programme in custody 2.00% 0.70% 11% 0.50% 0.70% 2%
Received any Prison Accredited Intervention 8.00% 3.00% 22% 2.60% 3.10% 3%
Government Office Region:
East Midlands 9% 11% 7% 10% 11% 2%
East of England 8% 10% 5% 9% 10% 3%
London 11% 9% 7% 10% 9% 4%
North East 6% 5% 6% 4% 5% 1%
North West 16% 14% 4% 15% 14% 2%
South East 11% 13% 6% 13% 13% 1%
South West 7% 8% 4% 7% 7% 1%
Wales 6% 6% 2% 7% 6% 3%
West Midlands 12% 11% 2% 12% 11% 3%
Yorkshire and the Humber 11% 10% 4% 9% 10% 2% Labour Market:
Standardised Job Density in Local Authority 0.0 0.0 3% 0.0 0.0 4%
Weeks in P45 employment in year prior to custody 4.3 15.4 65% 14.2 14.6 2% Weeks receiving Jobseeker's Allowance in year prior to custody 9.7 8.5 8% 8.4 8.7 3%
Weeks in DWP Programme in year prior to custody 2.6 2.7 2% 2.6 2.8 2% Weeks receiving Incapacity Benefit in year prior to custody 10.5 3.5 43% 4.3 3.6 6% Weeks receiving Employment and Support Allowance in year prior to custody 0.2 0 7% 0.1 0 3% Weeks receiving Income Support in year prior to custody 4.2 1.6 25% 2 1.6 5% Weeks receiving out-of-work benefits in year prior to custody 24.8 13.6 55% 14.8 14 4%
OASys Assessment:
OASys re-offending predictor 60.9 44.9 70% 44.2 45.5 6%
OASys violence predictor 39.9 34.5 30% 33.3 34.8 9%
Illegal income - some problems 21% 14% 20% 14% 14% 1%
Illegal income - Serious problems 24% 11% 35% 11% 11% 2%
Financial Management - No Problems 32% 47% 32% 49% 47% 4%
Financial Management - Some Problems 41% 35% 12% 35% 36% 2%
Financial Management - Serious Problems 27% 17% 23% 17% 18% 3%
Employment History - No Problems 15% 37% 51% 37% 36% 2%
Employment History – Some Problems 46% 46% 1% 47% 47% 1%
Employment History - Serious Problems 39% 17% 51% 16% 17% 2%
Attitude to employment – No Problems 45% 72% 56% 72% 71% 1%
Attitude to employment - Some Problems 41% 23% 39% 24% 24% 0%
Attitude to employment - Serious Problems 14% 5% 31% 4% 5% 3%
Financial Situation - No Problems 27% 41% 31% 42% 41% 3%
Financial Situation - Some Problems 42% 38% 8% 37% 39% 3%
Financial Situation – Serious Problems 31% 20% 24% 21% 20% 0%
Accommodation Criminogenic Score 3.1 2.1 32% 2.1 2.2 4% Education, Training and Employability Criminogenic Needs Score 4.5 2.8 73% 2.8 2.9 3%
Relationships Criminogenic Needs Score 2.6 2.0 31% 2.0 2.1 3%
Lifestyle and Associates Criminogenic Needs Score 3 2.3 44% 2.2 2.3 4%
Drug Misuse Criminogenic Needs Score 3.3 1.7 57% 1.6 1.7 5%
Alcohol Misuse Criminogenic Needs Score 3 2.8 4% 2.7 2.9 5%
Attitudes Criminogenic Needs Score 4.6 4.1 25% 4.1 4.1 2% Health and Other Considerations Criminogenic Needs Score 3.1 2.2 43% 2.2 2.3 5%
Total Criminogenic Needs Score 5.3 4.1 60% 4 4.1 4%
50

Characteristics before and after matching: sentences of one year or more
0% 20% 30% 40% 50% 60% 70%
CNS: Education, Training and EmployabilityOASys re-offending predictor
Total CNSWeeks P45 emp. year prior to custody
Copas rateEmployment History - No Problems
Employment History - Serious ProblemsAttitude to employment - No ProblemsCNS: Health and Other Considerations
Previous Offences: total convictionsCNS: Drug Misuse
CNS: Lifestyle and AssociatesOASys violence predictor
CNS: AttitudesAttitude to employment - Some Problems
Weeks out-of-work benefits in year prior toPrevious Offences: Absconding/Bail Offences
Previous Offences: Theft Previous Offences: Violence
CNS: RelationshipsCNS: Accommodation
Attitude to employment - Serious ProblemsPrevious Offences: Criminal Damage
Previous Offences: Domestic BurglaryIllegal income - Serious problems
Previous Offences: HandlingPrevious Offences: Other Burglary
Financial Management - No ProblemsAge at first contact with the CJS
Previous Offences: Drugs (P/SSS)Index Offence: Burglary
Previous Offences:year prior to custodyFinancial Situation - No Problems
Age at first contact with the CJS, squaredWeeks IB in year prior to custody
Financial Management - Serious ProblemsPrevious Offences: Public Order
Previous Offences: RobberyFinancial Situation - Serious Problems
Index Offence: ViolenceWeeks IS in year prior to custody
DTP in custodyAny NOMS Accr. Intervention in custody
Illegal income - some problemsWeeks JSA year prior to custody
Financial Management - Some ProblemsIndex Offence: Fraud and forgery
Previous Offences: Fraud and ForgeryCNS:Alcohol Misuse
Age at date of index offenceEthnicity: AsianEthnicity: Black
Previous Offences: Drink DrivingFinancial Situation - Some Problems
Index Offence: Theft and HandlingGOR: South WestGOR: North East
Previous Offences: Drugs (I/E/P/S)Previous Offences: Sexual
Age at date of index offence, squaredEthnicity: Other
GOBP in custodyPrevious Offences: result in caution
GOR: East of EnglandGOR: London
GOR: South EastIndex Offence: Sexual Offence
GOR: East MidlandsIndex Offence: Public Order Offence
GOR: West MidlandsStandardized Job Density in Local AuthorityIndex Offence: Summary motoring offence
Weeks ESA in year prior to custodyGOR: North West
GOR: WalesIndex Offence: Drug Offences
Weeks DWP Programme year prior to custodyEmployment History - Some Problems
Index Offence: RobberyIndex Offence: Criminal Damage
Index Offence: Other summary offenceIndex Offence: Other Indictable offence
Index Offence: Common AssaultGOR: Yorkshire and the Humber
SOTP in custodyFemale
Previous Offences: Sexual (Child)10%
Absolute standardised differences
51

Characteristics of offenders before and after matching: sentences of one year or more
Before Matching After Matching
No P45 employment (Control group)
P45 employment (Treatment group)
absolute standardised difference
No P45 employment (Control group)
P45 employment (Treatment group)
absolute standardised difference
N: 12,320 3,753 3,622 3,622
Female 6% 6% 0% 6% 6% 1%
Black 11% 9% 7% 10% 9% 2%
Asian 5% 6% 7% 6% 6% 1%
Other 0% 1% 5% 1% 1% 3%
Criminal History:
Age at first contact with the CJS 17.9 20 23% 20.3 19.9 4%
Age at first contact with the CJS, squared 385.1 500.1 19% 516.7 494.8 3%
Age at date of index offence 31.4 30.6 8% 31.2 30.7 5%
Age at date of index offence, squared 1097.3 1053.9 5% 1093.9 1059 4%
Index Offence: Burglary 19% 12% 21% 11% 12% 3%
Index Offence: Common Assault 1% 1% 1% 1% 1% 1%
Index Offence: Criminal Damage 2% 2% 1% 2% 2% 1%
Index Offence: Drug Offences 15% 16% 2% 17% 16% 3%
Index Offence: Fraud and forgery 2% 3% 10% 3% 3% 1%
Index Offence: Other Indictable offence 11% 11% 1% 11% 11% 1%
Index Offence: Other summary offence 1% 0% 1% 0% 0% 1%
Index Offence: Public Order Offence 0% 0% 3% 0% 0% 3%
Index Offence: Robbery 12% 13% 1% 13% 13% 1%
Index Offence: Sexual Offence 7% 8% 4% 9% 8% 4%
Index Offence: Summary motoring offence 1% 1% 3% 1% 1% 0%
Index Offence: Theft and Handling 6% 5% 7% 5% 5% 1%
Index Offence: Violence 20% 27% 15% 26% 26% 0%
Mean number of previous offences:
Previous Offences: Violence 2.9 2.0 29% 2.0 2.0 3%
Previous Offences: Robbery 0.4 0.2 17% 0.2 0.2 1%
Previous Offences: Public Order 1.3 0.9 17% 0.9 0.9 5%
Previous Offences: Sexual 0.1 0.1 5% 0.1 0.1 2%
Previous Offences: Sexual (Child) 0.1 0.1 0% 0.1 0.1 2%
Previous Offences: Domestic Burglary 1.9 1.0 27% 1.0 1.0 0%
Previous Offences: Other Burglary 1.9 1.0 25% 1.0 1.0 1%
Previous Offences: Theft 5.3 2.9 29% 2.6 3.0 7%
Previous Offences: Handling 1.1 0.6 25% 0.6 0.6 2%
Previous Offences: Fraud and Forgery 1.0 0.7 8% 0.6 0.7 4%
Previous Offences: Drink Driving 0.4 0.3 7% 0.3 0.3 3%
Previous Offences: Criminal Damage 1.7 1.1 27% 1.1 1.1 2% Previous Offences: Drugs (Import/Export/Production/Supply) 0.2 0.1 6% 0.1 0.1 1% Previous Offences: Drugs (Possession/Small Scale Supply) 1.4 0.9 22% 0.9 1.0 2%
Previous Offences: Absconding or Bail Offences 2.1 1.3 29% 1.3 1.4 3%
Previous Offences that resulted in a caution 1.1 1.0 5% 1.0 1.1 4% Previous Offences that resulted in a court conviction 32.1 19.0 42% 18.3 19.6 5%
52

Previous Offences in year prior to custody 2.4 1.7 21% 1.5 1.7 6%
Copas rate -0.8 -1.2 44% -1.2 -1.2 6%
Interventions: Received the Drug Treatment Programme in custody 10% 6% 14% 6% 6% 1% Received the General Offending Behaviour Programme in custody 6% 5% 5% 4% 5% 3%
Received the Sex Offender Treatment Programme 0% 0% 0% 1% 0% 4%
Received any Prison Accredited Intervention 14% 10% 13% 10% 10% 2%
Government Office Region:
East Midlands 8% 9% 4% 9% 9% 1%
East of England 7% 8% 4% 8% 8% 2%
London 13% 11% 4% 13% 12% 4%
North East 6% 5% 6% 5% 5% 1%
North West 18% 17% 2% 16% 17% 2%
South East 10% 12% 4% 11% 12% 1%
South West 4% 6% 6% 6% 6% 1%
Wales 6% 5% 2% 5% 5% 1%
West Midlands 11% 10% 3% 10% 10% 1%
Yorkshire and the Humber 11% 12% 1% 11% 11% 1%
Labour Market:
Standardised Job Density in Local Authority 0 0 3% 0 0 0%
Weeks in P45 employment in year prior to custody 4.9 13.2 49% 12.2 12.1 1% Weeks receiving Jobseeker's Allowance in year prior to custody 7.8 6.4 11% 6.5 6.6 1%
Weeks in DWP Programme in year prior to custody 1.9 2 2% 2 2.1 0% Weeks receiving Incapacity Benefit in year prior to custody 7.9 5 19% 5.6 5.1 3% Weeks receiving Employment and Support Allowance in year prior to custody 0.1 0.1 3% 0.1 0.1 1% Weeks receiving Income Support in year prior to custody 2.6 1.3 15% 1.5 1.4 2% Weeks receiving out-of-work benefits in year prior to custody 18.7 12.8 31% 13.9 13.2 4%
OASys Assessment:
OASys re-offending predictor 52.2 39.5 52% 39 40 5%
OASys violence predictor 34.8 29 33% 28 29 7%
Illegal income - some problems 22% 17% 12% 17% 18% 1%
Illegal income - Serious problems 31% 20% 25% 21% 20% 1%
Financial Management - No Problems 38% 50% 24% 51% 49% 4%
Financial Management - Some Problems 40% 35% 10% 34% 35% 3%
Financial Management - Serious Problems 22% 15% 18% 15% 15% 2%
Employment History - No Problems 20% 40% 44% 40% 38% 2%
Employment History - Some Problems 43% 42% 2% 42% 43% 2%
Employment History - Serious Problems 37% 18% 44% 18% 18% 0%
Attitude to employment - No Problems 54% 75% 44% 74% 74% 1%
Attitude to employment - Some Problems 35% 22% 31% 22% 22% 1%
Attitude to employment - Serious Problems 10% 4% 27% 4% 4% 1%
Financial Situation - No Problems 36% 46% 21% 47% 45% 3%
Financial Situation - Some Problems 40% 36% 7% 35% 37% 4%
Financial Situation - Serious Problems 24% 18% 17% 18% 18% 1%
Accommodation Criminogenic Score 3.0 2.1 28% 2.1 2.2 2% Education, Training and Employability Criminogenic Needs Score 4.2 2.9 57% 3.0 3.0 1%
Relationships Criminogenic Needs Score 2.4 1.9 28% 1.9 1.9 3%
Lifestyle and Associates Criminogenic Needs Score 3.1 2.5 37% 2.5 2.5 4%
53

Drug Misuse Criminogenic Needs Score 2.9 1.8 40% 1.8 1.9 3%
Alcohol Misuse Criminogenic Needs Score 2.1 1.9 8% 1.8 1.9 5%
Attitudes Criminogenic Needs Score 4.3 3.6 33% 3.6 3.7 2% Health and Other Considerations Criminogenic Needs Score 2.8 2.0 43% 2.0 2.1 2%
Total Criminogenic Needs Score 4.9 3.8 52% 3.8 3.9 4%
54

Annex F: Testing the difference in re-offending rates The tables below show whether matched pairs are concordant (both offenders
within the pair do re-offend, or both do not re-offend) or discordant, and the
direction of the effect of P45 employment. Where the pairs are discordant,
there are more pairs where comparison group member re-offends but the
offender with a P45 employment spell does not, than the reverse. This
suggests that P45 employment reduces the likelihood of re-offending.
A: Custodial sentences less than one year P45 Employment group Comparison Group No proven re-offence
within one year Proven re-offence within one year
No proven re-offence within one year
979 361
Proven e-offence within one year
578 380
McNemar’s Test Statistic (S) 50.1480DF 1Asymptotic Pr > S <0.0001Exact 1.4 x10⁻¹² There is not a clear consensus in the literature about whether or not paired
tests should be used to test for differences between the matched groups in
PSM; therefore we also used independent samples t-tests to test for
significance. The t-test also showed that re-offending was significantly lower in
the P45 employment group than in the matched comparison group; t (4581)
=6.67, p<0.0001.
55

Sensitivity testing for difference in re-offending rates (using McNemar’s test29) – testing for effect of unobserved variable: Sensitivity Analysis I The upper bound of the p value can tell us whether the effect of P45
employment on release would be significant, even if there was an unobserved
variable which increased the odds of P45 employment on release by 5 per
cent, 10 per cent, 15 per cent etc. In our analysis, even if there was an
unobserved variable which increased the odds of employment on release by
25 per cent, P45 employment would still have a significant effect on reducing
re-offending.
Gamma P + p - p (lower
bound) p (upper bound)
1.00 0.50000 0.50000 8.9 x10⁻¹³ 8.9 x10⁻¹³ 1.05 0.51220 0.48780 3.1 x10⁻¹⁵ 8.9 x10⁻¹³ 1.10 0.52381 0.47619 0 0.000000012 1.15 0.53488 0.46512 0 0.000000523 1.20 0.54545 0.45455 0 0.000012337 1.25 0.55556 0.44444 0 0.000174846
The upper bound reflects the highest possible value of p when we introduce
an unobserved binary variable which increases the odds of P45 employment
on release. If p becomes greater than 0.05 we can no longer conclude that
P45 employment has a statistically statistical effect on re-offending.
B: Custodial sentences of one year or more P45 Employment group Comparison Group No proven re-offence
within one year Proven re-offence within one year
No proven re-offence within one year
2,262 476
Proven re-offence within one year
680 204
McNemar’s Test Statistic (S) 36.0000DF 1Asymptotic Pr > S <.0001Exact 2.2 x10⁻⁹
29 McNemar’s test is used to compare proportions (such as re-offending rates) in paired data.
56

An independent samples t-test also showed that re-offending was significantly
lower in the P45 employment group than in the matched comparison group;
t (7,177)= 5.84, p<0.0001.
Sensitivity testing for difference in re-offending rates Even if there was an unobserved variable which increased the odds of
employment on release by 25 per cent, P45 employment on release would still
have a significant effect on reducing re-offending.
Gamma P + p - p (lower
bound) p (upper bound)
1.00 0.50000 0.50000 1.5 x10⁻⁹ 0.000000 1.05 0.51220 0.48780 6.3 x10⁻⁹ 0.000000 1.10 0.52381 0.47619 1.8 x10⁻¹⁴ 0.000009 1.15 0.53488 0.46512 0 0.000235 1.20 0.54545 0.45455 0 0.003083 1.25 0.55556 0.44444 0 0.023152 Hazard ratios
Cox proportional hazard models were fitted to the matched samples, so that
we could obtain hazard ratios for re-offending.
As the propensity score matched sample does not consist of independent
observations, we used a Cox proportional hazards model that stratified on the
matched pairs (Cummings, McKnight, & Greenland, 2003). This approach
accounts for the within-pair homogeneity by allowing the baseline hazard
function to vary across matched sets. We also fit a Cox proportional hazard
model with robust standard errors (Lin & Wei, 1989) to ensure that the hazard
ratio was fairly similar when using either choice of suitable model.
The hazard ratio is an expression of the hazard or chance of re-offending for
offenders who entered P45 employment after release as a ratio of the hazard
of re-offending occurring in the matched comparison group. For us to be able
to say with confidence that re-offending occurs earlier in the absence of a P45
employment spell after release, the hazard ratio must be less than one and
the upper limit of the 95% confidence interval of the hazard ratio must also be
less than 1, which is the case for both samples in this analysis. The hazard
57

ratio also allows us to calculate the probability that an offender with a P45
employment spell after release will re-offend before an offender from the
matched comparison group30.
Sentences less than one year The only predictor variable in the Cox proportional hazard model was P45
employment on release, stratified on the matched pairs. The hazard ratio for
P45 employment compared to no P45 employment was 0.62 (95% CI=[0.56,
0.70], p<0.0001). This corresponds to a 38 per cent chance of an offender in
P45 employment re-offending before an offender from the matched
comparison group.
When the alternative univariate Cox proportional hazards model was fit and a
robust variance estimate was obtained, the associated hazards ratio was 0.69
(95% CI=[0.63,0.76], p<0.0001). This corresponds to a 41 per cent chance of
an offender in P45 employment re-offending before an offender in the
matched comparison group.
This shows that offenders with P45 employment have a lower hazard of re-
offending than the matched comparison group and that the hazards ratio is
fairly similar in both models.
Sentences of one year or more When we fitted a Cox proportional hazard model which was stratified on the
matched pairs, the hazard ratio for P45 employment compared to no P45
employment was 0.70 (95% CI=[0.62, 0.78], p<0.0001). This corresponds to a
41 per cent chance of an offender in P45 employment re-offending before an
offender from the matched comparison group.
When we fitted a univariate Cox proportional hazards model with a robust
variance estimate, the associated hazards ratio was 0.72 (95%
CI=[0.66,0.80], p<0.0001). This corresponds to a 42 per chance of an
30 This can be calculated by Probability = (hazard ratio) / (1 + hazard ratio)
58

offender in P45 employment re-offending before an offender from the matched
comparison group.
For custodial sentences of greater than one year, offenders with P45
employment have a lower hazard of re-offending than the matched
comparison group and the hazards ratio is very similar in both models.
59

Annex G: Benefit and P45 employment status of all offenders released from custody and offenders serving sentences in the community in 2008 The analysis in the main body of this publication presents findings on the
impact P45 employment has on re-offending for a sample of offenders
released from prison in 2008.
To improve the quality of the matching and analysis, only offenders who had
an OASys assessment were included in the analysis -these tend to be the
more serious offenders with higher needs31. However, the key limitation of
restricting the analysis to offenders with OASys assessments is that it means
that the findings can not be generalised to all prisoners.
In addition, the analysis focused on offenders released from custody. The
methodology used was not found to be appropriate to extend the analysis to
see the impact employment has on re-offending for offenders serving
sentences in the community.
Therefore, the following descriptive statistics are included to provide
contextual information on the benefit and P45 employment status of all
offenders released from prison in 2008 (i.e. not just those with an OASys
assessment) and those sentenced to serving sentences in the community in
2008.
The descriptive statistics show the benefit and P45 employment status of
offenders up to two years before and after their sentence.
Key findings
Offenders serving custodial sentences
Benefit status:
Around half of all offenders released from custody in 2008 claimed
benefits on release – 51 per cent of all offenders released from custody
in 2008 were claiming benefits one week after release, with 50 per cent
claiming benefits two years after release
31 See Chapter 2 of publication for further information on the difference between offenders given an OASys assessment and those offenders who are not.
60

During the two year period after release from custody in 2008, 82 per
cent of offenders made a new benefit claim at some point in those two
years.
Offenders serving custodial sentences of under twelve months are
slightly more likely to be claiming benefits than those offenders serving
custodial sentences of twelve or more months - particularly a few years
after release from prison:
o 52 per cent of offenders serving custodial sentences of under
twelve months were claiming benefits one week after release in
2008, with 53 per cent of these offenders claiming benefits two
years after release.
o 50 per cent of offenders serving custodial sentences of twelve
months or more were claiming benefits one week after release in
2008, falling to 44 per cent of offenders claiming benefits two
years after release.
P45 employment status:
Around 5 per cent of offenders released from custody in 2008 are in
some form of P45 employment a few weeks after release from prison.
The proportion in P45 employment increases to 15 per cent of
offenders in P45 employment two years following release from custody.
During the two year period following release from custody overall, 29
per cent of offenders started P45 employment at some point.
Offenders serving custodial sentences of twelve months or more are
slightly more likely to be in P45 employment than offenders serving
shorter sentences. 14 per cent of offenders serving custodial sentences
of under twelve months were in P45 employment two years after
release, compared to 18 per cent of offenders serving longer custodial
sentences.
61

P45 employment and benefit status of offenders released from custody in 2008 – by sentence length: Under one year sentences (<12 month), one year or more sentences (>=12 months)
0%
10%
20%
30%
40%
50%
60%
-10
4
-97
-90
-83
-76
-69
-62
-55
-48
-41
-34
-27
-20
-13 -6 6
13
20
27
34
41
48
55
62
69
76
83
90
97
10
4
Weeks before prison reception Weeks after prison release
Pro
po
rtio
n o
f o
ffen
der
s
% claiming benefits: < 12 month custodial sentences% claiming benefits: >=12 months custodial sentences% in P45 Employment: < 12 month custodial sentences% in P45 Employment: >=12 months custodial sentences
Pri
son
sp
ell
44% of offenders serving custodial sentences of one year or more were claiming benefits 2 years (104 weeks) after release from prison
Note: This chart tracks offenders’ benefit and P45 employment status for two
years prior to prison reception date, and two years after release from prison.
The “prison spell” bar in the chart indicates the time offenders spent in prison
but is for illustration purposes only to show that it is not a continuous period.
Offenders serving sentences in the community
Benefit status:
44 per cent of offenders sentenced to a community sentence or
suspended sentence order (SSO) in 2008 were claiming benefits at the
time of sentence, with 51 per cent claiming benefits two years after the
sentence date.
62

During the two year period following their sentence date, 77 per cent of
offenders serving sentences in the community made a new benefit
claim at some point.
P45 employment status:
Offenders serving sentences in the community (Community sentences
and SSOs) in 2008 were more likely to be in P45 employment than
offenders released from custodial sentences. A quarter of offenders
sentenced to sentences in the community were in P45 employment at
the time of sentence, compared to 30 per cent in P45 employment two
years after their sentence date.
During the two year period following their sentence date, 51 per cent of
offenders serving sentences in the community were in P45 employment
at some point.
The table below provides a cumulative measure of benefit and P45
employment status over the two year period for offenders released from
prison in 2008, or sentenced to a community sentence/SSO in 2008. This
does not mean that the offender was claiming benefits, or in P45 employment
at the two year point following release from prison / sentence date – just that
they had one (or more) of those statuses at some point in the two years
following release / sentence date.
Proportion of offenders released from custody or starting community sentences in 2008 who claimed benefits or were in P45 employment at some point in the two years following release / sentence date
Claimed benefits In P45 Employment
Offenders released from custody in 2008:Under 12 month custodial sentences 83% 30%Twelve month or more custodial sentences 79% 34%All offenders released from custody 82% 31%
77% 51%Offenders starting community sentences in 2008 (Community Sentences /Suspended Sentence Orders)
Proportion of offenders who either claimed benefits or were in P45 employment at some
point in the two years after release from custody, or sentence date
63

These descriptive statistics relate to offenders released from custody or who
started a community sentence (including an SSO) in 2008 to allow enough
time to track the benefit and P45 employment status up to two years after
release / sentence date. However, we know that the actual proportion of
offenders claiming benefits has increased since 200832, which we think is due
to the recession – in line with the increase in the proportion of the general
population who claim benefits.
Please contact us if you would like further information on the benefit and P45
employment status of offenders. We will be extending this analysis in future
with the new ongoing data share between MoJ, DWP and HMRC. We would
be grateful for any feedback or suggestions for further analysis using our
linked data.
32 See Chapter 2 of “Offending, employment and benefits – emerging findings from the data linkage project”
64

Contact points for further information
Press enquiries should be directed to the Ministry of Justice press office:
Media Enquiries: 020 3334 3536 Out-of-hours: 07659 173270 Website: www.justice.gov.uk/
Ideas and advice or any enquiries about this analysis should be directed to:
Justice Statistics Analytical Services 7th Floor, 102 Petty France, London SW1H 9AJ Tel: 020 3334 3737 E-mail: [email protected]
General enquiries about the statistical work of the Ministry of Justice can also be e-mailed to: [email protected]
© Crown copyright
Produced by the Ministry of Justice Alternative formats are available on request from [email protected]
65