Embed Size (px)
Citation preview
© 2018 IBRACON
Volume 11, Number 5 (October 2018) p. 1122 – 1150 • ISSN 1983-4195http://dx.doi.org/10.1590/S1983-41952018000500012
Analysis of the influence of column reinforcement anchorage length in a concrete two-pile cap
Análise da influência do comprimento de ancoragem da armadura do pilar no bloco sobre duas estacas
a University of Campinas, Civil Engineering, Architecture and Urbanism School, Campinas, SP, Brazil;b Jahu School of Tecnology, Jaú, SP, Brazil.
Received: 20 Jul 2017 • Accepted: 15 May 2018 • Available Online:
This is an open-access article distributed under the terms of the Creative Commons Attribution License
R. P. RANDI a
L. C. ALMEIDA a
L. M. TRAUTWEIN a
F. S. MUNHOZ b
Abstract
Resumo
This paper describes the parametric analysis applied to assess the influence of column anchorage-reinforcement length on concrete two-pile caps under uniform compression. The non-linear numerical analysis was conducted with the bi-dimensional elements of ATENA 2D software, consid-ering perfect adherence between steel and concrete. Simulation was based on the experimental reference model by Munhoz [1], which was the parameter adopted to validate the numerical modeling. From the validated model, four different anchorage reinforcement lengths were adopted, 34,0 cm, 20,0 cm, 10,0 cm e 3,0 cm, in order to compare pile caps behavior after these changes. Pile cap simulations presented similar behavior, i.e., column anchorage reinforcement length is not a preponderant factor for the internal mechanisms that regulate the function of these elements.
Keywords: reinforced concrete, pile caps, anchorage, numerical analysis, finite elements.
Este artigo analisa parametricamente a influência do comprimento da armadura de ancoragem do pilar em um bloco de concreto sobre duas estacas, submetido à compressão uniforme. A análise numérica não linear é realizada com o emprego dos elementos finitos bidimensionais do programa computacional ATENA 2D, considerando aderência perfeita entre aço e concreto. A simulação é baseada em um modelo expe-rimental de referência, oriundo da pesquisa de Munhoz [1], utilizado como parâmetro para validar a modelagem numérica. A partir do modelo validado, adotaram-se quatro comprimentos diferentes de ancoragem das armaduras do pilar, sendo 34,0 cm, 20,0 cm, 10,0 cm e 3,0 cm, a fim de comparar o comportamento dos blocos após essas alterações. As simulações dos blocos apresentaram comportamentos semelhantes, ou seja, o comprimento das armaduras de ancoragem dos pilares não é um fator preponderante para os mecanismos de funcionamento interno desses elementos.
Palavras-chave: concreto armado, blocos sobre estacas, anccoragem, análise numérica, elementos finitos.
1. Introduction
The theory by Blévot & Frémy [2] is the most accepted and wide-spread one to describe pile cap behavior, since their study became a reference for other researchers and codes. The Strut and Tie Model is their main contribution to this field, because it consistently explains the cap stress flows. According to the aforementioned au-thors, most tested models failed due to struts concrete crushes after cracks emerged parallel to the compressive stress flows. The tensile stress actions, perpendicular to the struts caused these cracks. Such process is also known as splitting effect.Studies performed in the following decades corroborated assert-ively these conclusions. With the computer software evolution and the Finite Elements Method allowed a refined analysis about the behavior of pile caps.Mautoni [3] deepened the studies about pile cap failure mechanisms. Tests were performed with models in different reinforcement distribu-tions and also found that they failed due to struts concrete crushes (splitting effect), corroborating with Blévot & Frémy [2] results.Buttignol [4] performed numerical analysis based on Delalibera [5] and Miguel’s [6] experimental tests and also observed, as afore-mentioned authors, the splitting effect and compressive struts formation. Also according to Buttignol [4], the numerical and ex-perimental comparative results demonstrated the complexity of laboratorial tests reproduced in computers. Pile cap structural stiffness was one of the main differences found, and this finding was also observed by Delalibera [5], who recorded three factors to explain the greater stiffness observed in numerical models: ex-perimental model accommodation at test start, perfect adhesion between reinforcement bars and concrete, and the assumption of perfect connection between piles and cap.Related to this paper, compares will be performed between experi-mental and numerical pile caps with two piles, in order to validate the numerical simulation conducted in ATENA 2D software, in which experimental results come from results by Munhoz1s [1] research.
Specifically, the behavior of columns anchorage reinforcement will be analyzed. Papers about this subject remain scarce in the lit-erature. Notably Munhoz [1] analyzed, among other results, the influence of column sections and of different reinforcement rates on stress transmission between columns and pile caps. According to author’s analysis, column anchorage reinforcement strains and stress tend to decrease throughout the column’s length; however, they are transferred to the pile cap, after a certain depth, depend-ing on the columns’ transversal section and on reinforcement rate and distribution.
1.1 Justification
Pile caps are important structural elements of stress transition between superstructures and infrastructures. Main codes such as ACI 318 [7], CEB-FIP [8] and ABNT NBR6118/2014 [9] indicate the struts and the tie model applied to pile caps design. Therefore, further studies are essential to help better understanding the be-havior, since it would make pile caps designs more safe.Besides experimental tests, the advancement of computer soft-ware and the Finite Elements Method allowed many researchers to use numerical simulations in their studies. However, numerical analysis results must represent accurate structure behavior simu-lations. Therefore, experimental and numerical comparisons must be studied in order to understanding the convergence and diver-gence between models, aiming a better use of software.Related to this paper core, i.e., the behavior of column anchorage reinforcement in pile caps with two piles, this work is justified by the scarcity of researches in this subject. It is expected to improve the codes and to provide more accurate and economic models based on reliable reinforcement anchorage results.
2. Analysis methodology
Comparisons were performed on the behavior of pile caps with two piles. Numerical pile caps were modelled in the ATENA 2D
1123IBRACON Structures and Materials Journal • 2018 • vol. 11 • nº 5
R. P. RANDI | L. C. ALMEIDA | L. M. TRAUTWEIN | F. S. MUNHOZ
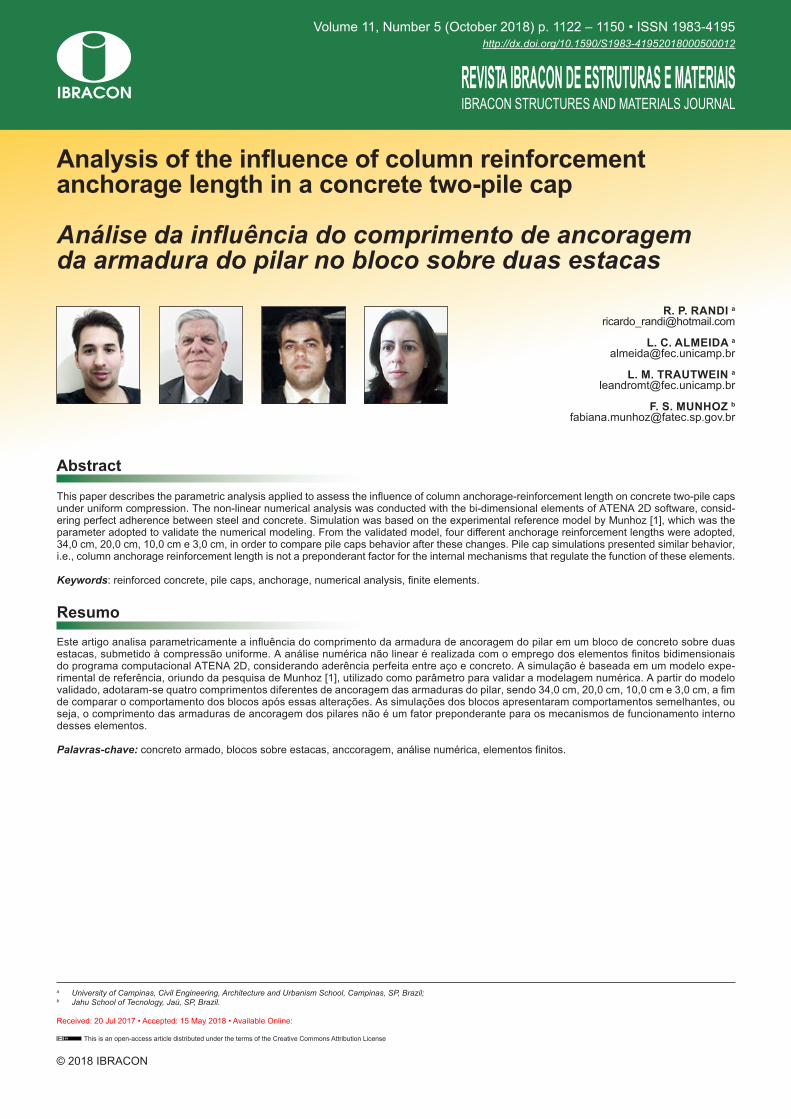
Figure 1Geometry, reinforcement dispose and strain gage location in analyzed model
1124 IBRACON Structures and Materials Journal • 2018 • vol. 11 • nº 5
Analysis of the influence of column reinforcement anchorage length in a concrete two-pile cap
software. Steel/concrete material properties and element ge-ometry were assessed based on experimental tests and on the B110P125R2.5 model by Munhoz [1].Pile cap model geometry is 110.0 cm x 15.0 cm x 40.0 cm, present-ed in Figure 1. Tie reinforcement is composed of four bars (12.5 mm) above the piles, superior reinforcement comprised three bars (10.0 mm) and pile caps reinforcement was completed with hori-zontal and vertical stirrups bars (6.3 mm). Piles presented 12.5 cm x 12.5 cm section, 40.0 cm height (5.0 cm inward the pile cap), 10.0 mm longitudinal reinforcement (inward the pile cap) and 5.0 mm stirrups along the pile. The column presented a 12.5 cm x 12.5 cm section and 35.0 cm height. Column longitudinal reinforcement is composed of four bars (12.5 mm) and of bursting reinforcement and stirrups (5.0 mm) along the column.Figure 1 shows the location of strain gages adopted to measure the reinforcement strains, which are highlighted by letter E. Five comparative parameters validated the model: load versus displace-ment curve, failure load, reinforcement strain and stress, stress flows, crack patterns and failure modes.
3. Numerical analysis
The nonlinear analysis was performed in the ATENA 2D software, version 5.3.2 (Cervenka Consulting Company), based on the Finite
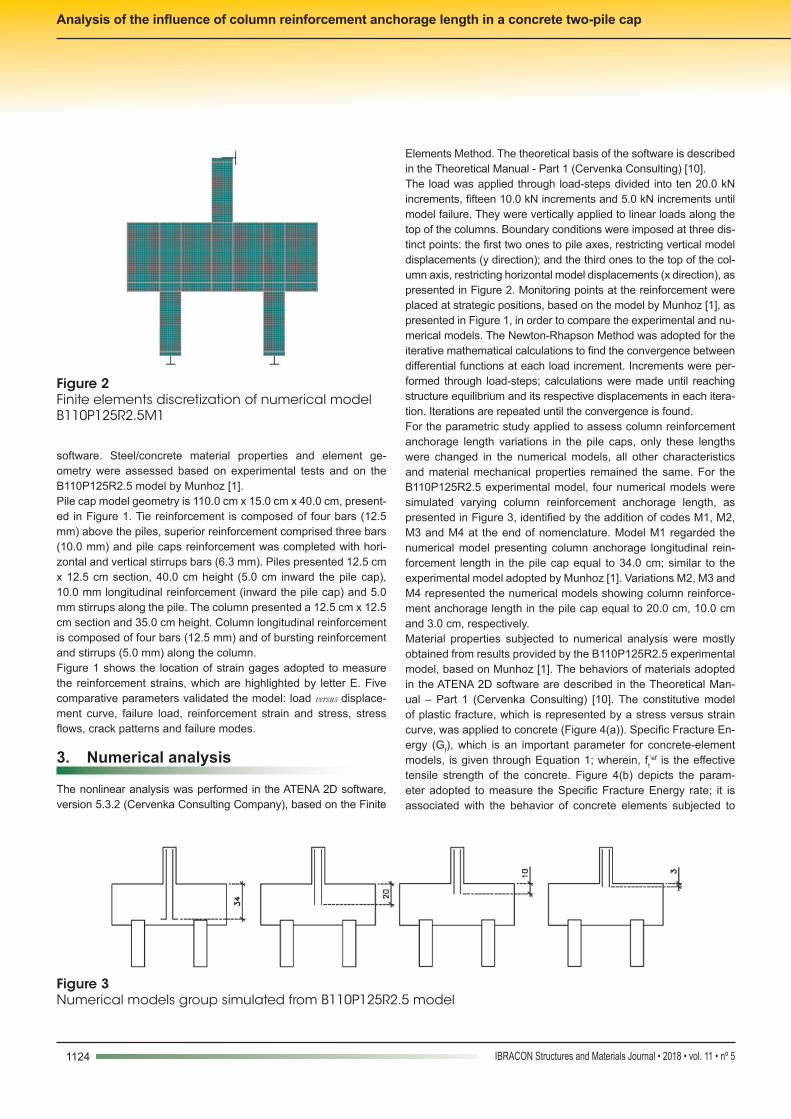
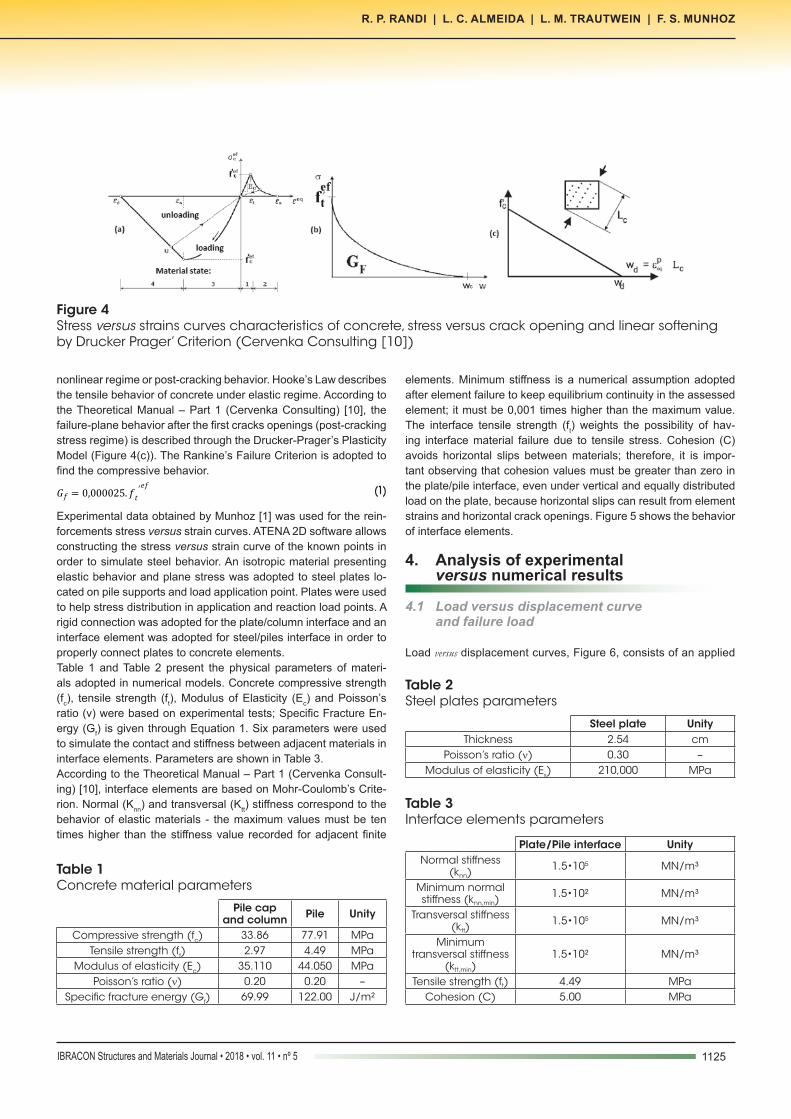
Elements Method. The theoretical basis of the software is described in the Theoretical Manual - Part 1 (Cervenka Consulting) [10].The load was applied through load-steps divided into ten 20.0 kN increments, fifteen 10.0 kN increments and 5.0 kN increments until model failure. They were vertically applied to linear loads along the top of the columns. Boundary conditions were imposed at three dis-tinct points: the first two ones to pile axes, restricting vertical model displacements (y direction); and the third ones to the top of the col-umn axis, restricting horizontal model displacements (x direction), as presented in Figure 2. Monitoring points at the reinforcement were placed at strategic positions, based on the model by Munhoz [1], as presented in Figure 1, in order to compare the experimental and nu-merical models. The Newton-Rhapson Method was adopted for the iterative mathematical calculations to find the convergence between differential functions at each load increment. Increments were per-formed through load-steps; calculations were made until reaching structure equilibrium and its respective displacements in each itera-tion. Iterations are repeated until the convergence is found.For the parametric study applied to assess column reinforcement anchorage length variations in the pile caps, only these lengths were changed in the numerical models, all other characteristics and material mechanical properties remained the same. For the B110P125R2.5 experimental model, four numerical models were simulated varying column reinforcement anchorage length, as presented in Figure 3, identified by the addition of codes M1, M2, M3 and M4 at the end of nomenclature. Model M1 regarded the numerical model presenting column anchorage longitudinal rein-forcement length in the pile cap equal to 34.0 cm; similar to the experimental model adopted by Munhoz [1]. Variations M2, M3 and M4 represented the numerical models showing column reinforce-ment anchorage length in the pile cap equal to 20.0 cm, 10.0 cm and 3.0 cm, respectively.Material properties subjected to numerical analysis were mostly obtained from results provided by the B110P125R2.5 experimental model, based on Munhoz [1]. The behaviors of materials adopted in the ATENA 2D software are described in the Theoretical Man-ual – Part 1 (Cervenka Consulting) [10]. The constitutive model of plastic fracture, which is represented by a stress versus strain curve, was applied to concrete (Figure 4(a)). Specific Fracture En-ergy (Gf), which is an important parameter for concrete-element models, is given through Equation 1; wherein, ft
’ef is the effective tensile strength of the concrete. Figure 4(b) depicts the param-eter adopted to measure the Specific Fracture Energy rate; it is associated with the behavior of concrete elements subjected to
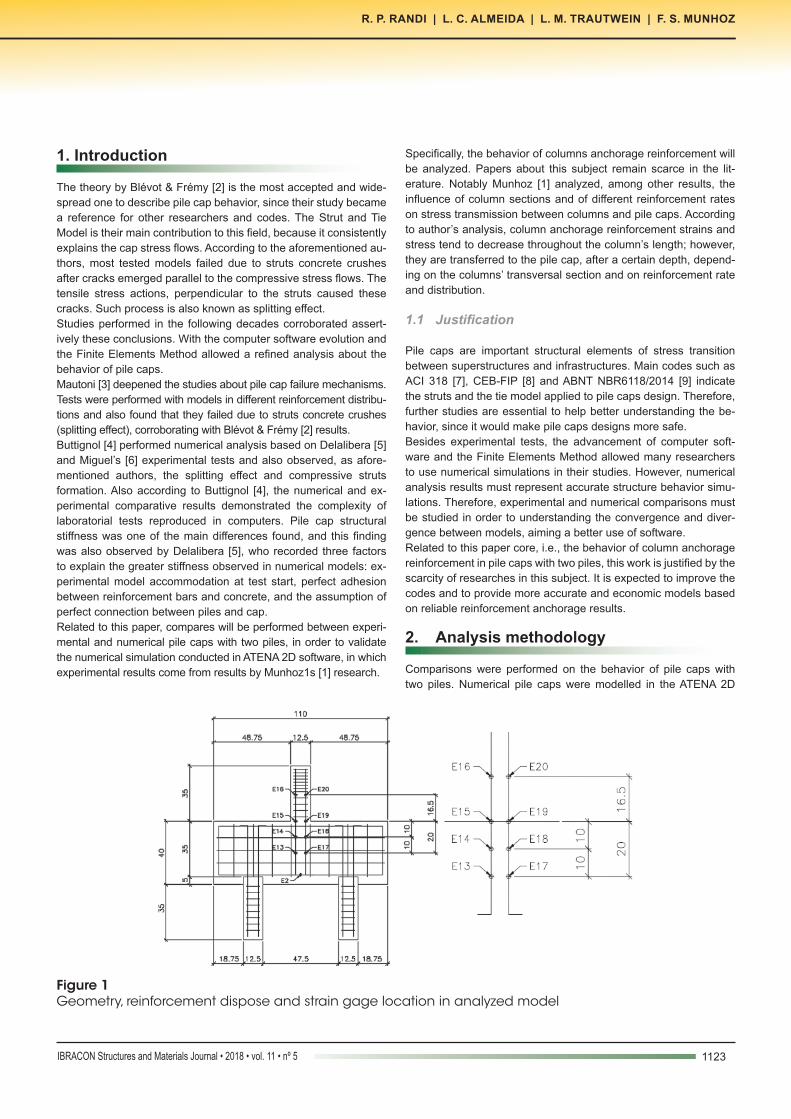
Figure 2Finite elements discretization of numerical model B110P125R2.5M1
Figure 3Numerical models group simulated from B110P125R2.5 model
1125IBRACON Structures and Materials Journal • 2018 • vol. 11 • nº 5
R. P. RANDI | L. C. ALMEIDA | L. M. TRAUTWEIN | F. S. MUNHOZ
nonlinear regime or post-cracking behavior. Hooke’s Law describes the tensile behavior of concrete under elastic regime. According to the Theoretical Manual – Part 1 (Cervenka Consulting) [10], the failure-plane behavior after the first cracks openings (post-cracking stress regime) is described through the Drucker-Prager’s Plasticity Model (Figure 4(c)). The Rankine’s Failure Criterion is adopted to find the compressive behavior.
(1)
Experimental data obtained by Munhoz [1] was used for the rein-forcements stress versus strain curves. ATENA 2D software allows constructing the stress versus strain curve of the known points in order to simulate steel behavior. An isotropic material presenting elastic behavior and plane stress was adopted to steel plates lo-cated on pile supports and load application point. Plates were used to help stress distribution in application and reaction load points. A rigid connection was adopted for the plate/column interface and an interface element was adopted for steel/piles interface in order to properly connect plates to concrete elements.Table 1 and Table 2 present the physical parameters of materi-als adopted in numerical models. Concrete compressive strength (fc), tensile strength (ft), Modulus of Elasticity (Ec) and Poisson’s ratio (ν) were based on experimental tests; Specific Fracture En-ergy (Gf) is given through Equation 1. Six parameters were used to simulate the contact and stiffness between adjacent materials in interface elements. Parameters are shown in Table 3.According to the Theoretical Manual – Part 1 (Cervenka Consult-ing) [10], interface elements are based on Mohr-Coulomb’s Crite-rion. Normal (Knn) and transversal (Ktt) stiffness correspond to the behavior of elastic materials - the maximum values must be ten times higher than the stiffness value recorded for adjacent finite
elements. Minimum stiffness is a numerical assumption adopted after element failure to keep equilibrium continuity in the assessed element; it must be 0,001 times higher than the maximum value. The interface tensile strength (ft) weights the possibility of hav-ing interface material failure due to tensile stress. Cohesion (C) avoids horizontal slips between materials; therefore, it is impor-tant observing that cohesion values must be greater than zero in the plate/pile interface, even under vertical and equally distributed load on the plate, because horizontal slips can result from element strains and horizontal crack openings. Figure 5 shows the behavior of interface elements.
4. Analysis of experimental versus numerical results
4.1 Load versus displacement curve and failure load
Load versus displacement curves, Figure 6, consists of an applied
Figure 4Stress versus strains curves characteristics of concrete, stress versus crack opening and linear softening by Drucker Prager’ Criterion (Cervenka Consulting [10])
Table 2Steel plates parameters
Steel plate UnityThickness 2.54 cm
Poisson’s ratio (ν) 0.30 –Modulus of elasticity (Es) 210,000 MPa
Table 3Interface elements parameters
Plate/Pile interface UnityNormal stiffness
(knn)1.5•105 MN/m³
Minimum normal stiffness (knn,min)
1.5•10² MN/m³
Transversal stiffness (ktt)
1.5•105 MN/m³
Minimum transversal stiffness
(ktt,min)1.5•10² MN/m³
Tensile strength (ft) 4.49 MPaCohesion (C) 5.00 MPa
Table 1Concrete material parameters
Pile cap and column Pile Unity
Compressive strength (fc) 33.86 77.91 MPaTensile strength (ft) 2.97 4.49 MPa
Modulus of elasticity (Ec) 35.110 44.050 MPaPoisson’s ratio (ν) 0.20 0.20 –
Specific fracture energy (Gf) 69.99 122.00 J/m²
1126 IBRACON Structures and Materials Journal • 2018 • vol. 11 • nº 5
Analysis of the influence of column reinforcement anchorage length in a concrete two-pile cap
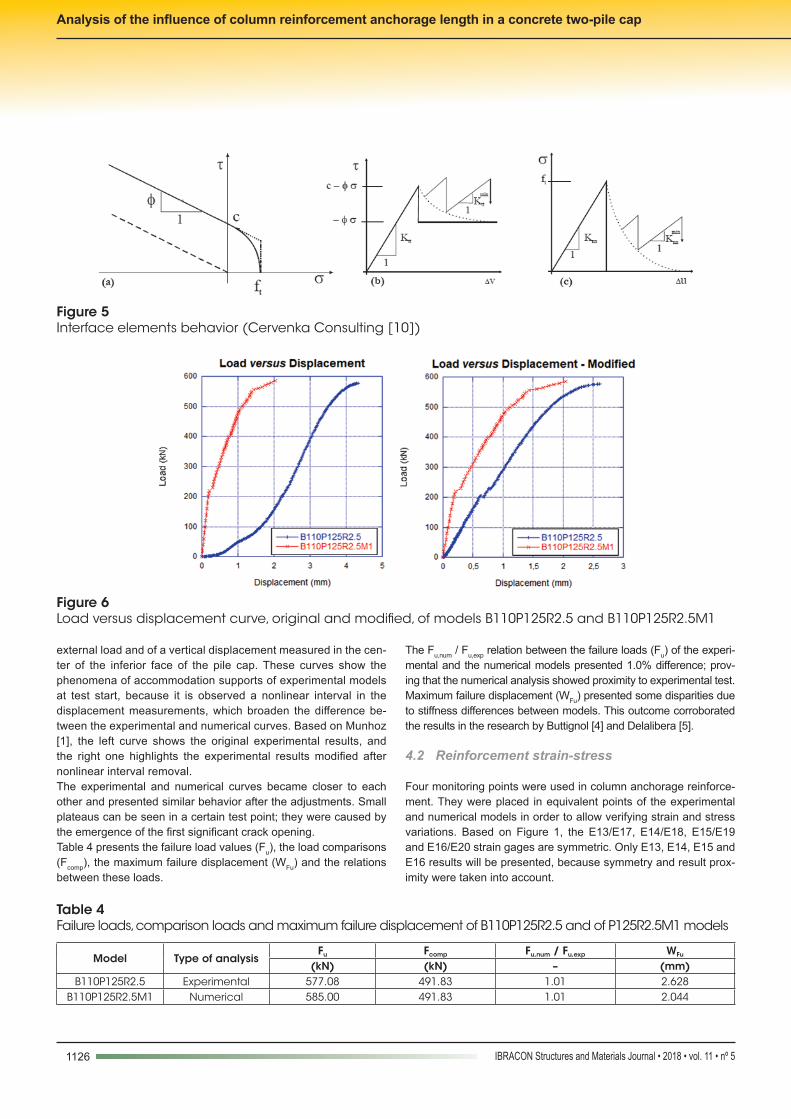
external load and of a vertical displacement measured in the cen-ter of the inferior face of the pile cap. These curves show the phenomena of accommodation supports of experimental models at test start, because it is observed a nonlinear interval in the displacement measurements, which broaden the difference be-tween the experimental and numerical curves. Based on Munhoz [1], the left curve shows the original experimental results, and the right one highlights the experimental results modified after nonlinear interval removal.The experimental and numerical curves became closer to each other and presented similar behavior after the adjustments. Small plateaus can be seen in a certain test point; they were caused by the emergence of the first significant crack opening.Table 4 presents the failure load values (Fu), the load comparisons (Fcomp), the maximum failure displacement (WFu) and the relations between these loads.
The Fu,num / Fu,exp relation between the failure loads (Fu) of the experi-mental and the numerical models presented 1.0% difference; prov-ing that the numerical analysis showed proximity to experimental test. Maximum failure displacement (WFu) presented some disparities due to stiffness differences between models. This outcome corroborated the results in the research by Buttignol [4] and Delalibera [5].
4.2 Reinforcement strain-stress
Four monitoring points were used in column anchorage reinforce-ment. They were placed in equivalent points of the experimental and numerical models in order to allow verifying strain and stress variations. Based on Figure 1, the E13/E17, E14/E18, E15/E19 and E16/E20 strain gages are symmetric. Only E13, E14, E15 and E16 results will be presented, because symmetry and result prox-imity were taken into account.
Figure 5Interface elements behavior (Cervenka Consulting [10])
Figure 6Load versus displacement curve, original and modified, of models B110P125R2.5 and B110P125R2.5M1
Table 4Failure loads, comparison loads and maximum failure displacement of B110P125R2.5 and of P125R2.5M1 models
Model Type of analysisFu Fcomp Fu,num / Fu,exp WFu
(kN) (kN) – (mm)B110P125R2.5 Experimental 577.08 491.83 1.01 2.628
B110P125R2.5M1 Numerical 585.00 491.83 1.01 2.044
1127IBRACON Structures and Materials Journal • 2018 • vol. 11 • nº 5
R. P. RANDI | L. C. ALMEIDA | L. M. TRAUTWEIN | F. S. MUNHOZ
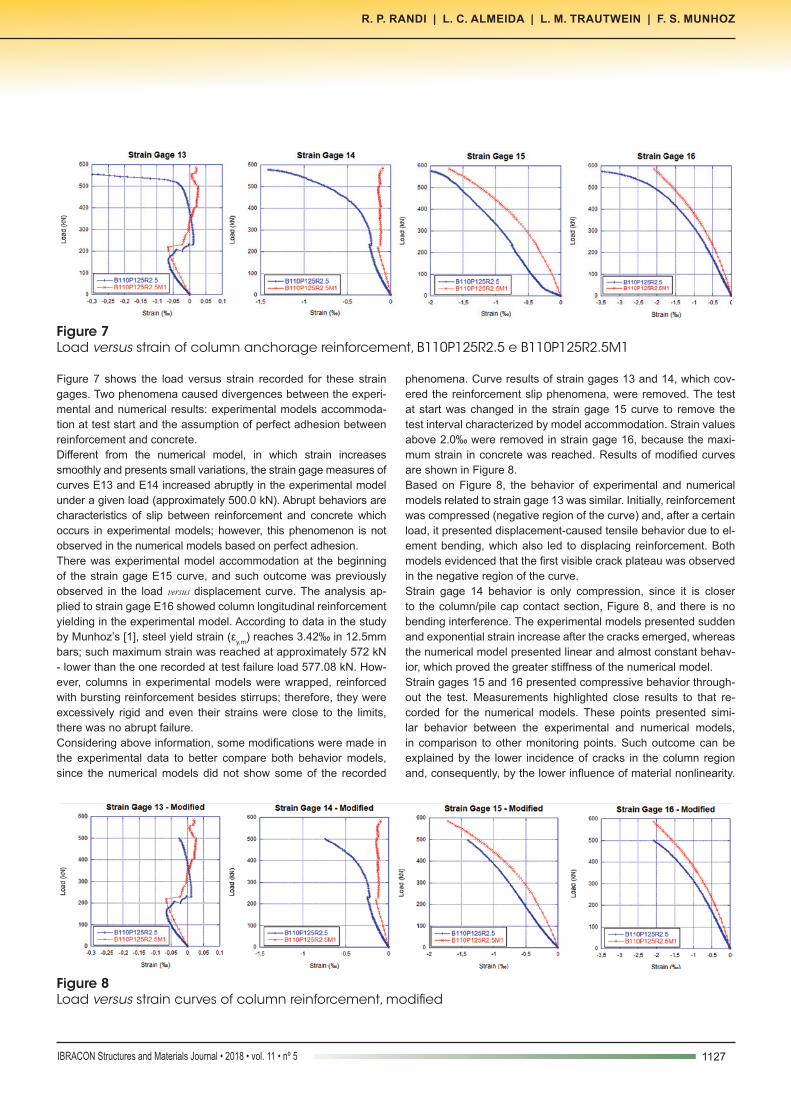
Figure 7 shows the load versus strain recorded for these strain gages. Two phenomena caused divergences between the experi-mental and numerical results: experimental models accommoda-tion at test start and the assumption of perfect adhesion between reinforcement and concrete.Different from the numerical model, in which strain increases smoothly and presents small variations, the strain gage measures of curves E13 and E14 increased abruptly in the experimental model under a given load (approximately 500.0 kN). Abrupt behaviors are characteristics of slip between reinforcement and concrete which occurs in experimental models; however, this phenomenon is not observed in the numerical models based on perfect adhesion. There was experimental model accommodation at the beginning of the strain gage E15 curve, and such outcome was previously observed in the load versus displacement curve. The analysis ap-plied to strain gage E16 showed column longitudinal reinforcement yielding in the experimental model. According to data in the study by Munhoz’s [1], steel yield strain (εy,m) reaches 3.42‰ in 12.5mm bars; such maximum strain was reached at approximately 572 kN - lower than the one recorded at test failure load 577.08 kN. How-ever, columns in experimental models were wrapped, reinforced with bursting reinforcement besides stirrups; therefore, they were excessively rigid and even their strains were close to the limits, there was no abrupt failure. Considering above information, some modifications were made in the experimental data to better compare both behavior models, since the numerical models did not show some of the recorded
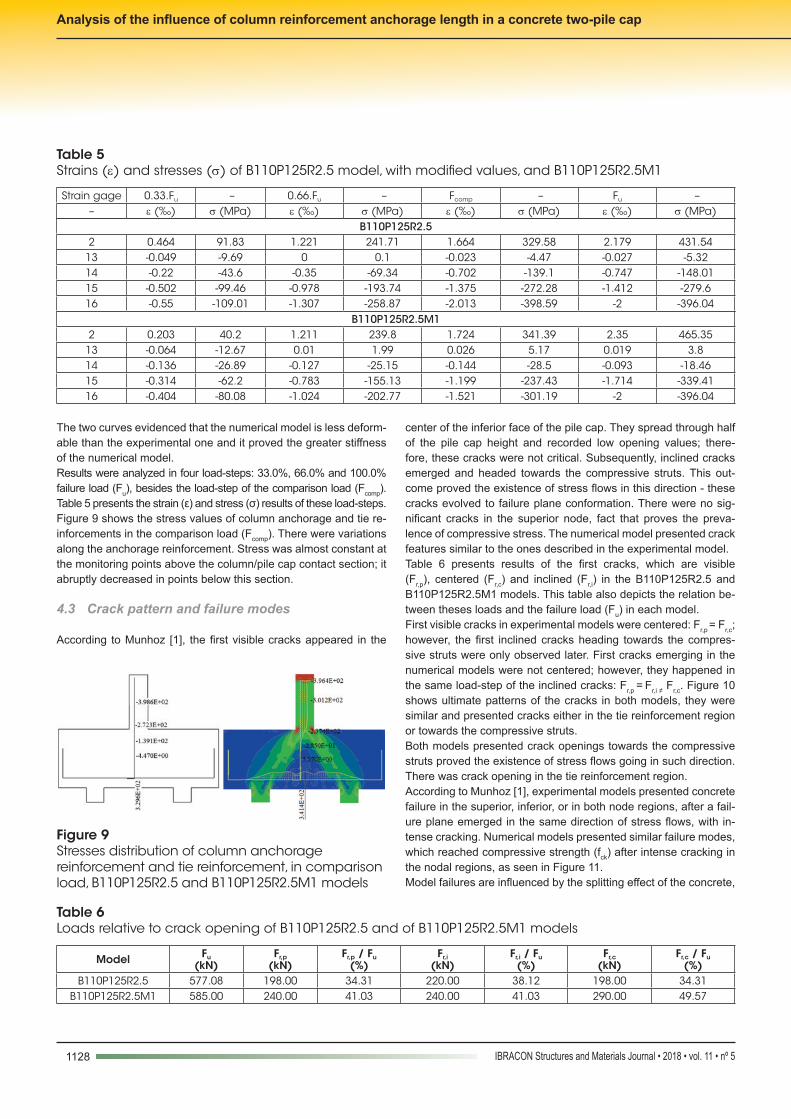
phenomena. Curve results of strain gages 13 and 14, which cov-ered the reinforcement slip phenomena, were removed. The test at start was changed in the strain gage 15 curve to remove the test interval characterized by model accommodation. Strain values above 2.0‰ were removed in strain gage 16, because the maxi-mum strain in concrete was reached. Results of modified curves are shown in Figure 8.Based on Figure 8, the behavior of experimental and numerical models related to strain gage 13 was similar. Initially, reinforcement was compressed (negative region of the curve) and, after a certain load, it presented displacement-caused tensile behavior due to el-ement bending, which also led to displacing reinforcement. Both models evidenced that the first visible crack plateau was observed in the negative region of the curve.Strain gage 14 behavior is only compression, since it is closer to the column/pile cap contact section, Figure 8, and there is no bending interference. The experimental models presented sudden and exponential strain increase after the cracks emerged, whereas the numerical model presented linear and almost constant behav-ior, which proved the greater stiffness of the numerical model. Strain gages 15 and 16 presented compressive behavior through-out the test. Measurements highlighted close results to that re-corded for the numerical models. These points presented simi-lar behavior between the experimental and numerical models, in comparison to other monitoring points. Such outcome can be explained by the lower incidence of cracks in the column region and, consequently, by the lower influence of material nonlinearity.
Figure 7Load versus strain of column anchorage reinforcement, B110P125R2.5 e B110P125R2.5M1
Figure 8Load versus strain curves of column reinforcement, modified
1128 IBRACON Structures and Materials Journal • 2018 • vol. 11 • nº 5
Analysis of the influence of column reinforcement anchorage length in a concrete two-pile cap
The two curves evidenced that the numerical model is less deform-able than the experimental one and it proved the greater stiffness of the numerical model.Results were analyzed in four load-steps: 33.0%, 66.0% and 100.0% failure load (Fu), besides the load-step of the comparison load (Fcomp). Table 5 presents the strain (ε) and stress (σ) results of these load-steps.Figure 9 shows the stress values of column anchorage and tie re-inforcements in the comparison load (Fcomp). There were variations along the anchorage reinforcement. Stress was almost constant at the monitoring points above the column/pile cap contact section; it abruptly decreased in points below this section.
4.3 Crack pattern and failure modes
According to Munhoz [1], the first visible cracks appeared in the
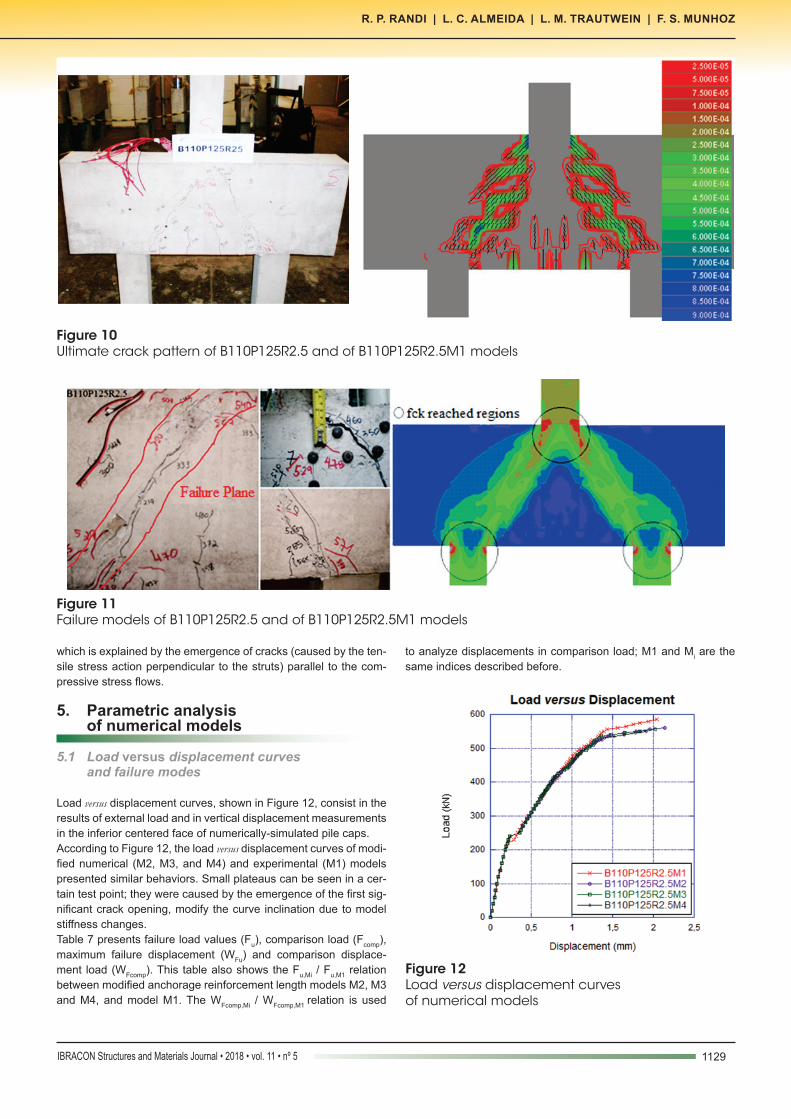
center of the inferior face of the pile cap. They spread through half of the pile cap height and recorded low opening values; there-fore, these cracks were not critical. Subsequently, inclined cracks emerged and headed towards the compressive struts. This out-come proved the existence of stress flows in this direction - these cracks evolved to failure plane conformation. There were no sig-nificant cracks in the superior node, fact that proves the preva-lence of compressive stress. The numerical model presented crack features similar to the ones described in the experimental model.Table 6 presents results of the first cracks, which are visible (Fr,p), centered (Fr,c) and inclined (Fr,i) in the B110P125R2.5 and B110P125R2.5M1 models. This table also depicts the relation be-tween theses loads and the failure load (Fu) in each model.First visible cracks in experimental models were centered: Fr,p = Fr,c; however, the first inclined cracks heading towards the compres-sive struts were only observed later. First cracks emerging in the numerical models were not centered; however, they happened in the same load-step of the inclined cracks: Fr,p = Fr,i ≠ Fr,c. Figure 10 shows ultimate patterns of the cracks in both models, they were similar and presented cracks either in the tie reinforcement region or towards the compressive struts.Both models presented crack openings towards the compressive struts proved the existence of stress flows going in such direction. There was crack opening in the tie reinforcement region.According to Munhoz [1], experimental models presented concrete failure in the superior, inferior, or in both node regions, after a fail-ure plane emerged in the same direction of stress flows, with in-tense cracking. Numerical models presented similar failure modes, which reached compressive strength (fck) after intense cracking in the nodal regions, as seen in Figure 11.Model failures are influenced by the splitting effect of the concrete,
Figure 9Stresses distribution of column anchorage reinforcement and tie reinforcement, in comparison load, B110P125R2.5 and B110P125R2.5M1 models
Table 5Strains (ε) and stresses (σ) of B110P125R2.5 model, with modified values, and B110P125R2.5M1
Strain gage 0.33.Fu – 0.66.Fu – Fcomp – Fu –– ε (‰) σ (MPa) ε (‰) σ (MPa) ε (‰) σ (MPa) ε (‰) σ (MPa)
B110P125R2.52 0.464 91.83 1.221 241.71 1.664 329.58 2.179 431.5413 -0.049 -9.69 0 0.1 -0.023 -4.47 -0.027 -5.3214 -0.22 -43.6 -0.35 -69.34 -0.702 -139.1 -0.747 -148.0115 -0.502 -99.46 -0.978 -193.74 -1.375 -272.28 -1.412 -279.616 -0.55 -109.01 -1.307 -258.87 -2.013 -398.59 -2 -396.04
B110P125R2.5M12 0.203 40.2 1.211 239.8 1.724 341.39 2.35 465.3513 -0.064 -12.67 0.01 1.99 0.026 5.17 0.019 3.814 -0.136 -26.89 -0.127 -25.15 -0.144 -28.5 -0.093 -18.4615 -0.314 -62.2 -0.783 -155.13 -1.199 -237.43 -1.714 -339.4116 -0.404 -80.08 -1.024 -202.77 -1.521 -301.19 -2 -396.04
Table 6Loads relative to crack opening of B110P125R2.5 and of B110P125R2.5M1 models
Model Fu
(kN)Fr,p
(kN)Fr,p / Fu
(%)Fr,i
(kN)Fr,i / Fu
(%)Fr,c
(kN)Fr,c / Fu
(%)B110P125R2.5 577.08 198.00 34.31 220.00 38.12 198.00 34.31
B110P125R2.5M1 585.00 240.00 41.03 240.00 41.03 290.00 49.57
1129IBRACON Structures and Materials Journal • 2018 • vol. 11 • nº 5
R. P. RANDI | L. C. ALMEIDA | L. M. TRAUTWEIN | F. S. MUNHOZ
which is explained by the emergence of cracks (caused by the ten-sile stress action perpendicular to the struts) parallel to the com-pressive stress flows.
5. Parametric analysis of numerical models
5.1 Load versus displacement curves and failure modes
Load versus displacement curves, shown in Figure 12, consist in the results of external load and in vertical displacement measurements in the inferior centered face of numerically-simulated pile caps. According to Figure 12, the load versus displacement curves of modi-fied numerical (M2, M3, and M4) and experimental (M1) models presented similar behaviors. Small plateaus can be seen in a cer-tain test point; they were caused by the emergence of the first sig-nificant crack opening, modify the curve inclination due to model stiffness changes.Table 7 presents failure load values (Fu), comparison load (Fcomp), maximum failure displacement (WFu) and comparison displace-ment load (WFcomp). This table also shows the Fu,Mi / Fu,M1 relation between modified anchorage reinforcement length models M2, M3 and M4, and model M1. The WFcomp,Mi / WFcomp,M1 relation is used
to analyze displacements in comparison load; M1 and Mi are the same indices described before.
Figure 10Ultimate crack pattern of B110P125R2.5 and of B110P125R2.5M1 models
Figure 11Failure models of B110P125R2.5 and of B110P125R2.5M1 models
Figure 12Load versus displacement curves of numerical models
1130 IBRACON Structures and Materials Journal • 2018 • vol. 11 • nº 5
Analysis of the influence of column reinforcement anchorage length in a concrete two-pile cap
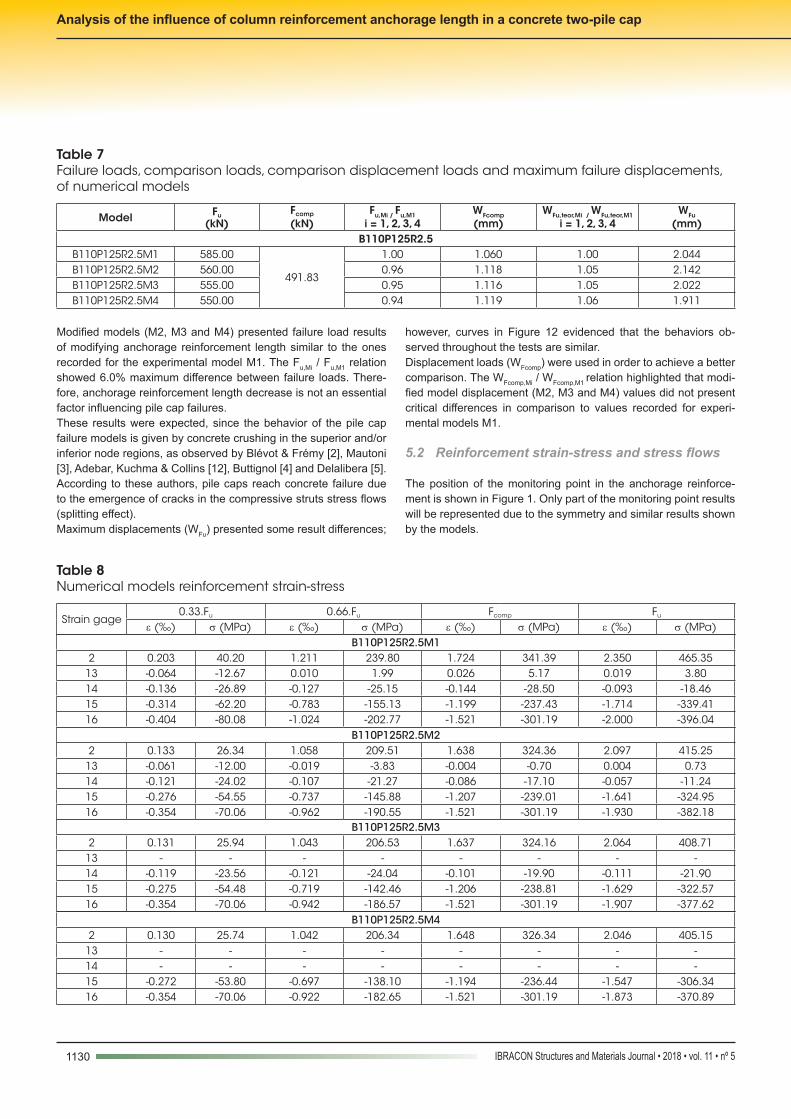
Modified models (M2, M3 and M4) presented failure load results of modifying anchorage reinforcement length similar to the ones recorded for the experimental model M1. The Fu,Mi / Fu,M1 relation showed 6.0% maximum difference between failure loads. There-fore, anchorage reinforcement length decrease is not an essential factor influencing pile cap failures. These results were expected, since the behavior of the pile cap failure models is given by concrete crushing in the superior and/or inferior node regions, as observed by Blévot & Frémy [2], Mautoni [3], Adebar, Kuchma & Collins [12], Buttignol [4] and Delalibera [5]. According to these authors, pile caps reach concrete failure due to the emergence of cracks in the compressive struts stress flows (splitting effect).Maximum displacements (WFu) presented some result differences;
however, curves in Figure 12 evidenced that the behaviors ob-served throughout the tests are similar.Displacement loads (WFcomp) were used in order to achieve a better comparison. The WFcomp,Mi / WFcomp,M1 relation highlighted that modi-fied model displacement (M2, M3 and M4) values did not present critical differences in comparison to values recorded for experi-mental models M1.
5.2 Reinforcement strain-stress and stress flows
The position of the monitoring point in the anchorage reinforce-ment is shown in Figure 1. Only part of the monitoring point results will be represented due to the symmetry and similar results shown by the models.
Table 7Failure loads, comparison loads, comparison displacement loads and maximum failure displacements, of numerical models
Model Fu
(kN)Fcomp
(kN)Fu,Mi / Fu,M1
i = 1, 2, 3, 4WFcomp
(mm)WFu,teor,Mi / WFu,teor,M1
i = 1, 2, 3, 4WFu
(mm)B110P125R2.5
B110P125R2.5M1 585.00
491.83
1.00 1.060 1.00 2.044B110P125R2.5M2 560.00 0.96 1.118 1.05 2.142B110P125R2.5M3 555.00 0.95 1.116 1.05 2.022B110P125R2.5M4 550.00 0.94 1.119 1.06 1.911
Table 8Numerical models reinforcement strain-stress
Strain gage0.33.Fu 0.66.Fu Fcomp Fu
ε (‰) σ (MPa) ε (‰) σ (MPa) ε (‰) σ (MPa) ε (‰) σ (MPa)B110P125R2.5M1
2 0.203 40.20 1.211 239.80 1.724 341.39 2.350 465.3513 -0.064 -12.67 0.010 1.99 0.026 5.17 0.019 3.8014 -0.136 -26.89 -0.127 -25.15 -0.144 -28.50 -0.093 -18.4615 -0.314 -62.20 -0.783 -155.13 -1.199 -237.43 -1.714 -339.4116 -0.404 -80.08 -1.024 -202.77 -1.521 -301.19 -2.000 -396.04
B110P125R2.5M22 0.133 26.34 1.058 209.51 1.638 324.36 2.097 415.25
13 -0.061 -12.00 -0.019 -3.83 -0.004 -0.70 0.004 0.7314 -0.121 -24.02 -0.107 -21.27 -0.086 -17.10 -0.057 -11.2415 -0.276 -54.55 -0.737 -145.88 -1.207 -239.01 -1.641 -324.9516 -0.354 -70.06 -0.962 -190.55 -1.521 -301.19 -1.930 -382.18
B110P125R2.5M32 0.131 25.94 1.043 206.53 1.637 324.16 2.064 408.71
13 - - - - - - - -14 -0.119 -23.56 -0.121 -24.04 -0.101 -19.90 -0.111 -21.9015 -0.275 -54.48 -0.719 -142.46 -1.206 -238.81 -1.629 -322.5716 -0.354 -70.06 -0.942 -186.57 -1.521 -301.19 -1.907 -377.62
B110P125R2.5M42 0.130 25.74 1.042 206.34 1.648 326.34 2.046 405.15
13 - - - - - - - -14 - - - - - - - -15 -0.272 -53.80 -0.697 -138.10 -1.194 -236.44 -1.547 -306.3416 -0.354 -70.06 -0.922 -182.65 -1.521 -301.19 -1.873 -370.89
1131IBRACON Structures and Materials Journal • 2018 • vol. 11 • nº 5
R. P. RANDI | L. C. ALMEIDA | L. M. TRAUTWEIN | F. S. MUNHOZ
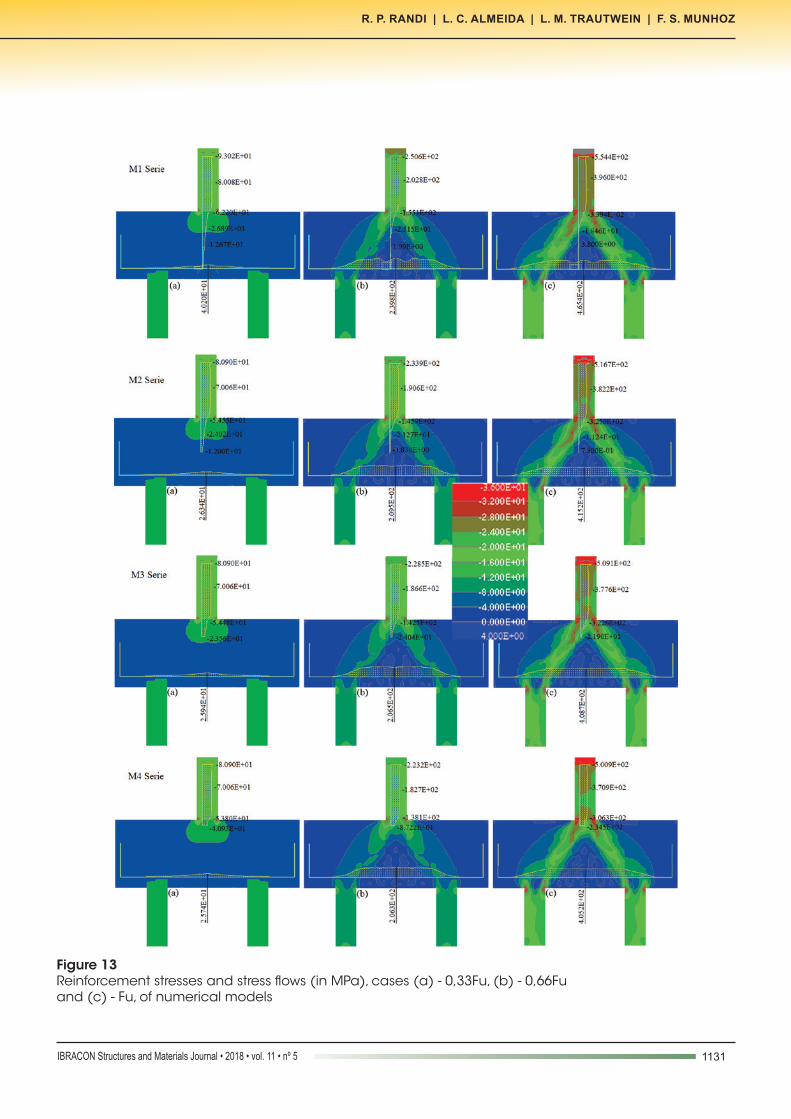
Figure 13Reinforcement stresses and stress flows (in MPa), cases (a) - 0,33Fu, (b) - 0,66Fu and (c) - Fu, of numerical models
1132 IBRACON Structures and Materials Journal • 2018 • vol. 11 • nº 5
Analysis of the influence of column reinforcement anchorage length in a concrete two-pile cap
Table 8 presents the strain (ε) and stress (σ) results; stress was calculated based on the Hooke’s Law. Loads related to failure load (Fu) 66%.Fu, 33%.Fu and to load comparison (Fcomp) in each strain gage are also shown in this table.In order to facilitate the visualization of results, values in Table 8 were allocated to their respective positions along the reinforcement (Figure 13). Cases (a), (b) and (c) regard reinforcement stress and stress flow in 0.33Fu, 0.66Fu and Fu, respectively.Based on results of the presented models, it is observed the de-creasing of strain and stress along the column reinforcement an-chorage length.Figure 13 depicted the abrupt stress decrease along the anchor-age reinforcement length, mainly in the column/pile cap contact section, as discussed by Fusco [11]. From the different loads, (a), (b) and (c), highlighted that such phenomenon was observed in the numerical model simulating the experimental model (M1) and in models presenting modified reinforcement (M2, M3 and M4). Therefore, reinforcement anchorage length can be decreased since stress dissipates faster than the expected. Stress flows followed the same behavior in models M1, M2, M3
and M4. Compressive struts evolution is proportional to the evolu-tion of the applied load; there is gradual stress flows and com-pressive struts propagation inside the pile caps. The compressive struts formation in case (a) is observed in the superior node of the pile caps and it spread towards the inferior node regions, as seen in cases (b) and (c). Because stress moves towards the structure for more rigid points, stress located in the superior node region goes towards the inferior nodes, because the stiffness at this point is greater than in the center of the pile cap where it iss possible observing larger displacements. Stress flows evidenced that com-pressive struts got a characteristic inclination.Moreover, it is observed that there is non-uniformity in pile stress, the internal regions (near column) of the piles are more solicited, and it corroborated the results by Buttignol [4] and Delalibera [5]. Overall, designing models do not take into consideration the non-uniform distribution of stress; they are often based on equilibrium at the center of the piles. Equilibrium cannot be taken into consid-eration for the centered section of the superior node in the column, i.e., stress concentration is greater in the decentered section of the column, i.e., as suggested in the refined model by Adebar, Kuchma
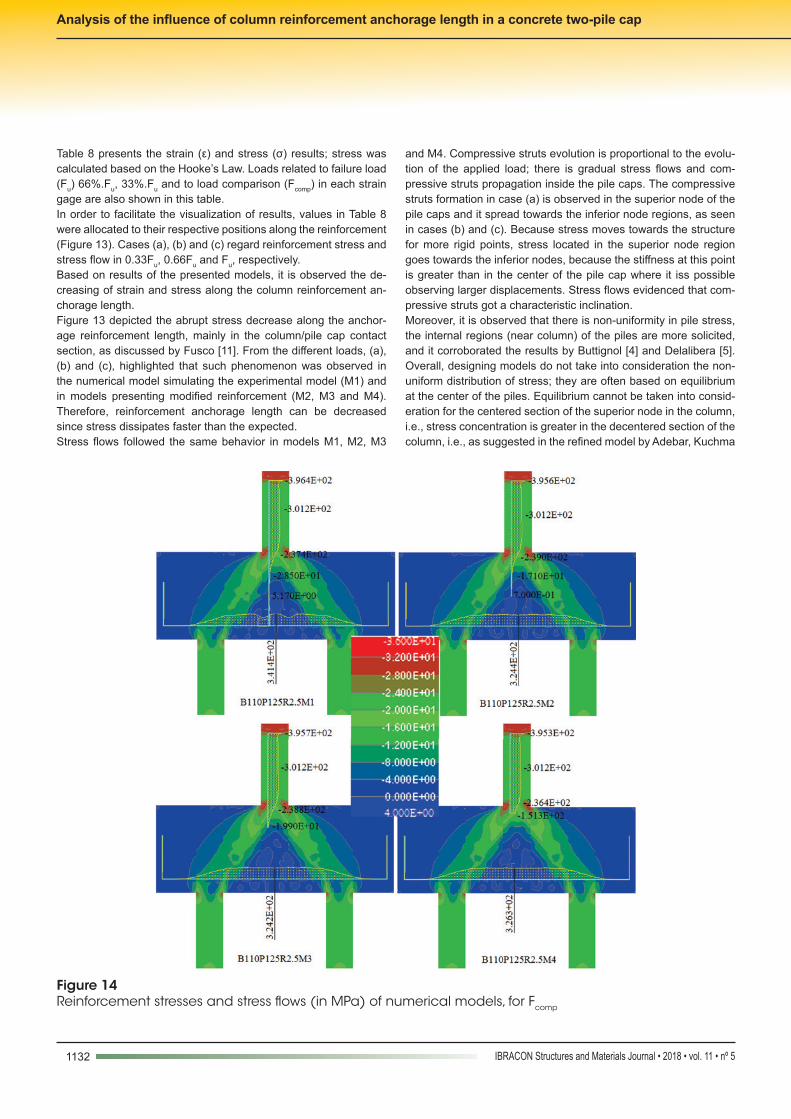
Figure 14Reinforcement stresses and stress flows (in MPa) of numerical models, for Fcomp
1133IBRACON Structures and Materials Journal • 2018 • vol. 11 • nº 5
R. P. RANDI | L. C. ALMEIDA | L. M. TRAUTWEIN | F. S. MUNHOZ
& Collins [12]. Compressive struts also had positive influence on the behavior of the reinforcement arranged on the top of the piles, because observes an abrupt strain and stress decrease in the in-ferior node region. For a better comparison, Figure 14, presents the comparison load (Fcomp) results of pile caps at 491.83 kN, for different reinforcement anchorage length in models M1, M2, M3 and M4.Based on Figure 14, the same load (Fcomp) applied to models pre-senting different anchorage reinforcement length presented similar reinforcement stress and stress flows behavior, thus changes in reinforcement did not significantly influence the models. In general, the monitoring points in column regions presented strain and stress practically constant; and the decrease occurs in the inferior points of the column/pile cap contact section. This phe-nomenon is caused by the positive influence of compressive struts on the superior node region of the pile cap. Compressive stress in these regions collaborates for a confining action of concrete on steel and such process increases material contact, improving ad-hesion between materials and fastens reinforcement dissipation in narrower sections of the anchorage reinforcement. Stress is almost null in regions near the inferior monitoring points located approximately 20,0 cm below the pile cap face.From these observations it is concluded that anchorage necessary for force transference between columns and pile caps is a lower value than the designed and detailed values often used in structur-al designs of reinforced concrete. Reinforcement stress dissipated throughout load application, as discussed by Fusco [11]. However, the pile caps designing models did not take these phenomena into consideration.
5.3 Crack pattern and failure modes
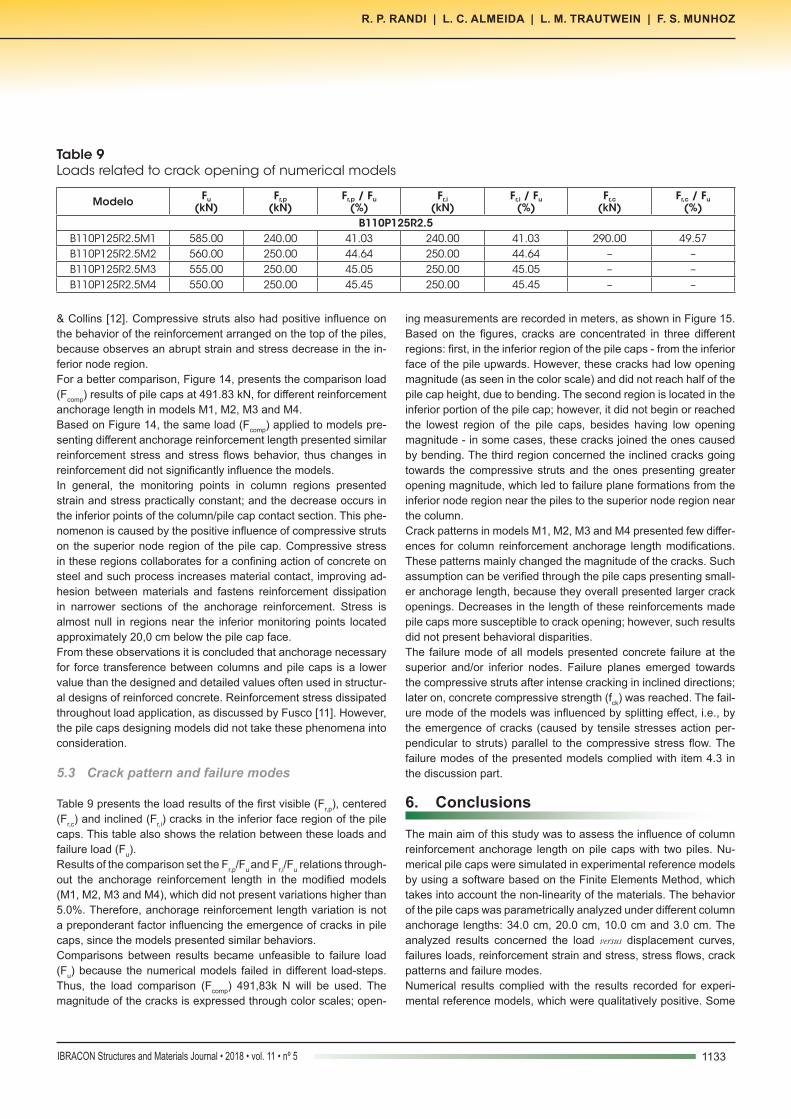
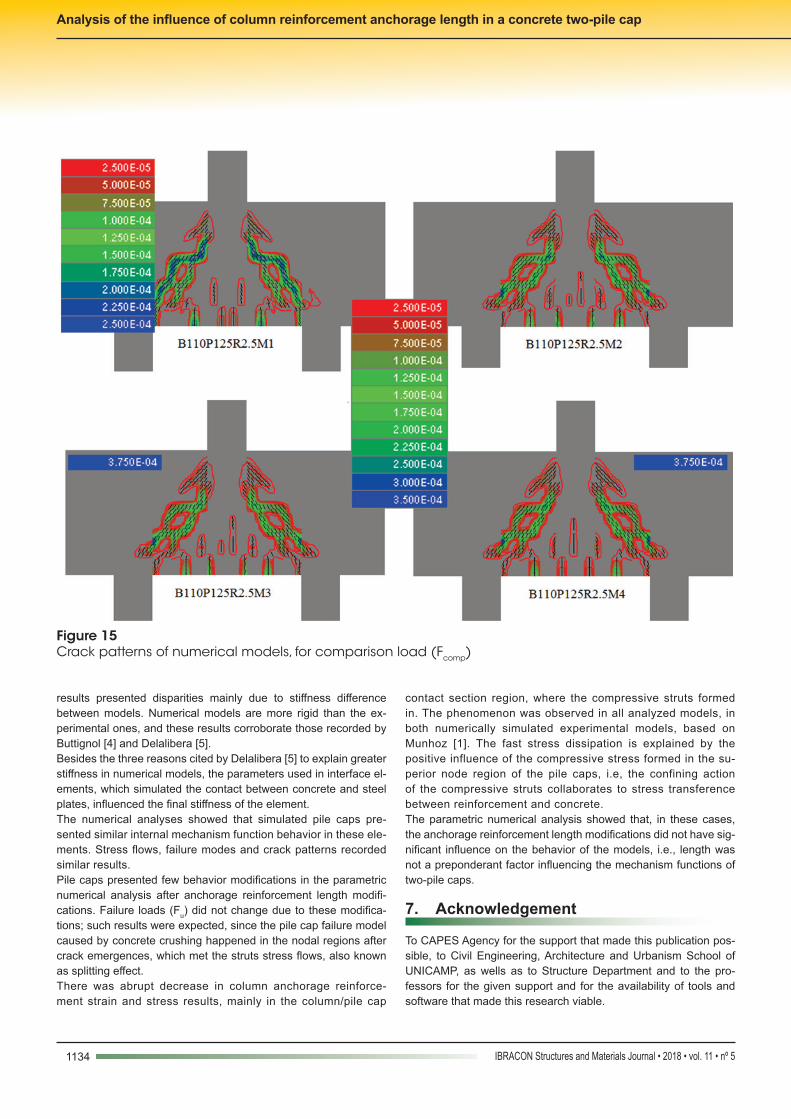
Table 9 presents the load results of the first visible (Fr,p), centered (Fr,c) and inclined (Fr,i) cracks in the inferior face region of the pile caps. This table also shows the relation between these loads and failure load (Fu).Results of the comparison set the Fr,p/Fu and Fr,i/Fu relations through-out the anchorage reinforcement length in the modified models (M1, M2, M3 and M4), which did not present variations higher than 5.0%. Therefore, anchorage reinforcement length variation is not a preponderant factor influencing the emergence of cracks in pile caps, since the models presented similar behaviors.Comparisons between results became unfeasible to failure load (Fu) because the numerical models failed in different load-steps. Thus, the load comparison (Fcomp) 491,83k N will be used. The magnitude of the cracks is expressed through color scales; open-
ing measurements are recorded in meters, as shown in Figure 15.Based on the figures, cracks are concentrated in three different regions: first, in the inferior region of the pile caps - from the inferior face of the pile upwards. However, these cracks had low opening magnitude (as seen in the color scale) and did not reach half of the pile cap height, due to bending. The second region is located in the inferior portion of the pile cap; however, it did not begin or reached the lowest region of the pile caps, besides having low opening magnitude - in some cases, these cracks joined the ones caused by bending. The third region concerned the inclined cracks going towards the compressive struts and the ones presenting greater opening magnitude, which led to failure plane formations from the inferior node region near the piles to the superior node region near the column.Crack patterns in models M1, M2, M3 and M4 presented few differ-ences for column reinforcement anchorage length modifications. These patterns mainly changed the magnitude of the cracks. Such assumption can be verified through the pile caps presenting small-er anchorage length, because they overall presented larger crack openings. Decreases in the length of these reinforcements made pile caps more susceptible to crack opening; however, such results did not present behavioral disparities.The failure mode of all models presented concrete failure at the superior and/or inferior nodes. Failure planes emerged towards the compressive struts after intense cracking in inclined directions; later on, concrete compressive strength (fck) was reached. The fail-ure mode of the models was influenced by splitting effect, i.e., by the emergence of cracks (caused by tensile stresses action per-pendicular to struts) parallel to the compressive stress flow. The failure modes of the presented models complied with item 4.3 in the discussion part.
6. Conclusions
The main aim of this study was to assess the influence of column reinforcement anchorage length on pile caps with two piles. Nu-merical pile caps were simulated in experimental reference models by using a software based on the Finite Elements Method, which takes into account the non-linearity of the materials. The behavior of the pile caps was parametrically analyzed under different column anchorage lengths: 34.0 cm, 20.0 cm, 10.0 cm and 3.0 cm. The analyzed results concerned the load versus displacement curves, failures loads, reinforcement strain and stress, stress flows, crack patterns and failure modes.Numerical results complied with the results recorded for experi-mental reference models, which were qualitatively positive. Some
Table 9Loads related to crack opening of numerical models
Modelo Fu
(kN)Fr,p
(kN)Fr,p / Fu
(%)Fr,i
(kN)Fr,i / Fu
(%)Fr,c
(kN)Fr,c / Fu
(%)B110P125R2.5
B110P125R2.5M1 585.00 240.00 41.03 240.00 41.03 290.00 49.57B110P125R2.5M2 560.00 250.00 44.64 250.00 44.64 – –B110P125R2.5M3 555.00 250.00 45.05 250.00 45.05 – –B110P125R2.5M4 550.00 250.00 45.45 250.00 45.45 – –
1134 IBRACON Structures and Materials Journal • 2018 • vol. 11 • nº 5
Analysis of the influence of column reinforcement anchorage length in a concrete two-pile cap
results presented disparities mainly due to stiffness difference between models. Numerical models are more rigid than the ex-perimental ones, and these results corroborate those recorded by Buttignol [4] and Delalibera [5].Besides the three reasons cited by Delalibera [5] to explain greater stiffness in numerical models, the parameters used in interface el-ements, which simulated the contact between concrete and steel plates, influenced the final stiffness of the element.The numerical analyses showed that simulated pile caps pre-sented similar internal mechanism function behavior in these ele-ments. Stress flows, failure modes and crack patterns recorded similar results.Pile caps presented few behavior modifications in the parametric numerical analysis after anchorage reinforcement length modifi-cations. Failure loads (Fu) did not change due to these modifica-tions; such results were expected, since the pile cap failure model caused by concrete crushing happened in the nodal regions after crack emergences, which met the struts stress flows, also known as splitting effect.There was abrupt decrease in column anchorage reinforce-ment strain and stress results, mainly in the column/pile cap
contact section region, where the compressive struts formed in. The phenomenon was observed in all analyzed models, in both numerically simulated experimental models, based on Munhoz [1]. The fast stress dissipation is explained by the positive influence of the compressive stress formed in the su-perior node region of the pile caps, i.e, the confining action of the compressive struts collaborates to stress transference between reinforcement and concrete.The parametric numerical analysis showed that, in these cases, the anchorage reinforcement length modifications did not have sig-nificant influence on the behavior of the models, i.e., length was not a preponderant factor influencing the mechanism functions of two-pile caps.
7. Acknowledgement
To CAPES Agency for the support that made this publication pos-sible, to Civil Engineering, Architecture and Urbanism School of UNICAMP, as wells as to Structure Department and to the pro-fessors for the given support and for the availability of tools and software that made this research viable.
Figure 15Crack patterns of numerical models, for comparison load (Fcomp)
1135IBRACON Structures and Materials Journal • 2018 • vol. 11 • nº 5
R. P. RANDI | L. C. ALMEIDA | L. M. TRAUTWEIN | F. S. MUNHOZ
8. References
[1] MUNHOZ, F. S. Experimental and numerical analysis of rigid two-pile caps with square and rectangular column and differ-ent rates of column reinforcement. Thesis (Doctored). São Carlos School of Engineering, University of São Paulo. São Carlos, Brazil, 2014. (in Portuguese).
[2] BLÉVOT, J. L.; FRÉMY, R. Semelles sur pleux. Institut Technique du Bátiment et des Travaux Publics. Paris, Fran-çe, 1967. (in French).
[3] MAUTONI, M. Bloco sobre dois apoios. Grêmio Politécnico. São Paulo, Brasil, 1972.
[4] BUTTIGNOL, T.E.T. Computational Analysis of Pile Caps. Master Dissertation. School of Civil Engineering, Architec-ture and Urbanism, University of Campinas. Campinas, Bra-zil, 2011. (in Portuguese).
[5] DELALIBERA, R. G. Numerical and experimental analysis of two pile caps submitted to the action of a load centered and eccentric. Thesis (Doctored). São Carlos School of En-gineering, University of São Paulo. São Carlos, Brazil, 2006. (in Portuguese).
[6] MIGUEL, G. M. Numerical and experimental analysis of three-pile caps. Thesis (Doctored). São Carlos School of En-gineering, University of São Paulo. São Carlos, Brazil, 2000. (in Portuguese).
[7] ACI COMMITTEE 318 ON STANDARD BUILDING CODE. Building code requirements for structural concrete - ACI 318R-14, American Concrete Institute, 2014.
[8] COMITÉ EURO-INTERNATIONAL DU BÉTON. CEB/FIP MODEL CODE MC-2010 – Design code. International Fed-eration for Structural Concrete, 2010.
[9] BRAZILIAN ASSOCIATION STANDARS. NBR 6118:2014 – Design of concrete structures. Rio de Janeiro, Brazil, 2014. (in Portuguese).
[10] CERVENKA, V; JENDELE, L. e CERVENKA, J. ATENA Pro-gram Documentation - Part 1: Theory. Prague, Czech Re-public, 2015.
[11] FUSCO, P.B. Técnicas de armar as estruturas de concreto. Editora PINI Ltda. São Paulo, Brasil, 1994.
[12] ADEBAR, P.; KUCHMA, D.; COLLINS, M. P.. Strut-and-tie models for design of pile caps: an experimental study. ACI Journal, v. 87, Jan/Feb-1990; p. 81-91.