Embed Size (px)
Citation preview

IBO
Fiscal Brief New York City Independent Budget Office
March 2015 Analysis of the Mayor’s Preliminary Budget for 2016
IBO’s Re-estimate Of the Mayor’s Preliminary Budget for 2016 And Financial Plan Through 2019
New York CityIndependent Budget OfficeRonnie Lowenstein, Director
110 William St., 14th floorNew York, NY 10038Tel. (212) 442-0632
Fax (212) [email protected] www.ibo.nyc.ny.us

ANALYSIS OF THE MAYOR’S PRELIMINARY BUDGET FOR 2016
NYC Independent Budget Office March 2015II
Contributors
David Belkin Economic forecastingElizabeth Brown Housing, public housing, homeless services Sean Campion Debt, debt service, economic development,
transportationDebipriya Chatterjee Business taxesMartin Davis Municipal laborJulie Anna M. Golebiewski Sales, hotel taxesMichael Jacobs Personal income taxPaul Lopatto Public assistanceBernard O’Brien Police, fire, elections boardGeoffrey Propheter Property taxAna Maria Ventura Capital plan Nashla Rivas-Salas Youth services, senior services, correction,
information technologyYolanda Smith EducationSarita Subramanian School construction Alan Treffeisen Property transfer and mortgage recording taxes
I
NYC Independent Budget Office March 2015 III
This report presents IBO’s most recent economic forecast and provides our re-estimate of tax revenues and expenditures based on the Mayor’s Preliminary Budget for 2016 and Financial Plan Through 2019. The report also focuses on some key proposals in the Mayor’s plan. With negotiations still underway in Albany on the state budget as IBO completed this report, we have reflected state issues affecting the city budget as they are presented in Mayor de Blasio’s plan.
As we began doing last year, sections of this report examining some key budget issues were previously released to contribute to the public discussion as relevant hearings were underway at the City Council. IBO also publishes as a companion to this volume an annual report called Budget Options for New York City. Also beginning last year, we now release the budget options report in the fall so the revenue and spending options that are examined in the volume can be considered earlier in the deliberations on the upcoming fiscal year’s budget.
This report on the Mayor’s preliminary budget and financial plan, which IBO is required to produce by the City Charter, is the result of the diligent work of IBO’s staff. A list of staff members who contributed to the report can be seen on the adjacent page. The report is produced under the direction of Deputy Directors George Sweeting and Frank Posillico along with Supervising Analysts Elizabeth Brown, Ray Domanico, Paul Lopatto, and Michael Jacobs. Tara Swanson coordinated the report’s production and distribution.
Ronnie Lowenstein
Director
Preface
II

ANALYSIS OF THE MAYOR’S PRELIMINARY BUDGET FOR 2016
NYC Independent Budget Office March 2015IV
Contents
Contributors I
Preface II
Overview 1Economic & Tax Revenue Forecast 4Spending 4Balancing Act 6
Economic Outlook 7U.S. Economy 7Local Economy 10
Revenue Projections 19Tax Revenue Overview 19Real Property Tax 21Property Transfer Taxes 23Commercial Rent Tax 25Personal Income Tax 25Business Income Taxes 27General Sales Tax 27Hotel Occupancy Tax 28Other Revenues 28Tax Policy and the New York State Budget 29
Expenditure Projections 33Universal Pre-Kindergarten: Enrollment and Funding 33Will State Funds Be Available Again forExpanded After-School Programs? 37
More Federal Sandy Aid Added to CityBudget, More Expected to Be Approved 40
Homeless Rental Assistance IncreasedBut Impact on Shelter Uncertain 41
Capital Funds Added to Finance Mayor’s Housing Plan 43Ferries, Select Bus, Vision Zero: Capital Funds Added, More Will Be Needed 44
III

NYC Independent Budget Office March 2015 V
Capital Spending, Financing & Debt Service 47Four-Year Capital Commitment Plan 47Ten-Year Capital Strategy 49Financing the Capital Plan 50
IV

ANALYSIS OF THE MAYOR’S PRELIMINARY BUDGET FOR 2016
NYC Independent Budget Office March 2015VIV

OVERVIEW
NYC Independent Budget Office March 2015 1
Overview
There are two major differences between the de Blasio Administration’s first preliminary budget, issued in February 2014, and the second plan introduced last month: Unlike the first plan, the Preliminary Budget for Fiscal Year 2016 and Financial Plan Through 2019 offers no signature initiative on the order of providing pre-kindergarten for all 4-year-olds and expanding after-school programs for middle school students—all to be paid for with an income tax surcharge on city residents earning more than $500,000. While one could argue that the Mayor’s affordable housing plan is this budget’s marquee initiative, it is predominately a capital budget measure and one that unfolds over 10 years. But the absence of an overarching initiative in the day-to-day operating budget does not mean the plan is bereft of new measures. While smaller in scope and cost than pre-k expansion, there are a number of new initiatives and program enhancements included in the Mayor’s latest plan.
The other major difference entails labor costs. When Mayor Bill de Blasio presented last year’s preliminary budget, contracts with every labor union in the city had expired, some dating back to 2009. The potential cost of labor settlements clouded any discussion of the Mayor’s budget. Now, more than 70 percent of expired contracts for civilian and uniformed members of the municipal workforce have been settled, and the
de Blasio Administration has factored its estimate of the cost of these settlements, along with the cost of extending the same patterns to unions that have yet to reach agreements, into its budget plan through 2019.
There is also a key similarity between the Mayor’s first two preliminary budgets: the city’s budget outlook remains sound. IBO estimates that the city will end the current fiscal year with a surplus of $1.8 billion based on our latest economic forecast and projections of tax revenues and expenditures under the policies articulated in the Mayor’s financial plan. Assuming this surplus is used to prepay some expenditures for the upcoming fiscal year, IBO projects the city will end 2016 with a surplus of $1.3 billion. We anticipate that the city will have a surplus of more than $300 million annually in each of the following fiscal years.
Among the key findings from our latest economic forecast and tax revenue and spending projections:
• The city added a record 121,000 jobs in 2014 and is expected to add more than 96,000 jobs this year and an additional 80,000 in 2016.
• About 55 percent of projected employment gains for 2015-2019 will be in two sectors: education and health care services and professional and business services. Professional and business
Total Revenue and Expenditure ProjectionsDollars in millions
2015 2016 2017 2018 2019Average Change
Total Revenue $78,760 $79,497 $81,929 $84,723 $87,606 2.7%
Total Taxes 49,876 52,225 54,553 56,874 59,606 4.6%Total Expenditures 78,760 78,232 81,568 84,409 87,254 2.6%
IBO Surplus/(Gap) Projections $0 $1,265 $360 $315 $353
Adjusted for Prepayments:
Total Expenditures $79,121 $80,329 $81,769 $84,607 $87,254 2.5%City-Funded Expenditures $56,848 $58,978 $60,188 $62,601 $65,300 3.5%
NOTES: IBO projects a surplus of $1.76 billion for 2015, $182 million above the de Blasio Administration’s forecast. The surplus is used to prepay some 2016 expenditures, leaving 2015 with a balanced budget. Figures may not add due to rounding.
New York City Independent Budget Office

ANALYSIS OF THE MAYOR’S PRELIMINARY BUDGET FOR 2016
NYC Independent Budget Office March 20152
Pricing Differences Between IBO and the de Blasio AdministrationItems that Affect the GapDollars in millions
2015 2016 2017 2018 2019
Gaps as Estimated by the Mayor $0 $0 ($1,048) ($1,370) ($2,074)
Revenue
TaxesProperty $2 $439 $548 $826 $1,204 Personal Income 188 295 379 312 540 General Sales (1) 39 57 24 10 General Corporation (10) 69 147 197 220 Unincorporated Business 41 195 358 500 609 Banking Corporation 0 20 63 97 94 Real Property Transfer 36 37 57 55 46 Mortgage Recording 33 58 40 24 21 Utility 5 24 30 29 29 Hotel Occupancy 6 62 81 100 128 Commercial Rent 7 21 9 (6) (21)Cigarette 2 1 (1) (2) (3)
Subtotal $308 $1,259 $1,768 $2,156 $2,877
STaR Reimbursement 0 (28) (27) (21) (16)Taxi Medallion Sales (5) (47) (36) (38) (69)
TOTAL REVENUE $303 $1,184 $1,705 $2,097 $2,792
Expenditures
Debt Service 104 75 75 75 75 Fringe Benefits:Health Insurance-Education (31) 20 (36) (60) (33)Health Insurance-City University (37) 10 10 8 2 Health Insurance-All Other Agencies 34 83 (32) (53) (44)
Education (125) (152) (173) (192) (212)Police (50) (50) (50) (50) (50)Board of Elections - (25) (25) (25) (25)Corrections - (15) (15) (15) (15)Homeless Services (10) (32) (32) (32) (32)Public Assistance (10) (12) (13) (13) (13)Small Business Services 4 (2) (6) (14) (18)Campaign Finance Board - - - (40) -
TOTAL EXPENDITURES (121) (100) (297) (411) (365)
TOTAL IBO PRICING DIFFERENCES $182 $1,084 $1,408 $1,686 $2,427
IBO Prepayment Adjustment 2015/2016 (182) 182 - - - IBO SURPLUS/(GAP) PROJECTIONS $0 $1,265 $360 $315 $353 NOTES: Negative pricing differences (in parentheses) widen the gaps, while positive pricing differences narrow the gaps. Figures may not add due to rounding.
New York City Independent Budget Office

OVERVIEW
NYC Independent Budget Office March 2015 3
services will also account for over a fourth of the real wage gains projected for 2015 and 2016.
• Tax revenues are expected to grow at an average rate of 4.8 percent over 2015 and 2016, 1.6 percentage points below the annual rate during the first five years of the recovery (2010 through 2014).
• Some of the largest increases in tax revenue growth in 2016 are expected to come from the property tax (6.5 percent, $1.4 billion) and the business taxes (6.8 percent, $414 million).
• IBO projects that tax revenues will grow at an average annual rate of 4.6 percent over the financial plan period, well above our forecast of a 3.5 percent annual average increase in city-funded expenditures (adjusted for prepayments).
• The budget recognizes nearly $2.0 billion in additional federal Sandy aid, $1.4 billion in the capital budget and the remainder in the city’s operating budget
• An additional $3.1 billion in capital funds has been added for the Mayor’s 10-year affordable housing plan, bringing total planned commitment by the city to $7.2 billion.
• Education projects comprise nearly 25 percent of the four-year capital plan with a total of $11.0 billion in planned commitments.
• Despite the Mayor’s increase in funding for providing shelter for homeless families and adults, IBO estimates an additional $32 million in city funds will be needed in 2016.
• The four-year capital plan includes $55 million for five new ferry routes but no money is budgeted for operating subsidies.
The report also examines some of the proposed tax changes in the Governor’s budget that affect city taxpayers. The proposal with the most far-reaching impact is a restructuring of the city’s tax on corporate income that would largely mirror changes already adopted for New York State. The de Blasio Administration has characterized the proposal as revenue neutral and while that may be correct over a number of years, it is quite possible that it will have a
negative impact on city tax revenue in some of the early years after the changes are adopted (see page 29).
As with any projection, there are a number of factors that could affect our economic forecast and upend the city’s fiscal stability. Given the importance of international tourism to the local economy, slower growth in much of the rest of the world coupled with the strength of the dollar could further slow or even reverse the flow of visitors. But risks to our economic forecast can also arise closer to home. IBO’s forecast for Wall Street firms shows very modest growth in profits over the next few years. With Wall Street firms and the broader financial sector still adjusting to regulatory and market changes that have curtailed some lines of business while also raising firms’ costs, and with additional changes yet to be implemented, there is considerable uncertainty as to the ultimate bottom line impact. Limits on risk taking coupled with higher expenses and greater capital requirements could dampen profit growth more—or less—than we have anticipated.
The vagaries of Washington and Albany politics also present risks to our projections. Most immediately, uncertainty over the level of state education aid may present the greatest risk to the Mayor’s funding plan for the continued expansion of pre-kindergarten and after-school programs for middle school students. A proposed state cut of $22 million for homeless prevention programs could also leave a shortfall in the de Blasio Administration’s ongoing efforts to reverse the growing number of homeless in the shelter system.
New local spending measures not included in the preliminary budget could also affect IBO’s surplus estimates. In the days since the plan was released, City Council Members and other elected officials have called for initiatives such as hiring 1,000 more police at a first-year cost of about $100 million and expanding the availability of free legal services for low-income tenants facing eviction ($7.5 million).
The Mayor himself has also upped the ante, suggesting that the state and city make matching $300 million allocations to the housing authority. The preliminary budget also did not provide funds for some initiatives highlighted in the Mayor’s State of the City speech, including operating subsidies for the expansion of ferry service (see page 44). And although the Mayor

ANALYSIS OF THE MAYOR’S PRELIMINARY BUDGET FOR 2016
NYC Independent Budget Office March 20154
has repeatedly said he views the Metropolitan Transportation Authority’s budget difficulties as a state responsibility, pressure to increase city aid may mount given that the basic city operating subsidy for the transit agency has been flat for decades and our capital commitments are scheduled to fall from $351 million this year to $40 million annually in 2016 through 2018. Pressure may also mount for the city to provide budget relief for the public hospital system. The fiscally beleaguered Health and Hospitals Corporation is facing the loss of millions of dollars in federal funds it receives for treating the uninsured beginning in 2017.
Economic & Tax Revenue Forecast
IBO’s economic forecast for the city anticipates growth throughout the financial plan period, although this growth slows after calendar year 2016. Following a year in which the city experienced unprecedented job growth of nearly 121,000 (based on recently revised labor department figures), IBO anticipates the city will add more than 96,000 jobs this calendar year and an additional 80,000 jobs next year. In the remaining years of the financial plan, we expect job growth to gradually slow, with annual employment gains projected to fall to an average of about 54,000 in 2017 through 2019.
Looking beyond the number of new jobs anticipated, IBO’s economic forecast shows a change in the mix of jobs being created, with low-wage jobs comprising a smaller share of the employment increases than in the recent past. The largest shares of our projected employment growth will be coming from education and health care services (28.5 percent), professional and business services (26.7 percent), and leisure and hospitality (14.6 percent).
IBO’s outlook for tax revenue growth follows the general pattern of our projections for employment growth. While over the course of the five-year plan period we estimate tax revenues will increase by an average of 4.6 percent annually, the growth is a bit higher than the average in 2015 and 2016 and lower in 2017 and 2018. In dollar terms, we project tax collections will grow from nearly $49.9 billion this fiscal year to $52.2 billion in 2016, an increase of $2.3 billion. IBO expects tax revenues will reach $56.9 billion in 2018.
While this forecast clearly anticipates sustained tax revenue growth, it is relatively moderate growth
compared with increases in the recent past. During fiscal years 2010 through 2014, tax revenue grew at an average rate of 6.4 percent; we project average growth this year and next at a more modest rate of 4.8 percent.
Spending
Under IBO’s re-estimate of the Mayor’s financial plan, expenditures are forecast to rise more slowly than tax revenues. We project total expenditures will grow from $78.8 billion this year to $87.3 billion in 2019, rising at an average annual rate of 2.6 percent. Looking just at city-funded expenses and after adjusting for the use of surpluses to make prepayments, we expect spending will rise from $56.8 billion this year to $65.3 billion in 2019, an average growth rate of 3.5 percent.
While there are no new big-ticket spending initiatives proposed under the Mayor’s preliminary budget, there are a number of relatively small measures to create new programs or expand existing services. These include initiatives such as increasing the number of ambulance tours to improve response times ($11 million), reforming child welfare training and preventive services ($11 million in 2016, $10 million annually in the following years), purchasing new bullet-proof vests for police officers ($8.0 million in 2015, $4.2 million in 2016), and expanding the capacity of drop-in centers for the homeless ($850,000 a year in 2016-2019). Perhaps the most costly initiative is one that cancels payments to the city: the Mayor’s plan forgoes $72.5 million in annual reimbursements from the housing authority for policing housing developments.
Sources of Spending Growth. These initiatives play a relatively small role in the modest increase in projected spending over the five years of the financial plan. Spending by most agencies is relatively flat. And where there are increases in spending they do not necessarily reflect an expansion of services. For example, the roughly $3 billion increase in spending by the Department of Education from 2015 through 2019 results largely from the higher salaries awarded principals and teachers under their new labor contract.
While the biggest spending increases in dollar terms are in the education department, in percentage terms two other areas are increasing at a faster rate: health insurance and other fringe benefits for city employees and debt service on the money the city borrows for

OVERVIEW
NYC Independent Budget Office March 2015 5
capital projects such as housing construction or buying new fire trucks.
In percentage terms, the cost of health insurance and other fringe benefits for city employees (excluding those in the education department and the city university system) is growing faster than any other major expenditure category, rising at an average yearly rate of 7.4 percent over the 2015-2019 period. Projected costs are rising from more than $4.9 billion this year to $5.2 billion in 2016, an increase of $281 million. Over the five-year financial plan period, health insurance and other fringe benefit costs are expected to rise by a total of $1.6 billion and reach nearly $6.6 billion in 2019. If not for the expected health insurance savings negotiated as part of the recent labor settlements, these costs would be escalating more rapidly.
Debt service costs are growing at an average rate of 6.8 percent over 2015-2019. IBO projects debt service will rise from about $6.1 billion this year to more than $6.9 billion next year, an increase of $818 million, after adjusting for the use of budget surpluses to prepay some of these expenditures. This increase comes despite the reduction in interest payments needed to support the Hudson Yards redevelopment by a combined $170 million in 2015 and 2016 (see page 51). By 2019, IBO projects debt service expenditures will exceed $7.9 billion. Our projected increase in debt service expenditures comes even after we factor in our expectation that the city will not need the short-term borrowing that is routinely budgeted by City Hall (see page 50).
Up until several years ago, city spending on pensions for the municipal workforce and Medicaid for low-income New Yorkers were two other key drivers of local expenditure increases. These costs are now essentially flat, although they still consume a significant portion of the budget. Over the 2015-2019 period, the city’s annual pension contributions are projected to remain relatively unchanged from this year’s $8.5 billion expenditure. Likewise, Medicaid costs are also projected to remain nearly unchanged through 2019 from this year’s cost of $6.6 billion.
Higher than Projected Costs. There are a number of expenditures that IBO estimates will be higher than projected under the Mayor’s financial plan. The largest difference is in education spending. We project spending
by the education department will be $152 million more than budgeted by the Mayor for next year, an amount that grows to $212 million in 2019. Two factors drive this difference: one is that the Mayor’s budget does not provide sufficient funding for charter schools already scheduled to open this coming fall as well as for charter schools expected to expand to include additional grades over the financial plan period; the other factor is our projection that the city will not receive all of the Medicaid reimbursements for eligible special education services expected under the Mayor’s plan.
Among the other expenditures we estimate will be higher than projected under the financial plan is overtime for police and correction officers. IBO projects that overtime will cost $65 million more annually for these officers than forecast in the Mayor’s plan. Likewise, we estimate that shelter costs for homeless individuals and families will cost $32 million more annually than currently budgeted. Given the recent increase in the cash assistance caseload, we also estimate that public assistance spending will be $12 million higher in 2016 than currently budgeted and $13 million more in each of the ensuing years.
No Cuts, Funds in Reserve. While the budget plan does not include a Program to Eliminate the Gap, a tool that has often been used by mayors in the past, the plan does set aside more funds in reserve than typical of these same past budgets. The Mayor has said he will propose new spending reductions as part of the executive budget to be released in the coming weeks, and has noted that his budget office is working with agencies to find efficiencies that would cut city spending without cutting services and to identify programs that may have become outmoded.
Although there may be no spending cuts, the plan does contain a general reserve fund of $750 million annually in 2016 through 2019. These funds are within the budget but not allocated for any spending purpose and can be directed to help cover unanticipated spending needs or lower-than-expected tax collections. If unused, they become part of the end-of-year surplus. In comparison, the Bloomberg Administration’s last budget plans contained reserves of $300 million to $450 million. The City Charter requires that the budget for a fiscal year begin with a reserve of only $100 million. In addition to the general reserve, the de Blasio Administration has maintained about $2.0 billion in

ANALYSIS OF THE MAYOR’S PRELIMINARY BUDGET FOR 2016
NYC Independent Budget Office March 20156
the Retiree Health Benefit Trust, a set-aside Mayor Bloomberg’s last budget had proposed eliminating.
New Spending on the Horizon? Following the release of the Mayor’s budget plan, there were a number of calls for new spending to address needs that City Council Members and other elected officials considered inadequately met. A prime example is the proposal by the City Council Speaker and other members to augment the city’s roughly 35,000 police officers with an additional 1,000 recruits. IBO estimates that the additional officers would cost about $100 million. Public officials have also suggested, for example, that the Mayor’s plan for subsidizing libraries and cultural organizations remains insufficient and that the pilot program to provide free breakfast for middle school students should be expanded.
But the most costly post-budget plan proposal came from the Mayor himself. Testifying to the Legislature in Albany after the plan’s release, the Mayor urged the state to provide $300 million in aid for the New York City Housing Authority. If the state provided the funds, the Mayor said the city would match it—although no funds are included in the current plan for this purpose. The Mayor has also indicated that his upcoming budget plan will address more of the city’s infrastructure needs. This would likely mean an increase to the city’s capital budget and as a result more borrowing and higher than currently estimated debt service costs.
Balancing Act
In characterizing his budget, one of the words Mayor de Blasio has emphasized is “responsible.” By responsible the Mayor means fiscally prudent. Given IBO’s forecast for tax revenues and spending under the terms of the Mayor’s preliminary budget and financial plan,
expenditures grow more modestly than tax revenues, sizable funding reserves remain, and each fiscal year ends with a surplus. Many budget analysts would characterize that as fiscally prudent.
But budgets and financial plans are not etched in stone, they continue to evolve. In response to a number of questions raised about the current plan—from possibly increasing the size of the police force to addressing additional infrastructure needs to presenting a set of spending reductions—the Mayor has said these issues are to be dealt with in the budget plan coming in April. Even as these questions are answered in the upcoming plan, there will be additional pressures as the process moves towards adopting the 2016 budget in June. The City Council and other elected officials will have additional priorities for spending as will various resident and business constituencies. The budget needs of the housing authority, transit agency, and public hospital system may also add to the fiscal pressures on the city.
The revenue side of the budget may also prove to be a source of fiscal pressure. Aid from the state could fall short of expectations built into the current plan, forcing new choices such as whether to maintain the expansion of after-school programs. Economic risks such as weaker-than-expected economic growth in Europe and China could slow the flow of international visitors to the city, decreasing the expected level of tax revenues. And just as some elected officials and local organizations will call for spending increases, others may promote tax or other revenue reductions.
Whether the moniker of fiscal prudence can be maintained will be a balancing act that unfolds in the months ahead.

ECONOMIC OUTLOOK/U.S. Economy
NYC Independent Budget Office March 2015 7
Economic Outlook
After a sharp contraction of real gross domestic product (GDP) in the first quarter of 2014, the U.S. economy rebounded during the rest of the year growing at some of the strongest rates since the 2008-2009 recession. (In this economic outlook section, years refer to calendar years rather than fiscal years, and monthly and quarterly data are seasonally adjusted.) The economy is on pace to add more jobs this year than in any year since the late 1990s. IBO expects the current momentum to continue into 2016. Barring serious deterioration in the global economy or major missteps in fiscal or monetary policy, real GDP growth will accelerate in 2015 and remain nearly as strong in 2016.
In the last five years employment growth in New York City has been very strong, with 120,700 jobs added to the city’s economy in 2014—by far the largest increase in the 65 years that records have been kept. IBO forecasts healthy job gains to continue through 2016, accompanied by solid gains in personal income. About 55 percent of the projected employment gains will be in two sectors—education and health care services and professional and business services—with the latter accounting for the largest share of wage gains. The city’s unemployment rate, which had been substantially higher than the nation’s for much of the post-recession period, has been falling rapidly and is on track to converge with the national rate towards end of the forecast period.
U.S. Economy
Real GDP grew 2.4 percent in 2014, with strong growth in the second quarter through the end of the year more than offsetting the weather-induced contraction in the first quarter. The U.S. economy has gained momentum and the expansion is now self-sustaining. Hiring has picked up at the same time that the drag from prior years’ contractionary fiscal policies and budgetary uncertainty has faded. Following very strong employment growth last year, there are recent indications that labor markets have begun to tighten and wages have begun to rise. Increases in personal
income, aided by substantial declines in oil and gas prices, are expected to boost consumer spending. Barring external shocks to the economy or debt-ceiling brinksmanship in Washington, IBO forecasts stronger real GDP growth in the next two years: 3.4 percent in 2015 and 3.3 percent growth in 2016.
After years of slow and uncertain growth, the U.S. economy’s recovery from the 2008-2009 recession gained momentum in 2014. Following the economy’s contraction in the first quarter of 2014, due in part to harsh winter weather in much of the country, the economy rebounded strongly in the remainder of the year. Real GDP growth was particularly rapid in the second and third quarters (4.6 percent and 5.0 percent, respectively) and was 2.4 percent for the year as a whole. The strength of the economy is most evident in the labor market, where 3.1 million jobs were added during 2014—the largest increase in payroll employment since 1997. The unemployment rate has continued at a steady descent from its 9.9 percent peak during the recession (2009, fourth quarter) to 5.5 percent in February 2015—a rate last seen in the second quarter of 2008. Beyond the unemployment rate, there are other signs of labor market tightening. There are currently more job openings than hires each month and the number of workers who quit their jobs is rising, a sign that workers are increasingly confident about finding other employment. Payroll data suggests that real wages have begun to rise among workers who have not switched jobs, and there have also been several well-publicized companywide increases in starting wages. But recent wage gains have thus far had little impact on prices. Policy makers at the Federal Reserve have focused on core inflation, a measure that excludes the impact of food and energy prices, which tend to be particularly volatile. By this measure, the rate of inflation was 1.7 percent in 2014, no higher than in 2013 and still below the Federal Reserve’s 2.0 percent target.
Even with the steady decline in the unemployment rate and the boom-like employment gains of last year, the

ANALYSIS OF THE MAYOR’S PRELIMINARY BUDGET FOR 2016
NYC Independent Budget Office March 20158
IBO versus Mayor’s Office of Management and Budget Economic Forecasts2014 2015 2016 2017 2018 2019
National Economy
Real GDP GrowthIBO 2.4 3.4 3.3 2.9 2.4 2.1OMB 2.4 3.0 2.7 2.8 2.5 2.8
Inflation Rate (CPI-U)IBO 1.7 1.1 2.5 2.9 2.8 2.2OMB 1.6 0.3 2.2 2.3 2.5 2.5
Personal Income GrowthIBO 3.9 5.2 6.7 6.3 5.4 4.0OMB 3.9 4.3 5.0 5.6 5.0 5.2
Unemployment RateIBO 6.2 5.5 5.2 5.0 4.9 4.9OMB 6.2 5.6 5.3 5.2 5.2 5.1
10-Year Treasury Bond RateIBO 2.5 2.9 4.0 4.6 4.5 4.5OMB 2.5 2.8 3.6 4.2 4.4 4.4
Federal Funds RateIBO 0.1 0.3 2.1 3.5 4.0 4.1OMB 0.1 0.4 1.6 3.3 3.8 3.8
New York City Economy
Nonfarm New Jobs (thousands)IBO 120.7 96.4 80.1 63.3 53.5 45.7OMB 91.0 65.0 64.0 60.0 45.0 41.0
Nonfarm Employment GrowthIBO 3.0 2.4 1.9 1.5 1.2 1.0OMB 2.3 1.6 1.6 1.4 1.1 1.0
Inflation Rate (CPI-U-NY)IBO 1.3 1.2 3.0 3.3 3.3 3.1OMB 1.5 0.9 2.3 2.4 2.6 2.6
Personal Income ($ billions)IBO 510.4 533.3 561.6 590.6 618.2 641.4OMB 503.7 519.0 539.3 565.0 589.1 613.2
Personal Income GrowthIBO 5.9 4.5 5.3 5.2 4.7 3.7OMB 4.6 3.0 3.9 4.8 4.3 4.1
Manhattan Office Rents ($/sq.ft)IBO 72.1 76.7 78.6 80.5 82.0 83.4OMB 73.7 76.7 80.6 82.9 86.3 87.6
SOURCE: Mayor’s Office of Management and BudgetNOTES: Rates reflect year-over-year percentage changes except for unemployment, 10-Year Treasury Bond Rate, Federal Funds Rate, and Manhattan Office Rents. The U.S. price index is for all urban consumers, all items. The local price index for urban consumers (CPI-U-NY) covers the New York/Northern New Jersey region. Personal income is nominal. For 2014, New York City personal income and growth rates are estimated, pending Bureau of Economic Analysis release. OMB estimates of nonfarm new jobs and nonfarm employment growth predate Bureau of Labor Statistic’s annual revisions.
New York City Independent Budge Office

ECONOMIC OUTLOOK/U.S. Economy
NYC Independent Budget Office March 2015 9
economy remains far short of full employment. The U.S. unemployment rate would be considerably higher if not for the decline in labor force participation in recent years, as discouraged job seekers stopped looking for work and therefore were no longer counted in the labor force. Nearly a third of the jobless have been unemployed for more than 26 weeks—an unusually high share given how long the expansion has been underway—and many of those employed part time would rather be working full time.
Helping to fuel economic activity is considerable pent-up demand for consumer goods and housing—much of it from young adults who deferred starting their own households during the recession and recovery. Households are now in a better position to spend. Their mortgage debt has shrunk, and the household sector’s debt as a percentage of disposable (after-tax) income has fallen to its lowest level in the 35 years that the data have been kept. The improved financial position of households and a gradual increase in consumer confidence have stimulated spending, particularly for autos and other durable goods.
The demand for homes has also increased, led by a combination of strong job growth and very low interest rates. Home sales and prices have both risen, and the total number of vacant homes for rent, sale, or held off the market is low. But single-family housing starts barely increased in 2014, in part due to relatively fewer first-time homebuyers. The tight mortgage lending standards for first-time homebuyers continue to make it difficult to enter the market. With fewer potential first-time buyers able to secure financing, there are ripple effects for households who already own homes but want to sell in order to buy something larger. Policymakers are working to ease the regulatory impediments to first-mortgage lending. The Federal Housing Administration recently decided to reduce its mortgage insurance premiums by half a percentage point. It also is now allowing Fannie Mae and Freddie Mac to purchase mortgages issued to certain low-income first-time buyers who made only a 3.0 percent down payment.
While U.S. economic growth has become strong enough to be self-sustaining, monetary policy is expected to continue to play a significant role in generating growth. The Federal Reserve has kept the federal funds rate on overnight loans between banks near zero and—
until recently—had kept downward pressure on long-term interest rates by purchasing bonds (quantitative easing). Low rates have been critical in eventually reviving the housing market, which had been a major drag on growth in the aftermath of the last recession. With economic growth gaining momentum, we expect the Federal Reserve to begin raising short-term interest rates—doing so in a gradual, orderly process to avoid causing long-term rates to spike.
Economic growth accelerated during 2014 in part because the fiscal drag created by previously adopted contractionary policies has abated. There was only limited Congressional skirmishing over the federal budget and debt ceiling and no disruption of government operations in 2014 as there were in 2013—developments which undermined consumer and business confidence at the time. IBO’s forecast is predicated on the assumption that there will be no further political brinksmanship over raising the nation’s debt ceiling. It also assumes that federal government spending will not increase substantially in the coming years and that increases in tax revenue resulting from faster economic growth will continue to reduce the deficit. Finally, it assumes that the appreciation of the U.S. dollar against most other currencies, which has already hurt export industries and worsened the nation’s balance of trade, will not have enough of an effect to cut the expansion short.
Based on these assumptions, IBO expects the robust economic growth of the last three quarters of 2014 to continue in 2015 and into 2016. IBO forecasts 3.4 percent real GDP growth in 2015 and 3.3 percent growth in 2016—faster growth than in any year since 2005. We also expect the economy to continue adding over 3 million jobs in these years: 3.3 million in 2015 (a 2.4 percent increase from 2014) and 3.5 million in 2016 (another 2.4 percent increase). Personal income growth is also projected to accelerate, from 3.9 percent in 2014 to 5.2 percent this year and 6.7 percent in 2016—the result of employment growth, wage gains earned in a tightening labor market, greater interest earnings from higher interest rates, and increases in nonwage income generated in a strong economy.
Robust growth will also put upward pressure on prices. IBO expects inflation to accelerate gradually, from 1.1 percent in 2015—very low due to oil and gas prices falling—to 2.5 percent in 2016 and to a bit under

ANALYSIS OF THE MAYOR’S PRELIMINARY BUDGET FOR 2016
NYC Independent Budget Office March 201510
3.0 percent in the following years. The unemployment rate is already below the Federal Reserve’s previously announced 6.5 percent marker for when it would consider raising interest rates, though many observers inside and outside the Federal Reserve contend that declines in the unemployment rate are overstating the strength of the recovery. IBO’s forecast assumes that the Federal Reserve will begin to gradually increase the federal funds rate later this year—from the current 0.1 percent rate to an average of 0.3 percent for all of 2015, to 2.1 percent in 2016, and higher rates thereafter.
IBO forecasts growth of both personal income and output to moderate after 2016, with real GDP growth slowing to 2.9 percent, 2.4 percent, and 2.1 percent in 2017 through 2019, respectively. Despite slower economic growth, we expect the unemployment rate to continue its decline, reaching 4.9 percent by the end of 2019—a rate last seen at the end of 2007.
Compared with IBO’s macroeconomic forecast, the Mayor’s Office of Management and Budget (OMB) projects slower real GDP growth in 2015 (3.0 percent versus 3.4 percent for IBO) and also in 2016 (3.3 percent versus 2.7 percent). IBO’s and OMB’s forecasts of the unemployment rate in 2015 and 2016 are nearly identical. With a slower growth assumption, OMB also forecasts a much lower rate of inflation in 2015 than does IBO (0.3 percent versus 1.1 percent). For 2016 both forecasts show a jump in the inflation rate; to 2.2 percent for OMB and 2.5 percent for IBO. After 2016, OMB forecasts slightly faster real GDP growth, but lower rates of inflation, than IBO.
Risks to the U.S. Forecast. While the economic outlook for the U.S. economy is favorable, there are significant risks to the forecast. IBO’s economic forecast is premised on there being no major external shocks to the U.S. economy, whether from economic disruptions elsewhere in the global economy or oil prices. Over the next two years we expect oil prices to gradually rise to $80 a barrel—above the very low oil and gas prices consumers have enjoyed in recent months but still favorable. But sudden spikes in oil prices could pose a risk to the continued growth in IBO’s forecast.
The greatest risk to the forecast comes from a worsening of economic problems outside the U.S. Economic growth in the European Union remains slow at best, with many countries struggling to avoid
stagnation. Moreover, the unresolved fiscal and sovereign debt problems of Greece and other countries in the European Union’s periphery continue to threaten the stability of the euro. The rapid export-led growth of the Chinese economy—the world’s second largest—has become unsustainable, and it is not clear if current reform efforts to refocus growth on domestic demand will be succeed without major economic disruptions. Because Europe and China are major trading partners of the U.S., weaker growth in these regions would adversely affect our economy as well. Given New York City’s role as a global financial center, financial shocks from Europe or China would have a major impact across all sectors of the city’s economy.
Economic growth has also slowed in what had been two bright spots of the global economy, Turkey and Brazil. The Russian economy continues to reel from falling oil and gas prices (its major export), the ruble’s depreciation, and the impact of economic sanctions in response to its invasion of Ukraine. After contracting for two quarters in a row, the Japanese economy grew at the end of 2014. But there is no certainty that its aggressive monetary and fiscal policy stimulus will succeed in ending the country’s decades-long economic stagnation.
Finally, domestic policies also pose a risk to our forecast. We have assumed that the Federal Reserve will be able to begin raising the federal funds rate without generating sharp increases in long-term interest rates. If long-term rates rise faster than hoped it could batter consumer spending and home sales. Another risk comes from the possibility of Congress again battling over the debt ceiling, which would undermine consumer and business confidence and potentially trigger another downgrade of U.S. debt.
Local Economy
New York City’s economy continues to show signs of strength, particularly in terms of employment gains and real estate markets, but trends in wages, hours worked, and personal income send a more mixed signal. The city has enjoyed unprecedented employment growth over the past several years, but this has been accompanied by markedly sluggish wage growth. IBO expects that employment growth will taper off over the forecast period while wage and personal income growth will remain tepid. The

NYC Independent Budget Office March 2015 11
ECONOMIC OUTLOOK / Local Economy
city’s ability to move beyond—in some though not all respects—the diminished impact of Wall Street has been a pivotal factor in the current expansion and will remain so in the forecast.
Employment. This month, the annual revision to earlier employment survey estimates revealed that annual average payroll employment in New York City grew by 120,700 (3.0 percent) in 2014, by far the largest increase in the 65 years that records have been kept.
Employment growth in 2013 was also revised upward to 95,900 (2.5 percent), itself one of the largest increases on record. With these increases, the city has added nearly 500,000 jobs in the five years since the recession of 2008-2009. These gains dwarf the employment losses (140,500) during the recession itself.
The city suffered much steeper job losses during its previous two contractions and considerably weaker gains in the previous (2003-2008) recovery as well.
Barring a negative shock to the economy, IBO expects New York City employment to continue to grow but at a decelerating pace through 2019. We forecast annual job growth dropping to a still very strong 96,400 (2.4 percent) in 2015 and then to 80,100 (1.9 percent) in 2016, and ultimately to 45,700 (1.0 percent) by 2019. These increases would bring cumulative job growth since the recession to nearly 800,000 over 10 years, although 10 years would be a very long expansion by historical standards. Since 1950, the city’s longest run between downturns has been eight years.
Wages. In striking contrast to the employment story, this has been the weakest of recent New York City expansions with respect to wages. Despite an uptick early in 2014, inflation-adjusted wages have grown only 0.9 percent per year in the current expansion—not nearly enough to offset the sharp drop from the fourth quarter of 2007 to the fourth quarter of 2009.1 Consequently, overall average wages in 2014 ($84,371) were still well below their 2007 peak ($89,238 in 2014 dollars).
Over the previous cycle, a milder wage drop during the 2001-2003 recession was followed by a burst of 4.1 percent annual real average wage growth from 2003-2007. Prior to that, average wages actually increased during the steep recession and slow recovery of 1990-1994 and then growth accelerated to a brisk 3.7 percent per year over the long (1994-2001) expansion that followed.
Almost all the volatility in overall average wage growth since 1990 has been due to booms and crashes in securities wages. In 2014 dollars, the average wage in the securities sector more than tripled between 1990 ($138,617) and 2007 ($437,249), but fell almost 25 percent between 2007 and 2009 ($334,618) and remained almost 16 percent below peak as of 2014 ($368,720). In the rest of the city economy, real
-400-300-200-100
0100200300400
Cumulative Employment Losses and Gains in Recent New York City Cycles
January 1990-January 2001
September 2008-January 2015 (so far)
January 2001-September 2008
Cumulative seasonally adjusted change, in thousands
Months From Start of Cycle
0 12 24 36 48 60 72 84 96 108120
136
SOURCE: Bureau of Labor StatisticsNew York City Independent Budget Office
+483.7
-140.5
-231.1
+292.1
+489.5
-345.7
-10,000
-5,000
0
5,000
10,000
15,000
20,000
$25,000
4 8 12 16 20 24 28 32 36 40 44
Change from start of cycle, in 2014 dollars
Real Average Wage Change Over Recent New York City Cycles*
1990Q1-2001Q2
2001Q2-2007Q4
2007Q4-2014Q4 (so far)
Quarters Since Start of Cycle
NOTE: *Four-quarter moving average of annualized wages.New York City Independent Budget Office
$57,751-$80,859
$80,859-$89,238
$89,238-$84,371
0

ANALYSIS OF THE MAYOR’S PRELIMINARY BUDGET FOR 2016
NYC Independent Budget Office March 201512
average wage growth has been both much slower and much less volatile, with annual rates of 2.0 percent, 1.7 percent, and 1.1 percent over the last three expansions interrupted by no growth during the post-9/11 recession and only a mild decline in the 2008-2009 recession. This has increased the real average wage excluding securities from $54,275 in 1990 to $72,243 in 2014.
In the forecast period IBO projects real average wage growth of 1.7 percent per year in securities (which would still leave average wages in 2019 below the 2007 peak) and 1.5 percent per year in the rest of the city economy.
Distribution of Growth. Even outside of securities, varying employment and wage growth trends in low-, medium-, and high-wage industries have had a bearing on the distribution of opportunities as well as the magnitude of gains and declines in the New York City economy. In 2014 roughly one-quarter of city employment was in industries with average wages below $45,000, one-half in industries with average wages between $45,000 and $99,999, one-fifth in industries with average wages between $100,000 and $199,999, and approximately 5 percent in industries with average wages of $200,000 or more.2 These demark our definitions of low wage (0 to 25th percentile), medium wage (25th to 75th percentile), high wage (75th to 95th percentile), and very high wage (95th to 100th
percentile) industries in the table and charts below.
IBO sorted employment into the four categories according to the average wage for each industry average wages. The table below provides a rough sense of where the city’s lower and higher wage jobs are currently distributed within the major industry groups.
Low- and medium-wage industries have accounted for much of the additional overall employment growth in the current expansion compared with the previous two expansions, while conversely the very high wage, predominantly securities industry, job growth of the earlier expansions has been absent. It is also interesting to note that low-wage industries suffered negligible job losses in both the 2001-2003 and 2008-2009 recessions, but more substantial losses in the much larger employment contraction of 1991-1992. We expect the slowdown in employment growth in our economic forecast to be spread relatively evenly across low-, medium-, and high-wage industries.
Medium- and high-wage jobs will be greater contributors to employment growth in the forecast period than low-wage jobs. By broad industry category, the largest shares of forecast New York City employment growth will be coming from education and health care services (28.5 percent), professional and business services (26.7 percent), leisure and hospitality (14.6 percent), and trade (11.7 percent).
Distribution of Employment in Low- to Very High-Wage Industries Across Major Industry Groups in 2014
Major Industry Group
Low (Under
$45,000)
Medium($45,000 -
$99,999)
High ($100,000 - $199,999)
Very High ($200,000
and over) Total
Natural Resources, Mining, and Construction 124 119,259 8,284 0 127,667 Manufacturing 16,874 58,214 870 0 75,958 Trade 286,397 189,320 17,467 0 493,183 Transportation, Warehousing, and Utilities 64,578 45,372 15,292 0 125,242 Information 0 0 184,533 0 184,533 Financial Activities 0 121,409 159,591 167,800 448,800 Professional and Business Services 0 219,967 448,933 0 668,900 Education and Health Care Services 289,885 556,748 0 0 846,633 Leisure and Hospitality 302,317 104,492 0 0 406,808 Other Services 125,892 53,592 0 0 179,483 Government 0 544,975 0 0 544,975 TOTAL 1,086,067 2,013,347 834,969 167,800 4,102,183 NOTE: Based on average wages.
New York City Independent Budget Office

NYC Independent Budget Office March 2015 13
ECONOMIC OUTLOOK / Local Economy
-200-175-150-125-100
-75-50-25
0255075
100125
19911993
19951997
19992001
20032005
20072009
20112013
2015f2017f
2019f
Change in average annual employment, in thousands
Employment Change in Low-, Medium-, and High-Wage Industries in New York City
2014 dollars in billionsReal Aggregate Wage Change in Low-, Medium-, and High-Wage Industries in New York City
-35-30-25-20-15-10
-505
10152025
$30
19911993
19951997
19992001
20032005
20072009
20112013
2015f2017f
2019f
Low wage (0-25th percentile): food manufacturing, plastics and rubber manufacturing, retail (except where noted below), transportation (except where noted below), noncovered educational services, nursing and residential care facilities, social assistance, amusement and gambling, food services and drinking places, repair and maintenance, personal and laundry services. Medium wage (25th-75th percentile): construction (except heavy and civil engineering), manufacturing (except where noted), wholesale trade (except electronic markets and agents), part of retail (motor vehicles and parts dealers, electronics and appliance stores, miscellaneous store retailers, nonstore retailers), part of transportation (air, water, scenic and sightseeing, and support activities for transportation), real estate, rental and leasing services, administrative and waste services, covered educational services, ambulatory health care services, hospitals, performing arts and spectator sports, museums and parks, accommodation, membership organizations, government.High wage (75th-95th percentile): financial services (except securities), management of companies and enterprises, professional and technical services, information, utilities, electronic markets and agents (wholesale trade), heavy and civil engineering construction, lessors of nonfinancial intangible assets, beverage and tobacco product manufacturing, mining.Very high wage: (95th-100th percentile): securities and commodities contracts.
New York City Independent Budget Office
Low Wage (0-25th percentile; under $45,000 in 2014)
Medium Wage(25th-75th percentile; $45,000-$99,999 in 2014)
High Wage(75th to 95th percentile;$100,000-$199,999 in 2014)
Very High Wage (95th-100th percentile; $200,000 and up in 2014)
Legend for Both Charts

ANALYSIS OF THE MAYOR’S PRELIMINARY BUDGET FOR 2016
NYC Independent Budget Office March 201514
The combined share of education and health care and professional and business services has been trending up, from 48.4 percent in the 2003-2008 expansion to 52.0 percent in the current expansion to 55.2 percent in the forecast. Conversely, the combined share of leisure and hospitality and trade—which has recently been surging thanks in part to record levels of tourism and business travel to New York City—is expected to drop from 39.3 percent in the current expansion to 26.3 percent in the forecast.
The wage story is quite different. Very high wages in the securities industry dominated overall aggregate wage growth in New York City prior to the city’s emergence from the crisis of 2008-2009. Securities accounted for more than 40 percent of the real aggregate wage gains in the city economy in five of the seven expansion years during the 1990s, and during the 2000s generated 53 percent of the aggregate wage gains in expansion years and 69 percent of the aggregate losses in years when wages were contracting.
It is just that outsized impact that has been missing in the current expansion, and that is expected to remain much diminished in the forecast period. The securities industry produced just 11 percent of overall aggregate wage growth between 2009 and 2014, and the share edges up only to 15 percent over the forecast period. Wage growth is now led by high- and medium-wage industries, respectively generating about 48 percent and 30 percent of overall wage growth in the current and forecast expansion.
By broad industry category professional and business services will provide the largest share of real aggregate wage growth over the forecast period (28 percent), followed by securities (as just mentioned, 15 percent), and then information, other financial activities, and educational and health care services, about 10 percent each.
Personal Income. In current dollars, total personal income in New York City is projected to grow at 4.7 percent per year from 2014 through 2019, about the same as the 4.6 percent annual growth from 2009 through 2014 but much weaker than the 7.6 percent annual growth from 2003 through 2007. Inflation has also been tamped down since the last recession. The local area consumer price index (CPI) grew 3.5 percent per year from 2003-2007 but only 1.9 percent per year
from 2009-2014. It is expected to pick up beginning in 2016, bringing CPI growth to 2.8 percent per year from 2014-2019. Thus the slowdown in personal income growth has been a little less marked in real dollar terms: from 4.5 percent per year from 2003 through 2007 to 3.0 percent per year from 2009 through 2014 to 2.7 percent per year from 2014 through 2019.
Residents’ wages and other net labor income account for a little over half of personal income in New York City, with capital income and current transfer payments (mostly government retirement, disability, medical, income, and unemployment insurance benefits) currently accounting for a bit under 18 percent each and proprietors’ income about 12 percent. The slowdown in real wage income has already been noted, but the recent drop-off in real capital income growth has been even more dramatic, falling from 11.4 percent per year in the last expansion (2003-2007), to 5.5 percent over the recovery so far (2009-2014), and to a projected 2.4 percent (2014-2019).
Labor Force. In terms of payroll losses and gains New York City weathered the Great Recession better than the nation as a whole and experienced a quicker and stronger recovery. Despite this, the city’s unemployment rate rose just as sharply as the nation’s in 2008 and 2009 and has been slower to come down towards prerecession levels: The city’s unemployment rate in January 2015, 6.5 percent, was still almost a full percentage point above the U.S. rate of 5.6 percent (see the right axis in the chart on the next page).
This puzzle is largely explained by the very different trajectories of labor force participation at the national and city level. The labor force is the sum of individuals who are working or looking for paid work; the latter group is labeled as unemployed in the official statistics. But many adults—full-time students, full-time homemakers, the disabled, and retirees—fall into neither category and are considered out of the labor force. These groups are excluded when the unemployment rate is calculated.
Consequently, the employed share of the adult population in the United States (the employment/population ratio, left axis) remains much lower than it was before the recession—and the U.S. unemployment rate would be considerably higher today if there had been fewer people moving out of (or more coming

NYC Independent Budget Office March 2015 15
ECONOMIC OUTLOOK / Local Economy
into) the labor force. Conversely, the employment/population ratio in New York City has already topped its prerecession peak—and is in fact at a record high.3 Little, if any, of the fall in the city’s unemployment rate can be ascribed to lagging labor force growth.
Demographic factors, a somewhat slower pace of younger adults aging into the labor force and quickened pace of older adults aging out, are expected to begin to slow the growth of the city’s labor force—one of the factors contributing to the slowdown in payroll employment growth in IBO’s economic forecast. But the city’s labor market will continue to tighten and we expect the unemployment rate to converge to the national rate by the end of the forecast period.
Hours Worked. One of the few local economic indices that have not been showing strength recently is hours worked in the private sector. While record numbers of workers are employed today in New York City, they are not, on average, working as long as they used to. The average work week of private sector employees fell sharply in the recession and
is still slipping, and in 2014 was down 3.4 percent compared with 2008. As a result, while private payroll employment in 2014 was 10.2 percent higher than in 2008, aggregate private hours worked—perhaps a truer measure of the market’s demand for labor—was only 6.4 percent higher.4
IBO estimates that about a fifth of the decline in average hours worked is a function of changes in New York City’s industry mix—the somewhat increased share of relatively lower-wage, shorter-hour jobs in the city economy along with the drop in very high wage (and usually very long-hour) jobs. The remaining four-fifths of the decline are due to shrinking hours within industries. What the future holds is uncertain, but if the city’s labor market continues to tighten as anticipated, this may favor a turnaround in demand for hours worked.
Wall Street. New York Stock Exchange (NYSE) member firms finished 2014 with member-firm broker-dealer profits of $16.0 billion, slightly down from 2013 but still relatively robust by pre-financial crisis standards. But this belies how different the Wall Street of today
Alternate Measures of New York City and United States Labor Force Slack
0%
2%
4%
6%
8%
10%
12%
53%
55%
57%
59%
61%
63%
65%
NYC Employment/Population Ratio U.S. Employment/Population Ratio
NYC Unemployment Rate U.S. Unemployment Rate
Employment/Population Ratio Unemployment Rate
SOURCE: Bureau of Labor StatisticsNOTE: 2000-2014 are actual, 2015-2019 are forecast.
New York City Independent Budget Office
2000
2001
2002
2003
2004
2005
2006
2007
2008
2009
2010
2011
2012
2013
2014
2015
2016
2017
2018
2019

ANALYSIS OF THE MAYOR’S PRELIMINARY BUDGET FOR 2016
NYC Independent Budget Office March 201516
is from the Wall Street of 2007 and earlier years. This transformation is shown in the chart above, which shows net operating revenues (noninterest revenues less noninterest costs), net interest revenues (interest revenues less interest costs), and net profits (total revenues less total costs) all on a quarterly basis since 1995.
Historically, broker-dealer operating revenues have almost always exceeded operating costs so that net operating revenue is positive, while interest income received has almost always been less than interest paid, so that net interest revenue is negative. This is still true today, but on nothing like the scale of former times.
Net operating revenues have shrunk to just a fraction of what they were before the financial crisis. Indeed net operating revenue over all four quarters of 2014 ($22.4 billion) was less than a tenth of the peak it hit in 2007 ($231.2 billion in 2014 dollars); this reflects mainly the collapse of revenue from trading on firms’ own accounts and related income. But concurrently interest received and paid have tumbled even further, dropping the net burden of interest from an (inflation-adjusted) -$243.7 billion in 2007 all the way down to just -$6.5 billion in 2014. This is mostly due to the near-zero interest rates in place since the crisis.
These changes in income and expense flows are mirrored in the value of NYSE member-firm assets, which in real terms have shrunk by over $2.6 trillion (more than 40 percent) since the second quarter of 2007.
IBO expects both net operating revenues and net interest burdens to drop even further in 2015 but then to gradually rise over the rest of the forecast period, though neither will recover to anything close to precrisis levels. Wall Street profits will edge up in nominal terms as well, reaching almost $18 billion by 2019. But in real dollars, this translates into virtually no growth over the next five years.
Real Estate. The city’s real estate market has recovered strongly since the 2008 crash. The total value of real estate sales recorded in 2014—those subject to the real property transfer tax as well as those that were exempt—was $122.3 billion, the second-highest on record after the $127.7 billion recorded in 2007.
The overall strength of real estate sales in recent years is largely a function of growth in the commercial market, which declined much more sharply than the residential market in the aftermath of the financial crisis. Since 2011 the annual value of commercial
-70-60-50-40-30-20-10
0102030405060
$70
Net Operating Revenues Net Interest Revenues Profits2014 dollars in billions
Quarterly Net Operating Revenues, Net Interest Revenue, And Profits of New York Stock Exchange Member Firms
SOURCE: New York Stock ExchangeNew York City Independent Budget Office
19951996
19971998
19992000
20012002
20032004
20052006
20072008
20092010
20112012
20132014

NYC Independent Budget Office March 2015 17
ECONOMIC OUTLOOK / Local Economy
sales has exceeded that of residential sales, and in 2014 taxable commercial sales were just 8.6 percent below their 2007 peak, while residential sales were 12.0 percent below.
IBO projects that commercial real estate sales will decline slightly in 2015, as the recent trading frenzy in the market subsides. Growth is forecast to resume in 2016, but rising interest rates and the availability of new office space at Hudson Yards and the World Trade Center sites will be a drag on prices. IBO projects that sales of commercial property will not return to their 2014 level until 2018.
In contrast, IBO expects that the value of residential sales will continue to rise in 2015 and approach its
2007 peak. However, the number of transactions will be much lower, implying a higher average value per transaction. Growth in residential sales is expected to slow toward the end of 2015, as rising interest rates put a damper on demand. IBO projects modest growth in the value of residential sales from 2016 through 2018.
Endnotes1The decline in real wages slightly lagged the employment downturn in 2001 but led the employment downturn in 2008.2Although other (usually small) industries have slipped in and out of the top category over the past 25 years, only securities has consistently ranked as very high wage.3Full labor force data for the city go back to 1976, but overall participation rates were generally lower before that—with the possible exception of World War II—because fewer women worked outside the home.4Because New York City average hours worked is not available on a seasonally adjusted basis, we measure the changes from prerecession levels on an annual average basis.

ANALYSIS OF THE MAYOR’S PRELIMINARY BUDGET FOR 2016
NYC Independent Budget Office March 201518

REVEUNE PROJECTIONS
NYC Independent Budget Office March 2015 19
Revenue Projections
IBO’s forecast of revenue from taxes and other sources including fines, fees, and state and federal aid totals $78.8 billion for this year—an increase of $5.3 billion (7.3 percent) over 2014. Much of this increase is due to a 17.7 percent increase in state and federal grants—which had been swelled by the receipt of federal aid for Sandy relief efforts, including $296 million that was added in for the preliminary budget. Tax revenue growth from 2014 to 2015 is forecast to be a more pedestrian 4.9 percent. Our forecast of total revenue for 2016 is $79.5 billion, an increase of 0.9 percent, dragged down by a 14.0 percent drop in federal aid.
While total revenue growth is expected to show little change from this year to next, IBO expects the tax revenue portion of that total to continue growing at about the same pace as in 2015, rising by 4.7 percent ($2.3 billion) to $52.2 billion in 2016. In contrast, the city’s own nontax revenues (primarily fees, fines, and sales) for 2016 are projected to fall by $691 million (-10.4 percent) from their current year total to $5.9 billion. Noncity revenues in 2016 are expected to be 4.1 percent lower than in 2015, thanks to the drop in federal grants.
Following 2016, IBO projects that total revenues will grow in a more typical pattern, increasing to $81.9 billion in 2017 and $87.6 billion by 2019. Annual revenue growth will average 3.3 percent in these years, driven by city taxes, which are forecast to increase at an average annual rate of 4.5 percent. Grants and other noncity revenue sources are expected to be largely unchanged over the three years (2017 through 2019).
The first part of this section presents IBO’s tax revenue forecast, followed by a detailed discussion of each of the city’s major tax sources and a brief overview of the outlook for nontax revenues. The section concludes with a discussion of some of the tax policy changes in the Governor’s state budget proposals that would affect New York City taxpayers.
Tax Revenue Overview
IBO’s forecast for tax revenue in the current fiscal year is $49.9 billion, an increase of 4.9 percent from 2014. Revenue growth is slower this year than in 2014 for several of the city’s major taxes, most notably the real property transfer tax and mortgage recording tax, which both saw double-digit increases in 2014 but taken together are expected to grow by 1.7 percent this year. For 2016, IBO projects somewhat slower revenue growth of 4.7 percent to $52.2 billion.
The tax revenue growth for 2016 is expected to come from across most of the city’s taxes. Some of the largest gains are expected in the business income taxes—an increase of $414 million (6.8 percent)—thanks to strength in sectors such as professional and business services and information, and from the real property tax, where January’s tentative assessment roll for 2016 was much stronger than anticipated and revenues are now expected to increase by $1.4 billion (6.5 percent).
In 2017 through 2019, IBO expects continued tax revenue growth averaging 4.5 percent annually. Tax revenues are forecast to reach $59.6 billion by 2019. Business income taxes and the property tax are expected to continue to be the most robust among the city’s major tax sources, although in both cases annual growth slows somewhat from 2016 levels to 5.7 percent and 5.4 percent, respectively, over the last three years of the financial plan.
IBO’s tax revenue forecast was completed before the labor department released revised employment data for 2013 and 2014. As discussed earlier (see page 11), the revision shows that the city’s labor market was even stronger than previously thought. Because employment and wage data are critical to forecasting tax revenue it is likely that these changes will have an effect on our projections when we incorporate them into our next revenue forecast. But the difference may be somewhat muted given that the 2013 counts were also revised upward making the year-to-year

ANALYSIS OF THE MAYOR’S PRELIMINARY BUDGET FOR 2016
NYC Independent Budget Office March 201520
change measures closer to those we used in this forecast. Because the Mayor’s preliminary budget estimates also predate the revised employment data, comparisons of tax revenues between IBO’s forecast and OMB’s are not affected by the revisions.
Continued difficulties in the securities industry, including depressed aggregate earnings, minimal increases in employment, and an expectation of little increase in profits mean that Wall Street is unlikely to account for much new tax revenue for the city. IBO expects growth in the securities sector—along with growth in the sector’s contribution to city tax revenues—to remain relatively modest compared with growth during the pre-2008 expansion or even the more recent years of recovery.
IBO’s forecast does not include double-digit tax revenue growth, something that did occur each of the boom years from 2004 through 2007. Nor does IBO’s forecast assume an acceleration of growth over the recent past. Indeed, the average annual growth projected for 2015 through 2019—4.6 percent—is less than two-thirds the 6.4 percent annual average rate that occurred over the preceding five years of the expansion (2010 through 2014).
Compared with the city’s revenue forecast when the 2015 budget was adopted last spring, IBO’s new forecast is $2.1 billion (4.4 percent) higher for this year and our outlook for 2016 is $2.2 billion (4.4 percent) above the adopted budget estimate. The
IBO Revenue ProjectionsDollars in millions
2015 2016 2017 2018 2019Average Change
Tax Revenue
Property $21,172 $22,552 $23,689 $24,977 $26,424 5.7%Personal Income 10,005 10,371 10,687 10,903 11,448 3.4%General Sales 6,781 7,084 7,384 7,648 7,903 3.9%General Corporation 2,890 3,019 3,183 3,333 3,466 4.7%Unincorporated Business 2,070 2,313 2,525 2,751 2,954 9.3%Banking Corporation 1,171 1,214 1,253 1,288 1,312 2.9%Real Property Transfer 1,537 1,543 1,614 1,667 1,707 2.7%Mortgage Recording 993 1,002 1,026 1,054 1,092 2.4%Utility 403 428 443 457 469 3.9%Hotel Occupancy 573 612 646 674 697 5.0%Commercial Rent 742 786 809 829 844 3.3%Cigarette 51 49 46 44 42 -5.0%Other Taxes and Audits 1,488 1,252 1,248 1,248 1,248 -4.3%Total Taxes $49,876 $52,225 $54,553 $56,874 $59,606 4.6%
Other Revenue
STaR Reimbursement $861 $849 $854 $860 $865 0.1%Miscellaneous Revenue 5,766 5,087 4,955 5,000 5,196 -2.6%Unrestricted Intergovernmental Aid - - - - - n/aDisallowances (15) (15) (15) (15) (15) n/a
Total Other Revenue $6,612 $5,921 $5,794 $5,844 $6,046 -2.2%
TOTAL CITY-FUNDED REVENUE $56,487 $58,146 $60,347 $62,718 $65,652 3.8%
State Categorical Grants $12,462 $12,774 $13,184 $13,641 $13,685 2.4%Federal Categorical Grants 8,328 7,161 6,977 6,934 6,841 -4.8%Other Categorical Aid 910 869 877 885 882 -0.8%Interfund Revenue 573 547 543 545 545 -1.2%TOTAL REVENUE $78,760 $79,497 $81,929 $84,723 $87,606 2.7%NOTE: Figures may not add due to rounding.
New York City Independent Budget Office

REVEUNE PROJECTIONS
NYC Independent Budget Office March 2015 21
strength in 2015 collections is not entirely surprising—IBO’s forecast last spring suggested that the city was underestimating 2014 revenues by $781 million. Moreover, even before the revised labor data was released the local labor market and real property assessments proved to be even stronger than expected last fall, prompting an upward revision of $733 million in our forecast for 2015 tax revenue, with the largest changes made to the personal income tax and real property transfer tax forecasts. We made more modest adjustments of between $523 million and $654 million to our projections from last fall for 2016 through 2018.
IBO’s latest tax revenue forecast for 2015 is $308 million (0.6 percent) higher than OMB’s preliminary budget forecast. The gap between the two forecasts widens substantially next year to $1.3 billion and then grows steadily each year, from $1.8 billion in 2017 to $2.9 billion in 2019 when IBO’s forecast of total tax revenues exceeds OMB’s by 5.1 percent.
Real Property Tax
IBO projects that property tax revenue will grow from $21.2 billion in 2015 to $22.6 billion in 2016, a 6.5 percent increase.1 The 2016 tentative assessment roll revealed strong growth in assessed value for Class 2 (consisting of coop, condo, and rental apartment buildings) and Class 4 (all commercial property), leading IBO to increase its 2016 revenue forecast by $478 million since December. After 2016 we expect property tax revenue to grow at an average annual rate of 5.4 percent through 2019. IBO’s forecast does not take into consideration possible effects of the not-yet-enacted state budget, which includes a proposal that would alter the STAR exemption program; nor does it take into consideration revenue loss due to three property tax credits proposed by the City Council.
The Tentative Assessment Roll for 2016. In January, the Department of Finance (DOF) released the tentative 2016 assessment roll. After taxpayer challenges and other department adjustments are processed, assessments will be finalized in May and used for setting 2016 tax bills. IBO anticipates the final assessment roll will be about 1.5 percent smaller than the tentative roll. This reduction is greater than the five-year average reduction of 1.1 percent in part because for the first time the tentative roll includes $2.5 billion of assessed value for Battery Park City Authority
property as taxable. The Department of Finance is expected to reverse the action, restoring the authority’s historical tax-exempt status for the final roll.
Before the assessment roll is finalized in May, property owners’ challenges to their assessments and the finance department’s assessment reviews and processing of new exemptions are expected to reduce aggregate assessed value. We anticipate that aggregate Class 4 assessments on the final roll will be 2.0 percent less than on the tentative roll, with more modest reductions expected for Class 1 and Class 2 of 0.1 percent and 1.2 percent, respectively. These reductions will be partly offset by an expected increase of $377 million of assessed value for Class 3 utility property in anticipation of state assessments expected in April. Once property owners’ challenges and the finance department’s reviews and processing are completed, IBO projects that the final roll for 2016 will show $195.2 billion of taxable assessed value.
The Outlook for Market Value and Assessed Value in 2016. When the roll is finalized in May, IBO forecasts that market value in the city will total $961.0 billion, 6.0 percent greater than 2015. This growth rate is almost twice the average annual growth of 3.4 percent experienced from 2012 through 2015. Even with our expectation of a larger than usual reduction from the tentative to the final roll, 2016 taxable assessed value is projected to grow 7.0 percent over 2015; by comparison, it averaged 5.5 percent annually from 2012 through 2015.
Class 1. IBO forecasts aggregate market value of Class 1 properties (primarily one-, two-, and three-family houses) will grow 4.2 percent in 2016 and taxable assessed value will grow 2.5 percent. These rates are slower than growth rates in 2015—4.6 percent for market value and 4.2 percent for assessed value.
In Class 1, the assessed value of a property moves toward a target of 6.0 percent of market value, with assessment increases capped at 6.0 percent a year or 20.0 percent over five years. If a parcel is assessed at less than 6.0 percent of market value, its assessed value grows until it hits the target ratio of 6.0 percent of market value or it reaches the cap on annual assessment increases—even if the market value stays flat or declines. During the housing boom, the median ratio of assessed value to market value for

ANALYSIS OF THE MAYOR’S PRELIMINARY BUDGET FOR 2016
NYC Independent Budget Office March 201522
one-family homes outside Manhattan declined from 5.4 percent in 2004 to a low of 3.7 percent in 2008, well below the 6.0 percent target. From 2009 through 2014, the median assessment ratio increased, from 4.0 in 2009 to 5.4 percent in 2015. The median assessment ratio declined slightly to 5.3 percent on the tentative 2016 roll.
Class 2 and Class 4. IBO projects that on the final roll for 2016, aggregate market value for Class 2 properties will total $234.2 billion, 8.5 percent greater than 2015. Since 2014, Class 2 market value will have grown by 15.7 percent, reflecting a generally strong city housing market from calendar years 2012 through 2014. Nonetheless, recent increases in the value of Class 2 properties trail those from 2004 through 2008 when the three-year moving average growth was often over 30 percent. Meanwhile, in Class 4, despite the larger than usual reduction from the tentative to final roll, market value is expected to reach $264.2 billion, a 7.1 percent increase over 2015.
Aggregate assessed value for tax purposes is expected to be $68.3 billion for Class 2, 7.6 percent higher than 2015, and $97.0 billion for Class 4, a year-over-year increase of 7.5 percent. Both classes are projected to see stronger growth this year than the average annual growth for the previous eight years, 5.4 percent in Class 2 and 6.3 percent in Class 4.
This stronger growth in assessed value for tax purposes stems partly from the method for capturing changes in market value. Increases and, in many cases, decreases in parcels’ market values are phased in over five years. The assessed value changes from the preceding four years that have yet to be recognized on the tax roll are called the pipeline. Strong growth in recent years, especially in Class 4, has replenished the pipeline. IBO projects that the pipeline will reach $20.4 billion in 2016, a 16.1 percent increase from last year and a threefold increase since 2011.
Changes to the State’s STAR Exemption. Governor Cuomo’s executive budget proposes replacing the STAR property tax exemption with a refundable property tax credit administered through the state income tax, which is discussed on page XX. The transition would occur in multiple steps over four years and it is not known how many city taxpayers would switch or when. However, since rates for the real property tax are set
on assessed value before the STAR exemptions are applied, and because the city is already reimbursed for property tax revenue lost to STAR, the proposal should not impact city tax rates or revenue.
Outlook for Market and Assessed Values in 2017 Through 2019. For 2017, IBO forecasts an increase in aggregate market value of 5.4 percent. Growth in market value is projected at 4.0 percent in Class 1, 7.2 percent in Class 2, and 4.9 percent Class 4. In 2018 and 2019, annual market value growth is projected to average 5.2 percent for these three classes. Class 1 growth will be slower at 3.8 percent a year on average, while Class 2 and Class 4 are projected to increase an average of 6.0 percent and 6.8 percent a year, respectively.
IBO projects growth of 5.8 percent in aggregate assessed value for tax purposes in 2017, slower than this year. Total assessed value for tax purposes in Class 1 is expected to increase an average of 2.8 percent a year from 2017 through 2019.
Strong growth in assessments since 2011 has swelled the pipeline of Class 2 and Class 4 assessed value, thus providing a substantial supply of value in the event of slower growth of the tax base in the future. Based on the tentative roll, the Class 2 pipeline is expected to increase to $9.5 billion by 2019 while the Class 4 pipeline is expected to grow to $12.2 billion.
Revenue Outlook. After the Department of Finance completes the assessment roll, the actual property tax levy is determined by the City Council when it sets the tax rates for each class. Both the de Blasio Administration’s and IBO’s baseline property tax revenue forecast assume that the average tax rate during the forecast period will remain 12.28 percent, the rate set by the City Council in December 2008 when the Council enacted Mayor Bloomberg’s proposal to rescind a short-lived 7.0 percent rate reduction.
The amount of property tax revenue in a fiscal year is determined not only by the levy, but also by the delinquency rate, abatements granted, refunds for disputed assessments, collections from prior years, and other property tax debits and credits called “reserve components.” Taking the reserve into account, IBO projects that property tax revenue for 2015 will total $21.2 billion, 6.0 percent higher than in 2014.

REVEUNE PROJECTIONS
NYC Independent Budget Office March 2015 23
For 2016, IBO forecasts property tax revenue of $22.6 billion, an increase of $478 million since our December 2014 forecast, with most of the increase attributable to the stronger than anticipated 2016 assessment roll. From 2017 through 2019, revenue growth is projected to average 5.4 percent a year, reaching $26.4 billion by the last year of the forecast period. This projected revenue growth is slower than the 5.8 percent average annual growth seen during 2012 through 2014.
IBO’s property tax revenue forecast is just $1.7 million above OMB’s for 2015, stemming from small differences in the reserve. For 2016, our revenue forecast is $439 million above OMB’s, with the difference primarily attributable to divergent forecasts of the reserve. IBO anticipates tax cancellations and refunds to be $219 million less than that forecast by OMB, while we expect prior year collections to be $8 million greater than OMB projects. Through the forecast period, IBO projects stronger revenue growth than does OMB, with our revenue forecast exceeding the de Blasio Administration’s by $548 million, $827 million, and $1.2 billion from 2017 through 2019, respectively. The forecast variations are again mostly attributable to differences in anticipated revenue flows from reserve components in the later years of the forecast period.
IBO’s forecast does not take into consideration possible revenue impacts due to two state property tax credits proposed in Governor Cuomo’s Executive Budget for 2015-2016, which are discussed later in this report (see page 29).
Our forecast also does not reflect the potential effect of three property tax credits proposed by the City Council via resolution that call on the state to adopt legislation allowing relief for homeowners, small businesses, and commercial landlords. The resolutions for small businesses and commercial landlords do not prescribe any benefit levels, and so IBO cannot estimate potential revenue impacts.2 The third resolution, however, calls for a one-time, nonrefundable credit of $500 for Class 1 and Class 2 homeowners who use the property as their primary residence.3 IBO estimates that 568,000 homeowners would be eligible if the legislation is adopted, at a cost to the city of $398 million. Additionally, IBO calculates the credit would completely eliminate property tax liability for nearly 40,000 homeowners.
Property Transfer Taxes
Revenues from the real property transfer tax (RPTT) and the mortgage recording tax (MRT)—collectively referred to as the transfer taxes—have been stronger than anticipated in recent months, and IBO has revised its 2015 projections upward for the two taxes. The projected sum of the two taxes for 2015 is $2.5 billion, the highest level since 2008. IBO projects modest average annual growth of 2.6 percent in the sum of the two taxes from 2015 through 2019. By 2019, the combined revenues from the RPTT and MRT are forecast to reach just under $2.8 billion—still below the 2007 peak of $3.3 billion, but far greater than in 2009 through 2011 in the aftermath of the financial crisis.
RPTT collections have recovered strongly since 2012. Revenues totaled just over $1.5 billion in 2014, a jump of 40.7 percent from 2013, and the second-highest amount on record after the $1.7 billion collected in 2007. IBO’s December forecast anticipated a decline in RPTT revenues for 2015, but based on the strength of subsequent collections, IBO now projects a slight increase of around $10 million. The overall trends in RPTT revenues during the past decade have been driven largely by variation in the strength of commercial property markets, which are subject to greater year-
0200400600800
1,0001,2001,4001,600
1,800$2,000
20052007
20092011
2013
RPTT Revenue from Sales of Residential Properties
RPPT Reveune, dollars in millions
Commercial Property Sales Have Been the Driving Force Behind Fluctuations in Real Property Transfer Tax Revenue
Total RPTT Revenue
RPTT Revenue from Sales of Commercial Properties
SOURCE: Department of FinanceNew York City Independent Budget Office
Fiscal Year

ANALYSIS OF THE MAYOR’S PRELIMINARY BUDGET FOR 2016
NYC Independent Budget Office March 201524
to-year fluctuations in the value and volume of sales than are residential properties. Commercial buildings also are subject to higher RPTT rates than residential properties, and thus have an outsized influence on the overall level of RPTT revenue.
There were 89 taxable commercial sales valued at over $100 million in the first eight months of this fiscal year, compared with 70 such sales during the same period of 2014. The largest transaction so far this year has been the sale of the office building at 1095 Avenue of the Americas (6th Avenue and 42nd Street) for $2.2 billion.
Low interest rates, the global search for a safe haven for capital, and the prospect of rising rents have all contributed to intense activity in the city’s commercial real estate market in recent years. As interest rates rise and new commercial space becomes available at the World Trade Center, Hudson Yards, and other sites, sales activity is expected to decline. IBO projects that the level of commercial real estate sales will begin to subside in the remaining months of 2015 and into 2016. Growth in commercial sales is projected to resume in 2017, but at a lower level than the past two years.
IBO forecasts that the value of residential sales will grow at a modest pace from 2016 through 2019. As has been the case since the financial crisis, the growth will take place primarily through an increase in the average value per sale, rather than an increase in the number of transactions. The number of residential sales in New York City was just over 53,000 in 2014, compared with almost 78,000 in 2006. With the supply of residential properties available for sale expected to remain relatively low, there will continue to be upward pressure on prices, despite likely increases in mortgage interest rates.
With the decline in commercial real estate transactions offset by modest growth in residential sales, RPTT revenue is expected to remain essentially unchanged in 2015 and 2016. Average annual growth of 3.4 percent is projected between 2016 and 2019, with RPTT revenue reaching $1.7 billion in 2019, similar to the 2007 peak.
Mortgage recording tax revenues fell more sharply than RPTT collections in the wake of the financial crisis. From a high of almost $1.6 billion in 2007, MRT revenues plunged to just $366 million in 2010. While revenues have increased substantially since 2010—
reaching $961 million in 2014—they remain about one-third lower than in 2007.
The MRT does not track the value of real estate sales as closely as does the RPTT because not all sales are financed using a mortgage. Loans to finance the purchase of coop apartments are not considered mortgages under current New York State law because technically the buyer is purchasing shares in a corporation rather than a piece of real estate. All-cash sales are common in the city’s luxury housing market, both among U.S. residents and the foreign buyers who are believed to account for a considerable share of high-end residential purchases. If foreign buyers obtain financing overseas, no mortgage is recorded in New York City, and no MRT liability is incurred. For sales that do involve a mortgage, the ratio of the mortgage to the sales price varies widely from one transaction to another. Moreover, the pace of mortgage refinancings—which are usually at least partially subject to the MRT—are not directly related to trends in property sales.
Historically, high MRT collections have generally corresponded to periods of low interest rates and significant refinancing activity. The low mortgage rates that are a hallmark of the post-2008 crisis have persisted for longer than expected, and while lending standards remain stricter than during the years leading up to the financial crisis, credit availability has improved in recent years.
Based on the strength of MRT collections through January, and the expectation that there will be a flurry of refinancings in coming months as borrowers seek to lock in low rates before they begin to rise later this calendar year, IBO projects $993 million in MRT revenue for 2015, a 3.3 percent increase over 2014 receipts. After 2015, IBO forecasts slower MRT growth at an annual average rate of 2.4 percent through 2019, with 2019 revenues projected just short of $1.1 billion—still well below the 2007 peak of $1.6 billion.
IBO’s projections for both RPTT and MRT are slightly above OMB’s for each year of the financial plan. For the entire 2015-2019 period, our RPTT and MRT forecasts are 2.9 percent and 3.5 percent, respectively, above OMB’s. IBO’s higher forecasts for transfer tax revenues are attributable in part to our expectation of faster employment and personal income growth than OMB projects.

REVEUNE PROJECTIONS
NYC Independent Budget Office March 2015 25
Commercial Rent Tax
IBO’s forecast for 2015 commercial rent tax (CRT) revenue is $742 million, 4.5 percent higher than the total for 2014. CRT collections during the first four months of this fiscal year have been strong. The intense activity in commercial real estate markets that has caused a surge in RPTT and MRT revenues has also pushed up asking rents and leasing activity as demand for office space remains strong. For 2016, IBO projects revenue of $786 million—growth of 5.9 percent—as office-using employment and average office rents continue to rise. IBO projects slower growth in CRT revenue after 2016, averaging 2.4 percent annually through 2019. By 2019, revenue is forecast to reach $844 million, 18.9 percent more than in 2014.
The CRT is a tax imposed on tenants renting space for business, professional, or commercial purposes in much of Manhattan below 96th Street. Not-for-profit organizations, subtenants, tenants located in the World Trade Center area, and tenants located in the Commercial Revitalization Program abatement zone are all exempt from the tax, as are most retail tenants south of Chambers Street. Over time both the tax rate and the geographic area subject to the tax have been
reduced. Currently, tenants whose annual gross rents are less than $250,000 are exempt from the tax, and a sliding tax credit is applied to tenants with annual or annualized rents between $250,000 and $300,000. For those tenants who are subject to the tax and whose annual or annualized rent is over $300,000, the effective tax rate is 3.9 percent of gross rent.
Annual CRT collections depend on the tax rate, rent levels, and the amount of rental space subject to the tax. Unlike the transfer taxes, CRT revenue has not evidenced significant year-to-year fluctuations. Since the last rate reduction in 1999, CRT revenue has risen continuously, increasing even in the aftermath of the 2008 financial crisis when revenue growth slowed but remained positive, averaging 1.6 percent annually in 2010 and 2011. More recently, revenue growth has accelerated and a 7.0 percent gain in 2014 was the highest since 2007. The projected slowdown in CRT growth after 2016 coincides with IBO’s anticipation of slower growth in rents, due to slower growth in office-using employment as well as significant amounts of new office space becoming available in Manhattan, including areas such as the World Trade Center site that are exempt from the tax.
IBO’s CRT forecast for 2015 is $7.0 million higher than OMB’s, a difference of less than 1.0 percent. IBO’s 2016 and 2017 forecasts are 2.7 percent and 1.1 percent above OMB’s, respectively, while our 2018 and 2019 forecasts are slightly lower.
Personal Income Tax
IBO has increased its forecast of personal income tax (PIT) revenue for the current fiscal year to $10.0 billion, $466 million (4.9 percent) greater than 2014 receipts. With employment and personal income gains this past calendar year outpacing previous expectations, it is not surprising that collections to date in 2015 have been coming in stronger than anticipated. With the outlook for continued though less robust income and employment growth in calendar years 2015 and 2016, IBO’s PIT forecast for fiscal year 2016 is $10.4 billion, 3.7 percent greater than the revenue projected for this year. After 2016, we expect PIT revenue growth to slow further, in line with our forecast of slower income and employment growth.
Withholding payments—the single largest component of PIT receipts—are projected to increase by 7.9 percent
0
200
400
600
800
1,000
1,200
1,400
1,600
$1,800
MRT Reveune, Actual MRT Revenue, Forecast
MRT Reveune, dollars in millions
20052007
20092011
20132015
20172019
Mortgage Recording Tax Revenue Is Projected To Remain Well Below Pre-Financial Crisis Peak
SOURCE: Department of FinanceNew York City Independent Budget Office
Fiscal Year

ANALYSIS OF THE MAYOR’S PRELIMINARY BUDGET FOR 2016
NYC Independent Budget Office March 201526
this year, the highest rate of growth since 2007. From July through November withholding collections were 8.3 percent higher than during the same period in 2014, reflecting strong employment gains in New York City. Since the start of the bonus-paying season in December through February, collections are up 5.1 percent—stronger growth than last calendar year’s dip in Wall Street profits would suggest, resulting from employees exercising deferred compensation options granted as bonuses in prior years. Given IBO’s forecast that security industry profits will remain in the $16 billion to $18 billion range in the next several years and that employment and income growth will slow, we expect growth in withholding to slow as well. Employment growth in calendar years 2015 and 2016 is expected to be well below the torrid growth of 2014, which in turn will slow withholding growth. IBO forecasts 5.5 percent growth in withholding in 2016 and slower growth in subsequent years.
After a decline in 2014, estimated payments have been rising in 2015. Estimated payments are made by taxpayers who are self-employed or who anticipate realizing capital gains from the sale of financial and property assets, along with those filing for extensions to delay the deadline for final returns past April 15th. Estimated payments fell by 7.4 percent in 2014 because many taxpayers choose to speed up realization of capital gains to take them in calendar year 2012 in anticipation of federal tax hikes that took effect in January 2013. This shift in the timing of realizations boosted fiscal year 2013 revenue at the expense of revenue in 2014 and (to a lesser extent) 2015. IBO forecasts a 4.0 percent increase in estimated payments this year and 3.0 percent in 2016. Despite the resumption of revenue growth, IBO projects that estimated payments for 2015 and 2016 will still be below the amount collected in 2013.
With IBO expecting personal income growth to peak at the end of calendar year 2015 and start falling steadily by the middle of 2016, we project PIT growth will slow to an annual average rate of 3.3 percent in fiscal years 2017 through 2019. Withholding receipts after 2016 are forecast to increase every year, though at slower growth rates due to slower employment and income growth. Total PIT growth will also be dampened by projected declines in estimated payments in 2017 and 2018 as capital gains income levels off as the U.S. economy slows.
IBO projects faster city income and employment growth than OMB during the forecast period, particularly in calendar years 2015 and 2016. As a result IBO’s personal income tax forecast exceeds OMB’s each year through 2019, with the difference between the two forecasts growing in all years except 2018. For the current year, our forecast is $188 million (1.9 percent) above OMB’s and for 2016 the difference rises to $295 million (2.9 percent). By 2019, IBO projects $540 million (5.0 percent) more PIT revenue than does OMB.
Business Income Taxes
IBO projects that the combined revenue from the city’s three business income taxes will be $6.1 billion in 2015, an increase of 4.3 percent from 2014. This growth, which follows a year when combined business tax revenue was essentially unchanged, will finally bring business tax collections above the $6.1 billion total generated in 2007. Revenue growth is expected to accelerate in 2016, increasing to 6.7 percent—yielding $6.5 billion in combined revenue—and then slow to 5.7 percent on an average annual basis during the remainder of the financial plan period.
The three taxes are expected to have markedly different trajectories over the 2015 through 2019 period. For 2015, IBO projects collections for the unincorporated business tax (UBT) to expand by 9.9 percent and the general corporation tax (GCT) to grow by 4.5 percent. Banking corporation tax (BCT) revenue, however, is forecast to decline by 4.5 percent this year. IBO expects momentum in GCT and UBT collections to generally continue in 2016. UBT revenue growth is expected to accelerate further to 11.7 percent in 2016, while growth in GCT collections is expected to remain at the same rate in 2016 as in 2015 (4.5 percent). BCT revenue growth is projected to resume in 2016, with collections increasing by 3.6 percent over 2015’s total. Beginning in 2017, IBO expects growth for all three taxes to continue but at diminished rates as both the national and local economies slow in the later years of our forecast; of the three, the UBT will continue to be the fastest growing and the BCT the slowest.
IBO forecasts general corporation tax revenue of $2.9 billion for 2015—4.5 percent ($124 million) higher than collections in 2014. Through January, GCT collections for 2015 are up $38 million (2.9 percent) over the same period last year. Data on current-year payments

REVEUNE PROJECTIONS
NYC Independent Budget Office March 2015 27
indicate that much of the growth so far has come from firms in retail and wholesale trade (up 59.8 percent) and real estate (up 86.8 percent). Other sectors that are large contributors to GCT revenue, such as finance and insurance, information, and personal and business services have seen less robust collections growth this year but are expected to continue expanding beyond the current fiscal year and help sustain GCT revenue growth in 2016. While securities industry profits in calendar year 2014 were down 4.5 from their level in 2013 to $16.0 billion, Wall Street firms remain an outsized source of GCT revenue. However, they are expected to contribute only moderately to growth in GCT collections over the next few years. IBO expects Wall Street profits to remain essentially flat—ranging from $15.6 billion to $17.9 billion in the forecast period—as rising interest rates, increasing compensation expenses, and additional regulatory and compliance costs portend lower profit margins. For 2017 through 2019, IBO projects that GCT collections will grow at an average annual rate of 4.7 percent.
UBT revenue is projected to grow at an annual average rate of 9.9 percent from 2015 through 2019, a faster pace than that of the other two business taxes over the forecast period. Driving the outlook for strong UBT growth is the professional and business services sector, which includes many UBT-paying partnerships in fields such as management consulting, advertising, and technology, and is projected to add 92,000 jobs (an increase of 13.9 percent) over the next four years. For 2015, IBO forecasts $2.0 billion in UBT revenue—$188 million (9.9 percent) greater than in 2014—which would bring UBT collections to an all-time peak. Collections through January are up $153 million (16.6 percent), compared with the same period last year, and strong growth is expected for the rest of the year. With both the local and national economies forecast to continue expanding in calendar year 2015, IBO anticipates even faster UBT revenue growth next year of 11.7 percent. Beyond 2016, we project revenue growth at an average annual rate of 8.5 percent through 2019, when UBT collections are expected to approach $3 billion.
The banking corporation tax is the city’s most volatile among its major sources of revenue, with strong revenue growth in one year often followed by a steep decline the following year. A key cause of the bank tax’s volatility is very large year-to-year fluctuations in refunds
resulting from overpayments of estimated liabilities—overpayments that can be triggered by the timing of deductions for net operating losses. Through January, BCT receipts for the current fiscal year are slightly less than receipts during the same period last year, and IBO forecasts a $56 million (4.6 percent) decline in collections, yielding $1.2 billion in BCT revenue when 2015 is complete. For 2016, IBO expects BCT collections to grow at 3.6 percent and regain their 2014 level of $1.2 billion. Thereafter, IBO expects slower BCT growth, at an annual average rate of 2.6 percent.
There are several reasons to expect BCT revenue growth to slow in the coming years. Rising interest rates will increase the cost of obtaining funds and thereby take a toll on bank profits. Many of the recent settlements between large banks and the U.S. government over practices leading up to the 2008 financial crisis include payments by the banks. To the extent these payments are deductible, they lower banks’ taxable income, thereby shrinking BCT collections. Instituting Dodd-Frank regulations, including the adopted Volcker Rule, is also expected to negatively effect BCT collections by limiting some activities by banks, including highly lucrative (but potentially risky) proprietary trading.
IBO’s revenue forecast for the combined business income taxes is very similar to OMB’s for the current year. For 2016, IBO’s forecast is a total of $283 million above OMB’s—$69 million higher for GCT, $194 million higher for UBT, and $19 million higher for BCT. The difference between the two forecasts grows each year and reaches $923 million in 2019, reflecting differences in the forecasts of economic growth.
General Sales Tax
Following strong growth in sales tax collections in 2014 (5.9 percent), IBO forecasts somewhat slower but still substantial growth of 4.4 percent ($287 million) in 2015, with $6.8 billion in projected revenue. In the first seven months of fiscal year 2015, collections have been growing at a somewhat brisker pace—5.0 percent over the same period last year—but slower growth is expected for the remainder of the year. Sales tax revenues are forecast to total $7.1 billion in 2016—4.5 percent higher than in 2015. Growth is expected to gradually taper off over the remainder of the financial plan period, with revenues reaching $7.9 billion in 2019.

ANALYSIS OF THE MAYOR’S PRELIMINARY BUDGET FOR 2016
NYC Independent Budget Office March 201528
IBO’s sales tax forecast is influenced by the trajectory of projected growth in local personal income and wages. Setting aside the unusually strong year-over-year personal income growth in the first quarter of calendar year 2014, personal income growth in the remaining quarters of the year was 4.9 percent. IBO forecasts moderate personal income growth of 4.5 percent in 2015 and 5.3 percent in 2016. The expected gain in personal income in the forecast period reflects increases in the number of jobs in mid- and high-wage industries and rising wages in most sectors of the economy. However, we do not expect increases in spending and sales tax revenue to be proportional to income. After finally returning to levels not seen since the start of the recession, consumer confidence has wavered in recent months. Some confirmation of the trend in the consumer confidence survey results comes from data showing that a large portion of the increase in disposable income stemming from low gas prices has not been spent on consumption goods. Moreover, much of the income growth will be enjoyed by higher income households that tend to save larger shares of their income.
IBO expects increases in sales tax revenue to be constrained by slower growth in international tourism, a result of the slowing economies in much of Europe, Asia, and Brazil. Actions by central banks to stimulate their economies by lowering interest rates have contributed to the depreciation of the Euro and other currencies relative to the U.S. dollar. As a result, it has become more expensive for international visitors to travel to the U.S. and to make purchases during their stay. Conversely, the dollar’s appreciation has made it relatively less costly for U.S. residents to travel abroad, luring some who would have otherwise visited New York.
Slower economic growth nationally and locally starting in calendar year 2017 is expected to reduce the growth of sales tax collections. IBO projects an annual average increase in sales tax revenue of 3.7 percent in fiscal years 2017 through 2019, with revenue reaching $7.9 billion in 2019. IBO’s sales tax forecast is approximately the same as OMB’s in the current year and $39 million (0.6 percent) higher in 2016. Differences in the two forecasts remain small throughout the forecast period.
Hotel Occupancy Tax
IBO forecasts $573 million in hotel tax revenue in 2015, an increase of 6.8 percent over 2014
collections. Collections through January have grown by 8.0 percent over the same period last year, but we expect collections to grow less rapidly in the remainder of the year. Slower economic growth in regions and countries that account for the largest numbers of international tourists to New York City and the strength of the U.S. dollar are likely to constrain growth in international tourism to the city in the near term. But with 12.2 million of the record 56.4 million visitors to the city coming from outside the country in calendar year 2014, growth is slowing from a very high base.
For fiscal year 2016, IBO expects hotel tax revenue to grow 6.9 percent to $612 million. This will be largely driven by faster U.S. economic growth and lower gasoline prices boosting domestic tourism. Moreover, the number of new hotels scheduled to open in the next few years will enable the city to absorb more visitors. Though increases in the number of hotel rooms is expected to lower occupancy rates (from the record high of 89.2 percent seen in calendar year 2014) and constrain increases in room rates (which rose $5 on average to $294 in 2014), the actual number of hotel room nights sold is projected to continue rising. Over the forecast period hotel tax revenue growth of 5.6 percent is expected in 2017 and 3.8 percent on average in 2018 and 2019.
IBO’s hotel tax forecast is approximately the same as OMB’s in the current year. For 2016, IBO’s revenue projection is $62 million (11.3 percent) higher than OMB’s due to IBO’s forecast of faster national economic growth and more rapid gains in income through calendar year 2017. The difference grows each year thereafter, reaching $128 million in 2019.
Other Revenues
The city’s nontax revenues combine a variety of fees, fines, charges, asset sales, interest income, and other miscellaneous revenues, which total $6.6 billion this year. The Mayor’s preliminary budget anticipates that nontax revenues will fall to $5.9 billion next year, a decline of $691 million. One reason for the drop is that the 2015 total includes a one-time $1.0 billion transfer from the Health Insurance Stabilization fund, which was a product of the agreement between the city and the municipal labor committee on ways to help fund the current round of collective bargaining agreements. The difference between 2015 and 2016 would have been

REVEUNE PROJECTIONS
NYC Independent Budget Office March 2015 29
even greater without the shift of over $500 million in revenue that had been anticipated from the sale of taxi medallions during 2015 to later years. IBO’s revenue estimate includes additional reductions in the revenue forecast from these sales due to recent declines in market prices for medallions.
State, federal, and other categorical aid and interfund revenue are the remaining sources among nontax revenues. They are expected to total $22.3 billion this year, which includes $1.2 billion in anticipated Hurricane Sandy assistance from the federal government for the city’s operating budget. The bulk of that money has been allocated through the federal government’s community development grant process to help in the recovery and is scheduled to be spent this year, which largely accounts for the decline in this revenue category to $21.4 billion in 2016. After 2016, state, federal, other categorical and interfund revenues resume growing at a slower pace; annual growth is expected to average 0.9 percent in 2017 through 2019. By the last year of the financial plan, these grants are expected to total $22.0 billion.
Tax Policy and the New York State Budget
The New York State 2015-16 Executive Budget that was submitted by Governor Cuomo in January contains several changes to New York City and New York State’s taxes. (As of publication of this report the state budget has not been enacted by the Legislature.) While these changes would affect the tax liabilities of many households and businesses located in the city, the city’s preliminary budget assumes that they will have no effect on the financial plan’s projected surpluses or deficits.
The most far-reaching impact on city taxes in the budget legislation comes from a package of major revisions to the city’s business income taxes that would affect most large corporations in the city. Together all of the business tax changes are intended to be revenue neutral, with the tax cuts received by some corporations offset by increased liabilities for others. The budget would also reduce STAR’s personal income tax and real property tax benefits for some households, but the resulting increase in the city’s tax revenues would be offset by a corresponding decrease in state revenue to the city. Another provision would benefit households with property tax liability that is high relative to their household income by creating a credit
against the state’s personal income tax. This new credit would not affect either property tax liability or the city PIT liability of city residents.
Business Tax Changes. Last spring’s state budget legislation included a major overhaul of the state’s corporate taxes, effective January 1, 2015. Earlier this year the de Blasio Administration proposed similar changes to the city’s own corporate taxes, with the goal of increasing conformity of city taxes with the state’s now revised corporation tax. Conformity would ease compliance burdens for city taxpayers, who are—by definition—also state taxpayers. The changes to the city’s tax laws have been incorporated into this year’s state budget legislation now being considered in Albany, and if the budget is adopted they would take effect retroactive to January 1, 2015. For now, the provisions in the reform package are limited to “C corporations,” which is the most common corporate form used by mid-size and large corporations; the taxation of small corporations known as “S corps,” and partnerships and proprietorships subject to the unincorporated business tax would not be altered.4
The Mayor has said that the set of business tax changes would be revenue neutral, although some taxpayers would pay more and others would pay less. Because the de Blasio Administration has made only limited information available about these complex changes, it is not possible to independently examine the fiscal impact of each component, or when each proposed change would begin to affect the city’s revenue flow. Even if the changes are essentially in balance over a number of years, it is quite possible that in the first few years under the proposed changes that the net fiscal impact would not be zero, although that is how it is presented in the city’s preliminary budget.
Conformity in the structure and rates of business income taxes across the state and the city is expected to simplify the processes of filing, collecting, and auditing taxes, as well as make it easier to forecast behavioral effects of policy changes. To this end the city would mirror the single corporation tax that now exists in the state tax system by extending the general corporation tax to banks and eliminating what until now has been a separate banking corporation tax. Activities that are common to both bank and nonbank financial companies are currently taxed differently, depending on corporation type. Under conformity these corporations

ANALYSIS OF THE MAYOR’S PRELIMINARY BUDGET FOR 2016
NYC Independent Budget Office March 201530
would be taxed uniformly, making the city’s tax treatment of corporate income fairer.
There would be significant changes to the calculation of tax liability for all corporations, including: setting the basic tax rate at 8.85 percent (slightly less than the current BCT rate); eliminating the net income plus compensation base; increasing the fixed minimum tax; narrowing the definition of investment income so that expenses cannot be misallocated between the business and investment sides of the corporation; and eliminating exemptions for income from subsidiary capital. The city’s Department of Finance estimates that these changes together would generate $210 million of additional tax revenue, with the revenue to be gained from some of the changes out-weighing the revenue to be lost by others. (Unless otherwise noted, all revenue estimates in the discussion of business tax changes were made by DOF.)
Another important change concerns apportionment rules that determine how much of the total income of multijurisdictional firms is to be taxed by New York City. Under the proposed “customer-based sourcing rule,” allocation of net income taxable by the city would now be determined solely by the percent of sales or receipts from consumers located in the city. The city has been phasing in a sales-based allocation formula since 2009 for GCT and UBT payers, and the new rule would encompass all financial institutions, while also sourcing their tax liability to the fraction of their customer base located in New York City. Most banks (and other financial corporations) in the city serve national and global markets, and with city customers accounting for only a small portion of their deposits and receipts, it is likely that their tax liabilities would decrease if this allocation formula were adopted. The finance department estimates that the loss of tax revenue from implementing the allocation rule is $295 million, almost 60 percent of which would come from banking corporations.
Partially offsetting the sharp reduction in liability for corporations with few customers in the city under the shift to customer-based sourcing is a change that extends the state’s existing “nexus” standard for determining which corporations are subject to city tax. Nexus for city tax purposes would be defined to include any business with $1.0 million or more of receipts sourced in the city. The de Blasio Administration has estimated that this change will yield $35 million in additional revenue. To reduce the avenues through
which corporations can shift their tax liability to subsidiaries located in low-tax jurisdictions, the package would also establish a “unitary combination” filing rule. Domestic businesses with subsidiaries would be required to file combined tax returns if there are significant transactions between the subsidiaries. According to the finance department, city tax revenue would increase by an estimated $85 million from adopting a unitary combination rule.
Another set of changes with less of an impact on city tax revenue are aimed at encouraging the expansion of small businesses in the city, especially manufacturing. Qualified firms will be able to exclude $10,000 of capital when calculating their alternative capital base liability. Moreover, tax rates on allocated net income would be lower than the basic rate: 4.425 percent for small manufacturers with less than $10 million of allocated net income, with a phase-out of the rate reduction over the $10 million to $20 million income range; and 6.5 percent for small nonmanufacturers with less than $1.0 million in allocated net income. These changes would cost the city an estimated $57 million in tax revenue.
Although the changes in treatment of investment income, broader nexus, and combined reporting are all expected to contribute some new revenue to help offset the revenue losses associated with the change in income sourcing and the more favorable treatment of some types of banks under the GCT, the package of changes would almost certainly result in a loss of revenue without one component that differs significantly from the changes enacted by the state. While the state eliminated its alternative capital base for calculating tax liability, the city will continue to compute tax liability at 0.15 percent of the capital base. Under the city corporate tax, firms compute several alternative liabilities and then pay on the highest. The capital base would remain as one of the alternatives for city taxpayers. The maximum tax payable under this base would be raised to $10 million from $1 million—a change that would increase liability for many businesses that are highly capitalized but have relatively small cash flows. IBO assumes that the majority of the additional revenue—$366 million—would come from businesses with assets in New York greater than $667 million.5
Although the package of corporate tax changes as a whole is intended to be revenue-neutral, the expected
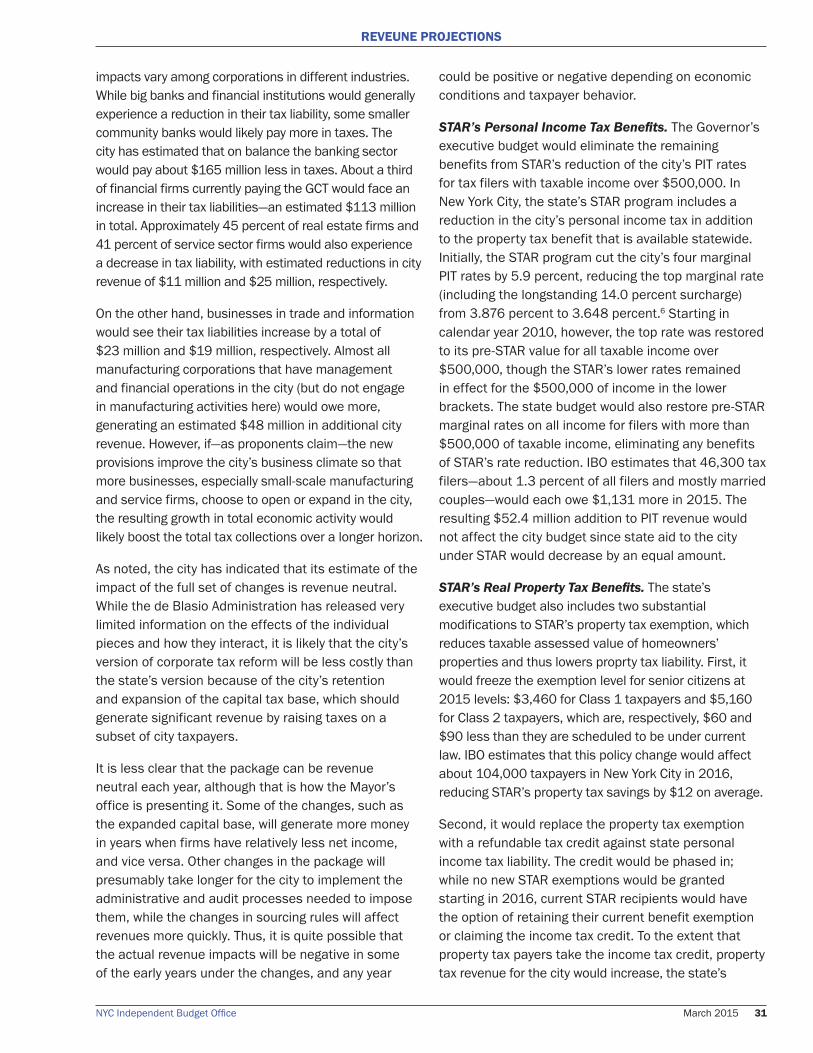
REVEUNE PROJECTIONS
NYC Independent Budget Office March 2015 31
impacts vary among corporations in different industries. While big banks and financial institutions would generally experience a reduction in their tax liability, some smaller community banks would likely pay more in taxes. The city has estimated that on balance the banking sector would pay about $165 million less in taxes. About a third of financial firms currently paying the GCT would face an increase in their tax liabilities—an estimated $113 million in total. Approximately 45 percent of real estate firms and 41 percent of service sector firms would also experience a decrease in tax liability, with estimated reductions in city revenue of $11 million and $25 million, respectively.
On the other hand, businesses in trade and information would see their tax liabilities increase by a total of $23 million and $19 million, respectively. Almost all manufacturing corporations that have management and financial operations in the city (but do not engage in manufacturing activities here) would owe more, generating an estimated $48 million in additional city revenue. However, if—as proponents claim—the new provisions improve the city’s business climate so that more businesses, especially small-scale manufacturing and service firms, choose to open or expand in the city, the resulting growth in total economic activity would likely boost the total tax collections over a longer horizon.
As noted, the city has indicated that its estimate of the impact of the full set of changes is revenue neutral. While the de Blasio Administration has released very limited information on the effects of the individual pieces and how they interact, it is likely that the city’s version of corporate tax reform will be less costly than the state’s version because of the city’s retention and expansion of the capital tax base, which should generate significant revenue by raising taxes on a subset of city taxpayers.
It is less clear that the package can be revenue neutral each year, although that is how the Mayor’s office is presenting it. Some of the changes, such as the expanded capital base, will generate more money in years when firms have relatively less net income, and vice versa. Other changes in the package will presumably take longer for the city to implement the administrative and audit processes needed to impose them, while the changes in sourcing rules will affect revenues more quickly. Thus, it is quite possible that the actual revenue impacts will be negative in some of the early years under the changes, and any year
could be positive or negative depending on economic conditions and taxpayer behavior.
STAR’s Personal Income Tax Benefits. The Governor’s executive budget would eliminate the remaining benefits from STAR’s reduction of the city’s PIT rates for tax filers with taxable income over $500,000. In New York City, the state’s STAR program includes a reduction in the city’s personal income tax in addition to the property tax benefit that is available statewide. Initially, the STAR program cut the city’s four marginal PIT rates by 5.9 percent, reducing the top marginal rate (including the longstanding 14.0 percent surcharge) from 3.876 percent to 3.648 percent.6 Starting in calendar year 2010, however, the top rate was restored to its pre-STAR value for all taxable income over $500,000, though the STAR’s lower rates remained in effect for the $500,000 of income in the lower brackets. The state budget would also restore pre-STAR marginal rates on all income for filers with more than $500,000 of taxable income, eliminating any benefits of STAR’s rate reduction. IBO estimates that 46,300 tax filers—about 1.3 percent of all filers and mostly married couples—would each owe $1,131 more in 2015. The resulting $52.4 million addition to PIT revenue would not affect the city budget since state aid to the city under STAR would decrease by an equal amount.
STAR’s Real Property Tax Benefits. The state’s executive budget also includes two substantial modifications to STAR’s property tax exemption, which reduces taxable assessed value of homeowners’ properties and thus lowers proprty tax liability. First, it would freeze the exemption level for senior citizens at 2015 levels: $3,460 for Class 1 taxpayers and $5,160 for Class 2 taxpayers, which are, respectively, $60 and $90 less than they are scheduled to be under current law. IBO estimates that this policy change would affect about 104,000 taxpayers in New York City in 2016, reducing STAR’s property tax savings by $12 on average.
Second, it would replace the property tax exemption with a refundable tax credit against state personal income tax liability. The credit would be phased in; while no new STAR exemptions would be granted starting in 2016, current STAR recipients would have the option of retaining their current benefit exemption or claiming the income tax credit. To the extent that property tax payers take the income tax credit, property tax revenue for the city would increase, the state’s

ANALYSIS OF THE MAYOR’S PRELIMINARY BUDGET FOR 2016
NYC Independent Budget Office March 201532
STAR reimbursement to the city would decrease, and the state’s income tax revenue would decrease. The legislation does not address whether the current cap limiting the growth of an individual’s STAR benefit to 2.0 percent of the prior year’s savings would also apply to the income tax credit. Because property tax rates are determined based on assessed value before the STAR exemptions are applied, and because the city is already reimbursed by the state for property tax revenue lost to STAR, the proposal should not impact city tax rates or revenue.
Real Property Tax Circuit Breaker. The proposed state budget also includes another refundable state income tax credit: a property tax circuit breaker to provide tax relief for residents with high ratios of property tax to personal income. The proposed credit would be phased in over four years and would provide a credit against state income tax liability for the portion of property tax in excess of 6.0 percent of income. The credit benefit schedule is structured so that savings decrease with income, and because it is a credit against state taxes, it would not affect city RPT revenue.
Homeowners are eligible for the credit if their household income is less than $250,000 a year and their property taxes exceed 6.0 percent of their income. For renters, individual income must be less than $150,000 and the portion of rent due to real property taxes—defined in the legislation as 13.75 percent of rent excluding utilities in buildings not fully exempt from taxes—must exceed 6.0 percent of income. In effect, to be eligible a tenant’s rent must equal 43.6 percent or more of income.7 For both homeowners and renters there are additional income restrictions if a portion of gross income is earned from businesses enterprises, capital gains, and other sources.
The Governor anticipates about 210,000 New York City homeowners would benefit from the state circuit breaker, with an average credit of $872. It is not certain how many renters would benefit. Because New York City Housing Authority developments are tax-exempt, the approximately 387,000 renters in public housing would not be eligible for the credit even if their rent-to-income ratio was high enough to qualify.8
Endnotes1For additional information about the city’s real property tax, see IBO’s 2006 report Twenty-Five Years After S7000A: How Property Tax Burdens Have Shifted in New York City. When IBO refers to market values and assessments, the reference includes only taxable property. The assessed value for tax purposes (also referred to as billable taxable value) reflects the required phase-in of assessment changes for apartment, commercial, and industrial buildings.2See City Council Resolutions 0541-2015 and 0581-2015.3See City Council Resolution 0595-2015.4It is expected that in the coming year the de Blasio Administration will announce another package of changes to overhaul the taxation of S corps and UBT payers.5The city currently limits the liability for its alternative capital base to $1.0 million. This means that firms that are subject to the capital base because their net income allocated to the city is relatively low have their tax capped even if their capital exceeds $667 million (in round numbers $667 million times the 0.15 percent capital tax rate equals $1.0 million in tax liability). Therefore, the firms affected by raising the cap on the alternative capital tax base to $10 million will have capital assets allocated to New York City of at least $667 million.6The per filer credit against PIT liability that STAR also established is not altered in the proposed state budget. 7With property tax assumed by definition to be 13.75 percent of rent and a threshold of 6.0 percent of income going to property tax in order to qualify then a tenant’s rent must be at least 0.06/0.1375 or 0.4364 of income in order to qualify for the Governor’s proposed credit.8Were housing authority apartment buildings considered taxable property, IBO estimates that 31 percent of the tenants would be eligible for the circuit breaker credit.

NYC Independent Budget Office March 2015 33
EXPENDITURE PROJECTIONS
Expenditure Projections
IBO projects that total city expenditures—including spending funded by local, state, and federal revenue—will increase from $79.1 billion this year to $80.3 billion in 2016, a rise of $1.2 billion. This projection is based on our re-estimate of the Mayor’s budget and adjusts for the use of the 2015 surplus to prepay some 2016 expenses. We expect spending will rise by an additional $1.4 billion in 2017 under the Mayor’s financial plan and reach nearly $87.3 billion by 2019. IBO estimates spending will grow at an average annual rate of 2.5 percent over the five years of the financial plan.
Looking just at city-funded spending and again adjusting for the use of the surplus, IBO estimates expenditures will grow from $56.8 billion this year to just under $59.0 billion in 2016, an increase of $2.1 billion. We expect city-funded spending will grow by an additional $1.2 billion in 2017 to $60.2 billion, and reach $65.3 billion by 2019—average annual growth over the five years of 3.5 percent.
Our spending estimates have increased modestly since the release of Mayor’s previous financial plan in November. Total expenditures have increased by $271 million for 2015 and $338 million for 2016 under the current plan after adjusting for prepayments with prior-year surpluses. Looking just at city-funded expenditures adjusted for prepayments, we estimate expenditures will be $249 million less this year than under the previous plan. IBO’s estimate for city-funded spending in 2016 is now $194 million above our projection under the November plan.
Just a few areas of the budget are responsible for much of the growth in spending. In dollar terms, IBO estimates the largest increase in spending over the five-year financial plan period will be by the Department of Education. Expenditures are expected to grow by about $3 billion, from just under $21 billion this year to $24.1 billion in 2019. In percentage terms, the largest growth is in health insurance and other fringe benefits for city workers (excluding education department and city university staff), which is expected to rise at an
average annual rate of 7.4 percent and increase from $4.9 billion this year to $6.6 billion in 2019. The only other sizable increase is in debt service, which IBO expects will grow at an annual rate of 6.8 percent after adjusting for the use of the surplus to prepay some of the is expenditure, and reach nearly $8 billion by 2019 (see page 50 for a more details). For most other major components of the budget, spending is flat or even slightly negative.
The following sections of this part of the report discuss some of the key spending issues in the preliminary budget and financial plan.
Universal Pre-Kindergarten: Enrollment and Funding
Following up on the Mayor’s campaign promise to expand the city’s pre-kindergarten program to make full-day services available for all 4-year olds, the de Blasio Administration opened the 2014-2015 school year with 32,700 more full-day pre-k enrollees than last year, with further expansion planned for the coming year. The preliminary budget assumes that there will be sufficient state funding to cover the costs of expanding the program in 2015-2016.
The city initially planned on funding pre-k expansion with an income tax surcharge on high-income households, but state leaders objected to the tax increase and instead established a new state funding stream for pre-k expansion initiatives across the state. Last spring, the state allocated $340 million in additional statewide funding for 2014-2015, with a commitment from the Governor to fund pre-k expansion on a recurring basis for school districts looking to do so. With few districts outside the city participating in the new program, New York City received $300 million of the new money this year. The city’s preliminary budget expects total state funds for the city’s pre-k program will grow to $565 million in 2016, about $40 million more than in this year’s budget. Given the still-limited participation by other districts in the state, there should be sufficient funds available to cover the city’s funding need.

ANALYSIS OF THE MAYOR’S PRELIMINARY BUDGET FOR 2016
NYC Independent Budget Office March 201534
IBO Expenditure ProjectionsDollars in millions
2015 2016 2017 2018 2019Average Change
Health & Social Services
Social ServicesMedicaid $6,600 $6,569 $6,571 $6,572 $6,572 -0.1%All Other Social Services 3,280 3,142 3,134 3,120 3,106 -1.4%
HHC 209 150 193 208 214 0.5%Health 1,479 1,459 1,461 1,455 1,456 -0.4%Children Services 2,861 2,875 2,884 2,886 2,886 0.2%Homelss 1,120 1,114 1,112 1,112 1,115 -0.1%Other Related Services 717 571 573 573 573 -5.4%Subtotal $16,268 $15,880 $15,929 $15,927 $15,922 -0.5%
Education
DOE (excluding labor reserve) $20,963 $21,664 $22,598 $23,556 $24,106 3.6%CUNY 935 863 870 876 883 -1.4%
Subtotal $21,898 $22,527 $23,468 $24,432 $24,990 3.4%
Uniformed Services
Police $4,979 $4,842 $4,827 $4,832 $4,835 -0.7%Fire 1,982 1,952 1,938 1,912 1,915 -0.9%Correction 1,141 1,185 1,173 1,176 1,180 0.8%Sanitation 1,483 1,568 1,562 1,561 1,559 1.3%
Subtotal $9,585 $9,547 $9,500 $9,481 $9,489 -0.3%
All Other Agencies $10,066 $8,975 $8,876 $8,967 $8,901 -3.0%
Other Expenditures
Fringe Benefits $4,928 $5,209 $5,651 $6,076 $6,567 7.4%**Debt Service 5,778 4,859 7,138 7,463 7,977 6.8%*Pensions 8,455 8,405 8,375 8,360 8,457 0.0%Judgments and Claims 695 710 746 782 817 4.1%General Reserve 300 750 750 750 750 n/aLabor Reserve:Education 11 - - - - n/aAll Other Agencies 841 1,328 971 1,870 2,961 n/a
Expenditure Adjustments (65) 43 164 300 423 n/aTOTAL EXPENDITURES $78,760 $78,232 $81,568 $84,409 $87,254 2.6%NOTES: *Represents the annual average change after adjusting for prepayments. **Fringe benefits exclude DOE and CUNY expenditures, which are reported within DOE and CUNY budget amounts.Expenditure adjustments include energy, lease and non-labor inflation adjustments.Figures may not add due to rounding.
New York City Independent Budget Office
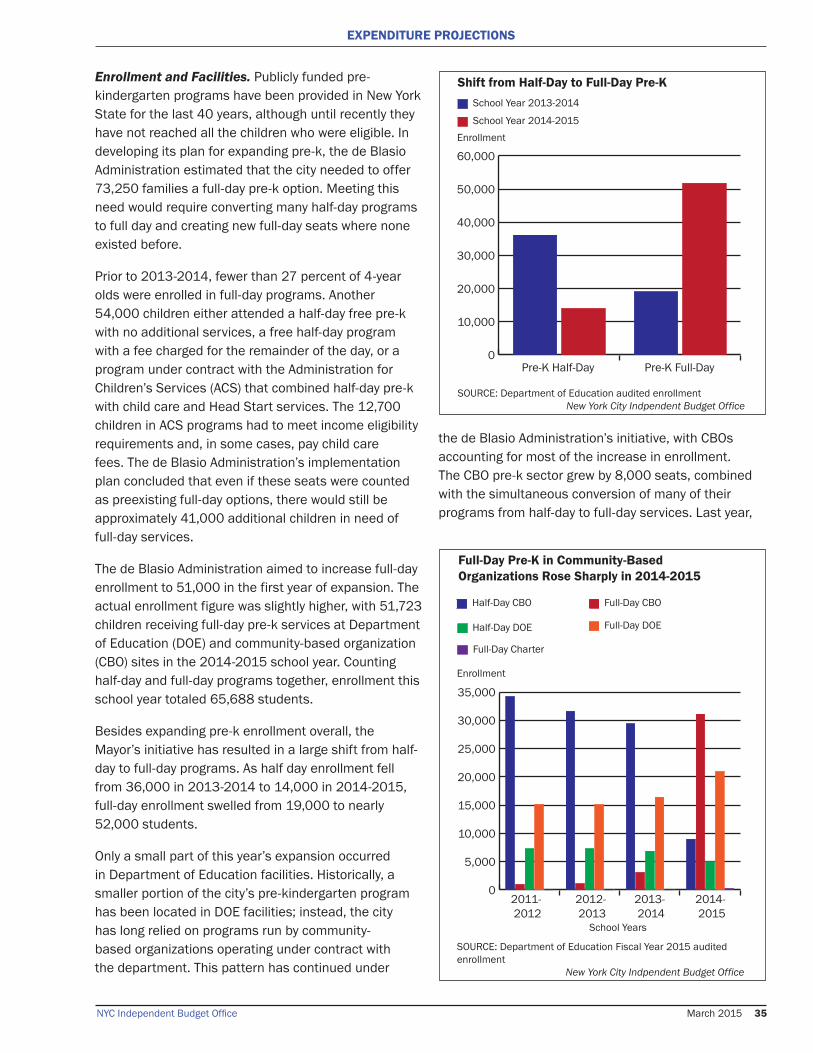
NYC Independent Budget Office March 2015 35
EXPENDITURE PROJECTIONS
Enrollment and Facilities. Publicly funded pre-kindergarten programs have been provided in New York State for the last 40 years, although until recently they have not reached all the children who were eligible. In developing its plan for expanding pre-k, the de Blasio Administration estimated that the city needed to offer 73,250 families a full-day pre-k option. Meeting this need would require converting many half-day programs to full day and creating new full-day seats where none existed before.
Prior to 2013-2014, fewer than 27 percent of 4-year olds were enrolled in full-day programs. Another 54,000 children either attended a half-day free pre-k with no additional services, a free half-day program with a fee charged for the remainder of the day, or a program under contract with the Administration for Children’s Services (ACS) that combined half-day pre-k with child care and Head Start services. The 12,700 children in ACS programs had to meet income eligibility requirements and, in some cases, pay child care fees. The de Blasio Administration’s implementation plan concluded that even if these seats were counted as preexisting full-day options, there would still be approximately 41,000 additional children in need of full-day services.
The de Blasio Administration aimed to increase full-day enrollment to 51,000 in the first year of expansion. The actual enrollment figure was slightly higher, with 51,723 children receiving full-day pre-k services at Department of Education (DOE) and community-based organization (CBO) sites in the 2014-2015 school year. Counting half-day and full-day programs together, enrollment this school year totaled 65,688 students.
Besides expanding pre-k enrollment overall, the Mayor’s initiative has resulted in a large shift from half-day to full-day programs. As half day enrollment fell from 36,000 in 2013-2014 to 14,000 in 2014-2015, full-day enrollment swelled from 19,000 to nearly 52,000 students.
Only a small part of this year’s expansion occurred in Department of Education facilities. Historically, a smaller portion of the city’s pre-kindergarten program has been located in DOE facilities; instead, the city has long relied on programs run by community-based organizations operating under contract with the department. This pattern has continued under
the de Blasio Administration’s initiative, with CBOs accounting for most of the increase in enrollment. The CBO pre-k sector grew by 8,000 seats, combined with the simultaneous conversion of many of their programs from half-day to full-day services. Last year,
0
10,000
20,000
30,000
40,000
50,000
60,000
Pre-K Half-Day Pre-K Full-Day
Shift from Half-Day to Full-Day Pre-KSchool Year 2013-2014
School Year 2014-2015Enrollment
SOURCE: Department of Education audited enrollmentNew York City Indpendent Budget Office
Full-Day Pre-K in Community-Based Organizations Rose Sharply in 2014-2015
Half-Day CBO Full-Day CBO
SOURCE: Department of Education Fiscal Year 2015 audited enrollment
New York City Indpendent Budget Office
0
5,000
10,000
15,000
20,000
25,000
30,000
35,000
Half-Day DOE Full-Day DOE
Full-Day Charter
Enrollment
School Years
2011-2012
2012-2013
2013-2014
2014-2015

ANALYSIS OF THE MAYOR’S PRELIMINARY BUDGET FOR 2016
NYC Independent Budget Office March 201536
Department of Education Pedagogue Headcount
2015 2014
0 200 400 600 800 10001,200
Full Time State- Funded Educational Paraprofessionals
Full Time State- Funded Pedagogic Positions
Full Time Tax-Levy Funded Pedagogic Positions
Number of Full TIme Pre-K Positions
SOURCES: Tax-levy positions, Mayor’s Office of Management and Budget, Departmental Estimates; State-funded positions, Department of Education, Financial Status ReviewNOTE: Excludes staff at community-based organization sites.
New York City Indpendent Budget Office
students in CBO pre-k classes comprised 59 percent of total enrollment and this share has increased to 61 percent this year. The number of full-day students in community-based organizations grew sharply, rising from 3,000 in 2013-2014 to more than 31,000 this year, while CBO half-day enrollment declined by more than 20,000. Changes in DOE schools were more muted as full-day enrollment increased by 4,700 and half-day enrollment declined by 1,800.
Funding and Headcount. Funding has increased both to provide additional full-day services and to expand the educational content of the program. Overall, the city’s pre-k budget grew from a total of $232 million in 2014 to $575 million this year, a 60 percent increase. The increase for 2015 was largely due to the new state commitment of $300 million; as a result, state revenue now comprises more than 90 percent of the city’s pre-k expense budget.
The preliminary budget assumes total state funds for pre-k in the city will grow to $565 million, including $340 million from the state’s pre-k expansion funds. In the Governor’s executive budget there is $340 million to continue the expanded pre-k program statewide for the 2015-2016 school year, the same amount that was appropriated last spring by the state for the 2014-2015 school year. (His budget also includes a $25 million competitive grant for innovative pre-k programs.) Because there was little interest in expanding pre-k elsewhere in the state, the city was able to access the
$300 million it had sought for its program. Assuming other districts continue to show limited interest in pre-k expansion, the Governor’s budget for next year would be sufficient to accommodate the city’s hoped for $340 million in pre-k expansion funds.
Department of Education headcount data shows a large increase in the number of state-funded pre-k positions between school year 2013-2014 and school year 2014-2015. Based on data from December 2013 and December 2014, the number of full time pre-k pedagogic positions—primarily teachers—grew from 593 positions to 1,110 positions in 2014. Likewise, the number of state-funded educational paraprofessionals working in pre-k programs grew to over 900 positions. In contrast, there was no change in the number of city tax-levy funded pre-k teachers from 2014 to 2015. Overall, pre-k headcount grew by 723 positions to a total of 2,155. Note that this data only includes staff working for the Department of Education; staff working at community-based organizations are not included in the DOE headcount.
Looking at the various components of the pre-k program budget we see that the largest expenditures are currently for payments to CBOs, which are labeled payments to contract schools. Payments to outside contractors nearly tripled, rising from $84 million in 2014 to $238 million in 2015. Spending on personal services for staff at DOE pre-k sites (pedagogic personal services) grew by 82.8 percent, reflecting the increase in the number of teachers and other staff, as well as the higher teacher salaries under the recent contract with the teachers’ union. Although total personal services costs at DOE sites grew, this category, which had accounted for the largest share of pre-k spending before the expansion, now trails the payments to contract schools, as the share of payments to CBOs grew even faster.
Some of the smaller categories have also grown rapidly as the program’s expansion has spurred much greater spending on items such as other professional services, professional development, and data processing consultants The amount of pre-k funding going to the Administration for Children’s Services more than doubled from $41 million in 2014 to $95 million this year. These funds are for CBOs that provide pre-k services under contract with ACS. ACS sites also use

NYC Independent Budget Office March 2015 37
EXPENDITURE PROJECTIONS
Changes in Pre-K Budget Lines as Program Expands
2013-2014 2014-2015
Budget Category $(000) Share $(000) Share
Payments to Contract Schools $83,594.4 36.0% $238,036.2 41.4%Pedagogic Personal Services (DOE) 101,549.7 43.7% 185,654.2 32.3%
Salaries 71,397.2 30.6% 128,235.9 22.2% Health Insurance 16,421.7 7.0% 29,341.6 5.1% Other Benefits 13,730.7 5.9% 28,076.7 4.9%
ACS Intracity Grant 41,340.2 17.8% 94,867.8 16.5%Other Professional Services 751.8 0.3% 19,135.0 3.3%General Supplies and Materials 1,001.3 0.4% 6,537.9 1.1%Equipment 0.0 0.0% 3,605.5 0.6%Hourly Personal Service 2,908.3 1.3% 6,229.9 1.1%Curriculum/Professional Development Services 146.1 0.1% 4,766.2 0.8%Nonpedagogic Personal Service 368.9 0.2% 4,574.1 0.8%Noncontractual Services 525.2 0.2% 2,835.5 0.5%Per Session 130.3 0.1% 2,677.0 0.5%Data Processing Consultants 0.0 0.0% 2,173.3 0.4%Printing Contracts 10.0 0.0% 1,344.0 0.2%Text Books 27.6 0.0% 1,113.5 0.2%Other 128.3 0.1% 1,300.8 0.2%TOTAL $232,482.2 100.0% $574,850.9 100.0%SOURCE: New York City’s Financial Management System—includes all fundsNOTE: Totals may not sum due to rounding.
New York City Independent Budget Office
child care and Head Start programs to offer additional services. Most of the new funding was used to enhance the educational content of the ACS programs in order to align services with the DOE pre-k model.
Going forward, the city’s pre-k program may be able to access additional funding. While the Governor’s executive budget did not increase state funding for the pre-k expansion that he pushed through last year, it did include a $25 million dollar proposal to add 3-year olds to pre-k programs in high need school districts. Although the DOE has not indicated whether it will participate, more than 250 school districts will be eligible to apply for the funding, which is expected to create at least 5,000 seats. New York State will also be the recipient of a four year, $100 million federal expansion grant for high quality pre-k programs. The federal expansion dollars were awarded to states that serve at least 10 percent of their 4-year olds or have received a Race to the Top Early Learning Challenge grant. Programs funded with this money are expected to become models for preschool expansion to all 4-year olds from low- and moderate-income families. New York
City will be among five high-need communities to be served under New York State’s plan, along with Indian River, Yonkers, Port Chester, and Uniondale.
Will State Funds Be Available Again for Expanded After-School Programs?
In one of its signature initiatives last year, the de Blasio Administration expanded the size of the city’s after-school program for middle school students, more than tripling the number of slots available. For fiscal year 2015, the expansion was funded with a portion of state education aid, but the prospects for significant growth in state aid this year are unclear, with the state aid appropriation intertwined with contentious education policy proposals by the Governor. If there is less aid than the de Blasio Administration is assuming, further expanding the middle school initiative would require another funding source—presumably city funds.
Since 2005 the Department of Youth and Community Development (DYCD) has administered the city’s primary after-school program. Originally known as Out-of-School Time, the program was renamed

ANALYSIS OF THE MAYOR’S PRELIMINARY BUDGET FOR 2016
NYC Independent Budget Office March 201538
Comprehensive After School System of New York City (COMPASS NYC) beginning in 2015. The program provides activities for school-age youth during after-school hours, on weekends, and during school vacations. COMPASS programs are offered at no cost to participants and provide a mix of academic, recreational, and cultural programs for elementary-, middle-, and high-school students. COMPASS service providers operate mostly in public school buildings, with a smaller number operating in facilities of the parks department and the New York City Housing Authority.
Besides the change in name, DYCD’s after-school system has undergone major changes in its scale and funding beginning in 2013 when DYCD revamped its program for elementary- and middle-school students to expand the types of services offered and raised the per slot rate to cover the cost of these additional services. This increased cost per slot, together with a scheduled decrease in funding, was expected to reduce the number of slots in 2013 by nearly half, from 52,600 in 2012 to 26,900 (denoted as 2013 RFP Service Enhancement in the accompanying table). During
negotiations to adopt the 2013 budget, however, the City Council added $51 million to restore nearly 30,000 slots for one year, although these were funded at the previous, lower cost per slot. The City Council once again added $51 million for the 2014 adopted budget to maintain the 30,000 slots for an additional year. These funds were then baselined in November 2013, making the Council-funded slots a permanent part of the overall COMPASS system.
Soon after taking office, the de Blasio Administration announced a plan to further upgrade the after-school system at DYCD by vastly expanding the number of slots for middle school students. For 2015, the number of slots available to middle school students during the school year more than tripled, growing to 42,750 from 13,114. Although part of the COMPASS system, the new middle school initiative is known as School’s Out New York City (SONYC). The Mayor had planned to pay for the SONYC initiative with revenue from an income tax surcharge on high income households, but after that proposal failed to gain traction in Albany, the city decided to fund SONYC by redirecting some of the incremental increase in New York State Foundation
Compass Fiscal Year 2015 Program FactsAs of 2015 adopted budget, dollars in millions
Elementary School Programs Budget School Slots School Enrollment Summer Slots Summer Enrollment
Base RFP 2013 Service Enhancement $48.7 15,422 20,148 15,472 18,969 Council 61.8 21,986 25,138 21,888 23,426 DOE Expansion 2.0 1,882 - - - Total Elementary School $112.5 39,290 45,286 37,360 42,395
Middle School Programs Budget School Slots School Enrollment Summer Slots Summer Enrollment
Base RFP 2013 Service Enhancement $34.3 9,388 12,036 9,303 9,969 Council 13.8 3,726 5,258 3,777 3,812 DOE Expansion 1.0 - - - -
Program Prior to SONYC Subtotal $49.1 13,114 17,294 13,080 13,781
New SONYC 81.6 27,154 33,687 - - New SONYC Nonpublic (3/1/15) 5.0 2,482 - - -
SONYC Subtotal 86.6 29,636 33,687 - -
Total Middle School $135.7 42,750 50,981 13,080 13,781
High School & Option II Budget School Slots School Enrollment Summer Slots Summer Enrollment
High School $4.4 5,874 5,764 3,818 1,955 Total High School $4.4 5,874 5,764 3,818 1,955
Evaluation & Support $7.5 Total COMPASS Budget $260.1 87,914 102,031 54,258 58,131 SOURCE: Department of Youth and Community DevelopmentNOTES: Excludes administrative costs. All new SONYC programs started in September 2014.
New York City Independent Budget Office

NYC Independent Budget Office March 2015 39
EXPENDITURE PROJECTIONS
Aid received by the city’s Department of Education (DOE). Foundation Aid, which is determined by formulas that take into account enrollment, student need, and a school district’s relative wealth, is the largest component of state education aid. Thus, the year-to-year fluctuation in the Foundation Aid received by DOE is largely determined by changes in the fiscal condition of the education department as it carries out its core educational mission.
Increased Capacity and Participation. As expected, the implementation of SONYC has greatly expanded the number of students receiving after-school services in 2015. Compared with 2014, enrollment increased by 29 percent for school year programs and 12 percent for summer programs.
In 2015, the overall COMPASS program includes a total of 87,914 school year slots and 54,258 summer slots. Among the school-year programs, 29,636, or 34 percent, of the total slots are new SONYC slots. Because SONYC did not begin until September 2014, there were no new SONYC summer slots in fiscal year 2015.
Students do not always participate in every session, so DYCD estimates that each program slot can serve approximately 1.25 students. Total enrollment in COMPASS school-year programs reached 102,031 students in 2015 including 45,286 in elementary school, 50,981 in middle school, and 5,764 in high school. Overall summer enrollment totaled 58,131 including 42,395 in elementary school, 13,781 in middle school, and 1,955 in high school. Only in the high-school programs did enrollment not surpass available slots. The 2015 enrollment numbers for middle schools do not include new SONYC programs located outside of public schools (SONYC nonpublic in the table), which are scheduled to begin operating in March 2015.
Uncertain Funding. As a result of the expansion of middle school programs, the total budget for COMPASS, including administrative costs, increased from $154 million in 2014 to $270 million in 2015, and is expected to increase further to $301 million in 2016. The program’s expansion in 2015, however, relied on state funds, some or all of which, might not be available next year.
Prior to 2015, COMPASS programs were largely paid for with city funds; in 2014, 88 percent of the budget was funded with city dollars. In the 2015 budget DOE allocated $145 million in state Foundation Aid to the new after-school initiative, with $128 million of this transferred to DYCD to implement the expansion. The remaining funds ($17 million) remained in DOE’s budget to cover that agency’s administrative costs as well as after-school programs for special education students in District 75 schools.
The city’s financial plan assumes that DOE will receive enough Foundation Aid from the state for 2016 to be able to allocate $190 million to SONYC, with $170 million of this to be transferred to DYCD to further expand the program. However, it is far from clear if the final state budget will include enough incremental Foundation Aid to allow DOE to cover the costs of SONYC, while also meeting its own internal needs for additional state aid. The risk is heightened this year as the Governor has tied approval of a major increase in statewide Foundation Aid to acceptance by the Legislature of several controversial education policy proposals regarding teacher evaluations, charter schools, and state takeover of failing schools. If the ultimate agreement results in less Foundation Aid than the city is counting on, city officials would be left with a choice between scaling back the program and making up the funding shortfall with city funds.
0
50,000
100,000
150,000
200,000
250,000
300,000
$350,000
2014 2015 2016Fiscal Year
City Intracity-Administration for Children’s Services
Other State State Foundation Aid
COMPASS Increasingly Depends on State Funds
Funding
SOURCE: New York City budget function analysisNew York City Independent Budget Office

ANALYSIS OF THE MAYOR’S PRELIMINARY BUDGET FOR 2016
NYC Independent Budget Office March 201540
More Federal Sandy Aid Added to City Budget, More Expected to Be Approved
Nearly $2 billion in federal Hurricane Sandy disaster-relief funds were added to the city’s operating and capital budgets in the Mayor’s most recent financial plan, almost two-thirds more than the amount previously budgeted. The majority of the funds, close to $1.4 billion, was added to the city’s capital commitment plan, while just over $546 million was added to the city’s operating budget.
Sandy Aid for Capital Projects Increased. The addition of $1.4 billion in federal Sandy aid brings total disaster funding from Washington planned for capital projects up to nearly $3.1 billion in fiscal years 2015 through 2018. Another $220 million in Sandy-recovery costs is expected to be paid for with city capital funds over the same period, for a total of $3.3 billion in planned Sandy-related capital commitments over the next four years. This is in addition to $795 million the city already committed for Sandy capital projects in 2013 and 2014, including $706 million in expected federal aid.
The majority of the federal funds added to the city’s capital commitment plan ($876 million) are expected from the Federal Emergency Management Agency (FEMA), which reimburses the city after it makes eligible recovery-related outlays. The remaining $490 million is part of the city’s federal disaster relief grant awarded under the Community Development Block Grant Disaster Recovery (CDBG-DR) program.
Capital projects managed by the city’s Health and Hospitals Corporation received the largest share of the federal funding increase—$497 million to be committed over the next four years. This includes $172 million in CDBG-DR funds. Overall, almost exactly one-third of the total $3.1 billion in federal aid planned for Sandy-recovery capital projects is budgeted for repairs and reconstruction of city hospitals impacted by the storm ($1.0 billion). The majority of this funding is expected to flow to three hospitals: Coney Island, Bellevue, and Coler, which were the most severely damaged.
The New York City Housing Authority (NYCHA) also received a significant share of the new federal capital funding. Some $308 million (all in CDBG-DR funds) is planned for repair, reconstruction, and resiliency work at public housing developments damaged by the storm.
In addition to these funds, which flow through the city’s capital budget, NYCHA also expects to receive direct reimbursements for capital projects from FEMA, which will not flow through the city’s budget.
The Department of Education also received a substantial portion of the increased federal capital funding. Nearly $258 million in federal aid was added to the department’s capital commitment plan to repair damaged schools. The city also added nearly $29 million in city capital funds to help cover the costs of Sandy-related projects. In total the city expects to receive $423 million in federal funds to help repair schools over the next four years, with most of the funding targeted for projects in two school districts: Queen’s district 27, which includes the Rockaways, Howard Beach, Lindenwood, and Ozone Park; and Brooklyn’s district 21, which includes Sea Gate, Brighton Beach, Manhattan Beach, and Gravesend.
Federal funds for capital projects were also added to the commitment plans of the Department of Environmental Protection ($87 million), the Department of Transportation ($63 million), the Department of Parks and Recreation ($62 million), the Department of Small Business Services ($55 million), the police department ($27 million) and the fire department ($9.4 million).
Sandy Aid Added to the City’s Operating Budget. Federal aid to help cover the city’s operating expenses for Hurricane Sandy recovery increased by $546 million in the Mayor’s financial plan, bringing the total Sandy operating-budget support the city has expects to receive from Washington over the next five years to $1.8 billion. Most of those funds ($1.2 billion) are planned for 2015. The vast majority of funds added ($530 million) are part of the city’s CDBG-DR award, while $16 million was added in expected FEMA reimbursements and just over $130,000 was added from the Federal Highway Administration’s Emergency Relief Program.
Of the increased federal funds for operations, the largest share ($412 million) was added to the Department of Housing Preservation and Development’s budget, with most of the funds planned for the city’s Build it Back Program for the repair and reconstruction of multifamily housing Funds were also added to the budgets of the Department of Social Services ($46 million) and the Mayor’s office ($44 million) to cover costs associated with the city’s Housing

NYC Independent Budget Office March 2015 41
EXPENDITURE PROJECTIONS
Recovery Office, which is overseeing the city’s Sandy housing programs, as well as administrative costs. Close to $12 million was added to the budget of the Department of Small Business Services for economic development recovery programs and about $10 million was added to the budget of the Health and Hospitals Corporation for emergency protective measures. The remaining $23 million added over the next five years was divided among a dozen other city agencies.
More CDBG-DR Aid Expected. In addition to the funds added to the city’s capital and operating budgets in this financial plan, nearly $1.6 billion in additional Sandy aid is expected to be allocated in upcoming financial plans through the federal CDBG-DR program. In total, the city was awarded just over $4.2 billion in CDBG-DR funding for Sandy recovery through three rounds of awards. Of that, the city received about $517 million in 2014 and 2015 and another $2.1 billion is budgeted through fiscal year 2019, including funds flowing though both the city’s capital and operating budgets. The Department of Housing and Urban Development has yet to approve the city’s plan for the use of the remaining $1.6 billion. The money will not be included in the city’s budget until the federal agency approves the plan; the city expects the agency to approve the planned uses for the majority of these funds this spring.
Homeless Rental Assistance Increased But Impact on Shelter Uncertain
The de Blasio Administration increased spending on rental assistance programs aimed at reducing the city’s record-high homeless shelter population in its preliminary budegt for 2016 and financial plan. With the additional funds, the city now projects it will be able to move 6,551 households into permanent housing this year. But funding for additional placements in future years is uncertain, and therefore the long-term impact of these programs on the city’s homeless shelter population—and shelter costs—may be less than anticipated.
New Rental Programs Introduced. Three new rental assistance programs targeting homeless adults were added in the Mayor’s financial plan. The programs, which are budgeted to cost a total of $6.8 million this fiscal year and $18.5 million in 2016, are projected to move 2,600 households into permanent housing this year. The additional funds raise the total amount budgeted for rental assistance for the city’s homeless to $30 million this year and $84 million in 2016. The city has also allocated funds for aftercare and case management services for households receiving the assistance, including $5 million this year and $14 million next year.
Two of the new rental assistance programs are part of the Living in Communities (LINC) initiative that the
Nearly $1.4 Billion in Federal Sandy Aid Added to City’s Capital Commitment Plan Dollars in thousands
Agency Newly Added
FundsTotal Federal Funds Planned 2015-2019
Health and Hospitals Corporation $497,344 $1,029,164Housing Authority 308,000 308,000Department of Education 257,580 422,920Department of Environmental Protection 86,870 133,517Department of Transportation 63,114 336,960Department of Parks & Recreation 61,690 383,558Small Business Services 55,046 98,031Police Department 27,489 40,201Fire Department 9,436 140,997Department of Corrections - 71,244Department of Cultural Affairs - 67,050Brooklyn Public Library - 6,258Department of Sanitation - 5,291Queens Public Library - 4,101City University of New York - 3,058Department of Health and Mental Hygiene - 2,644Department of Homeless Services - 227New York Public Library - 27Department of Citywide Administrative Services - 6Total $1,366,569 $3,053,254SOURCE: Preliminary Fiscal Year 2016 Capital Commitment Plan NOTE: Totals exclude interfund agreements.
New York City Independent Budget Office

ANALYSIS OF THE MAYOR’S PRELIMINARY BUDGET FOR 2016
NYC Independent Budget Office March 201542
Most Rental Subsidy Programs Funded for Only One Cohort
Rental Assistance Program
Target Population
Projected Placements
Fiscal Year 2015
Fiscal Year 2016
LINC I Working Families 1,101 1,101
LINC IIRepeat and
Long-term Stayers 950 670
LINC III
Domestic Violence
Survivors 1,900 -LINC IV Senior Citizens 1,100 -LINC V Working Adults 1,000 -Rental Assistance For Singles Single Adults 500 -Total Placements 6,551 1,771SOURCES: New York City Department of Homeless Services; New York City Office of Management and Budget
New York City Independent Budget Office
Mayor announced last May. The previously introduced LINC programs (LINC I, LINC II, and LINC III), which began placing families in September, all target homeless families with children, specifically working families, families that have repeatedly entered the shelter system, and survivors of domestic violence, respectively.
Through the two new LINC programs, which began in December, the de Blasio Administration projects it will place 1,100 senior citizens living in the city’s single adult or adult family shelter systems (LINC IV) into permanent housing this year, as well as another 1,000 working adults without children (LINC V).
In addition to the two new LINC programs, which are administered by the Human Resources Administration, the preliminary budget includes funding for a new, shorter-term rental assistance program administered by the Department of Homeless Services. This new program provides one year of rental assistance (compared with up to five years under LINC) through a fixed, $600-a-month subsidy (rental subsidies for the LINC programs are based on household size and income.) Although the city projects it will move 500 single adults out of shelter this year through the program, as of early March it had yet to be launched.
Each of the three new programs, however, is currently funded only for one cohort—meaning the city has only budgeted enough funds to pay for the initial 2,600 placements. Funds budgeted in upcoming years
are allotted to provide continuing subsides to those households. In fact, only two of the LINC programs have funding for more than one cohort of recipients.
The city projects LINC I, which has received $40 million of state funds over four years in addition to city funding, will help 1,101 families move out of shelter this year with funding continuing for 1,101 additional families in subsequent years. The LINC II program is expected to help 950 families move out of shelter this year and an additional 670 move out next year. However, the funding for LINC II is contingent upon homeless shelter savings. According to state rules, the city may only use savings from reductions in the cost of homeless shelters to pay for the program. This rule has already proven problematic. The city initially projected that it would have $60 million a year to invest in the LINC II program, which included a mix of city, state, and federal funds. After a plan to cut shelter costs resulted in less savings than anticipated, however, in November the city reduced its savings estimate to $4 million this year and $16 million in 2016.
The Mayor recently requested that the state provide $32 million more this year and increasing amounts in future years to help pay for these and other rental assistance programs. It is unclear, however, if the state will provide the funding. The Governor’s proposed budget did contain language that would cap the amount the state has historically charged the city for juvenile detention placements and allow the city to redirect those funds into the LINC programs, but again this is still uncertain.
While the city expects to reach its placement targets for the year, the roll out of the programs has been slow. In fact, in November the city raised the rent limits for the LINC programs to make them more attractive to landlords. For example, the maximum rent for a family of three increased from $1,200 to $1,515 a month. The city is also currently offering bonuses to landlords and brokers who rent apartments through the LINC programs. As of late January, only 405 households had moved out of shelter through the five LINC rental assistance programs.
Impact on Homeless Shelter Census. Despite the addition of the new rental assistance programs, the homeless shelter census remains at a record high. During the first eight months of 2015 there were,

NYC Independent Budget Office March 2015 43
EXPENDITURE PROJECTIONS
on average, 13,946 families in shelter each day—13 percent more families than during the same period last year. There was a similar increase in single adults in shelter over the same period. During the first eight months of fiscal year 2015, on average 11,064 individuals were in adult shelter each day—11 percent more than during the same period last year.
There were modest declines in the number of families in shelter in January and February of this year, which may be a result of the initial housing placements. The average number of families in shelters fell from 14,415 in December, 2014 to 14,156 in February, 2015. While the overall impac
t of the rental assistance programs on the shelter population will not be known until the programs are fully implemented, because so many of the programs are currently funded for only one cohort, the long-term impacts may be relatively small. IBO estimates that shelter costs will be above what the city has budgeted in 2016 for both family and adult shelter. IBO’s budget estimate also assumes that additional funds are necessary for adult shelter this year.
The city has budgeted $577 million for family shelter this year, $44 million more than it spent last year, which IBO estimates is adequate given current census levels and the anticipated housing placements. However, if funding is not added so that more families can be placed through the rental assistance programs next year, IBO projects that at least $50 million more than the $516 million the city has already budgeted would be necessary to cover shelter costs in 2016. Of the additional funds, IBO estimates $13 million would be city funds.
IBO’s forecast of adult shelter costs exceeds the de Blasio Administration’s, both for this year and next. Based on the current shelter census and the fact that the rental assistance programs targeting adults were not launched until halfway through the year, IBO estimates that adult shelter costs will reach $366 million by the end of 2015, nearly $10 million more (all city funds) than the city has budgeted. Without additional funds to provide rental assistance for another cohort of households next year, IBO estimates that adult shelter costs would reach $356 million in 2016, $19 million more than the city’s current projection (all city funds).
Capital Funds Added to Finance Mayor’s Housing Plan
The de Blasio Administration has budgeted nearly $7.2 billion for the capital program of the Department of Housing Preservation and Development (HPD), the agency charged with administering the Mayor’s Housing New York initiative to build or preserve 200,000 units of affordable housing over the next decade. The spending, which is planned over 10 years from fiscal year 2015 through the end of the Mayor’s housing plan in fiscal year 2024, is more than twice the $3.5 billion the Bloomberg Administration actually committed for housing capital projects during its last decade in office.
The current funding reflects an increase of $3.1 billion, or 76 percent, over the level previously budgeted for HPD’s capital program. All of the $3.1 billion in new funding was added to the last six years of the housing plan, fiscal years 2019 through 2024, according to the Mayor’s preliminary Ten-Year Capital Strategy for 2016-2018, which accompanied the release of the Preliminary Budget for 2016. The Mayor had previously added $1.2 billion for more near-term Housing New York projects—planned in fiscal years 2015 and 2018—in his Executive Capital Commitment Plan released last May.
Nearly all of the $7.2 billion budgeted for HPD capital projects from fiscal year 2015 through 2024 are planned for the Housing New York initiative, with a small share of funds earmarked for demolition of unsafe buildings, technology upgrades, and other similar projects. The total includes $6.6 billion in city capital and $587 million in federal funds. It is about $365 million less than the $7.5 billion the Mayor originally calculated would come from city and federal capital sources, according to the budget released with the Mayor’s housing plan last May. However, some additional city capital funds—known as Resolution A funds, which are allocated by the City Council and other elected officials—are expected to be added over the life of the plan, bringing the total back closer to the original amount. Also, while the Housing New York budget spanned fiscal years 2015 through 2024, during the second half of fiscal year 2014 HPD committed $219 million in capital funds for projects it is counting toward the Mayor’s affordable housing goals.
An average of $718 million commitments is planned annually over the next 10 years, with the amount

ANALYSIS OF THE MAYOR’S PRELIMINARY BUDGET FOR 2016
NYC Independent Budget Office March 201544
gradually increasing each year to keep pace with inflation. Slightly over $672 million is planned to be committed in fiscal year 2015 with planned commitments increasing by about 2 percent a year, reaching $783 million in fiscal year 2024. This is a considerable increase over HPD’s past annual capital commitments, which averaged $355 million over the last decade.
While the goals of the Mayor’s housing plan are set in terms of the number of units newly constructed (80,000) and those for which existing affordability is preserved (120,000), HPD’s capital funding is divided into five categories. These are new housing construction; preservation; special needs housing, which can include both newly constructed and preserved units for special populations; occupied in-rem rehab, which includes the rehabilitation and disposition of the city-owned housing stock, units that are likely to be classified as preserved; and other housing support investment, which can include a range of project types.
Over the next 10 years, the highest share of HPD capital funds—a third—is planned for preservation
projects ($2.4 billion), closely followed by new housing construction and special needs housing, with each making up 28 percent of the planned total (at $2.0 billion each). Fewer capital funds are allocated for occupied in-rem rehab projects (7 percent at $474 million) and other housing support investment (4 percent at $263 million).
While the capital funds planned for the Mayor’s housing plan are an increase over past spending levels, they represent only a fraction of the total affordable housing plan’s $41 billion budget. In addition to the mix of city and federal capital funding for HPD, the overall spending plan for the Housing New York also includes significant financing from private sources ($30 billion), funding from state and other federal programs ($2.2 billion), as well as funding from non-capital city sources ($1.4 billion).
Ferries, Select Bus, Vision Zero: Capital Funds Added, More Will Be Needed
The Mayor added more than $300 million in planned capital funds for three of his top transportation initiatives— the creation of a citywide ferry program, expansion of the Select Bus Service (SBS), and the Vision Zero street safety program—in the four-year capital plan released with his preliminary budget. While the increased funding provides for some of the costs associated with these transportation projects, additional funds will be necessary to see them through to completion.
Capital Funds Added for Ferry Expansion. The Mayor’s latest capital plan contains $55 million in planned capital commitments for the development of five ferry routes to connect waterfront neighborhoods with job centers in Manhattan. These new routes are to operate on the model of the existing East River Ferry service, a public-private partnership between the city’s Economic Development Corporation (EDC) and private ferry operators.
The plan includes funding for 10 ferry landings in the Bronx, Queens, Brooklyn, and Manhattan, covering the cost of upgrading piers and bulkheads, building gang planks, installing kiosks, ticket machines, and signage, as well as other miscellaneous expenses. Several existing ferry stops will also be integrated into the new routes. Work is expected to begin in fiscal
0
100
200
300
400
500
600
700
$800Dollars in millions
Highest Share of Housing Preservation and Development Capital Funds Planned for Housing Preservation
20162017
20182019
20202021
20222015
20232024
Fiscal Years
Preservation New Housing Construction
Specail Needs Housing Occupied In-Rem Rehab
Other Housing Support Investment
SOURCES: Fiscal Year 2016 Capital Commitment Plan; Preliminary 10-Year Capital Strategy Fiscal Years 2016-2025
New York City Independent Budget Office

NYC Independent Budget Office March 2015 45
EXPENDITURE PROJECTIONS
year 2017, with operations on some routes getting underway later that year and all routes expected to be operating by 2018.
The $55 million in planned commitments does not include funding to build a landing at Astoria Cove, a proposed 1,700-unit residential development in the Astoria neighborhood of Queens, despite the fact that the Mayor highlighted the stop in his State of the City address. It is estimated that the Astoria Cove ferry landing would cost an additional $7.2 million in capital spending, according to a 2013 ferry study commissioned by EDC that formed the basis of the city’s proposal to expand ferry service.
According to the Mayor’s Office of Management and Budget, the funding for the Astoria Cove stop is still being determined. News reports suggest that the city would pay for a portion of the cost of the Astoria Cove landing, with the project’s developer contributing the balance. The other 10 landings that are included in the capital plan will be built and maintained directly by EDC.
In another notable absence, the preliminary budget does not include funding for operating subsidies for the ferry program, even though EDC’s study found that the proposed routes would operate at a loss.
EDC’s 2013 ferry study contained models of the revenue and expenses for each route and estimated the extent to which the city would need to subsidize their operations. The level of subsidy varied considerably from route to route. Projections showed that revenue would cover approximately 20 percent of operating expenses on the Rockaway, South Brooklyn, and Soundview routes. For this reason, the study’s authors discouraged the development of the Rockaway and South Brooklyn routes, noting that they “proved to require considerable subsidies and were not recommended for further consideration.”
The other routes were projected to be less costly to sustain. The coverage ratio on a route connecting the Lower East Side with Midtown and Wall Street was estimated at 49 percent, while the Astoria route reached 65 percent. For context, the currently operating East River Ferry achieved a coverage ratio of 64 percent in 2013, albeit with a higher fare than projected for the new routes and substantial ridership from tourists and other noncommuters.
Based on the ferry study’s projections, IBO estimates that the five proposed routes will require annual subsidies from the city’s expense budget of at least $16 million when they are fully operational.
Additional Capital Funds for Vision Zero. The Mayor added $237 million to the Department of Transportation’s (DOT) preliminary four-year capital plan for projects associated with Vision Zero, the de Blasio Administration’s campaign to eliminate traffic deaths on the city’s streets.
Last month, DOT and the police department released a series of borough-specific Pedestrian Safety Action Plans. These reports found that a small number of streets were responsible for a disproportionate share of injuries and fatalities and flagged 154 roads as “priority corridors,” suggesting steps the city could take to prevent accidents from occurring on those thoroughfares in the future.
Several of these priority corridors are slated to receive additional capital funding in the preliminary budget. The increased funding includes $100 million for safety improvements on Queens Boulevard, $65 million for a third phase of improvements for the Grand Concourse, $20 million for Atlantic Avenue, and $16 million for 4th Avenue in Brooklyn over the next four years. The plan also allocates an additional $36 million for street lights and traffic and pedestrian signals. These projects meet just a portion of the citywide need highlighted in the Pedestrian Safety Action Plans, which underscores the scope of capital work that will be necessary to achieve all the goals of Vision Zero.
Increased Funding for Select Bus Service. DOT also added $35 million in capital funds over the next four years for Select Bus Service expansion. By the end of calendar year 2017, the city plans to increase the number of SBS routes from 7 to 20. The city will undertake the capital investment needed to create the SBS routes, including construction of the street, sidewalk, and signal improvements. Once construction has been completed, the NYC Transit division of the Metropolitan Transportation Authority will assume responsibility for supplying the buses and operating the routes. Two-thirds of the new funding in the Mayor’s Preliminary Capital Commitment Plan is allocated for general citywide SBS expansion and the remaining third is for a proposed route along Utica Avenue.

ANALYSIS OF THE MAYOR’S PRELIMINARY BUDGET FOR 2016
NYC Independent Budget Office March 201546
Overall, DOT’s four-year commitment plan contains $165 million for SBS projects from fiscal year 2015 through fiscal year 2018, nearly $118 million of which is planned for general citywide initiatives rather than specific routes. Of the four routes that DOT has publicly said are in the design or construction stages (86th Street, Flushing/Jamaica, Utica Avenue, and Woodhaven Boulevard), only Utica Avenue and Woodhaven Boulevard are individually specified in the plan, and Woodhaven Boulevard is only funded through the design phase. DOT has identified 10 other corridors for future expansion, although it is not clear when the
de Blasio Administration will commit funding to the specific routes. In the absence of more information, it is difficult to determine how close the de Blasio Administration will come to meeting its target of 20 routes by the end of 2017.

NYC Independent Budget Office March 2015 47
CAPITAL SPENDING, FINANCING & DEBT SERVICE/Four-Year Plan
Capital Spending, Financing & Debt ServiceFour-Year Capital Commitment Plan
The February 2015 Capital Commitment Plan that accompanied the Mayor’s preliminary budget provides $44.7 billion for the city’s capital program covering 2015 through 2018, including a total of $3.3 billion for Hurricane Sandy related capital projects. Most of the four-year capital plan, $36.6 billion (82 percent), is city-financed with the remaining $8.1 billion expected to come from state, federal, and private grants.
The city has revised its projected spending for agency capital programs, in part to reflect the increase in federal funding in response to damage caused by Hurricane Sandy. Capital commitments were adjusted by a net increase of $2.5 billion, or 6.0 percent, from the level in the adopted plan which was released in October 2014.The largest share of the increase, $1.4 billion, is federal funding for Hurricane Sandy capital projects (for information on Hurricane Sandy capital commitments see page 38).
Education, Environmental Protection, and Transportation. Capital commitments are largely concentrated in three areas of the plan: education, environmental protection, and transportation. Together
Changes in Capital Commitment Plan Since AdoptionAuthorized commitments, dollars in millions
2015 2016 2017 2018 Total
February 2015 PlanCity Funds $13,638 $9,047 $7,709 $6,204 $36,599 Sandy Federal Funds 1,478 1,245 221 109 3,053 Other Noncity Funds 2,191 899 878 1,037 5,004
Total $17,307 $11,191 $8,808 $7,350 $44,656
October 2014 PlanCity Funds $13,885 $7,603 $5,714 $4,988 $32,190 Sandy Federal Funds 1,584 32 70 1 1,687 Other Noncity Funds 2,344 2,113 2,192 1,605 8,255
Total $17,813 $9,748 $7,976 $6,594 $42,132
ChangeCity Funds ($247) $1,444 $1,995 $1,216 $4,409 Sandy Federal Funds (106) 1,213 151 108 1,366 Other Noncity Funds (153) (1,214) (1,314) (568) (3,251)
Total ($506) $1,443 $832 $756 $2,524 NOTES: Plan figures exclude interfund agreements and contingency amounts. Figures may not add due to rounding.
New York City Independent Budget Office
Changes Since Adopted Plan by Project TypeAuthorized commitments, dollars in millions
Project Type
Funding Changes
City Other Total
Hospitals $88 $497 $585 Transportation 502 50 552 Housing Authority 21 308 329 Education 3,331 (3,045) 286 Police, Fire, and Correction 213 37 250 Economic Development 75 75 150 Environmental Protection (4) 126 122 All Other 183 67 250 TOTAL $4,409 ($1,885) $2,524 NOTES: Plan figures exclude interfund agreements and contingency amounts. Figures may not add due to rounding.
New York City Indpendent Budget Office

ANALYSIS OF THE MAYOR’S PRELIMINARY BUDGET FOR 2016
NYC Independent Budget Office March 201548
these three categories total $26.5 billion, or nearly 60 percent of the overall capital plan.
Department of Education projects total $11 billion, which is the largest share (24.7 percent) of total planned commitments over the 2015 through 2018 period. Since the adopted plan was released in October, funding to repair school buildings damaged by Hurricane Sandy has increased by $286 million. In addition, the new plan includes a shift in funding of roughly $3 billion—an increase in city funds offsetting an equal decrease in state funding. The city currently assigns state building aid to the Transitional Finance Authority (TFA), which is authorized to issue building aid revenue bonds (BARBs) to finance a portion of the city’s school construction needs. The TFA is approaching its limit of $9.2 billion in BARBs that can be issued under the state legislation that authorized this financing mechanism. As a result, the city is expecting that a larger share of state aid will flow to the city’s general fund, financing a larger share of projects through general obligation bonds. This funding shift will not affect the amount of state aid due to the city.
Department of Environmental Protection projects account for the second largest share, $8.2 billion, or 18.3 percent, of total planned commitments from 2015 through 2018. The February 2015 plan reflects a net increase of $122 million in capital funding for environmental protection projects (a $126 million increase in noncity funding sources offset in part with a decrease of $3.5 million in city funding).The largest increases include $142 million for sewer construction and $120 million for water pollution control projects, of which $90 million is federal funding for damage caused by Hurricane Sandy. Conversely, funding reductions include declines of $121 million for water supply projects and $29 million for equipment purchases.
Transportation projects are the third largest share, $6.8 billion, or 15.3 percent, of total planned commitments. The February 2015 plan increases capital funding for transportation projects by a total of $552 million, of which $502 million is city-financed. Highway projects account for $461 million of the total increase in planned commitments ($13 million of which is funded with federal Sandy reconstruction funds), including $237 million for Vision Zero projects and $35 million for Select Bus Service expansion. Funding for various ferry projects has increased by $81 million
(see page 44 for additional details on funding for Vision Zero, select bus, and ferries). The allocation of highway bridge funding is increased by $20 million, including $36 million in federal funding for Hurricane Sandy projects offset in part with a decrease from other sources. Conversely, there was a decrease in funding of $11 million for traffic projects over the plan period.
Hospitals. Capital funding for hospital projects increased by $585 million, or 56 percent, since the October plan to reach $1.6 billion over the plan period. The increase is largely the result of additional federal funding ($497 million), which includes Sandy Community Development Block Grant Disaster Recovery funding of $172 million and $270 million for public hospital reconstruction projects as a result of Hurricane Sandy.
The Housing Authority. Capital funding for projects in public housing developments is $329 million, or 133.7 percent higher, than in the previous plan, and now totals $576 million over the plan period. The largest share of the increase, $308 million or over 90 percent of the total increase, is federal Community Development Block Grant Disaster Recovery funding planned for repair, reconstruction, and resiliency work at housing authority developments as a direct result of Hurricane Sandy.
Police, Fire, and Correction. Capital funding for these three areas of the plan have increased by $250 million, or 10.7 percent, bringing the total over the plan period to $2.6 billion. The majority of the increase, $213 million, is city-financed, with federal Sandy assistance contributing the remaining $37 million. Police department projects include $80 million for a new property and evidence storage facility after some of the department’s evidence storage capacity was damaged by Hurricane Sandy. There is $40 million in new funding for Department of Correction projects including the expansion of the video recording and camera system on Rikers Island and other rehabilitation and improvement projects for jails and detention centers. Funding for fire department projects increased by $67 million for various repairs and capital improvements, some of which are needed in the wake of damage from Sandy.
Economic Development. The new plan increases funding for economic development projects by $150 million, or 10.2 percent, bringing planned commitments
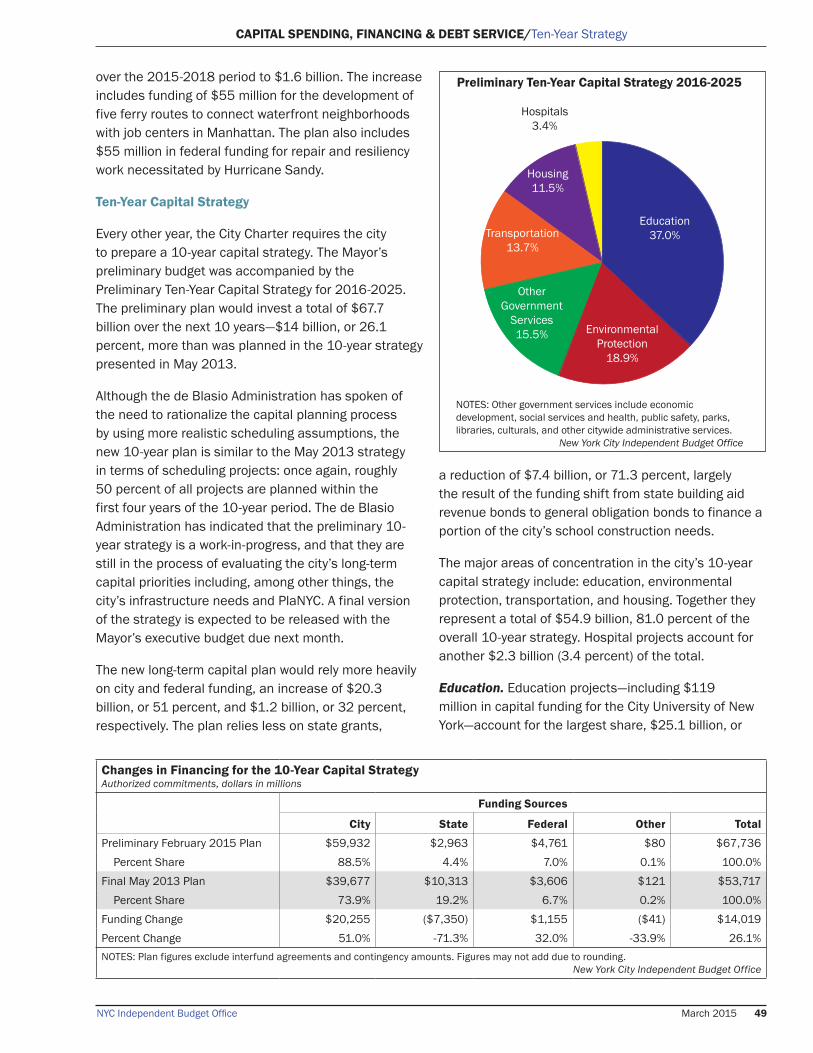
NYC Independent Budget Office March 2015 49
CAPITAL SPENDING, FINANCING & DEBT SERVICE/Ten-Year Strategy
over the 2015-2018 period to $1.6 billion. The increase includes funding of $55 million for the development of five ferry routes to connect waterfront neighborhoods with job centers in Manhattan. The plan also includes $55 million in federal funding for repair and resiliency work necessitated by Hurricane Sandy.
Ten-Year Capital Strategy
Every other year, the City Charter requires the city to prepare a 10-year capital strategy. The Mayor’s preliminary budget was accompanied by the Preliminary Ten-Year Capital Strategy for 2016-2025. The preliminary plan would invest a total of $67.7 billion over the next 10 years—$14 billion, or 26.1 percent, more than was planned in the 10-year strategy presented in May 2013.
Although the de Blasio Administration has spoken of the need to rationalize the capital planning process by using more realistic scheduling assumptions, the new 10-year plan is similar to the May 2013 strategy in terms of scheduling projects: once again, roughly 50 percent of all projects are planned within the first four years of the 10-year period. The de Blasio Administration has indicated that the preliminary 10-year strategy is a work-in-progress, and that they are still in the process of evaluating the city’s long-term capital priorities including, among other things, the city’s infrastructure needs and PlaNYC. A final version of the strategy is expected to be released with the Mayor’s executive budget due next month.
The new long-term capital plan would rely more heavily on city and federal funding, an increase of $20.3 billion, or 51 percent, and $1.2 billion, or 32 percent, respectively. The plan relies less on state grants,
a reduction of $7.4 billion, or 71.3 percent, largely the result of the funding shift from state building aid revenue bonds to general obligation bonds to finance a portion of the city’s school construction needs.
The major areas of concentration in the city’s 10-year capital strategy include: education, environmental protection, transportation, and housing. Together they represent a total of $54.9 billion, 81.0 percent of the overall 10-year strategy. Hospital projects account for another $2.3 billion (3.4 percent) of the total.
Education. Education projects—including $119 million in capital funding for the City University of New York—account for the largest share, $25.1 billion, or
Changes in Financing for the 10-Year Capital StrategyAuthorized commitments, dollars in millions
Funding Sources
City State Federal Other Total
Preliminary February 2015 Plan $59,932 $2,963 $4,761 $80 $67,736 Percent Share 88.5% 4.4% 7.0% 0.1% 100.0%
Final May 2013 Plan $39,677 $10,313 $3,606 $121 $53,717 Percent Share 73.9% 19.2% 6.7% 0.2% 100.0%
Funding Change $20,255 ($7,350) $1,155 ($41) $14,019 Percent Change 51.0% -71.3% 32.0% -33.9% 26.1%NOTES: Plan figures exclude interfund agreements and contingency amounts. Figures may not add due to rounding.
New York City Independent Budget Office
Education 37.0%Transportation
13.7%
Other Government
Services15.5%
Housing11.5%
Environmental Protection
18.9%
Hospitals3.4%
Preliminary Ten-Year Capital Strategy 2016-2025
NOTES: Other government services include economic development, social services and health, public safety, parks, libraries, culturals, and other citywide administrative services.
New York City Independent Budget Office

ANALYSIS OF THE MAYOR’S PRELIMINARY BUDGET FOR 2016
NYC Independent Budget Office March 201550
37.0 percent, of the 10-year total. The plan includes allocations of $10.6 billion for the rehabilitation, improvement, and upgrade of school buildings, along with system expansion of $7.4 billion for new school construction, building additions, and new athletic fields and playgrounds.
Environmental Protection. Environmental protection projects account for $12.8 billion, or 18.9 percent, over the 10-year period. The plan includes $5.4 billion for wastewater treatment programs including plant upgrades, reconstruction, and water quality projects systemwide. Water supply and distribution systems account for another $3.6 billion including water main replacement and quality preservation improvements to the upstate watershed.
Transportation. Transportation projects—including the city’s $404 million capital contribution to the Metropolitan Transit Authority for subways and buses—account for $9.3 billion or 13.7 percent over the total 10-year period. The plan includes $4.9 billion for systemwide bridge reconstruction and upgrades. It also provides for $3.0 billion in highway projects including $1.4 billion for street resurfacing and $1.2 billion for street reconstruction.
Housing. Housing projects account for $7.8 billion, or 11.5 percent, of total planned projects. The plan includes $2.5 billion for projects to preserve existing affordable housing and provide long-term affordability. An additional $2.1 billion is allocated for construction and preservation for special needs housing and $2.0 billion for new construction projects to house low-, moderate-, and middle-income families.
Hospitals. Hospital projects account for $2.3 billion, or 3.4 percent, over the total 10-year period, of which $1.5 billion, or roughly 65 percent, is federal funding for hospital reconstruction as a result of Hurricane Sandy. The plan also includes the completion of the Harlem Hospital modernization and expansion project, along with the construction of an Emergency Medical Service station at the hospital. Funding is also provided for the construction of the Vanderbilt Avenue Health Clinic, a new system to replace the existing electronic medical record system and infrastructure projects and equipment purchases throughout the public hospital system.
Financing the Capital Plan
To finance the February 2015 Capital Commitment Plan, the city will borrow money by issuing three types of debt: general obligation (GO), Transitional Finance Authority (TFA), and Municipal Water Finance Authority (often referred to as New York Water or NYW). General obligation debt is backed primarily by the city’s property tax. TFA debt is backed by the personal income tax. NYW debt is backed by fees and charges levied on users of the New York City water and sewer systems. The proceeds of water authority debt are pledged exclusively to capital improvements for the city’s water and sewer system. GO and TFA debt proceeds fund the remainder of the city-funded capital program.
City Debt Issuance Trends. Annual borrowing is based on the city’s cash needs for capital projects. Cash needs are roughly correlated with city capital expenditures in each year. There is a much weaker relationship between either cash needs or capital expenditures and capital commitments in a given year. This is because a capital commitment (when the city registers a contract for the project) in one year can result in capital expenditures in that year, in a later year, or spread out over a few years.
The Mayor’s Office of Management and Budget (OMB) projects that the city will issue $3.5 billion in new
0
1
2
3
4
5
6
7
$8
Dollars in billions
Bond Issues Financed From City's General FundActual Projected
SOURCE: Mayor’s Office of Management and BudgetNOTE: Includes GO and TFA new money bond issues. Excludes refunding bonds,TFA Recovery Bonds, TFA Building Aid Revenue Bonds, and Muncipal Water FInance Authority Bonds.
New York City Independent Budget Office
20042006
20082010
20122014
20162018

NYC Independent Budget Office March 2015 51
CAPITAL SPENDING, FINANCING & DEBT SERVICE/Financing
debt in 2015, which would represent a 32 percent decrease from 2014 and the lowest total since 2008. This continues a shift that began last year. Since January 2014, the city has reduced the amount it plans to borrow in 2015 by $2.3 billion while increasing planned borrowing in 2016 through 2019 by $6.2 billion. This shift is, in part, a byproduct of the de Blasio Administration’s goal to more accurately project the timing of capital projects across the four-year plan and 10-year capital strategy. With fewer projects planned for 2015 and a surplus of proceeds on hand, the city needs to borrow less to fund its capital needs.
Some of the growth in the later years of the plan also reflects new planned commitments for affordable housing, Vision Zero projects, bus rapid transit, and Hurricane Sandy recovery work. Another factor is the previously discussed funding shift affecting school construction. The 2015 through 2019 financial plan assumes that the city will finance a greater share of education projects through GO borrowing instead of building aid revenue bonds. The shift will not affect the total amount the city borrows for school construction projects. Swapping city-funded debt for state-funded debt, however, means that a greater share of education spending will qualify as city obligations, and therefore will count against the city’s debt limit.
Cost of Debt Service. Debt service—the cost of repaying principal and/or interest on outstanding bonds—is a function of the amount of outstanding debt and the terms that were obtained when the debt was issued. Debt service in the city budget reflects GO and TFA borrowing, as well as several smaller obligations. Debt service for NYW borrowing is not an item in the city budget as it is paid directly by the water authority—a self-financing public benefit corporation.
Debt service, after adjusting for prepayments and defeasances—which involve the use of current surplus funds to prepay future interest and principal on existing debt—is expected to total $6.2 billion in 2015, according to the Mayor’s budget office. While this is an 11.1 percent increase from debt service the city paid in 2014, it is 5.1 percent below the amount forecast by the Mayor in his November 2014 Financial Plan. IBO estimates that debt service will be $6.1 billion in 2015, slightly lower than the city’s current projection, due to our expectation of greater savings from continued low interest rates.
OMB reduced its interest rate forecast for the city’s outstanding variable rate debt obligations for 2015 in the preliminary budget, which it estimated will save the city $117 million this year. OMB lowered its assumption for the rate on tax-exempt debt from 4.1 percent to 2.5 percent, while the assumed rate on taxable debt was reduced from 6.0 percent to 3.0 percent. IBO estimates that there will be even greater savings this year —an additional $104 million—given that current interest rates are less than 1 percent on both taxable and tax-exempt debt, well below the city’s revised assumptions.
Along with the changes in the variable-rate debt assumptions, the city also reduced its forecast of interest support payments to the Hudson Yards Infrastructure Corporation by $197 million, with the majority of the savings ($170 million) concentrated in 2015 and 2016. (The city agreed to subsidize the corporation’s interest payments for bonds issued to redevelop Hudson Yards until revenue from the area’s development could fully support the payments.) This adjustment accounts for revenue generated by new projects, mostly one-time payments made by office developers in exchange for additional air rights. As development continues, the city may be able to further reduce its annual subsidy.
While some savings were recognized in the short-term, OMB forecasts an increase in annual debt service costs over the next few years to nearly $8.1 billion by 2019. However, given the conservative nature of the city’s estimates in the financial plan, it is possible that the city will continue to realize savings in the future if interest rates remain low or fail to rise as quickly as OMB has assumed. In addition to the variable rate debt savings, the city has taken advantage of the low interest rate environment in recent years to refinance outstanding debt and to sell fixed rate bonds at lower than forecasted rates. If the gap between OMB’s interest rate assumptions and actual market rates persists this would generate additional debt service savings although IBO has not included such savings in our re-estimate of the city’s future debt service costs.
The current debt service budget also includes $75 million for short-term borrowing in 2016 through 2019, even though the city has not issued short-term notes since 2004. While IBO does not yet make adjustments for possible lower-than-projected interest rates in the out-years of the financial plan, we do assume that the

ANALYSIS OF THE MAYOR’S PRELIMINARY BUDGET FOR 2016
NYC Independent Budget Office March 201552
city will not issue the short-term debt, bringing IBO’s estimate of debt service in 2019 down to just under $8.0 billion.
Debt service as a share of IBO’s forecast of tax revenue is projected to increase to 12.4 percent in 2015, up from 11.5 percent in 2014. Debt service as a share of expenditures is forecast to grow to 10.9 percent, up from 10.0 percent last year. IBO projects that both these ratios will continue to rise in 2016 and then stay roughly constant through the out-years of the financial plan as increases in debt service are nearly matched by increases in tax revenues and expenditures. While high, these estimates are still within the range of what the city has paid in debt service relative to revenue and expenses in the past. Additionally, given the conservative nature of IBO’s future year debt service estimates, it is likely that future ratios will settle in closer to historic levels.
Debt Service and Debt Service as Shares Of Tax Revenues and Expenditures
Actual & Projected Debt Service (R)
012345678$9
0%
4%
8%
12%
16%
20%
Debt Service as Percent of Tax Revenue (L)
Debt Service as Percent of Total City Expenditures (L)
Debt Service, in billionsDebt Service as Percent of Tax Revenue
SOURCE: Mayor's Office of Management and BudgetNOTES: Fiscal years 2015 to 2019 are projected. Adjusted for prepayment of debt service. Projections based on IBO tax revenue and expenditure forecasts.
New York City Independent Budget Office
20042006
20082010
20122014
2016p2018p
2002

Share on

IBONew York City
Independent Budget Office
Ronnie Lowenstein, Director110 William St., 14th Floor • New York, NY 10038Tel. (212) 442-0632 • Fax (212) [email protected] • www.ibo.nyc.ny.usE-mail Text Facebook Twitter RSS