Embed Size (px)
Citation preview
Journal of Retailing and Consumer Services 20 (2013) 408–418
Contents lists available at SciVerse ScienceDirect
Journal of Retailing and Consumer Services
0969-69
http://d
n Corr
E-m
jmberpi
rvazcar
journal homepage: www.elsevier.com/locate/jretconser
Analysis of the moderating role of the gender variablein service recovery processes
Jesus Cambra-Fierro n, Juan M. Berbel-Pineda, Rocıo Ruiz-Benıtez, Rosario Vazquez-Carrasco
University Pablo de Olavide, Sevilla 41013, Spain
a r t i c l e i n f o
Available online 21 December 2012
Keywords:
Service recovery
Customer satisfaction
Loyalty
Gender
Mobile phone market
89/$ - see front matter & 2013 Published by
x.doi.org/10.1016/j.jretconser.2012.11.008
esponding author. Tel.: þ34 954 977 924.
ail addresses: [email protected] (J. Cambra-Fier
[email protected] (J.M. Berbel-Pineda), rruiben@upo.
@upo.es (R. Vazquez-Carrasco).
a b s t r a c t
In this study, the authors focus on service recovery processes and identify a set of key factors that drive
satisfaction with the recovery process, which ultimately leads to customer loyalty. In addition, the
authors investigate the role of gender as a potential moderating variable in the recovery process. Using
a sample of 202 customers who had experienced a problem with their provider, filed a complaint and
received a response from the company, the authors empirically test the proposed framework in the
mobile phone market. The findings reveal that men tend to be more demanding when dealing with
service providers and less loyal, while women tend to exhibit a more fully-developed sense of justice
and greater attitudinal and behavioral loyalty. These results provide valuable insights for the consumer
services industry: Companies can use gender information to manage complaints in order to restore
customer satisfaction and increase customer loyalty more efficiently.
& 2013 Published by Elsevier Ltd.
1. Introduction
More competition means consumers have more choices—
hence, are more demanding (Tsai and Su, 2009). Demandingcustomers often perceive service as being of low quality. Thismay be due to errors on the part of the service provider or simplydue to the fact that demanding consumers expect more.
This explains why more and more consumer services firms aredeveloping market research as a tool for identifying and assessingboth existing and potential consumer needs and expectations; thegoal being to design better services and enhanced personneltraining methods. Another key element is striving to streamlineservices, improving service failure management and enhancingcustomer service (Salavou, 2010), which is even more importantin the post-purchase stage (Endo et al., 2012).
Nevertheless, not even the best companies are immune tomaking mistakes, as authors such as Chang and Hsiao (2008),DeWitt et al. (2008), Huang (2008), Michel and Meuter (2008) andVarela et al. (2008) – among others – have pointed out. Companyerrors have an impact on end-user perception and can affectsatisfaction/dissatisfaction levels (Michel and Meuter, 2008).However, effective service failure management and a timely solutioncan restore customer satisfaction (Varela et al., 2008; Hocutt et al.,
Elsevier Ltd.
ro),
es (R. Ruiz-Benıtez),
2006; Spreng et al., 1995; Bitner et al., 1990). As a consequence,service recovery has become a relevant strategy for firms aiming tosatisfy and retain customers (Bitner et al., 1990; Zeithaml et al.,1996). As Maxham and Netemeyer (2002) point out, the enormouspressure most industries are currently under has turned the atten-tion of both academic and business spheres back on this issue.
Thus, the impact of service recovery on customer satisfactionhas been amply studied (e.g., Michel and Meuter, 2008; Varelaet al., 2008). The literature suggests that recovery measuresdecrease the likelihood of customer switching (e.g., Tsai and Su,2009; Varela et al., 2009)—in fact, they are considered antece-dents to client loyalty and the relational approach (e.g., DeWittet al., 2008; Chang and Hsiao, 2008). However, most research inthe context of consumer services has only examined how firmsmay rebuild satisfaction, but just some recent studies go deeperinto the consequences of such satisfaction (e.g., Watson, 2012).
In general, literature (DeWitt et al., 2008; Chang and Hsiao,2008) shows that effective management of services-related com-plaints paves the way for profitable relationships in the long term,while providing valuable feedback opportunities for companieswhich are receptive to constructive criticism. Poor service failuremanagement, on the other hand, can trigger even higher levels ofdissatisfaction. DeWitt et al. (2008) specify that – despiteadvances in research – considerable gaps in the literature persistregarding (i) how justice is perceived and its impact on loyalty,and (ii) individual and joint consideration of attitudinal andbehavioral loyalty, which would contribute to a fuller under-standing of service recovery measure effectiveness (p. 270).
J. Cambra-Fierro et al. / Journal of Retailing and Consumer Services 20 (2013) 408–418 409
Huang (2008) delves into the notion of customer satisfaction, yetfalls short of presenting empirical proof for the claim that a directlink exists between satisfaction and loyalty. Huang postulates thatthe scope of the failure, client perception of staff efforts, andexpectations with respect to recovery are antecedents to the levelof recovery-related satisfaction when service is eventually restored.
On the other hand, retailers and consumer services firms aim tomanage their resources as efficiently as possible. Therefore, identi-fying specific customer characteristics which impact on customerbehavior may be of great interest in order to segment customers’databases and to achieve a better resources allocation. In thissense, of particular interest are studies by authors such as Mattila(2010), Verhoef (2003), Homburg and Giering (2001), Mittal andKamakura (2001) and Iacobucci and Ostrom (1993), who point outthat men and women tend to display divergent behavior patternsand perceive satisfaction differently. Yet, literature specificallyanalyzing the role of gender in satisfaction models is hard to comeby in services marketing research. Shanin and Chan (2006), Pai-Linet al. (2001) and Iacobucci and Ostrom (1993) are rare exceptions.In the case of service recovery research, we were only able to findexplicit evidence in Lin (2010) and, even then, it was limited to ananalysis of the impact of service recovery processes on theexpectations–satisfaction relationship. Therefore, research on theeffect of gender in service recovery processes within the consumerservices industry is scarce.
In such a context, this study aims to complement the existingliterature and reach the following specific objectives: (i) identifyand explore antecedents of perceived satisfaction with servicerecovery processes as well as analyze links of such satisfactionwith loyalty, and (ii) study the potential moderating role of thegender variable in service recovery processes. To the extent thatwe achieve these goals we will be contributing to filling in thementioned gaps, especially in the context of consumer servicesindustry. More specifically, our research is conducted in thecontext of a particular retailing setting where, based on theinteraction between providers and end consumers, both productsand services are sold to end customers (Gummerus and Pihlstrom,2011; Premazzi et al., 2010): mobile phones and services.
The paper is structured as follows. Section 2 presents theliterature review taking as key reference service recovery pro-cesses. Section 3 presents the model of reference based on a set ofhypothesis. Section 4 justifies the sector of reference for theempirical study: The intrinsic interest of a closer look at themobile sector lies in (i) its structural characteristics; and (ii) thefact that this sector has already served as a framework foranalyzing service recovery processes. Sections 5 and 6 are relatedwith the empirical study and results. The front-end of the paperdiscusses about our contribution to literature and practice as wellas presents the main conclusions of this research.
2. Literature review
The term service failure is defined as a real or perceived setback orproblem occurring during customer–company interaction (Micheland Meuter, 2008; Maxham, 2001). Along similar lines, authors suchas Bitner et al. (1990) and Gronroos (1998) defined service recovery aspost-failure measures taken by the service provider aimed at resol-ving the problem. Both Chang and Hsiao (2008) and Smith et al.(1999) make a distinction between complaint management and service
recovery. In both cases, we are dealing with a reaction to a service-related problem on the part of the company; however, these authorsargue, while complaint management is reactive in nature, servicerecovery is proactive; the aim is not only to deal with the complaintbut to provide a satisfactory, client-oriented solution as quickly aspossible. Therefore, for the purposes of this research we suppose that
customers make complaints when expectations are not achieved andtherefore we only analyze the perceived satisfaction with servicerecovery processes.
Successful service recovery, then, is a catalyst for customersatisfaction which may in turn translate into positive word-of-mouth, boost long-term purchasing patterns and enhancecompany–client relationships (Tsai and Su, 2009; Hocutt et al.,2006; Kau and Loh, 2006; Weun et al., 2004). Similar lines ofreasoning are found in research by De Matos et al. (2007),Magnini et al. (2007), Maxham (2001), Smith and Bolton (1998),and Zeithaml et al. (1996).
With respect to key variables, the literature highlights perceived
satisfaction and repurchase intent (e.g., DeWitt et al., 2008; Micheland Meuter, 2008; De Matos et al., 2007). Yet, the vast majority ofresearch published prior to the present study focuses on thesevariables in isolation; and only a small percentage of studies, in ouropinion, have grounded findings in empirical evidence—despiteimplicitly recognizing the link between customer satisfaction andservice loyalty/intent to repurchase. For instance, Watson (2012)recently examines the effects of service critical nature, service type,previous service experience and service recovery (assistance only,compensation only or assistance with compensation) on customersatisfaction, customer loyalty and complaint behavior. Huang(2008) and De Matos et al. (2007) consider service failure severity,recovery expectations, company responsibility, and perceivedinterest/effort when it comes to resolving service-related problems.Work by DeWitt et al. (2008) revolves around the notions ofjustice, and loyalty—both attitudinal and behavioral. In short, thevast majority of the studies cited recognize the potential impact ofmoderating factors such as type of service/industry or the demo-graphic profile of the sample although without empirical evidence.
Key studies for understanding notions such as perceived satisfac-
tion and customer retention strategy (e.g., Shanin and Chan, 2006;Verhoef, 2003; Homburg and Giering, 2001; Mittal and Kamakura,2001) point out that certain variables – including gender, age,education and income level – can alter projected behavior patterns.Such research suggests that male clients tend to be more demand-ing and expect short-term results; female clients, on the other hand,tend to exhibit a more developed sense of justice and higher levelsof attitudinal and behavioral loyalty.
The value of such findings has been corroborated in servicemarketing circles by Mattila (2010), Pai-Lin et al. (2001), andIacobucci and Ostrom (1993), among others. Yet, Pai-Lin et al.(2001) alone explicitly focuses on service recovery strategies—
though limiting the scope of analysis to the expectations–satisfaction relationship. Lin’s study concludes that women havehigher expectations for recovery than men and calls for renewedresearch efforts taking into account a broader service recoverymodel. For instance, Mattila (2010) suggests that women are moresatisfied with the compensation when given the opportunity tochoose from alternatives than are men.
In any case, a review of the literature, then, reveals research gapswhich substantiate the present study. It follows – as authors such asDeWitt et al. (2008) – have recently suggested, that more empiricalevidence of the nexus linking perceived justice, service recovery-related satisfaction and customer loyalty is needed. Of interest as well,is an in-depth analysis of the potential moderating role of the gendervariable (Lin, 2010). Our study acquires added value by looking at aspecific industry and context which has yet to be analyzed—despiteits economic impact: the mobile phone sector in Spain.
3. Hypotheses
Based on the ideas and arguments developed in the literatureand presented in previous sections we argue that customer
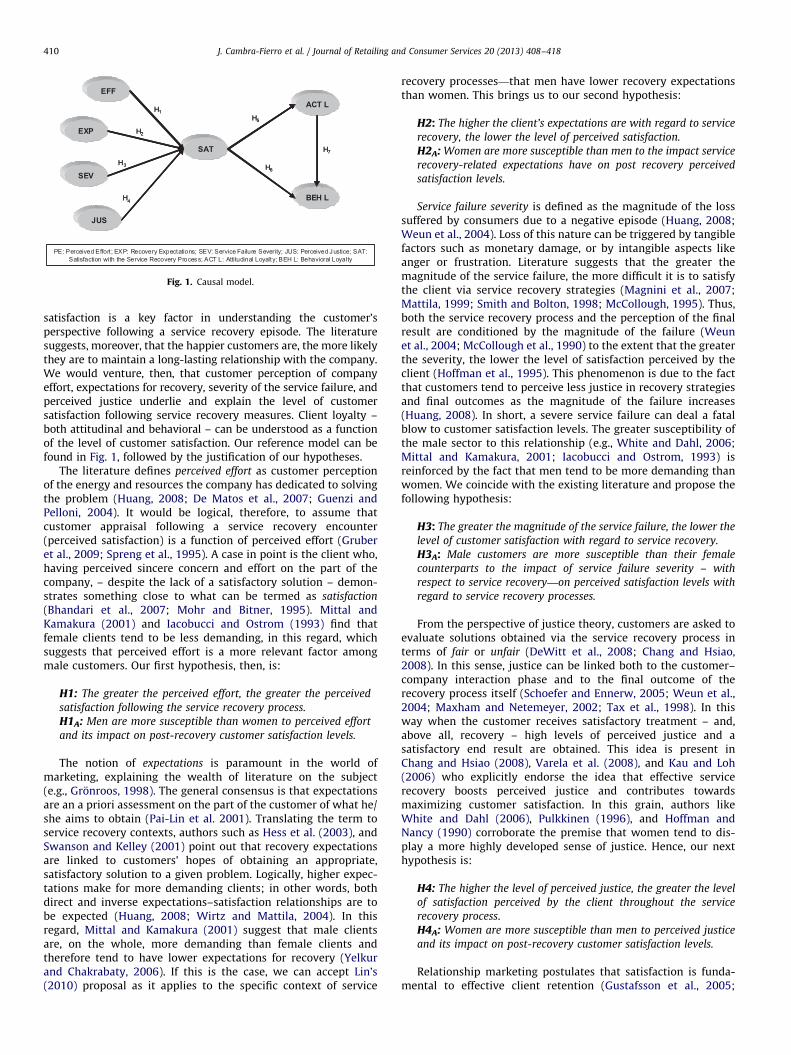
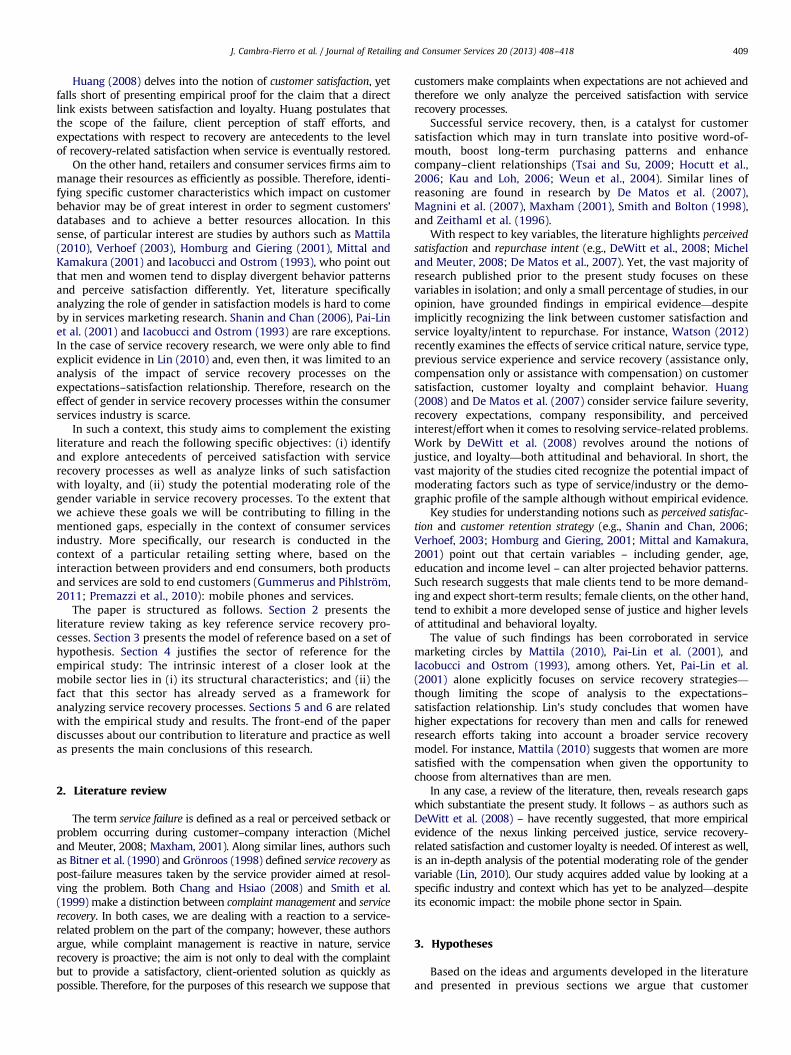
Fig. 1. Causal model.
J. Cambra-Fierro et al. / Journal of Retailing and Consumer Services 20 (2013) 408–418410
satisfaction is a key factor in understanding the customer’sperspective following a service recovery episode. The literaturesuggests, moreover, that the happier customers are, the more likelythey are to maintain a long-lasting relationship with the company.We would venture, then, that customer perception of companyeffort, expectations for recovery, severity of the service failure, andperceived justice underlie and explain the level of customersatisfaction following service recovery measures. Client loyalty –both attitudinal and behavioral – can be understood as a functionof the level of customer satisfaction. Our reference model can befound in Fig. 1, followed by the justification of our hypotheses.
The literature defines perceived effort as customer perceptionof the energy and resources the company has dedicated to solvingthe problem (Huang, 2008; De Matos et al., 2007; Guenzi andPelloni, 2004). It would be logical, therefore, to assume thatcustomer appraisal following a service recovery encounter(perceived satisfaction) is a function of perceived effort (Gruberet al., 2009; Spreng et al., 1995). A case in point is the client who,having perceived sincere concern and effort on the part of thecompany, – despite the lack of a satisfactory solution – demon-strates something close to what can be termed as satisfaction
(Bhandari et al., 2007; Mohr and Bitner, 1995). Mittal andKamakura (2001) and Iacobucci and Ostrom (1993) find thatfemale clients tend to be less demanding, in this regard, whichsuggests that perceived effort is a more relevant factor amongmale customers. Our first hypothesis, then, is:
H1: The greater the perceived effort, the greater the perceived
satisfaction following the service recovery process.
H1A: Men are more susceptible than women to perceived effort
and its impact on post-recovery customer satisfaction levels.
The notion of expectations is paramount in the world ofmarketing, explaining the wealth of literature on the subject(e.g., Gronroos, 1998). The general consensus is that expectationsare an a priori assessment on the part of the customer of what he/she aims to obtain (Pai-Lin et al. 2001). Translating the term toservice recovery contexts, authors such as Hess et al. (2003), andSwanson and Kelley (2001) point out that recovery expectationsare linked to customers’ hopes of obtaining an appropriate,satisfactory solution to a given problem. Logically, higher expec-tations make for more demanding clients; in other words, bothdirect and inverse expectations–satisfaction relationships are tobe expected (Huang, 2008; Wirtz and Mattila, 2004). In thisregard, Mittal and Kamakura (2001) suggest that male clientsare, on the whole, more demanding than female clients andtherefore tend to have lower expectations for recovery (Yelkurand Chakrabaty, 2006). If this is the case, we can accept Lin’s(2010) proposal as it applies to the specific context of service
recovery processes—that men have lower recovery expectationsthan women. This brings us to our second hypothesis:
H2: The higher the client’s expectations are with regard to service
recovery, the lower the level of perceived satisfaction.
H2A: Women are more susceptible than men to the impact service
recovery-related expectations have on post recovery perceived
satisfaction levels.
Service failure severity is defined as the magnitude of the losssuffered by consumers due to a negative episode (Huang, 2008;Weun et al., 2004). Loss of this nature can be triggered by tangiblefactors such as monetary damage, or by intangible aspects likeanger or frustration. Literature suggests that the greater themagnitude of the service failure, the more difficult it is to satisfythe client via service recovery strategies (Magnini et al., 2007;Mattila, 1999; Smith and Bolton, 1998; McCollough, 1995). Thus,both the service recovery process and the perception of the finalresult are conditioned by the magnitude of the failure (Weunet al., 2004; McCollough et al., 1990) to the extent that the greaterthe severity, the lower the level of satisfaction perceived by theclient (Hoffman et al., 1995). This phenomenon is due to the factthat customers tend to perceive less justice in recovery strategiesand final outcomes as the magnitude of the failure increases(Huang, 2008). In short, a severe service failure can deal a fatalblow to customer satisfaction levels. The greater susceptibility ofthe male sector to this relationship (e.g., White and Dahl, 2006;Mittal and Kamakura, 2001; Iacobucci and Ostrom, 1993) isreinforced by the fact that men tend to be more demanding thanwomen. We coincide with the existing literature and propose thefollowing hypothesis:
H3: The greater the magnitude of the service failure, the lower the
level of customer satisfaction with regard to service recovery.
H3A: Male customers are more susceptible than their female
counterparts to the impact of service failure severity – with
respect to service recovery—on perceived satisfaction levels with
regard to service recovery processes.
From the perspective of justice theory, customers are asked toevaluate solutions obtained via the service recovery process interms of fair or unfair (DeWitt et al., 2008; Chang and Hsiao,2008). In this sense, justice can be linked both to the customer–company interaction phase and to the final outcome of therecovery process itself (Schoefer and Ennerw, 2005; Weun et al.,2004; Maxham and Netemeyer, 2002; Tax et al., 1998). In thisway when the customer receives satisfactory treatment – and,above all, recovery – high levels of perceived justice and asatisfactory end result are obtained. This idea is present inChang and Hsiao (2008), Varela et al. (2008), and Kau and Loh(2006) who explicitly endorse the idea that effective servicerecovery boosts perceived justice and contributes towardsmaximizing customer satisfaction. In this grain, authors likeWhite and Dahl (2006), Pulkkinen (1996), and Hoffman andNancy (1990) corroborate the premise that women tend to dis-play a more highly developed sense of justice. Hence, our nexthypothesis is:
H4: The higher the level of perceived justice, the greater the level
of satisfaction perceived by the client throughout the service
recovery process.H4A: Women are more susceptible than men to perceived justice
and its impact on post-recovery customer satisfaction levels.
Relationship marketing postulates that satisfaction is funda-mental to effective client retention (Gustafsson et al., 2005;
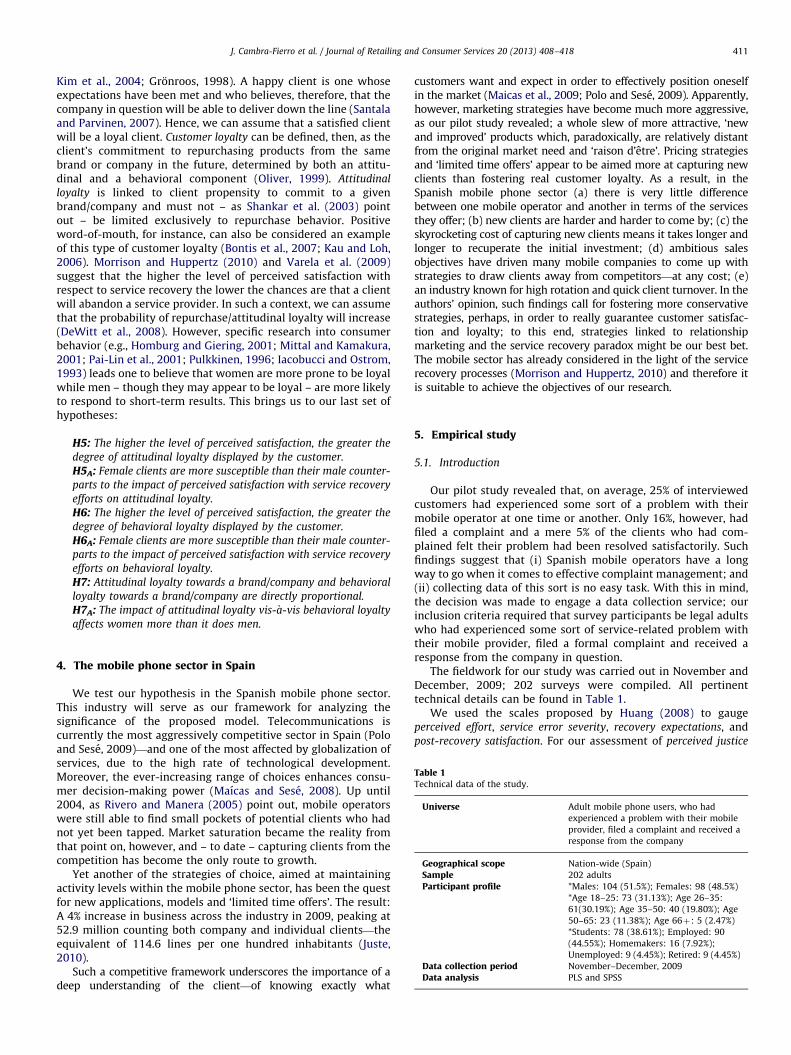
Table 1Technical data of the study.
Universe Adult mobile phone users, who had
experienced a problem with their mobile
provider, filed a complaint and received a
response from the company
Geographical scope Nation-wide (Spain)
Sample 202 adults
Participant profile *Males: 104 (51.5%); Females: 98 (48.5%)
*Age 18–25: 73 (31.13%); Age 26–35:
61(30.19%); Age 35–50: 40 (19.80%); Age
50–65: 23 (11.38%); Age 66þ: 5 (2.47%)
*Students: 78 (38.61%); Employed: 90
(44.55%); Homemakers: 16 (7.92%);
Unemployed: 9 (4.45%); Retired: 9 (4.45%)
Data collection period November–December, 2009
Data analysis PLS and SPSS
J. Cambra-Fierro et al. / Journal of Retailing and Consumer Services 20 (2013) 408–418 411
Kim et al., 2004; Gronroos, 1998). A happy client is one whoseexpectations have been met and who believes, therefore, that thecompany in question will be able to deliver down the line (Santalaand Parvinen, 2007). Hence, we can assume that a satisfied clientwill be a loyal client. Customer loyalty can be defined, then, as theclient’s commitment to repurchasing products from the samebrand or company in the future, determined by both an attitu-dinal and a behavioral component (Oliver, 1999). Attitudinal
loyalty is linked to client propensity to commit to a givenbrand/company and must not – as Shankar et al. (2003) pointout – be limited exclusively to repurchase behavior. Positiveword-of-mouth, for instance, can also be considered an exampleof this type of customer loyalty (Bontis et al., 2007; Kau and Loh,2006). Morrison and Huppertz (2010) and Varela et al. (2009)suggest that the higher the level of perceived satisfaction withrespect to service recovery the lower the chances are that a clientwill abandon a service provider. In such a context, we can assumethat the probability of repurchase/attitudinal loyalty will increase(DeWitt et al., 2008). However, specific research into consumerbehavior (e.g., Homburg and Giering, 2001; Mittal and Kamakura,2001; Pai-Lin et al., 2001; Pulkkinen, 1996; Iacobucci and Ostrom,1993) leads one to believe that women are more prone to be loyalwhile men – though they may appear to be loyal – are more likelyto respond to short-term results. This brings us to our last set ofhypotheses:
H5: The higher the level of perceived satisfaction, the greater the
degree of attitudinal loyalty displayed by the customer.
H5A: Female clients are more susceptible than their male counter-
parts to the impact of perceived satisfaction with service recovery
efforts on attitudinal loyalty.
H6: The higher the level of perceived satisfaction, the greater the
degree of behavioral loyalty displayed by the customer.
H6A: Female clients are more susceptible than their male counter-
parts to the impact of perceived satisfaction with service recovery
efforts on behavioral loyalty.
H7: Attitudinal loyalty towards a brand/company and behavioral
loyalty towards a brand/company are directly proportional.
H7A: The impact of attitudinal loyalty vis-�a-vis behavioral loyalty
affects women more than it does men.
4. The mobile phone sector in Spain
We test our hypothesis in the Spanish mobile phone sector.This industry will serve as our framework for analyzing thesignificance of the proposed model. Telecommunications iscurrently the most aggressively competitive sector in Spain (Poloand Sese, 2009)—and one of the most affected by globalization ofservices, due to the high rate of technological development.Moreover, the ever-increasing range of choices enhances consu-mer decision-making power (Maıcas and Sese, 2008). Up until2004, as Rivero and Manera (2005) point out, mobile operatorswere still able to find small pockets of potential clients who hadnot yet been tapped. Market saturation became the reality fromthat point on, however, and – to date – capturing clients from thecompetition has become the only route to growth.
Yet another of the strategies of choice, aimed at maintainingactivity levels within the mobile phone sector, has been the questfor new applications, models and ‘limited time offers’. The result:A 4% increase in business across the industry in 2009, peaking at52.9 million counting both company and individual clients—theequivalent of 114.6 lines per one hundred inhabitants (Juste,2010).
Such a competitive framework underscores the importance of adeep understanding of the client—of knowing exactly what
customers want and expect in order to effectively position oneselfin the market (Maicas et al., 2009; Polo and Sese, 2009). Apparently,however, marketing strategies have become much more aggressive,as our pilot study revealed; a whole slew of more attractive, ‘newand improved’ products which, paradoxically, are relatively distantfrom the original market need and ‘raison d’etre’. Pricing strategiesand ‘limited time offers’ appear to be aimed more at capturing newclients than fostering real customer loyalty. As a result, in theSpanish mobile phone sector (a) there is very little differencebetween one mobile operator and another in terms of the servicesthey offer; (b) new clients are harder and harder to come by; (c) theskyrocketing cost of capturing new clients means it takes longer andlonger to recuperate the initial investment; (d) ambitious salesobjectives have driven many mobile companies to come up withstrategies to draw clients away from competitors—at any cost; (e)an industry known for high rotation and quick client turnover. In theauthors’ opinion, such findings call for fostering more conservativestrategies, perhaps, in order to really guarantee customer satisfac-tion and loyalty; to this end, strategies linked to relationshipmarketing and the service recovery paradox might be our best bet.The mobile sector has already considered in the light of the servicerecovery processes (Morrison and Huppertz, 2010) and therefore itis suitable to achieve the objectives of our research.
5. Empirical study
5.1. Introduction
Our pilot study revealed that, on average, 25% of interviewedcustomers had experienced some sort of a problem with theirmobile operator at one time or another. Only 16%, however, hadfiled a complaint and a mere 5% of the clients who had com-plained felt their problem had been resolved satisfactorily. Suchfindings suggest that (i) Spanish mobile operators have a longway to go when it comes to effective complaint management; and(ii) collecting data of this sort is no easy task. With this in mind,the decision was made to engage a data collection service; ourinclusion criteria required that survey participants be legal adultswho had experienced some sort of service-related problem withtheir mobile provider, filed a formal complaint and received aresponse from the company in question.
The fieldwork for our study was carried out in November andDecember, 2009; 202 surveys were compiled. All pertinenttechnical details can be found in Table 1.
We used the scales proposed by Huang (2008) to gaugeperceived effort, service error severity, recovery expectations, andpost-recovery satisfaction. For our assessment of perceived justice
J. Cambra-Fierro et al. / Journal of Retailing and Consumer Services 20 (2013) 408–418412
and customer loyalty (attitudinal and behavioral) we opted infavor of the scales put forth by DeWitt et al. (2008). Prior todistributing the final survey we circulated a pretest we hadfleshed out in collaboration with colleagues from Marketingdepartments at several different universities, Ph.D. candidates,and a small sample of potential interviewees. With the contextunder scrutiny in mind, pertinent reliability and validity testswere run for all proposed scales—even in cases where the scale inquestion had previously been tested in earlier studies. The scalesthat were eventually selected have been included in Appendix 1for easy reference.
We worked with a Partial Least Squares (PLS) structuralequations analysis technique to evaluate the measurement modeland significance of the hypotheses. PLS-Graph version 03.00 build
1017 (Chin and Frye, 2003) was the software of choice.
5.2. Measurement model
It should be noted here that one of the constructs– – perceived
justice – is made operable via a molecular approach; this makes ita second-level factor which is the cause of its first-level compo-nents or factors (Chin and Gopal, 1995). Thus, it was essential toapply the approach in two phases—also referred to as hierarchical
components analysis (HCA) (Lohmoller, 1989; Chin and Gopal,1995). We should note here as well that perceived justice is asecond-level construct which is measured using three first-levelfactors: distributive justice, interactive justice and procedural justice.
With regard to our measurement model, we began by asses-sing the reliability of individual items. The indicators for all threesamples are above the accepted 0.707 benchmark established byCarmines and Zeller (1979), as seen in Table 2. Only one item wasbelow the accepted benchmark: If another mobile provider offered
lower prices or special discounts, I would make the change (ACT L3);this item was excluded from all three samples.
In the case of construct reliability, the measurement scale ofchoice was composite reliability (rc) (Werts et al., 1974). Carefulscrutiny of the findings in Appendix 1 shows all constructs in alldimensions to be reliable across the three samples: indicatorvalues above 0.8 (Nunnally, 1978).
When it came to assessing convergent validity, we turned to theaverage variance extracted (AVE) scale proposed by Fornell andLarcker (1981). Given that the 0.5 benchmark these authorsestablish is below the AVE for the different constructs/dimensions,we can affirm that convergent validity exists (see Appendix 1).
The presence of discriminant validity has been confirmed usingAVE (Fornell and Larcker, 1981), comparing the square root of thismeasurement with the correlations among constructs. Discrimi-nant validity is present in all samples, as seen in Appendix 2.
6. Findings
6.1. Structural model
Following this analysis of our measurement model an assess-ment of the significance of the hypotheses proposed in thestructural model is in order. It should be noted that PLS doesnot require that data derive from normal, or known,distributions—which explains why traditional parameter estima-tion techniques for testing model significance are consideredinappropriate (Chin, 1998). Yet another difference betweencovariance-based structural equation models and PLS is that, inthe latter, goodness-of-fit measures are not called for (Hulland,1999). As seen in Table 2, the structural model is assessed (i)using the variance value from the model (R2), and (ii) consideringthe size of the standardized path coefficients (b) after observing
both the t values and the significance level obtained from thebootstrap test with 500 subsamples.
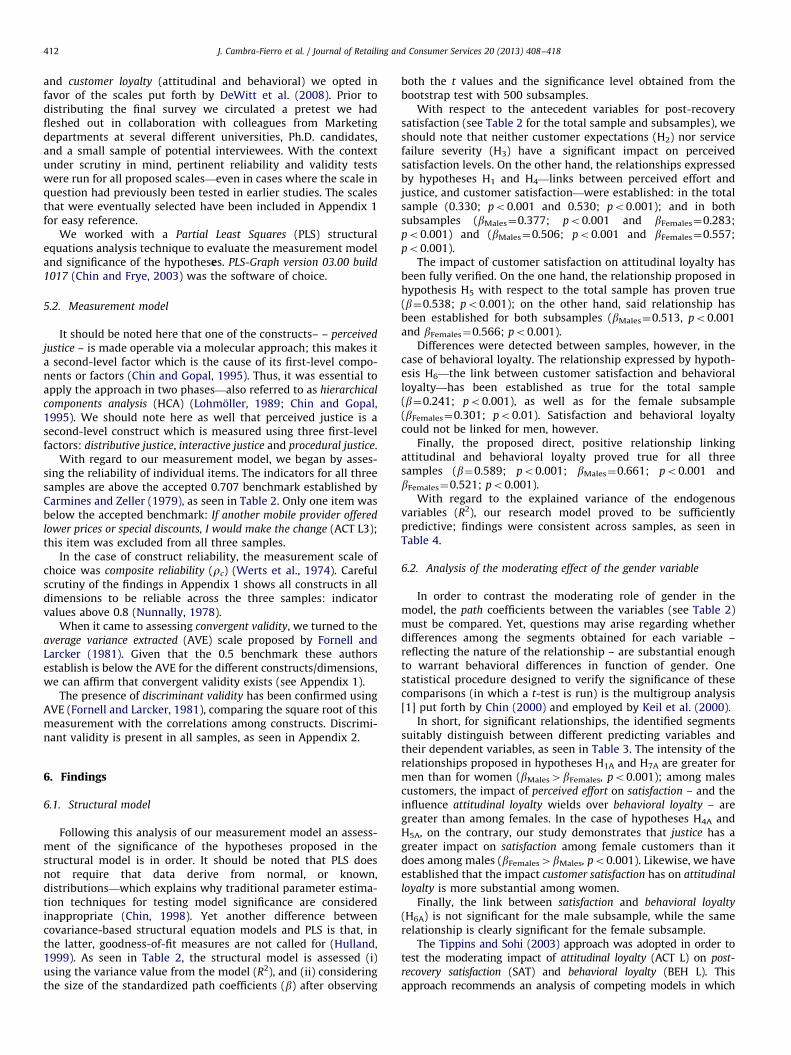
With respect to the antecedent variables for post-recoverysatisfaction (see Table 2 for the total sample and subsamples), weshould note that neither customer expectations (H2) nor servicefailure severity (H3) have a significant impact on perceivedsatisfaction levels. On the other hand, the relationships expressedby hypotheses H1 and H4—links between perceived effort andjustice, and customer satisfaction—were established: in the totalsample (0.330; po0.001 and 0.530; po0.001); and in bothsubsamples (bMales¼0.377; po0.001 and bFemales¼0.283;po0.001) and (bMales¼0.506; po0.001 and bFemales¼0.557;po0.001).
The impact of customer satisfaction on attitudinal loyalty hasbeen fully verified. On the one hand, the relationship proposed inhypothesis H5 with respect to the total sample has proven true(b¼0.538; po0.001); on the other hand, said relationship hasbeen established for both subsamples (bMales¼0.513, po0.001and bFemales¼0.566; po0.001).
Differences were detected between samples, however, in thecase of behavioral loyalty. The relationship expressed by hypoth-esis H6—the link between customer satisfaction and behavioralloyalty—has been established as true for the total sample(b¼0.241; po0.001), as well as for the female subsample(bFemales¼0.301; po0.01). Satisfaction and behavioral loyaltycould not be linked for men, however.
Finally, the proposed direct, positive relationship linkingattitudinal and behavioral loyalty proved true for all threesamples (b¼0.589; po0.001; bMales¼0.661; po0.001 andbFemales¼0.521; po0.001).
With regard to the explained variance of the endogenousvariables (R2), our research model proved to be sufficientlypredictive; findings were consistent across samples, as seen inTable 4.
6.2. Analysis of the moderating effect of the gender variable
In order to contrast the moderating role of gender in themodel, the path coefficients between the variables (see Table 2)must be compared. Yet, questions may arise regarding whetherdifferences among the segments obtained for each variable –reflecting the nature of the relationship – are substantial enoughto warrant behavioral differences in function of gender. Onestatistical procedure designed to verify the significance of thesecomparisons (in which a t-test is run) is the multigroup analysis[1] put forth by Chin (2000) and employed by Keil et al. (2000).
In short, for significant relationships, the identified segmentssuitably distinguish between different predicting variables andtheir dependent variables, as seen in Table 3. The intensity of therelationships proposed in hypotheses H1A and H7A are greater formen than for women (bMales4bFemales, po0.001); among malescustomers, the impact of perceived effort on satisfaction – and theinfluence attitudinal loyalty wields over behavioral loyalty – aregreater than among females. In the case of hypotheses H4A andH5A, on the contrary, our study demonstrates that justice has agreater impact on satisfaction among female customers than itdoes among males (bFemales4bMales, po0.001). Likewise, we haveestablished that the impact customer satisfaction has on attitudinal
loyalty is more substantial among women.Finally, the link between satisfaction and behavioral loyalty
(H6A) is not significant for the male subsample, while the samerelationship is clearly significant for the female subsample.
The Tippins and Sohi (2003) approach was adopted in order totest the moderating impact of attitudinal loyalty (ACT L) on post-
recovery satisfaction (SAT) and behavioral loyalty (BEH L). Thisapproach recommends an analysis of competing models in which
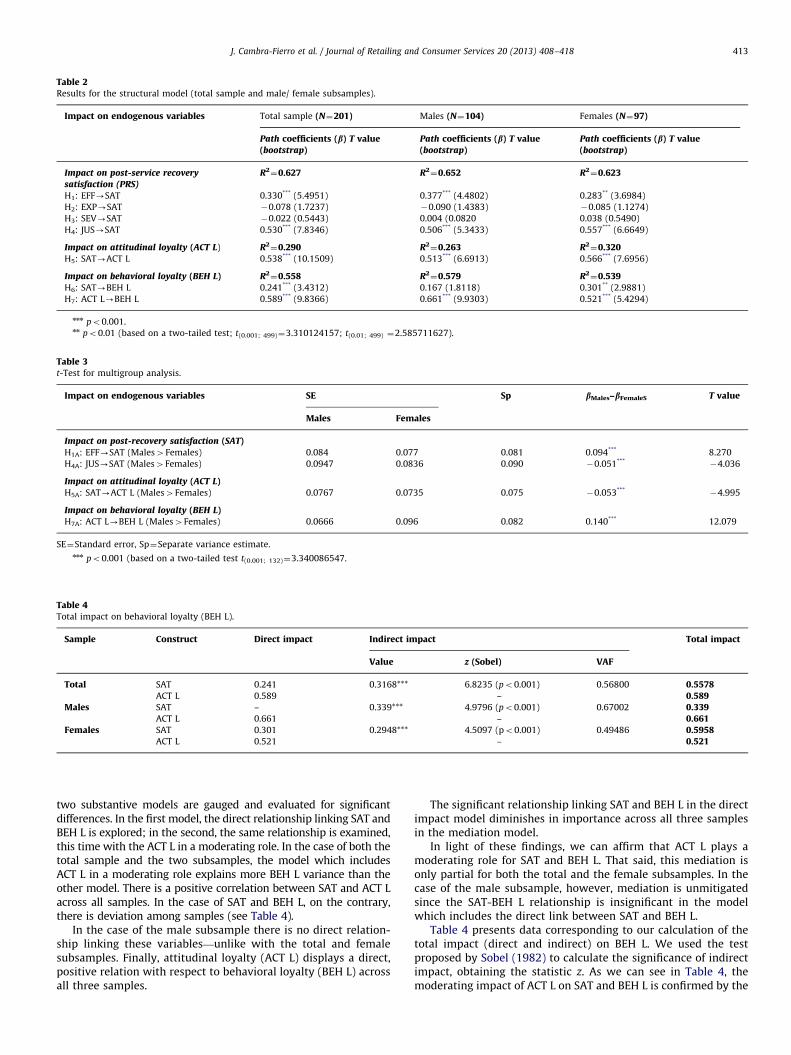
Table 2Results for the structural model (total sample and male/ female subsamples).
Impact on endogenous variables Total sample (N¼201) Males (N¼104) Females (N¼97)
Path coefficients (b) T value(bootstrap)
Path coefficients (b) T value(bootstrap)
Path coefficients (b) T value(bootstrap)
Impact on post-service recoverysatisfaction (PRS)
R2¼0.627 R2
¼0.652 R2¼0.623
H1: EFF-SAT 0.330*** (5.4951) 0.377*** (4.4802) 0.283** (3.6984)
H2: EXP-SAT �0.078 (1.7237) �0.090 (1.4383) �0.085 (1.1274)
H3: SEV-SAT �0.022 (0.5443) 0.004 (0.0820 0.038 (0.5490)
H4: JUS-SAT 0.530*** (7.8346) 0.506*** (5.3433) 0.557*** (6.6649)
Impact on attitudinal loyalty (ACT L) R2¼0.290 R2
¼0.263 R2¼0.320
H5: SAT-ACT L 0.538*** (10.1509) 0.513*** (6.6913) 0.566*** (7.6956)
Impact on behavioral loyalty (BEH L) R2¼0.558 R2
¼0.579 R2¼0.539
H6: SAT-BEH L 0.241*** (3.4312) 0.167 (1.8118) 0.301** (2.9881)
H7: ACT L-BEH L 0.589*** (9.8366) 0.661*** (9.9303) 0.521*** (5.4294)
nnn po0.001.nn po0.01 (based on a two-tailed test; t(0.001; 499)¼3.310124157; t(0.01; 499) ¼2.585711627).
Table 3t-Test for multigroup analysis.
Impact on endogenous variables SE Sp bMales–bFemaleS T value
Males Females
Impact on post-recovery satisfaction (SAT)H1A: EFF-SAT (Males4Females) 0.084 0.077 0.081 0.094*** 8.270
H4A: JUS-SAT (Males4Females) 0.0947 0.0836 0.090 �0.051***�4.036
Impact on attitudinal loyalty (ACT L)H5A: SAT-ACT L (Males4Females) 0.0767 0.0735 0.075 �0.053***
�4.995
Impact on behavioral loyalty (BEH L)H7A: ACT L-BEH L (Males4Females) 0.0666 0.096 0.082 0.140*** 12.079
SE¼Standard error, Sp¼Separate variance estimate.nnn po0.001 (based on a two-tailed test t(0.001; 132)¼3.340086547.
Table 4Total impact on behavioral loyalty (BEH L).
Sample Construct Direct impact Indirect impact Total impact
Value z (Sobel) VAF
Total SAT 0.241 0.3168*** 6.8235 (po0.001) 0.56800 0.5578ACT L 0.589 – 0.589
Males SAT – 0.339*** 4.9796 (po0.001) 0.67002 0.339ACT L 0.661 – 0.661
Females SAT 0.301 0.2948*** 4.5097 (po0.001) 0.49486 0.5958ACT L 0.521 – 0.521
J. Cambra-Fierro et al. / Journal of Retailing and Consumer Services 20 (2013) 408–418 413
two substantive models are gauged and evaluated for significantdifferences. In the first model, the direct relationship linking SAT andBEH L is explored; in the second, the same relationship is examined,this time with the ACT L in a moderating role. In the case of both thetotal sample and the two subsamples, the model which includesACT L in a moderating role explains more BEH L variance than theother model. There is a positive correlation between SAT and ACT Lacross all samples. In the case of SAT and BEH L, on the contrary,there is deviation among samples (see Table 4).
In the case of the male subsample there is no direct relation-ship linking these variables—unlike with the total and femalesubsamples. Finally, attitudinal loyalty (ACT L) displays a direct,positive relation with respect to behavioral loyalty (BEH L) acrossall three samples.
The significant relationship linking SAT and BEH L in the directimpact model diminishes in importance across all three samplesin the mediation model.
In light of these findings, we can affirm that ACT L plays amoderating role for SAT and BEH L. That said, this mediation isonly partial for both the total and the female subsamples. In thecase of the male subsample, however, mediation is unmitigatedsince the SAT-BEH L relationship is insignificant in the modelwhich includes the direct link between SAT and BEH L.
Table 4 presents data corresponding to our calculation of thetotal impact (direct and indirect) on BEH L. We used the testproposed by Sobel (1982) to calculate the significance of indirectimpact, obtaining the statistic z. As we can see in Table 4, themoderating impact of ACT L on SAT and BEH L is confirmed by the
J. Cambra-Fierro et al. / Journal of Retailing and Consumer Services 20 (2013) 408–418414
z statistic, with a value of po0.001 across all three samples. Themagnitude of indirect impact on the total is derived from thevariance accounted for (VAF) put forth by Iacobucci and Duhachek(2003). In the total sample, 56.8% of the total impact of SAT onBEH L is due to indirect impact, climbing to 67% in the case ofmales and dropping to approximately 49.5% for females.
7. Discussion
For the context analyzed (the mobile sector in Spain) ourfindings warrant a defense of the inherent value of designing andexecuting effective service recovery strategies—given the impactthey have on perceived customer satisfaction levels. This analysisis in line with pioneering research by Bitner et al. (1990),Zeithaml et al. (1996), and more recent studies by authors suchas DeWitt et al. (2008) and Michel and Meuter (2008), amongothers. Not even the best companies are immune to makingmistakes; this is something that the vast majority of consumerstend to understand. That said, complaint management and servicerecovery strategies clearly must lead to a reasonable solution iffull customer satisfaction is to be recuperated and companyimage to remain intact. In this light, successful recovery from aservice failure can translate into enhanced customer satisfaction,confidence and loyalty, as long as the company has effectivelyshown its ability to solve the problem. Furthermore, – in line withauthors such as Mattila (2010), Shanin and Chan (2006), Verhoef(2003), Homburg and Giering (2001), and Mittal and Kamakura(2001) – our findings demonstrate that gender plays a moderatingrole with regard to the relationships proposed in service recoverymodels.
In this regard, the present study anticipated the possibility thatfactors linked to service failure severity, expectations for recovery,and perceived effort on the part of the company, all contributetowards determining the level of customer satisfaction with respectto service recovery. Our data suggests, however, that service failureseverity and expectations for recovery do not have a significantimpact on perceived satisfaction (H2 and H3). Such results contra-dict claims by authors like Magnini et al. (2007), Mattila (1999),Hoffman et al. (1995), and McCollough et al. (1990) – who defendthat service failure severity is inversely proportional to post servicerecovery satisfaction – and Huang (2008), Hess et al. (2003) orSwanson and Kelley (2001) with respect to the expectations–satisfaction relationship. We consider that this could be due tothe fact that the greater the range of choices, the more entitled thecustomer feels to receive satisfactory service from the get-go;customers expect a satisfactory solution—regardless of the magni-tude of the service failure. In other words, the severity of the failureis not the issue and higher expectations can put a damper onotherwise positive service recovery outcomes. Whatever the casemay be, this is merely a supposition as our findings are notconclusive in this regard and do not allow for a broader discussionregarding studies such as Lin (2010).
Customer perceptions regarding mobile company efforts todeal with problems (H1), on the other hand, do have a direct,significant impact on customer satisfaction with service recovery.Existing studies (Huang, 2008; De Matos et al., 2007; Mohr andBitner, 1995) suggest that customers value the interest and effortcompanies invest in resolving problems. It has even been pointedout that if real, sincere desire is perceived, customer satisfactionwill exist even if a solution does not. The implications of this areclear: When service failure occurs or customers express dissatis-faction, the company should make an effort to get to the bottomof the problem and provide a solution, while making sure theclient is well aware that the company is taking steps in the rightdirection. Moreover, we have found that higher expectations
among male customers make perceived effort on the part of thecompany of the essence for this sector; such findings are in linewith Mittal and Kamakura (2001) and Iacobucci and Ostrom(1993), among others.
The literature called for additional research into the impact ofperceived justice (DeWitt et al., 2008; Varela et al., 2008). Ourfourth hypothesis (H4) proposes a direct relationship betweenperceived justice and post service recovery satisfaction. The datasuggests such a nexus exists, aligning us with authors like DeWittet al. (2008), Chang and Hsiao (2008), Varela et al. (2008),Maxham and Netemeyer (2002) and Tax et al. (1998). Underlyingthis hypothesis is the assumption that customers should betreated fairly and receive solutions which they consider just. Inthis regard – and given that perceptions with respect to justicecan vary notably between companies and clients – it would be agood idea for companies to invest in getting to know whatcustomers expect, and what they consider fair, in order to adaptto their needs or, at the very least, help them understand that thesolution provided is the most appropriate and just given theproblem in question. That said, female customers are more likelythan male customers to perceive justice both in the servicerecovery process and in the final result, allowing us to corroborateideas put forth by White and Dahl (2006), Pulkkinen (1996), andHoffman and Nancy (1990).
Whichever route is eventually taken, the company shouldreact quickly (i) to understand underlying factors and (ii), tocommunicate with the customer. This shows the company’sdesire to find a satisfactory solution to the problem. Moreover,as Mattila (2006) suggests, it is essential that firms explain howthe error occurred and what is being done to deal with it. In orderto do so, the company must have staff capable of attending clientsin a friendly, effective way. We have demonstrated thatcustomer–company interaction and perceived effort have a clearimpact on satisfaction in service-recovery contexts. Hence, asGruber et al. (2009) and Mazaheri et al. (2011) highlight, invest-ing in selection, training and staff motivation activities is essentialsince sometimes interaction between staff and customers is keyto show effort and interest in solving the problem.
Furthermore, incentivizing unhappy customers to file a com-plaint might be worthwhile. Simplifying the filing process, oreven adopting a proactive attitude – in other words, not waitinguntil a complaint is filed before asking customers whether theyare satisfied with the service or not – can be interpreted positivelyas showing interest and investing in problem-solving. In addition,such processes can yield feedback from customers regardingspecific aspects of the service(s) provided.
Lastly, this study set out to find a nexus between Huang’s 2008study, focused on customer satisfaction, and research by Micheland Meuter (2008) which takes a closer look at attitudinal andbehavioral loyalty. In this regard – taking the tenets of relationshipmarketing as a point of reference – our findings for H5, H6 and H7
show a link between customer satisfaction and loyalty, and suggestthat we are looking at a key relational tool with the potential tomake switching costly for the client. In this line of thought, Varelaet al. (2009) suggest that positive service recovery processesdecrease the chances of clients jumping ship (switching). Poloand Sese (2009), though implicitly, corroborate this thesis.
In many cases, customer–company interaction could be chan-neled to cultivate longer-lasting relationships. Knowledgegleaned from this type of feedback would equip firms to tailorservices more specifically to present needs and future expecta-tions, while affording clients a better grasp on a service provider’sactual capacity to react in the face of service failure. If thecustomer does eventually abandon the relationship, the companyshould be interested in the motive(s) and try to learn from eachand every client that falls by the wayside.
J. Cambra-Fierro et al. / Journal of Retailing and Consumer Services 20 (2013) 408–418 415
Another recommendation is that companies take a proactivestance by promising ‘satisfaction guaranteed’ from the start, thusboosting customer trust early on. Clearly, a guarantee of this sortinvolves a concerted effort on the part of the company to meetexpectations, hence never having to pay the penalty of not havingfulfilled the guarantee. On the contrary, such a guarantee wouldhave a legal underpinning and the company would find itselfobliged to make good on its promise.
Our initial multi-sample analysis – later corroborated by ourimpact study of moderating effects – establishes that, in servicerecovery contexts (as in other situations) female clients are morelikely to build long-term relationships and exhibit a greaterdegree of attitudinal and behavioral loyalty than male clients.Male customers, on the contrary, tend to establish a loyalrelationship in appearance only (attitudinal loyalty) which isnot reflected in their behavior. For this sector, behavioral loyaltyis not, automatically, a result of satisfaction. While satisfactiondoes have an immediate impact on attitude, among men, a periodof time must pass before this becomes behavioral loyalty. Suchresults align us with Homburg and Giering (2001), Pai-Lin et al.(2001) and Pulkkinen (1996), among others.
Thus, our findings related to moderating effects suggest thatfirms could benefit from a differential focus on the requirementsof the training provided to staff as well as solutions offered tocustomers depending on such customers’ gender. Service opera-tors and retailers might benefit from offering the customers achoice between hedonic and utilitarian compensation options as apart of the service recovery process. Women seem to be moresatisfied with the compensation when given the opportunity tochoose from alternatives than are men. When targeting females,firms would benefit from focusing more on building and main-taining relationships between employees and customers; womenwant their views heard during the service recovery and to beallowed to provide input, while men do not view voice asimportant. Building customer–company bonds by making theclient feel special may be of interest for women. On the otherhand, emphasis on the utilitarian aspects of the service wouldappeal more to male customers. More specifically it could beargued that efforts to train and motivate frontline employees tohandle service recovery processes, as suggested by Watson(2012), could be more successful in the case of women, as theyplace more importance on justice. On the other hand, an adequatechoice of compensations would be of great value in dealing withwomen, given that satisfaction with the compensation providedwould be higher for women, when given the opportunity tochoose from alternatives than it would be for men (Mattila,2010). Similarly, the results suggest that a different emphasis onadvertising themes would be necessary. Themes stressing perso-nal relationships would be more appealing to women, whilst menwould respond better to the utilitarian or efficiency-relatedaspects of the service.
All of these findings could be harnessed by mobile companiesto enhance customer–company interaction and streamline theuse of available resources. The interest of increasing efficiency inservice recovery processes may be critical in the consumerservices industry in general and in the mobile sectors in parti-cular: Mobile companies use to choose between two alternativeswhen attempting to boost customer loyalty (e.g., Rivero andManera, 2005): (i) the defensive approach, consisting in minimiz-ing motives for discontent by enhancing service quality, and (ii)the offensive approach, where customer–company bonds are builtby making the client feel special (special offers, loyalty programs,etc.). The Spanish context, the one we have analyzed, seems to tiltin the direction of the second option, where customers receive anew phone in exchange for signing a 12- to 18-month contract(if the client breaks the contract he/she must pay for the phone).
Clients feel like they have been taken hostage—penalized ratherthan rewarded. However, both customer’s opinions and relation-ship marketing literature tend to recommend a defensiveapproach as it is more cost efficient and there is a higherprobability of achieving customer satisfaction. A good exampleis Polo and Sese (2009) recent study which establishes keydifferences between positive and negative switching barriers.Successful service recovery is, in fact, a positive barrier, andusually far more effective than the borderline abusive contractswhich trap unhappy clients in a hostage-like relationship with theservice provider. However, our findings show that such programsshould vary depending on whether customers are male or female.
8. Conclusions
We embarked on the present study with the objective ofdiscovering a nexus between antecedents to perceived customersatisfaction following a service recovery process (the impact ofperceived justice, among others), and customer loyalty towards acompany which had dropped the ball but later offered a solution.We went on to analyze the moderating role of the gender variablein service recovery scenarios. In this sense, our study contributesto narrowing the gap identified in the first section of the article.
In short, the present study identifies the impact servicerecovery efforts and perceived justice have on the degree of postrecovery customer satisfaction. Satisfaction, moreover, is anantecedent to customer loyalty. On the contrary, for the sectorconsidered, recovery expectations and service failure severity donot have a significant impact on customer satisfaction. In addi-tion, we have found men have a different profile than women:Where male clients are more demanding and less prone to beloyal, female customers tend to be both fair and loyal. Therefore,consumer services firms may segment their customers’ databaseto achieve better results in service recovery processes.
Thus, our findings corroborate research recognizing the posi-tive impact of service recovery efforts. It is striking, therefore, that– according to consumers – mobile companies in Spain do notinvest in service recovery as a loyalty-building strategy. Implica-tions of the data for business theory and best practice werediscussed in the previous section.
However, despite the inherent interest of the study, it is clearlynot without its limitations. For one, only the Spanish mobilephone sector has been analyzed; a sector which is representativebut which exhibits significant idiosyncrasies. The literature calledfor exploring sectors which had yet received little attention fromresearchers and our data is, for the most part, in line with resultsreported in previous studies. However, one must be cautiouswhen extrapolating findings across sectors: an analysis of poten-tial structural/conjunctural similarities and differences would bein order.
Second, this is a cross-sectional study based on the opinionsexpressed by customers themselves. It would be interesting tocarry out a longitudinal analysis of the entire complaint process,followed by an objective assessment of service provider solutionsand final outcomes. From a practical standpoint, however, gettinginvolved in customer–company interaction can be an extremelycomplex endeavor; and, after all, the key to the service recoveryparadox lies in customers’ perceptions of how they are treatedand to what extent their problems are, or are not, resolved.
Finally, with regard to potential lines for future research, itwould be interesting to analyze the moderating effect of otherconsumer profile variables such as age, profession, income andeducation. An international study comparing mobile companybehavior patterns and customer perceptions might justify adopt-ing a relational approach – which customers in our pilot study
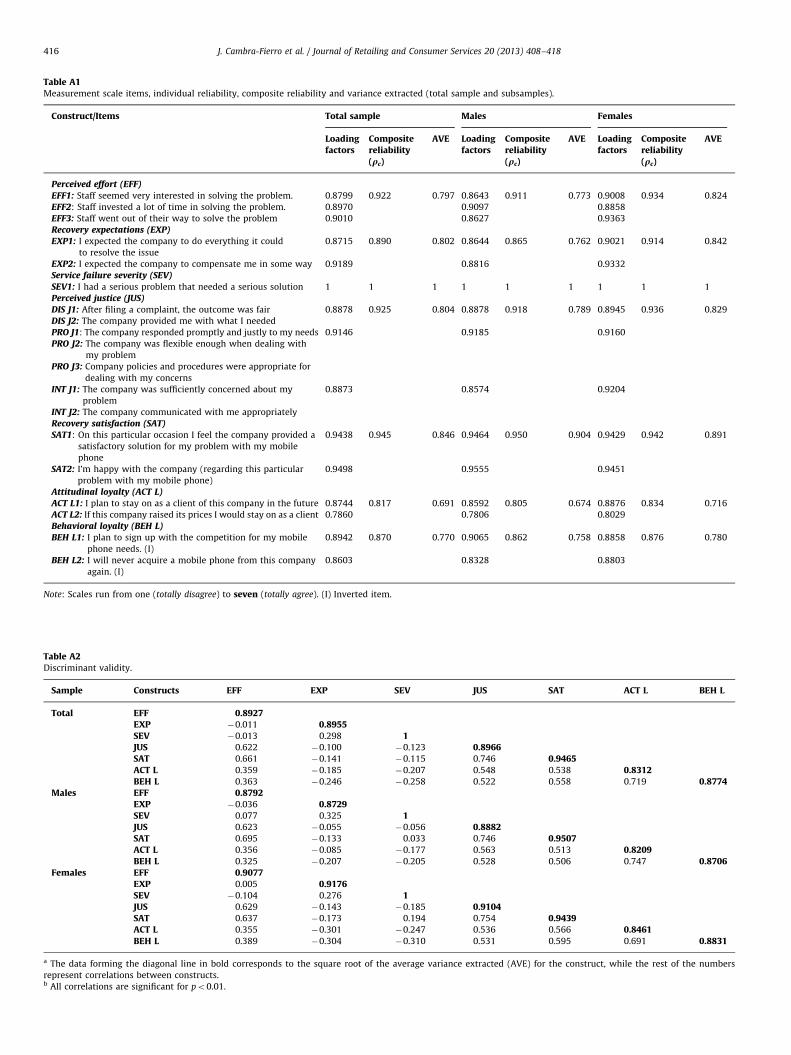
Table A1Measurement scale items, individual reliability, composite reliability and variance extracted (total sample and subsamples).
Construct/Items Total sample Males Females
Loadingfactors
Compositereliability(qc)
AVE Loadingfactors
Compositereliability(qc)
AVE Loadingfactors
Compositereliability(qc)
AVE
Perceived effort (EFF)EFF1: Staff seemed very interested in solving the problem. 0.8799 0.922 0.797 0.8643 0.911 0.773 0.9008 0.934 0.824
EFF2: Staff invested a lot of time in solving the problem. 0.8970 0.9097 0.8858
EFF3: Staff went out of their way to solve the problem 0.9010 0.8627 0.9363
Recovery expectations (EXP)EXP1: I expected the company to do everything it could
to resolve the issue
0.8715 0.890 0.802 0.8644 0.865 0.762 0.9021 0.914 0.842
EXP2: I expected the company to compensate me in some way 0.9189 0.8816 0.9332
Service failure severity (SEV)SEV1: I had a serious problem that needed a serious solution 1 1 1 1 1 1 1 1 1
Perceived justice (JUS)DIS J1: After filing a complaint, the outcome was fair 0.8878 0.925 0.804 0.8878 0.918 0.789 0.8945 0.936 0.829
DIS J2: The company provided me with what I needed
PRO J1: The company responded promptly and justly to my needs 0.9146 0.9185 0.9160
PRO J2: The company was flexible enough when dealing with
my problem
PRO J3: Company policies and procedures were appropriate for
dealing with my concerns
INT J1: The company was sufficiently concerned about my
problem
0.8873 0.8574 0.9204
INT J2: The company communicated with me appropriately
Recovery satisfaction (SAT)SAT1: On this particular occasion I feel the company provided a
satisfactory solution for my problem with my mobile
phone
0.9438 0.945 0.846 0.9464 0.950 0.904 0.9429 0.942 0.891
SAT2: I’m happy with the company (regarding this particular
problem with my mobile phone)
0.9498 0.9555 0.9451
Attitudinal loyalty (ACT L)ACT L1: I plan to stay on as a client of this company in the future 0.8744 0.817 0.691 0.8592 0.805 0.674 0.8876 0.834 0.716
ACT L2: If this company raised its prices I would stay on as a client 0.7860 0.7806 0.8029
Behavioral loyalty (BEH L)BEH L1: I plan to sign up with the competition for my mobile
phone needs. (I)
0.8942 0.870 0.770 0.9065 0.862 0.758 0.8858 0.876 0.780
BEH L2: I will never acquire a mobile phone from this company
again. (I)
0.8603 0.8328 0.8803
Note: Scales run from one (totally disagree) to seven (totally agree). (I) Inverted item.
Table A2Discriminant validity.
Sample Constructs EFF EXP SEV JUS SAT ACT L BEH L
Total EFF 0.8927EXP �0.011 0.8955SEV �0.013 0.298 1JUS 0.622 �0.100 �0.123 0.8966SAT 0.661 �0.141 �0.115 0.746 0.9465ACT L 0.359 �0.185 �0.207 0.548 0.538 0.8312BEH L 0.363 �0.246 �0.258 0.522 0.558 0.719 0.8774
Males EFF 0.8792EXP �0.036 0.8729SEV 0.077 0.325 1JUS 0.623 �0.055 �0.056 0.8882SAT 0.695 �0.133 0.033 0.746 0.9507ACT L 0.356 �0.085 �0.177 0.563 0.513 0.8209BEH L 0.325 �0.207 �0.205 0.528 0.506 0.747 0.8706
Females EFF 0.9077EXP 0.005 0.9176SEV �0.104 0.276 1JUS 0.629 �0.143 �0.185 0.9104SAT 0.637 �0.173 0.194 0.754 0.9439ACT L 0.355 �0.301 �0.247 0.536 0.566 0.8461BEH L 0.389 �0.304 �0.310 0.531 0.595 0.691 0.8831
a The data forming the diagonal line in bold corresponds to the square root of the average variance extracted (AVE) for the construct, while the rest of the numbers
represent correlations between constructs.b All correlations are significant for po0.01.
J. Cambra-Fierro et al. / Journal of Retailing and Consumer Services 20 (2013) 408–418416
J. Cambra-Fierro et al. / Journal of Retailing and Consumer Services 20 (2013) 408–418 417
sample showed an interest in – vis-�a-vis maintaining the moreaggressive approach which, for the moment, seems to prevailin Spain.
NOTES:
t¼PathMales�PathFemales
Spxffiffiffiffiffiffiffiffiffiffiffi1m�
1n
q � t mþn�2ð Þ ð1Þ
Student’s t-distribution of a one-tail test and the number ofdegrees of freedom stated in the expression (mþn�2), Sp beingthe separate variance estimate, m the number of cases in Sample1, n the number of cases in Sample 2, and SE the standard error forthe path provided by PLS-Graph (bootstrap technique).
Sp¼
ffiffiffiffiffiffiffiffiffiffiffiffiffiffiffiffiffiffiffiffiffiffiffiffiffiffiffiffiffiffiffiffiffiffiffiffiffiffiffiffiffiffiffiffiffiffiffiffiffiffiffiffiffiffiffiffiffiffiffiffiffiffiffiffiffiffiffiffiffiffiffiffiffiffiffiffiffiffiffiffiffim�1ð Þ
2
mþn�2SE2
Malesþn�1ð Þ
2
mþn�2SE2
Females
s
Acknowledgements
The authors are very grateful for the comments made by theanonymous reviewers. They are also very grateful for commentsreceived from Prof. Javier Sese. Finally, they want to show theirgratitude to the economic support of the project ECO2011-23027and Generes S09-Fondo Social Europeo.
Appendix A
See Tables A1 and A2.
References
Bhandari, M., Tsarenko, Y., Polonsky, M., 2007. A proposed multi-dimensionalapproach to evaluating service recovery. Journal of Services Marketing 21,174–185.
Bitner, M., Booms, B., Tetreault, M., 1990. The service encounter: diagnosingfavourable and unfavourable incidents. Journal of Marketing 54, 71–84.
Bontis, N., Booker, L., Serenko, A., 2007. The mediating effect of organizationalreputation on customer loyalty and service recommendation in the bankingindustry. Management Decision 45, 1426–1445.
Carmines, E., Zeller, R., 1979. Reliability and validity assessment. Sage UniversityPaper Series on Quantitative Applications in the Social Sciences (07-017). Sage,Beverly Hills, CA.
Chang, H., Hsiao, H., 2008. Examining the causal relationship among servicerecovery, perceived justice, perceived risk and customer value in the hotelindustry. The Service Industries Journal 28, 513–528.
Chin, W., 1998. Issues and opinion on structural equation modeling. MIS Quarterly22, 7–15.
Chin, W., 2000. Frequently Asked Questions—Partial Least Squares and PLS-Graph.Home Page. [On-line], avalaible at: /http://disc-nt.cba.uh.edu/chin/plsfaq.htmS.
Chin, W., Frye, T., 2003. PLS-Graph, Version 3.00 (Build 1017). University ofHouston.
Chin, W., Gopal, A., 1995. Adoption intention in GSS: relative importance of beliefs.The Data Base for Advances in Information Systems 26, 42–63.
De Matos, C.A., Henrique, J.L., Vargas, C.A., 2007. Service recovery paradox: a meta-analysis. Journal of Service Research 10, 60–77.
Dewitt, T., Nguyen, D., Marshall, R., 2008. Exploring customer loyalty followingservice recovery. Journal of Service Research 10, 269–281.
Endo, S., Yang, J., Park, J., 2012. The investigation on dimensions of e-satisfactionfor online shoes retailing. Journal of Retailing and Consumer Services 19(2012), 398–405.
Fornell, C., Larcker, D.F., 1981. Evaluating structural equation models withunobservable variables and measurement error. Journal of Marketing Research18, 39–50.
Gronroos, C., 1998. Marketing services: the case of a missing product. Journal ofBusiness and Industrial Marketing 13, 322–335.
Gruber, T., Szmigin, I., Voss, R., 2009. Developing a deeper understanding of theattributes of effective customer contact employees in personal complaint-handling encounters. Journal of Services Marketing 23, 422–435.
Guenzi, P., Pelloni, O., 2004. The impact of interpersonal relationship on customersatisfaction and loyalty to the service provider. International Journal of ServiceIndustry Management 15, 365–384.
Gummerus, J., Pihlstrom, M., 2011. Context and mobile services’ value-in-use.Journal of Retailing and Consumer Services 18, 521–533.
Gustafsson, A., Johnson, M., Roos, I., 2005. The effects of customer satisfaction,relationship commitment dimensions, and triggers on customer retention.Journal of Marketing 69, 210–218.
Hess, R., Ganesan, S., Klein, N., 2003. Service failure and recovery: the impact ofrelationship factors on customer satisfaction. Journal of the Academy ofMarketing Science 31, 127–145.
Hocutt, M., Bowers, M., Donavan, D., 2006. The art of service recovery: fact orfiction? Journal of Services Marketing 20, 199–207.
Hoffman, D., Kelley, S., Rotalsky, H., 1995. Tracking service failures and employeerecovery efforts. Journal of Services Marketing 9, 49–61.
Hoffman, C., Nancy, H., 1990. Gender stereotypes: perception or rationalization?Journal of Personality and Social Psychology 58, 197–208.
Homburg, C., Giering, A., 2001. Personal characteristics as moderators of therelationships between customer satisfaction and royalty: an empirical analy-sis. Psychology and Marketing 18, 43–66.
Huang, W., 2008. The impact of other-customer failure on service satisfaction.International Journal of Service Industry Management 19, 521–536.
Hulland, J., 1999. Use of partial least squares (PLS) in strategic management research:a review of four recent studies. Strategic Management Journal 20 (2), 195–204.
Iacobucci, D., Duhachek, A., 2003. Mediation analysis. In: Round Table at ACRConference, Toronto.
Iacobucci, D., Ostrom, A., 1993. Gender differences in the impact of core andrelational aspects of services on the evaluations of service encounters. Journalof Consumer Psychology 20, 257–286.
Juste, M., 2010. La guerra de la telefonıa movil: Orange y Yoigo, las companıas quecaptan mas clientes. Expansion, 3rd february.
Kau, A.K., Loh, E., 2006. The effects of service recovery on consumer satisfaction: acomparison between complainants and non-complainants. Journal of ServicesMarketing 20, 101–111.
Keil, M., Tan, B.C., Wei, K.-K., Saarinen, T., Tuunainen, V., Wassenaar, A., 2000.A cross-cultural study on escalation of commitment behavior in softwareprojects. MIS Quarterly 24 (2), 299–325.
Kim, M., Park, M., Jeong, D., 2004. The effects of customer satisfaction andswitching barriers on customer loyalty in Korean mobile telecommunicationsservices. Telecommunications Policy 28, 145–156.
Lin, W., 2010. Service recovery expectation model—from the perspectives ofconsumers. The Service Industries Journal 30, 873–889.
Lohmoller, J., 1989. Latent variables path modelling with Partial Least Squares.Pysica-Verlag, Heideberg.
Magnini, V., Ford, J., Markowski, E., Honeycutt, E., 2007. The service recoveryparadox: justifiable theory of smouldering myth? Journal of Services Market-ing 21, 213–225.
Maicas, J., Polo, Y., Sese, J., 2009. The role of personal network effects andswitching costs in determining mobile users’ choice. Journal of InformationTechnology 24, 160–171.
Maicas, J., Sese, J., 2008. Analisis de la intensidad de los costes de cambio en laindustria de la telefonıa movil. Cuadernos de Economıa y Direccion deEmpresa 35, 27–56.
Mattila, A., 2010. Do women like options more than men? An examination in thecontext of service recovery. Journal of Services Marketing 24, 499–508.
Mattila, A., 2006. The power of explanations in mitigating the ill-effects of servicefailures. Journal of Services Marketing 20, 422–428.
Mattila, A., 1999. An examination of factors affecting service recovery in arestaurant setting. Journal of Hospitality and Tourism Research 23, 284–298.
Maxham, J., 2001. Service recovery’s influence on consumer satisfaction, positiveword-of-mouth, and purchase intentions. Journal of Business Research 54, 11–24.
Maxham, J., Netemeyer, R., 2002. Modeling customer perceptions of complainthandling over time: the effect of perceived justice on satisfaction and intent.Journal of Retailing 78, 239–252.
Mazaheri, E., Basil, D., Yanamandram, V., Daroczi, Z., 2011. The impact of pre-existing attitude and conflict management style on customer satisfaction withservice recovery. Journal of Retailing and Consumer Services 18, 235–245.
McCollough, M., 1995. The Recovery Paradox: A Conceptual Model and EmpiricalInvestigation of Customer Satisfaction and Service Quality Attitudes afterService Failure and Recovery. Doctoral Dissertation, Texas A&M University,College Station, United States.
McCollough, M., Leonard, L., Manjit, S., 1990. An empirical investigation ofcustomer satisfaction after service failure and recovery. Journal of ServiceResearch 3, 121–137.
Michel, S., Meuter, M., 2008. The service recovery paradox: true but overrated?International Journal of Service Industry Management 19, 441–457.
Mittal, V., Kamakura, W., 2001. Satisfaction, repurchase intent and repurchasebehaviour: investigating the moderating effect of customer characteristics.Journal of Marketing Research 38, 131–142.
Mohr, L., Bitner, M., 1995. The role of employee effort in satisfaction with servicetransactions. Journal of Business Research 32, 239–252.
Morrison, O., Huppertz, J., 2010. External equity, loyalty program membership, andservice recovery. Journal of Services Marketing 24, 244–254.
Nunnally, J., 1978. Psychometric Theory, second ed. McGraw-Hill, New York.Oliver, R., 1999. Whence consumer loyalty? Journal of Marketing 63, 33–44.Pai-Lin, N., Chiu, H., Hsieh, T., 2001. Investigating the relationship between service
providers’ personality and customers’ perceptions of service quality acrossgender. Total Quality Management 12, 57–67.
Premazzi, K., Castaldo, S., Grosso, M., Hofacker, C., 2010. Supporting retailers toexploit online settings for internationalization: the different role of trust andcompensation. Journal of Retailing and Consumer Services 17, 229–240.
J. Cambra-Fierro et al. / Journal of Retailing and Consumer Services 20 (2013) 408–418418
Pulkkinen, L., 1996. Female and male personality styles: a typological and develop-mental analysis. Journal of Personality and Social Psychology 70, 1288–1306.
Rivero, L., Manera, J., 2005. El comportamiento del usuario de servicios de tele-comunicaciones. Universidad Rey Juan Carlos, Ed. Dykin Son, SI Melendez Valdez.
Salavou, H., 2010. Strategy types of service firms: evidence from Greece. Manage-ment Decision 48, 1033–1047.
Santala, M., Parvinen, P., 2007. From strategic fit to customer fit. ManagementDecision 45, 582–602.
Schoefer, K., Ennew, Ch., 2005. The impact of perceived justice on consumers’emotional responses to service complaint experiences. Journal of ServicesMarketing 19, 261–270.
Shahin, A., Chan, F., 2006. Customer requirements segmentation (CRS): a pre-requisite technique for quality function deployment. Total Quality Manage-ment 17, 567–587.
Shankar, V., Smith, A., Rangaswany, A., 2003. Customer satisfaction and loyalty inonline and offline environments. International Journal of Research in Market-ing 20, 153–175.
Smith, A., Bolton, R., 1998. An experimental investigation of service failure andrecovery: paradox or peril? Journal of Service Research 1, 65–80.
Smith, A., Bolton, R., Wagner, J., 1999. A model of customer satisfaction withservice encounters involving failure and recovery. Journal of MarketingResearch 36, 356–372.
Sobel, M., 1982. Asymptotic confidence intervals for indirect effects on structuralequation models. In: Leinhardt, S. (Ed.), Sociological Metlzodology. Jossy-Bass,pp. 290–312.
Spreng, R., Harrell, G., Mackoy, R., 1995. Service recovery: impact on satisfactionand intentions. Journal of Services Marketing 9, 15–23.
Swanson, S., Kelley, S., 2001. Service recovery attributions and worth-of-mouthintentions. European Journal of Marketing 35, 194–211.
Tax, S., Brown, S., Chandrashekaran, M., 1998. Customer evaluations of servicecomplaint experiences: implications for relationship marketing. Journal ofMarketing 62, 60–76.
Tippins, M., Sohi, R., 2003. IT competency and firm performance: is organizationallearning a missing link? Strategic Management Journal 24, 745–761.
Tsai, C., Su, C., 2009. Service failures and recovery strategies of chain restaurants inTaiwan. The Service Industries Journal 29, 1779–1796.
Varela, C., Vazquez, R., Iglesias, V., 2008. The influence of emotions on customers’cognitive evaluations and satisfaction in a service failure and recovery context.The Service Industries Journal 28, 497–512.
Varela, C., Vazquez, R., Iglesias, V., 2009. Comportamiento de abandono de larelacion de un cliente con la empresa en un contexto de fallo y recuperaciondel servicio. Cuadernos de Economıa y Direccion de Empresa 40, 143–170.
Verhoef, P., 2003. Understanding the effect of customer relationship managementefforts on customers retention and customer share development. Journal ofMarketing 67, 30–45.
Watson, S., 2012. Customer responses to service situations: test for main andinteraction effects. Journal of Retailing and Consumer Services 19, 287–296.
Werts, C.E., Linn, R.L., Joreskog, K.G., 1974. Interclass reliability estimates: testingstructural assumptions. Educational and Psychological Measurement 34,25–33.
Weun, S., Beatty, S., Jones, M., 2004. The impact of service failure severity onservice recovery evaluations and post-recovery relationships. Journal ofServices Marketing 18, 133–146.
White, K., Dahl, D., 2006. To be or not to be? The influence of dissociative referencegroups on consumers’ preferences. Journal of Consumer Psychology 16,404–414.
Wirtz, J., Mattila, A., 2004. Consumer responses to compensation, speed ofrecovery and apology after service failure. International Journal of ServiceIndustry Management 15, 150–166.
Yelkur, R., Chakrabarty, S., 2006. Gender differences in service quality expectationsin the fast food industry. Services Marketing Quarterly 27, 141–151.
Zeithaml, V., Berry, L., Parasuranam, A., 1996. The behavioural model of servicefailure and recovery strategies. Journal of Marketing 60, 31–46.