Embed Size (px)
Citation preview

Analysis of the Utilities' June 16, 2017, Natural
Gas Leak and Emission Reports
SB 1371 (Leno) Natural Gas: Leakage Abatement
R.15-01-008/D.17-06-015
Ed Charkowicz, CPA, CPUC
Fred Hanes, P.E., CPUC
Andrew Mrowka, P.E., ARB
Mihail Cucu, P.E., ARB
January 5, 2018

ANALYSIS OF THE UTILITIES' JUNE 16, 2017, NATURAL GAS LEAK AND EMISSION REPORTS
2
Table of Contents
Executive Summary ................................................................................................................4
Key Findings: ......................................................................................................................................... 5
Conclusion: ............................................................................................................................................ 9
Introduction and Background .............................................................................................10
Purpose of the Gas Leak Abatement Report: ..................................................................................... 11
Basis for the Annual Gas Leak Abatement Report: ............................................................................. 12
Findings and Discussion .....................................................................................................13
Leaks and Emissions: ........................................................................................................................... 13
System Wide Leak Rate ....................................................................................................................... 14
2016 Categorization Adjustments ...................................................................................................... 15
Aliso Canyon Storage Facility: ............................................................................................................. 15
Key Findings: ....................................................................................................................................... 16
Detailed Discussion for Each of the Seven Systems Categories ......................................................... 23
Responses to Data Request Questions #1 and #7 ............................................................37
Lessons Learned ....................................................................................................................45
Conclusions ............................................................................................................................49
Appendix A: Methods for Estimating Emissions ................................................................................. 51
Appendix B: Definitions ...................................................................................................................... 57
Appendix C: Article 3, Section 975 (c) and (e)(6) ............................................................................... 59
Appendix D: Conversion of Natural Gas to Carbon Dioxide Equivalents ............................................ 60
Appendix E: Proposed Changes to Data Request Template ............................................................... 62
Appendix F: Methodology Change - Impact on PG&E’s 2015 Transmission Blowdown Baseline ...... 64

ANALYSIS OF THE UTILITIES' JUNE 16, 2017, NATURAL GAS LEAK AND EMISSION REPORTS
3
Table of Tables
Table 1: SB 1371 Sector Emissions - 2015 & 2016 .................................................................................. 6
Table 2: Systems Categories (Emissions for 2015 & 2016) .................................................................. 6
Table 3: Emissions Grouped by Source Classification (2015 Compared to 2016) ...................... 7
Table 4: Calculated Emissions Volume by Leak Grade (2016) ............................................................ 8
Table 5: System Wide Emissions – Throughput Categories (2015 & 2016) ............................... 14
Table 6: Emissions by Utility and Independent Storage Provider (2015 & 2016) ................... 16
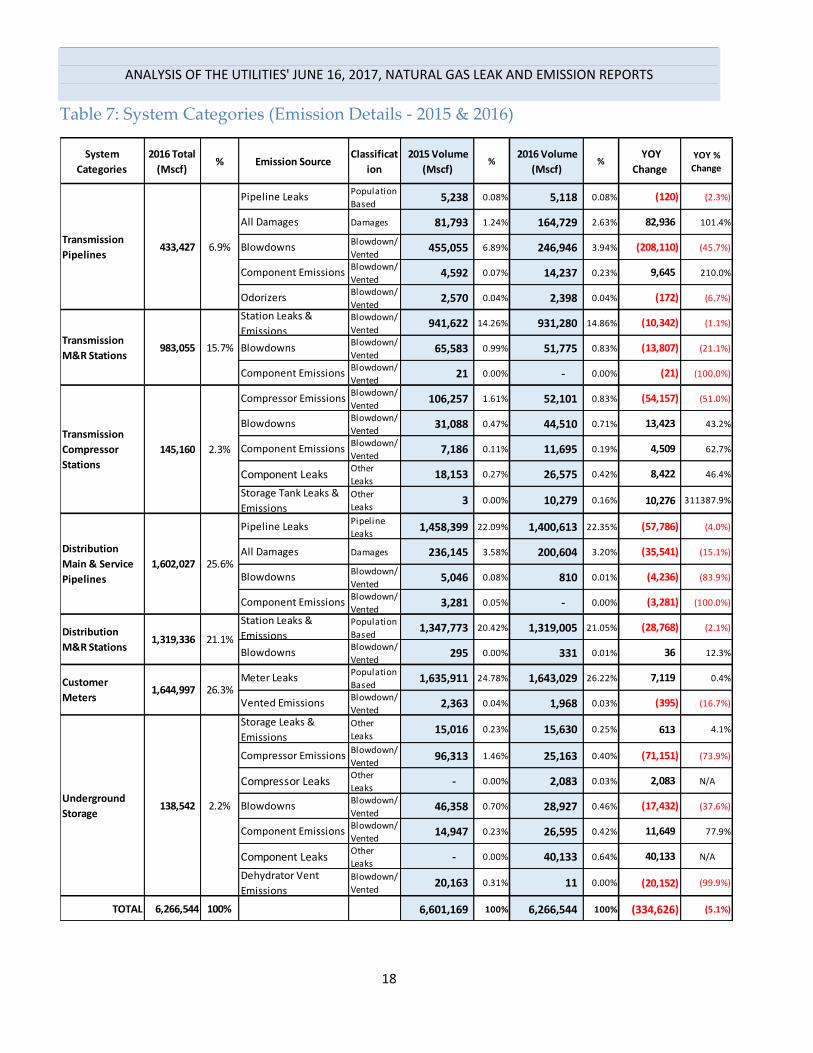
Table 7: System Categories (Emission Details - 2015 & 2016) ........................................................ 18
Table 8: Blowdown and Vented Emissions (2015 & 2016) ............................................................... 21
Table 9: Transmission Pipeline (Emissions - 2015 & 2016) ............................................................. 23
Table 10: Transmission M&R Station (Emissions - 2015 & 2016) ................................................. 24
Table 11: Transmission Compressor Station (Emissions - 2015 & 2016) ................................... 25
Table 12: Distribution Mains and Services (DM&S) (Emissions - 2015 & 2016) ...................... 26
Table 13: Calculated Emissions Volume by Leak Grade (2016) ..................................................... 27
Table 14: Emissions from Open Leaks (Comparison of 2015 & 2016) ......................................... 28
Table 15: Leaks Discovered (2015 Compared to 2016) ..................................................................... 28
Table 16: 2016 - Average Days to Repair by Entity (Graded Leaks) .............................................. 29
Table 17: Leak Count by Grade and by Entity (2016) ......................................................................... 30
Table 18: Distribution M&R Stations (Emissions - 2015 & 2016) .................................................. 32
Table 19: Customer Meter (Emissions - 2015 & 2016) ....................................................................... 32
Table 20: Underground Storage (Emissions - 2015 & 2016) ........................................................... 33
Table of Figures
Figure 1: 2016 Emissions by Reporting Entity ...................................................................................... 17
Figure 2: Emissions Grouped by Source Classification - 2016 ........................................................ 19
Figure 3: Population Based Emissions 2016 .......................................................................................... 20
Figure 4: Distribution Pipeline Emissions by Grade 2015 & 2016 ................................................ 29

ANALYSIS OF THE UTILITIES' JUNE 16, 2017, NATURAL GAS LEAK AND EMISSION REPORTS
4
Executive Summary This is the third annual report (2016 Joint Report) produced in compliance with
SB 1371 (Leno – 2014) on natural gas emissions, as being implemented in Rulemaking
(R.) 15-01-008 by the California Public Utilities Commission (CPUC).
Staff from the California Air Resources Board (CARB) and the CPUC jointly prepared
this annual report, which analyzes and accounts for natural gas emissions from leaks and
vented emissions in the natural gas system in California.1 This report provides the total
estimated emissions of methane – a potent greenhouse gas – from California’s utility
transmission, distribution and storage systems and discusses emissions by system categories,
source categories and leak grades.2
On March 31st of each year CPUC Staff issues a data request to gas utilities and
independent storage providers (ISPs) in California (Respondents) including reporting templates
and associated guidelines. Respondents filed their 2016 data and information with the
CPUC on June 16, 2017.
In some cases, additional data requests were necessary to resolve inconsistencies,
clarify information to ensure consistency and integrity of the 2016 Joint Report. The report
filings and any other relevant data obtained were used to prepare the 2016 Joint Report.3
Staff made minor adjustments to categorization of 2015 and 2016 data to match up year-over-
year (YOY) information that resulted from changes made to 2016 reporting templates.
The 2016 Joint Report looks different than prior Joint Reports in that it:
Incorporates year-over-year (YOY) comparisons to the 2015 baseline emissions,
Shows aggregated emissions data and emissions information for selected entities,
Shows emissions grouped by source type and estimation method, and
Shows new information based on the changes to this year’s reporting templates.
This information should be used by gas system operators to help determine where
emission reductions can be achieved to meet the State’s goal of reducing methane emissions
by 40% by2030,4 while maintaining the safe and reliable operation of the regulated gas
storage and delivery systems.
1 Unless specified as a fugitive leak or vented emission, for the purposes of this report “emissions” include both fugitive leaks, and
vented emissions of natural gas. 2 “System Category” refers to the grouping of assets by function within the natural gas delivery system. “Source Category” refers to
grouping emissions based on like source, e.g. pipelines emissions, or M&R station emissions. See page 9 of this report for definition of leak grades. 3 R. 15-01-008, Order Instituting Rulemaking to Adopt Rules and Procedures Governing Commission-Regulated Natural Gas Pipelines
and Facilities to Reduce Natural Gas Leakage Consistent with Senate Bill 1371 4 This goal was established by (SB 1383, Lara 2016).
ANALYSIS OF THE UTILITIES' JUNE 16, 2017, NATURAL GAS LEAK AND EMISSION REPORTS
5
As Respondents gain greater insight and understanding of their emissions profiles
and sources, they are providing more detailed and accurate data submissions. Some of these
insights impacted categorization and accounting of 2016 emissions, and helped identify the
potential need to change accounting of 2015 baseline emissions. In cases where the 2016
accounting varied from 2015 accounting Staff explained the changes in reporting the YOY
impact.
Staff will track the impact of accounting changes until the Commission decides
whether to authorize retroactive changes to the 2015 baseline balances. The potential changes
identified in 2016 are relatively small compared to the total and would have a negligible
impact on most reduction efforts.
A larger change being considered is updating the 1996 USEPA/Gas Research Institute
(GRI) emission factors (EFs) used for the 2015 & 2016 Joint Reports. The USEPA/GRI EFs are
over 20 years old and are not California specific. Recent studies suggest that emissions could
be significantly lower for distribution mains and services and metering and regulating
stations.
CARB is currently evaluating Distribution Mains and Services EFs with the Gas
Technology Institute (GTI) and utilities. Discrepancies between pipeline types (e.g. plastic,
protected steel) initially reported and the pipeline type reported upon repair means
additional analysis is necessary to determine appropriate emission factors. The utilities are
working with CARB, but the collection and evaluation of data is ongoing, and more time is
required to fully evaluate the survey results and determine the correct EFs.
Key Findings:
Based on respondents 2016 reported data, the total emissions estimate for this sector is
6,267 million standard cubic feet (MMscf) for the 2016 reporting year.5 This total is 5% lower
than the emissions volume reported in 2015.6 This equates to 2.81 million metric tonnes of
carbon dioxide (MMTCO2e) using the Intergovernmental Panel on Climate Change (IPCC)
100- year methane Global Warming Potential (GWP) value of 25 (Fourth Assessment Report
(AR4)). Using the 20-year methane GWP value of 72, the 2016 emission estimate equates to
8.08 MMTCO2e.
5 Note: This intentionally excludes the methane released from the 2015 Aliso Canyon storage failure because the extraordinary failure
of the Aliso Canyon storage facility investigation and resultant regulations were handled outside this proceeding. The emissions from Aliso Canyon have been reviewed by CARB and the results are discussed in the Findings and Discussion section of this report. 6 This reduction coincided with a similar reduction to natural gas system delivered to in-state customers during the year, (see Table 5).
However, because of the multiple changes to emissions from various components of the system (see Table 2), it cannot be said with any certainty that this was a “cause and effect” correlation.

ANALYSIS OF THE UTILITIES' JUNE 16, 2017, NATURAL GAS LEAK AND EMISSION REPORTS
6
Table 1: SB 1371 Sector Emissions - 2015 & 2016
This report also analyses emissions by two categories: Emissions by Systems (Table 2)
and Emissions by Source Classification (Table 3).
Table 2: Systems Categories (Emissions for 2015 & 2016)
As shown in Table 3, the Distribution Mains and Services graded leak emissions make
up 22% of total 2016 reported emissions, consistent with 2015 emissions. The majority of the
remaining 78% of emissions come from population based leaks (62%),7 blowdown/vented
emissions (8%),8 pipeline damages (6%), and other leaks (2%).9
7 Population based emissions are merely the population units multiplied by the appropriate EF, and not based on actual measurements
of leaks and emissions. These emissions can only change if the population or EF changes. 8 Vented emissions include operational blowdowns, automatic pressure relief valves, and other venting done for safety or operational
reasons. 9 Other Leaks include fugitive leaks from compressors, compressor components, storage systems, and storage components.
2015 2016YOY
Change
YOY %
Change
6,601 6,267 (334) (5.1%)
2.96 2.81 (0.15) (5.1%)
8.51 8.08 (0.43) (5.1%)
SB 1371 Sector Emissions - 2015 & 2016
Million Standard Cubic Feet (MMscf)
100-Year Global Warming Potential (GWP) MMTCO2e
20-Year Global Warming Potential (GWP) MMTCO2e
System Categories2015
(MMscf)
2015 % of
Total
2016 (MMscf)
2016 % of
Total
YOY
Difference
(MMscf)
YOY %
Change Inc/(Decr)
Transmission Pipeline 549 8% 433 7% (116) (21.1%)
Transmission M&R Station 1,007 15% 983 16% (24) (2.4%)
Compressor Station 163 2% 145 2% (18) (10.8%)
Distribution Mains & Services 1,703 26% 1,602 26% (101) (5.9%)
Distribution M&R Stations 1,348 20% 1,319 21% (29) (2.1%)
Customer Meter 1,638 25% 1,645 26% 7 0.4%
Underground Storage 193 3% 139 2% (54) (28.1%)
Total 6,601 100% 6,267 100% (335) (5.1%)

ANALYSIS OF THE UTILITIES' JUNE 16, 2017, NATURAL GAS LEAK AND EMISSION REPORTS
7
Table 3: Emissions Grouped by Source Classification (2015 Compared to 2016)
The population based emissions fall into the following categories (Figure 3):
Metering and Regulation (M&R) stations (both transmission and distribution) 36%
of the total 2016 emissions,
Customer Meters 26%, and
Transmission Pipeline 0.1%,
The M&R Stations and Customer Meters emissions are based on the installed
population of units (i.e. the customer meter set assembly (MSA) is a population unit)
multiplied by an EF. As expected, the population based leak estimates did not change
appreciably, with only a 1% decrease in total reported emissions. Actual emissions from
these systems will not change unless the number of units in the population decreases, or the
EF values change.
Virtually all of the YOY decrease occurred in the Blowdown and Vented emissions
category with a decrease of 354 MMscf, from 2015 reported levels, which corresponds to 41%
decrease from 2015 to 2016 for that category alone (Table 3). PG&E and SoCalGas had the
largest decreases of 214 MMscf (47%) and 129 MMscf (35%) respectively.
PG&E attributes the decrease to bundling its maintenance projects so that one
blowdown serves several projects, and from a focused effort to decrease pressures prior to
blowdown.10 SoCalGas indicates that its efforts to re-route gas and decrease line pressures
before blowdowns played a big role in this decrease. SoCalGas reported a 42 MMscf
reduction due to pressure reductions before blowdowns while San Diego Gas & Electric
(SDG&E) reported 0.12 MMscf reduction for the same practice.
10
Based on the information provided the amount of the decrease that resulted from each of the activities cited as causal factors in the emissions reduction could not be determined.
2015
(MMscf)% of Total
2016
(MMscf)% of Total
YOY
Change
(MMscf)
YOY %
Change
3,931 60% 3,898 62% (32) (1%)
1,458 22% 1,401 22% (58) (4%)
861 13% 507.466 8% (354) (41%)
318 5% 365 6% 47 15%
33 1% 95 2% 62 185%
6,601 100% 6,267 100% (335) (5.1%)Total Sector Emissions
Population Based Emissions
Emissions Grouped by Source Classification
(2015 Compared to 2016)
Graded Pipeline Leaks
Blowdown and Vented Emissions
Damages
Other Leaks

ANALYSIS OF THE UTILITIES' JUNE 16, 2017, NATURAL GAS LEAK AND EMISSION REPORTS
8
Table 4: Calculated Emissions Volume by Leak Grade (2016)11
Graded leak emissions from distribution mains and services (DM&S), as detailed in
Table 4, remained roughly the same, with a 4% YOY decrease.12 However, the 2016 Grade 1
leak volumes comprise 3.5% of the total, Grade 2 about 5.3%, Grade 3 at 52%, and leaks
estimated to come from un-surveyed areas (not given a grade) at 39%.13
The 2016 Joint Report estimates leaks occurring on the un-surveyed portions of
Respondents’ service territory based on the known 2016 leak rate for the surveyed territory.
These estimated un-surveyed leaks amount to 549,682 Mscf or 39.2% of the graded leaks
category, and comprise 8.8% of the total 2016 sector emissions.
The emissions from pipeline damages make up 6% of total emissions and increased by
47 MMscf or 15% from 2015 levels (Table 3); these are considered one of the least controllable
categories of emissions due to the random nature of damages to pipelines. The trend should
be monitored because, while damages are expected to vary from year to year, a general
downward trend would indicate the efficacy of any mitigation. 14
Lastly, emissions from Other Leaks increased by 62 MMscf, almost entirely due to
including two new reporting categories in 2016 for Transmission and Storage components.
These leaks comprise about 2% of the 2016 total emissions (Table 3).
11
The table includes Above Ground (AG) leaks because they make up part of the leaks and to ensure there is no question about transparency of the data they were broken out as a separate line item. 12
Transmission pipeline leak volumes are included but only make up 0.4% of graded leaks and 0.08% of total emissions. 13
Grade 1 leaks are leaks that represent an existing or probable hazard to persons or property and require prompt action. Grade 2 leaks are leaks that are not hazardous at the time of detection but justify a scheduled repair based on potential for a future hazard. Grade 3 leaks are leaks that are not hazardous at the time of detection and can reasonably be expected to remain non-hazardous. 14
In 2016 the transmission pipeline damages increased by 83 MMscf from 2015, offset by a decrease of distribution pipeline damages of 36 MMscf resulting in a net increase of combined pipeline damages of 47 MMscf or 15.1%.
Calculated Emissions Volume by Leak
Grade
Carried Over
to 2016
(Mscf)
Discovered in
2016 (Mscf)
Estimated
Unsurveyed
(Mscf)
Total
(Mscf)% of Total
% of Total
Emissions:
(6,266,544 Mscf)
Grade 1 450 47,990 - 48,440 3.5% 0.8%
Grade 2 14,015 59,734 - 73,749 5.3% 1.2%
Grade 3 437,154 291,586 - 728,741 52.0% 11.6%
Unsurveyed - No grade - - 549,682 549,682 39.2% 8.8%
AG - Haz - - - - 0.0% 0.0%
AG - Non-Haz - 0.12 - 0.12 0.0% 0.0%
Total (Mscf) 451,619 399,311 549,682 1,400,613 100.0% 22%

ANALYSIS OF THE UTILITIES' JUNE 16, 2017, NATURAL GAS LEAK AND EMISSION REPORTS
9
Conclusion:
The major findings from the 2016 data are:
1. The total 2016 reduction of 5% from 2015 baseline emissions were primarily driven by
reduction in blowdown and venting emissions. There were small decreases in
pipeline leaks and compressor emissions, but those were offset by small increases in
emissions from damages and component leaks and emissions (Table 1).
2. Significant reductions in blowdown emissions took place in 2016 attributed to
implementation of Best Practices (BPs) for bundling work, concerted efforts to reduce
line pressure before blowdown, and cyclical changes in facilities maintenance. The
amounts of emission reduction associated with these different activities are difficult to
evaluate due to the Respondents’ failure to apply performance metrics and collect the
necessary empirical data.
3. The majority of reported emissions (62%) come from population based emission
estimates that rely on Emission Factors (EFs) rather than actual measurements, and
are expected to remain relatively constant over time (Table 3). Significant changes to
EFs may occur based on improved information and could ultimately affect baseline
emissions levels.
4. The second largest emissions category (22%) is DM&S graded leaks (Table 3). Grade 3
leaks make up 52% of graded leak volume, and 12% of the total overall emissions
volume (Table 4). Grade 3 leaks make up 96.5% of the leaks that go unrepaired for
extended periods, and virtually all the leaks carried over from prior years. For
example, eliminating the backlog of grade 3 leaks carried over to 2016 could decrease
the overall 2016 emissions inventory by 7%.15
5. Anticipated DM&S emissions from un-surveyed service territories make up 39.2% of
the 2016 graded leaks (Table 4). The estimated un-surveyed emissions make up about
9% of the total 2016 sector emissions. Increasing the frequency of leak surveys, as
ordered by the CPUC in D.17-06-015, should reduce graded pipeline emissions,
because leaks will be detected and repaired more quickly.
###
15
The 7% emissions reduction is based on the 2016 grade 3 leaks carried over from prior years of 437 MMscf which is 7% of the 2016 emissions. Grade 3 leaks are discovered every year and all else being equal, eliminating the carryover of grade 3 leaks from prior years would net 7% of 2016 reported emissions.

ANALYSIS OF THE UTILITIES' JUNE 16, 2017, NATURAL GAS LEAK AND EMISSION REPORTS
10
Introduction and Background In accordance with Senate Bill (SB) 1371 (Leno, Chapter 525, Statutes of 2014; Pub.
Util. Code §§ 975, 977, 978), the California Air Resources Board (ARB) and California Public
Utilities Commission (CPUC) prepared this annual report, which analyzes and accounts for
methane from leaks and vented emissions from natural gas transmission, distribution and
storage in California.16 On September 14, 2014, Governor Jerry Brown signed into law
SB 1371 that requires reporting and verification of emissions of greenhouse gases (GHG)
and also requires gas corporations to file a report summarizing utility leak management
practices, a list of new methane leaks by grade, a list of open leaks that are being monitored
or are scheduled to be repaired, and a best estimate of gas loss due to leaks.
In January 2015, the Commission opened an Order Instituting Rulemaking (R.) 15-01-
008 (OIR) to implement the provisions of SB 1371. SB 1371 requires the adoption of rules and
procedures to minimize natural gas leakage from Commission regulated natural gas pipeline
facilities consistent with Pub. Util. Code § 961(d), § 192.703(c) of Subpart M of Title 49 of the
Code of Federal Regulation, the Commission’s General Order (GO) 112-F, and the state’s
goal of reducing greenhouse gas (GHG) emissions.
On June 15, 2017, the Commission in D.17-06-015 (Gas Leak Decision) approved the
Natural Gas Leak Abatement Program consistent with SB 1371. This decision established
Best Practices (BPs) and reporting requirements for the CPUC Natural Gas Leak Abatement
Program developed in consultation with CARB.17 The decision implements the following to
support the goal to reduce methane emissions by 40% by 2030:
1. Annual reporting for tracking methane emissions;
2. Twenty-six mandatory BPs for minimizing methane emissions pertaining to
policies and procedures, recordkeeping, training, experienced trained
personnel, leak detection, leak repair, and leak prevention;
3. Biennial compliance plan incorporated into the respondents’ annual Gas
Safety Plans, beginning in March 2018; and
16
Unless specified as a fugitive leak or vented emission, for the purposes of this report “emissions” include both fugitive leaks, and vented emissions of natural gas. 17
Leno, Chapter 525, Statutes of 2014; Pub. Util. Code §§ 975, 977, 978

ANALYSIS OF THE UTILITIES' JUNE 16, 2017, NATURAL GAS LEAK AND EMISSION REPORTS
11
4. Cost recovery process to facilitate Commission review and approval of
incremental expenditures to implement Best Practices (BPs), Pilot Programs
and Research & Development.
In the Gas Leak Decision, the Commission affirms that the 2015 baseline emissions
estimates will provide the starting point to measure future natural gas emissions
reductions.18 The rulemaking (R.15-01-008) remains open to address implementation issues
in a second phase.
In addition, SB 32, which sets a 40% greenhouse gas reduction target for 2030, was
passed and signed into law in 2016.19 This additional legislation directs CARB to develop
plans to reduce statewide methane emissions, which it did in the Short-Lived Climate
Pollutants strategy (SB 605 (Lara, Chapter 523, Statutes of 2014).
Methane is a very potent GHG, which has an impact many times greater than carbon
dioxide. According to the Intergovernmental Panel on Climate Change (IPCC) Fourth
Assessment Report (AR4), methane is 72 times more potent than CO2 over a 20-year time
frame. Although the more recent IPCC Fifth Assessment Report (AR5) estimates a global
warming potential (GWP) value 86 times higher than CO2 over a 20-year span, the AR4
values are used for consistency with prior Reports.
Purpose of the Gas Leak Abatement Report:
The report estimates emissions from the gas storage and delivery systems in aggregate
and by entity, by system categories, source classification and by grade. The information
should be used by the gas system operators to help determine where emission reductions
can be achieved while maintaining the safe and reliable operation of commission-regulated
gas pipelines and other facilities. The metrics used to compile this report provide operators,
the Commission, and the public with reasonably accurate information about the type,
number, and severity of emissions and the quantity of gas emitted to the atmosphere over
time.
This report provides a summary of the 2016 emissions inventory reports submitted by
the respondents on June 16, 2017.
This year’s Joint Report differs from prior reports in a few ways as follows:
Incorporates year-over-year (YOY) comparisons to the 2015 baseline emissions,
18
http://docs.cpuc.ca.gov/SearchRes.aspx?DocFormat=ALL&DocID=190740714, Finding of Fact #13, pg. 145. 19
California Global Warming Solutions Act of 2006: emissions limit. SB32, Pavley, Reg. Sess. 2015-2016. (2016).

ANALYSIS OF THE UTILITIES' JUNE 16, 2017, NATURAL GAS LEAK AND EMISSION REPORTS
12
Shows aggregated emissions data and emission information from selected entity,
Shows emissions grouped by source type and estimation method, and
Shows new information based on the changes to this year’s reporting templates.
The distribution mains and services (DM&S) pipeline leaks are categorized according
to their “grade”.
Grade 1 leaks are leaks that represent an existing or probable hazard to persons or
property and require prompt action.
Grade 2 leaks are leaks that are not hazardous at the time of detection but justify a
scheduled repair based on potential for a future hazard.
Grade 3 leaks are leaks that are not hazardous at the time of detection and can
reasonably be expected to remain non-hazardous.
Above ground DM&S leaks are not graded, but are designated in a similar manner
to denote what repair priority they should receive.20 They are classified as Above
Ground – Hazardous (AG-Haz), Above Ground - Non-Hazardous (AG-Non-Haz),
and Above Ground – Non-Hazardous – Minor.
Even though the system categories of emissions are the same as in 2015, a greater
effort was made to standardize the data submissions to improve consistency and integrity of
the data. To ensure consistency, the data request continued to require the use of 1996 GRI
emissions factors (EFs) for this year’s report. 21 The 2016 Joint Report covers emissions and
leaks for components within system categories. Additionally, the report includes general
discussions of changes to operational practices, new methods for leak and emission detection
and mitigation programs. Lastly, improvements to data capture (e.g. performing inventory
verification of assets), and methodology for estimating emissions (e.g. calculating emissions
for all blowdowns not just those above a specific threshold), may provide greater accuracy in
future reporting cycles.
Basis for the Annual Gas Leak Abatement Report:
On April 4, 2017, Staff issued a data request to CPUC jurisdictional utilities and
independent storage providers (ISPs) in California to collect the information required by
20
Above Ground leaks are not statutorily required to be graded and are subject to each utility own nomenclature. 21
See Appendix 9 of the Data Request for specific EFs recommended by each System Category. http://www.cpuc.ca.gov/General.aspx?id=8829

ANALYSIS OF THE UTILITIES' JUNE 16, 2017, NATURAL GAS LEAK AND EMISSION REPORTS
13
Article 3, Section 975 (c) and (e)(6), using templates jointly developed by CPUC and CARB.
(See Appendix C for detailed wording.)
The data was separated into the following seven systems categories (which included
subgroupings by type):
1. Transmission Pipelines (leaks, damages, blowdowns, components, and odorizers);
2. Transmission Metering and Regulation (M&R) stations (station leaks and
emissions, and blowdowns);
3. Compressor stations (compressor leaks and emissions, blowdowns, components
leak and emissions, and storage tanks);
4. Distribution Pipeline Mains and Services (leaks, damages, and blowdowns);
5. Distribution M&R stations (station leaks and emissions, and blowdowns);
6. Customer Meters (leaks, and venting); and
7. Underground Storage Facilities (leaks, compressors leaks and emissions,
blowdowns, and component leaks and emissions. Dehydrators are omitted in
2016).
The respondents provided contextual information and explanations for their data to
help understand the composition of the emissions, emission sources and related calculations
underlying the emission estimates. The respondents summarized the data and provided
their system-wide leak information. Appendix A explains methods used to estimate
emissions.
CARB and CPUC Staff jointly analyzed the data and requested supplementary
information for clarification. The “Lessons Learned” section of this report identifies insights
Staff acquired about potential improvements to the process and opportunities to enhance
future data requests.
Findings and Discussion
Leaks and Emissions:
Based on the utilities and ISPs reports, CARB and CPUC Staff estimate that the
natural gas sector statewide emissions were approximately 6,267 MMscf in 2016, which
equates to 2.81 MMTCO2e (AR4, 100-year methane life cycle) (see Table 1). This is a 5% YOY
decrease from 2015 reported emissions of 6,601 MMscf or 2.96 MMTCO2e.22
22
Total Natural Gas emissions reported to the CPUC/CARB for the 2016 annual report without Aliso Canyon come to 6,267 MMscf
which translates to 118,026 metric tonnes of methane. See Appendix D for calculations.

ANALYSIS OF THE UTILITIES' JUNE 16, 2017, NATURAL GAS LEAK AND EMISSION REPORTS
14
System Wide Leak Rate
The System-wide Leak Rate is an important metric that could show the correlation
with reductions in emissions or reductions in throughput. SB 1371 requires the
establishment and annual monitoring of a System-wide Leak Rate for the transmission and
distribution system.23
The 2015 Joint Report calculated a System-wide Leak Rate of 0.32% (emissions of
about 6,601 MMscf divided by throughput of 2,056,950 MMscf). The 2016 system wide leak
rate of 0.33% is consistent with that of 2015 (on emissions of about 6,267 MMscf divided by
1,877,179 MMscf of throughput) (Table 5.) There is a small YOY increase of 4% because the
overall emissions decreased 5.1% the throughput decreased 8.7%, which had an increasing
effect on the overall emissions rate. The emissions from storage facilities and compressor
stations may be directly impacted by changes in throughput, but not the population based
emissions.
The throughput decreases in 2016 is attributed to a warmer than average 2015-2016
winter resulting in less withdrawal by customers, and consequently less volume injected into
storage.
Table 5: System Wide Emissions – Throughput Categories (2015 & 2016)
23
Refer to Appendix C for PUC Code Section 975(e)(6), Article 3
System-Wide Emissions - Throughput Categories2015 Inventory
(MMscf)
2016
Inventory
(MMscf)
YOY %
Change
Total Emissions 6,601.2 6,266.5 (5.1%)
Total Storage Annual Volume of Injections to Storage 199,522 116,579 (41.6%)
Total Transmission Annual Volume of Gas Used by the Gas Department 7,717 6,107 (20.9%)
Total Transmission Volume of Annual Gas transported to or for Customers in state 1,832,676 1,736,336 (5.3%)
Total Transmission Volume of Annual Gas transported to or for Customers out of state 16,775 18,002 7.3%
Total Distribution Annual Volume of Gas Used by the Gas Department 261 156 (40.2%)
Total Throughput 2,056,950 1,877,179 (8.7%)
System-Wide Emissions Rate 0.32% 0.33% 4.0%
ANALYSIS OF THE UTILITIES' JUNE 16, 2017, NATURAL GAS LEAK AND EMISSION REPORTS
15
2016 Categorization Adjustments
This report reflects a few minor categorization adjustments to the data reported for
2016. All of these adjustments are discussed in more detail later in the Report:24
1. The 2016 reporting templates sought additional component emissions and leak data
for M&R
2. The 2016 reporting templates sought to change the way damages were categorized by
requiring respondents to separate their MSA damages from their DM&S damages.
3. In the 2015 Joint Report, Storage component leaks and emissions were reported
separately in the 2016 reporting templates; (in 2015 they were combined as one item)
4. Respondents provided new information on dehydrator assets and practices, and the
report includes actual emissions based on Respondents’ specific dehydrator
emissions.
Aliso Canyon Storage Facility:
Beginning in October 2015 and lasting through February 2016, operators of the Aliso
Canyon gas storage facility in Southern California reported an uncontrolled leak
preliminarily attributed to the failure of well pipe casing below ground level. Based on the
CARB analysis, the Aliso Canyon leak event contributed about 5% to California’s statewide
natural gas emissions in 2015.25 The CARB has estimated a total quantity of 99,650 metric
tonnes of methane emissions for the duration of the leak.26
This event raised the national awareness of the risks associated with natural gas
storage facilities. Consequently, this large leak resulted in new storage facility regulations.
The environmental risks from this single leak were substantial and the safety, operations and
maintenance regulations are still under examination.
The catastrophic nature of the Aliso Canyon emissions is included for context, but
they are largely outside the scope of this Report.
24
These changes had negligible impact on reported emissions. 25
The 78,895 MT of CH4 equated to 1.97 MM MT CO2e or 4.7% of estimated 2015 CH4 emissions assuming 2014 and 2015 CH4 overall emissions would be the same. Calculated emissions based on CARB report page 25 data. https://www.arb.ca.gov/research/aliso_canyon/aliso_canyon_methane_emissions-arb_final.pdf 26
Ibid, Pg.1.
ANALYSIS OF THE UTILITIES' JUNE 16, 2017, NATURAL GAS LEAK AND EMISSION REPORTS
16
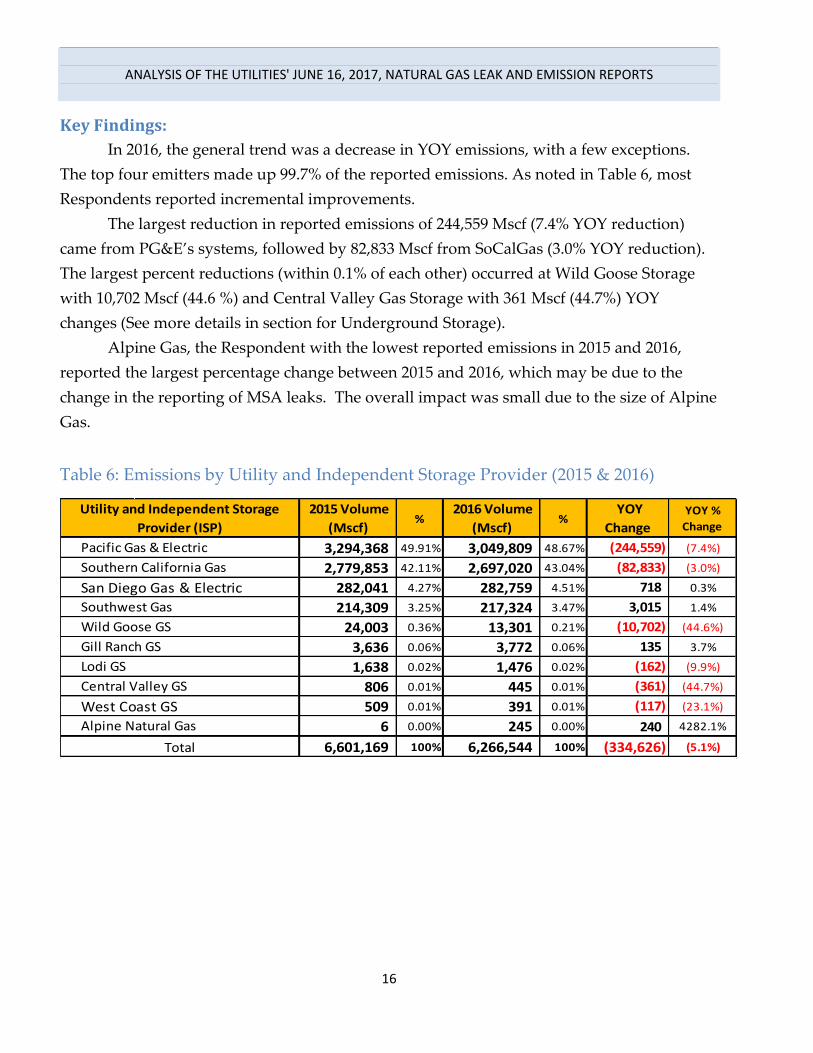
Key Findings:
In 2016, the general trend was a decrease in YOY emissions, with a few exceptions.
The top four emitters made up 99.7% of the reported emissions. As noted in Table 6, most
Respondents reported incremental improvements.
The largest reduction in reported emissions of 244,559 Mscf (7.4% YOY reduction)
came from PG&E’s systems, followed by 82,833 Mscf from SoCalGas (3.0% YOY reduction).
The largest percent reductions (within 0.1% of each other) occurred at Wild Goose Storage
with 10,702 Mscf (44.6 %) and Central Valley Gas Storage with 361 Mscf (44.7%) YOY
changes (See more details in section for Underground Storage).
Alpine Gas, the Respondent with the lowest reported emissions in 2015 and 2016,
reported the largest percentage change between 2015 and 2016, which may be due to the
change in the reporting of MSA leaks. The overall impact was small due to the size of Alpine
Gas.
Table 6: Emissions by Utility and Independent Storage Provider (2015 & 2016)
2015 Volume
(Mscf) %
2016 Volume
(Mscf) %
YOY
Change
YOY %
Change
3,294,368 49.91% 3,049,809 48.67% (244,559) (7.4%)
2,779,853 42.11% 2,697,020 43.04% (82,833) (3.0%)
282,041 4.27% 282,759 4.51% 718 0.3%
214,309 3.25% 217,324 3.47% 3,015 1.4%
24,003 0.36% 13,301 0.21% (10,702) (44.6%)
3,636 0.06% 3,772 0.06% 135 3.7%
1,638 0.02% 1,476 0.02% (162) (9.9%)
806 0.01% 445 0.01% (361) (44.7%)
509 0.01% 391 0.01% (117) (23.1%)
6 0.00% 245 0.00% 240 4282.1%
6,601,169 100% 6,266,544 100% (334,626) (5.1%)
Utility and Independent Storage
Provider (ISP)
Pacific Gas & Electric
Southern California Gas
San Diego Gas & ElectricSouthwest Gas
Wild Goose GS
Gill Ranch GS
Lodi GS
Central Valley GS
West Coast GS
Alpine Natural Gas
Total

ANALYSIS OF THE UTILITIES' JUNE 16, 2017, NATURAL GAS LEAK AND EMISSION REPORTS
17
Figure 1: 2016 Emissions by Reporting Entity
Table 7 shows the emissions by systems category and the sub-categories included in
the system category. The 2016 emissions are compared to 2015 baseline emissions with the
YOY changes.
Pacific Gas & Electric,
3,049,809
Southern California Gas,
2,697,020
San Diego Gas & Electric, 282,759
Southwest Gas , 217,324
Wild Goose GS, 13,301
Gill Ranch GS, 3,772
Lodi GS, 1,476
Central Valley GS, 445 West Coast GS,
391 Alpine Natural
Gas, 245
2016 Emissions by Reporting Entity (Mscf)
ANALYSIS OF THE UTILITIES' JUNE 16, 2017, NATURAL GAS LEAK AND EMISSION REPORTS
18
Table 7: System Categories (Emission Details - 2015 & 2016)
System
Categories
2016 Total
(Mscf)% Emission Source
Classificat
ion
2015 Volume
(Mscf) %
2016 Volume
(Mscf) %
YOY
Change
YOY %
Change
Pipeline LeaksPopulation
Based5,238 0.08% 5,118 0.08% (120) (2.3%)
All Damages Damages 81,793 1.24% 164,729 2.63% 82,936 101.4%
BlowdownsBlowdown/
Vented455,055 6.89% 246,946 3.94% (208,110) (45.7%)
Component EmissionsBlowdown/
Vented4,592 0.07% 14,237 0.23% 9,645 210.0%
OdorizersBlowdown/
Vented2,570 0.04% 2,398 0.04% (172) (6.7%)
Station Leaks &
Emissions
Blowdown/
Vented941,622 14.26% 931,280 14.86% (10,342) (1.1%)
BlowdownsBlowdown/
Vented65,583 0.99% 51,775 0.83% (13,807) (21.1%)
Component EmissionsBlowdown/
Vented21 0.00% - 0.00% (21) (100.0%)
Compressor EmissionsBlowdown/
Vented106,257 1.61% 52,101 0.83% (54,157) (51.0%)
BlowdownsBlowdown/
Vented31,088 0.47% 44,510 0.71% 13,423 43.2%
Component EmissionsBlowdown/
Vented7,186 0.11% 11,695 0.19% 4,509 62.7%
Component LeaksOther
Leaks18,153 0.27% 26,575 0.42% 8,422 46.4%
Storage Tank Leaks &
Emissions
Other
Leaks3 0.00% 10,279 0.16% 10,276 311387.9%
Pipeline LeaksPipeline
Leaks1,458,399 22.09% 1,400,613 22.35% (57,786) (4.0%)
All Damages Damages 236,145 3.58% 200,604 3.20% (35,541) (15.1%)
BlowdownsBlowdown/
Vented5,046 0.08% 810 0.01% (4,236) (83.9%)
Component EmissionsBlowdown/
Vented3,281 0.05% - 0.00% (3,281) (100.0%)
Station Leaks &
Emissions
Population
Based1,347,773 20.42% 1,319,005 21.05% (28,768) (2.1%)
BlowdownsBlowdown/
Vented295 0.00% 331 0.01% 36 12.3%
Meter LeaksPopulation
Based1,635,911 24.78% 1,643,029 26.22% 7,119 0.4%
Vented EmissionsBlowdown/
Vented2,363 0.04% 1,968 0.03% (395) (16.7%)
Storage Leaks &
Emissions
Other
Leaks15,016 0.23% 15,630 0.25% 613 4.1%
Compressor EmissionsBlowdown/
Vented96,313 1.46% 25,163 0.40% (71,151) (73.9%)
Compressor LeaksOther
Leaks- 0.00% 2,083 0.03% 2,083 N/A
BlowdownsBlowdown/
Vented46,358 0.70% 28,927 0.46% (17,432) (37.6%)
Component EmissionsBlowdown/
Vented14,947 0.23% 26,595 0.42% 11,649 77.9%
Component LeaksOther
Leaks- 0.00% 40,133 0.64% 40,133 N/A
Dehydrator Vent
Emissions
Blowdown/
Vented20,163 0.31% 11 0.00% (20,152) (99.9%)
TOTAL 6,266,544 100% 6,601,169 100% 6,266,544 100% (334,626) (5.1%)
Underground
Storage138,542 2.2%
Distribution
M&R Stations1,319,336 21.1%
Customer
Meters1,644,997 26.3%
Transmission
Compressor
Stations
145,160 2.3%
Distribution
Main & Service
Pipelines
1,602,027 25.6%
Transmission
Pipelines433,427 6.9%
Transmission
M&R Stations983,055 15.7%

ANALYSIS OF THE UTILITIES' JUNE 16, 2017, NATURAL GAS LEAK AND EMISSION REPORTS
19
Figure 2: Emissions Grouped by Source Classification - 2016
Population based leaks make up 62% of the total 2016 emission as shown in Figure 2.27
Similar to 2015, the leak emissions in 2016 Joint Report make up 22% of all reported graded
emissions. Though blowdown and vented emissions make up only 8% of total 2016
emissions this category accounted for the greatest amount of YOY reductions. 28 Pipeline
damages made up 6% of 2016 emissions and had a slight uptick from 2015 levels.29 Other
Leaks make up the remaining 2%. Most of the 62 MMscf increase in Other Leaks from 2015
to 2016 is due to the addition of new items captured in the reporting templates (Table 3).
27
The number in the population, of a given asset or component, multiplied by the appropriate EF to estimate the emissions for that system asset such as MSAs and M&R Stations. 28
Vented emissions include operational blowdowns, automatic pressure relief valves, assets that vent as a function of their design, and other venting done for safety or operational reasons. 29
In 2016 the transmission pipeline damages increased by 83 MMscf from 2015, offset by a decrease of distribution pipeline damages of 36 MMscf resulting in a net increase of combined pipeline damages of 47 MMscf or 15.1%.
Population Based Leaks (3,898
MMscf)62%
Graded Pipeline Leaks (1,401
MMscf)22%
Blowdown and Vented Emissions
(507 MMscf)8%
Damages (365 MMscf)
6%
Other Leaks (95 MMscf)
2%
Emissions Grouped by Source Classification - 2016 (6,267 MMscf)

ANALYSIS OF THE UTILITIES' JUNE 16, 2017, NATURAL GAS LEAK AND EMISSION REPORTS
20
Population Based Emissions:
The population based emissions are broken down in the following categories and
shown in Figure 3:
Metering and Regulation (M&R) stations (both transmission (24%) and
distribution (34%)) make up 58% of population emissions and comprise 36% of the
2016 total emissions,
Customer Meters leaks comprise 42% of population based emissions and 26% of
2016 total emissions, and
Ungraded Transmission Pipeline leaks just are less than 0.1% of the population
and total emissions.
Figure 3: Population Based Emissions 2016
The M&R Station and Customer Meter emissions are based on the population of units
multiplied by an EF. Transmission pipeline leaks are based on an EF per mile of installed
transmission pipeline.
Customer Meter Sets (1,643
MMscf)42%
Distribution M&R Stations (1,319 MMscf)
34%
Transmission M&R Stations (931 MMscf)
24%
Transmission Pipeline Miles
(5 MMscf)0%
Population Based Emissions 2016(Total of 3,898 MMscf)

ANALYSIS OF THE UTILITIES' JUNE 16, 2017, NATURAL GAS LEAK AND EMISSION REPORTS
21
As expected the population based leak estimates did not change appreciably with a
1% decrease in total reported emissions. Unless items are re-categorized, or the number of
units or the EF changes, the amount of emissions will remain constant YOY. The small
difference between 2015 and 2016 is due to updated records of the number of M&R Stations
and an increase in the number of customer meters.
Blowdown and Vented Emissions:
The largest YOY decrease in emissions occurred in the Vented/Blowdown emissions,
with a decrease of 353,652 Mscf (41%) from 2015 reported levels. PG&E and SoCalGas had
the largest decreases of 214,435 Mscf (47%) and 128,758 Mscf (35%) respectively. PG&E
reports that bundling maintenance projects coupled with decreasing line pressures prior to
blowdown had the largest impact. SoCalGas also attributes its decrease to isolating and
decreasing line pressures as well as the cyclical nature of maintenance activities.
Table 8: Blowdown and Vented Emissions (2015 & 2016)
Blowdown and Vented Emissions 2015(Mscf)
2016(Mscf)
YOY Change(Mscf)
YOY %
Change
Transmission Assets - Blowdown:Pipeline 455,055 246,946 (208,110) (45.7%)
M&R Stations 65,582 51,775 (13,807) (21.1%)
Compressor Blowdowns 31,088 44,510 13,423 43.2%
Total Transmission Assets - Blowdown: 551,726 343,232 (208,494) (38%)
Transmission Assets - Venting:Pipeline Components - Venting 7,162 16,635 9,473 132.3%
Compressor Emissions 106,257 52,101 (54,156) (51.0%)
Compressor Component Emissions 7,207 11,695 4,488 62.3%
Total Transmission Assets - Venting: 120,626 80,430 (40,196) (33%)
Distribution Asset - Blowdowns:Pipeline 5,046 810 (4,236) (83.9%)
M&R Stations 295 331 36 12.3%
Total Distribution Asset - Blowdowns: 5,340 1,141 (4,199) (79%)
Distribution Asset - Venting:Component Emissions 3,281 0 (3,281) (100.0%)
Customer Meter Venting 2,363 1,968 (395) (16.7%)
Total Distribution Asset - Venting: 5,645 1,968 (3,676) (65%)
Storage Asset Venting:Compressors 96,313 25,163 (71,151) (73.9%)
Storage Components/Dehydrators 81,467 55,532 (25,935) (31.8%)
Total Storage Asset Venting: 177,781 80,695 (97,086) (55%)
Total Blowdown and Venting Emissions 861,117 507,466 (353,652) (41%)
ANALYSIS OF THE UTILITIES' JUNE 16, 2017, NATURAL GAS LEAK AND EMISSION REPORTS
22
Graded Pipeline Leaks Distribution Mains and Services (DM&S) Graded Leaks:
DM&S graded leaks decreased slightly by 57,787 Mscf to 1,400,612 Mscf in 2016, or 4%
YOY.30 As shown in Table 4, the 2016 grade 1 leak volumes comprise 3.5% of the total sector
emissions; grade 2 is 5.3%, and grade 3 make up the remaining 52%.31 See detailed
discussion of DM&S systems leaks and emissions below.
The 2016 Joint Report includes utilities’ estimated proportion of leaks occurring
between surveys in all of their service territory based on the actual 2016 leak rate for the
portion of territory surveyed. Also shown in Table 4, 39.2% (549,682 Mscf) of the pipeline
leaks are estimated to come from the un-surveyed areas (referred to as “un-surveyed leaks”),
and comprise about 8.8% of the total 2016 emissions.
Damages:
The emissions from damages increased 47 MMscf or 15% from 318 MMscf in 2015.This
is one of the least controllable categories of emissions due to the random nature of damage to
pipeline assets (Table 3). Damages are expected to vary from year to year, but over time the
trend should generally be downward if mitigation efforts are effective.
Other Leaks:
Lastly, emissions from Other Leaks increased in large part due to inclusion of two
new reporting categories in 2016 for Transmission and Storage components. These leaks
made up virtually all of the 62 MMscf change and comprise about 2% of the total emissions
reported in 2016 (Table 3). The increased emissions had a negligible impact on total
emissions.
30
In 2015 the transmission pipeline leak volumes are included but only make up 0.4% of graded leaks and 0.08% of total emissions. 31
Grade 1 leaks are leaks that represent an existing or probable hazard to persons or property and require prompt action. Grade 2 leaks are leaks that are not hazardous at the time of detection but justify a scheduled repair based on potential for a future hazard. Grade 3 leaks are leaks that are not hazardous at the time of detection and can reasonably be expected to remain non-hazardous.

ANALYSIS OF THE UTILITIES' JUNE 16, 2017, NATURAL GAS LEAK AND EMISSION REPORTS
23
Detailed Discussion for Each of the Seven Systems Categories
Transmission Pipeline:
Four utilities reported transmission pipeline emissions of 433,427 Mscf, which is a
decrease of 21.1% from last year’s report of 549,248 Mscf.
Table 9: Transmission Pipeline (Emissions - 2015 & 2016)
Findings (Table 9):
The emissions in the transmission pipeline leaks category did not change
significantly from 5,238 Mscf in 2015 to 5,118 Mscf in 2016, which is based on the
miles of transmission pipeline multiplied by an EF.
Damages from third parties showed an increase in emissions from 81,793 Mscf in
2015 to 164,729 Mscf in 2016 due to an increased number of events and longer
durations to repair transmission pipelines.
Blowdown emissions decreased 208,110 Mscf from 455,055 Mscf in 2015 to 246,949
Mscf in 2016. Respondents reported that project bundling resulting in fewer
events, the natural ebb and flow of maintenance procedures, lowering line
pressures prior to blowdown, and more accurate measurements are factors
contributing to the decrease. For all respondents, the number of blowdown events
decreased by 887 (68%) from 1,311 to 424. More work needs to be done to show
how each of the various changes to operating practices actually impact emissions.
o A third of the emission reduction resulted from a change in the calculation
method used by PG&E. In 2016 PG&E changed its methodology and calculated
the discrete amount gas released from all smaller blowdown events. In 2015,
for smaller blowdown events PG&E used the median figure of 125 Mscf
(between 0 and 250 Mscf) for those transmission pipeline clearances that were
estimated to produce an emission less than 250 Mscf. In 2016 PG&E no longer
Emission Source Categories2015 (Mscf)
2015
% of Total2016 (Mscf)
2016
% of Total
YOY Change
(Mscf)
YOY %
Change Inc/(Decr)
Pipeline Leaks 5,238 1.0% 5,118 1.2% (120) (2.3%)
All Damages 81,793 14.9% 164,729 38.0% 82,936 101.4%
Blowdowns 455,055 82.9% 246,946 57.0% (208,110) (45.7%)
Component Emissions 4,592 0.8% 14,237 3.3% 9,645 210.0%
Oderizers 2,570 0.5% 2,398 0.6% (172) (6.7%)
Transmission Pipeline Total 549,248 100% 433,427 100% (115,821) (21.1%)
ANALYSIS OF THE UTILITIES' JUNE 16, 2017, NATURAL GAS LEAK AND EMISSION REPORTS
24
estimated its clearances below 250 Mscf, but instead used an engineering
calculation to more accurately estimate all pipeline clearances. Using this
method, the mean average of the clearance volumes below 250 Mscf is 47 Mscf,
which is considerably less than the 125 Mscf value assumed in 2015. If the
mean average was retrospectively applied to the 2015 data, the 2015 blowdown
volume would be 67,444, Mscf lower. See Appendix F for calculation details.
Component emissions increased from 4,592 Mscf to 14,237 Mscf, largely due to re-
categorization of assets that were included in other categories or omitted from
2015.
Transmission M&R Stations:
Four utilities reported total transmission M&R station emissions of 983,055 Mscf for
2016, which was a 2.4% decrease from 1,007,226 Mscf for 2015.
Table 10: Transmission M&R Station (Emissions - 2015 & 2016)
There is a decrease of 13,807 Mscf (21.1%) for M&R station blowdowns in 2016. PG&E
made up virtually all the emissions in this category and attributed its decrease of 13,974 Mscf
to bundling maintenance activities and reducing line pressure prior to the blowdown.
SoCalGas had a very small increase of 171 Mscf in emissions attributed to normal yearly
variation in maintenance cycles.
In 2015, entities reported Component Leaks and Component Emissions together on
one worksheet, and in 2016, at Staff’s request, Component Leaks and Component Emissions
were reported on separate worksheets. The Component Emissions are the vented emissions
that occur by design or operation of the components, while the Component Leaks are the
unplanned, fugitive leaks.
Transmission Compressors:
Three respondents reported total transmission compressor station emissions of
145,160 Mscf, which was a 10.8% decrease from 162,686 Mscf in 2015. The percentage of these
Emission Source Categories2015 (Mscf)
2015
% of Total
2016 (Mscf)
2016
% of Total
YOY Change
(Mscf)
YOY %
Change Inc/(Decr)
Station Leaks & Emissions 941,622 93.5% 931,280 94.7% (10,342) (1.1%)
Blowdowns 65,582 6.5% 51,775 5.3% (13,807) (21.1%)
Component Emissions 21 0.0% - 0.0% (21) (100.0%)
Transmission M&R Station Total 1,007,226 100% 983,055 100% (24,170) (2.4%)

ANALYSIS OF THE UTILITIES' JUNE 16, 2017, NATURAL GAS LEAK AND EMISSION REPORTS
25
emissions compared to the total from all categories remains roughly the same with 2.5% in
2015 and 2.3% in 2016.
Table 11: Transmission Compressor Station (Emissions - 2015 & 2016)
The subcategory compressor emissions have decreased 54,156 Mscf or 51% from
106,257 Mscf in 2015 to 52,101 Mscf in 2016.32 Staff notes that a compressor can have a
significantly different scf/hour rating for pressurized operating state, pressurized idle, and
depressurized idle YOY. In 2018, reporting methods will be modified to address this by
taking measurements more frequently to reflect the contemporaneous changes to compressor
emissions that may correlate them to maintenance activities.33
Blowdown emissions increased 13,426 Mscf or 43.2% from 31,088 Mscf in 2015 to
44,510 Mscf in 2016 due to several factors contributing to these changes. The largest impact
comes from 6,303 Mscf due to the inclusion by PG&E of compressors whose activity and
emissions were omitted in prior reporting years because they fell below CARB’s Mandatory
Reporting Requirement (MRR). This requirement will be clarified during the annual
reporting workshop planned for winter 2018.34 The rest of the increase is due to normal
fluctuations in maintenance activity.
In the 2015 Joint Report there was only one category for capturing both component
leaks and emissions. In 2016, Respondents reported Component Leaks and Component
Emissions separately. To enable comparison, Staff separated the 2015 reported emissions in
accordance with these definitions. The Component Emissions increase 4,509 Mscf from 2015
32
GO 112-F, and PHMSA regulations required compressor operators to take one measurement of each of their compressors in its various states (e.g. pressurized operation, pressurized idle, non-pressurized idle) as an EF. The measured EF is multiplied by the number of hours in each state to estimate the emissions per compressor. There is no provision when to take the measurement, such as after maintenance, at the beginning of the year. However, new CARB regulations require operators to take quarterly measurements starting in 2018 (CCR, Title 17, Division 3, Chapter 1, Subchapter 10 Climate Change Article 4. Subarticle 13). 33
Ibid. 34
The Joint Staff report intends to capture all system emissions that can be reasonably identified, estimated and/or measured; SB 1371 does not restrict the reporting of emissions to the MRR guidelines.
Emission Source Categories2015 (Mscf)
2015
% of Total2016 (Mscf)
2016
% of Total
YOY Change
(Mscf)
YOY %
Change Inc/(Decr)
Compressor Emissions 106,257 65.3% 52,101 35.9% (54,156) (51.0%)
Blowdowns 31,088 19.1% 44,510 30.7% 13,423 43.2%
Component Emissions 7,186 4.4% 11,695 8.1% 4,509 62.7%
Component Leaks 18,153 11.2% 26,575 18.3% 8,422 46.4%
Storage Tank Leaks & Emissions 3 0.0% 10,279 7.1% 10,276 314756%
Compressor Station Total 162,686 100% 145,160 100% (17,527) (10.8%)

ANALYSIS OF THE UTILITIES' JUNE 16, 2017, NATURAL GAS LEAK AND EMISSION REPORTS
26
to 11,695 Mscf in 2016, and Component Leaks increased 8,422 Mscf from 2015 to 26,575 Mscf
in 2016.
Operators do not currently track all the repairs performed on component leaks at
compressor facilities. Due to their size and familiarity with their operations, the smaller ISPs
could identify the specific repairs made for the leaks found at their facilities. However, both
PG&E and SoCalGas could not document the repair dates of leaks detected in prior years, or
whether leaks detected during 2016 facility surveys were repaired. PG&E and SoCalGas
historically have not tracked the repair of minor leaks by tightening, lubrication, and
adjustment but claim that when a leak is found, this occurs immediately. SoCalGas
committed to implementing new procedures to record all component leak repair activities.
For 2018 reporting, Staff will address the need for better record-keeping for compressor
station leak repair to ensure compliance with BPs.
Storage Tanks:
Storage Tank Leaks and Emission increased from 3 Mscf to 10,279 Mscf in 2016, due to
2 LNG storage tank leaks detected by PG&E at one of its facilities in 2016.
Distribution Mains and Services (DM&S):
Six respondents reported total DM&S emissions of 1,602,027 Mscf, which is 100,844
Mscf or a 5.9% decrease from last year’s total of 1,702,871 Mscf. This comprised the second
largest system category for 25.6% of total gas emissions.
The emissions from DM&S pipeline leaks showed a slight decrease of 57,786 MMscf
from 1,458,399 Mscf in 2015 to 1,400,613 Mscf in 2016, which by itself makes up 22% of total
emissions (Table 7).
Table 12: Distribution Mains and Services (DM&S) (Emissions - 2015 & 2016)
Staff continues to work with Respondents to improve the methodology for calculating
emissions from un-surveyed portions of their territory. In 2016, the template was updated to
Emission Source Categories2015 (Mscf)
2015
% of Total
2016 (Mscf)
2016
% of Total
YOY Change
(Mscf)
YOY %
Change Inc/(Decr)
Pipeline Leaks 1,458,399 85.6% 1,400,613 87.4% (57,786) (4.0%)
All Damages 236,145 13.9% 200,604 12.5% (35,541) (15.1%)
Blowdowns 5,046 0.3% 810 0.1% (4,236) (83.9%)
Component Emissions 3,281 0.2% - 0.0% (3,281) (100.0%)
Distribution Mains & Services Total 1,702,871 100% 1,602,027 100% (100,844) (5.9%)

ANALYSIS OF THE UTILITIES' JUNE 16, 2017, NATURAL GAS LEAK AND EMISSION REPORTS
27
include new worksheets to calculate and summarize emissions consistently. Consequently,
Staff worked with respondents to ensure that they filled out the worksheets correctly.
The DM&S damages showed a decrease from 236,145 Mscf in 2015 to 200,604 Mscf.
This category includes about 15 MMscf of MSA above ground damages (See #2 on page 18).
There were fewer blowdowns in 2016, which consequently reduced the volume of
emissions from 5,045 Mscf in 2015 to 810 Mscf. Also, due to re-categorization of the
component emissions, there were no emissions to report for 2016; however, the report
retained the line item since emissions were reported in 2015.
Detailed Discussion of DM&S Leaks and Emissions:
Utilities reported more incidents of DM&S pipeline leaks than all of the other sources
in the survey combined. Six respondents reported a total of 57,015 leaks. Respondents
provided data for: leak discovery date, repair date, leak grade, pipeline classification as
either main or service, pipeline material, method of discovery, and calculated emissions.
Respondents provided other parameters for informational purposes that were not used in
calculations, such as: address of leak, pipe size, pressure, and scheduled date of repair.
Table 13: Calculated Emissions Volume by Leak Grade (2016)
In 2015, 33,987 leaks were estimated in un-surveyed territory, which contributed
emissions of 660,493 Mscf. In 2016, there were fewer leaks, 21,743 estimated in un-surveyed
territory, which contributed 549,682 Mscf of emissions (Table 13). The number of anticipated
leaks in the un-surveyed area dropped by about 12,240 (36%), however the emissions
associated with un-surveyed areas only dropped 110,811 Mscf (17%). This is due to the fact
Calculated Emissions Volume by Leak
Grade
Carried Over
to 2016
(Mscf)
Discovered in
2016 (Mscf)
Estimated Un-
surveyed
(Mscf)
Total
(Mscf)% of Total
% of Total
Emissions:
(6,266,544
Mscf)
Grade 1 450 47,990 - 48,440 3.5% 0.8%
Grade 2 14,015 59,734 - 73,749 5.3% 1.2%
Grade 3 437,154 291,586 - 728,741 52.0% 11.6%
Un-surveyed - No grade - - 549,682 549,682 39.2% 8.8%
AG - Haz - - - - 0.0% 0.0%
AG - Non-Haz - 0.12 - 0.12 0.0% 0.0%
Total (Mscf) 451,619 399,311 549,682 1,400,613 100.0% 22%
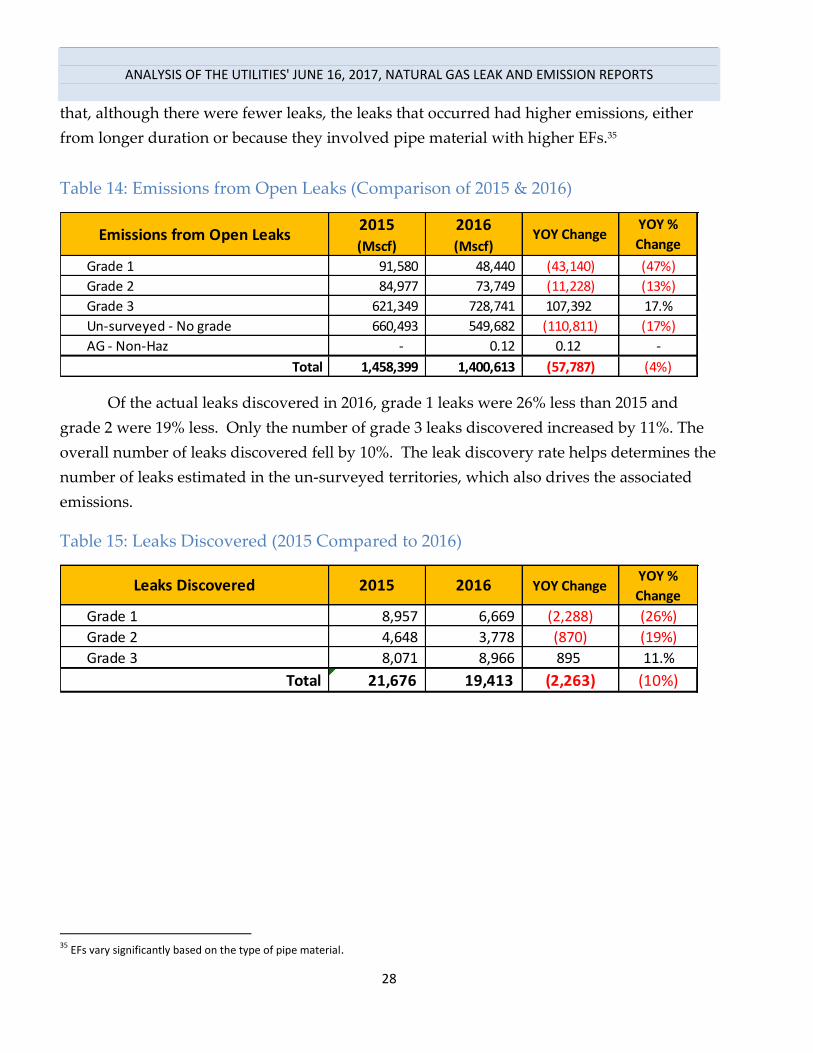
ANALYSIS OF THE UTILITIES' JUNE 16, 2017, NATURAL GAS LEAK AND EMISSION REPORTS
28
that, although there were fewer leaks, the leaks that occurred had higher emissions, either
from longer duration or because they involved pipe material with higher EFs.35
Table 14: Emissions from Open Leaks (Comparison of 2015 & 2016)
Of the actual leaks discovered in 2016, grade 1 leaks were 26% less than 2015 and
grade 2 were 19% less. Only the number of grade 3 leaks discovered increased by 11%. The
overall number of leaks discovered fell by 10%. The leak discovery rate helps determines the
number of leaks estimated in the un-surveyed territories, which also drives the associated
emissions.
Table 15: Leaks Discovered (2015 Compared to 2016)
35
EFs vary significantly based on the type of pipe material.
Emissions from Open Leaks2015(Mscf)
2016(Mscf)
YOY ChangeYOY %
Change
Grade 1 91,580 48,440 (43,140) (47%)
Grade 2 84,977 73,749 (11,228) (13%)
Grade 3 621,349 728,741 107,392 17.%
Un-surveyed - No grade 660,493 549,682 (110,811) (17%)
AG - Non-Haz - 0.12 0.12 -
Total 1,458,399 1,400,613 (57,787) (4%)
Leaks Discovered 2015 2016 YOY ChangeYOY %
Change
Grade 1 8,957 6,669 (2,288) (26%)
Grade 2 4,648 3,778 (870) (19%)
Grade 3 8,071 8,966 895 11.%
Total 21,676 19,413 (2,263) (10%)

ANALYSIS OF THE UTILITIES' JUNE 16, 2017, NATURAL GAS LEAK AND EMISSION REPORTS
29
Figure 4: Distribution Pipeline Emissions by Grade 2015 & 2016
Average Days to Repair Leaks36
The overall average days-to-repair leaks appear to be within the timeframes allowed
by statutory and regulatory requirements.
Table 16: 2016 - Average Days to Repair by Entity (Graded Leaks)
36
The formula for average days to repair leaks is the average of “Repair date minus discovery date plus one day.”
91,580 48,440
84,977 73,749
621,349 728,741
660,493 549,682
-0.12
2015 2016
Distribution Pipeline Emissions by Grade2015 & 2016
(Mscf)
AG - Non-Haz
Un-surveyed - Nograde
Grade 3
Grade 2
Grade 1
Entity Grade 1 Grade 2 Grade 3PG&E 1.3 63.3 1,067.3
SCG 1.8 163.6 838.0
SDG&E 1.3 57.7 131.5
SWG 1.0 17.4 88.9
WCG - - -
Weighted Average 1.5 88.7 849.5
2016 - Average Days to Repair by Entity

ANALYSIS OF THE UTILITIES' JUNE 16, 2017, NATURAL GAS LEAK AND EMISSION REPORTS
30
For example, while most Grade 1 leaks were repaired within 1 day, in rare cases repair
times were longer. In several instances, leaks that PG&E originally designated grade 3, were
upgraded to a grade 1 or 2, but the original discovery date as a grade 3 was reflected in the
raw data. The times to repair these upgraded leaks were statistical “outliers” at the tail end
of the distribution for repair of grade 1 or 2 leaks. However, PG&E could not provide the
date of upgrade for our analysis.
To prevent skewing the data, Staff omitted these outlier leaks from the average time to
repair calculation. The calculation of the average time to repair graded leaks used 98.7% of
the data and omitted 1.3% of the “outlier” repaired leaks.
Table 17: Leak Count by Grade and by Entity (2016)
Leak Count by Grade and by EntityCarried Over
to 2016
Discovered in
2016Total % of Total
Repaired in
2016
Carried Over
to 2017
Carried
Over
% of Total
PG&E 71 3,965 4,036 60% 4,036 0 -
SCG 4 2,274 2,278 34% 2,278 0 -
SDG&E 0 410 410 6% 410 0 -
SWG 0 20 20 0% 20 0 -
WCG 0 0 0 0% 0 0 -
Grade 1 Total 75 6,669 6,744 19.2% 6,744 0 0.0%
PG&E 844 2,535 3,379 67% 3,349 30 4%
SCG 434 1,127 1,561 31% 934 627 92%
SDG&E 20 100 120 2% 98 22 3%
SWG 0 16 16 0% 16 0 0%
WCG 0 0 0 0% 0 0 0%
Grade 2 Total 1,298 3,778 5,076 14.4% 4,397 679 3.2%
PG&E 5,964 4,466 10,430 45% 215 10,215 50%
SCG 8,277 4,462 12,739 55% 2,569 10,170 50%
SDG&E 1 3 4 0% 4 0 0%
SWG 5 26 31 0% 29 2 0%
WCG 3 9 12 0% 0 12 0%
Grade 3 Total 14,250 8,966 23,216 66.0% 2,817 20,399 96.4%
PG&E 37 80 117 98% 35 82 100%
SCG 0 2 2 2% 2 0 0%
SDG&E 0 0 0 0% 0 0 0%
SWG 0 0 0 0% 0 0 0%
WCG 0 0 0 0% 0 0 0%
AG - Non-Haz Total 37 82 119 0.3% 37 82 0.4%
Total Known Leaks 15,660 19,495 35,155 100% 13,995 21,160 100%
PG&E 0 14,564 14,564 67% N/A N/A -
SCG 0 6,423 6,423 30% N/A N/A -
SDG&E 0 728 728 3% N/A N/A -
SWG 0 28 28 0% N/A N/A -
WCG 0 0 0 0% N/A N/A -
Unsurveyed - No grade Total 0 21,743 21,743 38.2% 0 0 0.0%
Grand Total 15,660 41,238 56,898 100% 13,995 21,160 100%

ANALYSIS OF THE UTILITIES' JUNE 16, 2017, NATURAL GAS LEAK AND EMISSION REPORTS
31
Above Ground (AG) Leaks (Not Graded)
In the 2015 Joint Report, there was a concern that not all leaks were graded. The 2016
template worksheets explicitly included categories for three ungraded Above Ground leak
designations. Grading above ground leaks is not required by regulation and is not standard
industry practice. The above ground leaks that are not graded are classified as “Above
Ground Hazardous”, “Above Ground Non-Hazardous”, and “Above Ground Non-
Hazardous Minor.” However, PG&E grades their Above Ground Non-Hazardous leaks and
includes any emissions associated with Above Ground leaks in their respective graded
category. The Staff adjusted the data to accurately reflect PG&E’s Above Ground Non-
Hazardous and prevent duplication. As noted, Respondents are generally reporting their
un-surveyed leaks without proportionately allocating them by grade. However, Staff would
like to understand whether the respondents have empirical data that can be used to allocate
the leaks that are estimated for their un-surveyed areas, not only by leak grade but also by
pipe material.
Pipe Material Type
One important data element in estimating leak volume is the pipe material since each
material type has a specific EF. In PG&E’s case, for the majority of leaks the material type is
not known and it assumes that the estimated leaks occur in different pipe materials in the
same proportions as known leaks occur in different pipe materials. However, this fails to
account for the fact that some pipeline materials have been installed disproportionately
throughout the service territory, accordingly, this estimation method likely miss-states the
emissions from these leaks.
PG&E uses a weighted average of the known leak’s EFs to come up with a hybrid EF
for its leaks with unknown material type. This is a temporary solution until we devise a
better method for allocating the leaks to an appropriate material type.
Staff is concerned that this issue could have other safety ramifications because
different pipeline materials have different EFs and require different repair methodologies.
Without complete information, PG&E could make suboptimal short and long-term pipeline
repair decisions where pipeline materials have a bearing on the decision.
As noted, Respondents are generally reporting their un-surveyed leaks without
proportionately allocating them by grade. For future reports, Staff would like to understand
whether the respondents have empirical data that can be used to allocate the leaks that are
estimated for their un-surveyed areas, not only by leak grade but also by pipe material.

ANALYSIS OF THE UTILITIES' JUNE 16, 2017, NATURAL GAS LEAK AND EMISSION REPORTS
32
Distribution M&R Stations:
Four respondents reported total distribution M&R station emissions of 1,319,336 Mscf, which
is 28,732 Mscf (2.1%) less than the 2015 total of 1,348,067 Mscf. Virtually all of the emissions
come from the M&R stations leaks and emissions, with only 331 Mscf from blowdown
emissions. Distribution M&R stations have the highest EF in the inventory for above ground
M&R stations.37 Therefore, Distribution M&R Stations remain one of the largest sources of
emissions.
Table 18: Distribution M&R Stations (Emissions - 2015 & 2016)
Customer Meters:
Six respondents reported emissions from customer meters totaling 1,644,997 Mscf, which is
6,723 Mscf (0.4%) greater than the 2015 total of 1,638,274 Mscf. The increase is due to
additional customer meters. In 2016, this system category has the largest share of the total
emissions at 26.3%, and comprises the largest share of population based emission estimates.
Table 19: Customer Meter (Emissions - 2015 & 2016)
In addition, in 2016 four of the six respondents reported vented emissions of 1,968
Mscf, a reduction of 395 Mscf (16.7%) from 2015.
Starting in 2016, Staff added worksheets for; a) damages, b) actual Meter Set
Assemblies (MSA) leaks and c) component emissions within the customer meter category.
Review and evaluation of this data, though not included in the emissions inventory, may
37
The EF for Distribution system above grade M&R Stations with an inlet pressure of 300 PSI or greater is 1,648.5 Mscf/year/station. The emissions are driven by the size of the EF and the number of stations.
Emission Source Categories2015 (Mscf)
2015
% of Total2016 (Mscf)
2016
% of Total
YOY Change
(Mscf)
YOY %
Change Inc/(Decr)
Station Leaks & Emissions 1,347,773 100.0% 1,319,005 100.0% (28,768) (2.1%)
Blowdowns 295 0.0% 331 0.0% 36 12.3%
Distribution M&R Stations 1,348,067 100% 1,319,336 100% (28,732) (2.1%)
Emission Source Categories2015 (Mscf)
2015
% of Total2016 (Mscf)
2016
% of Total
YOY Change
(Mscf)
YOY %
Change Inc/(Decr)
Meter Leaks 1,635,910 99.9% 1,643,029 99.9% 7,119 0.4%
Vented Emissions 2,363 0.1% 1,968 0.1% (395) (16.7%)
Customer Meter Total 1,638,274 100% 1,644,997 100% 6,723 0.4%

ANALYSIS OF THE UTILITIES' JUNE 16, 2017, NATURAL GAS LEAK AND EMISSION REPORTS
33
eventually allow reporting emissions in this systems category based on actual
measurements, rather than population/EF based estimated emissions.
Out of the six respondents, only PG&E failed to report their damages in the template
for MSA damages. PG&E explained that they were not capable of separating out the MSA
related damages from their DM&S damages that they reported in Appendix 4 - DM&S
damages data.
In 2015 the above ground MSA and DM&S pipeline damages were reported together
as DM&S damages of 200,604 Mscf. Because PG&E could not separate its MSA damages
from its DM&S damages Staff aggregated the 2016 MSA damages (15,116 Mscf) reported by
other Respondents with the DM&S pipeline damages (185,488 Mscf) for a combined total of
200,604 Mscf, that is reported as DM&S damages in the 2016 Joint Report.
The YOY DM&S damages are comparable, but MSA damages are not reported as a
subcategory of Customer Meter emissions in the 2016 Joint Report. Staff will explore ways to
separate PG&E’s 2016 MSA damages from their DM&S pipeline damages so they may be
reported separately in the future.
Underground Storage:
Six respondents reported underground storage systems emissions totaling 138,542
Mscf for 2016, which is a 28.1% decrease from 192,797 Mscf for 2015.
Table 20: Underground Storage (Emissions - 2015 & 2016)
Significant changes:
The subcategory Storage Leaks and Emissions changed slightly from 15,016 Mscf in 2015
to 15,630 Mscf, up about 4.1%.
The storage compressor emissions decreased 71,151 Mscf (73.9%) from 2015 emission of
96,313 Mscf to 25,163 Mscf. (In 2016, the compressor emissions portion was reported
Emission Source Categories2015 (Mscf)
2015
% of Total
2016 (Mscf)
2016
% of Total
YOY Change
(Mscf)
YOY %
Change Inc/(Decr)
Storage Leaks & Emissions 15,016 7.8% 15,630 11.3% 613 4.1%
Compressor Emissions 96,313 50.0% 25,163 18.2% (71,151) (73.9%)
Compressor Leaks - 0.0% 2,083 1.5% 2,083 NA
Blowdowns 46,358 24.0% 28,927 20.9% (17,432) (37.6%)
Component Emissions 14,947 7.8% 26,595 19.2% 11,649 77.9%
Component Leaks - 0.0% 40,133 29.0% 40,133 NA
Dehydrator Vent Emissions 20,163 10.5% 11 0.0% (20,152) (99.9%)
Underground Storage Total 192,797 100% 138,542 100% (54,255) (28.1%)

ANALYSIS OF THE UTILITIES' JUNE 16, 2017, NATURAL GAS LEAK AND EMISSION REPORTS
34
separately from compressor fugitive leaks.) The YOY change in compressor emissions is
due to reduced operations at both SoCalGas and PG&E facilities (see more details below
under storage blowdowns) as well as a the temporary shutdown of PG&E’s McDonald
Island facility, and changes in the annual survey to measure each compressor’s scf/hour
EF for each operating state.38 Similar to compressors used in transmission, there are new
regulations that will require quarterly testing, which may reduce dramatic fluctuations in
the EF from measurement to measurement.
Blowdown emissions decreased as well from 46,358 Mscf in 2015 to 28,927 Mscf in 2016
due to reduced blowdowns, warmer heating season reducing activity levels, seasonal
changes and multi-year maintenance cycles. The following lists drivers in blowdown and
corollary compressor emissions reduction:39
a. As a result of the 2015 Aliso Canyon leak, authorities directed the Aliso Canyon
storage field to reduce operations for inspections and repairs. The reduced
pressurized operations reduced the need for blowdowns, and therefore resulted in
reduced emissions.
b. McDonald Island storage field:
o In 2015, McDonald Island had issues with the emergency shutdown (ESD)
equipment that activated the ESD system purging the system in accordance
with safety protocols. Even though this problem was intermittent it caused
several station blowdowns. The issue was investigated and repaired. As a
result, the number of ESD decreased by 11 from 2015 to 2016 significantly
reducing emissions from blowdowns.
o PG&E kept compressor units online during reduced injection rate periods
rather than shutdown the unit. A shutdown results in a blowdown.
o A warmer than average 2015-2016 winter shortened the withdrawal season
resulting in fewer hours of pressurized operation. Less compressor run-time
equates to less blowdowns.
o Due to higher inventory carryover of natural gas, fewer injections were needed
to reach maximum storage capacity for the following winter. This also
contributed to less compressor run-time and blowdowns.
38
The annual compressor survey establishes the EF for its operating states, e.g. pressurized operation, pressurized idle and non-pressurized idle. 39
We included PG&E’s thorough breakdown of the issues and activities that occurred in 2015/2016 which helped Staff more fully understand the YOY changes in emissions and provided useful examples of practices that may mitigate emissions in storage systems.

ANALYSIS OF THE UTILITIES' JUNE 16, 2017, NATURAL GAS LEAK AND EMISSION REPORTS
35
o Due to a new Division of Oil, Gas, and Geothermal Resources (DOGGR)
regulation requiring additional surveys of storage fields, PG&E identified a
reservoir leak. The two-month leak investigation required a shut-in of the
storage field during this time when no injection or withdrawal occurred.
Accordingly, the related compressor units were offline for two months, which
also resulted in fewer withdrawal and injections (compressor runs) for the
remainder of 2016.
o PG&E initiated reliability improvements for compressor Units K-1 and K-2 that
reduced; a) the number of unit shutdowns in 2016, and b) blowdowns as a
result of corrective replacement of the gas cooler rotating equipment during
annual maintenance of these two compressors. As a result, each compressor
unit’s blowdown volume was significantly reduced throughout 2016.
o In 2015, a large number of operating and equipment issues occurred with the
rental compressors (K-7, K-8, and K-9). Improvements in preventative
maintenance, compressor loading, and tuning were performed throughout
2015 to increase reliability and engine efficiency. These actions resulted in
reduced unit shutdowns, lowering the unit’s number of blowdown.
In addition, component leaks and vented emissions were shown as one category in
2015 with an emissions total of 14,947 Mscf. In 2016, component emissions and component
leaks were reported separately. The 2016 “component emissions” are 26,595 Mscf, and the
component leaks are 40,133 Mscf. If the 2016 component leaks and emissions are combined
for a total 66,728 Mscf, then this compares to the 14,947 Mscf reported in 2015. The 51,782
Mscf difference is attributed to accounting for emissions not previously reported as well as
better knowledge of systems assets. Continued monitoring of these component leaks and
emission will help understand long term changes and trends.
Dehydrators:
Six entities reported operating dehydrator facilities in 2015 and 2016. In 2015, three
respondents reported emissions totaling 20 MMscf based on the EFs provided in the
reporting templates. Three ISPs did not report any emissions because all methane gas
vented by the dehydrators was routed to a vapor recovery unit (VRU) and incinerated by a
thermal oxidizer.
In 2016, based on concerns that dehydrator emissions were not being reported
consistently, Staff investigated the types of dehydrators and emissions used by respondents.

ANALYSIS OF THE UTILITIES' JUNE 16, 2017, NATURAL GAS LEAK AND EMISSION REPORTS
36
Staff found that virtually all operators use glycol based dehydrators and either use a thermal
oxidizer, or pipe the distilled flash gas for use as a fuel in its heat exchangers. In all but one
case, the dehydrator’s flash gas is combusted so that no natural gas is vented to the
atmosphere.
Only PG&E reported dehydrator-vented emissions at on dehydrator facility, where it
measured emissions of 11 Mscf in 2016. Even though this is a glycol based dehydrator that
recycles its flash gas in a heat exchanger, not all the flash gas is used and the excess is vented.
The 2015 dehydrator emissions were overstated because the reporting template only
provides an EF for dehydrators that are desiccant based, or directs respondents to use a
CARB MRR calculation for dehydrator vented natural gas. 40 Respondents followed the
template guidelines, even if their dehydrators had no vented emissions.
Staff has decided that, in the future, Respondents using glycol dehydrators with vapor
recovery unit (VRU) and a thermal oxidizer, or that use all of the flash gas as a fuel should
report zero vented natural gas emissions for their dehydrators. Those respondents that use
desiccant dehydrators or that have glycol dehydrators without a VRU and destruction device
that completely combusts the natural gas should report emissions using the appropriate EF
provided or their measured emissions.
Staff will include this update in the winter 2018 workshop.
40
The EF provided in the data request for desiccant dehydrators is 2.23E-03 MT CH4/MMscf, with the alternative CARB MRR calculation “Eq. 5 in MRR”.
ANALYSIS OF THE UTILITIES' JUNE 16, 2017, NATURAL GAS LEAK AND EMISSION REPORTS
37
Responses to Data Request Questions #1 and #7
Responses to Data Request Question #1:
Question 1 asks each respondent to provide: “A summary of changes to utility leak
and emission management practices from January 1st, 2016 to December 31st, 2016. The
report must include a detailed summary of changes, including the reasoning behind each
change and an explanation of how each change will reduce methane leaks and emissions.”
Utilities’ responses to Question #1 can be grouped into several categories as described
below. In general, the answers did not always include the reasoning behind each change and
how the change will reduce leaks and emissions. Greater detail will be shown in the 2018
Compliance Plans required under CPUC Decision 17-16-015.
Blowdown Reduction
SDG&E and SoCalGas report reduction of blowdown emissions from the practice of
reducing transmission operating pressure before venting the pipeline for maintenance.
SDG&E states they reduced emissions by approximately 116 Mscf, and SoCalGas reduced
emissions by about 42,000 Mscf of methane in 2016.
Wild Goose Storage reduced blowdown emissions by bundling projects together that
require gas venting, such as maintenance tasks and operational changes.
Damage Prevention
SoCalGas and SDG&E report they are continuing to follow the BPs of the Federal
PIPES Act (of 2006) Section 60134(b) to reduce excavation damage. In 2016, they committed
to the EPA Methane Challenge program for excavation damage prevention. Pipelines
damaged by excavation and similar activities will vent gas until the flow can be controlled.
Distribution Mains and Services
PG&E emphasized continuation of their policy to replace, rather than repair, leaky
service lines for a total of 3,951 services replaced in 2016, and a total emissions reduction of
15% for Distribution Mains and Services. Staff has some questions about the necessity of this
in instances where an appropriate repair would eliminate the emissions, and PG&E should
explain this further in its compliance plan.

ANALYSIS OF THE UTILITIES' JUNE 16, 2017, NATURAL GAS LEAK AND EMISSION REPORTS
38
SoCalGas reported its replacement of distribution mains and services totaled 46 miles
of mains and 8,022 services in 2016, for a total of 1,379 Mscf emissions reduction from this
practice.
Leak Detection and Repair
SoCalGas has a program to reduce the inventory of Grade 3 (non-hazardous) leaks,
and reports that 799 of these leaks were eliminated in 2016.
SoCalGas stated they are evaluating feasibility of existing mobile mapping technology
by measuring atmospheric methane in the vicinity of pipelines to assess conditions prior to
replacement of pipeline segments identified by integrity management programs. The results
may drive re-prioritization of segments for replacement. In 2016, SoCalGas assessed 50 main
replacement projects with a total of 79,866 feet of main and 3 areas of service leak clusters.
They discovered 4 leaks from this activity that were not previously known.
SoCalGas and SDG&E are enabling electronic tracking of leaks measured with hand-
held survey equipment by adding Bluetooth connectivity to the equipment. Leak
measurements will be tagged with GPS location and uploaded for integration with the
pipeline Geographic Information System.
SoCalGas and SDG&E jointly installed a dozen methane leak sensors near schools,
hospitals and nursing homes in a pilot program to evaluate effectiveness as an early warning
device.
SoCalGas and SDG&E also report the use of e-GIS (electronic geographic information
system) mapping to identify distribution pipeline leak to optimize the prioritization of
pipeline replacements.
Southwest Gas reported they have adopted the more frequent leak repair
requirements of GO 112-F including the repair of Grade 2 and Grade 3 within one year of
discovery, and that if a leak once downgraded to Grade 3 is later upgraded, it cannot later be
downgraded to Grade 3.
Gill Ranch Storage evaluated leak detection procedures and instruments in 2016.
Wild Goose Storage installed remote-controlled exit valve actuators at their well pad
to allow for faster pipeline closure in the event of a leak.
Compressor Stations
SoCalGas participates in the EPA Gas Star program to replace compressor engine rod
packing on a more frequent schedule, to reduce methane leakage from that source. An
ANALYSIS OF THE UTILITIES' JUNE 16, 2017, NATURAL GAS LEAK AND EMISSION REPORTS
39
increased replacement interval of 26,000 hours of engine operation drove incremental
replacement of 9 packings in 2016. SoCalGas did not report the emissions reduction from
this practice in 2016; however, similar efforts in 2015 reduced emissions by 25,085 Mscf of
methane from replacement of 29 packings.
Wild Goose Storage installed fuel gas flow meters on four compressor engines to
allow for greater tacking of fuel gas consumption and thus greater efficiency with engine
operation to minimize emissions.
Gas Storage Facilities
PG&E improved leak monitoring at their McDonald Island storage location by
adopting daily leak surveys, aerial surveys, and installation of 3 fixed methane sensors in the
facility, in collaboration with Pipeline Research Council International (PRCI). PG&E also
installed a Sensit monitor device at the Los Medanos site for a pilot program in collaboration
with EDF. Further, PG&E tested the Picarro gas detection vehicle to identify larger leaks on
wellheads at Los Medanos.
SoCalGas reports they have begun their SIMP, or Storage Well Integrity Management
Program, in 2016. The SIMP program at Aliso Canyon included 38 well inspections,
transition of 33 wells to tubing flow only, isolation of 71 wells from the storage zone,
abandonment of 1 well, installation of real time pressure sensors across all fields, a new
alarm system, and monitoring of tubing, casings and annular space for all wells.
Central Valley Gas Storage conducted a study using a rented, portable compressor to
collect and re-inject gas that had leaked from its compressor engine rod packings. The
emissions were reduced but CVGS concluded the cost of the added compressor was much
greater than the value of the emissions prevented.
High Bleed Pneumatics
Gas facilities often use pressurized pipeline gas as a power source to actuate control
and shut-off valves. Some of those devices have a high “bleed” rate: they are designed to
vent, or bleed, gas at a high rate in normal operation. These high-bleed devices have been
phased out by most operators. SoCalGas has identified a number of these devices that will
be replaced in 2016.
ANALYSIS OF THE UTILITIES' JUNE 16, 2017, NATURAL GAS LEAK AND EMISSION REPORTS
40
Research Projects
SoCalGas funded and participated in a number of research projects aimed to reduce
methane emissions:
Study to refine Emission Factors to more accurately estimate emissions from
buried pipelines and meter set assemblies.
Technology to detect and quantify fugitive and vented emissions including fixed
sensors, mobile mapping, optical imaging, aerial detection including drones, and
fiber optics.
Synergistic pipeline safety and integrity technologies including study of an
intelligent shut-off device, leak growth rates in plastic piping, and breakaway
devices for service risers.
Damage Prevention measures including fiber optics, acoustic sensing, pipe
locating, excavator warning system, and RFID technologies.
Blowdown emission reduction methods and technologies.
Changes to Emissions Data Reporting
PG&E reported changes in the way emissions were reported for several categories as
follows.
Transmission Pipeline Blowdowns. Due to new EPA requirements (new CFR – 40
CFR 938.232(m)) and to provide more accuracy, PG&E discontinued the
assumption of an average value of 125 Mscf for clearances below 250 Mscf and
instead used a more accurate calculation for each event.
Transmission M&R Stations. Emissions in this category increased largely due to
the addition of 40 Large Volume Customers (LVCs) by PG&E, which were not
previously included in this group. In the previous year, the majority of LVC
stations were characterized as Meter Sets, which have a different emissions factor.
After further review and understanding of these assets, PG&E decided the LVCs
should be considered as a Farm Tap type of station.
Distribution Mains and Services. PG&E revised the calculation for estimating
emissions due to pipeline damage to provide better accuracy. For emissions due to
dig-ins and other Distribution Main and Service pipe damage, PG&E made two
changes in the flow rate calculation to estimate emission volumes. In previous
reports, PG&E has assumed damage occurred at the maximum operating pressure
when calculating leak flow from damages, which will overstate the emissions since
ANALYSIS OF THE UTILITIES' JUNE 16, 2017, NATURAL GAS LEAK AND EMISSION REPORTS
41
pipelines rarely operate at their maximum pressure. In this report, PG&E instead
used the normal operating pressure to better represent gas flow conditions at the
time of a rupture. Additionally, PG&E reviewed its assumption about the shape of
the rupture opening and now believes a majority of the damages caused by
external forces (e.g. dig-ins) result in damage, which is inward (puncture) rather
than outward (burst). This damage model led PG&E to modify the discharge
coefficient in the flow calculation, which resulted in lower emissions volume.
Staff observes that it is standard engineering practice to use a discharge coefficient,
or multiplier, to model the friction effect of the orifice that gas is flowing through.
The coefficient chosen by PG&E, 0.6, is indicative of a very rough-edged orifice.
As noted herein, Staff must evaluate any method changes for their impact on prior
year reported emissions to obtain a valid YOY comparison of emissions.
Responses to Data Request Question #7:
Question 7 asks each respondent to provide: “An annual report on measures that will
be taken in the following year to reduce gas leaks and emissions to achieve the goals of SB
1371. The report must include a detailed summary of changes, including the reasoning
behind each change and an explanation of how each change will reduce methane leaks and
emissions.”
Small independent storage providers (ISPs) and local distribution operators reported
fewer measures because they have simpler operations and have reported a very low
emissions baseline. In addition, some of the ISP’s gas facilities were built within recent years
to modern engineering and safety standards and so may not have as much opportunity for
significant emissions reduction.
There were some common approaches among some of the operators, and some
unique technical solutions offered as well. The common approaches included increased leak
survey frequency; and pipe replacement based on various techniques, such as use of geo-
spatial analysis to identify leak-prone pipeline segments. The unique approaches include
new technology that is not yet in common use or new applications of existing technology to
the emissions problem.
Some of the measures were continuations of programs already in place during the
previous year. Staff notes that the Best Practice Compliance Plan will require operators to
ANALYSIS OF THE UTILITIES' JUNE 16, 2017, NATURAL GAS LEAK AND EMISSION REPORTS
42
identify whether a BP is a new approach or continuation of an existing one under other code
requirements.
Emission Reduction practices common to a number of operators:
More than one operator described measures in the following areas:
Leak Survey Frequency
Southwest Gas reported they have already increased their distribution leak survey
frequency from the Federal minimum of every five years to a three-year cycle, which
achieves earlier leak discovery and also synchronizes with the Federal three-year
atmospheric corrosion survey cycle. SDG&E and SoCalGas will accelerate leak surveys for
segments of the distribution pipeline built with early vintage Aldyl-A and other leak-prone
plastic materials from their current five-year to annual leak surveys.
Pipe Replacement
All four of the largest operators plan to pursue distribution pipe replacement based
on integrity management analysis of their pipelines. Integrity Management is an existing
requirement under the Federal Gas Safety Code, CFR Title 49, Part 192. These programs
require operators to identify and prioritize safety risks such as hazardous gas leaks, and
remediate them based on analysis of where leaks have occurred and the causes. This
analysis has focused the operator’s attention on remediation of pipeline segments made from
older pipe materials such as cast iron, unprotected steel, and” early vintage” polymers such
as Aldyl-A and PVC.
Geo-Spatial Analysis
“Geo-spatial” analysis helps to identify clusters of leaks. Known leaks are entered
into a Geographic Information System (GIS), so that clusters can be visualized and then
prioritized for repair or replacement. PG&E, SoCalGas and SDG&E all plan to use this
technique in 2017.
Blowdown Reduction
Blowdowns are controlled gas releases that are required to safely perform
maintenance on pipelines or other gas facilities. Reduction measures include routing of gas
away from the affected area to reduce pressure before release, flaring the gas, or capturing

ANALYSIS OF THE UTILITIES' JUNE 16, 2017, NATURAL GAS LEAK AND EMISSION REPORTS
43
and re-pressurizing the emissions for re-injection. PG&E has a pressure reduction program
for transmission pipeline blowdowns. SDG&E will use the methane capture system
developed by SoCalGas, and will collect field data to drive more reductions in future.
In their respective responses to this question no operator explicitly reported the
practice of bundling more than one maintenance activity concurrently to minimize
blowdowns.
Compressor Station Rod Packing
Transmission operators and storage providers operate compressors to increase gas
pressure as needed. Compressor equipment can produce emissions, which operators plan to
reduce by more frequent replacement of the compressor rod packing. Central Valley Gas
Storage, SoCalGas, and SDG&E all reported plans to increase the frequency of rod packing
replacement.
Unique Technical Processes and Practices:
The following measures are unique to a particular operator or are a new application of
existing techniques.
Fiber-optic sensing
Fiber-optic sensing could facilitate identifying leaks and encroachment on
transmission line right-of-way. This novel approach by SoCalGas makes use of the way the
internal molecular structure in fiber-optic glass responds to changes in temperature or
mechanical strain. These structural changes are sensed by changes in light scattering
through the fiber cable. For leak detection, pressurized gas escaping from a pipe becomes
colder, changing the temperature of the fiber optic cable. Construction equipment places a
strain on surrounding soil, which produces strain in the fiber optic cable to indicate
encroachment of the right of way. SoCalGas is scheduling the first installation of this
technology in 2017.
Bluetooth
Mobile handheld devices with GPS equipped with Bluetooth could support direct
digital leak mapping for on-foot leak surveyors. Traditional leak surveys are done on foot
with handheld leak sensors. Bluetooth communication adds the ability to upload readings,
including GPS data, from the handheld devices that may support the use of GIS systems to
ANALYSIS OF THE UTILITIES' JUNE 16, 2017, NATURAL GAS LEAK AND EMISSION REPORTS
44
plot and analyze the leak data more systematically. SDG&E and SoCalGas are planning to
use this approach.
Increased In-Line Inspection (ILI)
PG&E plans to increase its mileage of Transmission subjected to ILI to identify trouble
spots in pipelines where leaks may occur. Older transmission lines may require replacement
of sharp bends or abrupt diameter changes, for example, to accommodate the ILI tools, so
making those changes increases the number of miles that can be inspected. It was not clear
whether the increased miles are part of PG&E’s existing Federally- required Integrity
Management program or if the miles are above and beyond that requirement.
Increased Atmospheric Surveys
SoCalGas and SDG&E plan to do surveys of the atmosphere near pipelines for high
methane levels with mobile mapping as an independent means to find pipeline emissions, in
addition to traditional leak surveys focused immediately on the pipeline path. Specific
technology for conducting these surveys was not detailed. Staff expects further information
will be supplied with the upcoming Best Practices Compliance Plan filing due in March 2018.
Coordinate One-Call Excavation Activity
SDG&E and SoCalGas plan to coordinate their One-Call activities with GIS mapping
and real-time field technician locations for prompt and accurate marking of pipelines in
excavation project areas. SDG&E and SoCalGas think that this approach will give the call
center better tools to respond quickly and accurately to an excavator’s request for pipeline
location marking to reduce dig-ins and the corresponding emissions.

ANALYSIS OF THE UTILITIES' JUNE 16, 2017, NATURAL GAS LEAK AND EMISSION REPORTS
45
Lessons Learned Each year Staff tries to identify issues and concerns that affect emissions reporting as
well as look for opportunities to improve future emissions reporting. This section tries to
focus on lessons that may factor into improving emissions reporting processes and methods.
Only a brief description will be noted here because many of the issues have been discussed
in the report in greater detail. These items will be included in the agenda for the workshop
on potential changes to the annual reporting templates.
Transmission Pipelines:
In particular, PG&E’s blowdown events decreased dramatically from 2015 levels, as
they used a more accurate method for estimating emissions in 2016.
1. The 2016 methodology shows that the 2015 blowdown emissions were overstated,
and for accurate comparison to measurements in later years, the 2015 baseline
emissions need to be adjusted. This shows that improving methods could have
unintended retrospective impacts to prior year emissions.
2. The reasons for the dramatic change in number of events is believed to be due to
bundling maintenance work, however, the reporting entities could not provide
more empirical evidence to support the impact of bundling on the number of
events versus the ebb and flow of cyclical maintenance work. Different ways to
obtain and parses the data should be discussed in order to show how much is due
to the change in activity levels and how much is due to bundling efforts.
3. Considering the long-term assessment of blowdown activity: How best to show
the discrete blowdown emissions each year to ensure the integrity of comparable
emissions accounting YOY?
a. The engineering variables and formulas were not consistently provided in
blowdown worksheets, requiring CARB and CPUC follow up to validate
that the emissions are calculated consistently and in accordance with sound
engineering estimation principles.
b. Since the equipment in many, if not most, cases are blown down
periodically, how do we show the positive impact of BPs on emission
reductions?
c. Due to the discrete circumstances and nature of each blowdown event, and
the activity levels that vary YOY comparisons to prior year emissions are

ANALYSIS OF THE UTILITIES' JUNE 16, 2017, NATURAL GAS LEAK AND EMISSION REPORTS
46
problematic. Considering that BPs focus on blowdown mitigation activities
how should CARB and the CPUC measure the impact of mitigation
activities?
d. What additional concerns or considerations need to be taken into account in
order to use the discrete component leaks for quantifying emissions from
the Transmission Pipeline category?
Transmission M&R Stations:
Respondents reported finding new information about their M&R stations during the
data accumulation effort for the 2016 report and re-categorized the M&R stations
accordingly. That categorization affected the accounting of 2016 emissions and marked a
change in prior year reported emissions. Staff will leave the 2015 reported emissions
unchanged in these circumstances and report the 2016 emissions based on the best
information about their categorization for 2016.
Distribution Mains and Services:
There were issues with filling out the new Pipeline Summary worksheet in Appendix
4. Because pipeline leak surveys are done on multi-year cycles, Staff made significant
modifications to DM&S pipeline reporting templates for 2016 to include estimates of the
leaks expected to have occurred on the un-surveyed portions of the pipeline system, which
improved granularity of the data reported. However, the complexity of the worksheets
created confusion for respondents filling out the templates. Staff worked with respondents
to ensure consistency in reporting and integrity of the data. Some of these issues are
highlighted below.
1. How to determine the “average days to repair leaks” by grade. Modify the
instructions provided to clarify using the leak repaired date minus the date of the leak
discovered and add one day.
2. In 2016, the leaks anticipated from the un-surveyed areas were not allocated to the
different grades due to concerns of overstating the grade 1 leaks based on the ratio of
leaks detected in the current year. It would be helpful to understand the best methods
for trying to approximate the probability of occurrence of leaks by grade annually.
3. Leaks upgraded from a grade 3 need to be identified, and the date upgraded should
be noted or obtained to reset the clock for repair response time.

ANALYSIS OF THE UTILITIES' JUNE 16, 2017, NATURAL GAS LEAK AND EMISSION REPORTS
47
4. In 2015 and 2016, a majority of leaks in PG&E’s system are on pipelines, where the
material type is unknown. PG&E should determine how to resolve this discrepancy
or to work around it with better empirical information to allocate emissions to the
corresponding pipe material for these leaks.
5. PG&E can only identify pipe material for about 16% of their 6,920 leaks carried over
Pre-2016, and 47% of the 8,270 pipeline leaks discovered in 2016. For the remaining
84% of pre-2016 leaks and 53% of 2016 leaks on unknown pipe materials, PG&E
assigned them based on a proportional distribution of data set with known pipe
material. This assumes that the materials are ratably dispersed through their entire
service territory. However, Staff is concerned that this assumption is not supported
by sufficient empirical data so that the pipeline emissions estimate will not be
reasonably accurate.
Staff notes that each utility uses its own methodology and various assumptions to
estimate damages emissions that make direct comparisons between respondents difficult and
unwarranted. For example, SoCalGas and SDG&E used historical emissions profiles to
establish an average emission estimate for about 30% of their damage events. They also use
a self-generated EF for above-ground MSA damages when specific event information was
not available to calculate the emissions. SoCalGas/SDG&E also incorporate the leak grade to
determine the level of emissions for the damage event.
Impact of Increasing the Frequency of Leak Surveys:
Increasing the frequency of leak surveys is often offered as a good way to reduce
emissions of pipeline systems. Further work needs to be done to understand the cost benefit
of such changes. This will be addressed through Respondents’ compliance plans that
demonstrate implementation of Best Practices. Staff would like respondents to help develop
a theoretical analysis for determining the amount of emissions reduction, which could occur
by increasing the frequency of the graded leak surveys (e.g. from 5 to 4 years, etc.).
Preliminary investigations indicate that respondents are capable of providing theoretical
estimates of emissions reductions expected from shifting from a 5-year to a 4-year survey
cycle, or from a 4-year to a 3-year survey cycle.
A set of common assumptions should be required in order to establish a consistency
across emissions reduction estimates by respondents. Ideally, the assumptions should be
mutually agreed to by parties. The assumptions could include: region specific distribution of

ANALYSIS OF THE UTILITIES' JUNE 16, 2017, NATURAL GAS LEAK AND EMISSION REPORTS
48
pipeline material, specific regional leak rate, proportion of mains and services in the different
regions, the age assets by sector or region, and the foot print of the areas to be surveyed in
each year.
This topic will be added to the discussion for the updating reporting templates in the
workshop planned for winter 2018.
Customer Meters:
Damages for above ground DM&S infrastructure associated with MSAs needs to be
separated out from the DM&S pipeline damages. The MSA related damages need to be
included in the MSA systems category. The impediment to that is overcoming PG&E’s
issues reporting them separately.
Underground Storage:
Staff found that the reporting guidelines (Appendix 9) for dehydrator emissions need
to be updated to include glycol based dehydrators, which have a vapor recovery unit and a
combustor/oxidizer or recovery system. Appendix 9 also should provide updated
instructions on how to estimate dehydrator emissions.

ANALYSIS OF THE UTILITIES' JUNE 16, 2017, NATURAL GAS LEAK AND EMISSION REPORTS
49
Conclusions The report provides a framework for understanding the data submitted in the June 17,
2016, reports and subsequent resubmittals. The major findings are:
1. The total 2016 reduction of 5% from 2015 baseline emissions were primarily driven
by reduction in blowdown and venting emissions. There were small decreases in
pipeline leaks and compressor emissions, which were offset by small increases in
emissions from damages and component leaks and emissions (Table 1).
2. Significant reductions in blowdown emissions took place in 2016 attributed to
implementation of BPs for bundling work, concerted efforts to reduce line pressure
before blowdown, and cyclical changes in facilities maintenance. The amounts of
emission reduction associated with these different activities are difficult to evaluate
due to the lack of empirical data and performance metrics used by the respondents.
3. The majority of reported emissions (62%) come from population based emission
estimates that rely on EFs rather than measurements, and are expected to remain
relatively constant over time (Figure 2).
4. If significant changes to EFs occur based on improved information that affects
baseline emissions levels, Staff must consider the implications of any changes and
the potential adjustments to the baseline to avoid incorrectly accounting for
emissions over time.
In the short term, continued use of EFs is acceptable. However, in order to
better quantify emission reductions over time respondents must devise better ways
to measure actual leak volumes. Because it is difficult to quantify the actual volume
of leaks and emissions, more work is needed to develop and improve California
specific EFs until actual emissions measurements are available for the sources where
it is feasible to directly measure emissions.
5. The second largest emissions category (22%) came from graded leaks (Table 7).
Grade 3 leaks make up 52% of graded leak volume, and 12% of the total overall
emissions volume (Table 13). Of the unrepaired leaks that were carried over from
prior years, 96.5% of the emissions come from grade 3 leaks. Eliminating the backlog

ANALYSIS OF THE UTILITIES' JUNE 16, 2017, NATURAL GAS LEAK AND EMISSION REPORTS
50
of grade 3 leaks carried over to 2016 could decrease the overall emissions inventory
by 7%.41
6. The emissions from pipeline leaks that are estimated to come from un-surveyed
DM&S pipelines make up 39.2% of the 2016 graded leaks (Table 13). The estimated
un-surveyed emissions make up 9% of the total 2016 sector emissions. Increasing
the frequency of leak surveys should reduce graded pipeline emissions, by reducing
the lengths of time until leaks are detected and repaired.
7. Record keeping issues have a significant impact on estimating emissions accurately.
An ongoing concern is that key factors used for quantifying, categorizing and
calculating emissions are not available and Staff must accept assumptions without
empirical support. (See the example provided in section detailing DM&S results.)
This increases the likelihood that emissions estimates are not sufficiently accurate,
which would make reported emissions unreliable.
In 2016, challenges with consistent application of reporting template guidelines and
understanding the reporting requirements continued. In a few cases Respondents
did not include emissions because they were not subject to CARB’s Mandatory
Reporting Requirement (MRR). The Commission does not restrict the reporting of
subject emissions to those subject to MRRs. Staff plans to discuss the reporting
thresholds and revise reporting templates to clarify that any and all system
emissions that can be identified, estimated and measured should be reported.
41
The 7% emissions reduction is based on the 2016 grade 3 leaks carried over from prior years of 437 MMscf which is 7% of the 2016 emissions. Grade 3 leaks are discovered every year and all else being equal, eliminating the prior carry over of grade 3 leaks would in the case of 2016 reported emission figures, net 7%.

ANALYSIS OF THE UTILITIES' JUNE 16, 2017, NATURAL GAS LEAK AND EMISSION REPORTS
51
Appendix A: Methods for Estimating Emissions
Explanation of methods used for reporting and estimating leaks and emissions in the Joint Report.
System Categories
Emission Source Categories
Description
Transmission Pipeline
Pipeline Leaks
Pipeline operators were instructed to provide emissions using the approved EF by number of miles of pipeline. It was determined that use of the emission factor from INGAA Greenhouse Gas Emission Estimation Guidelines for Natural Gas Transmission and Storage - Volume 1 GHG Emission Estimation Methodologies and Procedures (September 28, 2005 - Revision 2) - Table 4-4 study would be the best available for Transmission Pipeline emissions at this time.
All damages (as defined by PHMSA)
Event specific emissions data reported where emissions were estimated either from modelling or size of breach using pressure and duration to calculate the emissions.
Pipeline Blowdowns The blowdown emissions are calculated based on unique equipment
attributes and measured with engineering calculations on an individual basis.
Component Emissions: The emissions from components associated with transmission pipeline operations are based on the recommended EFs outlined in Appendix 9 of the Data Request. In some cases, the components did not meet the definition for the EFs and discrete approximations based on manufacturer provided leak rates, direct measurement of the different operating states as well as the for specific values recommended for use in calculating component specific leaks times number of units of equipment.
Pneumatic Devices
Pressure Relief Valves
Component Leaks:
This new category was added to the reporting templates for RY 2016. The purpose is to capture fugitive component leaks in this category. This differentiates them from emissions from components that result from normal operations or by design. No emissions were reported in this category for RY 2016.
Odorizer (Odorizer and Gas Sampling Vents)
The EFs recommended in Appendix 9 were used where directly applicable, however where transmission pipeline dehydrator equipment did not match the pipeline operators used the discrete equipment attributes and operations profile to estimate emissions. The methods used appeared to provide the best estimate of emissions given the variety and operating context of these facilities.
Transmission M&R
M&R Stations
The emission estimate for M&R stations are based on the EFs recommended in Appendix 9 multiplied by the population of each type of M&R station.

ANALYSIS OF THE UTILITIES' JUNE 16, 2017, NATURAL GAS LEAK AND EMISSION REPORTS
52
M&R Components Emissions.
The purpose of this category is to capture emissions that occur in M&R station components that result from normal operations or by design of the component. The emissions from components are captured in the EF used on a station by station basis and the discrete information on a subset of components in the facility would duplicate emissions and present misleading count information. Until further work can be done with more comprehensive survey techniques relying on the recommended EFs on a station by station basis is considered the best estimate of emissions at this time.
M&R Leaks
This new category was added to the reporting templates for RY 2016. The purpose of this category is to capture fugitive leaks on components within the M&R station, and create a record as a basis for evaluating using actual measured leaks rather than an M&R station EF for estimating emissions. Currently the discrete leaks for M&R stations would be captured in the recommended EFs used to estimate the M&R station emissions and only where it could be determined that inclusion of discrete M&R leaks were not duplicated would they be included in the count of emissions for this category.
M&R blowdown
Blowdown emissions were estimated based on the calculation of the unique equipment volume being vented corrected for pressure and temperature at the time of the release. The estimates for blowdown events in general provide a reliable emission estimate.
Transmission Compressor
Stations
Compressor Equipment - Centrifugal and Reciprocating.
The emissions calculated based on the direct measurement of each compressor unit given its operating state and pressure, and then the emissions are based on number of operating hours in each operating state.
Compressor Leaks:
This new category was added to the reporting templates for RY 2016. The purpose is to capture fugitive leaks in this category, and differentiate them from emissions from compressors that result from normal operations or by design. There were no discrete compressor leaks in RY 2016.
Equipment and pipeline blowdowns
Blowdown emissions were estimated based on the calculation of the unique equipment volume being vented corrected for pressure and temperature at the time of the release. The estimates for blowdown events in general provide a reliable emission estimate.
Components Emissions.
The equipment and component emissions are based on the leaks detected at the compressor stations times the recommended EF for that type of equipment per Appendix 9. The purpose of this tab is to capture emissions that result from normal operations or by design.
Component Leaks:
This new category was added to the reporting templates for RY 2016. The purpose is to capture fugitive component leaks in this category. This differentiates them from emissions from components that result from normal operations or by design. No emissions were reported in this category for RY 2016.

ANALYSIS OF THE UTILITIES' JUNE 16, 2017, NATURAL GAS LEAK AND EMISSION REPORTS
53
Compressor Station Storage Tanks
These emissions are based on discrete tank pressure fluctuations due to exterior temperature fluctuations. The initial volume of gas release calculation is based on the starting and ending pressures assuming a constant temperature.
Distribution Mains and
Services Pipelines
Pipeline Leaks - Below Ground
The emissions from leaks detected in 2016 in Distribution Mains and Service pipelines are calculated assuming that the leak was emitting from the first day of the calendar year through date of repair, or the entire year if not repaired in 2016, times the recommended EF. For identified leaks carried over from prior years the emissions are calculated from the beginning of the year through repair date (if repaired in 2016) or end of year times the recommended EF. In addition, leaks occurring in un-surveyed parts of operator's service territory were estimated based on the leak occurrence rate in the surveyed portion of the territory extrapolated based on number of years in the survey cycle to come up with the number of expected leaks in the un-surveyed territory times the recommended EF. This method of estimating the emissions from leaks occurring in un-surveyed portions of the service territory is considered a reasonable way of approximating the emissions and takes into account the frequency of leak detection surveys.
Pipeline Leaks - Above Ground
See above for below ground leaks. Above ground leaks associated with MSAs are not counted in the volume or the numbers of leaks in order to prevent misleading representation of emissions as well as potential for duplication of emissions volumes.
Blowdowns and Venting
Blowdown emissions were estimated based on the calculation of the unique equipment volume corrected for pressure and temperature at the time of the release. The estimates for blowdown events in general provide a reliable emission estimate.
All damages (as defined by PHMSA)
Emissions from damages for Above Ground (AG) Non-hazardous and MSA damages are calculated based on company emission factor for above ground facilities times the number of days leaking unless an engineering estimate could be performed to measure the emissions. For AG Hazardous and Below Ground Code 1 damages, emission was estimated based on engineering calculation using pipe size, damage opening size, and duration. For Code 2 and Code 3 damages, the emission factor for Distribution pipeline leaks was used. In 2015 and 2016 all damages for DM&S above and below ground as well as MSA above ground damages are aggregated in this category.
Where an estimate was not made at the time of the event, the emission was estimated from population of similar events with respective pipe material and pipe size.
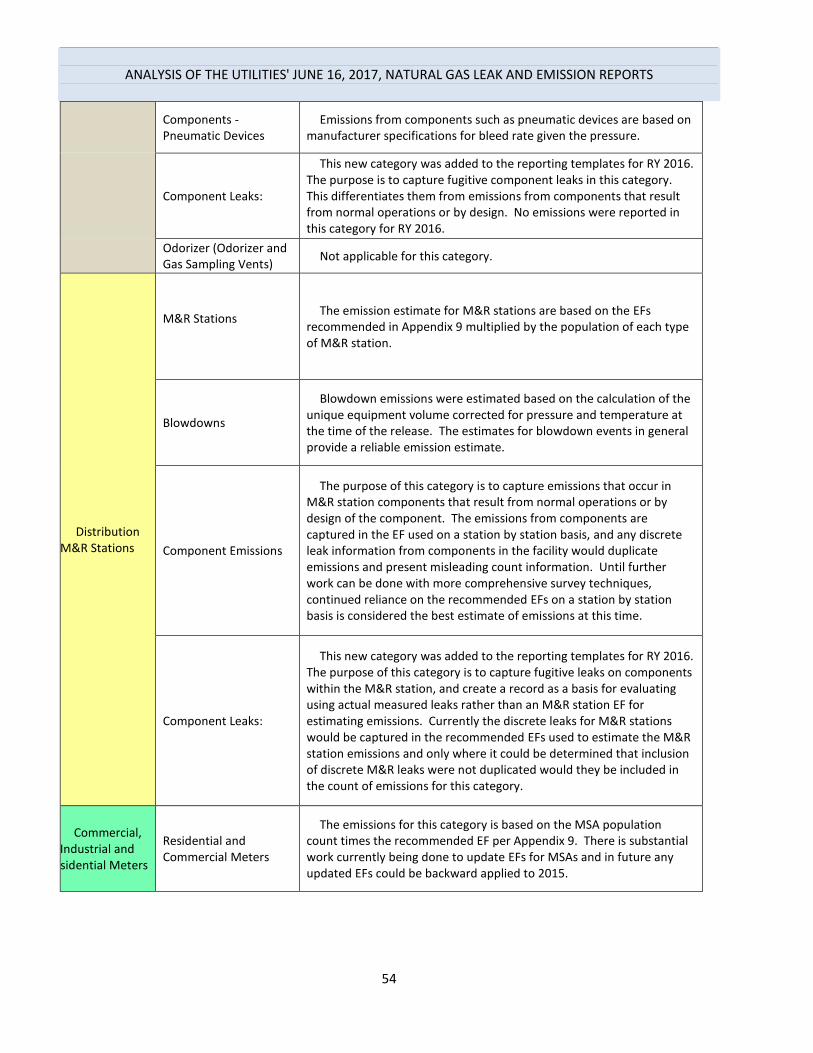
ANALYSIS OF THE UTILITIES' JUNE 16, 2017, NATURAL GAS LEAK AND EMISSION REPORTS
54
Components - Pneumatic Devices
Emissions from components such as pneumatic devices are based on manufacturer specifications for bleed rate given the pressure.
Component Leaks:
This new category was added to the reporting templates for RY 2016. The purpose is to capture fugitive component leaks in this category. This differentiates them from emissions from components that result from normal operations or by design. No emissions were reported in this category for RY 2016.
Odorizer (Odorizer and Gas Sampling Vents)
Not applicable for this category.
Distribution M&R Stations
M&R Stations
The emission estimate for M&R stations are based on the EFs recommended in Appendix 9 multiplied by the population of each type of M&R station.
Blowdowns
Blowdown emissions were estimated based on the calculation of the unique equipment volume corrected for pressure and temperature at the time of the release. The estimates for blowdown events in general provide a reliable emission estimate.
Component Emissions
The purpose of this category is to capture emissions that occur in M&R station components that result from normal operations or by design of the component. The emissions from components are captured in the EF used on a station by station basis, and any discrete leak information from components in the facility would duplicate emissions and present misleading count information. Until further work can be done with more comprehensive survey techniques, continued reliance on the recommended EFs on a station by station basis is considered the best estimate of emissions at this time.
Component Leaks:
This new category was added to the reporting templates for RY 2016. The purpose of this category is to capture fugitive leaks on components within the M&R station, and create a record as a basis for evaluating using actual measured leaks rather than an M&R station EF for estimating emissions. Currently the discrete leaks for M&R stations would be captured in the recommended EFs used to estimate the M&R station emissions and only where it could be determined that inclusion of discrete M&R leaks were not duplicated would they be included in the count of emissions for this category.
Commercial, Industrial and
Residential Meters
Residential and Commercial Meters
The emissions for this category is based on the MSA population count times the recommended EF per Appendix 9. There is substantial work currently being done to update EFs for MSAs and in future any updated EFs could be backward applied to 2015.

ANALYSIS OF THE UTILITIES' JUNE 16, 2017, NATURAL GAS LEAK AND EMISSION REPORTS
55
Actual MSA Leaks
This new category was added to the reporting templates for RY 2016. The purpose of this category is to capture fugitive leaks on MSAs, and create a record in order to form a basis for evaluating using actual measured leaks rather the number of meters in the population times an EF to estimate emissions. Currently the discrete MSA leaks would be captured in the current method using EFs time the population of meters.
All damages (as defined by PHMSA)
Emissions from damages for Above Ground (AG) Non-hazardous MSA damages should be calculated based on company emission factor for above ground facilities times the number of days leaking. For AG Hazardous damages, emission should be estimated based on based on engineering calculation using pipe size, damage opening size, and duration. The reported damages in this category were re-categorized and included with DM&S pipeline damages because not all respondents were capable of separating out their AG - MSA related damages with their AG - DM&S damages. Grouping them all together in this year's report is consistent with the grouping used in 2015. However, in the future separating the respective AG damages will help differentiate the source of damages and emissions.
Component Emissions:
This new category was added to the reporting templates for RY 2016. The purpose of this category is to capture fugitive leaks on components other than MSAs in the MSA systems to determine whether such leaks existed. In addition, if such leaks existed this could form a basis for evaluating using actual measured leaks rather than an EF for estimating emissions. No component leaks were identified or reported in 2016.
Vented Emission from MSA
Emissions from venting MSAs are based on the number of events times the estimated volume release by MSA and/or the type of activity.
Underground Storage
Facility Leaks
Emissions in this category are based on EPA GHG Subpart W data EFs multiplied by the number of units of each equipment type. Or respondents may use EFs from MRR Leaker Emission Factor Table W-4, or they may choose to use Leaker based EFs, which means that if a survey is conducted, those components found not to be leaking would be recorded with zero emissions as opposed to applying a population based EF. Just as those components found to be leaking would use a "Leaker EF" with a proscribed value.
Compressor Emissions Emissions from storage facility compressors are calculated in the
same manner as for compressors in other categories. See the description in the Compressor Station category.
Compressor Leaks:
This new category was added to the reporting templates for RY 2016. The purpose is to capture fugitive leaks in this category, and differentiate them from emissions from compressors that result from normal operations or by design. The emissions from components associated with compressor operations are based on the recommended EFs outlined in Appendix 9 of the Data Request.

ANALYSIS OF THE UTILITIES' JUNE 16, 2017, NATURAL GAS LEAK AND EMISSION REPORTS
56
Blowdown and Venting
Blowdown emissions were estimated based on the calculation of the unique equipment volume corrected for pressure and temperature at the time of the release. The estimates for blowdown events in general provide a reliable emission estimate.
Components Emissions:
Component emissions are based on the emissions that occur as a result of normal operation of the component or its design. The emissions detected during GHG leak survey pursuant to the GHG Mandatory Reporting Regulation and each component's EF times the population count. All leak and component emission estimates are based on the assumption that the leak is leaking the entire year or during its identified hours of operation.
Component Leaks:
This new category was added to the reporting templates for RY 2016. The purpose is to capture fugitive leaks in this category, and differentiate them from emissions from components that result from normal operations or by design. The emissions from components associated with transmission pipeline operations are based on the recommended EFs outlined in Appendix 9 of the Data Request.
Dehydrator Emissions
Because there are several different types and configurations of dehydrators and it was determined that the majority of respondent's dehydrators use a control device to eliminate natural gas emissions. Therefore, only those dehydrators which vent natural gas are included in this category. The dehydrator emission estimate is based on the engineering estimate, manufacturer's data, or MRR prescribed method of calculating natural gas emissions.
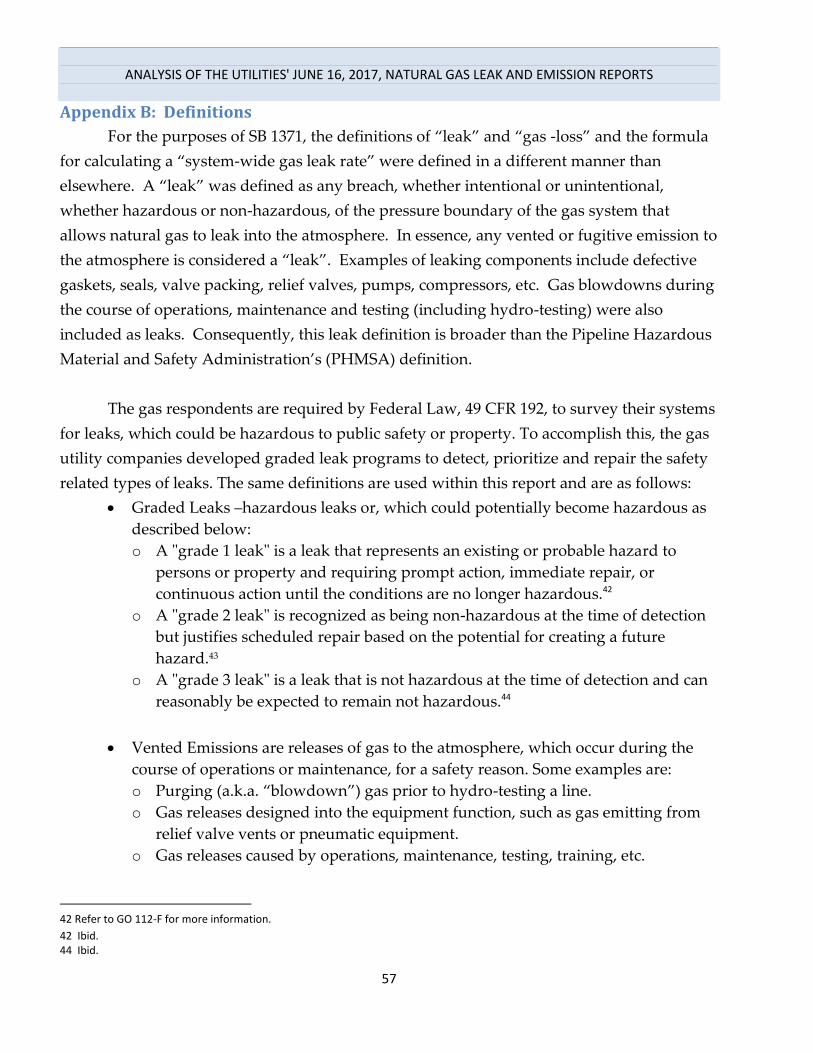
ANALYSIS OF THE UTILITIES' JUNE 16, 2017, NATURAL GAS LEAK AND EMISSION REPORTS
57
Appendix B: Definitions
For the purposes of SB 1371, the definitions of “leak” and “gas -loss” and the formula
for calculating a “system-wide gas leak rate” were defined in a different manner than
elsewhere. A “leak” was defined as any breach, whether intentional or unintentional,
whether hazardous or non-hazardous, of the pressure boundary of the gas system that
allows natural gas to leak into the atmosphere. In essence, any vented or fugitive emission to
the atmosphere is considered a “leak”. Examples of leaking components include defective
gaskets, seals, valve packing, relief valves, pumps, compressors, etc. Gas blowdowns during
the course of operations, maintenance and testing (including hydro-testing) were also
included as leaks. Consequently, this leak definition is broader than the Pipeline Hazardous
Material and Safety Administration’s (PHMSA) definition.
The gas respondents are required by Federal Law, 49 CFR 192, to survey their systems
for leaks, which could be hazardous to public safety or property. To accomplish this, the gas
utility companies developed graded leak programs to detect, prioritize and repair the safety
related types of leaks. The same definitions are used within this report and are as follows:
Graded Leaks –hazardous leaks or, which could potentially become hazardous as
described below:
o A "grade 1 leak" is a leak that represents an existing or probable hazard to
persons or property and requiring prompt action, immediate repair, or
continuous action until the conditions are no longer hazardous.42
o A "grade 2 leak" is recognized as being non-hazardous at the time of detection
but justifies scheduled repair based on the potential for creating a future
hazard.43
o A "grade 3 leak" is a leak that is not hazardous at the time of detection and can
reasonably be expected to remain not hazardous.44
Vented Emissions are releases of gas to the atmosphere, which occur during the
course of operations or maintenance, for a safety reason. Some examples are:
o Purging (a.k.a. “blowdown”) gas prior to hydro-testing a line.
o Gas releases designed into the equipment function, such as gas emitting from
relief valve vents or pneumatic equipment.
o Gas releases caused by operations, maintenance, testing, training, etc.
42 Refer to GO 112-F for more information.
42 Ibid. 44 Ibid.
ANALYSIS OF THE UTILITIES' JUNE 16, 2017, NATURAL GAS LEAK AND EMISSION REPORTS
58
o Ungraded Leaks are the remaining leaks, which are not hazardous to persons
and/or property.
For further information please see CPUC GO 112-F.
Lastly, in 2014 the system-wide gas leak rate was calculated as a percent of total input
for the 12 months ending June 30 of the reporting year. However, Staff determined that there
were problems with this calculation and opted not to report a leak rate using this formula.
The formula for calculating a system-wide gas leak was written as follows:
Pipeline Hazardous Material and Safety Administration (PHMSA) Modified
Equation for Lost and Unaccounted for (LAUF) Gas:
[(Purchased gas + produced gas + transported gas entering the gas system)
minus (customer use +company use + appropriate adjustments + gas injected into
storage + transported gas leaving the gas system)] divided by (Purchased gas +
produced gas + transported gas entering the gas system) = System Wide Gas Leak
Rate.
Note: transported gas includes gas purchased by customers and transported in
common carrier pipelines.
In section 5 of the 2015 Joint Report, “Baseline System-Wide Emissions Rate,” Staff
determined the value for 2015 to be 0.32% by using the total emissions from all source
categories (6,601.2 MMscf) divided by the Total Annual Volume of Gas Transported
(2,056,950 MMscf). The five sources for Total Annual Volume of Gas Transported are listed
on pages 50 and 51 of this report.

ANALYSIS OF THE UTILITIES' JUNE 16, 2017, NATURAL GAS LEAK AND EMISSION REPORTS
59
Appendix C: Article 3, Section 975 (c) and (e)(6)
Article 3. Section 975 (c) As soon as practicable, the commission shall require gas corporations to file a report that
includes, but is not limited to, all of the following:
(1) A summary of utility leak management practices.
(2) A list of new methane leaks in 2013 by grade.
(3) A list of open leaks that are being monitored or are scheduled to be repaired.
(4) A best estimate of gas loss due to leaks.
(e) The rules and procedures adopted pursuant to subdivision (d) shall accomplish all of the following:
(6) to the extent feasible, require the owner of each commission-regulated gas pipeline
facility that is an intrastate transmission or distribution line to calculate and report to the
commission and the State Air Resources Board a baseline system-wide leak rate, to periodically
update that system-wide leak rate calculation, and to annually report measures that will be taken in
the following year to reduce the system-wide leak rate to achieve the goals of the bill.

ANALYSIS OF THE UTILITIES' JUNE 16, 2017, NATURAL GAS LEAK AND EMISSION REPORTS
60
Appendix D: Conversion of Natural Gas to Carbon Dioxide Equivalents
The conversion of natural gas volume to carbon dioxide equivalent mass requires the
use of a GWP value. CARB used the GWP value of 25 (100-year value) from the IPCC, AR4,
for previous GHG emissions inventory. The following calculations show the conversion of
the total emissions from this report. The conversion was done in two steps. In the first step,
the calculation shows the volumetric natural gas that contains exactly one metric ton of
methane.
1 𝑀𝑇 𝐶𝐻4 ∗ 2,204.62 𝑙𝑏𝑠 𝐶𝐻4
1 𝑀𝑇 𝐶𝐻4∗
1 𝑙𝑏 𝑚𝑜𝑙𝑒
16.04246 𝑙𝑏 𝐶𝐻4∗
379.48 𝑠𝑐𝑓 𝑜𝑓 𝐶𝐻4 𝑔𝑎𝑠
1 𝑙𝑏 𝑚𝑜𝑙𝑒
∗1.0 𝑠𝑐𝑓 𝑜𝑓 𝑛𝑎𝑡𝑢𝑟𝑎𝑙 𝑔𝑎𝑠
0.934 𝑠𝑐𝑓 𝑜𝑓 𝐶𝐻4 𝑔𝑎𝑠∗
1 𝑀𝑠𝑐𝑓
1,000 𝑠𝑐𝑓= 55.835 𝑀𝑠𝑐𝑓 𝑜𝑓 𝑛𝑎𝑡𝑢𝑟𝑎𝑙 𝑔𝑎𝑠
Using this volumetric unit, the 2015 total emissions, 6,267 MMscf, is equivalent to
about 2.81 MMTCO2e, as shown below:
6,266,544 𝑀𝑠𝑐𝑓 𝑛𝑎𝑡𝑢𝑟𝑎𝑙 𝑔𝑎𝑠 ∗ 1 𝑀𝑇 𝐶𝐻4
55.835 𝑀𝑠𝑐𝑓 𝑜𝑓 𝑛𝑎𝑡𝑢𝑟𝑎𝑙 𝑔𝑎𝑠∗
25 𝐶𝑂2𝑒
1 𝐶𝐻4= 2,805,831 𝑀𝑇 𝐶𝑂2𝑒
CARB has also used the GWP value of 72 (AR4, 20-year) in the Short-Lived Climate
Pollutant Plan and Oil and Gas Regulation. Based on the higher GWP, the 2016 total
emissions, 6,267 MMscf, is about 8.08 MMTCO2e, as follows:
6,266,544 𝑀𝑠𝑐𝑓 𝑛𝑎𝑡𝑢𝑟𝑎𝑙 𝑔𝑎𝑠 ∗ 1 𝑀𝑇 𝐶𝐻4
55.835 𝑀𝑠𝑐𝑓 𝑜𝑓 𝑛𝑎𝑡𝑢𝑟𝑎𝑙 𝑔𝑎𝑠∗
72 𝐶𝑂2𝑒
1 𝐶𝐻4= 8,080,794 𝑀𝑇 𝐶𝑂2𝑒
The use of 1.0 scf of natural gas per 0.934 scf of CH4 gas accounts for composition of
natural gas being not 100% methane. The American Gas Association published a value of
93.4% to be used as a default methane concentration that is comparable to what respondents’
reported.45
The standard cubic foot “scf” for measuring gas is based on 60 degrees Fahrenheit at
atmosphere pressure.
In addition, respondents reported trace amounts of concentration for ethane, inert
gases, and other elements and compounds. There was not an entry for carbon dioxide
explicitly, and so it cannot be assumed that all of the inert gas was carbon dioxide. A 45
AGA, GHG Guidelines, page 39, April 18, 2008, http://s3.amazonaws.com/zanran_storage/www.aga.org/ContentPages/18068841.pdf

ANALYSIS OF THE UTILITIES' JUNE 16, 2017, NATURAL GAS LEAK AND EMISSION REPORTS
61
calculation was performed that showed CO2 emissions from the inert gases would be less
than 0.1% of the total, and is excluded in this report.

ANALYSIS OF THE UTILITIES' JUNE 16, 2017, NATURAL GAS LEAK AND EMISSION REPORTS
62
Appendix E: Proposed Changes to Data Request Template
The proposed template changes will be discussed in the workshop planned for the winter
2018. See Lessons Learned section of the report where the discussion of those issues may lead
to changes to the reporting templates. The following template changes are planned for the
workshop:
Appendix 4:
Add worksheet requiring miles in of pipeline in the system.
Add a new column to identify if/when a leak grade has changed up/down upon later
inspection. This information facilitates calculating average days to repair leaks by
grade.
Add a comment box in the Summary worksheet that the formula for average days to
repair leaks is “Repair Date minus Discovery Date plus one day.”
Add a comment box in the All Damages worksheet in Appendix 4. The comment box
will outline the formula for calculating the average days to repair a leak which is
defined as “Repair Date minus Discovery Date plus one day.”
Appendix 6:
Add a comment box in the All Damages worksheet in Appendix 6. The comment box
will outline the formula for calculating the average days to repair a leak which is
defined as “Repair Date minus Discovery Date plus one day.”
Change the emissions units of measure in the Vented and Emissions worksheet for the
blowdown units from “Mscf/yr.” to “Mscf/event.”
Appendix 7:
Add a column on the Dehydrator worksheet requiring a description of the
dehydrators in use at each facility and a column for their respective quantity.
Dehydrators are a discussion topic for the winter 2018 workshop.
Appendix 8:
Add a new worksheet in Appendix 8’s Summary for “Explanations for Year-Over-
Year Changes.” Respondents should include the baseline (2015), current and prior
year emissions reported by line item category. Columns calculating amount and
percent change from period to period will be included as well. These columns should
be self- explanatory and will be covered in the winter 2018 workshop. Both positive
and negative significant differences should be explained. The definition of what is
significant will be discussed at the workshop.
ANALYSIS OF THE UTILITIES' JUNE 16, 2017, NATURAL GAS LEAK AND EMISSION REPORTS
63
Correct minor formatting issues and try to clean up unnecessary references, such as
the width of worksheet headers and sizing the comment boxes to reveal content.
Update the category line items in Appendix 8 for any additional worksheet added or
changed in all the other templates. Where appropriate designate the intent of the data
whether for reporting or for informational data collection.

ANALYSIS OF THE UTILITIES' JUNE 16, 2017, NATURAL GAS LEAK AND EMISSION REPORTS
64
Appendix F: Methodology Change - Impact on PG&E’s 2015 Transmission
Blowdown Baseline
In 2016 PG&E made a significant change to its methodology for transmission pipeline
blowdown emissions, whereby it calculated all blowdown emissions rather than using 125
Mscf for pipeline blowdowns estimated to be below 250Mscf. The 125 Mscf median was also
assumed to be the mean value. Due to the empirical data provided from the 2016 blowdown
calculations the mean average for blowdown events below 250 Mscf was determined to be
47.3 Mscf.
PG&E concurred that the 47.3 Mscf mean value would likely apply to 2015
blowdowns which were based on the median of 125 Mscf. The net impact of this change in
assumption would result in a reduction of 67,444 Mscf to the 2015 transmission blowdown
emissions.
Average
Mscf/Event
Mscf/Event Median Value Used in 2015 125.0
Actual Mean Value Calculated in 2016 47.3
Overstated Emissions Per Event (Mscf) 77.7
Number of
Events
Number of 2015 Pipeline Blowdown
Events Below 250 Mscf868.0
Amount of 2015 Baseline Overstated
(Mscf)67,444
Impact on 2015 Transmission Pipeline
Blowdown Emissions (Mscf)