Embed Size (px)
Citation preview

American Journal of BioScience 2015; 3(4): 145-166
Published online July 17, 2015 (http://www.sciencepublishinggroup.com/j/ajbio)
doi: 10.11648/j.ajbio.20150304.15
ISSN: 2330-0159 (Print); ISSN: 2330-0167 (Online)
Analysis on Effect of Cold Stress in Bean Seeds (Phaseolusvulgaris l)
Vandana Srivastava, Anish Soni, Kumari Sonam
Science in Biotechnology, 4th SEM (Biotechnology), PES COLLEGE Affiliated to Bangalore University, Bangalore, India
Email address: [email protected] (V. Srivastava), [email protected] (A. Soni), [email protected] (K. Sonam)
To cite this article: Vandana Srivastava, Anish Soni, Kumari Sonam. Analysis on Effect of Cold Stress in Bean Seeds (Phaseolusvulgaris l). American Journal of
BioScience. Vol. 3, No. 4, 2015, pp. 145-166. doi: 10.11648/j.ajbio.20150304.15
Abstract: Low temperature or cold stress is one of the major abiotic stresses for bean seeds production. The objective of this
study was to analyze the effect of cold stress on Phaseolusvulgaris l seeds by doing different types of tests(germination studies,
respiration response, conductivity test, amylase and catalase test) at different temperatures like room temperature, at 3° C and
at - 19° C. Seeds were germinated in germination box. Germination percentage, rate, seed vigour and germination index was
measured. Respiration response was also analyzed. The procedure does not quantify a respiration rate, but it indicates that
respiration rate can be compared across different treatments. Observation from conductivity measurement shows that leachate
solution of -19° C gives low conductivity whereas 3° C gives moderate and at normal room temperature it was high. Low
temperature showed high amylase as well as catalase activity. Room temperature showed a good response against few
parameters but not in enzyme activity.
Keywords: Effects, Cold Stress, Temperature, Bean Seeds (Phaseolus Vulgaris l)
1. Introduction
Phaseolus vulgaris, the green bean, kidney bean, or
common bean, is an herbaceous annual plant in the Fabaceae
(legume or bean family) that originated in Central and South
America and is now cultivated in many parts of the world for
its beans, which can be harvested and eaten immature, still in
the edible pod, or when mature, shelled, and dried. Numerous
cultivars of green beans have been developed, including
string beans, stringless varieties (such as the slender French
haricot varieties), and snap beans. Cultivars of dried (or
shelling) beans from this species are even more diverse,
among them the following: black beans (or black turtle
beans); cranberry beans (tan speckled with maroon, or white
speckled with crimson); kidney beans (which may be light or
dark red, and come in various sizes); cannellini or white
kidney beans; pinto beans (the speckled varieties used in
many Latin American dishes); and various white beans (also
called navy beans).
P. vulgaris varieties have been developed to have both
bush and twining forms. The bush forms, which grow in erect
leafy clumps, reach 1 m (3.25 ft) tall, while twining forms,
which need to be supported with poles or trellising, grow up
to 4 m (13 ft) long. Plants have trifoliate compound leaves
with oval to rhombic leaflets, each up to 16 cm (9.25 in) long,
which are pubescent (covered with downy hair). The flowers,
which may be white, yellow, violet, or red, in loose, open
unbranched clusters (racemes) that are shorter than the leaves,
and develop into linear Round to slightly flattened pods upto
15 cm (6.75 in) long.
Figure 1. Phaseolus vulgaris l.

146 Vandana Srivastava et al.: Analysis on Effect of Cold Stress in Bean Seeds (Phaseolusvulgaris l)
Classification: Phaseolusvulgaris L.
Kingdom Plantae – Plants
Subkingdom Tracheobionta – Vascular plants
Superdivision Spermatophyta – Seed plants
Division Magnoliophyta – Flowering plants
Class Magnoliopsida – Dicotyledons
Subclass Rosidae
Order Fabales
Family Fabaceae – Pea family
Genus Phaseolus L. – bean
Species Phaseolusvulgaris L. – kidney bean
The U.N. Food and Agricultural Organization estimates
that total commercial production of dried beans (which
includes numerous varieties of P. vulgaris but also includes
some beans of other species, including P. lunatus, but does
not include green beans) was 23.23 million metric tons
worldwide in 2010, harvested from 29.92 million hectares.
India was the leading producer, responsible for 21% of total
production, followed by Brazil, Myanmar, China, the U.S.,
and Mexico. Within the U.S., the major dried-bean producing
states in 2007 were North Dakota, Michigan, Nebraska,
Minnesota, and Idaho (Bailey et al., 1976).
The leaf is occasionally used as a leaf vegetable, and the
straw is used for fodder. Botanically, with other species of the
bean genus (Phaseolus), it is classified into legumes family
(Fabaceae), so they acquire their nitrogen through an
association with rhizobia: species of nitrogen-fixing bacteria
(Phillips, R. and Rix, M., 1993).
Abiotic stress is stress produced by natural factors such as
temperature, cold, heat and salinity. One of the types of
abiotic stress is cold. This has a huge impact on farmers.
Cold impacts crop growers all over the world in every single
country. ROS stands for reactive oxygen species. ROS plays
a large role in mediating events through transduction. Cold
stress was shown to enhance the transcript, protein, and
activity of different ROS-scavenging enzymes. Low
temperature stress has also been shown to increase the H2O2
accumulation in cells. Plants seeds can be acclimated to low
or even freezing temperatures. If a plant seeds can go through
a mild cold spell this activates the cold-responsive genes in
the plant. Then if the temperature drops again, the genes will
have conditioned the plant to cope with the low temperature.
Even below freezing temperatures can be survived if the
proper genes are activated (Suzuki and Mittler, 2006).
Cold shock response is the physiological response of
organisms to sudden cold, especially cold water. Living
organisms encounter various stresses, change in temperature
being one of the most common. Fluctuations in temperature
have widespread effects on the growth and survival of plant,
which have therefore developed mechanisms that allow them
to adapt to these changes. The cold-shock response is one
such mechanism; it consists of a number of adaptive changes
ranging from alterations in membrane composition to
alterations in the global protein profile of the cell
(Thomashow M.F., 1998).
1.1. Study Comprised of Following Objectives
� Effect of cold stress on germination activity,
� Effect of cold stress on respiration activity,
� Conductivity measurement of seeds exposed to cold
stress,
� Amylase and catalase activity in seeds exposed to cold
stress.
1.2. Review of Literature
1.2.1. Cold Response in Seed Germination
Cold response is a highly complex process that involves
physiological and biochemical modifications. Furthermore,
alterations of the expression patterns of many genes, proteins
and metabolites in response to cold stress have been reported.
Plants require specialized mechanisms to survive exposure to
low temperature. Cold stress can be classified as chilling (0–
15 °C) and freezing (<0 °C) stresses. . Multiple primary
sensors are thought to be involved in stress sensing. Each
sensor may perceive a specific aspect of the stress and may
be involved in a distinct branch of the cold signaling pathway.
Plants may sense low temperature through changes in the
physical properties of membranes, because membrane
fluidity is reduced during cold stress. In fact, plasma
membrane rigidification raised by a membrane rigidifier,
dimethyl sulfoxide (DMSO), can induce the expression of
COR (cold-responsive) genes, even at normal growth
temperatures, whereas the application of a membrane
fluidizer, benzyl alcohol, prevents the induction of COR gene
expression at low temperatures (Kenji Miura and Tsuyoshi
Furumoto, 2013).
Plants on exposure to low temperature acquire freezing
tolerance. Freezing injury in most plants and tissues occur by
from severe cellular dehydration that occurs upon ice
formation and cellular membrane systems are a primary site
of freeze-induced injury. Cold responsive genes get activated
in response to low temperature (Michael F. Thomashow,
2001).
Studies on seed germination on different physiological
parameters like (germination rate, germination percentage,
seedvigour and germination index) are important to solve
taxonomic and phylogenetic problems, to contribute to the
knowledge of plant morphology through the ontogenesis, to
recognize species in the field. Moreover, these studies
reinforce the necessity of conservation of some species in
forest and tropical regions also (Andreataand Pereira, 1990).
Temperature and relative humidity together cause rapid
decline in seed quality during storage. The pattern of seed
longevity and storage potential of different species have been
studied by several workers both for long and medium term
under ambient and controlled storage conditions and for short
term under accelerated ageing conditions. The accelerating
ageing test, in which seed is incubated for a short period (a
few days) under low temperature conditions, was first
developed by Delouche and Baskin (1973) for predicting the
storability of seed.
Cold tolerance during seed germination was defined as the

American Journal of BioScience 2015; 3(4): 145-166 147
inverse of the ratio of germination time under cold stress to
germination time under control conditions and referred to as
germination tolerance index (Foolad, M.R andLin, G.Y.2000).
Plants on exposure to low temperature acquire freezing
tolerance. Freezing injury in most plants and tissues occur
from severe cellular dehydration that occurs upon ice
formation and cellular membrane systems are a primary site
of freeze-induced injury. Cold responsive genes get activated
in response to low temperature (Su Jung Park et al. 2013).
Seed germination and vigour are the main physiological
quality attributes. Vigour testing- is important because it
often gives a better prediction of field performance and is a
more sensitive indicator of seed quality than the standard
germination test (Makkawil et.al., 1999).
Seeds germinate in a wide range of environmental
conditions, yet the major determinant of germination is the
availability of water. Under unfavorable conditions
germination is delayed or entirely suppressed depending on
the stress intensity and the genetic background. Annual plants
inhabiting semi-arid to arid regions have developed unique
strategies including a tight regulation of germination
ensuring species survival in spite of an unpredictable regime
of precipitation (Bing Bai et.al, 2011).
Water stress affects practically every aspect of plant
growth and metabolism. Plant responses to water deficit
depend upon various factors such as duration and degree of
stress, growth stage and time of stress exposure. Due to their
sedentary mode of life, plants resort to many adaptive
strategies in response to different abiotic stresses such as
high salt, dehydration, cold and heat, which ultimately affect
the plant growth and productivity (Arun Dev Sharmaetal.,
2000).
Seedling is the most vulnerable stage in life cycle of plants
and germination determines when and where seedling growth
begins. The emergence of radical/plumule or root/shoot from
seeds is usually taken as an index of germination (%).
The duration of cold stratification has positively effective
on germination percentage and rate of the seeds. When the
duration of cold stratification increases, the germination
percentage of the seeds was increased, but the average rate of
germination was decreased (Zafer Olmez, Askin Gokturk,
2006).
Growth tests are based on the principle that vigorous seeds
grow at a faster rate than poor vigour seeds even under
favorable environments. Vigorous seeds rapidly germinate,
metabolize and establish in the field. So, any method used to
determine the rapidity of growth of the seedling will give an
indication of seed vigour level (Gupta P.C, 1984).
Seed vigour is an important quality parameter which needs
to be assessed for a seed lot in the field or in storage.
Seedvigour is " the sum total of those properties of the seed
which determine the level of activity and performance of the
seed or seed lot during germination and seedling emergence'".
Seed vigour is described as performance of seeds when sown
in the field .Seed vigour is affected by several factors like
genetic constitution, environment and nutrition of mother
plant. Maturity at harvest, seed weight and size, mechanical
integrity, deterioration and ageing and pathogens are known
to influence seed vigour.
Germination percentage and rate were determined
according to stratification time applied. Below formula was
used when determining germination rate (Pieper, 1952):
GR=(n1*t1)+(n2*t2)+(n3*t3)........(ni*ti)/T
GR: Germination rate, n: Number of days for each
counting of germinated seeds. t: number of germinated seeds
in each counting day. T: Total number of germinated seeds
(Gupta P.C, 1984).
Abiotic stresses adversely affect growth, productivity and
trigger a series of morphological, physiological, biochemical
and molecular changes in plants. Cold stress is a major
environmental factor that limits the agricultural productivity
of plants in hilly areas. Plants respond and adapt to this stress
to survive under stress conditions at the molecular and
cellular levels as well as at the physiological and biochemical
levels. However, expression of a variety of genes is induced
by different stresses in diverse plants (Gulzar S. et al., 2011).
Low temperature often affects plant growth and crop
productivity, which causes significant crop losses. Plants
differ in their tolerance to chilling (0-15 ºC) and freezing (<
0ºC) temperatures. In general, plants from temperate climatic
regions are considered to be chilling tolerant with variable
degree, and can increase their freezing tolerance by being
exposed to chilling, non-freezing temperatures, a process
known as cold acclimation, which is associated with bio-
chemical and physiological changes and ultimately showed
marked changes in gene expression, biomembrane lipid
composition, and small molecule accumulation (Gulzar S
et.al., 2011).
Low temperature affects the growth and productivity of
plant. Seedling adapt to stress environment by different
mechanism, including changes in morphological
developmental pattern as well as physiological and
biochemical process (Hong-Xing Cao, Cheng-Xu Sun, 2011).
The physical state of water in seeds during storage and its
changes during imbibition strongly influence the germination
under varying environmental condition. The binding nature
of seeds water influences its quality, germination and
emergence. Water is an important substrate in many reactions
and its effect on phospholipid structure plays an important
role in membrane stability (Nabamita Chatterjee and Shantha
Nagarajan, 2006).
Seed germination is controlled by several environmental
factors like moisture, temperature and water content. Seed
quality is a major factor which control its germination like
seed coat may be water impermeable or mature seed may
contain an underdeveloped embryo that grow to its full size
after imbibition. Seed stored in dry condition show lower
germination and slower emergence than in the wet condition.
Moisture condition is necessary for seed germination
(Takahiro Tezuka, Hisa Yokoyama, 2012).
exploring new schemes for catalasepurification (Sinha,
A.K ,1972).

148 Vandana Srivastava et al.: Analysis on Effect of Cold Stress in Bean Seeds (Phaseolusvulgaris l)
1.2.2. Respiration Response
Plants need energy to metabolize their stored sugars
through cellular respiration. Plants need energy to maintain
homeostasis, to perform certain functions like transporting
sugars, and to grow. A plant’s respiration rate is not
consistent and depends on many factors. After a seed drops
from a plant it usually goes into a resting period called
dormancy when it metabolizes stored energy reserves very
slowly (Lynn Vaccaro, 2003). Dormancy is defined as a state
during which the seed is not able to germinate. To fulfill the
high-energy needs of a germinating seedling, cellular
respiration increases as a seed emerges from dormancy and
begins germinating. However, seeds respire at a lower rate
throughout dormancy. In fact, seed suppliers measure seed
respiration using a highly sensitive method to determine if
dormant seeds are still viable and suitable for cultivation. The
timing of seed germination will strongly influence the
success of a seedling. If a seed emerges too early in the
spring it could die of frost. Wild flowers native to deciduous
forests often take advantage of the high light period before
trees put out new leaves or after trees lose their leaves; if
these seeds wait too long to germinate they could miss their
window of opportunity. As a result, seeds have evolved
complex ways of detecting that window of opportunity. For
example, many seeds can detect the quality or spectral
composition of light. Sunlight that passes through a canopy
of leaves is depleted in red light relative to the amount of far
red light (longer wavelength). Thus, the proportion of light of
different colors will trigger germination of wildflower seeds,
allowing these seeds to avoid being shaded by trees (Bewley,
J.D., and M. Black, 1985).
Some seeds have to wait for years before they are able to
germinate. During this time, seeds cannot make their own
food because they lack leaves! Therefore, in order for a seed
to stay alive or to grow it needs to use stored energy reserves
and undergo cellular respiration. The seed will use those
calories to survive during dormancy and to germinate.
When plants use sugars stored in their leaves or seeds they
undergo cellular respiration
Sugar + Oxygen à Carbon dioxide + Water + Energy (ATP)
As the seeds respire they take in oxygen and release
carbon dioxide at roughly the same rate. If left alone in a
sealed test tube, the carbon dioxide would replace any
oxygen utilized by the seeds and the air pressure would
remain relatively constant. In this experiment, any carbon
dioxide released in the test tube reacts with the calcium
hydroxide to form solid calcium carbonate, also known as
calcite or limestone. This process essentially removes all
gaseous carbon dioxide from the air space in the test tube and
converts it to a solid. As more carbon dioxide is produced,
more carbon dioxide is removed from the air and the air
pressure in the test tube declines, essentially sucking water
up into the test tube. If atmospheric pressure is higher outside
the test tube than inside the test tube, water will rise in the
test tube. Theoretically, the difference in air pressure should
equal the weight of the water that rose in the test tube. Thus,
the height of the water in the test tube is an indicator of the
amount of respiration that occurred (Lynn Vaccaro, 2003).
Amount of oxygen used by plants can be measured with a
device called respirometer (Bewley, J.D., and M. Black,
1985).
During germination, seeds use sugars and other molecules
as a substrate for respiration. Germination of a seed begins
with water uptake by the seed. This process is called
imbibition. The uptake of water by a seed is an essential step
in order for the seed to germinate. The total amount of water
taken up is about 2-3 times the weight of the seed. The extent
to which germination has progressed can be determined by
measuring water uptake or respiration (Bewley, J.D., and M.
Black, 1985).
Most seeds dry out and are in a dormant condition before
germination. In this state, their metabolism is extremely slow.
When sufficient moisture is present in the environment, seeds
absorb water and swell. This triggers enzyme activity. All
seeds store nutrients, usually starch, and the appropriate
enzymes digest it to release glucose as an energy source.
With a supply of energy, cellular respiration can occur.
1.2.3. Conductivity Test
Seed gene banks often have limited quantities of seed
available for testing; therefore, it is important to develop a
method to test a seed sample without destroying it.
Determining seed viability traditionally has involved a
standardized germination test, which is obviously destructive
to seed and labor intensive. Electro conductivity (EC)
measurements of single seed leachate solutions could lead to
the replacement of the standard germination test if the
measurements could be taken early during imbibition, which,
in turn, would lead to the development of nondestructive
testing methods for seed quality i.e., viability and vigor
determination (Matthews and Bradnock, 1968).
Electrolytes are substances that produce free ions when
they are dissolved in a suitable solvent like water. The
dissociation process take place when electric current is
passed molecules are split in to atomic components called
ions. Positively charged ions are called cations and
negatively are called anions. Due to the presence of free ions,
electrolyte solutions behave as an electrically conductive
medium (Sarka K., Kopecky, F, 1990).
A simple procedure based on the electrical conductivity of
seed leachates has recently been developed for the southern
pines. This test is based on the principle that seeds leach
numerous substances when soaked in water and that because
of membrane deterioration the amounts leached will increase
as the seeds deteriorate. Although several chemical
constituents can also be determined, the electrical
conductivity of the leachate can be measured more quickly
and easily (Bonner,F.T., 1991).
The electrical conductivity is based on the principle that
the deterioration process is the leaching of the cells of seeds
soaked in water due to loss of integrity of cellular systems.
Thus, low conductivity means a high-quality seed and high
conductivity suggest low quality seeds.The effect of

American Journal of BioScience 2015; 3(4): 145-166 149
temperature on conductivity readings depends on the solution
being measured. The effect is greatest in low ionic strength
(low conductivity) solutions. A general rule to follow is there
will be a 2% changes (increase)/degree C. (Davidson, K.G.V,
Moore, F.G. 1994).
When seeds are immersed in water for conductivity test
and kept in freeze for 24hrs the weaking of cell membrane
takes place which causes leakage of water soluble
compounds like amino acids, electrolytes and sugar. Whereas
fresh seeds have intact membrane so they leach fewer
amounts of these chemicals. The measurement of electrical
conductivity is measured by conductometer which gives the
estimation of membrane permeability (Gupta P.C.1984).
Conductivity can be used for estimation of seed quality and
viability of seeds (Bonner, F.T., 1991).This test helps to know
the physiological quality of seeds (Kennya Mara et al.,
2012).The electrical conductivity is based on the amount of
seed deterioration is proportional to the cell membrane
integrity. Leachate electro conductivity test was proposed as
a seed quality test which is rapid and simple (Davidson,
K.G.V, Moore, F.G. 1994).
1.2.4. Enzymes and Stress
Several stresses in plants alters metabolic processes which
lead to production of reactive oxygen species which is
protected by antioxidant defense system present in plants and
enzymes like catalases, amylase and peroxidases (Amjad
Hameed, Shazia Naseer et al.,2008).Reactive oxygen species
(ROS) play a significant role in plant growth, development,
and interaction with biotic and abiotic environments .ROS
have also been implicated as important regulatory and
signaling elements in a variety of cellular processes . ROS
are constantly produced during the course of photosynthesis
and respiration, whereas redox homeostasis in the cell is
tightly controlled by redundant protective mechanisms
(Vladimir Shulaev, David Oliver, 2002).
Chilling condition leads to the formation of reactive
oxygen species which cause oxidative damage to plants. This
is protected by enzymes like catalase, peroxidase which
eliminate ROS and keep a homoeostasis between production
and cleaning of ROS and thus reduces the formation of free
radicles (Ya-jing Guan, Jin Hu, 2009).
1.2.5. Amylase
Amylases hydrolyze starch and glycogen into sugars.
There are 2 types of amylases: α amylase & β amylase. α
amylase is an endohydrolase which hydrolyses the α-1→4
linkage within the chain and breaks these polymers into small
fragments. In contrast β amylase is an exohydrolase and it
starts acting from non-reducing end removing two glucose
molecules at a time. The products thus formed are a
disaccharide, β –maltose, and limit dextrin. The hydrolytic
action of β-amylase results in increasing reducing power of
the starch solution due to release of a large number of
molecules of the reducing sugar viz.maltose. The reducing
sugars can be determined quantitatively by their reaction with
dinitrosalicylic acid with absorption maxima at 570 nm.
Plants have developed a series of enzymatic and non-
enzymatic detoxification systems to counteract ROS, and
protect cells from oxidative damage. The antioxidant
enzymes such as SOD, CAT, POX, and GR function in
detoxification of super oxide and H2O2. β-amylaseexpressed
during stress has been shown to play a major role in
transitory breakdown of starch (Sawney, S.K, Randhir
Singh,1996).
Beta-amylase is a exoamylase that hydrolyzes α -
1,4glycosidic linkages of polyglucan chains at the non
reducing end to produce maltose. β- amylase is involved in
starch breakdown in plants (Fatma Kaplan and Charles L.
Guy, 2004).
Beta-amylase and alpha-amylase are involved in
degradation of endosperm starch. Starch present is
hydrolysed in to glucose by a action of a and beta-amylases,
debranching enzyme and a-glucosidases (maltase) (Tuomas
Sopanen and Christiane Lauriere, 1988).
Amylase activity is essential for providing energy and
carbon to growing embryo through respiratory breakdown of
utilizable substrates. The onset of germination or from
quiescent stage to active phase is supported by stored ATP
and breakdown of stored lipid. The providing of utilizable
substrate is mainly done by amylase until the seed become
photosyntheticallyself sufficient (Soman Nandi and Gitali
Das, 1994).
Amylases are starch degrading enzymes. The reducing
sugar produced by amylases react with dinitrosalicyclic acid
and reduce it in to a brown coloured product called nitro
aminosalicyclic acid. The nitro aminosalicyclic acid will
show the rate of maltose released by starch. Beta-amylase
hydrolyses alternate bonds from the non-reducing end of the
substrate. The enzyme degrades amylose, amylopectin or
glycogen in an exo-or stepwise fashion by hydrolysing
alternate glycosidic bonds. The end product is beta-maltose
(Peter Bernfield, 1955)
Germinating seeds show high amylase activity as amylase
mobilize stored food (starch and protein) for the survival of
young plant until it is capable of making its food by
photosynthesis(Afiukwa, C. A, Ibiam, U. A, 2009).
1.2.6. Catalase
Catalase is present in the peroxisomes of nearly all aerobic
cells and serves to protect the cell from the toxic effects of
hydrogen peroxide by catalyzing the decomposition of H2O2.
The mechanism of catalysis is not fully elucidated, but the
overall reaction is as follows: 2H2O2 —> 2H20 + O2
Catalase is an antioxidant enzyme ubiquitously present in
mammalian and non-mammalian aerobic cellscontaining a
cytochrome system. It was initially isolated from ox liver and
later from blood, bacterial, and plant sources. The enzyme
contains 4 ferrihemoprotein groups per molecule. The
enzyme has a molecular mass of 240 kDa. In eukaryotic cells
the enzyme is concentrated in the subcellular organelles
called peroxisomes (microbodies). Catalase catalyses the
decomposition of hydrogen peroxide (H2O2) to water and
oxygen. Hydrogen peroxide is formed in the eukaryotic cell
as a by-product of various oxidase and superoxide dismutase

150 Vandana Srivastava et al.: Analysis on Effect of Cold Stress in Bean Seeds (Phaseolusvulgaris l)
reactions. Hydrogen peroxide is highly deleterious to the cell
and its accumulation causes oxidation of cellular targets such
as DNA, proteins, and lipids leading to mutagenesis and cell
death.5-8 Removal of the H2O2 from the cell by catalase
provides protection against oxidative damage to the cell. It’s
role in oxidative stress related diseases has been widely
studied (Deisseroth, A., and Dounce, A.L.,1970).
Enzymes are proteins that catalyze specific reactions in
living organisms.In many cases, enzymes can be purified and
studied in vitro. Spectrophotometric enzyme assays can be
conducted qualitatively: that is, simply showing the general
procedure, the formation of a colored product, the process of
measuring absorbance, and so forth. On the other hand, a
quantitative approach would focus on careful measurements.
It can be take it to the level of exploring new schemes for
catalasepurification (Sinha, A.K ,1972).
2. Materials and Methods
2.1. Cold Stress on Germination
2.1.1. Plant Material
Seeds of bean plant (Phaseolus vulgarisl) were taken for
germination studies. Seeds were collected from Horticulture
Department of Lalbagh, Bangalore. From the seed lots, seeds
having uniform size, colour and shape with intact seed coats
were selected by hand picking. The seeds were surface
sterilized in bavistin solution for ten minutes, and rinsed
several times with distilled water. These surface sterilized
seeds were taken for germination in germination box. 30
seeds were counted and sowed in moistened towel in a
germination box. These germination boxes were well
ventilated for aeration. This type of three set up were made
for different temperature treatment.
2.1.2. Temperature Treatment
This experiment was conducted in a completely
randomized design with 3 different temperatures. Experiment
is conducted in a germination box (19cm length*12.5cm
breadth* 6.7cm height). Three germination boxes were taken
for germination studies for cold treatment of seeds.
Moistened paper towel was kept in the germination box and
surface sterilized seeds were sowed in the germination box
with cover. This type of temperature treatments were given to
bean seed lots at normal room temperature, 3°C and -19° C
for 15 days. The treated seeds in each germination boxes
were subjected to germination studies. These seeds were
constantly moistened by spraying with water.
2.1.3. Germination Studies
These germination boxes were observed for 15 days. After
one day interval seed germination were recorded. Each day
shoot length was measured and no. of germinated seeds were
also recorded. By observation germination percentage,
germination rate, germination index and seed vigour index
were calculated of each treated temperature.
Germination percentage = (no of seeds germinated /total
no of seeds taken for germination) * 100
Germination rate=(n1*t1)+(n2*t2)+(n3*t3)........(ni*ti)/T
(Pieper, 1952)
n: Number of days for each counting of germinated seeds.
t: number of germinated seeds in each counting day. T: Total
number of germinated seeds.
Seedling vigour was calculated following Abdul Baki and
Anderson (1973) -
Vigour index = (Germination % * Seedling length)
Germination index (GI) was calculated according to
Copeland and McDonald (1995) using the formulae-
Germination index = (no of germinated seeds/ days of first
count) + --------+ (no of germinated seeds / days of final
count)
2.2. Respiration
2.2.1. Seed Source
The collected seeds were stored in polyethylene jars at
room temperature for subsequent studies.
2.2.2. Experiment
Figure 2. Diagram of the protocol for measuring respiration.
In this experiment, Seeds were soaked in water for half
an hour. These seeds were taken for the experiment. A
substance called Calcium hydroxide powder (SDFCL, S D
Fine Chem. Limited) also called hydrated lime was used to
absorb CO2 in this experiment. The calcium in either
substance will react with and absorb any carbon dioxide
produced by the seeds during respiration. Calcium
hydroxide is a strong base and will cause irritation and
burns upon contact with skin. Gloves and eye protection
should be worn and contact with skin and clothing should
be avoided. Seeds were kept inmedium sized test tubes that
contain calcium hydroxide, and then the tubes were inverted
in a beaker (usually borosilicate glass) of water. The
calcium hydroxide will react with any carbon dioxide that is
produced and remove the gas from the test tube air space.
As the seeds respire, they are taking in oxygen and
respiring out carbon dioxide, but the carbon dioxide is
absorbed by the calcium hydroxide. As a result, the amount
of air in the sealed test tube actually decreased and water
raised in the test tube. In a closed vessel containing seeds
which are respiring, the concentration of oxygen will

American Journal of BioScience 2015; 3(4): 145-166 151
decrease and concentration of carbon dioxide will increase
but because of chemical calcium hydroxide powder inside
the beaker, the pressure in the beaker decreases as oxygen is
absorbed by the seeds (Roberts, M.B.V.1987) This provides
a visible indication that respiration is actually occurring.
The set up is like in this manner:-
Like wise there is one more set is done as Control in
which test tube contain all the contents as same in previous
but there is no seed in it. The decrease in level of water in
each beaker at different exposed temperature(normal room
temperature , 3° C and -19° C was measured everyday till
one week( refer table no 5 and graph no 6).
2.2.3. The Reaction
As the seeds respire they take in oxygen and release
carbon dioxide at roughly the same rate. If left alone in a
sealed test tube, the carbon dioxide would replace any
oxygen utilized by the seeds and the air pressure would
remain relatively constant. In this experiment, any carbon
dioxide released in the test tube reacts with the calcium
hydroxide to form solid calcium carbonate, also known as
calcite or limestone. This process essentially removes all
gaseous carbon dioxide from the air space in the test tube and
converts it to a solid. As more carbon dioxide is produced,
more carbon dioxide is removed from the air and the air
pressure in the test tube declines, essentially sucking water
up into the test tube. If atmospheric pressure is higher outside
the test tube than inside the test tube, water will rise in the
test tube. Theoretically, the difference in air pressure should
equal the weight of the water that rise in the test tube (P1- P2=
weight of water). Thus, the height of the water in the test tube
is an indicator of the amount of respiration that occurred. It is
theoretically possible to calculate a respiration rate from the
change in the volume of air in the test tube, but changes in
humidity and barometric pressure could complicate the
calculations (Lynn Vaccaro,2003).
2.3. Conductivity
2.3.1. Seed Collection
The collected seeds were stored in polyethylene jars at
room temperature for subsequent studies.
2.3.2. Conductivity Test
The development of tests to evaluate the physiological
quality of seeds, as well as the standardization of these is
essential for the establishment of an efficient quality control.
The measurement of electrical conductivity through the
electrolyte amount released by soaking seeds in water has
been applied by the individual method where each seed is a
sample or more often, a sample of seed representative of a
population (mass method). For this case, the results represent
the average conductivity of a group of seeds, may a small
amount of dead seeds affect the conductivity of a batch with
many high-quality seed generating a read underestimated.
To minimize this problem, seeds were chosen, excluding
the damaged seeds. 25 seeds were tested for each temperature
treatment. Seeds were placed into containers holding 5 ml of
distilled water and left to soak for 24 hours. After 24 hours
leachate solution was used to check the conductivity of seed
sample.
2.3.3. Conductivity Procedure
Conductometer was plugged on. 50 ml beaker was filled
with a solution of KCl- 0.1 N KCl (MERCK) standard
solution: 0.74gm of KCl powder was mixed in 100 ml of
distilled water. Conductometric container was dipped into the
beaker such that all three platinum fillets are immersed in the
solution. The ‘scale selector’ knob be brought to 200
millimhos position (maximum).The ‘Read/Cal’ knob be
brought to ‘Cal’, & The ‘Cal’ be operated to display 100 in
the display panel.Now,The cell be dipped in N/10 KCl
(specific conductivity of N/10 KCl at present temperature)
The ‘scale selector’ knob be brought to 20 millimhos position
& ‘Read-Cal’ knob be brought to 0.95 position. After that the
‘scale selector’ knob be brought to ‘Read’ position.The meter
is supposed to display a value which is little less than
14.12.The ‘cell constant’ knob be adjusted, so that, the meter
reads according to present temperature. Value of conductance
was read andconductometric container was taken off the
solution. KCl solution was poured back to the storage bottle.
Conductometric container was carefully rinsed and dried.
The ‘Read/Cal’ knob be brought to ‘cal’ position. Then cell
be rinsed with distilled water.
Conductance of distilled water was measured to ensure
that the beaker and conductometric container are clean. The
conductance has to be less then 10 S and it w as found to be
0.5 µS. Next the cell was dipped in sample water. The Read
/Cal knob be brought to Read position and The scale selector
knob be rotated anticlockwise from 200 millimhos
position(highest value)gradually stage by stage to the 20
micromhos mark(lowest value),till the meter displays 1.0.
Now, the ‘scale selector’knob be rotated clockwise stage by
stage and to be stopped at that point where we get the highest
value. Conductivity of the leachate solution (unknown
solution) of seeds which kept at different temperatures after
soaking of 24 hours as well as leachate solution of
germinating seeds of 6 days was measured ( table no 6 ,7and
graph no 7).
2.4. Amylase
2.4.1. Plant Material and Other Materials Used
Seeds were surface sterilized and kept for germination at
different temperature of -19 0C, 3
0C and at room temperature
for period of 2 to 3 days. Then on 8th
day seeds cover was
removed and they were weighed on weighing balance
separately. They were used for estimating amylase activity.
Boiling water bath, centrifuge, test tubes, measuring cylinder,
pipette, test tube stand, colorimeter etc were needed for
performing experimental procedure.
2.4.2. Preparation of Reagents
Different reagents were prepared for standard maltose
curve and amylase extraction and assay. Dinitrosalicylic acid
(SDFCL) was prepared by dissolving 1gram of DNS, 200mg

152 Vandana Srivastava et al.: Analysis on Effect of Cold Stress in Bean Seeds (Phaseolusvulgaris l)
crystalline phenol and 50mg sodium sulphite in 100 ml 0f 1%
NaOH was kept in reagent bottle. Sodium potassium tartarate
(MERCK 40%) was prepared by taking 40 gram of sodium
potassium tartarate and dissolving it in small amount of water
and making the final volume upto 100 ml with water and was
kept aside in a reagent bottle. The starch solution (SDFCL-
1%) was prepared as follows: 1 gm of starch was weighed
and 100 ml of boiling water was added to it.It was boiled for
2-3 minutes then it was cooled and filtered. Filtrate was used
as a substrate solution and transferred to a reagent bottle.
Sodium phosphate buffer (0.05M, pH 7) and 0.5M Sodium
chloride (SRL) were prepared for amylase extraction and
assay. Stock standard solution (SQ, QUALIGENS fine
chemicals,0.01%): was prepared by dissolving 180mg of
maltose in 100 ml of distilled water for standard maltose
curve.
2.4.3. Standard Maltose Curve
Firstly standard maltose curve was prepared before
performing amylase assay.For β-amylase test, standard
maltose curve was prepared. Six clean test tubes were taken
and labeled from T1 to T5.One test tube served as Blank.
Firstly maltose was added in increasing order like 0.2, 0.4,
0.6, 0.8 and 1.0 ml in each test tube and volume was made
up to 2ml by adding distilled water only. The blank was
prepared by adding 2ml of distilled water only. After that
1ml of DNS reagent was added to all the six test tubes and
mixed well. All the test tubes were covered with aluminum
foil and kept in boiling water bath for 5 minutes. Now test
tubes were removed and allowed to cool. Absorbance was
measured at 540 nm using colorimeter and this reading was
proportional to the amount of maltose present (table no. 8).
2.4.4. Extraction of Seed Amylase
Amylase was extracted from 5gm of germinated seeds kept
at different temperature. Extraction of the Enzyme is done in
cold at 0-4 0 C. 500 mg of washed germinating seeds in a
chilled pestle and mortar was macerated with 5ml of 0.05M
phosphate buffer (pH 7.0) containing 0.5M NaCl.
Homogenate was centrifuged at 10,000 rpm for 15 min in a
refrigerated centrifuge at 4 0C. Then supernatant was
decanted and used as the enzyme preparation (S.K.Sawney,
Randhir Singh, 1996).
2.4.5. Enzyme Assay
The two test tubes were taken control and experiment; 1ml
of starch and 1ml of enzyme is pipetted in to them
respectively. In one of the test tubes, the reaction was
terminated immediately by adding 2ml of DNS
(dinitrosalicyclic acid) reagent. The other test tubes were
incubated at 370C for 15 minutes and then 1ml of sodium
potassium tartrate was added to each of the test tubes. Then
both tubes were cooled under running tap water and volume
was made up to 10ml with distilled water. Colorimeter was
set to zero absorbance at 570 nm and absorbance was
recorded of the test. This amylase test was repeated on 6th
day (refer table number 9 and 10).
2.5. Catalase
2.5.1. Preparation of the Reagents
50 ml of a 5% aqueous solution of potassium dichromate
in distilled water was prepared.150 ml of glacial acetic acid
was slowly added to this. The resulting solution in a 250 ml
reagent bottle was placed and set aside. The prepared liquid
was toxic and corrosive.0.2M solution of hydrogen
peroxide was prepared. It was given in the bottle that
1M=34.01g/L so, 2M=68.02g/L, therefore 0.2M=6.80g/L.
So in 100 ml of water 0.6802gm was added. It was given 30%
of H2O2 in 100 ml,so it was 30gm in 100 ml. Therefore
2.2673ml of H2O2 in 100 ml of distilled water was added
and used in the experiment.About 250 ml of
0.01Mphosphate buffer, pH 7.0 was prepared. Enzymes are
generally the most stable in a solution. The standard curve
using 6 different test tubes containing increasing amounts
of H2O2 (39.98 to 202.29micromoles) were taken. To each
of these 2 mL of the dichromate / acetic acidreagent was
added. When a blue precipitate forms in each, each test tube
was heated for 10 minutes in a boiling water bath to
decomposethe blue precipitate. This will leave a green
solution of chromic acetate. They were cooled to room temp
and in each tube enough distilled water was added to make
the volume up to 3 ml.3 mL contents of first test tubes were
transferred to a clean cuvette and the absorbance was
measured at 570 nanometers in the colorimeter. This
process was repeated for the remaining five tubes, using a
cleaned cuvette each time.Using the data obtained, graph of
absorbance at 570 nm (y-axis) versus micromoles of H2O2
in the cuvette (x-axis) was plotted. A straight line was
obtained as standard curve (refer table no 12).
2.5.2. Catalase Preparation
Before catalase preparation reagents should be prepared
and standard curve should be done. Otherwise enzymes,
once freed from their native environment, tend to lose their
activity. Enzyme was extracted from the seeds, using a
buffer at physiological pH and cold. 5 gram of seeds was
weighed from normal room temperature, 3° C and -19° C.
These seeds exposed to different temperatures were grinded
in the mortar and pestle using chilled 0.01 M phosphate
buffer. Grinded seed extracts were transferred in the
centrifuge tube and were centrifuged at 10,000 rpm for 15
minutes at 24° C in a centrifuge rotor. The supernatant of
each tube were transferred to fresh test tubes and were
diluted.
2.5.3. Enzyme Dilution
This is necessary to get the enzyme concentration within a
range that can be measured properly by the method. Too
much enzyme will act so rapidly that there won't be enough
H2O2 left to detect with the colorimetric assay. The
supernatant were diluted to 10X buffer.
2.5.4. The Enzyme Assay
Graph of absorbance at 570 nm vs. micromoles of H2O2
was already made by that aliquots of enzyme preparation to

American Journal of BioScience 2015; 3(4): 145-166 153
test how much H2O2 the enzyme destroys in various time
intervals were used. When proper dilution for the enzyme
was found, then following procedures were followed-
Reaction mixture was prepared by adding 4 ml of a 0.2 M
solution in a flask in which 5 ml of phosphate buffer was
added.1 ml of diluted enzyme preparation was added. 1.0
ml of this reaction mixture was withdrawn and injected it
into 2.0 ml of Dichromate / acetic acid reagent. The goal
here is to halt the enzymatic reaction completely. Using
different test tubes, this procedure was repeated at 60
second intervals. Each test tube was heated for 10 minutes
in a boiling water bath to decompose the blue precipitate
and produce a green solution. The absorbance was
measured at 570 nanometers in the colorimeter. Using the
"standard curve", how much H2O2 was left in the solution
was determined when the enzyme was stopped with acetic
acid. This procedure was performed on seeds with two days
of exposure of cold temperature and on five days of
exposure of cold temperature (Sinha, A.K ,1972)(refer table
no 13 and 14).
3. Result and Discussion
3.1. Cold Stress on Germination
3.1.1. Germination Percentage
The highest no of germinated seeds was found at normal
room temperature. The germination percentage was highest
in normal room temperature , at 3° C temperature it was
moderate and at -19° C temperature due to extreme chilling
condition there was no growth hence no germination
percentage followed by table no 1 , graph no 1.
Table 1. showing germination percentage at normal temperature, 3°C and -
19° C.
Date Germination percentage
At normal room temperature (not
exposed to cold stress) AT 3° C AT -19° C
Day 1 20 _ _
Day 3 60 10 _
Day 5 76.6 16.6 _
Day 7 83.3 33.3 _
Day 10 93.3 46.6 _
Day 12 96.33 80 _
Day 15 96.33 86.6 _
Graph 1. showing germination percentage at normal temperature, 3°C and -19° C.
3.1.2. Germination Rate
The highest no of germinated seeds was found at normal
room temperature. The germination rate was highest in
normal room temperature, at 3° C temperature it was
moderate and at -19° C temperature due to extreme chilling
condition there was no growth hence no germination rate
followed by table no 2, graph no 2.
Table 2. showing germination rate at normal temperature, 3°C and -19° C.
At normal room temperature AT 3° C AT -19° C
48.72 32.92 _

154 Vandana Srivastava et al.: Analysis on Effect of Cold Stress in Bean Seeds (Phaseolusvulgaris l)
Graph 2. Showing germination rate at normal temperature, 3°C and -19° C
3.1.3. Seed Vigour
The highest no of germinated seeds was found at normal
room temperature. The vigour index was highest in normal
room temperature , at 3° C temperature it was moderate and
at -19° C temperature due to extreme chilling condition there
was no growth hence no seed vigour index followed by table
no 3, graph no 3 and 4.
Table 3. showing seed vigour index at normal temperature, 3°C and -19° C.
Germination Percentage(a) Shoot Length(b) in mm Seed Vigour Index (a*b)
Day 1
At Normal Room temperature 20 10.16 203.2
At 3° C - - -
At -19° C - - -
Day 3
At Normal Room temperature 60 25.4 1524
At 3° C 10 3.33 33.3
At -19° C - - -
Day 5
At Normal Room temperature 76.6 28.3 2167.78
At 3° C 16.6 4.8 79.68
At -19° C - - -
Day 7
At Normal Room temperature 83.3 32.3 2690.59
At 3° C 33.3 6.5 216.45
At -19° C - - -
Day 10
At Normal Room temperature 93.3 38.21 3564.99
At 3° C 46.6 7.7 358.82
At -19° C - - -
Day 12
At Normal Room temperature 96.66 40.2 3885.732
At 3° C 80 11.7 936
At -19° C - - -
Day 15
At Normal Room temperature 96.66 40.5 3914.73
At 3° C 93.3 29.5 2752.35
At -19° C - - -

American Journal of BioScience 2015; 3(4): 145-166 155
Graph 3. showing shoot length (mm) at normal temperature, 3°C and -19° C.
Graph 4. showing seed vigour index at normal temperature, 3°C and -19° C.
3.1.4. Germination Index
The highest no of germinated seeds was found at normal
room temperature. The germination index was highest in
normal room temperature, at 3° C temperature it was
moderate and at -19° C treated temperature due to extreme
chilling condition there was no growth hence no germination
index followed by table no 4 and graph no 5.
Table 4. showing germination index at normal temperature, 3°C and -19° C
At Normal Room Temperature(Not Exposed to Cold) At 3° C At -19° C
77.31 08.56 _

156 Vandana Srivastava et al.: Analysis on Effect of Cold Stress in Bean Seeds (Phaseolusvulgaris l)
Graph 5. showing germination index at normal temperature, 3°C and -19° C.
3.1.5. Discussion
Cold acclimation is a universal phenomenon in chilling-
tolerant plants. Bean seeds were kept to survive at a lower
temperature of 3° C and -19° C. Overviewing these results,
chilling-sensitive plants was achieved by exposure to around
or above the threshold temperature that caused chilling injury
for several days. However, whether chilling acclimation can
be achieved by exposure to under the threshold chilling
temperature, even as low as 3° C, which was generally
known as the temperature of severe chilling injury, hasn’t
been documented. In the present study, we found that cold-
shock at 3° C and -19° C for several days could significantly
induce chilling tolerance of seedlings and investigated the
changes of antioxidant enzyme activities after the cold-shock
and chilling stress (Li et al .,2011).
Figures: The figures shown below are showing the
germination of the Bean Seeds (Phaseolusvulgaris l) on
different days at different temperatures i.e., normal
temperature, 3°C and at -19°C
Figure 3. At Normaltemp. On day 1.
Figure 4. At 3°C On day 1.
Figure 5. At -19° C on day 1.
Figure 6. Atnormaltemp.On 3rd day.

American Journal of BioScience 2015; 3(4): 145-166 157
Figure 7. At 3°C on 3rd day.
Figure 8. At normal temp. On 5th day.
Figure 9. At 3°C on 5th day.
Figure 10. Atnormal temp. On 7th day.
Figure 11. At 3°C On 7th day.
Figure 12. At normal temp.On 10th day.
Figure 13. At 3° C On 10th day.
Figure 14. At normal temp.On 12th day.
Figure 15. At 3°C On 12th day.
Figure 16. At normal temp.On 15th day .
158 Vandana Srivastava et al.:
Figure 17. At 3°C On 15th day.
Table 5. showing the water level in beaker at normal tempera
Water level in beaker at normal room temp
1st day 5
2nd day 4.6
3rd day 3.8
4th day 3.4
5th day 3
6th day 2.7
7th day 2.4
Graph 6. Showing
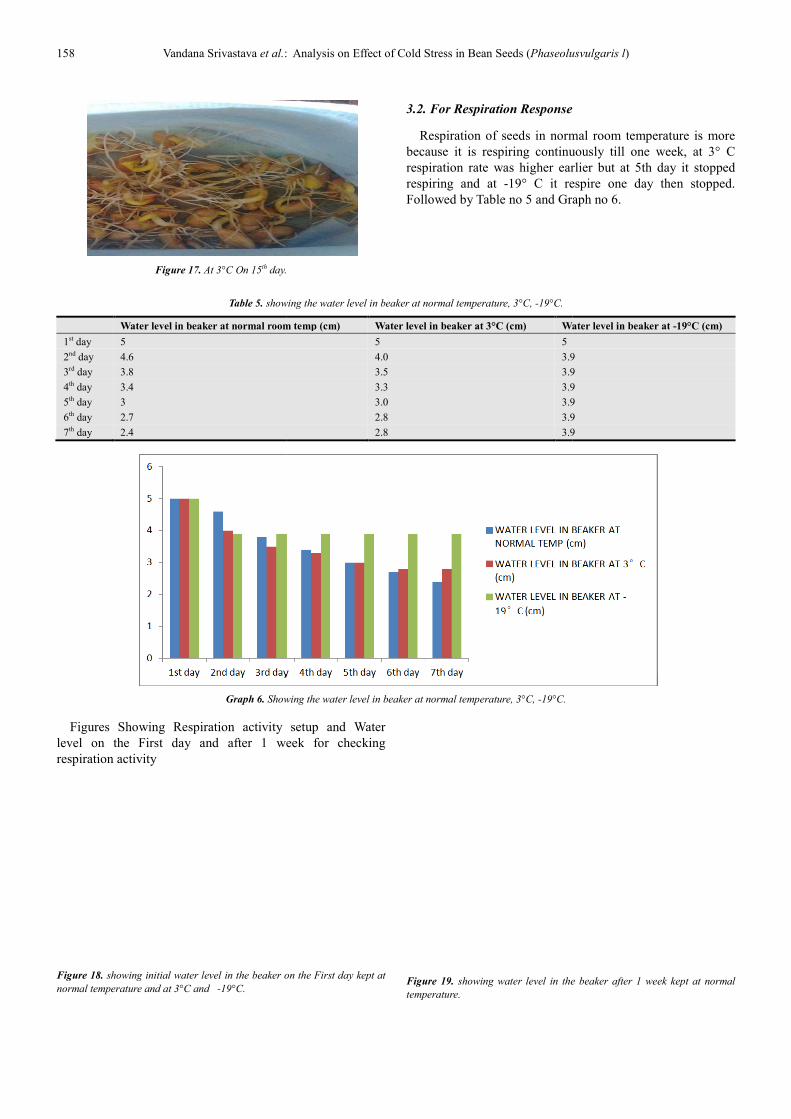
Figures Showing Respiration activity setup and Water
level on the First day and after 1 week
respiration activity
Figure 18. showing initial water level in the beaker on the First day
normal temperature and at 3°C and -19°C.
: Analysis on Effect of Cold Stress in Bean Seeds (Phaseolusvulgaris l
.
3.2. For Respiration Response
Respiration of seeds in normal room temperature is more
because it is respiring continuously till one week, at
respiration rate was higher earlier but at 5th day it stopped
respiring and at -19° C it respire one day then stopped.
Followed by Table no 5 and Graph no 6.
showing the water level in beaker at normal temperature, 3°C, -19°C.
Water level in beaker at normal room temp (cm) Water level in beaker at 3°C (cm) Water level in beaker at
5 5
4.0 3.9
3.5 3.9
3.3 3.9
3.0 3.9
2.8 3.9
2.8 3.9
Showing the water level in beaker at normal temperature, 3°C, -19°C.
Showing Respiration activity setup and Water
First day and after 1 week for checking
on the First day kept at Figure 19. showing water level in the beaker after 1 week kept at normal
temperature.
Phaseolusvulgaris l)
Respiration of seeds in normal room temperature is more
because it is respiring continuously till one week, at 3° C
respiration rate was higher earlier but at 5th day it stopped
19° C it respire one day then stopped.
Followed by Table no 5 and Graph no 6.
Water level in beaker at -19°C (cm)
3.9
3.9
3.9
3.9
3.9
3.9
in the beaker after 1 week kept at normal

American Journal of BioScience 2015;
Figure 20. Showing water level in the beaker after 1 week kept at
Figure 21. Showing water level in the beaker after 1 week kept at
3.2.1. Discussion
Parallel observations have been made on changes in
respiration rate of Phaseolus vulgaris L at room temperature,
3° C and - 19º C . While oxygen rises to a peak between the
third and fifth days in set up of room and 3º c. Respiration
American Journal of BioScience 2015; 3(4): 145-166
after 1 week kept at 3°C
after 1 week kept at -19°C.
Parallel observations have been made on changes in
at room temperature,
19º C . While oxygen rises to a peak between the
third and fifth days in set up of room and 3º c. Respiration
activity falls or stop from 24 hours onwards in
expression of respiration patterns of the three set of
respiration activity of bean under room temperature, were
different from those under 3°C and
most stress-tolerant form of higher plants, and, accordingly,
they were found to harbor extremely resistant to temperature
extremes. Because respiration is the dr
germination, a high level of mitochondrial stress tolerance
certainly contributes to the vigor of germinating seeds in the
environment. The respiration response under chilling
temperature might be an important factor contributing to
chilling susceptibility of bean seeds.
plant cells are also affected by temperature and there is a
linear increase in O2 uptake with temperature. In addit
short term responses, species grown at low temperatures
often show higher rates of respiration than species grown at
higher temperatures when measured at the same
temperature .This stimulation of respiration was reported as
adaptive behavior of seeds grown at cold conditions
compared with related species from warmer conditions
increased rate of respiration at low temperatures in
mitochondria involves two energy dissipating systems,
Alternative Oxidase (AOX) pathway and Plant Uncoupling
Mitochondrial Protein (PUMP). This stimulation of
respiration causes a decrease in the yi
which is linked to an increase in heat dissipation. These
systems are also involved inremoval of Reactive Oxygen
Species (ROS), because theydo not generate a proton
electrochemical gradient (Maryam Madadkar
3.3. Conductivity
The electrical conductivity can be used as an indicator of
seed viability and presents two
and reliable results and the technique is not destructive and
can use the seeds after the conductivity test, so they can be
used to produce seedlings. The present study showed that
different soaking times had no effect on the results of
conductivity testing of freshly collected
seeds, suggesting that the amount of leach
never below the threshold required for adequate testing. It
was observed that conductivity was more at normal
temperature and lesser in cold stress. But compared to 2
day conductivity decreased on 7
testing proved to be a feasible option for viability testing of
Phaseolus vulgaris L. seeds.Followed by table no
Table 6. showing the weight of soaked seeds and temperature of leachate
solution at normal temperature, 3°C, -19°C
At normal
temperature
On 2nd day
Weight of soaked seeds (g) 20.18
Temp of leachate solution 34.7° c
On 7th day
Weight of soaked seeds (g) 21.2
Temp of leachate solution 35°C
159
activity falls or stop from 24 hours onwards in - 19º C. The
expression of respiration patterns of the three set of
of bean under room temperature, were
different from those under 3°C and -19° C. Seeds are the
tolerant form of higher plants, and, accordingly,
they were found to harbor extremely resistant to temperature
extremes. Because respiration is the driving force that powers
germination, a high level of mitochondrial stress tolerance
certainly contributes to the vigor of germinating seeds in the
environment. The respiration response under chilling
temperature might be an important factor contributing to
chilling susceptibility of bean seeds. Respiration rates of
plant cells are also affected by temperature and there is a
uptake with temperature. In addition to
short term responses, species grown at low temperatures
rates of respiration than species grown at
higher temperatures when measured at the same
mulation of respiration was reported as
adaptive behavior of seeds grown at cold conditions
compared with related species from warmer conditions .The
increased rate of respiration at low temperatures in
mitochondria involves two energy dissipating systems,
Alternative Oxidase (AOX) pathway and Plant Uncoupling
Mitochondrial Protein (PUMP). This stimulation of
respiration causes a decrease in the yield of ATP synthase
which is linked to an increase in heat dissipation. These
systems are also involved inremoval of Reactive Oxygen
Species (ROS), because theydo not generate a proton
Maryam Madadkar.,2007).
The electrical conductivity can be used as an indicator of
seed viability and presents two advantages: to provide rapid
and reliable results and the technique is not destructive and
the conductivity test, so they can be
used to produce seedlings. The present study showed that
different soaking times had no effect on the results of
conductivity testing of freshly collected Phaseolus vulgaris L
seeds, suggesting that the amount of leached matter was
never below the threshold required for adequate testing. It
was observed that conductivity was more at normal
temperature and lesser in cold stress. But compared to 2nd
day conductivity decreased on 7th day. Electrical conductivity
oved to be a feasible option for viability testing of
. seeds.Followed by table no
showing the weight of soaked seeds and temperature of leachate
19°C.
At normal
temperature At 3° C At -19° C
20.91 21
34.7° c 10°C 0°C
21.45 21.56
4°C 0° C

160 Vandana Srivastava et al.: Analysis on Effect of Cold Stress in Bean Seeds (Phaseolusvulgaris l)
Table 7. showing the conductivity of seeds at normal temperature, 3°c, -19°c.
Conductivity at
Normal
Temperature °C
(µsiemens)
Conductivity
at 3° C
(µsiemens)
Conductivity at
-19°C
(µsiemens)
Day 2 136 58 30
Day 7 96 59 54
Graph 7. showing the conductivity of seeds at normal temperature, 3°C, -
19°C.
3.3.1. Discussion
Based on conductivity result, different soaking times
were not associated with any significant differences in
conductivity results in Phaseolus vulgaris l seeds. As seeds
lose vigor, nutrients exude from their membranes, and so
low quality seeds leak electrolytes such as amino acids,
organic acids while high quality seeds contains their
nutrients within well structured membranes. Therefore,
seeds with higher conductivity measurement are indication
of low quality seeds as vice versa. Concerning the cold test,
most seed lots presented standard values. Beans seed lots
that present EC test values between 60 and 70 µS cm–1
g–1
are considered high vigor seed lots; values between 70 and
80 µS cm–1
g–1
are presented by intermediary vigor seed
lots. On the other hand, in the United States of America,
seeds with EC values higher than 150 µS cm–1
g–1
are
classified as low vigor seed lots and considered inadequate
for sowing (AOSA, 1983). One of the causes for the high
EC values obtained for some seed lots is, probably, the low
initial seed water content, as already reported by Loeffer et
al. (1998), Hampton et al. (1992) and Vieira et al. (2002).
These authors observed that beans seeds having initial
water contents lower than 10% usually presented higher
values for the EC test, in spite of having similar standard
germination and vigor evaluated by the accelerated aging
test. This has been attributed to the fact that, the lower the
seed moisture content, the higher the structural
disorganization of cellular membranes, and the higher the
loss of leachates during the initial period of seed soaking
and, consequently, the higher the value of EC of the seed
soaking solution, which does not mean, however, a
necessarily lower seed vigor (Bewley& Black, 1994). The
effect of the initial seed water content is very difficult to be
isolated and characterized, and may interact with other
factors affecting EC.
3.4. Amylase
Table 8. maltose standard curve
Table 8. standard maltose curve.
Sl no. Std.maltose solution (ml) Amount of maltose (µmoles) DW(ml) DNS(ml)
Mix and place all
tubes in boiling
water bath for 10
mins and then
cool at room
temp
DW(ml) OD at 540 nm
Blank 0.0 0 1 1 6 0.0
T1 0.2 1 0.8 1 6 0.05
T2 0.4 2 0.6 1 6 0.15
T3 0.6 3 0.4 1 6 0.19
T4 0.8 4 0.2 1 6 0.30
T5 1.0 5 0.0 1 6 0.40
Observation Table 9
On 2nd
day assay
Table 9. showing amylase enzyme assay on 2ndday for measuring activity of amylase enzyme in bean seeds at normal temperature, 3°C and -19°C.
Sl.no. Enzyme
extract(ml)
Starch
solution(ml)
Test tube
containing
test is
incubate at
37°C for
15 mins
DNS(ml) Kept in
boiling
water
bath for 5
mins
Na-K
tartarate
solution(ml)
Cool the
tubes in
running
tap water
and make
volume
upto 10 ml
with DW
OD at 570
nm of
normal
temp
OD at 570
nm of 3°C
OD at 570
nm of -
19°C
test 1 - 2 1 0.09 0.12 0.20
blank - 1 2 1 0.0 0.0 0.0
Observation Table 10
On 6th
day assay

American Journal of BioScience 2015; 3(4): 145-166 161
Table 10. showing amylase enzyme assay on 6th day for measuring activity of amylase enzyme in bean seeds at normal temperature, 3°C and -19°C.
Enzyme
extract(ml)
Starch
solution(ml)
Test tube
containing
test is
incubate at
37°C for
15 mins
DNS(ml) Kept in
boiling
water
bath for
5 mins
Na-K
tartarate
solution(ml)
Cool the
tubes in
running
tap water
and make
volume
upto 10 ml
with DW
OD at 570
nm of
normal
temp
OD at 570
nm of 3°C
OD at 570
nm of -
19°C
test 1 - 2 1 0.03 0.05 0.06
blank - 1 2 1 0.0 0.0 0.0
On 2nd
day
From maltose curve 0.09 OD at normal temperature on 2nd
day corresponds to 1.2 µmoles/ml of maltose
Dilution factor = 10x
Incubation time = 15 mins
Volume of enzyme taken for assay = 1 ml
Activity of enzyme = (µmoles of maltose*dilution
factor)/weight of enzyme per gram * incubation time =
1.2*10/1*15 = 0.8 µmoles/ml/min
From maltose curve 0.12 OD at 3° C on 2nd
day
corresponds to 1.45 µmoles/ml of maltose
Dilution factor = 10x
Incubation time = 15 mins
Volume of enzyme taken for assay = 1 ml
Activity of enzyme = (µmoles of maltose*dilution
factor)/weight of enzyme per gram * incubation time =
1.45*10/1*15 = 0.966 µmoles/ml/min
From maltose curve 0.20 OD at -19° C on 2nd
day
corresponds to 2.65 µmoles/ml of maltose
Dilution factor = 10x
Incubation time = 15 mins
Volume of enzyme taken for assay = 1 ml
Activity of enzyme = (µmoles of maltose*dilution
factor)/weight of enzyme per gram * incubation time =
2.65*10/1*15 = 1.766 µmoles/ml/min
On 6th
day
From maltose curve 0.03 OD at normal temperature on 6th
day corresponds to 0.4 µmoles/ml of maltose
Dilution factor = 10x
Incubation time = 15 mins
Volume of enzyme taken for assay = 1 ml
Activity of enzyme = (µmoles of maltose*dilution
factor)/weight of enzyme per gram * incubation time =
0.4*10/1*15 = 0.266 µmoles/gwt/min
From maltose curve 0.05 OD at 3°C on 6th
day
corresponds to 0.65 µmoles/ml of maltose
Dilution factor = 10x
Incubation time = 15 mins
Volume of enzyme taken for assay = 1 ml
Activity of enzyme = (µmoles of maltose*dilution
factor)/weight of enzyme per gram * incubation time =
0.65*10/1*15 = 0.433 µmoles/ml/min
From maltose curve 0.06 OD at -19° C on 6th
day
corresponds to 0.8 µmoles/ml of maltose
Dilution factor = 10x
Incubation time = 15 mins
Volume of enzyme taken for assay = 1ml
Activity of enzyme = (µmoles of maltose*dilution
factor)/weight of enzyme per gram * incubation time =
0.8*10/1*15 = 0.533 µmoles/ml/min
3.4.1. Result
Activity of beta amylase in bean seeds (phaseolus vulgaris
l)
Table 11. showing activity of amylase enzymes in bean seeds at normal
temperature, 3°C and -19°C.
Days
Activity at normal
room temperature
(µmoles/ml/min)
Activity at 3°C
(µmoles/ml/min)
Activity at -19°C
(µmoles/ml/min)
2nd
day 0.8 0.966 1.766
6th
day 0.266 0.433 0.533
Graph 8. showing activity of amylase enzymes in bean seeds at normal
temperature, 3°C and -19°C.
Figure 22. Amylase activity experiment.
3.4.2. Discussion
The amylase activity was high at -19° C then at 3° C and
room temperature respectively. The reason was that as seeds

162 Vandana Srivastava et al.: Analysis on Effect of Cold Stress in Bean Seeds (Phaseolusvulgaris l)
are stored at low temperature there is high accumulation of
sugar in the seeds as compared to high temperature so it will
show high starch degrading activities at low temperature
(Tom Hamborg Nielsen, UtaDeiting, 1997).There are studies
which supports that amylase activity increases in response to
control (Md. ShahidulHaque and Md. Kamal Hossain 2011,
Shashi Sharma, Rajender Kumar Sharma, 2010).
3.5. Catalase
Standard H2O2 (Table 12)
Table 12. Standard Hydrogen Peroxide Curve.
Std H2O2
solution(ml)
Amount of
H2O2(µmoles)
Dichromate/acetic acid
reagent(ml)
Formation of blue
precipitate and heat for
10 mins in boiling
water bath
Cool to room
temp and volume
is make upto 3ml
with DW
OD at 570 nm
Blank 0.0 0 2 0.0
T1 0.2 1 2 0.26
T2 0.4 2 2 0.33
T3 0.6 3 2 0.49
T4 0.8 4 2 0.65
T5 1.0 5 2 0.69
Catalase Enzyme Assay
On 2nd
day(Table 13)
Table 13. Showing catalse enzyme assay on 2nd day for measuring activity of catalse enzyme in bean seeds at normal temperature, 3°C and -19°C.
Sl.no Enzyme
extract(ml)
Reaction
mixture(ml)
Dichromate/
acetic acid
reagent(ml)
Repeat this at
60 sec
interval
Heat test
tubes for 10
minsina a
boiling water
bath to get
green colour
OD at 570
nm of
normal room
temp
OD at 570
nm of 3°C
OD at 570
nm of -19°C
Test 1 1 2 0.37 0.44 0.46
Blank - 1 2 0.0 0.0 0.0
On 5th
day(Table 14)
Table 14. showing catalse enzyme assay on 5th day for measuring activity of catalse enzyme in bean seeds at normal temperature, 3°c and -19°c.
Sl.no Enzyme
extract(ml)
Reaction
mixture(ml)
Dichromate/acetic
acid reagent(ml)
Repeat
this at
60 sec
interval
Heat test tubes
for 10 minsina a
boiling water
bath to get
green colour
OD at 570
nm of
normal room
temp
OD at 570
nm of 3°Cnh
OD at 570
nm of -19°C
test 1 1 2 0.18 0.20 0.22
Blank - 1 2 0.0 0.0 0.0
3.5.1. Result
Calculation
0.37 OD at normal room temperature on 2nd
day
corresponds to the decomposition of 90.265 µmoles of H2O2
in a 3.0 ml reaction mixture
Dilution factor = 10 x
Volume of sample = 1 ml
Interval of time = 1 min
Activity of enzyme(µmoles/min/ml) = µmoles of
H2O2*dilution factor/volume of enzyme*time =
90.265*10/1*1 = 902.65 µmoles/min/ml
0.44 OD at 3° C on 2nd
day corresponds to the
decomposition of 108.256 µmoles of H2O2 in a 3.0 ml
reaction mixture
Dilution factor = 10 x
Volume of sample = 1 ml
Interval of time = 1 min
Activity of enzyme(µmoles/min/ml) = µmoles of
H2O2*dilution factor/volume of enzyme*time =
108.256*10/1*1 = 1082.56 µmoles/min/ml
0.46 OD at-19° C on 2nd
day corresponds to the
decomposition of 116.252 µmoles of H2O2 in a 3.0 ml
reaction mixture
Dilution factor = 10 x
Volume of sample = 1 ml
Interval of time = 1 min
Activity of enzyme(µmoles/min/ml) = µmoles of
H2O2*dilution factor/volume of enzyme*time =
116.252*10/1*1 = 1162.52 µmoles/min/ml
0.18 OD at normal room temperature on 5th
day
corresponds to the decomposition of 43.978 µmoles of H2O2
in a 3.0 ml reaction mixture
Dilution factor = 10 x
Volume of sample = 1 ml
Interval of time = 1 min
Activity of enzyme(µmoles/min/ml) = µmoles of
H2O2*dilution factor/volume of enzyme*time =

American Journal of BioScience 2015; 3(4): 145-166 163
43.978*10/1*1 = 439.78 µmoles/min/ml
0.20 OD at 3° C on 5th day corresponds to the
decomposition of 49.975 µmoles of H2O2 in a 3.0 ml reaction
mixture
Dilution factor = 10 x
Volume of sample = 1 ml
Interval of time = 1 min
Activity of enzyme(µmoles/min/ml) = µmoles of
H2O2*dilution factor/volume of enzyme*time =
49.975*10/1*1 = 499.75 µmoles/min/ml
0.22 OD at -19° C on 5th day corresponds to the
decomposition of 53.973 µmoles of H2O2 in a 3.0 ml reaction
mixture
Dilution factor = 10 x
Volume of sample = 1 ml
Interval of time = 1 min
Activityofenzyme(μmoles/min/ml)
= μmolesofH2O2
∗ dilutionfactor/volumeofenzyme
∗ time = 53.973 ∗ 10/1 ∗ 1
= 539.73μmoles/min/ml
Table 15 Activity of catalase in bean seeds(Phaseolus
vulgaris l)
Table 15. Showing Activity Of Catalase Enzymes In Bean Seeds At Normal
Temperature, 3°C and -19°C.
Days
Activity at normal
room temperature
(µmoles/ml/min)
Activity at 3°C
(µmoles/ml/min)
Activity at -19°C
(µmoles/ml/min)
2nd day 902.65 1082.56 1162.52
5th day 439.78 499.75 539.73
Graph 9. Showing activity of catalase enzymes in bean seeds at normal
temperature, 3°C and -19°C.
4. Discussion
The H2O2 content showed highly significant differences
between the control and tolerance to low temperatures. The
normal room temperature had the lowest level of CAT activity
and the highest H2O2 content. The lowest level of H2O2 was
observed at the 3° C and -19° C which shows the highest level
of CAT activity. The results of our experiments demonstrate
that low temperatures induce an accumulation of AOS (active
oxygen species). AOS play a role in the photosystem II (PSII)
operation (Willekens et al., 1997). The H2O2 accumulation was
observed in the normal room temperature characterized by its
sensitivity to cold (Vidalie, 1978). For the selected cold
temperature, the low level of H2O2 is explained by the
important CAT activity that at these temperature exhibit CAT
are the first enzymes which take place in H2O2 neutralization
and thus could avoid cellular damage caused by excessive
accumulation of the substrate (Willekens et al., 1994). The
importance of these enzymes under stress conditions are
explored by several scientists (Foyer and Noctor, 2005).
Puntarol et al. (1988) showed that the catalases are responsible
for H2O2 elimination and that an over activity exhibition of
these enzymes is able to induce hydrogen peroxide
detoxification and is considered as a strategy for improving
tolerance to the stress for plant cells. This is also proved by
studies onrelationship between peroxidase and catalase with
metabolism and environmentalfactors in
(FagusorientalisLipsky) in three different elevations done by
Zolfaghari,R , Hosseini,S.M , Korori ,S.A.A, in 2010.The
activity of catalase in high elevation was significantly more
than lower elevations in all collecting months except June and
November. The increase of catalase activity in high elevation is
due to lower temperature degree in winter and higher amount
of light intensity and Ozone concentration. The results of this
research show the lowest amount of catalase activity was in
June. There was not any significant difference in catalase
activity in three elevation classes. Also the catalase activity in
high elevation was lower than other elevations in November in
this month. The catalase activity started decreasing in February
and reaches lowest amount in June and then started increasing
until November.
5. Summary and Conclusion
Effect of cold stress was analyzed on bean seed phaseolus
vulgaris l by doing different types of tests (germination
studies, respiration response, conductivity test, and amylase
and catalase test) at different temperatures like at normal
room temperature, at 3° C and at -19° C.
6. Germination Study
Effect of cold stress was analyzed on germination of bean
seeds at different physiological parameters like germination
percentage, germination rate, and seedvigour and
germination index. Germination set up was made and seeds
were kept for germination on moistened paper towel in a
well-ventilated germination box and expose to different
temperatures (normal room temperature, 3° C and -19° C).
These experimental set up were observed for 15 days and
their growth was recorded. It was observed that due to more
chilling condition provided to the seed at -19° C ,due to
oxidative stress they were not able to grow so there were no
germination percentage, germination rate, seed vigour and
germination index. At 3° C there was growth but lesser than
normal room temperature so germination percentage,
germination rate, seed vigour and germination index all were
lesser than normal room temperature.

164 Vandana Srivastava et al.: Analysis on Effect of Cold Stress in Bean Seeds (Phaseolusvulgaris l)
7. Respiration Study
Effect of cold stress was analyzed on respiration response
of bean seeds. Experimental set up was made by placing
three test tubes in the water containing beaker at different
temperatures (normal room temperature, 3° C and -19° C).
Those test tubes were filled with calcium hydroxide, cotton
plug, seeds then again cotton plug and tied together with the
rubber band. One set up was also kept for control without
seeds to check respiration response till one week. It was
observed that at -19° C it starts respiring but due to ice
formation it stopped. At 3° C it was respiring but little faster
than normal room temperature. This stimulation of
respiration was reported as adaptive behavior of seeds grown
at cold conditions compared with related species from
warmer conditions. The increased rate of respiration at low
temperatures involves two energy dissipating systems,
Alternative Oxidase (AOX) pathway and Plant Uncoupling
Mitochondrial Protein (PUMP).
8. Conductivity
Effect of cold stress was analyzed on conductivity of seed
leachate solution. These seed leachate were exposed to
different temperatures (normal room temperature, 3° C and -
19° C). Conductivity was recorded by using conductivity
meter followed by calibration of the instrument with
potassium chloride. Conductivity measurement was done two
days –on 1st day and on 6
th day of germination. It was
observed that leachate solution of -19° C gives low
conductivity whereas 3° C gives moderate and at normal
room temperature it was high. Thus it was concluded that the
electrical conductivity is based on the principle that the
deterioration process is the leaching of the cells of seeds
soaked in water due to loss of integrity of cellular systems.
Thus, low conductivity means a high-quality seed.
9. Amylase
Amylase activity was studied at different temperature
exposure(normal room temperature , 3° C and -19° C) to
analyse cold stress. Standard maltose curve was done and
plotted. Enzyme assay ofseeds exposed to different
temperatures was carried out and maltose curve was
calculated at different temperatures. Amylase enzyme assay
was done two days- 2nd
day and 6th
day of germination. It
was observed that amylase activity was greater at -19° C.
Low temperature showed high amylase activity as there was
high accumulation of starch in the seeds stored at low
temperature and amylase activity will be high as it will be
highly involved in the degradation of starch in to maltose.
The greater the amount of maltose released the greater
activity of amylase it will show.
10. Catalase
Catalase activity was studied at different temperature
exposure (normal room temperature, 3° C and -19° C)
toanalyze cold stress. Standard H2O2 curve was done and
plotted. Enzyme assay ofseeds exposed to different
temperatures was carried out and H2O2 curve activity was
calculated at different temperatures. Catalase enzyme assay
was done two days- 2nd
day and 5th
day of germination. It
was observed that amylase activity was greater at -19° C.
Seeds exposed to normal room temperature had the lowest
level of CAT activity and the highest H2O2 content. The
lowest level of H2O2 was observed at the 3° C and -19° C
which shows the highest level of CAT activity. The results of
our experiments suggests that low temperatures induce an
accumulation of AOS (active oxygen species).
References
[1] Abdul- Baki, A. and Anderson.J.D. 1973. Vigor determination in Soybean seed by multiple criteria. Crop Sci. 13, 630-633.
[2] Afiukwa, C. A., Ibiam, U. A., Edeogu, C. O., Nweke, F. N. and Chukwu, U. E. 2009. Determination of amylase activity of crude extract from partially germinated mango seeds (Mangiferaoraphila) African Journal of Biotechnology Vol. 8 (14), 3294-3296.
[3] AmjadHameed ,ShaziaNaseer; etal. 2008. Effects of NaCl salinity of seedling growth,senescence,catalase and protease activities in two wheat genotypes differing in salt tolerance, 1-9.
[4] Andreata, R.H.P. & Pereira, T.S. 1990. Morfologia das plântulas de algumasespécies de Smilax L. Pesqui. Bot. 41, 7-24.
[5] AOSA-Association of Official Seed Analysts. 1983. Seed vigor testing handbook. Contribution No. 32 to the Handbook on Seed Testing. Association of Official Seed Analysts 93.
[6] Arun Dev Sharma, Meenu Thakur, MeenakshiRana and Kuldeep Singh.2004. Effect of plant growth hormones and abiotic stresses on germination, growth and phosphatase activities in Sorghum bicolor (L.) Moench seeds. African Journal of Biotechnology Vol. 3 (6), 308-312.
[7] Bewley, J.D., and Black, M. 1985. Seeds: Physiology of Development and Germination.Plenum Press, New York.
[8] Bing Bai, NogaSikron, Tanya Gendler, Yana Kazachkova, Simon Barak, Gideon Grafi,InnaKhozin-Goldberg and Aaron Fait.2011. Ecotypic Variability in the Metabolic Response of Seeds to Diurnal Hydration–Dehydration Cycles and its Relationship to Seed Vigor .Plant Cell Physiol. 53(1), 38–52.
[9] Bonner.F.T., 1991. Leachate Conductivity: A Rapid Nondestructive Test for Pine Seed Quality. Spring 41.
[10] Copeland, O.L. and M.B. Mcdonald, 1995. Seed science and technology. Third Edn, Chapman and Hall. New York.
[11] Davidson K.G.V. and Moore F.D., 1994.Comparison of Seed-quality IndicesResulting from Single-seed Electroconductivity Measurements.Hortscience 29(10),1158–1163.
[12] Deisseroth.A and Dounce.A.L., 1970.Catalase: Physical and chemical properties, mechanism of catalysis, and physiological role. Physiol Rev. 50 (3), 319-75.

American Journal of BioScience 2015; 3(4): 145-166 165
[13] Delouche, J.C.; Baskin, C.C. 1973.Accelerated aging techniques for predicting the relative storability of seeds lots. Seed Science and Technology, Zurich. vol.1(2), p.427-452.
[14] Fatma Kaplan and Charles L. Guy, 2004. Beta-Amylase Induction and the Protective Role of Maltose during Temperature Shock, 135(3),1674–1684.
[15] Foolad M.R. and G.Y. Lin. 2000. Relationship between Cold Tolerance during Seed Germination and Vegetative Growth in Tomato: Germplasm Evaluation. J. Amer. Soc. Hort.Sci. 125(6),679–683.
[16] Foyer, C.H., Noctor, G., 2005. Redox homeostasis and antioxidant signalling: a metabolic interface between stress perception and physiological responses. Plant Cell 17, 1866–1875.
[17] Gupta P.C. Seed VigourTesting , 1984. 242-249.
[18] Gulzar S SangheraWani SH, Hussain W, Singh NB.2011. Engineering Cold Stress Tolerance in Crop Plants .Curr Genomics; 12(1),30–43.
[19] Hai-Yan Li,Chun-Guang Li.2011.Short-term cold-shock at 1 induced chilling tolerance in maize seedlings. 2010 International Conference on Biology, Environment and Chemistry.IPCBEEvol.1 , IACSIT Press, Singapore.
[20] Hampton, J.G.; Johnstone, K.A.; Eua–umpon, V. 1992.Bulk conductivity test variables for Mungbean, Soybean and French bean seed lots. Seed Science and Technology, v.20,677–686.
[21] Hong-Xing Cao, Cheng-Xu Sun, Hong-Bo Shao,and Xin-Tao Lei.2011.Effects of low temperature and drought on the physiological and growth changes in oil palm seedlings. African Journal of Biotechnology Vol. 10(14), 2630-2637.
[22] Kaymakanova.M. 2000. Effect of Salinity on Germination and Seed Physiology in Bean (phaseolus vulgaris l.)Biotechnol. &Biotechnol. Eq. 23/2009/se.
[23] Kenji Miura, and Tsuyoshi Furumoto, 2013. Cold Signaling and Cold Response in Plants.Int. J. Mol. Sci , 14, 5312-5337.
[24] Kennya Mara Oliveira Ramos, Juliana M.M. Matos, Rosana C. C.Martins, and IldeuS.Martins. 2012.Electrical Conductivity Testing as Applied to the Assessment of Freshly Collected Kielmeyeracoriacea Mart. Seed Technology Laboratory of Forestry .Seeds.5.
[25] Loeffler, T.M.; Tekrony, D.M.; Egli, D.B.1988. The bulk conductivity test as an indicator of soybean seed quality. Journal of Seed Technology, v.12, p.37–53.
[26] Lynn Vaccaro, 2003, Seed repirationteacher,CSIP publication.
[27] Makkawi, M., El Balla, M., Bishaw, Z. and Van Gastel, A. J. G.1999. The relationship between seed vigour tests and field emergence in lentil (Lens culinarisMedikus), Seed Sci. &Technol., 27, 657-668.
[28] Maryam Madadkar., 2007.Photosynthesis and Respiration under Low Temperature Stress in Two DunaliellaStrainsmore. World Applied Sciences Journal 2 (4), 276-282.
[29] Matthews, S. and W.T. Bradnock. 1968. Relationship between seed exudation and field emergence in peas and French beans. Hort. Res.8, 89–93.
[30] Md. ShahidulHaque and Md. Kamal Hossain., 2011. A Regulatory Approach Caused by Cold Acclimation and Arsenic on the Impairment of Root Growth of Rice (Oryza sativa) .Jordan Journal of Biological Sciences. 4(4), 265- 274.
[31] Michael F. Thomashow.1998.Role of cold-responsive genes in plant freezing tolerance. Plant Physiol.118, 1–7.
[32] Michael F.Thomashow.2001. So What’s New in the Field of Plant Cold Acclimation? Lots! Plant Physiology, vol. 125, 89-93.
[33] Nabamita Chatterjee and Shantha Nagarajan.2006. Evaluation of water binding, Seed coat, permeability and germination characteristics of wheat seeds equilibrated at different relative humidities,Indian Journal of Biochemistry &Biophysics,vol. 43, 233-238.
[34] Peter Bernfield .1955. In: Methods of Enzymology (EdsColowick, S and Kaplan, N O) Academic Press New York 1,149.
[35] Phillips, R.; Rix, M. 1993. Vegetables. New York: Random House.
[36] Pieper, A. Das Saatgut. V.P. Darey Berlin.1952.Hamburg.
[37] Puntarol, S., Sanchez, R.A., Boveris, A., 1988. Hydrogen peroxide metabolism in soybean embryonic axes at the onset of germination. Plant Physiol. 86, 626–630.
[38] Roberts M.V.B., King .T.J.,1987. Biology.a functional approach student manual ,2nd Edition, Thorns Nelson and Sons Ltd, 64-65.
[39] Sarka K., Kopecký .1990. Physics for Students of Pharmacy II. Bratislava.1-5.
[40] Sawney.S.K and Randhir Singh.1996.Determination of beta-amylase activity in germinating bean seeds. Second edition. NarosaPublisihg House Pvt.Ltd. 148-149.
[41] Shashi Sharma, Rajender Kumar Sharma.2010.Long-term storage-dependent changes in seed physiological aspects of Hyoscyamusniger from a cold desert region of Trans-Himalaya.International Journal of Plant Biology, Vol.1(2), 13.
[42] Sinha AK,1972.Colorimetric assay of catalase. Anal Biochem. 47(2),389-94.
[43] SomenNandi,Gitali Das and Swati Sen.1994.β-amylase Activity as an Index for Germination potential in Rice. Annals of Botany 75,463-467.
[44] Su Jung Park, Kyung Jin Kwak , Tae Rin Oh , Yeon Ok Kim and Hunseung Kang.2009. Cold Shock Domain Proteins Affect Seed Germination and Growth of Arabidopsis thaliana under abiotic stress conditions. Plant Cell Physiol. 50(4), 869–878.
[45] Suzuki N, Mittler R.2006. Reactive oxygen species and temperature stresses: A delicate balance between signaling and destruction. Physiol. Plant. 126, 45-51.
[46] Takahiro Tezuka, Hisa Yokoyama, Hideyuki Tanaka, ShujiShiozaki, and Masayuki Oda., 2012. Seed and Embryo Germination in Ardisiacrenata. Hindawi Publishing Corporation.Journal of Botany doi:10.1155/2012/679765.
[47] Tom Hamborg Nielsen, UtaDeiting. M Stitt; 1997. A P-Amylase in Potato Tubers is induced by storage at low temperature. Plant Physiology,Vol. 113,503-510.

166 Vandana Srivastava et al.: Analysis on Effect of Cold Stress in Bean Seeds (Phaseolusvulgaris l)
[48] TuomasSopanen and Christiane Lauriere.1989. Release and activity of bound, b-amylase in a germinating barley grain. Plant Physiology,89, 244-249.
[49] Vladimir Shulaev and David J. Oliver. 2006. Metabolic and Proteomic Markers for Oxidative Stress. New Tools for Reactive Oxygen Species Research. Plant Physiol. vol. 141,367-370.
[50] Vidalie, H., 1978. Comportement de diffe´rents cultivars de glaı¨eulspre´cocescultive´s sous tunnel. Pe´p. Hort. Mar. 192, 13–18.
[51] Vieira, R.D.; Penariol, A.L.; Perecin, D.; Panobianco, M. 2002.Condutividade elétrica e teor de águainicial das sementes de soja. PesquisaAgropecuáriaBrasileira, v.37, p.1333–1338.
[52] Willekens, H., Chamnongpol, S., Davey, M., Schraudner, M., Langebartels, C., Van Montagu, M., Inzé, D., and Van Camp, W. 1997. Catalase is a sink for H2O2 and is indispensable for stress defense in C3 plants. EMBO J. 16, 4806–4816.
[53] Willekens, H., Langebartels, C., Tire´, C., Van montagu, M., Inze´, D., Van Camp, W., 1994. Differential expression of catalase genes in Nicotianaplumbaginifolia. Proc. Natl. Acad. Sci. U.S.A. 91, 10450–10454.
[54] Ya.JingGuan,Jin Hu. etal. 2009. Seed priming with chitosan improves maize germination and seedling growth in relation to physiological changes under low temperature stress,J Zhejiang UnivSci B. 10(6): 427–433.
[55] ZaferOlmez, AskinGokturk and SuleymanGulcu, 2006. Effects of cold stratification on germination rate and percentage of caper (CapparisovataDesf.) seeds. Journal of Environmental Biology, 27(4), 667-670.
[56] Zolfaghari R., Hosseini S. M., Korori S. A. A.2010. Relationship between peroxidase and catalase with metabolism and environmental factors in Beech (FagusorientalisLipsky) in three different elevations. International Journal of Environmental Sciences, vol 1(2) ,243- 252.