Embed Size (px)
Citation preview

Analyst Booklet – detailed financialsFor the six months ended 30 September 2017
Important information
2
This presentation contains forward-looking statements as defined in the United States Private Securities Litigation Reform Act of 1995. Words such as “believe”, “anticipate”, “intend”, “seek”, “will”, “plan”, “could”, “may”, “endeavour” and similar expressions are intended to identify such forward-looking statements, but are not the exclusive means of identifying such statements.
While these forward-looking statements represent our judgments and future expectations, a number of risks, uncertainties and other important factors could cause actual developments and results to differ materially from our expectations. These include key factors that could adversely affect our businesses and financial performance.
We are not under any obligation to (and expressly disclaim any such obligation to) update or alter our forward-looking statements whether as a result of new information, future events or otherwise. Investors are cautioned not to place undue reliance on any forward-looking statements contained herein.
Strategy: to build valuable internet platforms
3
Build businesses with ‘platform’ potential
In high-growth markets
Where we can build sustainable leadership positions
Address big societal needs
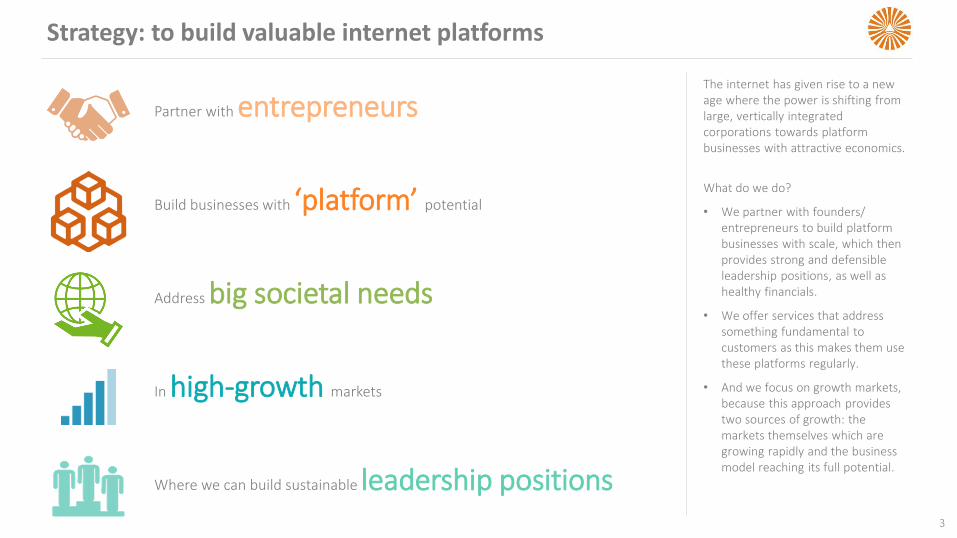
Partner with entrepreneursThe internet has given rise to a new age where the power is shifting from large, vertically integrated corporations towards platform businesses with attractive economics.
What do we do?
• We partner with founders/ entrepreneurs to build platform businesses with scale, which then provides strong and defensible leadership positions, as well as healthy financials.
• We offer services that address something fundamental to customers as this makes them use these platforms regularly.
• And we focus on growth markets, because this approach provides two sources of growth: the markets themselves which are growing rapidly and the business model reaching its full potential.

FINANCIALS
Synopsis of financials
5
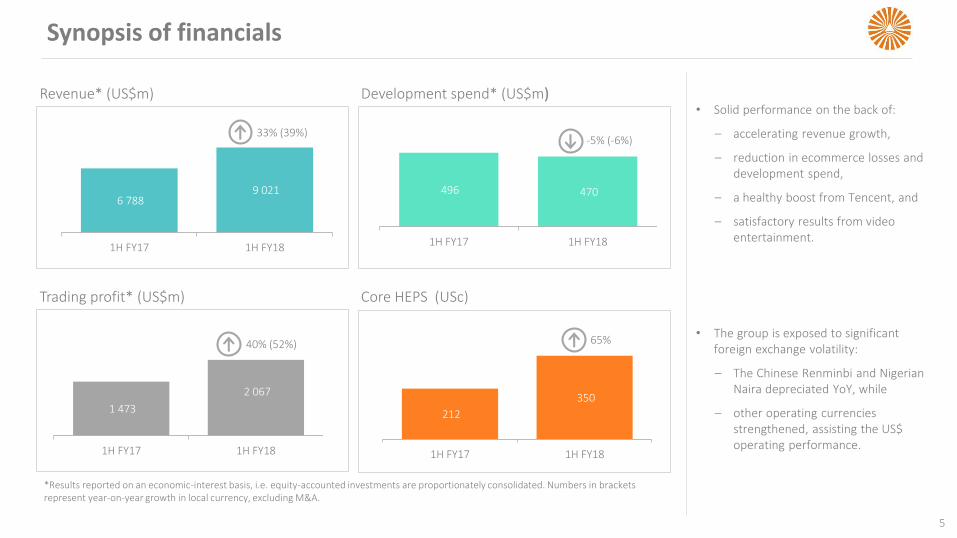
• Solid performance on the back of:
‒ accelerating revenue growth,
‒ reduction in ecommerce losses and development spend,
‒ a healthy boost from Tencent, and
‒ satisfactory results from video entertainment.
• The group is exposed to significant foreign exchange volatility:
‒ The Chinese Renminbi and Nigerian Naira depreciated YoY, while
‒ other operating currencies strengthened, assisting the US$ operating performance.
*Results reported on an economic-interest basis, i.e. equity-accounted investments are proportionately consolidated. Numbers in brackets represent year-on-year growth in local currency, excluding M&A.
6 788 9 021
1H FY17 1H FY18
Revenue* (US$m)
33% (39%)
496 470
1H FY17 1H FY18
Development spend* (US$m)
-5% (-6%)
1 473
2 067
1H FY17 1H FY18
Trading profit* (US$m)
40% (52%)
212
350
1H FY17 1H FY18
Core HEPS (USc)
65%
Ecommerce and Tencent fuel robust revenue growth
6
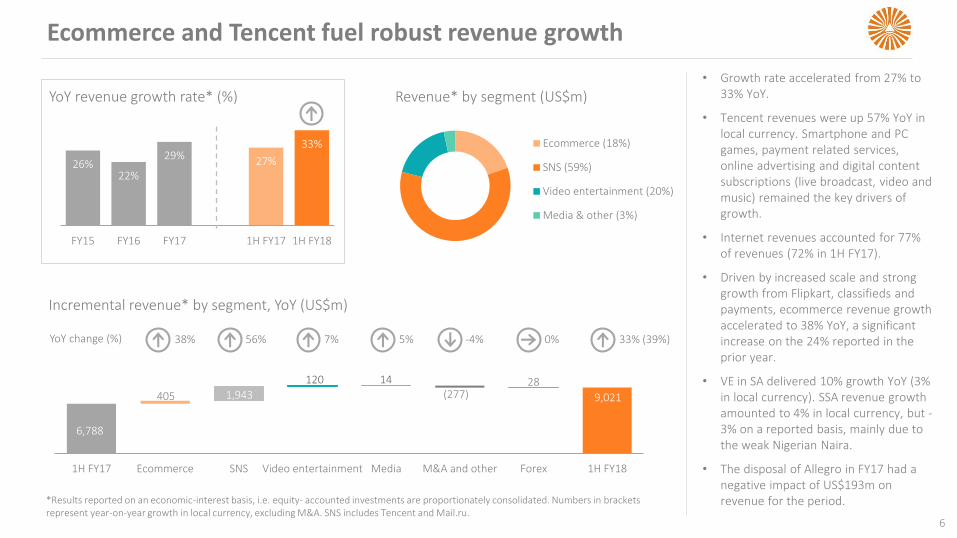
• Growth rate accelerated from 27% to 33% YoY.
• Tencent revenues were up 57% YoY in local currency. Smartphone and PC games, payment related services, online advertising and digital content subscriptions (live broadcast, video and music) remained the key drivers of growth.
• Internet revenues accounted for 77% of revenues (72% in 1H FY17).
• Driven by increased scale and strong growth from Flipkart, classifieds and payments, ecommerce revenue growth accelerated to 38% YoY, a significant increase on the 24% reported in the prior year.
• VE in SA delivered 10% growth YoY (3% in local currency). SSA revenue growth amounted to 4% in local currency, but -3% on a reported basis, mainly due to the weak Nigerian Naira.
• The disposal of Allegro in FY17 had a negative impact of US$193m on revenue for the period.
Incremental revenue* by segment, YoY (US$m)
9,021
33% (39%)38% 56% 7% -4% 0% 5% YoY change (%)
(277)
Revenue* by segment (US$m) YoY revenue growth rate* (%)
26%22%
29% 27%
33%
FY15 FY16 FY17 1H FY17 1H FY18
Ecommerce (18%)
SNS (59%)
Video entertainment (20%)
Media & other (3%)
*Results reported on an economic-interest basis, i.e. equity- accounted investments are proportionately consolidated. Numbers in brackets represent year-on-year growth in local currency, excluding M&A. SNS includes Tencent and Mail.ru.
1,94328
6,788
1H FY17 Ecommerce SNS Video entertainment Media M&A and other Forex 1H FY18
9,021405
14120
Diversified business mix – ongoing shift
7
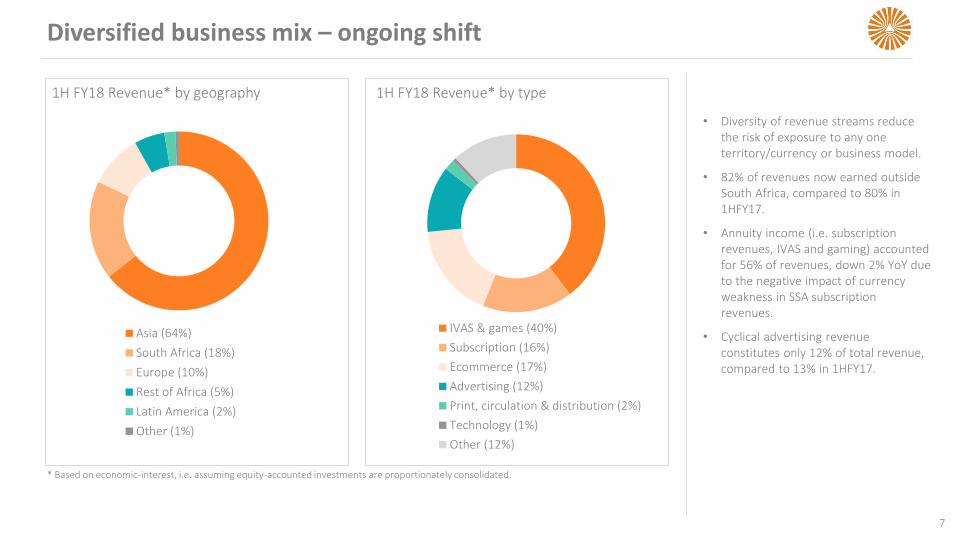
• Diversity of revenue streams reduce the risk of exposure to any one territory/currency or business model.
• 82% of revenues now earned outside South Africa, compared to 80% in 1HFY17.
• Annuity income (i.e. subscription revenues, IVAS and gaming) accounted for 56% of revenues, down 2% YoY due to the negative impact of currency weakness in SSA subscription revenues.
• Cyclical advertising revenue constitutes only 12% of total revenue, compared to 13% in 1HFY17.
1H FY18 Revenue* by geography
Asia (64%)
South Africa (18%)
Europe (10%)
Rest of Africa (5%)
Latin America (2%)
Other (1%)
1H FY18 Revenue* by type
IVAS & games (40%)
Subscription (16%)
Ecommerce (17%)
Advertising (12%)
Print, circulation & distribution (2%)
Technology (1%)
Other (12%)
* Based on economic-interest, i.e. assuming equity-accounted investments are proportionately consolidated.
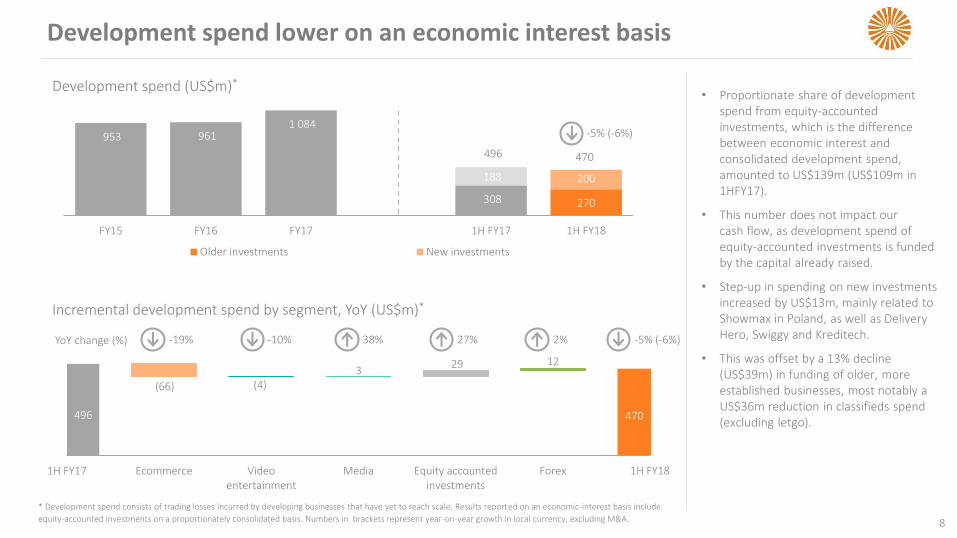
Incremental development spend by segment, YoY (US$m)*
Development spend (US$m)*
953 961 1 084
308 270
188 200
FY15 FY16 FY17 1H FY17 1H FY18
Older investments New investments
-5% (-6%)
Development spend lower on an economic interest basis
8
• Proportionate share of development spend from equity-accounted investments, which is the difference between economic interest and consolidated development spend, amounted to US$139m (US$109m in 1HFY17).
• This number does not impact our cash flow, as development spend of equity-accounted investments is funded by the capital already raised.
• Step-up in spending on new investments increased by US$13m, mainly related to Showmax in Poland, as well as DeliveryHero, Swiggy and Kreditech.
• This was offset by a 13% decline (US$39m) in funding of older, more established businesses, most notably a US$36m reduction in classifieds spend (excluding letgo).
* Development spend consists of trading losses incurred by developing businesses that have yet to reach scale. Results reported on an economic-interest basis include
equity-accounted investments on a proportionately consolidated basis. Numbers in brackets represent year-on-year growth in local currency, excluding M&A.
496 470
1H FY17 Ecommerce Videoentertainment
Media Equity accountedinvestments
Forex 1H FY18
496 470
(66) (4)3
29 12
2%YoY change (%) -5% (-6%)-19% -10% 27%38%
Trading profit boosted by Tencent and reduced ecommerce losses
9
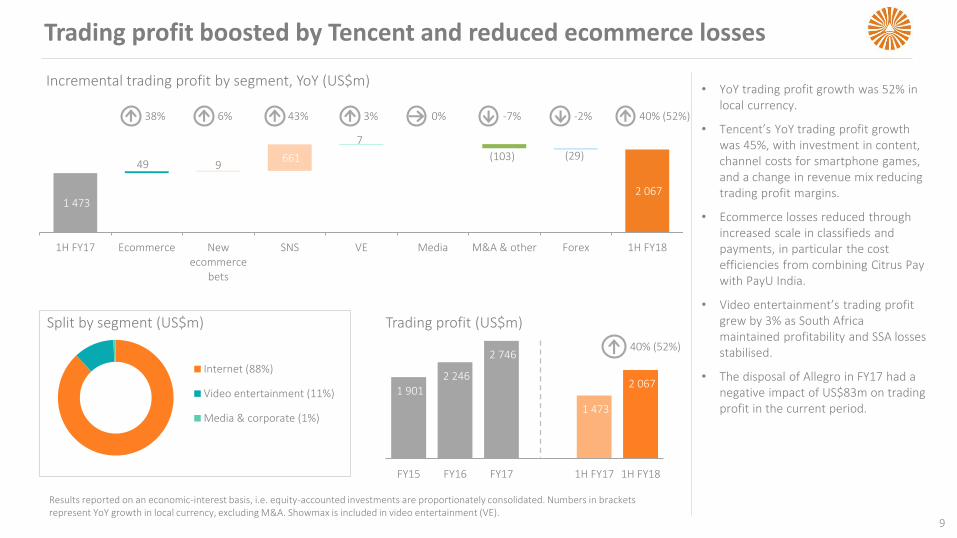
• YoY trading profit growth was 52% in local currency.
• Tencent’s YoY trading profit growth was 45%, with investment in content, channel costs for smartphone games, and a change in revenue mix reducing trading profit margins.
• Ecommerce losses reduced through increased scale in classifieds and payments, in particular the cost efficiencies from combining Citrus Pay with PayU India.
• Video entertainment’s trading profit grew by 3% as South Africa maintained profitability and SSA losses stabilised.
• The disposal of Allegro in FY17 had a negative impact of US$83m on trading profit in the current period.
Incremental trading profit by segment, YoY (US$m)
Split by segment (US$m)
Internet (88%)
Video entertainment (11%)
Media & corporate (1%)
Trading profit (US$m)
1 901 2 246
2 746
1 473
2 067
FY15 FY16 FY17 1H FY17 1H FY18
40% (52%)
2 067
49 9(103) (29)661
7
1 473
1H FY17 Ecommerce Newecommerce
bets
SNS VE Media M&A & other Forex 1H FY18
38% 43% 3% 40% (52%) -2% -7% 6% 0%
Results reported on an economic-interest basis, i.e. equity-accounted investments are proportionately consolidated. Numbers in brackets represent YoY growth in local currency, excluding M&A. Showmax is included in video entertainment (VE).
Ecommerce segmental detail
10
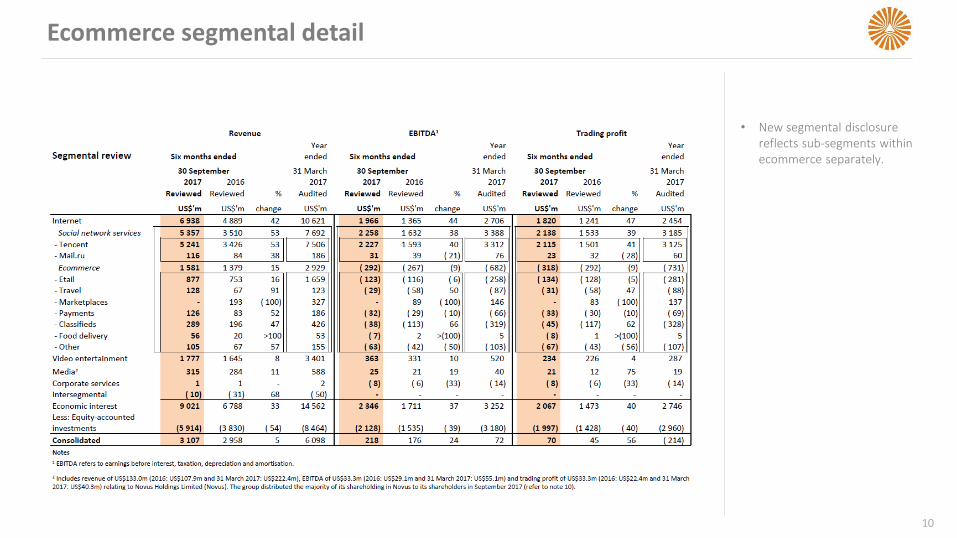
• New segmental disclosure reflects sub-segments within ecommerce separately.
Classifieds and payments drive profitability in ecommerce
11
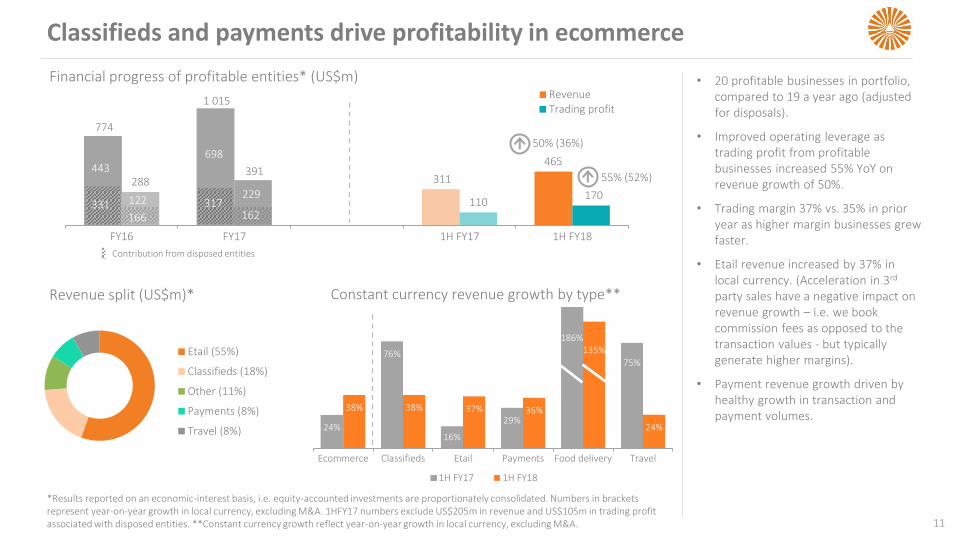
• 20 profitable businesses in portfolio, compared to 19 a year ago (adjusted for disposals).
• Improved operating leverage as trading profit from profitable businesses increased 55% YoY on revenue growth of 50%.
• Trading margin 37% vs. 35% in prior year as higher margin businesses grew faster.
• Etail revenue increased by 37% in local currency. (Acceleration in 3rd
party sales have a negative impact on revenue growth – i.e. we book commission fees as opposed to the transaction values - but typically generate higher margins).
• Payment revenue growth driven by healthy growth in transaction and payment volumes.
Revenue split (US$m)* Constant currency revenue growth by type**
24%
76%
16%
29%
186%
75%
38% 38% 37% 36%
135%
24%
Ecommerce Classifieds Etail Payments Food delivery Travel
1H FY17 1H FY18
*Results reported on an economic-interest basis, i.e. equity-accounted investments are proportionately consolidated. Numbers in brackets represent year-on-year growth in local currency, excluding M&A. 1HFY17 numbers exclude US$205m in revenue and US$105m in trading profit associated with disposed entities. **Constant currency growth reflect year-on-year growth in local currency, excluding M&A.
774
1 015
311
465
288 391
110 170
FY16 FY17 1H FY17 1H FY18
RevenueTrading profit
50% (36%)
162
Contribution from disposed entities
443
317
698698
331166
Financial progress of profitable entities* (US$m)
122
698
229
55% (52%)
Etail (55%)
Classifieds (18%)
Other (11%)
Payments (8%)
Travel (8%)
12
Classifieds now profitable
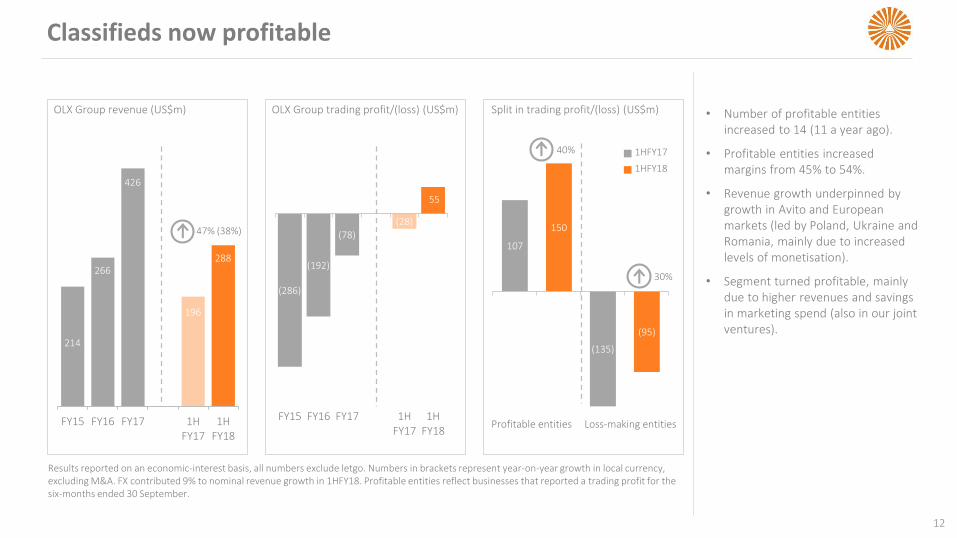
• Number of profitable entities increased to 14 (11 a year ago).
• Profitable entities increased margins from 45% to 54%.
• Revenue growth underpinned by growth in Avito and European markets (led by Poland, Ukraine and Romania, mainly due to increased levels of monetisation).
• Segment turned profitable, mainly due to higher revenues and savings in marketing spend (also in our joint ventures).
214
266
426
196
288
FY15 FY16 FY17 1HFY17
1HFY18
OLX Group revenue (US$m)
47% (38%)
OLX Group trading profit/(loss) (US$m)
(286)
(192)
(78)
(28)
55
FY15 FY16 FY17 1HFY17
1HFY18
107
150
(135)
(95)
Split in trading profit/(loss) (US$m)
1HFY17
1HFY18
40%
Profitable entities Loss-making entities
30%
Results reported on an economic-interest basis, all numbers exclude letgo. Numbers in brackets represent year-on-year growth in local currency, excluding M&A. FX contributed 9% to nominal revenue growth in 1HFY18. Profitable entities reflect businesses that reported a trading profit for the six-months ended 30 September.
1 645 1 777
226 234
1H FY17 1H FY18
Revenue Trading profit
Video entertainment: steady profitability
Video entertainment (VE) financials (US$m)
Capital expenditure (US$m)
43
17
1H FY17 1H FY18
-60%
Programming and production costs (US$m)
545
573
1H FY17 1H FY18
5%
8%
4%
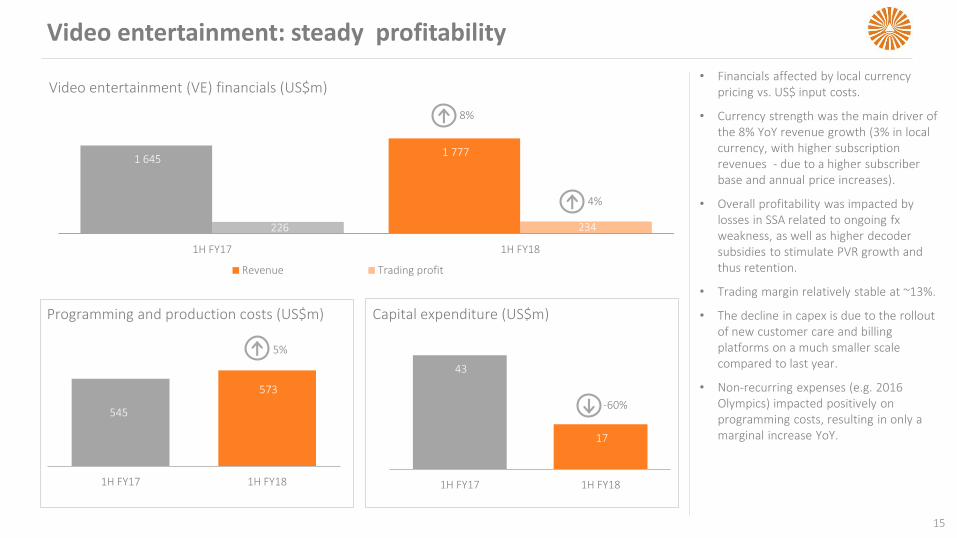
• Financials affected by local currency pricing vs. US$ input costs.
• Currency strength was the main driver of the 8% YoY revenue growth (3% in local currency, with higher subscription revenues - due to a higher subscriber base and annual price increases).
• Overall profitability was impacted by losses in SSA related to ongoing fxweakness, as well as higher decoder subsidies to stimulate PVR growth and thus retention.
• Trading margin relatively stable at ~13%.
• The decline in capex is due to the rollout of new customer care and billing platforms on a much smaller scale compared to last year.
• Non-recurring expenses (e.g. 2016 Olympics) impacted positively on programming costs, resulting in only a marginal increase YoY.
15
494 479
(103) (115)
1H FY17 1H FY18
Revenue Trading profit
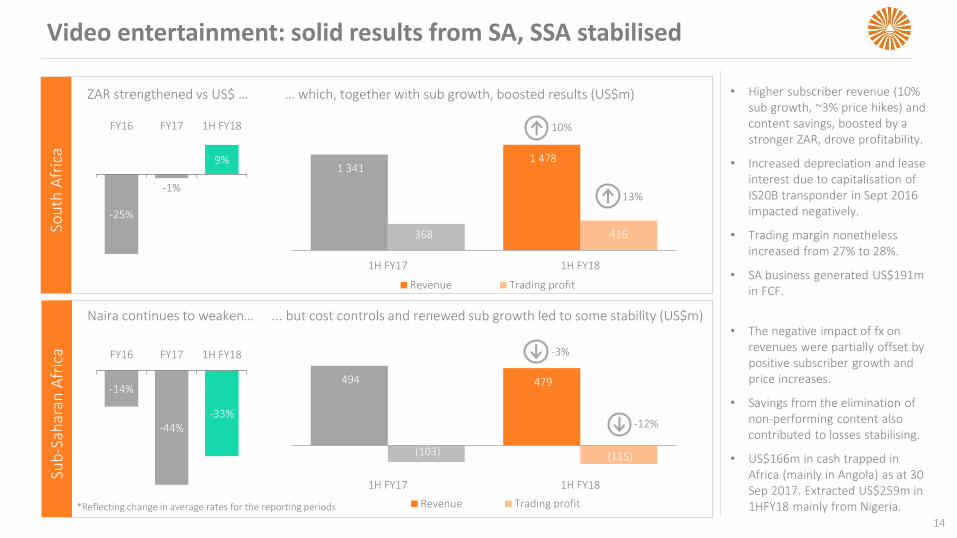
Video entertainment: solid results from SA, SSA stabilised
14
Naira continues to weaken… ... but cost controls and renewed sub growth led to some stability (US$m)
-25%
-1%
9%
FY16 FY17 1H FY18
ZAR strengthened vs US$ … … which, together with sub growth, boosted results (US$m)
1 341 1 478
368 416
1H FY17 1H FY18
Revenue Trading profit
Sou
th A
fric
aSu
b-S
ahar
an A
fric
a
*Reflecting change in average rates for the reporting periods
-14%
-44%-33%
FY16 FY17 1H FY18
10%
-3%
13%
-12%
• Higher subscriber revenue (10% sub growth, ~3% price hikes) and content savings, boosted by a stronger ZAR, drove profitability.
• Increased depreciation and lease interest due to capitalisation of IS20B transponder in Sept 2016 impacted negatively.
• Trading margin nonetheless increased from 27% to 28%.
• SA business generated US$191m in FCF.
• The negative impact of fx on revenues were partially offset by positive subscriber growth and price increases.
• Savings from the elimination of non-performing content also contributed to losses stabilising.
• US$166m in cash trapped in Africa (mainly in Angola) as at 30 Sep 2017. Extracted US$259m in 1HFY18 mainly from Nigeria.
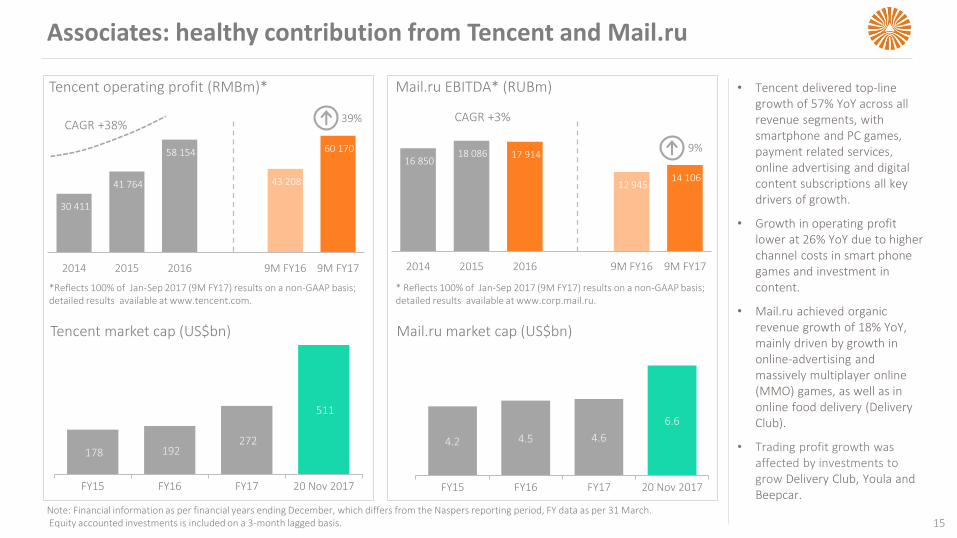
Associates: healthy contribution from Tencent and Mail.ru
15
Tencent operating profit (RMBm)*
CAGR +38%39%
Mail.ru EBITDA* (RUBm)
CAGR +3%
9%
*Reflects 100% of Jan-Sep 2017 (9M FY17) results on a non-GAAP basis; detailed results available at www.tencent.com.
* Reflects 100% of Jan-Sep 2017 (9M FY17) results on a non-GAAP basis; detailed results available at www.corp.mail.ru.
Tencent market cap (US$bn)
178 192 272
511
FY15 FY16 FY17 20 Nov 2017
Mail.ru market cap (US$bn)
4.2 4.5 4.6
6.6
FY15 FY16 FY17 20 Nov 2017
• Tencent delivered top-line growth of 57% YoY across all revenue segments, with smartphone and PC games, payment related services, online advertising and digital content subscriptions all key drivers of growth.
• Growth in operating profit lower at 26% YoY due to higher channel costs in smart phone games and investment in content.
• Mail.ru achieved organic revenue growth of 18% YoY, mainly driven by growth in online-advertising and massively multiplayer online (MMO) games, as well as in online food delivery (Delivery Club).
• Trading profit growth was affected by investments to grow Delivery Club, Youla and Beepcar.
30 411
41 764
58 154
43 208
60 170
2014 2015 2016 9M FY16 9M FY17
16 850 18 086 17 914
12 945 14 106
2014 2015 2016 9M FY16 9M FY17
Note: Financial information as per financial years ending December, which differs from the Naspers reporting period, FY data as per 31 March.Equity accounted investments is included on a 3-month lagged basis.
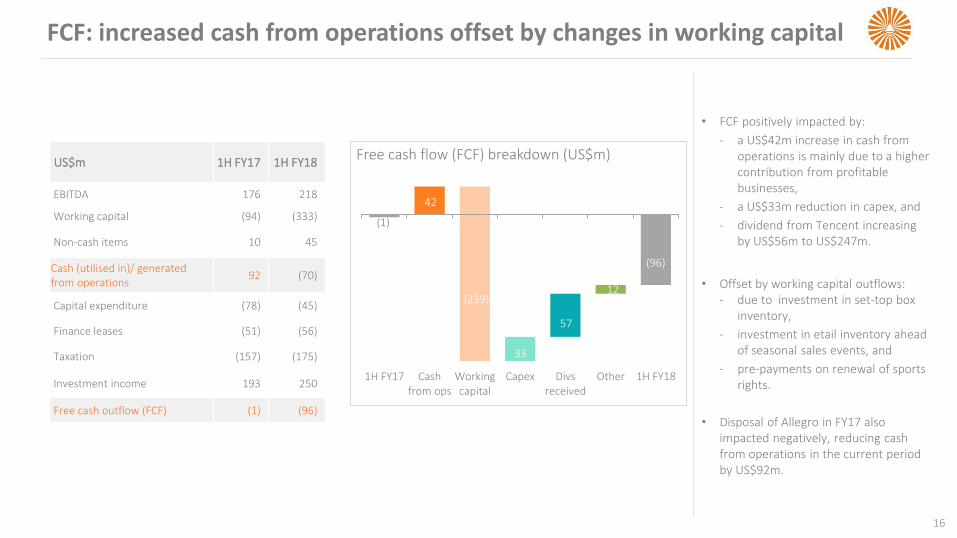
FCF: increased cash from operations offset by changes in working capital
16
Free cash flow (FCF) breakdown (US$m)
(1)
1H FY17 Cashfrom ops
Workingcapital
Capex Divsreceived
Other 1H FY18
(239)
33
57
12
(96)
42
US$m 1H FY17 1H FY18
EBITDA 176 218
Working capital (94) (333)
Non-cash items 10 45
Cash (utilised in)/ generated from operations
92 (70)
Capital expenditure (78) (45)
Finance leases (51) (56)
Taxation (157) (175)
Investment income 193 250
Free cash outflow (FCF) (1) (96)
42
• FCF positively impacted by:
‐ a US$42m increase in cash from operations is mainly due to a higher contribution from profitable businesses,
‐ a US$33m reduction in capex, and
‐ dividend from Tencent increasing by US$56m to US$247m.
• Offset by working capital outflows: ‐ due to investment in set-top box
inventory,
‐ investment in etail inventory ahead of seasonal sales events, and
‐ pre-payments on renewal of sports rights.
• Disposal of Allegro in FY17 also impacted negatively, reducing cash from operations in the current period by US$92m.
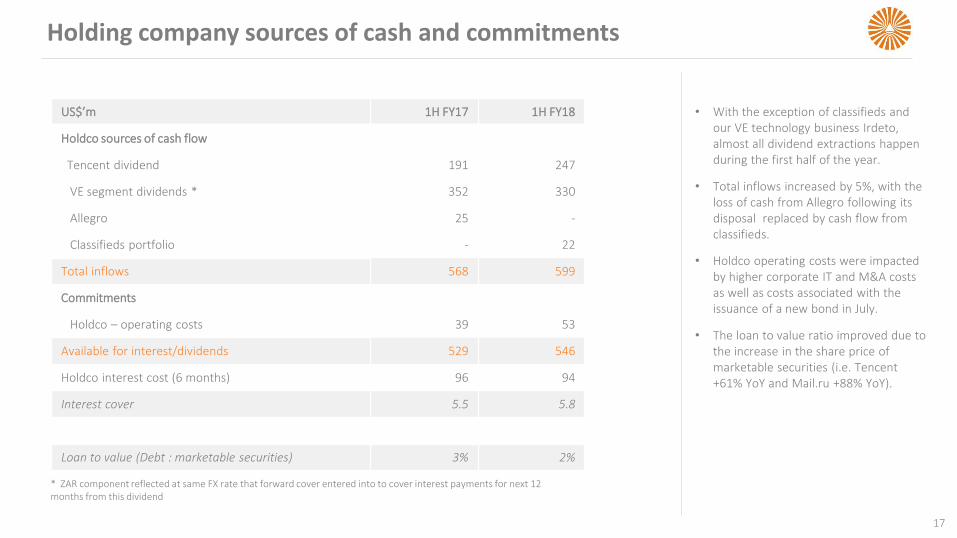
Holding company sources of cash and commitments
17
US$’m 1H FY17 1H FY18
Holdco sources of cash flow
Tencent dividend 191 247
VE segment dividends * 352 330
Allegro 25 -
Classifieds portfolio - 22
Total inflows 568 599
Commitments
Holdco – operating costs 39 53
Available for interest/dividends 529 546
Holdco interest cost (6 months) 96 94
Interest cover 5.5 5.8
Loan to value (Debt : marketable securities) 3% 2%
* ZAR component reflected at same FX rate that forward cover entered into to cover interest payments for next 12 months from this dividend
• With the exception of classifieds and our VE technology business Irdeto, almost all dividend extractions happen during the first half of the year.
• Total inflows increased by 5%, with the loss of cash from Allegro following its disposal replaced by cash flow from classifieds.
• Holdco operating costs were impacted by higher corporate IT and M&A costs as well as costs associated with the issuance of a new bond in July.
• The loan to value ratio improved due to the increase in the share price of marketable securities (i.e. Tencent+61% YoY and Mail.ru +88% YoY).
Recent M&A activity
18
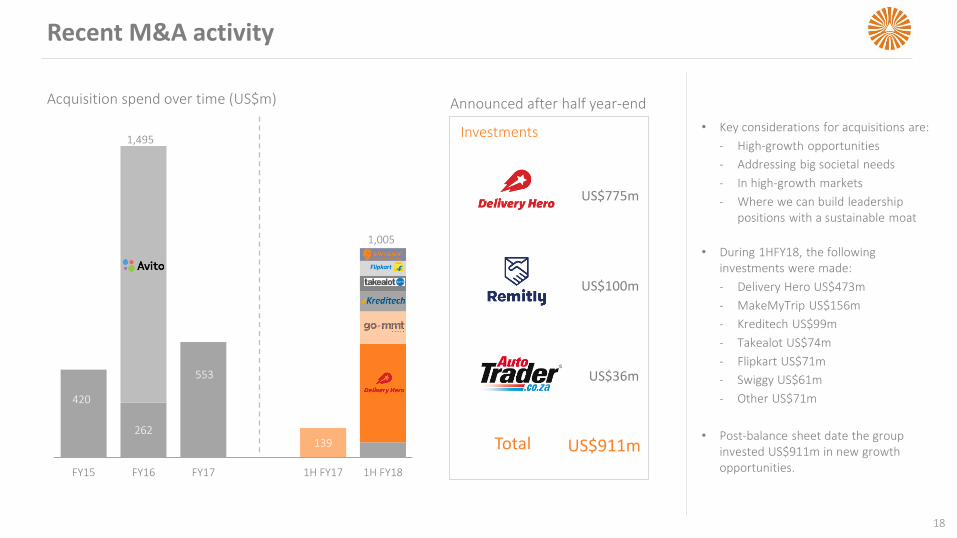
• Key considerations for acquisitions are:
‐ High-growth opportunities
‐ Addressing big societal needs
‐ In high-growth markets
‐ Where we can build leadership positions with a sustainable moat
• During 1HFY18, the following investments were made:
‐ Delivery Hero US$473m
‐ MakeMyTrip US$156m
‐ Kreditech US$99m
‐ Takealot US$74m
‐ Flipkart US$71m
‐ Swiggy US$61m
‐ Other US$71m
• Post-balance sheet date the group invested US$911m in new growth opportunities.
Acquisition spend over time (US$m)
Investments
US$775m
US$100m
US$36m
Total US$911m
Announced after half year-end
262
553
139
FY15 FY16 FY17 1H FY17 1H FY18
1,495
1,005
420
19
Summarised income statement
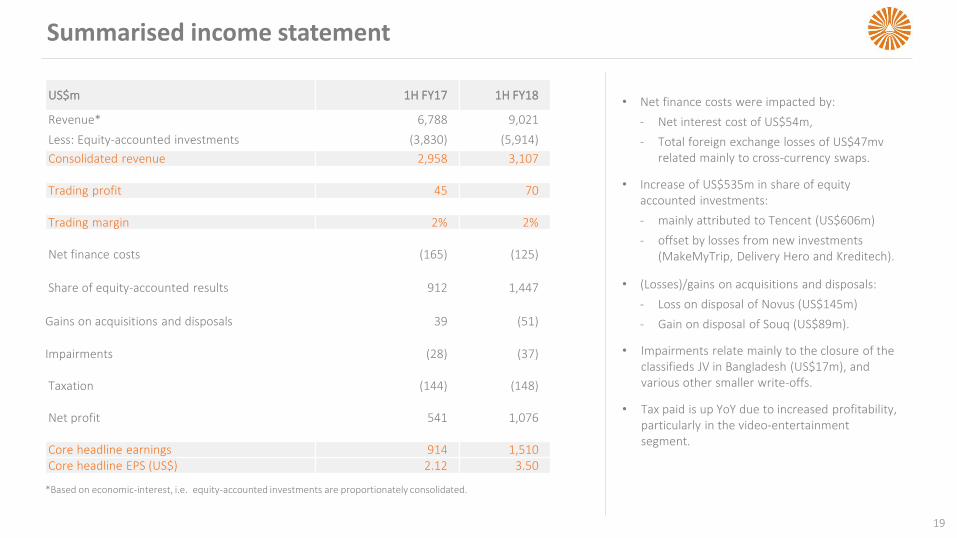
• Net finance costs were impacted by:
‐ Net interest cost of US$54m,
‐ Total foreign exchange losses of US$47mv related mainly to cross-currency swaps.
• Increase of US$535m in share of equity accounted investments:
‐ mainly attributed to Tencent (US$606m)
‐ offset by losses from new investments (MakeMyTrip, Delivery Hero and Kreditech).
• (Losses)/gains on acquisitions and disposals:
‐ Loss on disposal of Novus (US$145m)
‐ Gain on disposal of Souq (US$89m).
• Impairments relate mainly to the closure of the classifieds JV in Bangladesh (US$17m), and various other smaller write-offs.
• Tax paid is up YoY due to increased profitability, particularly in the video-entertainment segment.
*Based on economic-interest, i.e. equity-accounted investments are proportionately consolidated.
US$m 1H FY17 1H FY18
Revenue* 6,788 9,021
Less: Equity-accounted investments (3,830) (5,914)
Consolidated revenue 2,958 3,107
Trading profit 45 70
Trading margin 2% 2%
Net finance costs (165) (125)
Share of equity-accounted results 912 1,447
Gains on acquisitions and disposals 39 (51)
Impairments (28) (37)
Taxation (144) (148)
Net profit 541 1,076
Core headline earnings 914 1,510Core headline EPS (US$) 2.12 3.50
Equity-accounted results
20
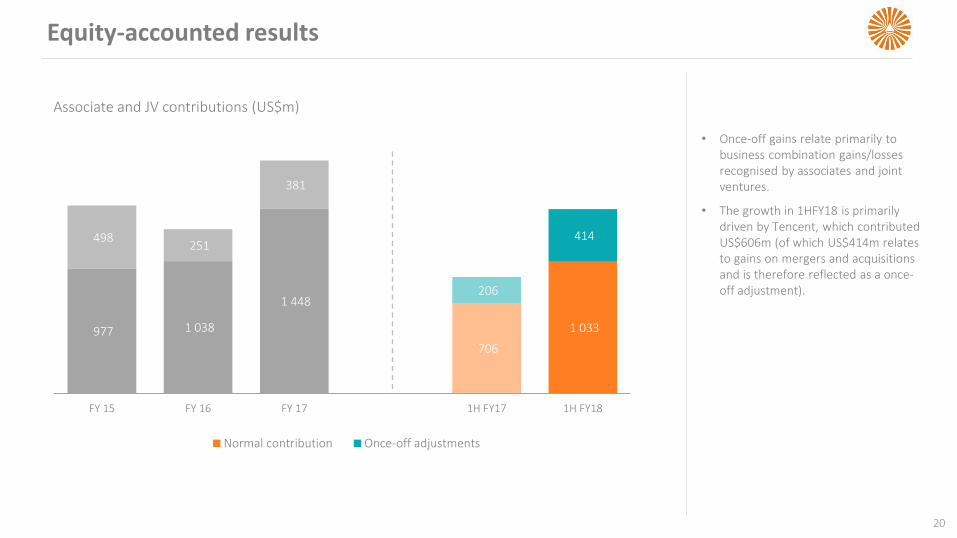
Associate and JV contributions (US$m)
977 1 038
1 448
706
1 033
498 251
381
206
414
FY 15 FY 16 FY 17 1H FY17 1H FY18
Normal contribution Once-off adjustments
• Once-off gains relate primarily to business combination gains/losses recognised by associates and joint ventures.
• The growth in 1HFY18 is primarily driven by Tencent, which contributed US$606m (of which US$414m relates to gains on mergers and acquisitions and is therefore reflected as a once-off adjustment).
Contribution by associates and joint ventures
21
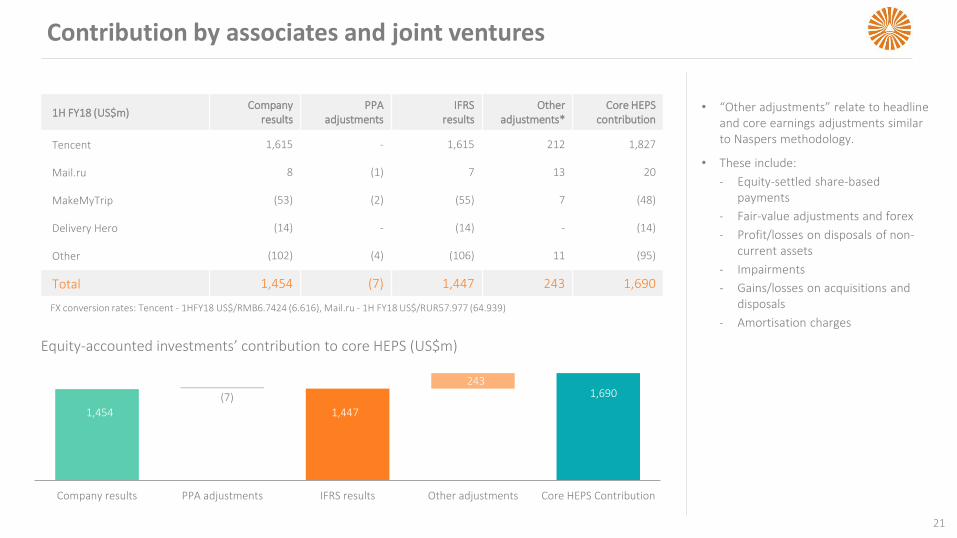
1H FY18 (US$m)Company
results PPA
adjustments IFRS
results Other
adjustments*Core HEPS
contribution
Tencent 1,615 - 1,615 212 1,827
Mail.ru 8 (1) 7 13 20
MakeMyTrip (53) (2) (55) 7 (48)
Delivery Hero (14) - (14) - (14)
Other (102) (4) (106) 11 (95)
Total 1,454 (7) 1,447 243 1,690
Equity-accounted investments’ contribution to core HEPS (US$m)
Company results PPA adjustments IFRS results Other adjustments Core HEPS Contribution
• “Other adjustments” relate to headline and core earnings adjustments similar to Naspers methodology.
• These include:
‐ Equity-settled share-based payments
‐ Fair-value adjustments and forex
‐ Profit/losses on disposals of non-current assets
‐ Impairments
‐ Gains/losses on acquisitions and disposals
‐ Amortisation charges
1,454 1,447
2431,690(7)
FX conversion rates: Tencent - 1HFY18 US$/RMB6.7424 (6.616), Mail.ru - 1H FY18 US$/RUR57.977 (64.939)
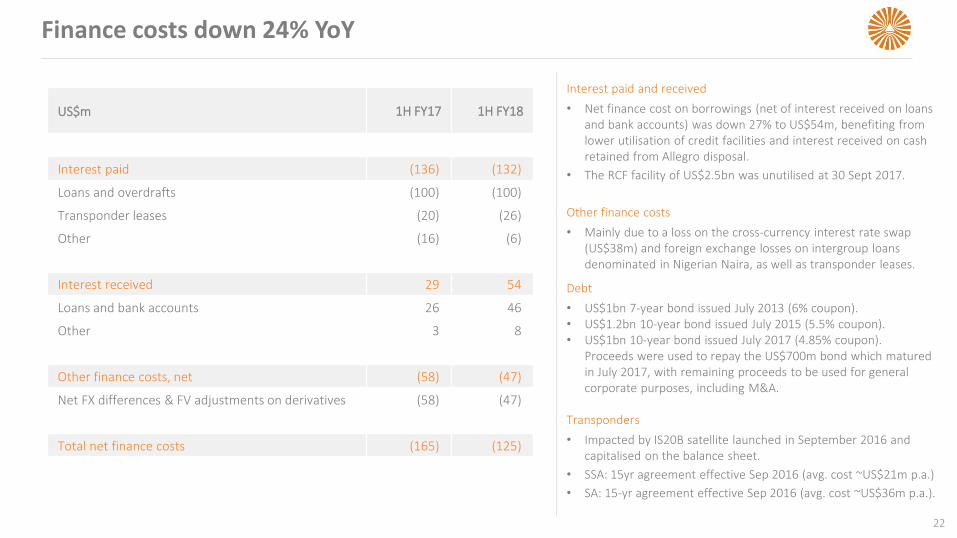
Interest paid and received
• Net finance cost on borrowings (net of interest received on loans and bank accounts) was down 27% to US$54m, benefiting from lower utilisation of credit facilities and interest received on cash retained from Allegro disposal.
• The RCF facility of US$2.5bn was unutilised at 30 Sept 2017.
Other finance costs
• Mainly due to a loss on the cross-currency interest rate swap (US$38m) and foreign exchange losses on intergroup loans denominated in Nigerian Naira, as well as transponder leases.
Debt
• US$1bn 7-year bond issued July 2013 (6% coupon).• US$1.2bn 10-year bond issued July 2015 (5.5% coupon).• US$1bn 10-year bond issued July 2017 (4.85% coupon).
Proceeds were used to repay the US$700m bond which matured in July 2017, with remaining proceeds to be used for general corporate purposes, including M&A.
Transponders
• Impacted by IS20B satellite launched in September 2016 and capitalised on the balance sheet.
• SSA: 15yr agreement effective Sep 2016 (avg. cost ~US$21m p.a.)
• SA: 15-yr agreement effective Sep 2016 (avg. cost ~US$36m p.a.).
Finance costs down 24% YoY
22
US$m 1H FY17 1H FY18
Interest paid (136) (132)
Loans and overdrafts (100) (100)
Transponder leases (20) (26)
Other (16) (6)
Interest received 29 54
Loans and bank accounts 26 46
Other 3 8
Other finance costs, net (58) (47)
Net FX differences & FV adjustments on derivatives (58) (47)
Total net finance costs (165) (125)
Core headline earnings growing strongly
23
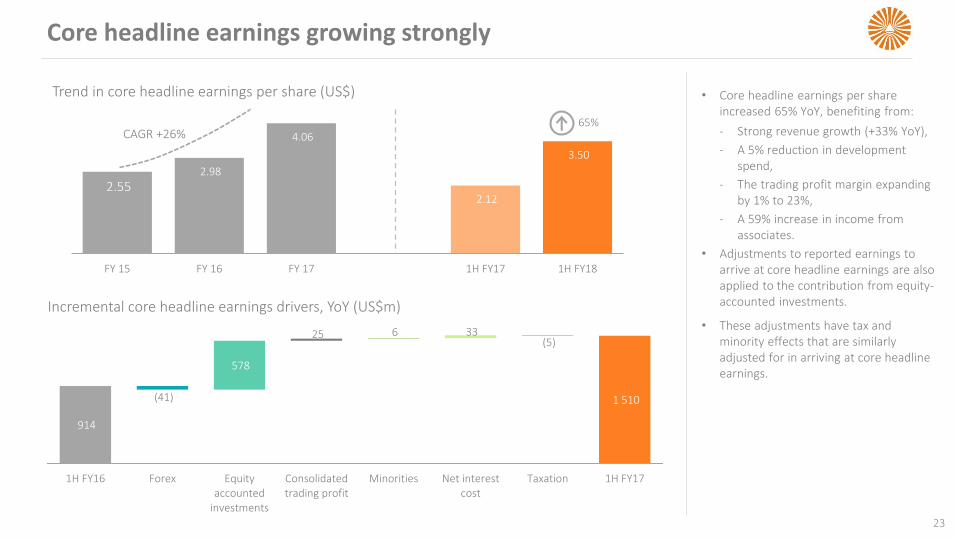
Trend in core headline earnings per share (US$)
2.55 2.98
4.06
2.12
3.50
FY 15 FY 16 FY 17 1H FY17 1H FY18
• Core headline earnings per share increased 65% YoY, benefiting from:
‐ Strong revenue growth (+33% YoY),
‐ A 5% reduction in development spend,
‐ The trading profit margin expanding by 1% to 23%,
‐ A 59% increase in income from associates.
• Adjustments to reported earnings to arrive at core headline earnings are also applied to the contribution from equity-accounted investments.
• These adjustments have tax and minority effects that are similarly adjusted for in arriving at core headline earnings.
65% CAGR +26%
Incremental core headline earnings drivers, YoY (US$m)
1 510 (41)
578
25 6 33 (5)
914
1H FY16 Forex Equityaccounted
investments
Consolidatedtrading profit
Minorities Net interestcost
Taxation 1H FY17
Core headline earnings reconciliation
24
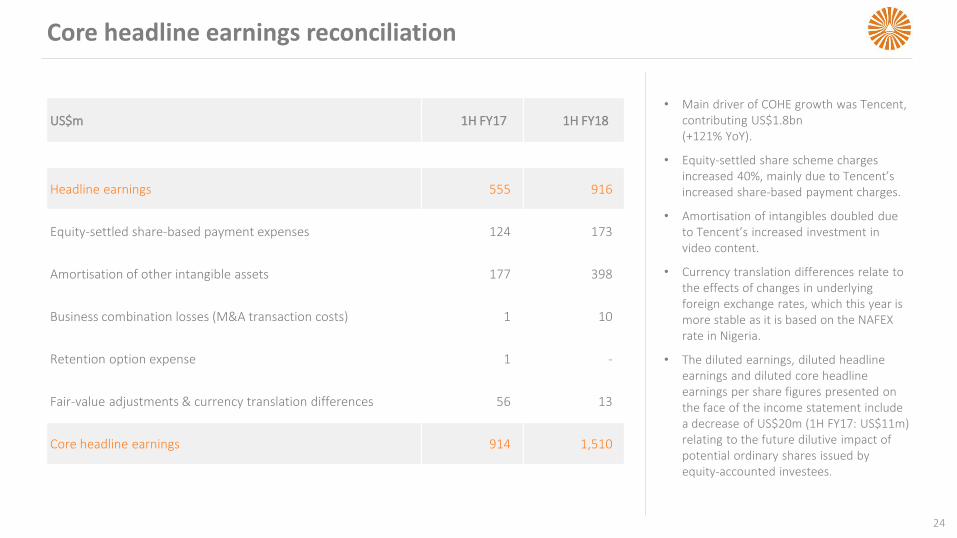
US$m 1H FY17 1H FY18
Headline earnings 555 916
Equity-settled share-based payment expenses 124 173
Amortisation of other intangible assets 177 398
Business combination losses (M&A transaction costs) 1 10
Retention option expense 1 -
Fair-value adjustments & currency translation differences 56 13
Core headline earnings 914 1,510
• Main driver of COHE growth was Tencent, contributing US$1.8bn (+121% YoY).
• Equity-settled share scheme charges increased 40%, mainly due to Tencent’sincreased share-based payment charges.
• Amortisation of intangibles doubled due to Tencent’s increased investment in video content.
• Currency translation differences relate to the effects of changes in underlying foreign exchange rates, which this year is more stable as it is based on the NAFEX rate in Nigeria.
• The diluted earnings, diluted headline earnings and diluted core headline earnings per share figures presented on the face of the income statement include a decrease of US$20m (1H FY17: US$11m) relating to the future dilutive impact of potential ordinary shares issued by equity-accounted investees.
Balance sheet strong, current business plans fully funded
25
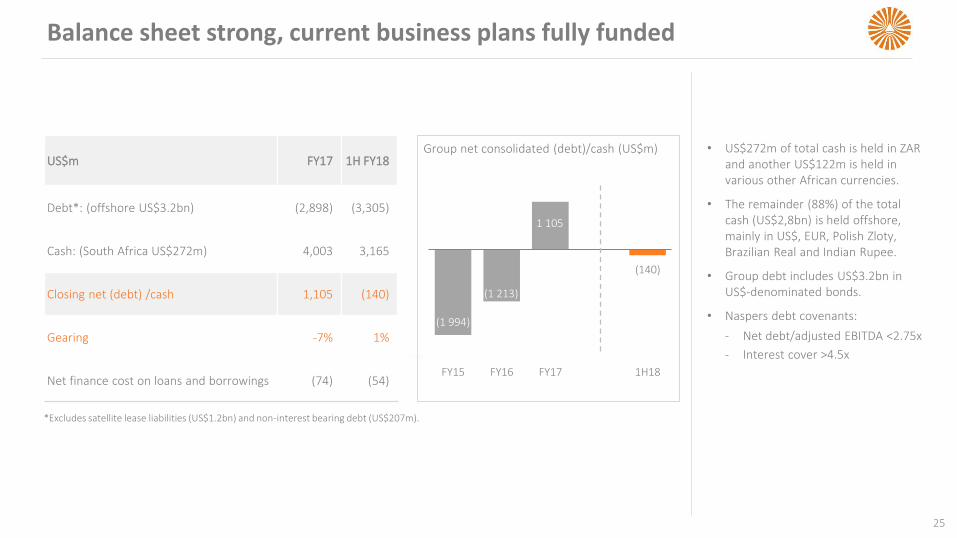
• US$272m of total cash is held in ZAR and another US$122m is held in various other African currencies.
• The remainder (88%) of the total cash (US$2,8bn) is held offshore, mainly in US$, EUR, Polish Zloty, Brazilian Real and Indian Rupee.
• Group debt includes US$3.2bn in US$-denominated bonds.
• Naspers debt covenants:
‐ Net debt/adjusted EBITDA <2.75x
‐ Interest cover >4.5x
*Excludes satellite lease liabilities (US$1.2bn) and non-interest bearing debt (US$207m).
Group net consolidated (debt)/cash (US$m) US$m FY17 1H FY18
Debt*: (offshore US$3.2bn) (2,898) (3,305)
Cash: (South Africa US$272m) 4,003 3,165
Closing net (debt) /cash 1,105 (140)
Gearing -7% 1%
Net finance cost on loans and borrowings (74) (54)
(1 994)
(1 213)
1 105
(140)
-2 500
FY15 FY16 FY17 1H18
Debt maturity profile and debt position
26
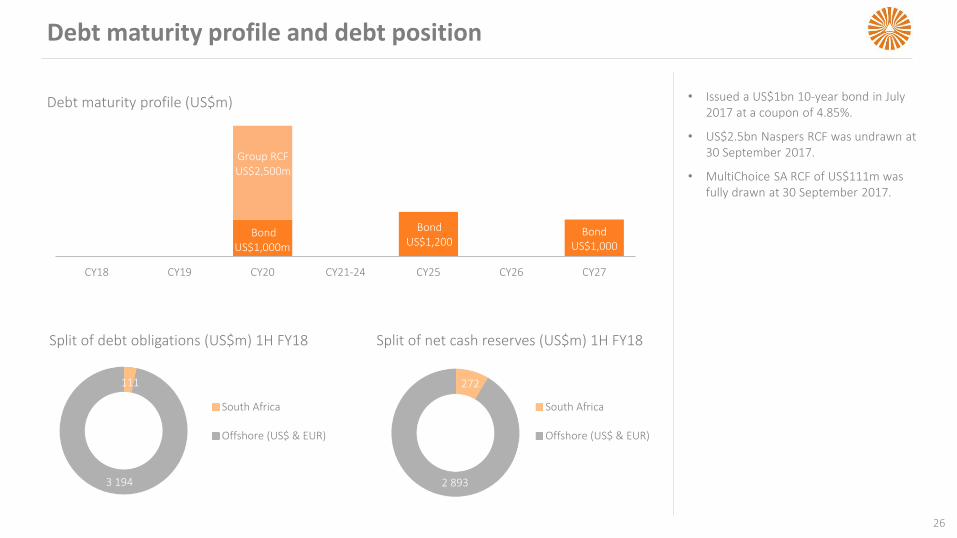
Debt maturity profile (US$m)
Split of net cash reserves (US$m) 1H FY18Split of debt obligations (US$m) 1H FY18
272
2 893
South Africa
Offshore (US$ & EUR)
111
3 194
South Africa
Offshore (US$ & EUR)
• Issued a US$1bn 10-year bond in July 2017 at a coupon of 4.85%.
• US$2.5bn Naspers RCF was undrawn at 30 September 2017.
• MultiChoice SA RCF of US$111m was fully drawn at 30 September 2017.
Group RCF US$2,500m
Bond US$1,000m
Bond US$1,200
CY18 CY19 CY20 CY21-24 CY25 CY26 CY27
BondUS$1,000
Current assets and liabilities
27
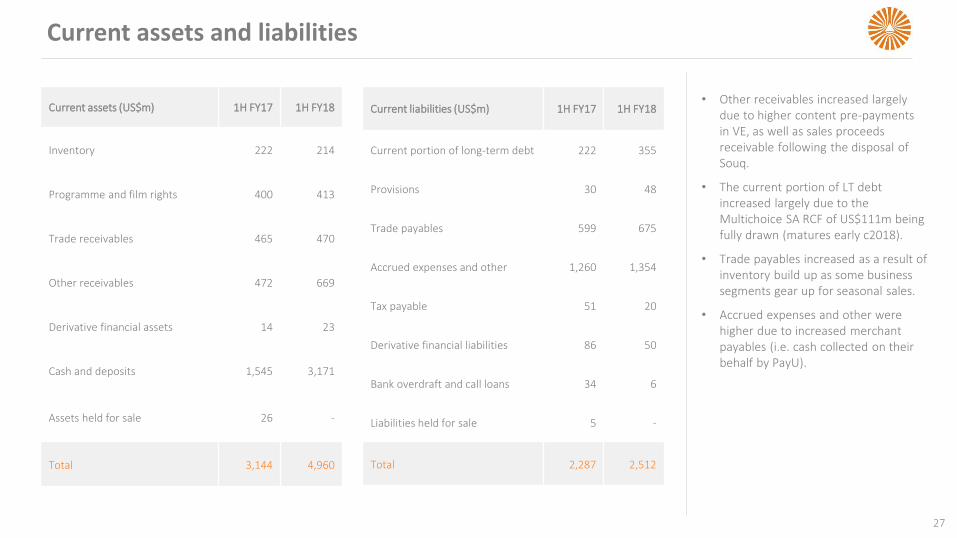
Current assets (US$m) 1H FY17 1H FY18
Inventory 222 214
Programme and film rights 400 413
Trade receivables 465 470
Other receivables 472 669
Derivative financial assets 14 23
Cash and deposits 1,545 3,171
Assets held for sale 26 -
Total 3,144 4,960
Current liabilities (US$m) 1H FY17 1H FY18
Current portion of long-term debt 222 355
Provisions 30 48
Trade payables 599 675
Accrued expenses and other 1,260 1,354
Tax payable 51 20
Derivative financial liabilities 86 50
Bank overdraft and call loans 34 6
Liabilities held for sale 5 -
Total 2,287 2,512
• Other receivables increased largely due to higher content pre-payments in VE, as well as sales proceeds receivable following the disposal of Souq.
• The current portion of LT debt increased largely due to the Multichoice SA RCF of US$111m being fully drawn (matures early c2018).
• Trade payables increased as a result of inventory build up as some business segments gear up for seasonal sales.
• Accrued expenses and other were higher due to increased merchant payables (i.e. cash collected on their behalf by PayU).
Capital expenditure
28
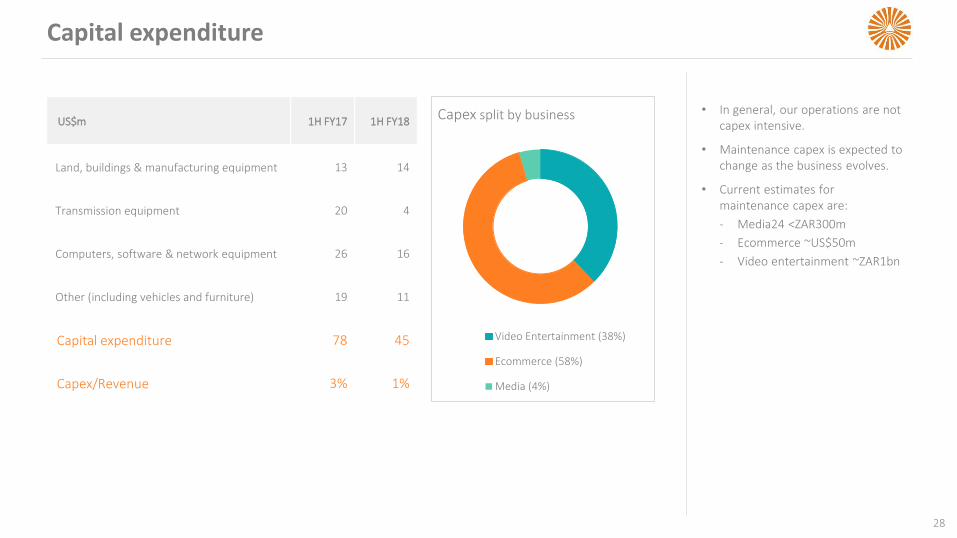
US$m 1H FY17 1H FY18
Land, buildings & manufacturing equipment 13 14
Transmission equipment 20 4
Computers, software & network equipment 26 16
Other (including vehicles and furniture) 19 11
Capital expenditure 78 45
Capex/Revenue 3% 1%
Capex split by business
Video Entertainment (38%)
Ecommerce (58%)
Media (4%)
• In general, our operations are not capex intensive.
• Maintenance capex is expected to change as the business evolves.
• Current estimates for maintenance capex are:
‐ Media24 <ZAR300m
‐ Ecommerce ~US$50m
‐ Video entertainment ~ZAR1bn
FX exposure: hedging
29
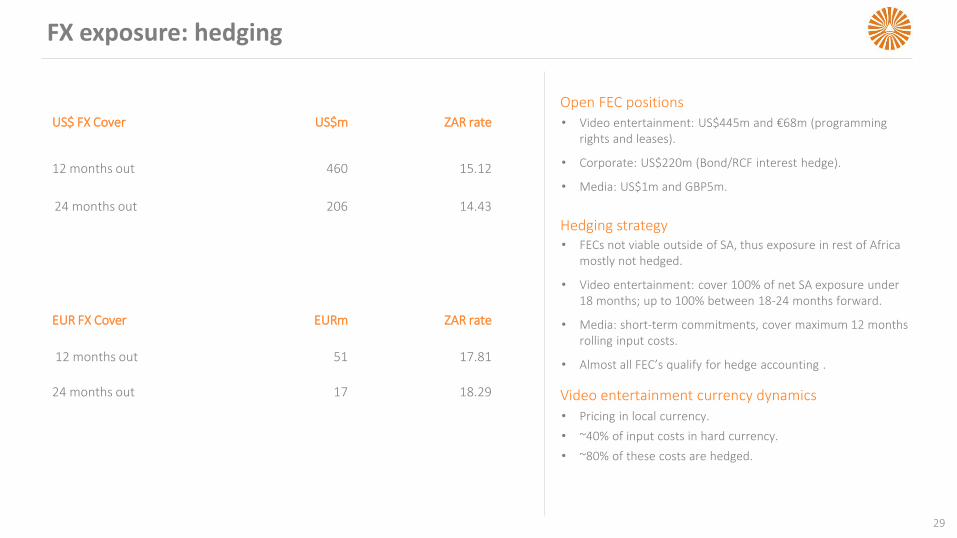
US$ FX Cover US$m ZAR rate
12 months out 460 15.12
24 months out 206 14.43
EUR FX Cover EURm ZAR rate
12 months out 51 17.81
24 months out 17 18.29
• Video entertainment: US$445m and €68m (programming rights and leases).
• Corporate: US$220m (Bond/RCF interest hedge).
• Media: US$1m and GBP5m.
Open FEC positions
• FECs not viable outside of SA, thus exposure in rest of Africa mostly not hedged.
• Video entertainment: cover 100% of net SA exposure under 18 months; up to 100% between 18-24 months forward.
• Media: short-term commitments, cover maximum 12 months rolling input costs.
• Almost all FEC’s qualify for hedge accounting .
Hedging strategy
• Pricing in local currency.
• ~40% of input costs in hard currency.
• ~80% of these costs are hedged.
Video entertainment currency dynamics

OPERATIONS
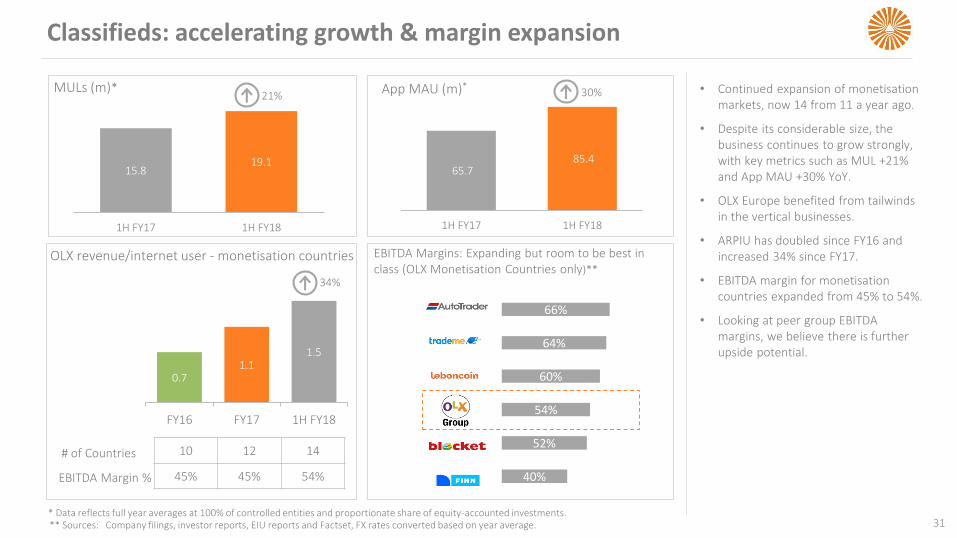
Classifieds: accelerating growth & margin expansion
31** Sources: Company filings, investor reports, EIU reports and Factset, FX rates converted based on year average.
EBITDA Margins: Expanding but room to be best in class (OLX Monetisation Countries only)**
OLX revenue/internet user - monetisation countries
0.71.1
1.5
FY16 FY17 1H FY18
# of Countries
EBITDA Margin %
34%
10 12 14
45% 45% 54% 40%
52%
54%
60%
64%
66%
• Continued expansion of monetisation markets, now 14 from 11 a year ago.
• Despite its considerable size, the business continues to grow strongly, with key metrics such as MUL +21% and App MAU +30% YoY.
• OLX Europe benefited from tailwinds in the vertical businesses.
• ARPIU has doubled since FY16 and increased 34% since FY17.
• EBITDA margin for monetisationcountries expanded from 45% to 54%.
• Looking at peer group EBITDA margins, we believe there is further upside potential.
15.819.1
1H FY17 1H FY18
MULs (m)*
65.7 85.4
1H FY17 1H FY18
App MAU (m)*21% 30%
* Data reflects full year averages at 100% of controlled entities and proportionate share of equity-accounted investments.
MULs
App MAUs
# of PayingListers
2.2 3.3
6.2 4.7
6.8
FY14 FY15 FY16 9m FY16 9m FY17
4.36.7
11.78.4
11.3
FY14 FY15 FY16 9m FY16 9m FY17
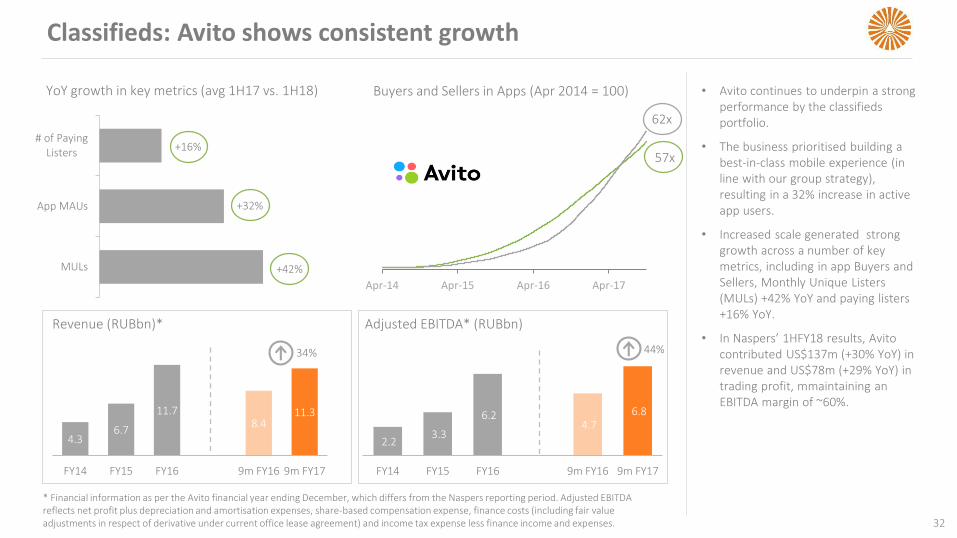
Classifieds: Avito shows consistent growth
32
• Avito continues to underpin a strong performance by the classifieds portfolio.
• The business prioritised building a best-in-class mobile experience (in line with our group strategy), resulting in a 32% increase in active app users.
• Increased scale generated strong growth across a number of key metrics, including in app Buyers and Sellers, Monthly Unique Listers(MULs) +42% YoY and paying listers+16% YoY.
• In Naspers’ 1HFY18 results, Avitocontributed US$137m (+30% YoY) in revenue and US$78m (+29% YoY) in trading profit, mmaintaining an EBITDA margin of ~60%.
Buyers and Sellers in Apps (Apr 2014 = 100)YoY growth in key metrics (avg 1H17 vs. 1H18)
62x
57x
Revenue (RUBbn)*
34%
Adjusted EBITDA* (RUBbn)
44%
+16%
+32%
+42%
Apr-14 Apr-15 Apr-16 Apr-17
* Financial information as per the Avito financial year ending December, which differs from the Naspers reporting period. Adjusted EBITDA reflects net profit plus depreciation and amortisation expenses, share-based compensation expense, finance costs (including fair value adjustments in respect of derivative under current office lease agreement) and income tax expense less finance income and expenses.
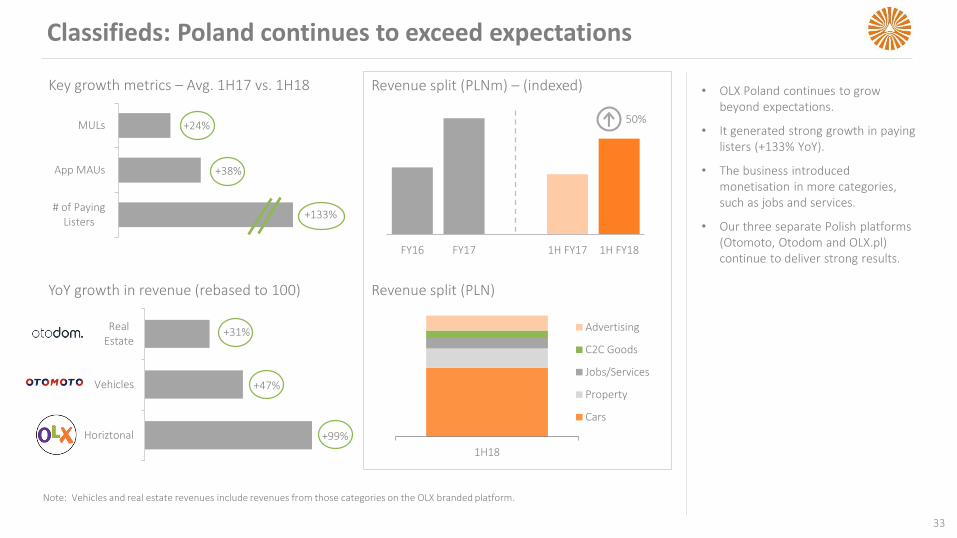
Classifieds: Poland continues to exceed expectations
33
# of PayingListers
App MAUs
MULs +24%
Horiztonal
Vehicles
RealEstate
Note: Vehicles and real estate revenues include revenues from those categories on the OLX branded platform.
YoY growth in revenue (rebased to 100)
+38%
+31%
+47%
+99%
+133%
Key growth metrics – Avg. 1H17 vs. 1H18 • OLX Poland continues to grow beyond expectations.
• It generated strong growth in paying listers (+133% YoY).
• The business introduced monetisation in more categories, such as jobs and services.
• Our three separate Polish platforms (Otomoto, Otodom and OLX.pl) continue to deliver strong results.
Revenue split (PLNm) – (indexed)
50%
FY16 FY17 1H FY17 1H FY18
1H18
Advertising
C2C Goods
Jobs/Services
Property
Cars
Revenue split (PLN)
34
1H FY17 1H FY18
88%
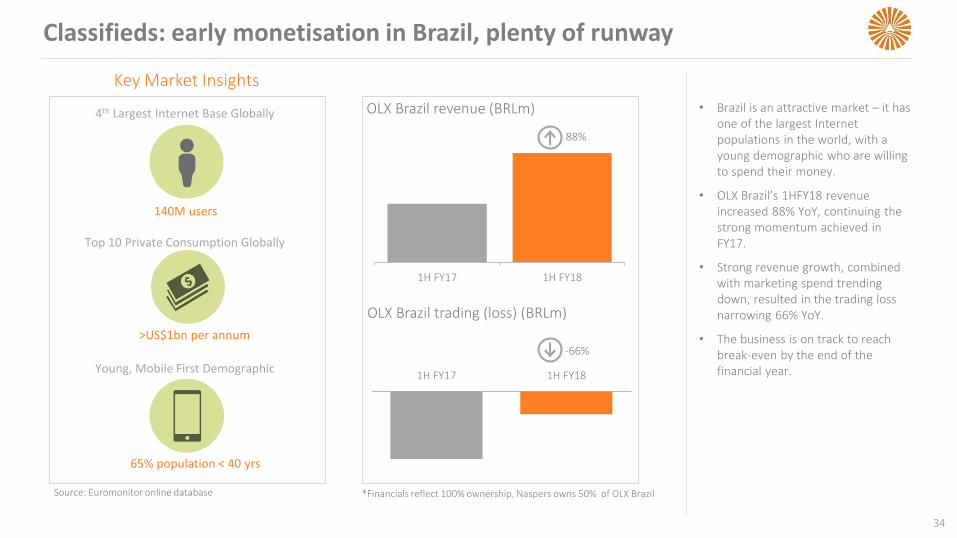
Classifieds: early monetisation in Brazil, plenty of runway
Key Market Insights
4th Largest Internet Base Globally
140M users
Top 10 Private Consumption Globally
>US$1bn per annum
Young, Mobile First Demographic
65% population < 40 yrs
*Financials reflect 100% ownership, Naspers owns 50% of OLX BrazilSource: Euromonitor online database
OLX Brazil revenue (BRLm) • Brazil is an attractive market – it has one of the largest Internet populations in the world, with a young demographic who are willing to spend their money.
• OLX Brazil’s 1HFY18 revenue increased 88% YoY, continuing the strong momentum achieved in FY17.
• Strong revenue growth, combined with marketing spend trending down, resulted in the trading loss narrowing 66% YoY.
• The business is on track to reach break-even by the end of the financial year.
OLX Brazil trading (loss) (BRLm)
-66%
1H FY17 1H FY18
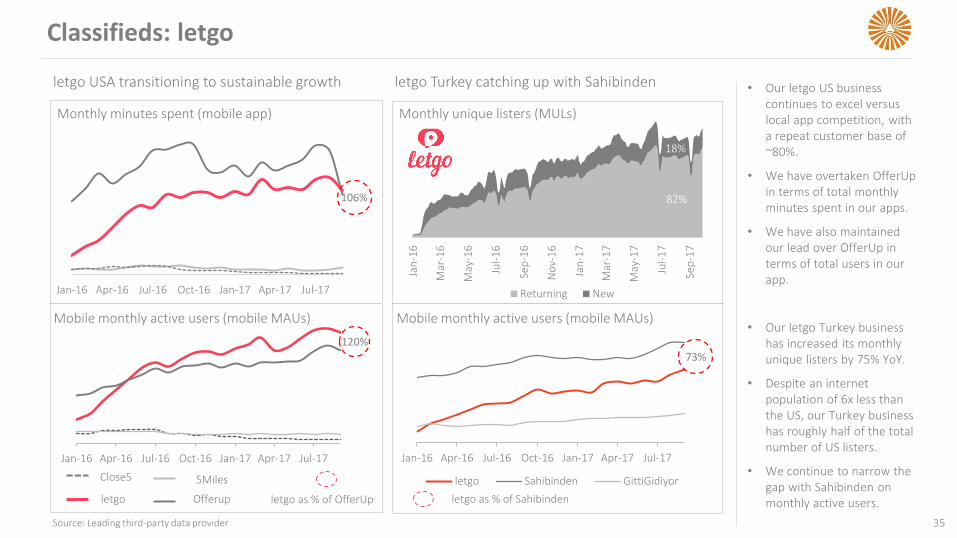
Classifieds: letgo
35
Monthly minutes spent (mobile app)
Mobile monthly active users (mobile MAUs)
120%
19%
81%
19%
Jan-16 Apr-16 Jul-16 Oct-16 Jan-17 Apr-17 Jul-17
Close5
letgo
5Miles
Offerup letgo as % of OfferUp
Source: Leading third-party data provider
106%
• Our letgo US business continues to excel versus local app competition, with a repeat customer base of ~80%.
• We have overtaken OfferUpin terms of total monthly minutes spent in our apps.
• We have also maintained our lead over OfferUp in terms of total users in our app.
• Our letgo Turkey business has increased its monthly unique listers by 75% YoY.
• Despite an internet population of 6x less than the US, our Turkey business has roughly half of the total number of US listers.
• We continue to narrow the gap with Sahibinden on monthly active users.
Jan-16 Apr-16 Jul-16 Oct-16 Jan-17 Apr-17 Jul-17
letgo USA transitioning to sustainable growth letgo Turkey catching up with Sahibinden
Jan
-16
Mar
-16
May
-16
Jul-
16
Sep
-16
No
v-1
6
Jan
-17
Mar
-17
May
-17
Jul-
17
Sep
-17
Returning New
82%
18%
Monthly unique listers (MULs)
Jan-16 Apr-16 Jul-16 Oct-16 Jan-17 Apr-17 Jul-17
letgo Sahibinden GittiGidiyor
73%
letgo as % of Sahibinden
Mobile monthly active users (mobile MAUs)
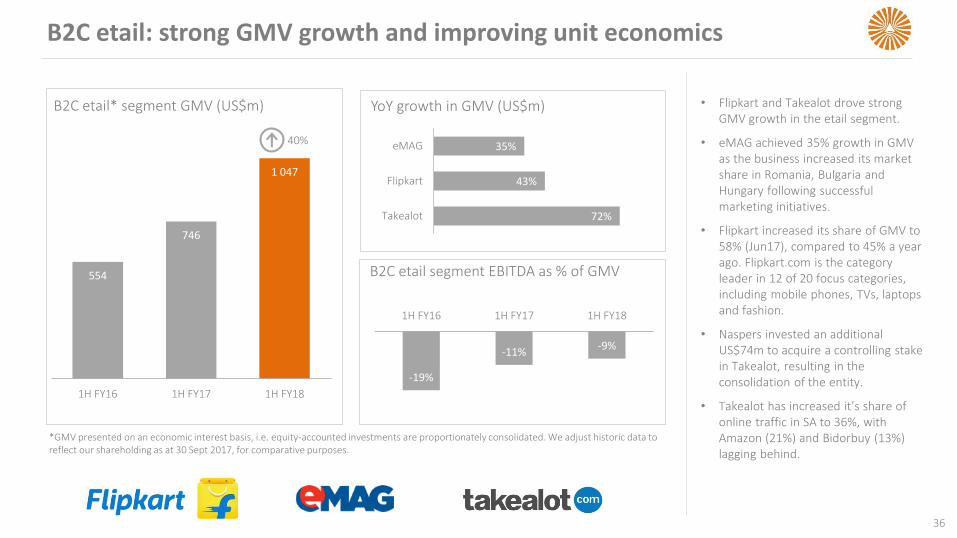
B2C etail: strong GMV growth and improving unit economics
36
• Flipkart and Takealot drove strong GMV growth in the etail segment.
• eMAG achieved 35% growth in GMV as the business increased its market share in Romania, Bulgaria and Hungary following successful marketing initiatives.
• Flipkart increased its share of GMV to 58% (Jun17), compared to 45% a year ago. Flipkart.com is the category leader in 12 of 20 focus categories, including mobile phones, TVs, laptops and fashion.
• Naspers invested an additional US$74m to acquire a controlling stake in Takealot, resulting in the consolidation of the entity.
• Takealot has increased it’s share of online traffic in SA to 36%, with Amazon (21%) and Bidorbuy (13%) lagging behind.
B2C etail* segment GMV (US$m)
40%
YoY growth in GMV (US$m)
72%
43%
35%
Takealot
Flipkart
eMAG
-19%
-11%-9%
1H FY16 1H FY17 1H FY18
B2C etail segment EBITDA as % of GMV554
746
1 047
1H FY16 1H FY17 1H FY18
*GMV presented on an economic interest basis, i.e. equity-accounted investments are proportionately consolidated. We adjust historic data to reflect our shareholding as at 30 Sept 2017, for comparative purposes.
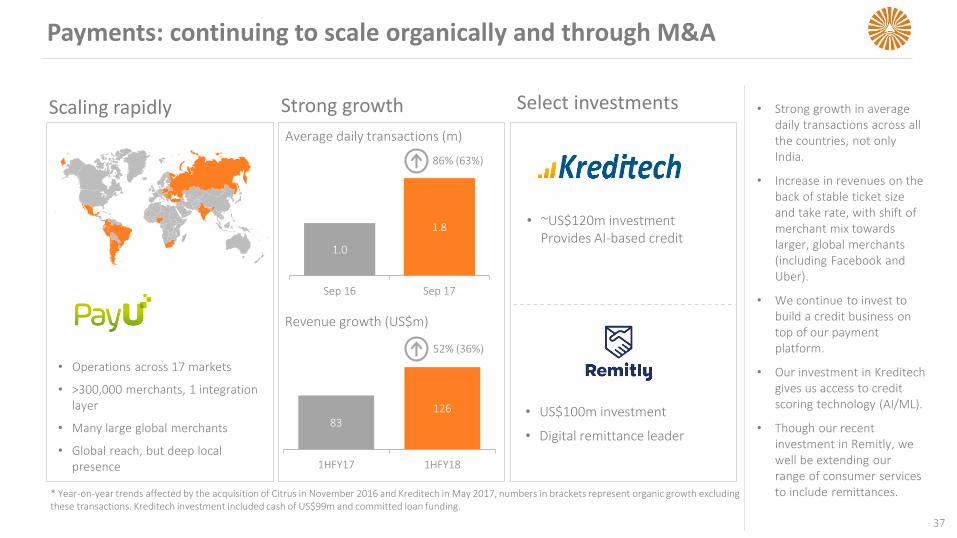
Payments: continuing to scale organically and through M&A
Revenue growth (US$m)
52% (36%)
1.0
1.8
Sep 16 Sep 17
Average daily transactions (m)
86% (63%)
• Operations across 17 markets
• >300,000 merchants, 1 integration layer
• Many large global merchants
• Global reach, but deep local presence
• ~US$120m investment Provides AI-based credit
Scaling rapidly Strong growth Select investments
83126
1HFY17 1HFY18
* Year-on-year trends affected by the acquisition of Citrus in November 2016 and Kreditech in May 2017, numbers in brackets represent organic growth excluding these transactions. Kreditech investment included cash of US$99m and committed loan funding.
• US$100m investment
• Digital remittance leader
• Strong growth in average daily transactions across all the countries, not only India.
• Increase in revenues on the back of stable ticket size and take rate, with shift of merchant mix towards larger, global merchants (including Facebook and Uber).
• We continue to invest to build a credit business on top of our payment platform.
• Our investment in Kreditechgives us access to credit scoring technology (AI/ML).
• Though our recent investment in Remitly, we well be extending our range of consumer services to include remittances.
37
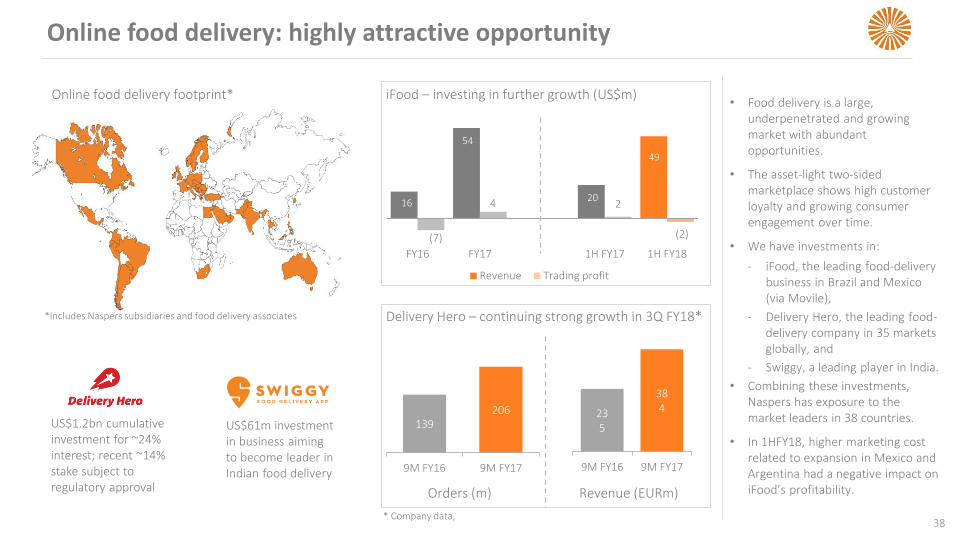
Online food delivery: highly attractive opportunity
38
Online food delivery footprint* iFood – investing in further growth (US$m)
Delivery Hero – continuing strong growth in 3Q FY18*
16
54
20
49
(7)
4 2
(2)
FY16 FY17 1H FY17 1H FY18
Revenue Trading profit
*Includes Naspers subsidiaries and food delivery associates
• Food delivery is a large, underpenetrated and growing market with abundant opportunities.
• The asset-light two-sided marketplace shows high customer loyalty and growing consumer engagement over time.
• We have investments in:
‐ iFood, the leading food-delivery business in Brazil and Mexico (via Movile),
‐ Delivery Hero, the leading food-delivery company in 35 markets globally, and
‐ Swiggy, a leading player in India.
• Combining these investments, Naspers has exposure to the market leaders in 38 countries.
• In 1HFY18, higher marketing cost related to expansion in Mexico and Argentina had a negative impact on iFood’s profitability.
US$1.2bn cumulative investment for ~24% interest; recent ~14% stake subject to regulatory approval
US$61m investment in business aiming to become leader in Indian food delivery
* Company data,
139206
9M FY16 9M FY17
235
384
9M FY16 9M FY17
Orders (m) Revenue (EURm)
4,699 5,174 5,563 6,048 6,636
2 019 2 355
2 243 2 401
2 615
541
873
2 428
2 553
2 981
1H FY14 1H FY15 1H FY16 1H FY17 1H FY18
SA DTH SSA DTH SSA DTT
52% 56%
30% 29%
18% 15%
1H FY17 1H FY18
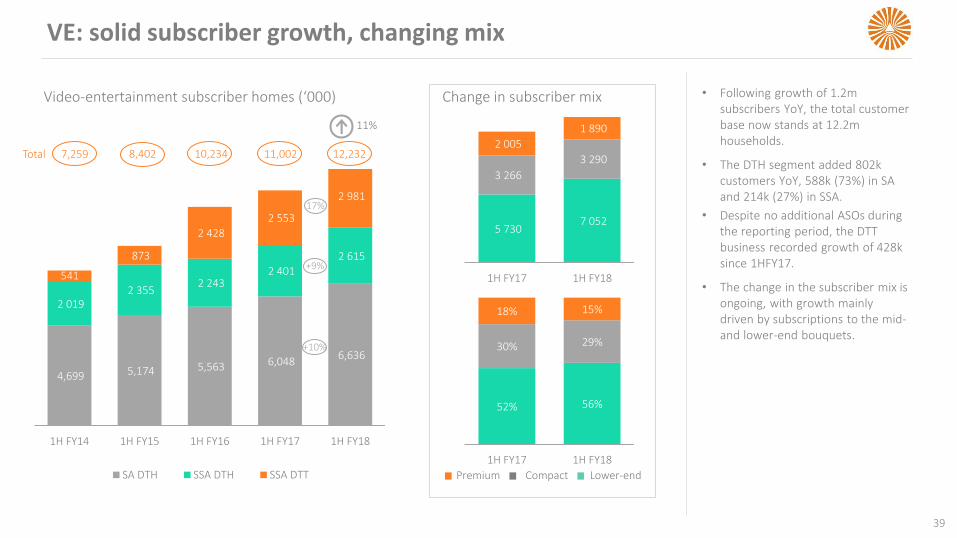
VE: solid subscriber growth, changing mix
• Following growth of 1.2m subscribers YoY, the total customer base now stands at 12.2m households.
• The DTH segment added 802k customers YoY, 588k (73%) in SA and 214k (27%) in SSA.
• Despite no additional ASOs during the reporting period, the DTT business recorded growth of 428k since 1HFY17.
• The change in the subscriber mix is ongoing, with growth mainly driven by subscriptions to the mid-and lower-end bouquets.
Video-entertainment subscriber homes (‘000)
11%
Change in subscriber mix
Premium Compact Lower-end
7,259 8,402 10,234 11,002 12,232Total
17%
+9%
+10%
5 730 7 052
3 266
3 290
2 005
1 890
1H FY17 1H FY18
39
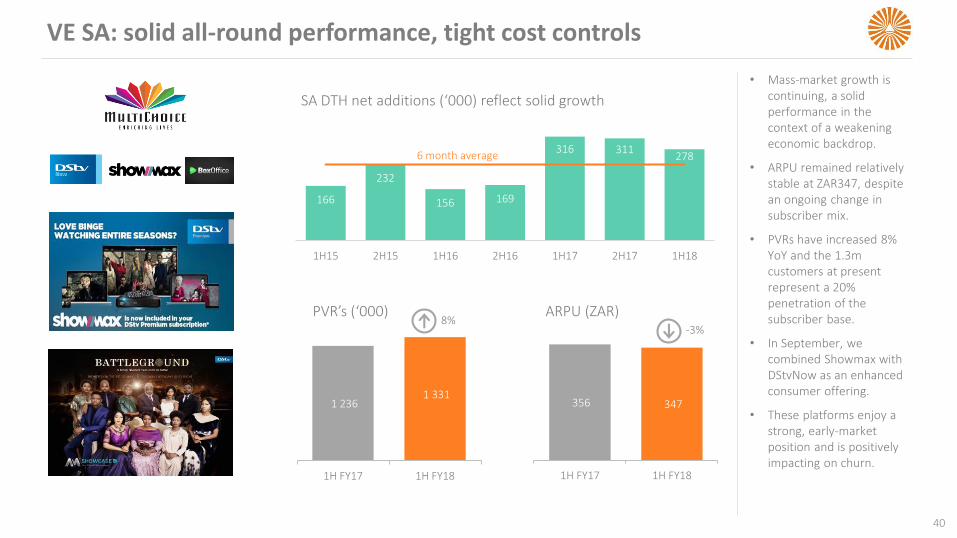
VE SA: solid all-round performance, tight cost controls
40
166
232
156 169
316 311278
1H15 2H15 1H16 2H16 1H17 2H17 1H18
SA DTH net additions (‘000) reflect solid growth
6 month average
1 236 1 331
1H FY17 1H FY18
PVR’s (‘000) ARPU (ZAR)8%
356 347
1H FY17 1H FY18
-3%
• Mass-market growth is continuing, a solid performance in the context of a weakening economic backdrop.
• ARPU remained relatively stable at ZAR347, despite an ongoing change in subscriber mix.
• PVRs have increased 8% YoY and the 1.3m customers at present represent a 20% penetration of the subscriber base.
• In September, we combined Showmax with DStvNow as an enhanced consumer offering.
• These platforms enjoy a strong, early-market position and is positively impacting on churn.
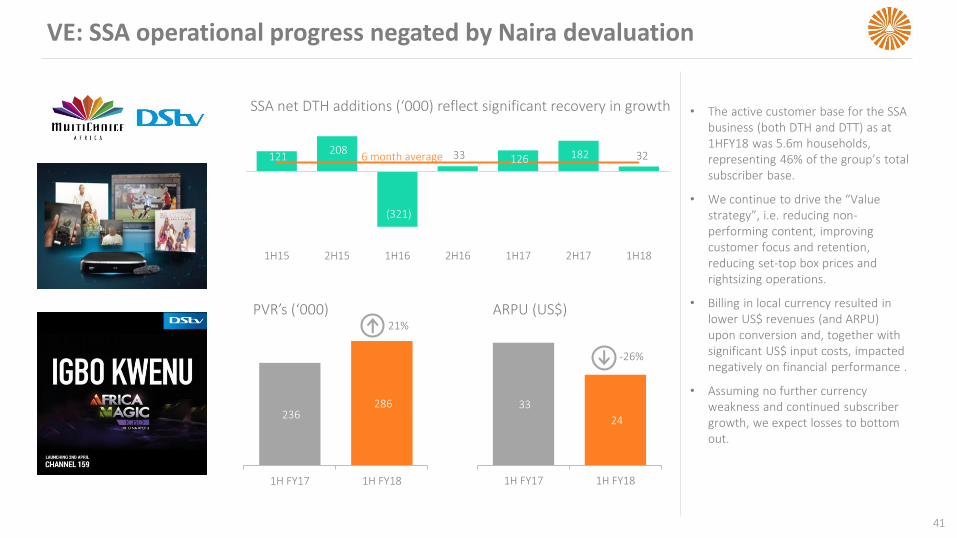
VE: SSA operational progress negated by Naira devaluation
41
• The active customer base for the SSA business (both DTH and DTT) as at 1HFY18 was 5.6m households, representing 46% of the group’s total subscriber base.
• We continue to drive the “Value strategy”, i.e. reducing non-performing content, improving customer focus and retention, reducing set-top box prices and rightsizing operations.
• Billing in local currency resulted in lower US$ revenues (and ARPU) upon conversion and, together with significant US$ input costs, impacted negatively on financial performance .
• Assuming no further currency weakness and continued subscriber growth, we expect losses to bottom out.
121 208
(321)
33 126 182 32
1H15 2H15 1H16 2H16 1H17 2H17 1H18
6 month average
SSA net DTH additions (‘000) reflect significant recovery in growth
236 286
1H FY17 1H FY18
PVR’s (‘000)21%
ARPU (US$)
33
24
1H FY17 1H FY18
-26%
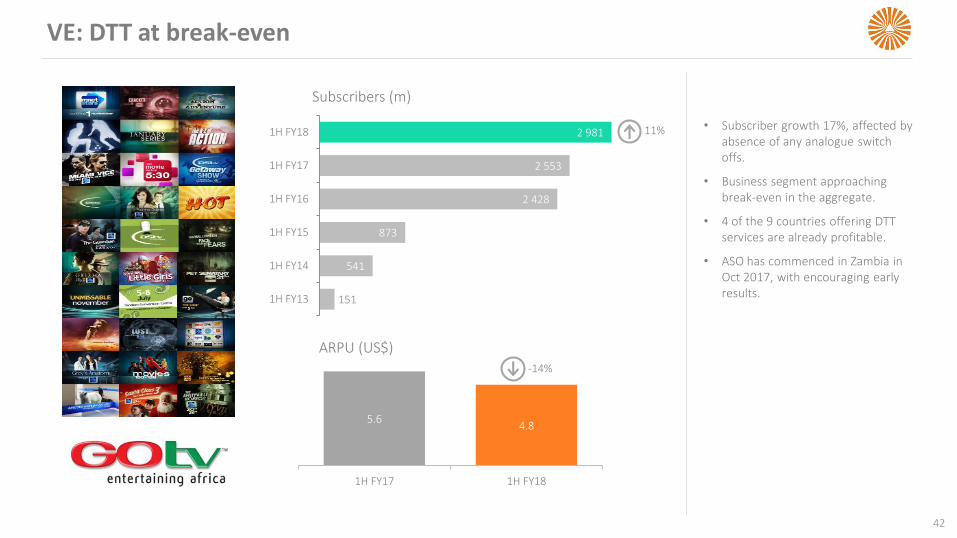
VE: DTT at break-even
42
• Subscriber growth 17%, affected by absence of any analogue switch offs.
• Business segment approaching break-even in the aggregate.
• 4 of the 9 countries offering DTT services are already profitable.
• ASO has commenced in Zambia in Oct 2017, with encouraging early results.
Subscribers (m)
151
541
873
2 428
2 553
2 981
1H FY13
1H FY14
1H FY15
1H FY16
1H FY17
1H FY18 11%
ARPU (US$)
5.64.8
1H FY17 1H FY18
-14%

APPENDIX
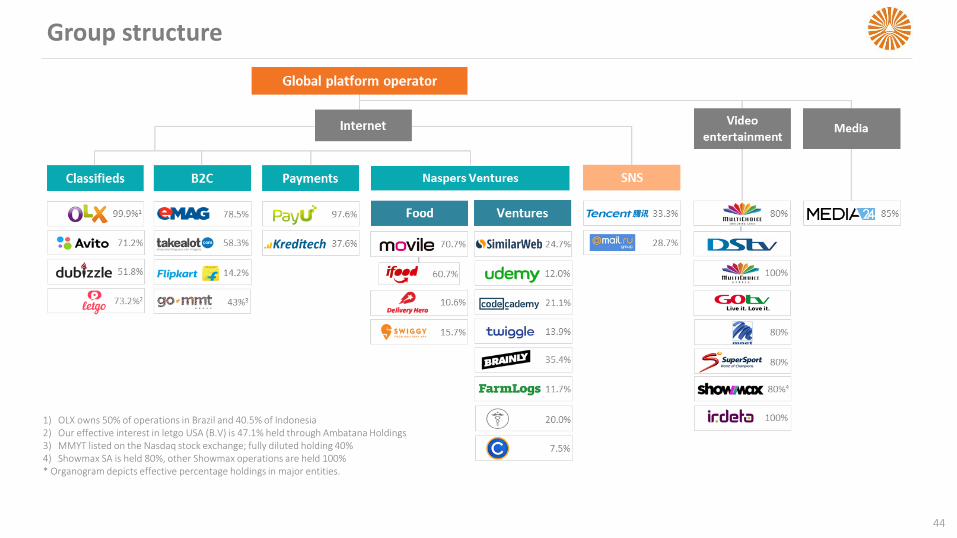
Group structure
44
1) OLX owns 50% of operations in Brazil and 40.5% of Indonesia2) Our effective interest in letgo USA (B.V) is 47.1% held through Ambatana Holdings3) MMYT listed on the Nasdaq stock exchange; fully diluted holding 40%4) Showmax SA is held 80%, other Showmax operations are held 100%* Organogram depicts effective percentage holdings in major entities.
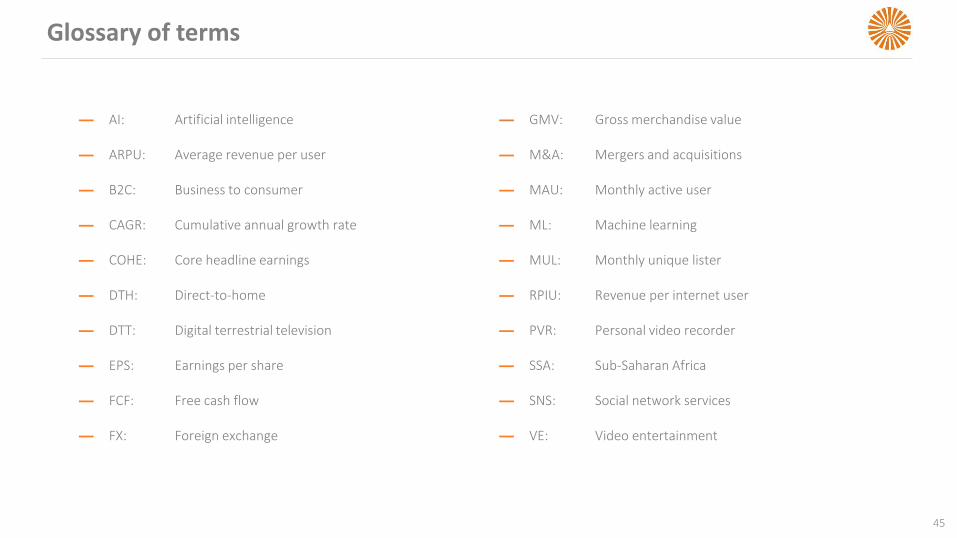
Glossary of terms
45
— AI: Artificial intelligence
— ARPU: Average revenue per user
— B2C: Business to consumer
— CAGR: Cumulative annual growth rate
— COHE: Core headline earnings
— DTH: Direct-to-home
— DTT: Digital terrestrial television
— EPS: Earnings per share
— FCF: Free cash flow
— FX: Foreign exchange
— GMV: Gross merchandise value
— M&A: Mergers and acquisitions
— MAU: Monthly active user
— ML: Machine learning
— MUL: Monthly unique lister
— RPIU: Revenue per internet user
— PVR: Personal video recorder
— SSA: Sub-Saharan Africa
— SNS: Social network services
— VE: Video entertainment