Embed Size (px)
Citation preview

Analyst
ARTICLE
This journal is © The Royal Society of Chemistry 20xx J. Name., 2013, 00, 1-3 | 1
Please do not adjust margins
Please do not adjust margins
a. Department of Chemistry, Illinois Institute of Technology, Chicago, IL 60616, USA. E-mail: [email protected]. Tel: 312-567-8922. Fax: 312-567-3494.
Electronic Supplementary Information (ESI) available: [Additional figures, including effect of cGO concentration on fluorescence intensity and quenching efficiency of peptide Pep-FAM, raman spectra of cGO and cGO-Pep-FAM, effect of reaction time on cGO-Pep-FAM detection of ADAM17, and effect of HSA on the background fluorescence intensity of the cGO-Pep-FAM sensor]. See DOI: 10.1039/x0xx00000x
Received 00th January 20xx,
Accepted 00th January 20xx
DOI: 10.1039/x0xx00000x
www.rsc.org/
Rapid and Sensitive Detection of the Activity of ADAM17 using Graphene Oxide-based Fluorescent Sensor
Youwen Zhang, Xiaohan Chen, Golbarg M Roozbahani, Xiyun Guan*
A disintegrin and metalloproteinase 17 (ADAM17) has become a novel biomarker and potential therapeutic target for the
early detection and treatment of human cancers. In this work, by covalently attaching fluorescent labeled ADAM17
substrate peptide (Pep-FAM) molecules to carboxylated graphene oxide (cGO), and monitoring the cleavage of the peptide
substrate by ADAM17, we developed a cGO-Pep-FAM fluorescent sensor for the rapid, sensitive and accurate detection of
ADAM17. The sensor was highly sensitive with a detection limit of 17.5 picomolar. Furthermore, the sensor was selective:
structure similar proteases such as ADAM9 and MMP-9 would not interfere with ADAM17 detection. In addition,
simulated serum samples were successfully analyzed. Our developed cGO-Pep-FAM sensing strategy should find useful
applications in disease diagnosis and drug screening.
1. Introduction
ADAMs (short for a disintegrin and metalloproteinase) play
important roles in cell surface remodeling, ectodomain shedding,
regulation of growth factor availability, and mediating cell-cell and
cell-matrix interaction in both normal development and
pathological states such as Alzheimer’s diseases, arthritis, cancer,
and cardiac hypertrophy.1 As a member of ADAM family, a
disintegrin and metalloproteinase 17 (ADAM17) is also known as a
tumor necrosis factor-α-converting enzyme.2 An increased
expression of ADAM17 has been found in various inflammatory
diseases such as rheumatoid arthritis (RA), Crohn’s disease,
pulmonary inflammation, endotoxin shock, multiple sclerosis and
myocardial infarction.1-3 Recent studies showed that ADAM17 was
highly expressed in many human tumors and can promote tumor
invasion and metastasis.4 For example, significantly enhanced
expression of ADAM17 was found in hepatocellular carcinoma than
non-cancerous liver tissues.5 It was also demonstrated that
ADAM17 was involved in the progression of breast, ovarian, and
colorectal cancers.6-8 Therefore, ADAM17 has become a novel
biomarker and potential therapeutic target for the early detection
and treatment of human cancers.9 Thus far, two major approaches
have been used for ADAM17 detection. One is enzyme-linked
immunosorbent assay (ELISA), while the other is western blotting.
These two methods, although sensitive, are time-consuming, which
contain complicated steps such as multi-steps of washing /
immunoblotting and incubation, and usually take hours or even
days to provide results.10, 11 Furthermore, another limitation of
them is that they only detect protease abundance but could not
measure protease activity.12, 13 However, proteases are often tightly
regulated on a post-translational level leading to a potentially
significant divergence of abundance and activity. Hence, it is
important to develop a simple, rapid and sensitive method for
detection of the activity of ADAM17.
Scheme 1. The principle of detecting ADAM17. The cleavage of the
peptide substrate by ADAM17 releases a dye-labeled short peptide
fragment into the solution, thus producing fluorescence.
In our previous study, we have successfully developed a graphene
oxide (GO) based fluorescence resonance energy transfer (FRET)
biosensing platform for the detection of HIV-1 protease activity.14
Due to the unique heterogeneous structure (coexistence of π state
sp2 carbon clusters and σ state sp3 C-O matrix),15 GO not only
provides a broad absorbance from 200 nm to 800 nm, but also
supplies a mass of chemical binding sites for further modification.16
Note that, one requirement for the development of highly sensitive
FRET sensors is the delicate matching of fluorophore and quencher
(i.e., the overlap of the emission spectrum of the fluorophore and
the absorption spectrum of the quencher). The capability of a

ARTICLE Analyst
2 | J. Name., 2012, 00, 1-3 This journal is © The Royal Society of Chemistry 20xx
Please do not adjust margins
Please do not adjust margins
quencher to cover a broad range of absorbance spectra has the
advantage of constructing a fluorescent sensor to detect multiple
analytes in one sample without employing multiple different
quenchers.17 Furthermore, both theoretical calculation and
experiments have demonstrated that GO was an efficient quencher
for various fluorophores with the quenching distance reaching as
far as 30 nm.18 Compared with other fluorescent quenchers such as
quantum dots, which typically allow less than 10 nm distance
between donor and acceptor, such a long quenching distance offers
unique opportunities to detect large biomolecules and study
biomolecule-biomolecule (e.g., protein-antibody) interactions.19-21
In this work, by attaching a dye labeled ADAM17 substrate peptide
to the GO surface, and monitoring the cleavage of the substrate by
ADAM17 (Scheme 1), we accomplished quantitative ADAM17
detection with good sensitivity, great simplicity and high
reproducibility.
2. Experimental Section
2.1 Chemicals and Reagents.
ADAM9 and ADAM17 were purchased from R&D Systems
(Minneapolis, MN), while the 5-FAM labeled ADAM17 protease
substrate peptide (Pep-FAM) with a sequence of NH2-
CALNNLAQAVRSSSARK(5-FAM) (95.22% pure) was ordered from
WatsonBio Sciences (Houston, TX). All the other chemicals,
including graphene oxide and MMP-9 were obtained from Sigma-
Aldrich (St. Louis, MO). ADAM17 and its substrate peptide were
dissolved in HPLC-grade water (ChromAR, Mallinckrodt Baker). The
stock solution of ADAM17 was prepared at 200 μg mL-1 and kept at
-80 °C before and after immediate use, while that of the peptide
substrate was prepared at a concentration of 1 mM and stored at -
20 °C before and after use. Two buffer solutions were used in this
study: (1) MES buffer (containing 100 mM 2-(N-morpholino)-
ethanesulfonic acid, pH 6.0); and (2) Tris buffer, which was
consisted of 50 mM Tris, 15 mM NaCl, and 5 μM ZnCl2 with the
solution pH adjusted to 7.5 using HCl.
2.2 Instruments.
Fluorescence spectra were obtained at λex/em = 492/515 nm by using
a luminescence spectrophotometer (LS50B, PerkinElmer, Waltham,
MA, USA). Infrared (IR) spectra were recorded from 1000 cm-1 to
4000 cm-1 with an infrared spectrophotometer (NEXUS 470 FT-IR,
Thermo Nicolet, Waltham, MA, USA) equipped with pressed KBr
pellets. UV-vis absorption spectra (from 200 nm to 800 nm) were
collected using a UV-Vis-NIR spectrophotometer (Varian Cary 500
Scan, Agilent, Santa Clara, CA, USA). Raman experiments were
performed in the range of 2000 cm-1 -1000 cm-1 using a confocal
Raman spectrometer with a 514 nm laser as the excitation source
(Renishaw, United Kingdom).
2.3 Synthesis of cGO-Pep-FAM.
Production of cGO-Pep-FAM sensor was carried out using GO as
starting material and based on two step reactions. The first step
was involved with a well-documented technique, i.e., use of
chloroacetic acid to transform unreactive hydroxyls of the GO
surface into carboxylate groups under strongly basic conditions 22,
while the second step took advantage of carbodiimide coupling
reaction with EDC and sulfo-NHS. Briefly, 4 mg mL-1 GO suspension
was mixed with 4.8 g NaOH and 4 g ClCH2COOH, and sonicated until
the hydroxyl groups of GO were converted to carboxyl groups. The
resultant solution was neutralized by HCl (1 M), and purified by
repeated rinsing with water until carboxylated GO (cGO) could be
well dispersed in water. Then, cGO (1 mg mL-1, 50 μL) was
dispersed in 1.0 mL of MES buffer (100 mM, pH 5.2). 20 μL of 200
mM 1-ethyl-3-(-3-dimethylaminopropyl) carbodiimide
hydrochloride (EDC) and 100 μL of 200 mM N-
hydroxysulfosuccinimide (Sulfo-NHS) were added to the cGO
suspension and sonicated for 30 min under an ice-water bath. The
resulting mixture was centrifuged at 12,000 rpm for 10 min, and the
supernatant was discarded. After washing the precipitate for three
more times to remove excess EDC and Sulfo-NHS, it was dispersed
in 1.0 mL of MES buffer and adjusted to pH 7.4 with NaOH, followed
by addition of 50 μL peptide substrate (1 mM). The mixture was
stirred at room temperature for 2 hours in darkness. The product
was purified by repeated centrifugation and rinsing with distilled
water three times to remove the unreacted peptide, and then
rinsing with 20 μL bull serum albumin (BSA, 20 mg mL-1) three times
to remove non-specifically absorbed peptide on the GO surface. The
final product was dispersed in 1 mL water and stored in a
refrigerator at 4 °C. Note that the molar ratio of the peptide
substrate Pep-FAM to cGO used to prepare the cGO-Pep-FAM
sensor as described above was determined from the fluorescence
quenching experiment. Under this experimental condition,
fluorescence quenching efficiency was relatively high (90%), while
the amount of cGO consumed was relatively small (Supplementary
Material, Fig. S1).
3. Results and discussion
3.1 Infrared, Raman, UV-vis Spectroscopy and Fluorescence Spectra.
The chemical structures of GO, cGO and cGO-Pep-FAM samples
were confirmed by infrared spectroscopy (FT-IR). As shown in Fig.
1a and Supplementary Material, Fig. S2, characteristic absorption
peaks appeared at 3400 cm-1 (stretching vibration of -OH), 1722 cm-
1 (stretching vibration of C=O), and 1580 cm-1 (stretching vibration
of C=C), revealing the presence of -OH, C=O and C=C functional
groups on GO. After activation of GO with chloroacetic acid, cGO
showed a stronger absorption band at 1634 cm-1, which indicated
the formation of carboxylate moieties COO- in comparison with GO.
After conjugation of the peptide with cGO, a strong characteristic
band appeared at 1655 cm-1 (stretching vibration of CO-NH) with an
increased small peak near 2900 cm-1 (stretching vibration of CH2),
which indicated the successful formation of covalent bond between
cGO and the peptide molecule. The structure of cGO was also
characterized by Raman spectroscopy. As depicted in
Supplementary Material, Figure S3, cGO showed a strong Raman
shift at 1344 cm−1 and 1587 cm−1, corresponding to the D- and G-
bands, respectively. It should be noted that the high intensity ratio
of D band and G band indicated a more amorphous carbon

Analyst ARTICLE
This journal is © The Royal Society of Chemistry 20xx J. Name., 2013, 00, 1-3 | 3
Please do not adjust margins
Please do not adjust margins
structure.23 The significant difference between the structures of
GO, cGO and cGO-Pep-FAM was also supported by our UV-vis
experiments. For example, as shown in Fig. 1b, the cGO-Pep-FAM
sample (50 μg mL-1) had much larger absorbance values in the
visible region than cGO (50 μg mL-1), and showed a small peak at
492 nm. This peak was located at a similar position to that of 5-
FAM labeled peptide (Pep-FAM), which was not observed with the
GO and cGO samples. Moreover, the huge difference between the
Raman spectra of cGO and cGO-Pep-FAM provided further evidence
for the difference in their structures. In addition, fluorescence of
the free substrate peptide Pep-FAM, cGO, mixture of cGO and Pep-
FAM, and covalently-conjugated cGO-Pep-FAM were recorded at
λex/em = 492/515 nm. As shown in Fig. 1c, these four samples
produced significantly different fluorescence intensities, again
indicating the quite different structures among them.
Figure 1. Characterization of cGO-Pep-FAM sensor. (a) FT-IR spectra of GO, cGO and cGO-Pep-FAM; (b) UV-Vis absorbance spectra of GO, Pep-FAM, cGO, and cGO-Pep-FAM; (c) fluorescence spectra of Pep-FAM, cGO, cGO / Pep-FAM mixture, and covalently-conjugated cGO-Pep-FAM. With the exception of Pep-FAM (50 µM), the concentrations of GO, cGO, and cGO-Pep-FAM used in Fig. 1b were 50 μg mL-1 each, while those of Pep-FAM, cGO, and cGO-Pep-FAM used in Fig. 1c were 5 μM, 1 μg mL-1, 1 μg mL-1, respectively. An enlarged view of the FTIR spectra in the region from 1500 cm-1 to 2000 cm-1 was displaced in Supplementary Material, Fig. S2.
3.2 Effect of Solution pH on the cGO-Pep-FAM Sensor.
Although covalently conjugated GO sensors are more resistant to
various experimental conditions than non-specific adsorption-based
graphene sensors, they are still slightly affected by solution pH
since fluorescein has four species (i.e., cation, neutral, monoanion,
and dianion) with the dominant component changing with the pH
of the solution.24 To find an appropriate pH for sensitive detection
of ADAM17, the fluorescence intensities of the 0.5 μg mL-1
covalently-conjugated cGO-Pep-FAM sensor were investigated at a
series of pH values ranging from 1 to 13. As a control, a mixture of
cGO (0.5 μg mL-1) and peptide (0.5 μM) was also prepared. Our
experimental results (Fig. 2) showed that, with an increase in the
solution pH, the background fluorescence intensity of cGO-Pep-
FAM gradually increased (but didn’t change much until pH 10),
while that of the mixture of GO and Pep-FAM increased drastically.
Hence, the effect of the solution pH on cGo-Pep-FAM was much less
significant than that on cGO / Pep-FAM mixture due to the covalent
conjugation. Furthermore, cGO-Pep-FAM biosensor had smaller
background fluorescence intensity values than the non-specific
adsorption-based cGO / Pep-FAM mixture at all the pH values
investigated, and hence it is more suitable for use as sensing
element for ADAM17 detection. Due to the low background noise
and high signal to noise ratio of the cGO-Pep-FAM sensor at pH 7.5
as well as the optimum enzyme activity25 of ADAM17 under this
condition, a buffer solution with a pH of 7.5 was used in the
remaining experiments.
Figure 2. Effect of solution pH on fluorescence intensities of cGO-Pep-FAM and mixture of cGO and Pep-FAM. The concentrations of cGO-Pep-FAM, cGO, and Pep-FAM used were 0.5 μg mL-1, 0.5 μg mL-1, and 0.5 μM, respectively. Each data point represents the average from three replicate analyses ± one standard deviation.
3.3 Effect of Incubation Time on ADAM17 Detection.
To optimize the experimental condition for ADAM17 detection, the
effect of reaction time on ADAM17 cleavage of the peptide
substrate was investigated. For this purpose, a mixture sample,
which contained 0.5 μg mL-1 cGO-Pep-FAM, 100 ng mL-1 ADAM17
and Tris buffer, was prepared. Then, the mixture was incubated at
37 °C for a period of time ranging from 0 to 120 min, followed by
fluorescence measurement. The experimental results were
summarized in Fig. S4 (Supplementary Material). We could see that
the fluorescence intensity of the mixture sample increased with an
increase in the reaction time until 60 minutes, after which the
fluorescence signal began to saturate. To achieve rapid detection
of ADAM17, 60 min was chosen as the optimum reaction time and
used in all the subsequent experiments.
3.4 Dose Response Curve for ADAM17.
Utilizing the current physical conditions (i.e., pH 7.5, 60 min
reaction time, and 37 °C incubation temperature), dose response
curve for ADAM17 detection was constructed by monitoring the
interaction between the cGO-Pep-FAM solution (0.5 μg mL-1) and
ADAM17 at various concentrations, ranging from 5 to 200 ng mL-1.
The fluorescence intensity of each mixture sample was collected in
the range of 500 nm to 600 nm (excited at 492 nm). Our
experimental results (Fig. 3a) showed that the fluorescence
intensity of the mixture was linearly correlated with ADAM17
concentration, indicating that the peptide substrate (NH2-
CALNNLAQAVRSSSARK(5-FAM)) attached to the GO surface was
being cleaved by ADAM17. In addition to a wide dynamic range
(linear regression with the ADAM17 concentration ranging from 5
to 200 ng mL-1, R2 = 0.9998), this ADAM17 sensor also showed a
detection limit (defined as the ADAM17 concentration
corresponding to three times the standard deviation of blank signal)
of 0.91 ng mL-1, which is equivalent to 17.5 pM. Such a detection
limit is better than that (2 ng mL-1) obtained with ELISA26, and more
than good enough for analyzing ADAM17 in clinical samples (note
200 400 600 8000
1
2
Ab
so
rban
ce (
a.u
.)
Wavelength (nm)
(a) cGO-Pep-FAM
(b) cGO
(c) GO
(d) Pep-FAM
abcd
c)
500 550 600
0
200
400
600
800
1000
Flu
ore
sc
en
ce
In
ten
sit
y
Wavelength (nm)
(a) Pep-FAM
(b) cGO + Pep-FAM
(c) cGO-Pep-FAM
(d) cGO
a
b
cd
b)a)
C=O
CH
2
C=C
OH
CO
O-
CO
NH
1000200030004000
cGO-Pep-FAM
cGO
Tra
ns
mit
tan
ce
(%
)
Wavenumber (cm-1)
GO
1 2 3 4 5 6 7 8 9 10 11 12 130
200
400
600
800
1000
Flu
ore
scen
ce In
ten
sit
y
pH
cGO + Pep-FAM Mixture
cGO-Pep-FAM

ARTICLE Analyst
4 | J. Name., 2012, 00, 1-3 This journal is © The Royal Society of Chemistry 20xx
Please do not adjust margins
Please do not adjust margins
that the mean serum level of ADAM 17 in patients with colorectal
cancer is 2.09 ng mL-1 27, 28).
Figure 3. cGO-Pep-FAM detection of ADAM17. (a) Fluorescence
spectra of cGO-Pep-FAM in the presence of ADAM17 at various
concentrations; and (b) plot of fluorescence intensity versus analyte
species, showing the selectivity of the cGO-Pep-FAM sensor. The
inset in Fig. 3a displays the dose-response curve for ADAM17. The
fluorescence intensity values in Fig. 3b were background corrected,
which were obtained by subtracting the blank fluorescence
intensity from that of the analyte species. Experiments were
performed by incubating cGO-Pep-FAM suspension solutions (0.5
µg mL-1, Tris buffer, pH 7.5) with ADAM17 or other species for 60
min at 37 °C, followed by measuring their fluorescence intensities
with λex/em = 492/515 nm at room temperature. The concentrations
of MMP-9, ADAM9, ADAM17, and HSA used in Fig. 3b were 100 ng
mL-1, 100 ng mL-1, 100 ng mL-1, and 10 µg mL-1, respectively. Each
data point represents the average from three replicate analyses ±
one standard deviation.
3.5 Selectivity and Specificity of the cGO-Pep-FAM Sensor.
Two structure similar proteases, including ADAM 9 and matrix
metalloproteinases 9 (MMP-9), were selected as potential
interfering species to examine the cross-reactivity of the cGO-Pep-
FAM sensor. Like ADAM17, ADAM9 and MMP-9 are also important
cancer biomarkers.29, 30 For example, serum and tissue levels of
MMP-9 are significantly higher in patients with pancreatic ductal
adenocarcinoma than in patients with chronic pancreatitis and
healthy controls,31 while plasma and/or tumor tissues from patients
with pancreatic ductal adenocarcinoma have significantly elevated
levels of ADAM9,32 which may predict shortened survival of
patients.32,33 Furthermore, human serum albumin (HSA, an
abundant serum protein) was tested to investigate the matrix
effect. The experimental results were summarized in Fig. 3b. We
could see that all these three samples produced significantly
smaller fluorescence signals than ADAM17, thus suggesting the high
selectivity and specificity of our cGO-Pep-FAM sensor.
Figure 4. Effect of HSA on the fluorescence spectra of cGO-Pep-FAM in the presence of ADAM17 at various concentrations. The inset displays the plot of fluorescence intensity versus ADAM17 concentration. Experiments were performed by incubating the mixtures of cGO-Pep-FAM suspension (0.5 µg mL-1, Tris buffer, pH 7.5), HSA (400 μg mL-1), and ADAM17 at concentrations ranging from 5 ng mL-1 to 200 ng mL-1 at 37 °C, followed by measuring their fluorescence intensity with λex/em = 492/515 nm at room temperature. Each data point represents the average from three replicate analyses ± one standard deviation.
3.6 Simulated Serum Sample Analysis.
Previous studies have shown that some molecules, especially
proteins, could competitively bind to the GO surface, thus affecting
the fluorescence signal 14. In the previous selectivity section, we
found that low concentrations of HSA would not significantly
interfere with ADAM17 detection by our cGO-Pep-FAM sensor. In
order to accurately detect ADAM17 in serum, which contains large
amounts of HSA, IgG, hemoglobin and fatty acids, and also has trace
amounts of short DNA/RNA, small peptides, and other molecules,
the effect of the concentration of HSA on the cGO-Pep-FAM sensor
was further investigated. Our experimental results (Supplementary
Material, Fig. S5) showed that, with an increase in the
concentration of added HSA, the background fluorescence intensity
of the cGO-Pep-FAM suspension increased slightly until the
concentration of HSA reached 200 μg mL-1, after which the
fluorescence signal began to saturate. To address the serum matrix
effect, a modified dose response curve (Fig. 4) was constructed,
where the interactions between the cGO-Pep-FAM solution (0.5 μg
mL-1) and ADAM17 at various concentrations were held and
monitored in the presence of 400 μg mL-1 HSA. Then, 4 simulated
serum samples, which were prepared by spiking 20 ng mL-1 to 200
ng mL-1 ADAM17 into 20 μL human serum, were analyzed by the
cGO-Pep-FAM sensor. Our experimental results (Table 1) showed
that these ADAM17-spiked serum samples could successfully be
quantitated, supporting the feasibility of our developed cGO-Pep-
FAM sensor for potential clinical applications.
Table 1. Recovery of ADAM17 from serum by use of the cGo-Pep-FAM sensor. Each value represents the mean of three replicate analyses ± one standard deviation.
Sample
number
Theoretical
value (ng mL-1)
Experimental value SD
(ng mL-1)
HSA MMP-9 ADAM9 ADAM170
40
80
120
ΔF
(a
.u.)
a) b)
500 520 540 560 580 6000
50
100
150
200
250
Flu
ore
sc
en
ce I
nte
ns
ity
(I F
)
Wavelength (nm)
0 50 100 150 200
50
100
150
200
250
I F
[ADAM17] (ng mL-1)
500 520 540 560 580 6000
50
100
150
200
250
Flu
ore
scen
ce In
ten
sit
y (
I F)
Wavelength (nm)
0 50 100 150 200
100
150
200
250
I F
[ADAM17] (ng mL-1)
Analyst ARTICLE
This journal is © The Royal Society of Chemistry 20xx J. Name., 2013, 00, 1-3 | 5
Please do not adjust margins
Please do not adjust margins
1 20 19.0 ± 4.8
2 50 49.0 ± 6.5
3 100 106.8 ± 7.1
4 200 199.1 ± 6.6
4. Conclusions
In summary, by covalently attaching fluorescently labeled ADAM17
substrate peptide to the GO surface, and based on enzyme-
substrate cleavage reaction, we successfully developed a cGO-Pep-
FAM fluorescent biosensor for rapid and accurate detection of
ADAM17. The sensor was highly sensitive with a detection limit of
17.5 picomolar. Furthermore, the sensor was selective: structure
similar proteases such as ADAM 9 and MMP-9 would not interfere
with ADAM17 detection. In addition, simulated serum samples
were accurately analyzed. It could be visualized that, with the same
ADAM17 detection strategy, highly sensitive and selective sensors
for a variety of other proteases could be developed by changing the
peptide substrates. These GO-based fluorescent sensors may find
useful applications in many fields such as diagnosis of protease-
related diseases and high-throughput screening of drug candidates.
Conflicts of interest
There are no conflicts to declare.
Acknowledgments
This work was financially supported by the National Institutes of
Health (2R15GM110632-02) and National Science Foundation
(1708596).
Notes and references 1. P. Saftig and K. Reiss, Eur. J. Cell Biol., 2011, 90, 527-535. 2. S. M. Le Gall, P. Bobé, K. Reiss, K. Horiuchi, X.-D. Niu, D. Lundell, D. R.
Gibb, D. Conrad, P. Saftig and C. P. Blobel, Mol. Biol. Cell, 2009, 20, 1785-1794.
3. M. Satoh, Y. Ishikawa, T. Itoh, Y. Minami, Y. Takahashi and M. Nakamura, European Journal of Clinical Investigation, 2008, 38, 97-105.
4. H. B. Liu, Y. Zhu, Q. C. Yang, Y. Shen, X. J. Zhang and H. Chen, 2015, 14, 4391-4398.
5. X. Ding, L.-Y. Yang, G.-W. Huang, W. Wang and W.-Q. Lu, World Journal of Gastroenterology : WJG, 2004, 10, 2735-2739.
6. P. M. McGowan, B. M. Ryan, A. D. K. Hill, E. McDermott, N. Higgins and M. J. Duffy, Clinical Cancer Research, 2007, 13, 2335.
7. Y. Tanaka, S. Miyamoto, S. O. Suzuki, E. Oki, H. Yagi, K. Sonoda, A. Yamazaki, H. Mizushima, Y. Maehara, E. Mekada and H. Nakano, Clinical Cancer Research, 2005, 11, 4783.
8. N. B. Merchant, I. Voskresensky, C. M. Rogers, B. LaFleur, P. J. Dempsey, R. Graves-Deal, F. Revetta, A. C. Foutch, M. L. Rothenberg, M. K. Washington and R. J. Coffey, Clinical Cancer Research, 2008, 14, 1182.
9. R. Roy, J. Yang and M. A. Moses, Journal of Clinical Oncology, 2009, 27, 5287-5297.
10. S. Saraheimo, J. Hepojoki, V. Nurmi, A. Lahtinen, I. Hemmilä, A. Vaheri, O. Vapalahti and K. Hedman, PLoS One, 2013, 8, e62739.
11. J. J. Bass, D. J. Wilkinson, D. Rankin, B. E. Phillips, N. J. Szewczyk, K. Smith and P. J. Atherton, Scandinavian Journal of Medicine & Science in Sports, 2016, 27, 4-25.
12. B. Pulli, M. Ali, R. Forghani, S. Schob, K. L. C. Hsieh, G. Wojtkiewicz, J. J. Linnoila and J. W. Chen, PLoS One, 2013, 8, e67976.
13. S. Zhou, L. Wang, X. Chen and X. Guan, ACS Sensors, 2016, 1, 607-613. 14. Y. Zhang, X. Chen, G. M. Roozbahani and X. Guan, Anal. Bioanal. Chem.,
2018, 410, 6177-6185. 15. D. R. Dreyer, S. Park, C. W. Bielawski and R. S. Ruoff, Chem. Soc. Rev.,
2010, 39, 228-240. 16. J. Kim, L. J. Cote, F. Kim, W. Yuan, K. R. Shull and J. Huang, J. Am. Chem.
Soc., 2010, 132, 8180-8186. 17. P. Crisalli and E. T. Kool, Bioconjugate Chem., 2011, 22, 2345-2354. 18. R. S. Swathi and K. L. Sebastian, The Journal of Chemical Physics, 2009,
130, 086101. 19. F. Tian, J. Lyu, J. Shi and M. Yang, Biosensors and Bioelectronics, 2017,
89, 123-135. 20. S. Mayilo, M. A. Kloster, M. Wunderlich, A. Lutich, T. A. Klar, A. Nichtl, K.
Kürzinger, F. D. Stefani and J. Feldmann, Nano Lett., 2009, 9, 4558-4563. 21. P. Bojarski, L. Kulak, K. Walczewska-Szewc, A. Synak, V. M. Marzullo, A.
Luini and S. D’Auria, The Journal of Physical Chemistry B, 2011, 115, 10120-10125.
22. X. Sun, Z. Liu, K. Welsher, J. T. Robinson, A. Goodwin, S. Zaric and H. Dai, Nano research, 2008, 1, 203-212.
23. M. M. Lucchese, F. Stavale, E. H. M. Ferreira, C. Vilani, M. V. O. Moutinho, R. B. Capaz, C. A. Achete and A. Jorio, Carbon, 2010, 48, 1592-1597.
24. L. Ferrari, L. Rovati, P. Fabbri and F. Pilati, Sensors (Basel, Switzerland), 2013, 13, 484-499.
25. M. J. Mohan, T. Seaton, J. Mitchell, A. Howe, K. Blackburn, W. Burkhart, M. Moyer, I. Patel, G. M. Waitt, J. D. Becherer, M. L. Moss and M. E. Milla, Biochemistry, 2002, 41, 9462-9469.
26.A. Trad, N. Hedemann, M. Shomali, V. Pawlak, J. Grötzinger and I. Lorenzen, J. Immunol Methods, 2011, 371, 91-96.
27. K. Walkiewicz, E. Nowakowska-Zajdel, J. Strzelczyk, S. Dzięgielewska-Gęsiak and M. Muc-Wierzgoń, 2017, 31, 929-934.
28. K. Paweł, W. Katarzyna, S. Joanna, D.-G. Sylwia, W. Dariusz, C. Angelika, M.-W. Malgorzata and Z. Ewa Nowakowska, Journal of Gastrointestinal & Digestive System, 2016, 8.
29. A. Merdad, S. Karim, H.-J. Schulten, A. Dallol, A. Buhmeida, F. Al-Thubaity, M. A. Gari, A. G. Chaudhary, A. M. Abuzenadah and M. H. Al-Qahtani, Anticancer Res., 2014, 34, 1355-1366.
30. S. Zhao, W. Ma, M. Zhang, D. Tang, Q. Shi, S. Xu, X. Zhang, Y. Liu, Y. Song, L. Liu and Q. Zhang, Medical Oncology, 2012, 30, 335.
31. M. Tian, Y.-Z. Cui, G.-H. Song, M.-J. Zong, X.-Y. Zhou, Y. Chen and J.-X. Han, BMC Cancer, 2008, 8, 241.
32. R. Grützmann, J. Lüttges, B. Sipos, O. Ammerpohl, F. Dobrowolski, I. Alldinger, S. Kersting, D. Ockert, R. Koch, H. Kalthoff, H. K. Schackert, H. D. Saeger, G. Klöppel and C. Pilarsky, Br. J. Cancer, 2004, 90, 1053.
33. L. E. Jones, M. J. Humphreys, F. Campbell, J. P. Neoptolemos and M. T. Boyd, Clinical Cancer Research, 2004, 10, 2832.

ARTICLE Analyst
6 | J. Name., 2012, 00, 1-3 This journal is © The Royal Society of Chemistry 20xx
Please do not adjust margins
Please do not adjust margins
Table 1. Recovery of ADAM17 from serum by use of the cGo-Pep-FAM sensor. Each value represents the mean of three replicate analyses ± one standard deviation.
Sample
number
Theoretical
value (ng mL-1)
Experimental value SD
(ng mL-1)
1 20 19.0 ± 4.8
2 50 49.0 ± 6.5
3 100 106.8 ± 7.1
4 200 199.1 ± 6.6
Analyst ARTICLE
This journal is © The Royal Society of Chemistry 20xx J. Name., 2013, 00, 1-3 | 7
Please do not adjust margins
Please do not adjust margins
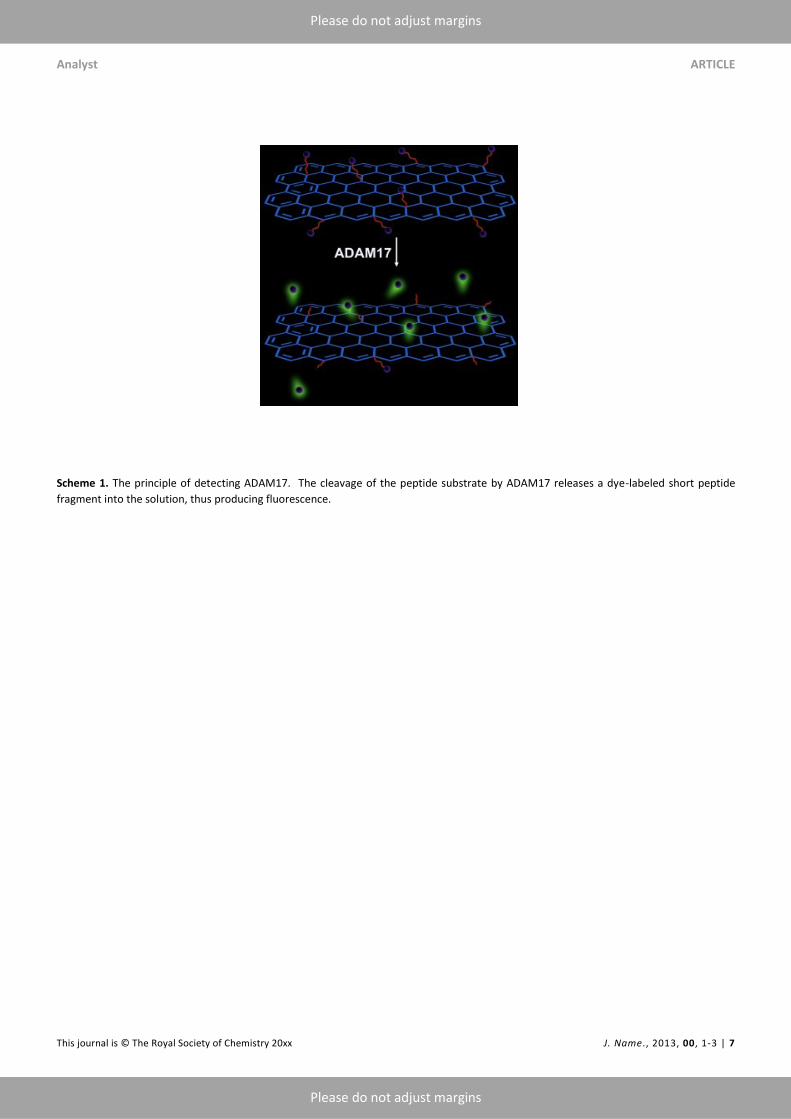
Scheme 1. The principle of detecting ADAM17. The cleavage of the peptide substrate by ADAM17 releases a dye-labeled short peptide
fragment into the solution, thus producing fluorescence.

ARTICLE Analyst
8 | J. Name., 2012, 00, 1-3 This journal is © The Royal Society of Chemistry 20xx
Please do not adjust margins
Please do not adjust margins
Figure 1. Characterization of cGO-Pep-FAM sensor. (a) FT-IR spectra of GO, cGO and cGO-Pep-FAM; (b) UV-Vis absorbance spectra of GO,
Pep-FAM, cGO, and cGO-Pep-FAM; (c) fluorescence spectra of Pep-FAM, cGO, cGO / Pep-FAM mixture, and covalently-conjugated cGO-
Pep-FAM. With the exception of Pep-FAM (50 µM), the concentrations of GO, cGO, and cGO-Pep-FAM used in Fig. 1b were 50 μg mL-1
each, while those of Pep-FAM, cGO, and cGO-Pep-FAM used in Fig. 1c were 5 μM, 1 μg mL-1, 1 μg mL-1, respectively. An enlarged view of
the FTIR spectra in the region from 1500 cm-1 to 2000 cm-1 was displaced in Supplementary Material, Fig. S2.
200 400 600 8000
1
2
Ab
so
rban
ce (
a.u
.)Wavelength (nm)
(a) cGO-Pep-FAM
(b) cGO
(c) GO
(d) Pep-FAM
abcd
c)
500 550 600
0
200
400
600
800
1000
Flu
ore
sc
en
ce
In
ten
sit
y
Wavelength (nm)
(a) Pep-FAM
(b) cGO + Pep-FAM
(c) cGO-Pep-FAM
(d) cGO
a
b
cd
b)a)
C=O
CH
2
C=C
OH
CO
O-
CO
NH
1000200030004000
cGO-Pep-FAM
cGO
Tra
nsm
itta
nce (
%)
Wavenumber (cm-1)
GO

Analyst ARTICLE
This journal is © The Royal Society of Chemistry 20xx J. Name., 2013, 00, 1-3 | 9
Please do not adjust margins
Please do not adjust margins
Figure 2. Effect of solution pH on fluorescence intensities of cGO-Pep-FAM and mixture of cGO and Pep-FAM. The concentrations of
cGO-Pep-FAM, cGO, and Pep-FAM used were 0.5 μg mL-1, 0.5 μg mL-1, and 0.5 μM, respectively. Each data point represents the average
from three replicate analyses ± one standard deviation.
1 2 3 4 5 6 7 8 9 10 11 12 130
200
400
600
800
1000
Flu
ore
scen
ce In
ten
sit
y
pH
cGO + Pep-FAM Mixture
cGO-Pep-FAM

ARTICLE Analyst
10 | J. Name., 2012, 00, 1-3 This journal is © The Royal Society of Chemistry 20xx
Please do not adjust margins
Please do not adjust margins
Figure 3. cGO-Pep-FAM detection of ADAM17. (a) Fluorescence spectra of cGO-Pep-FAM in the presence of ADAM17 at various
concentrations; and (b) plot of fluorescence intensity versus analyte species, showing the selectivity of the cGO-Pep-FAM sensor. The inset
in Fig. 3a displays the dose-response curve for ADAM17. The fluorescence intensity values in Fig. 3b were background corrected, which
were obtained by subtracting the blank fluorescence intensity from that of the analyte species. Experiments were performed by incubating
cGO-Pep-FAM suspension solutions (0.5 µg mL-1, Tris buffer, pH 7.5) with ADAM17 or other species for 60 min at 37 °C, followed by
measuring their fluorescence intensities with λex/em = 492/515 nm at room temperature. The concentrations of MMP-9, ADAM9, ADAM17,
and HSA used in Fig. 3b were 100 ng mL-1, 100 ng mL-1, 100 ng mL-1, and 10 µg mL-1, respectively. Each data point represents the average
from three replicate analyses ± one standard deviation.
HSA MMP-9 ADAM9 ADAM170
40
80
120
ΔF
(a
.u.)
a) b)
500 520 540 560 580 6000
50
100
150
200
250
Flu
ore
sc
en
ce I
nte
ns
ity
(I F
)
Wavelength (nm)
0 50 100 150 200
50
100
150
200
250
I F
[ADAM17] (ng mL-1)

Analyst ARTICLE
This journal is © The Royal Society of Chemistry 20xx J. Name., 2013, 00, 1-3 | 11
Please do not adjust margins
Please do not adjust margins
Figure 4. Effect of HSA on the fluorescence spectra of cGO-Pep-FAM in the presence of ADAM17 at various concentrations. The inset
displays the plot of fluorescence intensity versus ADAM17 concentration. Experiments were performed by incubating the mixtures of cGO-
Pep-FAM suspension (0.5 µg mL-1, Tris buffer, pH 7.5), HSA (400 μg mL-1), and ADAM17 at concentrations ranging from 5 ng mL-1 to 200 ng
mL-1 at 37 °C, followed by measuring their fluorescence intensity with λex/em = 492/515 nm at room temperature. Each data point
represents the average from three replicate analyses ± one standard deviation.
500 520 540 560 580 6000
50
100
150
200
250
Flu
ore
scen
ce In
ten
sit
y (
I F)
Wavelength (nm)
0 50 100 150 200
100
150
200
250
I F
[ADAM17] (ng mL-1)

ARTICLE Analyst
12 | J. Name., 2012, 00, 1-3 This journal is © The Royal Society of Chemistry 20xx
Please do not adjust margins
Please do not adjust margins
Table of Contents
The cleavage of the peptide substrate by ADAM17 releases a dye-labelled short peptide fragment into the
solution, thus producing fluorescence