Embed Size (px)
Citation preview

Retieseweg 111, 2440 Geel, Belgium. Telephone: (+32-14) 571 316, email: [email protected]
EUROPEAN COMMISSION DIRECTORATE-GENERAL JOINT RESEARCH CENTRE Directorate F - Health, Consumer & Reference Materials (Geel) Fraud Detection & Prevention
Analytical approach for checking the compliance of fats and oils
against a possible regulated limit for industrial trans fatty acids
This report shall be read in conjunction with an earlier report submitted by DG JRC to DG
SANTE (ARES(2016)6994854).
Ref. Ares(2018)3313247 - 22/06/2018

2
Background
Evidence from epidemiological as well as controlled human intervention studies indicates that
consumption of diets containing elevated levels of trans fatty acids (TFA) increases the risk of
coronary heart disease. The European Food Safety Authority (EFSA) concluded that TFA intakes
should be as low as is possible within the context of a nutritionally adequate diet [1]. A further
conclusion drawn by EFSA was that the available evidence is insufficient to establish whether
there is a difference between ruminant and industrial trans fatty acids consumed in equivalent
amounts on the risk of coronary heart disease. In the Report form the Commission to the
European Parliament and the Council regarding trans fats in foods and in the overall diet of the
Union population [2] several options are explored to limit the amount of TFA in the EU food
supply. Introducing a legal limit was seen as the most appropriate policy measure to achieve an
effective reduction of industrial TFA (iTFA). They are formed in high amounts by partial
hydrogenation and to a much lesser degree by physical raffination of edible oils. Regulating
ruminant TFA (rTFA) is not feasible as TFA are formed naturally in relatively stable proportions
in ruminant fats, and cannot be avoided in ruminant products, which contribute essential
nutrients in the EU diet. In case the presence of iTFA in food products will be regulated, reliable
analytical tools are needed to control and enforce legislation.
Terms of Reference
DG JRC has been requested by DG SANTE to devise an analytical approach that allows the
estimation of the amount of iTFA in food products containing mixtures of partially
hydrogenated oils and ruminant fats (dairy fat or beef tallow). The methods shall permit the
control of an envisaged limit of 2 g iTFA/100 g fat contained in the food product.
Trans fatty acids
Regulation (EC) No 1169/2011 defines ‘trans fat’ as fatty acids with at least one non-conjugated
(namely interrupted by at least one methylene group) carbon-carbon double bond in the trans
configuration [3]. Therefore, this definition includes all mono- and poly-unsaturated fatty acids
of edible oils and fats, but excludes fatty acids whose double-bond system is conjugated (not-
interrupted by at least one methylene group).
TFA in edible fats and oils result from either industrial processing (hydrogenation and/or
physical refining) or biohydrogenation of fatty acids in the stomach of ruminant animals (milk
and body fat of cows, sheep, goat). Industrial processing and biohydrogenation of unsaturated
fats and oils results in different profiles of the generated TFA, while, with few exceptions, the
physico-chemical nature of the TFA generated by those two pathways do not differ at all.
Differences in the TFA profiles between partial hydrogenated vegetable oils and ruminant fats

3
relate primarily to the distribution of positional isomers of trans octacedenoic acid (18:1)1 and
the exclusive occurrence of conjugated fatty acids (CFA) in ruminant fats, the main isomer being
c9,t11-18:2 (conjugated linoleic acid, CLA). Trans-vaccenic acid (t11-18:1) is the predominant
monounsaturated FA (MUFA) of ruminant fats (35-55 % of trans MUFA), while in partially
hydrogenated fats and oils the distribution of positional isomers of trans MUFA follows a bell-
shaped curve centred on t9/t10/t11 isomers of 18:1 [4].
Quantities of TFA in industrially processed fats and oils range from around 1 % for physically
refined vegetable oils, mostly trans isomers of linoleic (18:2) and linolenic acid (18:3), up to 50 %
for partially hydrogenated oils (PHO), mostly trans isomers of oleic acid (18:1).
Vegetable oils are partially hydrogenated to modify their functional properties with two main
objectives: (i) to improve oxidative stability to make oils more suitable for frying of food and (ii)
to change physical properties (texture, plasticity) for the production of margarine and
shortenings. The latter are used in bakery products (Danish pastry, cakes, cookies, cream fillings,
and frostings), savoury snacks (crackers, biscuits, and popcorn), confectionary (candy bars,
chewing gum), instant foods, and stock cubes. PHO are also used as carriers of certain food
additives (flavours and colours) and as processing aid (pan release agent); contributions from
those minor uses to dietary intake are, however, minimal.
Ruminant fats, predominantly bovine milk fat (MF), are another source of dietary TFA. Based on
the analysis of more than 2000 MF samples obtained from 14 EU Member States, Precht and
Molkentin [5] estimated a mean total TFA content in MF of 4.92 % (range 1.29 %-7.17 %), of
1.76 % (0.35 %-4.46 %) for t11-18:1, and of 0.76 % (0.10 %-1.89 %) for c9, t11-18:2. The c9, t11-
18:2 content was strongly correlated to the t11-18:1 and the total TFA content (r=0.97). The
total TFA amount as well as the distribution of positional trans isomers of FA in ruminant fats is
very variable and depends on the type of feeding regimen [6]. The distribution of the TFA
concentrations does not follow a Gaussian distribution but is bimodal meaning that, in general,
the TFA content during pasture feeding is higher than during barn feeding. For this reason
arbitrary values to characterise the total TFA content of MF are more appropriate than the
arithmetic mean or percentiles, which require that the data follow a Gaussian distribution. Table
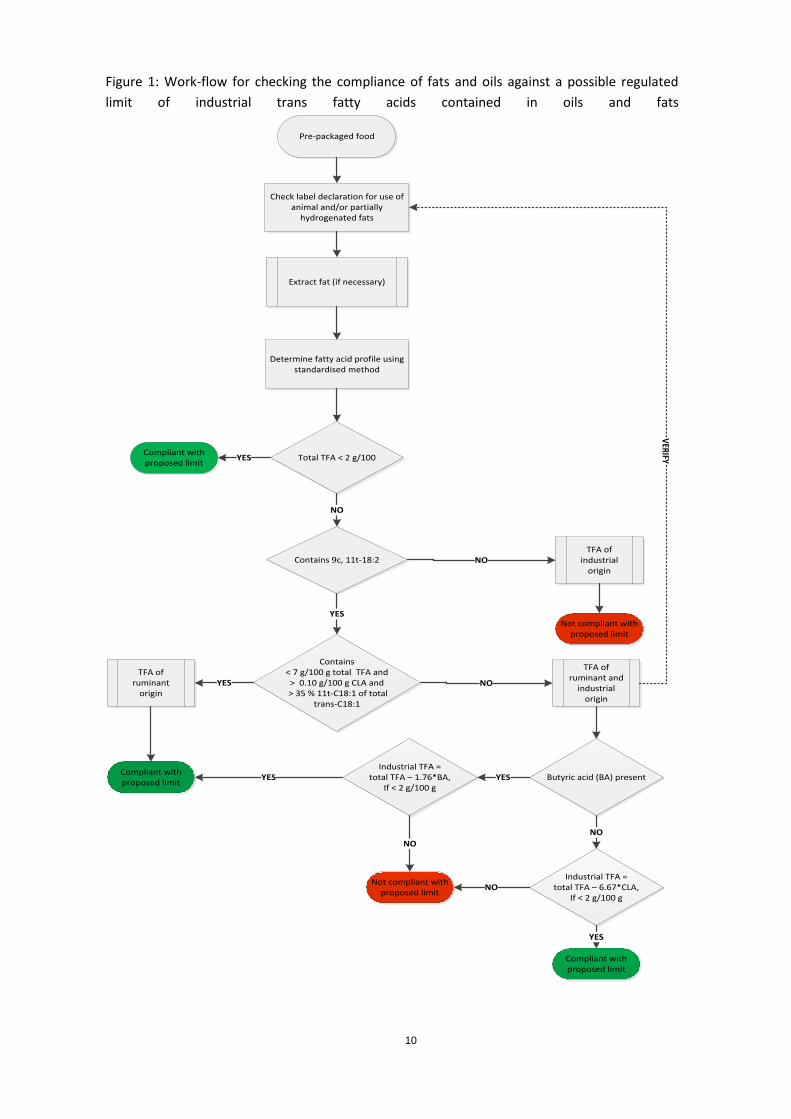
1 (Annex) provides an overview of recently published TFA data of MF. Noteworthy is the fact
that many of the published data contained in Table 1 result from experiments designed to
demonstrate the influence of certain feeding regimes on MF composition and does not reflect
routine practices. However, the data also demonstrate that even under such extreme conditions
the total amount of TFA in milk fat is less than 10 g/100 g. The TRANSFAIR Study estimated the
TFA content in commercialised dairy products from 14 European countries; the amounts ranged
between 3.2 and 6.2% of fatty acids [7].
On the basis of the available data it is reasonable to use a content of 6 g TFA/100 g MF for
source apportionment of TFA contained in a mixture of ruminant and industrial fats. It is a
rather conservative estimate, which will not disadvantage food business operators, while still be
effective in protecting public health.
1 The carbon chain length of a FA and its degree of unsaturation are denoted by xx:y; the geometrical configuration of a double bond is denoted by c (cis) or t (trans); the position of the double bond is denoted by a number counting from the carboxyl group (e.g. 9c, 12t-18:2).

4
Principles of the approach for checking the compliance of fats and
oils against a possible regulated limit for industrial trans fatty
acids
Whereas several collaboratively tested analytical methods for the determination of total and
individual TFA in edible fats and oils exist, methods to differentiate them according to their
origin (iTFA or rTFA) are scarce. It is not possible to chemically differentiate if an individual TFA
originates from an industrially processed oil/fat or from ruminant fat. Therefore, it has to be
well understood that the proposed approach approximates the amount of iTFA in a mixture
where rTFA co-occur, but it does not allow a quantification delivering accurate results with an
associated uncertainty.
The proposed approach builds on the use of
the amounts (g/100 g fat) of butyric acid (4:0), total TFA (sum of fatty acids with at least
one non-conjugated carbon-carbon double bond in the trans configuration, usually the
trans-isomers of hexadecenoic acid (t16:1), octadecenoic acid (t18:1), octadecadienoic
acid (t18:2) and octadecatrienoic acid (t18:3)), and of c9, t11-18:2, as well as the
proportion (%) of trans-vaccenic acid (t11-18:1) relative to the sum of t18:1,
determined by a collaboratively tested analytical method (AOAC 2012.13 | ISO
16958:2015 | IDF 231:2015 [8]), which is based on capillary gas-liquid chromatography
with flame-ionisation detection,
subjected to a decision making algorithm (decision tree) to identify whether the fat
contains:
o less than a regulated limit for TFA (e.g. less than 2 g/100 g fat),
o only iTFA in amounts exceeding the limit,
o only rTFA in amounts exceeding the limit,
o a mixture of iTFA and rTFA in amounts exceeding the limit.
In case butyric acid is present next to iTFA and rTFA, the amount of butyric acid is used to,
firstly, approximate the amount of MF in the mixture and, secondly, the amount of rTFA
originating from MF (Equation 1).
rTFA [g/100 g] = (Butyric acid [g/100 g] * 29.4* 6)/100 Equation 1
The factor 29.4 is used to convert the measured amount of butyric acid to MF based on an
average content of 3.4 g butyric acid/100 g MF [9]; furthermore, it is assumed that MF contains
6 g TFA /100 g.
In the rare event that butyric acid is not present while c9, t11-18:2 is present next to iTFA and
rTFA, the amount of c9, t11-18:2 is used to approximate the amount of rTFA originating from
bovine body fat (tallow) in the mixture (Equation 2).
rTFA [g/100 g] = (c9, t11-18:2 [g/100 g])/0.15 Equation 2

5
As the TFA concentration in tallow is similar to MF, a factor of 0.15, which approximates the
relation of total TFA to c9, t11-18:2 for MF, is used to estimate the amount of total TFA in
tallow.
Finally, subtraction of the amount of rTFA from total TFA gives the amount of iTFA (Equation 3):
iTFA [g/100 g] = total TFA – rTFA Equation 3
N.B. Zero replaces negative values in Equation 3.

6
Work instruction for checking the compliance of fats and oils
against a possible regulated limit for industrial trans fatty acids
1. Scope
This procedure serves to estimate the content of industrial trans fatty acids (iTFA) in samples
containing a blend of ruminant fat and industrially processed fats or oils. The method described
shall be applied if the individual fats/oils contained in the blend are not available/accessible;
otherwise, the contribution of each of the blended fats to total trans fatty acids (TFA) shall be
estimated via the analysis of the pure fats.
N.B. The procedure does not allow to accurately determine the amount of TFA attributable to
industrially processed fats or oils. It provides an estimate which is based on empirical factors for
correcting the total amount of analytically determined TFA by the contribution resulting from
ruminant fats (milk fat or tallow).
2. Principle
The method comprises the determination of butyric acid (4:0), total TFA (sum of fatty acids with
at least one non-conjugated carbon-carbon double bond in the trans configuration, usually the
trans-isomers of hexadecenoic acid (t16:1), octadecenoic acid (t18:1), octadecadienoic acid
(t18:2) and octadecatrienoic acid (t18:3)), and conjugated linoleic acid (c9, t11-18:2), as well as
the proportion (%) of trans-vaccenic acid (t11-18:1) relative to the sum of t18:1, by gas
chromatography with flame ionisation detection using AOAC 2012.13 | ISO 16958:2015 | IDF
231:2015 [8] or another standardised method with similar performance characteristics. A
correction of the TFA content by the TFA content stemming from ruminant fat (rTFA) is then
applied. The contribution of rTFA to the total TFA content of the blend is either estimated via
the butyric acid content if the blend contains milk fat or via conjugated linoleic acid if the blend
contains ruminant body fat (tallow).
The content of trans fatty acids is expressed as gram per 100 gram fat.
3. Definitions
Trans fatty acids: fatty acids with at least one non-conjugated (namely interrupted by at least
one methylene group) carbon-carbon double bond in the trans configuration
iTFA: total trans fatty acids contained in industrially processed fats/oils, expressed as gram per
100 gram of fat/oil
rTFA: total trans fatty acids contained in ruminant fats (milk fat or body fat), expressed as gram
per 100 gram of fat
tTFA: total trans fatty acids is the sum of the contents of isomers of non-conjugated trans fatty
acids of hexadecenoic acid (t16:1), octadecenoic acid (t18:1), octadecadienoic acid (t18:2) and
octadecatrienoic acid (t18:3), expressed as gram per 100 gram of fat.

7
CLA: conjugated linoleic acid; for the purpose of this document, CLA is the cis-9, trans-11 isomer
of linoleic acid (c9, t11-18:2)
4. Sample preparation and analysis
The ingredient list of the tested food shall be checked whether ruminant fats (milk fat and/or
tallow) have been used. If their amounts are specified, this has to be recorded for cross-
checking the plausibility of the obtained testing results.
Depending on the analytical method used for the determination of FAME by GLC-FID, fat might
be transesterified directly in the test sample, or after the extraction of a representative portion
of fat. Only internationally accepted methods shall be used for the determination of the content
of TFA and of butyric acid in the test sample. AOAC 2012.13 | ISO 16958:2015 | IDF 231:2015 [8]
shall be used for the determination of the TFA content in different food matrices; other suitable
methods such as AOAC 996.06 [10] and AOCS Ce 1j-07 [11] may be used if it can be proven that
they deliver equivalent results.
Figure 1 (Annex) presents the analytical workflow for the estimation of iTFA in mixtures of
industrial fat and ruminant fat.
5. Estimation of the content of industrial TFA in mixtures of
ruminant and industrial fats
In case butyric acid is present next to iTFA and rTFA, the amount of butyric acid is used to
approximate the amount of MF in the mixture (Equation 1).
rTFA [g/100 g] = (Butyric acid [g/100 g] × 29.4 × 6)/100 Equation 1
The factor 29.4 is used to convert the measured amount of butyric acid to MF based on an
average content of 3.4 g butyric acid/100 g MF; furthermore, it is assumed that MF contains 6 g
TFA /100 g.
In the rare event that butyric acid is not present while c9, t11-18:2 is present next to iTFA and
rTFA, the amount of c9, t11-18:2 is used to approximate the amount of rTFA originating from
bovine body fat (tallow) in the mixture (Equation 2).
rTFA [g/100 g] = (c9, t11-18:2 [g/100 g])/0.15 Equation 2
As the TFA concentration in tallow is similar to MF, a factor of 0.15, which approximates the
relation of total TFA to c9, t11-18:2 for MF is used to estimate the amount of total TFA in tallow.
Finally, subtraction of the amount of rTFA from total TFA gives the amount of iTFA (Equation 3):
iTFA [g/100 g] = total TFA – rTFA Equation 3
N.B. Zero replaces negative values in Equation 3.

8
References
1. European Food Safety Authority: Scientific Opinion on Dietary Reference Values for fats,
including saturated fatty acids, polyunsaturated fatty acids, monounsaturated fatty acids,
trans fatty acids, and cholesterol. EFSA Journal 2010; 8(3):1461.
2. Report form the Commission to the European Parliament and the Council regarding trans
fats in foods and in the overall diet of the Union population. COM(2015) 619 final.
3. Regulation (EU) No 1169/2011 of the European Parliament and of the Council of 25
October 2011 on the provision of food information to consumers.
4. Aldai N., de Renobales M., Barron L.J.R., Kramer J.K.G.: What are the trans fatty acids issues
in foods after discontinuation of industrially produced trans fats? Ruminant products,
vegetable oils, and synthetic supplements. European Journal of Lipid Science and
Technology 115 (2013) 1378-1401.
5. Precht D., Molkentin J.: Frequency distribution of conjugated linoleic and trans fatty acid
contents in European bovine milk fats. Milchwissenschaft 55 (2000) 687-691.
6. Tyburczy C., Mossoba M.M., Rader J.I.: Determination of trans fat in edible oils: current
official methods and overview of recent developments. Analytical and Bioanalytical
Chemistry 405 (2013) 5759–5772.
7. Aro A, Antoine J.M., Pizzoferrato L., Reykdal O., van Poppel G. Trans fatty acids in dairy and
meat products from 14 European countries: The TRANSFAIR Study. Journal of Food
Composition and Analysis 11 (1998) 150-160.
8. ISO 16958:2015 Milk, milk products, infant formula and adult nutritionals — Determination
of fatty acids composition — Capillary gas chromatographic method. International
Organization for Standardization, Geneva, CH.
9. Molkentin J., Precht D. Representative determination of the butyric acid content in
European milk fats. Milchwissenschaft 52 (1997) 82-85.
10. AOAC Official Method 996.06 Fat (Total, Saturated, and Unsaturated) in Foods – Hydrolytic
Extraction Gas Chromatographic Method. AOAC International, Rockville, MD, USA
11. AOCS Official Method AOCS Official Method Ce 1j-07 Determination of cis-, trans-,
saturated, monounsaturated, and polyunsaturated fatty acids in extracted fats by capillary
GLC. American Oil Chemists' Society, IL, USA.

9
Annex
10
Figure 1: Work-flow for checking the compliance of fats and oils against a possible regulated
limit of industrial trans fatty acids contained in oils and fats
Pre-packaged food
Check label declaration for use of animal and/or partially
hydrogenated fats
Determine fatty acid profile using standardised method
Extract fat (if necessary)
Contains < 7 g/100 g total TFA and > 0.10 g/100 g CLA and
> 35 % 11t-C18:1 of total trans-C18:1
Compliant with proposed limit
Contains 9c, 11t-18:2
Not compliant with proposed limit
Total TFA < 2 g/100 Compliant with proposed limit
YES
NO
YES
TFA of ruminant and
industrial origin
NO
Not compliant with proposed limit
TFA of industrial
originNO
TFA of ruminant
originYES
Industrial TFA = total TFA – 6.67*CLA,
If < 2 g/100 g
Compliant with proposed limit
Butyric acid (BA) presentIndustrial TFA =
total TFA – 1.76*BA,If < 2 g/100 g
YES
NO
YES
NO
NO
YES
VER
IFY

Retieseweg 111, 2440 Geel, Belgium. Telephone: (+32-14) 571 316, email: [email protected]
Table 1. Literature overview regarding the TFA content of milk fat
Samples Sampling year
C4:0 t-16:1 t-18:1 t-18:2 total TFA
tTFA SD
min tTFA
max tTFA
CLA c9,t11
CLA c9,t11/tTFA
CLA c9,t11/t-
C18:1
CLA c9,t11/C18:1
t11 Comment
Jahreis et al.1 36 bulk % FAME
0.4-0.5 1.8-3.4 0.5-0.7 3.0-5.0
0.3-0.8
1)
0.11-0.16 0.19-0.23
0.25+0.07391)
Feeding regime: indoor group (maize silage), pasture group (pasture during summer, silage during other seasons) and ecological group (grazing during summer, silage during other seasons);
1)Σc9,t11C18:2 and t9,c11-C18:2
Precht, Molkentin
2
1756 individual
1995 % FA
3.6
0.82)
0.44x+0.05 DE samples; influence barn/pasteure feeding; 2)
g FA/100g fat
Molkentin, Precht
3
136 European milk samples
g FA/100g fat
3.4
na na na na
Jahreis et al.4 8 individual
% FAME
1.0
0.318x+0.1413)
3) function for correlation between CLA and
t11-C18:1 covers different species, not all ruminants
Precht, Molkentin
5
~2000 individual
1995 % FA
3.7 1.1 4.9
1.5 8.7 0.8
Samples are from EU14
Lock, Garnsworthy
6 433 individual
1997-2000
% FAME 2.0-3.1
2.6-4.5
0.6-1.7
0.19-0.61
0.19-0.61 Seasonal variations, highest CLA values pasture feeding early summer, lowest CLA values in Oct-Dec
Lindmark Mansson et al.
7
63 bulk 1995-1996
% FA (weighted means)
4.7 0.1 2.2 0.2 2.54)
0.3 2.2 2.9 na na na na Composition od Swedish dairy milk;
4)not all t-
FAs considered in tTFA value

12
Samples Sampling year
C4:0 t-16:1 t-18:1 t-18:2 total TFA
tTFA SD
min tTFA
max tTFA
CLA c9,t11
CLA c9,t11/tTFA
CLA c9,t11/t-
C18:1
CLA c9,t11/C18:1
t11 Comment
Secchiari et al.
8
32 individual
g FA/100g fat
3.2-3.8
1.8-3.0
0.35-0.5
0.17-0.21
0.51-0.63
correlation between CLA and tTFA, fed basis: maize silage, lucerne hay, and maize grains; supplemented by full fat extruded soy bean, full fat linseed, soybean meal coated with palm oil soap, or olive oil soap
Brzoska9
64 individual
% FA
0.8-1.1
supplementation of feed with different vegetable oils, no control group
Loor et al.10
16 individual
% FA
2,7-12.1
0.1-2.8 1.9-12.8
0.6-2.5 0.19-0.34 0.16-0.23
0.41-0.61 supplementation of low/high percentage concentrate feed with linseed oil
Couvreur et al.
11
32 individual
2003 % FA 3.8-4.3
2.4-5.9
2.6-6.5
0.5-1.6 0.18-0.26 0.20-0.28
0.56-0.35 corn silage replaced by fresh grass (spring)
Lindmark Mansson
12
28 bulk 2001 % FA (weighted means)
4.4 0.4 2.1 0.2 2.7 0.7
3.9 0.4 0.15 0.19
significant seasonal variation,
Mendis et al.
13
41 individual
2006-2007
% FA
3.9
5.5 0.7 4.2 7.4 0.5 0.09 0.13 0.39 Canadian dairy products, average of combined values for cream, butter, milk, cheese;
Rego et al.14
64 individual
2006 % FA
4.5-8.7
5.4-10.8
1.1-1.6 0.14-0.22 0.17-0.26
0.42-0.48x
supplementation of control group feed with different vegetable oils (rapeseed, sunflower, and linseed oil), control group diet: 20 h grazing pasture + 5 kg corn based concentrate.
O'Donnel15
228 bulk 2008 % FA 4.1
3.2
0.55
0.17 0.37x bulk milk samples covering US milk production, ratio CLA c9,t11/t11-C18:1
13
Samples Sampling year
C4:0 t-16:1 t-18:1 t-18:2 total TFA
tTFA SD
min tTFA
max tTFA
CLA c9,t11
CLA c9,t11/tTFA
CLA c9,t11/t-
C18:1
CLA c9,t11/C18:1
t11 Comment
Rouille, Montourcy
16 85 bulk
2008-2009
% FA 3.7-3.9
2.4-3.4
3.3-4.9 1.1 2.8 6.8 0.6-1.2 0.17-0.25 0.23-0.36
0.456x-0.047 Highest value: pasture feeding early summer; in winter
Kuhnt et al.17
23 individual
2007-2009
% FAME na
2.7
3.2
2.3 4.6 0.9
0.38 0.79x+0.79 data for butter
Butler et al.18
88 individual
2006-2008
% FA 1.9
1.2-1.6
5)
0.6-0.7
Commercial milk samples, conventional versus organic production,
5) value represents
only t11-C18:1
Chassaing et al.
19
360 bulk 2008 g FA/100 g fat
3.86)
1.86)
8.76)
mean value of milk from Fr, No, Sl, and Sk; 6)
tTFA values include conjugated linoleic acid contents
Bada Algom et al.
20
14 individual
% FA
4.95)
1.75
0.35x+0.21 5)
value represents only t11-C18:1
Schwendel et al.
21
160 bulk 2010-2013
g FA/100 g fat
2.8-3.0
2.3-5.3
5)
0.9-1.6
bulk milk samples from conventional and organic farms;
5) value represents only t11-
C18:1
Spatny22
296 individual
2006 % FA 4.2-4.4
2.8-3.1
0.6-0.7
0.18-0.25
0.39-0.41 correlation between CLA and tTFA; data from conventional, rbST-free, and organic milk production
1 Jahreis, G., J. Fritsche, and H. Steinhart, Conjugated linoleic acid in milk fat: High variation depending on production system. Nutrition Research, 1997. 17(9): p. 1479-1484.
2 Precht, D. and J. Molkentin, Trans unsaturated fatty acids in bovine milk fat and dairy products. European Journal of Lipid Science and Technology, 2000. 102(10): p. 635-640.
3 Molkentin, J. and D. Precht, Representative determination of the butyric acid content in European milk fats. Milchwissenschaft, 1997. 52: p. 82-85.
4 Jahreis, G., et al., The potential anticarcinogenic conjugated linoleic acid, cis-9,trans-11 C18:2, in milk of different species: Cow, goat, ewe, sow, mare, woman. Nutrition Research. 19(10): p. 1541-1549.

14
5 Precht, D. and J. Molkentin, Frequency distributions of conjugated linoleic acid and trans fatty acid contents in European bovine milk fats. Milchwissenschaft = Milk science international, 2000. 55(12): p.
687-691. 6 Lock, A.L. and P.C. Garnsworthy,
9-desaturase activity in dairy cows. Livestock Production Science, 2003. 79(1): p. 47-59.
7 Lindmark-Månsson, H., R. Fondén, and H.-E. Pettersson, Composition of Swedish dairy milk. International Dairy Journal, 2003. 13(6): p. 409-425.
8 Secchiari, P., et al., Effect of kind of dietary fat on the quality of milk fat from Italian Friesian cows. Livestock Production Science, 2003. 83(1): p. 43-52.
9 Brzoska, F., Effect of dietary vegetable oils on milk yield, composition and CLA isomer profile in milk from dairy cows. Journal of Animal and Feed Sciences, 2005. 14(3): p. 445-459.
10 Loor, J.J., et al., Relationship Among Trans and Conjugated Fatty Acids and Bovine Milk Fat Yield Due to Dietary Concentrate and Linseed Oil. Journal of Dairy Science, 2005. 88(2): p. 726-740.
11 Couvreur, S., et al., The linear relationship between the proportion of fresh grass in the cow diet, milk fatty acid composition, and butter properties. Journal of Dairy Science, 2006. 89(6): p. 1956-1969.
12 Lindmark-Månsson, H., Fatty acids in bovine milk fat. Food Nutr Res, 2008. 52.
13 Mendis, S., C. Cruz-Hernandez, and W.M.N. Ratnayake, Fatty acid profile of Canadian dairy products with special attention to the trans-octadecenoic acid and conjugated linoleic acid isomers. Journal
of AOAC International, 2008. 91(4): p. 811-819. 14
Rego, O.A., et al., Rumen biohydrogenation-derived fatty acids in milk fat from grazing dairy cows supplemented with rapeseed, sunflower, or linseed oils. Journal of Dairy Science. 92(9): p. 4530-4540. 15
O'Donnel, A.M., Milk fatty acids: retail milk fat composition and efforts to naturally enhance bioactive fatty acids in milk for the benefit of human health, in Dissertation. 2010, Cornell University. 16
Rouîlle, B. and M. Montourcy, Influence de quelques sytèmes d'alimentation sur la composition en acides gras du lait de vache en France. 2010. p. 33. 17
Kuhnt, K., et al., Trans fatty acid isomers and the trans-9/trans-11 index in fat containing foods. European Journal of Lipid Science and Technology, 2011. 113(10): p. 1281-1292. 18
Butler, G., et al., Fat composition of organic and conventional retail milk in northeast England. Journal of Dairy Science, 2011. 94(1): p. 24-36. 19
Chassaing, C., et al., Mineral, vitamin A and fat composition of bulk milk related to European production conditions throughout the year. Dairy Science and Technology, 2016. 96(5): p. 715-733. 20
Bada Algom, O., et al., Comparison of milk fatty acid profiles measured on Kouri cows near Lake Chad and on dairy cattle as reported by meta-analytical data. Tropical Animal Health and Production, 2017. 49(5): p. 915-921. 21
Schwendel, B.H., et al., Pasture feeding conventional cows removes differences between organic and conventionally produced milk. Food Chemistry, 2017. 229(Supplement C): p. 805-813. 22
Spatny, K.P., Survey of retail milk: comparison of the fatty acid composition of conventional milk and milk labelled as "rbST-free" and "organic". 2009, Cornell University: Research Honors Program 2009. p. 32.