Embed Size (px)
Citation preview
NASA Contractor Report 171824
FINAL REPORT - Shuttle Derived Atmospheric Density Model
Part 1 : Comparisons of the Various Ambient Atmospheric Source Data with Derived Parameters From the First Twelve STS Entry Flights - a Data Package for AOTV Atmospheric Development
John T. Findlay G. Me1 Kelly Patrick A. Troutman
-1
CONTRACT NAS9-17158
December 1984
I N A S A - C R - 1 7 1 8 2 U ) SHUTTLE DEBXYED 887- 10662 A T B O S E H E A I C D E N S I T Y HCEEL. P e 6 T 1: C O H P A B I S O N S O F 'IfiE V A B I C U S A C E I E E T ATEOSPHEZIC S C U K C E CATB Y Z T B C E r t I Y E D Uncfas PARBlYlETERS PBCa THE FIRST IWELVE. [Analytical G3/47 44352
,-
ANALYTICAL MECHANICS ASSOCIATES, INC. 17 Research Road Hamptm, Virginia 23666
https://ntrs.nasa.gov/search.jsp?R=19870001229 2018-09-03T16:24:07+00:00Z
1
NASA Contractor Report 171824
FINAL REPORT - Shuttle Derived Atmospheric Density Model
Part 1: Comparisons of the Various Ambient Atmospheric Source Data with Derived Parameters From the First Twelve STS Entry Flights - a Data Package for AOTV Atmospheric Development
John T. Findlay G. Me1 Kelly Patrick A. Troutman
CQNTRACrNAs9-17 u8
December 1984
ANALYTICAL MECHANICS ASSOCIATES, INC. 17 Research Road Hampton, Virginia 23666
TABLE OF CONTENTS
Section
I
I1
111
IV
Page . Title
ABSTRACT . . . . . . . . . . . . ii INTRODUCTORY BACKGROUND . . . . . . . 1
AVAILABLE STS FLIGHTS . . . . . . . . 3
AVAILABLE DATA. MODELS. AND METHODOLOGY . . 8
Shuttle derived atmospheres . . . . . . 9 Remote measurements . . . . . . . . 1-0
Models . . . . . . . . . . . . . 11
DISCUSSION OF RESULTS . . . . . . . . 13
Shuttle derived atmospheres . . . . . . 13
Remote measurements . . . . . . . . 15 Models . . . . . . . . . . . . . 16 Statistical considerations . . . . . . 17
CONCLUSIONS . . . . . . . . . . . 23
REFEREKS.. . . . . . . . . . . . 24- APPENDIX A . Atmospheric Density Comparisons
f o r the First Twelve Shuttle Entries . . . . . . . . 25
APPENDIX B . Atmospheric Temperature Compar- isons for First Twelve Shuttle Entries . . . . . . . . 38
ABSTRACT
This r e p o r t , Part 1 of the f i n a l r e p o r t generated under NASA
Contract NAS9-17158, p re sen t s ambient atmospheric parameter compar-
i sons versus der ived values from t h e f irst twelve( l2) Space S h u t t l e
O r b i t e r e n t r y f l i g h t s . Available f l i g h t s , f l i g h t d a t a products , and
d a t a sources u t i l i z e d a r e reviewed. Comparisons a r e presented based
on remote meteorological measurements as well as two comprehensive
models which inco rpora t e l a t i t u d i n a l and seasonal effects . These are
t h e A i r Force 1978 Reference Atmosphere and t h e Marshall Space F l i g h t
Center Global Reference Model (GRAM). Atmospheric s t r u c t u r e s e n s i b l e
i n t h e S h u t t l e f l i g h t d a t a i s shown and d iscussed .
r e p o r t p re sen t s a model f o r cons idera t ion i n Aero-assis ted Orb i t a l
T rans fe r Vehicle (AOTV) t r a j e c t o r y a n a l y s i s , proposed t o mod i f y t h e
GRAM d a t a t o ~ emulate ~~ S h u t t l e ~ experience.
Part 2 of t h e f i n a l
I . In t roductory Background
S h u t t l e p o s t - f l i g h t d a t a reduct ion i n support of aerodynamic and
aerothermodynamic research has been ongoing throughout t h e aerospace
community s i n c e t h e first mission i n Apr i l , 1981.
been ex tens ive ly publ ished; have been u t i l i z e d t o eva lua te and develop
i n t e r i m updates t o t h e Orb i t e r performance, s t a b i l i t y and con t ro l esti- mates; and, w i l l u l t i m a t e l y evolve i n t o a f i n a l Operat ional O r b i t e r
Aerodynamic Data Base. Of s i g n i f i c a n t i n t e r e s t during t h i s a n a l y s i s has
been t h e apparent atmospheric s t r u c t u r e sensed by t h e O r b i t e r i n t h e upper
reaches of t h e mesosphere, throughout t h e mesopause, and up i n t o t h e
thermosphere. Considerable shear s t r u c t u r e , t tpotholes- in-the-sky , It and
gene ra l ly abrupt increases /decreases i n t h e atmospheric d e n s i t y have
been observed. D r . W. M. Robertson of t h e Charles S tark Draper Labor-
a t o r i e s (CSDRL) has conducted ex tens ive research i n t h i s area and has
i d e n t i f i e d var ious meteorological mechanisms i n h i s l i t e r a t u r e search t o
account f o r such phenomena. Proposed candida tes are g r a v i t y waves, pur-
por ted a l s o by o the r s , and Kelvin-Helmholtz i n s t a b i l i t i e s . Thus, S h u t t l e
experience i s no t without precedence. Though such d e n s i t y depar tures
have minimal e f f e c t on t h e S h u t t l e f l i g h t s p e r se, apa r t from t h e fact
t h a t t h e crew has experienced a sense of clear a i r turbulence i n t h i s
a l t i tude-region, t h e e f f e c t of same on l i g h t e r , lower performance, space-
c ra f t i s of cons iderable i n t e r e s t . S p e c i f i c a l l y , AOTV t r a j e c t o r y a n a l y s t s
(Reference 1) have expressed concern re t h e in f luence of S h u t t l e type
atmospheric s t r u c t u r e on AOTV t r a j e c t o r y r e s u l t s . S impl i f ied , reasonable ,
models t o emulate s imilar atmospheric s t r u c t u r e has shown l a r g e t r a j e c t o r y
pe r tu rba t ions during t h e e x i t phase of t h e a e r o - a s s i s t maneuver us ing
va r ious guidance algori thms which u t i l i z e p red ic to r - co r rec to r t a r g e t i n g
schemes.
atmospheric modelling requirements f o r AOTV ana lys t s .
atmospheric a n a l y s i s was required t o provide s t a t i s t i c a l comparisons be-
tween S h u t t l e der ived atmospheres and t h e Nat ional Weather Serv ice d a t a ,
and eva lua te t h e adequacy o f two a v a i l a b l e , comprehensive, models ( t h e MSFC GRAM (Reference 2 ) and the A i r Force 1978 Reference Model (Reference
3 ) ) , u l t i m a t e l y de f in ing a pe r tu rba t ion model f o r dens i ty shears a t
The r e s u l t s have
~ ~ ~ ~
~ ~
A s a consequence, t h i s t a s k was undertaken t o h e l p e s t a b l i s h
This add i t iona l
1 -4.-
a l t i t u d e s above 200 k f t . Addi t iona l ly , t h e r e s u l t s , though no mechanism
was e s t ab l i shed , should provide d a t a t o assist i n t h e development of a
r e f ined Global Atmosphere Model.
I t i s recognized tha t AOTV trajectory analysts are considering u t i l i z a t i o n of the "13th month" (average) GRAM data throughout much of the preliminary design stages. presently simulate return from GEO with the aeroassis t maneuver near the Equator. Consequently, la t i tud inal e f f e c t s w i l l be, minimum. Hm- ever, f o r the purposes of t h i s study, the comprehensive model, t o in- clude lat i tudinal and seasonal e f f e c t s , was u t i l i z e d and an assessment of the modelled accuracy ( la) Was made. The former t o es tabl i sh the systematic global appl icabi l i ty of the GRAM, the l a t t e r t o quantify the expected accuracy. v a l i d i t y but supports the use of the MSFC error model for the various Monte Carlo analyses performed throughout the Agency.
Further, design considerations
This not only aids i n establishing the model
Contrac tua l ly , AMA was r equ i r ed t o perform t h i s a n a l y s i s f o r t h e
f i r s t nine(9) S h u t t l e f l i g h t s . Since d a t a were a v a i l a b l e from t h e f i rs t
twelve( l2) f l i g h t s , it was decided t o inc lude t h e s e r e s u l t s as well.
This p a r t o f t h e f i n a l r e p o r t p r i n c i p a l l y p r e s e n t s r e s u l t s showing com-
par i sons of t he va r ious atmospheric sources with S h u t t l e der ived param-
e t e r s .
f l i g h t s , a n a l y s i s methodology, and q u a n t i f i c a t i o n of atmospheric s t r u c t u r e
which has been encountered over t h e first t h r e e yea r s of t h e STS Program.
Pa r t 2 of t he f i n a l r e p o r t p re sen t s a proposed p e r t u r b a t i o n model which
can be u t i l i z e d with t h e GRAM t o emulate S h u t t l e experience.
Included h e r e i n i s a background d i scuss ion of t h e a v a i l a b l e
- 2 -
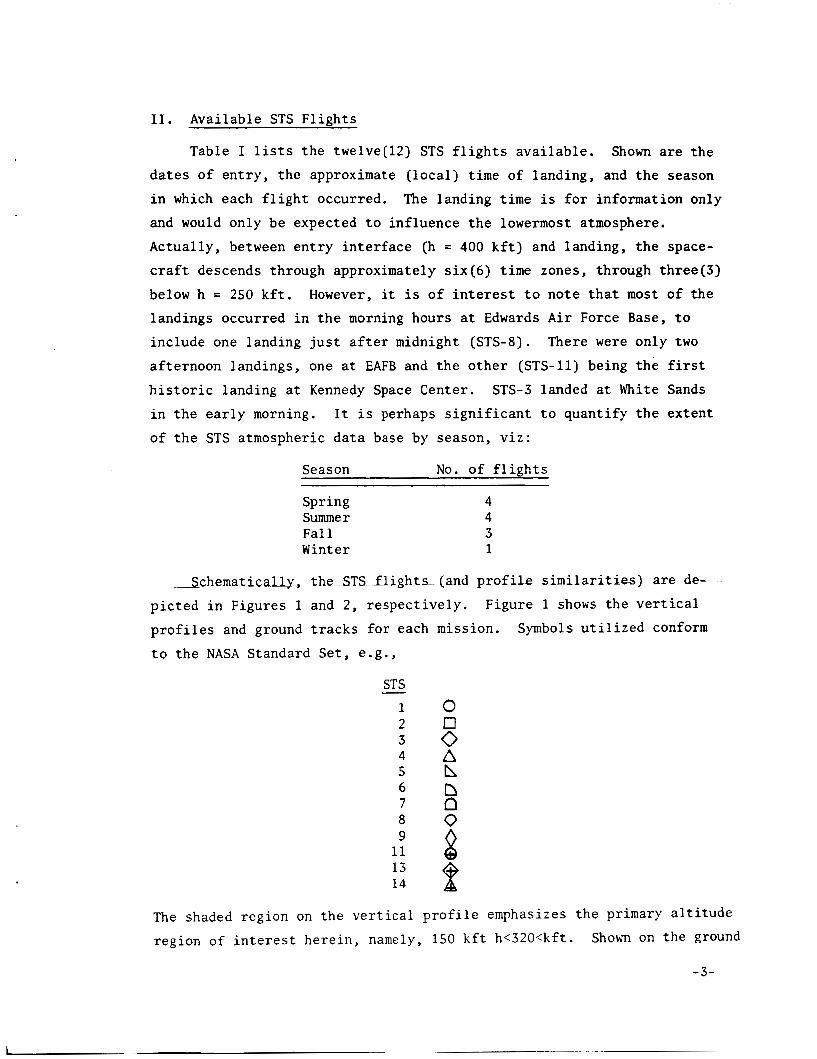
11. Avai lable STS F l i g h t s
Table I l i s t s t h e twelve( l2) STS f l i g h t s a v a i l a b l e . Shown are t h e
d a t e s of en t ry , t h e approximate ( l o c a l ) time of landing, and t h e season
i n which each f l i g h t occurred. The landing t i m e is f o r information only
and would only be expected t o inf luence t h e lowermost atmosphere.
Actua l ly , between e n t r y i n t e r f a c e (h = 400 k f t ) and landing, t h e space-
craft descends through approximately s i x ( 6 ) time zones, through th ree (3 )
below h = 250 k f t . However, it i s o f i n t e r e s t t o n o t e t h a t most of t h e
landings occurred i n t h e morning hours a t Edwards A i r Force Base, t o
inc lude one landing j u s t a f t e r midnight (STS-8).
a f te rnoon landings , one a t EAFB and t h e o t h e r (STS-11) being t h e f irst
h i s t o r i c landing a t Kennedy Space Center . STS-3 landed a t White Sands
i n t h e e a r l y morning.
of t h e STS atmospheric d a t a base by season, v i z :
There were only two
I t i s perhaps s i g n i f i c a n t t o quan t i fy t h e ex ten t
Season No. o f f l i g h t s
Spring Summer Fa1 1 Winter
SchematicaUy, t h c S T S f l i g h t s (and p r o f i l e s i m i l a r i t i e s ) are de-
p i c t e d i n Figures l and 2 , r e spec t ive ly . Figure l shows t h e v e r t i c a l
p r o f i l e s and ground t r a c k s f o r each mission. Symbols u t i l i z e d conform
t o t h e NASA Standard Se t , e .g . ,
1 0
4 A 5 0
2 3 8
6 n 7 n 8 0
11
14 l3 P The shaded reg ion on t h e v e r t i c a l p r o f i l e emphasizes t h e primary a l t i t u d e
region of i n t e r e s t h e r e i n , namely, 150 k f t h<320<kft . Shown on t h e ground
-3-
track plot are the landing sites and remote meteorological sites utilized in support of the Shuttle entries. flight (STS-9) returning from an -60 degree orbit, a Northerly flight during the onset of winter. Also superimposed thereon is an altitude contour corresponding to the geographic location of the uppermost altitude occurrence for each flight. file is quite evident in the altitude plot, at least in the region of interest. twelve flights. least above h = 180 kft. It is noted, though not specifically evident thereon, that with the exception of STS-4 the spread in altitude rate
Of interest is the one available
The shallowness of each Orbiter descent pro-
Figure 2 shows the range of Orbiter descent rate over the The similarity in each flight is clearly suggested, at
would be considerably more narrow even below this altitude. ness of the vertical descent, and the similarities in same across the twelve flights, are addressed later during the discussions of Shuttle derived atmospheres (as a possible limitation) and the sharpness (with time) of the encountered density structure.
The shallow-
- 4 -
E 0 rn cd e, v)
M E
x k c, E w ccc 0
Q) c, cd n
v) b m
b cn a
3 0 N
0 .. 4
b m a E m (u
d ..
G 5 z
m 0
OI ..
z 3 a
0 4
m ..
G 3 a
0 M
9 ..
b m a
3 Ln Ln
0 .. d
s 3 a
0 0 b ..
b a n
3 0 d
0 ..
Li k p.
m d M ..
L i z z w a a
m o o A d d
- L n a .. .. ..
N M
d 4
d -4 k 4
L hi P
> 0 z
0 tc,
c u k cd z
L
d
x
L . . 0) P E e, > 0 z
L
0,
d .rl k 2
. U N
0 c 3 r,
a, P
c, a Q) v)
E L, 0 P
u 0
E n
x k
k 4
-5-
Altitude, kft s a
\ 0
\
Longitude, deg
F i g u r e 1. Ground t r a c k s and v e r t i c a l p r o f i l e s f o r f i r s t -6- twelve( l2) STS e n t r y f l i g h t s .
ALTITUDE R A T E , f p s Range of O r b i t e r d e s c e n t p r o f i l e s f o r f i r s t t w e l v e ( l 2 ) e n t r y f l i g h t s . - 7 -
F i g u r e 2 .
111. Available Data, Models, and Methodology
Reader f a m i l i a r i t y with d e t a i l s o f t h e ongoing S h u t t l e aerodynamic
research i s , perhaps, presumptuous. Thus, t h i s l i m i t e d d i scuss ion i s
included.
Compton, e t a1 i n Reference 4 , def ines t h e b e s t p o s t - f l i g h t t ime h i s t o r y
of t h e spacec ra f t ( i n e r t i a l ) s ta te ; p o s i t i o n , v e l o c i t y , and a t t i t u d e ,
which is obta ined by combining ( d e t e r m i n i s t i c a l l y ) spacec ra f t dynamic
measurements and ( s t a t i s t i c a l l y ) t h e ground based t r a c k i n g information;
C-band, S-band, and c ine - theodo l i t e when a v a i l a b l e . The p r i n c i p a l source
f o r spacecraf t dynamics i s t h e t r i - r edundan t I n e r t i a l Measurement Unit
(IMU) measurements of p la t form a t t i t u d e qua tern ion and summed v e l o c i t y
changes i n t h e i n e r t i a l Mean o f 1950 r e fe rence frame. Heck, e t a l , i n
Reference 5 presented algori thms t o d e r i v e t h e equiva len t body axes
acce le ra t ions and ra tes from t h e -1 Hz measurement s e t . 1
The concept of t h e Best Estimate Tra j ec to ry , as discussed by
Given an i n e r t i a l recons t ruc ted t r a j e c t o r y , one needs some atmos-
phe r i c information t o compute t h e necessary a i r r e l a t i v e parameters.
(The Orb i t e r does have an a i r d a t a system which provides i n s i t u measure-
ments below Mach - 3 (h<100 k f t ) ) . Obviously models can be u t i l i z e d (as
done here in) b u t , t o enhance t h e q u a l i t y of t h e research products , meteor-
o log ica l rocke t s and ba l loons have been launched i n support of S h u t t l e
e n t r y f l i g h t s .
s p a t i a l l y optimum as p o s s i b l e and y e t , compilat ion of t hese measurements
i n t o a s i n g l e , v i a b l e , atmosphere commensurate with t h e Orb i t e r ground
t r a c k and v e r t i c a l p r o f i l e i s s t i l l an arduous t a s k . Two separa te t r e a t -
ments of t h i s process a r e c u r r e n t l y performed a s d iscussed l a t e r .
These remote measurements have been taken as time and
For t h e s e l e c t e d atmosphere (remote(s) o r model (s ) ) , computation of
f l i g h t der ived aerodynamic c o e f f i c i e n t s i s s t r a igh t fo rward . To complete
t h e aerodynamic r e sea rch , spacec ra f t con f igu ra t ion information i s r equ i r ed
t o enable comparison of t h e f l i g h t r e s u l t s with t h a t expected from ground- based facilities a;d/cr t h e ~ r e t i c a ! ccripitation;. Grbiter con t ro l siirface
pos i t i ons and r e a c t i o n j e t f i r i n g information are a v a i l a b l e from the Operational Instrumentat ion recorded d a t a s e t t o d e f i n e t h e necessary
'As p a r t o f t h e Orb i t e r Experiments Package (OEX), t h e High Resolution Accelerometer Package (HiRAP) i s an a v a i l a b l e pg source ( s ince STS-6) which can be u t i l i z e d i n t h e thermosphere. Resul t s from H i R A P a r e presented i n P a r t 2 of t h i s f i n a l r e p o r t . - 8 -
conf igura t ion .
u t i l i z e d t o ob ta in p red ic t ed c o e f f i c i e n t s . The d a t a book i s based
on a consensus f a i r i n g by aerodynamicists throughout t h e S h u t t l e
community and was developed over a per iod of yea r s and many thousands
of wind tunnel opera t ing hours.
has , with few except ions , been s u b s t a n t i a t e d by t h e f l i g h t s of record
t o be an e x c e l l e n t aerodynamic p r e d i c t i o n package.
base has been s c r u t i n i z e d by the most comprehensive end-to-end f l i g h t
t e s t program ever . P r o j e c t aerodynamicists have been a b l e t o develop
i n t e r i m F l i g h t Assessment Deltas (FADS) i n support o f t h e Shu t t l e Program,
u l t i m a t e l y geared toward development o f a f i n a l Operat ional Orb i t e r Aero-
dynamic Data Book.
u t i l i z e d and t h e FADS, small incremental changes, have not been incor -
pora ted .
A comprehensive O r b i t e r Aerodynamic Data Base i s
As w i l l be shown la te r , t h e d a t a base
Indeed, t h e d a t a
For t h e purposes he re in , a 1978 v in t age d a t a base is
With t h e preceeding background i n mind, it is apparent t h a t t h e
process can be reversed from one of aerodynamic performance comparison
t o atmospheric eva lua t ion . The pred ic t ed aerodynamic c o e f f i c i e n t s can
be u t i l i z e d t o d e r i v e an i n s i t u atmosphere and s a i d atmosphere can be
compared with o t h e r sources d i r e c t l y t o eva lua te t h e i r r e spec t ive ade-
quacy, each on a common t r a j e c t o r y p r o f i l e . however, p r i o r t o p re sen t ing the r e s u l t s , it is worthwhile t o f u r t h e r
d i scuss t h e p a r t i c u l a r s of each atmospheric source sepa ra t e ly .
This has been done he re in ;
S h u t t l e der ived atmomheres
These atmospheric da t a a r e based, as s t a t e d , on t h e pred ic ted
O r b i t e r normal f o r c e c o e f f i c i e n t , C N ~ , from a v in t age 1978 da ta base,
and t h e measured normal acce le ra t ion , AN, der ived from t h e IMUs. I t
should be s t a t e d t h a t an -1 mg quan t i za t ion (due t o downlis t l i m i t a t i o n s )
i n t h e IMU d a t a nega tes use of t h e s e d a t a above -300 k f t (due t o s i g n a l -
t o -no i se cons ide ra t ions ) though major dev ia t ions can be de tec ted up t o
-320 k f t by averaging through t h e no i se induced s i g n a l .
ob ta ined as a d i r e c t map a s follows:
Density can be
Such a dens i ty de te rmina t ion i s reasonably accu ra t e .
v e l o c i t y (VA) and a l t i t u d e / l a t i t u d e f o r t h e a s soc ia t ed d e n s i t y p r o f i l e
a r e obtained from t h e BET which i s , as s t a t e d , based on a s ta t i s t ica l
f i t t o the a v a i l a b l e t r a c k i n g measurements taken dur ing en t ry . Also,
updated post f l i g h t mass p r o p e r t i e s are u t i l i z e d . Perhaps t h e l a t e n t
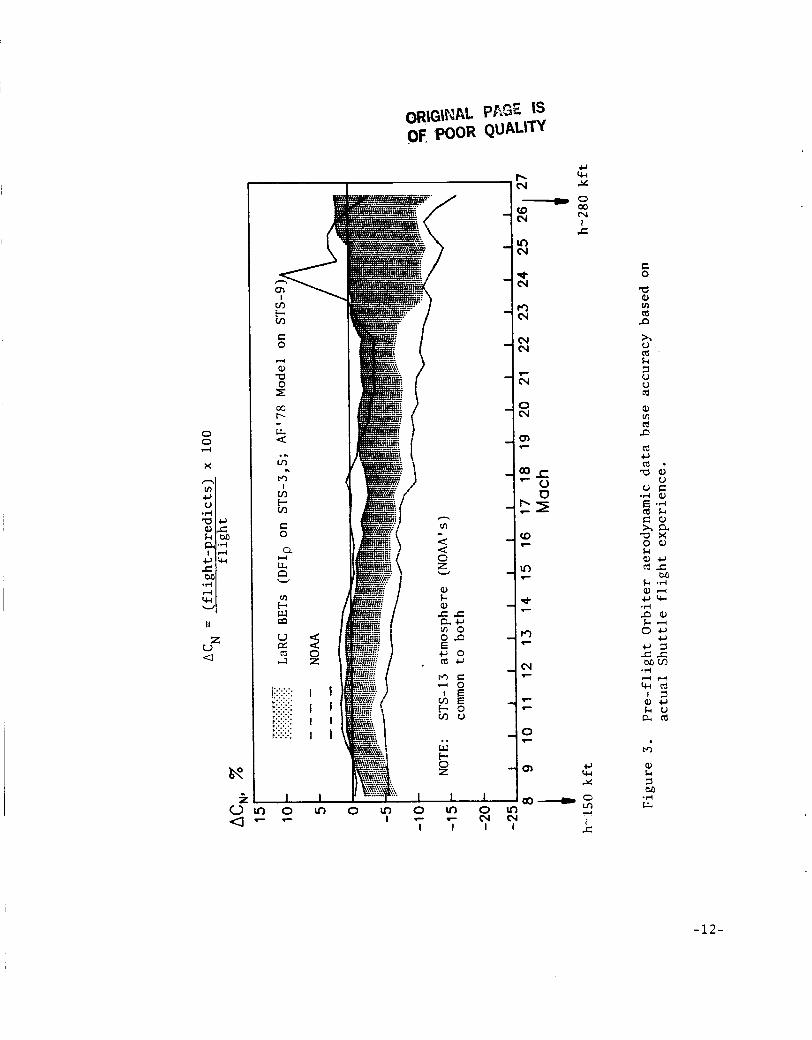
weakness of t h i s de te rmina t ion , though no t a major one, i s t h e p red ic t ed aerodynamic c o e f f i c i e n t which has been shown (see Figure 3) t o be, based on t h e f l i g h t s analyzed t o d a t e , overpredic ted by some 3 t o 5 pe rcen t .
This overpredic t ion r e f l e c t s as a b i a s i n t h e d e n s i t y de te rmina t ion ,
making t h e der ived d e n s i t y some 3 t o 5 percent less dense than a c t u a l ,
a t least f o r 150 kf t<h<280 k f t .
The requi red
To cont inue, p re s su re i s obtained from t h e h y d r o s t a t i c equat ion:
d p = - P g d h cN
F i n a l l y , temperature i s computed from t h e p e r f e c t gas law. Readers a r e
reminded t h a t t h e S h u t t l e e n t r y f l i g h t p r o f i l e i s very shallow (on a r e l a t i v e b a s i s ) when compared t o t h e usua l sounding devices employed f o r atmospheric e x t r a c t i o n . Thus, some l i b e r t i e s are taken i n t h e employment
of t h e hydros t a t i c equat ion y e t , a p a r t from t h i s l i m i t a t i o n (approxima-
t i o n ) one i s l e f t with l i t t l e recourse t o enable determinat ion of t h e
"complete" ambient atmosphere.
no " in s i t u" winds a r e de r ivab le from t h e S h u t t l e d a t a .
For t h e a l t i t u d e range under cons ide ra t ion ,
Remote measurements
Remote soundings are taken during each S h u t t l e e n t r y f l i g h t i n
support o f t h e ongoing aerothermodynamic research .
as s p a t i a l l y and time optimum as p o s s i b l e .
(PWN-12A) and the rmis to r s (PWN-11A) are u t i l i z e d a t t h e s e a l t i t u d e s .
Though e f f o r t s are made t o ob ta in time optimum measurements, some
a n a l y s i s i s r equ i r ed t o t r a n s l a t e t h e s e d a t a t o t h e S h u t t l e ground track
and v e r t i c a l p r o f i l e .
a c t i v i t i e s . These inc lude (1) t h e development of Langley Atmospheric
Information Re t r i eva l System (LAIRS) f i l e s by J . Mac P r i c e of t h e
Aerothermodynamic Branch of t h e Space Systems Divis ion a t L a R C , and
( 2 ) development of N O M fltotem-pole" atmospheres by Me1 Gelman of t h e
Climatology Branch of t h e National Weather Serv ice i n h'ashington, D.C.
These soundings a r e
Devices such as Robin spheres
To t h a t e x t e n t , t h e r e are a c t u a l l y two sepa ra t e
-10-
Though each t reatment of t h e remote sounding d a t a is equal ly r igorous
t h e r e a r e some d i f f e rences v i s i b l e i n t h e f i n a l p roducts .
wi th in t h e scope of t h i s r epor t t o a t tempt t o quan t i fy t h e d i f f e rences
i n t h e two methodologies.
usua l source f o r LaRC a n a l y s i s is t h e LAIRS f i l e ( see Reference 6 ) and,
a l s o by convention, t h e JSC BET a c t i v i t y u t i l i z e s t h e "totem pole" a t -
mospheres i n conjunct ion with a b i - v a r i a t e l a t i t u d e / l o n g i t u d e in t e rpo la -
t i o n algori thm. A s p a r t o f an o v e r a l l q u a l i t y assessment, both atmos-
pheres are considered p r i o r t o r e l e a s e of t h e f i n a l LaRC BET products .
For t h e purposes he re in , both remote atmospheric sources are considered.
Thus, r eade r s can review t h e r e s u l t s from each(*) , reminded t h a t , f o r
t h e most p a r t , any d i f f e r e n c e s shown r e f l e c t p rocess d i f f e rences s ince ,
i n most i n s t ances , t h e same sounding information was u t i l i z e d . What i s
not r e f l e c t e d d i r e c t l y i s t h e accuracy o f t h e s e soundings pe r se which
would, o f course, be sub jec t t o some e r r o r .
I t is not
Suf f ice i t t o say t h a t , by convention, t h e
Mode 1 s
The two models considered, namely t h e MSFC Global Reference Atmos-
phere and t h e A i r Force 1978 Reference Atmosphere, a r e very comprehensive
models which incorpora te l a t i t u d i n a l and seasonal effects. A t h i r d model,
t h e 1976 Standard Atmosphere, is only u t i l i z e d t o normalize t h e dens i ty
p r o f i l e s t o show any s igna l i n the va r ious d e n s i t y p r o f i l e s .
model, which was furn ished by the government v i a JSC, i s the most gene ra l .
The A i r Force model i s only def ined up t o 90 km (55 km a t t h e pole) and
r e q u i r e s some ex t r apo la t ion t o h ighe r a l t i t u d e s . For general u t i l i t y , a
comprehensive upper atmosphere model would need be developed.
model a l r eady has the Jacchia-Roberts model a v a i l a b l e , and, what might
prove va luable f o r f u t u r e AOTV t r a j e c t o r y ana lyses , a sphe r i ca l harmonic
wind model.
The GRAM
The GRAM
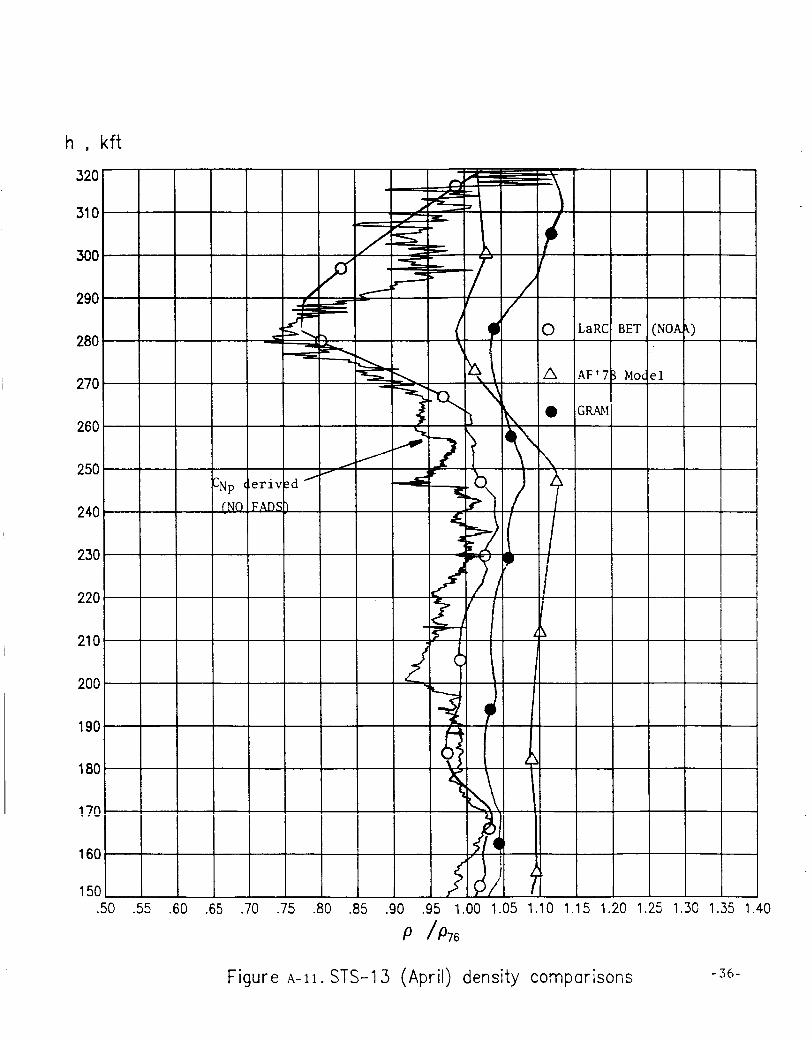
( * ) I t i s t o be understood t h a t comparisons of t h e two remote sources on four of t h e f l i g h t s i s not v a l i d . The LaRC BETS u t i l i z e d dens i ty pro- f i l e s der ived from in s i t u Development F l i g h t Instrumentat ion p res su re
due t o ground t r a c k cons idera t ions ; and t h e equiva len t N O M ITtotem-pole" d a t a f o r STS-13.
measurements fer STS-3 and STS-5; t h e P.ir F E C P 1978 Mndel f n r STS-9
-11-
3 0 z
I I I I
I I 0 cv I
c, rec
c, w X
c 0
a e, VI cd P
5. cd k 3 u u cd e, VI cd P cd c, r e . m e , u u c 4 o, E cdh G o , x a a x oe, k e,@ cdc
M k -4 a 4 Wrec *4 Po, $-4d o w
c, c l 3 s s MV3
.I+ 4 4 r e c c d
I 3 0 0 k O acd
M o, k 3 M .4 U
-12 -
I V . Discussion of Resul t s
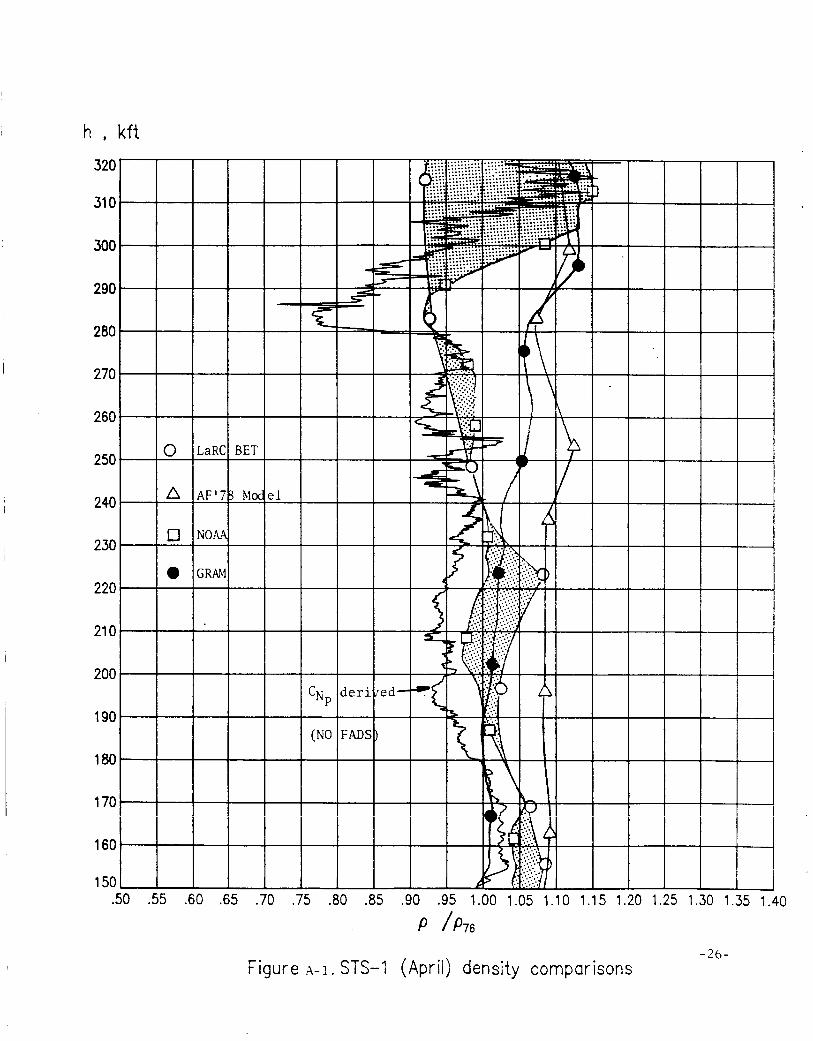
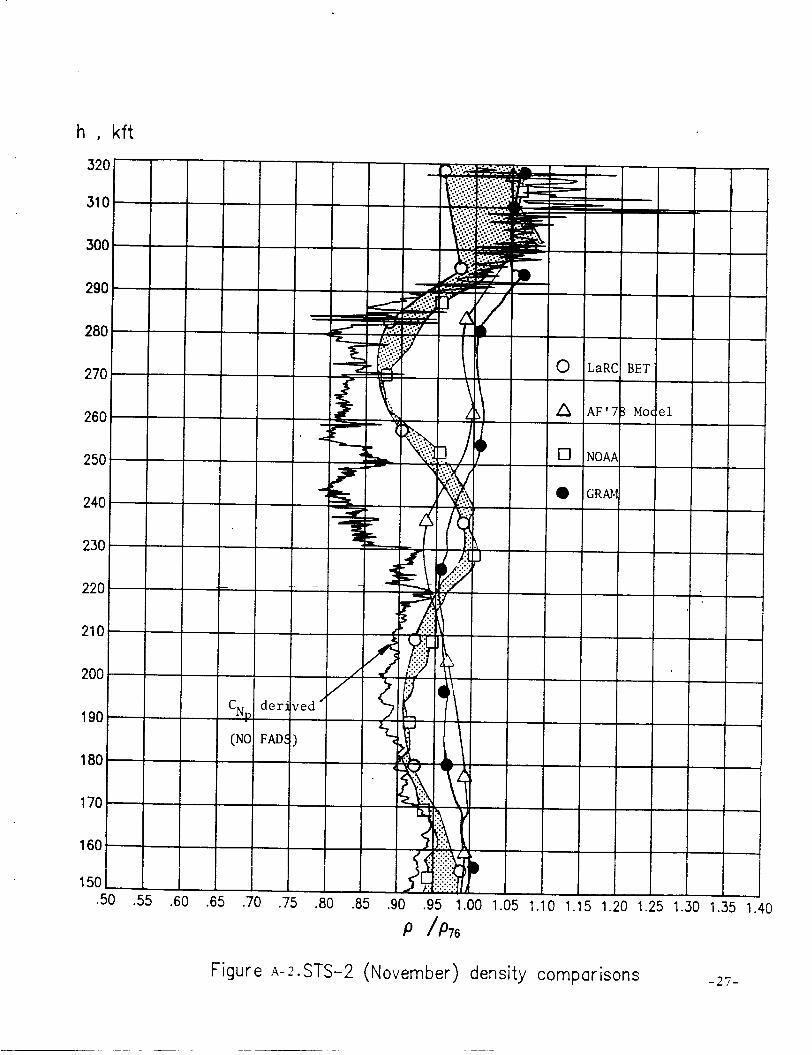
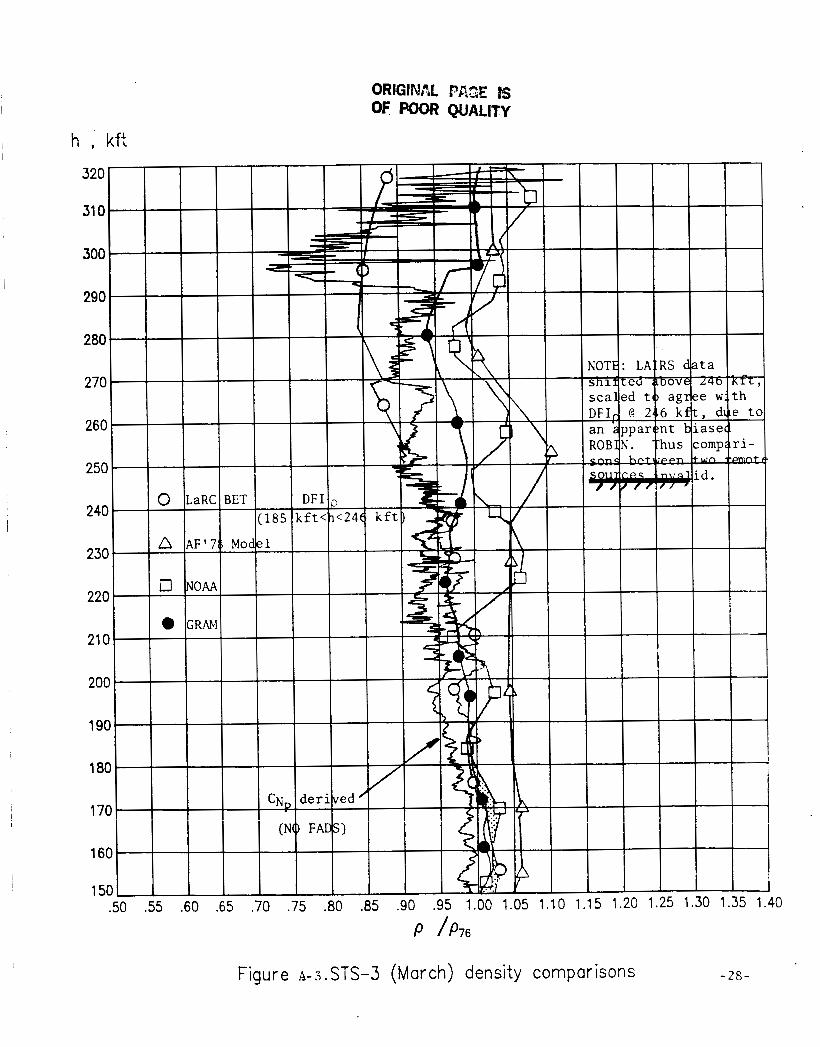
Appendices A and B present d e n s i t y and temperature comparisons by
f l i g h t f o r each of t h e a v a i l a b l e atmospheric sources .
are t h e S h u t t l e der ived r e s u l t s .
t h e 1976 Standard Atmosphere t o exemplify d i f f e r e n c e s and permit de tec-
t i o n of s t r u c t u r e i n t h e der ived da ta . The temperature p l o t s are in -
cluded f o r completeness with v i r t u a l l y no d iscuss ion . I t i s dens i ty ,
and r e p r e s e n t a t i v e s t r u c t u r e i n same, t h a t i s of paramount importance
t o AOTV t r a j e c t o r y a n a l y s t s .
each f l i g h t by r e f e r r i n g t o t h e appropr i a t e f i g u r e i n t h e Appendices.
S p e c i f i c a l l y , one can s e e t h e somewhat unique s t r u c t u r e encountered
during each en t ry . Also, any d i f f e r e n c e s between t h e remote source d a t a ,
where a v a i l a b l e , a r e h ighl ighted by t h e shaded reg ions thereon. F ina l ly ,
t h e adequacy (o r lack the reo f ) of each of t h e two models and p o t e n t i a l
f o r improvement are r e a d i l y v i s i b l e . Annotation and comments as neces-
s a r y are included on each cha r t . In t h i s Sec t ion , a general summary of
t h e more r e l e v a n t r e s u l t s i s presented. A measure of t h e range of den-
s i t i es sensed by t h e accelerometers i s compared d i r e c t l y with t h e o t h e r
sources . F i n a l l y , t h e d i f f e rences between t h e sensed atmosphere and each
source ~ ~ i s w a n t i f i e d s t a t i s t i c a l l y .
Included thereon
The d e n s i t y p l o t s are normalized t o
Readers can make s p e c i f i c comparisons f o r
S h u t t l e der ived atmospheres
0 Though each f l i g h t i s somewhat unique, t h e r e is cons iderable
s i m i l a r i t y by season. Part 2 o f t h i s f i n a l r epor t p re sen t s
t h e der ived d a t a i n t h i s form (sca led t o t h e GRAM va lues) f o r
modelling purposes. Reference 7 a l s o presented comparisons
by season.
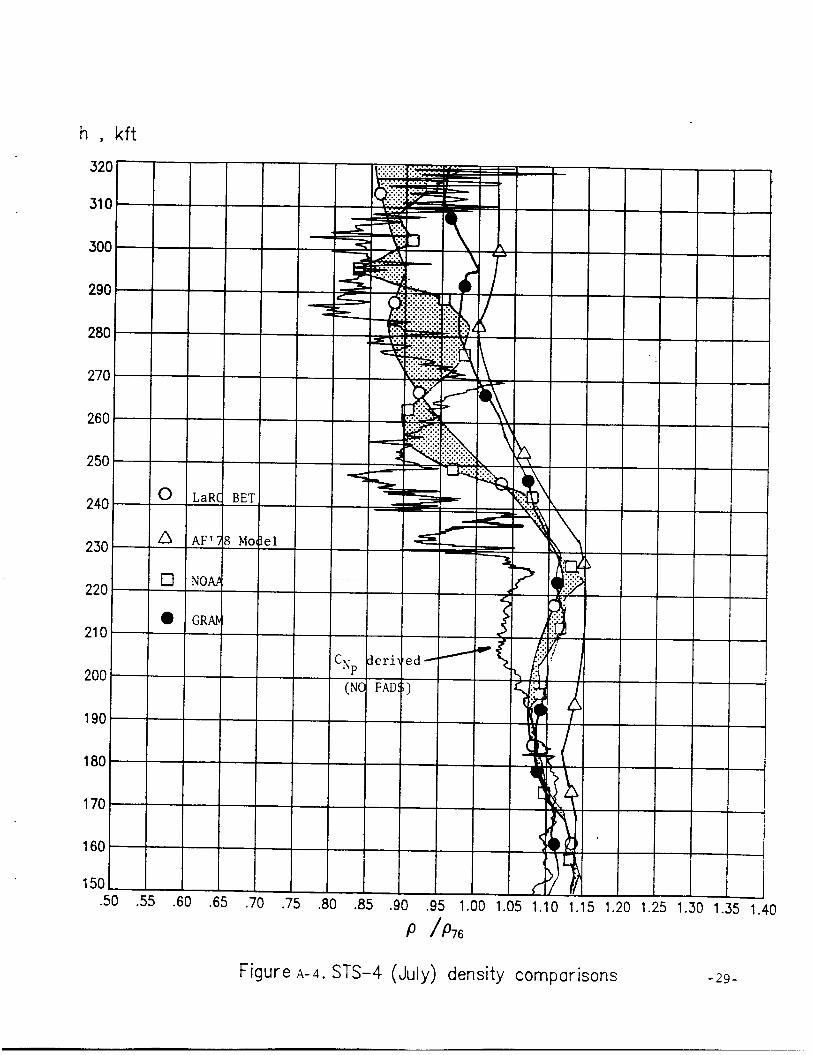
0 Large shea r s (up t o 15 percent on STS-4) are v i s i b l e i n t h e
summer months between a l t i t u d e s of 230 kft<h<250 k f t . These
shea r s occur , i n some ins t ances , over a l t i t u d e i n t e r v a l s on
t h e o rde r of 100 f t , i .e . , over a per iod of 1 t o 2 seconds,
i n f e r r e d from t h e descent r a t e curve (Figure 2 ) .
0 The "pothole-in-the-sky" s t r u c t u r e observed i n t h e STS-2
f l i g h t d a t a i s shown as a reg ion of less d e n s i t y i n t h e
i?lterval, 23c! k f t < h < 2 5 0 k f t . In r e t r c s p e c t , t h i s regicr , , - 13-
though cause of major concern during t h e e a r l y aerodynamic
research a c t i v i t y , i s not so unique s i n c e s imilar s t r u c t u r e
can be seen i n many of t h e f l i g h t s , p a r t i c u l a r l y s i n c e t h e
r e s u l t s have been developed at h ighe r a l t i t u d e s f o r t h i s
study.
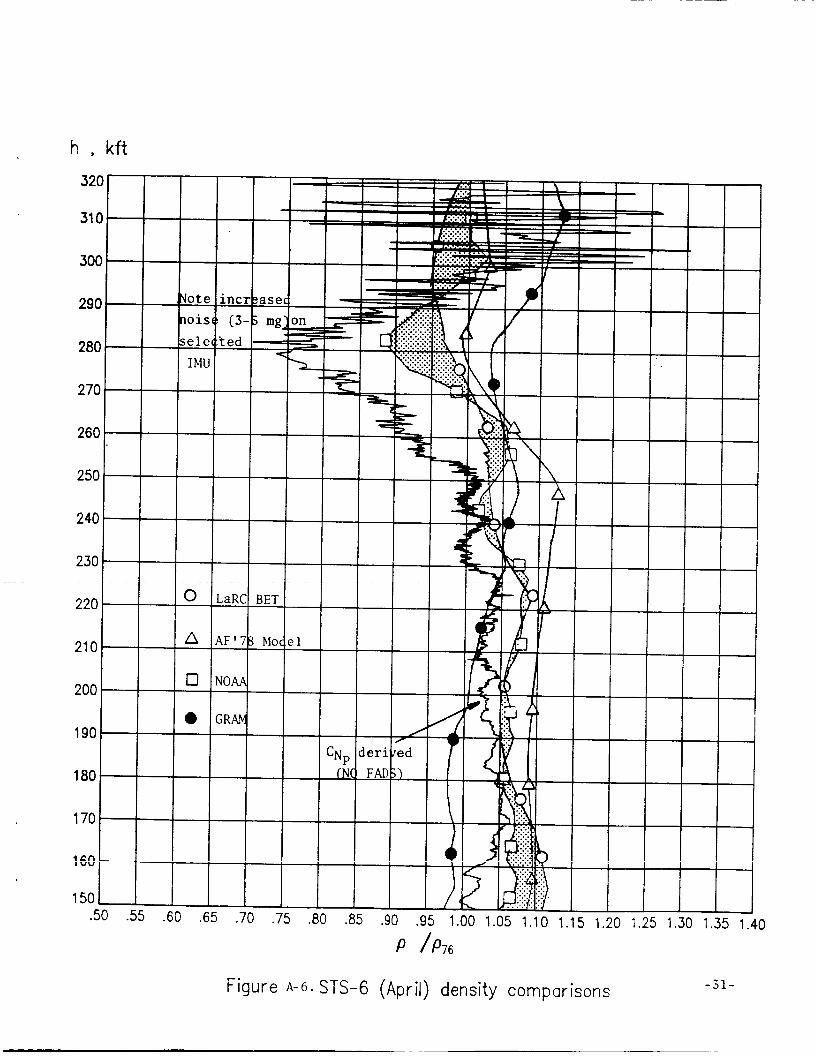
0 There i s t y p i c a l l y more s t r u c t u r e suggested i n t h e sp r ing
months a t a l t i t u d e s above h-280 k f t . In p a r t i c u l a r , abrupt
i nc reases i n d e n s i t y on t h e o r d e r of 15 t o 20 percent over
- 2 k f t (3 t o 4 seconds) a r e observed, e .g . , a t -280 k f t on STS-1, -295 k f t on STS-3.
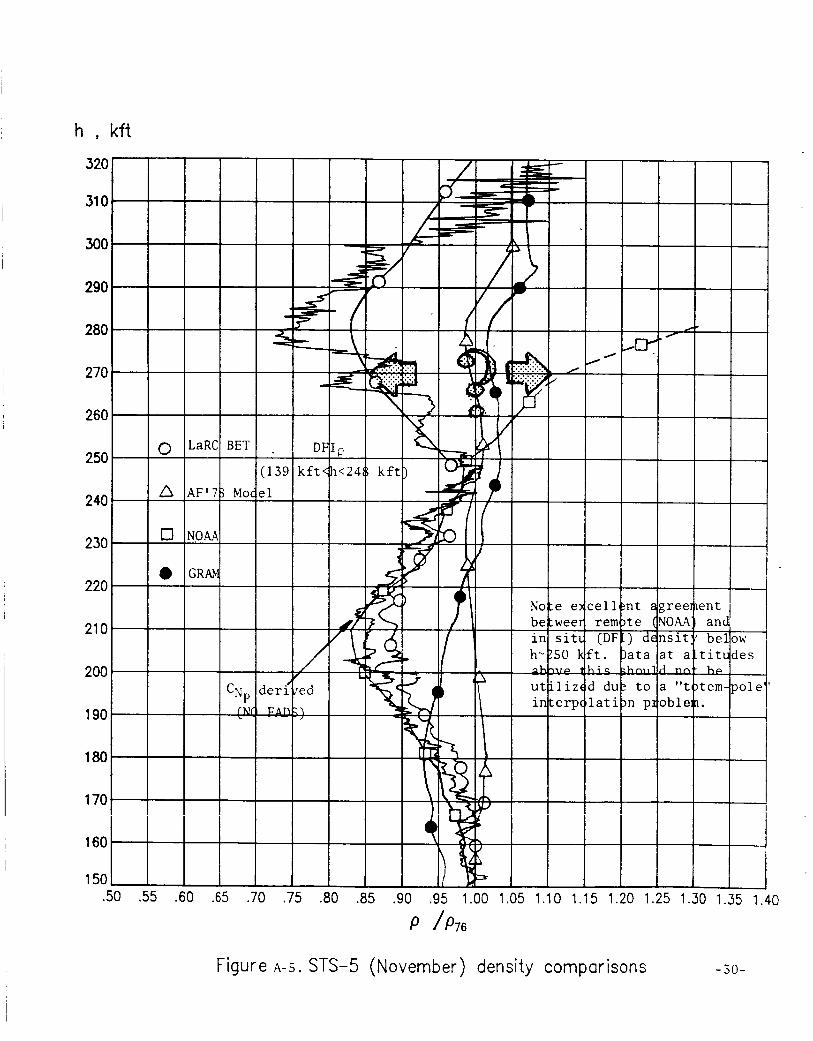
0 STS-5 r e s u l t s (Figure A-5) show a somewhat unique p r o f i l e
This November e n t r y impl ies between 250 k f t and 280 k f t .
a sharp d e n s i t y inc rease (-15 pe rcen t ) a t -276 k f t , de-
c reas ing as a t r i a n g u l a r wave by -10 pe rcen t , followed by
two abrupt s h i f t i n c r e a s e s ; one a t -266 k f t and t h e second
a t -252 k f t . This atmosphere i s perhaps t h e most no t i ceab le
mult i - layered p r o f i l e of any of t h e f l i g h t s .
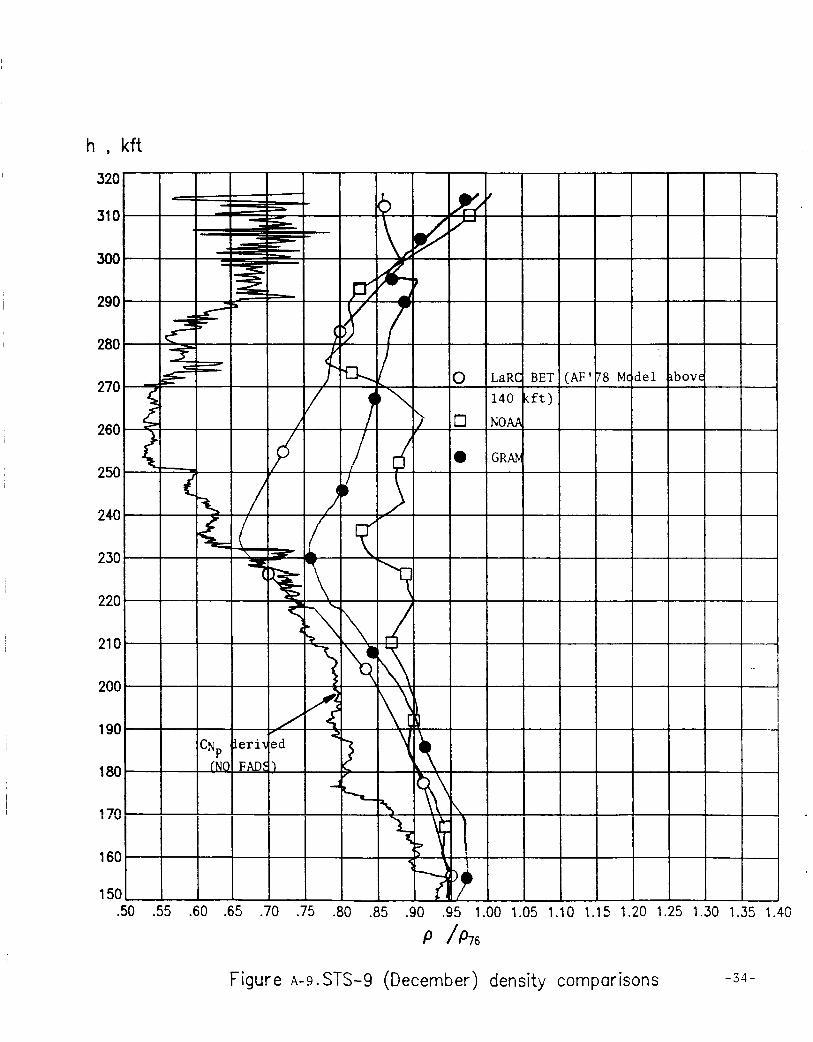
0 The somewhat unique r e s u l t shown f o r STS-9, which e x h i b i t s
much less d e n s i t y above 230 k f t , sugges ts some l a t i t u d i n a l
model improvements can be made but more high i n c l i n a t i o n
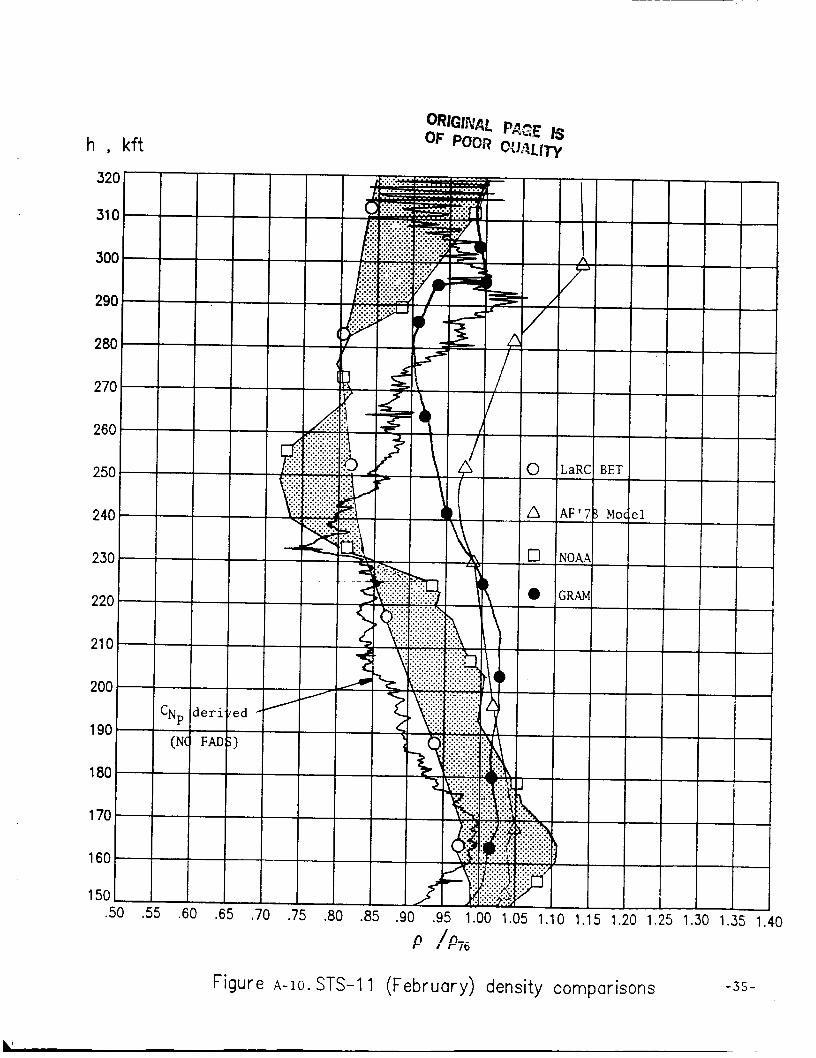
en t ry f l i g h t s a r e c e r t a i n l y requi red . Also, STS-11 i s t h e
only win te r f l i g h t a v a i l a b l e which p r e s e n t s a l i m i t a t i o n i n
the atmospheric d a t a base f o r model improvement.
Given t h a t t h e AOTV experiment i s c u r r e n t l y planned with a
near Equator ia l a e r o - a s s i s t maneuver, it i s r e l e v a n t t o look
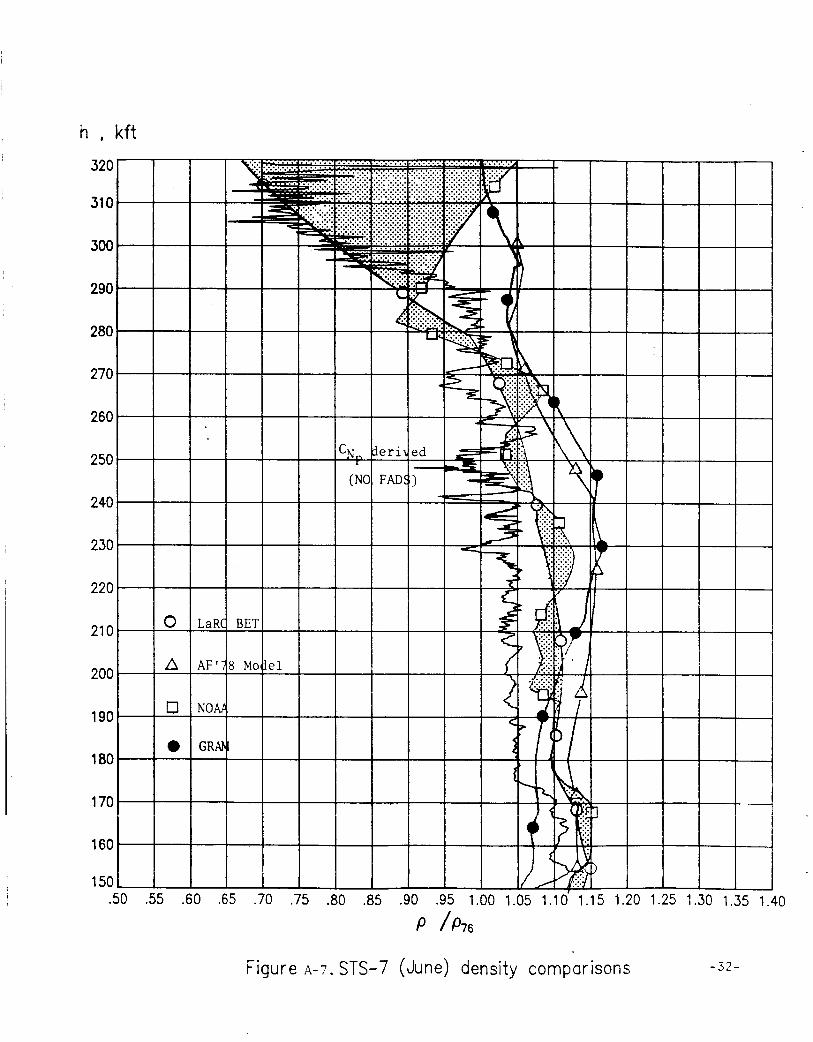
s p e c i f i c a l l y a t t h e r e s u l t s from STS-3, 6 , 13 and 11. These
f l i g h t s , ordered as ind ica t ed , are c l o s e s t t o t h e Equator
during descent . Atmospheric p e r t u r b a t i o n s t h e r e i n a r e no
le>> > 1 g 1 1 1 1 1 L C + l I C . 2 - - - - 2 --: e;
Though not s p e c i f i c a l l y presented he re in , r eade r s can r e f e r t o
t h e d iscuss ions i n Reference 7 p e r t a i n i n g t o p o t e n t i a l atmospheric
s t a b i l i t y (convective over turn ing) i n the encountered atmospheres of
STS-2 and STS-4.
super ad iaba t i c lapse r a t e s though, as suggested, t he shallow aspec ts
The der ived temperature p r o f i l e s showed regions with
-14-
of t h e STS e n t r y p r o f i l e must be considered as a p o s s i b l e l i m i t a t i o n .
I t was recognized t h a t t he ana lys i s was l i m i t e d t o impl ica t ions i n t h e
v e r t i c a l and, q u i t e poss ib ly , h o r i z o n t a l s t r u c t u r e could have been
encountered.
Remote measurements
Figures 4 and 5 show range of d e n s i t i e s , as t h e shaded region, from t h e two remote sources , LAIRS and N O M , r e s p e c t i v e l y , based on t h e first twelve f l i g h t s . Superimposed on each f i g u r e is t h e suggested d e n s i t y
range ( a s t h e dashed l i n e s ) sensed by t h e accelerometry. Clear ly t h e
l e f t boundary of t h e C N ~ derived dens i ty spread i s governed by-STS-9.
Therein, t h e LAIRS d a t a , which u t i l i z e d t h e AF'78 atmosphere f o r t h a t
f l i g h t , i s somewhat misleading when represented as remote da t a . In any
event above h-230 k f t , none of t h e remote sources show as broad a range
of d e n s i t y as sensed. Other genera l comments a r e :
0
0
0
0
Remotely measured atmospheres, due t o smoothing processes a t
t h e va r ious l e v e l s of d a t a r educ t ion , can never r e f l e c t t h e
small scale atmospheric s t r u c t u r e s e n s i b l e i n t h e Orb i t e r
accelerometry.
There a r e sys temat ic d i f f e r e n c e s between t h e two remote atmos-
pheres i n most ins tances which ref lect process d i f f e rences , no t
sounding accuracy. However, s t a t i s t i c a l l y each provides f o r
e s s e n t i a l l y t h e same (on average) r e s u l t s as was shown i n t h e
ACN curve of Figure 3 .
The importance of s p a t i a l l y (and t ime) optimum soundings cannot
be overemphasized, i n p a r t i c u l a r i n view of t h e poor STS-9
r e s u l t s (Figure A-9) which r equ i r ed cons iderable t r a n s l a t i o n i n
t h e l a t i t u d i n a l d i r e c t i o n .
S h u t t l e has had good q u a l i t y sounding d a t a f o r t h e most p a r t .
Known problems ex i s t ed on STS-3 and t h e q u a l i t y of t he d a t a
f o r STS-11 was ques t ionable . For tuna te ly , on STS-3 t h e DFI
d a t a were a v a i l a b l e . However, t h e l a r g e d i f f e rences shown
between t h e two remote sources i n Figure A-10 f o r STS-11 ce r -
t a i n l y v i n d i c a t e t h e need f o r accu ra t e sounding information.
-15
The above cons ide ra t ions are extremely r e l e v a n t i f an AOTV exper-
iment i s flown with planned meteorological suppor t .
Models
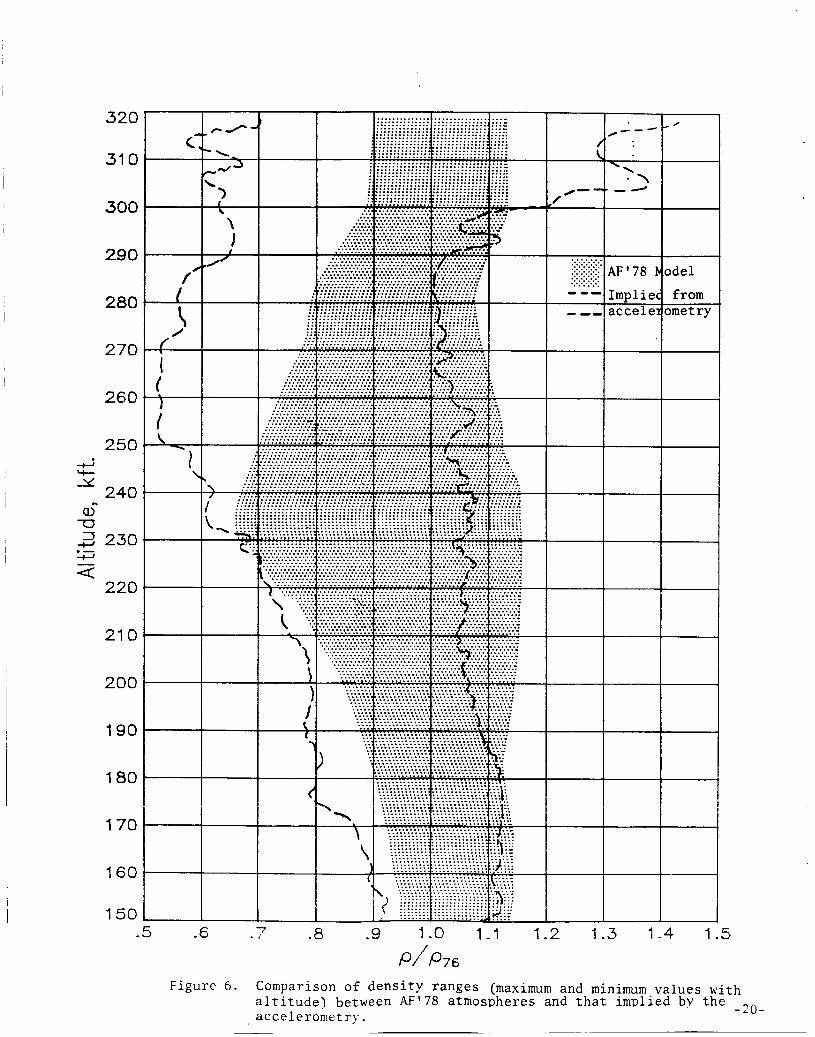
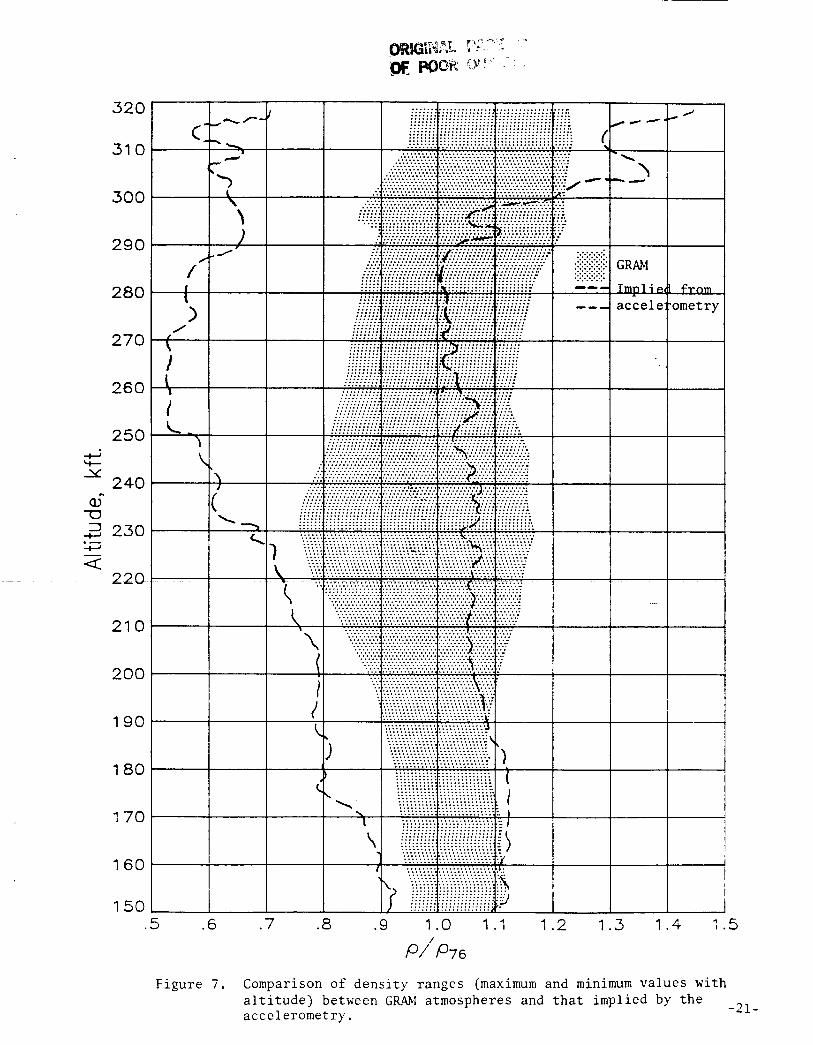
Figure 6 and 7 show t h e range of d e n s i t i e s over t h e first twelve
f l i g h t s suggested by t h e AF'78 and GRAM models, r e s p e c t i v e l y , as shaded
reg ions .
i n t h e accelerometry.
boundary, a l b e i t t oo dense throughout . Nei ther model ref lects t h e i n -
c reased spread aboveh-230 k f t . Again t h i s i s a l a t i t u d i n a l l i m i t a t i o n .
Other re levant comments are:
Superimposed thereon are t h e same range of d e n s i t i e s as sensed
Both models appear t o r e f l e c t t h e h igher d e n s i t y
0
0
0
a
0
Neither t h e GRAM nor AF'78 model can be expected t o e x h i b i t
the sharp d e n s i t y s t r u c t u r e evidenced i n t h e S h u t t l e der ived
p r o f i l e s .
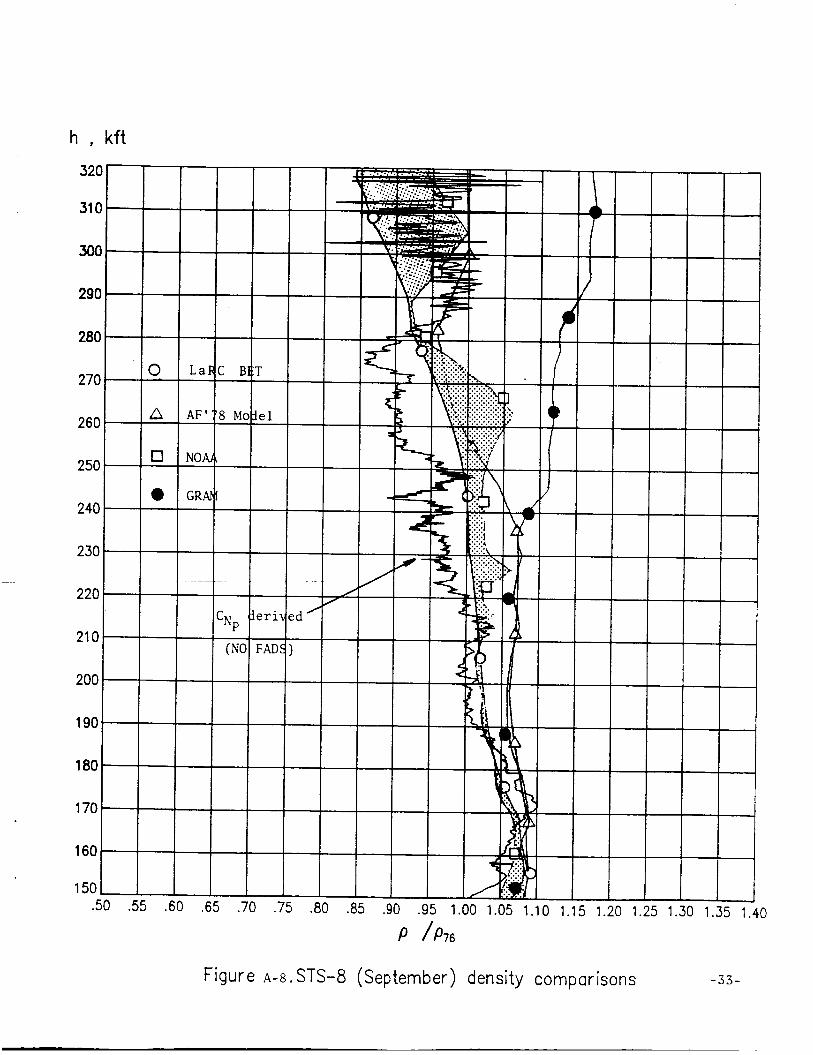
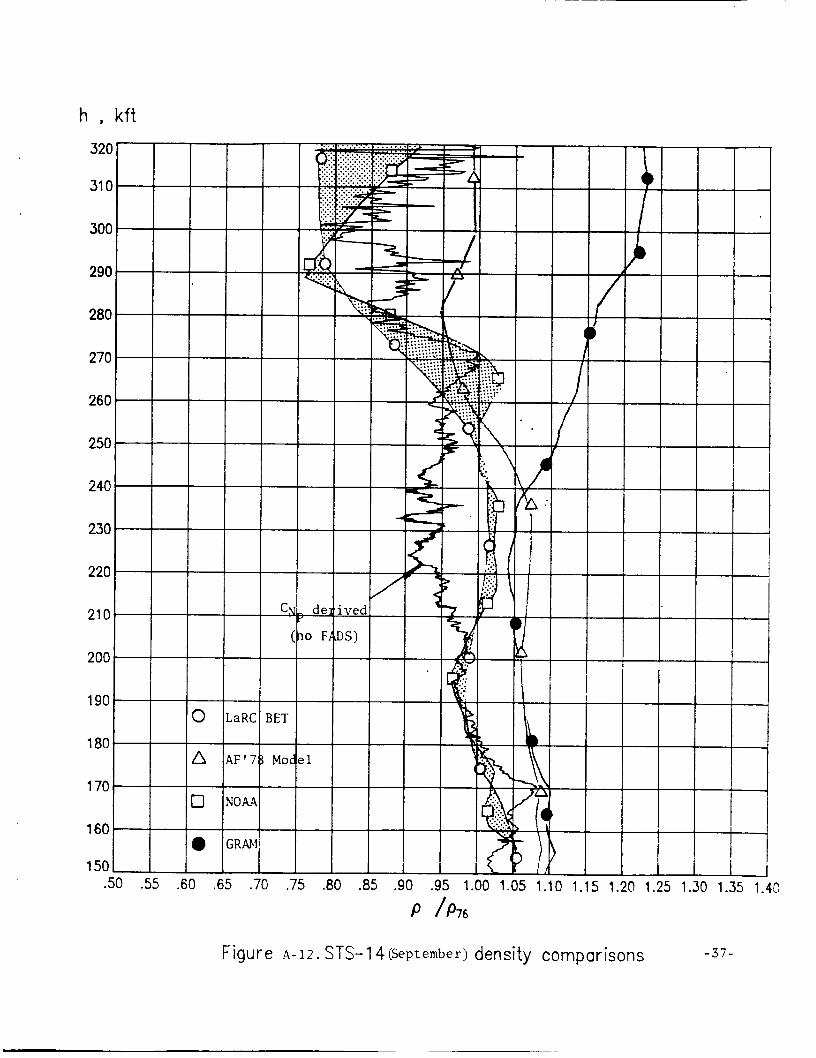
The GRAM dens i ty i s t o o dense i n t h e month of September above
h-230 k f t as observed i n t h e STS-8 and STS-14 c h a r t s (Figures
A-8 and A - 1 2 , r e s p e c t i v e l y ) . The temperature c h a r t s (Figures
B-8 and B-12) would not n e c e s s a r i l y i n d i c a t e a problem i n t h i s
month. The atmosphere i s somewhat warmer i n t h e reg ion , 210
kft<h<280 k f t . Both t h e GRAM and AF'78 models r e f l e c t t h e lower dens i ty sensed
by t h e accelerometry f o r t h e h igh l a t i t u d e e n t r y f l i g h t (STS-9,
Figure A-9), a t least up t o an a l t i t u d e of h-230 k f t . However,
a t l e a s t f o r t h i s f l i g h t , t h e AF'78 model would appear t o be a
somewhat b e t t e r , though s t i l l l i m i t e d , l a t i t u d i n a l (seasonal)
r ep resen ta t ion a t h ighe r a l t i t u d e s .
Above h-250 k f t on STS-11 (Figure A - l o ) , t h e only winter f l i g h t
ava i l ab le , t h e r e a r e apprec iab le d i f f e r e n c e s between t h e GRAM
and AF' 78 dens i ty p r o f i l e s .
For n ine(9) of t h e f l i g h t s , t h e GRAM i s as good o r s l i g h t l y
b e t t e r than t h e AF model.
Assuming t h e preceeding l i m i t a t i o n s are reviewed by the MSFC, t h e
GRAM should provide AOTV a n a l y s t s with a good model f o r f u t u r e s t u d i e s .
I t has the advantage over t h e AF'78 i n t h a t i t conta ins a Jacchia-Roberts
formulation f o r h igher a l t i t u d e s . -16-
S t a t i s t i c a l cons idera t ions
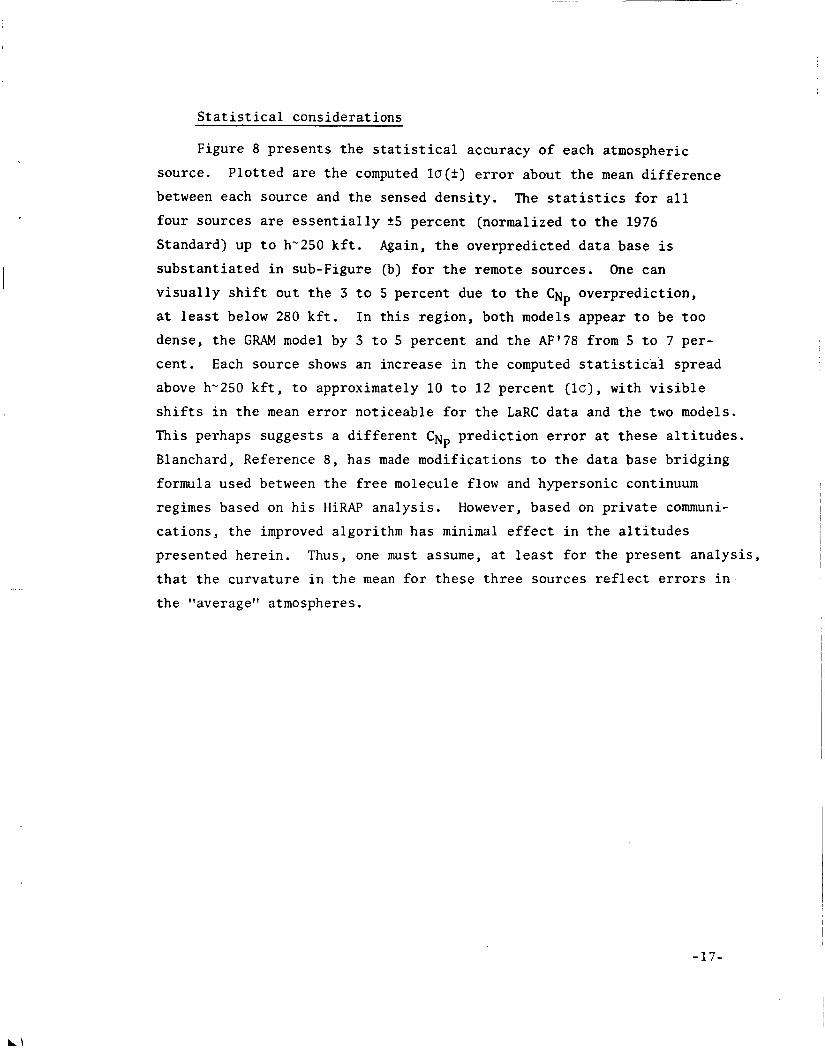
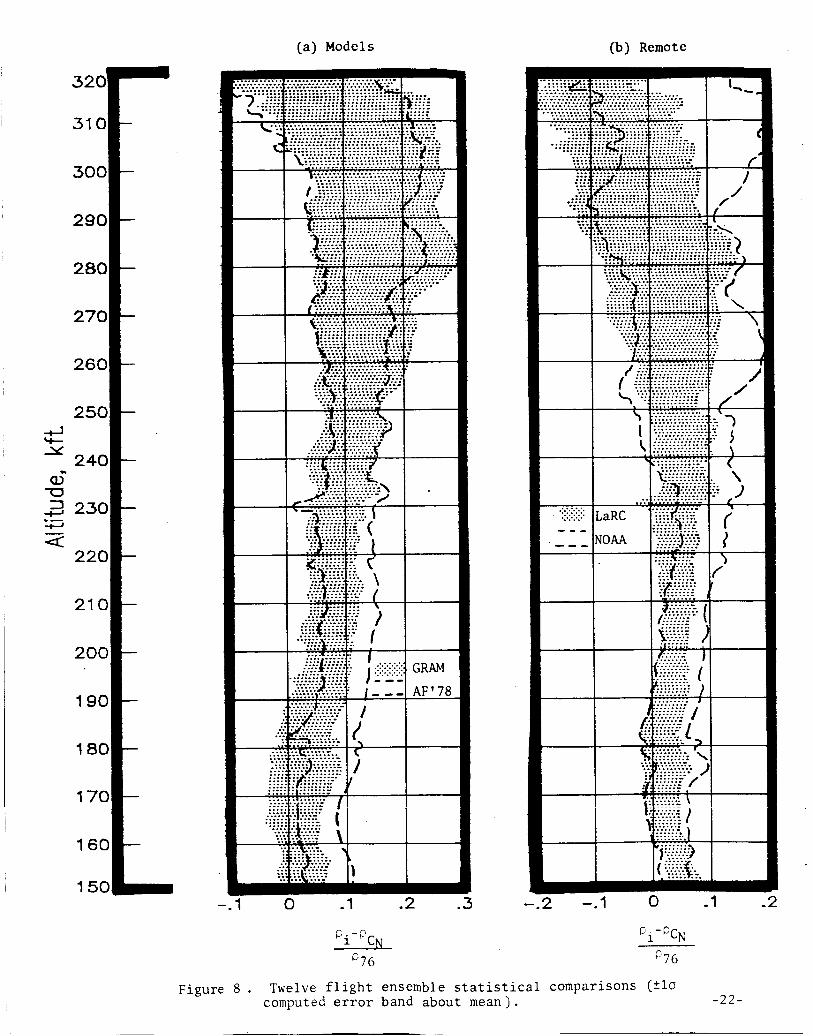
Figure 8 p re sen t s t h e s t a t i s t i c a l accuracy of each atmospheric
source.
between each source and t h e sensed dens i ty .
four sources are e s s e n t i a l l y 25 percent (normalized t o t h e 1976
Standard) up t o h-250 k f t .
s u b s t a n t i a t e d i n sub-Figure (b) f o r t h e remote sources . One can
v i s u a l l y s h i f t ou t t h e 3 t o 5 percent due t o t h e C N ~ overpredic t ion ,
a t l eas t below 280 k f t . I n t h i s reg ion , both models appear t o be t o o
dense, t h e GRAM model by 3 t o 5 percent and t h e AF'78 from 5 t o 7 per -
cen t . Each source shows an increase i n t h e computed s t a t i s t i c a l spread
above h-250 k f t , t o approximately 10 t o 1 2 percent ( l a ) , with v i s i b l e
s h i f t s i n t h e mean e r r o r no t iceable f o r t h e LaRC d a t a and t h e two models.
This perhaps sugges ts a d i f f e r e n t CN P Blanchard, Reference 8 , has made modi f ica t ions t o t h e da t a base br idging
formula used between t h e f r e e molecule flow and hypersonic continuum
regimes based on h i s HiRAP ana lys i s . However, based on p r i v a t e communi-
c a t i o n s , t h e improved algori thm has minimal e f f e c t i n t h e a l t i t u d e s
presented he re in . Thus, one must assume, a t least f o r t h e p re sen t a n a l y s i s ,
t h a t t h e curva ture i n t h e mean f o r t h e s e t h r e e sources r e f l e c t errors i n t h e "average" atmospheres.
P lo t t ed are t h e computed l a ( . ) e r r o r about t h e mean d i f f e r e n c e
The s ta t i s t ics f o r a l l
Again, t h e overpredic ted d a t a base i s
p r e d i c t i o n e r r o r a t t h e s e a l t i t u d e s .
-17-
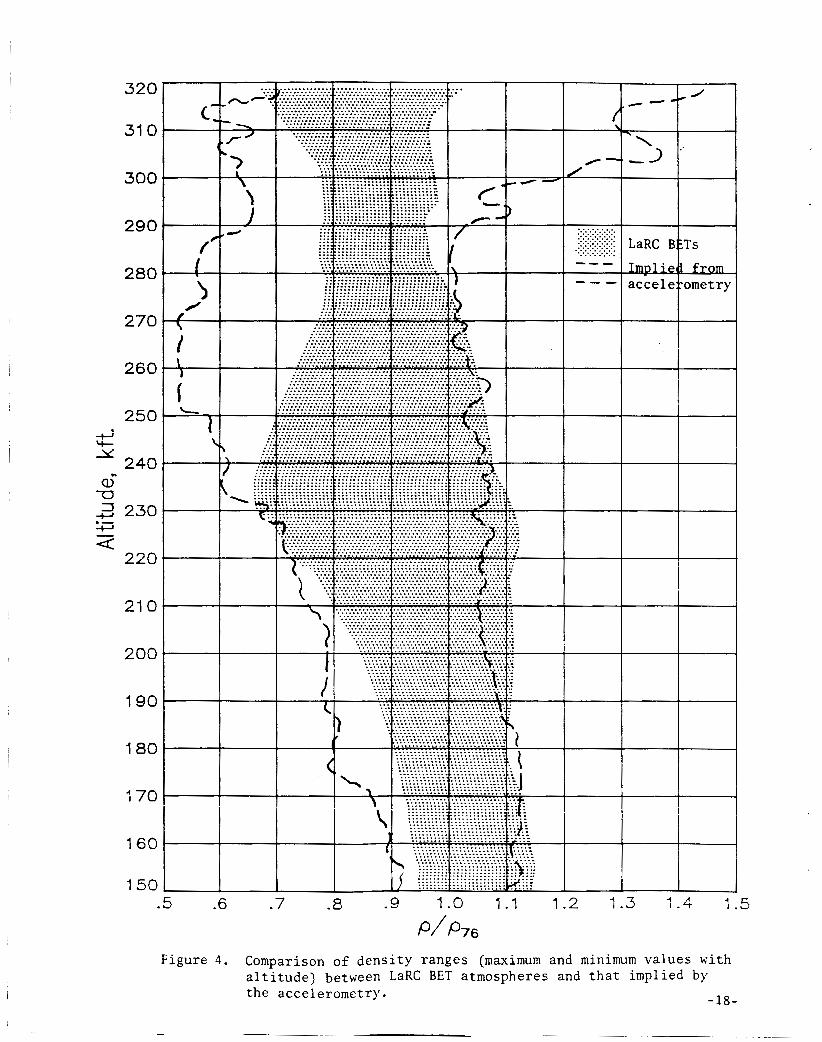
Figure 4. Comparison of density ranges (maximum and minimum values with altitude) between LaRC BET atmospheres and that implied by the accelerometry. -18-
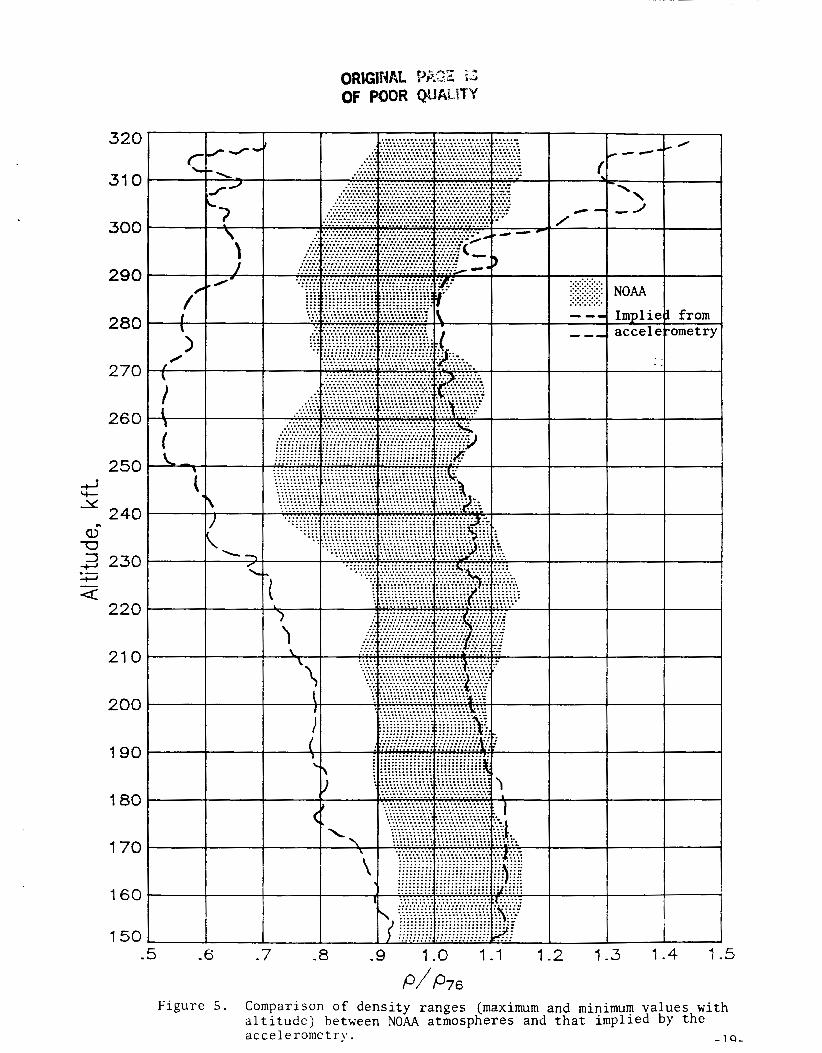
Figure 5. Comparison of density ranges (maximum and minimum values with altitude) between NOM atmospheres and that implied by the accelerometry. - 10-
320
31 0
300
290
280
270
260
250 -4 Y +
240 a>” 2 230
220
U
.- -+ 3
21 0
200
190
180
170
160
150 .5 -7 1-0 1-1 1.2 1.3 1.4 1.5
Figure 6. Comparison of density ranges (maximum and minimum.values with altitude) between AF’78 atmospheres and that implied by the -20- accelerometry .
320
31 0
300
290
280
270
260
250 4 -Y ct
240 6 ’13 3 230 .- -e -=c
220
21 0
200
190
180
170
160
150 E 1.2 1.3 1.4 1.d .5 .6 .7 .8 .9 1.0 1.1
P / h Figure 7. Comparison of density ranges (maximum and minimum values with
altitude) between G R A M atmospheres and that implied by the accelerometry. -21-
(a) Modcls
310
300
290
280
270
260
250 -4 x Y-
240 a- I230 ? d
U
+
220
210
200
190
180
170
160
(b) Remote
320-
-
-
-
-
-
-
-
-
-
-
-
-
-
-
-
-
150- 0 -1 .2 2 -.l 0 .1
P,-Pch’
p76
Figure 8 . Twelve flight ensemble statistical comparisons (210 computed error band about mean). -22-
V. Conclusions
Atmospheres encountered during t h e f irst twelve STS f l i g h t s cha rac t e r -
i s t i c a l l y e x h i b i t sharp dens i ty s t r u c t u r e , somewhat r epea tab le by season,
which c e r t a i n l y must be considered s i g n i f i c a n t f o r AOTV app l i ca t ion .
Comprehensive models and remote sounding information, t h e l a t t e r , though
perhaps lacking l o c a l l y i s good on average, do not , as expected, ref lect
t h i s s t r u c t u r e . A s an atmospheric d a t a base, STS f l i g h t s are l imi t ed a t
t h e h ighe r l a t i t u d e s and i n the win te r months. However, comprehensive
coverage f o r t h r e e seasons i n t h e lower Nor ther ly l a t i t u d e band ((30") provides a good d a t a set f o r AOTV atmospheric de te rmina t ions .
f l i g h t s , model adjustments can be developed t o r e p l i c a t e S h u t t l e atmos-
p h e r i c experience.
From these
-23-
References
1. Cerimele, C. J . , Skalecki , L.M., and Gamble, J. D. ; f tMeteorological Accuracy Requirements f o r Aerobraking O r b i t a l Transfer Vehicles"; AIM Paper No. 84-0030; January, 1984.
2. J u s t u s , C .G. , F l e t che r , G. R . , Gramling, F. E . , and Pace, W. B.; "The NASA/MSFC Global Reference Atmospheric Model - MOD 3 (With Spher ica l Harmonic Wind Model)"; NASA CR-3256; March, 1980.
3 . Cole, A. E . , and Kantor, A. J . , " A i r Force Reference Atmospheres"; AFGL-TR-78-0051; A i r Force Surveys i n Geophysics, No. 382; 28 February, 1978.
4. Compton, H., F indlay, J . , Kelly, G . , and Heck, M . ; "Shut t le (STS-1) Entry Tra j ec to ry Reconstruction"; AIAA Paper No. 81-24.59; November, 1981.
5. Heck, M. L . , F indlay, J. T. , Kelly, G. M . , and Compton, H. R . , "The Adaptation of a S t r a p Down Formulation f o r Processing I n e r t i a l P l a t - form Data"; Jou rna l of Guidance, Control , and Dynamics, Vol. 7 , No. 1, pp. 15-19, January-February, 1984.
6. P r i ce , J . M . , "Atmospheric Def in i t i on f o r S h u t t l e Aerothermodynamic Inves t iga t ions" ; Journa l of Spacecraf t and Rockets, Vol. 20, pp. 133-140, March-April, 1983.
7 . Findlay, J . T . , Kelly, G. M . , McConnell, J . G . , and Compton, H. R . , "Shut t le 'Chal lenger ' Aerodynamic Performance from F l igh t Data - Comparisons with Predic ted Values and 'Columbia' Experience"; AIAA Paper No. 84-0485; January, 1984.
8 . Blanchard, R. C . , and Buck, G. M.; "Determination of Rarefied-Flow Aerodynamics of t h e S h u t t l e O r b i t e r From F l i g h t Measurements on STS-6 and STS-7"; AIAA Paper No. 85-0347 ( t o be presented a t t h e 23rd Aerospace Sciences Meeting i n January, 1985).
-24-
APPENDIX A
Atmospheric Density Comparisons
for the First Twelve Shuttle Entries
- 2 5 -
320
310
300
290
280
270
260
250
240
230
220
210
200
190
180
170
5 .60 .65 .70 .75 .80 .85 .90 .95 1.00 1.05 1.10 1.15 1.20 1.25 1.30 1.35 1.40
P /P76
- 2 6 - Figure A - I . STS-1 (April) density comparisons
-
-
-
-
-
-
-
-
-
-
-
-
-
-
-
-
h , kft
h , kft
ORIGINAL PAG€ OF PDOR QUALITY
S O .55 .60 .65 .70 .75 .80 .85 .90 .95 1.00 1.05 1.10 1.15 1.20 1.25 1.30 1.35 1.40
P / P 7 6
Figure A-3.STS-3 (March) density comparisons -28-
h . kft
- 2 9 -
h , kf t 320
31 0
300
290
280
270
260
250
240
230
220
21 0
200
190
1 80
1 70
160
150 .50 .55 .60 .65 .70 .75 .a0 .a5 .90 .95 1.00 1 .40
P / P 7 6
Figure A-5 . STS-5 (November) density comparisons -30-
h , kft
10
r^ / F 7 6
Figure A-6. STS-6 (April) density comp
1.15 1.20 1.25 1.30 1.35 1.40
arisons -31-
h s 320
31 0
300
290
280
270
260
250
240
230
220
21 0
200
190
180
170
160
150 .50 .55 .60 .65 .70 .75 3 0 .85 .90 .95 1.00 1.05 1.10 1.15 1.20 1.25 1.30 1.35 1.40
P /P76
Figure A-7 . STS-7 (June) density comparisons - 3 2 -
h , kft
h , kft
S O .55 .60 .65 .70 .75 .80 .85 .90 .95 1.00 1.05 1.10 1.15 1.20 1.25 1.30 1.35 1.4G
P /P76
Figure A-9. STS-9 (December) density comparisons - 3 4 -
h , kft
1 1.25 1.30 1.35 1.40
Figure A-IO. STS-11 (February) density comparisons - 3 5 -
-
h , kft
25 1.30 1.35 1.40
P / P 7 6
Figure A - I I . STS-13 (April) density compar isons - 3 6 -
h , kft
320
31 0
300
290
280
270
260
250
240
230
220
21 0
200
190
180
150 .50 .55 .60 .65 .70 .75 .80 .85 .90 .95 1.00 1.05 1-10 1.15 1.20 1.25 1.30 1,35 1.40
P / P 7 6
Figure A - 1 2 . STS-14 (September) density comparisons -37 -
APPENDIX B
Atmospheric Temperature Comparisons
for First Twelve Shuttle Entries
-38-
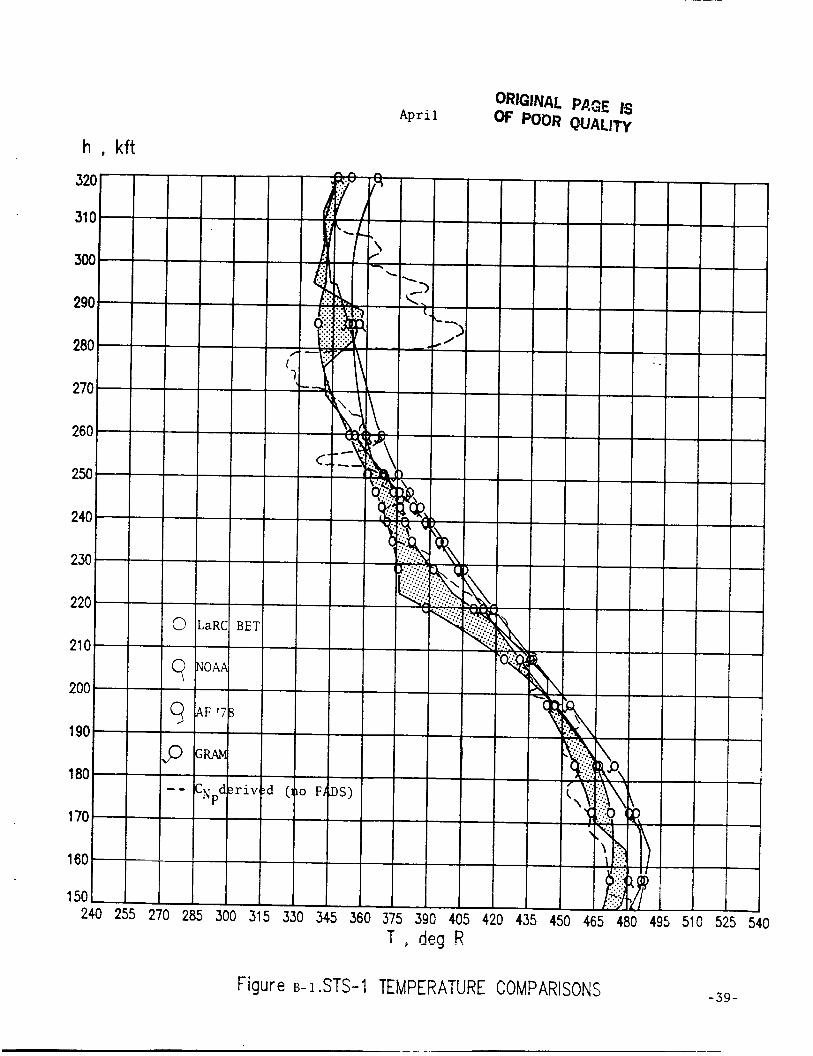
h , kft
Figure B- 1 .STS-1 TEMPERATURE COMPARISONS -39-
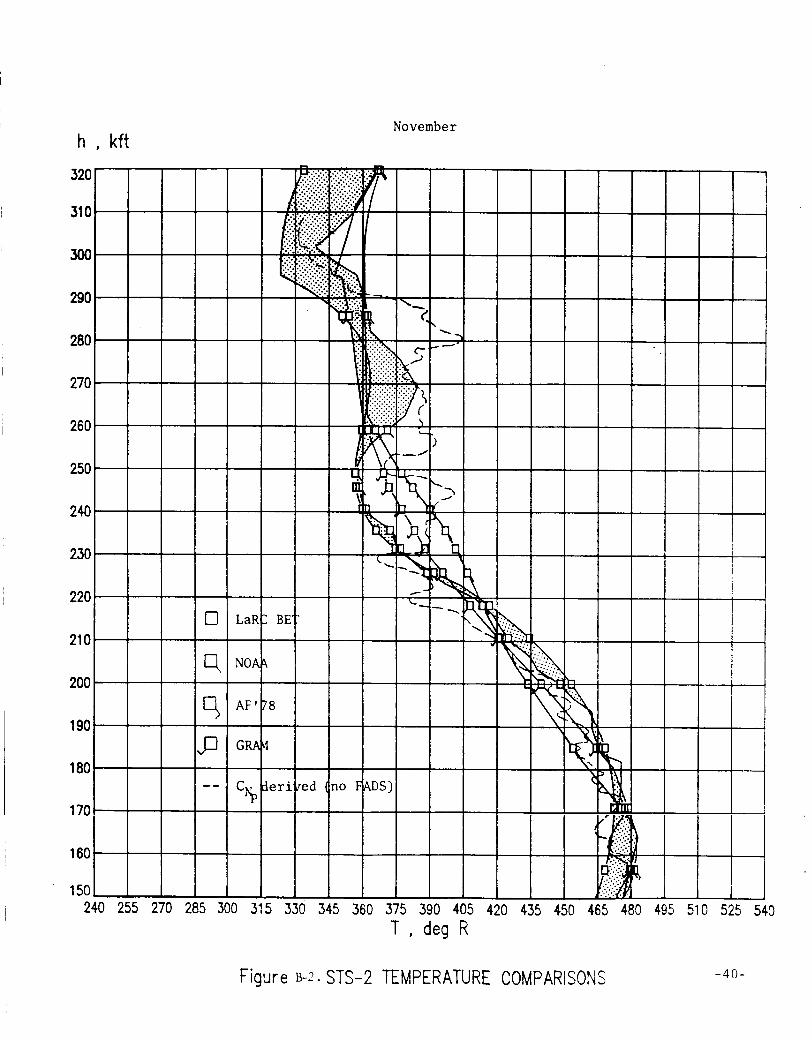
November h , kft
195 510 525 540
Figure B-2. STS-2 TEMPERATURE COMPARISONS -40-
March h , kft
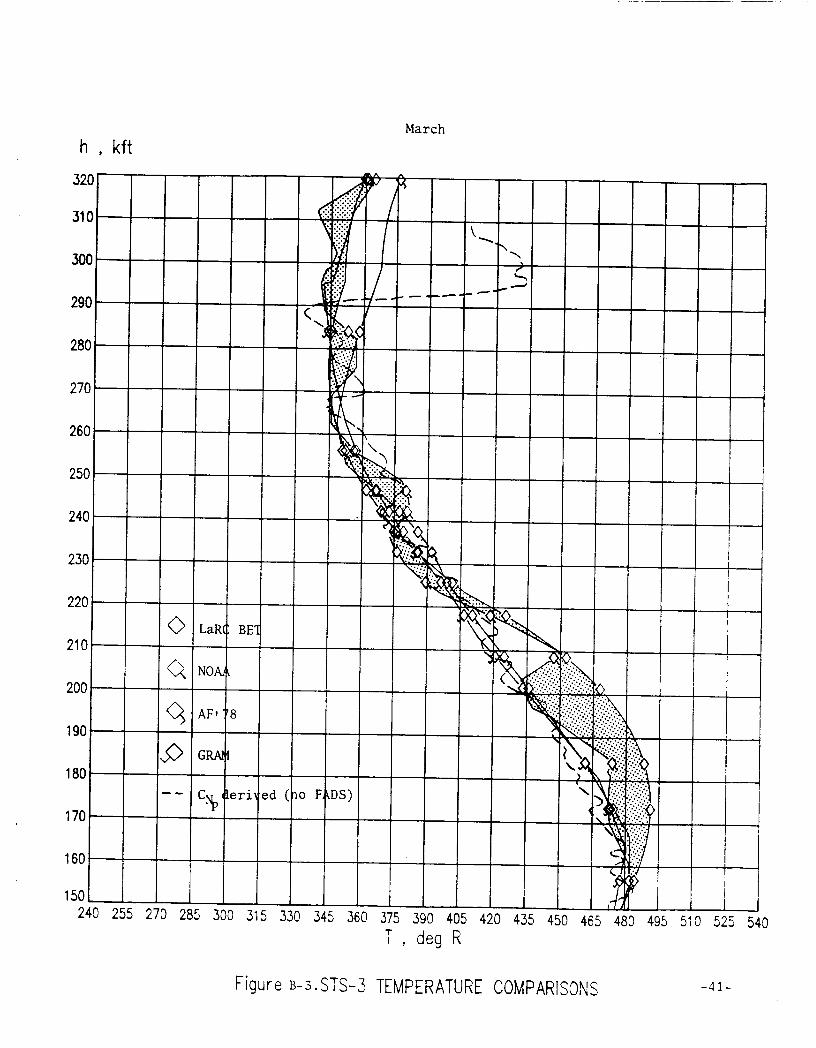
Figure ~ - 3 . STS-3 TEMPERATURE COMPARISONS - 4 1 -
J u l y h , kft
- 4 2 - I
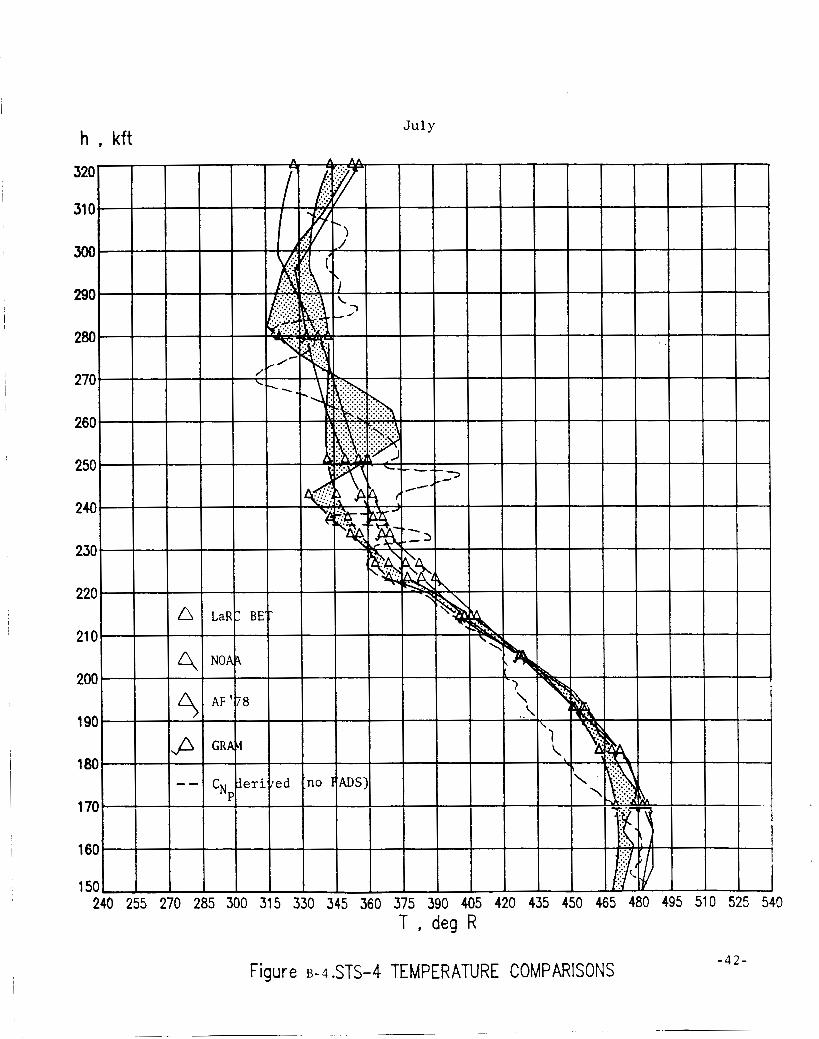
Figure B-4 .STS-4 TEMPERATURE COMPARISONS
~~
November h , kft
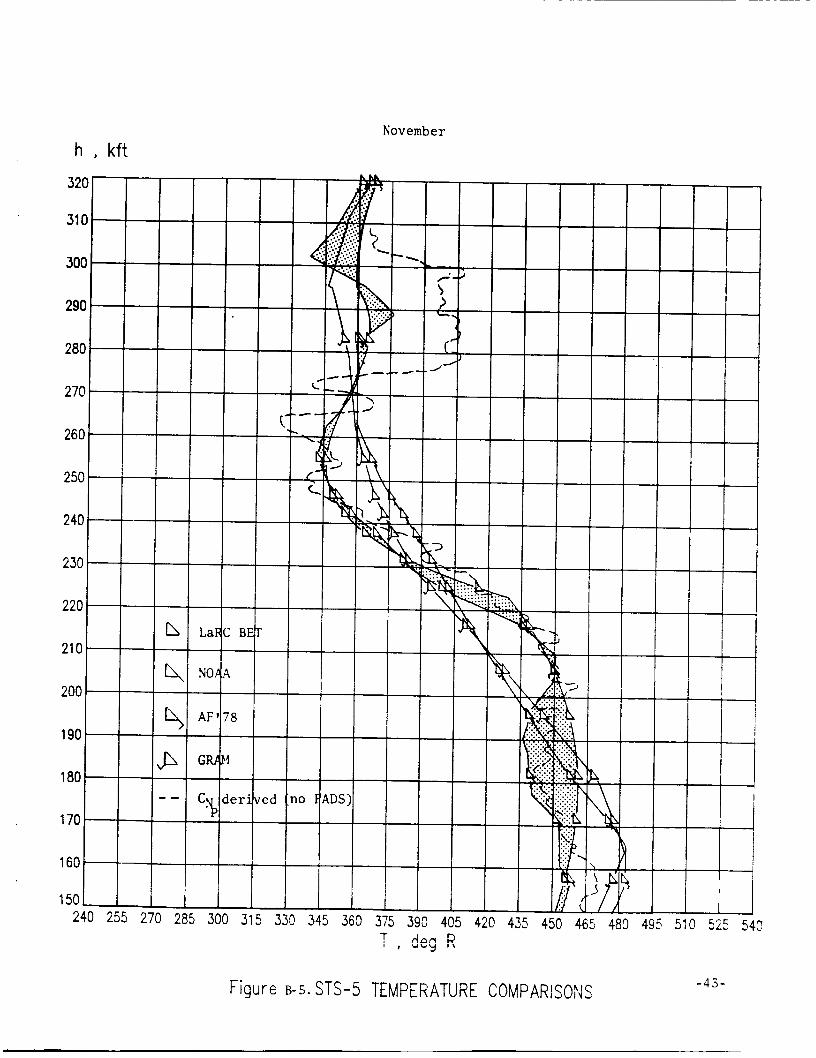
-43- Figure B-5. STS-5 TEMPERATURE COMPARISONS
Apri l
h , kft
T , deg R
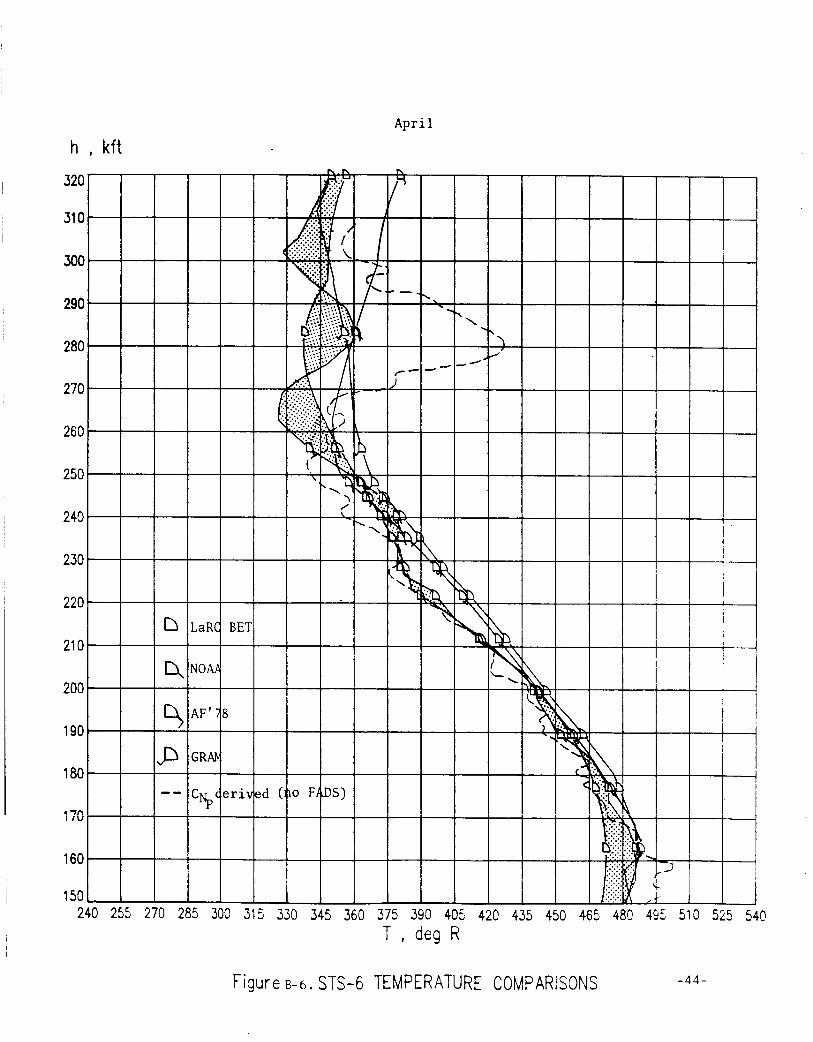
Figure B-6. STS-6 TEMPERATURE COMPARISONS - 4 4 -
June h , kft
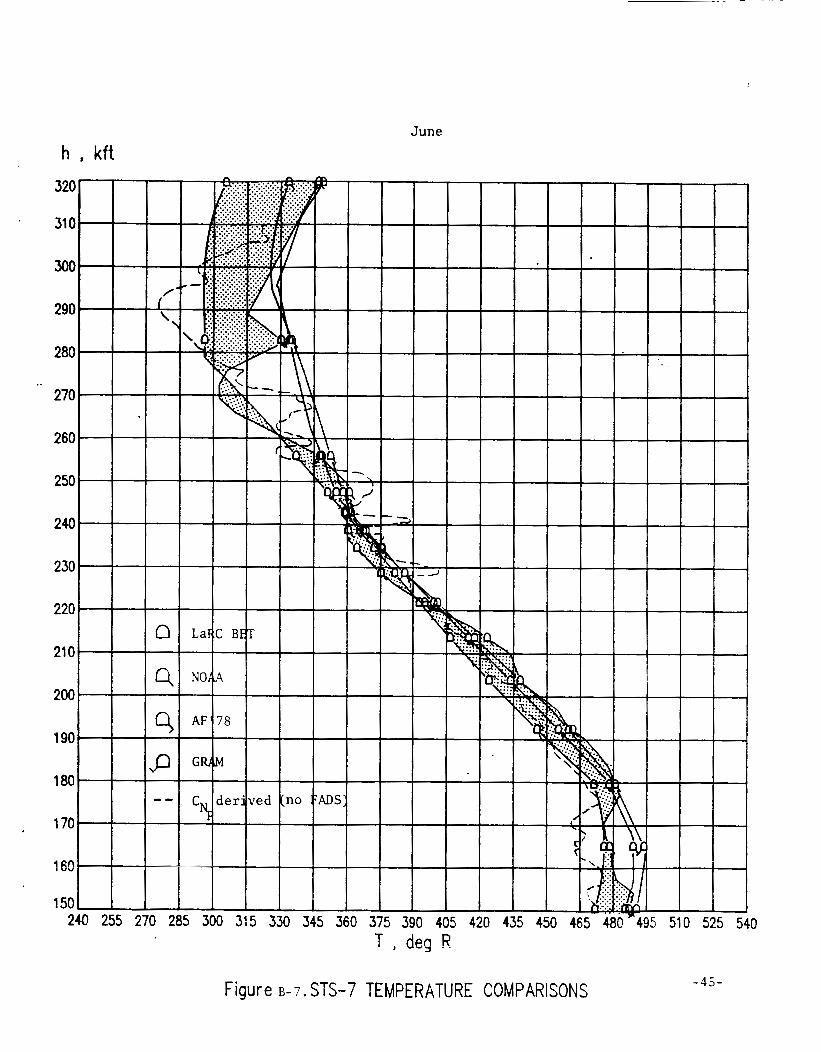
-45- Figure B- 7. STS-7 TEMPERATURE COMPARISONS
Sep t ember h , kft
320
31 0
300
290
280
270
260
250
240
230
220
21 0
200
190
180.
1 70
9 A F ' 7 8
9 GRAM
C der j -- YJ
150
T , deg R
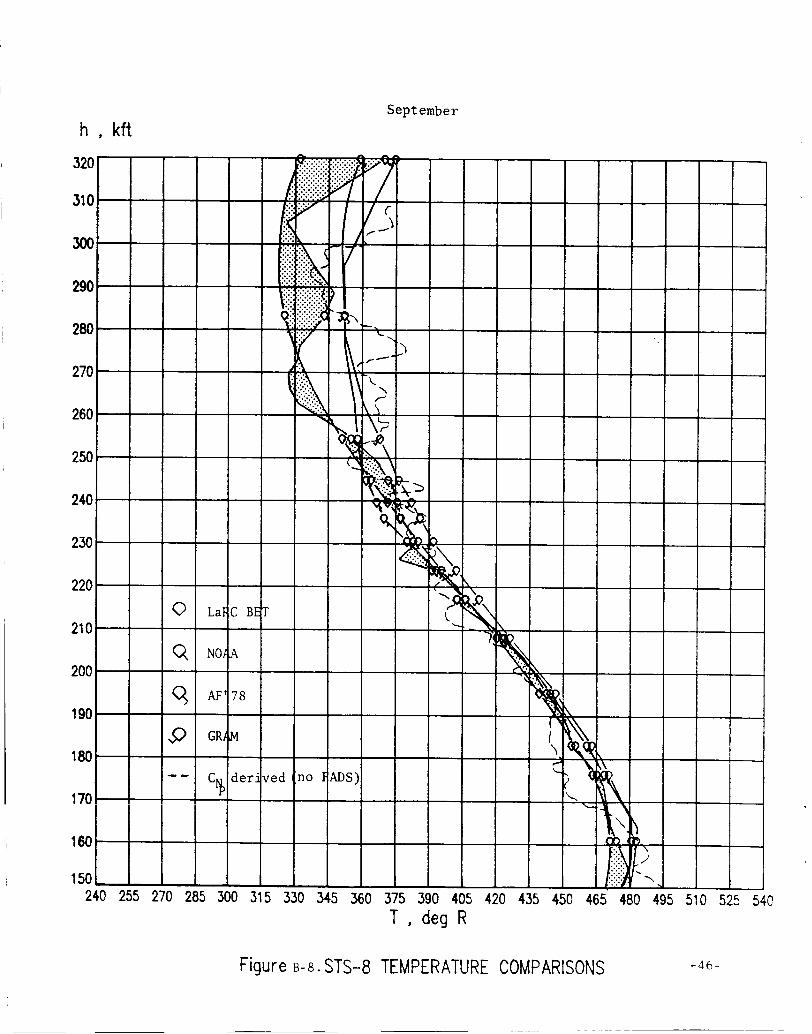
Figure B-8. STS-8 TEMPERATURE COMP
450 465 480 495 510 525 54C
-46- ' ARI SON S
December
h , kft
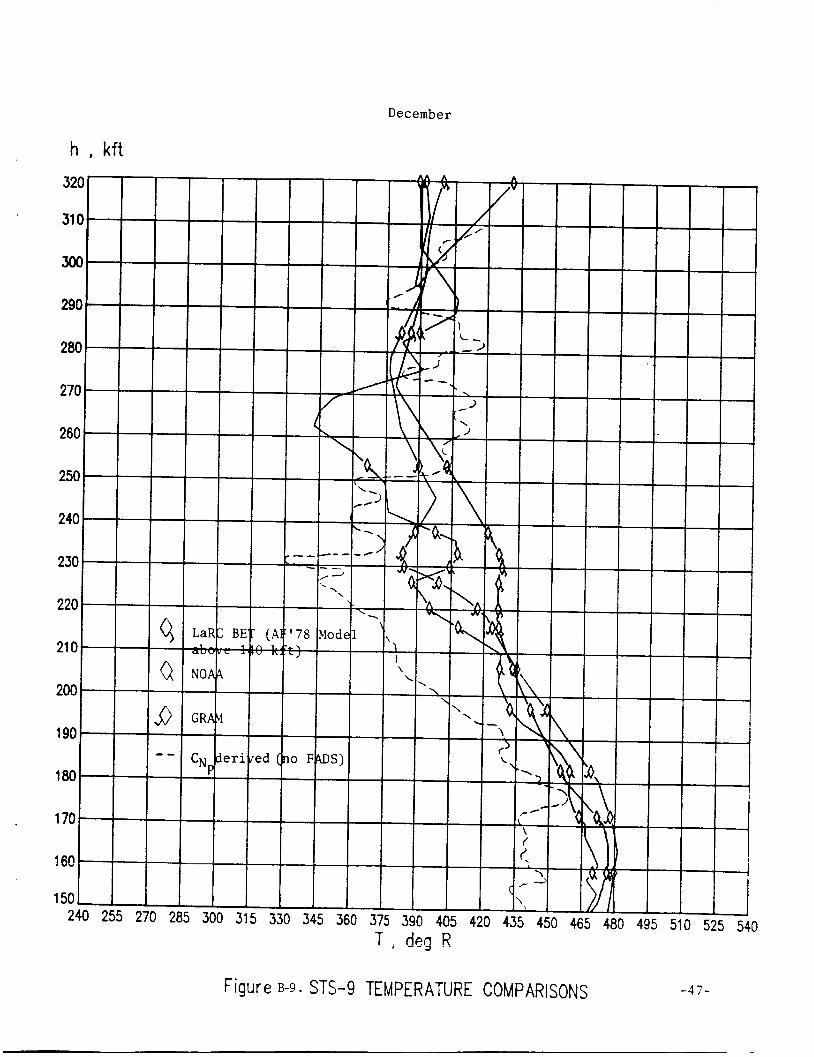
Figure 13-9. STS-9 TEMPERATURE COMPARISONS -47-
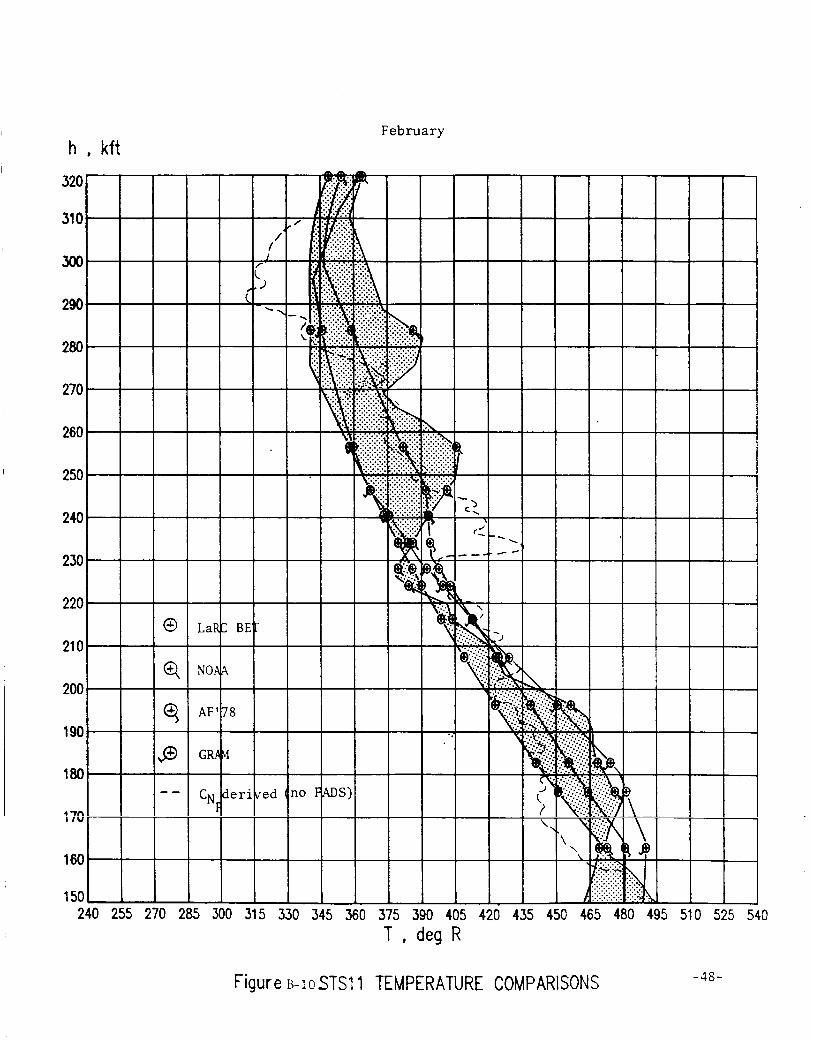
February h , kft
40
-48 - Figure B-IoSTS~ 1 TEMPERATURE COMPARISONS
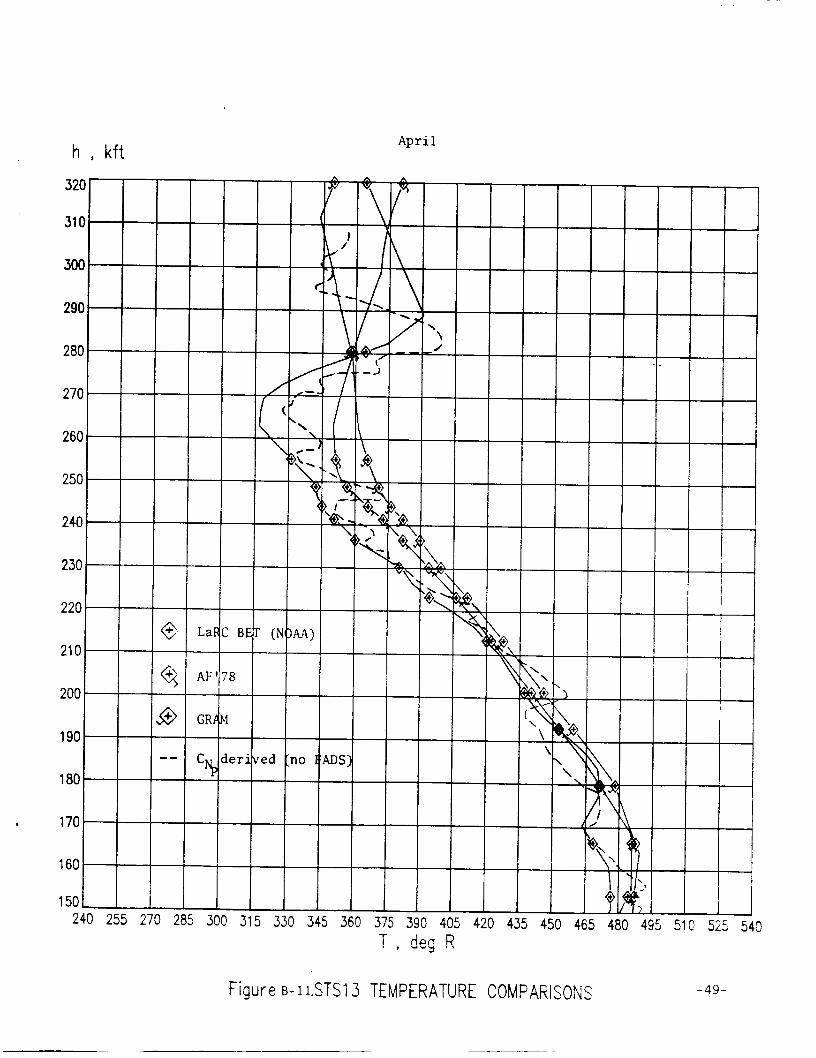
April h , kft
Figure B- n S T S 1 3 TEMPERATURE COMPARISONS -49-
h , kft
150 I 6 O t t 240 255 2
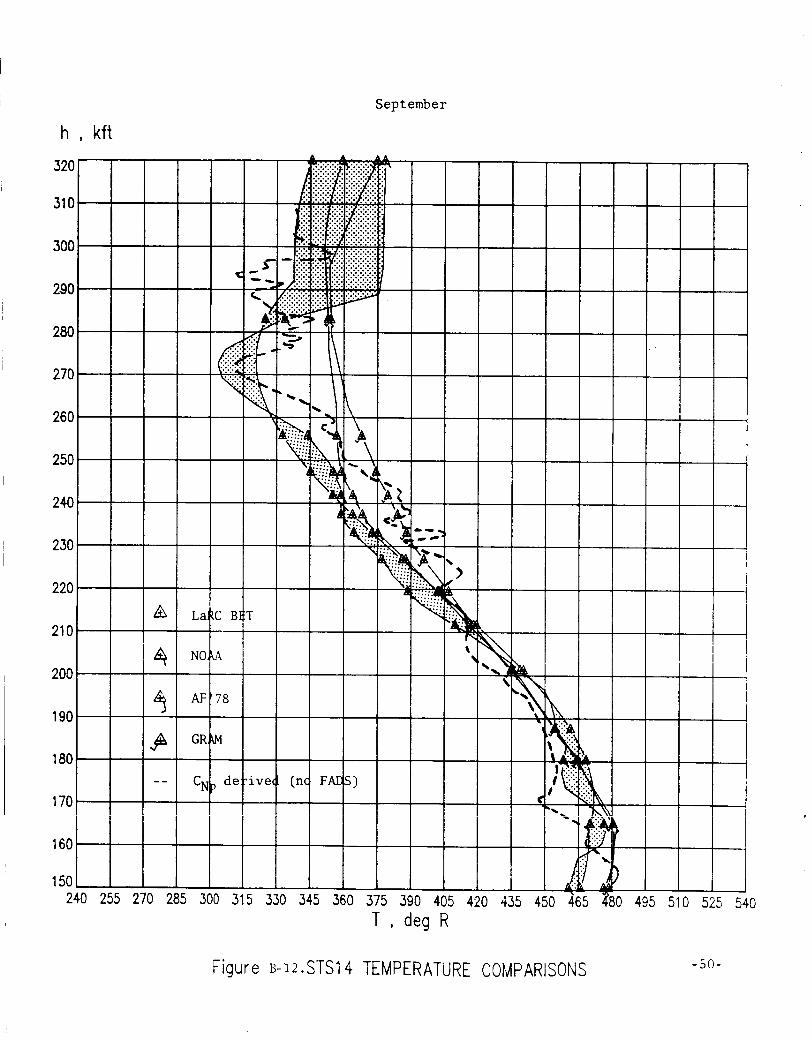
September
T , deg R
Figure 6-12.STS14 TEMPERATURE COMPARISONS -50-
1. nom No.
4. title Nld Subtitle FIN-ORT: Sh u t t l e Derived Atmospheric 6. R ~ p o r t b t r
2. Gwnnment Atcatton No. 3. Rloponr's clubg No. NASA CR- 171824
Density Model P a r t 1: Comparisons of t he Various Ambient December 1984 Atmospheric Source Data with Derived Parameters from t h e F i r s ! 6. Pdormtng Orpntrrt,on codr Twelve STS Entry F l i g h t s - a Data Package f o r AOTV Atmospherit
John T. Findlay G. Me1 Kel ly , P a t r i c k A. Troutman
AMA Report No. 84-16
, 10. Work Unit No. 9. Worming Organization Name and Addrerr
Analy t i ca l Mechanics Assoc ia tes , Inc. 17 Research Road
11. Contract or Grant No.
Hampton, VA 23666 NAS9 - 17158 , 13. Typ. Of R . p o n a d Pariod C o v r r d
12. Sponsoring Agmcy Mnw and Address Contractor Report Nat ional Aeronaut ics and Space Adminis t ra t ion Washington, DC 20546 14 Sponsoring A m W
93 6-1 5-01-0 1 IS. Supplernontrry Nota
Johnson Space Center Technical Monitor: Joe D. Gamble
16. A b m w t
This r e p o r t , P a r t 1 of t h e f i n a l r epor t generated under NASA Contract NAS9-17158, p re sen t s ambient atmospheric parameter comparisons versus der ived va lues from t h e f i r s t twelve (12) Space S h u t t l e O r b i t e r en t ry f l i g h t s . Avai lable f l i g h t s , f l i g h t d a t a products , and d a t a sources u t i l i z e d a r e reviewed. measurenents as well as two comprehensive models which incorpora te l a t i t u d i n a l and seasonal e f f e c t s . Space F l i g h t Center Global Reference Model (GRAM). S h u t t l e f l i g h t d a t a i s shown and discussed. f o r cons ide ra t ion i n Aero a s s i s t e d Orb i t a l T rans fe r Vehicle (AOTV) t r a j e c t o r y a n a l y s i s , proposed t o modify
'
Comparisons a r e presented based on remote meteorological
These a re t h e A i r Force 1978 Reference Atmosphere and t h e Marshall Atmospheric s t r u c t u r e s e n s i b l e i n t h e
P a r t 2 of t h e f i n a l r e p o r t p re sen t s a model
t h e GRAM d a t a t o emulate S h u t t l e experience.
Space S h u t t l e STS, Atmospheric Data Atmospheric Models
50 Unclas s i f i ed Unclass i f ied
'For We by the National Technical InforrnatiM %mice. Springfield. Virginia 22161