Embed Size (px)
Citation preview
Analytical Procedures and Quality
Assurance for Geothermal Water Chemistry
Pang Zhong-he and Halldór Ármannsson
Editors
United Nations University
Geothermal Training Programme
2005

PREFACE
Chemical analyses of geothermal fluids need special attention compared to normal
freshwater samples mainly due to the fact that they are often highly saline, with total
dissolved solids up to tens of grams per litre. In addition to this, they often contain boric
acid and other weak acids and therefore may introduce a matrix effect that can be a cause
of unreliable analytical results for HCO3, for example. Furthermore, it has been realized
that different procedures are being used in different laboratories for the same
constituents, for example, silica concentration, which is a key parameter in geothermal
investigations as an ideal geothermometer. Standard procedures should be used for
analysis in order to ensure comparability of results.
Based on the results of several rounds of inter-laboratory comparison exercises sponsored
by the International Atomic Energy Agency (IAEA) in the past several years, it has been
realized that quality is still an issue to be addressed in geothermal chemical analysis.
Inter-laboratory comparison exercises, in addition to routine caution in the laboratory,
have proven to be effective means of analytical quality assurance based on experience
from the implementation of such exercises.
Water chemistry data is essential information required for the characterization of
geothermal fluids and evaluation of energy potential of geothermal fields by
geothermometry, and provides good indicators for monitoring reservoir changes in
response to production. Analytical results with good quality are the key to accurately
evaluating geothermal resources and effectively solving reservoir management problems.
As a consequence, at a project planning meeting organized by the IAEA in July 2000 in
Morelia, Mexico, geothermal experts from Costa Rica, El Salvador, Guatemala,
Indonesia, Philippines, Mexico and Nicaragua suggested a “cookbook” type of document
be compiled and distributed to facilitate information exchange and to support training and
routine performance of geothermal chemistry laboratories working on geothermal water
samples to achieve improved analytical quality. The document should include standard
procedures used by experienced geothermal chemistry laboratories and quality assurance
measures.
The 15 chemical constituents covered in this document coincide with the inter-laboratory
comparison exercises organized by the IAEA with 42 methods of analysis for the
constituents commonly analyzed for in geothermal water described. Besides 3 methods of
standardization of commonly used reagents are presented. The presentation of each
method has been standardized under the following headings: Scope (basis for the method,
detection limit, possible interferences and ways of combatting them); References;
Materials and equipment; Reagents (incl. descriptions of preparation); Procedure;
Calculations; and Quality assurance/quality control. In the appendices, a report of an
inter-laboratory comparison exercise, undertaken in 2003, is included just to show an
example of the typical evaluation procedure of results and assessment of performance of
individual laboratories.
We would like to thank authors from the twelve laboratories that have prepared writeups
of their adopted procedures. The efforts of Dr. Rosa Maria Barragan and Ms. Rowena A.
Isidro who reviewed the original manuscripts are acknowledged. We also thank the
United Nations University (UNU) Geothermal Training Programme for its interest in
publishing the book and we do hope that this publication will serve as a valuable aid to
the UNU fellows that do chemistry work and in general to laboratory personnels dealing
with geothermal water chemistry.
The editors
28 April, 2006
Beijing and Reykjavik
TABLE OF CONTENTS
PREFACE ................................................................................................................................... 3
PROCEDURES ............................................................................................................... 15
ALUMINIUM (FLUORIMETRIC WITH LUMOGALLION) ...................................... 15
Scope ............................................................................................................... 15
References ......................................................................................................... 15
Materials and Equipment .................................................................................. 15
Reagents and Standards ..................................................................................... 15
Procedure ........................................................................................................... 16
Calculation ........................................................................................................ 16
Quality Assurance/Quality Control ................................................................... 17
AMMONIA (SPECTROPHOTOMETRIC WITH INDOPHENOL BLUE) .................. 18
Scope ............................................................................................................... 18
References ......................................................................................................... 18
Materials and Equipment .................................................................................. 18
Reagents and Standards ..................................................................................... 18
Procedure ........................................................................................................... 19
Calculation ........................................................................................................ 20
Quality Assurance/Quality Control ................................................................... 20
AMMONIA (ION SELECTIVE ELECTRODE) ............................................................ 21
Scope ............................................................................................................... 21
References ......................................................................................................... 21
Materials and Equipment .................................................................................. 21
Reagents and Standards ..................................................................................... 21
Procedure ........................................................................................................... 22
Calculation ........................................................................................................ 22
Quality Assurance/Quality Control ................................................................... 22
AMMONIA (NH3-N) (SPECTROHOTOMETRIC WITH NESSLER
REAGENT) ....................................................................................................... 24
Scope ............................................................................................................... 24
References ......................................................................................................... 24
Materials and equipment ................................................................................... 24
Reagents and standards ..................................................................................... 24
Procedure ........................................................................................................... 25
Calculation ........................................................................................................ 26
Quality Assurance/Quality Control ................................................................... 26
BICARBONATE, CARBONATE AND TOTAL CARBON DIOXIDE
(TITRIMETRIC) ............................................................................................... 27
Scope ............................................................................................................... 27
References ......................................................................................................... 27
Materials and Equipment .................................................................................. 27
Reagents and Standards ..................................................................................... 27
Procedure ........................................................................................................... 28
Calculations ....................................................................................................... 30
Quality Assurance/Quality Control ................................................................... 30
BORON (TITRIMETRIC WITH MANNITOL) ............................................................ 31
Scope ............................................................................................................... 31
Reference ........................................................................................................... 31
Materials and Equipment .................................................................................. 31
Reagents and Standards ..................................................................................... 31
Procedure ........................................................................................................... 31
Calculation ........................................................................................................ 32
Quality Assurance/Quality Control ................................................................... 32
BORON (ICP-ATOMIC EMISSION SPECTROMETRY) ............................................ 33
Scope ............................................................................................................... 33
References ......................................................................................................... 33
Materials and Equipment .................................................................................. 33
Reagents and Standards ..................................................................................... 33
Procedure ........................................................................................................... 34
Calculation ........................................................................................................ 35
Quality Assurance/Quality Control ................................................................... 35
BORON (ICP-MASS SPECTROMETRY) .................................................................... 37
Scope ............................................................................................................... 37
References ......................................................................................................... 37
Materials and Equipment .................................................................................. 37
Reagents and Standards ..................................................................................... 38
Procedure ........................................................................................................... 38
Calculation ........................................................................................................ 39
Quality Assurance / Quality Control ................................................................. 39
BORON (SPECTROPHOTOMETRIC WITH CARMINE)........................................... 41
Scope ............................................................................................................... 41
Reference ........................................................................................................... 41
Materials and Equipment .................................................................................. 41
Reagents and Standards ..................................................................................... 41
Procedure ........................................................................................................... 41
Calculation ........................................................................................................ 42
Quality Assurance/Quality Control ................................................................... 42
BORON (SPECTROPHOTOMETRIC WITH CURCUMIN) ....................................... 44
Scope ............................................................................................................... 44
References ......................................................................................................... 44
Materials and Equipment .................................................................................. 44
Reagents and Standards ..................................................................................... 44
Procedure ........................................................................................................... 45
Calculation ........................................................................................................ 45
Quality Assurance/Quality control .................................................................... 46
BORON (SPECTROPHOTOMETRIC WITH AZOMETHINE-H)............................... 47
Scope ............................................................................................................... 47
References ......................................................................................................... 47
Materials and Equipment .................................................................................. 47
Reagents and Standards ..................................................................................... 47
Procedure ........................................................................................................... 48
Calculation ........................................................................................................ 48
Quality Assurance/Quality Control ................................................................... 48
BORON (ATOMIC ABSORPTION SPECTROPHOTOMETRY) ................................ 50
Scope ............................................................................................................... 50
References ......................................................................................................... 50
Materials and Equipment .................................................................................. 50
Reagents and Standards ..................................................................................... 50
Procedure ........................................................................................................... 51
Calculations ....................................................................................................... 52
Quality Assurance/Quality control .................................................................... 52
CALCIUM (ATOMIC ABSORPTION SPECTROPHOTOMETRY) ........................... 53
Scope ............................................................................................................... 53
References ......................................................................................................... 53
Materials and Equipment .................................................................................. 53
Reagents and Standards ..................................................................................... 53
Procedure ........................................................................................................... 54
Calculation ........................................................................................................ 54
Quality Assurance/Quality Control ................................................................... 54
CALCIUM (ICP-ATOMIC EMISSION SPECTROMETRY) ....................................... 56
Scope ............................................................................................................... 56
References ......................................................................................................... 56
Materials and Equipment .................................................................................. 56
Reagents and Standards ..................................................................................... 56
Procedure ........................................................................................................... 57
Calculation ........................................................................................................ 58
Quality Assurance/Quality Control ................................................................... 58
CALCIUM (TITRIMETRIC WITH EDTA)................................................................... 59
Scope ............................................................................................................... 59
Reference ........................................................................................................... 59
Materials and Equipment .................................................................................. 59
Reagents and Standards ..................................................................................... 59
Procedure ........................................................................................................... 60
Calculation ........................................................................................................ 61
Quality Assurance/Quality control. ................................................................... 62
CALCIUM (ION CHROMATOGRAPHY).................................................................... 63
Scope ............................................................................................................... 63
References ......................................................................................................... 63
Materials and Equipment .................................................................................. 63
Reagents and Standards ..................................................................................... 64
Procedure ........................................................................................................... 64
Calculation ........................................................................................................ 65
Quality Assurance/Quality Control ................................................................... 65
CHLORIDE (ARGENTOMETRIC TITRATION) ......................................................... 67
Scope ............................................................................................................... 67
References ......................................................................................................... 67
Materials and Equipment .................................................................................. 67
Reagents and Standards ..................................................................................... 67
Procedure ........................................................................................................... 68
Calculation ........................................................................................................ 69
Quality Assurance/Quality Control ................................................................... 69
CHLORIDE (POTENTIOMETRIC TITRATION) ........................................................ 70
Scope ............................................................................................................... 70
Reference ........................................................................................................... 70
Materials and Equipment .................................................................................. 70
Reagents and Standards ..................................................................................... 70
Procedure ........................................................................................................... 71
Calculation ........................................................................................................ 71
Quality Assurance/Quality Control ................................................................... 71
CHLORIDE (SPECTROPHOTOMETRIC WITH THIOCYANATE) .......................... 73
Scope ............................................................................................................... 73
Reference ........................................................................................................... 73
Materials and Equipment .................................................................................. 73
Reagents and Standards ..................................................................................... 73
Procedure ........................................................................................................... 74
Calculation ........................................................................................................ 74
Quality Assurance/Quality Control ................................................................... 74
CHLORIDE (ION CHROMATOGRAPHY) .................................................................. 75
Scope ............................................................................................................... 75
References ......................................................................................................... 75
Materials and Equipment .................................................................................. 75
Reagents and Standards ..................................................................................... 76
Procedure ........................................................................................................... 77
Calculation ........................................................................................................ 78
Quality Assurance/Quality Control ................................................................... 79
FLUORIDE (ION SELECTIVE ELECTRODE-ISE) ..................................................... 80
Scope ............................................................................................................... 80
References ......................................................................................................... 80
Materials and Equipment .................................................................................. 80
Reagents and Standards ..................................................................................... 80
Procedure ........................................................................................................... 81
Calculation ........................................................................................................ 81
Quality Assurance/Quality Control ................................................................... 81
FLUORIDE (ION CHROMATOGRAPHY) .................................................................. 83
Scope ............................................................................................................... 83
References ......................................................................................................... 83
Materials and Equipment .................................................................................. 83
Reagents and Standards ..................................................................................... 83
Procedure ........................................................................................................... 84
Calculation ........................................................................................................ 84
Quality Assurance/Quality Control ................................................................... 84
FLUORIDE (SPADNS SPECTROPHOTOMETRIC) ................................................... 86
Scope ............................................................................................................... 86
References ......................................................................................................... 86
Materials and Equipment .................................................................................. 86
Reagents and Standards ..................................................................................... 87
Procedure ........................................................................................................... 87
Calculation ........................................................................................................ 88
Quality Assurance/ Quality Control .................................................................. 88
IRON (SPECTROPHOTOMETRIC WITH TPTZ) ........................................................ 90
Scope ............................................................................................................... 90
References ......................................................................................................... 90
Materials and Equipment .................................................................................. 90
Reagents and Standards ..................................................................................... 90
Procedure ........................................................................................................... 91
Calculation ........................................................................................................ 91
Quality Assurance/Quality Control ................................................................... 91
LITHIUM (ATOMIC ABSORPTION SPECTROPHOTOMETRY) ............................. 93
Scope ............................................................................................................... 93
References ......................................................................................................... 93
Materials and Equipment .................................................................................. 93
Reagents and Standards ..................................................................................... 93
Procedure ........................................................................................................... 94
Calculation ........................................................................................................ 94
Quality Assurance/Quality Control ................................................................... 94
MAGNESIUM (ATOMIC ABSORPTION SPECTROPHOTOMETRY) ..................... 96
Scope ............................................................................................................... 96
References ......................................................................................................... 96
Materials and Equipment .................................................................................. 96
Reagents and Standards ..................................................................................... 96
Procedure ........................................................................................................... 97
Calculation ........................................................................................................ 97
Quality Assurance/Quality Control ................................................................... 98
MAGNESIUM (ION CHROMATOGRAPHY) ............................................................. 99
Scope ............................................................................................................... 99
Reference ........................................................................................................... 99
Material and Equipment .................................................................................... 99
Reagents and Standards ..................................................................................... 99
Procedure ......................................................................................................... 100
Calculation ...................................................................................................... 100
Quality Assurance / Quality Control ............................................................... 100
PH (ELECTROMETRIC) ............................................................................................. 101
Scope ............................................................................................................. 101
Reference ......................................................................................................... 101
Materials and Equipment ................................................................................ 101
Reagents and Standards ................................................................................... 101
Procedure ......................................................................................................... 101
Quality Assurance/Quality Control ................................................................. 102
POTASSIUM (ATOMIC ABSORPTION SPECTROPHOTOMETRY) ..................... 103
Scope ............................................................................................................. 103
References ....................................................................................................... 103
Materials and Equipment ................................................................................ 103
Reagents and Standards ................................................................................... 103
Procedure ......................................................................................................... 104
Calculation ...................................................................................................... 104
Quality Assurance/Quality Control ................................................................. 104
POTASSIUM (ION CHROMATOGRAPHY) ............................................................. 106
Scope ............................................................................................................. 106
Reference ......................................................................................................... 106
Materials and Equipment ................................................................................ 106
Reagents and Standards ................................................................................... 106
Procedure ......................................................................................................... 107
Calculation ...................................................................................................... 107
Quality Assurance / Quality Control ............................................................... 107
POTASSIUM (ATOMIC EMISSION SPECTROSCOPY (AES) ................................ 108
Scope ............................................................................................................. 108
References ....................................................................................................... 108
Materials and Equipment ................................................................................ 108
Reagents and Standards ................................................................................... 108
Procedure ......................................................................................................... 109
Calculation ...................................................................................................... 109
Quality Assurance/Quality control .................................................................. 109
SILICA-TOTAL (SPECTROPHOTOMETRIC WITH AMMONIUM-
MOLYBDATE) .............................................................................................. 110
Scope ............................................................................................................. 110
References ....................................................................................................... 110
Materials and Equipment ................................................................................ 110
Reagents and Standards ................................................................................... 111
Procedure ......................................................................................................... 111
Calculation ...................................................................................................... 112
Quality Assurance/Quality Control ................................................................. 112
SILICA (SPECTROPHOTOMETRIC WITH AMMONIUMMOLYBDATE
AND HETEROPOLY BLUE) ........................................................................ 113
Scope ............................................................................................................. 113
References ....................................................................................................... 113
Materials and Equipment ................................................................................ 113
Procedure ......................................................................................................... 114
Calculation ...................................................................................................... 114
Quality Assurance/Quality Control ................................................................. 114
SILICA (ATOMIC ABSORPTION SPECTROPHOTOMETRY) ............................... 116
Scope ............................................................................................................. 116
References ....................................................................................................... 116
Materials and Equipment ................................................................................ 116
Reagents and Standards ................................................................................... 117
Procedure ......................................................................................................... 117
Calculations ..................................................................................................... 118
Quality control ................................................................................................. 118
SILICA, TOTAL (ICP– ATOMIC EMISSION SPECTROMETRY) .......................... 120
Scope ............................................................................................................. 120
References ....................................................................................................... 120
Materials and Equipment ................................................................................ 120
Reagents and Standards ................................................................................... 120
Procedure ......................................................................................................... 121
Calculation ...................................................................................................... 121
Quality Assurance / Quality Control ............................................................... 121
SODIUM AND POTASSIUM (ICP-ATOMIC EMISSION
SPECTROMETRY) ........................................................................................ 122
Scope ............................................................................................................. 122
References ....................................................................................................... 122
Materials and Equipment ................................................................................ 122
Reagents and Standards ................................................................................... 122
Procedure ......................................................................................................... 123
Calculation ...................................................................................................... 124
Quality Assurance/Quality Control ................................................................. 124
SODIUM (ATOMIC ABSORPTION SPECTROPHOTOMETRY) ............................ 125
Scope ............................................................................................................. 125
References ....................................................................................................... 125
Materials and Equipment ................................................................................ 125
Reagents and Standards ................................................................................... 125
Procedure ......................................................................................................... 126
Calculation ...................................................................................................... 126
Quality Assurance/Quality Control ................................................................. 126
SODIUM (ION CHROMATOGRAPHY) .................................................................... 128
Scope ............................................................................................................. 128
Reference ......................................................................................................... 128
Materials and Equipment ................................................................................ 128
Reagents and Standards ................................................................................... 128
Procedure ......................................................................................................... 129
Calculation ...................................................................................................... 129
Quality Assurance / Quality Control ............................................................... 129
SODIUM (ATOMIC EMISSION SPECTROSCOPY (AES) ....................................... 130
Scope ............................................................................................................. 130
References ....................................................................................................... 130
Materials and Equipment ................................................................................ 130
Reagents and Standards ................................................................................... 130
Procedure ......................................................................................................... 131
Calculation ...................................................................................................... 131
Quality Assurance/Quality control .................................................................. 131
SULFATE (INDIRECT SPECTROPHOTOMETRIC WITH BARIUM
CHROMATE AND BROMOPHENOL BLUE) ............................................. 132
Scope ............................................................................................................. 132
Reference ......................................................................................................... 132
Materials and Equipment ................................................................................ 132
Reagents and Standards ................................................................................... 132
Procedure ......................................................................................................... 133
Calculation ...................................................................................................... 133
Quality Assurance/Quality Control ................................................................. 134
SULFATE (ION CHROMATOGRAPHY) .................................................................. 135
Scope ............................................................................................................. 135
References ....................................................................................................... 135
Materials and Equipment ................................................................................ 135
Reagents and Standards ................................................................................... 136
Procedure ......................................................................................................... 136
Calculation ...................................................................................................... 137
Quality Assurance / Quality Control ............................................................... 137
SULFATE (TURBIDOMETRIC) ................................................................................. 139
Scope ............................................................................................................. 139
References ....................................................................................................... 139
Materials and Equipment ................................................................................ 139
Reagents and Standards ................................................................................... 139
Procedure ......................................................................................................... 140
Calculation ...................................................................................................... 140
Quality Assurance/Quality Control ................................................................. 140
STANDARDIZATION OF NAOH AGAINST KHP ................................................... 141
Materials and Equipment ................................................................................ 141
Reagents .......................................................................................................... 141
Procedure ......................................................................................................... 141
Calculation ...................................................................................................... 141
STANDARDIZATION OF HCL AGAINST NAOH ................................................... 143
Materials and Equipment ................................................................................ 143
Reagents .......................................................................................................... 143
Procedure ......................................................................................................... 143
Calculation ...................................................................................................... 143
STANDARDIZATION OF SILVER NITRATE AGAINST SODIUM
CHLORIDE ..................................................................................................... 145
Materials and Equipment ................................................................................ 145
Reagents .......................................................................................................... 145
Procedure ......................................................................................................... 145
Calculation ...................................................................................................... 145
BIBLIOGRAPHY ................................................................................................................... 146
APPENDIX I. ABBREVIATIONS ........................................................................................ 150
APPENDIX II. LIST OF CONTRIBUTING LABORATORIES BY METHODS ............... 151
APPENDIX III. CONTACT INFORMATION OF THE CONTRIBUTIING
LABORATORIES ......................................................................................................... 154
APPENDIX IV. LIST OF PERSONS INVOLVED IN DRAFTING AND REVIEW
OF THE DOCUMENT.................................................................................................. 156
APPENDIX V: IMPROVING ANALYTICAL QUALITY OF WATER
CHEMISTRY THROUGH INTER-LABORATORY COMPARISON ....................... 157
APPENDIX VI: 2003 INTER-LABORATORY COMPARISON OF
GEOTHERMAL WATER CHEMISTRY .................................................................... 166
INTRODUCTION ......................................................................................................... 168
METHODOLOGY ........................................................................................................ 169
Collection and Preparation of Samples ......................................................................... 169
Evaluation of Results ..................................................................................................... 170
Homogeneity ................................................................................................... 170
Stability ........................................................................................................... 170
Results of all labs ............................................................................................ 171
DISCUSSSION OF RESULTS ..................................................................................... 172
GW-03-01 Mixed Natural and Synthetic Brine ............................................................. 173
GW-03-02 Natural Brine ............................................................................................... 174
GW-03-03 Synthetic Brine ............................................................................................ 174
Laboratory Performance in Inter-laboratory Comparison ............................................. 174
CONCLUSIONS AND RECOMMENDATIONS ........................................................ 175
REFERENCES .............................................................................................................. 176
LIST OF TABLES, FIGURES AND ANNEXES ........................................................ 177
1. COUNTRY .................................................................................................................... 217
2. NAME/ADDRESS OF LABORATORY...................................................................... 217
3. COUNTRY .................................................................................................................... 219
NAME/ADDRESS OF LABORATORY ............................................................................... 219
4. COUNTRY .................................................................................................................... 220
5. NAME/ADDRESS OF LABORATORY...................................................................... 220
6. COUNTRY .................................................................................................................... 222
7. NAME/ADDRESS OF LABORATORY...................................................................... 222
8. COUNTRY .................................................................................................................... 223
9. NAME/ADDRESS OF LABORATORY...................................................................... 223
10. COUNTRY .................................................................................................................... 225
11. NAME/ADDRESS OF LABORATORY...................................................................... 225
12. COUNTRY .................................................................................................................... 227
13. NAME/ADDRESS OF LABORATORY...................................................................... 227
PROCEDURES
ALUMINIUM (FLUORIMETRIC WITH LUMOGALLION)
Iceland GeoSurvey, Iceland
Scope
The method is applicable to acidified water samples at concentrations ≥ 0.05 g/l but if
the concentration exceeds 50 g/l dilution is needed
Al forms a fluorescent complex with lumogallion at pH = 5. Glassware may interfere
with the reaction and plastic apparatus is preferred.
Iron interferes at concentrations > 200 g/l but this can usually be avoided by dilution.
Organic matter may also interfere but this can be overcome by irradiation with UV light
References
Hydes, D.J. and Liss, P.S. (1976); Vitense, K.R. and McGown, L.B. (1987).
Materials and Equipment
Plastic reagent bottles, 100 ml
Plastic volumetric flasks, 25, 50, 100 and 250 ml
Plastic measuring cylinders, 50 ml
Pipettes, 0.5 – 2 ml
Plastic film.
pH meter
Fluorimeter with filters or monochromator
Reagents and Standards
Buffer solution. Dissolve 45 g of sodium acetate (CH3COONa.3H2O) in demonized
water, add 6.5 ml glacial acetic acid and dilute to 100 ml. Check that this will buffer 50
ml of acidified water (1 ml conc. HNO3 + 499 ml water) plus 1 ml ammonia solution to
pH = 5.0 ± 0.1. Adjust with acetic acid if needed.
Ammonia solution, 25%.
Lumogallion solution. Dissolve 0.02 g of lumogallion in demonized water and dilute to
100 ml
Aluminum stock solution. 1 g Al/l
Aluminum working solutions. 1-4 g/l made up daily from the stock solution
Procedure
If dilution is required add 10 to 50 ml sample of acidified water sample (1 ml conc.
HNO3 + 499 ml water) and dilute with similarly acidified deionized water to 250 ml.
Using a 50 ml measuring cylinder transfer 5 portions of undiluted or diluted sample to
clean 100 ml polypropylene bottles and add reagents as specified in the following table.
Before adding the lumogallion check that the pH of the solution is 5.0 ± 0.1. If not adjust
with acetic acid or ammonia. Prepare reagent blanks with 50 ml acidified deionized
water, 1 ml ammonia, 0.5 ml buffer and 0.5 ml lumogallion.
Reagents to be added
Bottle
No.
Ammonia
Ml
Buffer
ml
Al amount
ml, g
Lumogallion
Ml
1 1 0.5 0 0
2 1 0.5 0 0.5
3 1 0.5 1.0 0.5
4 1 0.5 1.5 0.5
5 1 0.5 2.0 0.5
Cover the bottles with plastic film
Heat in a water bath at 70-80°C for 1 hour to ensure complete complexing of the
lumogallion. Cool the bottles to room temperature
Measure the fluorescence of the solution in each bottle using the 505 nm excitation
wavelength and the 565 nm emission wavelength, heating the lamp for at least 30
minutes before starting measurements. The solution in bottle No. 1 should show zero
fluorescence unless the sample fluoresces naturally in which case the natural fluorescence
should be subtracted from the measured fluorescence in the solutions from bottles No. 2-
5.
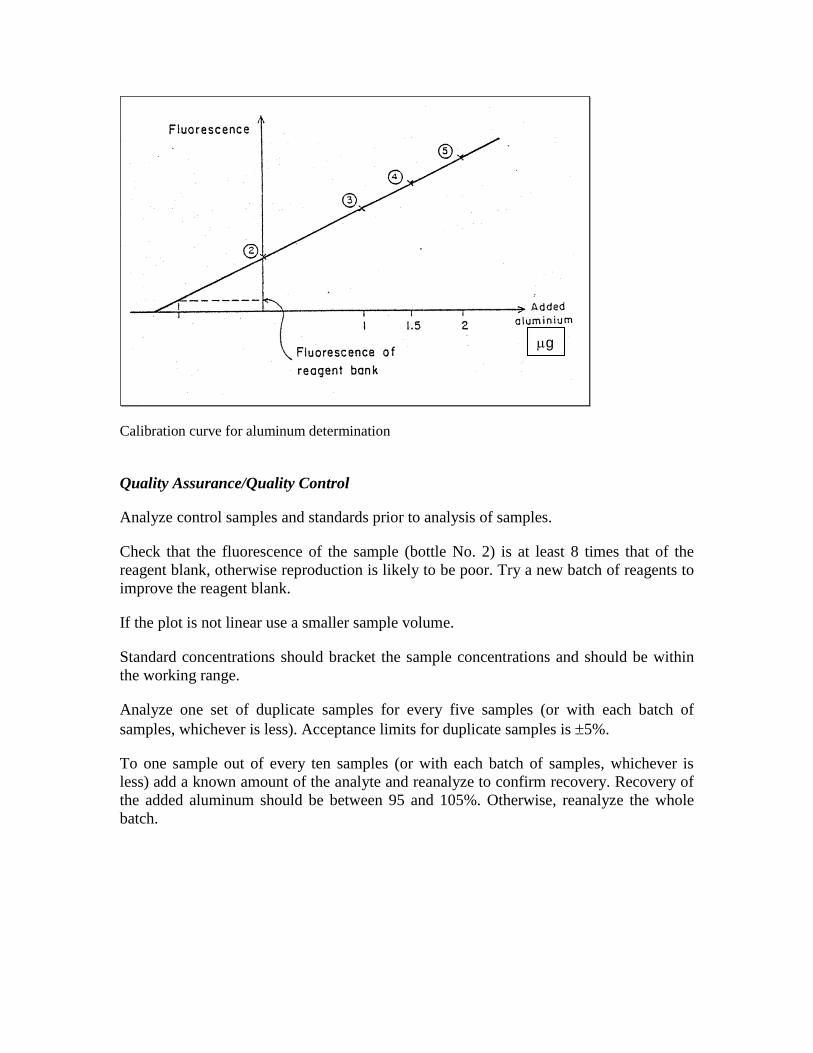
Calculation
Prepare a calibration curve for each sample and added standard. (See Figure). The
fluorescence of the solution from bottle No. 2 minus that of the reagent blank gives the
fluorescence due to the sample and hence the aluminum concentration. If the sample was
diluted multiply with the dilution factor to obtain the total concentration.
g
Calibration curve for aluminum determination
Quality Assurance/Quality Control
Analyze control samples and standards prior to analysis of samples.
Check that the fluorescence of the sample (bottle No. 2) is at least 8 times that of the
reagent blank, otherwise reproduction is likely to be poor. Try a new batch of reagents to
improve the reagent blank.
If the plot is not linear use a smaller sample volume.
Standard concentrations should bracket the sample concentrations and should be within
the working range.
Analyze one set of duplicate samples for every five samples (or with each batch of
samples, whichever is less). Acceptance limits for duplicate samples is 5%.
To one sample out of every ten samples (or with each batch of samples, whichever is
less) add a known amount of the analyte and reanalyze to confirm recovery. Recovery of
the added aluminum should be between 95 and 105%. Otherwise, reanalyze the whole
batch.
AMMONIA (SPECTROPHOTOMETRIC WITH INDOPHENOL BLUE)
Iceland GeoSurvey, Iceland
Scope
Ammonia reacts with hypochlorite at pH 8 - 11.5 to form monochloramine, which with
phenol, a catalytic amount of nitroprusside and excess hypochlorite, gives indophenol
blue. The precipitation of Mg and Ca ions is prevented by complexation with citrate. A
reaction temperature of 37 - 40oC causes complete color formation within 30 minutes.
The method is applicable to the determination of ammonia (NH3) in water with
concentrations ranging from 0.007 mg/l NH3 (using a 10 cm cell) and above. Higher
concentrations than about 1 mg/L can be determined following appropriate dilutions.
The sum of ammonium and ammonia is determined.
Mercuric ions at 2-40 mg/l decrease the indophenol blue by about 20% and samples
containing more than 2 mg/l sulphide should be diluted.
References
Koroleff, F. (1983)
Materials and Equipment
Amber glass bottles, 1000 ml and 100 ml
Glass bottle, 100 ml
Polyethylene bottle, 500 ml
Volumetric flasks, 100 ml and 50 ml (several)
Pipettes, 0.5, 1, 3, 5 ml
Erlenmeyer flasks, 100 ml
Burette, 25 ml
pH meter
UV-Visible Spectrophotometer with appropriate size sample cells (1-10 cm)
Reagents and Standards
Ammonia stock solution, 100 ppm: Dry ammonium chloride at 100°C. Dissolve 31.7 mg
in freshly deionized water and dilute to 100 ml. Preserve with a drop of chloroform and
store in a glass bottle in a refrigerator.
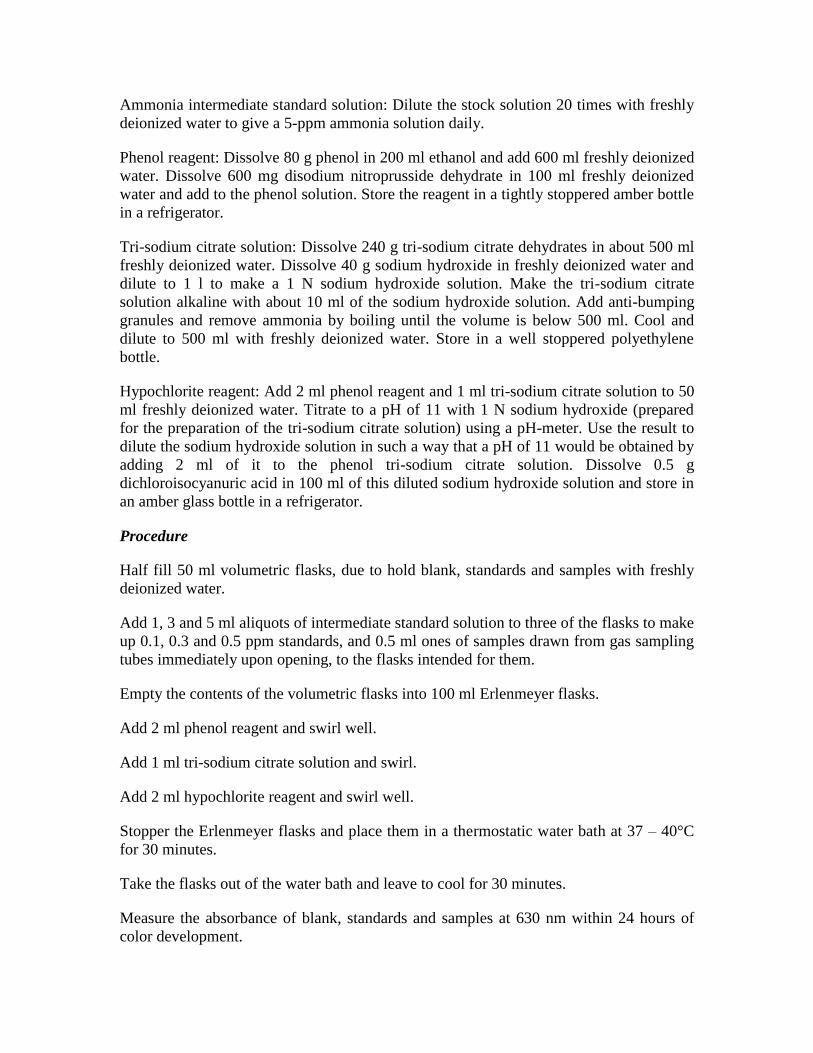
Ammonia intermediate standard solution: Dilute the stock solution 20 times with freshly
deionized water to give a 5-ppm ammonia solution daily.
Phenol reagent: Dissolve 80 g phenol in 200 ml ethanol and add 600 ml freshly deionized
water. Dissolve 600 mg disodium nitroprusside dehydrate in 100 ml freshly deionized
water and add to the phenol solution. Store the reagent in a tightly stoppered amber bottle
in a refrigerator.
Tri-sodium citrate solution: Dissolve 240 g tri-sodium citrate dehydrates in about 500 ml
freshly deionized water. Dissolve 40 g sodium hydroxide in freshly deionized water and
dilute to 1 l to make a 1 N sodium hydroxide solution. Make the tri-sodium citrate
solution alkaline with about 10 ml of the sodium hydroxide solution. Add anti-bumping
granules and remove ammonia by boiling until the volume is below 500 ml. Cool and
dilute to 500 ml with freshly deionized water. Store in a well stoppered polyethylene
bottle.
Hypochlorite reagent: Add 2 ml phenol reagent and 1 ml tri-sodium citrate solution to 50
ml freshly deionized water. Titrate to a pH of 11 with 1 N sodium hydroxide (prepared
for the preparation of the tri-sodium citrate solution) using a pH-meter. Use the result to
dilute the sodium hydroxide solution in such a way that a pH of 11 would be obtained by
adding 2 ml of it to the phenol tri-sodium citrate solution. Dissolve 0.5 g
dichloroisocyanuric acid in 100 ml of this diluted sodium hydroxide solution and store in
an amber glass bottle in a refrigerator.
Procedure
Half fill 50 ml volumetric flasks, due to hold blank, standards and samples with freshly
deionized water.
Add 1, 3 and 5 ml aliquots of intermediate standard solution to three of the flasks to make
up 0.1, 0.3 and 0.5 ppm standards, and 0.5 ml ones of samples drawn from gas sampling
tubes immediately upon opening, to the flasks intended for them.
Empty the contents of the volumetric flasks into 100 ml Erlenmeyer flasks.
Add 2 ml phenol reagent and swirl well.
Add 1 ml tri-sodium citrate solution and swirl.
Add 2 ml hypochlorite reagent and swirl well.
Stopper the Erlenmeyer flasks and place them in a thermostatic water bath at 37 – 40°C
for 30 minutes.
Take the flasks out of the water bath and leave to cool for 30 minutes.
Measure the absorbance of blank, standards and samples at 630 nm within 24 hours of
color development.
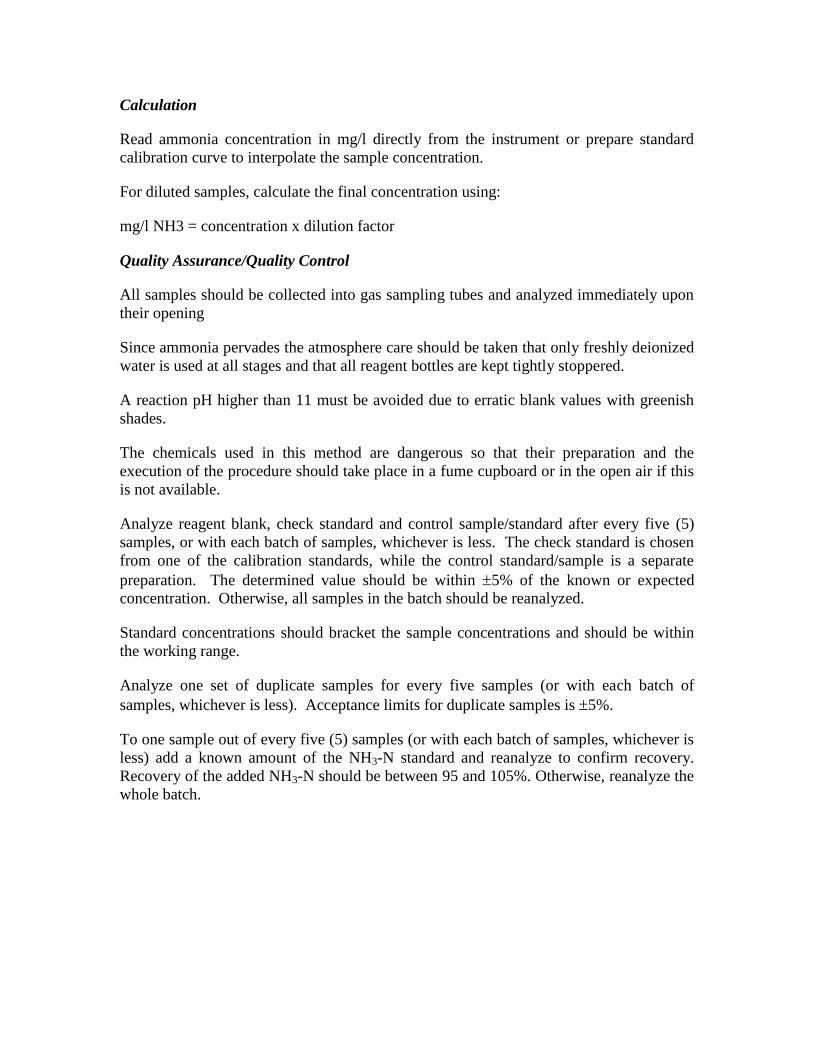
Calculation
Read ammonia concentration in mg/l directly from the instrument or prepare standard
calibration curve to interpolate the sample concentration.
For diluted samples, calculate the final concentration using:
mg/l NH3 = concentration x dilution factor
Quality Assurance/Quality Control
All samples should be collected into gas sampling tubes and analyzed immediately upon
their opening
Since ammonia pervades the atmosphere care should be taken that only freshly deionized
water is used at all stages and that all reagent bottles are kept tightly stoppered.
A reaction pH higher than 11 must be avoided due to erratic blank values with greenish
shades.
The chemicals used in this method are dangerous so that their preparation and the
execution of the procedure should take place in a fume cupboard or in the open air if this
is not available.
Analyze reagent blank, check standard and control sample/standard after every five (5)
samples, or with each batch of samples, whichever is less. The check standard is chosen
from one of the calibration standards, while the control standard/sample is a separate
preparation. The determined value should be within 5% of the known or expected
concentration. Otherwise, all samples in the batch should be reanalyzed.
Standard concentrations should bracket the sample concentrations and should be within
the working range.
Analyze one set of duplicate samples for every five samples (or with each batch of
samples, whichever is less). Acceptance limits for duplicate samples is 5%.
To one sample out of every five (5) samples (or with each batch of samples, whichever is
less) add a known amount of the NH3-N standard and reanalyze to confirm recovery.
Recovery of the added NH3-N should be between 95 and 105%. Otherwise, reanalyze the
whole batch.
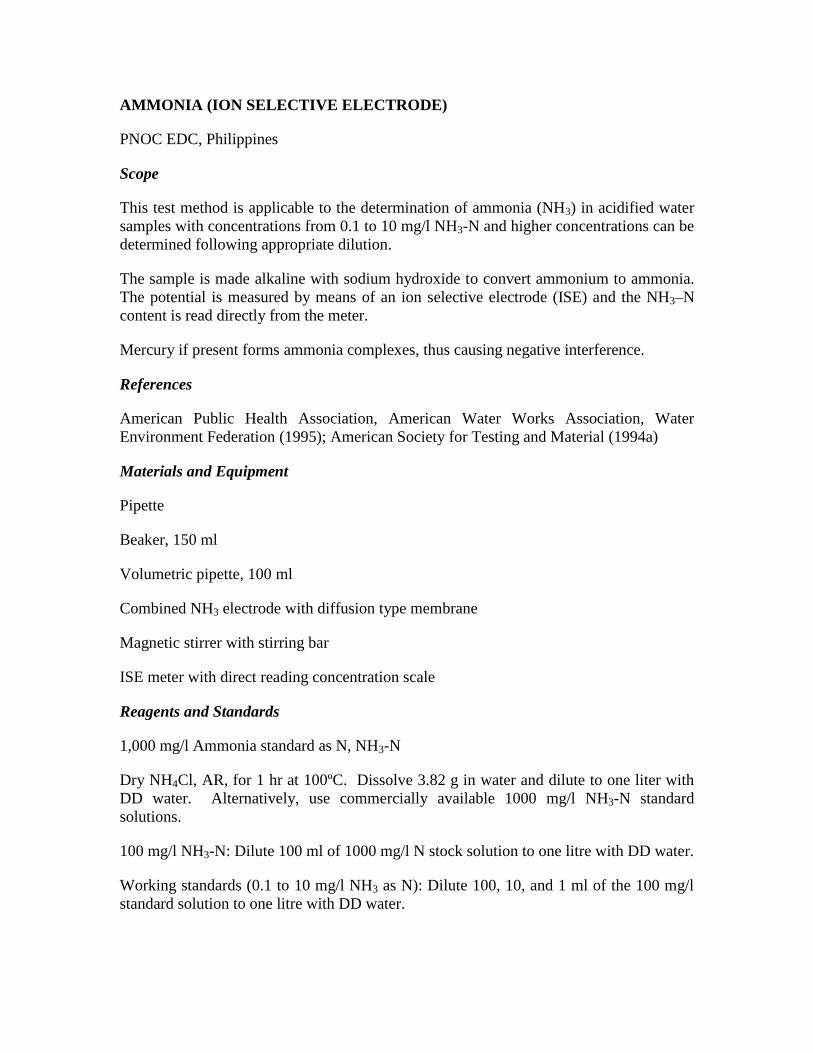
AMMONIA (ION SELECTIVE ELECTRODE)
PNOC EDC, Philippines
Scope
This test method is applicable to the determination of ammonia (NH3) in acidified water
samples with concentrations from 0.1 to 10 mg/l NH3-N and higher concentrations can be
determined following appropriate dilution.
The sample is made alkaline with sodium hydroxide to convert ammonium to ammonia.
The potential is measured by means of an ion selective electrode (ISE) and the NH3–N
content is read directly from the meter.
Mercury if present forms ammonia complexes, thus causing negative interference.
References
American Public Health Association, American Water Works Association, Water
Environment Federation (1995); American Society for Testing and Material (1994a)
Materials and Equipment
Pipette
Beaker, 150 ml
Volumetric pipette, 100 ml
Combined NH3 electrode with diffusion type membrane
Magnetic stirrer with stirring bar
ISE meter with direct reading concentration scale
Reagents and Standards
1,000 mg/l Ammonia standard as N, NH3-N
Dry NH4Cl, AR, for 1 hr at 100ºC. Dissolve 3.82 g in water and dilute to one liter with
DD water. Alternatively, use commercially available 1000 mg/l NH3-N standard
solutions.
100 mg/l NH3-N: Dilute 100 ml of 1000 mg/l N stock solution to one litre with DD water.
Working standards (0.1 to 10 mg/l NH3 as N): Dilute 100, 10, and 1 ml of the 100 mg/l
standard solution to one litre with DD water.
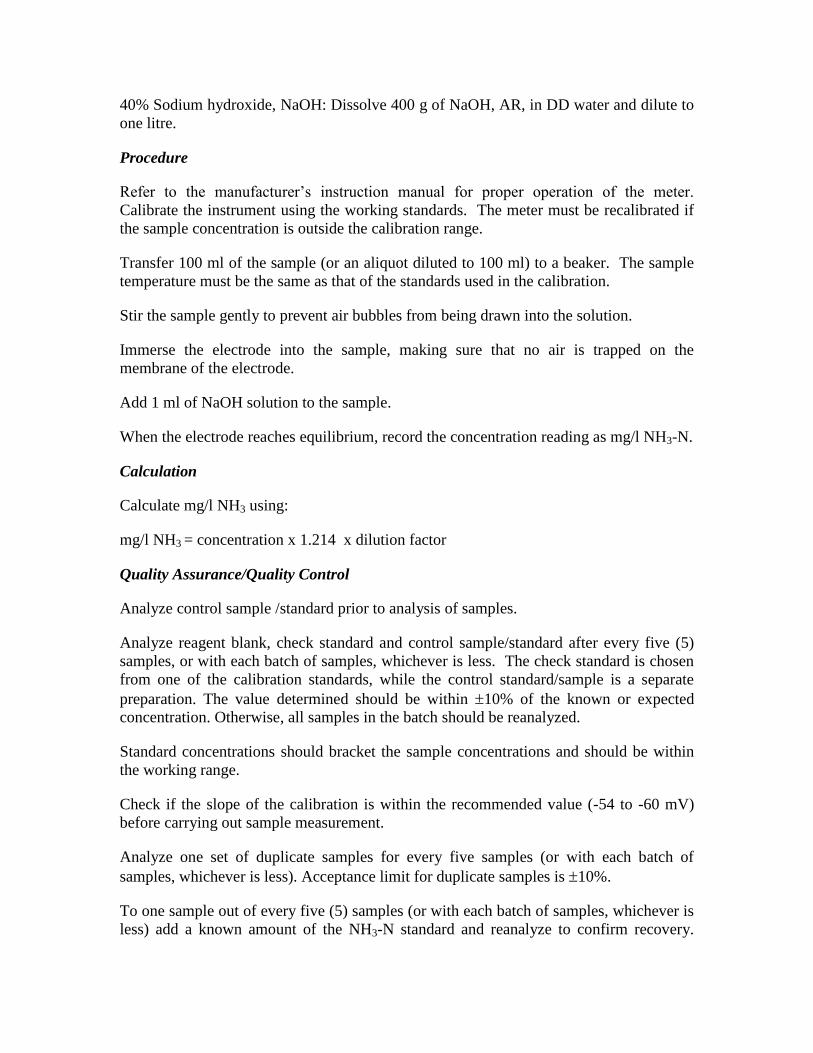
40% Sodium hydroxide, NaOH: Dissolve 400 g of NaOH, AR, in DD water and dilute to
one litre.
Procedure
Refer to the manufacturer’s instruction manual for proper operation of the meter.
Calibrate the instrument using the working standards. The meter must be recalibrated if
the sample concentration is outside the calibration range.
Transfer 100 ml of the sample (or an aliquot diluted to 100 ml) to a beaker. The sample
temperature must be the same as that of the standards used in the calibration.
Stir the sample gently to prevent air bubbles from being drawn into the solution.
Immerse the electrode into the sample, making sure that no air is trapped on the
membrane of the electrode.
Add 1 ml of NaOH solution to the sample.
When the electrode reaches equilibrium, record the concentration reading as mg/l NH3-N.
Calculation
Calculate mg/l NH3 using:
mg/l NH3 = concentration x 1.214 x dilution factor
Quality Assurance/Quality Control
Analyze control sample /standard prior to analysis of samples.
Analyze reagent blank, check standard and control sample/standard after every five (5)
samples, or with each batch of samples, whichever is less. The check standard is chosen
from one of the calibration standards, while the control standard/sample is a separate
preparation. The value determined should be within 10% of the known or expected
concentration. Otherwise, all samples in the batch should be reanalyzed.
Standard concentrations should bracket the sample concentrations and should be within
the working range.
Check if the slope of the calibration is within the recommended value (-54 to -60 mV)
before carrying out sample measurement.
Analyze one set of duplicate samples for every five samples (or with each batch of
samples, whichever is less). Acceptance limit for duplicate samples is 10%.
To one sample out of every five (5) samples (or with each batch of samples, whichever is
less) add a known amount of the NH3-N standard and reanalyze to confirm recovery.

Recovery of the added NH3-N should be between 90 and 110%. Otherwise, reanalyze the
whole batch.
AMMONIA (NH3-N) (SPECTROHOTOMETRIC WITH NESSLER REAGENT)
Moi University, Kenya
Scope
Ammonia nitrogen is determined through the formation of a colored ammonium
compound, which absorbs light at 425 nm. The method is suitable for ammonia
concentrations in the range 20 g/l to 50 mg/l.
Interferences include turbidity, color, and precipitates of Mg and Ca hydroxides, which
may be removed by distillation or by precipitation with zinc sulphate.
References
American Public Health Association, American Water Works Association, Water
Environment Federation (1992), Hatch Co. (1995).
Materials and equipment
Spectrophotometer for use at 400 to 500 nm, with light path of 1 cm or longer
25 ml graduated mixing cylinder
pH meter with high sensitivity electrode
Reagents and standards
Ammonia-free water should be used for all preparations, rinsing, and dilutions. Eliminate
traces of ammonia in distilled water by adding 0.1 ml conc. H2 SO4 to 1 l distilled water
and redistilling.
Stock ammonium solution: Dissolve 3.819 g anhydrous NH4Cl, dried at 100C, in water,
and dilute to 1 l. 1.00 ml of this solution contains 1.00 mg N, or 1.22 mg NH3.
Standard ammonium solution: Dilute 10.00 ml stock ammonium solution to 1000 ml with
water. 1.00 ml of this solution contains 10.00 g N, or 12.2 g NH3.
Sodium hydroxide, 6 N
Dechlorinating agent: Use 1ml of sodium sulphate solution (dissolve 0.9 g Na2SO3 in
water and dilute to 1 l. Prepare fresh daily) to remove 1mg/l residual chlorine in 500 ml
sample.
Neutralizing agents: Prepare with ammonia free water: Sodium hydroxide, NaOH, 1 N;
Sulphuric acid, H2 SO4, 1 N
Sulphuric acid, 0.04 N: Dilute 1.0 ml conc. H2 SO4 to 1 l.
Zinc sulphate solution: Dissolve 100 g Zn SO4.7H2O and dilute to 1 l with water.
Stabilizer reagent: EDTA Reagent: Dissolve 50 g disodium ethylenediamine tetra acetate
dehydrate in 60 ml water containing 10 g NaOH. Heat to dissolve, if necessary. Cool to
room temperature, and dilute to 100 ml.
Nessler Reagent: Dissolve 100 g HgI2 and 70 g KI in a small quantity of water. Add this
mixture, slowly, and with stirring, to a cool solution of 160 g NaOH dissolved in 500 ml
of water. Dilute to 1 liter. Store in rubber-stoppered borosilicate glassware and out of
sunlight. The reagent is stable for up to a year under normal laboratory conditions. Check
reagent to make sure that it yields the characteristic color with 0.1 mg NH3/l within 10
minutes of addition. It should not produce a precipitate with small amounts of ammonia
within 2 hours. CAUTION: Toxic. Do not ingest.
Polyvinyl alcohol
Procedure
Set the spectrophotometer wavelength to 425 nm.
If necessary, remove residual chlorine from freshly collected sample by adding an
equivalent amount of dechlorinating agent.
Add 1 ml ZnSO4 solution to 100 ml sample and mix thoroughly.
Add 0.4 to 0.5 ml NaOH solution to obtain a pH of 10.5, as determined with a pH meter
and electrode, and mix gently.
Let treated sample stand for five minutes. A heavy flocculent precipitate should form,
leaving a clear and colorless supernate.
Clarify by centrifuging or filtering with ammonia-free filter paper.
Fill another 25 ml mixing graduated cylinder to the mark with deionized water (blank).
Add three drops of "mineral stabiliser" to each cylinder.
Invert several times to mix.
Add three drops of polyvinyl alcohol to each cylinder, making sure that the dropping
bottle is exactly vertical.
Invert several times to mix.
Pipette 1.0 ml of Nessler Reagent into each cylinder.
Stopper and invert several times to ensure mixing.
Allow the reaction take place for 1 minute.
Pour each solution into blank and sample cells
Place the blank in the cell holder.
Close the light shield.
Press "ZERO". The display will show 0.00 mg/l after a short waiting period.
Place the prepared sample in the cell holder, and close the light shield.
Press: READ/ENTER.
The concentration of ammonia nitrogen will be displayed in mg/l.
Calculation
Deduct the amount of NH3-N in water used for diluting original sample before computing
final nitrogen value.
Deduct also reagent blank for volume of borate buffer and 6N NaOH solutions used with
sample.
Calculate total NH3-N using:
mgNH3-N/l(51ml final volume)sampleml
A
Where: A = g NH3-N (51 ml final volume)
In case of dilution of sample, multiply result by dilution factor. E.g. if sample was diluted
by a factor of 10, multiply by 10.
Quality Assurance/Quality Control
For best results, samples should be analyzed immediately after collection from the field.
Geothermal samples usually do not contain residual chlorine; otherwise this should be
destroyed to prevent its reaction with ammonia. If chlorine is suspected to be present, add
0.8 ml conc. H2SO4 to attain a pH of between 1.5 and 2.0, then store at 4C. If such
treatment is used, it is necessary to neutralize the samples with NaOH or KOH
immediately before starting the analysis.
The relative error should be between 0% and 10%.
BICARBONATE, CARBONATE AND TOTAL CARBON DIOXIDE
(TITRIMETRIC)
PNOC EDC, Philippines
Scope
This method is applicable to geothermal and groundwater samples with low sulfide and
sulfite contents. It consists essentially of an alkalinity titration corrected for the effects of
other weak acids, mainly boric and silicic acids and ammonium ion, by back titration.
The range of the method is 5 to 500 mg/l HCO3 and can be extended upward using
increased concentrations of HCl/NaOH.
Fresh and air-free samples should be analyzed to avoid interference due to carbon dioxide
absorption from the atmosphere.
Silver nitrate (AgNO3) is added prior to titration to remove H2S interference.
References
Ellis and Mahon (1977); Giggenbach and Goguel (1989).
Materials and Equipment
pH/mV meter
pH electrode
Automatic or digital burettes
Magnetic stirrer with stirring bars
Beakers, 150 ml
Compressed air or nitrogen gas
Volumetric pipette, 50 ml
Reagents and Standards
0.10 N AgNO3: Dissolve 16.987 g AgNO3, AR, crystals in one liter DD water.
1 N NaOH stock solution: Dissolve 40.08 g NaOH in one liter DD water or dilute one
ampoule commercially available 1 N NaOH standard solution to 1 l in a volumetric flask.
0.02 N NaOH titrant: Dilute 20 ml 1 N NaOH stock solution to one liter with DD water.
Standardize with KC8H5O4 (Appendix I.A).
1.0 N HCl stock solution: Dilute 82.6 ml concentrated HCl to one liter or dilute one
ampoule commercially available 1 N HCl standard solution to one liter with DD water in
a volumetric flask.
0.02 N HCl titrant: Pipette 20 ml 1.0 N HCl stock solution into 1 l volumetric flask and
dilute to one liter with DD water. Standardize with NaOH (Appendix I.B)
Procedure
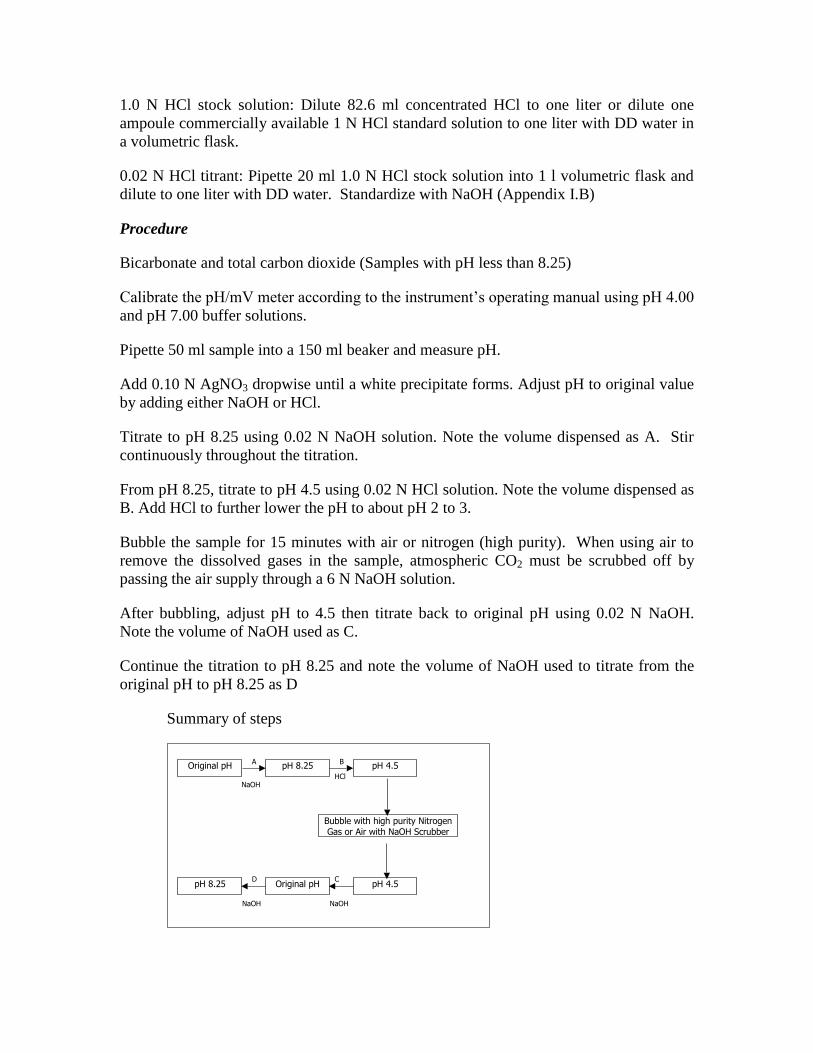
Bicarbonate and total carbon dioxide (Samples with pH less than 8.25)
Calibrate the pH/mV meter according to the instrument’s operating manual using pH 4.00
and pH 7.00 buffer solutions.
Pipette 50 ml sample into a 150 ml beaker and measure pH.
Add 0.10 N AgNO3 dropwise until a white precipitate forms. Adjust pH to original value
by adding either NaOH or HCl.
Titrate to pH 8.25 using 0.02 N NaOH solution. Note the volume dispensed as A. Stir
continuously throughout the titration.
From pH 8.25, titrate to pH 4.5 using 0.02 N HCl solution. Note the volume dispensed as
B. Add HCl to further lower the pH to about pH 2 to 3.
Bubble the sample for 15 minutes with air or nitrogen (high purity). When using air to
remove the dissolved gases in the sample, atmospheric CO2 must be scrubbed off by
passing the air supply through a 6 N NaOH solution.
After bubbling, adjust pH to 4.5 then titrate back to original pH using 0.02 N NaOH.
Note the volume of NaOH used as C.
Continue the titration to pH 8.25 and note the volume of NaOH used to titrate from the
original pH to pH 8.25 as D
Summary of steps
Original pH A B
C
NaOH HCl
D
NaOH NaOH
pH 8.25 pH 4.5
Original pH pH 4.5 pH 8.25
Bubble with high purity Nitrogen Gas or Air with NaOH Scrubber
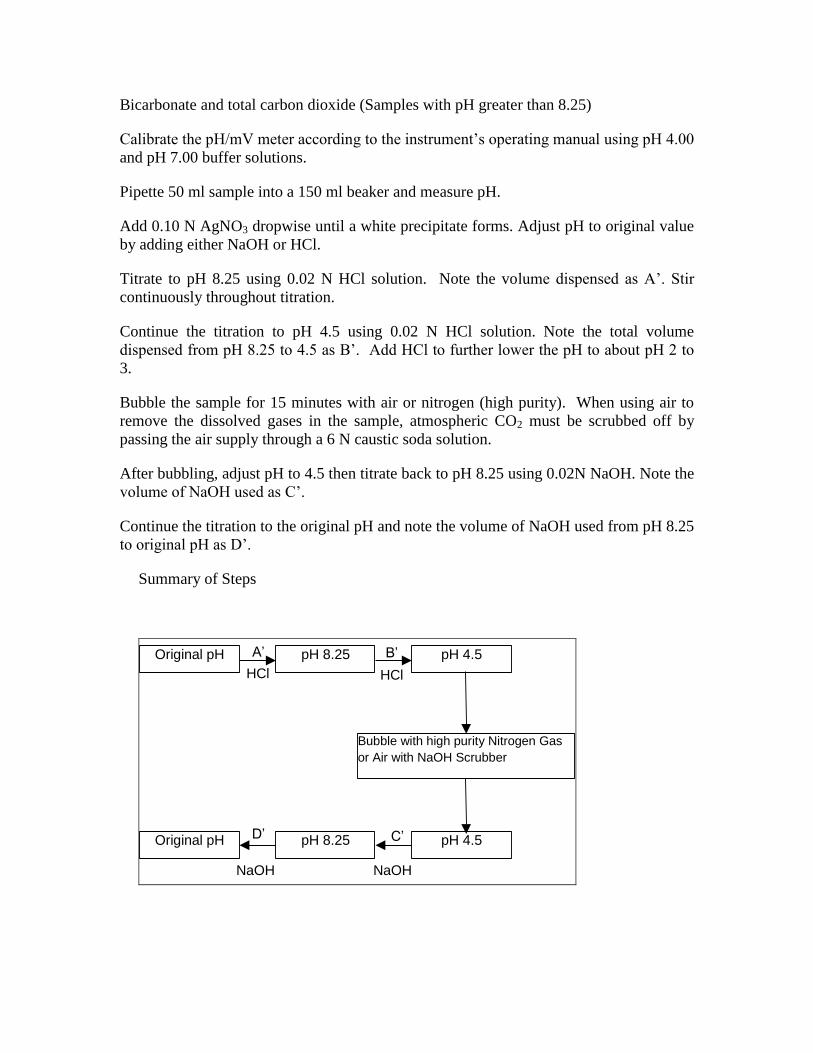
Bicarbonate and total carbon dioxide (Samples with pH greater than 8.25)
Calibrate the pH/mV meter according to the instrument’s operating manual using pH 4.00
and pH 7.00 buffer solutions.
Pipette 50 ml sample into a 150 ml beaker and measure pH.
Add 0.10 N AgNO3 dropwise until a white precipitate forms. Adjust pH to original value
by adding either NaOH or HCl.
Titrate to pH 8.25 using 0.02 N HCl solution. Note the volume dispensed as A’. Stir
continuously throughout titration.
Continue the titration to pH 4.5 using 0.02 N HCl solution. Note the total volume
dispensed from pH 8.25 to 4.5 as B’. Add HCl to further lower the pH to about pH 2 to
3.
Bubble the sample for 15 minutes with air or nitrogen (high purity). When using air to
remove the dissolved gases in the sample, atmospheric CO2 must be scrubbed off by
passing the air supply through a 6 N caustic soda solution.
After bubbling, adjust pH to 4.5 then titrate back to pH 8.25 using 0.02N NaOH. Note the
volume of NaOH used as C’.
Continue the titration to the original pH and note the volume of NaOH used from pH 8.25
to original pH as D’.
Summary of Steps
Original pH pH 8.25 pH 4.5
pH 8.25 pH 4.5 Original pH
Bubble with high purity Nitrogen Gas
or Air with NaOH Scrubber
D’
A’
C’
B’
HCl HCl
NaOH NaOH
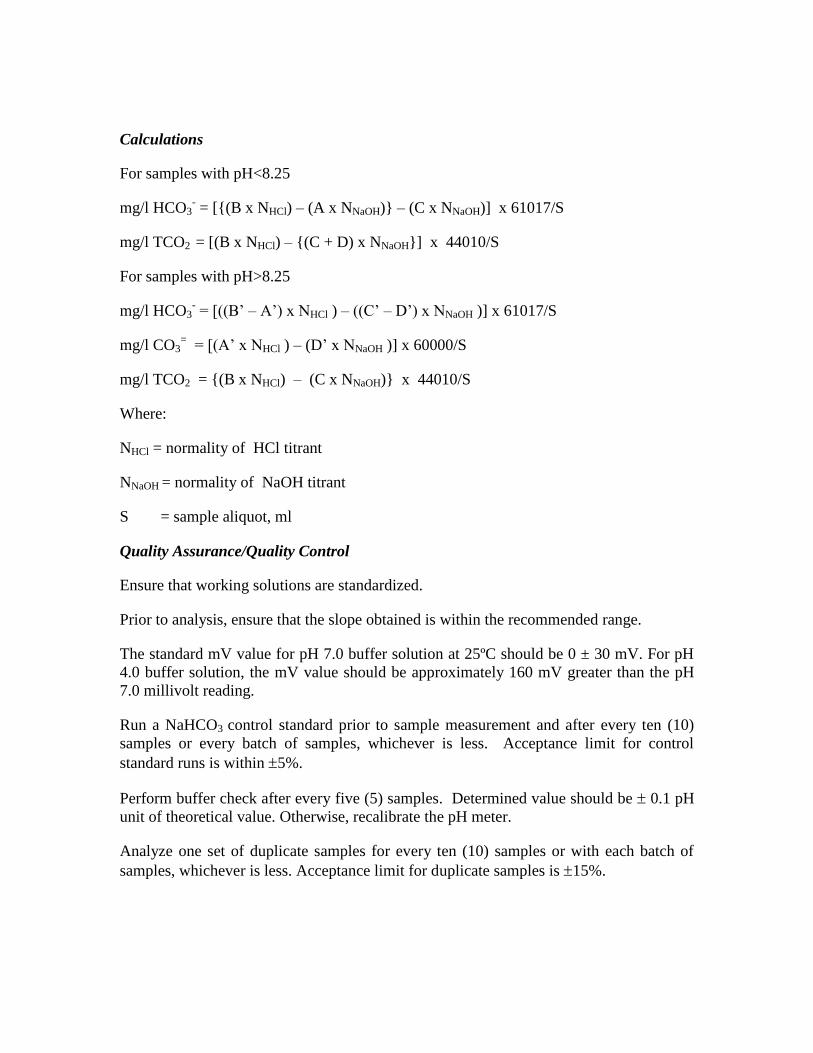
Calculations
For samples with pH<8.25
mg/l HCO3- = [{(B x NHCl) – (A x NNaOH)} – (C x NNaOH)] x 61017/S
mg/l TCO2 = [(B x NHCl) – {(C + D) x NNaOH}] x 44010/S
For samples with pH>8.25
mg/l HCO3- = [((B’ – A’) x NHCl ) – ((C’ – D’) x NNaOH )] x 61017/S
mg/l CO3= = [(A’ x NHCl ) – (D’ x NNaOH )] x 60000/S
mg/l TCO2 = {(B x NHCl) – (C x NNaOH)} x 44010/S
Where:
NHCl = normality of HCl titrant
NNaOH = normality of NaOH titrant
S = sample aliquot, ml
Quality Assurance/Quality Control
Ensure that working solutions are standardized.
Prior to analysis, ensure that the slope obtained is within the recommended range.
The standard mV value for pH 7.0 buffer solution at 25ºC should be 0 ± 30 mV. For pH
4.0 buffer solution, the mV value should be approximately 160 mV greater than the pH
7.0 millivolt reading.
Run a NaHCO3 control standard prior to sample measurement and after every ten (10)
samples or every batch of samples, whichever is less. Acceptance limit for control
standard runs is within 5%.
Perform buffer check after every five (5) samples. Determined value should be 0.1 pH
unit of theoretical value. Otherwise, recalibrate the pH meter.
Analyze one set of duplicate samples for every ten (10) samples or with each batch of
samples, whichever is less. Acceptance limit for duplicate samples is 15%.
BORON (TITRIMETRIC WITH MANNITOL)
PNOC EDC, Philippines
Scope
This method covers the determination of dissolved boron in acidified water samples.
This titration method is based on the pH change following the addition of mannitol,
which combines with boric acid to release hydrogen ion.
This method is applicable within the concentration range 1 to 100 mg/l boron.
Interferences from dissolved H2S and CO2 can be eliminated by bubbling the acidified
sample.
Reference
Giggenbach and Goguel (1989).
Materials and Equipment
Pipettes, 5, 10 and 20 ml
Beakers, 150 ml
Magnetic stirrer with stirring bars
pH meter or autotitrator.
pH glass electrode
Spatula
Reagents and Standards
1 N NaOH stock solution: Weigh 40.08 g NaOH and dissolve in one litre DD water.
Alternatively, dilute one ampoule commercially available 1 N NaOH standard solution to
one litre in a volumetric flask.
0.02 N NaOH titrant: Dilute 20 ml 1.0 N NaOH stock solution to one liter with DD water.
Standardize with KC8H5O4 (Appendix I.A).
Mannitol Powder, AR.
Procedure
Pipette appropriate aliquot of acidified sample into a beaker.
Bubble the sample for 15 minutes with air or nitrogen (high purity). When using air to
remove the dissolved gases in the sample, scrub off atmospheric CO2 by passing air
through a 6 N caustic soda solution.
Measure pH and add NaOH to adjust pH to 7.30.
Add approximately 5 grams of mannitol powder with continuous stirring.
Titrate sample using standardized 0.02 N NaOH until pH 7.30. Record the volume of the
titrant used.
Calculation
Calculate boron expressed in mg/l using the formula:
mg/l B = V x N x 10810 S
Where:
N = normality of NaOH titrant
V = volume of NaOH used, ml
S = sample aliquot, ml
Quality Assurance/Quality Control
Ensure that working solutions are standardized.
Analyze the control sample/standard prior to analysis of samples and after every ten (10)
samples, or with each batch of samples, whichever is less. The value determined should
be within 5% of the known or expected concentration. Otherwise, all samples in the
batch should be reanalyzed.
Calibrate the pH electrode using at least two (2) buffers, whose pH should bracket the
expected pH of the sample. Slope should be within 0.95 to 1.05.
Analyze one set of duplicate samples for every ten samples (or with each batch of
samples, whichever is less). Acceptance limit for duplicate samples is 5%.
Perform buffer check after every ten (10) samples. Determined value should be 0.1 pH
unit of theoretical value. Otherwise, recalibrate the pH meter.
To one sample out of every ten (10) samples (or with each batch of samples, whichever is
less) add a known amount of the analyte of interest and reanalyze to confirm recovery.
Recovery of the added analyte should be between 95 and 105%. Otherwise, reanalyze the
whole batch.
BORON (ICP-ATOMIC EMISSION SPECTROMETRY)
ECGI, China
Scope
This test method covers the determination of boron (B) in filtered acidified samples by
ICP-atomic emission spectrometry (ICP-AES).
The applicable range of this method is from 0.05 to 100 mg/l when using the 249.77 nm
wavelength. This range may be extended upward by dilution of an appropriate aliquot of
sample.
References
American Public Health Association, American Water Works Association, Water
Environment Federation (1998). Atom Scan 16 Manual
Materials and Equipment
Inductively Coupled Plasma-Atomic Emission Spectrometer.
Volumetric flasks, 50, 100 , 250 and 1000 ml.
Volumetric pipettes, 1, 5 and 10 ml.
Reagent bottles, 50, 100, 250 and 1000 ml, polyethylene or boron-free
containers
Filter paper, with particle retention of 20-25 µm; Cellulose nitrate membranes (0.45 µm
pore size) are used to filter the sample using a vacuum filtration set-up.
Reagents and Standards
Nitric acid, HNO3, conc. and 1+1.
Argon: Use technical or welder grade. If gas appears to be a source of problems, use
prepurified grade.
1000 mg/l B stock solution
Stock boron solution: Dissolve 571.6 mg anhydrous boric acid, H3BO3, in distilled water
and dilute to 1000 ml ; 1.00 ml=100 g B. Because H3BO3 loses weight with drying at
1050C, use a reagent meeting ACS specifications and keep the bottle tightly stoppered to
prevent entrance of atmospheric moisture.
Standard boron solution: Dilute 10.00 ml stock boron solution to 1000 ml with distilled
water; 1.00 ml = 1.00 g B.
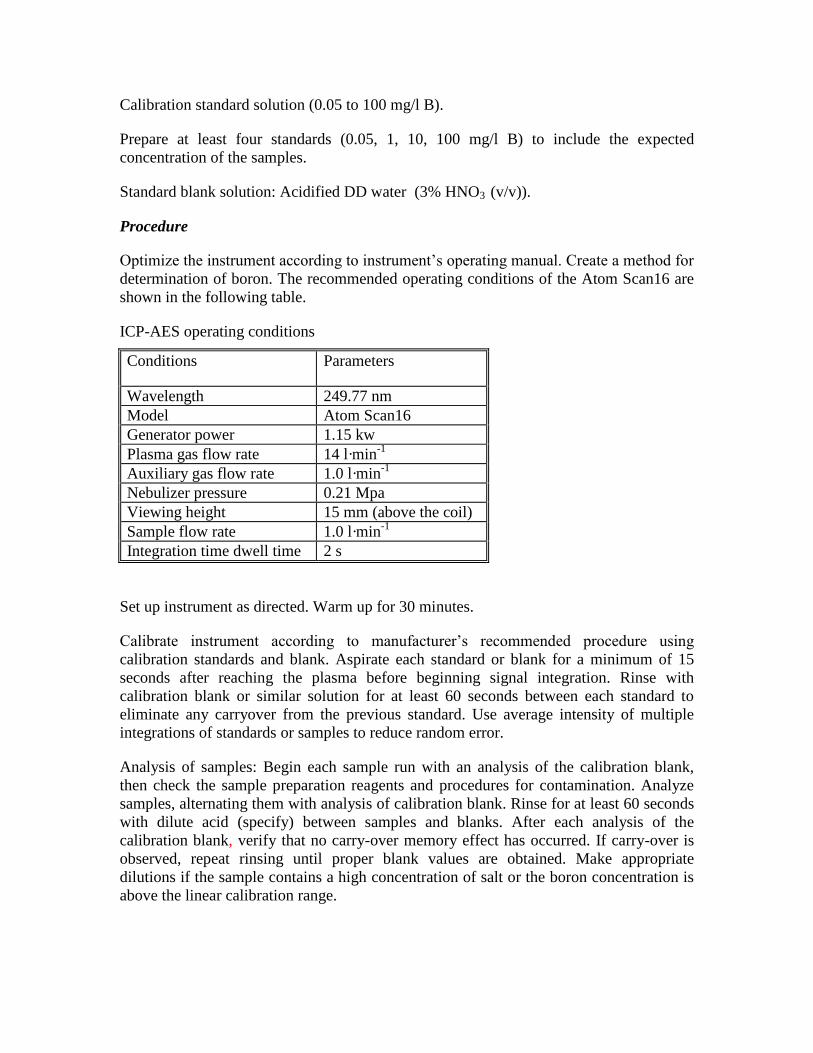
Calibration standard solution (0.05 to 100 mg/l B).
Prepare at least four standards (0.05, 1, 10, 100 mg/l B) to include the expected
concentration of the samples.
Standard blank solution: Acidified DD water (3% HNO3 (v/v)).
Procedure
Optimize the instrument according to instrument’s operating manual. Create a method for
determination of boron. The recommended operating conditions of the Atom Scan16 are
shown in the following table.
ICP-AES operating conditions
Conditions Parameters
Wavelength 249.77 nm
Model Atom Scan16
Generator power 1.15 kw
Plasma gas flow rate 14 l·min-1
Auxiliary gas flow rate 1.0 l·min-1
Nebulizer pressure 0.21 Mpa
Viewing height 15 mm (above the coil)
Sample flow rate 1.0 l·min-1
Integration time dwell time 2 s
Set up instrument as directed. Warm up for 30 minutes.
Calibrate instrument according to manufacturer’s recommended procedure using
calibration standards and blank. Aspirate each standard or blank for a minimum of 15
seconds after reaching the plasma before beginning signal integration. Rinse with
calibration blank or similar solution for at least 60 seconds between each standard to
eliminate any carryover from the previous standard. Use average intensity of multiple
integrations of standards or samples to reduce random error.
Analysis of samples: Begin each sample run with an analysis of the calibration blank,
then check the sample preparation reagents and procedures for contamination. Analyze
samples, alternating them with analysis of calibration blank. Rinse for at least 60 seconds
with dilute acid (specify) between samples and blanks. After each analysis of the
calibration blank, verify that no carry-over memory effect has occurred. If carry-over is
observed, repeat rinsing until proper blank values are obtained. Make appropriate
dilutions if the sample contains a high concentration of salt or the boron concentration is
above the linear calibration range.
Calculation
Calculate concentration of boron (mg/l) in a sample by referring to the calibration curve.
This step can be run automatically by instrumental software. The results can be printed or
displayed directly.
Subtract the result for an adjacent calibration blank from each sample result to make a
baseline drift correction.
If the sample was diluted or concentrated in preparation, multiply results by a dilution
factor (DF) calculated as follows:
mg/l B = Concentration × DF
Where:
DF = final volume/initial volume
Quality Assurance/Quality Control
Analyze instrument check standard once per 10 samples to determine if significant
instrument drift has occurred. If agreement is not within ±5% of the expected values (or
within the established control limits, whichever is lower), terminate the analysis of the
samples, correct the error, and recalibrate the instrument.
Correct for spectral interference by using computer software supplied by the instrument
manufacturer.
If non-spectral interference correction is necessary, use the method of standard additions.
It is applicable when the chemical and physical form of the element in the standard
addition is the same as in the sample, or the ICP converts the metal in both sample and
addition to the same form. The interference effect is independent of metal concentration
over the concentration range of standard additions; and the analytical calibration curve is
linear over the concentration range of standard additions.
Reanalyze one sample analyzed just before the termination of the analytical run. Results
should agree to within ±5%, otherwise all samples analyzed after the last acceptable
instrument check standard analysis must be reanalyzed.
If the concentration of boron is greater than 100 mg/l, use serial dilution with calibration
blank. Results from the analyses of a dilution should be within ±5% of the original result.
Alternatively, or if the concentration is either below 1 mg/l or not detectable, use a post-
digestion addition equal to 1 mg/l. Recovery of the addition should be either between
95% and 105% or within established control limits of ±2 standard deviations around the
mean.

Analyze the blank and control standard/sample before the samples. The control standard
is prepared separately from the calibration standards. The value determined for the
control standard/sample should be within ±5% of the known or expected concentration.
To one sample out of every ten (10) samples (or with each batch of samples, whichever is
less) add a known amount of the analyte of interest and reanalyze to confirm recovery.
Recovery of the added analyte should be between 95 and 105%. Otherwise, reanalyze the
whole batch.
BORON (ICP-MASS SPECTROMETRY)
BRIUG, China
Scope
This test method covers the determination of boron in filtered acidified samples by high
resolution inductively coupled plasma mass spectrometry (HR-ICP-MS).
The applicable range of this test method is from 0.05 to 100 mg/l when using the HR-
ICP-MS. This range may be extended upward by dilution of an appropriate aliquot of
sample.
For the determination of boron in a filtered aqueous sample aliquot where the total
dissolved salt content of the sample is <1000mg/l, the sample is made ready for analysis
by the appropriate addition of nitric acid, and then diluted to a predetermined volume and
mixed before analysis.
The method comprises the determination of a trace element by ICP-MS, (EPA METHOD
200.8, Revision 5.4). Sample material in solution is introduced by pneumatic nebulization
into radio frequency plasma where energy transfer processes cause desolvation,
atomization and ionization. The ions are extracted from the plasma through a
differentially pumped vacuum interface and separated on the basis of their mass-to-
charge ratio by a double focusing magnetic sector mass spectrometer having a maximum
resolution capability of 7500. The ions transmitted through the mass analyzer are
detected by an electron multiplier and the ion information processed by a data handling
system. Interferences relating to the technique must be recognized and corrected for.
Such corrections must include compensation for isobaric elemental interferences and
interferences from polyatomic ions derived from the plasma gas, reagents or sample
matrix. Instrumental drift as well as suppression or enhancement of instrument response
caused by the sample matrix must be corrected for by the use of internal standards. The
determination of boron is not specifically described in EPA METHOD 200.8, but the
general requirements described including definitions, safety, pollution prevention, waste
management and references are suitable for this procedure.
References
Keith (1996, EPA METHOD 200.8, Revision 5.4).
Materials and Equipment
High resolution inductively coupled plasma mass spectrometer, R 900, concentric
nebulizer for boron, peristaltic sampling pump.
Multi-parameter electric conductivity meter, for total salt content ranging from 0.1 to
1999 mg/l.
Volumetric flasks, 50 ml, 100 ml, 1000 ml (HDPE)
Pipettes
Reagent bottles, 50 ml, 100 ml, 1000 ml (HDPE)
Reagents and Standards
Deionized water with a specific resistance of 17.8 megaohm – cm or greater
Concentrated nitric acid, HNO3, high-grade reagent.
Nitric acid, 2%: 20 ml concentrated nitric acid diluted to 1000 ml with deionized water.
Boron stock standard solution, 1000 mg/l
Commercial boron standard solution for ICP-MS.
Scandium stock standard solution, 10 mg/l
Commercial scandium standard solution for ICP-MS.
Working standard solution (0.05 to 100 mg/l B)
Prepare at least four standards (0.05, 1, 10, 100 mg/l B) to bracket the expected B
concentrations of the samples. All standards are prepared in 2% HNO3 containing 0.050
mg/l Sc.
Standard blank solution / internal standard solution
0.050 mg/l Sc interior standard solution is prepared using scandium stock standard
solution (4.5) and 2% HNO3 (4.3). The internal standard solution is the same as the
standard blank solution.
Quality control samples
Quality control (QC) samples are preferably portions of one or more geothermal water
samples or artificial geothermal water standard samples (boron content ranging from 0.05
to 100 mg/l) that are stable and representative of the samples of interest. These QC
samples can be used to check the validity of the testing process as described in section 7.
All quality control samples are prepared in 2% HNO3 containing 0.050 mg/l Sc prior to
analysis.
Procedure
Check the total salt content of the samples using a multi-parameter electric conductivity
meter (3.2). If the total salt of a sample is higher than 1000 mg/l, dilute the sample to
make sure the total salt content of the sample is below 1000 mg/l. All samples after such
check are prepared in 2% HNO3 containing 0.050 mg/l Sc prior to analysis.
Optimize the instrument according to the instrument’s operation manual. The isotope of 11
B is selected for measurement.
Run the standard blank solution and working standard solutions to establish the
calibration curve for boron using the interior standard calibration method, which is
offered by most ICP-MS systems. The first order linearity of the standard calibration
curve should be such that r20.999.
Run QC samples to check the performance. If the results are within the control limits, go
on the next batch of samples. Any out-of control data should trigger investigation for root
cause(s).
Run filtered acidified samples and read their concentrations. Wash the sample
introduction system for at least 2 minutes using 2% HNO3 between sample introductions.
Note 1: In the procedure, a level of 0.050mg/l Sc as internal standard is added to all
samples, standards and QC samples to give 5×10⁵ or more cps signal.
Note 2: In the procedure, safety, pollution prevention and waste management should be
handled as described in EPA METHOD 200.8 (200.8-8, 200.8-29).
Calculation
Calculate the concentration of boron (mg/l B) in a sample by referring to the calibration
curve. This step can be carried out automatically by most ICP-MS systems. The results
can be printed or displayed directly.
For diluted samples, calculate original concentration of boron in the samples (mg/l B)
using:
Original concentration (mg/l B) = concentration dilution factor
Quality Assurance / Quality Control
Confirm the performance of the instrument or the best procedure by
Analyzing a QC sample
Prior to monitoring the measurement process, the user of the test method needs to
determine the average value and control limits of the QC samples.
It is recommended that, if possible, the type of QC sample that is regularly tested be
representative of the material routinely analyzed. An ample supply of QC sample
material should be available for the intended period of use, and must be stable under the
anticipated storage conditions.
Boron concentration in all reagents should be at minimum. Any cross contamination
among samples or standards should be avoided. Chemical preparation should take place
in clean room.
In order to avoid the interference of 21,22
Ne++
from argon gas in samples, the resolution of
ICP-MS should be greater than 900.
Analyze one set of duplicate samples for every ten samples (or with each batch of
samples, whichever is less). Every ten samples should include one QC sample (4.8) in the
sample sequence analysis. Acceptance limits for duplicate samples or QC samples is
20% for low levels and 10% for high levels. Any out-of control data should trigger
investigation for root cause(s).
To one sample out of every five samples (or with each batch of samples, whichever is
less) add a known amount of the standard and reanalyze to confirm recovery. Recovery
of standard should be between 95 and 105%. Otherwise, reanalyze the whole batch.
BORON (SPECTROPHOTOMETRIC WITH CARMINE)
PNOC EDC CCLS, Philippines
Scope
This method is applicable to acidified water samples containing 1.0-10 mg/l boron.
The test method is based on the color development of carmine or carminic acid in
concentrated sulfuric acid, in the presence of boron, from bright red to bluish red or blue,
which can be analyzed spectrophotometrically at 585 nm.
Silica, fluoride, nitrate and phosphate interfere to some extent.
Reference
American Public Health Association, American Water Works Association, Water
Environment Federation (1995).
Materials and Equipment
UV-visible spectrophotometer
Test tubes, 50 ml
Volumetric flasks, 50 ml, polyethylene
Pipettes, 5 and 10 ml
Filter paper, ashless hardened rapid (e.g. Whatman 541)
Reagents and Standards
Hydrochloric acid, AR, HCl, conc.
Sulfuric acid, AR, H2SO4, conc.
Carmine solution: Dissolve 920 mg carmine NF 40, or carminic acid, in 1.0 l con. H2SO4.
Prepare under a hood. Store solution in a polyethylene container.
Working standard solutions (1.0 to 10.0 mg/l B): Prepare at least four standards to
bracket the expected concentration of the samples.
Procedure
Pipette 2 ml standards and samples into 50 ml test tubes.
Add 2 drops conc. HCl.
Carefully introduce 10 ml conc. H2SO4. Mix and allow to cool to room temperature.
Carefully add 5 ml carmine solution. Mix well. Leave solution for 45-60 minutes.
Prepare a reagent blank by treating a 2 ml aliquot of DD water.
Switch on UV-Vis spectrophotometer and allow to warm up for at least 30 mins.
Measure the absorbance of the standards and samples at 585 nm against the reagent
blank.
Calculation
Read boron concentration in mg/l directly from the instrument or prepare standard
calibration curve to read the sample concentration.
For diluted samples, calculate the original concentration using:
mg/l B = concentration x dilution factor
Quality Assurance/Quality Control
Always include reagent and sample blanks in the analysis.
Standard concentrations should bracket the sample concentrations and should be within
the working range. Dilute samples if necessary.
Absorbance values should be within the acceptable working range, as specified in the
manufacturer’s manual.
Check that the first order linearity of the standard calibration curve has r2 0.995.
Ensure that the absorbance to concentration ratio of the calibration standards is consistent
within 95% confidence range of previously established values. Discard standards, which
deviate from acceptable ratio.
Analyze the reagent blank and control standard/sample before analyzing samples. The
control standard is a separate preparation from the calibration standards. The value
determined for the control sample should be within 10% of the known or expected
concentration.
Analyze samples in duplicate. Acceptance limit is 10%.
Analyze the reagent blank, check standard and control sample/standard after every five
samples, or with each batch of samples, whichever is less. The check standard is chosen
from one of the calibration standards. The determined values should be within 10% of
the known or expected concentration. Otherwise, all samples in the batch should be
reanalyzed.
To one sample out of every five samples (or with each batch of samples, whichever is
less) add a known amount of the standard and reanalyze to confirm recovery. Recovery
of standard should be between 90 to 110%. Otherwise, reanalyze the whole batch.
Check that the result has been multiplied by the dilution factor if dilution was needed.
BORON (SPECTROPHOTOMETRIC WITH CURCUMIN)
ICE, Costa Rica
Scope
This method covers the determination of boron (B) in filtered and unfiltered samples by
means of UV-Vis spectrophotometry.
The method is based on the formation of a complex between boron and curcumine in
concentrated sulfuric – acetic acids, which can be analyzed spectrophotometrically at 540
nm. The applicable range of this method is from 0.1 to 2.0 mg/l. This range may be
extended upward by dilution of an appropriate aliquot of sample.
Nitrite interferes in concentrations above 3 mg NO2/l.
References
American Public Health Association, American Water Works Association and Water
Environment Federation (1998); Barbolani Piccardi (1973).
Materials and Equipment
Spectrophotometer UV-Vis.
Polyethylene beakers, 50 ml.
Pipettes, 1-25 ml.
Volumetric flasks, 100 ml, 1 l.
Micropipette 100 – 1000 l
Reagents and Standards
Concentrated sulfuric acid, H2SO4.
Glacial acetic acid, HAc.
Curcumin solution: Weigh 0.125 g of curcumin reagent, dissolve and dilute to 100 ml
with glacial acetic acid. Since this curcumin solution is unstable, it is recommended to
prepare only the amount necessary for the analysis.
“Acid” reagent: Mix equal volumes of concentrated H2SO4 and glacial HAc.
Ammonium acetate-glacial acetic acid reagent: Dissolve 25 g of ammonium acetate in
DD water, add 30 ml of glacial HAc and dilute to 100 ml with DD water.
1000 or 100 mg/l, B stock solution: For the 1000 mg/l B stock solution, dilute one
ampoule of commercially available 1000 mg/l B standard to one liter with the appropriate
solvent (DD water or 0.1 mole/l HCl, follow the manufacturer’s instructions).
Alternatively, dissolve 0.5720 g of anhydrous boric acid, H3BO3, in DD water and dilute
to 1000 ml to give a 100 mg/l stock solution.
Working standard solutions (0.1 – 2.0 mg/l B): Prepare at least four standards to bracket
the expected concentration of the samples.
Amidosulfuric acid (H2NSO3H) 6% solution: Dissolve 6.0 g of amidosulfuric acid
reagent – grade in 100 ml of DD water.
Procedure
Optimize the instrument according to instrument’s operating manual.
Make a suitable dilution of samples with high B content, so that the concentration falls
within the working range.
For nitrite concentration of the sample > 3 mg/l:
Pipette a 20.0 ml aliquot of sample into a 25 ml volumetric flask.
Add 4.0 ml of a 6 % amidosulfuric acid solution.
Wait for 4-6 minutes and then dilute to the mark with DD water.
Pipette a 0.5 ml aliquot each of the blank, standards and samples into 50 ml plastic
beakers.
Add 3.0 ml of the curcumin solution. Mix well.
Add 3.0 ml of the acid reagent. Mix well.
Leave the solutions for 1 hr.
After 1 hour. , add 15.0 ml of the ammonium acetate – glacial acetic acid solution.
Read the spectrophotometer at 540 nm.
Calculation
Calculate the concentration of B (mg/l) by referring to the calibration curve.
For diluted samples, calculate the original concentration of B using:
mg/l B = concentration x dilution factor.
Quality Assurance/Quality control
Always include reagent and sample blanks in the analysis.
Standard concentrations should bracket the sample concentrations and should be within
the working range. Dilute samples accordingly.
Absorbance values should be within the acceptable working range.
Check that the first order linearity of the calibration curve has r2 0.999
Analyze the blank and control standard/sample before analyzing samples.
Analyze the reagent blank; check standard after every ten samples, or with each batch of
samples, whichever is less. The check standard is chosen from one of the calibration
standards, while the control standard/sample is a separate preparation. The determined
value should be within 5% of the known or expected concentration. Otherwise, all
samples in the batch should be reanalyzed.
To one sample out of every five samples (or with each batch of samples, whichever is
less) add a known amount of the standard and reanalyze to confirm recovery. Recovery
of standard should be between 90 to 110%. Otherwise, reanalyze the whole batch.
BORON (SPECTROPHOTOMETRIC WITH AZOMETHINE-H)
PNOC EDC Philippines
Scope
This method is applicable to untreated water samples containing 0.10-10-mg/l boron.
The test method is based on the complexation of boron with azomethine-H to form a
yellow complex, which can be analyzed Spectrophotometrically at 410 nm.
EDTA in buffer solution is used as masking agent to eliminate interferences from
complexing metals.
References
Cogbill and Yoe (1955); Krug et al. (1981);
Edwards (1980); Kirst and Rump (1992); Shucker et al. (1975).
Materials and Equipment
UV-visible spectrophotometer
Volumetric flasks, 50 ml, PE
Volumetric pipettes, 5 and 10 ml
Filter paper, ashless hardened rapid (e.g. Whatman 541)
Filter paper, 0.45, (Whatman 5 or equiv.)
Erlenmeyer flask, 50 ml, polyethylene
Reagents and Standards
Glacial acetic acid, AR, C2H4O2
Ammonium acetate, AR, C2H7NO2
EDTA disodium salt, AR, C10H18N2Na2O10
Ascorbic acid, AR, C6H8O6
Buffer solution, pH 5.9: Dissolve 3.0 g EDTA disodium salt in 75 ml DD water. Add 125
ml glacial acetic acid and 250 g ammonium acetate. Stir and gently heat to dissolve all
solids. Prepare solution under a fume hood.
Azomethin H powder, AR, C17H12NNaO8S2
Azomethine-H reagent: Dissolve 0.98 g Azomethin H powder in 80 ml cold DD water.
Add 1.0 g ascorbic acid and stir. Filter the solution and adjust its volume to 200 ml.
Store in amber PE container and keep cool in a refrigerator. Prepare fresh solution daily.
Working standard solutions (0.10 to 3.00 mg/l B): Prepare at least four standards to
bracket the expected concentration of the samples.
Procedure
Filter samples.
Pipette 15 ml standards and samples into 50 ml polyethylene Erlenmeyer flasks.
Add 5 ml buffer solution and 5 ml azomethine-H reagent. Mix well and allow to stand for
1 hour.
Prepare a reagent blank by treating 15 ml aliquot of DD water.
When necessary to correct for turbidity, treat 15 ml of sample with buffer solution only.
Switch on UV-VIS spectrophotometer and allow to warm up for at least 30 mins
Measure the absorbance of the standards and samples at 410 nm against the reagent
blank.
Calculation
Read boron concentration in mg/l directly from the instrument or prepare standard
calibration curve to read the sample concentration.
For diluted samples, calculate the original concentration using:
mg/l B = concentration x dilution factor
For turbidity correction, subtract corresponding turbidity blank concentration from
sample concentration.
Quality Assurance/Quality Control
Always include reagent and sample blanks in the analysis.
Standard concentrations should bracket the sample concentrations and should be within
the working range. Dilute samples if necessary.
Absorbance values should be within the acceptable working range, as specified in the
manufacturer’s manual.
Check that the first order linearity of the standard calibration curve has r2 0.999.
Ensure that the absorbance to concentration ratio of the calibration standards is consistent
within 95% confidence range of previously established values. Discard standards, which
deviate from the acceptable ratio.
Analyze the reagent blank and control standard/sample before analyzing samples. The
control standard is a separate preparation from the calibration standards. The determined
value of the control sample should be within 5% of the known or expected
concentration.
Analyze samples in duplicate. Acceptance limit is 5%.
Analyze the reagent blank, check standard and control sample/standard after every five
samples, or with each batch of samples, whichever is less. The check standard is chosen
from one of the calibration standards. The determined values should be within 5% of the
known or expected concentration. Otherwise, all samples in the batch should be
reanalyzed.
To one sample out of every five samples (or with each batch of samples, whichever is
less) add a known amount of the standard and reanalyze to confirm recovery. Recovery
of standard should be between 95 and 105%. Otherwise, reanalyze the whole batch.
Check that the result has been multiplied by the dilution factor if dilution was needed.
BORON (ATOMIC ABSORPTION SPECTROPHOTOMETRY)
GESAL, El Salvador
Scope
This test method covers the determination of boron (B) usually present in geothermal
waters, in filtered acidified samples (pH 1.2-1.5) by atomic absorption spectrophotometry
(AAS). The applicable range for this method is from 30 to 300 mg/l when using the 249.8
nm wavelength.
In flame atomic absorption spectrophotometry, a sample is aspirated into a flame and
atomized. A light beam is directed through the flame in a monochromator, and into a
detector where the amount of light absorbed by the atomized element in the flame is
measured. For some metals, atomic absorption exhibits superior sensitivity over flame
emission. Since each metal has its own characteristic absorption wavelength, a source
lamp composed of that element is used; this makes the method relatively free from
spectral or radiation interferences. The amount of energy at the characteristic wavelength
absorbed in the flame is proportional to the concentration of the element in the sample
over a limited concentration range.
Sodium has been found to cause interference when the ratio of sodium to boron is very
high. The effect is usually minimized by adjusting the flame to neutral stoichiometry (red
cone 0.5-1 cm high) with consequent loss of sensitivity.
References
American Public Health Association, American Water Works Association, Water
Environment Federation (1995); Skoog and Leary (1994).
Materials and Equipment
Atomic absorption spectrophotometer.
Boron hollow cathode lamp
Volumetric flasks, 50, 100 and 200 ml.
Volumetric pipettes 2, 5 and 10 ml.
500 ml plastic flasks.
Filter paper, Whatman No. 42
Pumping system to introduce and automatically dilute sample (SIPS)
Reagents and Standards
Concentrated nitric acid, HNO3
Acetylene gas with purity of at least 98.0 % vol.: Acetone is always present in acetylene
cylinders and can be prevented from entering and damaging the burner system by
replacing a cylinder when only 80-psig acetylene remain.
Air compressor, cleaned and dried through a suitable filter to remove oil, water, and other
foreign substances.
Nitrous oxide gas with purity of at least 99.2 %.
Fit nitrous oxide cylinder with a special nonfreezable regulator or wrap a heating coil
around an ordinary regulator to prevent flashback at the burner caused by a reduction in
nitrous oxide flow through a frozen regulator.
Acidified DD water: Add 10 ml concentrated HNO3, AR, for every 500 ml DD water.
Boron acidified standard solution of 1000 mg/l:
Boron stock solution may be purchased as certified solution or prepared as described
below: Do not dry but keep bottle tightly stoppered and store in a desiccator. Dissolve
0.5716 g anhydrous H3BO3 in water and dilute to 1000 ml; 1ml = 100 µg B.
Working standard solutions (50.0 to 200 mg/l of boron): Prepare at least four standards to
bracket the expected concentration of the samples.
Standard blank solution: Add 2 ml concentrated HNO3 to 100 ml DD water
Procedure
Optimize the instrument according to instrument’s operating manual (follow the safety
guidelines specified by the equipment manufacturer).
Wash the sample auto dilution system to eliminate any type of contaminants in the whole
pumping system. Also wash the burner and nebulizer.
Verify the sensitivity and stability of the signal using the highest concentration standard
prepared for the calibration curve, (e.g. for a wavelength of 249.8 nm one 400 mg/l
standard must read 0.2 of absorbance).
When signal is stable, proceed to set instrument to zero absorbance and then prepare the
calibration curve manually with the help of a sample dilution system. This means that the
equipment will read the blank and then the standards from smaller to greater
concentration and the equipment program will subtract the blank absorbance from each
standard until a calibration curve of linear type is obtained. In the auto dilution system
program there is a washing step after the completion of the calibration curve.
In case the auto dilution system program is not present, proceed to prepare standards of
50, 100, 150, and 200 mg/l and generate the calibration curve.
After the calibration read the values for the standards.
Read values for one control standard/sample and fourteen samples. Rinse the system after
every sample reading.
If the concentration of a sample is out of range of the calibration curve, introduce to the
auto dilution program a suitable dilution factor. If an auto dilution system is not available,
choose the respective dilutions.
Recalibrate the system after fourteen samples.
Calculations
Read mg/l B from the calibration curve.
For diluted samples, calculate original mg/l B using:
mg/l B = boron concentration x dilution factor
Quality Assurance/Quality control
All samples must be filtered and acidified in advance to keep the analytes in solution.
Always include reagent and sample blanks in the analysis.
Standard concentrations should bracket the sample concentrations and should be within
the working range. Dilute samples if necessary.
Absorbance values should be within the acceptable working range, as specified in the
manufacturer's manual.
Check that the first order linearity of the standard calibration curve has r2 0.999.
Analyze the control standard/sample before analyzing samples. The control standard is a
separate preparation from the calibration standards. The percentage difference between
the concentration value determined by the equipment and the theoretical one must be
within ± 5%.
Recalibrate the equipment after every fourteen samples. Analyze the control
standard/sample after recalibration verifying the percentage difference between the
theoretical and obtained values. If the results are out of range, a new calibration must be
carried out.
To one sample out of every five samples (or with each batch of samples, whichever is
less) add a known amount of the standard and reanalyze to confirm recovery. Recovery
of standard should be between 95 and 105%. Otherwise, reanalyze the whole batch.
CALCIUM (ATOMIC ABSORPTION SPECTROPHOTOMETRY)
PNOC EDC, Philippines
Scope
This test method covers the determination of calcium (Ca) in filtered acidified samples by
atomic absorption spectrophotometry (AAS).
The applicable range of this test method is from 0.2 to 20 mg/l when using the 422.7 nm
wavelength. This range may be extended upward either by dilution of an appropriate
aliquot of sample or rotating the burner head.
Lanthanum oxide is added to arrest interferences such as from sulfate, phosphate,
aluminum, silica and nitrate.
References
American Public Health Association, American Water Works Association and Water
Environment Federation (1995); American Society for Testing and Material (1995b).
Materials and Equipment
Atomic absorption spectrophotometer
Ca hollow cathode lamp
Volumetric flasks, 50 and 100 ml
Automatic dispenser
Pipettes, 1-10 ml
Erlenmeyer flasks, 50 ml, preferably plastic.
Reagent bottles, 1 l and 250 ml, plastic
Filter paper, with particle retention of 20-25 µm
Reagents and Standards
Concentrated hydrochloric acid, HCl
50% nitric acid, HNO3: Mix equal volumes of DD water and concentrated HNO3.
50 mg/l La as lanthanum oxide, La2O3: Wet 58.7 g La2O3, AR, in DD water. Add 250 ml
of concentrated HCl slowly to the mixture. When dissolved, dilute to 1000 ml with DD
water.
Acetylene gas with purity of at least 99.5 vol %: Acetone, which is always present in
acetylene cylinders, can be prevented from entering and damaging the burner system by
replacing a cylinder when only 75-psig acetylene remain.
Compressed air is cleaned and dried by passing it through a suitable filter to remove oil,
water, and other foreign substances.
Acidified DD water: Add 1 ml concentrated HNO3, AR, for every liter DD water.
1000 mg/l Ca stock solution: Dry about 3 g CaCO3 to constant weight at 105ºC. Suspend
2.497 g CaCO3 in DD water and dissolve cautiously with a minimum amount of 50%
HNO3. Add 10 ml concentrated HNO3 and dilute to 1 liter. Alternatively, dilute one
ampoule of commercially available 1000 mg/l Ca standard with acidified DD water.
Working standard solutions (0.20 to 20 mg/l Ca): Prepare at least four standards to
bracket the expected concentration of the samples.
Standard blank solution: Add 1 ml La2O3 suppressant for every 10 ml acidified DD
water.
Procedure
Optimize the instrument according to instrument’s operating manual.
Dilute samples with high Ca so that the concentration falls within the standard calibration
curve. Pipette 10 ml of the sample to a 50 ml Erlenmeyer flask and add 1 ml La2O3. Mix
well.
Aspirate the reagent blank and zero the instrument.
Aspirate each standard in turn into the flame and record the absorbance. Aspirate
acidified DD water between standards.
Aspirate samples and read the absorbance. Atomize acidified DD water between samples.
Calculation
Calculate mg/l Ca by referring to the calibration curve.
For diluted samples, calculate original mg/l Ca using:
mg/l Ca = concentration x dilution factor
Quality Assurance/Quality Control
Acidified DD water must be used in the preparation of samples/standards.
Always include reagent and sample blanks in the analysis.
Add suppressant to blanks, standards and samples.
Standard concentrations should bracket the sample concentrations and should be within
the working range. Dilute samples if necessary.
Absorbance values should be within the acceptable working range, as specified in the
manufacturer’s manual.
Check that the first order linearity of the standard calibration curve has r2 0.999.
Analyze the blank and control standard/sample before analyzing samples. The control
standard is a separate preparation from the calibration standards. The value determined
for the control standard/sample should be within 5% of the known or expected
concentration.
Analyze one set of duplicate samples for every ten samples (or with each batch of
samples, whichever is less). Acceptance limits for duplicate samples is 15% for low
levels and 5% for high levels.
Analyze the reagent blank, check standard and control sample/standard after every ten
samples, or with each batch of samples, whichever is less. The check standard is chosen
from one of the calibration standards, while the control standard/sample is a separate
preparation. The value determined should be within 5% of the known or expected
concentration. Otherwise, all samples in the batch should be reanalyzed.
To one sample out of every ten samples (or with each batch of samples, whichever is
less) add a known amount of the metal of interest and reanalyze to confirm recovery.
Recovery of the added metal should be between 95 and 105%. Otherwise, reanalyze the
whole batch.
Check that the result has been multiplied by the dilution factor if dilution was needed.
CALCIUM (ICP-ATOMIC EMISSION SPECTROMETRY)
ECGI, China
Scope
This test method covers the determination of calcium (Ca) in filtered acidified samples by
ICP-atomic emission spectrometry (ICP-AES).
The applicable range of this method is from 0.025 to 500 mg/l when using the 317.93 nm
wavelength.
The sample is introduced into the instrument as a stream of liquid that is converted inside
the instrument into an aerosol and then transported to the plasma where it is vaporized,
atomized, and ionized. The excited atoms and ions emit their characteristic radiation,
which is collected and sorted by wavelength. The radiation is detected and turned into
electronic signals that are converted into concentrations.
The sample matrix can cause physical interferences and total salt concentrations of more
than 0.5 % might cause ionization and viscosity interferences.
References
American Public Heath Association, American Water Works Association and Water
Environment Federation (1998); ICP-AES. instrument operating manual.
Materials and Equipment
Inductively Coupled Plasma-Atomic Emission Spectrometer.
Volumetric flasks, 50, 100 and 250 ml.
Pipettes, 1, 5 and 10 ml.
Reagent bottles, 250 and 1000 ml.
Filter paper, with particle retention of 20-25 µm; Cellulose nitrate membranes (0.45 µm
pore size) are used to filter the sample using vacuum filtration set-up.
Reagents and Standards
Nitric acid, HNO3, conc. and 1+1.
Argon: Use technical or welder grade. If gas appears to be a source of problems, use
prepurified grade.
1000 mg/l Ca stock solution
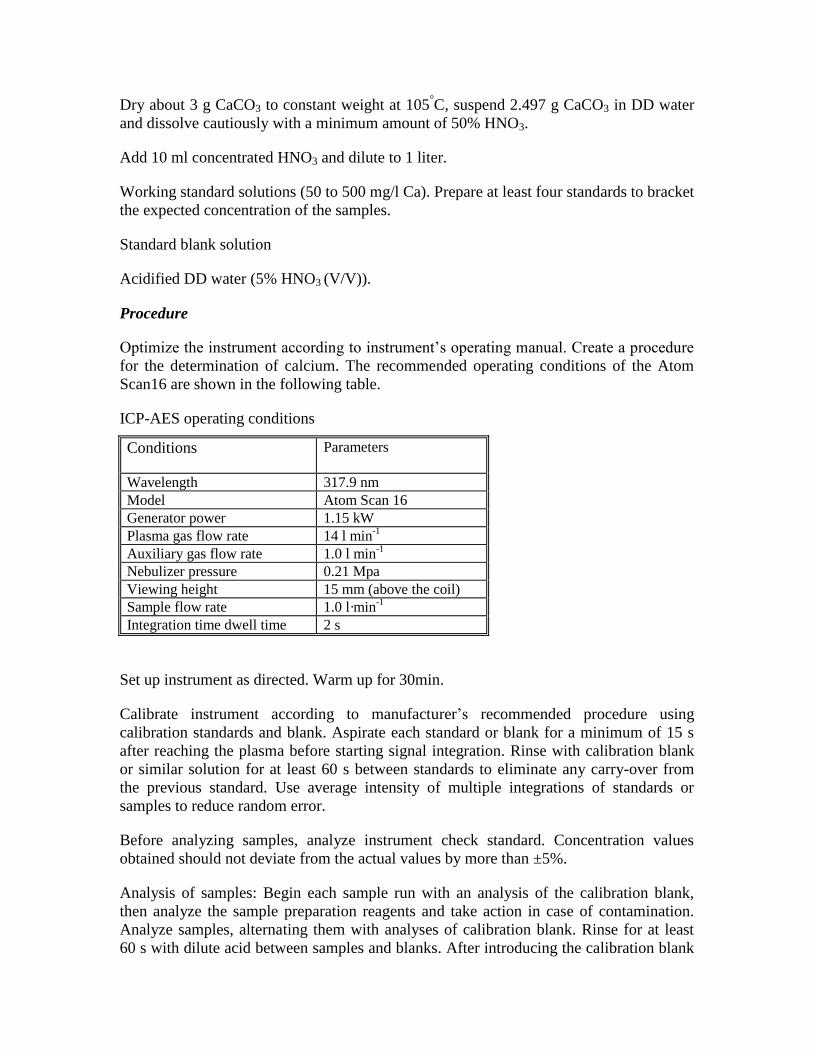
Dry about 3 g CaCO3 to constant weight at 105°C, suspend 2.497 g CaCO3 in DD water
and dissolve cautiously with a minimum amount of 50% HNO3.
Add 10 ml concentrated HNO3 and dilute to 1 liter.
Working standard solutions (50 to 500 mg/l Ca). Prepare at least four standards to bracket
the expected concentration of the samples.
Standard blank solution
Acidified DD water (5% HNO3 (V/V)).
Procedure
Optimize the instrument according to instrument’s operating manual. Create a procedure
for the determination of calcium. The recommended operating conditions of the Atom
Scan16 are shown in the following table.
ICP-AES operating conditions
Conditions Parameters
Wavelength 317.9 nm
Model Atom Scan 16
Generator power 1.15 kW
Plasma gas flow rate 14 l min-1
Auxiliary gas flow rate 1.0 l min-1
Nebulizer pressure 0.21 Mpa
Viewing height 15 mm (above the coil)
Sample flow rate 1.0 l·min-1
Integration time dwell time 2 s
Set up instrument as directed. Warm up for 30min.
Calibrate instrument according to manufacturer’s recommended procedure using
calibration standards and blank. Aspirate each standard or blank for a minimum of 15 s
after reaching the plasma before starting signal integration. Rinse with calibration blank
or similar solution for at least 60 s between standards to eliminate any carry-over from
the previous standard. Use average intensity of multiple integrations of standards or
samples to reduce random error.
Before analyzing samples, analyze instrument check standard. Concentration values
obtained should not deviate from the actual values by more than ±5%.
Analysis of samples: Begin each sample run with an analysis of the calibration blank,
then analyze the sample preparation reagents and take action in case of contamination.
Analyze samples, alternating them with analyses of calibration blank. Rinse for at least
60 s with dilute acid between samples and blanks. After introducing the calibration blank
each time verify that no carry-over memory effect has occurred. If carry-over is observed,
repeat rinsing until proper blank values are obtained. Make appropriate dilutions if the
sample contains a high concentration of salt or the calcium concentration is beyond the
linear calibration range.
Calculation
Calculate concentration of calcium (mg/l) in a sample by referring to the calibration
curve. This step can be run automatically by instrumental software. The results can be
printed or displayed directly.
Subtract the result for an adjacent calibration blank from each sample result to make a
baseline drift correction.
If the sample was diluted or concentrated in preparation, multiply results by a dilution
factor (DF) calculated as follows:
Quality Assurance/Quality Control
Analyze instrument check standard once per 10 samples to determine if significant
instrument drift has occurred. If agreement is not within ±5% of the expected values (or
within the established control limits, whichever is lower), terminate analysis of samples,
correct problem, and recalibrate instrument.
Correct for spectral interference by using computer software supplied by instrument
manufacture.
If non-spectral interference correction is necessary, use the method of standard additions.
It is applicable when the chemical and physical form of the element in the standard
addition matrix is the same as in the sample or when the ICP converts the metal in both
sample and addition matrix to the same form. The interference effect is independent of
metal concentration over the concentration range of standard additions; and the analytical
calibration curve is linear over the concentration range of standard additions.
Reanalyze one sample analyzed just before termination of the analytical run. Results
should agree to within ±5%, otherwise all samples analyzed after the last acceptable
instrument check standard analysis must be reanalyzed.
To one sample out of every ten samples (or with each batch of samples, whichever is
less) add a known amount of the metal of interest and reanalyze to confirm recovery.
Recovery of the added metal should be between 95 and 105%. Otherwise, reanalyze the
whole batch.
CALCIUM (TITRIMETRIC WITH EDTA)
ICE, Costa Rica
Scope
This method covers the determination of calcium Ca in filtered acidified samples by
means of titration with EDTA. The endpoint of the titration is determined by means of a
Ca+2
ion selective electrode.
The applicable range of this method is from 10 – 100 mg/l. This range may be extended
upward by dilution of an appropriate aliquot of sample.
Magnesiun in concentrations above 2 mg/l interferes if the pH is not adjusted properly.
Reference
American Public Health Association, American Water Works Association and Water
Environment Federation (1998).
Materials and Equipment
Autotitrator (Radiometer Tim 900).
Calcium ion selective electrode
Reference electrode.
Pipettes 1, 2, 10, 25 ml
Volumetric flasks, 100, 500 and 1000 ml.
Beakers, 50 ml
Reagents and Standards
EDTA disodium salt 0.01 mole/l. Weigh 3.75 g of reagent-grade disodium
ethylenediaminetetraacetate dihydrate, C10H14N2Na2O82H2O, MW 372.24, dissolve in
distilled water and dilute to 1000 ml. Standardize against a standard calcium solution as
described in 4.3.
Buffer solution, ammonium chloride - ammonia. Dissolve 6.75 g of ammonium chloride,
NH4Cl, in 57 ml of concentrated ammonium hydroxide, NH4OH (d = 0.90 g/ml), and
dilute to 100 ml with distilled water.
Calcium standard solution, 0.008 mole/l. Weigh 0.4000 g of anhydrous calcium
carbonate (volumetric standard grade). Transfer the solid to a 500 ml volumetric flask
using 100 ml of distilled water, add drop wise 1 + 1 HCl until all CaCO3 has dissolved.
Dilute to the mark with distilled water.
1000 mg/l, Ca stock solution. Weigh 1.000 g of anhydrous CaCO3 (primary standard)
into a 500-ml Erlenmeyer flask. Add slowly 1 + 1 HCl until all CaCO3 has dissolved.
Add 200 ml of distilled water and boil for a few minutes to expel CO2. Cool, add a few
drops of methyl orange indicator, and adjust to the intermediate orange color by adding
3N NH4OH or 1 + 1 HCl, as required. Transfer quantitatively and dilute to 1000 ml with
distilled water. Alternatively, dilute one ampoule of commercially available 1000 mg/l
Ca standard with the appropriate solvent (DD water or 0.1 mole/l HCl, follow the
manufacturer’s instructions).
Procedure
Standard EDTA titration, 0.01 mole/l.
Optimise the instrument according to instrument´s operating manual.
Place a 2.00 ml aliquot (A) calcium standard solution (0.008 mole/l) in a 50 ml beaker.
Add 1.0 ml of the buffer solution. Mix well.
Place the electrodes in the solution and titrate with the EDTA solution.
The end point of the titration is detected automatically by the instrument. Record the
volume (B).
Titration of geothermal samples
Optimise the instrument according to instrument´s operating manual.
Make a suitable dilution of samples with high Ca content, so that the concentration falls
within the working range (10 – 100 mg/l).
Pipette a 10.0 ml aliquot of sample (D) into a 50 ml beaker.
Add 1.0 ml of the buffer solution. Mix well. The pH should be about 12-13. If not it
should be adjusted to such a value.
Add 25 ml of distilled water.
Place the electrodes in the solution and titrate with the EDTA standard solution.
The end point of the titration is detected automatically by the instrument. Record the
volume used (C). The instrument can be programmed to calculate the calcium
concentration.
If an autotitrator is not available, the endpoint can be determined using a pH/mV meter
with a Ca+2
ion selective electrode, as follows:
Fit the meter with the electrodes (or combination electrode) inside the beaker.
Stir the solution and record the mV reading.
Add 0.5-1.0 ml portions of EDTA standard solution from the burette, stir and read the
mV.
Repeat the addition of 0.5 ml portions of titrant, stirring and measuring the mV after
every addition, until near the expected endpoint.
Add 0.1 ml or less of titrant and record the mV reading after each addition. Continue the
additions until the equivalence point has been passed by 1.0-2.0 ml.
Plot the titration curve (mV vs volume of EDTA added). The equivalence point is the
volume corresponding to the steepest part of the curve.
The endpoint can also be determined using an appropriate indicator, such as Murexide,
Eriochrome Blue Black R (CI 222), or Eriochrome Black T (CI 14645).
Calculation
Calculate the concentration of the calcium standard solution using:
[Ca] = g / (MW x Vol) , mole/l
Where:
Ca = calcium concentration, mole/l,
g = grams of CaCO3,
MW = formula weight, CaCO3 (100.09 g/mole)
Vol = final volume
Calculate the concentration of the EDTA solution using:
[EDTA] = M x A/B, mole/l
Where:
EDTA = EDTA concentration, mole/l
M = concentration of the calcium standard solution
A = volume of the calcium standard solution used.
B = ml titrant (EDTA).
Calculate the concentration of Ca (mg/l) in the samples using:
mg/l Ca = CEDTA x C x 40.09 x 1000/ml sample (D)
Where:
CEDTA = concentration of EDTA standard solution
C = ml titrant (EDTA).
D = sample volume, ml.
For diluted samples, calculate the original concentration of Ca using:
mg/l Ca = concentration x dilution factor
Quality Assurance/Quality control.
Always include reagent and sample blanks in the analysis.
Sample concentrations should be within the working range. Dilute samples accordingly.
Analyze the blank and control standard/sample before analyzing samples.
Analyze the reagent blank, control standard after every ten samples, or with each batch of
samples, whichever is less. The value determined should be within 1% (5% is
acceptable) of the known or expected concentration. Otherwise, all samples in the batch
should be reanalyzed.
To one sample out of every ten samples (or with each batch of samples, whichever is
less) add a known amount of the metal of interest and reanalyze to confirm recovery.
Recovery of the added metal should be between 95 and 105%. Otherwise, reanalyze the
whole batch.
CALCIUM (ION CHROMATOGRAPHY)
DOE, Philippines
Scope
This method is applicable to the determination of calcium (Ca) by chemically suppressed
ion chromatography. The method detection limit for the above analyte determined from
replicate analyses is 0.02 - 50mg/l and can only be extended to 100 mg/l by dilution. The
methods works best at relatively low calcium concentrations.
Sample is filtered using a 0.45 m membrane filter.
An aliquot of the sample is pumped through an ion-exchange column where the cation(s)
of interest is (are) separated. Because different ions have different migration rates, the
sample ions elute from the column as discrete bands. The sample ions are selectively
eluted off the separator column and onto a suppressor column. The eluent ions are
neutralized and the sample ions are converted to their corresponding strong bases and are
detected in a conductance cell. The chromatogram produced is displayed in an integrator
for measurement of peak height or area. The ion chromatograph is calibrated with
standard solutions containing known concentrations of the cation(s) of interest.
Interferences can be caused by substances with retention times that are similar to and
overlap those of the cation or anion of interest. Large amounts of an anion/cation can
interfere with the peak resolution of an adjacent analyte. Sample dilution and/or
fortification can be used to solve most interference problems associated with retention
times.
References
Dionex Application Notes, Keith (1996, EPA Method 300.7).
Materials and Equipment
Ion Chromatograph
Cation Guard Column
Cation Separator Column
Cation Suppressor Column
Conductivity Detector
Gradient Pump
Integrator
Balance, Analytical – capable of accurately weighing to the nearest 0.0001 g
Pipettes, 1.0 to 20.0 ml
Volumetric flasks, 20.0 to 1000.0 ml
Syringe, 1 ml capacity
Nitrogen gas, ultra high purity
Reagents and Standards
20 mM methane sulfonic acid (eluent): Pipette 1.80 ml of 99% Methane sulfonic acid
(MSA) into a 1 l volumetric flask and dilute to volume with reagent water.
Calcium stock solution (1000 mg/l): Dissolve 2.4970 g of calcium carbonate (CaCO3) in
reagent water and dilute to 1 l or prepare using commercially available calcium standard.
Mixed cation standard
Working standard solutions: Prepare at least four or five standards to bracket the
expected concentration of the analyte.
Reagent water. Filtered, deionized (Specific conductance 18 ohms) and degassed
Procedure
Chromatographic Conditions
Column: CS12-4mm (ethylvinylbenzene cross-linked w/55%
divinylbenzene)
Eluent: 20 mM Methane sulfonic acid
Flow rate: ml/min
Injection Vol: 50l
Detection: Suppressed Conductivity
Background Reading: 1-3S
Output Range: 30S
Start-up the equipment according to manual’s instructions.
Set desired integrator parameters
Chart speed:0.5
Attenuation:1024
Peak Threshold: 10000
Equilibrate the system by pumping eluent through the column and detector until a stable
baseline is obtained.
Inject the laboratory reagent blank (LRB).
Inject calibration standards. Calibration standards are stable for one week when stored at
4oC in high-density polyethylene containers.
When calibration is established, record peak height or area, and construct calibration
curve.
Inject the LRB.
Inject the samples. Flush the sampling system thoroughly with each new sample.
Verify calibration curve after every ten samples and at the end of each day’s analyses.
Calculation
Calculate concentration of the analyte from the calibration curve
For diluted samples, calculate calcium content as follows
mg/l Ca = Concentration x dilution factor
Report data in mg/l. Do not report data lower than the lowest calibration standard.
An integration system may also be used to provide a direct readout of the concentration
of the analyte of interest.
Quality Assurance/Quality Control
The laboratory must add a known amount of analyte to a minimum of 10% of the routine
samples. In each case the laboratory fortified matrix (LFM) aliquot must be a duplicate of
the aliquot used for sample analysis. The analyte concentration must be high enough to
be detected above the original sample and should not be less than four times the method
detection limit.
If the concentration of fortification is less than 25% of the background concentration of
the matrix, the matrix recovery should not be calculated.
Calculate the percent recovery for each analyte, corrected for concentration measured in
the unfortified sample, and compare these values to the designated LFM recovery range
of 90-110%.
Until sufficient data becomes available (usually 20-30 analyses), assess laboratory
performance against recovery limits. When sufficient internal performance data becomes
available develop control limits from percent mean recovery and standard deviation.
If the recovery of any analyte falls outside the designated LFM recovery range and the
laboratory performance for the analyte, the recovery problem encountered with the LFM
is judged to be either matrix or solution related, not system related.
In recognition of the rapid advances taking place in chromatography, the analyst is
permitted certain options, such as the use of different columns and/or eluents to improve
the separation or lower the cost of measurements.
To one sample out of every ten samples (or with each batch of samples, whichever is
less) add a known amount of the metal of interest and reanalyze to confirm recovery.
Recovery of the added metal should be between 95 and 105%. Otherwise, reanalyze the
whole batch.
CHLORIDE (ARGENTOMETRIC TITRATION)
PNOC EDC, Philippines
Scope
This test method is applicable to the measurement of chloride in low to highly
mineralized water.
This test method is based upon the Mohr procedure for determining chloride ion with
silver nitrate. The chloride ion reacts with silver ion before any silver chromate forms,
due to lower solubility of silver chloride. The potassium chromate indicator reacts with
the excess silver ion to form a red silver chromate precipitate. The end point is the
appearance of the first permanent orange color.
Samples containing 5 to 150,000 mg/l of chloride can be analyzed by this method. These
chloride levels can be determined by varying sample aliquot and using the appropriate
titrant concentration.
Sulfide, bromide, iodide, thiocyanate, cyanide, phosphate, sulfite, carbonate, hydroxide,
and iron interfere in this method. Sulfide, sulfite, and thiosulfate can be removed by
peroxide treatment, but usually no attempt is made to remove bromide and iodide because
they are usually present in insignificant quantities compared to chloride. If necessary, the
pH can be raised and the hydroxides of several metals, including iron, can be filtered off.
Iron, barium, lead, and bismuth precipitate with the chromate indicator.
References
American Public Health Association, American Water Works Association, Water and
Environment Federation (1995); American Society for Testing and Material. (1994b).
Materials and Equipment
Filter paper, 20-25 m particle retention
Beaker, 150 ml
Dropper
Pipettes, 10, 20 and 50 ml
Automatic or digital burette
Magnetic stirrer with stirring bar
Reagents and Standards
0.1 N Silver nitrate, AgNO3, for high chloride concentration: Dissolve 16.987 g AgNO3,
AR, in one liter DD water and standardize or dilute 1 ampoule commercially available
0.1 N AgNO3 to 1 liter with DD water and standardize (see p. 126). Store in an amber
bottle.
0.01 N Silver nitrate, AgNO3, for low chloride concentrations: Dissolve 1.699 g AgNO3,
AR, in one liter DD water and standardize. Alternatively, dilute 100 ml 0.1 N AgNO3 to
1 liter with DD water and standardize (see p. 126). Store in an amber bottle.
Nitric acid solution, HNO3: Add 1 volume of concentrated HNO3 to 19 volumes of water.
Chloride standard, 1000 mg/l Cl for 0.1 N AgNO3: Dissolve 1.65 g NaCl (dried at 110 ºC
for one hour) in a small amount of DD water. Add 2 ml HNO3 and dilute to mark with
DD water or alternatively, prepare using commercially available standards.
Chloride standard, 100 mg/l and 10 mg/l for 0.01 N AgNO3: Prepare by serial dilution
from 1000 mg/l Cl standard or alternatively, prepare using commercially available
standards.
Sodium bicarbonate, NaHCO3, AR or Calcium carbonate, CaCO3, AR
Potassium chromate indicator solution: Dissolve 50 g K2CrO4 in a small amount of DD
water. Add AgNO3 solution until a definite red precipitate is formed. Leave for 12 hours,
filter and dilute to 1 liter with DD water.
Procedure
Pipette 20 ml aliquot of 1,000 mg/l Cl standard into a 150 ml beaker to standardize the
0.1 N AgNO3 for high Cl analysis. For low Cl, use 100 ml of 10 mg/l Cl standard to
standardize 0.01 N AgNO3.
Add 1 ml chromate indicator, 1 g of NaHCO3 or CaCO3 powder, and titrate with
continuous stirring until the appearance of first permanent orange color preceding a red
precipitate. Record the volume of AgNO3 used.
Filter the sample to remove any insoluble or suspended materials.
Pipette 5 to 100 ml aliquot of sample into a 150 ml beaker. Choose sample aliquot so that
0.15 to 10 mg Cl- is present in the portion to be titrated.
Add 1 g of NaHCO3 or CaCO3 powder and stir to dissolve. Ensure that the resulting pH is
between 6.5 to 8.5.
Add 1 ml chromate indicator.
Titrate with the appropriate AgNO3 solution to a permanent orange color preceding the
brick red colored precipitate.
Record the volume of AgNO3 required to reach the end point and calculate the chloride
concentration in mg/l.
Calculation
mg/l = 35453VN/S
Where:
V = ml of silver nitrate used
N = normality of silver nitrate
S = sample aliquot in ml
Quality Assurance/Quality Control
Ensure that working solutions are standardized.
Analyze check standard and control sample/standard prior to analysis of samples and
after every ten (10) samples, or with each batch of samples, whichever is less. The
determined value should be within 5% of the known or expected concentration.
Otherwise, all samples in the batch should be reanalyzed.
Analyze one set of duplicate samples for every ten samples (or with each batch of
samples, whichever is less). Acceptance limit for duplicate samples is 5%.
To one sample out of every ten (10) samples (or with each batch of samples, whichever is
less) add a known amount of the analyte of interest and reanalyze to confirm recovery.
Recovery of the added analyte should be between 95 and 105%. Otherwise, reanalyze the
whole batch.
CHLORIDE (POTENTIOMETRIC TITRATION)
PNOC EDC, Philippines
Scope
This test method covers the determination of chloride in natural waters and geothermal
brine where the concentration is 5 mg/l.
Chloride is determined by a potentiometric titration with silver nitrate solution with a
glass and silver-silver chloride electrode system. During titration, an electronic voltmeter
is used to detect the change in potential between the two electrodes. The endpoint of the
titration is the instrument reading at which the greatest change in voltage has occurred for
a small and constant increment of silver nitrate added.
The sensitivity of the analysis can be adjusted depending on the amount of the sample
aliquot, concentration of AgNO3 solution, minimum volume that can be delivered by the
burette and the optimization of the program parameters in the autotitrator.
Samples are acidified with nitric acid to avoid carbonate precipitation. Bromide, iodide,
and sulfide are titrated along with the chloride. Orthophosphate and polyphosphate
interfere if present in concentrations greater than 250 and 25 mg/l, respectively.
Reference
American Public Health Association, American Water Works Association, Water
Environment Federation (1995).
Materials and Equipment
Beaker, 150 ml capacity
Pipettes, 5 and 50 ml
Combined Ag-AgCl electrode
Magnetic stirrer with stirring bar
Autotitrator
Reagents and Standards
0.1 N Silver nitrate, AgNO3, for high chloride concentration: Dissolve 16.987 g AgNO3,
AR, in one liter DD water and standardize or dilute 1 ampoule commercially available
0.1 N AgNO3 to 1 liter with DD water and standardize (see p. 126). Store in an amber
bottle.
0.01 N Silver nitrate, AgNO3, for low chloride concentration: Dissolve 1.699 g AgNO3,
AR, in one liter DD water and standardize. Alternatively, dilute 100 ml 0.1 N AgNO3 to
1 liter with DD water and standardize (see p. 126). Store in an amber bottle.
Chloride standard, 1000 mg/l Cl for 0.1 N AgNO3: Dissolve 1.65 g NaCl (dried at 110 ºC
for one hour) in one liter DD water or alternatively, prepare using commercially available
standards.
Chloride standard, 100 mg/l and 10 mg/l for 0.01 N AgNO3: Prepare by serial dilution
from 1000 mg/l AgNO3 or alternatively, prepare using commercially available standards.
50 % Nitric acid, HNO3: Add equal volumes of concentrated HNO3 and DD water.
Procedure
The various instruments that can be used in this determination differ in operating details;
follow manufacturer’s instructions. Make necessary mechanical adjustments.
Pipette 5 ml of sample (50 ml in case of low Cl) to a 150 ml beaker.
Add three drops of 50% HNO3 and stir.
Immerse the Ag electrode and burettes tip in the sample. Ensure that the junction hole of
the electrode is submerged in the sample by adding enough DD water.
Titrate the sample.
Calculation
mg/l = 35453VN/S
Where:
V = volume of silver nitrate used
N = normality of silver nitrate
S = sample aliquot in ml
Quality Assurance/Quality Control
Ensure that working solutions are standardized.
Analyze check standard and control sample/standard prior to analysis of samples and
after every ten (10) samples, or with each batch of samples, whichever is less. The value
determined should be within 5% of the known or expected concentration. Otherwise, all
samples in the batch should be reanalyzed.
Analyze one set of duplicate samples for every ten samples (or with each batch of
samples, whichever is less). Acceptance limit for duplicate samples is 5%.
To one sample out of every ten (10) samples (or with each batch of samples, whichever is
less) add a known amount of the analyte of interest and reanalyze to confirm recovery.
Recovery of the added analyte should be between 95 and 105%. Otherwise, reanalyze the
whole batch.
CHLORIDE (SPECTROPHOTOMETRIC WITH THIOCYANATE)
CAIR-BATAN, Indonesia
Scope
This test method covers the determination of chloride (Cl) in water samples at
concentrations by a spectrophotometric method using an UV-Vis spectrophotometer.
The applicable range of this test method is from 0.25 to 3.0 mg/l when using 460.0 nm
wavelength.
The sample solution is acidified with nitric acid and is evaporated on a water bath as
suppressant to arrest interference of sulfide.
Reference
Vogel (1961).
Materials and Equipment
Spectrophotometer UV-Vis
Volumetric flasks, 25 and 50 ml
Pipettes, 2 ml, 20 ml
Beaker, 50 ml
Reagent bottles, 500 and 250 ml
Filter paper, Whatman 42
Cuvette
Reagents and Standards
Stock mercuric thiocyanate solution [Hg-(SCN)2] solution: Dissolve 4.17 g Hg-
thiocyanate in about 500 ml ethanol, dilute to 1000 ml with ethanol, mix and filter
through filter paper.
Ferric ammonium sulfate 0.25 M: Dissolve 12.05475 g Fe (NH4)(SO4)2.12H2O in 100 ml
9M HNO3 solution.
Stock chloride solution: Dissolve 1.6482 g NaCl, dried at 140°C in distilled water and
dilute to 1000 ml.
1.00 ml = 1.00 mg Cl
Procedure
Add 20 ml of the water sample to 2 ml Fe (NH4)(SO4)2.12H2O solution in a 25 ml
volumetric flask.
Add 2 ml Hg-thiocyanate solution and dilute to 25 ml with DD water and mix. Leave at
room temperature for about 10 minutes.
Note absorbance at 460 nm.
Calculation
Calculate for mg/l chloride by referring to the calibration curve
For diluted samples, calculate original concentration using:
mg/l Cl- = Concentration x dilution factor
Quality Assurance/Quality Control
DD water must be used in the preparation of samples/standards
Always include reagent blanks in the analysis
Add suppressant to blanks, standards and samples
Standard concentrations should bracket the sample concentrations and should be within
the working range. Dilute if necessary
Absorbance values should be within the acceptable working standard range
Draw calibration curve using five standard concentrations, the correlation coefficient
should be r2 0.999
Spike and reanalyze after every five samples to check recovery. Recovery of the added
analyte should be between 90 and 110%. Otherwise, reanalyze the whole batch.
CHLORIDE (ION CHROMATOGRAPHY)
GESAL, El Salvador
Scope
This method covers the determination of chloride ion (Cl-) in filtered unacidified low-
salinity water samples by ion chromatography (IC).
The applicable range of this method is from 0.10 to 10.0 mg/l with a 100 l sample loop.
This range may be extended upward by dilution of an appropriate aliquot of sample.
A water sample is injected into a stream of carbonate-bicarbonate eluent and passed
through a series of ion exchangers. The anions of interest are separated on the basis of
their relative affinities for a low capacity, strongly basic anion exchanger (guard and
separator columns). The separated anions are passed through a suppressor column bathed
in continuously flowing regenerant solution (sulfuric acid solution). There, the separated
anions are converted to their highly conductive acid forms and the carbonate-bicarbonate
eluent is converted to weakly conductive carbonic acid.
The concentration of the separated anions in their acid forms is determined by
conductivity. They are identified on the basis of retention time as compared to standards.
Quantification is performed by correlating the peak area of the analyte obtained from the
sample solution to that obtained from the working standard solution.
Interferences can be divided into three different categories:
Direct chromatographic co-elution, where the analyte response is observed at very nearly
the same retention time as the target anion (i.e., relatively high concentrations of low-
molecular-weight organic acids)
Concentration dependent co-elution, which is observed when the response of higher than
typical concentrations of the neighbouring peak overlaps with the retention window of
the target anion; and,
Ionic displacement, where retention times may significantly shift due to the influence of
high ionic strength matrices (high mineral content or hardness) overloading the exchange
sites in the column and significantly shortening target analyte retention times.
References
American Public Health Association, American Water Works Association, Water
Environment Federation (1995); American Society for Testing and Materials (1988);
Centro de Investigaciones Geotérmicas, Gerencia División de Recursos; Geotérmicos
(1993); Keith (1996).
Materials and Equipment
Ion chromatograph
Anion separator column
Anion guard column
Membrane suppressor
Analytical balance
Volumetric flasks 1.0 to 1000.0 ml
Pipettes 1.0 to 50 ml
Membrane filter, 0.20 m
Test tubes
Syringes, plastic, disposable 0.1 and 10 ml
Reagents and Standards
Reagent water: Use high quality water: distilled or deionized water of 18 megaohm-cm
resistivity containing no particles larger than 0.20 m
N2 gas for bubbling
Sodium chloride (NaCl), A.R.
Sodium bicarbonate (NaHCO3), A.R.
Sodium carbonate (Na2CO3) , A.R.
Sulfuric Acid (H2SO4), A.R.
Eluent solution. (2.8 mM NaHCO3-2.2 mM Na2CO3).
Dissolve 0.9409 g NaHCO3 and 0.9327g Na2CO3 in water and dilute to 4 l. Filter through
0.2 m.
Regenerant solution (H2SO4 0.025 N): Dilute 2.8 ml concentrated H2SO4 (sp. gr 1.84) to
4 l.
1000 mg/l Cl- stock solution: Stock standard solution may be purchased as a certified
solution or prepared as described below:
Dry sodium chloride (NaCl) for 1 hour at 600°C and cool in a desiccator. Weigh exactly
1.6484 g of dried salt and transfer to a 1000 ml volumetric flask. Dissolve in reagent
water and dilute with the same solvent. Filter to remove particles larger than 0.2 m and
store in plastic bottles in a refrigerator. This solution is stable for at least 1 month (verify
stability).
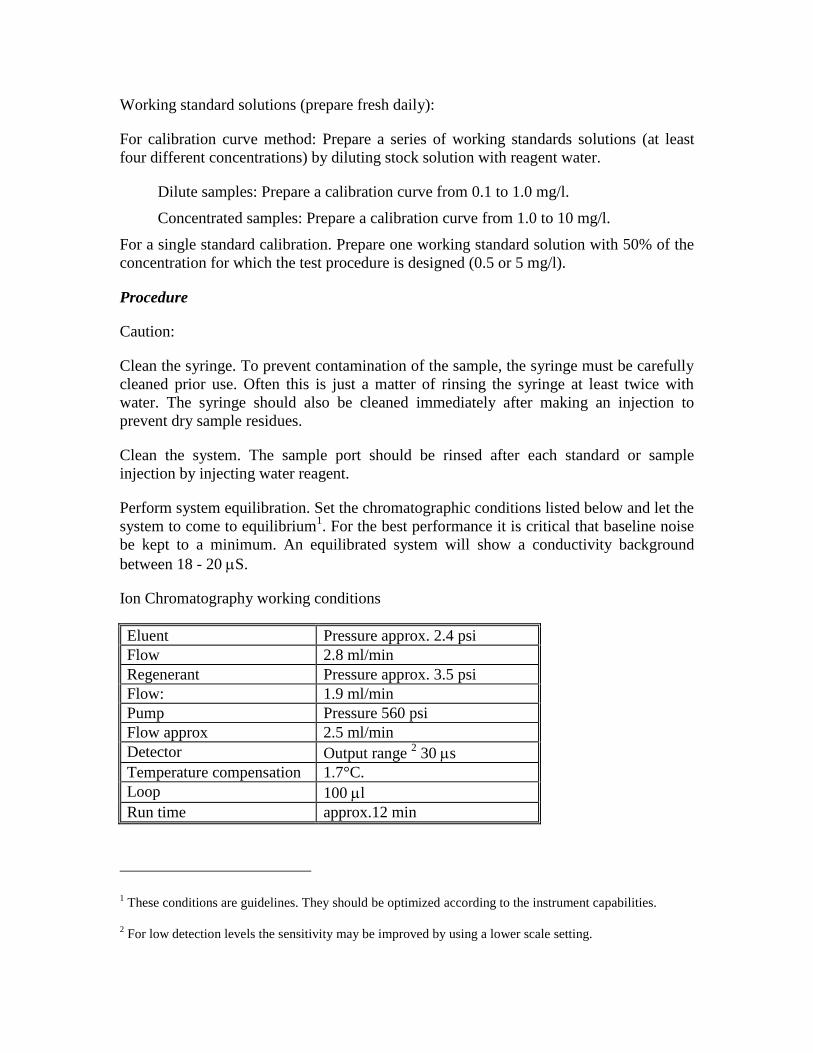
Working standard solutions (prepare fresh daily):
For calibration curve method: Prepare a series of working standards solutions (at least
four different concentrations) by diluting stock solution with reagent water.
Dilute samples: Prepare a calibration curve from 0.1 to 1.0 mg/l.
Concentrated samples: Prepare a calibration curve from 1.0 to 10 mg/l.
For a single standard calibration. Prepare one working standard solution with 50% of the
concentration for which the test procedure is designed (0.5 or 5 mg/l).
Procedure
Caution:
Clean the syringe. To prevent contamination of the sample, the syringe must be carefully
cleaned prior use. Often this is just a matter of rinsing the syringe at least twice with
water. The syringe should also be cleaned immediately after making an injection to
prevent dry sample residues.
Clean the system. The sample port should be rinsed after each standard or sample
injection by injecting water reagent.
Perform system equilibration. Set the chromatographic conditions listed below and let the
system to come to equilibrium1. For the best performance it is critical that baseline noise
be kept to a minimum. An equilibrated system will show a conductivity background
between 18 - 20 S.
Ion Chromatography working conditions
Eluent Pressure approx. 2.4 psi
Flow 2.8 ml/min
Regenerant Pressure approx. 3.5 psi
Flow: 1.9 ml/min
Pump Pressure 560 psi
Flow approx 2.5 ml/min
Detector Output range 2 30 s
Temperature compensation 1.7°C.
Loop 100 l
Run time approx.12 min
1 These conditions are guidelines. They should be optimized according to the instrument capabilities.
2 For low detection levels the sensitivity may be improved by using a lower scale setting.
Determine system blank by using water reagent as sample. This blank establishes the
baseline and confirms the lack of contamination in the system.
The sample port should be rinsed after each standard or sample injection by injecting
water reagent.
Calibration:
Determine chloride retention time by injecting one working standard solution.
Calibration curve. Inject and analyse at least four different concentrations of
analyte to bracket the sample concentration and construct a calibration curve by
plotting peak area against concentration.
Sample preparation:
Remove H2S from samples by bubbling with N2 (g) for 2 hours.
Filter through 0.2 m filter.
Sample reaction test: Transfer 2 ml of each sample to separate test tubes and add 3
ml of eluent solution. No precipitate or colour should be formed (otherwise the
sample cannot be processed).
Dilute samples if necessary. All samples must be within the working range, (avoid
overloading the ion-exchange and suppressor columns).
Sample analysis
Inject each sample. Inject enough sample to flush sample loop several times: for
0.100 ml sample loop inject at least 1 ml. After the conductivity signal has returned
to baseline, the next sample may be injected.
Calculation
Calculate the chloride ion concentration, in milligrams per litre, by referring to the
appropriate calibration curve. Alternatively, when response is shown to be linear, use the
following equation:
mg/lCl = AS/AR x CR x DF
Where:
AS = area of sample.
AR = area of reference solution (standard solution).
CR = concentration of standard in mg/l.
DF = dilution factor for those samples requiring dilution.
Quality Assurance/Quality Control
All solutions must be free of particles larger than 0.2 microns to avoid contamination and
plugging of the columns and flow system.
After every tenth field sample inject a calibration check standard in order to verify the
previously established calibration curve and confirm accurate analyte quantification for
the previous ten field samples analyzed. Acceptance limit should be within 1%.
End analysis of each batch by a check with the calibration check standard
Calculate the relative standard deviation (RSD) of the peak area for chloride in all
standard solutions. The RSD value should be 3.0% or less.
Separating performance of columns. When the analysis method is being used for the first
time with the equipment determine the plate number, plate height, tailing factor and
resolution of analyte peak.
To one sample out of every ten (10) samples (or with each batch of samples, whichever is
less) add a known amount of the analyte of interest and reanalyze to confirm recovery.
Recovery of the added analyte should be between 95 and 105%. Otherwise, reanalyze the
whole batch.
FLUORIDE (ION SELECTIVE ELECTRODE-ISE)
PNOC EDC, Philippines
Scope
This test method covers the determination of soluble fluoride ions in water using a
fluoride selective electrode.
Samples containing 0.25 to 50 mg/l can be analyzed by this method.
A fluoride selective electrode, a reference electrode and an ISE meter are used to
determine fluoride in a water sample by direct concentration readout. The fluoride
electrode consists of a lanthanum fluoride crystal that develops an electrode potential
corresponding to the level of fluoride ion in the solution.
Metal ions such as aluminum and iron (III) interfere with the fluoride determination by
forming complexes with fluoride ions. The buffer solution (TISAB series) contains a
complexing agent that preferentially complexes these metal ions.
References
American Public Health Association, American Water Works Association, Water
Environment Federation (1995); American Society for Testing and Material (1994c, d)
Materials and Equipment
Pipettor
Beaker, 50 ml
Pipette, 20 ml
Combined fluoride electrode
Magnetic stirrer with stirring bar
Ion selective meter
6-mm thick corkboard, heat barrier
Reagents and Standards
Total ionic strength adjustor buffer, TISAB
TISAB II: To approximately 500 ml DD water in a 1 l beaker, add 57 ml glacial acetic
acid, 58 g NaCl and 4 g CDTA (1, 2-diaminocyclohexane N, N. N’, N’-tetraacetic
acid/commercially available as cyclohexylenedinitrilotetraacetic acid) or EDTA
(ethylenediaminetetraacetic acid). Stir to dissolve and cool in a bath. Immerse a
calibrated pH electrode in the solution, and slowly add approximately 5 M NaOH until
the pH is between 5.0-5.5. Cool to room temperature. Transfer to one litre volumetric
flask and dilute to mark with DD water. Commercially available prepared TISAB
solutions can also be used for this method.
TISAB III: Use same procedure and reagents as for TISAB II. For a 500 ml preparation,
add 385 ml glacial acetic acid, 290 g NaCl and 20 g CDTA to 150 ml DD water and
follow same steps as in the TISAB II preparation before finally diluting to the mark.
1000 mg/l F standard, stock: Dissolve 2.2101 g of anhydrous sodium fluoride, NaF, in
DD water and dilute to one liter. Commercially available standards can also be used.
100 mg/l F standard: Dilute 100 ml stock F solution to one liter with DD water.
Working standards (0.5, 5 and 50 mg/l): Transfer 0.5, 5 and 50 ml of 100 mg/l F into
separate 100 ml volumetric flasks and dilute to mark with DD water.
Procedure
Refer to the manufacturer’s instruction manual for proper operation of the meter.
Calibrate the equipment using the working standards. The meter must be recalibrated if
the sample concentration is outside the calibration range.
Transfer 20 ml sample to 50 ml beaker.
Add TISAB (1:1 for TISAB II or 1:10 for TISAB III) and immerse the fluoride electrode
in the sample while stirring continuously.
Allow the reading to stabilize and read the sample concentration directly from the meter.
Calculation
Report the fluoride content in mg/l.
For diluted samples, calculate original mg/l F using:
mg/l F = concentration x dilution factor
Quality Assurance/Quality Control
Analyze control standard/sample prior to analysis of samples.
Analyze the sample blank (in case of dilution) reagent blank, check standard and control
sample/standard after every five (5) samples, or with each batch of samples, whichever is
less. The check standard is chosen from one of the calibration standards, while the control
standard/sample is a separate preparation. The value determined should be within 5% of
the known or expected concentration. Otherwise, all samples in the batch should be
reanalyzed.
Standard concentrations should bracket the sample concentrations and should be within
the working range, particularly in the upper range.
Check whether the slope of the calibration curve is within the recommended value (-54 to
-60 mV) before doing sample measurement.
Analyze duplicate samples. Acceptance limit for duplicate sample is 5%.
To one sample out of every five (5) samples (or with each batch of samples, whichever is
less) add a known amount of the F standard and reanalyze to confirm recovery. Recovery
of the added F should be between 95 and 105%. Otherwise, reanalyze the whole batch.
Check that the result has been multiplied by the dilution factor if dilution was needed.
FLUORIDE (ION CHROMATOGRAPHY)
BRIUG, China
Scope
This test method covers the determination of fluoride in filtered un-acidified sample by
Ion Chromatography (IC).
The applicable range of this test method is from 0.5 to 20 mg/l when using the IC. This
range may be extended upward or downward by dilution of an appropriate aliquot of
sample or increasing the size of the sample loop.
A small volume of sample, 100 l is introduced into an ion chromatograph. The anions of
interest are separated and measured, using a system comprising a guard column, an
analytical column, a suppressor device, and a conductivity detector.
Interference can be caused by substances such as organic acids in high concentrations
with retention times that are similar to that of the fluoride anion and may overlap the
fluoride peak. Such interferences can be eliminated by means of sample dilution.
References
Dionex (1992), Keith (1996, EPA method 300.1).
Materials and Equipment
Ion chromatograph with suppressor
Volumetric flasks, 50 ml and 100 ml
Pipettes, 1-20 ml
Reagent bottles, 50 ml and 100 ml
Volumetric flask, 1 l
Reagents and Standards
Deionized water with a specific resistance of 17.8 megaohm – cm or greater.
Eluent: 5 mmole/l sodium borate: Thoroughly dissolve 1.90 g sodium borate, tetra
hydrate (MW 381.42 g/mole) in 700 ml deionized water (4.1) in a 1 l volumetric flask.
Dilute to a final volume of 1000 ml.
1000 mg/l F- stock solution
Commercial standard solution
Standard working solutions (0.5 to 20 mg/l F-)
Prepare at least four or five standards to bracket the expected F concentration of the
samples.
Procedure
Optimize the instrument according to its operation manual.
Equilibrate the system by pumping eluent through the column and detector until a stable
baseline is attained.
Inject the standard working solution and construct the standard calibration curve.
Flush the sampling system with each new sample.
Inject sample. Dilute when necessary so that the concentration falls within the standard
calibration curve.
During daily operation, it may be necessary to elute the polyvalent anions that
concentrate on the column with a 50-mole/l sodium borate solution (10×eluent strength)
for 10 minutes. After cleaning the column, equilibrate it for 20 minutes with the operating
eluent.
Calculation
Calculate F- content of the sample in mg/l from the calibration curve.
For diluted samples, calculate original mg/l using:
mg/l F- = concentrationdilution factor
The chromatogram working station can provide the content of F- directly.
Quality Assurance/Quality Control
Use the same quality deionized water to dilute the samples and to prepare the eluent and
working solution, otherwise check the blank concentration of the water.
Check that the first order linearity of the standard calibration curve has r2 0.999.
Analyze the control standard /sample after a batch of samples. The control standard
should be prepared separately from the calibration standards. The value determined for
the control standard /sample should be within 5% of the known or expected
concentrations.
Analyze one set of the duplicate samples. Acceptance precision for duplicate samples is
10%
To one sample out of every ten (10) samples (or with each batch of samples, whichever is
less) add a known amount of the analyte of interest and reanalyze to confirm recovery.
Recovery of the added analyte should be between 95 and 105%. Otherwise, reanalyze the
whole batch.
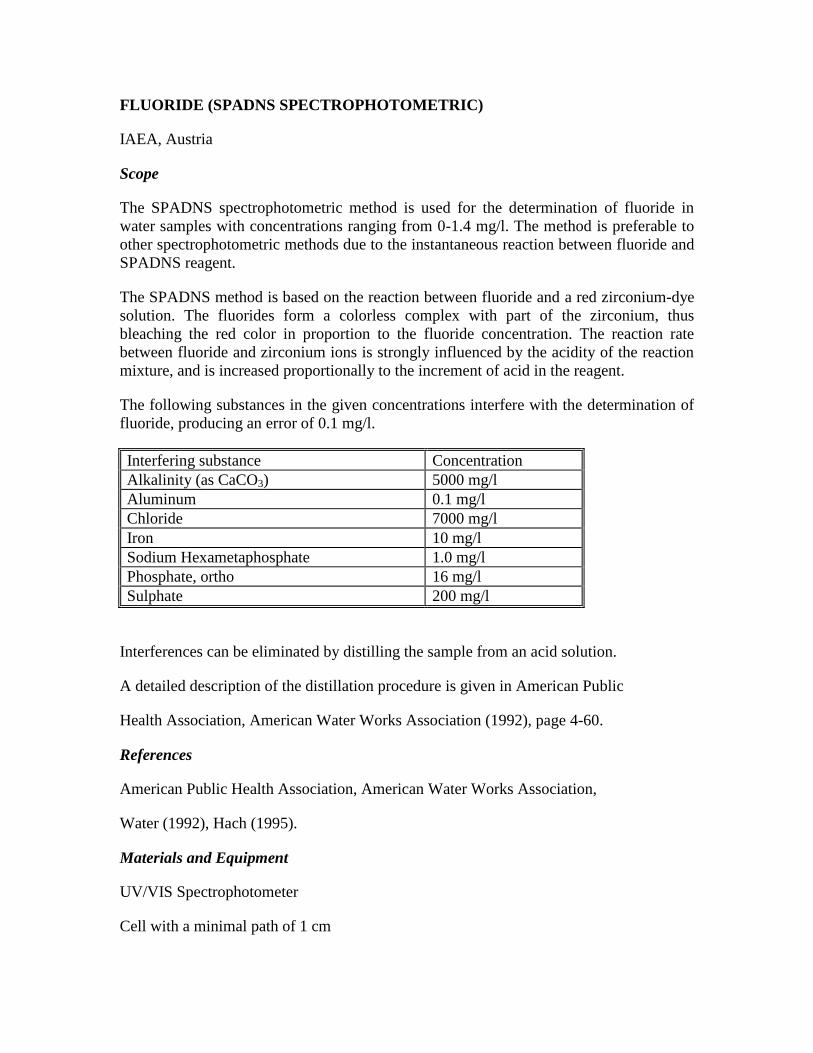
FLUORIDE (SPADNS SPECTROPHOTOMETRIC)
IAEA, Austria
Scope
The SPADNS spectrophotometric method is used for the determination of fluoride in
water samples with concentrations ranging from 0-1.4 mg/l. The method is preferable to
other spectrophotometric methods due to the instantaneous reaction between fluoride and
SPADNS reagent.
The SPADNS method is based on the reaction between fluoride and a red zirconium-dye
solution. The fluorides form a colorless complex with part of the zirconium, thus
bleaching the red color in proportion to the fluoride concentration. The reaction rate
between fluoride and zirconium ions is strongly influenced by the acidity of the reaction
mixture, and is increased proportionally to the increment of acid in the reagent.
The following substances in the given concentrations interfere with the determination of
fluoride, producing an error of 0.1 mg/l.
Interfering substance Concentration
Alkalinity (as CaCO3) 5000 mg/l
Aluminum 0.1 mg/l
Chloride 7000 mg/l
Iron 10 mg/l
Sodium Hexametaphosphate 1.0 mg/l
Phosphate, ortho 16 mg/l
Sulphate 200 mg/l
Interferences can be eliminated by distilling the sample from an acid solution.
A detailed description of the distillation procedure is given in American Public
Health Association, American Water Works Association (1992), page 4-60.
References
American Public Health Association, American Water Works Association,
Water (1992), Hach (1995).
Materials and Equipment
UV/VIS Spectrophotometer
Cell with a minimal path of 1 cm
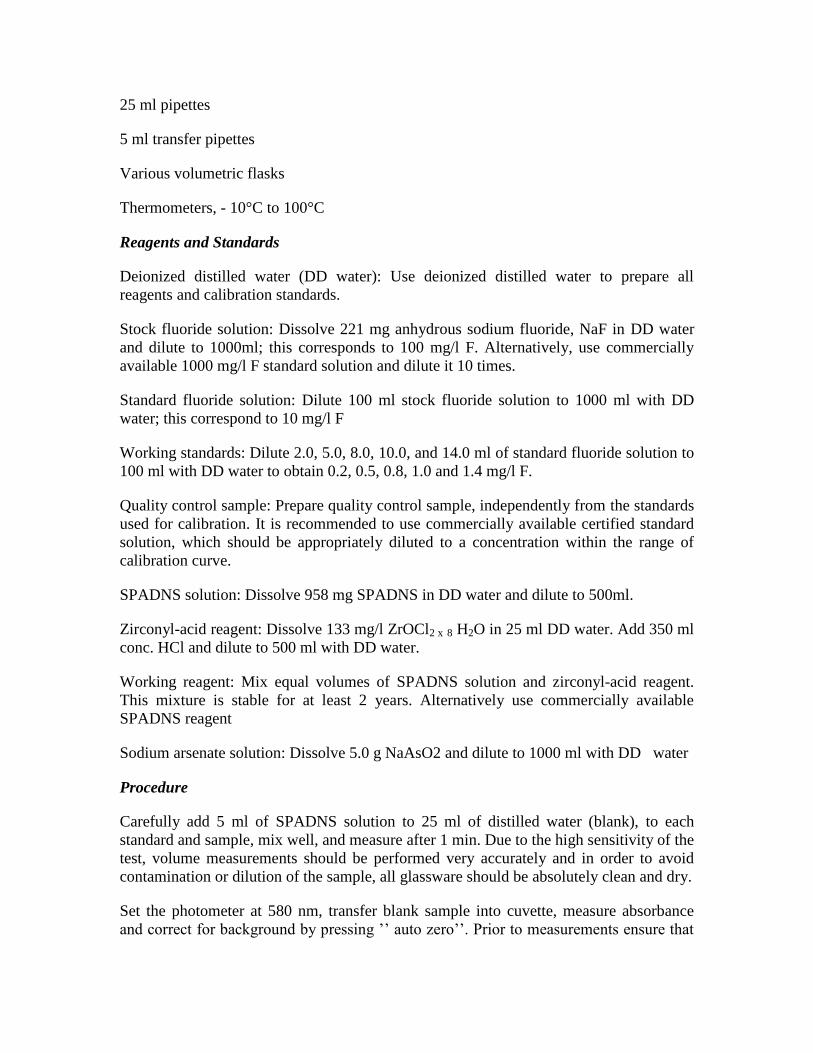
25 ml pipettes
5 ml transfer pipettes
Various volumetric flasks
Thermometers, - 10°C to 100°C
Reagents and Standards
Deionized distilled water (DD water): Use deionized distilled water to prepare all
reagents and calibration standards.
Stock fluoride solution: Dissolve 221 mg anhydrous sodium fluoride, NaF in DD water
and dilute to 1000ml; this corresponds to 100 mg/l F. Alternatively, use commercially
available 1000 mg/l F standard solution and dilute it 10 times.
Standard fluoride solution: Dilute 100 ml stock fluoride solution to 1000 ml with DD
water; this correspond to 10 mg/l F
Working standards: Dilute 2.0, 5.0, 8.0, 10.0, and 14.0 ml of standard fluoride solution to
100 ml with DD water to obtain 0.2, 0.5, 0.8, 1.0 and 1.4 mg/l F.
Quality control sample: Prepare quality control sample, independently from the standards
used for calibration. It is recommended to use commercially available certified standard
solution, which should be appropriately diluted to a concentration within the range of
calibration curve.
SPADNS solution: Dissolve 958 mg SPADNS in DD water and dilute to 500ml.
Zirconyl-acid reagent: Dissolve 133 mg/l ZrOCl2 x 8 H2O in 25 ml DD water. Add 350 ml
conc. HCl and dilute to 500 ml with DD water.
Working reagent: Mix equal volumes of SPADNS solution and zirconyl-acid reagent.
This mixture is stable for at least 2 years. Alternatively use commercially available
SPADNS reagent
Sodium arsenate solution: Dissolve 5.0 g NaAsO2 and dilute to 1000 ml with DD water
Procedure
Carefully add 5 ml of SPADNS solution to 25 ml of distilled water (blank), to each
standard and sample, mix well, and measure after 1 min. Due to the high sensitivity of the
test, volume measurements should be performed very accurately and in order to avoid
contamination or dilution of the sample, all glassware should be absolutely clean and dry.
Set the photometer at 580 nm, transfer blank sample into cuvette, measure absorbance
and correct for background by pressing ’’ auto zero’’. Prior to measurements ensure that
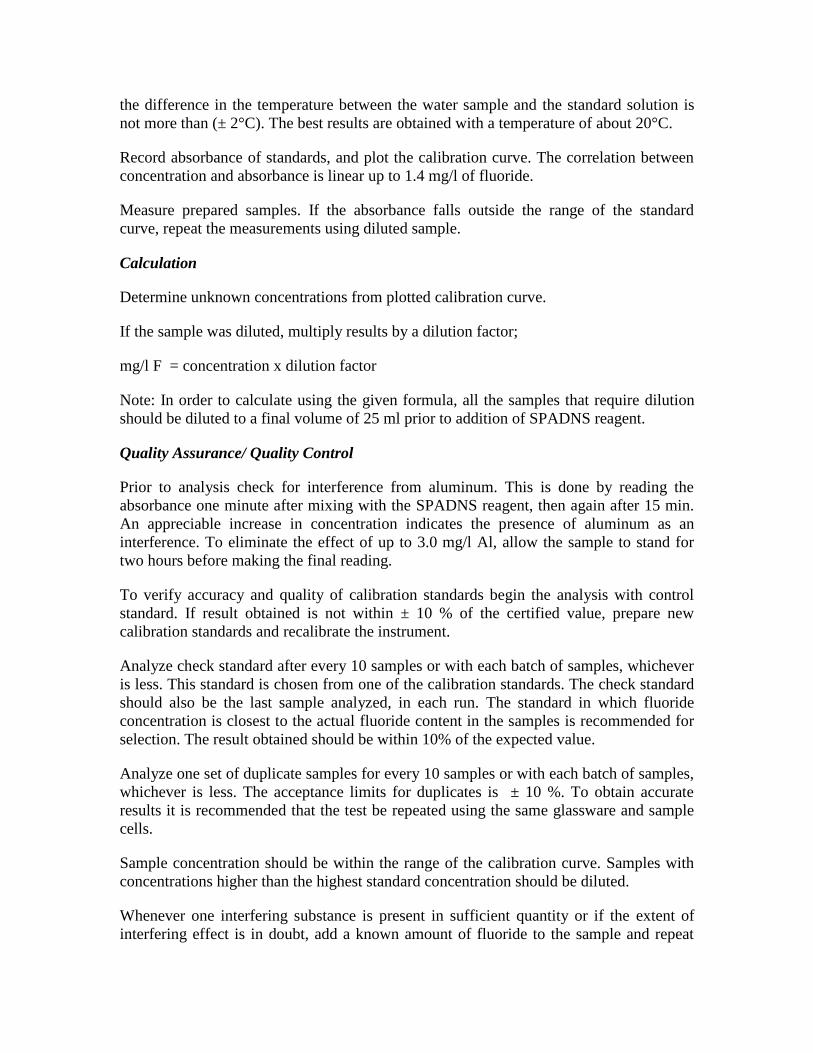
the difference in the temperature between the water sample and the standard solution is
not more than (± 2°C). The best results are obtained with a temperature of about 20°C.
Record absorbance of standards, and plot the calibration curve. The correlation between
concentration and absorbance is linear up to 1.4 mg/l of fluoride.
Measure prepared samples. If the absorbance falls outside the range of the standard
curve, repeat the measurements using diluted sample.
Calculation
Determine unknown concentrations from plotted calibration curve.
If the sample was diluted, multiply results by a dilution factor;
mg/l F = concentration x dilution factor
Note: In order to calculate using the given formula, all the samples that require dilution
should be diluted to a final volume of 25 ml prior to addition of SPADNS reagent.
Quality Assurance/ Quality Control
Prior to analysis check for interference from aluminum. This is done by reading the
absorbance one minute after mixing with the SPADNS reagent, then again after 15 min.
An appreciable increase in concentration indicates the presence of aluminum as an
interference. To eliminate the effect of up to 3.0 mg/l Al, allow the sample to stand for
two hours before making the final reading.
To verify accuracy and quality of calibration standards begin the analysis with control
standard. If result obtained is not within ± 10 % of the certified value, prepare new
calibration standards and recalibrate the instrument.
Analyze check standard after every 10 samples or with each batch of samples, whichever
is less. This standard is chosen from one of the calibration standards. The check standard
should also be the last sample analyzed, in each run. The standard in which fluoride
concentration is closest to the actual fluoride content in the samples is recommended for
selection. The result obtained should be within 10% of the expected value.
Analyze one set of duplicate samples for every 10 samples or with each batch of samples,
whichever is less. The acceptance limits for duplicates is ± 10 %. To obtain accurate
results it is recommended that the test be repeated using the same glassware and sample
cells.
Sample concentration should be within the range of the calibration curve. Samples with
concentrations higher than the highest standard concentration should be diluted.
Whenever one interfering substance is present in sufficient quantity or if the extent of
interfering effect is in doubt, add a known amount of fluoride to the sample and repeat
the analysis. The increase in concentration should correspond to the concentration added
with deviation of ±10 %. If the presence of interfering substances is confirmed, samples
should be distilled using the procedure described in American Public Health Association,
American Water Works Association Water (1992), and pages 4-60. In some cases,
depending on the fluoride concentrations, it is possible to compensate for the interference
by diluting the sample, by using the standard addition method, or by adding an
appropriate amount of interfering substance to the standards.
If the sample contains residual chlorine, remove it by adding 0.05 ml NaAsO2 solution.
To one sample out of every ten (10) samples (or with each batch of samples, whichever is
less) add a known amount of the analyte of interest and reanalyze to confirm recovery.
Recovery of the added analyte should be between 95 and 105%. Otherwise, reanalyze the
whole batch.
IRON (SPECTROPHOTOMETRIC WITH TPTZ)
Iceland GeoSurvey, Iceland
Scope
Ferrous ion (Fe+2
) forms a violet complex with 2,4,6-tripyridyl-1, 3,5-triazine (TPTZ) at
pH 3.5 - 5.8. Ascorbic acid reduces ferric ion (Fe+3
) to ferrous ion and the solution is
buffered with sodium hydroxide and ammonium acetate after the addition of a small
amount of hydrochloric acid. The method is applicable to the determination of iron (Fe)
in water samples with concentrations ranging from 0.001 mg/l NH3 (using a 10 cm cell)
and above. Higher concentrations than about 2 mg/l can be determined following
appropriate dilutions.
The method is extremely sensitive to pH. If a standard or a sample shows a suspiciously
low absorbance check the pH of the solution with universal indicator paper. If pH outside
the range 3.5 - 5.8 either try to adjust it with an acid and/or a base solution or repeat the
sample preparation.
If an unusual color is observed add ascorbic acid only to the solution and measure the
absorbance. The value obtained (the color blank) is subtracted from the observed iron
concentration of the sample.
Iron is widespread in the environment and great caution needs be shown in the handling
of glass- and plastic ware. All new items should be acid-washed and others washed well
in deionized water each time.
References
Koroleff (1983)
Materials and Equipment
Reagent bottles, 100 ml
Volumetric flasks, 100 ml, 50 ml and 25 ml (several)
Polyethylene bottles, 50 – 100 ml
Pipettes, 0.05 – 5 ml
pH meter
UV-Visible Spectrophotometer with appropriate size sample cells (1-10 cm)
Reagents and Standards
6 N hydrochloric acid solution: Add 54 ml concentrated hydrochloric acid to 46 ml
deionized water.
2 N sodium hydroxide solution: Dissolve 8 g sodium hydroxide in 100 ml deionized
water (or dilute the 40% NaOH solution, used for sampling gas in steam, 5 times with
deionized water).
Ascorbic acid solution: Dissolve 7 g ascorbic acid in 100 ml deionized water. Store in a
refrigerator. Make up a new solution as soon as it starts turning yellow.
TPTZ solution: Add 0.5 ml concentrated hydrochloric acid to 0.08 g 2,4,6-tripyridyl-
1,3,5-triazine and dilute to 100 ml with deionized water. Store in a refrigerator.
Ammonium acetate solution: Dissolve 5 g ammonium acetate in 100 ml deionized water.
Iron intermediate standard solution. Dilute 1000 ppm iron stock solution to 10 ppm daily,
adding 0.120 ml 6 N hydrochloric acid solution to each 100 ml of solution.
Procedure
Prepare 0.1, 0.2 and 0.3 ppm iron standard solutions by dilution of the intermediate
standard solution, adding 0.120 ml 6 N hydrochloric to each 100 ml of solution.
Put deionized water in 25 ml volumetric flasks, add 0.030 ml 6 N hydrochloric acid, fill
one to the mark to serve as a blank, but add 0.100 ml of sample to each of to the others
(or a quantity that is expected to give a concentration of 0.1 - 0.3 ppm when diluted to 25
ml).
Place 25 ml aliquots of standards, blanks and diluted samples in 50 - 100 ml polyethelene
bottles.
Add 0.050 ml 2 N sodium hydroxide solution. Shake well.
Add 0.5 ml ascorbic acid solution, shake well and wait for at least 30 seconds.
Add 0.5 ml TPTZ solution and shake well.
Add 0.5 ml ammonium acetate solution and shake well.
Measure the absorbance of blanks, standards and samples at 595 nm.
Calculation
Read iron concentration in mg/l directly from the instrument or prepare standard
calibration curve to interpolate the sample concentration.
In case of dilution multiply measured concentration by dilution factor.
Quality Assurance/Quality Control
Analyze control standard/sample prior to analysis of samples.
Analyze reagent blank, check standard and control sample/standard after every five (5)
samples, or with each batch of samples, whichever is less. The check standard is chosen
from one of the calibration standards, while the control standard/sample is a separate
preparation. The value determined should be within 5% of the known or expected
concentration. Otherwise, all samples in the batch should be reanalyzed.
Standard concentrations should bracket the sample concentrations and should be within
the working range.
Analyze one set of duplicate samples for every five samples (or with each batch of
samples, whichever is less). Acceptance limits for duplicate samples is 5%.
To one sample out of every five (5) samples (or with each batch of samples, whichever is
less) add a known amount of the Fe standard and reanalyze to confirm recovery.
Recovery of the added Fe should be between 95 and 105%. Otherwise, reanalyze the
whole batch.
LITHIUM (ATOMIC ABSORPTION SPECTROPHOTOMETRY)
PNOC EDC, Philippines
Scope
This test method covers the determination of lithium (Li) in filtered acidified samples by
atomic absorption spectrophotometry (AAS).
The applicable range of this test method is from 0.10 to 5.0 mg/l when using the 670.8
nm wavelength. This range may be extended upward by dilution of an appropriate
aliquot of sample.
Adding large excesses of an easily ionized element, such as potassium ion, controls
ionization interference.
References
American Public Health Association, American Water Works Association and Water
Environment Federation (1995), American Society for Testing and Material (1995c).
Materials and Equipment
Atomic absorption spectrophotometer
Li hollow cathode lamp
Volumetric flasks, 50 and 100 ml
Automatic dispenser
Pipettes, 1-25 ml
Erlenmeyer flasks, 50 ml, preferably plastic
Reagent bottles, 1 l and 250 ml, plastic
Filter paper, with particle retention of 20-25 µm
Reagents and Standards
50.00 g/l K as potassium chloride suppressant, KCl: Dissolve 95.84 g KCl, AR, in DD
water and dilute to 1000 ml.
Acetylene gas with purity of at least 99.5 vol %: Acetone, which is always present in
acetylene cylinders, can be prevented from entering and damaging the burner system by
replacing a cylinder with only 75 psig acetylene remaining.
Compressed air cleaned and dried by passing it through a suitable filter to remove oil,
water, and other foreign substances.
Acidified DD water: Add 1 ml concentrated HNO3, AR, for every liter DD water.
Concentrated nitric acid, HNO3
50% HNO3: Mix equal volumes of DD water and concentrated HNO3.
1000 mg/l Li stock solution: Dissolve 5.323 g Li2CO3 in a minimum volume of 50%
HNO3. Add 10 ml conc. HNO3 and dilute with DD water to 1 liter. Alternatively, dilute
one ampoule of commercially available 1000 mg/l Li standard with acidified DD water.
Working standard solutions (0.1 to 5.0 mg/l): Prepare at least four standards to bracket
the expected concentration of the samples.
Standard blank solution: Add 1 ml KCl suppressant solution for every 20 ml acidified DD
water.
Procedure
Optimize the instrument according to instrument’s operating manual.
Dilute samples with high Li so that the concentration falls within the standard calibration
curve. Pipette 20 ml of the sample into a 50 ml Erlenmeyer flask and add 1 ml KCl
suppressant. Mix well.
Aspirate the reagent blank and zero the instrument.
Aspirate each standard in turn into flame and record absorbance. Aspirate acidified DD
water between standards.
Aspirate samples and read the absorbance. Aspirate acidified DD water between samples.
Calculation
Calculate mg/l Li by referring to the calibration curve.
For diluted samples, calculate original mg/l Li using:
mg/l Li = concentration x dilution factor
Quality Assurance/Quality Control
Acidified DD water must be used in the preparation of samples/standards.
Always include reagent and sample blanks in the analysis.
Add suppressant to blanks, standards and samples.
Standard concentrations should bracket the sample concentrations and should be within
the working range. Dilute samples if necessary.
Absorbance values should be within the acceptable working range, as specified in the
manufacturer’s manual.
Check that the first order linearity of the standard calibration curve has r2 0.999.
Analyze the blank and control standard/sample before analyzing samples. The control
standard is a separate preparation from the calibration standards. The value determined
for the control standard/sample should be within 5% of the known or expected
concentration.
Analyze one set of duplicate samples for every ten samples (or with each batch of
samples, whichever is less). Acceptance limits for duplicate samples is 15% for low
levels and 5% for high levels.
Analyze the reagent blank, check standard and control sample/standard after every ten
samples, or with each batch of samples, whichever is less. The check standard is chosen
from one of the calibration standards, while the control standard/sample is a separate
preparation. The value determined should be within 5% of the known or expected
concentration. Otherwise, all samples in the batch should be reanalyzed.
To one sample out of every ten samples (or with each batch of samples, whichever is
less) add a known amount of the metal of interest and reanalyze to confirm recovery.
Recovery of the added metal should be between 95 and 105%. Otherwise, reanalyze the
whole batch.
Check that the result has been multiplied by the dilution factor if dilution was needed.
MAGNESIUM (ATOMIC ABSORPTION SPECTROPHOTOMETRY)
PNOC EDC, Philippines
Scope
This test method covers the determination of magnesium (Mg) in filtered acidified
samples by atomic absorption spectrophotometry (AAS).
The applicable range of this test method is from 0.02 to 2.0 mg/l when using nitrous
oxide acetylene flame and 0.05 to 3.50 mg/l when using the air-acetylene flame at 285.2
nm wavelength. This range may be extended upward by dilution of an appropriate
aliquot.
Adding large excesses of an easily ionized element, such as potassium or lanthanum,
controls ionization interference.
References
American Public Health Association, American Water Works Association and Water
Environment Federation (1995); American Society for Testing and Material (1995b)
Materials and Equipment
Atomic absorption spectrophotometer
Mg hollow cathode lamp
Volumetric flasks, 50 and 100 ml
Automatic dispenser
Pipettes, 1-25 ml
Erlenmeyer flasks, 50 ml, preferably plastic
Reagent bottles, 1 l and 250 ml, plastic
Filter paper, with particle retention of 20-25 µm
Reagents and Standards
50 mg/l K as potassium chloride suppressant, KCl (for nitrous oxide-acetylene flame):
Dissolve 95.82 g KCl, AR, in DD water and dilute to 1000 ml.
50 g/l La as lanthanum oxide, La2O3: Wet 58.7 g La2O3, AR, in DD water. Add slowly
250 ml of concentrated HCl to the mixture. When dissolved, dilute to 1000 ml with DD
water.
Acetylene gas with purity of at least 99.5 vol %: Acetone, which is always present in
acetylene cylinders, can be prevented from entering and damaging the burner system by
replacing a cylinder which has only 75 psig acetylene remaining.
Nitrous oxide, at least medical grade
Compressed air is cleaned and dried by passing it through a suitable filter to remove oil,
water, and other foreign substances.
Conc. HNO3
Acidified DD water: Add 1 ml concentrated HNO3, AR, for every liter DD water.
1000 mg/l Mg stock solution: Dissolve 1.658 g magnesium oxide, MgO, in DD water and
dilute to 1 liter. Alternatively, dilute one ampoule of commercially available 1000 mg/l
Mg standard with acidified DD water.
Working standard solutions (0.02 to 2.0 mg/l Mg for nitrous oxide-acetylene flame, 0.05
to 3.50 mg/l for air-acetylene flame)
Prepare at least four standards to bracket the expected concentration of the samples.
Standard blank solution: Add 1 ml suppressant solution for every 20 ml acidified DD
water.
Procedure
Optimize the instrument according to instrument’s operating manual.
Dilute samples with high Mg so that the concentration falls within the standard
calibration curve. Transfer 20 ml of the sample to a 50 ml Erlenmeyer flask and add 1 ml
suppressant. Mix well.
Aspirate the reagent blank and zero the instrument.
Aspirate each standard in turn into flame and record absorbance. Aspirate acidified DD
water between standards.
Aspirate samples to obtain the absorbance. Aspirate acidified DD water between each
two samples.
Calculation
Calculate mg/l Mg by referring to the calibration curve.
For diluted samples, calculate original mg/l Mg using:
mg/l Mg = concentration x dilution factor
Quality Assurance/Quality Control
Acidified DD water must be used in the preparation of samples/standards.
Always include reagent and sample blanks in the analysis.
Add suppressant to blanks, standards and samples.
Standard concentrations should bracket the sample concentrations and should be within
the working range. Dilute samples if necessary.
Absorbance values should be within the acceptable working range, as specified in the
manufacturer’s manual.
Check that the first order linearity of the standard calibration curve has r2 0.999.
Analyze the blank and control standard/sample before analyzing samples. The control
standard is a separate preparation from the calibration standards. The value determined
for the control standard/sample should be within 5% of the known or expected
concentration.
Analyze one set of duplicate samples for every ten samples (or with each batch of
samples, whichever is less). Acceptance limits for duplicate samples is 15% for low
levels and 5% for high levels.
Analyze the reagent blank, check standard and control sample/standard after every ten
samples, or with each batch of samples, whichever is less. The check standard is chosen
from one of the calibration standards, while the control standard/sample is a separate
preparation. The value determined should be within 5% of the known or expected
concentration. Otherwise, all samples in the batch should be reanalyzed.
To one sample out of every ten samples (or with each batch of samples, whichever is
less) add a known amount of the metal of interest and reanalyze to confirm recovery.
Recovery of the added metal should be between 95 and 105%. Otherwise, reanalyze the
whole batch.
Check that the result has been multiplied by the dilution factor if dilution was needed.
MAGNESIUM (ION CHROMATOGRAPHY)
BRIUG, China
Scope
This test method covers the determination of magnesium in filtered acidified samples by
Ion Chromatography (IC).
The applicable range of this test method is from 0.1 to 20 mg/l when using the IC. This
range may extended upward or downward by dilution of an appropriate aliquot of sample
or enlarging the sample loop.
A small volume of sample, 100 l, is introduced into an ion chromatograph. The anions
of interest are separated and measured, using a system comprising a guard column, an
analytical column, a suppressor device, and a conductivity detector.
Interference can be caused by substances such as potassium and calcium in high
concentrations overlapping the Mg peak. Sample dilution can be used to solve
interference problems.
Reference
Dionex (1992), Keith (1996, EPA Method 300.7)
Material and Equipment
Ion chromatograph with suppressor
Volumetric flasks, 50 and 100 ml
Pipettes, 1-20 ml
Reagent bottles, 50 and 100 ml
Volumetric flasks, 1000 ml
Reagents and Standards
Deionized water with a specific resistance of 17.8 megohm – cm or greater
Eluent : 20 mmole/l methanesulfonic acid : Pipette 1.3 ml methanesulfonic acid into a 1 l
volumetric flask , dilute to 1000 ml using water (4.1), degas the eluent .
1000 mg/l Mg2+
element stock solution: Commercial standard solution
Standard solution (0.5 to 20 mg/l Mg2+
): Prepare at least four standards to bracket the
expected Mg concentrations of the samples
Procedure
Equilibrate the system by pumping eluent through the column and detector until a stable
baseline is attained.
Optimize the instrument according to the instrument’s operation manual.
Inject the standard working solution and construct the standard calibration curve.
Flush the sampling system with each new sample.
Dilute samples when necessary so that the concentration of the element falls within the
standard calibration curve.
Calculation
Calculate mg/l by referring to the calibration curve.
For diluted samples, calculate original mg/l using :
mg/l Mg2+
=concentrationdilution factor
The chromatogram working station can provide the content of Mg2+
directly.
Quality Assurance / Quality Control
Use the same quality deionized water to dilute the samples and to prepare the eluent and
working solution, otherwise, check the blank concentration of the water. Check that the
first order linearity of the standard calibration curve has r2 0.999.
Analyze the control standard/sample after a batch of samples. A control standard should
be prepared separately from the calibration standards. The value determined for the
control standard/sample should be within 5% of the known or expected concentrations.
Analyze one set of duplicate samples. Acceptance precision for duplicate samples is
10%.
To one sample out of every ten samples (or with each batch of samples, whichever is
less) add a known amount of the metal of interest and reanalyze to confirm recovery.
Recovery of the added metal should be between 95 and 105%. Otherwise reanalyze the
whole batch.
PH (ELECTROMETRIC)
PNOC EDC, Philippines
Scope
This method covers the determination of pH in water by electrometric measurement using
the glass electrode as sensor. The sample measurement is made under strictly controlled
laboratory conditions.
Fresh and air-free samples should be analyzed to avoid interference due to carbon dioxide
absorption from the atmosphere.
The true pH of an aqueous solution is affected by the temperature, which can be corrected
using an automatic temperature compensator, or it can be manually compensated for in
other instruments.
Reference
American Public Health Association, American Water Works Association and Water
Pollution Control Federation (1995).
Materials and Equipment
pH/mV meter
pH electrode
Magnetic stirrer with stirring bar
Beakers, 150 ml.
Reagents and Standards
pH 6.86 reference buffer solution: Oven-dry about 5 g each of potassium dihydrogen
phosphate (KH2PO4) and disodium hydrogen phosphate (Na2HPO4) for two hours at
130ºC. Dissolve 3.39 g of KH2PO4 and 3.53 g of Na2HPO4 in DD water and dilute to one
liter. Alternatively, use calibrated commercially available pH 7.00 buffer solution.
pH 4.00 reference buffer solution: Dissolve 10.12 g of oven-dried (2 hours at 110ºC)
potassium hydrogen phthalate (KC8H5O4) in DD water and dilute to one liter.
Alternatively, use calibrated commercially available pH 4.00 buffer solution.
Procedure
Standardize the pH/mV meter according to the instrument’s operating manual using pH
4.00 and pH 6.86 or pH 7.00 buffer solutions.
Transfer about 50 ml sample into a 150 ml beaker. Immerse pH electrode in the sample.
Ensure that the junction hole of the electrode is submerged.
Establish equilibrium between electrodes and sample by stirring the sample to ensure
homogeneity. Stir gently to minimize carbon dioxide entrapment.
Record the pH and temperature of the sample. Report the pH values and temperature of
the measurement to the nearest 0.1 pH unit and 1ºC, respectively.
Quality Assurance/Quality Control
Calibrate the pH electrode using at least two (2) buffers, whose pH should bracket the
expected pH of the sample. Slope should be between 0.95 and1.05.
The standard mV value for pH 7.0 buffer solution at 25ºC should be between 0 ± 30 mV.
For pH 4.0 buffer solution, the mV value should be approximately 160 mV greater than
the pH 7.0 mill volt reading.
Perform buffer check after every five (5) samples. Value determined should be 0.1 pH
unit of the theoretical value. Otherwise, recalibrate the pH meter.
POTASSIUM (ATOMIC ABSORPTION SPECTROPHOTOMETRY)
PNOC EDC, Philippines
Scope
This test method covers the determination of potassium (K) in filtered acidified samples
by atomic absorption spectrophotometry (AAS).
The applicable range of this test method is from 0.40 to 1.50 mg/l at 766.5 nm, 1.10 to
4.40 mg/l at 769.9 nm, and 150 to 580 mg/l at 404.4 nm wavelength. These ranges may
be extended upward either by dilution of an appropriate aliquot of sample or rotating the
burner head.
Adding large excesses of an easily ionized element, such as cesium ion, controls
ionization interference.
References
American Public Health Association, American Water Works Association and Water
Environment Federation (1995); American Society for Testing and Material (1995d).
Materials and Equipment
Atomic absorption spectrophotometer
K hollow cathode lamp
Volumetric flasks, 50 and 100 ml
Automatic dispenser
Pipettes, 1-25 ml
Erlenmeyer flasks, 50 ml, preferably plastic.
Reagent bottles, 1 liter and 250 ml, plastic
Filter paper, with particle retention of 20-25 µm
Reagents and Standards
50 g/l Cs as cesium chloride suppressant, CsCl: Dissolve 63.66 g CsCl, AR, in DD water
and dilute to 1000 ml.
Acetylene gas with purity of at least 99.5 vol %
Acetone, which is always present in acetylene cylinders, can be prevented from entering
and damaging the burner system by replacing a cylinder when only 75 psig acetylene
remain.
Compressed air is cleaned and dried by passing it through a suitable filter to remove oil,
water, and other foreign substances.
Acidified DD water: Add 1 ml concentrated HNO3, AR, for every liter DD water.
1000 mg/l K stock solution: Dry about 2.5 g KCl to constant weight at 105ºC. Dissolve
1.907 g KCl in DD water and dilute to 1 liter. Alternatively, dilute one ampoule of
commercially available 1000 mg/l K standard with acidified DD water.
Working standard solutions (0.40-1.50, 1.10-4.40 or 150-580 mg/l K): Prepare at least
four standards to bracket the expected concentration of the samples at the appropriate
wavelength.
Standard blank solution: Add 1 ml CsCl suppressant solution for every 20 ml acidified
DD water.
Procedure
Optimize the instrument according to instrument’s operating manual.
Dilute samples with high K so that the concentration falls within the standard calibration
curve. Pipette 20 ml of the sample to a 50 ml Erlenmeyer flask and add 1 ml CsCl
suppressant. Mix well.
Aspirate the reagent blank and zero the instrument.
Aspirate each standard in turn into the flame and record absorbance. Aspirate acidified
DD water between standards.
Aspirate samples and read the absorbance. Aspirate acidified DD water between samples.
Calculation
Calculate mg/l K by referring to the calibration curve.
For diluted samples, calculate original mg/l K using:
mg/l K = concentration x dilution factor
Quality Assurance/Quality Control
Acidified DD water must be used in the preparation of samples/standards.
Always include reagent and sample blanks in the analysis.

Add suppressant to blanks, standards and samples.
Standard concentrations should bracket the sample concentrations and should be within
the working range. Dilute samples if necessary.
Absorbance values should be within the acceptable working range, as specified in the
manufacturer’s manual.
Check that the first order linearity of the standard calibration curve has r20.999.
Analyze the blank and control sample/standard before analyzing samples. The control
standard is a separate preparation from the calibration standards. The determined value of
the control sample/standard should be within 5% of the known or expected
concentration.
Analyze one set of duplicate samples for every ten samples (or with each batch of
samples, whichever is less). Acceptance limits for duplicate samples is 15% for low
levels and 5% for high levels.
Analyze the reagent blank, check standard and control sample/standard after every ten
samples, or with each batch of samples, whichever is less. The check standard is chosen
from one of the calibration standards, while the control sample/standard is a separate
preparation. The determined value should be within 5% of the known or expected
concentration. Otherwise, all samples in the batch should be reanalyzed.
To one sample out of every ten samples (or with each batch of samples, whichever is
less) add a known amount of the metal of interest and reanalyze to confirm recovery.
Recovery of the added metal should be between 95 and 105%. Otherwise, reanalyze the
whole batch.
Check that the result has been multiplied by the dilution factor if dilution was needed.

POTASSIUM (ION CHROMATOGRAPHY)
BRIUG, China
Scope
This test method covers the determination of potassium in filtered acidified sample by
Ion Chromatography (IC).
The applicable range of this test method is from 0.1 to 20 mg/l when using the IC. This
range may be extended upward or downward by dilution of an appropriate aliquot of
sample or enlarging the sample loop.
A small volume of sample, 100 ul is introduced into an ion chromatograph. The anions of
interest are separated and measured, using a system comprising a guard column, an
analytical column, a suppressor device, and a conductivity detector.
Interference can be caused by substances such as sodium, ammonium and magnesium in
high concentrations overlapping the K peak. Sample dilution can be used to solve
interference problems.
Reference
Dionex (1992), Keith (1996, EPA Method 300,7).
Materials and Equipment
Ion chromatograph with suppressor
Volumetric flasks, 50 and 100 ml
Pipettes, 1-20 ml
Reagent bottles, 50 and 100 ml
Volumetric flasks, 1000 ml
Reagents and Standards
Deionized water with a specific resistance of 17.8 megohm – cm or greater
Eluent: 20 mmole/l methanesulfonic acid: Pipette 1.3 ml methanesulfonic acid into a 1 l
volumetric flask, dilute to 1000 ml using water (4.1), degas the eluent.
1000 mg/l K+
element stock solution: Commercial standard solution
Standard solution (0.5 to 20 mg/l K+): Prepare at least four standards to bracket the
expected K concentrations of the samples
Procedure
Equilibrate the system by pumping eluent through the column and detector until a stable
baseline is attained.
Optimize the instrument according to the instrument’s operation manual.
Inject the standard working solution and construct the standard calibration curve.
Flush the sampling system with each new sample.
Dilute samples when necessary so that the concentration of the element falls within the
standard calibration curve.
Calculation
Calculate mg/l by referring to the calibration curve.
For diluted samples, calculate original mg/l using:
mg/l K+=concentrationdilution factor
The chromatogram working station can provide the content of K+ directly.
Quality Assurance / Quality Control
Use the same quality deionized water to dilute the samples and to prepare the eluent and
working solution, otherwise, check the blank concentration of the water. Check that the
first order linearity of the standard calibration curve has r2 0.999.
Analyze the control sample/standard after a batch of samples. A control standard should
be prepared separately from the calibration standards. The value determined for the
control sample/standard should be within 5% of the known or expected concentrations.
Analyze one set of duplicate samples. Acceptance limit for duplicate samples is 10%.
To one sample out of every ten samples (or with each batch of samples, whichever is
less) add a known amount of potassium and reanalyze to confirm recovery. Recovery of
the added potassium should be between 95 and 105%. Otherwise, reanalyze the whole
batch.
POTASSIUM (ATOMIC EMISSION SPECTROSCOPY (AES)
CAIR-BATAN, Indonesia
Scope
This test method covers the determination of potassium (K+)
in filtered acidified samples
by Atomic Emission Spectrophotometry (AES) using an Atomic Absorption
Spectrophotometer (AAS)
The applicable range of this test method is from 0.25 to 2.0 mg/l using the 766,5 nm
wavelength.
Lanthanum oxide is added as suppressant to arrest ionization interference.
References
American Public Health Association Water Works Association and Water
Pollution Control Federation (1985); Rodier (1975).
Materials and Equipment
Atomic absorption spectrophotometer.
Volumetric flasks, 25 and 50 ml.
Pipettes, 1-25 ml
Erlenmeyer flasks, 50 ml.
Reagent bottles, 500 and 250 ml, preferably plastic
Filter, with particle retention of 0,45 m.
Air compressor
Reagents and Standards
La2O3 solution, 5000 mg/l, wet 5.8637 g La2O3 in 2% HNO3 solution, and dilute to 1000
ml using DD water.
Acetylene gas.
Compressed air.
1000 mg/l K stock standard solution: Dissolve 1.907 g KCl in 1% HNO3 solution, dilute
to 1 l with DD water.
Working standard solution (0.25 to 2.0 mg/l K): Prepare five standards to bracket the
expected concentration of the samples.
Standard blank solution: Add 2.5 ml La2O3 suppressant for every 25 ml DD water.
Procedure
Optimize the instrument according to instrument’s operating manual.
Dilute samples with high K so that concentration falls within the standard calibration
curve.
Aspirate the reagent blank to zero the instrument
Aspirate each standard in turn into flame and read the emission
Aspirate the samples between standards and read the emission.
Calculation
Calculate mg/l K by referring to the calibration curve.
For diluted samples, calculate original mg/l K using
mg/l K= concentration x dilution factor
Quality Assurance/Quality control
DD water must be used in the preparation of samples/standards.
Always include reagent blanks in the analysis.
Add suppressant (La2O3 solution) to blanks, standards and samples.
Standard concentrations should bracket the sample concentrations and should be within
the working range. Dilute samples if necessary.
Emission values should be within the acceptable standard working range, as specified in
the manufacturer’s manual.
Check that the first order linearity of the standard calibration curve has r2 0.999. The
slope has to be checked for every 10 (ten) measurements together with the blank and
standard solution.
Analyze the blank and the calibration standard before analyzing samples. The value
determined should be within 5% of the known or expected concentrations.
Spike every 3 (three) samples; the recovery should be between 93.5 - 104.5 %.
SILICA-TOTAL (SPECTROPHOTOMETRIC WITH AMMONIUM-
MOLYBDATE)
PNOC EDC, Philippines
Scope
This test method covers the determination of silica in natural water and geothermal brine
by the molybdosilicate method.
The method includes alkaline digestion to break down polymeric silica. Ammonium
molybdate at pH approximately 1.2 reacts with monomeric silica and any phosphate
present to produce heteropoly acids. Oxalic acid is added to destroy the
molybdophosphoric acid but not the molybdosilicic acid. The intensity of yellow color is
proportional to the concentration of “molybdate-reactive silica”, and is analyzed at 410
nm.
The method is applicable to acidified samples with silica concentrations in the range 10-
800 mg/l. Higher concentrations can be determined after appropriate dilutions.
Color and turbidity will interfere if not removed by filtration or dilution.
Phosphate, sulfide and ferric ion interfere in the color reaction. Addition of oxalic acid
eliminates phosphate and ferric ion interferences. In cases of high sulfide, samples
require bubbling. Sulfide may alternatively be removed by adding iodine and then
thiosulfate to remove excess iodine.
Avoid using glassware and reagents with significant amounts of silica to minimize
contamination.
References
Ellis and Mahon (1977); Giggenbach and Goguel (1989)
Materials and Equipment
UV-visible Spectrophotometer
Water Bath
Volumetric flask, 100 ml, plastic with screw cap
Pipettes, 2 to 5 ml
Reagent dispenser or pipettor
Reagents and Standards
10% (w/v) Ammonium molybdate, (NH4)6Mo7O24H2O: Dissolve 10 g
(NH4)6Mo7O24H2O in DD water then dilute to 100 ml. Adjust to pH 7 with NaOH. Store
in plastic bottle.
6 N HCl: Mix equal volumes of concentrated HCl and DD water.
6 N NaOH: Dissolve 24 g NaOH pellets in DD water and dilute to 100 ml.
15% (w/v) oxalic acid, C2H2O4H2O: Dissolve 15 g C2H2O4H2O in DD water and dilute to
100 ml.
Absolute ethanol C2H6O: 1% (w/v) phenolphthalein indicator: Dissolve 1 g of
phenolphthalein powder, AR, in 150 ml ethanol and dilute to 100 ml with DD water.
Store in plastic bottle.
1,000 mg/l silicon stock solution: Dilute one ampoule commercially available 1000 mg/l
Si standard to 1 liter with DD water.
Working standard solutions:Low concentration range (10 to 100 mg/l Si equivalent to
21.4 to 214 mg/l SiO2). Prepare at least four standards to bracket the expected
concentration of the samples.
High concentration range (100 to 800 mg/l Si equivalent to 214 to 1712 mg/l SiO2):
Prepare at least four standards to bracket the expected concentration of the samples.
Procedure
Shake or stir sample. When working in the high Si concentration range, pipette 2 ml
standard solutions and samples into individual 100-ml volumetric flasks. In the case of
low concentration range, pipette 10 or 20 ml standard solutions and samples into 100-ml
volumetric flasks.
Prepare a reagent blank by treating 2, 10 or 20 ml aliquot of DD water, as required.
Add 2 to 3 drops of phenolphthalein indicator.
Add 0.5 ml 6 N NaOH and rinse sides of flask with DD water.
Cover with cap and heat in water bath for 45 minutes to 1 hour at 80-90C.
Remove from water bath and cool.
Add 2 ml 6 N HCl and 5 ml ammonium molybdate solution. Shake and allow to stand for
15 minutes.
Add 2 ml 15% oxalic acid, dilute to mark with DD water and shake.
Measure the absorbance of the samples at 410 nm against the reagent blank.
Calculation
Read silica concentration in mg/l directly from the instrument or prepare a standard
calibration curve to read the sample concentration. Check that the concentration is
expressed as SiO2 not Si.
For diluted samples, calculate the original concentration using:
mg/l SiO2 = concentration x dilution factor
Quality Assurance/Quality Control
Always include reagent and sample blanks in the analysis.
Standard concentrations should bracket the sample concentrations and be within the
working range. Dilute samples if necessary.
Absorbance values should be within the acceptable working range, as specified in the
manufacturer’s manual.
Check that the first order linearity of the standard calibration curve has r2 0.999.
Ensure that the absorbance to concentration ratio of the calibration standards is consistent
within 95% confidence range of previously established values. Discard standards, which
deviate from the acceptable ratio.
Analyze the reagent blank and control sample/standard before analyzing samples. The
control standard is a separate preparation from the calibration standards. The value
determined for the control sample should be within 5% of the known or expected
concentration.
Only ten (10) samples should be analyzed per batch run.
Analyze samples in duplicate. Acceptance limit is 5%.
Analyze the reagent blank, check standard and control sample/standard after every five
samples, or with each batch of samples, whichever is less. The check standard is chosen
from one of the calibration standards. The values determined should be within 5% of the
known or expected concentration. Otherwise, all samples in the batch should be
reanalyzed.
To one sample out of every five (or with each batch of samples, whichever is less) add a
known amount of the standard and reanalyze to confirm recovery. Recovery of standard
should be between 95 and 105%. Otherwise, reanalyze the whole batch.
Check that the result has been multiplied by the dilution factor if dilution was needed.
SILICA (SPECTROPHOTOMETRIC WITH AMMONIUMMOLYBDATE AND
HETEROPOLY BLUE)
PNOC EDC, Philippines
Scope
This test method covers the determination of low silica levels in geothermal fluids.
Ammonium molybdate at pH approximately 1.2 reacts with silica and any phosphate
present to produce heteropoly acids. Oxalic acid is added to destroy the
molybdophosphoric acid but not the molybdosilicic acid. The yellow molybdosilicic acid
is reduced by means of aminonaphtholsulfonic acid to heteropoly blue, and is analyzed at
815 nm.
The range of this method is from 0.02 to 1.00 mg/l of silica.
Color and turbidity will interfere if not removed by filtration or dilution.
Phosphate, sulfide and ferric ion interfere in the color reaction. Addition of oxalic acid
eliminates phosphate and ferric ion interferences. Sample requires bubbling to eliminate
H2S interference. Sulfide may alternatively be removed by adding iodine and then
thiosulfate to remove excess iodine.
References
American Public Health Association, American Water Works Association and Water
Pollution Control Federation (1995); American Society for Testing and Material (1995a).
Materials and Equipment
UV-visible Spectrophotometer
Volumetric flask, 100 ml capacity, plastic with screw cap
Pipettes, 5 to 20 ml
Reagent dispenser or pipettor
Reagents and Standards
10% (w/v) Ammonium molybdate (NH4)6Mo7O24H2O: Dissolve 10 g (NH4)6Mo7O24H2O
in DD water then dilute to 100 ml. Adjust to pH 7 by adding NaOH. Store in a plastic
bottle.
6 N HCl: Mix equal volumes of concentrated HCl and DD water.
Amino-naphtol sulfonic acid (ANSA) solution: Dissolve 1 g Na2SO3 and 30 g NaHSO3 in
about 100 ml DD water. Dissolve 0.50 g ANSA in this solution and dilute to 200 ml.
Store in a plastic reagent bottle.
1000 mg/l silicon stock solution: Dilute one commercially available ampoule, 1000 mg/l
Si standard to 1 liter with DD water.
100 mg/l silicon stock solution: Dilute 10 ml 1000 mg/l Si standard to 100 ml with DD
water.
Working standard solutions (0.10 to 1.0 mg/l Si equivalent to 0.21 to 2.14 mg/l SiO2):
Prepare at least four standards to bracket the expected concentration of the samples.
Procedure
Transfer about 100 ml of sample into a beaker. Bubble N2 gas into the sample for 15 to
30 minutes to remove H2S.
Pipette 50 ml standard solutions and samples into individual 100 ml volumetric flasks.
Prepare a reagent blank by treating a 50 ml aliquot of DD water.
Add in rapid succession 1 ml 6 N HCl and 2 ml 10% ammonium molybdate. Mix and
allow to stand for exactly five minutes.
Add 1.5 ml 10% oxalic acid and mix well.
After one minute, add 2 ml ANSA. Mix and allow to stand for 10 minutes.
Measure the absorbance of the samples at 815 nm against the reagent blank.
Calculation
Read silica concentration in mg/l directly from the instrument or prepare standard
calibration curve to read the sample concentration from. Check that the concentration is
expressed as SiO2 and not Si.
Quality Assurance/Quality Control
Always include reagent and sample blanks in the analysis.
Standard concentrations should bracket the sample concentrations and should be within
the working range. Dilute samples if necessary.
Absorbance values should be within the acceptable working range, as specified in the
manufacturer’s manual.
Check that the first order linearity of the standard calibration curve has r2 0.999.
Ensure that the absorbance to concentration ratio of the calibration standards is consistent
within 95% confidence range of previously established values. Discard standards, which
deviate from the acceptable ratio.
Analyze the reagent blank and control sample/standard before analyzing samples. The
control standard is a separate preparation from the calibration standards. The value
determined for the control sample should be within 5% of the known or expected
concentration.
Analyze samples in duplicate. Acceptance limit is 5%.
Analyze the reagent blank, check standard and control sample/standard after every five
samples, or with each batch of samples, whichever is less. The check standard is chosen
from one of the calibration standards. The values determined should be within 5% of the
known or expected concentration. Otherwise, all samples in the batch should be
reanalyzed.
To one sample out of every five (or with each batch of samples, whichever is less) add a
known amount of the standard and reanalyze to confirm recovery. Recovery of standard
should be between 95 and 105%. Otherwise, reanalyze the whole batch.
Check that the result has been multiplied by the dilution factor if dilution was needed.
SILICA (ATOMIC ABSORPTION SPECTROPHOTOMETRY)
GESAL, El Salvador
Scope
This test method covers the determination of silica usually present in geothermal waters,
in filtered acidified (pH 1.2-1.5) samples by atomic absorption spectrophotometry (AAS).
The applicable range of this method is from 50 to 500 mg/l when using the 250.7 nm
wavelength.
In flame atomic absorption spectrophotometry, a sample is aspirated into a flame and
atomized. A light beam is directed through the flame, into a monochromator, and into a
detector with which the amount of light absorbed by the atomized element in the flame is
measured. For some metals, atomic absorption exhibits superior sensitivity over flame
emission. Because each metal has its own characteristic absorption wavelength, a source
lamp composed of that element is used; this makes the method relatively free from
spectral or radiation interferences. The amount of energy at the characteristic wavelength
absorbed in the flame is proportional to the concentration of the element in the sample
over a limited concentration range.
Severe depression of silicon absorbance has been observed in the presence of
hydrofluoric acid, boric acid and potassium at significant levels (1%). The effect is
minimized by adjusting the flame to neutral stoichiometry (red cone 0.5-1 cm high), with
consequent loss of sensitivity.
References
American Public Health Association, American Water Works Association, Water
Environment Federation (1995); Skoog and Leary (1994).
Materials and Equipment
Atomic absorption spectrophotometer
Silicon hollow cathode lamp
Volumetric flasks, 50, 100 and 200 ml
Pipettes 2-10 ml
500 ml plastic flasks
Filter paper, Whatman No. 42
Pumping system to introduce and automatically dilute sample (SIPS)
Reagents and Standards
Concentrated nitric acid, HNO3
Acetylene gas with purity of at least 98.0 vol %
Acetone is always present in acetylene cylinders. Serious damage in the burner system
can be prevented by replacing a cylinder when only 80 psig acetylene remain.
Air compressor is cleaned and dried by passing the gas through a suitable filter to remove
oil, water, and other foreign substances.
Nitrous oxide gas with purity of at least 99.2 %.
Fit nitrous oxide cylinder with a special non-freezable regulator or wrap a heating coil
around an ordinary regulator to prevent flashback at the burner caused by a reduction in
nitrous oxide flow through a frozen regulator.
Acidified DD water. Add 10 ml concentrated nitric acid, HNO3, for every 500 ml DD
water.
Acidified standard silica stock solution, 1000 mg/l: Silica stock solution may be
purchased as a certified solution or prepared as described below: Fuse 0.2139 g of silicon
dioxide with 2 g of sodium carbonate in a platinum crucible. Dissolve with DD water and
transfer to a 100 ml volumetric flask and dilute to 1 liter with DD acidified water.
Working standard solutions: Prepare at least four standards in the expected concentration
range of the sample
Standard blank solution: Add 2 ml concentrated HNO3, dilute to 100 ml with acidified
DD water.
Procedure
Optimize the instrument according to instrument’s operating manual. (Follow the safety
guidelines specified by the equipment manufacturer).
Wash SIPS for 15 minutes with DD water to eliminate any type of contaminants in the
whole pumping system.
Verify the sensitivity and stability of the signal using the highest concentration standard
prepared for the calibration curve, (e.g. for a wavelength of 250.7 nm one 240 mg/l
standard must read 0.2 of absorbance).
When stable, proceed to set zero absorbance and then prepare the calibration curve
manually with the help of the sample dilution system i.e. read the blank and then the
standards from lower to higher concentrations and make the program subtract the blank
absorbance from each standard until a linear calibration curve is obtained. If there is an
auto dilution system program follow the preparation of the calibration curve is succeeded
by a washing step.
If there is no auto dilution system, prepare standards of 100, 200, 300, 400 and 500 mg/l
and the calibration curve.
When the calibration curve has been prepared read the standard absorbance.
Analyze one control sample/standard and fourteen samples. Rinse the system after every
sample reading.
If the concentration of a sample is out of the range of the calibration curve, introduce into
the auto dilution program a suitable dilution factor. If an auto dilution system is not
available make suitable dilutions.
Recalibrate the system after fourteen samples.
Calculations
Calculate mg/l SiO2 by referring to the calibration curve,
mg/l SiO2 = silicon concentration in mg/l x 2.14
For diluted samples, calculate original mg/l SiO2 using:
mg/l SiO2 = silicon concentration x 2.14 x dilution factor
Where 2.14 is gravimetric factor to convert silicon to silica
Quality control
All the samples must be filtered and acidified previously to keep the analytes in solution.
Always include reagent and sample blanks in the analysis.
Standard concentrations should bracket the sample concentrations and should be within
the working range. Dilute samples if necessary.
Absorbance values should be within the acceptable working range, as specified in the
manufacturer's manual.
Check that the precision of the standard calibration curve is < 0.1%.
Analyze the control sample/standard before analyzing samples. The control standard is a
separate preparation from the calibration standards. The percent difference between the
concentration value determined by the equipment and the theoretical one must be within
5%.

Recalibrate the equipment after every fourteen samples. Analyze the control
sample/standard after recalibration verifying the percent difference between the
theoretical and analyzed values. If the results were out of range, a new calibration must
be carried out.
To one sample out of every five (or with each batch of samples, whichever is less) add a
known amount of the standard and reanalyze to confirm recovery. Recovery of standard
should be between 95 and 105%. Otherwise, reanalyze the whole batch.
SILICA, TOTAL (ICP– ATOMIC EMISSION SPECTROMETRY)
DMGM, Malaysia
Scope
Total silica in filtered and acidified water samples is determined by this method.
The applicable range of this method is 0.005 – 250 mg/l using the emission line at
251.611 nm.
Main sources of interferences are: spectral interferences, non-spectral interferences and
chemical interferences
Spectral interferences can be minimized by selecting the emission lines with the smallest
line overlaps, while non-spectral interferences and chemical interferences can be
minimized by matrix matching the standards to the samples.
References
ICP–AES Manufacturer’s Manual: American Public Health Association, American Water
Works Association and Water Pollution Control Federation (1989).
Materials and Equipment
Inductively coupled plasma – atomic emission spectrophotometer.
Volumetric flasks, 1000 ml and 100 ml.
Pipettes, 2 – 20 ml
Polyethylene test tubes
Reagent bottles, 1 l and 250 ml, plastic.
Reagents and Standards
Concentrated nitric acid, HNO3
Deionized water
Argon gas with purity of at least 99.995%
1000 mg/l Si stock solution: Dissolve 10.1190 g sodium metasilicate; Na2SiO3.9H2O in
700 ml deionized water containing 50 ml concentrated HNO3. Transfer the solution to a 1
l volumetric flask and dilute to mark with deionized water. Store in a plastic bottle.
100 mg/l Si stock solution: Dilute 10 ml of 1000 mg/l Si stock solution to 100 ml with
5% HNO3 solution. Store in a plastic bottle.
Working standard solutions: Prepare two standards to bracket the expected concentration
of the sample. One standard per order of magnitude is sufficient, for example 5 mg/l and
50 mg/l. Dilute to volume with 1% HNO3.
Standard blank solution: Prepare 1% HNO3 solution.
Procedure
Optimize the instrument and make measurements according to the manufacturer’s
instruction manual.
Transfer a suitable amount of well-mixed nitric acid preserved sample solution into a
small polyethylene test-tube.
Run blank and working standards and obtain readings.
Run samples and obtain readings.
Calculation
Calculate mg/l Si from the calibration curve.
To report the value as mg/l SiO2 multiply mg/l Si with 2.1393.
Quality Assurance / Quality Control
Run a sample with known amounts of SiO2 or a certified reference standard. Prepare the
sample with the same acid matrix.
Recheck the standards after running 10 samples to determine if significant instrument
drift has occurred. Recalibrate the instrument if the results are not within + 5% of the
expected values.
Test for matrix interference by spiking the test sample with known amounts of silica.
Recovery of the addition should be between 95% and 105%.
SODIUM AND POTASSIUM (ICP-ATOMIC EMISSION SPECTROMETRY)
IAEA Isotope Hydrology Lab, Austria
Scope
The ICP-AES method is used to analyze sodium and potassium in acidified water
samples with concentrations ranging from 5-100 mg/l for sodium and from 1-20 mg/l for
potassium. Water samples with higher concentrations should be diluted appropriately.
The sample is introduced into the instrument as a stream of liquid that is converted inside
the instrument into an aerosol and then transported to the plasma where it is vaporized,
atomized, and ionized. The excited atoms and ions emit their characteristic radiation,
which is collected and sorted by wavelength. The radiation is detected and turned into
electronic signals that are converted into concentrations.
The sample matrix can cause physical interferences and total salt concentrations of more
than 0.5 % might cause ionization and viscosity interferences.
References
American Public Health Association, American Water Works Association, Water
Environment Federation (1992); Boss and Fredeen (1993).
Materials and Equipment
Perkin Elmer PLASMA 400
Perkin Elmer AS 90 Autosampler
PC: Digital DEC pc Lpv 433dx with Perkin Elmer software
Millipore equipment for filtration and 0.45um filters
Volumetric flasks
Pipettes and micropipettes, 1-50 ml
Vials, 50 ml for auto-sampler
Reagents and Standards
Deionized distilled water (DD water): Use deionized distilled water to prepare all
reagents and calibration standards.
Hydrocloric acid, HCl, conc., and diluted 1:1 with DD water
Nitric acid, HNO3, conc., and diluted 1:1 with DD water
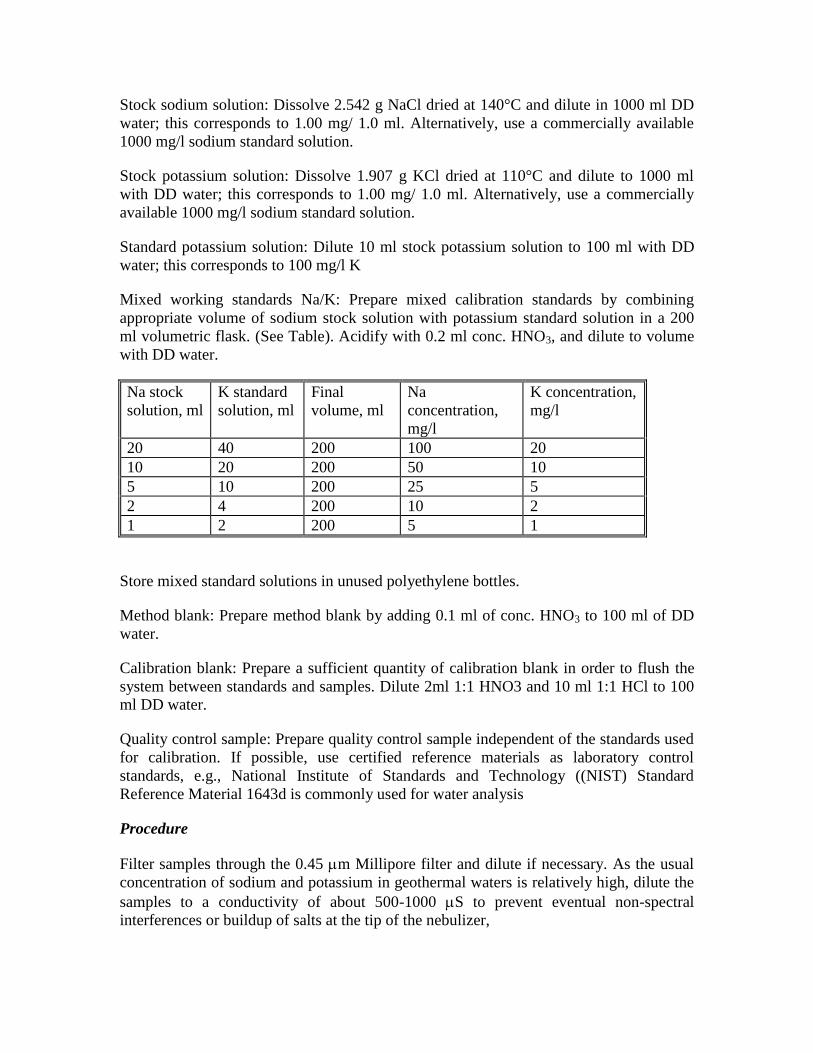
Stock sodium solution: Dissolve 2.542 g NaCl dried at 140°C and dilute in 1000 ml DD
water; this corresponds to 1.00 mg/ 1.0 ml. Alternatively, use a commercially available
1000 mg/l sodium standard solution.
Stock potassium solution: Dissolve 1.907 g KCl dried at 110°C and dilute to 1000 ml
with DD water; this corresponds to 1.00 mg/ 1.0 ml. Alternatively, use a commercially
available 1000 mg/l sodium standard solution.
Standard potassium solution: Dilute 10 ml stock potassium solution to 100 ml with DD
water; this corresponds to 100 mg/l K
Mixed working standards Na/K: Prepare mixed calibration standards by combining
appropriate volume of sodium stock solution with potassium standard solution in a 200
ml volumetric flask. (See Table). Acidify with 0.2 ml conc. HNO3, and dilute to volume
with DD water.
Na stock
solution, ml
K standard
solution, ml
Final
volume, ml
Na
concentration,
mg/l
K concentration,
mg/l
20 40 200 100 20
10 20 200 50 10
5 10 200 25 5
2 4 200 10 2
1 2 200 5 1
Store mixed standard solutions in unused polyethylene bottles.
Method blank: Prepare method blank by adding 0.1 ml of conc. HNO3 to 100 ml of DD
water.
Calibration blank: Prepare a sufficient quantity of calibration blank in order to flush the
system between standards and samples. Dilute 2ml 1:1 HNO3 and 10 ml 1:1 HCl to 100
ml DD water.
Quality control sample: Prepare quality control sample independent of the standards used
for calibration. If possible, use certified reference materials as laboratory control
standards, e.g., National Institute of Standards and Technology ((NIST) Standard
Reference Material 1643d is commonly used for water analysis
Procedure
Filter samples through the 0.45 m Millipore filter and dilute if necessary. As the usual
concentration of sodium and potassium in geothermal waters is relatively high, dilute the
samples to a conductivity of about 500-1000 S to prevent eventual non-spectral
interferences or buildup of salts at the tip of the nebulizer,
Transfer samples to the 50 ml vials and ensure that the temperatures of samples and
standards are similar and the pH is below 2.
Carry out measurements at the selected wavelengths of 766.490 nm for potassium and
589.592 nm for sodium. Other operating conditions such as: PMT voltages, background
correction, argon flow rates, RF power, etc., depend on the model of the ICP instrument;
therefore for routine analysis refer to the manufacturer’s instructions.
Calibrate the instrument using working standards and blank. Aspirate each standard or
blank for 20 sec. after reaching the plasma before beginning signal integration. Rinse
with calibration blank for at least 60 sec. between each standard to eliminate any traces of
the previous standard. During sample analysis continue to rinse with calibration blank for
at least 60 sec. between each sample.
Calculation
The concentration of samples is calculated using computer software supplied by the
instrument manufacturer.
If the sample was diluted, multiply results by a dilution factor.
mg/l Na = concentration x dilution factor
Quality Assurance/Quality Control
Analyze quality control standard prior to analysis of samples, to verify accuracy and
stability of the calibration standards. If the result obtained is not within ± 5 % of the
certified value, prepare new calibration standards and recalibrate the instrument.
Analyze reagent blank and check standard after every 10 samples or with each batch of
samples to determine if instrument drift has occurred. This standard is chosen from one
of the calibration standards. The check standard should also be the last sample analyzed
in each run. The value obtained should be within ± 5 % of the expected concentration,
otherwise all samples analyzed after the last acceptable value must be reanalyzed.
Analyze samples in duplicate. Acceptable limit for duplicates is ± 5 %.
Sample concentration should be within the range of the calibration curve. Samples with
concentrations higher than the highest standard concentration should be diluted.
To verify result and exclude matrix interferences dilute every 10th
sample and every one
with a high salt content. As mentioned before, interferences caused by high salt content
can be solved by diluting the samples to a conductivity of about 500-1000 S. The result
obtained for different dilutions should agree within ± 5 %. If the agreement is not
acceptable, samples should be further diluted until the values determined for two
different dilutions agree to within ± 5 %.
SODIUM (ATOMIC ABSORPTION SPECTROPHOTOMETRY)
PNOC EDC, Philippines
Scope
This test method covers the determination of sodium (Na) in filtered acidified samples by
atomic absorption spectrophotometry (AAS).
The applicable range of this test method is from 0.20 to 3.0 mg/l when using the 589.6
nm wavelength. This range may be extended upward either by dilution of an appropriate
aliquot of sample, or using the less sensitive 330.2 nm wavelength, or rotating the burner
head.
Adding large excesses of an easily ionized element, such as potassium, controls
ionization interference.
References
American Public Health Association, American Water Works Association and Water
Pollution Control Federation (1995); American Society for Testing and Material (1995e).
Materials and Equipment
Atomic absorption spectrophotometer
Na hollow cathode lamp
Volumetric flasks, 50 and 100 ml
Automatic dispenser
Pipettes, 1-25 ml
Erlenmeyer flasks, 50 ml, preferably plastic.
Reagent bottles, 1 liter and 250 ml, plastic
Filter paper, with particle retention of 20-25 µm
Reagents and Standards
50 g/l K as potassium chloride suppressant, KCl: Dissolve 95.82 g KCl, AR, in DD water
and dilute to 1000 ml.
Acetylene gas with purity of at least 99.5 vol %
Acetone, which is always present in acetylene cylinders, can be prevented from entering
and damaging the burner system by replacing a cylinder when only 75 psig acetylene
remain.
Compressed air is cleaned and dried by passing it through a suitable filter to remove oil,
water, and other foreign substances.
Acidified DD water: Add 1 ml concentrated HNO3, AR, for every liter DD water.
1000 mg/l Na stock solution: Dry about 3 g NaCl to constant weight at 105ºC. Dissolve
2.542 g NaCl in DD water and dilute to 1 liter. Alternatively, dilute one ampoule of
commercially available 1000 mg/l Na standard with acidified DD water.
Working standard solutions (0.20 to 3.0 mg/l Na for low concentration and 25 to 300
mg/l Na for high concentration)
Prepare at least four standards to bracket the expected concentration of the samples.
Standard blank solution: Add 1 ml KCl suppressant solution for every 20 ml acidified DD
water.
Procedure
Optimize the instrument according to instrument’s operating manual.
Dilute samples with high Na so that the concentration falls within the standard calibration
curve. Pipette 20 ml of the sample to 50 ml Erlenmeyer flask and add 1 ml KCl
suppressant. Mix well.
Aspirate the reagent blank and zero the instrument.
Aspirate each standard in turn into flame and record absorbance. Aspirate acidified DD
water between standards.
Aspirate samples and read the absorbance. Aspirate acidified DD water between samples.
Calculation
Calculate mg/l Na by referring to the calibration curve.
For diluted samples, calculate original mg/l Na using:
mg/l Na = concentration x dilution factor
Quality Assurance/Quality Control
Acidified DD water must be used in the preparation of samples/standards.
Always include reagent and sample blanks in the analysis.

Add suppressant to blanks, standards and samples.
Standard concentrations should bracket the sample concentrations and should be within
the working range. Dilute samples if necessary.
Absorbance values should be within the acceptable working range, as specified in the
manufacturer’s manual.
Check that the first order linearity of the standard calibration curve has r2 0.999.
Analyze the blank and control sample/standard before analyzing samples. The control
standard is a separate preparation from the calibration standards. The value determined
for the control sample/standard should be within 5% of the known or expected
concentration.
Analyze one set of duplicate samples for every ten samples (or with each batch of
samples, whichever is less). Acceptance limits for duplicate samples is 15% for low
levels and 5% for high levels.
Analyze the reagent blank, check standard and control sample/standard after every ten
samples, or with each batch of samples, whichever is less. The check standard is chosen
from one of the calibration standards, while the control sample/standard is a separate
preparation. The value determined should be within 5% of the known or expected
concentration. Otherwise, all samples in the batch should be reanalyzed.
To one sample out of every ten samples (or with each batch of samples, whichever is
less) add a known amount of the metal of interest and reanalyze to confirm recovery.
Recovery of the added metal should be between 95 and 105%. Otherwise, reanalyze the
whole batch.
Check that the result has been multiplied by the dilution factor if dilution was needed.
SODIUM (ION CHROMATOGRAPHY)
BRIUG, China
Scope
This test method covers the determination of sodium in filtered acidified sample by Ion
Chromatography (IC).
The applicable range of this test method is from 0.1 to 20 mg/l when using the IC. This
range may be extended upward or downward by dilution of an appropriate aliquot of
sample or enlarging the sample loop.
A small volume of sample, 100 l is introduced into an ion chromatograph. The anions of
interest are separated and measured, using a system comprising a guard column, an
analytical column, a suppressor device, and a conductivity detector.
Interference can be caused by substances such as ammonium in high concentrations
overlapping the Na peak. Sample dilution can be used to solve interference problems.
Reference
Dionex (1992), Keith (1996, EPA Method 300.7).
Materials and Equipment
Ion chromatograph with suppressor
Volumetric flasks, 50 and 100 ml
Pipettes, 1-25 ml
Reagent bottles, 50 and 100 ml
Volumetric flasks, 1000 ml
Reagents and Standards
Deionized water with a specific resistance of 17.8 megohm – cm or greater
Eluent: 20 mmole/l methanesulfonic acid
Pipette 1.3 ml methanesulfonic acid into a 1 l volumetric flask, dilute to 1000 ml using
water (4.1), degas the eluent.
1000 mg/l Na+element stock solution commercial standard solution
Standard solution (0.5 to 20 mg/l Na+)
Prepare at least four standards to bracket the expected Na concentrations of the samples
Procedure
Equilibrate the system by pumping eluent through the column and detector until a stable
baseline is attained.
Optimize the instrument according to the instrument’s operation manual.
Inject the standard working solution and construct the standard calibration curve.
Flush the sampling system with each new sample.
Dilute samples when necessary so that the concentration of the element falls within the
standard calibration curve.
Calculation
Calculate mg/l by referring to the calibration curve.
For diluted samples, calculate original mg/l using:
mg/l Na+=concentrationdilution factor
The chromatogram working station can provide the content of Na+ directly.
Quality Assurance / Quality Control
Use the same quality deionized water to dilute the samples and to prepare the eluent and
working solution, otherwise, check the blank concentration of the water. Check that the
first order linearity of the standard calibration curve has r2 0.999.
Analyze the control standard /sample after a batch of samples. A control standard should
be prepared separately from the calibration standards. The value determined for the
control sample/standard should be within 5% of the known or expected concentrations.
Analyze one set of duplicate samples. Accepted difference for duplicate samples is
10%.
To one sample out of every ten samples (or with each batch of samples, whichever is
less) add a known amount of the metal of interest and reanalyze to confirm recovery.
Recovery of the added metal should be between 95 and 105%. Otherwise, reanalyze the
whole batch.
SODIUM (ATOMIC EMISSION SPECTROSCOPY (AES)
CAIR-BATAN, Indonesia
Scope
This test method covers the determination of sodium (Na+)
in filtered acidified samples
by atomic emission spectrophotometry (AES) using an atomic absorption
spectrophotometer (AAS) instrument.
The applicable range of this test method is from 0.25 to 2.0 mg/l when using the 589.0
nm wavelength.
Lanthanum oxide is added as suppressant to arrest ionization interference. In AAS, KCl
is applied as suppressant.
References
American Public Health Association Water Works Association and Water Pollution
Control Federation (1985); Rodier (1975).
Materials and Equipment
Atomic absorption spectrophotometer
Volumetric flasks, 25 and 50 ml
Pipettes, 1-25 ml
Erlenmeyer flasks, 50 ml
Reagent bottles, 500 and 250 ml, plastic
Filter, with particle retention of 0,45 m
Air compressor
Reagents and Standards
La2O3 solution, 5 g/l, wet 5.8637 g La2O3 in 2% HNO3 solution, and dilute to 1000 ml
DD water.
Acetylene gas
Compressed air
1000 mg/l Na stock standard solution: Dissolve 2.542 g NaCl in 1% HNO3 solution,
dilute to 1 l with DD water
Working standard solution (0.25 to 2.0 mg/l Na): Prepare five standards to bracket the
expected concentration of the samples
Standard blank solution: Add 2.5 ml La2O3 suppressant for every 25 ml DD water
Procedure
Optimize the instrument according to the instrument’s operating manual
Dilute samples with high Na so that the concentration falls within the standard calibration
curve
Aspirate the reagent blank to zero the instrument
Aspirate each standard in turn into flame and read the emission
Aspirate the samples between standards and read the emission
Calculation
Calculate mg/l Na by referring to the calibration curve
For diluted samples, calculate original mg/l Na using
mg/l Na= concentration x dilution factor
Quality Assurance/Quality control
DD water must be used in the preparation of samples/standards
Always include reagent blanks in the analysis
Add suppressant (La2O3 solution) to blanks, standards and samples
Standard concentrations should bracket the sample concentrations and should be within
the working range. Dilute samples if necessary
Emission values should be within the acceptable working standard range, as specified in
the manufacturer’s manual
Check that the first order linearity of the standard calibration curve has r2 0.999. The
slope has to be checked in every 10 (ten) measurements together with the blank and
standard solution
Analyze the blank and calibration standard before analyzing samples
Spiking should be done after every 3 (three) samples, recovery be between 93.5 - 104.5
% is acceptable
SULFATE (INDIRECT SPECTROPHOTOMETRIC WITH BARIUM
CHROMATE AND BROMOPHENOL BLUE)
PNOC EDC, Philippines
Scope
This method is applicable to untreated water samples with sulfate concentrations in the
range 20 to 100 mg/l sulfate which can be extended upwards by dilution.
The test method is based on the reaction of sulfate with barium chromate to form
insoluble barium sulfate. Liberated chromate ions are determined spectrophotometrically
at 385 nm.
Acidification eliminates interferences from bicarbonate and sulfide.
Reference
Giggenbach and Goguel (1989)
Materials and Equipment
UV-Vis spectrophotometer
Water bath
Volumetric flasks, 50 ml
Volumetric pipettes, 10 ml
Filter paper
Reagents and Standards
Glacial acetic acid, AR, C2H4O2
Calcium carbonate, AR, CaCO3
Concentrated ammonium hydroxide, NH4OH
1 N HCl: Dilute 82.6 ml concentrated HCl to one liter or dilute one ampoule 1 N HCl
commercially available standard solution to one liter with DD water in a volumetric flask.
0.02 N HCl: Pipette 20 ml 1 N HCl and dilute to one liter with DD water.
2.5% (w/v) Barium chromate suspension, BaCrO4: Mix 10 ml 1 N HCl, 3 ml glacial acetic
acid and dilute to 100 ml. Add 2.5 g BaCrO4, AR. Store in polyethylene container.
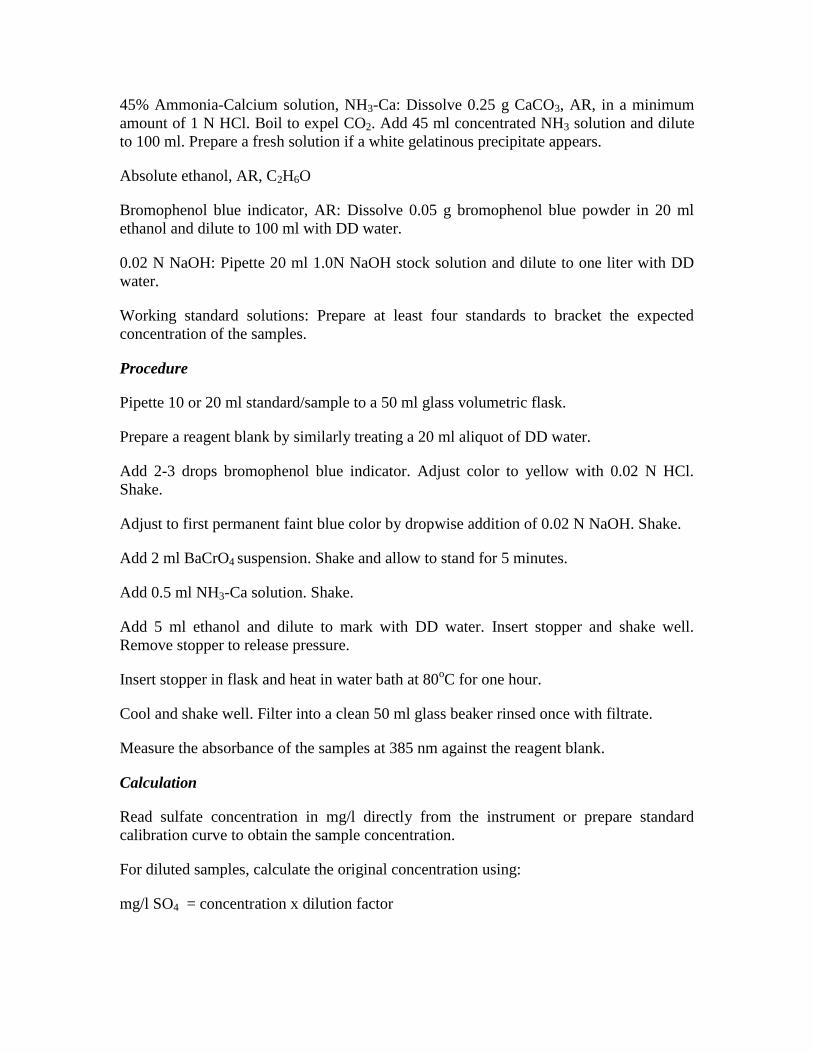
45% Ammonia-Calcium solution, NH3-Ca: Dissolve 0.25 g CaCO3, AR, in a minimum
amount of 1 N HCl. Boil to expel CO2. Add 45 ml concentrated NH3 solution and dilute
to 100 ml. Prepare a fresh solution if a white gelatinous precipitate appears.
Absolute ethanol, AR, C2H6O
Bromophenol blue indicator, AR: Dissolve 0.05 g bromophenol blue powder in 20 ml
ethanol and dilute to 100 ml with DD water.
0.02 N NaOH: Pipette 20 ml 1.0N NaOH stock solution and dilute to one liter with DD
water.
Working standard solutions: Prepare at least four standards to bracket the expected
concentration of the samples.
Procedure
Pipette 10 or 20 ml standard/sample to a 50 ml glass volumetric flask.
Prepare a reagent blank by similarly treating a 20 ml aliquot of DD water.
Add 2-3 drops bromophenol blue indicator. Adjust color to yellow with 0.02 N HCl.
Shake.
Adjust to first permanent faint blue color by dropwise addition of 0.02 N NaOH. Shake.
Add 2 ml BaCrO4 suspension. Shake and allow to stand for 5 minutes.
Add 0.5 ml NH3-Ca solution. Shake.
Add 5 ml ethanol and dilute to mark with DD water. Insert stopper and shake well.
Remove stopper to release pressure.
Insert stopper in flask and heat in water bath at 80oC for one hour.
Cool and shake well. Filter into a clean 50 ml glass beaker rinsed once with filtrate.
Measure the absorbance of the samples at 385 nm against the reagent blank.
Calculation
Read sulfate concentration in mg/l directly from the instrument or prepare standard
calibration curve to obtain the sample concentration.
For diluted samples, calculate the original concentration using:
mg/l SO4 = concentration x dilution factor
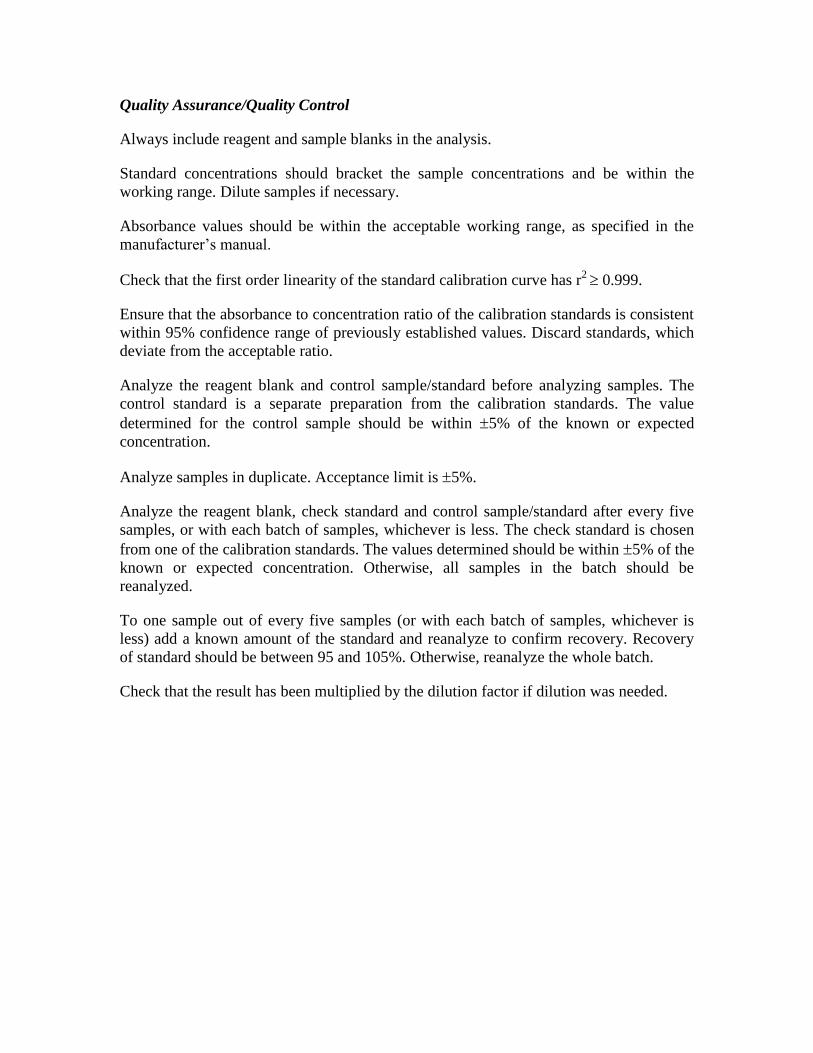
Quality Assurance/Quality Control
Always include reagent and sample blanks in the analysis.
Standard concentrations should bracket the sample concentrations and be within the
working range. Dilute samples if necessary.
Absorbance values should be within the acceptable working range, as specified in the
manufacturer’s manual.
Check that the first order linearity of the standard calibration curve has r2 0.999.
Ensure that the absorbance to concentration ratio of the calibration standards is consistent
within 95% confidence range of previously established values. Discard standards, which
deviate from the acceptable ratio.
Analyze the reagent blank and control sample/standard before analyzing samples. The
control standard is a separate preparation from the calibration standards. The value
determined for the control sample should be within 5% of the known or expected
concentration.
Analyze samples in duplicate. Acceptance limit is 5%.
Analyze the reagent blank, check standard and control sample/standard after every five
samples, or with each batch of samples, whichever is less. The check standard is chosen
from one of the calibration standards. The values determined should be within 5% of the
known or expected concentration. Otherwise, all samples in the batch should be
reanalyzed.
To one sample out of every five samples (or with each batch of samples, whichever is
less) add a known amount of the standard and reanalyze to confirm recovery. Recovery
of standard should be between 95 and 105%. Otherwise, reanalyze the whole batch.
Check that the result has been multiplied by the dilution factor if dilution was needed.
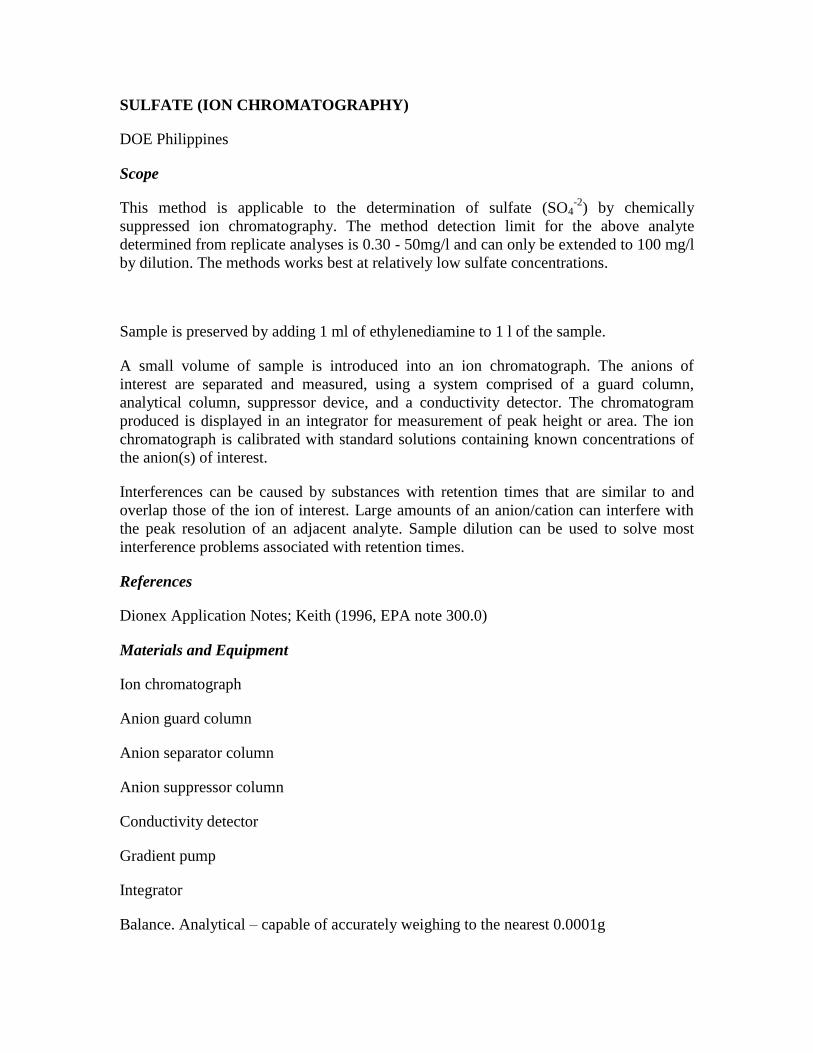
SULFATE (ION CHROMATOGRAPHY)
DOE Philippines
Scope
This method is applicable to the determination of sulfate (SO4-2
) by chemically
suppressed ion chromatography. The method detection limit for the above analyte
determined from replicate analyses is 0.30 - 50mg/l and can only be extended to 100 mg/l
by dilution. The methods works best at relatively low sulfate concentrations.
Sample is preserved by adding 1 ml of ethylenediamine to 1 l of the sample.
A small volume of sample is introduced into an ion chromatograph. The anions of
interest are separated and measured, using a system comprised of a guard column,
analytical column, suppressor device, and a conductivity detector. The chromatogram
produced is displayed in an integrator for measurement of peak height or area. The ion
chromatograph is calibrated with standard solutions containing known concentrations of
the anion(s) of interest.
Interferences can be caused by substances with retention times that are similar to and
overlap those of the ion of interest. Large amounts of an anion/cation can interfere with
the peak resolution of an adjacent analyte. Sample dilution can be used to solve most
interference problems associated with retention times.
References
Dionex Application Notes; Keith (1996, EPA note 300.0)
Materials and Equipment
Ion chromatograph
Anion guard column
Anion separator column
Anion suppressor column
Conductivity detector
Gradient pump
Integrator
Balance. Analytical – capable of accurately weighing to the nearest 0.0001g
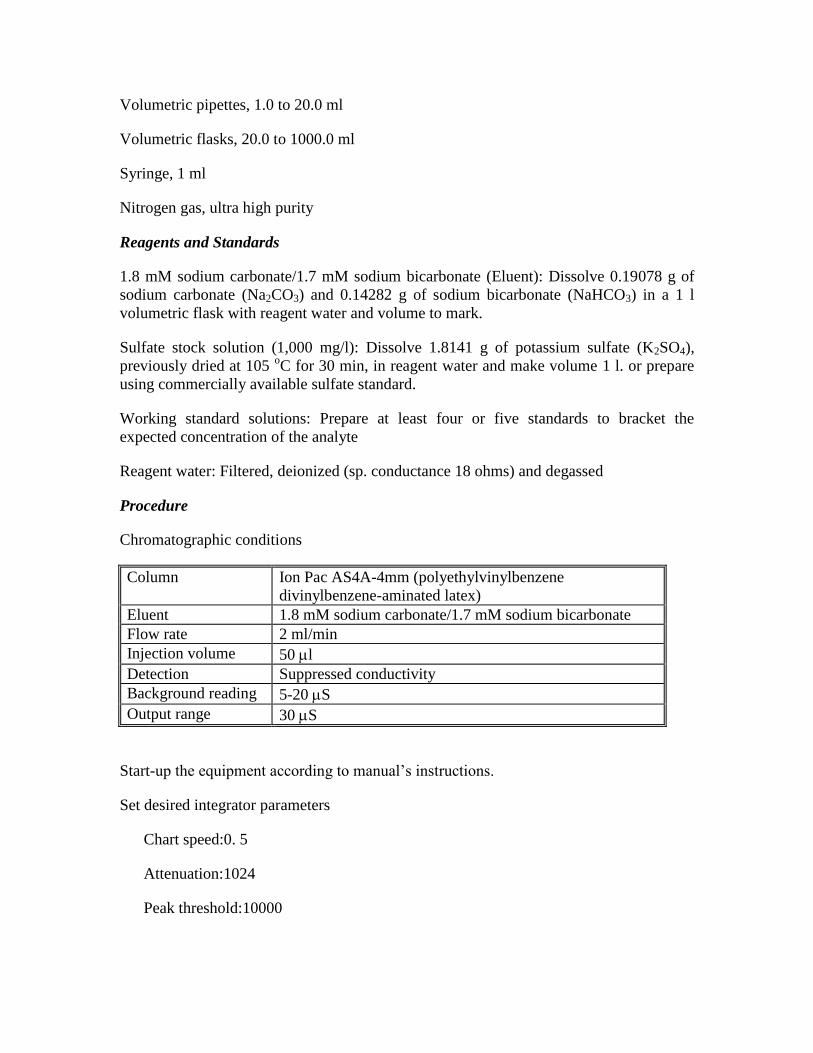
Volumetric pipettes, 1.0 to 20.0 ml
Volumetric flasks, 20.0 to 1000.0 ml
Syringe, 1 ml
Nitrogen gas, ultra high purity
Reagents and Standards
1.8 mM sodium carbonate/1.7 mM sodium bicarbonate (Eluent): Dissolve 0.19078 g of
sodium carbonate (Na2CO3) and 0.14282 g of sodium bicarbonate (NaHCO3) in a 1 l
volumetric flask with reagent water and volume to mark.
Sulfate stock solution (1,000 mg/l): Dissolve 1.8141 g of potassium sulfate (K2SO4),
previously dried at 105 oC for 30 min, in reagent water and make volume 1 l. or prepare
using commercially available sulfate standard.
Working standard solutions: Prepare at least four or five standards to bracket the
expected concentration of the analyte
Reagent water: Filtered, deionized (sp. conductance 18 ohms) and degassed
Procedure
Chromatographic conditions
Column Ion Pac AS4A-4mm (polyethylvinylbenzene
divinylbenzene-aminated latex)
Eluent 1.8 mM sodium carbonate/1.7 mM sodium bicarbonate
Flow rate 2 ml/min
Injection volume 50 l
Detection Suppressed conductivity
Background reading 5-20 S
Output range 30 S
Start-up the equipment according to manual’s instructions.
Set desired integrator parameters
Chart speed:0. 5
Attenuation:1024
Peak threshold:10000
Equilibrate the system by pumping eluent through the column and detector until a stable
baseline is obtained.
Inject the laboratory reagent blank (LRB).
Inject calibration standards (Calibration standards are stable for one week when stored at
4oC in high-density polyethylene containers).
After calibration is established, record peak height or area, and construct calibration
curve.
Inject the LRB.
Inject the samples. Flush the sampling system thoroughly with each new sample.
Verify calibration curve after every ten samples and at the end of each day’s analysis.
Calculation
Calculate concentration of the analyte from the calibration curve
For diluted samples, calculate sulfate content,
mg/l SO4 = Concentration x Dilution Factor
Report data in mg/l. do not report data lower than lowest calibration standard.
An integration system may also be used to provide a direct readout of the concentration
of the analyte of interest.
Quality Assurance / Quality Control
A known amount of analyte must be added to a minimum of 10% of the routine samples.
In each case the laboratory fortified matrix (LFM) aliquot must be a duplicate of the
aliquot used for sample analysis. The analyte concentration must be high enough to be
detectable above the original sample and should not be less than four times the method
detection limit.
If the concentration of the fortification is less than 25% of the background concentration
of the matrix, the matrix recovery should not be calculated.
Calculate the percent recovery for each analyte, corrected for concentration measured in
the unfortified sample, and compare these values to the designated LFM recovery range
of 90 - 110%.
Until sufficient data becomes available (usually 20-30 analyses), assess laboratory
performance against recovery limits. When sufficient internal performance data becomes
available develop control limits from the percent mean recovery and the standard
deviation.

If the recovery of any analyte falls outside the designated LFM recovery range and the
laboratory performance for the analyte, the recovery problem encountered with the LFM
is judged to be either matrix or solution related, not system related.
In recognition of the rapid advances occurring in chromatography, the analyst is
permitted certain options, such as the use of different columns and/or eluents to improve
the separation or lower the cost of measurements.
SULFATE (TURBIDOMETRIC)
Chiang Mai University, Thailand
Scope
Sulfate is determined by its quantitative precipitation with barium chloride. Because the
finely divided barium sulfate turbidity formed is proportional to amount of sulfate in the
sample, a turbidometric reading enables the sulfate concentration to be determined
accurately.
This method is applicable to untreated water samples whose sulfate content is in the
range 1.0 – 40 mg/l.
References
American Public Health Association, American Water Works Association, Water
Environment Federation (1992);
Materials and Equipment
Magnetic stirrer
Turbidometer (Nephelometer)
Stopwatch or electric timer
Measuring spoon
Volumetric flask 100 ml
Pipettes 1, 2, 5, 10, 20 ml
Erlenmeyer flasks 250 ml.
Reagents and Standards
Barium chloride (BaCl2) crystals. BaCl2 crystals should be desiccated for 24 hours then
screened to 20-30 meshes.
Buffer solution A (Required when the sample SO42-
concentration is more than 10 mg/l):
Dissolve 30.0 g magnesium chloride (MgCl2.6H2O), 5.0 g sodium acetate
(CH3COONa.3H2O), 1.0 g potassium nitrate (KNO3) and 20 ml acetic acid (CH3COOH-
99%) in 500 ml distilled water and make up to 1 l.
Buffer Solution B (Required when the sample SO42-
concentration is less than 10 mg/l):
Dissolve 30 g magnesium chloride (MgCl2.6H2O), 5 g sodium acetate
(CH3COONa.3H2O), 1.0 g potassium nitrate (KNO3), 20 ml acetic acid (CH3COOH-
99%) and, 0.111 g sodium sulphate (Na2SO4), in 500 ml distilled water and make up to 1
l.
Standard sulfate solution 100 mg/l: Dissolve 0.1479 g anhydrous Na2SO4 in distilled
water and dilute to 1.00 l.
Working standard solutions (0 to 40 mg/l): Prepare at least 4 standards to bracket the
expected concentrations of samples.
Procedure
Measure 100 ml sample or a suitable portion made up to 100 ml into a 250 ml
Erlenmeyer flask.
Add 20 ml buffer solution and mix in stirring apparatus.
While stirring, add a spoonful of BaCl2 crystals (approx. 0.352 g) and begin timing
immediately. Stir for 60+ 2 seconds.
Pour solution into absorption cell of turbid meter and measure turbidity at 5+0.5 minutes.
Preparation of calibration curve; Standards in the range 0 - 40 mg/l SO42-
Repeat steps 5.1
– 5.4 using standards instead of samples.
Calculation
Calculate mg/l SO42-
by referring to the calibration curve.
For diluted samples, calculate for final mg/l SO42-
using:
mg/l SO42-
= concentration x dilution factor
Quality Assurance/Quality Control
Analyze samples in duplicate. Acceptance limit is + 5%
Standard concentrations should bracket the sample concentrations and should be within
the working range. Dilute samples if necessary.
Check that the first order linearity of the standard calibration curve has r2 > 0.999
STANDARDIZATION OF NAOH AGAINST KHP
PNOC EDC, Philippines
Materials and Equipment
Pipette, 5 ml
Automatic or digital burettes
Magnetic stirrer with stirring bars
Beakers, 100 ml
Reagents
0.02 N NaOH
0.05 N potassium hydrogen phthalate, KHC8H4O4 (KHP): Weigh 5 to 10 g of primary
standard potassium hydrogen phthalate (KHC8H4O4) in a glass container and dry in an
oven at 120ºC for 2 hours. Stopper the container and cool in a desiccator. Weigh
accurately 0.95-±0.05 g of the dried KHC8H4O4, and transfer to a 500-ml container flask.
Add 100 ml of carbon dioxide-free water; stir gently to dissolve the sample.
1% phenolphthalein indicator: Dissolve 1 g of phenolphthalein in 50 ml absolute ethanol
and dilute to 100 ml with DD water.
Procedure
Pipette 5 ml of 0.05 N KHP into a 100 ml beaker.
Add 3 drops of phenolphthalein indicator and stir.
Titrate with 0.02 N NaOH until the first appearance of a permanent faint pink color.
Record the volume used.
Analyze in duplicate.
Calculation
Calculate the normality of the NaOH solution, as follows:
solution
KHPKHP
V
WN
23.204/
Where:
NKHP = Normality of KHP
WKHP = Grams KHP
Vsolution = Liters of solution
NNaOH = Normality of NaOH
VKHP = ml of KHP
VNaOH = ml of NaOH
Calculate the average normality obtained from the duplicate runs
221 NN
AVEN
STANDARDIZATION OF HCL AGAINST NAOH
PNOC EDC, Philippines
Materials and Equipment
Pipette, 20 ml
Automatic or digital burettes
Magnetic stirrer with stirring bars
Beakers, 150 ml
Reagents
0.02 N NaOH (standardized against KHP)
0.02 N HCl and 0.1 N HCl
1% phenolphthalein indicator: Dissolve 1 g of phenolphthalein in 50 ml of absolute
ethanol and dilute to 100 ml with DD water.
Procedure
Pipette 20 ml of 0.02 N HCl or 5 ml of 0.1 N HCl into a beaker.
Add 3 drops of phenolphthalein indicator and stir.
Titrate with 0.02 N standardized NaOH solution until the first appearance of a permanent
faint pink color.
Record the volume used.
Analyze in duplicate.
Calculation
Calculate the normality of the HCl solution, as follows:
HCL
NAOHNAOHHCL
V
VNN
*
Where:
NHCl = Normality of HCl
NNaOH = Normality of NaOH
VHCl = Volume of HCl
VNaOH = Volume of NaOH
Calculate the average normality obtained from the duplicate runs
221 NN
AVEN
STANDARDIZATION OF SILVER NITRATE AGAINST SODIUM CHLORIDE
PNOC EDC, Philippines
Materials and Equipment
Pipette, 50 ml
Automatic or digital burettes
Magnetic stirrer with stirring bars
Beakers, 150 ml
Reagents
0.10 N silver nitrate, AgNO3
0.01 N silver nitrate, AgNO3
Nitric acid, HNO3
Sodium chloride, standard solutions containing 100 mg/l Cl and 10 mg/l Cl
Procedure
Pipette 50 ml of the 100 mg/l Cl, or 100 ml of the 10 mg/l Cl standard solutions and
titrate potentiometrically or by using the Mohr method using the 0.01 N silver nitrate
solution.
Calculation
Calculate the normality of the AgNO3 solution, as follows:
3
3
*
AgNO
ClClAgNO
V
VNN
Where:
NAgNO3 = Normality of AgNO3 solution
NCl = Normality of Cl solution
VAgNO3 = ml of AgNO3 solution
VCl = ml of Cl solution
BIBLIOGRAPHY
Alvis-Isidro R., Urbino G. A. and Pang Z. (2001). Results of the 2000 IAEA Inter-
laboratory Comparison of Geothermal Water Chemistry. Combined RAS/8/092 and
INT/060 Coordination Meeting on Isotopic and Geochemical Techniques in
Geothermal Exploration and Reservoir Management, Cebu Philippines, March 12 –
17, 44 p.
American Public Health Association (APHA), American Water Works Association and
Water Pollution Control Federation 1985. Standard Methods for the Examination of
Water and Waste Water 16th
(ed), American Public Health Association, Washington,
DC.
American Public Health Association, American Water Works Association and Water
Pollution Control Federation (1989). Standard Methods for the Examination of Water
and Wastewater. 17th
edition. American Public Health Association, Washington, DC.
American Public Health Association, American Water Works Association and Water
Environment Federation (1992). Standard Methods for the Examination of Water and
Wastewater. 18th
edition. American Public Health Association, Washington, DC.
American Public Health Association, American Water Works Association and Water
Environment Federation (1995). Standard Methods for the Examination of Water and
Wastewater. 19th
edition. American Public Health Association, Washington, DC.
American Public Health Association, American Water Works Association and Water
Environment Federation (1998). Standard Methods for the Examination of Water and
Wastewater. 20th
edition. American Public Health Association, Washington, DC.
American Society for Testing and Materials (1988). Volume 11.01.Annual Book of ASTM
Standards, Water and Environmental Technology. ASTM Philadelphia, PA.
(Designation for Chloride by Ion Chromatography)
American Society for Testing and Material (1994a). Vol. 11.01 Standard Test Method for
Ammonia in Water. Designation: D1426-93;
American Society for Testing and Material (1994b). Standard Test Method for Chloride
Ion in Brackish Water, Seawater and Brines. Designation: D4458-85 ASTM
Philadelphia, PA
American Society for Testing and Material (1994c). Vol. 11.02 Fluoride Ions in Brackish
Water, Seawater, and Brines. Designation: D3868-79 (1989). ASTM, Philadelphia,
PA.
American Society for Testing and Material (1994d). Vol. 11.01 Standard Test Method for
Fluoride in Water. Designation: D1179-93 (1989). ASTM Philadelphia, PA.
American Society for Testing and Material (1995a). Vol. 11.01 Standard Test Method for
Silica in Water. Designation: D859-88. ASTM Philadelphia, PA.
American Society for Testing and Material (1995b) Vol. 11.01 Standard Test Method for
Calcium in Water by Atomic Absorption Spectrophotometry. Designation: D511-93.
ASTM Philadelphia, PA.
American Society for Testing and Material (1995c). Vol. 11.01 Standard Test Method for
Lithium in Water by Atomic Absorption Spectrophotometry. Designation: D3561-77.
ASTM Philadelphia, PA.
American Society for Testing and Material (1995d). Vol. 11.01 Standard Test Method for
Potassium in Water by Atomic Absorption Spectrophotometry. Designation: D4191-
93. ASTM Philadelphia, PA.
American Society for Testing and Material (1995e). Vol. 11.01 Standard Test Method for
Sodium in Water by Atomic Absorption Spectrophotometry. Designation: D4191-93.
ASTM Philadelphia, PA.
Arnorsson, S. and D’Amore, F. (2000). Sampling of geothermal fluids: on site
measurements and sample treatment. In: Arnorsson S. (editor), Isotopic and chemical
techniques in geothermal exploration, development and use, Chapter 8, IAEA, Vienna,
pp. 84-96.
Atom Scan 16 Manual
Barbolani Piccardi, E. (1973."Ossevazioni su un metodo per la determinazione del boro
nelle acque", Rassegna Chimica, No. 1, Gennaio - Febbraio,
Boss, C.B. and Fredeen, K.J. (1989), Concepts, Instrumentation and Techniques in ICP
AES, The Perkin Elmer Corporation, Norwalk, Connecticut, U.S.A.
Centro de Investigaciones Geotérmicas, Gerencia División de Recursos Geotérmicos
(1993). Técnicas, Procedimientos de muestreo y Determinaciones analíticas,
Mineralógicas, Físicas e Isotópicas. GEOCEL, Santa Tecla.
Cogbill, E.C. and Yoe, J.H. (1955). Derivatives of anthrarufin, chrysazin and quinizarin
as colorimetric reagents for boron. Anal. Chim. Acta, 12, 455-463
Dionex (1992)
Dionex Application Notes. Dionex Corporation, Sunnyvale, California, USA.
Edwards, R.A. (1980). Automatic Determination of Boron (0.10-10.0 mg/l) in Raw and
Wastewaters. Analyst , 105, 139-146.
Ellis, A.J and Mahon, W.A.J. (1977). Chemistry and Geothermal Systems, Academic
Press, N.Y., 392 pp.
Giggenbach, W. F. and Goguel, R. L. (1989). Collection and analysis of geothermal and
volcanic water and gas discharges. 4th
edition. Department of Scientific and Industrial
Research, Petone, New Zealand, 81 pp.
Giggenbach, W. F., Tedesco, D., Sulistiyo, Y., Caprai, A., Cioni, R., Favara, R., Fischer,
T.P., Hirabayashi, J. I., Korzhinsky, M., Martini, M., Menyailov, I., Shinohara, H.,
(2001). Evaluation of results from the fourth and fifth IAVCEI field workshops on
volcanic gases, Volcano Island, Italy and Java, Indonesia. J. Volc.Geoth. Res., 108, (1-
4), 157-172.
Hatch Co. (1995). Hatch DR/2000 Spectrophotometer Handbook Manual. Hatch Co.
Loveland Colorado.
Hydes, D.J. and Liss, P.S. (1976). Fluorimetric method for the determination of low
concentrations of dissolved aluminum in natural waters. Analyst 101, 922-931.
Keith, L.H. (1996). Compilation of EPA´s Sampling and Analysis Methods. 2nd
. Edition.
Lewis Publishers, CRC Press, Inc. Boca Ratón, Florida, .
Kirst, H. and. Rump, H.H. (1992) Laboratory Manual for the Examination of Water,
Wastewater and Soil 2nd
ed. Germany: VCH Verlagsgessellschaft mbH, Weinheim.
Koroleff, F. 1983: Determination of ammonia. In Grasshoff, K:, Erhardt, M. and
Kremling, K. (editors): Methods of seawater analysis. Verlag Chemie, Weinheim,
150-157.
Krug, F.J., Mortatti, J., Pessenda, L.C.R., Zagatto, E.A.G. and Bergamin, H. (1981). Flow
injection spectrophotometric determination of boron in plant material with
azomethine. Anal. Chim. Acta,125, 29-35.
Perkin Elmer(1993). User Manual Plasma 400 Emission Spectrometer, The Perkin-Elmer
Corporation, Norwalk, Connecticut, U.S.A.
Rodier, J. 1975. Analysis of Water. John Wiley & Sons. New York Toronto.
Shucker, G.D., T.S Magliocca and Yao-sin Su. (1975). Spectrophotometric
Determination of Boron in Siliceous Materials with Azomethine H. Anal. Chim. Acta,
75, 95-100.
Skoog and Leary. (1994). Análisis Instrumental, 4ª. Ed. McGraw-Hill/Interamericana de
España, S.A.
Vitense, K.R. and McGown, L.B. (1987). Simultaneous determination of aluminum (III)
and gallium (III) with lumogallion by phase-resolved fluorimetry. Analyst 112, 1273-
1277.

Vogel A. I. (1961). A textbook of quantitative inorganic analysis including elementary
instrumental analysis. Richard Clay and Co., Ltd., Bungay, Suffolk. Printed in Great
Britain, page 809.
APPENDIX I. ABBREVIATIONS
AAS: Atomic Absorption Spectrophotometry
AES: Atomic Emission Spectroscopy;
AR: Analytical reagent
DD: Distilled, deionized
DF: Dilution factor
HDPE: High density polyethylene
HR: High resolution
IC: Ion Chromatography
ICP: Inductively Coupled Plasma
ISE: Ion Selective Electrode
LFM: Laboratory fortified matrix
MS: Mass Spectrometry
PE: Polyethylene
QC: Quality control
SIPS: Sample Introduction Pumping System
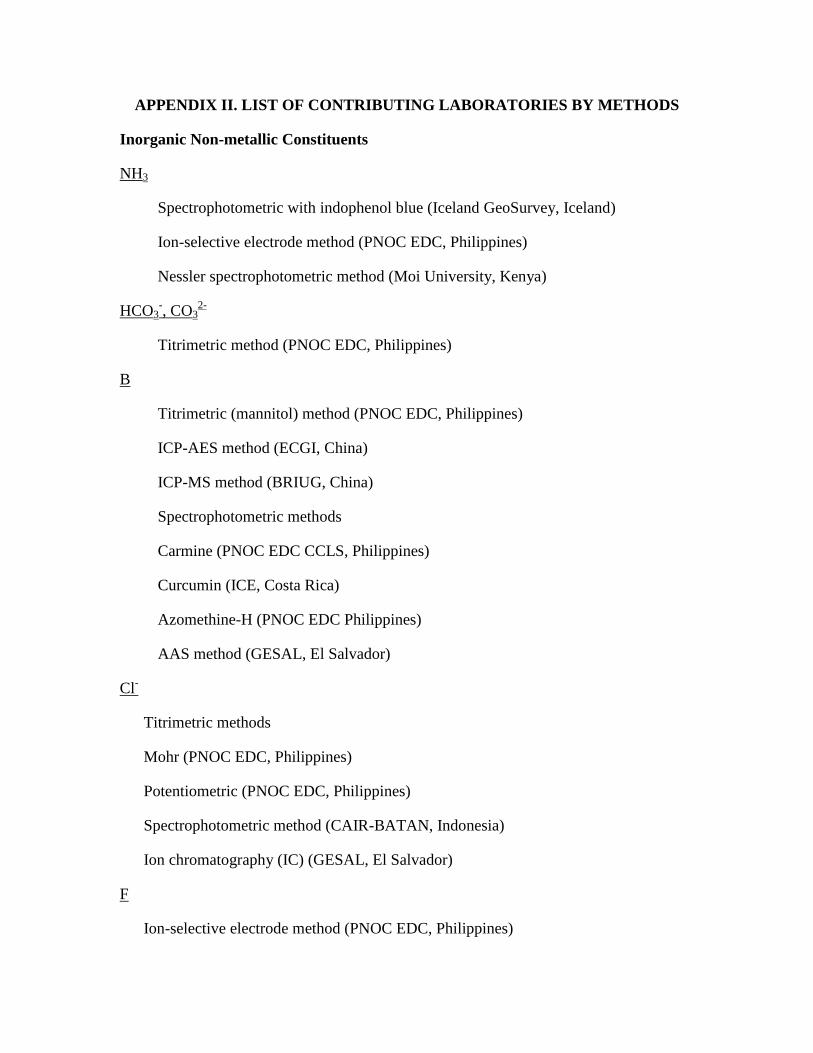
APPENDIX II. LIST OF CONTRIBUTING LABORATORIES BY METHODS
Inorganic Non-metallic Constituents
NH3
Spectrophotometric with indophenol blue (Iceland GeoSurvey, Iceland)
Ion-selective electrode method (PNOC EDC, Philippines)
Nessler spectrophotometric method (Moi University, Kenya)
HCO3-, CO3
2-
Titrimetric method (PNOC EDC, Philippines)
B
Titrimetric (mannitol) method (PNOC EDC, Philippines)
ICP-AES method (ECGI, China)
ICP-MS method (BRIUG, China)
Spectrophotometric methods
Carmine (PNOC EDC CCLS, Philippines)
Curcumin (ICE, Costa Rica)
Azomethine-H (PNOC EDC Philippines)
AAS method (GESAL, El Salvador)
Cl-
Titrimetric methods
Mohr (PNOC EDC, Philippines)
Potentiometric (PNOC EDC, Philippines)
Spectrophotometric method (CAIR-BATAN, Indonesia)
Ion chromatography (IC) (GESAL, El Salvador)
F
Ion-selective electrode method (PNOC EDC, Philippines)
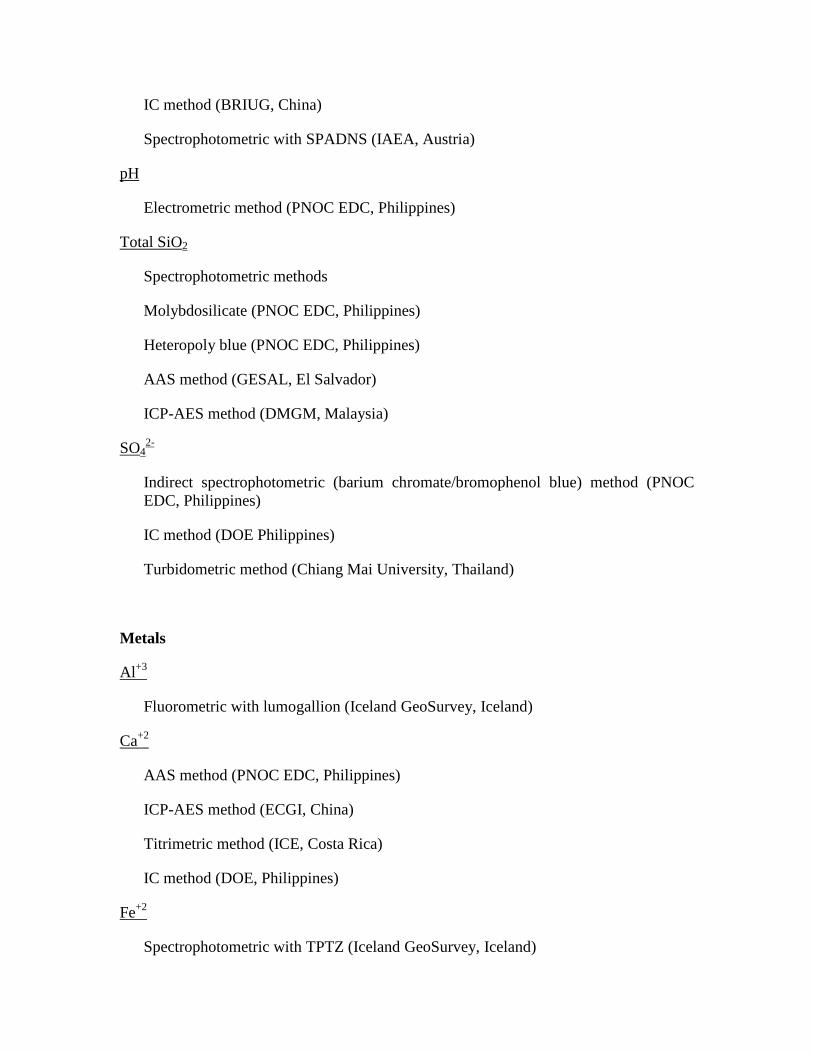
IC method (BRIUG, China)
Spectrophotometric with SPADNS (IAEA, Austria)
pH
Electrometric method (PNOC EDC, Philippines)
Total SiO2
Spectrophotometric methods
Molybdosilicate (PNOC EDC, Philippines)
Heteropoly blue (PNOC EDC, Philippines)
AAS method (GESAL, El Salvador)
ICP-AES method (DMGM, Malaysia)
SO42-
Indirect spectrophotometric (barium chromate/bromophenol blue) method (PNOC
EDC, Philippines)
IC method (DOE Philippines)
Turbidometric method (Chiang Mai University, Thailand)
Metals
Al+3
Fluorometric with lumogallion (Iceland GeoSurvey, Iceland)
Ca+2
AAS method (PNOC EDC, Philippines)
ICP-AES method (ECGI, China)
Titrimetric method (ICE, Costa Rica)
IC method (DOE, Philippines)
Fe+2
Spectrophotometric with TPTZ (Iceland GeoSurvey, Iceland)
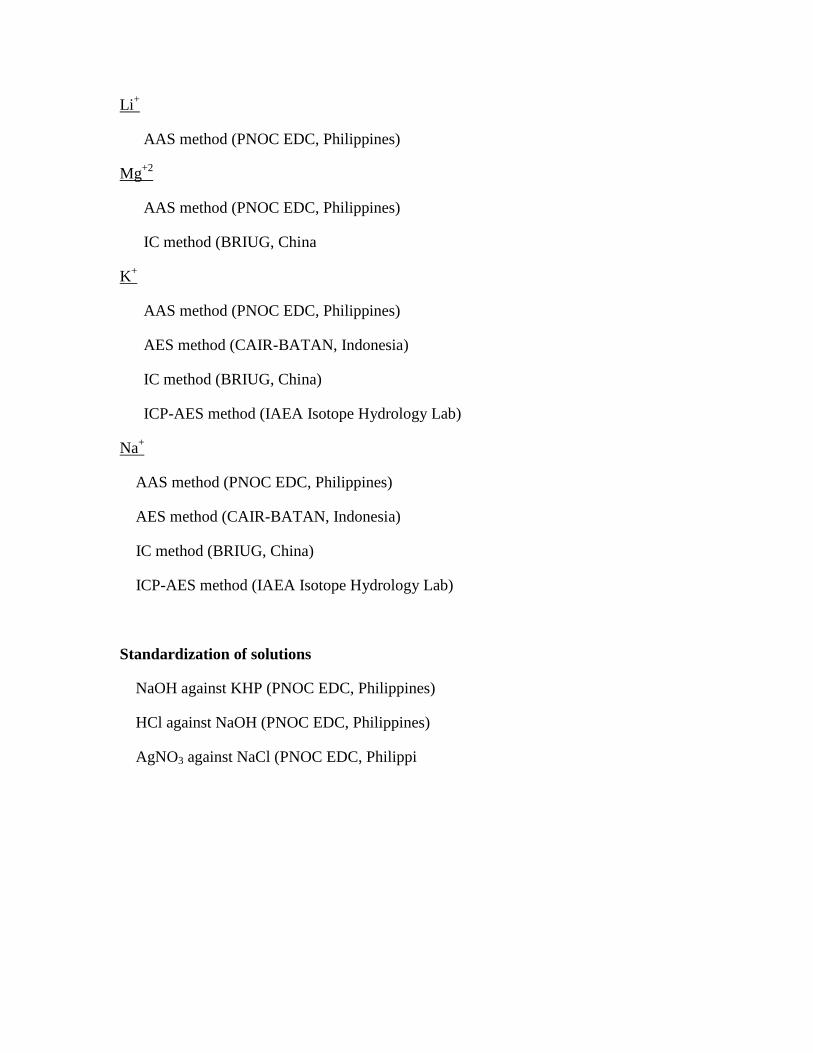
Li+
AAS method (PNOC EDC, Philippines)
Mg+2
AAS method (PNOC EDC, Philippines)
IC method (BRIUG, China
K+
AAS method (PNOC EDC, Philippines)
AES method (CAIR-BATAN, Indonesia)
IC method (BRIUG, China)
ICP-AES method (IAEA Isotope Hydrology Lab)
Na+
AAS method (PNOC EDC, Philippines)
AES method (CAIR-BATAN, Indonesia)
IC method (BRIUG, China)
ICP-AES method (IAEA Isotope Hydrology Lab)
Standardization of solutions
NaOH against KHP (PNOC EDC, Philippines)
HCl against NaOH (PNOC EDC, Philippines)
AgNO3 against NaCl (PNOC EDC, Philippi
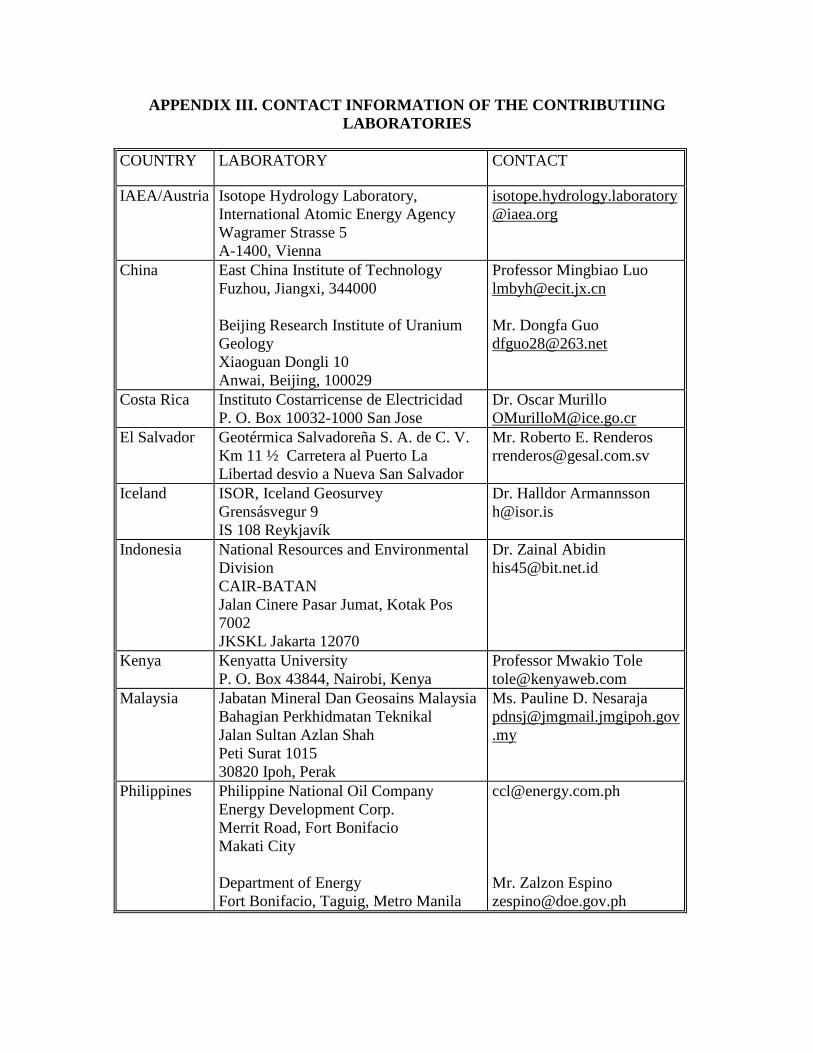
APPENDIX III. CONTACT INFORMATION OF THE CONTRIBUTIING
LABORATORIES
COUNTRY LABORATORY CONTACT
IAEA/Austria Isotope Hydrology Laboratory,
International Atomic Energy Agency
Wagramer Strasse 5
A-1400, Vienna
isotope.hydrology.laboratory
@iaea.org
China East China Institute of Technology
Fuzhou, Jiangxi, 344000
Beijing Research Institute of Uranium
Geology
Xiaoguan Dongli 10
Anwai, Beijing, 100029
Professor Mingbiao Luo
Mr. Dongfa Guo
Costa Rica Instituto Costarricense de Electricidad
P. O. Box 10032-1000 San Jose
Dr. Oscar Murillo
El Salvador Geotérmica Salvadoreña S. A. de C. V.
Km 11 ½ Carretera al Puerto La
Libertad desvio a Nueva San Salvador
Mr. Roberto E. Renderos
Iceland ISOR, Iceland Geosurvey
Grensásvegur 9
IS 108 Reykjavík
Dr. Halldor Armannsson
Indonesia National Resources and Environmental
Division
CAIR-BATAN
Jalan Cinere Pasar Jumat, Kotak Pos
7002
JKSKL Jakarta 12070
Dr. Zainal Abidin
Kenya Kenyatta University
P. O. Box 43844, Nairobi, Kenya
Professor Mwakio Tole
Malaysia Jabatan Mineral Dan Geosains Malaysia
Bahagian Perkhidmatan Teknikal
Jalan Sultan Azlan Shah
Peti Surat 1015
30820 Ipoh, Perak
Ms. Pauline D. Nesaraja
.my
Philippines Philippine National Oil Company
Energy Development Corp.
Merrit Road, Fort Bonifacio
Makati City
Department of Energy
Fort Bonifacio, Taguig, Metro Manila
Mr. Zalzon Espino

Thailand Geochemistry Laboratory
Department of Geological Sciences
Faculty of Science
Chiang Mai University
Professor Pongpor
Asnachinda

APPENDIX IV. LIST OF PERSONS INVOLVED IN DRAFTING AND REVIEW
OF THE DOCUMENT
Aragon G., Armannsson H., Arones P., Ascencio S., Cui Jianyong, Dargie M., Espino Z.,
Gabriel J., Isidor R., Lim P., Lu C., Magdadaro M., Murillo O., Nesaraja P., Nogara M.,
Olasiman R., Palabrita A., Pang Z., Pangilinan L., Panopio A., Penalosa M., Pinero E.,
Promphutha M., Solana R., Syamsu S., Tole M., Urbino G., Zapanta R.
APPENDIX V: IMPROVING ANALYTICAL QUALITY OF WATER
CHEMISTRY THROUGH INTER-LABORATORY COMPARISON
Z. Pang, M. Dargie and M. Groening
Department of Nuclear Sciences and Applications, International Atomic Energy
Agency, Vienna, Austria
Abstract. Out of a total of 40 (?) chemical laboratories that have ever participated in IAEA sponsored
inter-laboratory comparison exercises (ILCE) in the past years since 1997, we selected 21 laboratories that
have participated in three consecutive ILCEs from 1999 to 2001 and performed a statistical analysis of data
submitted by these laboratories in the ILCEs. Analytical capability of this pool of laboratories on 14
parameters including pH, electrical conductivity and minerals is assessed by the number of outliers for each
analyst, accuracy of analysis and precision of analysis. Evolution of the capability of this pool of
laboratories is evaluated by comparing the three parameters over the three years. Results show that in three
consecutive exercises in 1999, 2000 and 2001, the 21 water chemistry laboratories show continued
improvements of analytical capability. Compared to the 1999 results, in 2001, the pool of laboratories was
able to reduce the number of outliers by 3%, the coefficient of variation by 50 % (precision) and the
accuracy by 75%. This significant improvement may be attributed to enhanced skills of staff, standardized
analytical procedures and so on. The main impact of inter-laboratory comparison exercises is probably in
the recognition of errors so they can be properly corrected.
Introduction
Water chemistry data is essential in isotope hydrology investigations. In order to improve
analytical quality in laboratories in its member states, the International Atomic Energy
Agency (IAEA) has sponsored many inter-laboratory comparison exercises on
groundwater and geothermal water chemistry through its isotope hydrology programme.
Most laboratories involved in IAEA’s technical cooperation projects have participated in
this activity. Individual inter-laboratory exercises and assessment of analytical quality of
individual parameters have been reported separately [1-6]
. However, there has been a
question regarding the rationale of this activity due to the fact that analytical methods
used by different laboratories are different and the overall accepted performance is
artificially set. In this contribution, we perform a statistical analysis of analytical quality
for a selected pool of 21 laboratories (Table 1) that have participated in three consecutive
inter-laboratory comparison exercises from 1999 to 2001 to identify any possible trend in
their analytical quality with time.
About the inter-laboratory exercises
The quality of analytical data of separated water and vapour is of fundamental
importance in geochemical modelling of hydrothermal systems. To insure the analytical
quality of the geochemistry laboratories involved in such activities, Ellis (1976)
conducted the first inter-laboratory chemical analysis of geothermal waters involving
many countries. The scatter in the results during this study revealed serious deficiencies
in analytical accuracy and the need for general improvement and standardization of
analytical procedures (Giggenbach et al, 1992). Consequently, the International Atomic
Energy Agency, Vienna (IAEA) initiated inter-laboratory calibrations of geothermal
waters within the framework of the Coordinated Research Program on the Application of
Isotope and Geochemical Techniques in Geothermal Exploration in 1985. Giggenbach
(1992) reported the results of the first chemical analysis of geothermal water under this
program. The program was re-undertaken by Gerardo-Abaya et al. (1998) and presently
the program is a regular practice for comparing the analysis of geothermal waters every
year (Alvis-Isidro et al., 1999, 2000).
The objectives of this work are to analyze systematically the chemical data generated
under the IAEA Inter-laboratory calibration program and discuss a plan of action to
provide some guidance for future inter-laboratory calibrations in order to improve the
analytical quality of the participating laboratories.
Natural groundwater samples from springs and wells have been used in these inter-
laboratory exercises. In the analyses requested 14 major parameters are included: pH,
conductivity, HCO3- Cl
-, F
-, SO4
2- SiO2, NH3, Na
+, K
+, Ca
2+, Mg
2+, Li
+, and B.
Inter-laboratory Comparisons of Geothermal Water Chemistry in 1999, 2000, 2001 and
2003 have been jointly organized by the IAEA and PNOC EDC. Geothermal water
samples were collected from geothermal fields in Indonesia and Thailand in 1999 and the
Philippines in 2000, 2001 and 2003. The samples were processed by filtration using a
0.45 μm membrane filter and divided into two portions. One portion consisted of
untreated sample and the other portion was acidified with HNO3 until pH <2 was
attained. Untreated samples were analyzed for pH, conductivity, HCO3, Cl and SO4
while acidified portions were analyzed for SiO2 (total), B, F, Na, K, Ca, Mg, Li and NH3.
Geochemistry laboratories in East Asia and the Pacific, Latin American and African
regions and from other countries involved in geothermal development participated in
these activities. Results of two separate trials for each parameter were reported by the
laboratories, together with the mean, standard deviation, standard uncertainty and method
used for analyzing various parameters. Consensus values were determined from the
results of reference laboratories chosen for their expertise in geothermal water analysis.
The analytical results were evaluated using statistical tools, the AQCS (1999) and HISTO
(2000-2003) programs, involving Dixon, Grubbs, Skewness and Kurtosis tests at 95%
level of confidence. Results that passed these statistical tests were considered statistically
acceptable. However, outlying results would prompt each laboratory to review their
method and procedures to improve the accuracy of their analysis. As standard practice,
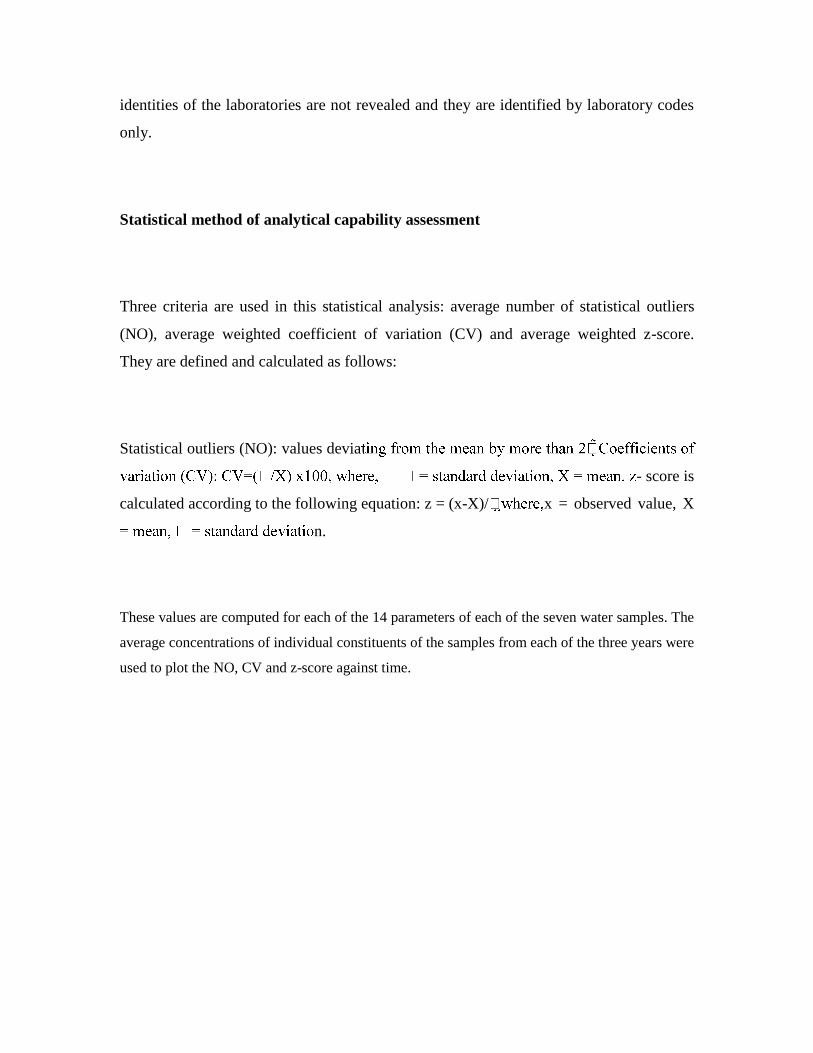
identities of the laboratories are not revealed and they are identified by laboratory codes
only.
Statistical method of analytical capability assessment
Three criteria are used in this statistical analysis: average number of statistical outliers
(NO), average weighted coefficient of variation (CV) and average weighted z-score.
They are defined and calculated as follows:
Statistical outliers (NO): values devia
- score is
calculated according to the following equation: z = (x-X)/ x = observed value, X
n.
These values are computed for each of the 14 parameters of each of the seven water samples. The
average concentrations of individual constituents of the samples from each of the three years were
used to plot the NO, CV and z-score against time.
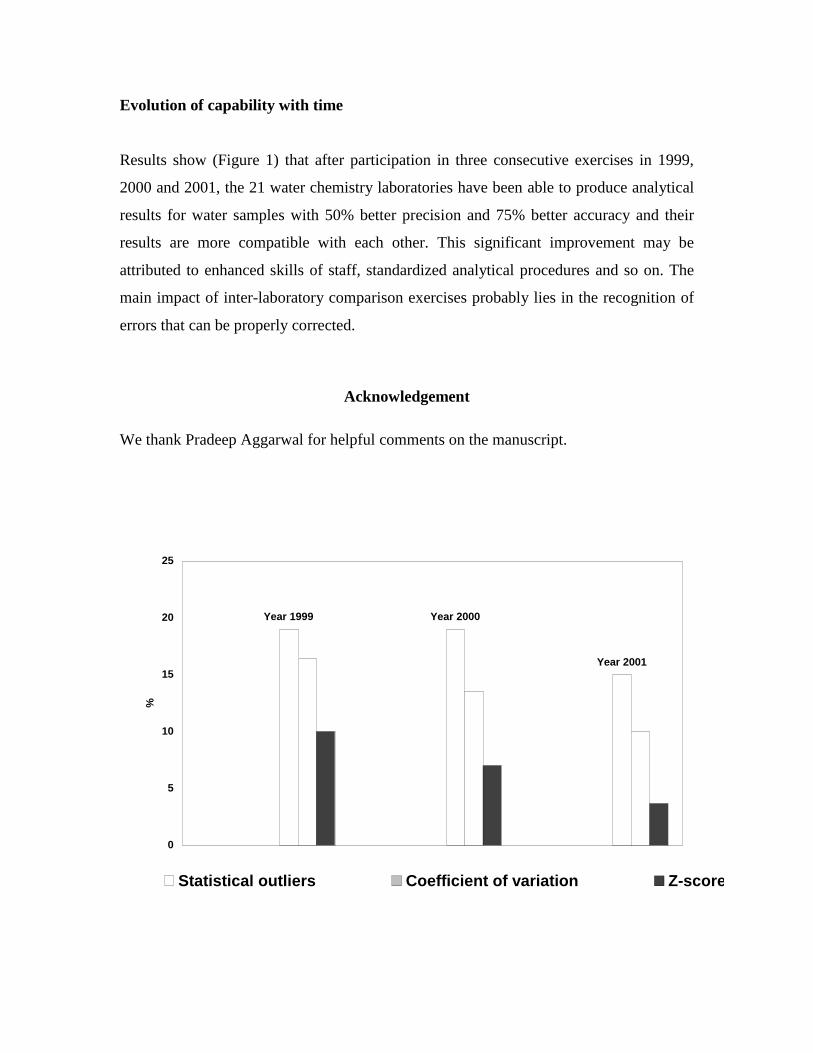
Evolution of capability with time
Results show (Figure 1) that after participation in three consecutive exercises in 1999,
2000 and 2001, the 21 water chemistry laboratories have been able to produce analytical
results for water samples with 50% better precision and 75% better accuracy and their
results are more compatible with each other. This significant improvement may be
attributed to enhanced skills of staff, standardized analytical procedures and so on. The
main impact of inter-laboratory comparison exercises probably lies in the recognition of
errors that can be properly corrected.
Acknowledgement
We thank Pradeep Aggarwal for helpful comments on the manuscript.
Year 1999 Year 2000
Year 2001
0
5
10
15
20
25
%
Statistical outliers Coefficient of variation Z-score

Figure 1. Improved analytical quality with time for the pool of laboratories according to
three criteria: number of outliers, coefficient of variation and the z-score
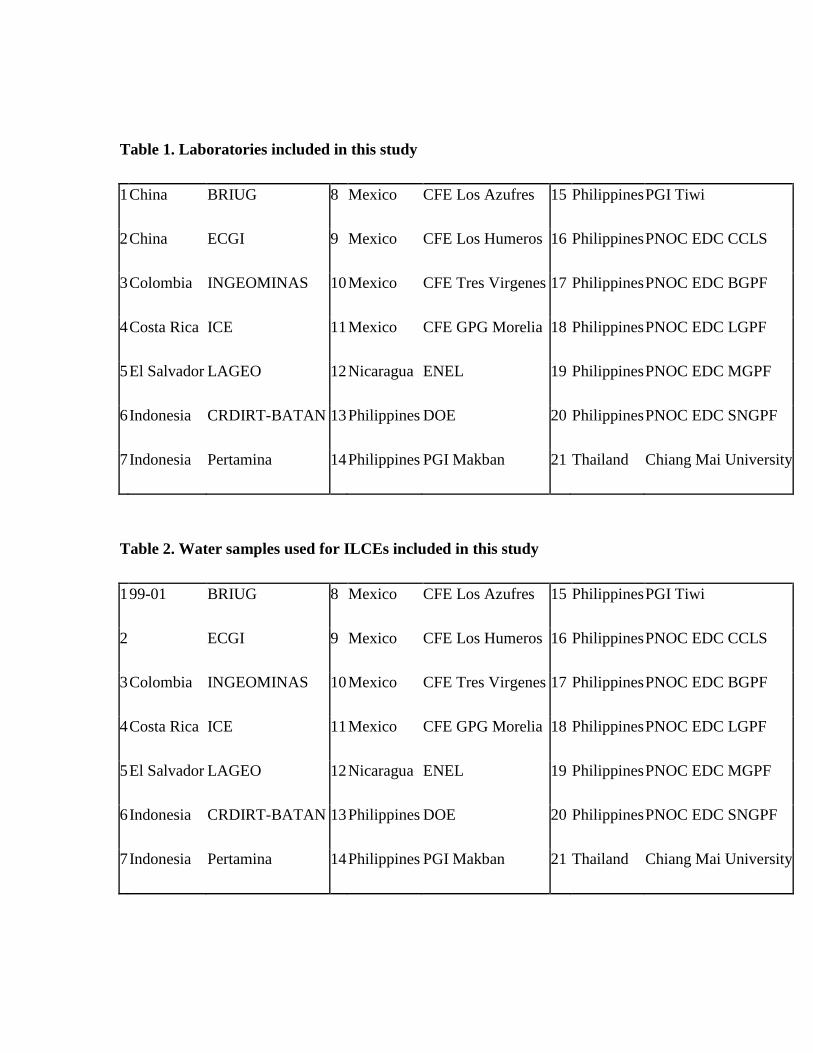
Table 1. Laboratories included in this study
1 China BRIUG 8 Mexico CFE Los Azufres 15 Philippines PGI Tiwi
2 China ECGI 9 Mexico CFE Los Humeros 16 Philippines PNOC EDC CCLS
3 Colombia INGEOMINAS 10 Mexico CFE Tres Virgenes 17 Philippines PNOC EDC BGPF
4 Costa Rica ICE 11 Mexico CFE GPG Morelia 18 Philippines PNOC EDC LGPF
5 El Salvador LAGEO 12 Nicaragua ENEL 19 Philippines PNOC EDC MGPF
6 Indonesia CRDIRT-BATAN 13 Philippines DOE 20 Philippines PNOC EDC SNGPF
7 Indonesia Pertamina 14 Philippines PGI Makban 21 Thailand Chiang Mai University
Table 2. Water samples used for ILCEs included in this study
1 99-01 BRIUG 8 Mexico CFE Los Azufres 15 Philippines PGI Tiwi
2 ECGI 9 Mexico CFE Los Humeros 16 Philippines PNOC EDC CCLS
3 Colombia INGEOMINAS 10 Mexico CFE Tres Virgenes 17 Philippines PNOC EDC BGPF
4 Costa Rica ICE 11 Mexico CFE GPG Morelia 18 Philippines PNOC EDC LGPF
5 El Salvador LAGEO 12 Nicaragua ENEL 19 Philippines PNOC EDC MGPF
6 Indonesia CRDIRT-BATAN 13 Philippines DOE 20 Philippines PNOC EDC SNGPF
7 Indonesia Pertamina 14 Philippines PGI Makban 21 Thailand Chiang Mai University
References
[1] Giggenbach W. F., Goguel R. L., Humaphries W. A. (1992). IAEA inter-laboratory
comparative geothermal water analysis program. IAEA-TECDOC-641. 439-456.
[2] Pang, Z., Grőning M. and Aggarwal, P. (1997). Evaluation of an inter-laboratory
comparison exercise on groundwater chemistry for the IAEA TC project RAF/8/022,
IAEA Report. 20p.
[3] Alvis-Isidro R., Urbino G.A., Gerardo-Abaya J. (1999). 1999 interlaboratory
comparison of geothermal water chemistry under IAEA regional project RAS/8/075.
IAEA Report, 39p.
[4] Alvis-Isidro R., Urbino G.A., Pang Z. (2000). Results of the 2000 IAEA
interlaboratory comparison of geothermal water chemistry. Report, IAEA, 40p.
[5] Aggarwal, P., Dargie, M., Grőning, M., Kulkarni, K. M., and Gibson, J.J. (2001). An
Inter-Laboratory Comparison of Arsenic Analysis in Bangladesh, IAEA Report, 24p
[6] Verma, M.P., Santoyo, S., Alvis-Isidro, R., Pang, Z. (2002) Assessment of the
Results of the IAEA Interlaboratory Comparisons for Geothermal Water Chemistry.
Proceedings, 27th
Workshop on Geothermal Reservoir Engineering, Stanford
University, January 24-26, 2002.
Gerardo-Abaya J., Schueszler C., Groening M. (1998). Results of the interlaboratory
comparison for water chemistry in natural geothermal samples under RAS/8/075. Report,
IAEA, 18p.
Giggenbach W.F. (1988). Geothermal solute equilibria. Derivation Na-K-Mg-Ca
geoindicators. Geochim. Cosmochim. Acta, 37, 2749-2765.
Giggenbach W.F., Goguel R.L., Humaphries W.A. (1992). IAEA interlaboratory
comparative geothermal water analysis program. Geothermal Investigations with Isotope
and Geothermal Techniques in Latin America. IAEA-TECDOC-641. 439-456.
GGrrooeenniinngg eett aall.. 11999988 ((nneeeedd ttoo ccoommpplleettee.. oonn ssttaabbllee iissoottooppee ccaalliibbrraattiioonn,, IIAAEEAA rreeppoorrtt)).
(Zhonge please help in completing the reference).
Parr R.M., Clements S.A. (1991). Intercomparison of enriched stable isotope reference
materials for medical and biological studies. Report IAEA, 31p.
Alvis-Isidro R., Urbino G.A., Gerardo-Abaya J. (1999). 1999 interlaboratory comparison
of geothermal water chemistry under IAEA regional project RAS/8/075. Preliminary
Report, IAEA, 39p.
Alvis-Isidro R., Urbino G.A., Pang Z. (2000). Results of the 2000 IAEA interlaboratory
comparison of geothermal water chemistry. Report, IAEA, 40p.
Bevington P.R. (1969). Data reduction and error analysis for the physical sciences.
McGraw-Hill Book Company, N.Y. 336p.
Box G.E.P., Hunter W.G., Hunter J.S. (1978). Statistics for experimenters: an
introduction to design, data analysis and model building. John Wiley & Sons, N.Y. 653.
APPENDIX VI: 2003 INTER-LABORATORY COMPARISON OF
GEOTHERMAL WATER CHEMISTRY
Report by
Guima A. Urbino1 and Zhonghe Pang2*3
1PNOC Energy Development Corporation
Merritt Road, Fort Bonifacio, Makati City, 1201, Philippines
2 Institute of Geology and Geophysics, Chinese Academy of Sciences, Beijing 100029, China
3 formerly at Isotope Hydrology Section, International Atomic Energy Agency, Vienna, Austria
Acknowledgement
This inter-laboratory comparison activity was made possible through the
support of the International Atomic Energy Agency through its Regional
Project RAS/8/092 on “Investigating the Environment and Water
Resources”. The authors also wish to thank all the laboratories that have
taken part in this activity either as reference or participating laboratories.
INTRODUCTION
An inter-laboratory comparison of geothermal water chemistry was jointly organized by the International Atomic Energy Agency (IAEA) and the PNOC Energy Development Corporation (PNOC EDC) in September to December 2003. This activity is part of the IAEA Regional Project RAS/8/092 on "Investigating the Environment and Water Resources". Similar inter-laboratory comparison exercises have been conducted in 1999 and 2000 under other IAEA Projects (Alvis-Isidro et al., 1999, 2001, 2002).
Thirty-one (31) laboratories participated in the 2003 inter-laboratory comparison activity from East Asia and Pacific, Latin American and African regions, besides Iceland GeoSurvey and the IAEA Hydrology laboratory. Of the 31 laboratories, five are reference laboratories, namely, Beijing Research Institute of Uranium Geology (China), Laboratorio Geoquimico LaGeo S.A. de C.V. (El Salvador), Iceland GeoSurvey (Iceland), Pakistan Institute of Nuclear Science and Technology (Pakistan) and PNOC EDC Central Chemistry Laboratory (Philippines).
The objectives of this inter-laboratory comparison are:
1. To measure the accuracy and precision of results of various chemical parameters in geothermal water analysis among participating laboratories.
2. To assess the improvement in the performance of laboratories which participated in previous inter-laboratory exercises.
3. To identify areas in which each participating laboratory may need to improve.
METHODOLOGY
Collection and Preparation of Samples
For the 2003 inter-laboratory comparison activity, only one of the three inter-laboratory comparison samples is natural geothermal water. The other two samples consist of synthetic brine and a mixture of the natural geothermal water and the synthetic brine. A water sample of medium salinity was collected from a geothermal well in the Leyte Geothermal Production Field located in the Visayas region of the Philippines, coded as GW-03-02. A standard solution with chloride concentration greater than 10,000 mg/L and calcium concentration greater than 1000 mg/L was prepared by weighing 4.585g CaCl2 (98.2%), 16.5g NaCl (99.9%), 3.58g MgCl2.6H2O (99.0%), 0.74g Na2SO4 (99.0%) and 0.95g KCl (99.5%) for every liter of solution, coded as GW-03-03. Another sample, GW-03-01, was prepared by mixing 44% GW-03-02 and 56% GW-03-03.
Each sample was filtered using a 0.45 μm membrane filter and divided into two portions. One portion consisted of an untreated sample and the other portion was acidified with HNO3 until pH <2 was attained. To ensure homogeneity, each sample was thoroughly mixed in a large plastic container before filling 1-L and 500-mL double-capped high density polyethylene sample bottles with them.
Each participating laboratory was provided with 500 mL acidified and 1 L unacidified portions of GW-03-01 and GW-03-02. Reference laboratories, except CCLS-Philippines and Iceland GeoSurvey, received 1 L acidified and 2 L unacidified portions of GW-03-01, GW-03-02 and GW-03-03. CCLS-Philippines and Iceland GeoSurvey were provided with 2 L acidified and 3 L unacidified portions of the three samples as these two reference laboratories were requested to do more analytical trials to check for homogeneity and stability of samples over time. Due to limitations in preparing large volume of synthetic brine, only the reference laboratories were provided with GW-03-03.
Analytical parameters included in this inter-laboratory comparison exercise are pH, conductivity, HCO3, Cl, SO4, SiO2 (total), B, F, Na, K, Ca, Mg, Li and NH3. Participating laboratories were requested to submit results of two separate trials of each parameter per sample together with the corresponding mean, standard deviation and standard uncertainties. Reference laboratories, on the other hand, were requested to submit results of three separate trials, except for CCLS-
Philippines and Iceland GeoSurvey, from whom results of 10 separate trials of each parameter were requested, to check for stability within a one-month period. CCLS-Philippines also conducted additional analyses to check for homogeneity of the samples. Parameters considered to be most sensitive to heterogeneity were included in homogeneity check.
Evaluation of Results
Homogeneity
A homogeneity check was carried out to ensure that there is no significant difference in the composition of the samples that would affect the evaluation of results. Ten samples of GW-03-01, seven samples of GW-03-02 and five samples of GW-03-03 were set aside for homogeneity checks. pH, Na, K, Ca, Cl and SO4 were initially chosen to check for homogeneity as these parameters were identified to be sensitive to heterogeneity.
Stability
Geothermal water samples are relatively unstable compared with
groundwater samples because of their high salinity and high silica content.
However, when properly preserved, these samples may be stable up to at
least one month. The stability checks were carried out by two laboratories,
CCLS-Philippines and Iceland GeoSurvey, to ensure that there is no
significant change in the composition of the sample within a one-month
period. Unlike the homogeneity check in which each parameter was
analyzed using separate samples, the stability check involves analysis of the
same sample at regular time intervals.
Results of all labs
Reference and participating laboratories were randomly assigned laboratory codes R1 to R5 and P1 to P26, respectively. The laboratory codes do not necessarily correspond to the order listed in Annexes A and B.
There were three levels of outlier tests conducted. The first level includes only the results of reference laboratories whose mean results were subjected to a statistical outlier test using the HISTO program (Radecki and Trinkl, 1999) to narrow down the variability of the reference values. This program includes the Dixon, Grubbs, Skewness and Kurtosis tests using a 95% level of confidence. After eliminating outliers, the remaining reference values together with the mean results of all participating laboratories, were again subjected to a second level statistical outlier test using the same program. Outliers identified in the second level outlier test were also eliminated. In the third level outlier test, values not
within +2of the initially determined mean (after two HISTO runs) were also identified as outliers.
The standard uncertainties of the analysis were significant in the evaluation of results, particularly for values that were identified as outliers. In cases in which a laboratory failed to report the standard uncertainty, standard deviation was used to estimate the uncertainty of the analysis.
As discussed above, reference values were obtained from the mean results of reference laboratories using more rigid statistical outlier tests. Three levels of statistical outlier tests were conducted on the results of reference laboratories while only two levels of outlier tests were carried out on the results of the participating laboratories. However, since n is small (4 or 5) for reference laboratories, special considerations were given in cases where two laboratories reported the same values. Otherwise, only two identical results will remain as accepted values and all other values will be considered as outliers even though the difference is within 1%, as in the case of pH and Cl in GW-03-02.
The accepted mean is the mean result of the reference and participating laboratories for each parameter excluding outliers identified up to the second level statistical outlier test while the final accepted mean is the mean result of
reference and participating laboratories excluding outliers identified up the third
level outlier test (two HISTO runs and values not within + 2
For the synthetic samples, GW-03-01 and GW-03-03, expected values for some parameters were calculated based on the preparation of these samples mentioned earlier. For GW-03-03, losses in Ca and Cl were calculated taking into account the possible precipitation of Ca as CaCl2.
DISCUSSSION OF RESULTS
The data for the homogeneity check is presented in Table 1. For GW-03-01, the coefficient of variation (CV) ranges from 0.36% to 1.74% with K having the highest CV. For GW-03-02, the CV ranges from 0.12% to 1.98 with K also having the highest CV. For GW-03-03, the CV ranges from 0.41% to 1.36% with Na having the highest CV. These values indicate that K tends to have the highest variability. However, the low range of CV values indicates no significant difference in the composition of the samples. Thus, GW-03-01, GW-03-02 and GW-03-03 are considered homogeneous.
Tables 2A and 2B shows results of stability checks performed by CCLS-Philippines and Iceland GeoSurvey, coded as Laboratory 1 and Laboratory 2 (not necessarily in that order). Results indicate no significant trends in increase or decrease of values with time of the various parameters analyzed except pH and HCO3 wherein a slight increase in pH and slight decrease in HCO3 are detected in the natural geothermal brine, GW-03-02. However, the effect is not quite significant as indicated by the CV that ranges from 0.9% to 3.6%. Other parameters with CV greater than 5% may be due to poor precision of the analysis.
The mean results of reference and participating laboratories are presented in Table 3 for GW-03-01 (mixed natural and synthetic brine), Table 5 for GW-03-02 (natural geothermal brine) and Table 7 for GW-03-03 (synthetic brine). Outliers identified using the HISTO program in the first level statistical test for reference laboratories are marked with a red asterisk (*). For the second level statistical
test, outliers are marked with a black asterisk (*) and values not within +2 are marked with a plus sign (+).
The S-shaped plots in Figures 1 to 37 show the results of all laboratories for the various parameters of each sample. The mean result of each laboratory and identified outliers are represented by open red diamonds (♦) and black-filled diamonds (♦), respectively. The standard uncertainties are also depicted in the graphs as error bars. The reference value, which is the mean of all accepted results of the reference laboratories excluding outliers, is represented by a blue
solid line with its +2as blue broken lines. The accepted mean is represented
by a black solid line with its +2as black broken lines. A red solid line represents the final accepted mean. For GW-03-01 and GW-03-03, the expected values are shown by a green solid line.
For all outlying results, standard uncertainties were considered in the evaluation.
When an outlying value with its uncertainty within +2value becomes acceptable. However, it has been noted that some laboratories have reported large standard uncertainty values that may not represent the actual uncertainties of the analysis. In this evaluation, the values are presented as reported by the laboratories.
The analytical methods used by the different laboratories for GW-03-01, GW-03-02 and GW-03-03 are shown in Tables 4, 6 and 8, respectively.
GW-03-01 Mixed Natural and Synthetic Brine
In GW-03-01, the final accepted mean of all parameters is within +2reference value except for Ca. The final accepted mean for Ca is 788 mg/L while
+2
Ca is 776 mg/L which is within +2
Reference values generally lie close to the expected values except for SO4, Na and K wherein the final accepted mean is closer to the expected value.
The percentage of accepted results for all parameters ranges from 71.4% to 96.4% with Ca having the lowest % accepted results.
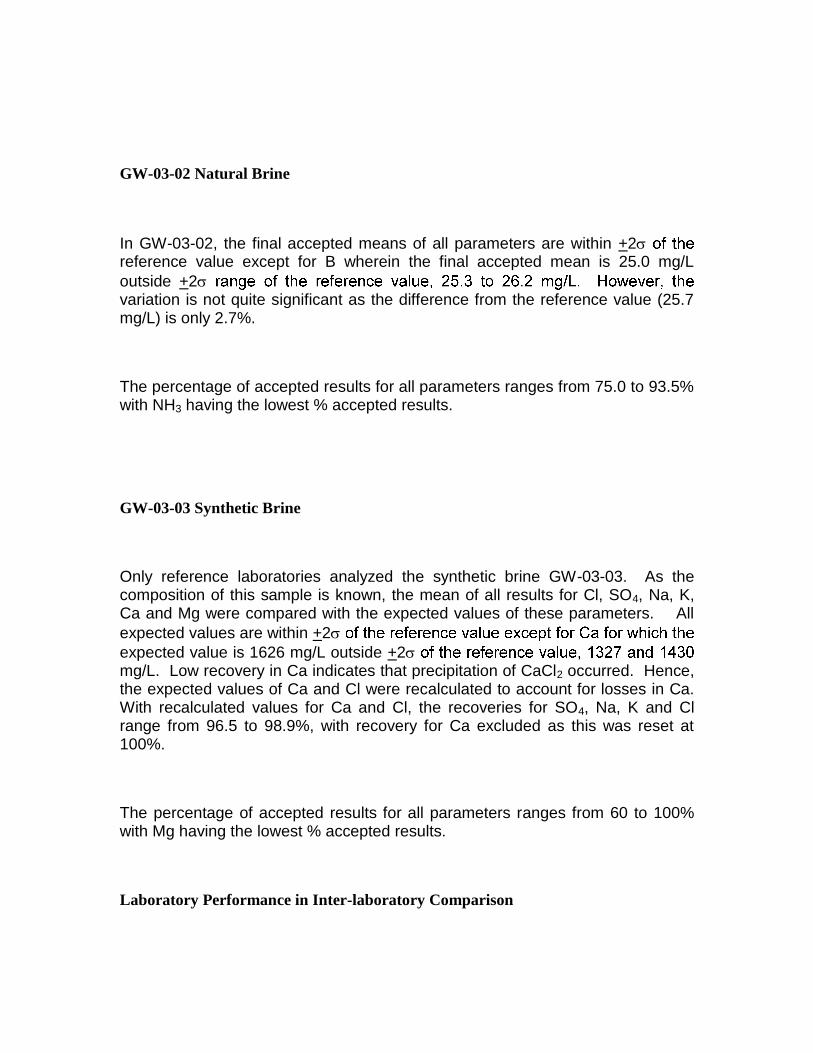
GW-03-02 Natural Brine
In GW-03-02, the final accepted means of all parameters are within +2reference value except for B wherein the final accepted mean is 25.0 mg/L
outside +2variation is not quite significant as the difference from the reference value (25.7 mg/L) is only 2.7%.
The percentage of accepted results for all parameters ranges from 75.0 to 93.5% with NH3 having the lowest % accepted results.
GW-03-03 Synthetic Brine
Only reference laboratories analyzed the synthetic brine GW-03-03. As the composition of this sample is known, the mean of all results for Cl, SO4, Na, K, Ca and Mg were compared with the expected values of these parameters. All
expected values are within +2
expected value is 1626 mg/L outside +2mg/L. Low recovery in Ca indicates that precipitation of CaCl2 occurred. Hence, the expected values of Ca and Cl were recalculated to account for losses in Ca. With recalculated values for Ca and Cl, the recoveries for SO4, Na, K and Cl range from 96.5 to 98.9%, with recovery for Ca excluded as this was reset at 100%.
The percentage of accepted results for all parameters ranges from 60 to 100% with Mg having the lowest % accepted results.
Laboratory Performance in Inter-laboratory Comparison
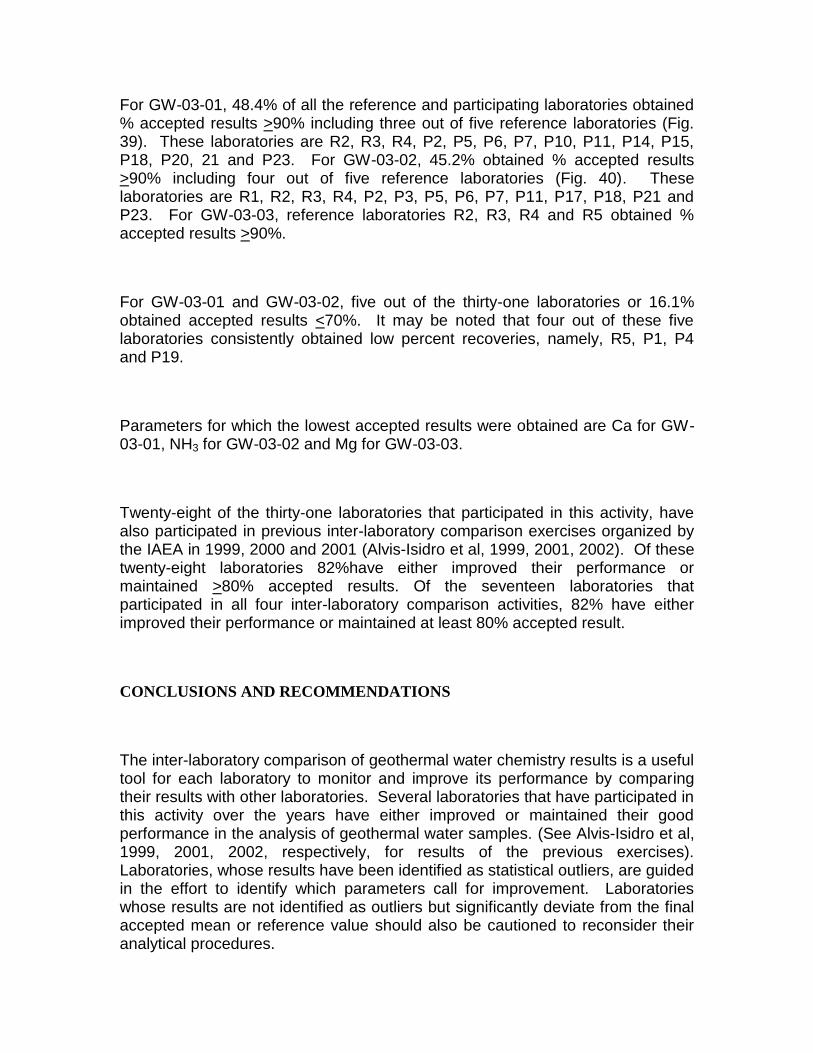
For GW-03-01, 48.4% of all the reference and participating laboratories obtained % accepted results >90% including three out of five reference laboratories (Fig. 39). These laboratories are R2, R3, R4, P2, P5, P6, P7, P10, P11, P14, P15, P18, P20, 21 and P23. For GW-03-02, 45.2% obtained % accepted results >90% including four out of five reference laboratories (Fig. 40). These laboratories are R1, R2, R3, R4, P2, P3, P5, P6, P7, P11, P17, P18, P21 and P23. For GW-03-03, reference laboratories R2, R3, R4 and R5 obtained % accepted results >90%.
For GW-03-01 and GW-03-02, five out of the thirty-one laboratories or 16.1% obtained accepted results <70%. It may be noted that four out of these five laboratories consistently obtained low percent recoveries, namely, R5, P1, P4 and P19.
Parameters for which the lowest accepted results were obtained are Ca for GW-03-01, NH3 for GW-03-02 and Mg for GW-03-03.
Twenty-eight of the thirty-one laboratories that participated in this activity, have also participated in previous inter-laboratory comparison exercises organized by the IAEA in 1999, 2000 and 2001 (Alvis-Isidro et al, 1999, 2001, 2002). Of these twenty-eight laboratories 82%have either improved their performance or maintained >80% accepted results. Of the seventeen laboratories that participated in all four inter-laboratory comparison activities, 82% have either improved their performance or maintained at least 80% accepted result.
CONCLUSIONS AND RECOMMENDATIONS
The inter-laboratory comparison of geothermal water chemistry results is a useful tool for each laboratory to monitor and improve its performance by comparing their results with other laboratories. Several laboratories that have participated in this activity over the years have either improved or maintained their good performance in the analysis of geothermal water samples. (See Alvis-Isidro et al, 1999, 2001, 2002, respectively, for results of the previous exercises). Laboratories, whose results have been identified as statistical outliers, are guided in the effort to identify which parameters call for improvement. Laboratories whose results are not identified as outliers but significantly deviate from the final accepted mean or reference value should also be cautioned to reconsider their analytical procedures.
Based on the results of this inter-laboratory comparison exercise, it has been observed that some laboratories may need to establish their standard uncertainties for the different parameters since this is also a part of the quality control measures each laboratory has to undertake. Knowing these values also increases confidence of the laboratory in the validity of their analysis.
As a continuing activity, it is also recommended that the conduct of this inter-laboratory comparison be further improved by adopting measures recommended by ISO/IEC Guide 43 (IOS,1997) and other references on proficiency testing applicable to geothermal water chemistry.
REFERENCES
Alvis-Isidro, R., Urbino, G.A. and Gerardo-Abaya, J. (1999) 1999 Inter-laboratory comparison of
geothermal water chemistry. IAEA report.
Alvis-Isidro, R., Urbino, G.A. and Pang, Z. (2001) Results of the 2000 IAEA inter-laboratory
comparison of geothermal water chemistry. IAEA report.
Alvis-Isidro, R., Urbino, G.A. and Pang, Z. (2002) Results of the 2001 IAEA inter-laboratory
comparison of geothermal water chemistry. IAEA report.
International Organization for Standardization (IOS). (1997) ISO/IEC 43-II. Proficiency Testing
by Inter-laboratory Comparisons, Switzerland.
Radecki, Z. and Trinkl, A. (1999) HISTO-Statistical analysis for inter-comparison data. IAEA
report.
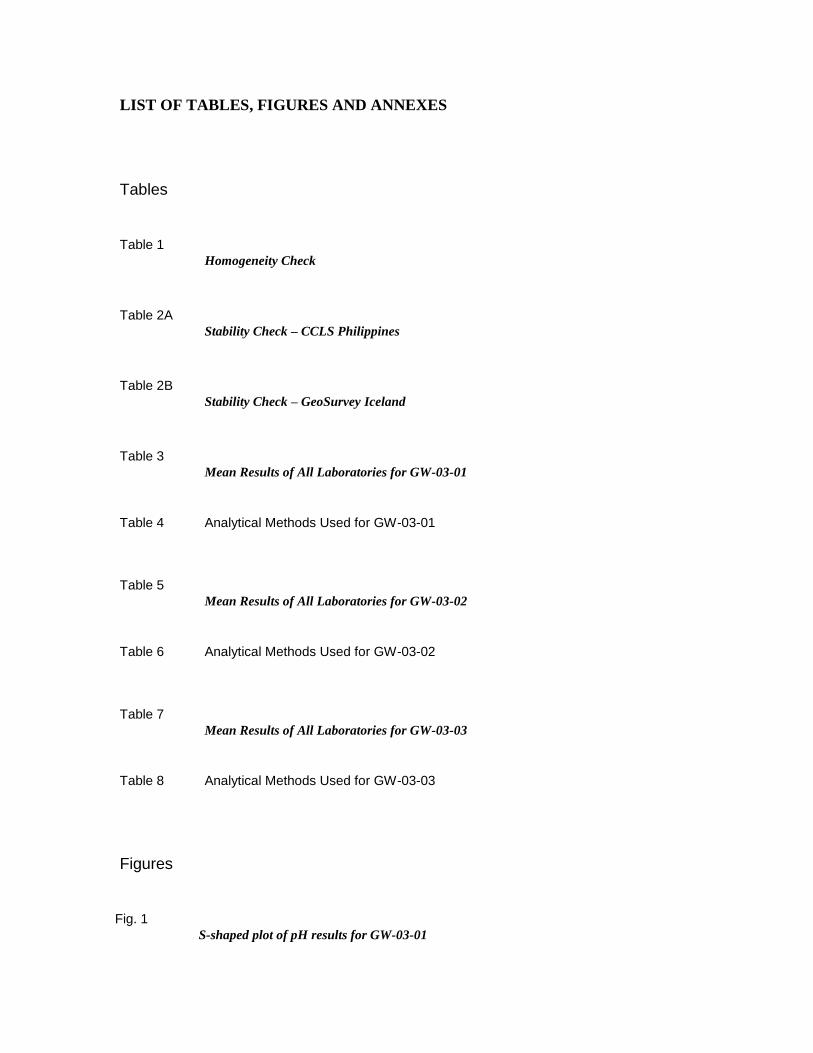
LIST OF TABLES, FIGURES AND ANNEXES
Tables
Table 1
Homogeneity Check
Table 2A
Stability Check – CCLS Philippines
Table 2B
Stability Check – GeoSurvey Iceland
Table 3
Mean Results of All Laboratories for GW-03-01
Table 4 Analytical Methods Used for GW-03-01
Table 5
Mean Results of All Laboratories for GW-03-02
Table 6 Analytical Methods Used for GW-03-02
Table 7
Mean Results of All Laboratories for GW-03-03
Table 8 Analytical Methods Used for GW-03-03
Figures
Fig. 1
S-shaped plot of pH results for GW-03-01
Fig. 2 S-shaped plot of Conductivity results for GW-03-01
Fig. 3 S-shaped plot of HCO3 results for GW-03-01
Fig. 4 S-shaped plot of Cl results for GW-03-01
Fig. 5 S-shaped plot of SO4 results for GW-03-01
Fig. 6 S-shaped plot of SiO2 results for GW-03-01
Fig. 7 S-shaped plot of B results for GW-03-01
Fig. 8 S-shaped plot of F results for GW-03-01
Fig. 9 S-shaped plot of Na results for GW-03-01
Fig. 10 S-shaped plot of K results for GW-03-01
Fig. 11 S-shaped plot of Ca results for GW-03-01
Fig. 12 S-shaped plot of Mg results for GW-03-01
Fig. 13 S-shaped plot of Li results for GW-03-01
Fig. 14 S-shaped plot of NH3 results for GW-03-01
Fig. 15
S-shaped plot of pH results for GW-03-02
Fig. 16 S-shaped plot of Conductivity results for GW-03-02
Fig. 17 S-shaped plot of HCO3 results for GW-03-02
Fig. 18 S-shaped plot of Cl results for GW-03-02
Fig. 19 S-shaped plot of SO4 results for GW-03-02
Fig. 20 S-shaped plot of SiO2 results for GW-03-02
Fig. 21 S-shaped plot of B results for GW-03-02
Fig. 22 S-shaped plot of F results for GW-03-02
Fig. 23 S-shaped plot of Na results for GW-03-02
Fig. 24 S-shaped plot of K results for GW-03-02
Fig. 25 S-shaped plot of Ca results for GW-03-02
Fig. 26 S-shaped plot of Mg results for GW-03-02
Fig. 27 S-shaped plot of Li results for GW-03-02
Fig. 28 S-shaped plot of NH3 results for GW-03-02
Fig. 29
S-shaped plot of pH results for GW-03-03
Fig. 30 S-shaped plot of Conductivity results for GW-03-03
Fig. 31 S-shaped plot of Cl results for GW-03-03
Fig. 32 S-shaped plot of SO4 results for GW-03-03
Fig. 33 S-shaped plot of Na results for GW-03-03
Fig. 34 S-shaped plot of K results for GW-03-03
Fig. 35 S-shaped plot of Ca results for GW-03-03
Fig. 36 S-shaped plot of Mg results for GW-03-03
Fig. 37 S-shaped plot of NH3 results for GW-03-03
Fig. 38 % Accepted Results per Parameter
Fig. 39 % Accepted Results of Laboratories in the Analysis of
Mixed Geothermal and Synthetic Brine (GW-03-01)
Fig. 40 % Accepted Results of Laboratories in the Analysis of
Geothermal Brine (GW-03-02)
Fig. 41 % Accepted Results of Laboratories in the Analysis of
Synthetic Brine (GW-03-03)
Fig. 42 % Overall Accepted Results
Fig. 43 Comparison of % Overall Accepted Results (1999-2003)
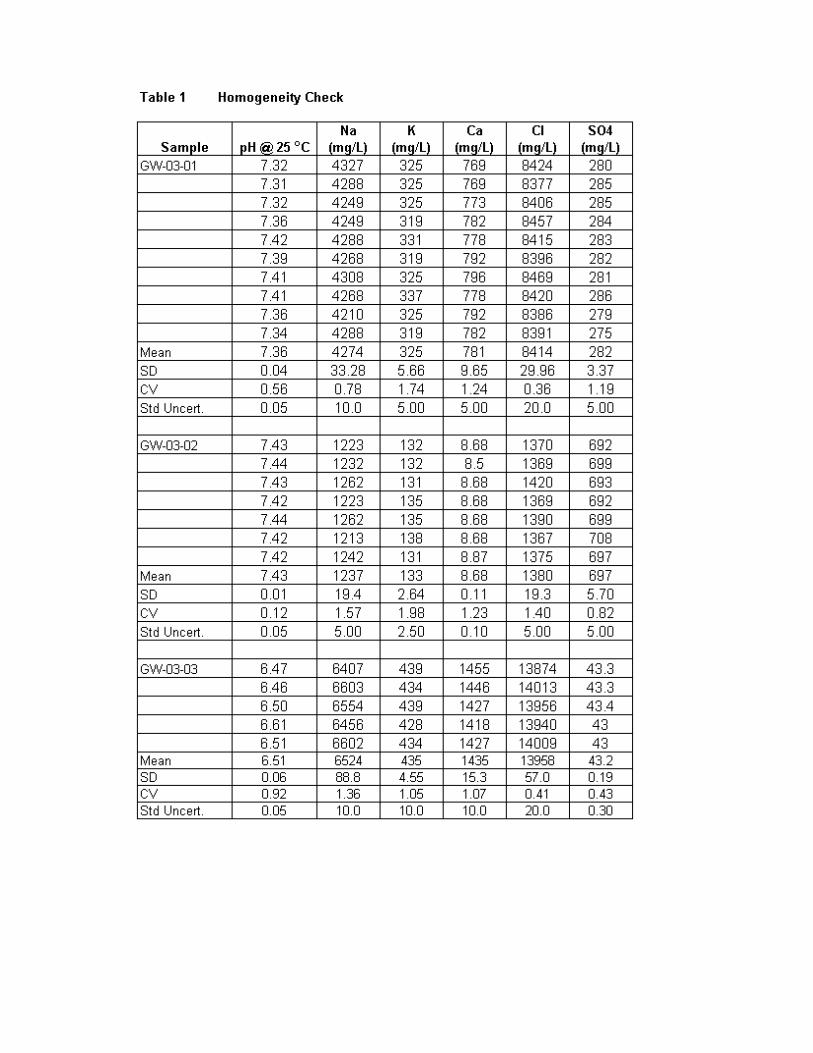
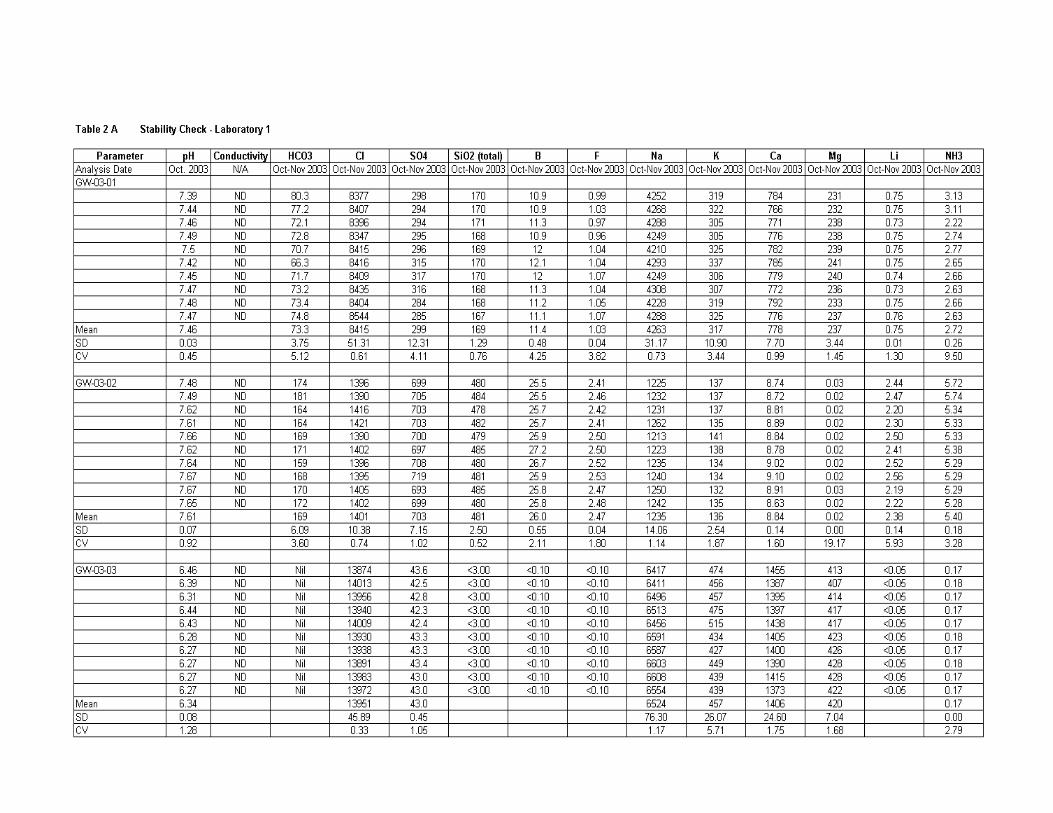
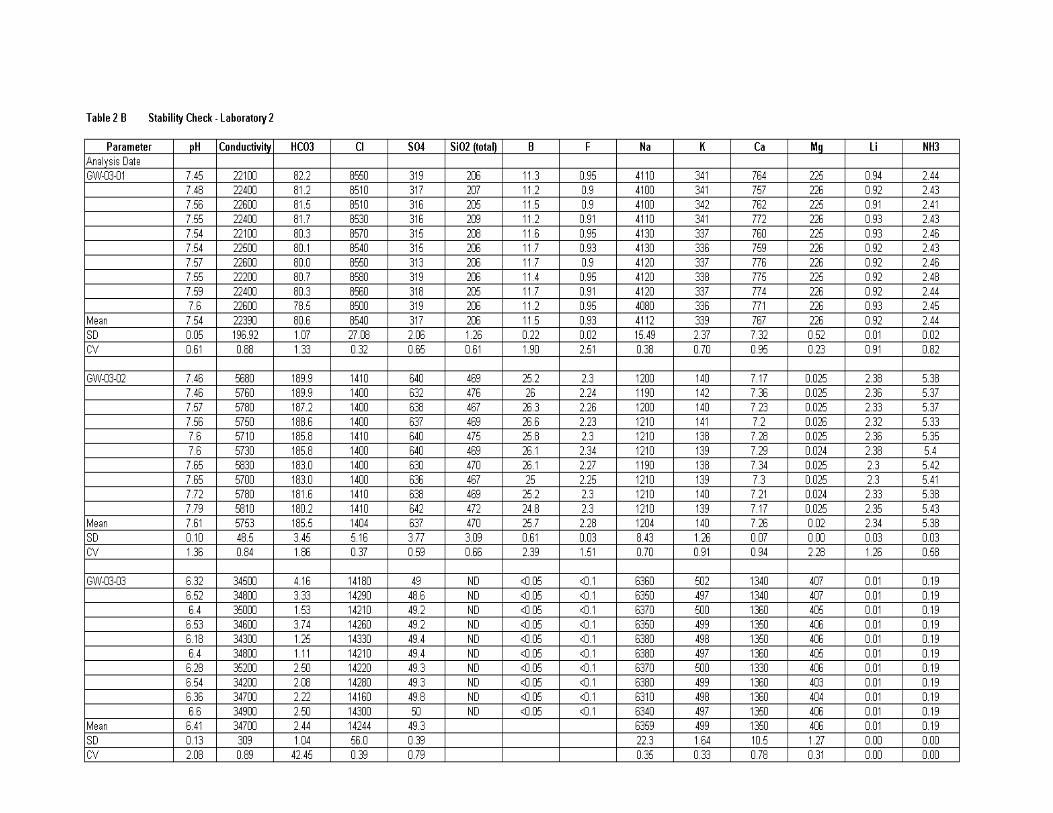
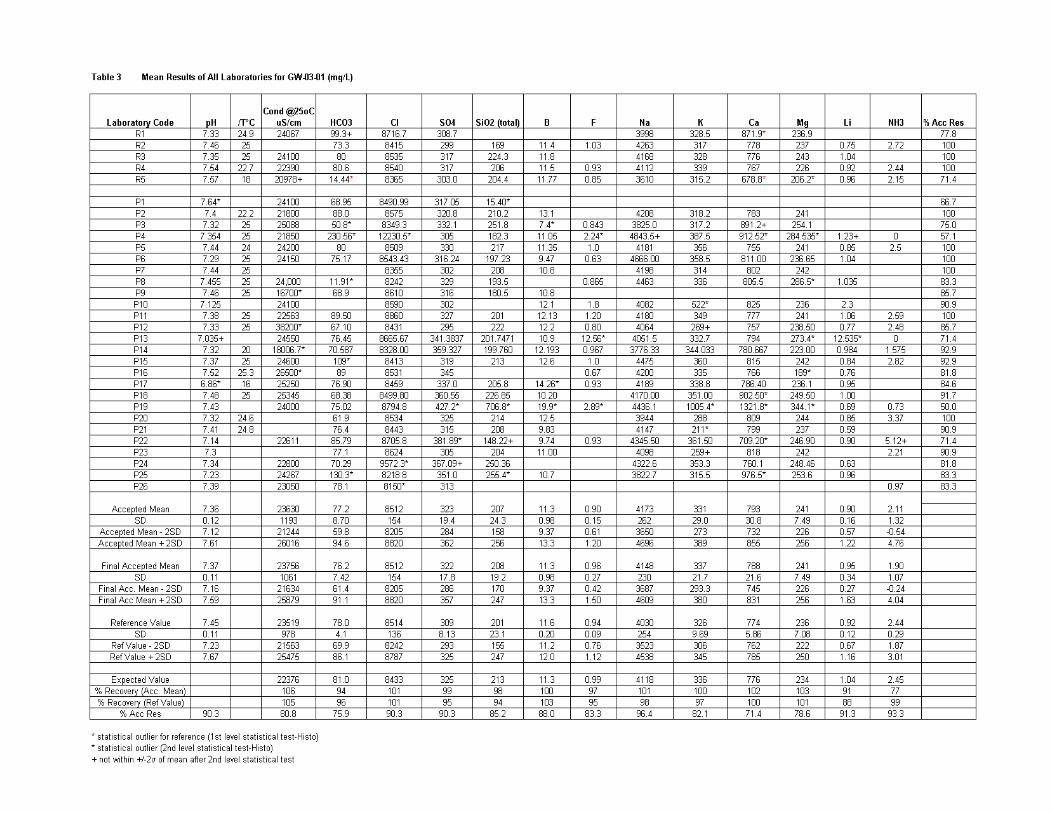
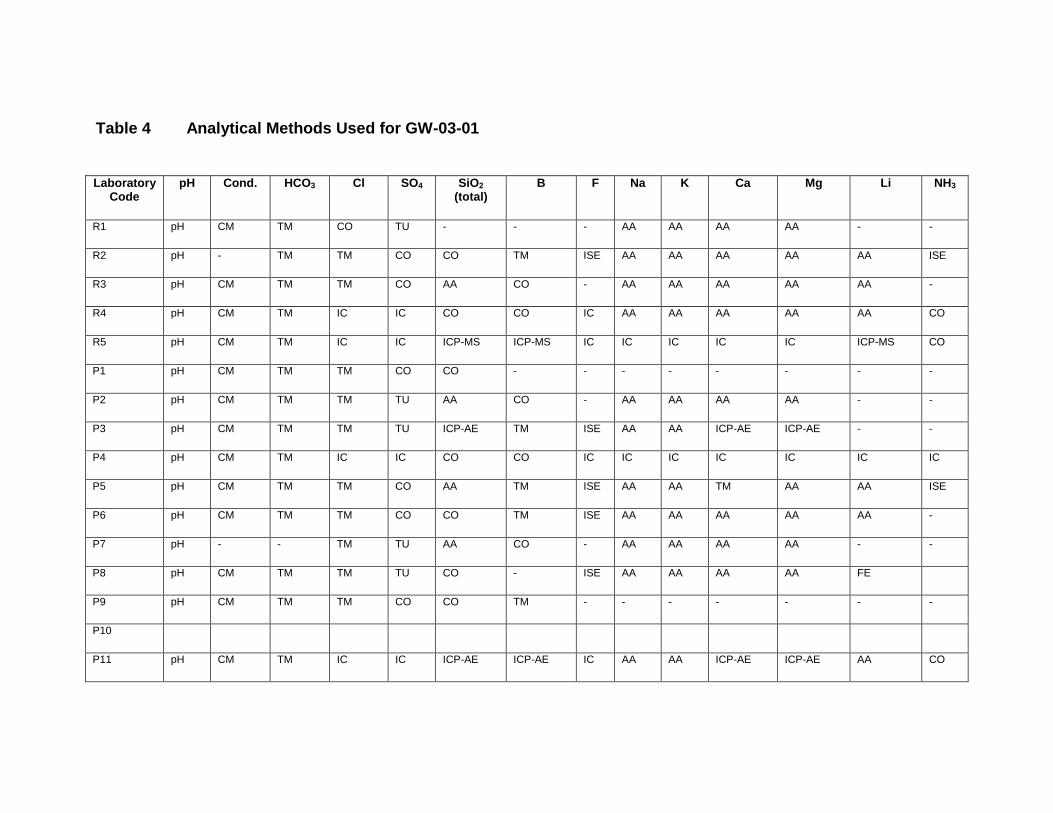
Table 4 Analytical Methods Used for GW-03-01
Laboratory Code
pH Cond. HCO3 Cl SO4 SiO2 (total)
B F Na K Ca Mg Li NH3
R1 pH CM TM CO TU - - - AA AA AA AA - -
R2 pH - TM TM CO CO TM ISE AA AA AA AA AA ISE
R3 pH CM TM TM CO AA CO - AA AA AA AA AA -
R4 pH CM TM IC IC CO CO IC AA AA AA AA AA CO
R5 pH CM TM IC IC ICP-MS ICP-MS IC IC IC IC IC ICP-MS CO
P1 pH CM TM TM CO CO - - - - - - - -
P2 pH CM TM TM TU AA CO - AA AA AA AA - -
P3 pH CM TM TM TU ICP-AE TM ISE AA AA ICP-AE ICP-AE - -
P4 pH CM TM IC IC CO CO IC IC IC IC IC IC IC
P5 pH CM TM TM CO AA TM ISE AA AA TM AA AA ISE
P6 pH CM TM TM CO CO TM ISE AA AA AA AA AA -
P7 pH - - TM TU AA CO - AA AA AA AA - -
P8 pH CM TM TM TU CO - ISE AA AA AA AA FE
P9 pH CM TM TM CO CO TM - - - - - - -
P10
P11 pH CM TM IC IC ICP-AE ICP-AE IC AA AA ICP-AE ICP-AE AA CO
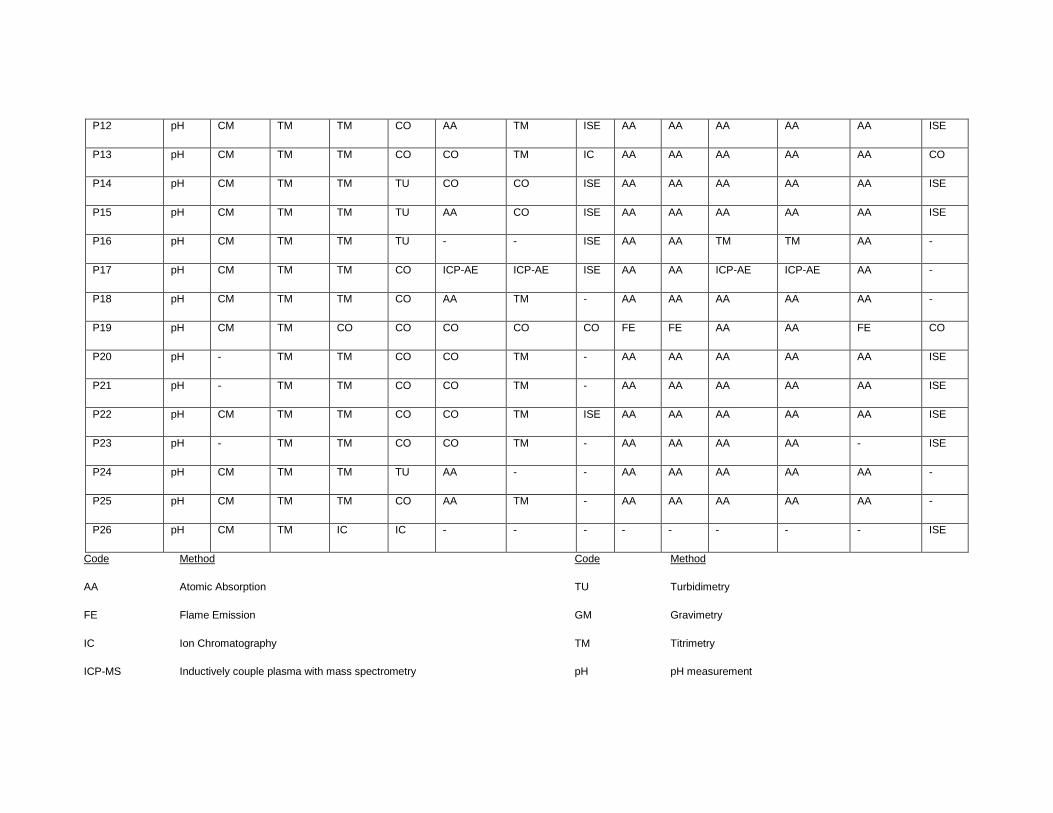
P12 pH CM TM TM CO AA TM ISE AA AA AA AA AA ISE
P13 pH CM TM TM CO CO TM IC AA AA AA AA AA CO
P14 pH CM TM TM TU CO CO ISE AA AA AA AA AA ISE
P15 pH CM TM TM TU AA CO ISE AA AA AA AA AA ISE
P16 pH CM TM TM TU - - ISE AA AA TM TM AA -
P17 pH CM TM TM CO ICP-AE ICP-AE ISE AA AA ICP-AE ICP-AE AA -
P18 pH CM TM TM CO AA TM - AA AA AA AA AA -
P19 pH CM TM CO CO CO CO CO FE FE AA AA FE CO
P20 pH - TM TM CO CO TM - AA AA AA AA AA ISE
P21 pH - TM TM CO CO TM - AA AA AA AA AA ISE
P22 pH CM TM TM CO CO TM ISE AA AA AA AA AA ISE
P23 pH - TM TM CO CO TM - AA AA AA AA - ISE
P24 pH CM TM TM TU AA - - AA AA AA AA AA -
P25 pH CM TM TM CO AA TM - AA AA AA AA AA -
P26 pH CM TM IC IC - - - - - - - - ISE
Code Method Code Method
AA Atomic Absorption TU Turbidimetry
FE Flame Emission GM Gravimetry
IC Ion Chromatography TM Titrimetry
ICP-MS Inductively couple plasma with mass spectrometry pH pH measurement
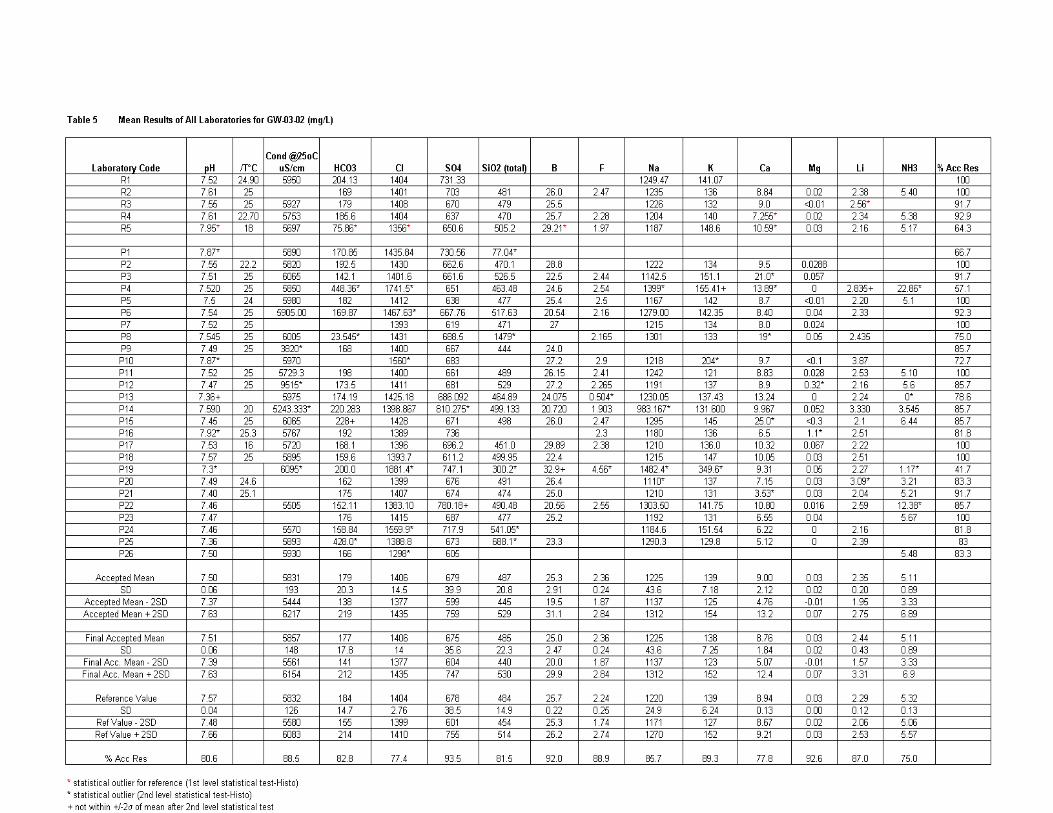
ICP-AE Inductively couple plasma with atomic emission CM Conductivity
HPLC High performance liquid chromatography ISE Ion selective electrode
CO Colorimetry
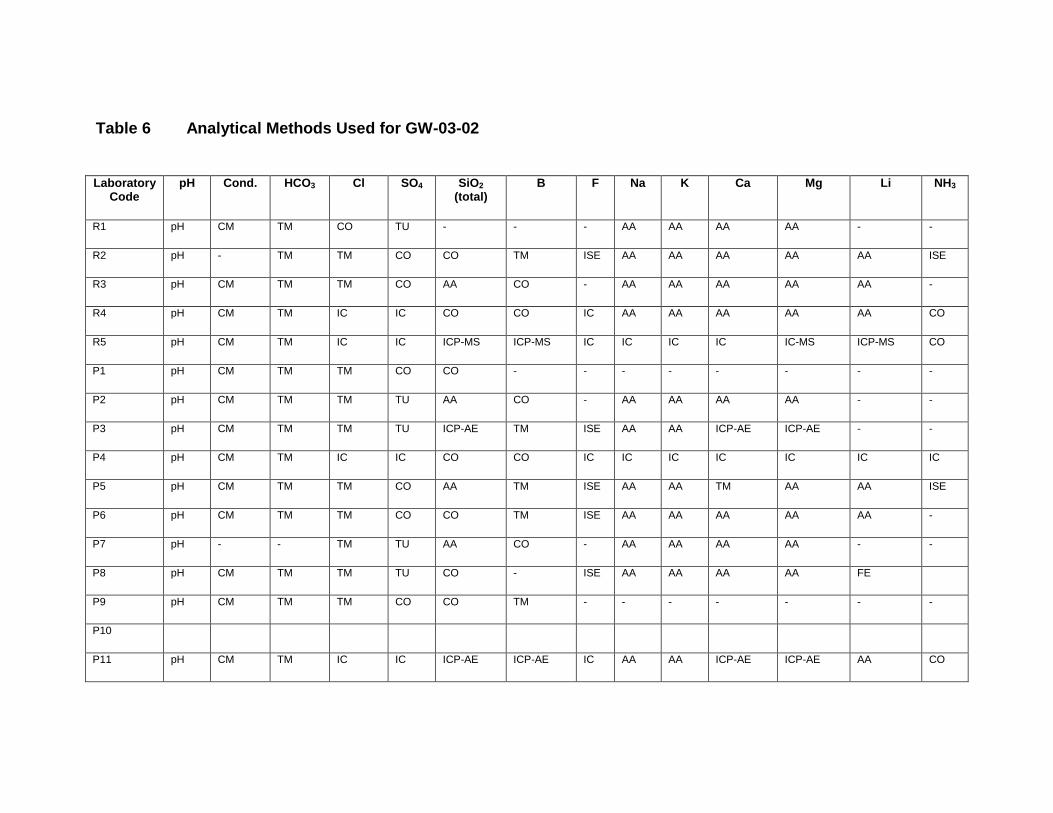
Table 6 Analytical Methods Used for GW-03-02
Laboratory Code
pH Cond. HCO3 Cl SO4 SiO2 (total)
B F Na K Ca Mg Li NH3
R1 pH CM TM CO TU - - - AA AA AA AA - -
R2 pH - TM TM CO CO TM ISE AA AA AA AA AA ISE
R3 pH CM TM TM CO AA CO - AA AA AA AA AA -
R4 pH CM TM IC IC CO CO IC AA AA AA AA AA CO
R5 pH CM TM IC IC ICP-MS ICP-MS IC IC IC IC IC-MS ICP-MS CO
P1 pH CM TM TM CO CO - - - - - - - -
P2 pH CM TM TM TU AA CO - AA AA AA AA - -
P3 pH CM TM TM TU ICP-AE TM ISE AA AA ICP-AE ICP-AE - -
P4 pH CM TM IC IC CO CO IC IC IC IC IC IC IC
P5 pH CM TM TM CO AA TM ISE AA AA TM AA AA ISE
P6 pH CM TM TM CO CO TM ISE AA AA AA AA AA -
P7 pH - - TM TU AA CO - AA AA AA AA - -
P8 pH CM TM TM TU CO - ISE AA AA AA AA FE
P9 pH CM TM TM CO CO TM - - - - - - -
P10
P11 pH CM TM IC IC ICP-AE ICP-AE IC AA AA ICP-AE ICP-AE AA CO
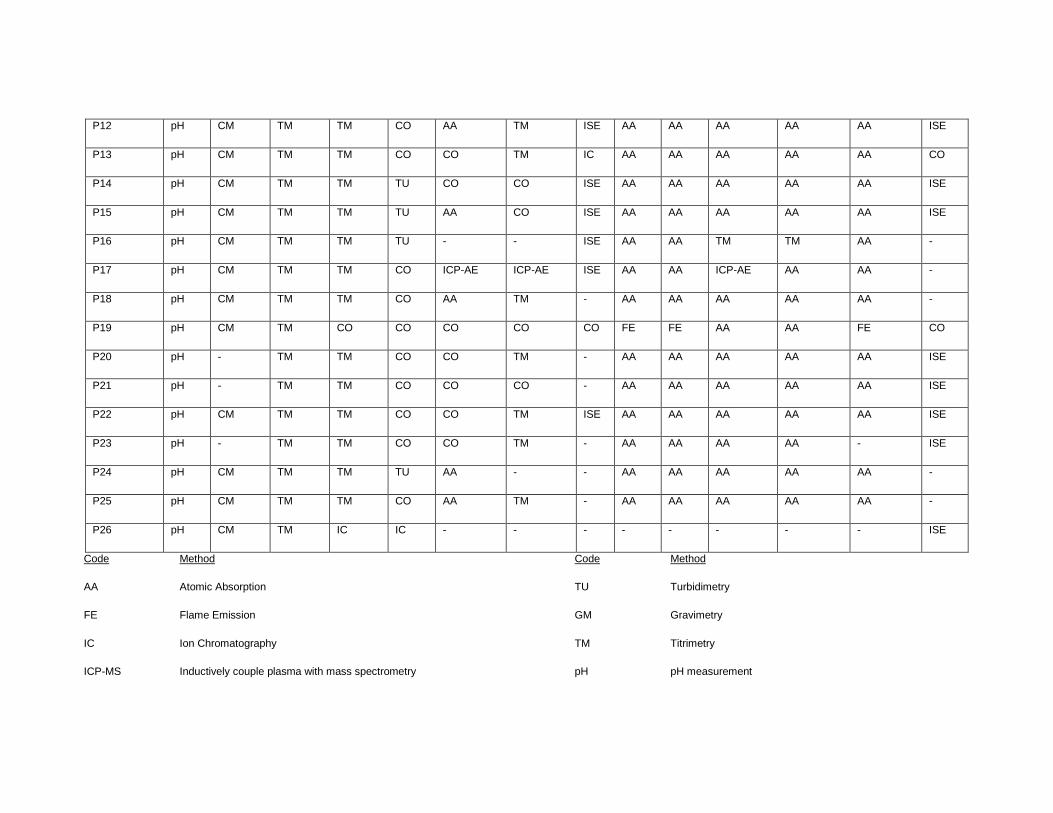
P12 pH CM TM TM CO AA TM ISE AA AA AA AA AA ISE
P13 pH CM TM TM CO CO TM IC AA AA AA AA AA CO
P14 pH CM TM TM TU CO CO ISE AA AA AA AA AA ISE
P15 pH CM TM TM TU AA CO ISE AA AA AA AA AA ISE
P16 pH CM TM TM TU - - ISE AA AA TM TM AA -
P17 pH CM TM TM CO ICP-AE ICP-AE ISE AA AA ICP-AE AA AA -
P18 pH CM TM TM CO AA TM - AA AA AA AA AA -
P19 pH CM TM CO CO CO CO CO FE FE AA AA FE CO
P20 pH - TM TM CO CO TM - AA AA AA AA AA ISE
P21 pH - TM TM CO CO CO - AA AA AA AA AA ISE
P22 pH CM TM TM CO CO TM ISE AA AA AA AA AA ISE
P23 pH - TM TM CO CO TM - AA AA AA AA - ISE
P24 pH CM TM TM TU AA - - AA AA AA AA AA -
P25 pH CM TM TM CO AA TM - AA AA AA AA AA -
P26 pH CM TM IC IC - - - - - - - - ISE
Code Method Code Method
AA Atomic Absorption TU Turbidimetry
FE Flame Emission GM Gravimetry
IC Ion Chromatography TM Titrimetry
ICP-MS Inductively couple plasma with mass spectrometry pH pH measurement
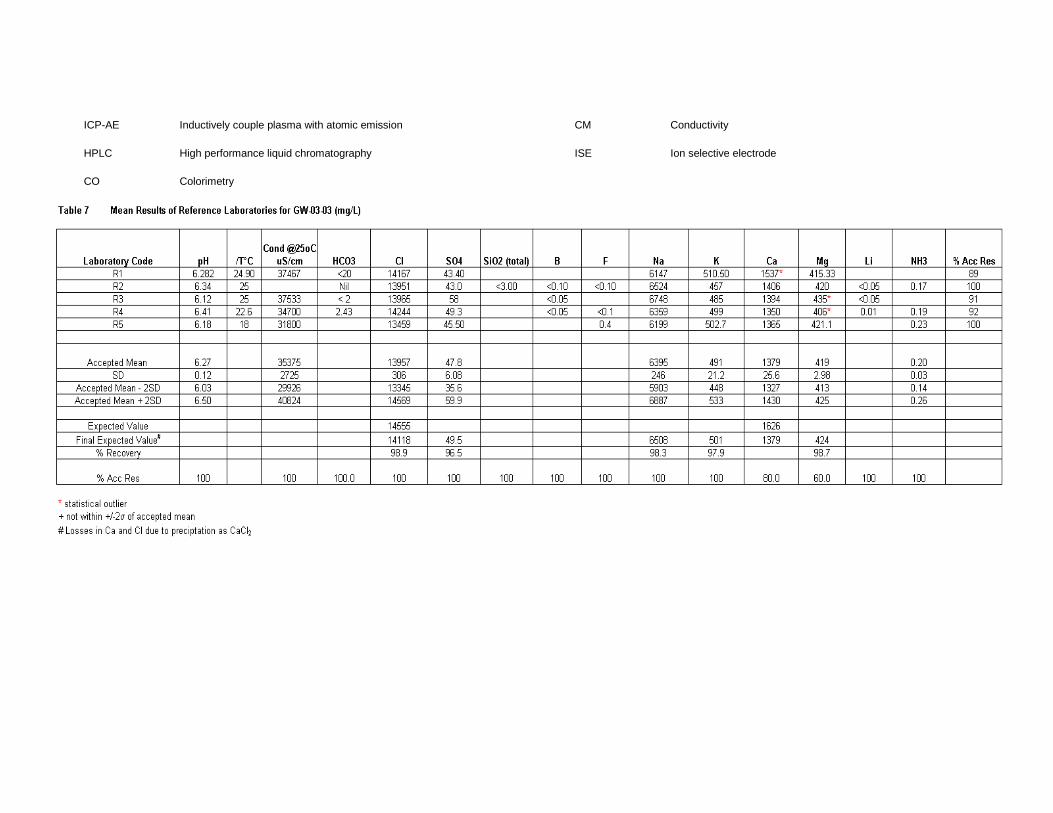
ICP-AE Inductively couple plasma with atomic emission CM Conductivity
HPLC High performance liquid chromatography ISE Ion selective electrode
CO Colorimetry
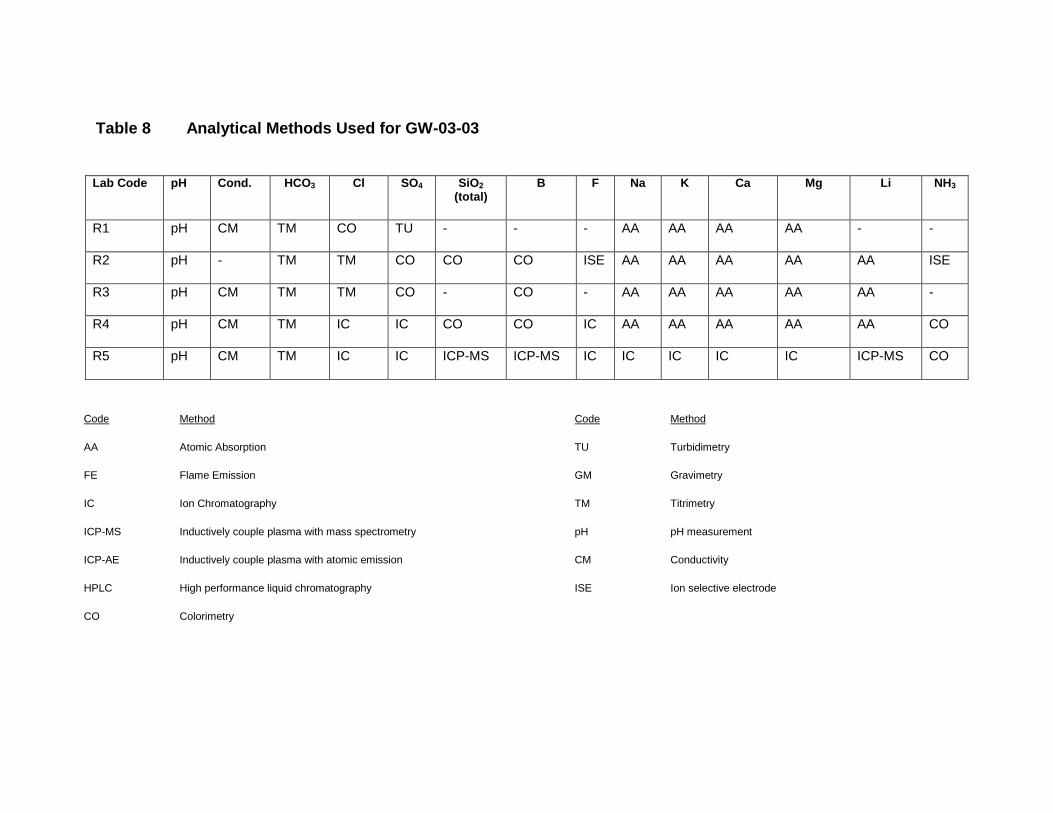
Table 8 Analytical Methods Used for GW-03-03
Lab Code pH Cond. HCO3 Cl SO4 SiO2 (total)
B F Na K Ca Mg Li NH3
R1 pH CM TM CO TU - - - AA AA AA AA - -
R2 pH - TM TM CO CO CO ISE AA AA AA AA AA ISE
R3 pH CM TM TM CO - CO - AA AA AA AA AA -
R4 pH CM TM IC IC CO CO IC AA AA AA AA AA CO
R5 pH CM TM IC IC ICP-MS ICP-MS IC IC IC IC IC ICP-MS CO
Code Method Code Method
AA Atomic Absorption TU Turbidimetry
FE Flame Emission GM Gravimetry
IC Ion Chromatography TM Titrimetry
ICP-MS Inductively couple plasma with mass spectrometry pH pH measurement
ICP-AE Inductively couple plasma with atomic emission CM Conductivity
HPLC High performance liquid chromatography ISE Ion selective electrode
CO Colorimetry
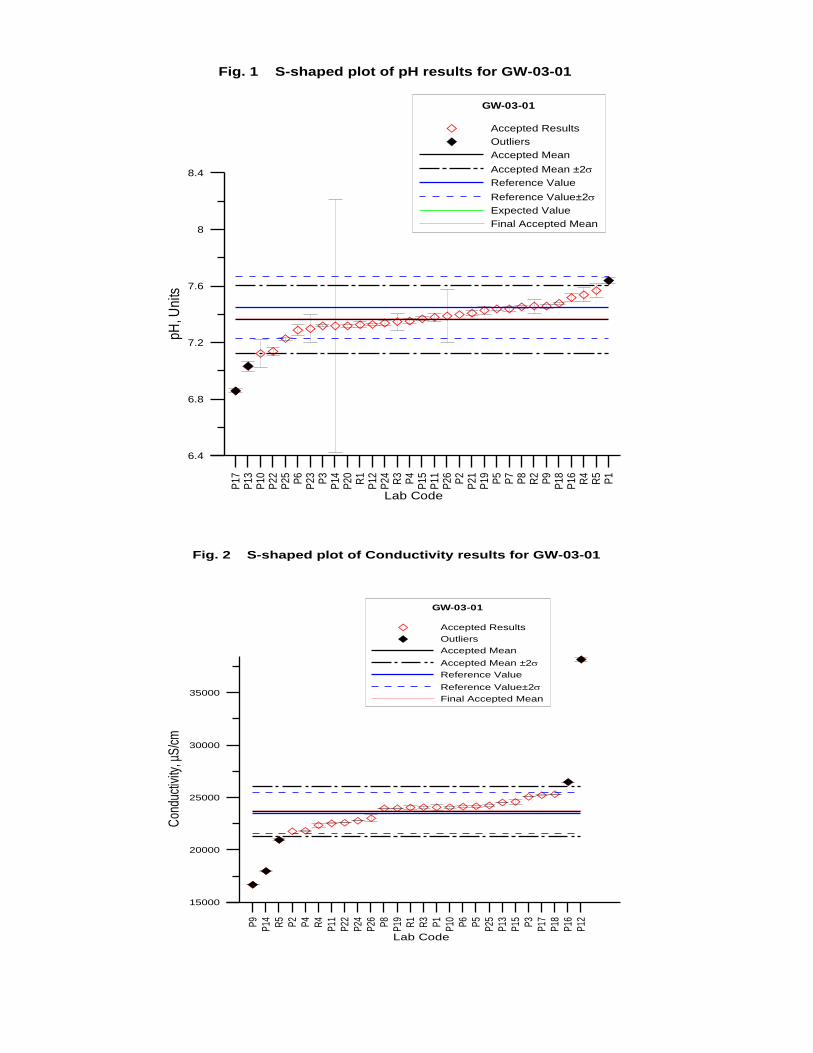
P9
P14 R
5
P2
P4
R4
P11
P22
P24
P26 P8
P19 R
1
R3
P1
P10 P6
P5
P25
P13
P15 P3
P17
P18
P16
P12
Lab Code
15000
20000
25000
30000
35000
Con
duct
ivity
, µS
/cm
GW-03-01
Accepted Results
Outliers
Accepted Mean
Accepted Mean ±2
Reference Value
Reference Value±2
Final Accepted Mean
Fig. 2 S-shaped plot of Conductivity results for GW-03-01
P17
P13
P10
P22
P25 P6
P23 P3
P14
P20 R
1P
12P
24 R3
P4
P15
P11
P26 P2
P21
P19 P5
P7
P8
R2
P9
P18
P16 R
4R
5P
1
Lab Code
6.4
6.8
7.2
7.6
8
8.4pH
, Uni
ts
GW-03-01
Accepted Results
Outliers
Accepted Mean
Accepted Mean ±2
Reference Value
Reference Value±2
Expected Value
Final Accepted Mean
Fig. 1 S-shaped plot of pH results for GW-03-01
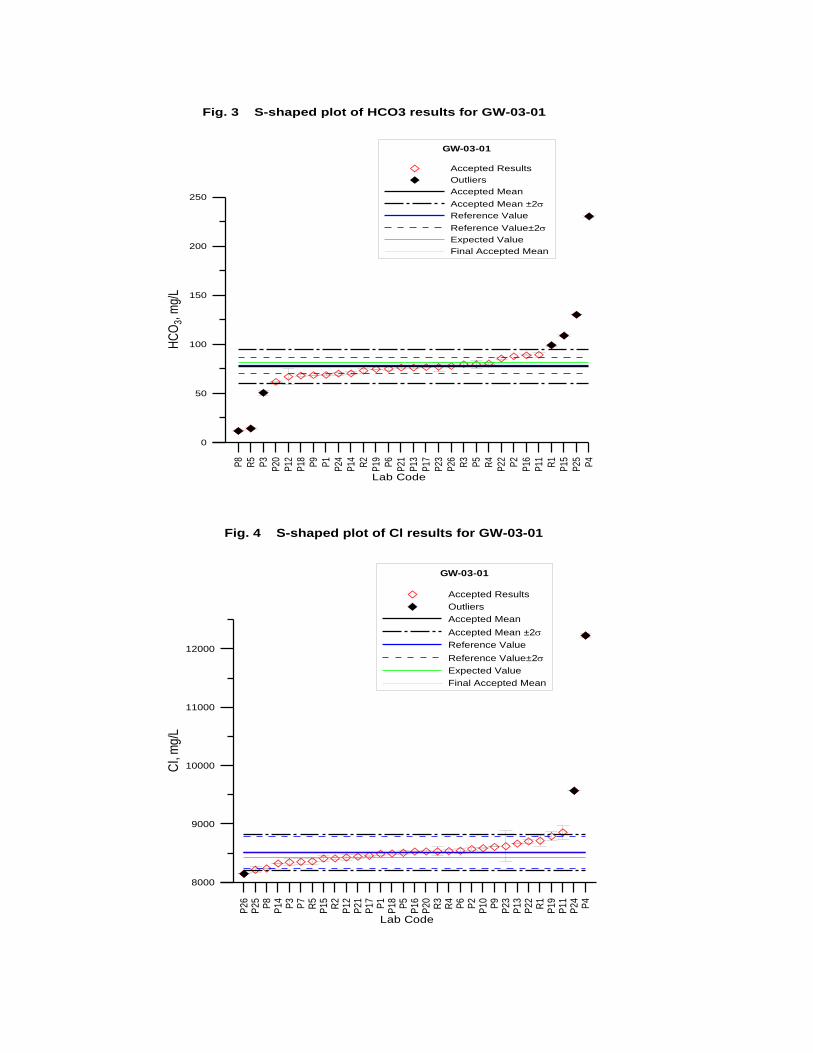
P8
R5
P3
P20
P12
P18 P9
P1
P24
P14 R
2
P19 P6
P21
P13
P17
P23
P26 R
3
P5
R4
P22 P2
P16
P11 R
1
P15
P25 P4
Lab Code
0
50
100
150
200
250
HC
O3,
mg/
L
GW-03-01
Accepted Results
Outliers
Accepted Mean
Accepted Mean ±2
Reference Value
Reference Value±2
Expected Value
Final Accepted Mean
Fig. 3 S-shaped plot of HCO3 results for GW-03-01
P2
6P
25
P8
P1
4P
3P
7R
5P
15
R2
P1
2P
21
P1
7P
1P
18
P5
P1
6P
20
R3
R4
P6
P2
P1
0P
9P
23
P1
3P
22
R1
P1
9P
11
P2
4P
4
Lab Code
8000
9000
10000
11000
12000
Cl,
mg
/L
GW-03-01
Accepted Results
Outliers
Accepted Mean
Accepted Mean ±2
Reference Value
Reference Value±2
Expected Value
Final Accepted Mean
Fig. 4 S-shaped plot of Cl results for GW-03-01
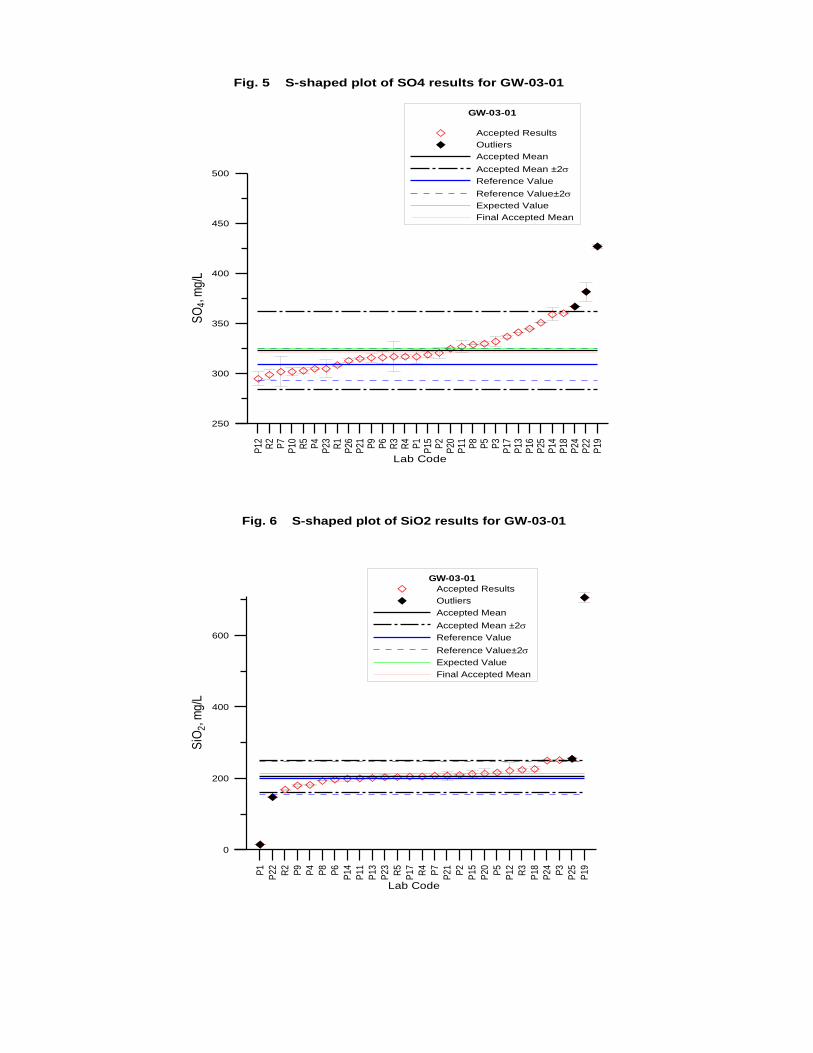
P12 R
2P
7P
10 R5
P4
P23 R
1P
26P
21 P9
P6
R3
R4
P1
P15 P2
P20
P11 P8
P5
P3
P17
P13
P16
P25
P14
P18
P24
P22
P19
Lab Code
250
300
350
400
450
500
SO
4, m
g/L
GW-03-01
Accepted Results
Outliers
Accepted Mean
Accepted Mean ±2
Reference Value
Reference Value±2
Expected Value
Final Accepted Mean
Fig. 5 S-shaped plot of SO4 results for GW-03-01
P1
P2
2
R2
P9
P4
P8
P6
P1
4
P1
1
P1
3
P2
3
R5
P1
7
R4
P7
P2
1
P2
P1
5
P2
0
P5
P1
2
R3
P1
8
P2
4
P3
P2
5
P1
9
Lab Code
0
200
400
600
SiO
2, m
g/L
GW-03-01
Accepted Results
Outliers
Accepted Mean
Accepted Mean ±2
Reference Value
Reference Value±2
Expected Value
Final Accepted Mean
Fig. 6 S-shaped plot of SiO2 results for GW-03-01
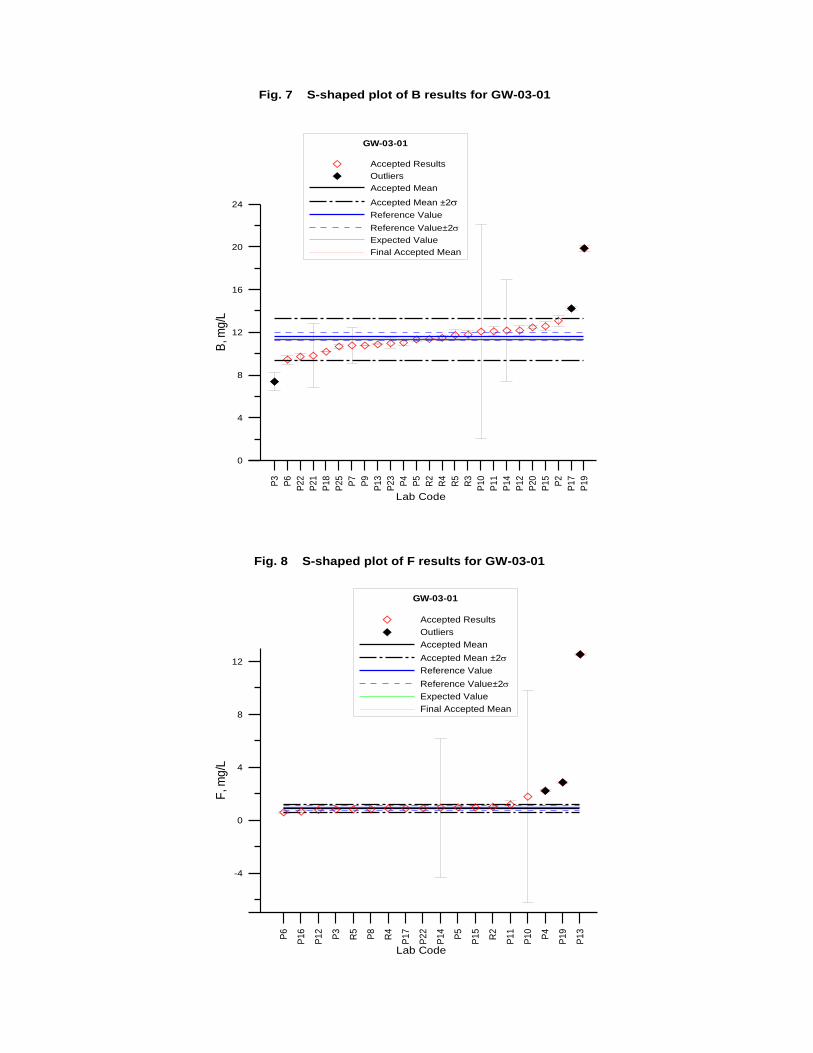
P3
P6
P2
2
P2
1
P1
8
P2
5
P7
P9
P1
3
P2
3
P4
P5
R2
R4
R5
R3
P1
0
P1
1
P1
4
P1
2
P2
0
P1
5
P2
P1
7
P1
9
Lab Code
0
4
8
12
16
20
24
B, m
g/L
GW-03-01
Accepted Results
Outliers
Accepted Mean
Accepted Mean ±2
Reference Value
Reference Value±2
Expected Value
Final Accepted Mean
Fig. 7 S-shaped plot of B results for GW-03-01
P6
P1
6
P1
2
P3
R5
P8
R4
P1
7
P2
2
P1
4
P5
P1
5
R2
P1
1
P1
0
P4
P1
9
P1
3
Lab Code
-4
0
4
8
12
F, m
g/L
GW-03-01
Accepted Results
Outliers
Accepted Mean
Accepted Mean ±2
Reference Value
Reference Value±2
Expected Value
Final Accepted Mean
Fig. 8 S-shaped plot of F results for GW-03-01
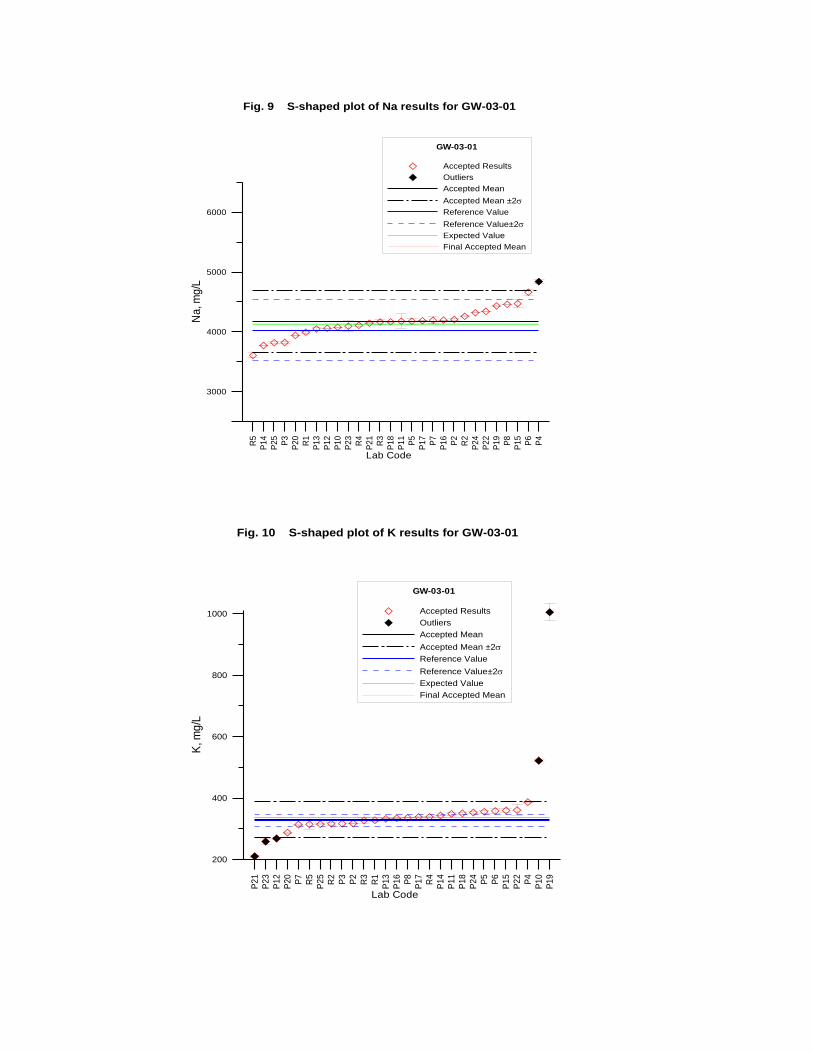
R5
P1
4
P2
5
P3
P2
0
R1
P1
3
P1
2
P1
0
P2
3
R4
P2
1
R3
P1
8
P1
1
P5
P1
7
P7
P1
6
P2
R2
P2
4
P2
2
P1
9
P8
P1
5
P6
P4
Lab Code
3000
4000
5000
6000
Na
, mg
/L
GW-03-01
Accepted Results
Outliers
Accepted Mean
Accepted Mean ±2
Reference Value
Reference Value±2
Expected Value
Final Accepted Mean
Fig. 9 S-shaped plot of Na results for GW-03-01
P2
1
P2
3
P1
2
P2
0
P7
R5
P2
5
R2
P3
P2
R3
R1
P1
3
P1
6
P8
P1
7
R4
P1
4
P1
1
P1
8
P2
4
P5
P6
P1
5
P2
2
P4
P1
0
P1
9
Lab Code
200
400
600
800
1000
K, m
g/L
GW-03-01
Accepted Results
Outliers
Accepted Mean
Accepted Mean ±2
Reference Value
Reference Value±2
Expected Value
Final Accepted Mean
Fig. 10 S-shaped plot of K results for GW-03-01
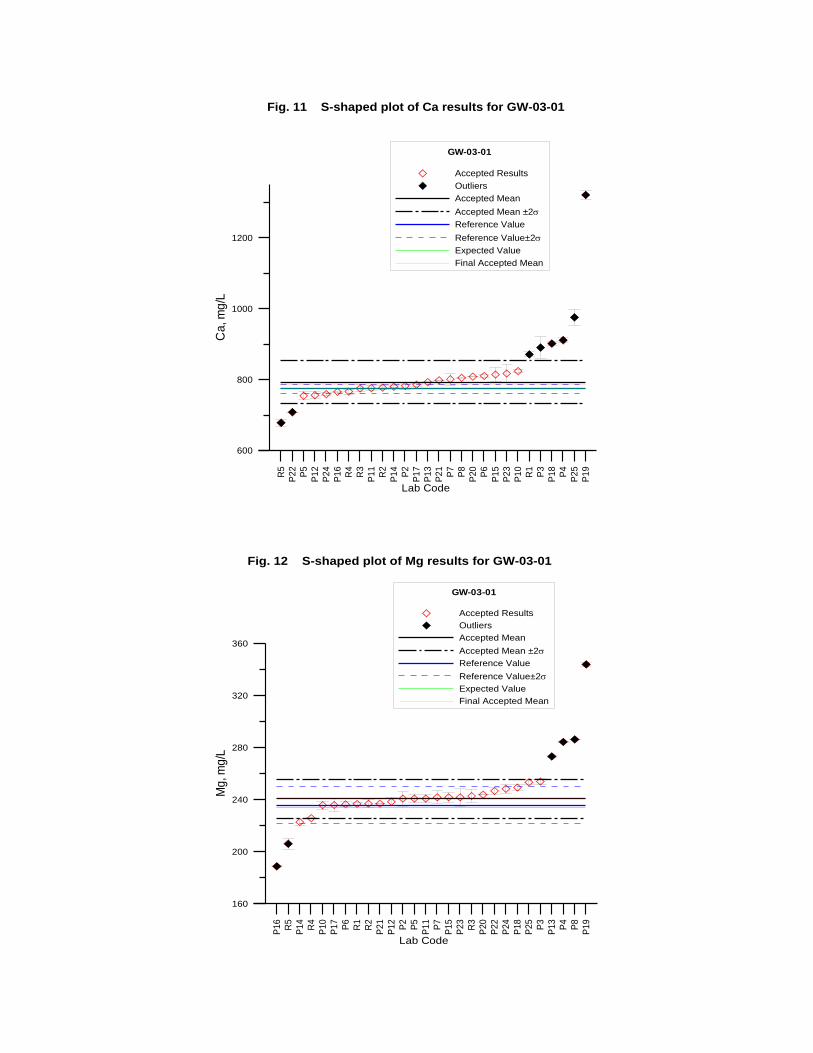
R5
P2
2
P5
P1
2
P2
4
P1
6
R4
R3
P1
1
R2
P1
4
P2
P1
7
P1
3
P2
1
P7
P8
P2
0
P6
P1
5
P2
3
P1
0
R1
P3
P1
8
P4
P2
5
P1
9
Lab Code
600
800
1000
1200
Ca
, m
g/L
GW-03-01
Accepted Results
Outliers
Accepted Mean
Accepted Mean ±2
Reference Value
Reference Value±2
Expected Value
Final Accepted Mean
Fig. 11 S-shaped plot of Ca results for GW-03-01
P1
6
R5
P1
4
R4
P1
0
P1
7
P6
R1
R2
P2
1
P1
2
P2
P5
P1
1
P7
P1
5
P2
3
R3
P2
0
P2
2
P2
4
P1
8
P2
5
P3
P1
3
P4
P8
P1
9
Lab Code
160
200
240
280
320
360
Mg
, mg
/L
GW-03-01
Accepted Results
Outliers
Accepted Mean
Accepted Mean ±2
Reference Value
Reference Value±2
Expected Value
Final Accepted Mean
Fig. 12 S-shaped plot of Mg results for GW-03-01
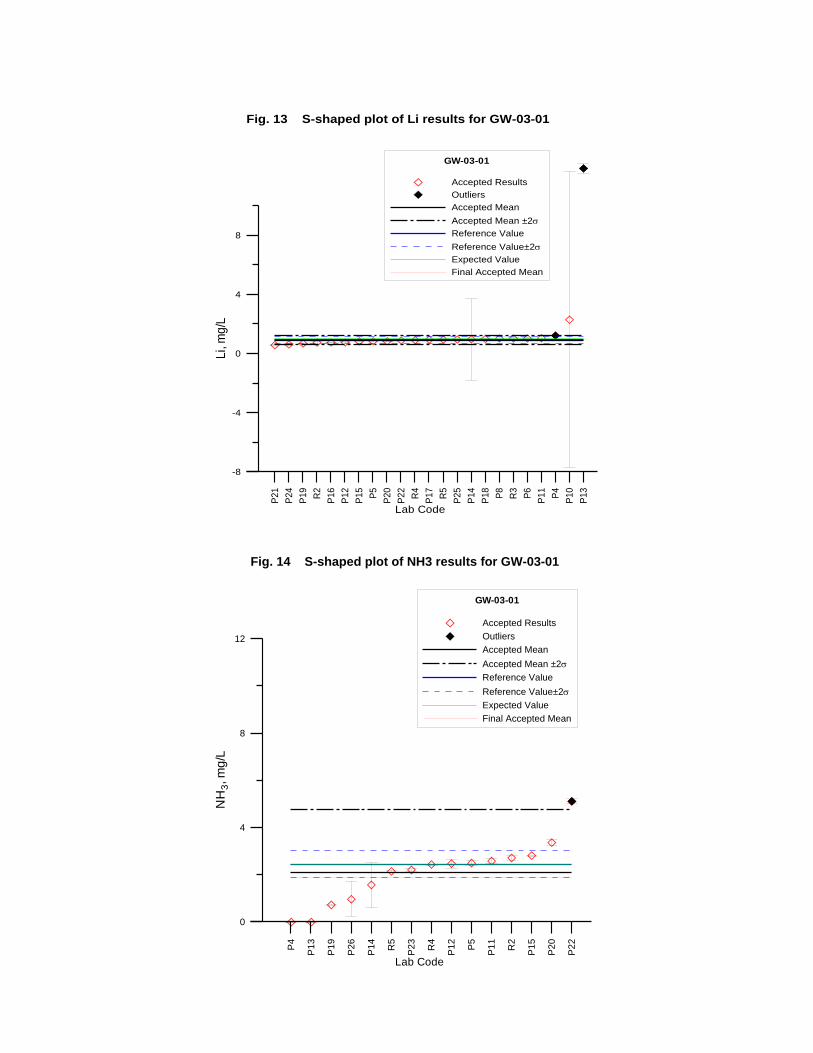
P2
1
P2
4
P1
9
R2
P1
6
P1
2
P1
5
P5
P2
0
P2
2
R4
P1
7
R5
P2
5
P1
4
P1
8
P8
R3
P6
P1
1
P4
P1
0
P1
3
Lab Code
-8
-4
0
4
8
Li,
mg
/L
GW-03-01
Accepted Results
Outliers
Accepted Mean
Accepted Mean ±2
Reference Value
Reference Value±2
Expected Value
Final Accepted Mean
Fig. 13 S-shaped plot of Li results for GW-03-01
P4
P1
3
P1
9
P2
6
P1
4
R5
P2
3
R4
P1
2
P5
P1
1
R2
P1
5
P2
0
P2
2
Lab Code
0
4
8
12
NH
3, m
g/L
GW-03-01
Accepted Results
Outliers
Accepted Mean
Accepted Mean ±2
Reference Value
Reference Value±2
Expected Value
Final Accepted Mean
Fig. 14 S-shaped plot of NH3 results for GW-03-01
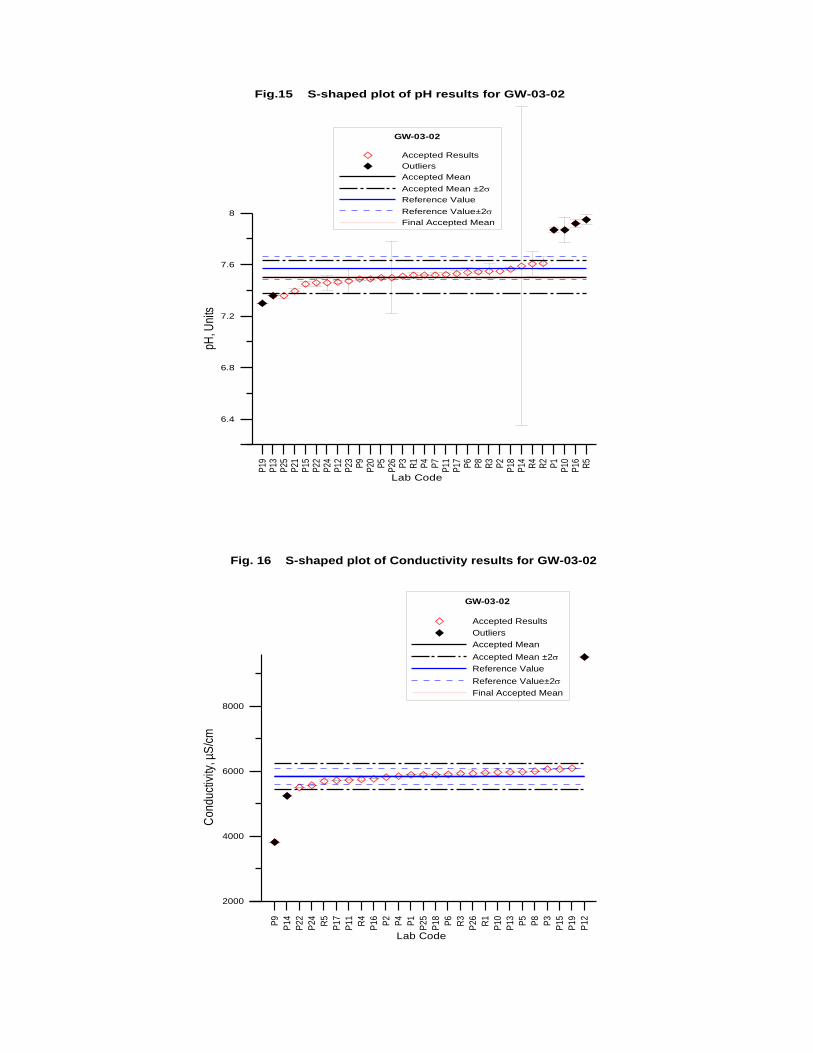
P19
P13
P25
P21
P15
P22
P24
P12
P23 P9
P20 P5
P26 P3
R1
P4
P7
P11
P17 P6
P8
R3
P2
P18
P14 R
4R
2P
1P
10P
16 R5
Lab Code
6.4
6.8
7.2
7.6
8pH
, Uni
ts
GW-03-02
Accepted Results
Outliers
Accepted Mean
Accepted Mean ±2
Reference Value
Reference Value±2
Final Accepted Mean
Fig.15 S-shaped plot of pH results for GW-03-02
P9
P1
4
P2
2
P2
4
R5
P1
7
P1
1
R4
P1
6
P2
P4
P1
P2
5
P1
8
P6
R3
P2
6
R1
P1
0
P1
3
P5
P8
P3
P1
5
P1
9
P1
2
Lab Code
2000
4000
6000
8000
Co
nd
uct
ivity
, µS
/cm
GW-03-02
Accepted Results
Outliers
Accepted Mean
Accepted Mean ±2
Reference Value
Reference Value±2
Final Accepted Mean
Fig. 16 S-shaped plot of Conductivity results for GW-03-02
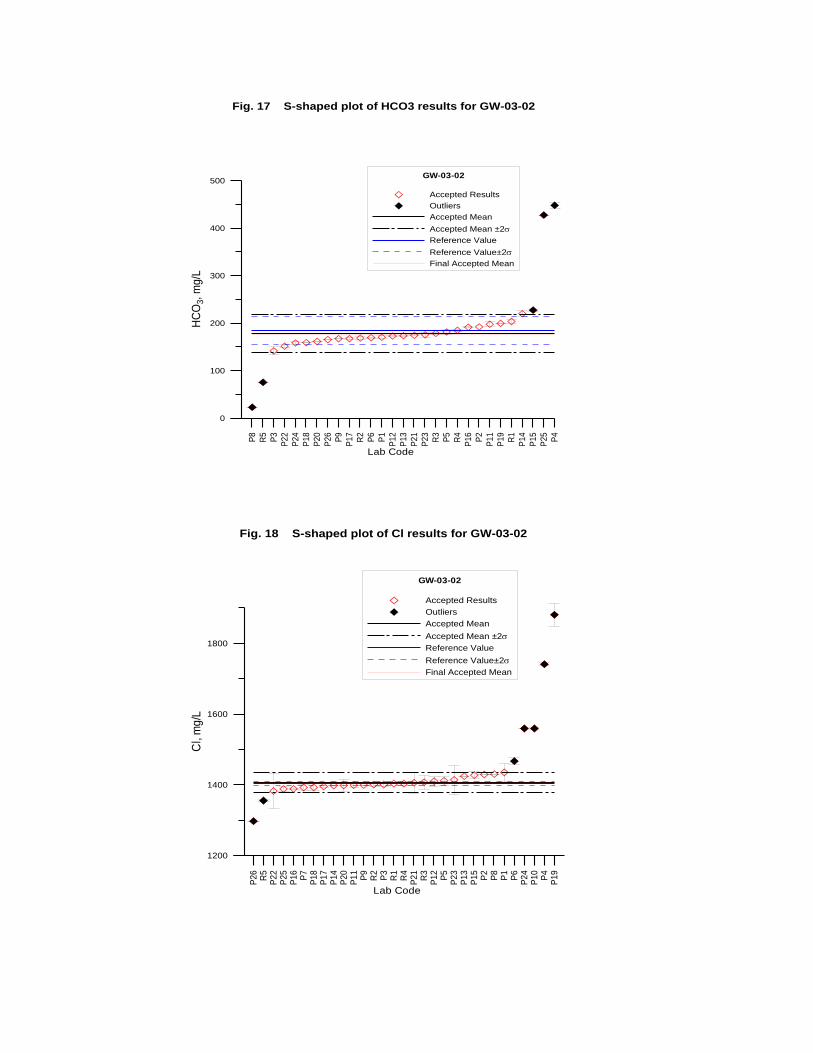
P8
R5
P3
P2
2
P2
4
P1
8
P2
0
P2
6
P9
P1
7
R2
P6
P1
P1
2
P1
3
P2
1
P2
3
R3
P5
R4
P1
6
P2
P1
1
P1
9
R1
P1
4
P1
5
P2
5
P4
Lab Code
0
100
200
300
400
500
HC
O3, m
g/L
GW-03-02
Accepted Results
Outliers
Accepted Mean
Accepted Mean ±2
Reference Value
Reference Value±2
Final Accepted Mean
Fig. 17 S-shaped plot of HCO3 results for GW-03-02
P2
6R
5P
22
P2
5P
16
P7
P1
8P
17
P1
4P
20
P1
1P
9R
2P
3R
1R
4P
21
R3
P1
2P
5P
23
P1
3P
15
P2
P8
P1
P6
P2
4P
10
P4
P1
9
Lab Code
1200
1400
1600
1800
Cl,
mg
/L
GW-03-02
Accepted Results
Outliers
Accepted Mean
Accepted Mean ±2
Reference Value
Reference Value±2
Final Accepted Mean
Fig. 18 S-shaped plot of Cl results for GW-03-02
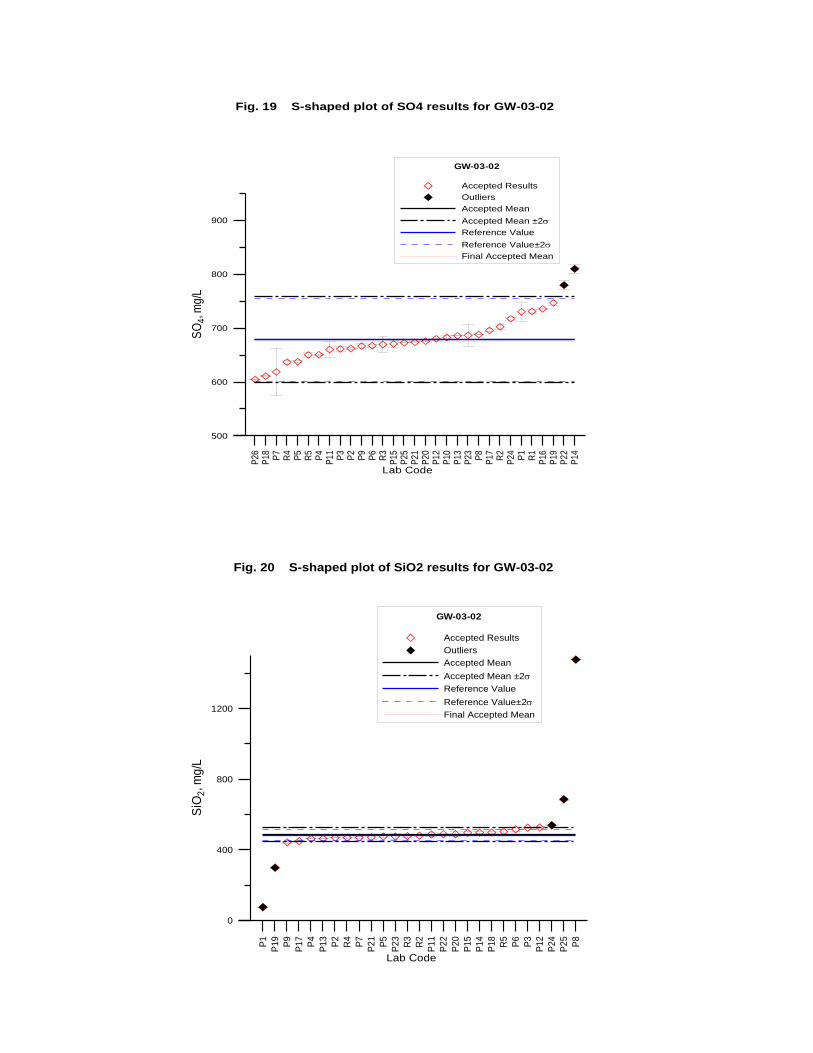
P26
P18 P7
R4
P5
R5
P4
P11 P3
P2
P9
P6
R3
P15
P25
P21
P20
P12
P10
P13
P23 P8
P17 R
2P
24 P1
R1
P16
P19
P22
P14
Lab Code
500
600
700
800
900
SO
4, m
g/L
GW-03-02
Accepted Results
Outliers
Accepted Mean
Accepted Mean ±2
Reference Value
Reference Value±2
Final Accepted Mean
Fig. 19 S-shaped plot of SO4 results for GW-03-02
P1
P1
9
P9
P1
7
P4
P1
3
P2
R4
P7
P2
1
P5
P2
3
R3
R2
P1
1
P2
2
P2
0
P1
5
P1
4
P1
8
R5
P6
P3
P1
2
P2
4
P2
5
P8
Lab Code
0
400
800
1200
SiO
2, m
g/L
GW-03-02
Accepted Results
Outliers
Accepted Mean
Accepted Mean ±2
Reference Value
Reference Value±2
Final Accepted Mean
Fig. 20 S-shaped plot of SiO2 results for GW-03-02
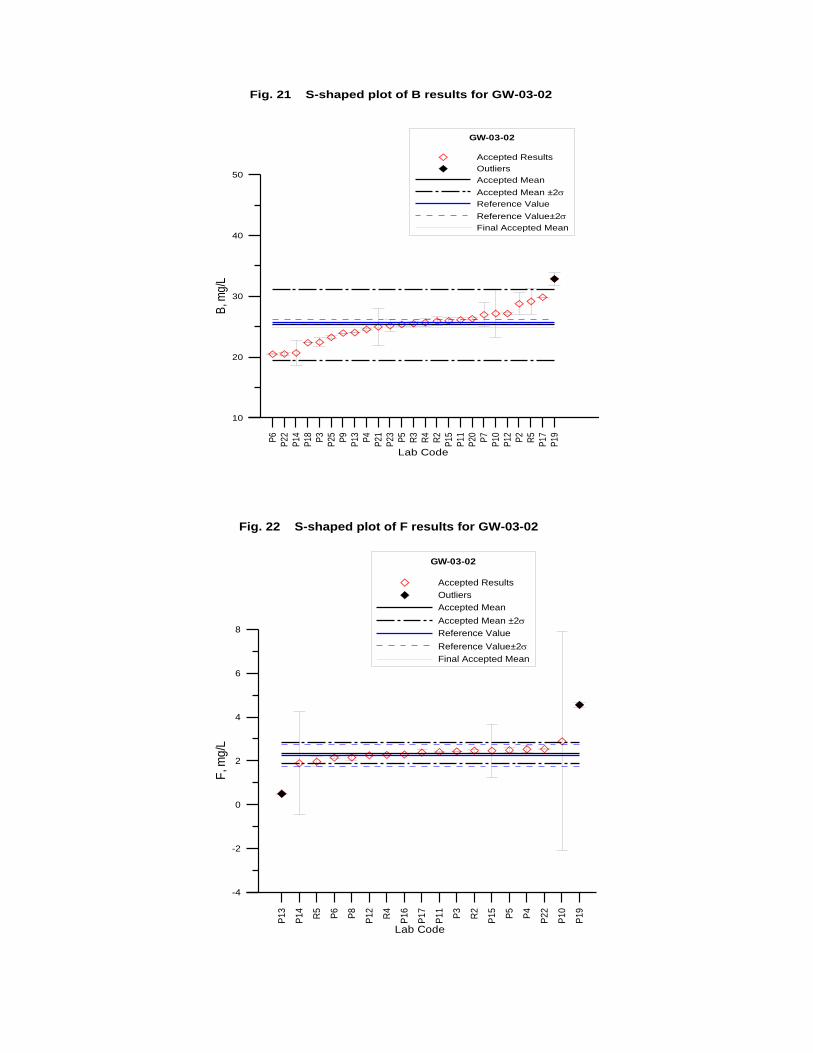
P6
P22
P14
P18 P3
P25 P9
P13 P4
P21
P23 P5
R3
R4
R2
P15
P11
P20 P7
P10
P12 P2
R5
P17
P19
Lab Code
10
20
30
40
50
B, m
g/L
GW-03-02
Accepted Results
Outliers
Accepted Mean
Accepted Mean ±2
Reference Value
Reference Value±2
Final Accepted Mean
Fig. 21 S-shaped plot of B results for GW-03-02
P1
3
P1
4
R5
P6
P8
P1
2
R4
P1
6
P1
7
P1
1
P3
R2
P1
5
P5
P4
P2
2
P1
0
P1
9
Lab Code
-4
-2
0
2
4
6
8
F, m
g/L
GW-03-02
Accepted Results
Outliers
Accepted Mean
Accepted Mean ±2
Reference Value
Reference Value±2
Final Accepted Mean
Fig. 22 S-shaped plot of F results for GW-03-02
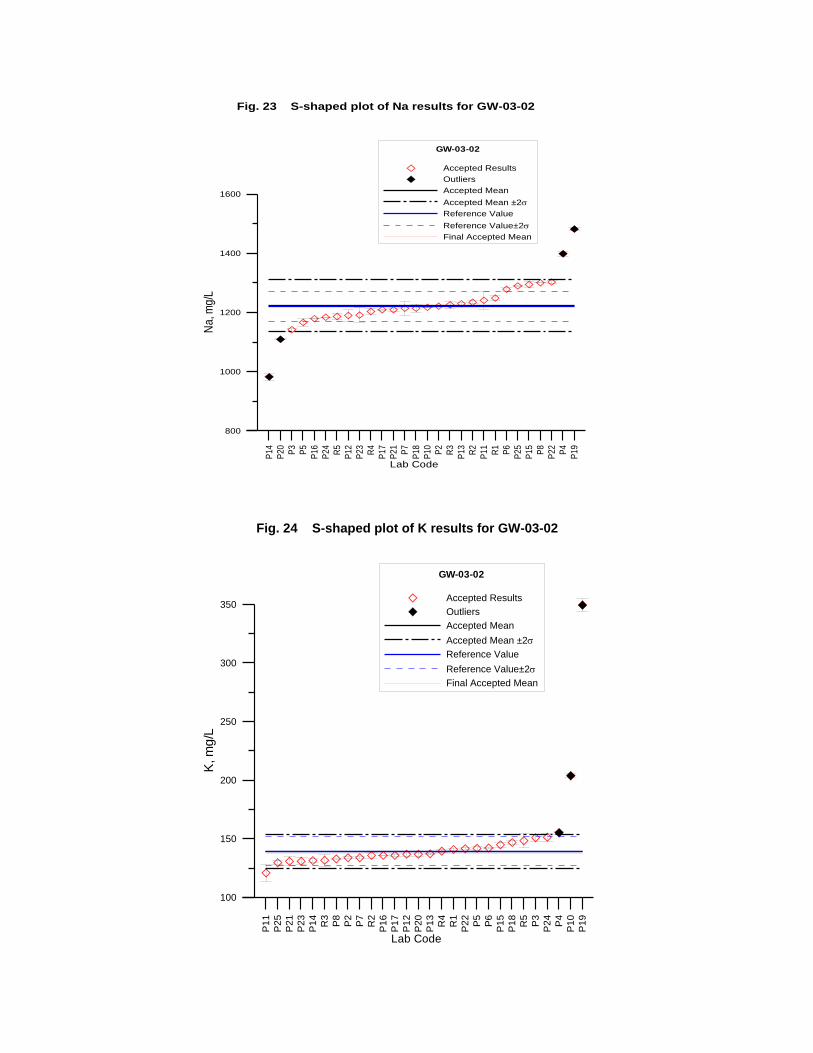
P1
4
P2
0
P3
P5
P1
6
P2
4
R5
P1
2
P2
3
R4
P1
7
P2
1
P7
P1
8
P1
0
P2
R3
P1
3
R2
P1
1
R1
P6
P2
5
P1
5
P8
P2
2
P4
P1
9
Lab Code
800
1000
1200
1400
1600
Na
, mg
/L
GW-03-02
Accepted Results
Outliers
Accepted Mean
Accepted Mean ±2
Reference Value
Reference Value±2
Final Accepted Mean
Fig. 23 S-shaped plot of Na results for GW-03-02
P1
1
P2
5
P2
1
P2
3
P1
4
R3
P8
P2
P7
R2
P1
6
P1
7
P1
2
P2
0
P1
3
R4
R1
P2
2
P5
P6
P1
5
P1
8
R5
P3
P2
4
P4
P1
0
P1
9
Lab Code
100
150
200
250
300
350
K, m
g/L
GW-03-02
Accepted Results
Outliers
Accepted Mean
Accepted Mean ±2
Reference Value
Reference Value±2
Final Accepted Mean
Fig. 24 S-shaped plot of K results for GW-03-02
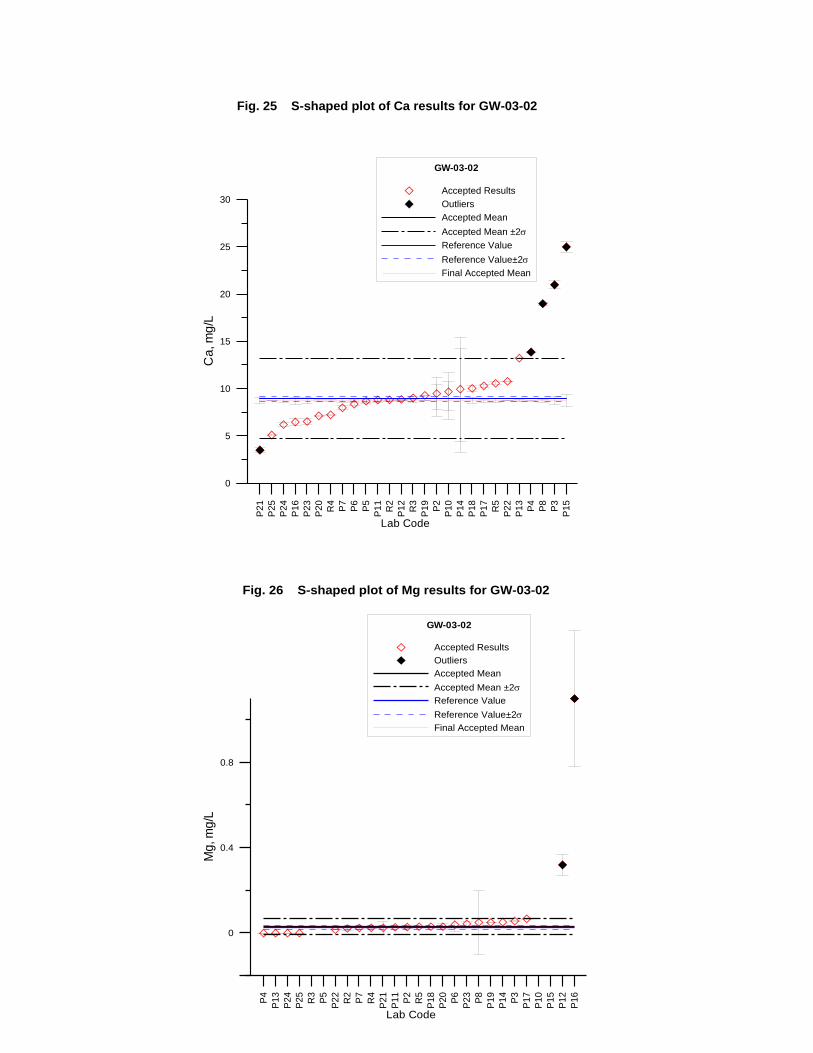
P2
1
P2
5
P2
4
P1
6
P2
3
P2
0
R4
P7
P6
P5
P1
1
R2
P1
2
R3
P1
9
P2
P1
0
P1
4
P1
8
P1
7
R5
P2
2
P1
3
P4
P8
P3
P1
5
Lab Code
0
5
10
15
20
25
30C
a, m
g/L
GW-03-02
Accepted Results
Outliers
Accepted Mean
Accepted Mean ±2
Reference Value
Reference Value±2
Final Accepted Mean
Fig. 25 S-shaped plot of Ca results for GW-03-02
P4
P1
3
P2
4
P2
5
R3
P5
P2
2
R2
P7
R4
P2
1
P1
1
P2
R5
P1
8
P2
0
P6
P2
3
P8
P1
9
P1
4
P3
P1
7
P1
0
P1
5
P1
2
P1
6
Lab Code
0
0.4
0.8
Mg
, m
g/L
GW-03-02
Accepted Results
Outliers
Accepted Mean
Accepted Mean ±2
Reference Value
Reference Value±2
Final Accepted Mean
Fig. 26 S-shaped plot of Mg results for GW-03-02
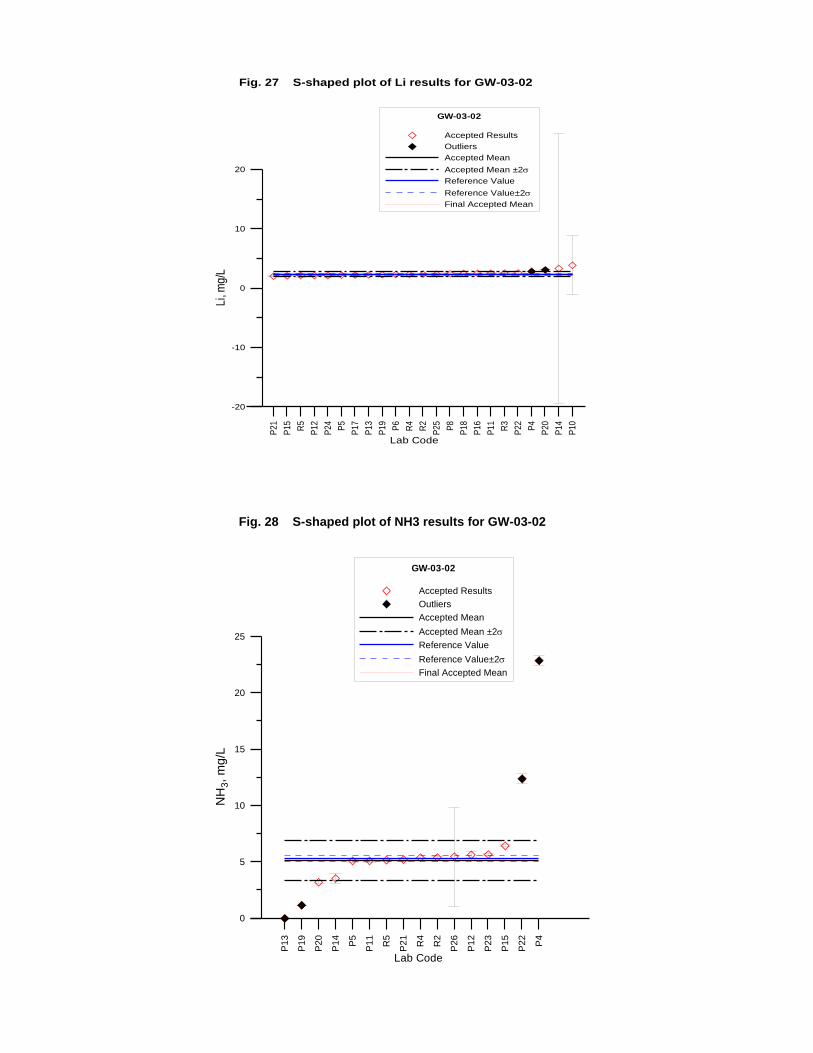
P1
3
P1
9
P2
0
P1
4
P5
P1
1
R5
P2
1
R4
R2
P2
6
P1
2
P2
3
P1
5
P2
2
P4
Lab Code
0
5
10
15
20
25
NH
3, m
g/L
GW-03-02
Accepted Results
Outliers
Accepted Mean
Accepted Mean ±2
Reference Value
Reference Value±2
Final Accepted Mean
Fig. 28 S-shaped plot of NH3 results for GW-03-02
P2
1
P1
5
R5
P1
2
P2
4
P5
P1
7
P1
3
P1
9
P6
R4
R2
P2
5
P8
P1
8
P1
6
P1
1
R3
P2
2
P4
P2
0
P1
4
P1
0
Lab Code
-20
-10
0
10
20
Li,
mg
/L
GW-03-02
Accepted Results
Outliers
Accepted Mean
Accepted Mean ±2
Reference Value
Reference Value±2
Final Accepted Mean
Fig. 27 S-shaped plot of Li results for GW-03-02
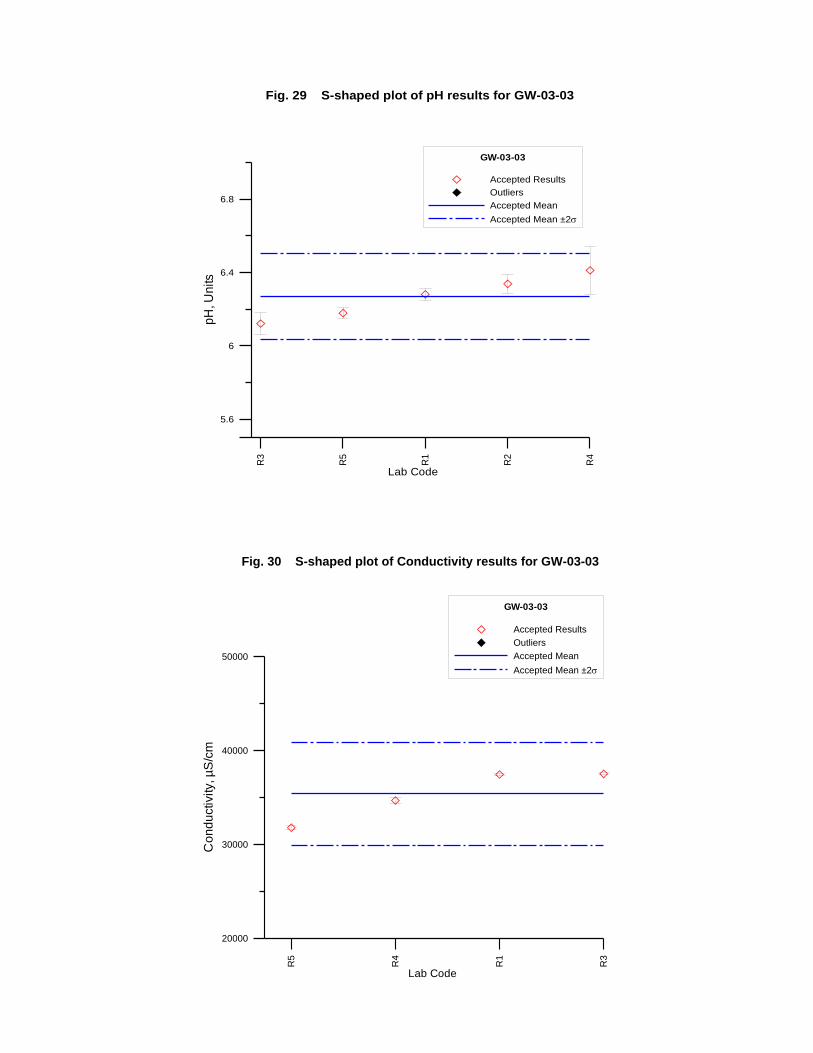
R5
R4
R1
R3
Lab Code
20000
30000
40000
50000
Co
nd
uctivity, µ
S/c
m
GW-03-03
Accepted Results
Outliers
Accepted Mean
Accepted Mean ±2
Fig. 30 S-shaped plot of Conductivity results for GW-03-03
R3
R5
R1
R2
R4
Lab Code
5.6
6
6.4
6.8p
H, U
nits
GW-03-03
Accepted Results
Outliers
Accepted Mean
Accepted Mean ±2
Fig. 29 S-shaped plot of pH results for GW-03-03
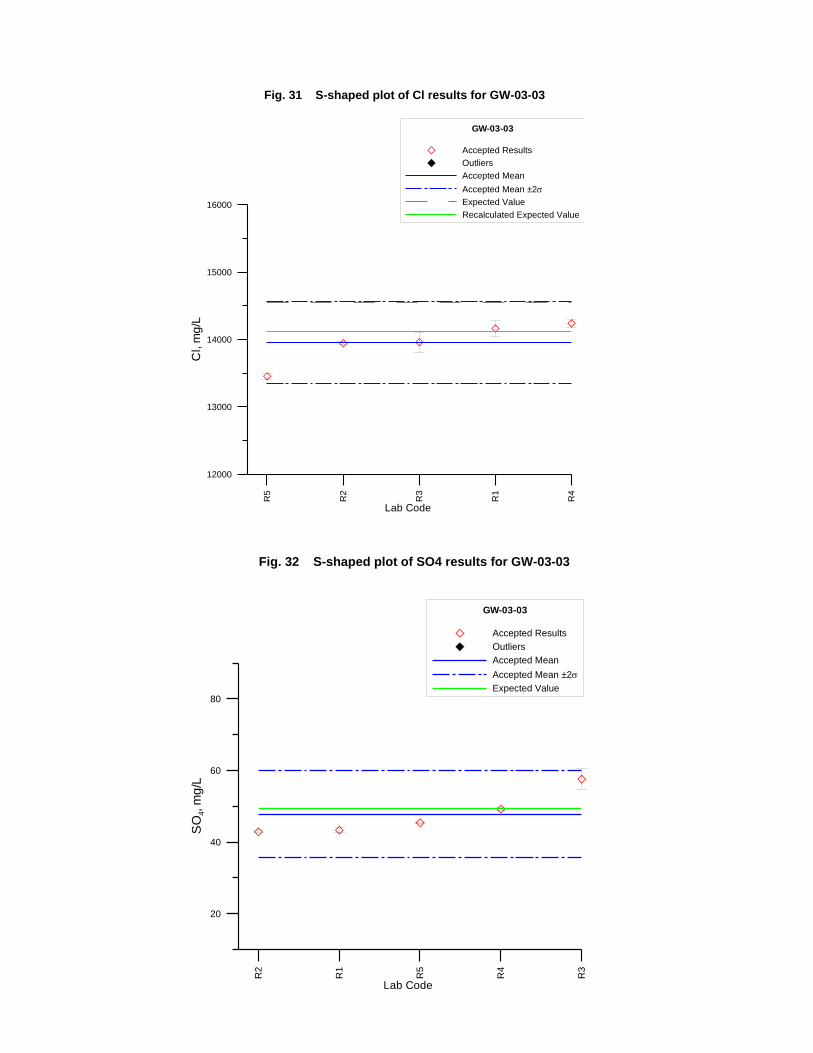
R5
R2
R3
R1
R4
Lab Code
12000
13000
14000
15000
16000C
l, m
g/L
GW-03-03
Accepted Results
Outliers
Accepted Mean
Accepted Mean ±2
Expected Value
Recalculated Expected Value
Fig. 31 S-shaped plot of Cl results for GW-03-03
R2
R1
R5
R4
R3
Lab Code
20
40
60
80
SO
4, m
g/L
GW-03-03
Accepted Results
Outliers
Accepted Mean
Accepted Mean ±2
Expected Value
Fig. 32 S-shaped plot of SO4 results for GW-03-03
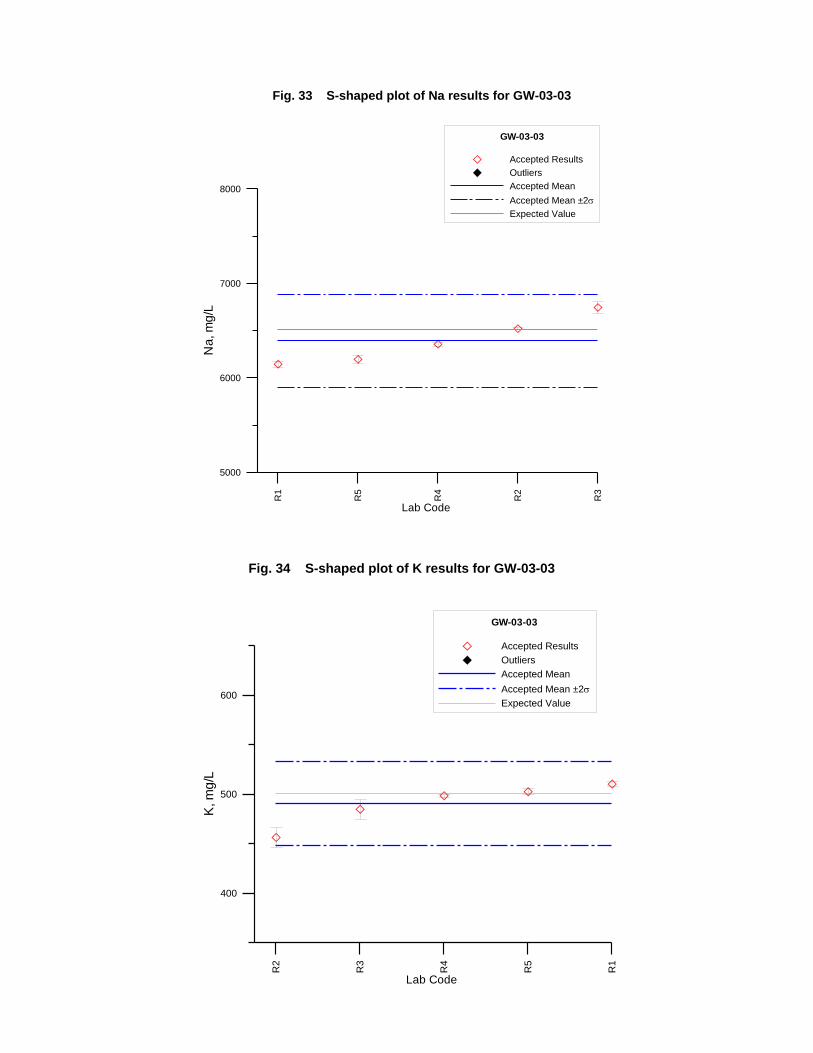
R1
R5
R4
R2
R3
Lab Code
5000
6000
7000
8000
Na
, m
g/L
GW-03-03
Accepted Results
Outliers
Accepted Mean
Accepted Mean ±2
Expected Value
Fig. 33 S-shaped plot of Na results for GW-03-03
R2
R3
R4
R5
R1
Lab Code
400
500
600
K, m
g/L
GW-03-03
Accepted Results
Outliers
Accepted Mean
Accepted Mean ±2
Expected Value
Fig. 34 S-shaped plot of K results for GW-03-03
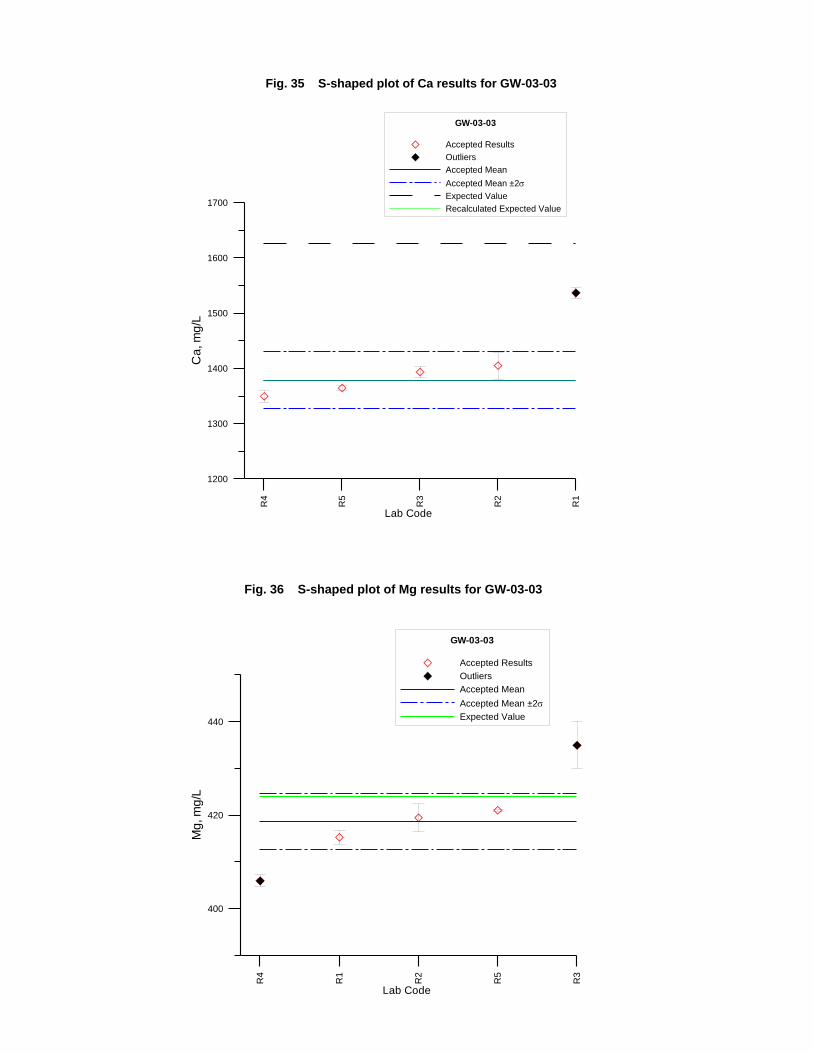
R4
R5
R3
R2
R1
Lab Code
1200
1300
1400
1500
1600
1700C
a, m
g/L
GW-03-03
Accepted Results
Outliers
Accepted Mean
Accepted Mean ±2
Expected Value
Recalculated Expected Value
Fig. 35 S-shaped plot of Ca results for GW-03-03
R4
R1
R2
R5
R3
Lab Code
400
420
440
Mg
, m
g/L
GW-03-03
Accepted Results
Outliers
Accepted Mean
Accepted Mean ±2
Expected Value
Fig. 36 S-shaped plot of Mg results for GW-03-03
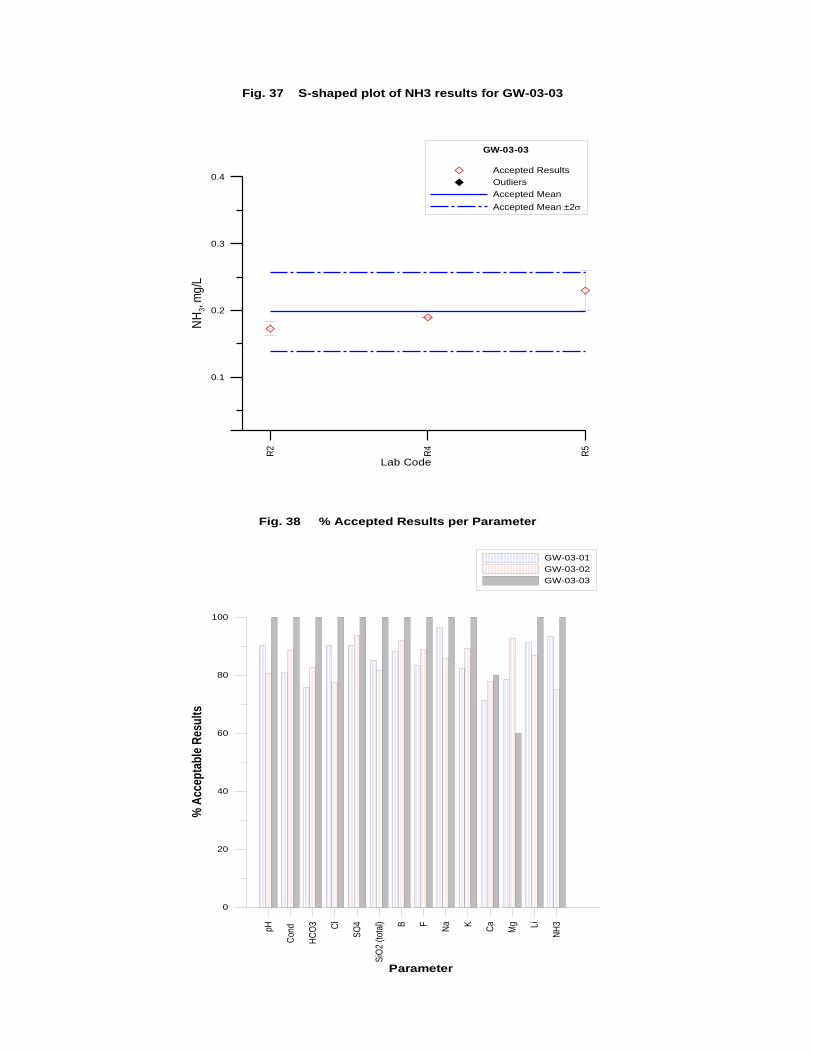
R2
R4
R5
Lab Code
0.1
0.2
0.3
0.4
NH
3, m
g/L
GW-03-03
Accepted Results
Outliers
Accepted Mean
Accepted Mean ±2
Fig. 37 S-shaped plot of NH3 results for GW-03-03
pH
Con
d
HC
O3 Cl
SO
4
SiO
2 (t
otal
) B F
Na K
Ca
Mg Li
NH
3
Parameter
0
20
40
60
80
100
% A
ccep
tab
le R
esu
lts
GW-03-01
GW-03-02
GW-03-03
Fig. 38 % Accepted Results per Parameter
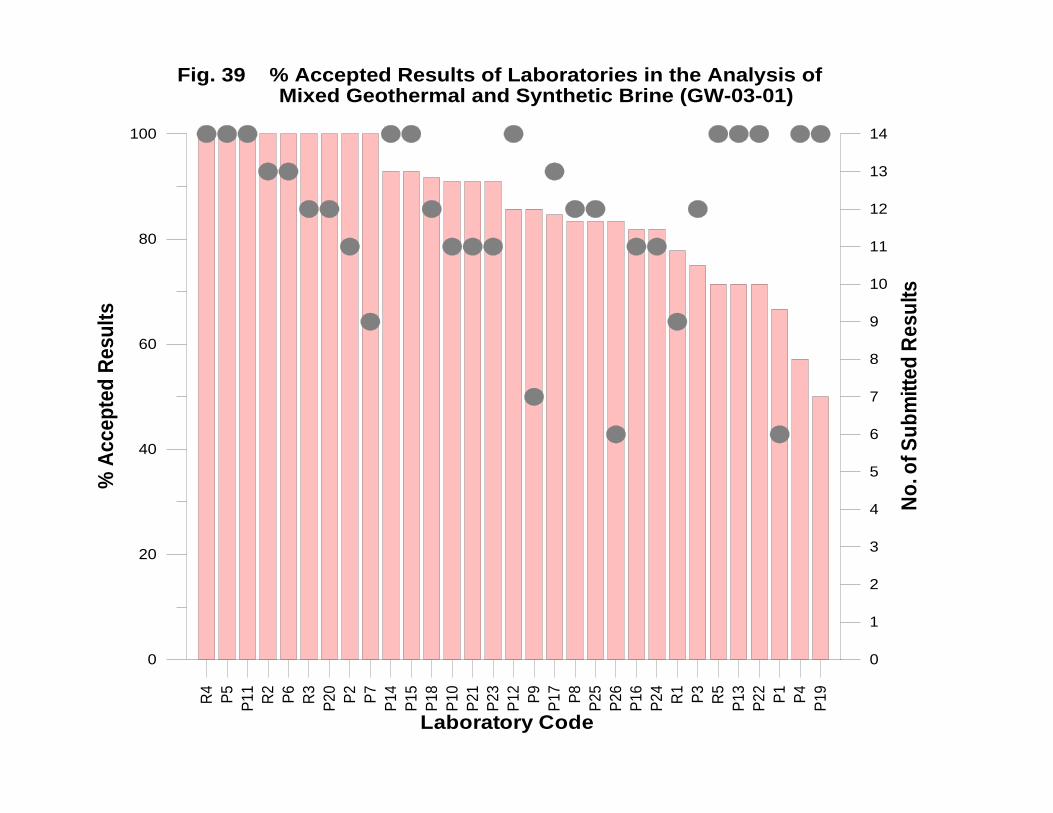
R4
P5
P1
1
R2
P6
R3
P2
0
P2
P7
P1
4
P1
5
P1
8
P1
0
P2
1
P2
3
P1
2
P9
P1
7
P8
P2
5
P2
6
P1
6
P2
4
R1
P3
R5
P1
3
P2
2
P1
P4
P1
9
Laboratory Code
0
20
40
60
80
100
% A
cce
pte
d R
esu
lts
0
1
2
3
4
5
6
7
8
9
10
11
12
13
14
No
. of
Su
bm
itte
d R
es
ult
s
Fig. 39 % Accepted Results of Laboratories in the Analysis of Mixed Geothermal and Synthetic Brine (GW-03-01)
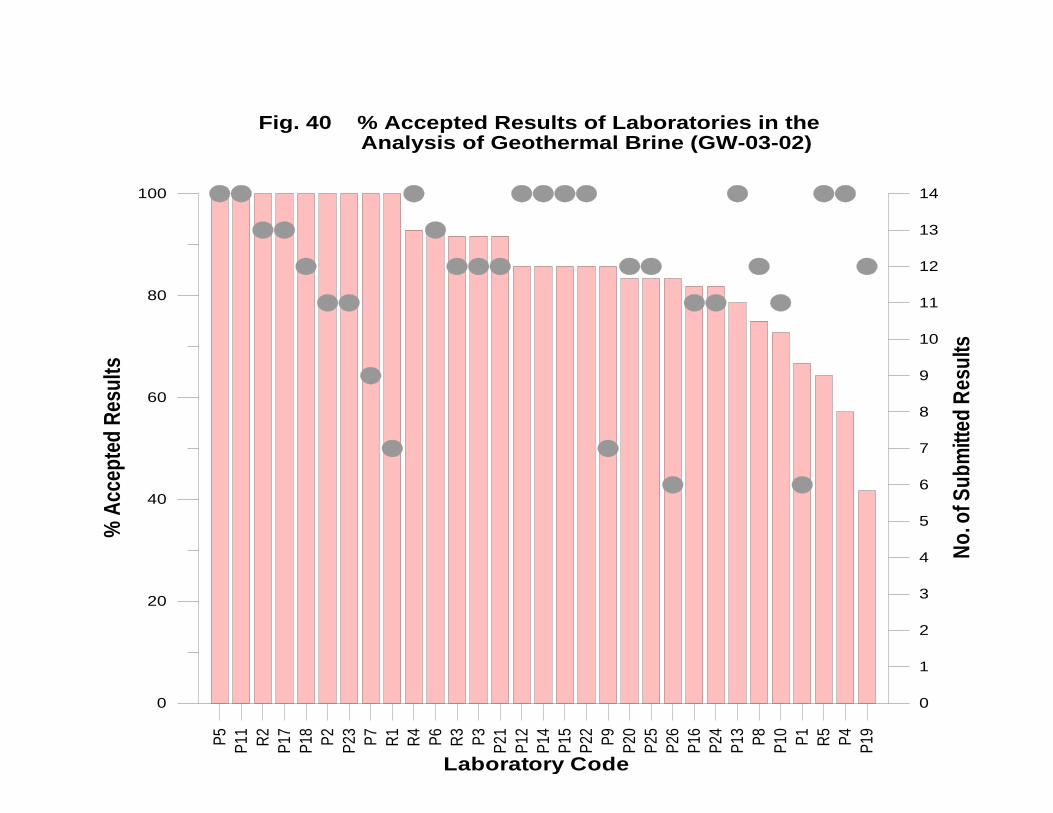
P5
P11 R
2
P17
P18 P2
P23 P7
R1
R4
P6
R3
P3
P21
P12
P14
P15
P22 P9
P20
P25
P26
P16
P24
P13 P8
P10 P1
R5
P4
P19
Laboratory Code
0
20
40
60
80
100
% A
ccep
ted
Res
ult
s
0
1
2
3
4
5
6
7
8
9
10
11
12
13
14
No
. of S
ub
mitt
ed R
esu
lts
Fig. 40 % Accepted Results of Laboratories in the Analysis of Geothermal Brine (GW-03-02)
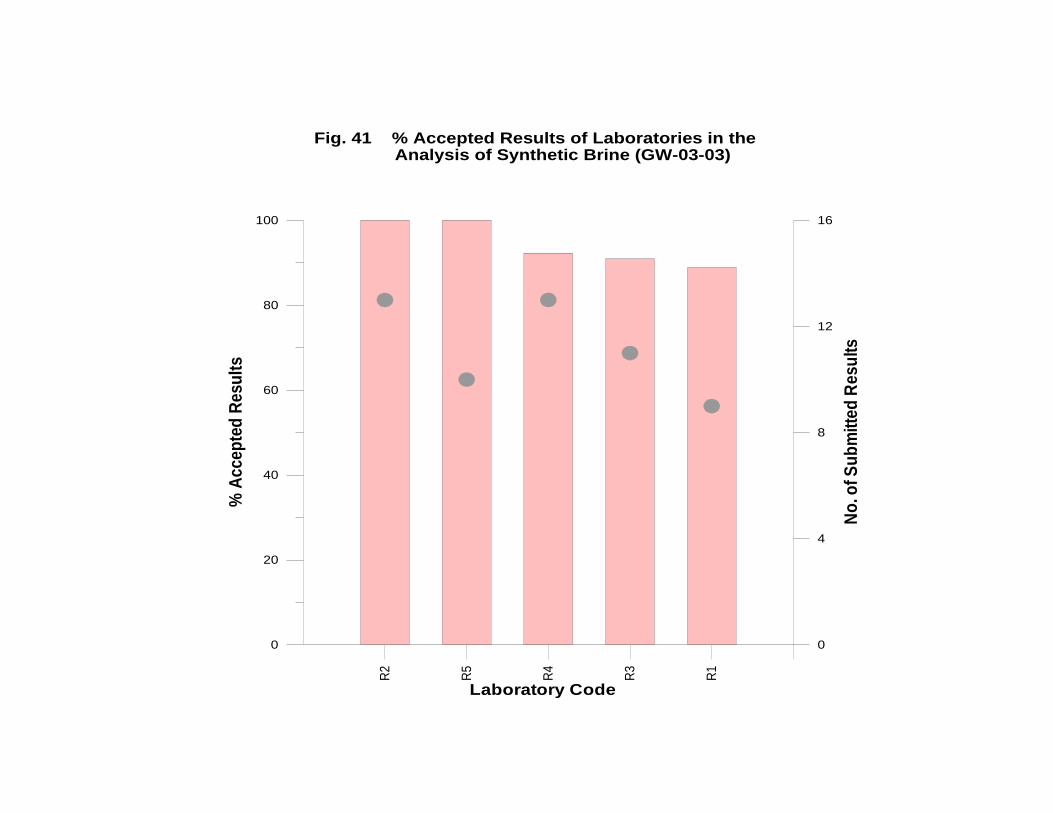
R2
R5
R4
R3
R1
Laboratory Code
0
20
40
60
80
100
% A
cce
pte
d R
esu
lts
0
4
8
12
16
No
. of
Su
bm
itte
d R
es
ult
s
Fig. 41 % Accepted Results of Laboratories in the Analysis of Synthetic Brine (GW-03-03)
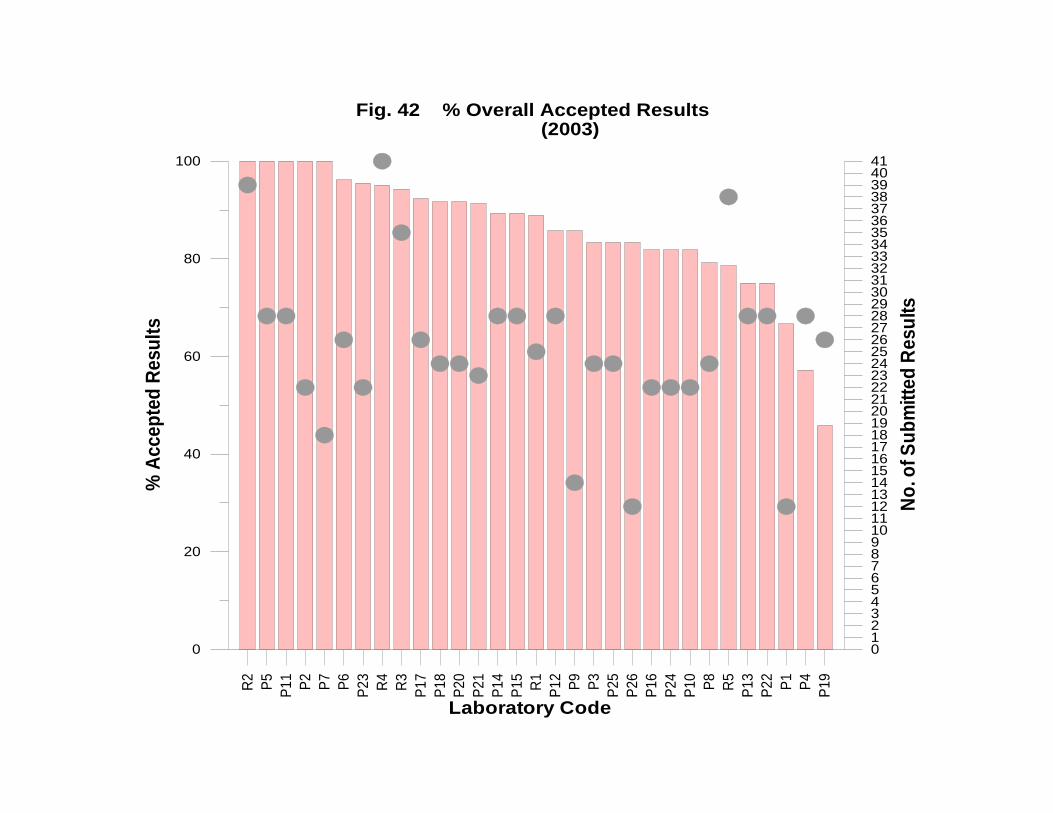
R2
P5
P1
1
P2
P7
P6
P2
3
R4
R3
P1
7
P1
8
P2
0
P2
1
P1
4
P1
5
R1
P1
2
P9
P3
P2
5
P2
6
P1
6
P2
4
P1
0
P8
R5
P1
3
P2
2
P1
P4
P1
9
Laboratory Code
0
20
40
60
80
100%
Ac
ce
pte
d R
esu
lts
01234567891011121314151617181920212223242526272829303132333435363738394041
No
. of
Su
bm
itte
d R
es
ult
s
Fig. 42 % Overall Accepted Results (2003)
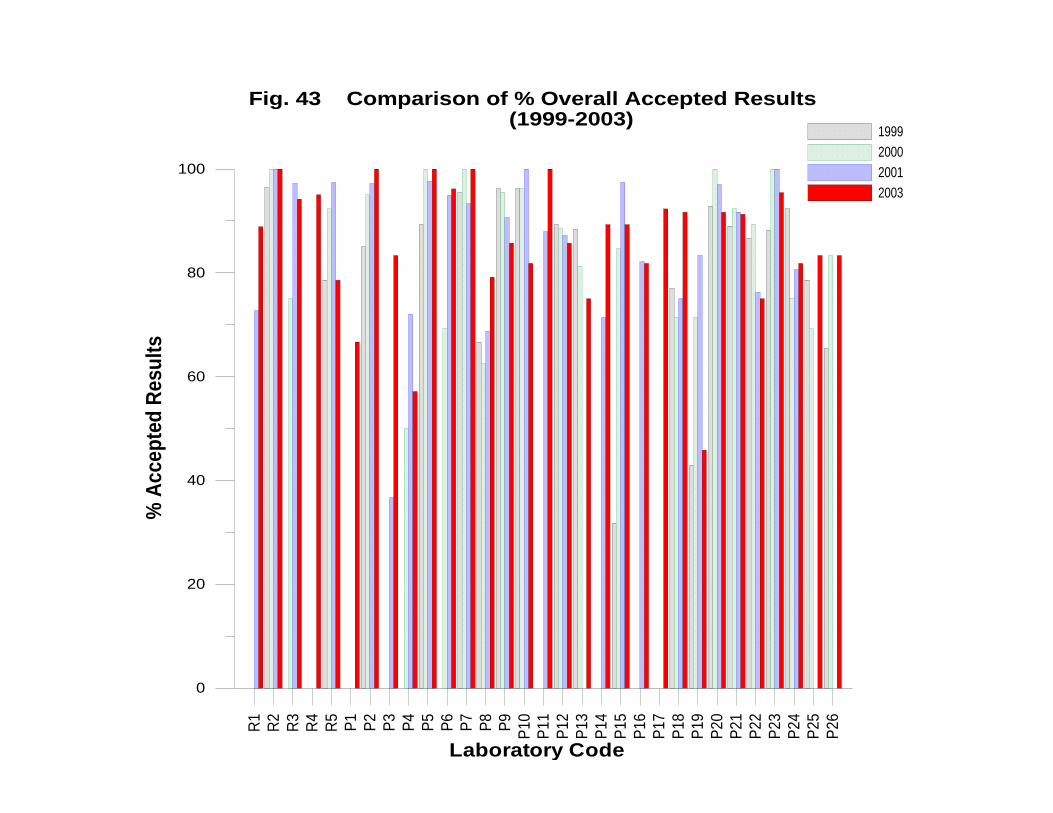
R1
R2
R3
R4
R5
P1
P2
P3
P4
P5
P6
P7
P8
P9
P1
0P
11
P1
2
P1
3
P1
4
P1
5
P1
6
P1
7
P1
8
P1
9
P2
0
P2
1
P2
2
P2
3
P2
4
P2
5
P2
6
Laboratory Code
0
20
40
60
80
100%
Ac
ce
pte
d R
esu
lts
1999
2000
2001
2003
Fig. 43 Comparison of % Overall Accepted Results (1999-2003)
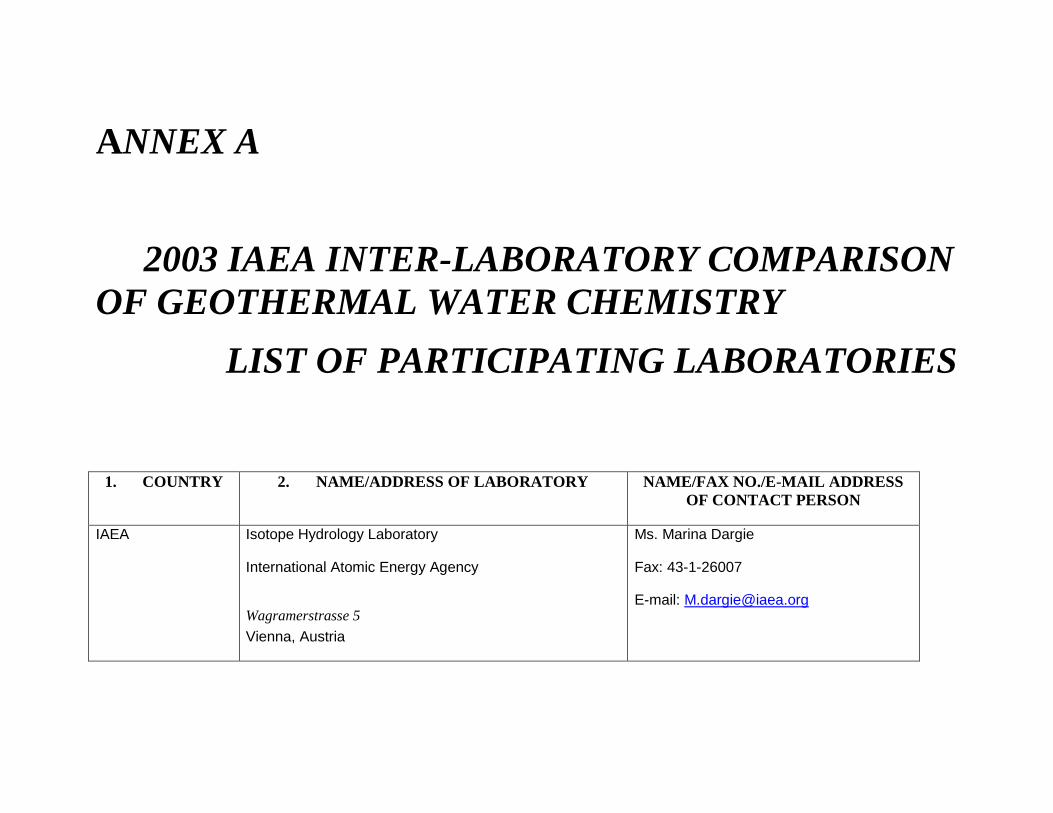
ANNEX A
2003 IAEA INTER-LABORATORY COMPARISON
OF GEOTHERMAL WATER CHEMISTRY
LIST OF PARTICIPATING LABORATORIES
1. COUNTRY 2. NAME/ADDRESS OF LABORATORY NAME/FAX NO./E-MAIL ADDRESS
OF CONTACT PERSON
IAEA Isotope Hydrology Laboratory
International Atomic Energy Agency
Wagramerstrasse 5
Vienna, Austria
Ms. Marina Dargie
Fax: 43-1-26007
E-mail: [email protected]
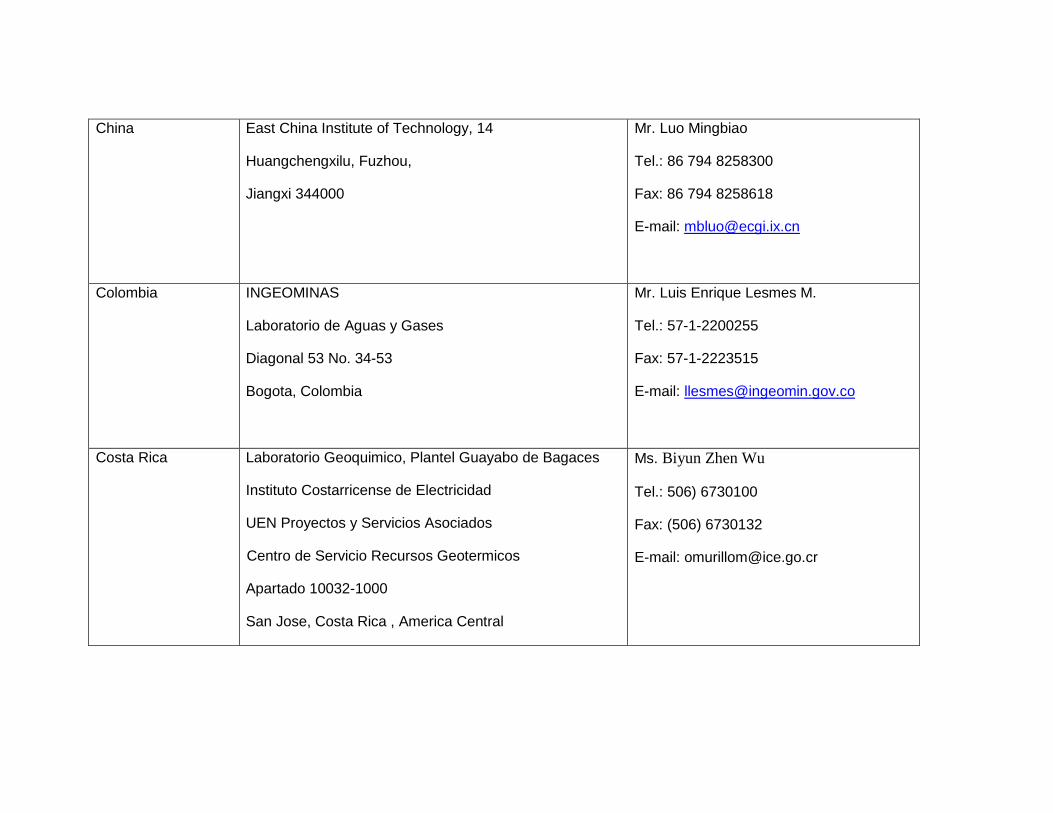
China East China Institute of Technology, 14
Huangchengxilu, Fuzhou,
Jiangxi 344000
Mr. Luo Mingbiao
Tel.: 86 794 8258300
Fax: 86 794 8258618
E-mail: [email protected]
Colombia
INGEOMINAS
Laboratorio de Aguas y Gases
Diagonal 53 No. 34-53
Bogota, Colombia
Mr. Luis Enrique Lesmes M.
Tel.: 57-1-2200255
Fax: 57-1-2223515
E-mail: [email protected]
Costa Rica Laboratorio Geoquimico, Plantel Guayabo de Bagaces
Instituto Costarricense de Electricidad
UEN Proyectos y Servicios Asociados
Centro de Servicio Recursos Geotermicos
Apartado 10032-1000
San Jose, Costa Rica , America Central
Ms. Biyun Zhen Wu
Tel.: 506) 6730100
Fax: (506) 6730132
E-mail: [email protected]
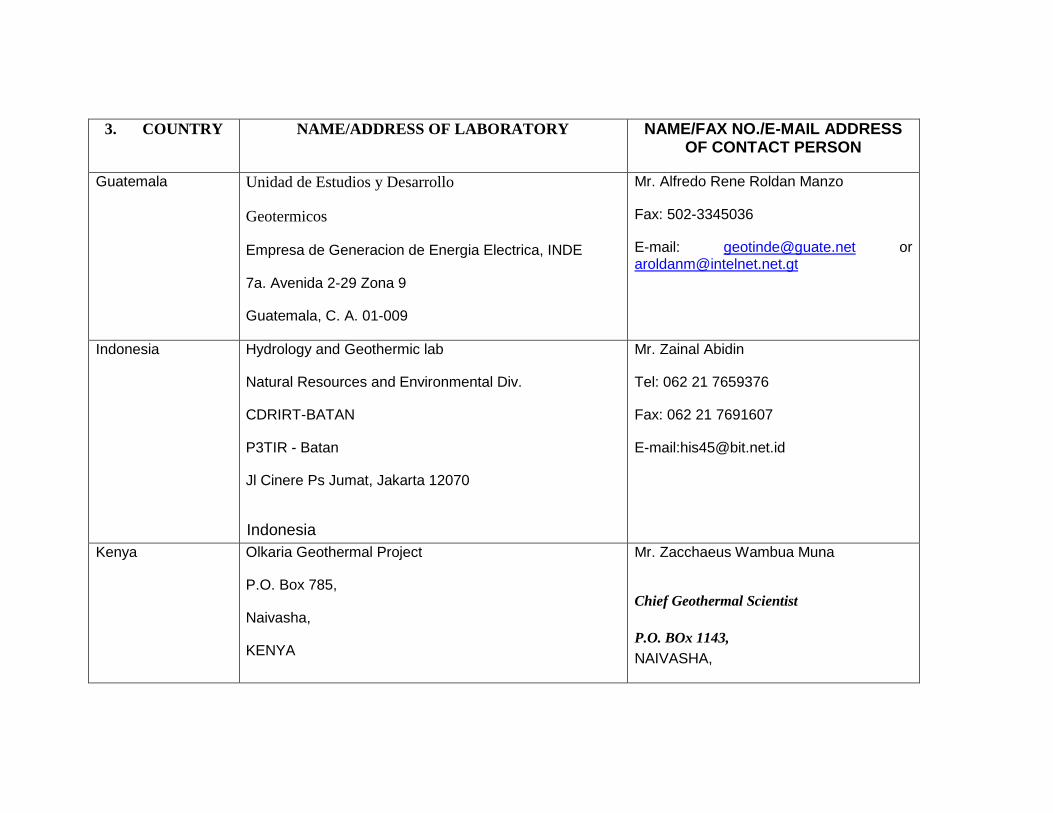
3. COUNTRY NAME/ADDRESS OF LABORATORY NAME/FAX NO./E-MAIL ADDRESS OF CONTACT PERSON
Guatemala Unidad de Estudios y Desarrollo
Geotermicos
Empresa de Generacion de Energia Electrica, INDE
7a. Avenida 2-29 Zona 9
Guatemala, C. A. 01-009
Mr. Alfredo Rene Roldan Manzo
Fax: 502-3345036
E-mail: [email protected] or [email protected]
Indonesia Hydrology and Geothermic lab
Natural Resources and Environmental Div.
CDRIRT-BATAN
P3TIR - Batan
Jl Cinere Ps Jumat, Jakarta 12070
Indonesia
Mr. Zainal Abidin
Tel: 062 21 7659376
Fax: 062 21 7691607
E-mail:[email protected]
Kenya Olkaria Geothermal Project
P.O. Box 785,
Naivasha,
KENYA
Mr. Zacchaeus Wambua Muna
Chief Geothermal Scientist
P.O. BOx 1143,
NAIVASHA,
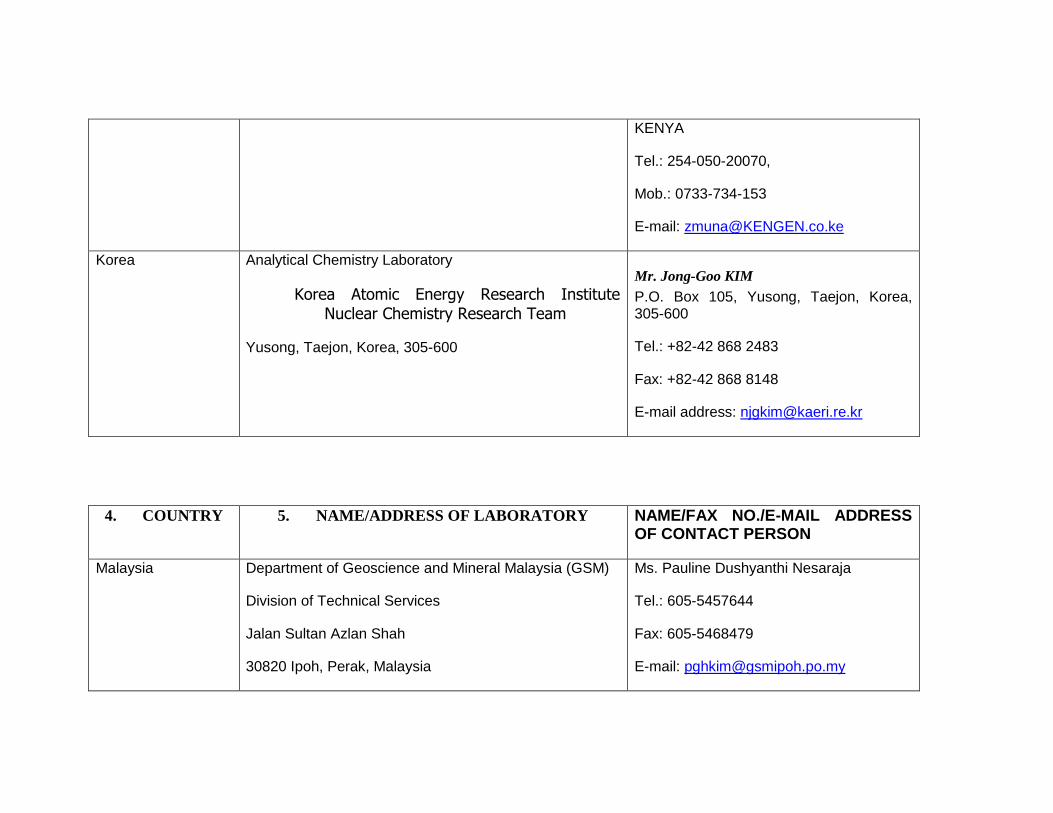
KENYA
Tel.: 254-050-20070,
Mob.: 0733-734-153
E-mail: [email protected]
Korea Analytical Chemistry Laboratory
Korea Atomic Energy Research Institute Nuclear Chemistry Research Team
Yusong, Taejon, Korea, 305-600
Mr. Jong-Goo KIM
P.O. Box 105, Yusong, Taejon, Korea, 305-600
Tel.: +82-42 868 2483
Fax: +82-42 868 8148
E-mail address: [email protected]
4. COUNTRY 5. NAME/ADDRESS OF LABORATORY NAME/FAX NO./E-MAIL ADDRESS OF CONTACT PERSON
Malaysia Department of Geoscience and Mineral Malaysia (GSM)
Division of Technical Services
Jalan Sultan Azlan Shah
30820 Ipoh, Perak, Malaysia
Ms. Pauline Dushyanthi Nesaraja
Tel.: 605-5457644
Fax: 605-5468479
E-mail: [email protected]
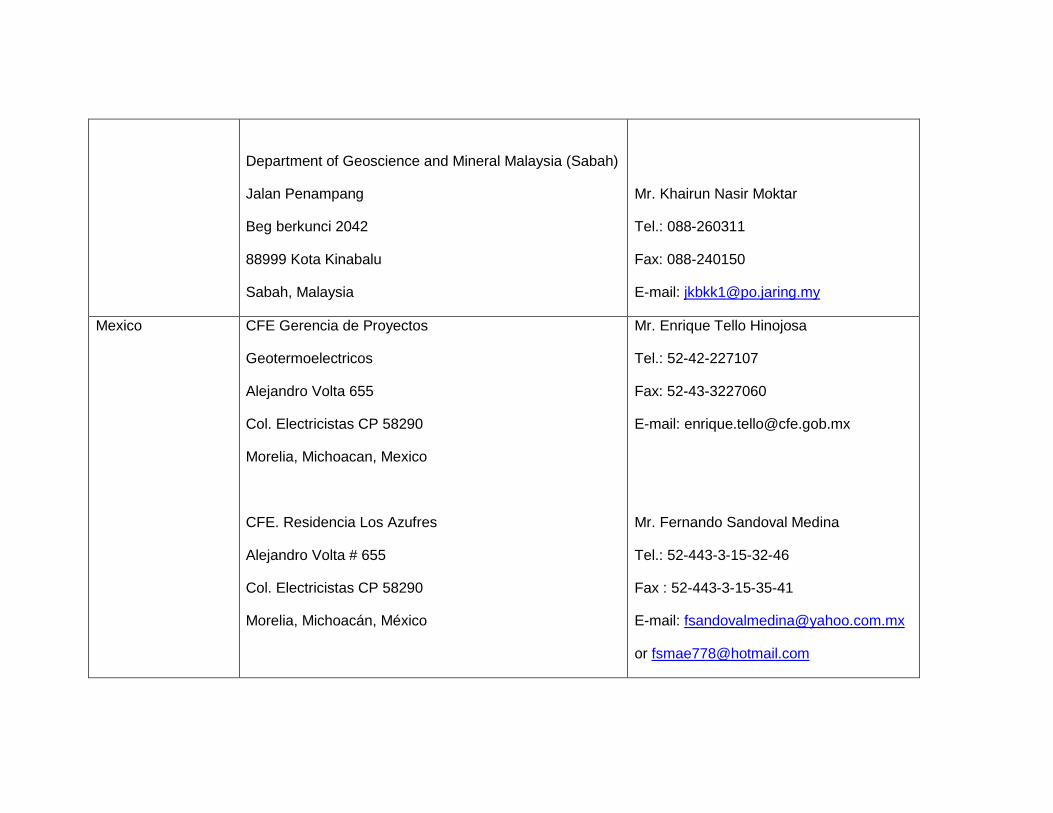
Department of Geoscience and Mineral Malaysia (Sabah)
Jalan Penampang
Beg berkunci 2042
88999 Kota Kinabalu
Sabah, Malaysia
Mr. Khairun Nasir Moktar
Tel.: 088-260311
Fax: 088-240150
E-mail: [email protected]
Mexico CFE Gerencia de Proyectos
Geotermoelectricos
Alejandro Volta 655
Col. Electricistas CP 58290
Morelia, Michoacan, Mexico
CFE. Residencia Los Azufres
Alejandro Volta # 655
Col. Electricistas CP 58290
Morelia, Michoacán, México
Mr. Enrique Tello Hinojosa
Tel.: 52-42-227107
Fax: 52-43-3227060
E-mail: [email protected]
Mr. Fernando Sandoval Medina
Tel.: 52-443-3-15-32-46
Fax : 52-443-3-15-35-41
E-mail: [email protected]
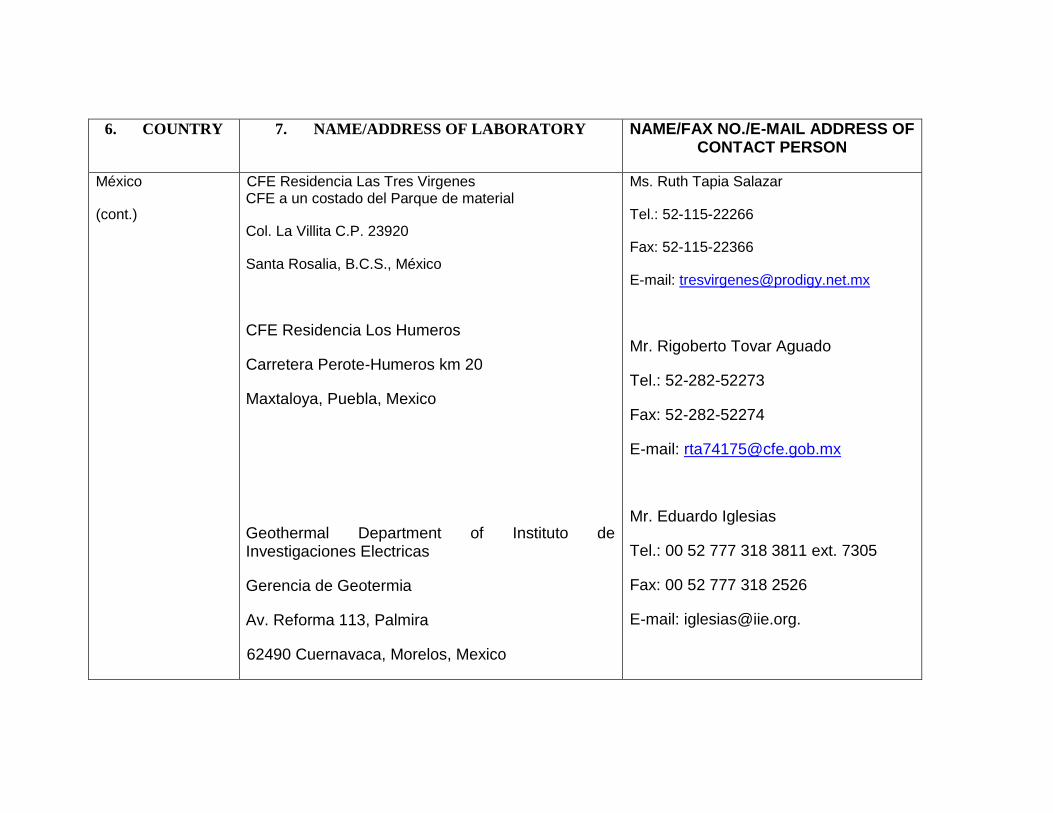
6. COUNTRY 7. NAME/ADDRESS OF LABORATORY NAME/FAX NO./E-MAIL ADDRESS OF CONTACT PERSON
México
(cont.)
CFE Residencia Las Tres Virgenes CFE a un costado del Parque de material
Col. La Villita C.P. 23920
Santa Rosalia, B.C.S., México
CFE Residencia Los Humeros
Carretera Perote-Humeros km 20
Maxtaloya, Puebla, Mexico
Geothermal Department of Instituto de Investigaciones Electricas
Gerencia de Geotermia
Av. Reforma 113, Palmira
62490 Cuernavaca, Morelos, Mexico
Ms. Ruth Tapia Salazar
Tel.: 52-115-22266
Fax: 52-115-22366
E-mail: [email protected]
Mr. Rigoberto Tovar Aguado
Tel.: 52-282-52273
Fax: 52-282-52274
E-mail: [email protected]
Mr. Eduardo Iglesias
Tel.: 00 52 777 318 3811 ext. 7305
Fax: 00 52 777 318 2526
E-mail: [email protected].
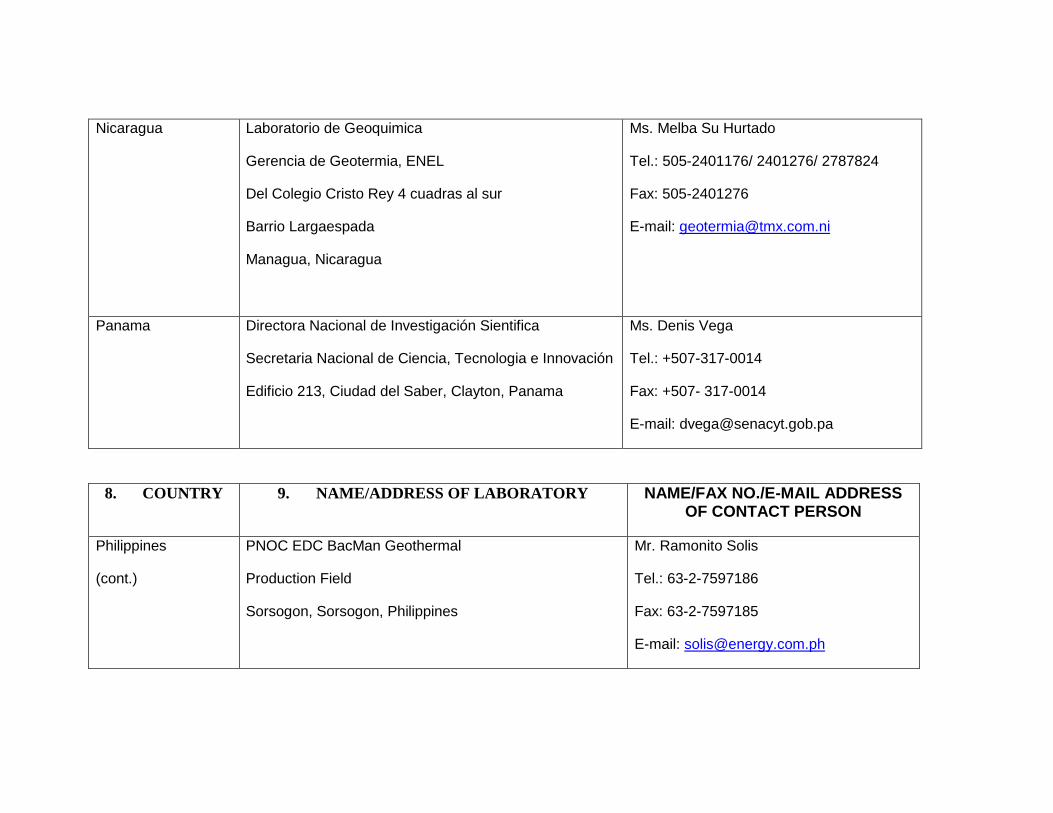
Nicaragua Laboratorio de Geoquimica
Gerencia de Geotermia, ENEL
Del Colegio Cristo Rey 4 cuadras al sur
Barrio Largaespada
Managua, Nicaragua
Ms. Melba Su Hurtado
Tel.: 505-2401176/ 2401276/ 2787824
Fax: 505-2401276
E-mail: [email protected]
Panama Directora Nacional de Investigación Sientifica
Secretaria Nacional de Ciencia, Tecnologia e Innovación
Edificio 213, Ciudad del Saber, Clayton, Panama
Ms. Denis Vega
Tel.: +507-317-0014
Fax: +507- 317-0014
E-mail: [email protected]
8. COUNTRY 9. NAME/ADDRESS OF LABORATORY NAME/FAX NO./E-MAIL ADDRESS OF CONTACT PERSON
Philippines
(cont.)
PNOC EDC BacMan Geothermal
Production Field
Sorsogon, Sorsogon, Philippines
Mr. Ramonito Solis
Tel.: 63-2-7597186
Fax: 63-2-7597185
E-mail: [email protected]
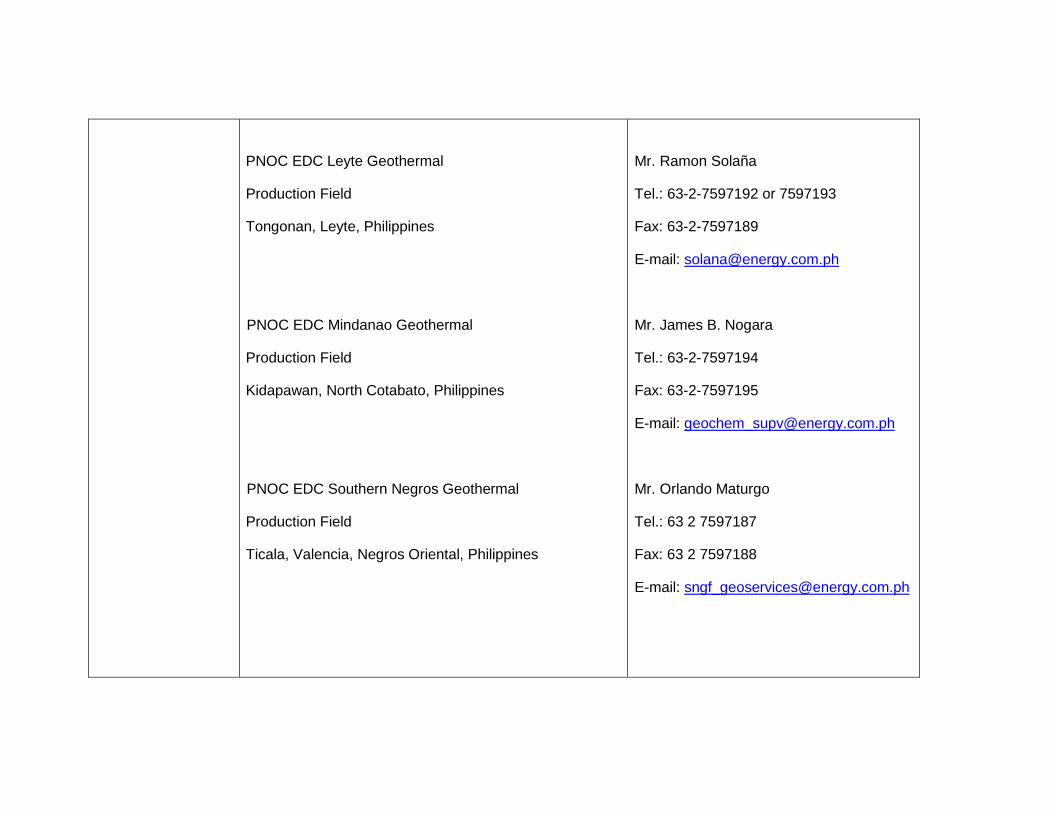
PNOC EDC Leyte Geothermal
Production Field
Tongonan, Leyte, Philippines
PNOC EDC Mindanao Geothermal
Production Field
Kidapawan, North Cotabato, Philippines
PNOC EDC Southern Negros Geothermal
Production Field
Ticala, Valencia, Negros Oriental, Philippines
Mr. Ramon Solaña
Tel.: 63-2-7597192 or 7597193
Fax: 63-2-7597189
E-mail: [email protected]
Mr. James B. Nogara
Tel.: 63-2-7597194
Fax: 63-2-7597195
E-mail: [email protected]
Mr. Orlando Maturgo
Tel.: 63 2 7597187
Fax: 63 2 7597188
E-mail: [email protected]
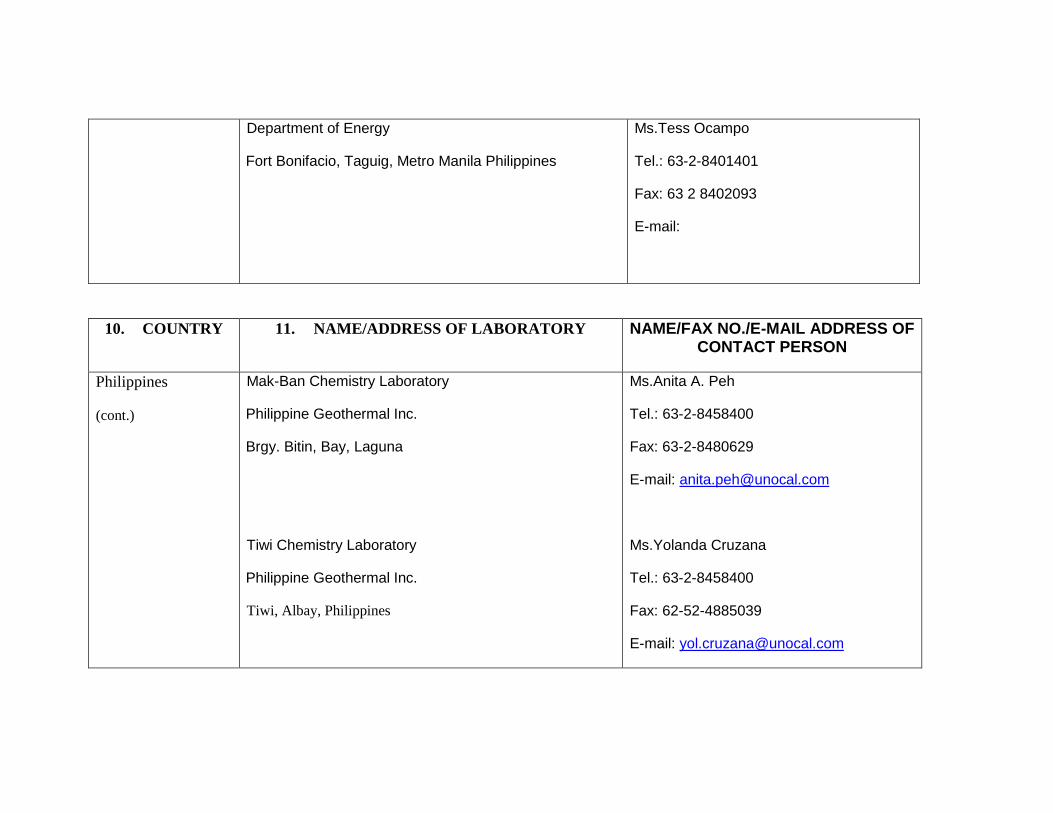
Department of Energy
Fort Bonifacio, Taguig, Metro Manila Philippines
Ms.Tess Ocampo
Tel.: 63-2-8401401
Fax: 63 2 8402093
E-mail:
10. COUNTRY 11. NAME/ADDRESS OF LABORATORY NAME/FAX NO./E-MAIL ADDRESS OF CONTACT PERSON
Philippines
(cont.)
Mak-Ban Chemistry Laboratory
Philippine Geothermal Inc.
Brgy. Bitin, Bay, Laguna
Tiwi Chemistry Laboratory
Philippine Geothermal Inc.
Tiwi, Albay, Philippines
Ms.Anita A. Peh
Tel.: 63-2-8458400
Fax: 63-2-8480629
E-mail: [email protected]
Ms.Yolanda Cruzana
Tel.: 63-2-8458400
Fax: 62-52-4885039
E-mail: [email protected]
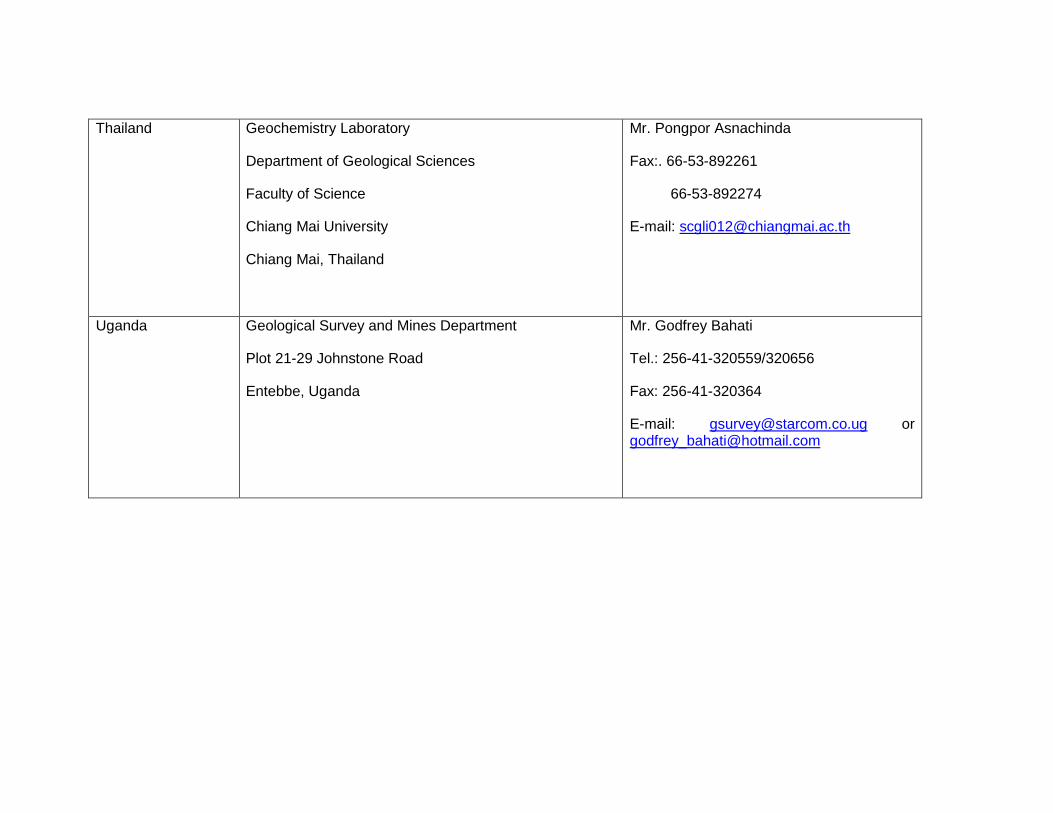
Thailand Geochemistry Laboratory
Department of Geological Sciences
Faculty of Science
Chiang Mai University
Chiang Mai, Thailand
Mr. Pongpor Asnachinda
Fax:. 66-53-892261
66-53-892274
E-mail: [email protected]
Uganda Geological Survey and Mines Department
Plot 21-29 Johnstone Road
Entebbe, Uganda
Mr. Godfrey Bahati
Tel.: 256-41-320559/320656
Fax: 256-41-320364
E-mail: [email protected] or [email protected]
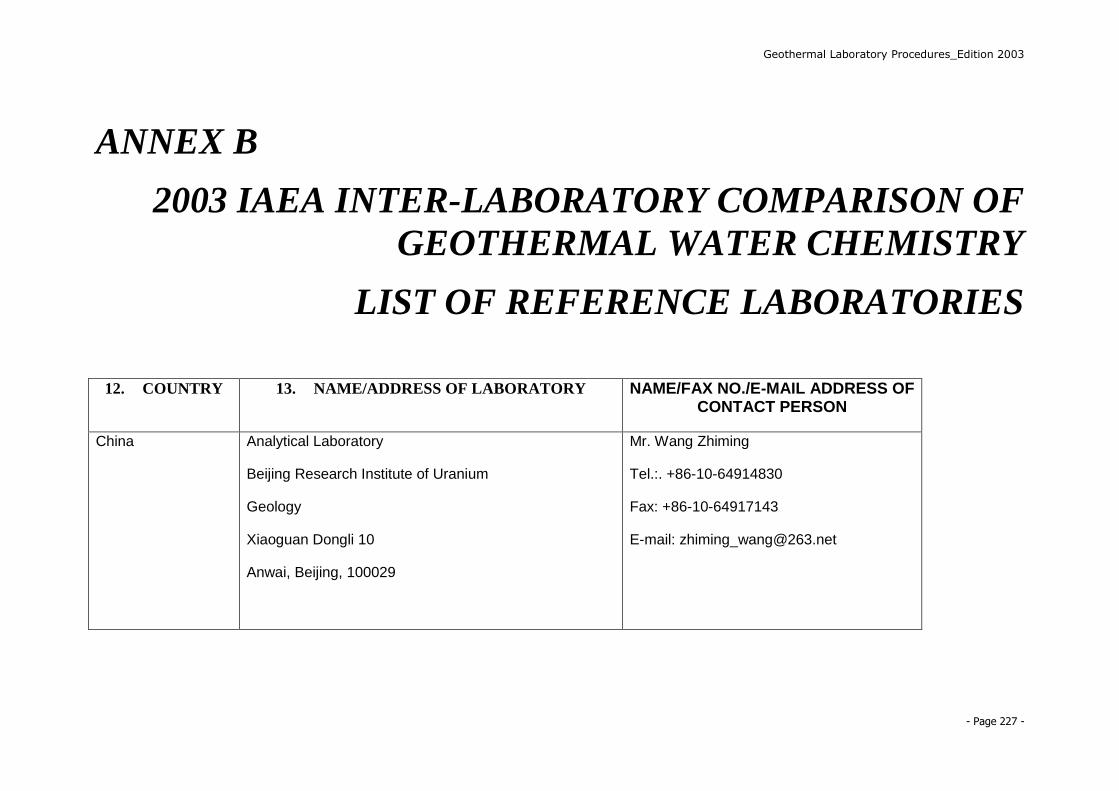
Geothermal Laboratory Procedures_Edition 2003
- Page 227 -
ANNEX B
2003 IAEA INTER-LABORATORY COMPARISON OF
GEOTHERMAL WATER CHEMISTRY
LIST OF REFERENCE LABORATORIES
12. COUNTRY 13. NAME/ADDRESS OF LABORATORY NAME/FAX NO./E-MAIL ADDRESS OF CONTACT PERSON
China Analytical Laboratory
Beijing Research Institute of Uranium
Geology
Xiaoguan Dongli 10
Anwai, Beijing, 100029
Mr. Wang Zhiming
Tel.:. +86-10-64914830
Fax: +86-10-64917143
E-mail: [email protected]
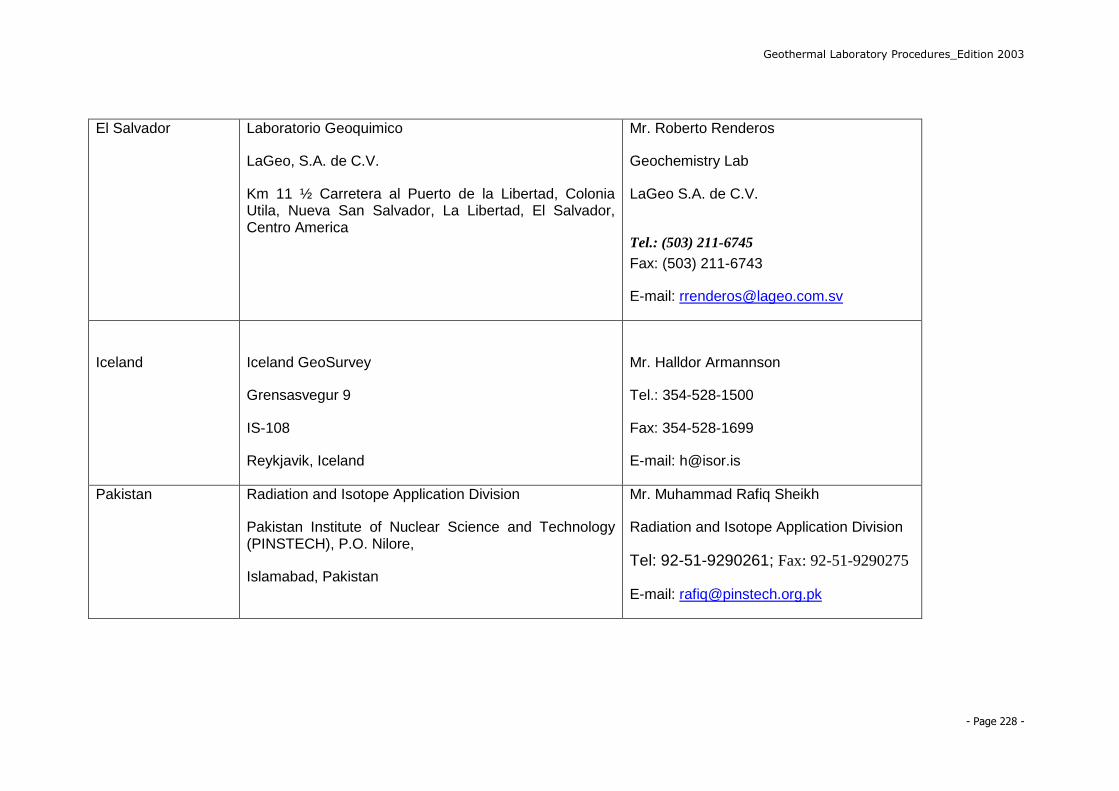
Geothermal Laboratory Procedures_Edition 2003
- Page 228 -
El Salvador Laboratorio Geoquimico
LaGeo, S.A. de C.V.
Km 11 ½ Carretera al Puerto de la Libertad, Colonia Utila, Nueva San Salvador, La Libertad, El Salvador, Centro America
Mr. Roberto Renderos
Geochemistry Lab
LaGeo S.A. de C.V.
Tel.: (503) 211-6745
Fax: (503) 211-6743
E-mail: [email protected]
Iceland
Iceland GeoSurvey
Grensasvegur 9
IS-108
Reykjavik, Iceland
Mr. Halldor Armannson
Tel.: 354-528-1500
Fax: 354-528-1699
E-mail: [email protected]
Pakistan Radiation and Isotope Application Division
Pakistan Institute of Nuclear Science and Technology (PINSTECH), P.O. Nilore,
Islamabad, Pakistan
Mr. Muhammad Rafiq Sheikh
Radiation and Isotope Application Division
Tel: 92-51-9290261; Fax: 92-51-9290275
E-mail: [email protected]
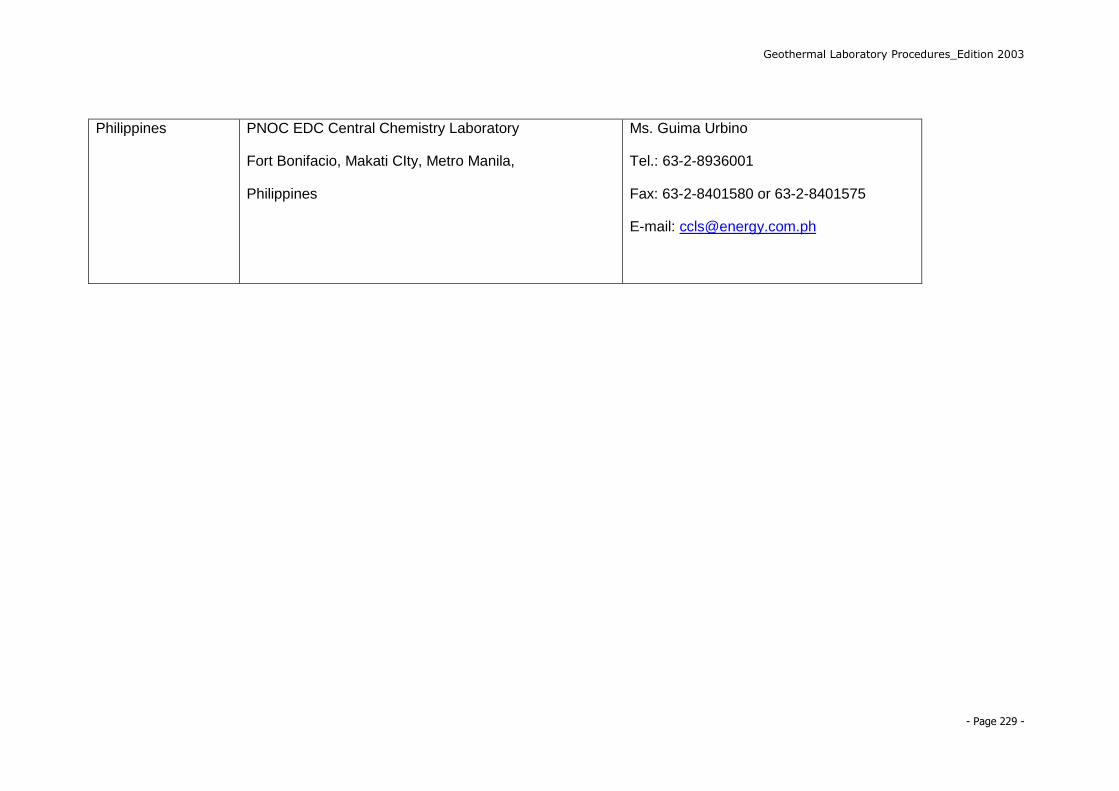
Geothermal Laboratory Procedures_Edition 2003
- Page 229 -
Philippines PNOC EDC Central Chemistry Laboratory
Fort Bonifacio, Makati CIty, Metro Manila,
Philippines
Ms. Guima Urbino
Tel.: 63-2-8936001
Fax: 63-2-8401580 or 63-2-8401575
E-mail: [email protected]