Embed Size (px)
Citation preview
Analytics for the CMO How Best-in-Class Marketers Use Customer Insights to
Drive More Revenue
September 2011
Peter Ostrow, David White

Analytics for the CMO: How Best-in-Class Marketers Use Customer Insights to Drive More Revenue Page 2
© 2011 Aberdeen Group. Telephone: 617 854 5200
Executive Summary Research Benchmark
Aberdeen’s Research Benchmarks provide an in-depth and comprehensive look into process, procedure, methodologies, and technologies with best practice identification and actionable recommendations
Marketing success depends on insight into, and intelligence regarding, one’s target audience. Research by the Aberdeen Group has found, however, that fewer than half of Best-in-Class marketing organizations employ lead management dashboards and campaign management tools (Sales and Marketing Alignment: Collaboration + Cooperation = Peak Performance). As the volume of customer-related data (transactional, behavioral and unstructured) continues to grow, marketing organizations are in danger of becoming increasingly data-rich, but insight-poor. Without a strong analytics capability to glean insights from both prior marketing activities and current customers, it is very difficult to execute these tactics effectively or efficiently.
Best-in-Class Performance In July 2011, Aberdeen surveyed 160 end-user organizations to learn about their marketing effectiveness. Aberdeen used the following three key performance criteria to distinguish the selling organizations within Best-in-Class companies:
• 60% average marketing contribution to sales pipeline, vs. 10% for Industry Average firms and 3% for Laggards
• 9.9% average year-over year improvement in incremental sales lift resulting from marketing campaigns, vs. 1.1% for the Industry Average and a 3.6% decline among Laggards
• 9.5% average year-over-year increase in customer retention rate, vs. 2.1% among Industry Average and a 3.2% decline for Laggard firms
Competitive Maturity Assessment “Many of our clients are starting to review web, email, lead and opportunity metrics, and track them over time. It's a slow process, and the processes are still immature, but they are moving in the right direction."
~ Brenda Stoltz, Founding Partner, Ariad Partners
Survey results show that the firms enjoying Best-in-Class performance shared several common characteristics, including:
• 86% utilize website visitor tracking
• 82% track, measure and report on all marketing campaign results
• 64% have a process to test effectiveness of campaign content
Required Actions In addition to the specific recommendations in Chapter Three of this report, to achieve Best-in-Class performance, marketing organizations must:
• Deploy web analytics to better understand the identity, behavior and potential spend of both prospects and customers
• Support their campaigns with pre-launch testing, post-launch evaluations, and open access among all internal stakeholders to both campaign-specific and overall department performance against well-defined KPI's
www.aberdeen.com Fax: 617 723 7897 This document is the result of primary research performed by Aberdeen Group. Aberdeen Group's methodologies provide for objective fact-based research and represent the best analysis available at the time of publication. Unless otherwise noted, the entire contents of this publication are copyrighted by Aberdeen Group, Inc. and may not be reproduced, distributed, archived, or transmitted in any form or by any means without prior written consent by Aberdeen Group, Inc.
Analytics for the CMO: How Best-in-Class Marketers Use Customer Insights to Drive More Revenue Page 3
© 2011 Aberdeen Group. Telephone: 617 854 5200 www.aberdeen.com Fax: 617 723 7897
Table of Contents Executive Summary....................................................................................................... 2
Best-in-Class Performance..................................................................................... 2 Competitive Maturity Assessment....................................................................... 2 Required Actions...................................................................................................... 2
Chapter One: Benchmarking the Best-in-Class.................................................... 4 Business Context ..................................................................................................... 4 The Maturity Class Framework............................................................................ 5 The Best-in-Class PACE Model ............................................................................ 6 Best-in-Class Strategies........................................................................................... 7
Chapter Two: Benchmarking Requirements for Success................................... 9 Capabilities and Enablers ......................................................................................10
Chapter Three: Required Actions .........................................................................18 Laggard Steps to Success......................................................................................18 Industry Average Steps to Success ....................................................................18 Best-in-Class Steps to Success ............................................................................19
Appendix A: Research Methodology.....................................................................20 Appendix B: Related Aberdeen Research............................................................22
Figures Figure 1: Pressure to Deliver Tangible Results to the Top Line ....................... 4 Figure 2: Strategic Actions Focus on Pinpoint Marketing Accuracy ................. 7 Figure 3: How is ROMI Best Measured?.................................................................. 8 Figure 4: Analytical Marketing Processes by the Best-in-Class ........................11 Figure 5: Best-in-Class Organizational Capabilities .............................................12 Figure 6: Managing Knowledge to Achieve Superior Results ...........................14 Figure 7: Showcasing the Value of Knowing Your Customer ..........................15 Figure 8: Performance Management Capabilities by Best-in-Class..................16
Tables Table 1: Top Performers Earn Best-in-Class Status.............................................. 6 Table 2: The Best-in-Class PACE Framework ....................................................... 6 Table 3: The Competitive Framework..................................................................... 9 Table 4: The PACE Framework Key ......................................................................21 Table 5: The Competitive Framework Key ..........................................................21 Table 6: The Relationship Between PACE and the Competitive Framework.........................................................................................................................................21

Analytics for the CMO: How Best-in-Class Marketers Use Customer Insights to Drive More Revenue Page 4
© 2011 Aberdeen Group. Telephone: 617 854 5200
Chapter One: Benchmarking the Best-in-Class
Business Context
www.aberdeen.com Fax: 617 723 7897
As companies head out into the brave new post-recession world, Aberdeen’s Q4 2010 Business Review found that the top two goals for marketers are margin growth (41%) and organic revenue growth (37%). To help achieve these objectives, Chief Marketing Officers (CMO’s) reported an average growth of 4.0% in their marketing budgets for 2011. The crucial question, then, is: how do CMO’s invest that marketing budget wisely to maximize gains?
This research highlights the strategies, actions, technologies and services that Best-in-Class marketing organizations are using to drive sales performance and optimize their marketing efforts. Overall, Aberdeen's research survey showed that two pressures dominate the thinking of CMO's (Figure 1).
Figure 1: Pressure to Deliver Tangible Results to the Top Line
48% 48%
36%
31% 31%
0%
10%
20%
30%
40%
50%
Need to deliverhigher quality
sales leads
Pressure todeliver ROI on
marketingspend
Need todeliver moresales leads
Faster responsetime required forbusiness impact
of marketing
Changing buyerbehavior (socialmedia, mobile
marketing, etc.)
n = 160
Perc
enta
ge o
f Res
pond
ents
All companies48% 48%
36%
31% 31%
0%
10%
20%
30%
40%
50%
Need to deliverhigher quality
sales leads
Pressure todeliver ROI on
marketingspend
Need todeliver moresales leads
Faster responsetime required forbusiness impact
of marketing
Changing buyerbehavior (socialmedia, mobile
marketing, etc.)
n = 160
Perc
enta
ge o
f Res
pond
ents
All companies
Fast Facts
√ Best-in-Class companies average 9.8% year-over-year growth in marketing's contribution to the sales pipeline, compared with 1.9% among the Industry Average and a 1.8% decline for Laggards
√ Average customer spend per year grew by 7.6% among the Best-in-Class, 1.9% for the Industry Average, and dropped by 3.5% among Laggard firms
√ Revenue from up-selling and cross-selling showed an increase of 7.2% per year for the Best-in-Class, vs. 1.9% and a 3.6% decline for Average and Laggard companies
Source: Aberdeen Group, July 2011 * Survey respondents were asked to choose three top pressures
As companies emerge from recession and take tentative steps towards growth, it's clear what Chief Marketing Officers need to deliver. It is not simply enough to pour more leads into the top of the sales funnel; rather, enterprises are becoming more discriminating and focusing on the quality of the leads more intently than before. This is consistent with the pressure felt to identify and quantify the Return on Marketing Investment (ROMI). While simply generating more leads might seem like a strong goal, obviously leads are only valuable when they materialize into revenue. The focus on high-quality leads indicates that a more powerful focus on quantifying the

Analytics for the CMO: How Best-in-Class Marketers Use Customer Insights to Drive More Revenue Page 5
© 2011 Aberdeen Group. Telephone: 617 854 5200
performance of marketing at all stages of the sales pipeline is coming to the fore.
The Maturity Class Framework Aberdeen used three key performance criteria to distinguish the Best-in-Class from Industry Average and Laggard organizations. In combination, these three metrics measure the holistic contribution of the marketing group to corporate performance:
• The contribution of the marketing organization to the sales pipeline. The role of the marketing organization is often very broad. It can encompass a range of activities, some that directly drive revenue, and others that make a very intangible contribution to business performance. Overall, the most direct measure is marketing contribution to the sales pipeline, a metric then gauges marketing's ability to generate and nurture sales leads that eventually contribute to the top line.
“This will take our company into an era of running a more collaborative and efficient sales/marketing operation."
~ John Staple, Director of Marketing, CareersUSA
• Year-over-year improvement in incremental sales lift.
Incremental sales lift hones in on the ability of the marketing organization to drive change. It measures the relative impact of a single or aggregate number of marketing campaigns on a target audience's buying behavior, compared to running no campaign at all. In essence it means that while marketing may wish to claim it touched many of the leads in the sales pipeline, this metric measures the ability of the marketing organization to truly change buyer behavior.
• Year-over-year increase in customer retention rate. The customer retention rate is influenced by many facets in the enterprise, including potentially R&D, manufacturing, logistics, service delivery, and relationships with key individuals in the company. However, marketing also has a role to play here, for example in delivering a large number of sales leads that eventually turn into customers. But, if they have the wrong type of customer - those that are inherently disloyal - this may be detrimental to the overall performance of the organization. Additionally, many organizations complete the customer management "circle of life" by re-marketing to existing accounts, in order to positively impact the likelihood that they will continue to buy, as well as add to the seller's bottom-line through up-sell and cross-sell revenue.
www.aberdeen.com Fax: 617 723 7897
Analytics for the CMO: How Best-in-Class Marketers Use Customer Insights to Drive More Revenue Page 6
© 2011 Aberdeen Group. Telephone: 617 854 5200 www.aberdeen.com Fax: 617 723 7897
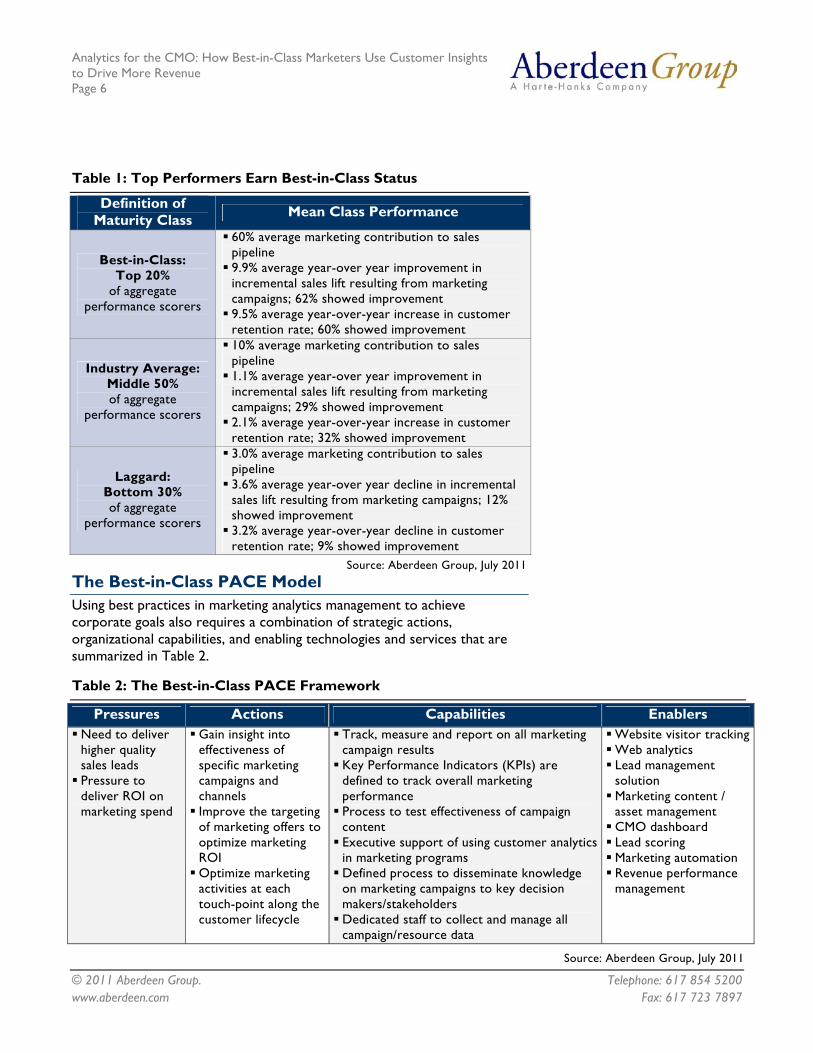
Table 1: Top Performers Earn Best-in-Class Status
Definition of Maturity Class Mean Class Performance
Best-in-Class: Top 20%
of aggregate performance scorers
60% average marketing contribution to sales pipeline 9.9% average year-over year improvement in incremental sales lift resulting from marketing campaigns; 62% showed improvement 9.5% average year-over-year increase in customer retention rate; 60% showed improvement
Industry Average: Middle 50% of aggregate
performance scorers
10% average marketing contribution to sales pipeline 1.1% average year-over year improvement in incremental sales lift resulting from marketing campaigns; 29% showed improvement 2.1% average year-over-year increase in customer retention rate; 32% showed improvement
Laggard: Bottom 30% of aggregate
performance scorers
3.0% average marketing contribution to sales pipeline 3.6% average year-over year decline in incremental sales lift resulting from marketing campaigns; 12% showed improvement 3.2% average year-over-year decline in customer retention rate; 9% showed improvement
Source: Aberdeen Group, July 2011
The Best-in-Class PACE Model Using best practices in marketing analytics management to achieve corporate goals also requires a combination of strategic actions, organizational capabilities, and enabling technologies and services that are summarized in Table 2.
Table 2: The Best-in-Class PACE Framework
Pressures Actions Capabilities Enablers Need to deliver higher quality sales leads Pressure to deliver ROI on marketing spend
Gain insight into effectiveness of specific marketing campaigns and channels Improve the targeting of marketing offers to optimize marketing ROI Optimize marketing activities at each touch-point along the customer lifecycle
Track, measure and report on all marketing campaign results Key Performance Indicators (KPIs) are defined to track overall marketing performance Process to test effectiveness of campaign content Executive support of using customer analytics in marketing programs Defined process to disseminate knowledge on marketing campaigns to key decision makers/stakeholders Dedicated staff to collect and manage all campaign/resource data
Website visitor tracking Web analytics Lead management solution Marketing content / asset management CMO dashboard Lead scoring Marketing automation Revenue performance management
Source: Aberdeen Group, July 2011

Analytics for the CMO: How Best-in-Class Marketers Use Customer Insights to Drive More Revenue Page 7
© 2011 Aberdeen Group. Telephone: 617 854 5200
Best-in-Class Strategies Altogether, survey respondents were asked to choose from eight possible strategies to deal with the marketing pressures they are currently facing. Simply put, Best-in-Class companies are steadily focused on improving the effectiveness of their marketing activities and need to collect and aggregate data in order to do so (Figure 2).
Figure 2: Strategic Actions Focus on Pinpoint Marketing Accuracy
43%
39%
30%
26%
21%
38%
33%
18%
26%23%
10%
20%
30%
40%
50%
Gain insight intoeffectiveness of
specificcampaigns and
channels
Improve targetingof offers to optimize
marketing ROI
Optimize marketingactivities at each
touch-point along thecustomer lifecycle
Align marketingactivities withspecific sales
objectives/goals
Build unique customerprofiles and personasto match solutions to
specific customerneeds
n = 160
Perc
enta
ge o
f Res
pond
ents
Best-in-Class All others43%
39%
30%
26%
21%
38%
33%
18%
26%23%
10%
20%
30%
40%
50%
Gain insight intoeffectiveness of
specificcampaigns and
channels
Improve targetingof offers to optimize
marketing ROI
Optimize marketingactivities at each
touch-point along thecustomer lifecycle
Align marketingactivities withspecific sales
objectives/goals
Build unique customerprofiles and personasto match solutions to
specific customerneeds
n = 160
Perc
enta
ge o
f Res
pond
ents
Best-in-Class All others
Source: Aberdeen Group, July 2011
The most popular strategy among all maturity classes, the action to "gain insight into the effectiveness of specific campaigns and channels," may seem like an obvious best practice, though fewer than half of companies overall actively do so at the current time. Still with 13% more Best-in-Class firms taking this approach than other companies (43% vs. 38%), it represents a wise course of action for CMO's interested in achieving better business results. Understanding which specific marketing campaigns and what media options are currently the most successful will point practitioners toward more wisely selecting the messages and media used in the future. This also helps support the second most-popular strategy: targeting marketing offers is a key element when pursuing today's data-rich and sales-savvy buyers, in both business and consumer environments. Finally, this approach to segmentation applies to the strategic action representing the widest divide between Best-in-Class and other companies, optimizing marketing activities to match different points in the customer lifecycle. With 67% more top performers than other firms (30% vs. 18%) ensuring the right message, to the right person, at the right time, the ability to better pinpoint marketing activity to maximize its effect is well-demonstrated by how top performers are refining their strategies.
www.aberdeen.com Fax: 617 723 7897
Analytics for the CMO: How Best-in-Class Marketers Use Customer Insights to Drive More Revenue Page 8
© 2011 Aberdeen Group. Telephone: 617 854 5200
Aberdeen Insights — Strategy
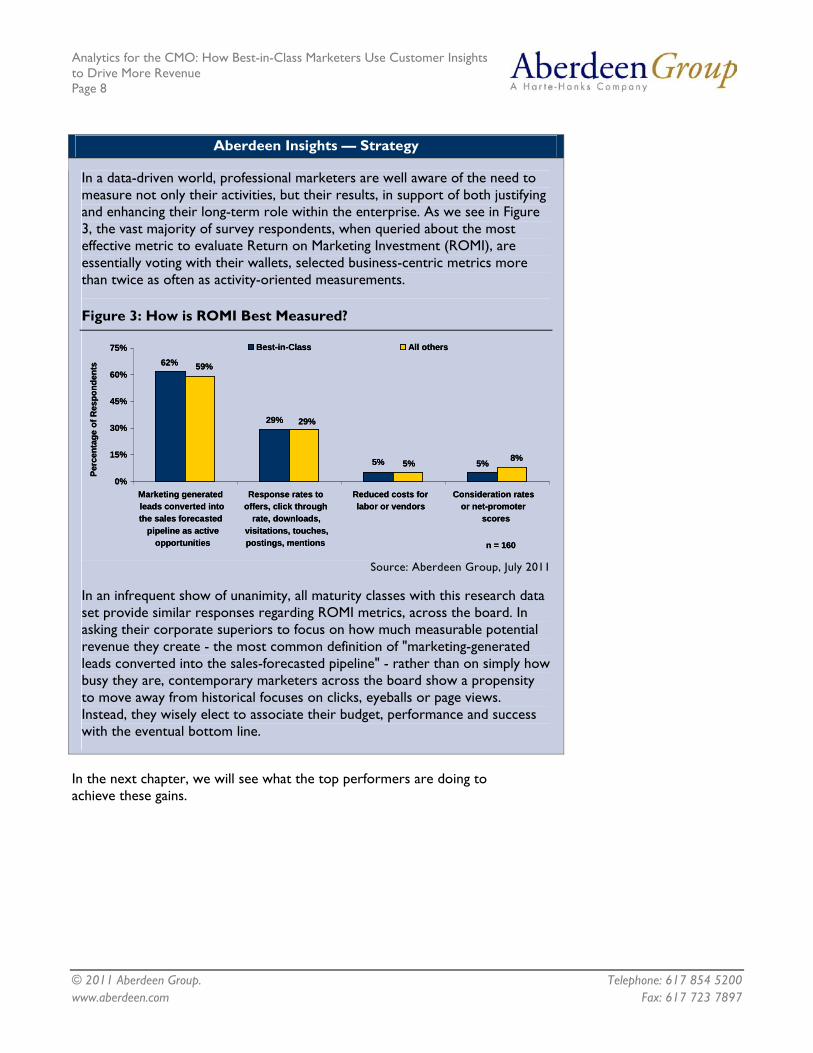
In a data-driven world, professional marketers are well aware of the need to measure not only their activities, but their results, in support of both justifying and enhancing their long-term role within the enterprise. As we see in Figure 3, the vast majority of survey respondents, when queried about the most effective metric to evaluate Return on Marketing Investment (ROMI), are essentially voting with their wallets, selected business-centric metrics more than twice as often as activity-oriented measurements.
Figure 3: How is ROMI Best Measured?
62%
29%
5% 5%
59%
29%
5% 8%
0%
15%
30%
45%
60%
75%
Marketing generatedleads converted intothe sales forecasted
pipeline as activeopportunities
Response rates tooffers, click through
rate, downloads,visitations, touches,postings, mentions
Reduced costs forlabor or vendors
Consideration ratesor net-promoter
scores
n = 160
Perc
enta
ge o
f Res
pond
ents
Best-in-Class
www.aberdeen.com Fax: 617 723 7897
All others
62%
29%
5% 5%
59%
29%
5% 8%
0%
15%
30%
45%
60%
75%
Marketing generatedleads converted intothe sales forecasted
pipeline as activeopportunities
Response rates tooffers, click through
rate, downloads,visitations, touches,postings, mentions
Reduced costs forlabor or vendors
Consideration ratesor net-promoter
scores
n = 160
Perc
enta
ge o
f Res
pond
ents
Best-in-Class All others
Source: Aberdeen Group, July 2011
In an infrequent show of unanimity, all maturity classes with this research data set provide similar responses regarding ROMI metrics, across the board. In asking their corporate superiors to focus on how much measurable potential revenue they create - the most common definition of "marketing-generated leads converted into the sales-forecasted pipeline" - rather than on simply how busy they are, contemporary marketers across the board show a propensity to move away from historical focuses on clicks, eyeballs or page views. Instead, they wisely elect to associate their budget, performance and success with the eventual bottom line.
In the next chapter, we will see what the top performers are doing to achieve these gains.
Analytics for the CMO: How Best-in-Class Marketers Use Customer Insights to Drive More Revenue Page 9
© 2011 Aberdeen Group. Telephone: 617 854 5200
Chapter Two: Benchmarking Requirements for Success
Effective analytics management deployments play a critical role in an organization's ability to turn these strategies into profit. The following sections provide an analysis of how top performers distinguish themselves from other companies through the implementation of capabilities and enablers that support excellence in deploying best practices in marketing effectiveness.
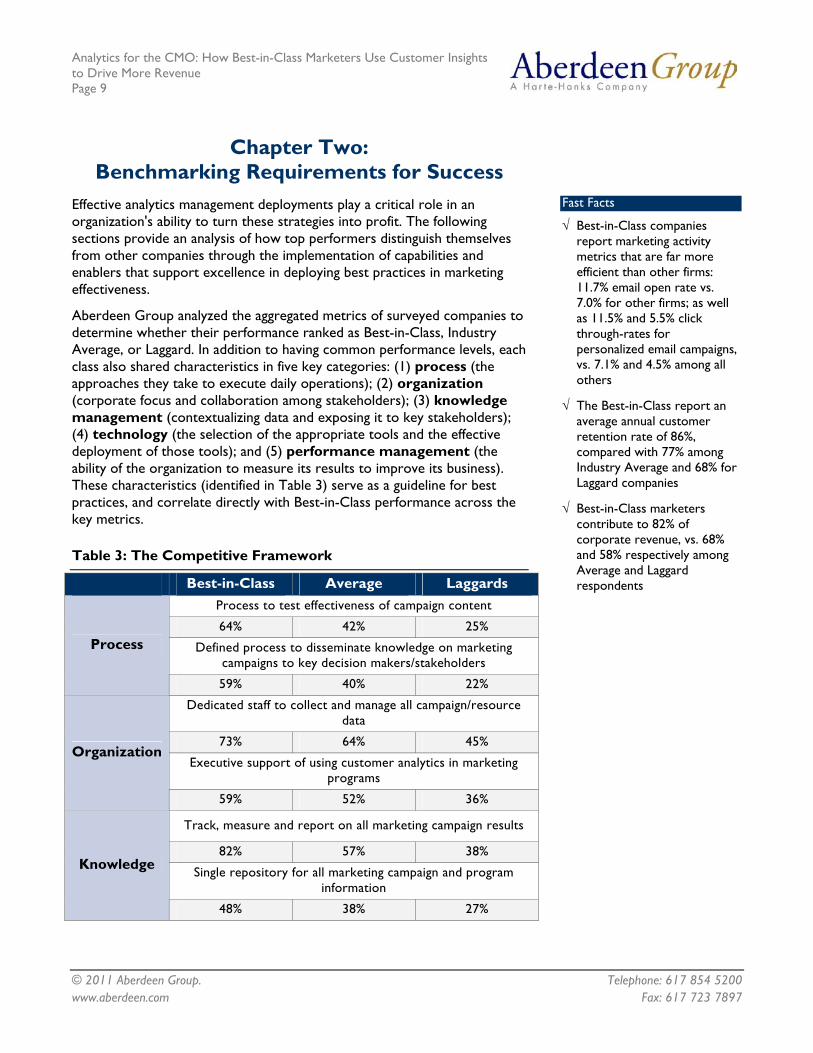
Aberdeen Group analyzed the aggregated metrics of surveyed companies to determine whether their performance ranked as Best-in-Class, Industry Average, or Laggard. In addition to having common performance levels, each class also shared characteristics in five key categories: (1) process (the approaches they take to execute daily operations); (2) organization (corporate focus and collaboration among stakeholders); (3) knowledge management (contextualizing data and exposing it to key stakeholders); (4) technology (the selection of the appropriate tools and the effective deployment of those tools); and (5) performance management (the ability of the organization to measure its results to improve its business). These characteristics (identified in Table 3) serve as a guideline for best practices, and correlate directly with Best-in-Class performance across the key metrics.
Table 3: The Competitive Framework
Best-in-Class Average Laggards Process to test effectiveness of campaign content
64% 42% 25%
Defined process to disseminate knowledge on marketing campaigns to key decision makers/stakeholders
Process
59% 40% 22%
Dedicated staff to collect and manage all campaign/resource data
73% 64% 45%
Executive support of using customer analytics in marketing programs
Organization
59% 52% 36%
Track, measure and report on all marketing campaign results
82% 57% 38%
Single repository for all marketing campaign and program information
Knowledge
48% 38% 27%
Fast Facts
√ Best-in-Class companies report marketing activity metrics that are far more efficient than other firms: 11.7% email open rate vs. 7.0% for other firms; as well as 11.5% and 5.5% click through-rates for personalized email campaigns, vs. 7.1% and 4.5% among all others
√ The Best-in-Class report an average annual customer retention rate of 86%, compared with 77% among Industry Average and 68% for Laggard companies
√ Best-in-Class marketers contribute to 82% of corporate revenue, vs. 68% and 58% respectively among Average and Laggard respondents
www.aberdeen.com Fax: 617 723 7897

Analytics for the CMO: How Best-in-Class Marketers Use Customer Insights to Drive More Revenue Page 10
© 2011 Aberdeen Group. Telephone: 617 854 5200 www.aberdeen.com Fax: 617 723 7897
Best-in-Class Average Laggards
Enabling Technology or
Service
86% Website visitor tracking 82% Web analytics 73% Dashboards 64% Lead management 59% Marketing content / asset management 52% Revenue performance management
77% Website visitor tracking 68% Web analytics 64% Dashboards 59% Lead management 35% Marketing content / asset management 43% Revenue performance management
68% Website visitor tracking 58% Web analytics 44% Dashboards 45% Lead management 29% Marketing content / asset management 39% Revenue performance management
Key Performance Indicators (KPIs) are defined to track overall marketing performance
64% 45% 27%
Ability to identify which marketing channels drive offline sales Performance
45% 25% 18%
Source: Aberdeen Group, July 2011
Capabilities and Enablers Based on the findings of the Competitive Framework and interviews with end users, Aberdeen’s analysis of the Best-in-Class reveals that there are a number of capabilities and competencies that help to deliver the insights necessary to improve marketing performance.
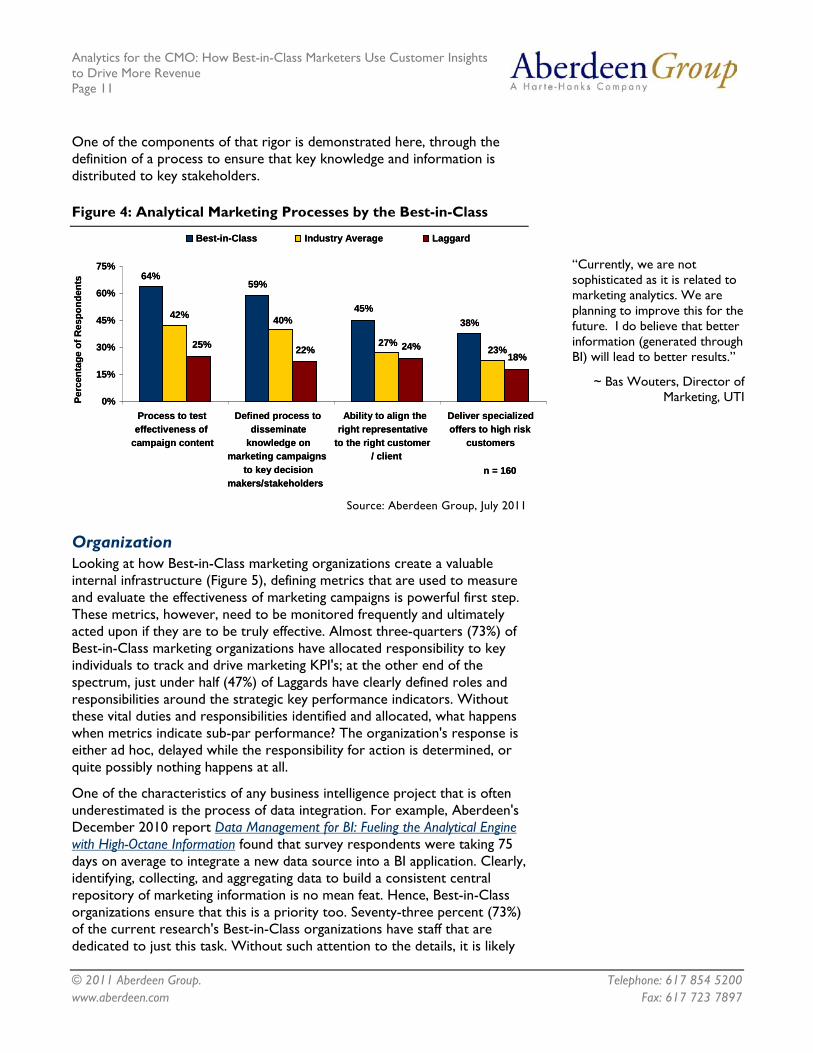
Process Top performing organizations (the Best-in-Class) have several processes in place (Figure 4) that help them to deliver better overall marketing performance than their peers. For example, the Best-in-Class are nearly twice as likely as other organizations (64% vs. 36%) to have a process to test the effectiveness of marketing campaign content. The use of such a process ties directly to key marketing results, and also to the strategy that Best-in-Class companies are pursuing to improve their marketing offers. As we have seen, top-performing marketing departments have been able to improve the incremental sales lift resulting from a marketing campaign by almost 10%, out-performing their peers by a factor of more than 10, on average. Being able to rigorously test drive their marketing campaigns before they execute them in their entirety is one step that will help them to achieve this level of performance.
As noted earlier, one of the central themes that runs through this research is that marketing departments are becoming far more data-driven. That is, they employ data rigorously in order to drive decisions throughout the formulation of marketing strategies and the execution of marketing tactics.
Analytics for the CMO: How Best-in-Class Marketers Use Customer Insights to Drive More Revenue Page 11
© 2011 Aberdeen Group. Telephone: 617 854 5200
One of the components of that rigor is demonstrated here, through the definition of a process to ensure that key knowledge and information is distributed to key stakeholders.
Figure 4: Analytical Marketing Processes by the Best-in-Class
22% 24%18%
64%59%
45%38%
42% 40%
27%23%25%
0%
15%
30%
45%
60%
75%
Process to testeffectiveness of
campaign content
Defined process todisseminate
knowledge onmarketing campaigns
to key decisionmakers/stakeholders
Ability to align theright representative
to the right customer/ client
Deliver specializedoffers to high risk
customers
n = 160
Perc
enta
ge o
f Res
pond
ents
Best-in-Class Industry Average Laggard
“Currently, we are not sophisticated as it is related to marketing analytics. We are planning to improve this for the future. I do believe that better information (generated through BI) will lead to better results.”
~ Bas Wouters, Director of Marketing, UTI
Source: Aberdeen Group, July 2011
Organization Looking at how Best-in-Class marketing organizations create a valuable internal infrastructure (Figure 5), defining metrics that are used to measure and evaluate the effectiveness of marketing campaigns is powerful first step. These metrics, however, need to be monitored frequently and ultimately acted upon if they are to be truly effective. Almost three-quarters (73%) of Best-in-Class marketing organizations have allocated responsibility to key individuals to track and drive marketing KPI's; at the other end of the spectrum, just under half (47%) of Laggards have clearly defined roles and responsibilities around the strategic key performance indicators. Without these vital duties and responsibilities identified and allocated, what happens when metrics indicate sub-par performance? The organization's response is either ad hoc, delayed while the responsibility for action is determined, or quite possibly nothing happens at all.
One of the characteristics of any business intelligence project that is often underestimated is the process of data integration. For example, Aberdeen's December 2010 report Data Management for BI: Fueling the Analytical Engine with High-Octane Information found that survey respondents were taking 75 days on average to integrate a new data source into a BI application. Clearly, identifying, collecting, and aggregating data to build a consistent central repository of marketing information is no mean feat. Hence, Best-in-Class organizations ensure that this is a priority too. Seventy-three percent (73%) of the current research's Best-in-Class organizations have staff that are dedicated to just this task. Without such attention to the details, it is likely
www.aberdeen.com Fax: 617 723 7897

Analytics for the CMO: How Best-in-Class Marketers Use Customer Insights to Drive More Revenue Page 12
© 2011 Aberdeen Group. Telephone: 617 854 5200
that key data will be missing, how to date, or be of poor quality. Any of these negative traits can quickly lead business managers to become disenchanted with analytics. Once disenchantment sets in, low adoption and neglect soon follow.
Figure 5: Best-in-Class Organizational Capabilities
45%36%
6%
73% 73%
59%
36%
67%64%
52%
8%
47%
0%
15%
30%
45%
60%
75%
Individuals identifiedwith responsibilityfor key marketing
metrics
Dedicated staff tocollect and manage
allcampaign/resource
data
Executive support ofusing customer
analytics inmarketingprograms
Marketingmanagers able to
use predictiveanalytics tools
without dedicatedstatistical experts
n = 160
Perc
enta
ge o
f Res
pond
ents
Best-in-Class Industry Average Laggard
Source: Aberdeen Group, July 2011
Case Study - Nordson
Nordson is a leading international designer and manufacturer of dispensing equipment for industrial and consumer adhesives, sealants and coatings. Faced with increasing competition and tougher economic conditions in the mature markets of North America and Western Europe, the Nordson’s adhesives dispensing division was challenged to demonstrate quantifiable returns from each marketing dollar spent. Accomplishing this objective required Nordson to understand the results of each marketing campaign and focus on repeating successful, high Return on Marketing Investment (ROMI)) campaigns. As a result, in 2011 Nordson implemented analytics tools and processes to track and measure the results of each marketing campaign and program. So far, this foundation has been rolled out in the markets that generate about 80% of the revenue, including the rapidly growing Chinese market. “Marketing is vital for maintaining and improving the health of our business. Building a data-driven infrastructure was imperative for us to maximize the results of our marketing efforts,” says Larry Saidman, Marketing Manager at Nordson.
One of the first steps in the company’s data-driven marketing initiatives was identifying key measures that reflect the effectiveness of its overall marketing performance.
continued
www.aberdeen.com Fax: 617 723 7897

Analytics for the CMO: How Best-in-Class Marketers Use Customer Insights to Drive More Revenue Page 13
© 2011 Aberdeen Group. Telephone: 617 854 5200 www.aberdeen.com Fax: 617 723 7897
Case Study - Nordson
The measures identified by Nordson were: marketing’s contribution to the sales-forecasted pipeline, and the percentage of closed business that is influenced by its marketing campaigns. “The use of analytics tools in conjunction with specific performance measures allows us to track and measure the effectiveness of numerous components within each marketing campaign,” says Saidman. The information captured on the results of these campaigns is stored within a centralized data repository, enabling Nordson to conduct analysis based on past marketing results.
Another process associated with the company’s data-driven marketing efforts is to empower sales reps with key customer and prospect information to target high-risk and/or high-value customers with special offers. The ability to capture customer data through marketing campaigns, filtering the data through analytics tools, and disseminating the resulting insights to the appropriate stakeholders enables the company to improve its customer acquisition and engagement efforts, resulting in increased customer retention and cross-sell and up-sell revenue.
The impact of Nordson’s data-driven marketing efforts has demonstrated quantifiable results over the past year. It is forecasted that the business will achieve a 5% year-over-year improvement in the percentage of sales-accepted leads generated by marketing campaigns, as well as marketing’s contribution to closed business– two key measures it regularly tracks to measure its overall marketing effectiveness. “The use of data in marketing is no longer an option; this is the new marketing realm. We are continuously looking to improve our marketing results by leveraging data, and will be adding predictive analytics capabilities over the next year to improve our ability to project future business through existing data,” concludes Saidman.
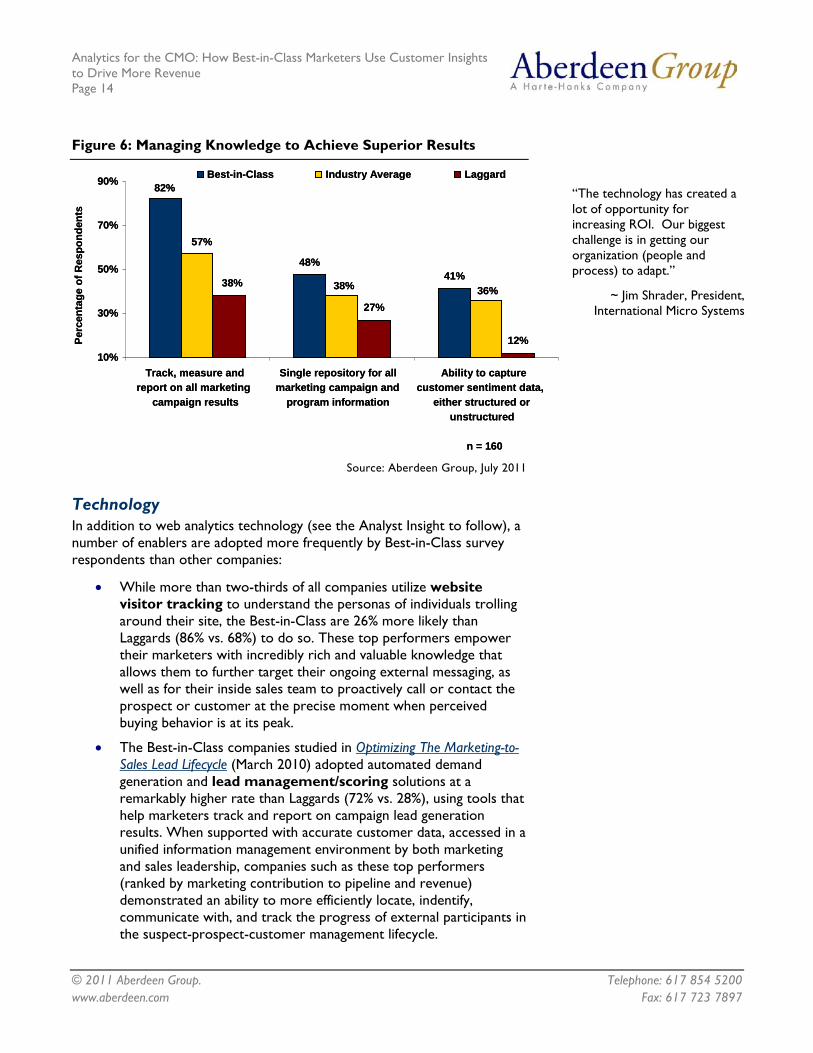
Knowledge Management Best-in-Class marketing departments are able to deliver high-quality marketing execution consistently, building on their past successes and taking rapid corrective action when necessary. The foundation of this achievement is the well-disciplined use of knowledge and data (Figure 6). Other organizations are less rigorous in both their collection of data and their use of it to drive marketing strategy and tactics, and their resulting performance has been revealed as less than impressive. One of the key concepts here that is central to successful business intelligence implementations is the creation and maintenance of a single central repository of management information. Colloquially, BI practitioners often refer to this as "a single version of the truth." As a starting point, this is a vital step in order to overcome the all too common situation of different managers having different data and hence different opinions on what should be done with it.
Analytics for the CMO: How Best-in-Class Marketers Use Customer Insights to Drive More Revenue Page 14
© 2011 Aberdeen Group. Telephone: 617 854 5200
Figure 6: Managing Knowledge to Achieve Superior Results
27%
12%
82%
48%41%
57%
38% 36%38%
10%
30%
50%
70%
90%
Track, measure andreport on all marketing
campaign results
Single repository for allmarketing campaign and
program information
Ability to capturecustomer sentiment data,
either structured orunstructured
n = 160
Perc
enta
ge o
f Res
pond
ents
Best-in-Class Industry Average Laggard
“The technology has created a lot of opportunity for increasing ROI. Our biggest challenge is in getting our organization (people and process) to adapt.”
~ Jim Shrader, President, International Micro Systems
Source: Aberdeen Group, July 2011
Technology In addition to web analytics technology (see the Analyst Insight to follow), a number of enablers are adopted more frequently by Best-in-Class survey respondents than other companies:
• While more than two-thirds of all companies utilize website visitor tracking to understand the personas of individuals trolling around their site, the Best-in-Class are 26% more likely than Laggards (86% vs. 68%) to do so. These top performers empower their marketers with incredibly rich and valuable knowledge that allows them to further target their ongoing external messaging, as well as for their inside sales team to proactively call or contact the prospect or customer at the precise moment when perceived buying behavior is at its peak.
• The Best-in-Class companies studied in Optimizing The Marketing-to-Sales Lead Lifecycle (March 2010) adopted automated demand generation and lead management/scoring solutions at a remarkably higher rate than Laggards (72% vs. 28%), using tools that help marketers track and report on campaign lead generation results. When supported with accurate customer data, accessed in a unified information management environment by both marketing and sales leadership, companies such as these top performers (ranked by marketing contribution to pipeline and revenue) demonstrated an ability to more efficiently locate, indentify, communicate with, and track the progress of external participants in the suspect-prospect-customer management lifecycle.
www.aberdeen.com Fax: 617 723 7897

Analytics for the CMO: How Best-in-Class Marketers Use Customer Insights to Drive More Revenue Page 15
© 2011 Aberdeen Group. Telephone: 617 854 5200
• Aberdeen research published in Marketing Asset Management - It's More Than Just An Image (November 2010) showcased the value of marketing content/asset management, a category of technology offerings developed to assist marketers with driving efficiency, speeding time-to-market of campaigns, and shrinking sales cycles in support of overall revenue growth. Nearly six out of 10 of the current Best-in-Class deploy this enabler, compared with fewer than a third of Laggards; the top performers benefit more from the value of creating, centralizing and managing all digital and other assets to better deliver targeted marketing content.
Aberdeen Insights — Web Analytics Technology
Occasionally it is of interest to examine, in the results of Aberdeen research among end-users, the actual lack of data provided in the context of certain questions posed to end-users. In the case of "What is the average number of clicks by your customers before they make a purchase?," the significant number of companies responding "don't know" or "don't measure" (Figure 7) was surprising. More telling, the Laggards provided one of these answers 66% more often than the Best-in-Class (83% total vs. 50% total).
Figure 7: Showcasing the Value of Knowing Your Customer
39%
28%
22%
35% 35%
44%
20%
30%
40%
50%
Don't know Don't measure
n = 160
Perc
enta
ge o
f Res
pond
ents
Best-in-Class
www.aberdeen.com Fax: 617 723 7897
Industry Average Laggard
39%
28%
22%
35% 35%
44%
20%
30%
40%
50%
Don't know Don't measure
n = 160
Perc
enta
ge o
f Res
pond
ents
Best-in-Class Industry Average Laggard
Source: Aberdeen Group, July 2011
continued

Analytics for the CMO: How Best-in-Class Marketers Use Customer Insights to Drive More Revenue Page 16
© 2011 Aberdeen Group. Telephone: 617 854 5200
Aberdeen Insights — Web Analytics Technology
Web analytics solutions are the antidote to not understanding enough of the customer's behavior, and the other data from survey respondents strongly supports other best practices around using this technology enabler. For example, 72% of the Best-in-Class utilize either a Software-as-a-Service (SaaS) or on-demand web analytics solution, either alone or in combination with licensed software, compared with 48% of other firms. The top performers also integrate additional technologies into their web analytics at far higher rates than Laggards: email marketing (72% vs. 35%), search engine optimization (59% vs. 24%), and Customer Relationship Management (CRM) at 50% vs. 35%. Finally, the Best-in-Class are three-times less likely than Laggards (11% vs. 33%) to rely solely on free web analytics solutions, preferring to include or only utilized paid products more frequently.
Performance Management The final set of corporate capabilities in which the Best-in-Class are out-adopting other companies lies in performance management, as seen in Figure 8. When it comes utilizing recognized metrics to track and evaluate the overall performance of the marketing team, it is somewhat surprising that even among the Best-in-Class, fewer than two-thirds do so, and yet far more often than other companies, these firms do acknowledge the formal need to hold their marketing leaders accountable for achieving stated goals.
Figure 8: Performance Management Capabilities by Best-in-Class
18%
64%
45%45%
25%27%
0%
15%
30%
45%
60%
75%
Key Performance Indicators (KPIs) aredefined to track overall marketing
performance
Ability to identify which marketingchannels drive offline sales
n = 160
Perc
enta
ge o
f Res
pond
ents
Best-in-Class Industry Average Laggard
18%
64%
45%45%
25%27%
0%
15%
30%
45%
60%
75%
Key Performance Indicators (KPIs) aredefined to track overall marketing
performance
Ability to identify which marketingchannels drive offline sales
n = 160
Perc
enta
ge o
f Res
pond
ents
Best-in-Class Industry Average Laggard
Source: Aberdeen Group, July 2011
www.aberdeen.com Fax: 617 723 7897

Analytics for the CMO: How Best-in-Class Marketers Use Customer Insights to Drive More Revenue Page 17
© 2011 Aberdeen Group. Telephone: 617 854 5200 www.aberdeen.com Fax: 617 723 7897
It is no coincidence that the second capability illustrated in Figure 8, supporting the ability to identify how various marketing messages drive indirect sales, is also more frequently adopted by the top performers. The connection between these two performance management capabilities lies in the age-old challenge of professional marketers: ensuring their own existence by linking measurable business results to the pre-sales activities in which they specialize. By using the technologies and practices around marketing analytics to their advantage, these practitioners are more able to show ROMI and generate continued and growing support for their own marketing budget.
Analytics for the CMO: How Best-in-Class Marketers Use Customer Insights to Drive More Revenue Page 18
© 2011 Aberdeen Group. Telephone: 617 854 5200
Chapter Three: Required Actions
Fast Facts
√ Best-in-Class companies average 7.2% year-over-year growth in marketing's contribution to closed business, compared with 0.7% among the Industry Average and a 2.7% decline for Laggards
√ Average ROMI grew YOY by 6.8% among the Best-in-Class, 3.0% for the Industry Average, and dropped by 3.5% among Laggard firms
√ Actual marketing spend showed an annual increase of 5.6% per year for the Best-in-Class, vs. 2.1% and a 2.0% decline for Average and Laggard companies
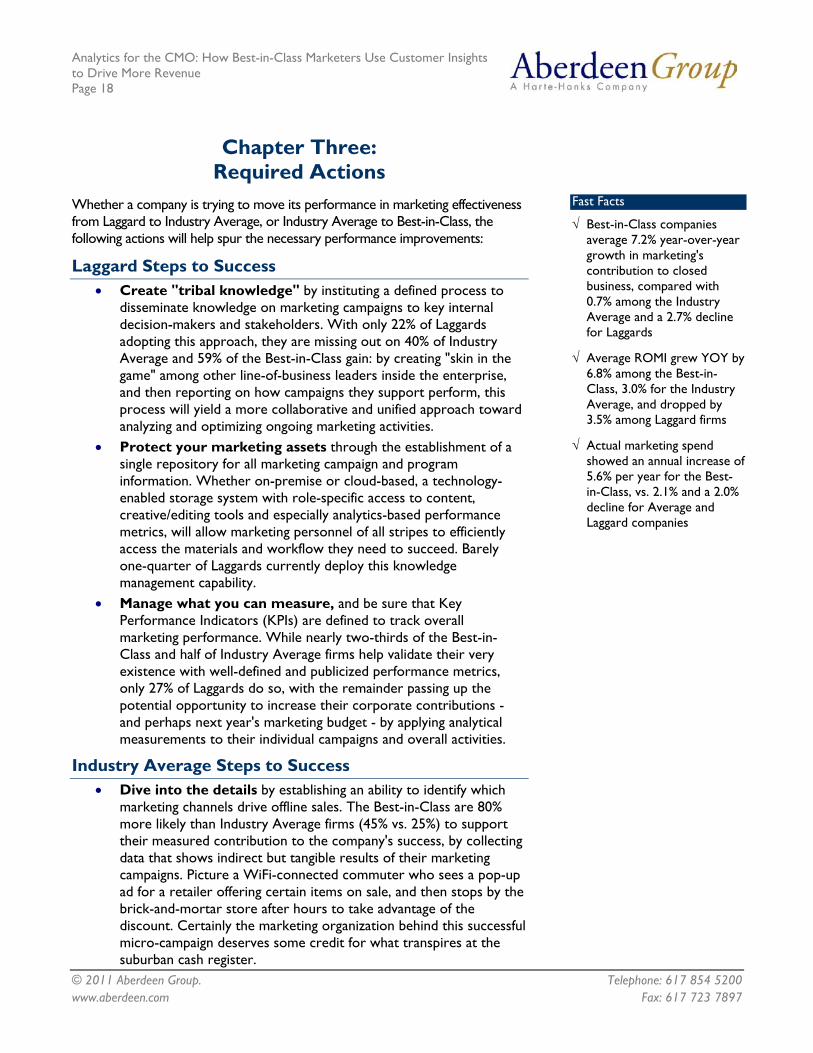
Whether a company is trying to move its performance in marketing effectiveness from Laggard to Industry Average, or Industry Average to Best-in-Class, the following actions will help spur the necessary performance improvements:
Laggard Steps to Success • Create "tribal knowledge" by instituting a defined process to
disseminate knowledge on marketing campaigns to key internal decision-makers and stakeholders. With only 22% of Laggards adopting this approach, they are missing out on 40% of Industry Average and 59% of the Best-in-Class gain: by creating "skin in the game" among other line-of-business leaders inside the enterprise, and then reporting on how campaigns they support perform, this process will yield a more collaborative and unified approach toward analyzing and optimizing ongoing marketing activities.
• Protect your marketing assets through the establishment of a single repository for all marketing campaign and program information. Whether on-premise or cloud-based, a technology-enabled storage system with role-specific access to content, creative/editing tools and especially analytics-based performance metrics, will allow marketing personnel of all stripes to efficiently access the materials and workflow they need to succeed. Barely one-quarter of Laggards currently deploy this knowledge management capability.
• Manage what you can measure, and be sure that Key Performance Indicators (KPIs) are defined to track overall marketing performance. While nearly two-thirds of the Best-in-Class and half of Industry Average firms help validate their very existence with well-defined and publicized performance metrics, only 27% of Laggards do so, with the remainder passing up the potential opportunity to increase their corporate contributions - and perhaps next year's marketing budget - by applying analytical measurements to their individual campaigns and overall activities.
Industry Average Steps to Success • Dive into the details by establishing an ability to identify which
marketing channels drive offline sales. The Best-in-Class are 80% more likely than Industry Average firms (45% vs. 25%) to support their measured contribution to the company's success, by collecting data that shows indirect but tangible results of their marketing campaigns. Picture a WiFi-connected commuter who sees a pop-up ad for a retailer offering certain items on sale, and then stops by the brick-and-mortar store after hours to take advantage of the discount. Certainly the marketing organization behind this successful micro-campaign deserves some credit for what transpires at the suburban cash register.
www.aberdeen.com Fax: 617 723 7897

Analytics for the CMO: How Best-in-Class Marketers Use Customer Insights to Drive More Revenue Page 19
© 2011 Aberdeen Group. Telephone: 617 854 5200
• Stay organized. While nearly three out of five Best-in-Class firms deploy a marketing content or asset management instance, barely a third of the Industry Average have a similar technology enabler in place. This approach makes sense from a variety of perspectives: legal protection of intellectual property, ease of access for marketing campaign owners, efficiencies for creative staff, and better workflows for production-oriented employees.
www.aberdeen.com Fax: 617 723 7897
• Keep an open-door policy by tracking, measuring and reporting on all marketing campaign results, as do 82% of Best-in-Class survey respondents. Only 57% of Industry Average firms comply, meaning that more than four out of 10 of them are flying blind, by launching their messages, offers and brand support into the market without an ability to understand whether their efforts have any impact at all.
Best-in-Class Steps to Success • Go back to the well by gaining executive support for using
customer analytics within marketing programs. If the commonly held idea is true that "it's cheaper to keep an existing customer than to find a new one," then re-marketing to a current customer base will yield retention, up-sell and cross-sell opportunities to expand the share of the customer's wallet. Fifty-nine percent (59%) of the Best-in-Class currently support this analytical initiative at the C-suite level; this is more than other companies but worth pursuing more aggressively among those that do not.
• Measure twice, cut once through enhanced processes around testing campaign content before executing on the open market. Pre-distribution analytics on both activities (opens, clicks, responses, etc.) and impact (focus groups, user-generated feedback/ratings) are effectively used by fewer than two-thirds of the Best-in-Class, and yet represent a highly impactful way to take significant guesswork out of the marketing function.
Aberdeen Insights — Summary
While the other two customer management "legs of the stool" - sales and customer service - have long been holding themselves accountable for demonstrating ROI, the marketing team within the typical enterprise organization has in some cases been late to the party. Yet no one in the department enjoys hearing, "what exactly does marketing do?" The simplest and most effective way to respond to this sort of challenge is with data, especially the kind of information that relates directly to the pocketbooks of any nay-sayers. With advanced contemporary analytics tools at their disposal, today's marketers have the opportunity to map the spend on media, staff and other resources directly to the acquisition of new customers, the retention of current accounts, the expansion of client spend, and ultimately their own net worth to the organization.
“BI tools could impact results better if all of the information we had were better coordinated; we still have too many silos of information.”
~ Director of Marketin, major BPO company
Analytics for the CMO: How Best-in-Class Marketers Use Customer Insights to Drive More Revenue Page 20
© 2011 Aberdeen Group. Telephone: 617 854 5200
Appendix A: Research Methodology
Study Focus
Responding executives, primarily in marketing management roles, completed an online survey that included questions designed to determine the following:
√ The degree to which marketing analytics is deployed in their organization and the impact it has on achieving their business goals
√ The structure, effectiveness and satisfaction with existing marketing analytics implementations
√ Current and planned use of marketing analytics to achieve desired changes in customer retention, Marketing’s contribution to Sales forecasted pipeline and sales lift from marketing programs
√ The benefits, if any, that have been derived from marketing analytics initiatives
The study aimed to identify emerging best practices for marketing analytics usage, and to provide a framework by which readers could assess their own management capabilities.
During July of 2011, Aberdeen examined the use, the experiences, and the intentions of 170 enterprises using analytics tools and technologies that impact the results from their marketing campaigns and programs.
Aberdeen supplemented this online survey effort with interviews with select survey respondents, gathering additional information on sales intelligence strategies, experiences, and results.
Responding enterprises included the following:
• Job title: The research sample included respondents with the following job titles: CEO / President (24%), EVP / SVP / VP (20%), Director (18%), Manager (12%), General Manager / Managing Director (5%) and other (21%).
• Department / function: The research sample included respondents from the following departments or functions: marketing (38%), corporate management (16%), sales and business development (15%), information technology (10%), and other (21%).
• Industry: The research sample included respondents exclusively from IT consulting and services (23%), software (16%), telecommunications equipment/services (8%), media/public relations (5%), financial services (4%), retail (4%), travel/hospitality/restaurant (4%), industrial product/equipment manufacturing (3%), computer equipment, hardware or peripherals (3%) and other (30%).
• Geography: The majority of respondents (73%) were from the Americas. Remaining respondents were from the EMEA region (16%) and Asia-Pacific (11%).
• Company size: 21% of respondents were from large enterprises (annual revenues above US $1 billion); 28% were from midsize enterprises (annual revenues between $50 million and $1 billion); and 51% of respondents were from small businesses (annual revenues of $50 million or less).
• Headcount: 33% of respondents were from large enterprises (headcount greater than 1,000 employees); 24% were from midsize enterprises (headcount between 100 and 999 employees); and 43% of respondents were from small businesses (headcount between 1 and 99 employees).
www.aberdeen.com Fax: 617 723 7897
Analytics for the CMO: How Best-in-Class Marketers Use Customer Insights to Drive More Revenue Page 21
© 2011 Aberdeen Group. Telephone: 617 854 5200
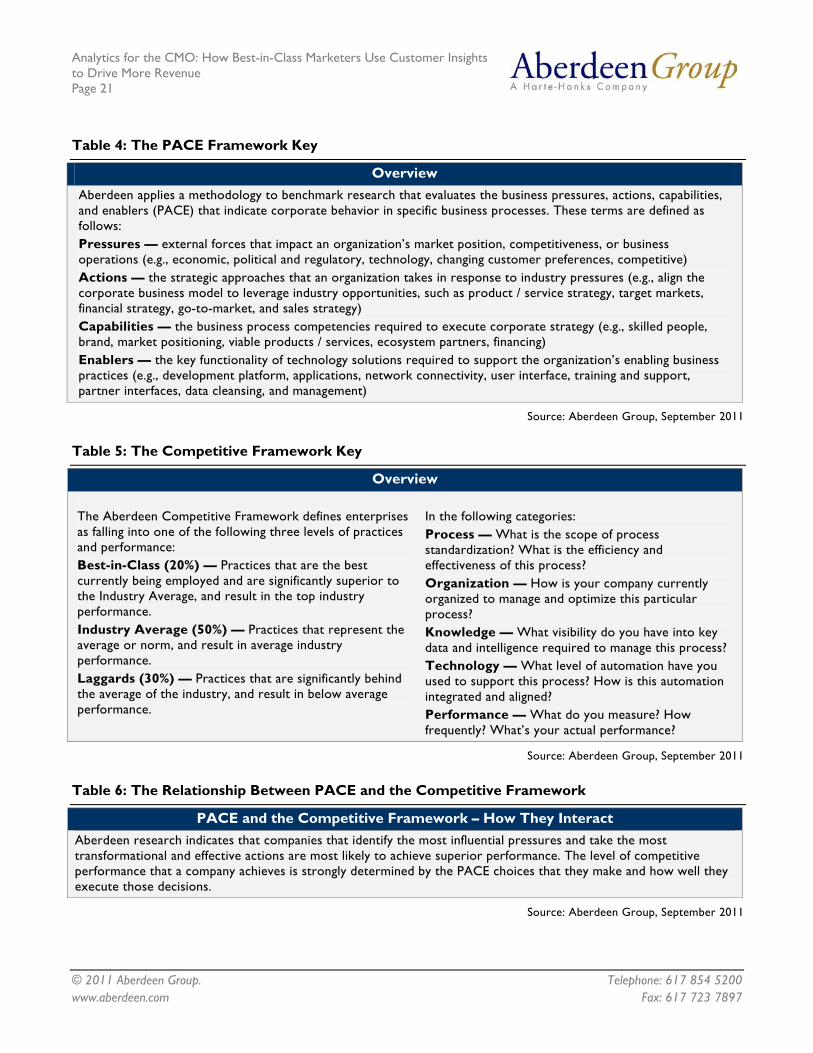
Table 4: The PACE Framework Key
Overview Aberdeen applies a methodology to benchmark research that evaluates the business pressures, actions, capabilities, and enablers (PACE) that indicate corporate behavior in specific business processes. These terms are defined as follows: Pressures — external forces that impact an organization’s market position, competitiveness, or business operations (e.g., economic, political and regulatory, technology, changing customer preferences, competitive) Actions — the strategic approaches that an organization takes in response to industry pressures (e.g., align the corporate business model to leverage industry opportunities, such as product / service strategy, target markets, financial strategy, go-to-market, and sales strategy) Capabilities — the business process competencies required to execute corporate strategy (e.g., skilled people, brand, market positioning, viable products / services, ecosystem partners, financing) Enablers — the key functionality of technology solutions required to support the organization’s enabling business practices (e.g., development platform, applications, network connectivity, user interface, training and support, partner interfaces, data cleansing, and management)
Source: Aberdeen Group, September 2011
Table 5: The Competitive Framework Key
Overview The Aberdeen Competitive Framework defines enterprises as falling into one of the following three levels of practices and performance: Best-in-Class (20%) — Practices that are the best currently being employed and are significantly superior to the Industry Average, and result in the top industry performance. Industry Average (50%) — Practices that represent the average or norm, and result in average industry performance. Laggards (30%) — Practices that are significantly behind the average of the industry, and result in below average performance.
In the following categories: Process — What is the scope of process standardization? What is the efficiency and effectiveness of this process? Organization — How is your company currently organized to manage and optimize this particular process? Knowledge — What visibility do you have into key data and intelligence required to manage this process? Technology — What level of automation have you used to support this process? How is this automation integrated and aligned? Performance — What do you measure? How frequently? What’s your actual performance?
Source: Aberdeen Group, September 2011
Table 6: The Relationship Between PACE and the Competitive Framework
PACE and the Competitive Framework – How They Interact Aberdeen research indicates that companies that identify the most influential pressures and take the most transformational and effective actions are most likely to achieve superior performance. The level of competitive performance that a company achieves is strongly determined by the PACE choices that they make and how well they execute those decisions.
Source: Aberdeen Group, September 2011
www.aberdeen.com Fax: 617 723 7897

Analytics for the CMO: How Best-in-Class Marketers Use Customer Insights to Drive More Revenue Page 22
© 2011 Aberdeen Group. Telephone: 617 854 5200 www.aberdeen.com Fax: 617 723 7897
Appendix B: Related Aberdeen Research
Related Aberdeen research that forms a companion or reference to this report includes:
• Migrating from Reports to Dashboards: Upgrading your Business Intelligence; August 2011
• "Chance Favors the Prepared Mind" - Understanding the Science of Sales Intelligence; July 2011
• Performance Management for Finance Executives: Driving Performance with Insight; July 2011
• Sales Forecasting: How Top Performers Leverage the Past, Visualize the Present, and Improve Their Future Revenue; July 2011
• The Extended Sales Enterprise: Channeling Better Results; April 2011
• Agile BI: Three Steps to Analytic Heaven; April 2011
• Performance Management - What the Mid-Market can Learn from Large Enterprises; November 2010
• Sales and Marketing Alignment: Collaboration + Cooperation = Peak Performance; September 2010
• Optimizing Lead-To-Win: Shrinking the Sales Cycle and Focusing Closers on Sealing More Deals; May 2010
• Providing a 360˚ View of the Customer: Better Service - Higher Sales; March 2010
• Predictive Analytics:The Right Tool for Tough Times; March 2010 Information on these and any other Aberdeen publications can be found at www.aberdeen.com.
Authors: Peter Ostrow, Research Director, Sales Effectiveness ([email protected])
David White, Senior Research Analyst, Business Intelligence ([email protected])
For more than two decades, Aberdeen's research has been helping corporations worldwide become Best-in-Class. Having benchmarked the performance of more than 644,000 companies, Aberdeen is uniquely positioned to provide organizations with the facts that matter — the facts that enable companies to get ahead and drive results. That's why our research is relied on by more than 2.5 million readers in over 40 countries, 90% of the Fortune 1,000, and 93% of the Technology 500.
As a Harte-Hanks Company, Aberdeen’s research provides insight and analysis to the Harte-Hanks community of local, regional, national and international marketing executives. Combined, we help our customers leverage the power of insight to deliver innovative multichannel marketing programs that drive business-changing results. For additional information, visit Aberdeen http://www.aberdeen.com or call (617) 854-5200, or to learn more about Harte-Hanks, call (800) 456-9748 or go to http://www.harte-hanks.com.
This document is the result of primary research performed by Aberdeen Group. Aberdeen Group's methodologies provide for objective fact-based research and represent the best analysis available at the time of publication. Unless otherwise noted, the entire contents of this publication are copyrighted by Aberdeen Group, Inc. and may not be reproduced, distributed, archived, or transmitted in any form or by any means without prior written consent by Aberdeen Group, Inc. (2011a)