Embed Size (px)
Citation preview
Analytics SAQL ReferenceSalesforce, Summer ’18
@salesforcedocsLast updated: July 19, 2018

© Copyright 2000–2018 salesforce.com, inc. All rights reserved. Salesforce is a registered trademark of salesforce.com, inc.,as are other names and marks. Other marks appearing herein may be trademarks of their respective owners.
CONTENTS
SAQL OVERVIEW . . . . . . . . . . . . . . . . . . . . . . . . . . . . . . . . . . . . . . . . . . . . . . . . . . 1Introduction . . . . . . . . . . . . . . . . . . . . . . . . . . . . . . . . . . . . . . . . . . . . . . . . . . . . . . . . . . 1Use SAQL in the User Interface . . . . . . . . . . . . . . . . . . . . . . . . . . . . . . . . . . . . . . . . . . . . . 3Write Your First Query . . . . . . . . . . . . . . . . . . . . . . . . . . . . . . . . . . . . . . . . . . . . . . . . . . . 5Enable SAQL Logs in the Browser . . . . . . . . . . . . . . . . . . . . . . . . . . . . . . . . . . . . . . . . . . . 6
SAQL EXAMPLES . . . . . . . . . . . . . . . . . . . . . . . . . . . . . . . . . . . . . . . . . . . . . . . . . . 7Combine Data from Multiple Datasets with cogroup . . . . . . . . . . . . . . . . . . . . . . . . . . . . . . 7Calculate Values over a Dynamic Range with Windowing . . . . . . . . . . . . . . . . . . . . . . . . . . 9Append Datasets using union . . . . . . . . . . . . . . . . . . . . . . . . . . . . . . . . . . . . . . . . . . . . 10
SAQL BASIC ELEMENTS . . . . . . . . . . . . . . . . . . . . . . . . . . . . . . . . . . . . . . . . . . . . 12Statements . . . . . . . . . . . . . . . . . . . . . . . . . . . . . . . . . . . . . . . . . . . . . . . . . . . . . . . . . 12Keywords . . . . . . . . . . . . . . . . . . . . . . . . . . . . . . . . . . . . . . . . . . . . . . . . . . . . . . . . . . 13Identifiers . . . . . . . . . . . . . . . . . . . . . . . . . . . . . . . . . . . . . . . . . . . . . . . . . . . . . . . . . . 13Number Literals . . . . . . . . . . . . . . . . . . . . . . . . . . . . . . . . . . . . . . . . . . . . . . . . . . . . . . 14String Literals . . . . . . . . . . . . . . . . . . . . . . . . . . . . . . . . . . . . . . . . . . . . . . . . . . . . . . . . 14Boolean Literals . . . . . . . . . . . . . . . . . . . . . . . . . . . . . . . . . . . . . . . . . . . . . . . . . . . . . . 14Quoted String Escape Sequences . . . . . . . . . . . . . . . . . . . . . . . . . . . . . . . . . . . . . . . . . . 14Special Characters . . . . . . . . . . . . . . . . . . . . . . . . . . . . . . . . . . . . . . . . . . . . . . . . . . . . 15Comments . . . . . . . . . . . . . . . . . . . . . . . . . . . . . . . . . . . . . . . . . . . . . . . . . . . . . . . . . 15Nulls and Nulls in Measures . . . . . . . . . . . . . . . . . . . . . . . . . . . . . . . . . . . . . . . . . . . . . . 16
SAQL OPERATORS . . . . . . . . . . . . . . . . . . . . . . . . . . . . . . . . . . . . . . . . . . . . . . . . 18Arithmetic Operators . . . . . . . . . . . . . . . . . . . . . . . . . . . . . . . . . . . . . . . . . . . . . . . . . . . 18Comparison Operators . . . . . . . . . . . . . . . . . . . . . . . . . . . . . . . . . . . . . . . . . . . . . . . . . 18String Operators . . . . . . . . . . . . . . . . . . . . . . . . . . . . . . . . . . . . . . . . . . . . . . . . . . . . . 20Logical Operators . . . . . . . . . . . . . . . . . . . . . . . . . . . . . . . . . . . . . . . . . . . . . . . . . . . . . 20case . . . . . . . . . . . . . . . . . . . . . . . . . . . . . . . . . . . . . . . . . . . . . . . . . . . . . . . . . . . . . . 21Null Operators . . . . . . . . . . . . . . . . . . . . . . . . . . . . . . . . . . . . . . . . . . . . . . . . . . . . . . . 24
SAQL STATEMENTS . . . . . . . . . . . . . . . . . . . . . . . . . . . . . . . . . . . . . . . . . . . . . . . 26load . . . . . . . . . . . . . . . . . . . . . . . . . . . . . . . . . . . . . . . . . . . . . . . . . . . . . . . . . . . . . . 26filter . . . . . . . . . . . . . . . . . . . . . . . . . . . . . . . . . . . . . . . . . . . . . . . . . . . . . . . . . . . . . . 27foreach . . . . . . . . . . . . . . . . . . . . . . . . . . . . . . . . . . . . . . . . . . . . . . . . . . . . . . . . . . . 27group and cogroup . . . . . . . . . . . . . . . . . . . . . . . . . . . . . . . . . . . . . . . . . . . . . . . . . . . 29union . . . . . . . . . . . . . . . . . . . . . . . . . . . . . . . . . . . . . . . . . . . . . . . . . . . . . . . . . . . . . 31order . . . . . . . . . . . . . . . . . . . . . . . . . . . . . . . . . . . . . . . . . . . . . . . . . . . . . . . . . . . . . 33limit . . . . . . . . . . . . . . . . . . . . . . . . . . . . . . . . . . . . . . . . . . . . . . . . . . . . . . . . . . . . . . 35
offset . . . . . . . . . . . . . . . . . . . . . . . . . . . . . . . . . . . . . . . . . . . . . . . . . . . . . . . . . . . . . 35
SAQL FUNCTIONS . . . . . . . . . . . . . . . . . . . . . . . . . . . . . . . . . . . . . . . . . . . . . . . . 37Aggregate Functions . . . . . . . . . . . . . . . . . . . . . . . . . . . . . . . . . . . . . . . . . . . . . . . . . . 37Date Functions . . . . . . . . . . . . . . . . . . . . . . . . . . . . . . . . . . . . . . . . . . . . . . . . . . . . . . . 43String Functions . . . . . . . . . . . . . . . . . . . . . . . . . . . . . . . . . . . . . . . . . . . . . . . . . . . . . . 54Math Functions . . . . . . . . . . . . . . . . . . . . . . . . . . . . . . . . . . . . . . . . . . . . . . . . . . . . . . 58Windowing Functions . . . . . . . . . . . . . . . . . . . . . . . . . . . . . . . . . . . . . . . . . . . . . . . . . . 61coalesce() . . . . . . . . . . . . . . . . . . . . . . . . . . . . . . . . . . . . . . . . . . . . . . . . . . . . . . . . . . 68
QUERY PERFORMANCE . . . . . . . . . . . . . . . . . . . . . . . . . . . . . . . . . . . . . . . . . . . 69Projection is Important . . . . . . . . . . . . . . . . . . . . . . . . . . . . . . . . . . . . . . . . . . . . . . . . . 69Grouping Order . . . . . . . . . . . . . . . . . . . . . . . . . . . . . . . . . . . . . . . . . . . . . . . . . . . . . . 70Network Traffic and Latency . . . . . . . . . . . . . . . . . . . . . . . . . . . . . . . . . . . . . . . . . . . . . . 70Redundant Filters . . . . . . . . . . . . . . . . . . . . . . . . . . . . . . . . . . . . . . . . . . . . . . . . . . . . . 71Use the ELT Process . . . . . . . . . . . . . . . . . . . . . . . . . . . . . . . . . . . . . . . . . . . . . . . . . . . . 71Multi-Value Dimensions . . . . . . . . . . . . . . . . . . . . . . . . . . . . . . . . . . . . . . . . . . . . . . . . 72Limit the use of Unique() . . . . . . . . . . . . . . . . . . . . . . . . . . . . . . . . . . . . . . . . . . . . . . . . 72
Contents
SAQL OVERVIEW
Use SAQL (Salesforce Analytics Query Language) to access data in Analytics datasets. Analytics uses SAQL behind the scenes in lenses,dashboards, and explorer to gather data for visualizations.
Developers can write SAQL to directly access Analytics data via:
• Analytics REST API
Build your own app to access and analyze Analytics data or integrate data with existing apps.
• Dashboard JSON
Create advanced dashboards. A dashboard is a curated set of charts, metrics, and tables.
Introduction
Most actions you take in Analytics result in one or more SAQL queries. Every lens, dashboard, and explorer action generates andexecutes a SAQL statement to build the data needed for the visualization.
Use SAQL in the User Interface
Use the Analytics Studio user interface to modify existing SAQL queries or write new ones. Writing SAQL queries in the user interfaceis the easiest way to get started.
Write Your First Query
Let's walk through each step of a simple SAQL query.
Enable SAQL Logs in the Browser
If you’re using Google Chrome to work with SAQL and Einstein Analytics, you can turn on SAQL logs.
SEE ALSO:
Analytics REST API Developer's Guide
Analytics Dashboard JSON Reference
Introduction
Most actions you take in Analytics result in one or more SAQL queries. Every lens, dashboard, and explorer action generates and executesa SAQL statement to build the data needed for the visualization.
Tip: SAQL is influenced by the Apache Pig Latin (pigql) syntax, but their implementations differ, and they are not compatible.
When Analytics evaluates the steps, widgets, and layouts to render a dashboard, it:
• Auto-facets the compact steps. In other words, it links different widgets that relate to each other.
• Resolves bindings and templates.
• Converts every step to a SAQL query.
The SAQL query is then sent to the query engine for execution. The resulting data is passed to the charting library, which renders it usingcorresponding widget definitions.
1
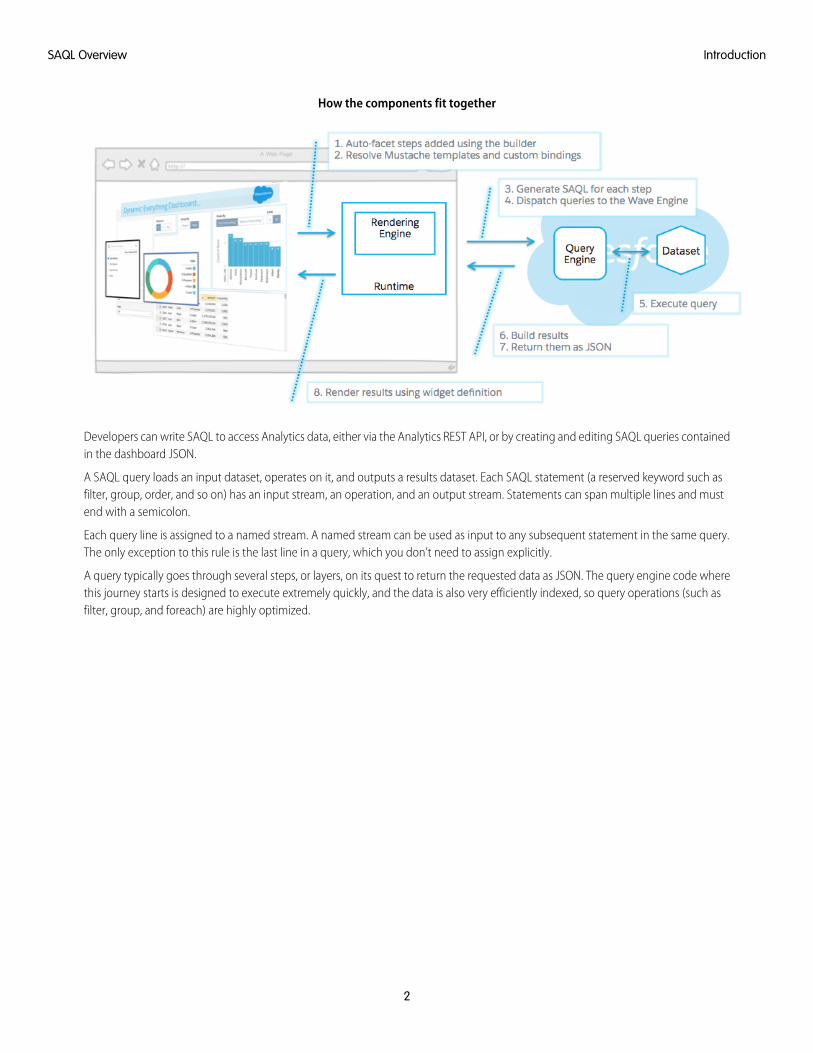
How the components fit together
Developers can write SAQL to access Analytics data, either via the Analytics REST API, or by creating and editing SAQL queries containedin the dashboard JSON.
A SAQL query loads an input dataset, operates on it, and outputs a results dataset. Each SAQL statement (a reserved keyword such asfilter, group, order, and so on) has an input stream, an operation, and an output stream. Statements can span multiple lines and mustend with a semicolon.
Each query line is assigned to a named stream. A named stream can be used as input to any subsequent statement in the same query.The only exception to this rule is the last line in a query, which you don’t need to assign explicitly.
A query typically goes through several steps, or layers, on its quest to return the requested data as JSON. The query engine code wherethis journey starts is designed to execute extremely quickly, and the data is also very efficiently indexed, so query operations (such asfilter, group, and foreach) are highly optimized.
2
IntroductionSAQL Overview
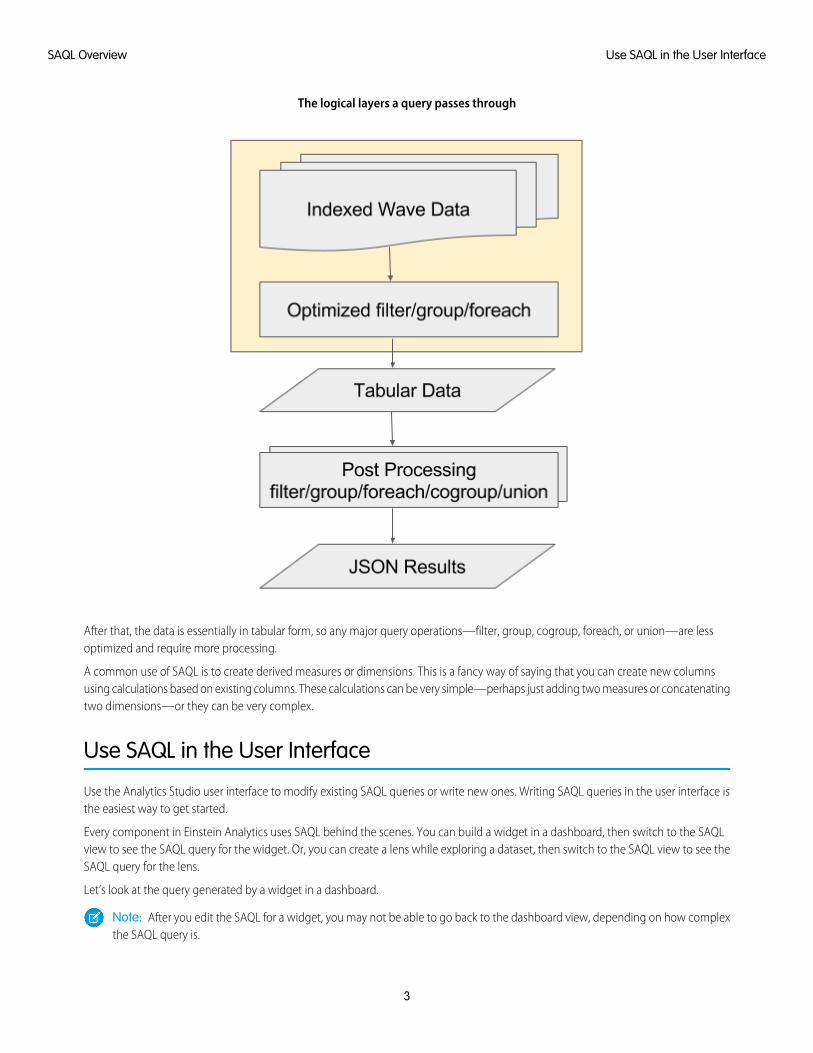
The logical layers a query passes through
After that, the data is essentially in tabular form, so any major query operations—filter, group, cogroup, foreach, or union—are lessoptimized and require more processing.
A common use of SAQL is to create derived measures or dimensions. This is a fancy way of saying that you can create new columnsusing calculations based on existing columns. These calculations can be very simple—perhaps just adding two measures or concatenatingtwo dimensions—or they can be very complex.
Use SAQL in the User Interface
Use the Analytics Studio user interface to modify existing SAQL queries or write new ones. Writing SAQL queries in the user interface isthe easiest way to get started.
Every component in Einstein Analytics uses SAQL behind the scenes. You can build a widget in a dashboard, then switch to the SAQLview to see the SAQL query for the widget. Or, you can create a lens while exploring a dataset, then switch to the SAQL view to see theSAQL query for the lens.
Let’s look at the query generated by a widget in a dashboard.
Note: After you edit the SAQL for a widget, you may not be able to go back to the dashboard view, depending on how complexthe SAQL query is.
3
Use SAQL in the User InterfaceSAQL Overview
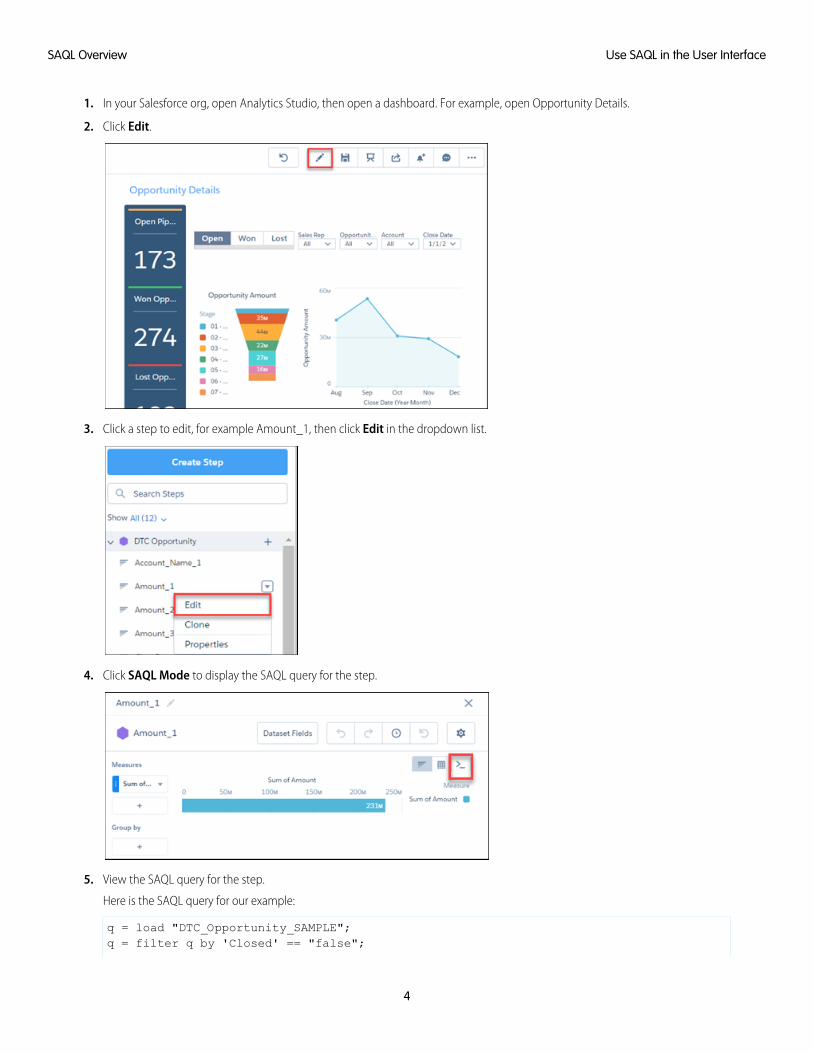
1. In your Salesforce org, open Analytics Studio, then open a dashboard. For example, open Opportunity Details.
2. Click Edit.
3. Click a step to edit, for example Amount_1, then click Edit in the dropdown list.
4. Click SAQL Mode to display the SAQL query for the step.
5. View the SAQL query for the step.
Here is the SAQL query for our example:
q = load "DTC_Opportunity_SAMPLE";q = filter q by 'Closed' == "false";
4
Use SAQL in the User InterfaceSAQL Overview
q = group q by all;q = foreach q generate sum('Amount') as 'sum_Amount';q = limit q 2000;
6. Edit the query, then click Run Query to run the new query. For example, you could change the sum to average.
Write Your First Query
Let's walk through each step of a simple SAQL query.
We’ll create a new dashboard in an Einstein Analytics org. Then we’ll add a simple chart and look at the resulting SAQL.
Note: These steps assume you are using the sample Salesforce Developer org, which includes sample datasets. If you are usinga different org, you can still follow the same general steps with your own dataset.
1. In your Einstein Analytics org, create a new dashboard:
a. Click Create.
b. Click Dashboard.
2. In the window Choose a dashboard template, click Blank Dashboard, then click Continue.
3. Drag a chart widget to the dashboard canvas.
4. In the chart widget, click Chart, then select DTC Opportunity dataset.
5. Click the SAQL Mode button to launch the SAQL editor.
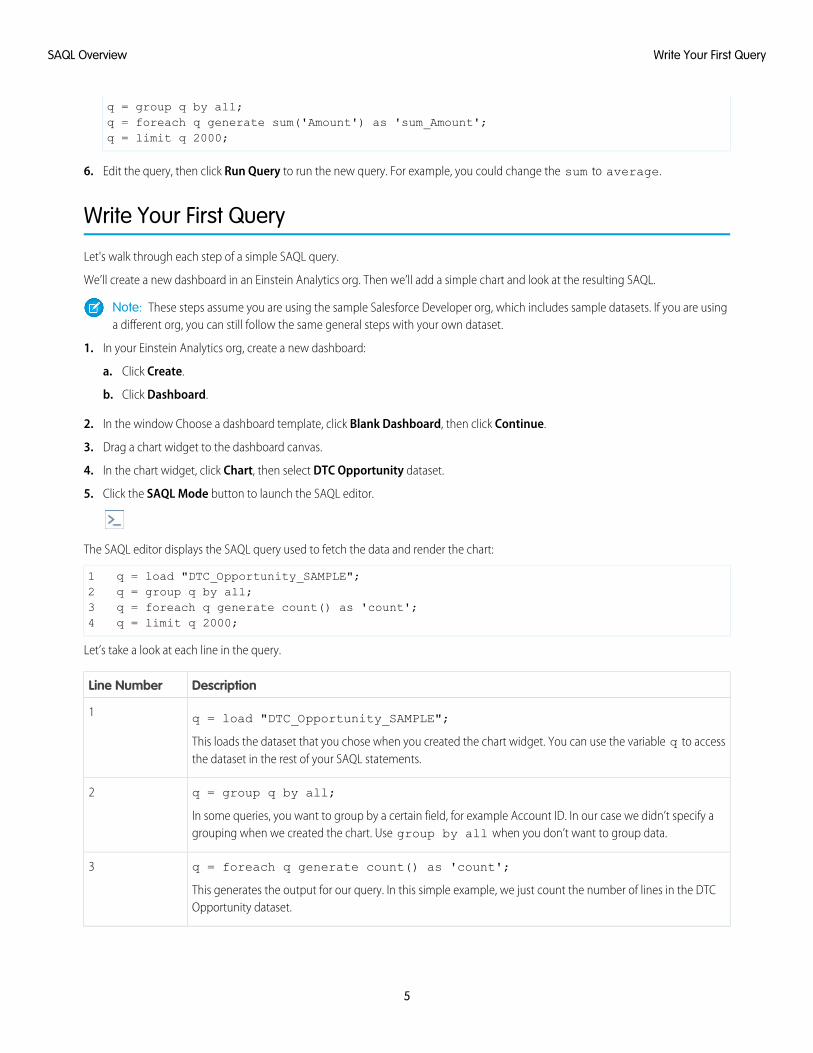
The SAQL editor displays the SAQL query used to fetch the data and render the chart:
1 q = load "DTC_Opportunity_SAMPLE";2 q = group q by all;3 q = foreach q generate count() as 'count';4 q = limit q 2000;
Let’s take a look at each line in the query.
DescriptionLine Number
q = load "DTC_Opportunity_SAMPLE";1
This loads the dataset that you chose when you created the chart widget. You can use the variable q to accessthe dataset in the rest of your SAQL statements.
q = group q by all;
In some queries, you want to group by a certain field, for example Account ID. In our case we didn’t specify agrouping when we created the chart. Use group by all when you don’t want to group data.
2
q = foreach q generate count() as 'count';
This generates the output for our query. In this simple example, we just count the number of lines in the DTCOpportunity dataset.
3
5
Write Your First QuerySAQL Overview
DescriptionLine Number
q = limit q 2000
This limits the number of results that are returned to 2000. Limiting the number of results can improve performance.However if you want q to contain more than 2000 results, you can increase this number.
4
You can click Back to go back to the chart. You can use the UI to make modifications to the chart, then view the resulting SAQL.
Enable SAQL Logs in the Browser
If you’re using Google Chrome to work with SAQL and Einstein Analytics, you can turn on SAQL logs.
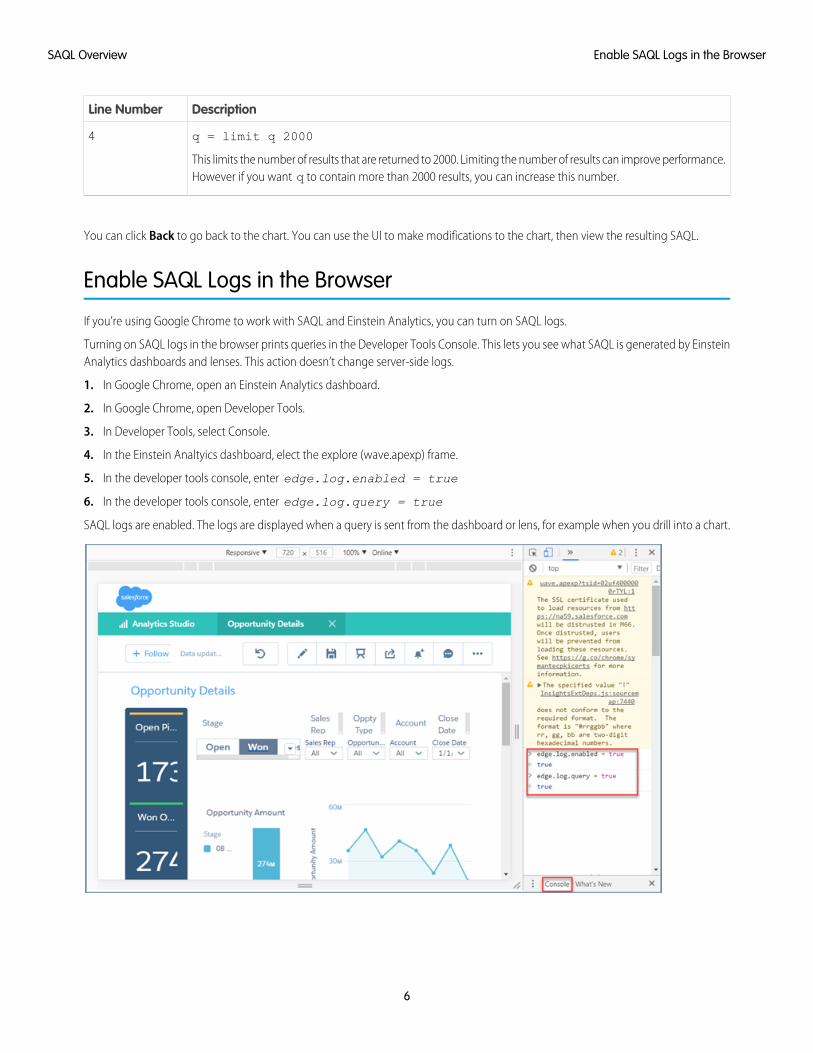
Turning on SAQL logs in the browser prints queries in the Developer Tools Console. This lets you see what SAQL is generated by EinsteinAnalytics dashboards and lenses. This action doesn’t change server-side logs.
1. In Google Chrome, open an Einstein Analytics dashboard.
2. In Google Chrome, open Developer Tools.
3. In Developer Tools, select Console.
4. In the Einstein Analtyics dashboard, elect the explore (wave.apexp) frame.
5. In the developer tools console, enter edge.log.enabled = true
6. In the developer tools console, enter edge.log.query = true
SAQL logs are enabled. The logs are displayed when a query is sent from the dashboard or lens, for example when you drill into a chart.
6
Enable SAQL Logs in the BrowserSAQL Overview
SAQL EXAMPLES
These hands-on SAQL examples walk you through writing a query to retrieve data
Combine Data from Multiple Datasets with cogroup
You can combine data from two or more data streams into a single data stream using cogroup. The data streams must have atleast one common field.
Calculate Values over a Dynamic Range with Windowing
Windowing functions perform calculations over a dynamic range. You can use time ranges like year to date to answer questionssuch as “what is the running total of deals for this year?” You can also calculate partial totals, either for specific segments of data orspecific time windows.
Append Datasets using union
You can append data from two or more data streams into a single data stream using union. The data streams must have the samefield names and structure.
Combine Data from Multiple Datasets with cogroup
You can combine data from two or more data streams into a single data stream using cogroup. The data streams must have at leastone common field.
Cogroup is similar to relational database joins, but with some important differences. Unlike a relational database join, in a cogroupthe datasets are grouped first, and then the groups are joined.
This example combines meeting information with account information.
Suppose that you want to understand how much time your reps spend meeting with each account. Is there a relationship betweenspending more time and winning an account? Are some reps spending much more or much less time than average? The first step inanswering your questions is to combine meeting data with account data using cogroup.
Suppose that you have a dataset of meeting information from the Salesforce Event object. In this example, your reps have had sixmeetings with four different companies. The Meetings dataset has a MeetingDuration column, which contains the meeting duration inhours.
7
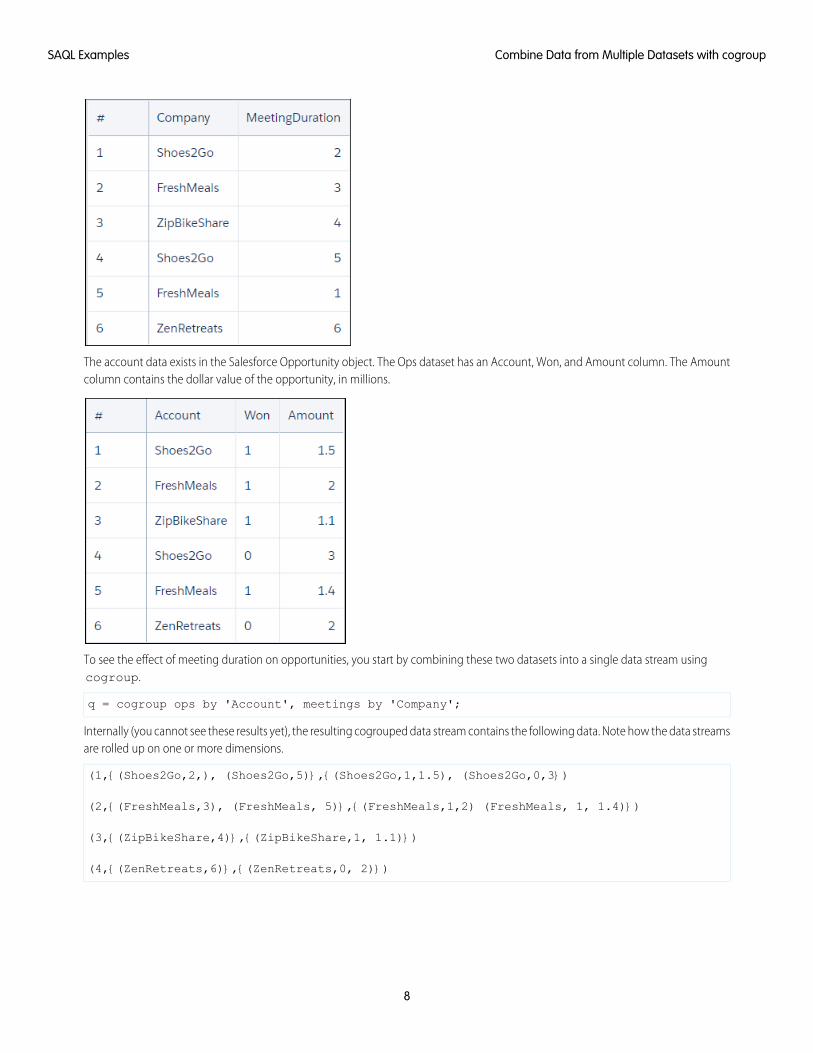
The account data exists in the Salesforce Opportunity object. The Ops dataset has an Account, Won, and Amount column. The Amountcolumn contains the dollar value of the opportunity, in millions.
To see the effect of meeting duration on opportunities, you start by combining these two datasets into a single data stream usingcogroup.
q = cogroup ops by 'Account', meetings by 'Company';
Internally (you cannot see these results yet), the resulting cogrouped data stream contains the following data. Note how the data streamsare rolled up on one or more dimensions.
(1,{(Shoes2Go,2,), (Shoes2Go,5)},{(Shoes2Go,1,1.5), (Shoes2Go,0,3})
(2,{(FreshMeals,3), (FreshMeals, 5)},{(FreshMeals,1,2) (FreshMeals, 1, 1.4)})
(3,{(ZipBikeShare,4)},{(ZipBikeShare,1, 1.1)})
(4,{(ZenRetreats,6)},{(ZenRetreats,0, 2)})
8
Combine Data from Multiple Datasets with cogroupSAQL Examples
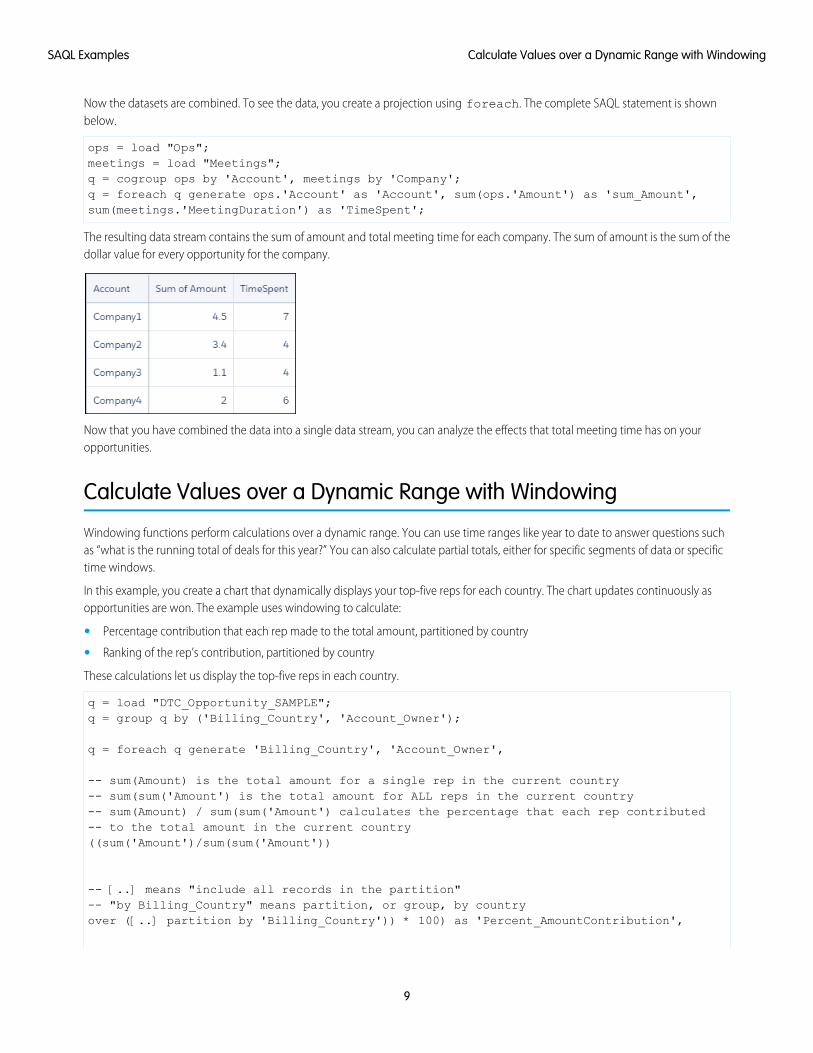
Now the datasets are combined. To see the data, you create a projection using foreach. The complete SAQL statement is shownbelow.
ops = load "Ops";meetings = load "Meetings";q = cogroup ops by 'Account', meetings by 'Company';q = foreach q generate ops.'Account' as 'Account', sum(ops.'Amount') as 'sum_Amount',sum(meetings.'MeetingDuration') as 'TimeSpent';
The resulting data stream contains the sum of amount and total meeting time for each company. The sum of amount is the sum of thedollar value for every opportunity for the company.
Now that you have combined the data into a single data stream, you can analyze the effects that total meeting time has on youropportunities.
Calculate Values over a Dynamic Range with Windowing
Windowing functions perform calculations over a dynamic range. You can use time ranges like year to date to answer questions suchas “what is the running total of deals for this year?” You can also calculate partial totals, either for specific segments of data or specifictime windows.
In this example, you create a chart that dynamically displays your top-five reps for each country. The chart updates continuously asopportunities are won. The example uses windowing to calculate:
• Percentage contribution that each rep made to the total amount, partitioned by country
• Ranking of the rep’s contribution, partitioned by country
These calculations let us display the top-five reps in each country.
q = load "DTC_Opportunity_SAMPLE";q = group q by ('Billing_Country', 'Account_Owner');
q = foreach q generate 'Billing_Country', 'Account_Owner',
-- sum(Amount) is the total amount for a single rep in the current country-- sum(sum('Amount') is the total amount for ALL reps in the current country-- sum(Amount) / sum(sum('Amount') calculates the percentage that each rep contributed-- to the total amount in the current country((sum('Amount')/sum(sum('Amount'))
-- [..] means "include all records in the partition"-- "by Billing_Country" means partition, or group, by countryover ([..] partition by 'Billing_Country')) * 100) as 'Percent_AmountContribution',
9
Calculate Values over a Dynamic Range with WindowingSAQL Examples
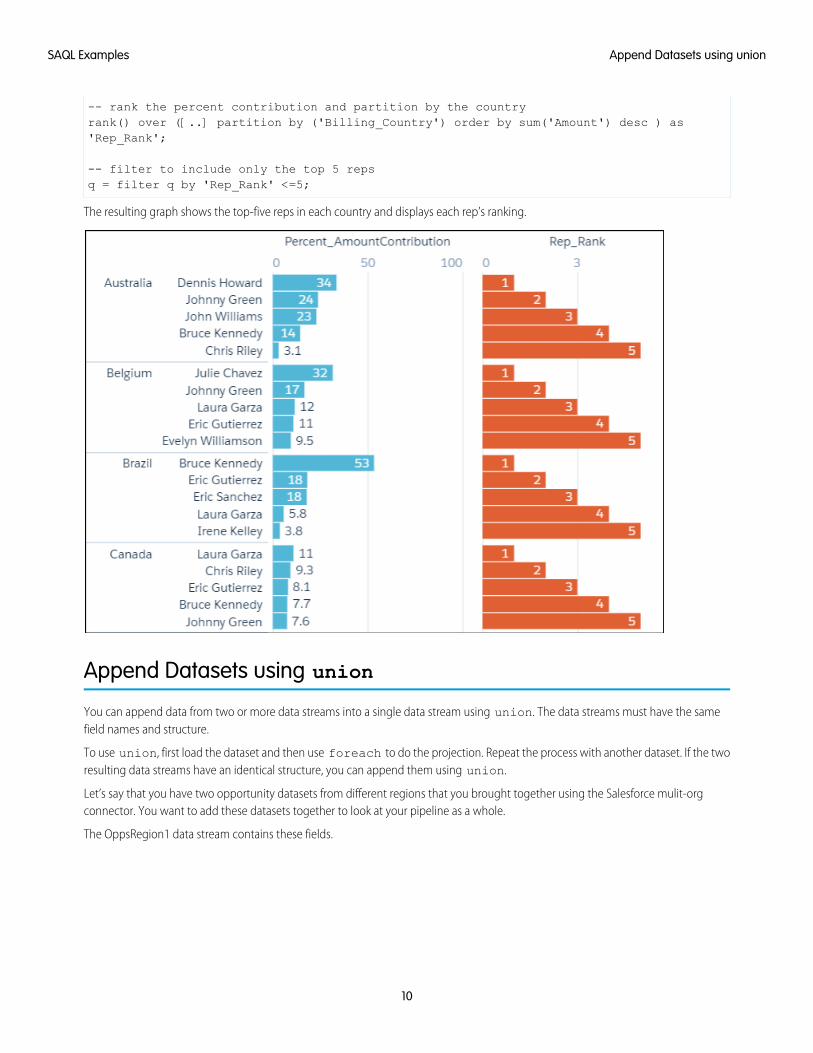
-- rank the percent contribution and partition by the countryrank() over ([..] partition by ('Billing_Country') order by sum('Amount') desc ) as'Rep_Rank';
-- filter to include only the top 5 repsq = filter q by 'Rep_Rank' <=5;
The resulting graph shows the top-five reps in each country and displays each rep’s ranking.
Append Datasets using union
You can append data from two or more data streams into a single data stream using union. The data streams must have the samefield names and structure.
To use union, first load the dataset and then use foreach to do the projection. Repeat the process with another dataset. If the tworesulting data streams have an identical structure, you can append them using union.
Let’s say that you have two opportunity datasets from different regions that you brought together using the Salesforce mulit-orgconnector. You want to add these datasets together to look at your pipeline as a whole.
The OppsRegion1 data stream contains these fields.
10
Append Datasets using unionSAQL Examples
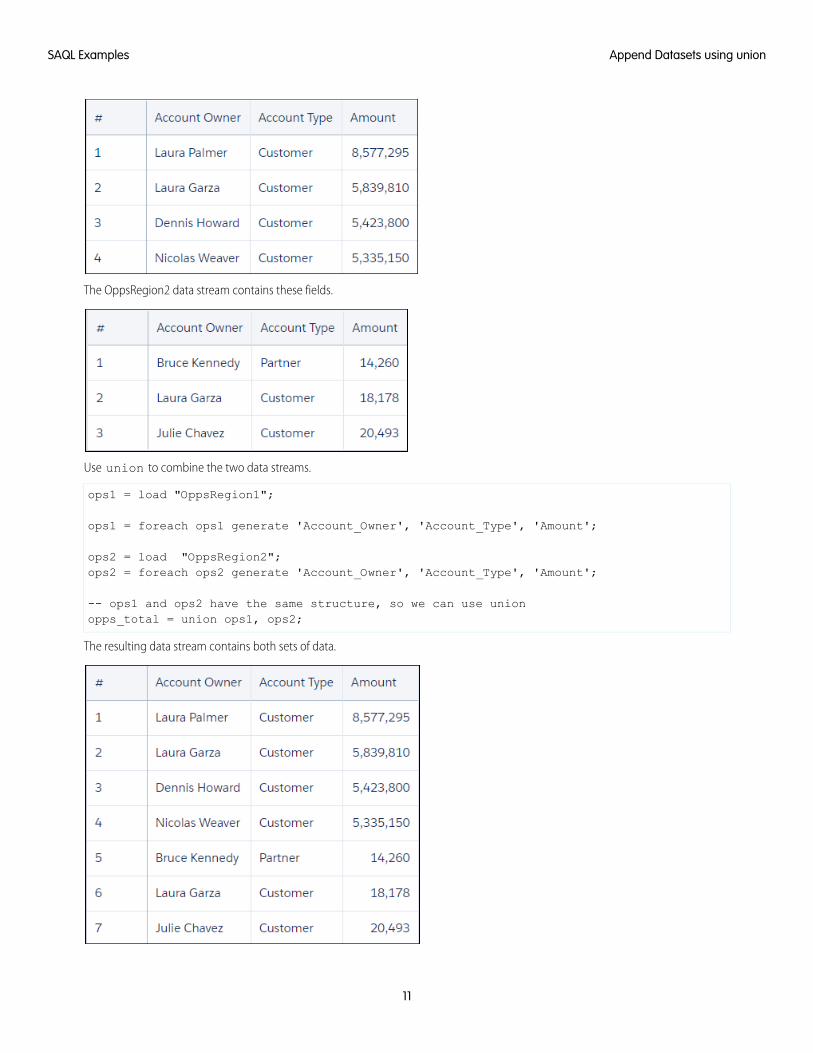
The OppsRegion2 data stream contains these fields.
Use union to combine the two data streams.
ops1 = load "OppsRegion1";
ops1 = foreach ops1 generate 'Account_Owner', 'Account_Type', 'Amount';
ops2 = load "OppsRegion2";ops2 = foreach ops2 generate 'Account_Owner', 'Account_Type', 'Amount';
-- ops1 and ops2 have the same structure, so we can use unionopps_total = union ops1, ops2;
The resulting data stream contains both sets of data.
11
Append Datasets using unionSAQL Examples
SAQL BASIC ELEMENTS
Basic elements are the building blocks of your SAQL query.
Statements
A SAQL query loads input data, operates on it, and outputs the result data. A query is made up of statements. Each SAQL statementhas an input stream, an operation, and an output stream.
Keywords
Keywords are case-sensitive and must be lowercase.
Identifiers
SAQL identifiers are case-sensitive. They can be enclosed in single quotation marks (') or no quotation marks.
Number Literals
A number literal represents a number in your script.
String Literals
A string is a set of characters inside double quotes (").
Boolean Literals
A boolean literal represents true or false (yes or no) in your script.
Quoted String Escape Sequences
Strings can be escaped with the backslash character.
Special Characters
Certain characters have special meanings in SAQL.
Comments
Two sequential hyphens (--) indicate the beginning of a single-line comment in SAQL.
Nulls and Nulls in Measures
In most contexts, SAQL allows the use of null anywhere a constant string or number would appear. SAQL also supports use of nullmeasures.
Statements
A SAQL query loads input data, operates on it, and outputs the result data. A query is made up of statements. Each SAQL statement hasan input stream, an operation, and an output stream.
A statement is made up of keywords (such as filter, group, and order), identifiers, literals, and special characters. Statementscan span multiple lines and must end with a semicolon.
Assign each query line to an identifier called a stream. The only exception to this rule is the last line in a query, which you don’t need toassign explicitly.
The output stream is on the left side of the = operator and the input stream is on the right side of the = operator.
12
Example: Each of the lines in this SAQL query is a SAQL statement:
q = load "0Fcc00000004DI1CAM/0Fd500000004F4sCAE";q = group q by all;q = foreach q generate count() as 'count', unique('OL.Helpful') as 'unique_OL.Helpful';limit q 2000;
SAQL is compositional—you can chain statements together to operate on data sequentially. The order of SAQL statements is enforcedaccording to how the operations in the statements change the results of a query.
The statement order rules:
• The order of filter and order can be swapped because it doesn't change the results.
• offset must be after filter and order
• offset must be before limit
• There can be no more than 1 offset statement after a foreach statement.
Tip: SAQL is influenced by the Pig Latin programming language, but their implementations differ and they aren’t compatible.
SEE ALSO:
filter
foreach
limit
offset
order
Keywords
Keywords are case-sensitive and must be lowercase.
Identifiers
SAQL identifiers are case-sensitive. They can be enclosed in single quotation marks (') or no quotation marks.
Quoted identifiers can contain any character that a string can contain.
Unquoted identifiers can’t be a reserved words and must start with a letter (A to Z or a to z) or an underscore. Subsequent characterscan be letters, numbers, or underscores. Unquoted identifiers can’t contain spaces.
This example uses valid syntax:
accounts = load "0Fbxx000000002qCAA/0Fcxx000000002WCAQ";opps = load "0Fcyy000000002qCAA/0Fcyy000000002WCAQ";c = group accounts by 'Year', opps by 'Year';d = foreach c generate opps.Year as 'Year';e = filter d by Year == "2002";
In the following example, the code in the third line throws an error:
accounts = load "0Fbxx000000002qCAA/0Fcxx000000002WCAQ";opps = load "0Fcyy000000002qCAA/0Fcyy000000002WCAQ";
13
KeywordsSAQL Basic Elements
c = group accounts by "Year", opps by "Year";d = foreach c generate opps.Year as 'Year';e = filter d by Year == "2002";
Note: A set of characters in double quotes is treated as a string rather than as an identifier.
Number Literals
A number literal represents a number in your script.
Some examples of number literals are 16 and 3.14159. You can’t explicitly assign a type (for example, integer or floating point) to anumber literal. Scientific E notation isn’t supported.
The responses to queries are in JSON. Therefore, the returned numeric field is a “number” class.
String Literals
A string is a set of characters inside double quotes (").
Example: "This is a string."
This example uses valid syntax:
accounts = load "0Fbxx000000002qCAA/0Fcxx000000002WCAQ";opps = load "0Fcyy000000002qCAA/0Fcyy000000002WCAQ";c = group accounts by 'Year', opps by 'Year';d = foreach c generate opps.Year as 'Year';e = filter d by Year == "2002";
Note: Identifiers are either unquoted or enclosed in single quotation marks.
Boolean Literals
A boolean literal represents true or false (yes or no) in your script.
Boolean literals true and false are supported in SAQL.
Quoted String Escape Sequences
Strings can be escaped with the backslash character.
You can use the following string escape sequences:
MeaningSequence
New line\n
Carriage return\r
Tab\t
14
Number LiteralsSAQL Basic Elements
MeaningSequence
One single-quote character\'
One double-quote character\"
One backslash character\\
Special Characters
Certain characters have special meanings in SAQL.
DescriptionNameCharacter
Used to terminate statements.Semicolon;
Used to quote identifiers.Single quote'
Used to quote strings.Double quote"
Used for function calls, to enforce precedence, for order clauses, and to groupexpressions. Parentheses are mandatory when you’re defining more than one group ororder field.
Parentheses()
Used to denote arrays. For example, this is an array of strings:Brackets[]
[ "this", "is", "a", "string", "array" ]
Also used for referencing a particular member of an object. For example,em['miles'], which is the same as em.miles.
Used for referencing a particular member of an object. For example, em.miles, whichis the same as em['miles'].
Period.
Used to explicitly specify the dataset that a measure or dimension belongs to, by placingit between a dataset name and a column name. Using two colons is the same as usinga period (.) between names. For example:
Two colons::
data = foreach data generate left::airline as airline
Used to separate a range of values. For example:Two periods..
c = filter b by "the_date" in["2011-01-01".."2011-01-31"];
Comments
Two sequential hyphens (--) indicate the beginning of a single-line comment in SAQL.
15
Special CharactersSAQL Basic Elements
You can put a comment on its own line:
--Load a data stream.a = load "myData";
You can put a comment at the end of a line:
a = load "myData"; --Load a data stream.
You can comment out a SAQL statement:
--The following line is commented out:--a = load "myData";
Nulls and Nulls in Measures
In most contexts, SAQL allows the use of null anywhere a constant string or number would appear. SAQL also supports use of nullmeasures.
Using Nulls In SAQLYou can specify a null constant almost anywhere a constant string or number can appear in SAQL, with the following exceptions andclarifications.
Typing
null is not typed. It is inferred from context. For example, null + 4 is a number. A SAQL syntax error will be generated when a typecannot be infered.
Filters
When a filter expression evaluates to null, the row is filtered out.
• Lists
foo in [null, "bar"] is handled like foo == null or foo == "bar".
• Ranges
filter q by dim in [null.."myvalue"] is handled as (dim>=null and dim<=7)
Unsupported
null is not supported in the following contexts:
• Offset
• Limit
• dateRelative
• dateRange
• Windowing range
• Trim (second argument)
Null Values in MeasuresMeasures in Analytics are dataset columns that contain numerical values. Analytics supports null values in measures.
16
Nulls and Nulls in MeasuresSAQL Basic Elements
Note: If null measure handling is not enabled in your org, it can be enabled by your admin.
Null measure handling lets customers distinguish between null and non-null—for example, the number 0—values in their numericaldata. SAQL support for null measures facilitates this customer preference; for example, when using aggregation, comparison, and mathfunctions, and for order by or group by clauses.
When you create or update a dataset, for example through your dataflow or a CSV upload, any blank measure values in your data arereplaced with specific values. Analytics uses the default values specified in your dataflow or CSV metadata file to replace blank values.
Replacing blank values with zeros can be problematic for a number of reasons. Take the example of data with customer satisfactionscores, where some customers have not responded. Calculated values such as average and minimum are correct in the source data, butwhen blank values are replaced with zeros when the dataset is created, the resulting calculations are incorrect.
Null measure handling lets you specify defaults using the special "null" value in your dataflows and CSV metadata files. When no defaultvalue is specified, Analytics replaces blanks with null values.
For more information on null measure handling and how to set it up, see the Analytics Data Integration Guide.
17
Nulls and Nulls in MeasuresSAQL Basic Elements
SAQL OPERATORS
Use operators to perform mathematical calculations or comparisons.
Arithmetic Operators
Use arithmetic operators to perform addition, subtraction, multiplication, division, and modulo operations.
Comparison Operators
Use comparison operators to compare values.
String Operators
To concatenate strings, use the plus sign (+).
Logical Operators
Use logical operators to perform AND, OR, and NOT operations.
case
Use the SAQL case operator within a foreach statement to create logic that chooses between conditions. The case operatorsupports two syntax forms: searched case expression and simple case expression.
Null Operators
Use null operators to test whether a value is null.
Arithmetic Operators
Use arithmetic operators to perform addition, subtraction, multiplication, division, and modulo operations.
DescriptionOperator
Plus+
Minus-
Multiplication*
Division/
Modulo%
Comparison Operators
Use comparison operators to compare values.
Comparisons are defined for values of the same type only. For example, strings can be compared with strings and numbers comparedwith numbers.
18
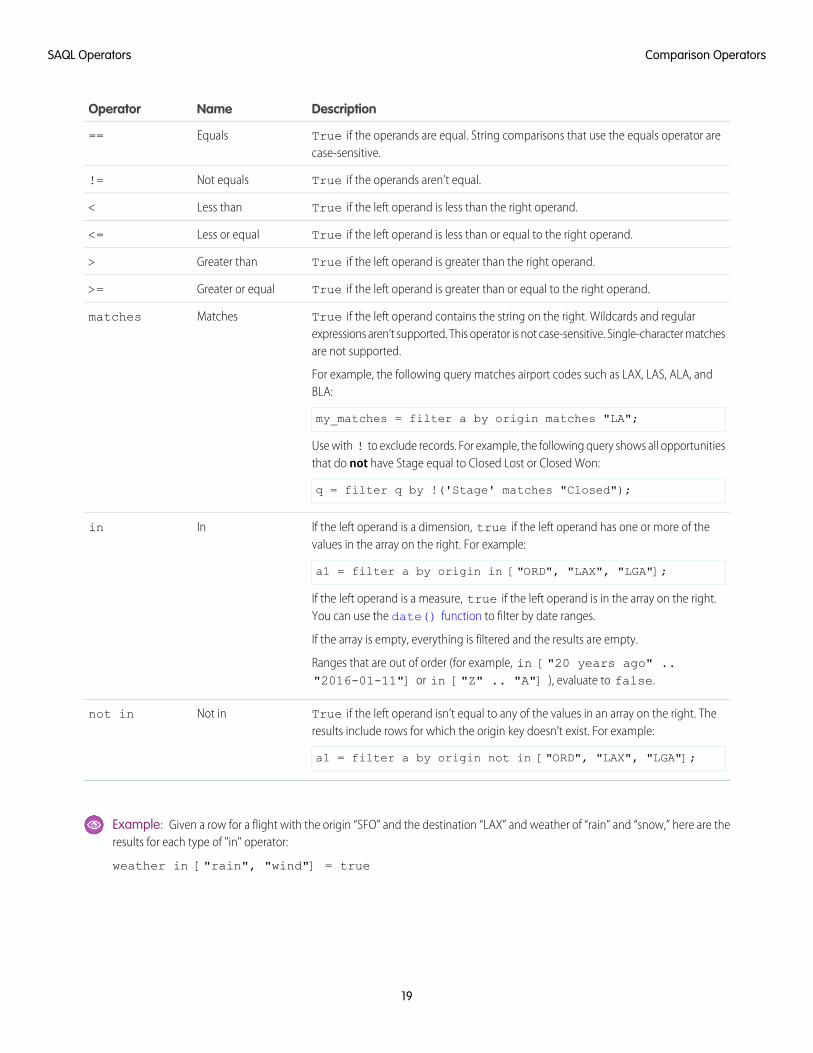
DescriptionNameOperator
True if the operands are equal. String comparisons that use the equals operator arecase-sensitive.
Equals==
True if the operands aren’t equal.Not equals!=
True if the left operand is less than the right operand.Less than<
True if the left operand is less than or equal to the right operand.Less or equal<=
True if the left operand is greater than the right operand.Greater than>
True if the left operand is greater than or equal to the right operand.Greater or equal>=
True if the left operand contains the string on the right. Wildcards and regularexpressions aren’t supported. This operator is not case-sensitive. Single-character matchesare not supported.
For example, the following query matches airport codes such as LAX, LAS, ALA, andBLA:
my_matches = filter a by origin matches "LA";
Matchesmatches
Use with ! to exclude records. For example, the following query shows all opportunitiesthat do not have Stage equal to Closed Lost or Closed Won:
q = filter q by !('Stage' matches "Closed");
If the left operand is a dimension, true if the left operand has one or more of thevalues in the array on the right. For example:
a1 = filter a by origin in ["ORD", "LAX", "LGA"];
Inin
If the left operand is a measure, true if the left operand is in the array on the right.You can use the date() function to filter by date ranges.
If the array is empty, everything is filtered and the results are empty.
Ranges that are out of order (for example, in ["20 years ago" .."2016-01-11"] or in ["Z" .. "A"] ), evaluate to false.
True if the left operand isn’t equal to any of the values in an array on the right. Theresults include rows for which the origin key doesn’t exist. For example:
a1 = filter a by origin not in ["ORD", "LAX", "LGA"];
Not innot in
Example: Given a row for a flight with the origin “SFO” and the destination “LAX” and weather of “rain” and “snow,” here are theresults for each type of "in" operator:
weather in ["rain", "wind"] = true
19
Comparison OperatorsSAQL Operators
weather not in ["rain", "wind"] = false
SEE ALSO:
filter
String Operators
To concatenate strings, use the plus sign (+).
DescriptionOperator
Concatenate+
Example: To combine the year, month, and day into a value that’s called CreatedDate:
q = foreach q generate Id as Id, Year + "-" + Month + "-" + Day as CreatedDate;
Logical Operators
Use logical operators to perform AND, OR, and NOT operations.
Logical operators can return true, false, or null.
DescriptionNameOperator
See table.Logical AND&& (and)
See table.Logical OR|| (or)
See table.Logical NOT! (not)
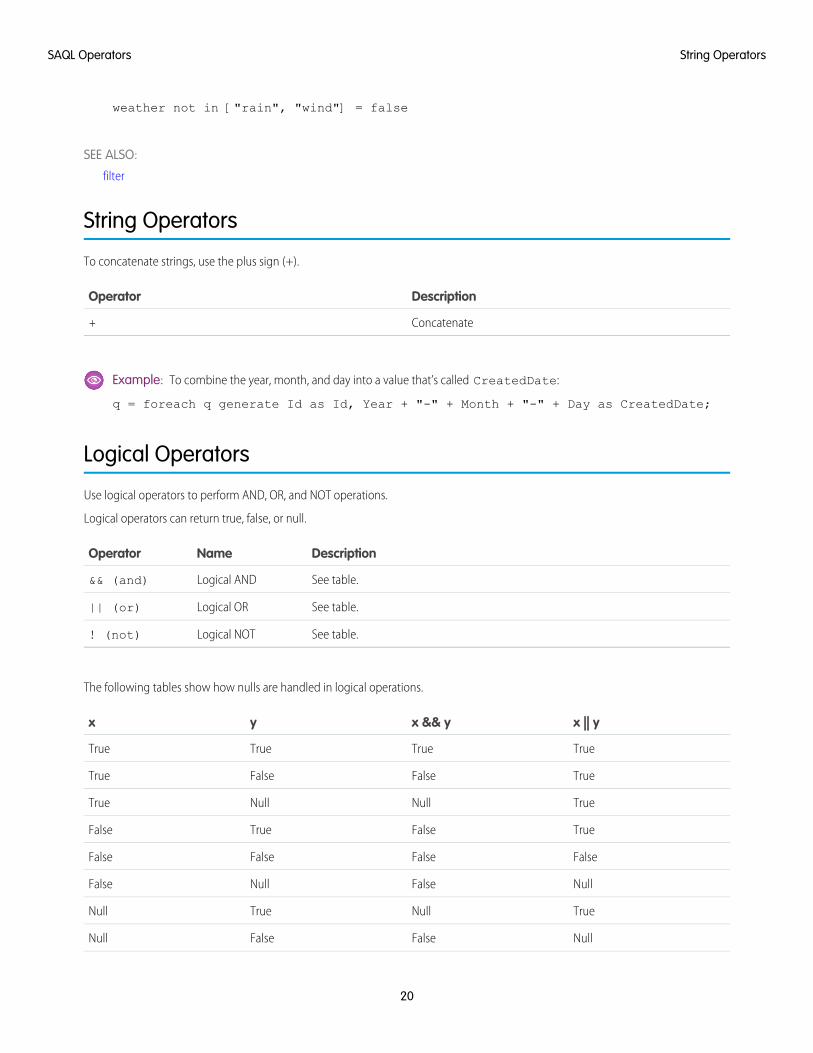
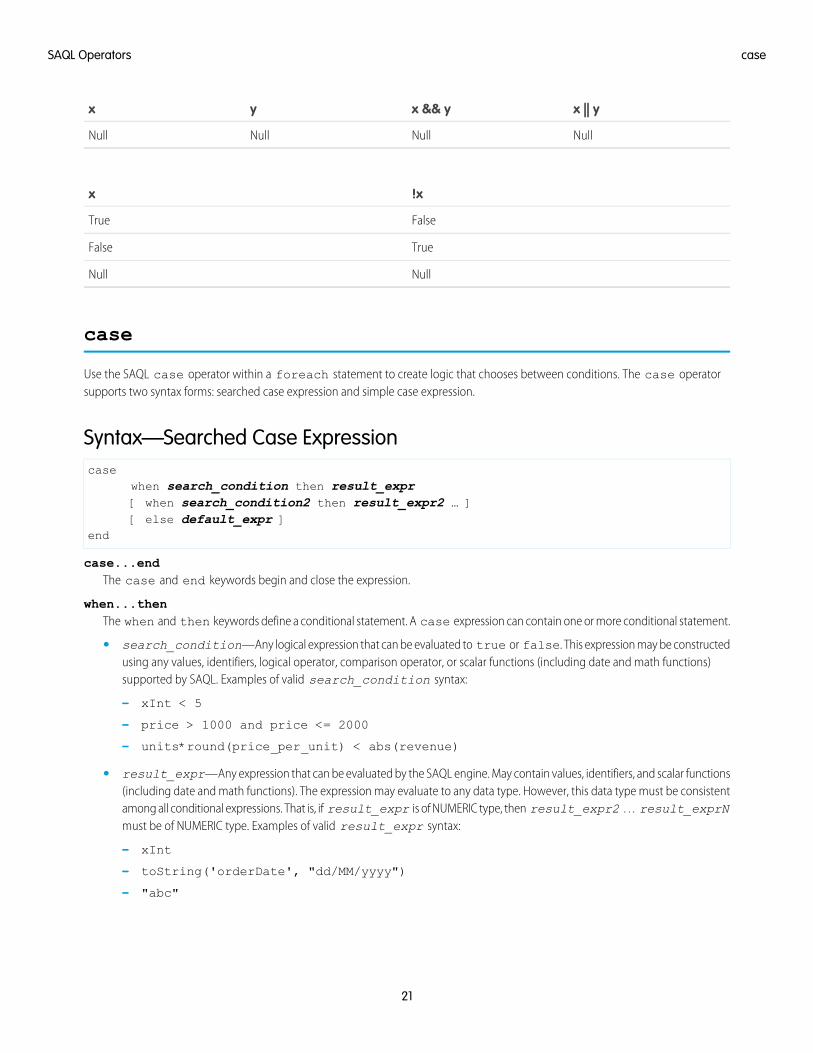
The following tables show how nulls are handled in logical operations.
x || yx && yyx
TrueTrueTrueTrue
TrueFalseFalseTrue
TrueNullNullTrue
TrueFalseTrueFalse
FalseFalseFalseFalse
NullFalseNullFalse
TrueNullTrueNull
NullFalseFalseNull
20
String OperatorsSAQL Operators
x || yx && yyx
NullNullNullNull
!xx
FalseTrue
TrueFalse
NullNull
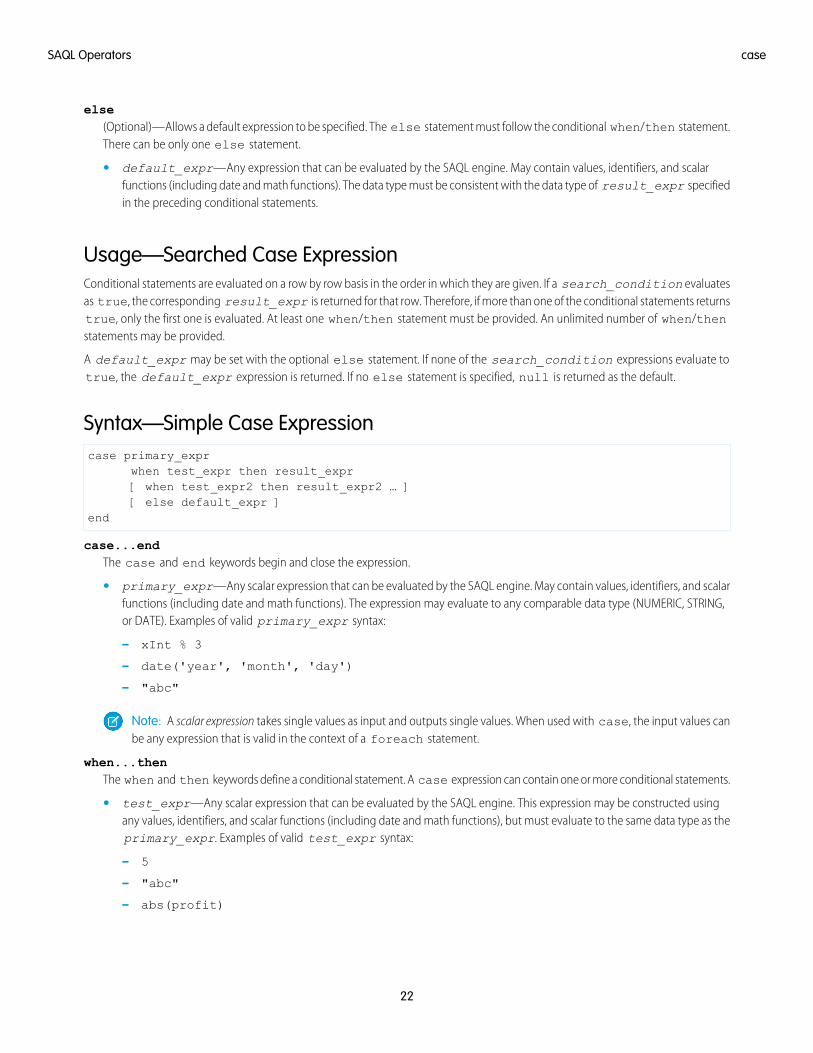
case
Use the SAQL case operator within a foreach statement to create logic that chooses between conditions. The case operatorsupports two syntax forms: searched case expression and simple case expression.
Syntax—Searched Case Expressioncase
when search_condition then result_expr[ when search_condition2 then result_expr2 … ][ else default_expr ]
end
case...endThe case and end keywords begin and close the expression.
when...thenThe when and then keywords define a conditional statement. A case expression can contain one or more conditional statement.
• search_condition—Any logical expression that can be evaluated to true or false. This expression may be constructedusing any values, identifiers, logical operator, comparison operator, or scalar functions (including date and math functions)supported by SAQL. Examples of valid search_condition syntax:
– xInt < 5
– price > 1000 and price <= 2000
– units*round(price_per_unit) < abs(revenue)
• result_expr—Any expression that can be evaluated by the SAQL engine. May contain values, identifiers, and scalar functions(including date and math functions). The expression may evaluate to any data type. However, this data type must be consistentamong all conditional expressions. That is, if result_expr is of NUMERIC type, then result_expr2 … result_exprNmust be of NUMERIC type. Examples of valid result_expr syntax:
– xInt
– toString('orderDate', "dd/MM/yyyy")
– "abc"
21
caseSAQL Operators
else(Optional)—Allows a default expression to be specified. The else statement must follow the conditional when/then statement.There can be only one else statement.
• default_expr—Any expression that can be evaluated by the SAQL engine. May contain values, identifiers, and scalarfunctions (including date and math functions). The data type must be consistent with the data type of result_expr specifiedin the preceding conditional statements.
Usage—Searched Case ExpressionConditional statements are evaluated on a row by row basis in the order in which they are given. If a search_condition evaluatesas true, the corresponding result_expr is returned for that row. Therefore, if more than one of the conditional statements returnstrue, only the first one is evaluated. At least one when/then statement must be provided. An unlimited number of when/thenstatements may be provided.
A default_expr may be set with the optional else statement. If none of the search_condition expressions evaluate totrue, the default_expr expression is returned. If no else statement is specified, null is returned as the default.
Syntax—Simple Case Expressioncase primary_expr
when test_expr then result_expr[ when test_expr2 then result_expr2 … ][ else default_expr ]
end
case...endThe case and end keywords begin and close the expression.
• primary_expr—Any scalar expression that can be evaluated by the SAQL engine. May contain values, identifiers, and scalarfunctions (including date and math functions). The expression may evaluate to any comparable data type (NUMERIC, STRING,or DATE). Examples of valid primary_expr syntax:
– xInt % 3
– date('year', 'month', 'day')
– "abc"
Note: A scalar expression takes single values as input and outputs single values. When used with case, the input values canbe any expression that is valid in the context of a foreach statement.
when...thenThe when and then keywords define a conditional statement. A case expression can contain one or more conditional statements.
• test_expr—Any scalar expression that can be evaluated by the SAQL engine. This expression may be constructed usingany values, identifiers, and scalar functions (including date and math functions), but must evaluate to the same data type as theprimary_expr. Examples of valid test_expr syntax:
– 5
– "abc"
– abs(profit)
22
caseSAQL Operators
• result_expr—Any scalar expression that can be evaluated by the SAQL engine. May contain values, identifiers, and scalarfunctions (including date and math functions). The expression may evaluate to any data type. However, this data type must beconsistent among all conditional statements. That is, if result_expr is of NUMERIC type, thenresult_expr2...result_exprN must be of NUMERIC type. Examples of result_expr syntax:
– xInt
– toString('orderDate', "dd/MM/yyyy")
– "abc"
else(Optional) The else keyword allows a default expression to be specified. The else statement must follow conditional when/thenstatements. There can be only one else statement.
• default_expr—Any scalar expression that can be evaluated by the SAQL engine. May contain values, identifiers, and scalarfunctions (including date and math functions). The data type must be consistent with the data type of result_expr specifiedin the preceding conditional statements.
Usage—Simple Case ExpressionConditional statements are evaluated on a row by row basis in the order that they are given. If primary_expr == test_exprfor a given conditional statement, the corresponding result_expr is returned for that row. At least one when/then statementmust be provided. An unlimited number of when/then statements may be provided.
A default_expr may be set with the optional else statement. If primary_expr doesn’t equal any of the test_exprconditions, the default_expr is returned. If no else statement is specified, null is returned as the default.
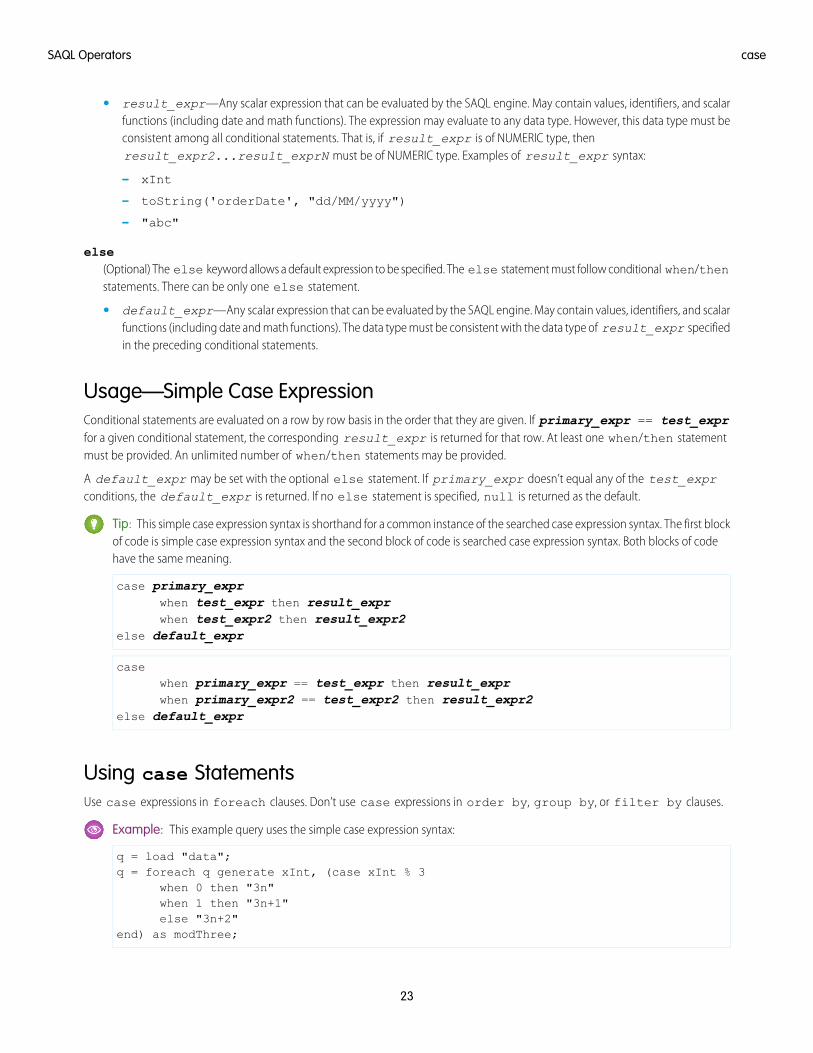
Tip: This simple case expression syntax is shorthand for a common instance of the searched case expression syntax. The first blockof code is simple case expression syntax and the second block of code is searched case expression syntax. Both blocks of codehave the same meaning.
case primary_exprwhen test_expr then result_exprwhen test_expr2 then result_expr2
else default_expr
casewhen primary_expr == test_expr then result_exprwhen primary_expr2 == test_expr2 then result_expr2
else default_expr
Using case StatementsUse case expressions in foreach clauses. Don’t use case expressions in order by, group by, or filter by clauses.
Example: This example query uses the simple case expression syntax:
q = load "data";q = foreach q generate xInt, (case xInt % 3
when 0 then "3n"when 1 then "3n+1"else "3n+2"
end) as modThree;
23
caseSAQL Operators
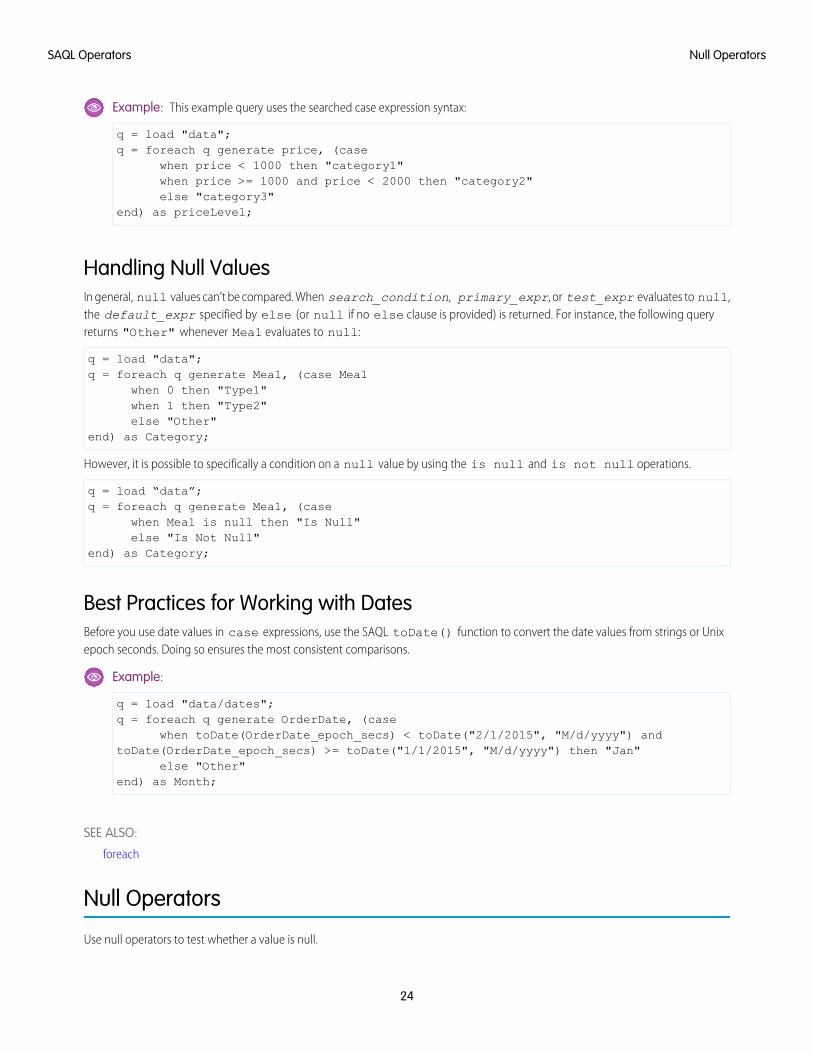
Example: This example query uses the searched case expression syntax:
q = load "data";q = foreach q generate price, (case
when price < 1000 then "category1"when price >= 1000 and price < 2000 then "category2"else "category3"
end) as priceLevel;
Handling Null ValuesIn general, null values can’t be compared. When search_condition, primary_expr, or test_expr evaluates to null,the default_expr specified by else (or null if no else clause is provided) is returned. For instance, the following queryreturns "Other" whenever Mea1 evaluates to null:
q = load "data";q = foreach q generate Mea1, (case Mea1
when 0 then "Type1"when 1 then "Type2"else "Other"
end) as Category;
However, it is possible to specifically a condition on a null value by using the is null and is not null operations.
q = load “data”;q = foreach q generate Mea1, (case
when Mea1 is null then "Is Null"else "Is Not Null"
end) as Category;
Best Practices for Working with DatesBefore you use date values in case expressions, use the SAQL toDate() function to convert the date values from strings or Unixepoch seconds. Doing so ensures the most consistent comparisons.
Example:
q = load "data/dates";q = foreach q generate OrderDate, (case
when toDate(OrderDate_epoch_secs) < toDate("2/1/2015", "M/d/yyyy") andtoDate(OrderDate_epoch_secs) >= toDate("1/1/2015", "M/d/yyyy") then "Jan"
else "Other"end) as Month;
SEE ALSO:
foreach
Null Operators
Use null operators to test whether a value is null.
24
Null OperatorsSAQL Operators
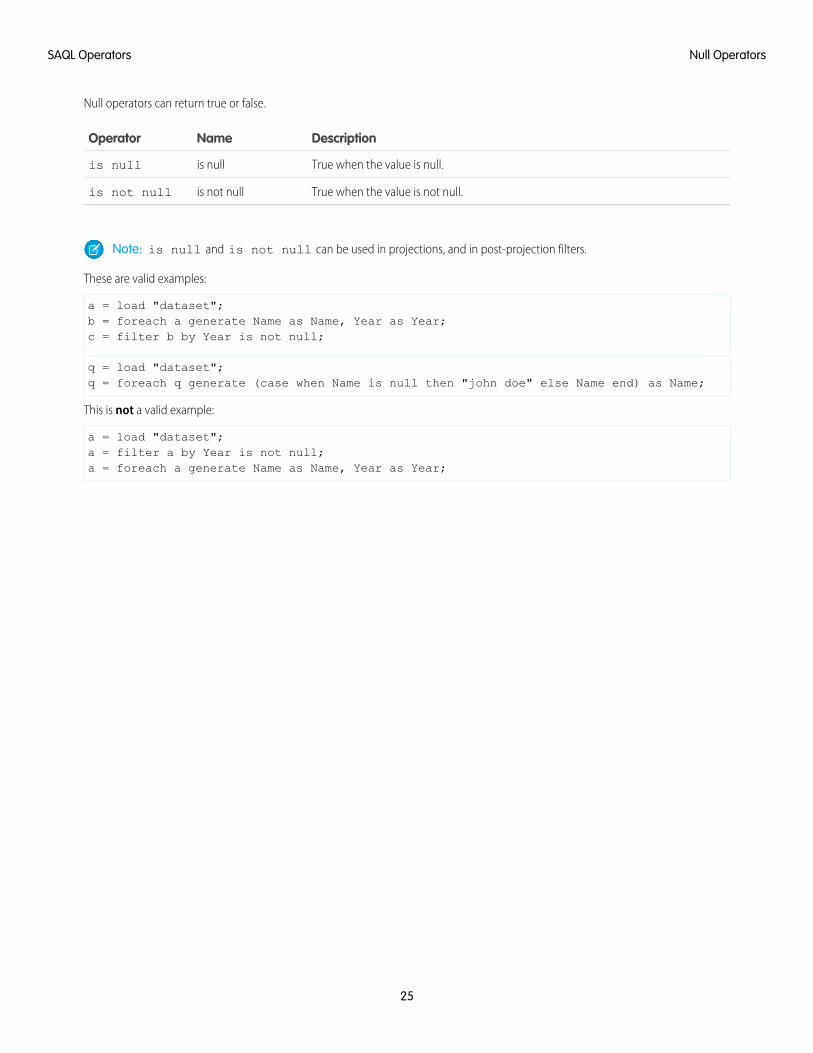
Null operators can return true or false.
DescriptionNameOperator
True when the value is null.is nullis null
True when the value is not null.is not nullis not null
Note: is null and is not null can be used in projections, and in post-projection filters.
These are valid examples:
a = load "dataset";b = foreach a generate Name as Name, Year as Year;c = filter b by Year is not null;
q = load "dataset";q = foreach q generate (case when Name is null then "john doe" else Name end) as Name;
This is not a valid example:
a = load "dataset";a = filter a by Year is not null;a = foreach a generate Name as Name, Year as Year;
25
Null OperatorsSAQL Operators
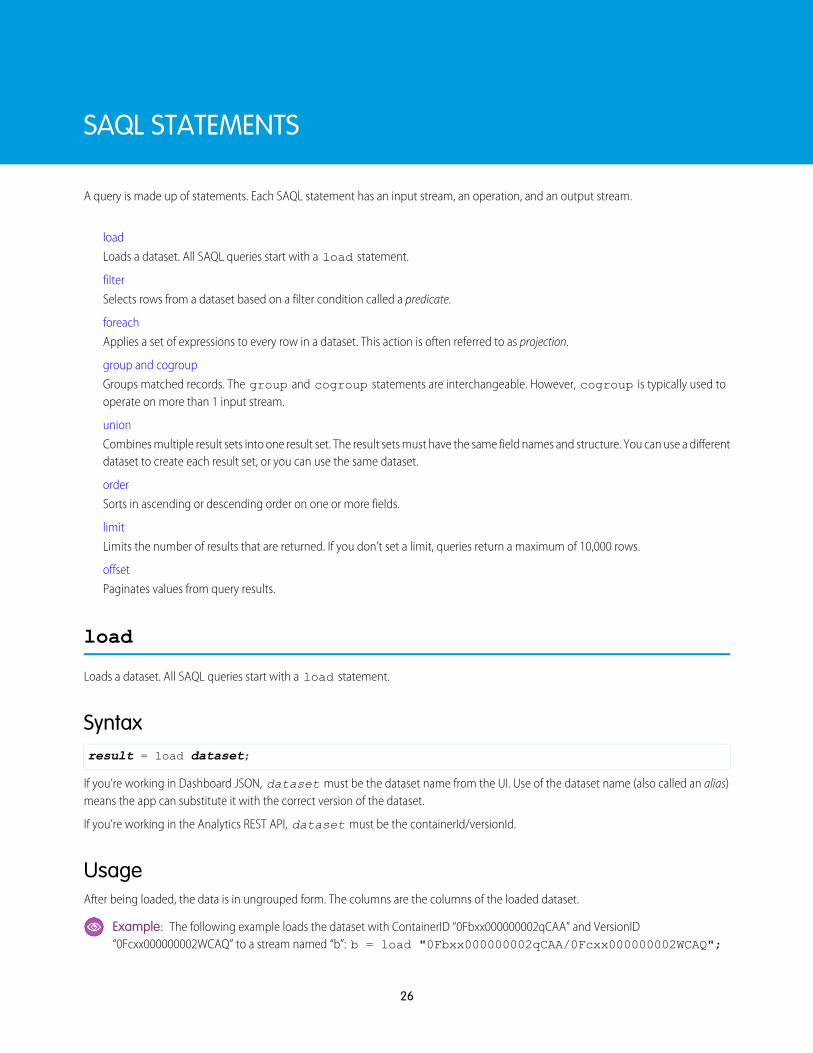
SAQL STATEMENTS
A query is made up of statements. Each SAQL statement has an input stream, an operation, and an output stream.
load
Loads a dataset. All SAQL queries start with a load statement.
filter
Selects rows from a dataset based on a filter condition called a predicate.
foreach
Applies a set of expressions to every row in a dataset. This action is often referred to as projection.
group and cogroup
Groups matched records. The group and cogroup statements are interchangeable. However, cogroup is typically used tooperate on more than 1 input stream.
union
Combines multiple result sets into one result set. The result sets must have the same field names and structure. You can use a differentdataset to create each result set, or you can use the same dataset.
order
Sorts in ascending or descending order on one or more fields.
limit
Limits the number of results that are returned. If you don’t set a limit, queries return a maximum of 10,000 rows.
offset
Paginates values from query results.
load
Loads a dataset. All SAQL queries start with a load statement.
Syntaxresult = load dataset;
If you’re working in Dashboard JSON, dataset must be the dataset name from the UI. Use of the dataset name (also called an alias)means the app can substitute it with the correct version of the dataset.
If you’re working in the Analytics REST API, dataset must be the containerId/versionId.
UsageAfter being loaded, the data is in ungrouped form. The columns are the columns of the loaded dataset.
Example: The following example loads the dataset with ContainerID “0Fbxx000000002qCAA” and VersionID“0Fcxx000000002WCAQ” to a stream named “b”: b = load "0Fbxx000000002qCAA/0Fcxx000000002WCAQ";
26
Example: The following example loads the dataset with the name “Accounts” to a stream named “b”: b = load"Accounts";
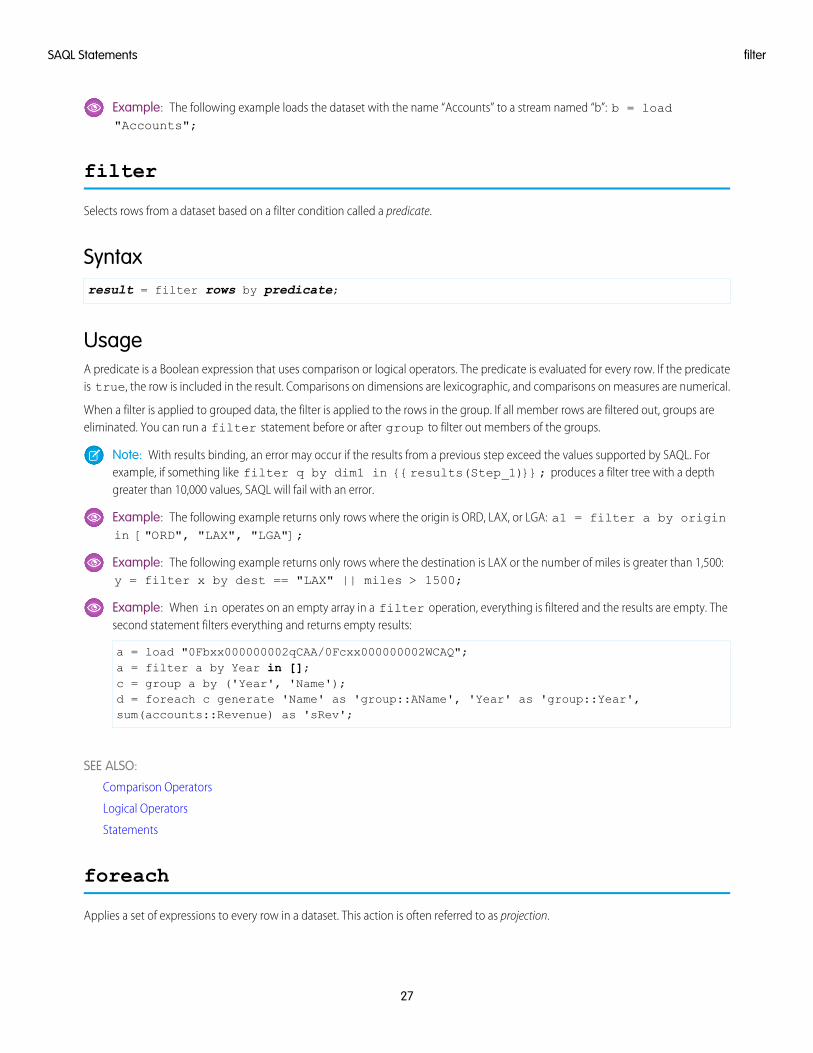
filter
Selects rows from a dataset based on a filter condition called a predicate.
Syntaxresult = filter rows by predicate;
UsageA predicate is a Boolean expression that uses comparison or logical operators. The predicate is evaluated for every row. If the predicateis true, the row is included in the result. Comparisons on dimensions are lexicographic, and comparisons on measures are numerical.
When a filter is applied to grouped data, the filter is applied to the rows in the group. If all member rows are filtered out, groups areeliminated. You can run a filter statement before or after group to filter out members of the groups.
Note: With results binding, an error may occur if the results from a previous step exceed the values supported by SAQL. Forexample, if something like filter q by dim1 in {{results(Step_1)}}; produces a filter tree with a depthgreater than 10,000 values, SAQL will fail with an error.
Example: The following example returns only rows where the origin is ORD, LAX, or LGA: a1 = filter a by originin ["ORD", "LAX", "LGA"];
Example: The following example returns only rows where the destination is LAX or the number of miles is greater than 1,500:y = filter x by dest == "LAX" || miles > 1500;
Example: When in operates on an empty array in a filter operation, everything is filtered and the results are empty. Thesecond statement filters everything and returns empty results:
a = load "0Fbxx000000002qCAA/0Fcxx000000002WCAQ";a = filter a by Year in [];c = group a by ('Year', 'Name');d = foreach c generate 'Name' as 'group::AName', 'Year' as 'group::Year',sum(accounts::Revenue) as 'sRev';
SEE ALSO:
Comparison Operators
Logical Operators
Statements
foreach
Applies a set of expressions to every row in a dataset. This action is often referred to as projection.
27
filterSAQL Statements

Syntaxq = foreach q generate expression as alias[, expression as alias ...];
The output column names are specified with the as keyword. The output data is ungrouped.
Using foreach with Ungrouped DataWhen used with ungrouped data, the foreach statement maps the input rows to output rows. The number of rows remains thesame.
Example: a2 = foreach a1 generate carrier as carrier, miles as miles;
Using foreach with Grouped DataWhen used with grouped data, the foreach statement behaves differently than it does with ungrouped data.
Fields can be directly accessed only when the value is the same for all group members. For example, the fields that were used as thegrouping keys have the same value for all group members. Otherwise, use aggregate functions to access the members of a group. Thetype of the column determines which aggregate functions you can use. For example, if the column type is numeric, you can use thesum() function.
Example: z = foreach y generate day as day, unique(origin) as uorg, count() as n;
Using foreach with a case ExpressionTo create logic in a foreach statement that chooses between conditional statements, use a case expression.
Example: This example query uses the simple case expression syntax:
q = load "data";q = foreach q generate xInt, (case xInt % 3
when 0 then "3n"when 1 then "3n+1"else "3n+2"
end) as modThree;
Example: This example query uses the searched case expression syntax:
q = load "data";q = foreach q generate price, (case
when price < 1000 then "category1"when price >= 1000 and price < 2000 then "category2"else "category3"
end) as priceLevel;
Projected Field NamesEach field name in a projection must be unique and not have the name 'none'. Invalid field names throw an error.
28
foreachSAQL Statements
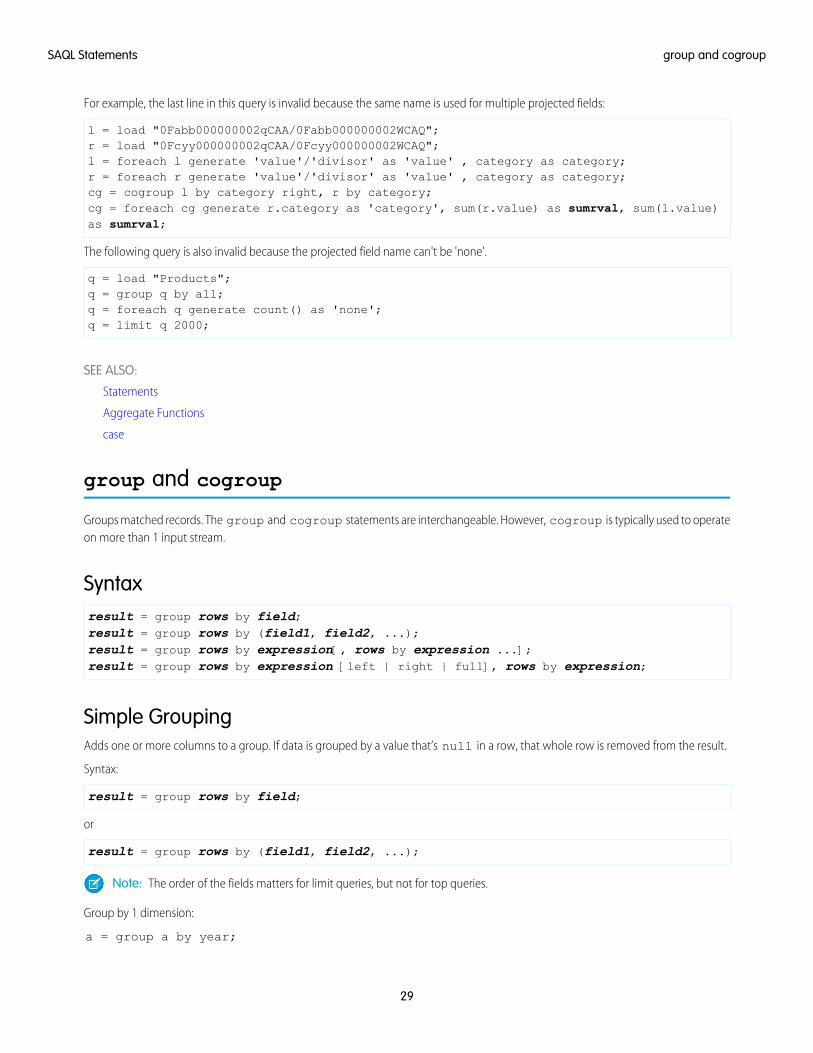
For example, the last line in this query is invalid because the same name is used for multiple projected fields:
l = load "0Fabb000000002qCAA/0Fabb000000002WCAQ";r = load "0Fcyy000000002qCAA/0Fcyy000000002WCAQ";l = foreach l generate 'value'/'divisor' as 'value' , category as category;r = foreach r generate 'value'/'divisor' as 'value' , category as category;cg = cogroup l by category right, r by category;cg = foreach cg generate r.category as 'category', sum(r.value) as sumrval, sum(l.value)as sumrval;
The following query is also invalid because the projected field name can't be 'none'.
q = load "Products";q = group q by all;q = foreach q generate count() as 'none';q = limit q 2000;
SEE ALSO:
Statements
Aggregate Functions
case
group and cogroup
Groups matched records. The group and cogroup statements are interchangeable. However, cogroup is typically used to operateon more than 1 input stream.
Syntaxresult = group rows by field;result = group rows by (field1, field2, ...);result = group rows by expression[, rows by expression ...];result = group rows by expression [left | right | full], rows by expression;
Simple GroupingAdds one or more columns to a group. If data is grouped by a value that’s null in a row, that whole row is removed from the result.
Syntax:
result = group rows by field;
or
result = group rows by (field1, field2, ...);
Note: The order of the fields matters for limit queries, but not for top queries.
Group by 1 dimension:
a = group a by year;
29
group and cogroupSAQL Statements
Group by multiple dimensions:
a = load "0Fbxx000000002qCAA/0Fcxx000000002WCAQ";a = group a by (year, month);a = foreach a generate year as year, month as month;
Inner CogroupingCogrouping means that two input streams, called left and right are grouped independently and arranged side by side. Only data thatexists in both groups appears in the results.
Syntax:
result = cogroup rows by expression[, rows by expression ...];
This example is a simple cogroup operation on 2 datasets:
a = load "0Fbxx000000002qCAA/0Fcxx000000002WCAQ";b = load "0Fbyy000000002qCAA/0Fcyy000000002WCAQ";a = cogroup a by carrier, b by carrier;
You can cogroup more than 2 datasets:
result = cogroup a by keya, b by keyb, c by keyc;
This example performs a cogroup operation:
z = cogroup x by (day,origin), y by (day,airport);
You can’t have the same stream on both sides of a cogroup operation. To perform a cogroup operation on 1 dataset, load thedataset twice so you have 2 streams.
a = load "0Fbxx000000002qCAA/0Fcxx000000002WCAQ";b = load "0Fbxx000000002qCAA/0Fcxx000000002WCAQ";b = cogroup a by ClosedDate, b by CreatedDate;c = foreach b generate sum(a.Amount) as Amount;
You can also load 1 dataset and filter it into 2 different streams:
a = load "0Fbxx000000002qCAA/0Fcxx000000002WCAQ";a = filter a by "region" in ["West"];a = filter a by "status" in ["closed"];b = filter a by "year" in [2014];c = filter a by "year" in [2015];d = cogroup b by ("state"), c by ("state");d = foreach d generate "state" as "state", sum(b.Amount) as "Amount_2014", sum(c.Amount)as "Amount_2015";
This code throws an error because it performs a cogroup operation on a single stream, a:
a = load "0Fbxx000000002qCAA/0Fcxx000000002WCAQ";b = cogroup a by ClosedDate, a by CreatedDate;c = foreach b generate sum(a.Amount) as Amount;
30
group and cogroupSAQL Statements
To use aggregate functions when cogrouping, specify which input side to use in the aggregate function. For example, if you have an aside and a b side, and each contains a particular measure, use one of these syntaxes:
sum(inputSide['myMeasure'])sum(inputSide::myMeasure)sum(inputSide.myMeasure)
This query is valid because it uses the third syntax form to specify that miles comes from the a side.
a = load "0Fbxx000000002qCAA/0Fcxx000000002WCAQ";b = load "0Fbyy000000002qCAA/0Fcyy000000002WCAQ";c = cogroup a by x, b by y;d = foreach c generate a.x as x, a.y as y, sum(a.miles) as miles;
This query isn’t valid because miles doesn't specify which side it is coming from:
a = load "0Fbxx000000002qCAA/0Fcxx000000002WCAQ";b = load "0Fbyy000000002qCAA/0Fcyy000000002WCAQ";c = cogroup a by x, b by y;d = foreach c generate a.x as x, a.y as y, sum(miles) as miles;
If a lens or dashboard has a cogroup query, specify the input stream for projections and for count() aggregations on cogroupqueries, as in this example:
a = load "0Fbxx000000002qCAA/0Fcxx000000002WCAQ";b = load "0Fbyy000000002qCAA/0Fyy000000002WCAQ";c = cogroup a by 'OwnerName', b by 'OwnerName';c = foreach c generate a['OwnerName'] as 'OwnerName', sum(a['AmountConverted']) /
sum(b['Amount']) as 'sum_target_completed', count(a) as count;
Outer CogroupingOuter cogrouping combines groups as an outer join. For the half-matches, null rows are added. The grouping keys are taken from theinput that provides the value.
Syntax:
result = cogroup rows by expression [left | right | full], rows by expression;
Specify left, right, or full to indicate whether to perform a left outer join, a right outer join, or a full join.
Example: z = cogroup x by (day,origin) left, y by (day,airport);
You can apply an outer cogrouping across more than 2 sets of data. This example does a left outer join from a to b, with a right join toc:
result = cogroup a by keya left, b by keyb right, c by keyc;
Note: Outer joins return null when there is no match, instead of defaulting to zero.
union
Combines multiple result sets into one result set. The result sets must have the same field names and structure. You can use a differentdataset to create each result set, or you can use the same dataset.
31
unionSAQL Statements
Syntaxresult = union resultSetA, resultSetB [, resultSetC ...];
Exampleq = union q1, q2, q3;
ExampleYou want to see how each rep compares to the average for deals won. You can make this comparison by appending these two resultsets together:
• Total amount of opportunities won for each rep
• Average amount of opportunities won for all reps
Then use union to append the two result sets.
First, show the total amount of won opportunities for each rep.
opt = load "DTC_Opportunity_SAMPLE";opt = filter opt by 'Won' == "true";
-- group by ownerrep = group opt by 'Account_Owner';
-- project the sum of amount for each reprep = foreach rep generate 'Account_Owner' as 'Account_Owner', sum('Amount') as 'sum_Amount';
rep = order rep by 'Account_Owner' asc;
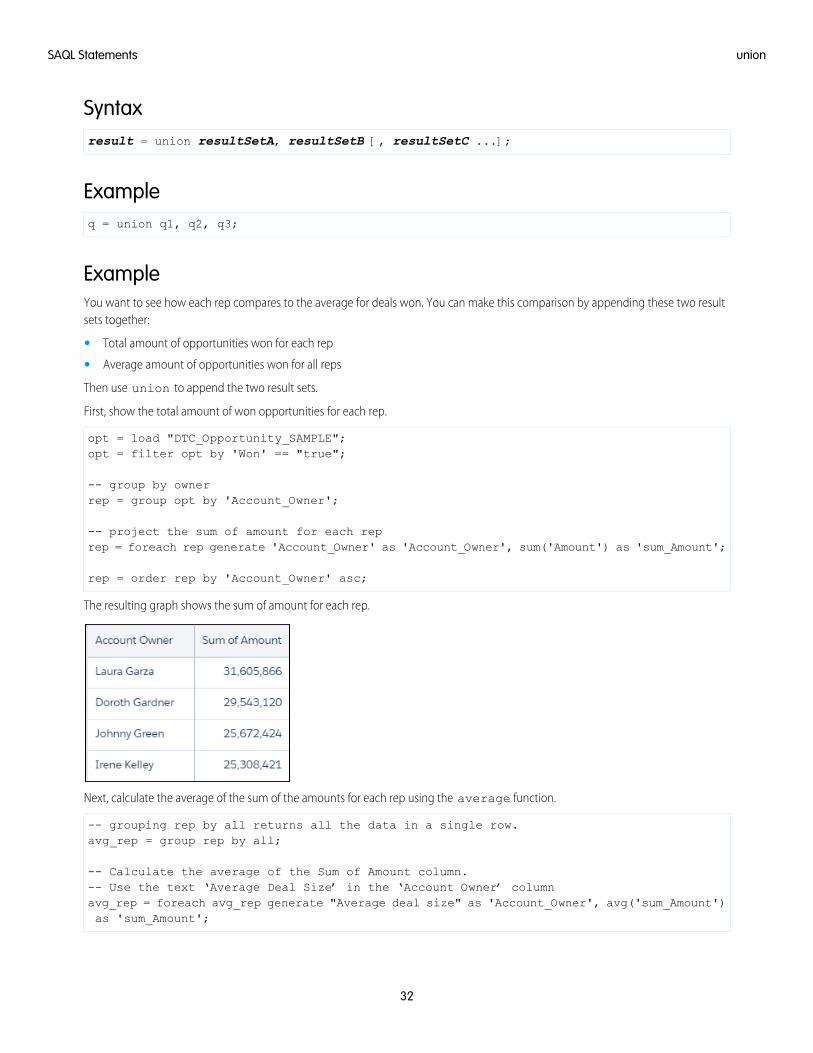
The resulting graph shows the sum of amount for each rep.
Next, calculate the average of the sum of the amounts for each rep using the average function.
-- grouping rep by all returns all the data in a single row.avg_rep = group rep by all;
-- Calculate the average of the Sum of Amount column.-- Use the text ‘Average Deal Size’ in the ‘Account Owner’ columnavg_rep = foreach avg_rep generate "Average deal size" as 'Account_Owner', avg('sum_Amount')as 'sum_Amount';
32
unionSAQL Statements
Because the two data streams have the same field names and structure, you can use union to combine them.
q = union rep, avg_rep;
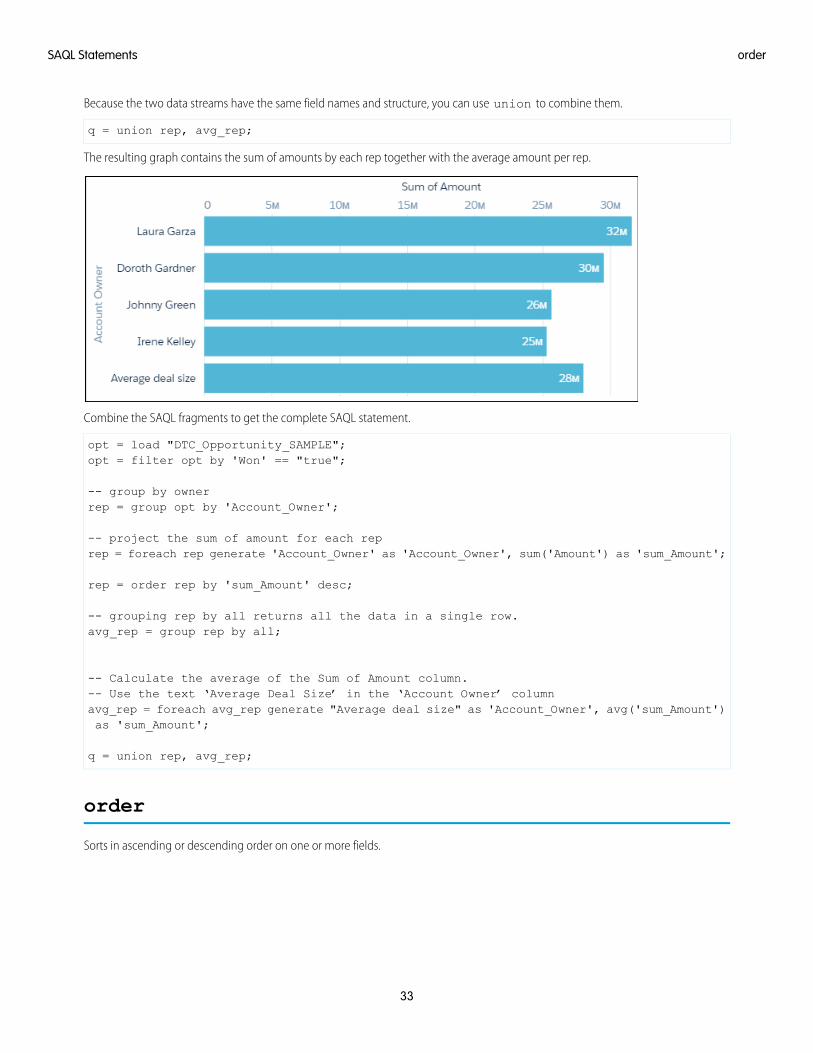
The resulting graph contains the sum of amounts by each rep together with the average amount per rep.
Combine the SAQL fragments to get the complete SAQL statement.
opt = load "DTC_Opportunity_SAMPLE";opt = filter opt by 'Won' == "true";
-- group by ownerrep = group opt by 'Account_Owner';
-- project the sum of amount for each reprep = foreach rep generate 'Account_Owner' as 'Account_Owner', sum('Amount') as 'sum_Amount';
rep = order rep by 'sum_Amount' desc;
-- grouping rep by all returns all the data in a single row.avg_rep = group rep by all;
-- Calculate the average of the Sum of Amount column.-- Use the text ‘Average Deal Size’ in the ‘Account Owner’ columnavg_rep = foreach avg_rep generate "Average deal size" as 'Account_Owner', avg('sum_Amount')as 'sum_Amount';
q = union rep, avg_rep;
order
Sorts in ascending or descending order on one or more fields.
33
orderSAQL Statements
Syntaxresult = order rows by field [ asc | desc ];result = order rows by (field [ asc | desc ], field [ asc | desc ]);result = order rows by field [ asc | desc ] nulls [first | last];
asc or desc specifies whether the results are ordered in ascending (asc) or descending (desc) order. The default order is ascending.
UsageThe order statement isn’t applied to the whole set. The order statement operates on rows individually.
You can use the order statement with ungrouped data. You can also use the order statement to specify order within a group orto sort grouped data by an aggregated value.
By default, nulls are sorted last when sorting in ascending order and first when sorting in descending order. You can change the orderingof nulls using nulls [first | last].
Note: Applying labels to dimension values in the XMD changes the displayed values, but doesn’t change the sort order.
Example: q = order q by 'count' desc;
Example: To order a stream by multiple fields, use this syntax:
a = load "0Fbxx000000002qCAA/0Fcxx000000002WCAQ";b = group a by (year, month);c = foreach b generate year as year, month as month;d = order c by (year desc, month desc);
Example: You can order a cogrouped stream before a foreach statement:
a = load "0Fbxx000000002qCAA/0Fcxx000000002WCAQ";b = load "0Fayy000000002qCAA/0Fbyy000000002WCAQ";c = cogroup a by year, b by year;c = order c by a.airlineName;c = foreach c generate year as year;
Example: By default, nulls are sorted first when sorting in descending order. To change the null sort order to last, use this syntax:
q = order q by last_shipping_cost desc nulls last;
Example: You can’t reference a preprojection ID in a postprojection order operation. (Projection is another term for a foreachoperation.) This code throws an error:
q = load "0Fbxx000000002qCAA/0Fcxx000000002WCAQ";
q = group q by 'FirstName';
q = foreach q generate sum('mea_mm10M') as 'sum_mm10M';
q = order q by 'FirstName' desc;
This code is valid:
q = load "0Fbxx000000002qCAA/0Fcxx000000002WCAQ";
q = group q by 'FirstName';
34
orderSAQL Statements
q = foreach q generate 'FirstName' as 'User_FirstName', sum('mea_mm10M') as 'sum_mm10M';
q = order q by 'User_FirstName' desc;
SEE ALSO:
Statements
limit
Limits the number of results that are returned. If you don’t set a limit, queries return a maximum of 10,000 rows.
Syntaxresult = limit rows number;
UsageUse this statement only on data that has been ordered with the order statement. The results of a limit operation aren’t automaticallyordered, and their order can change each time that statement is called.
You can use the limit statement with ungrouped data.
You can use the limit statement to limit grouped data by an aggregated value. For example, to find the top 10 regions by revenue:group by region, call sum(revenue) to aggregate the data, order by sum(revenue) in descending order, and limit thenumber of results to the first 10.
Note: The limit statement isn’t a top() or sample() function.
Example: This example limits the number of returned results to 10:
b = limit a 10;
The expression can’t contain any columns from the input. For example, this query is not valid:
b = limit OrderDate 10;
SEE ALSO:
Statements
order
offset
Paginates values from query results.
35
limitSAQL Statements
Syntaxresult = offset rows number;
UsageUsed to paginate values from query results. This statement requires that the data has been ordered with the order statement.
Example: This example loads a dataset, puts the rows in descending order, and returns rows 400 to 800:
a = load "0Fbxx000000002qCAA/0Fcxx000000002WCAQ";b = foreach a generate 'carrier' as 'carrier', count() as 'count';c = order b by 'count' desc;d = limit c 400;e = offset d 400;
SEE ALSO:
Statements
36
offsetSAQL Statements
SAQL FUNCTIONS
Use functions to perform complex operations on your data.
Aggregate Functions
Use aggregate functions to perform computations on values.
Date Functions
To use dates in a SAQL query, use date functions and relative date keywords.
String Functions
To perform string operations in a SAQL query, use string functions.
Math Functions
To perform numeric operations in a SAQL query, use math functions.
Windowing Functions
Use SAQL windowing functionality to calculate common business cases such as percent of grand total, moving average, year andquarter growth, and ranking.
coalesce()
Use the coalesce() function to get the first non-null value from a list of parameters.
Aggregate Functions
Use aggregate functions to perform computations on values.
Using an aggregate function on an empty set returns null. For example, if you use an aggregate function with a nonmatching columnof an outer cogrouping, you might have an empty set.
Aggregation functions treat each line as its own group if not preceded by group by.
This is a list of supported aggregate functions.
avg() or average()Returns the average value of a numeric field.
For example, to calculate the average number of miles:
a1 = group a by (origin, dest);a2 = foreach a1 generate origin as origin, dest as destination,
average(miles) as miles;
count()Returns the number of rows that match the query criteria.
37
For example, to calculate the number of carriers:
q = foreach q generate 'carrier' as 'carrier', count() as 'count';
The count() function operates on streams that were inputs to the group or cogroup statements. It doesn’t operate on thenewly grouped stream or on an ungrouped stream.
a = load "0Fcyy000000002qCAA/0Fcyy000000002WCAQ";a1 = group a by (Year);q = foreach a1 generate count(a) as countYear, count() as count, Year as year;q = limit q 20;
You can’t pass a1 to the count() function because it’s a newly grouped stream.
first()Returns the value for the first tuple. To work as expected, you must be aware of the sort order or know that the values of that measureare the same for all tuples in the set.
For example, you can use these statements to compute the distance between each combination of origin and destination:
a1 = group a by (origin, dest);a2 = foreach a1 generate origin as origin, dest as destination,first(miles) as miles;
last()Returns the value for the last tuple.
For example, to compute the distance between each combination of origin and destination:
a1 = group a by (origin, dest);a2 = foreach a1 generate origin as origin, dest as destination,last(miles) as miles;
max()Returns the maximum value of a field.
This function takes a measure as an argument, or a date, which will return the newest (most recent) value.
Use the toDate() function to format the date correctly first. For example:
q = load "case";q = foreach q generate 'ClosedDate_Year' as 'year', toDate(ClosedDate_Year + "-"+ ClosedDate_Month + "-" + ClosedDate_Day, "yyyy-MM-dd") as date;
q = group q by 'year';q = foreach q generate year, min('date') as 'mindate', max('date') as 'maxdate';q = limit q 100;
38
Aggregate FunctionsSAQL Functions
median()Accepts a grouped expression of numeric type and returns the middle number (by sorted order, ignoring null values). If there is no onemiddle number (in other words, the count of non-null values is even), then median returns the average of the two numbers closest tothe middle.
The expression can be any identifier, such as ‘xInt’ or ‘price’, but cannot be a complex expression, such as price/100 or ceil(distance), ora literal, such as 2.5.
q = load "data/airline";q = group q by dest;q = foreach q generate dest, median(miles) as medMiles;limit q 5;
If median is not preceded by a group by clause, it treats each individual row as its own group:
q = load "data/airline";q = foreach q generate dest, median(miles) as medMiles;limit q 5;
min()Returns the minimum value of a field.
This function takes a measure as an argument, or a date, which will return the oldest value.
Use the toDate() function to format the date correctly first. For example:
q = load "case";q = foreach q generate 'ClosedDate_Year' as 'year', toDate(ClosedDate_Year + "-"+ ClosedDate_Month + "-" + ClosedDate_Day, "yyyy-MM-dd") as date;
q = group q by 'year';q = foreach q generate year, min('date') as 'mindate', max('date') as 'maxdate';q = limit q 100;
sum()Returns the sum of a numeric field.
a = load "0Fbxx000000002qCAA/0Fcxx000000002WCAQ";a = filter a by dest in ["ORD", "LAX", "ATL", "DFW", "PHX", "DEN", "LGA"];a = group a by carrier;b = foreach a generate carrier as airline, sum(miles) as miles;
unique()Returns the count of unique values.
For example, to find how many origins and destinations a carrier flies from:
a1 = group a by carrier;a2 = foreach a1 generate carrier as carrier, unique(origin) as origins,unique(dest) as destinations;
39
Aggregate FunctionsSAQL Functions
Note: The best way to add summaries (for example, a summary row on a compare table) using unique() is to use it as awindowing function.
stddev()Returns the sample standard deviation computed on the group.
Accepts a grouped expression of numeric type. If the number of non-null values in the group is equal to 1, stddev return null. Otherwise,stddev returns the sample standard deviation computed on the group, ignoring null values.
The expression can be any numeric identifier, such as 'xInt' or 'price', but cannot be a complex expression, such as price/100 or ceil(price),or a literal, such as 2.5.
q = load "data/airline";q = group q by dest;q = foreach q generate dest, stddev(miles) as stddevMiles;limit q 5;
stddevp()Returns the population standard deviation computed on the group.
Accepts a grouped expression of numeric type and returns the population standard deviation computed on the group, ignoring nullvalues. The expression can be any numeric identifier, such as 'xInt' or 'price', but cannot be a complex expression, such as price/100 orceil(price), or a literal, such as 2.5.
q = load "data/airline";q = group q by dest;q = foreach q generate dest, stddevp(miles) as stddevMiles;limit q 5;
var()Returns the sample variance (also called the unbiased variance) computed on the group.
Accepts a grouped expression of numeric type. If the number of non-null values in the group is equal to 1, var return null. Otherwise,var returns the sample variance computed on the group, ignoring null values. The expression can be any numeric identifier, such as'xInt' or 'price', but cannot be a complex expression, such as price/100 or ceil(price), or a literal, such as 2.5.
q = load "data/airline";q = group q by dest;q = foreach q generate dest, var(miles) as varMiles;limit q 5;
varp()Returns the population variance (also called the biased variance) computed on the group.
40
Aggregate FunctionsSAQL Functions
Accepts a grouped expression of numeric type and returns the population variance computed on the group, ignoring null values. Theexpression can be any numeric identifier, such as 'xInt' or 'price', but cannot be a complex expression, such as price/100 or ceil(price),or a literal, such as 2.5.
q = load "data/airline";q = group q by dest;q = foreach q generate dest, varp(miles) as varMiles;limit q 5;
percentile_disc()Computes a specific (discrete) percentile for sorted values in an entire rowset or within distinct partitions of a rowset. The returned valueis an interpolation, i.e. the next lowest value in the rowset. The full syntax is:
percentile_disc(p as numeric) within group (order by expr [asc | desc])
The percentile_disc function accepts a grouped expression expr of numeric type and sorts it in the specified order (asc ordesc). If order is not specified, the default order is asc. It returns the value behind which (100*p)% of values in the group would fallin the sorted order, ignoring null values.
p can be any real numeric value between 0 and 1, and is accurate to 8 decimal places of precision. expr can be any identifier, such as'xInt' or 'price', but cannot be a complex expression, such as price/100 or ceil(distance), or a literal, such as 2.5.
If expr contains no value that falls exactly at the 100*p-th percentile mark, percentile_disc will return the next value fromexpr in the sort order.
For example, if Mea1 contains the values [54, 35, 15, 15, 76, 87, 78] then:
percentile_disc(0.5) within group (order by Mea1) == 54percentile_disc(0.72) within group (order by Mea1) == 78
Example query:
q = load "data/airline";q = group q by dest;q = foreach q generate dest, percentile_disc(0.25) withingroup (order by miles desc) as perMiles;
limit q 5;
percentile_cont()Calculates a percentile based on a continuous distribution of the column value. The full syntax is:
percentile_cont(p as numeric) within group (order by expr [asc | desc])
The percentile_cont function accepts a grouped expression expr of numeric type and sorts it in the specified order (asc ordesc). If the order is not specified, the default order is asc. It returns the value behind which (100*p)% of values in the group wouldfall in the sorted order, ignoring null values.
p can be any real numeric value between 0 and 1. expr can be any identifier, such as 'xInt' or 'price', but cannot be a complex expression,such as price/100 or ceil(distance), or a literal, such as 2.5.
If expr contains no value that falls exactly at the 100*p-th percentile mark, percentile_cont returns a value linear interpolatedfrom the two closest values in expr.
41
Aggregate FunctionsSAQL Functions
For example, if Mea1 contains the values [0, 1, 2, 3, 4, 5, 6, 7, 8, 9, 10, 11, 12, 13] then:
percentile_cont(0.25) within group (order by Mea1 asc) = 3.25percentile_cont(0.25) within group (order by Mea1 desc) = 9.75percentile_cont(0) within group (order by Mea1 asc) = 0percentile_cont(1) within group (order by Mea1 asc) = 13
Example query:
q = load "data/airline";q = group q by dest;q = foreach q generate dest, percentile_cont(0.25) withingroup (order by miles) as perMiles;
limit q 5;
regr_slope(y, x)The simple linear regression function regr_slope accepts a grouped dependent numeric expression y and a grouped independentnumeric expression x, and returns the slope of the regression line. The regr_slope function only considers pairs of (x, y) valueswhere both values are not null, and returns null if there exists fewer than 2 such pairs in the given group. Simple linear regressionfunctions work like aggregation functions on simple grouped values, but do not work with cogroups.
Example query:
q = load "data/sales";q = group q by all;q = foreach q generate regr_slope('profit', 'sales') as slope;limit q 1;
regr_intercept(y, x)The simple linear regression function regr_intercept accepts a grouped dependent numeric expression y and a groupedindependent numeric expression x, and returns the y-intercept for the regression line. The regr_intercept function only considerspairs of (x, y) values where both values are not null, and returns null if there exists fewer than 2 such pairs in the given group.Simple linear regression functions work like aggregation functions on simple grouped values, but do not work with cogroups.
Example query:
q = load "data/sales";q = group q by all;q = foreach q generate regr_intercept('profit', 'sales') as intercept;limit q 1;
regr_r2(y, x)The simple linear regression function regr_r2 accepts a grouped dependent numeric expression y and a grouped independentnumeric expression x, and returns the coefficient of determination (also called R-squared or goodness of fit) for the regression. Theregr_r2 function only considers pairs of (x, y) values where both values are not null, and returns null if there exists fewerthan 2 such pairs in the given group. Simple linear regression functions work like aggregation functions on simple grouped values, butdo not work with cogroups.
42
Aggregate FunctionsSAQL Functions
Example query:
q = load "data/sales";q = group q by all;q = foreach q generate regr_r2('profit', 'sales') as r2;limit q 1;
Date Functions
To use dates in a SAQL query, use date functions and relative date keywords.
Dates in Einstein AnalyticsWhen you upload a date field to Einstein Analytics, it creates dimension and measure fields to contain the date and time information.You can use SAQL date functions to convert the dimensions and measures to dates. You can then use the dates to sort, filter, and groupdata in your SAQL queries.
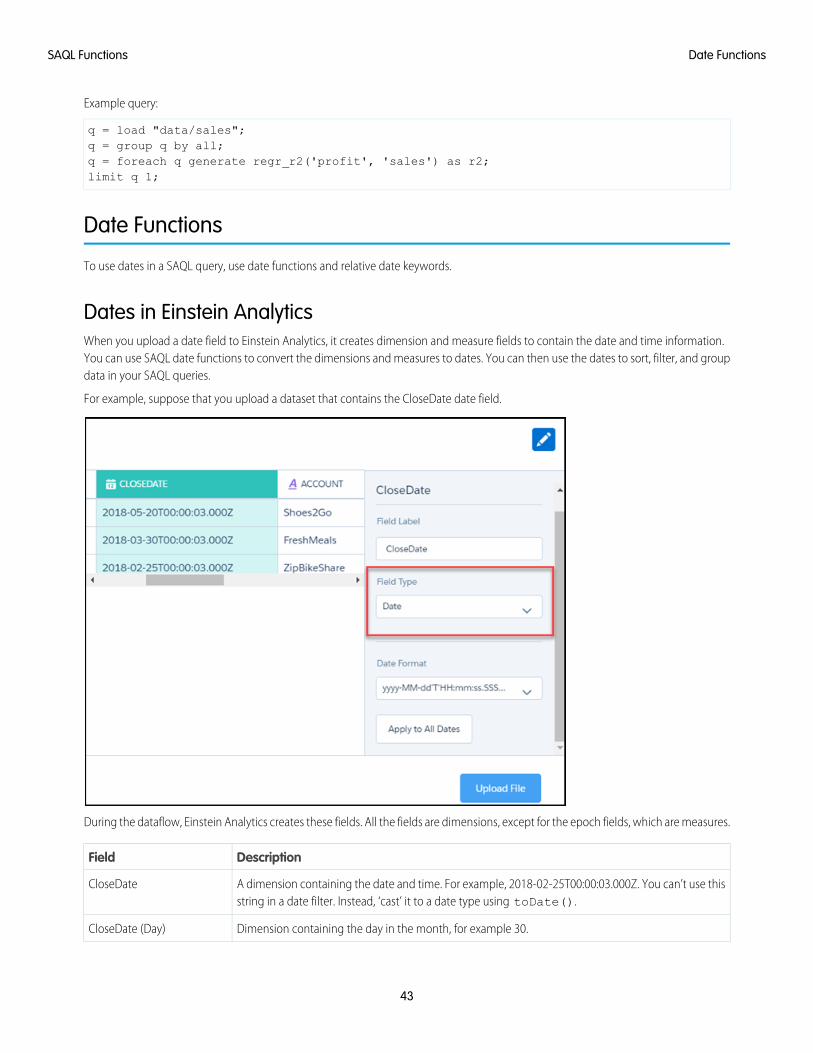
For example, suppose that you upload a dataset that contains the CloseDate date field.
During the dataflow, Einstein Analytics creates these fields. All the fields are dimensions, except for the epoch fields, which are measures.
DescriptionField
A dimension containing the date and time. For example, 2018-02-25T00:00:03.000Z. You can’t use thisstring in a date filter. Instead, ‘cast’ it to a date type using toDate().
CloseDate
Dimension containing the day in the month, for example 30.CloseDate (Day)
43
Date FunctionsSAQL Functions
DescriptionField
Dimension containing the hour, for example, 11. If the original date did not contain the hour, this fieldcontains 00.
CloseDate (Hour)
Dimension containing the minute, for example, 59. If the original date did not contain the minute, thisfield contains 00
CloseDate (Minute)
Dimension containing the month, for example, 12.CloseDate (Month)
Dimension containing the quarter, for example, 4.CloseDate(Quarter)
Dimension containing the second, for example, 59. If the original date did not contain the minute, thisfield contains 00.
CloseDate (Second)
Dimension containing the week, for example, 52.CloseDate (Week)
Measure containing the UNIX epoch time, which is the number of days that have elapsed since 00:00:00,Thursday, 1 January 1970.
CloseDate_day_epoch
Measure containing the Unix epoch time in seconds. Seconds epoch time is the number of secondsthat have elapsed since 00:00:00, Thursday, 1 January 1970.
CloseDate_sec_epoch
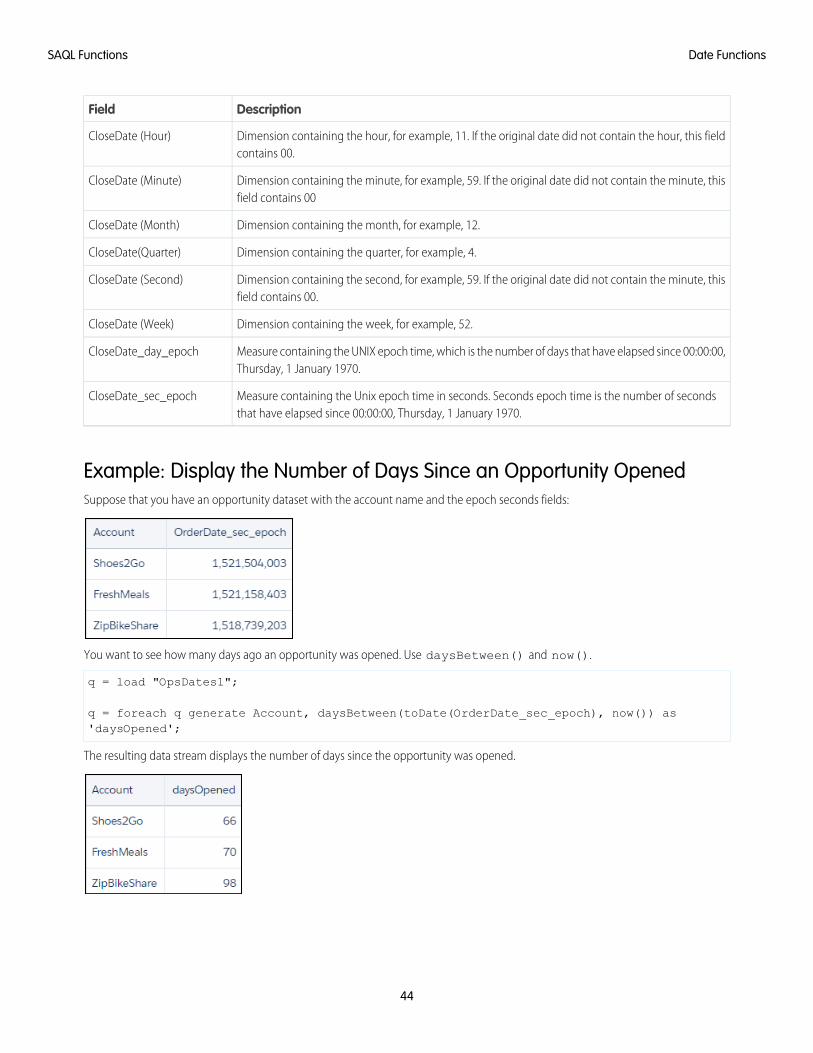
Example: Display the Number of Days Since an Opportunity OpenedSuppose that you have an opportunity dataset with the account name and the epoch seconds fields:
You want to see how many days ago an opportunity was opened. Use daysBetween() and now().
q = load "OpsDates1";
q = foreach q generate Account, daysBetween(toDate(OrderDate_sec_epoch), now()) as'daysOpened';
The resulting data stream displays the number of days since the opportunity was opened.
44
Date FunctionsSAQL Functions
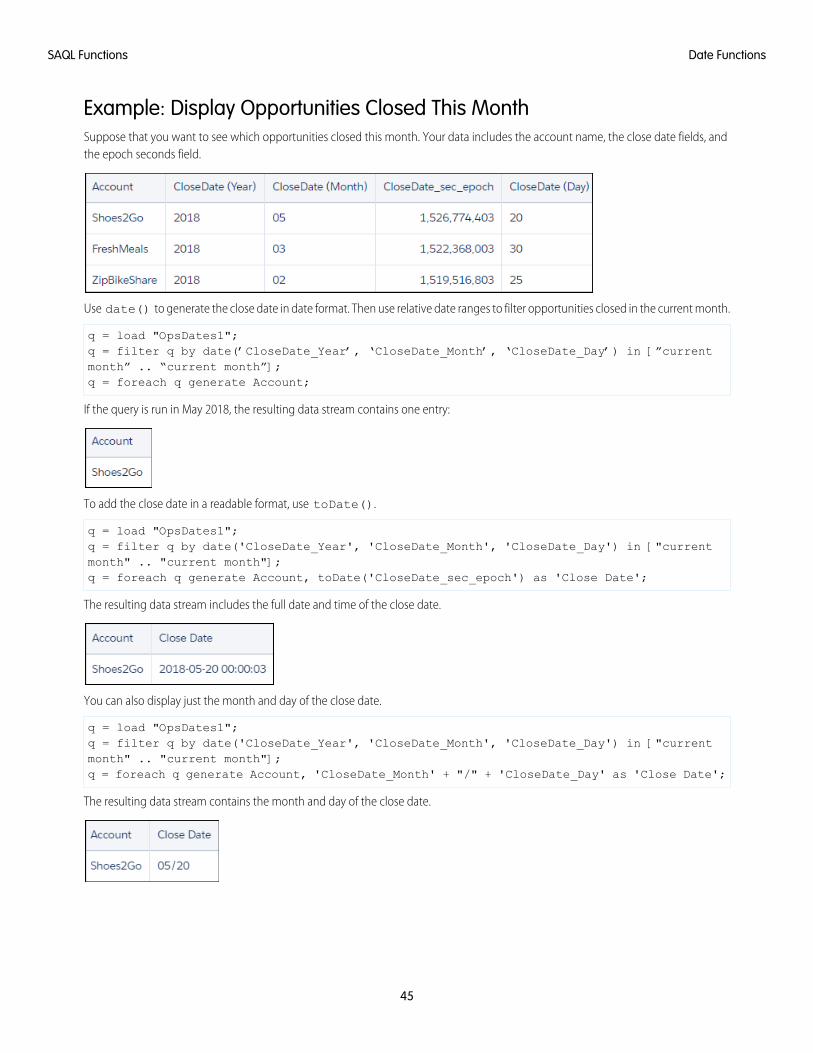
Example: Display Opportunities Closed This MonthSuppose that you want to see which opportunities closed this month. Your data includes the account name, the close date fields, andthe epoch seconds field.
Use date() to generate the close date in date format. Then use relative date ranges to filter opportunities closed in the current month.
q = load "OpsDates1";q = filter q by date(’CloseDate_Year’, ‘CloseDate_Month’, ‘CloseDate_Day’) in [”currentmonth” .. “current month”];q = foreach q generate Account;
If the query is run in May 2018, the resulting data stream contains one entry:
To add the close date in a readable format, use toDate().
q = load "OpsDates1";q = filter q by date('CloseDate_Year', 'CloseDate_Month', 'CloseDate_Day') in ["currentmonth" .. "current month"];q = foreach q generate Account, toDate('CloseDate_sec_epoch') as 'Close Date';
The resulting data stream includes the full date and time of the close date.
You can also display just the month and day of the close date.
q = load "OpsDates1";q = filter q by date('CloseDate_Year', 'CloseDate_Month', 'CloseDate_Day') in ["currentmonth" .. "current month"];q = foreach q generate Account, 'CloseDate_Month' + "/" + 'CloseDate_Day' as 'Close Date';
The resulting data stream contains the month and day of the close date.
45
Date FunctionsSAQL Functions
FunctionsUse these functions to use dates and date ranges in your SAQL queries.
Note: Relative dates are relative to UTC, not local time. Data returned for relative dates reflect dates based on UTC time, whichcan be offset from your local time.
date(year, month, day)Returns a date that can be used in a filter. Specify the year, month, and day. For example:
date('OrderDate_Year', 'OrderDate_Month', 'OrderDate_Day')
Examples:
Use this date filter to see all orders that have been placed in the past 30 days.
q = filter q by date('CloseDate_Year', 'CloseDate_Month', 'CloseDate_Day') in ["currentday - 30 days"..];
date_diff(datepart,startdate,enddate)Returns an integer representing the interval that has elapsed between two dates.
datepart indicates the interval part to calculate:
• year
• month
• quarter
• day
• week
• hour
• minute
• second
startdate indicates the start date.
enddate indicates the end date.
The difference between two dates is calculated based on the difference in the indicated date part. For example, the year differencebetween two dates is calculated by subtracting the year part of startdate from the year part of enddate.
date_diff("year", toDate("31-12-2015", "dd-MM-yyyy"), toDate("1-1-2016", "dd-MM-yyyy"))returns a result of 1.
Similarly, using the date part month as an example:
date_diff("month", toDate("31-12-2015", "dd-MM-yyyy"), toDate("1-1-2016", "dd-MM-yyyy"))returns a result of 1.
If startdate is after enddate the result is a negative integer of the difference.
Examples:
ResultQuery
46
Date FunctionsSAQL Functions
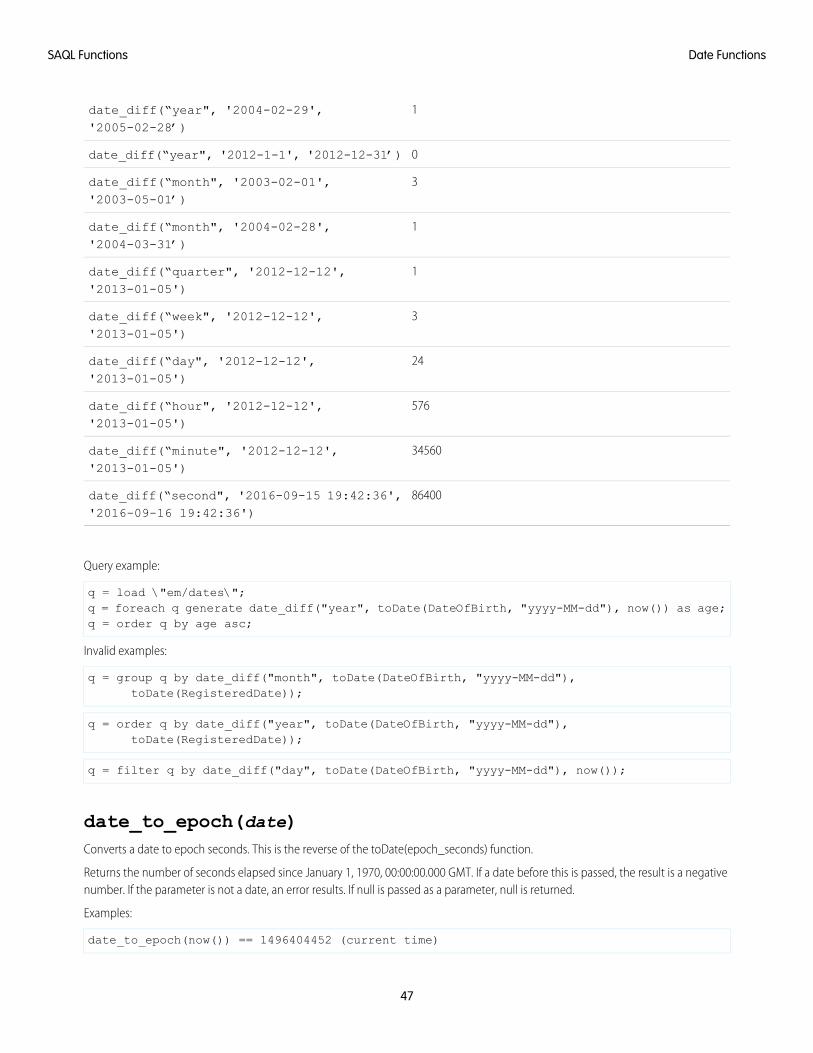
1date_diff(“year", '2004-02-29','2005-02-28’)
0date_diff(“year", '2012-1-1', '2012-12-31’)
3date_diff(“month", '2003-02-01','2003-05-01’)
1date_diff(“month", '2004-02-28','2004-03-31’)
1date_diff(“quarter", '2012-12-12','2013-01-05')
3date_diff(“week", '2012-12-12','2013-01-05')
24date_diff(“day", '2012-12-12','2013-01-05')
576date_diff(“hour", '2012-12-12','2013-01-05')
34560date_diff(“minute", '2012-12-12','2013-01-05')
86400date_diff(“second", '2016-09-15 19:42:36','2016-09-16 19:42:36')
Query example:
q = load \"em/dates\";q = foreach q generate date_diff("year", toDate(DateOfBirth, "yyyy-MM-dd"), now()) as age;q = order q by age asc;
Invalid examples:
q = group q by date_diff("month", toDate(DateOfBirth, "yyyy-MM-dd"),toDate(RegisteredDate));
q = order q by date_diff("year", toDate(DateOfBirth, "yyyy-MM-dd"),toDate(RegisteredDate));
q = filter q by date_diff("day", toDate(DateOfBirth, "yyyy-MM-dd"), now());
date_to_epoch(date)Converts a date to epoch seconds. This is the reverse of the toDate(epoch_seconds) function.
Returns the number of seconds elapsed since January 1, 1970, 00:00:00.000 GMT. If a date before this is passed, the result is a negativenumber. If the parameter is not a date, an error results. If null is passed as a parameter, null is returned.
Examples:
date_to_epoch(now()) == 1496404452 (current time)
47
Date FunctionsSAQL Functions
When supplying a date, first use the toDate() function to format the date correctly.
date_to_epoch(toDate("2017-06-02 11:54:12")) == 1496404452
date_to_string(date, formatString)Converts a date to a string.
This function must take a toDate() or now() function as its first argument.
q = foreach q generate date_to_string(now(), \"yyyy-MM-dd HH:mm:ss\") as ds1;
Note: Replaces (and is functionally identical to) the soon-to-be deprecated toString() function.
dateRange(startArray_y_m_d, endArray_y_m_d)Returns a fixed date range. The first parameter is an array that specifies the start date in the range. The second parameter is an array thatspecifies the end of the range. For example:
dateRange([1970, 1, 1], [1970, 1, 31])
day_in_month(date)Returns an integer representing the day of the month for a specific date. See day_in_week for usage.
day_in_quarter(date)Returns an integer representing the day of the quarter for a specific date. See day_in_week for usage.
day_in_week(date)Returns an integer representing the day of the week for a specific date. 1 = Sunday, 2 = Monday and so on.
date indicates the reference date.
Example:
q = foreach q generate day_in_week(toDate(OrderDate));
day_in_year(date)Returns an integer representing the day of the year for a specific date. See day_in_week for usage.
daysBetween(date1, date2)Returns the number of days between 2 dates as an integer.
48
Date FunctionsSAQL Functions
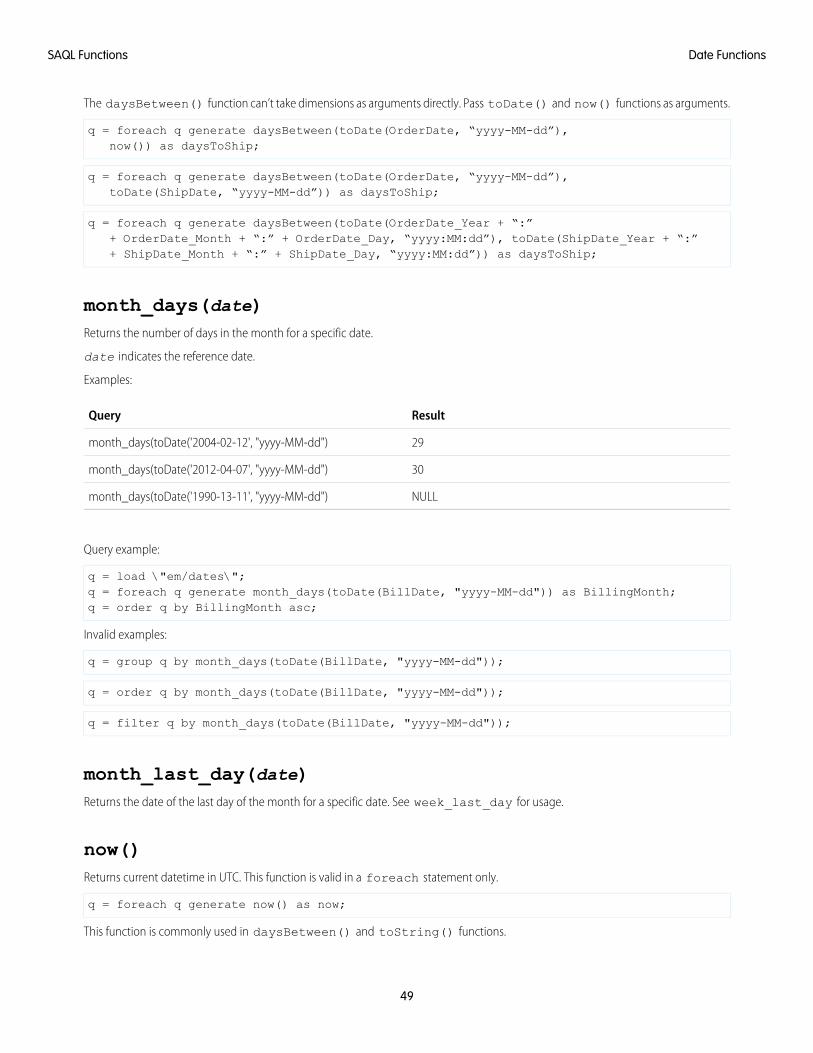
The daysBetween() function can’t take dimensions as arguments directly. Pass toDate() and now() functions as arguments.
q = foreach q generate daysBetween(toDate(OrderDate, “yyyy-MM-dd”),now()) as daysToShip;
q = foreach q generate daysBetween(toDate(OrderDate, “yyyy-MM-dd”),toDate(ShipDate, “yyyy-MM-dd”)) as daysToShip;
q = foreach q generate daysBetween(toDate(OrderDate_Year + “:”+ OrderDate_Month + “:” + OrderDate_Day, “yyyy:MM:dd”), toDate(ShipDate_Year + “:”+ ShipDate_Month + “:” + ShipDate_Day, “yyyy:MM:dd”)) as daysToShip;
month_days(date)Returns the number of days in the month for a specific date.
date indicates the reference date.
Examples:
ResultQuery
29month_days(toDate('2004-02-12', "yyyy-MM-dd")
30month_days(toDate('2012-04-07', "yyyy-MM-dd")
NULLmonth_days(toDate('1990-13-11', "yyyy-MM-dd")
Query example:
q = load \"em/dates\";q = foreach q generate month_days(toDate(BillDate, "yyyy-MM-dd")) as BillingMonth;q = order q by BillingMonth asc;
Invalid examples:
q = group q by month_days(toDate(BillDate, "yyyy-MM-dd"));
q = order q by month_days(toDate(BillDate, "yyyy-MM-dd"));
q = filter q by month_days(toDate(BillDate, "yyyy-MM-dd"));
month_last_day(date)Returns the date of the last day of the month for a specific date. See week_last_day for usage.
now()Returns current datetime in UTC. This function is valid in a foreach statement only.
q = foreach q generate now() as now;
This function is commonly used in daysBetween() and toString() functions.
49
Date FunctionsSAQL Functions
quarter_days(date)Returns the number of days in the quarter for a specific date. See month_days for usage.
quarter_last_day(date)Returns the date of the last day of the quarter for a specific date. See week_last_day for usage.
toDate(string [,formatString])Converts a string to a date. If a formatString argument isn’t provided, the function uses the format yyyy-MM-dd HH:mm:ss.
q = foreach q generate toDate(OrderDate);
q = foreach q generate toDate(OrderDate_Day + \"-\" + OrderDate_Month + \"-\" + OrderDate_Year, \"dd-MM-yyyy\");
This function is often passed as an argument to daysBetween() or toString().
toDate(epoch_seconds)Converts Unix epoch seconds to a date. If epoch_seconds is 0, toDate(epoch_seconds) returns '1970-01-0100:00:00'.
Note: Be sure to use the sec_epoch field and not the day_epoch field.
This function is convenient for adding or subtracting time periods to or from a date. When adjusting dates for time zone differences,adding or subtracting the number of seconds in the time difference produces the correct local date. If the time crosses the local meridian,a different date is produced.
For example, assuming Current_Date is the current date expressed as the number of seconds since '1970-01-01 00:00:00',then the function toDate(Current_Date - 8*3600) subtracts 8 hours. Refer to Working with Time Zones for a practicalexample.
toString(date, formatString)Converts a date to a string.
This function must take a toDate() or now() function as its first argument.
q = foreach q generate toString(now(), \"yyyy-MM-dd HH:mm:ss\") as ds1;
Note: This function is scheduled to be deprecated. Use the functionally identical date_to_string() on page 48 function instead.
week_last_day(date)Returns the date of the last day of the week for a specific date.
date indicates the reference date.
Examples:
50
Date FunctionsSAQL Functions
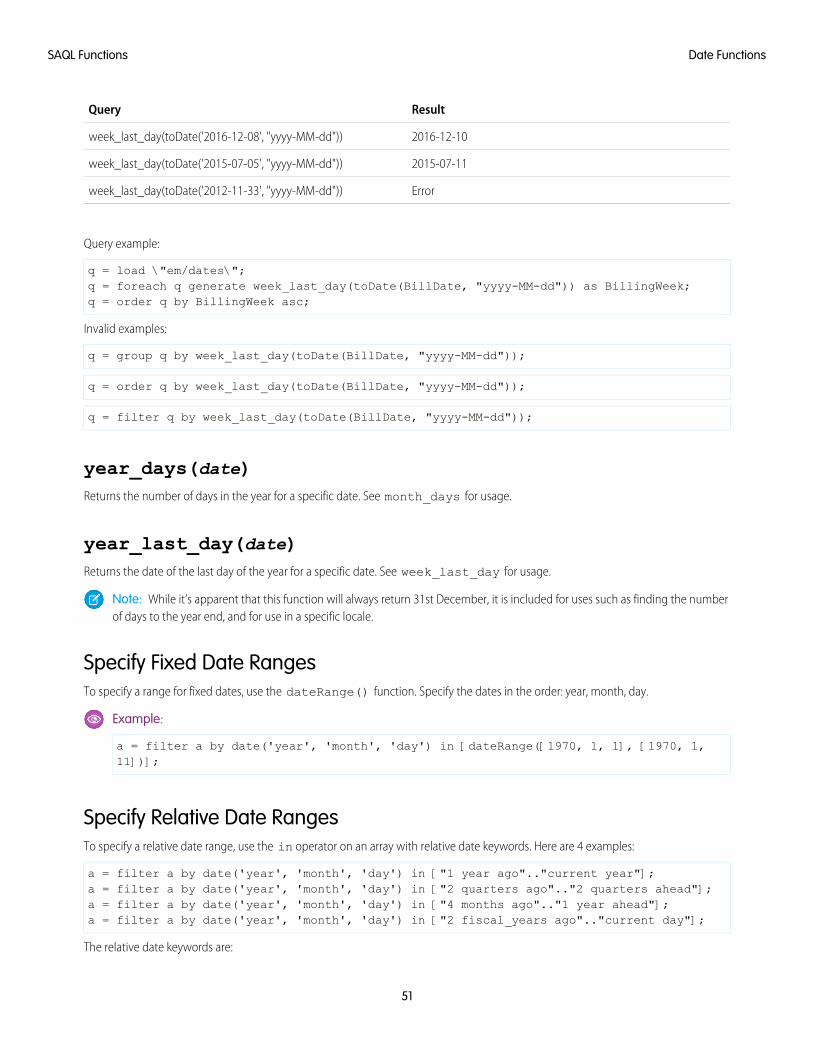
ResultQuery
2016-12-10week_last_day(toDate('2016-12-08', "yyyy-MM-dd"))
2015-07-11week_last_day(toDate('2015-07-05', "yyyy-MM-dd"))
Errorweek_last_day(toDate('2012-11-33', "yyyy-MM-dd"))
Query example:
q = load \"em/dates\";q = foreach q generate week_last_day(toDate(BillDate, "yyyy-MM-dd")) as BillingWeek;q = order q by BillingWeek asc;
Invalid examples:
q = group q by week_last_day(toDate(BillDate, "yyyy-MM-dd"));
q = order q by week_last_day(toDate(BillDate, "yyyy-MM-dd"));
q = filter q by week_last_day(toDate(BillDate, "yyyy-MM-dd"));
year_days(date)Returns the number of days in the year for a specific date. See month_days for usage.
year_last_day(date)Returns the date of the last day of the year for a specific date. See week_last_day for usage.
Note: While it’s apparent that this function will always return 31st December, it is included for uses such as finding the numberof days to the year end, and for use in a specific locale.
Specify Fixed Date RangesTo specify a range for fixed dates, use the dateRange() function. Specify the dates in the order: year, month, day.
Example:
a = filter a by date('year', 'month', 'day') in [dateRange([1970, 1, 1], [1970, 1,11])];
Specify Relative Date RangesTo specify a relative date range, use the in operator on an array with relative date keywords. Here are 4 examples:
a = filter a by date('year', 'month', 'day') in ["1 year ago".."current year"];a = filter a by date('year', 'month', 'day') in ["2 quarters ago".."2 quarters ahead"];a = filter a by date('year', 'month', 'day') in ["4 months ago".."1 year ahead"];a = filter a by date('year', 'month', 'day') in ["2 fiscal_years ago".."current day"];
The relative date keywords are:
51
Date FunctionsSAQL Functions
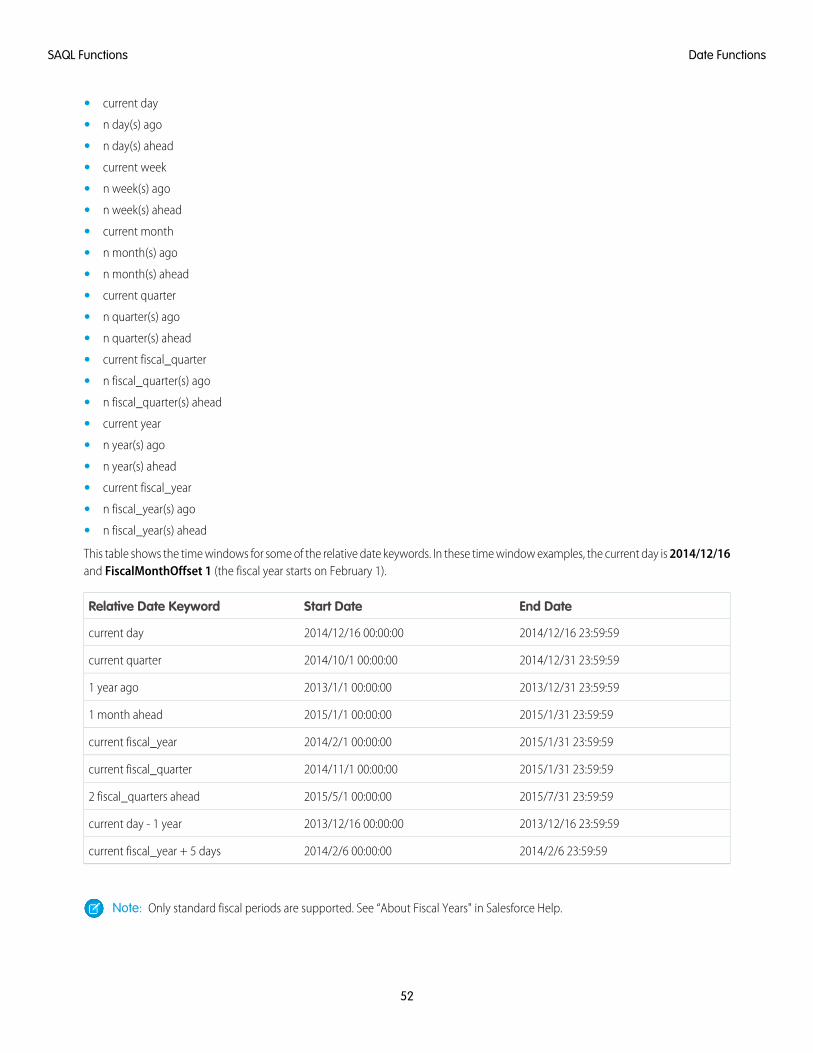
• current day
• n day(s) ago
• n day(s) ahead
• current week
• n week(s) ago
• n week(s) ahead
• current month
• n month(s) ago
• n month(s) ahead
• current quarter
• n quarter(s) ago
• n quarter(s) ahead
• current fiscal_quarter
• n fiscal_quarter(s) ago
• n fiscal_quarter(s) ahead
• current year
• n year(s) ago
• n year(s) ahead
• current fiscal_year
• n fiscal_year(s) ago
• n fiscal_year(s) ahead
This table shows the time windows for some of the relative date keywords. In these time window examples, the current day is 2014/12/16and FiscalMonthOffset 1 (the fiscal year starts on February 1).
End DateStart DateRelative Date Keyword
2014/12/16 23:59:592014/12/16 00:00:00current day
2014/12/31 23:59:592014/10/1 00:00:00current quarter
2013/12/31 23:59:592013/1/1 00:00:001 year ago
2015/1/31 23:59:592015/1/1 00:00:001 month ahead
2015/1/31 23:59:592014/2/1 00:00:00current fiscal_year
2015/1/31 23:59:592014/11/1 00:00:00current fiscal_quarter
2015/7/31 23:59:592015/5/1 00:00:002 fiscal_quarters ahead
2013/12/16 23:59:592013/12/16 00:00:00current day - 1 year
2014/2/6 23:59:592014/2/6 00:00:00current fiscal_year + 5 days
Note: Only standard fiscal periods are supported. See “About Fiscal Years" in Salesforce Help.
52
Date FunctionsSAQL Functions
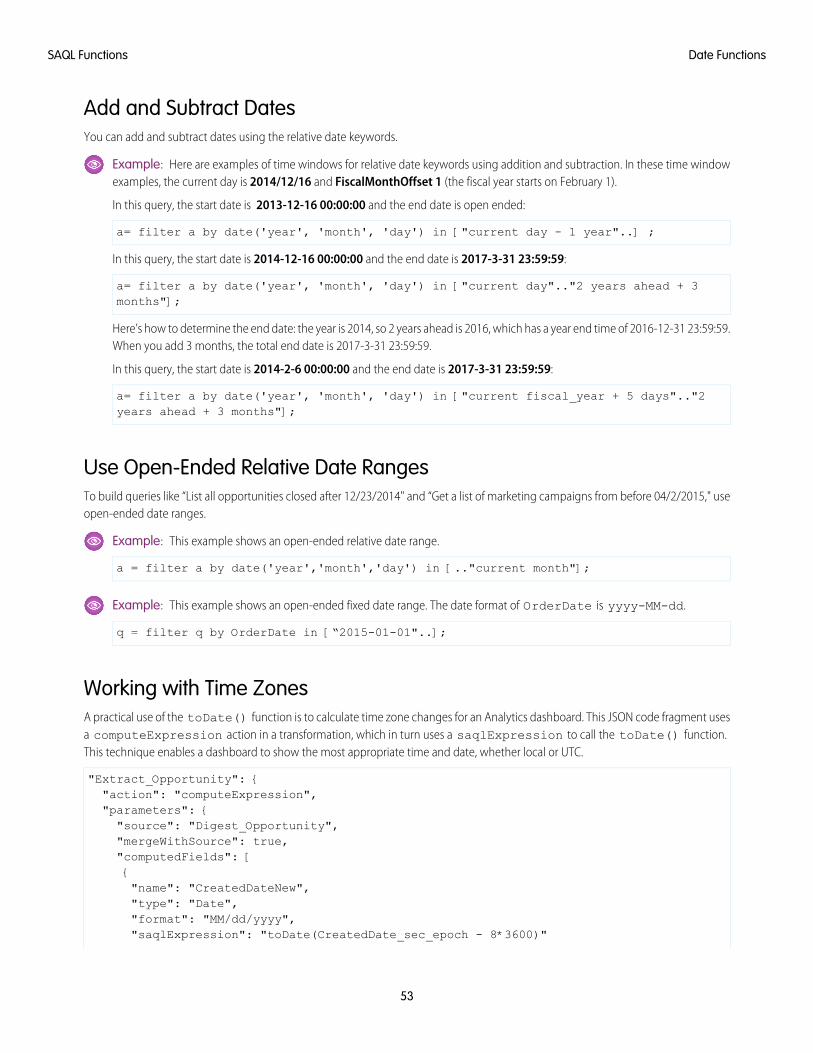
Add and Subtract DatesYou can add and subtract dates using the relative date keywords.
Example: Here are examples of time windows for relative date keywords using addition and subtraction. In these time windowexamples, the current day is 2014/12/16 and FiscalMonthOffset 1 (the fiscal year starts on February 1).
In this query, the start date is 2013-12-16 00:00:00 and the end date is open ended:
a= filter a by date('year', 'month', 'day') in ["current day - 1 year"..] ;
In this query, the start date is 2014-12-16 00:00:00 and the end date is 2017-3-31 23:59:59:
a= filter a by date('year', 'month', 'day') in ["current day".."2 years ahead + 3months"];
Here’s how to determine the end date: the year is 2014, so 2 years ahead is 2016, which has a year end time of 2016-12-31 23:59:59.When you add 3 months, the total end date is 2017-3-31 23:59:59.
In this query, the start date is 2014-2-6 00:00:00 and the end date is 2017-3-31 23:59:59:
a= filter a by date('year', 'month', 'day') in ["current fiscal_year + 5 days".."2years ahead + 3 months"];
Use Open-Ended Relative Date RangesTo build queries like “List all opportunities closed after 12/23/2014" and “Get a list of marketing campaigns from before 04/2/2015," useopen-ended date ranges.
Example: This example shows an open-ended relative date range.
a = filter a by date('year','month','day') in [.."current month"];
Example: This example shows an open-ended fixed date range. The date format of OrderDate is yyyy-MM-dd.
q = filter q by OrderDate in [“2015-01-01"..];
Working with Time ZonesA practical use of the toDate() function is to calculate time zone changes for an Analytics dashboard. This JSON code fragment usesa computeExpression action in a transformation, which in turn uses a saqlExpression to call the toDate() function.This technique enables a dashboard to show the most appropriate time and date, whether local or UTC.
"Extract_Opportunity": {"action": "computeExpression","parameters": {"source": "Digest_Opportunity","mergeWithSource": true,"computedFields": [{"name": "CreatedDateNew","type": "Date","format": "MM/dd/yyyy","saqlExpression": "toDate(CreatedDate_sec_epoch - 8*3600)"
53
Date FunctionsSAQL Functions
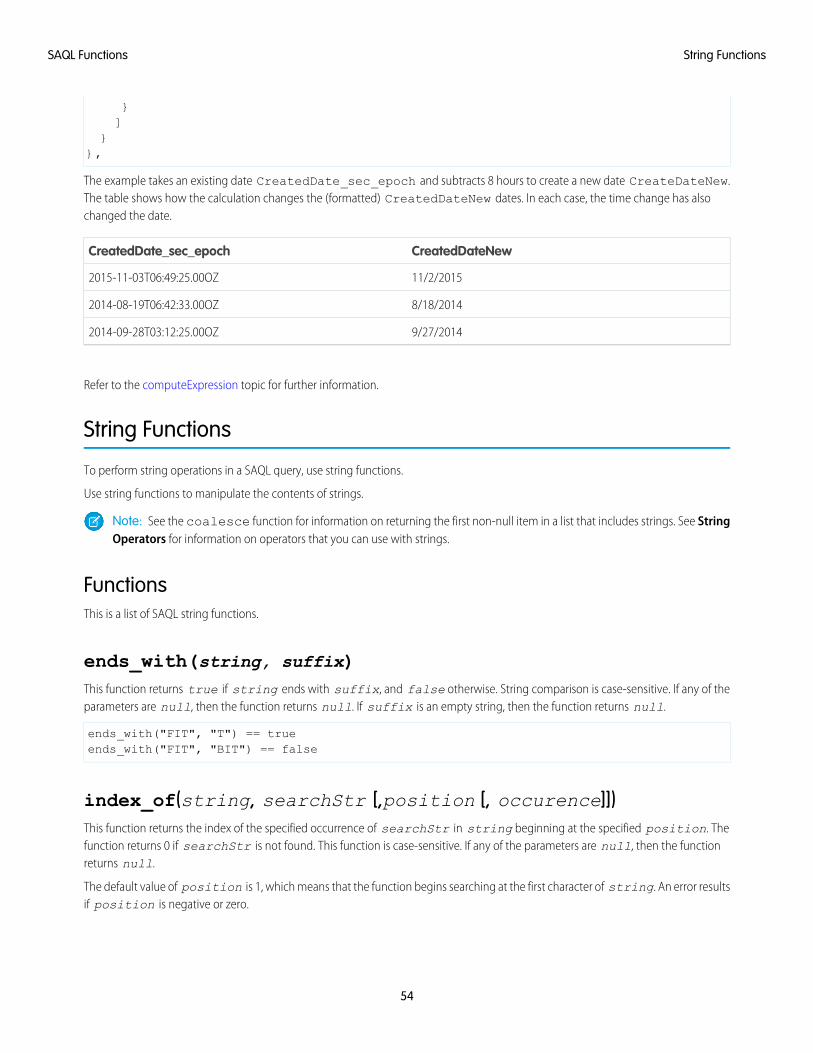
}]
}},
The example takes an existing date CreatedDate_sec_epoch and subtracts 8 hours to create a new date CreateDateNew.The table shows how the calculation changes the (formatted) CreatedDateNew dates. In each case, the time change has alsochanged the date.
CreatedDateNewCreatedDate_sec_epoch
11/2/20152015-11-03T06:49:25.00OZ
8/18/20142014-08-19T06:42:33.00OZ
9/27/20142014-09-28T03:12:25.00OZ
Refer to the computeExpression topic for further information.
String Functions
To perform string operations in a SAQL query, use string functions.
Use string functions to manipulate the contents of strings.
Note: See the coalesce function for information on returning the first non-null item in a list that includes strings. See StringOperators for information on operators that you can use with strings.
FunctionsThis is a list of SAQL string functions.
ends_with(string, suffix)This function returns true if string ends with suffix, and false otherwise. String comparison is case-sensitive. If any of theparameters are null, then the function returns null. If suffix is an empty string, then the function returns null.
ends_with("FIT", "T") == trueends_with("FIT", "BIT") == false
index_of(string, searchStr [,position [, occurence]])This function returns the index of the specified occurrence of searchStr in string beginning at the specified position. Thefunction returns 0 if searchStr is not found. This function is case-sensitive. If any of the parameters are null, then the functionreturns null.
The default value of position is 1, which means that the function begins searching at the first character of string. An error resultsif position is negative or zero.
54
String FunctionsSAQL Functions
If present, occurrence is an integer indicating which occurrence within string to search for. The value of occurrence must bepositive, and defaults to 1 if omitted. So for example, if there is more than one matching occurrence, and occurence is 2, the indexof the second occurrence is returned.
Constant values are supported for position and occurrence, not arbitrary expressions.
If searchStr is an empty string, then the function returns null.
index_of("Hawaii", "a") == 2index_of("Hawaii", "a", 2) == 2index_of("Hawaii", "a", 3) == 4index_of("Hawaii", "a", 3, 2) == 0index_of("Hawaii", "i", -1, 1) == errorindex_of("Hawaii", "i", -3, 1) == errorindex_of("", "i") == nullindex_of("i", "") == null
len(string)This function returns the number of characters in the string.
len returns the length of string in characters. If string is null, then len(string) is also null.
Leading and trailing whitespace characters are included in the length returned.
len("starfox") == 7len(" rocket ") == 8len(" ") == 1len("") == 0
lower(string)This function returns string with all characters in lowercase. If string is null, then the result is null. Refer to the note forupper() concerning Unicode case mapping.
lower("JAVA") == "java"
ltrim(string,chars)This function removes the left part of a string up to the specified characters, or removes leading spaces.
ltrim returns the value of string with the initial characters removed up to the first character not in chars.
chars may contain multiple characters. If chars is omitted, leading space characters are removed. If string or chars is null,then the result is null.
ltrim("__c__val__", "_") == "c__val__"ltrim(string, " \t\r") == ltrim(string)ltrim("aabcd", "ab") == "cd"
number_to_string(number, number_format)This function converts a number literal to a string literal.
55
String FunctionsSAQL Functions
number_to_string returns a string representation of the number number. The string is formatted as specified bynumber_format. number_format can specify either one or two parameters:
• number_to_string(number, number_format)
The format specified by number_format is used for both positive and negative numbers.
• number_to_string(number, <POSITIVE>;<NEGATIVE>)
If number is positive, the number format specified by <POSITIVE> is used. If number is negative, the number format specifiedby <NEGATIVE> is used. Note the semicolon separating the two specified formats.
Functionality supported by number_format includes:
• 0, #, decimal point(.)
• Thousands separator (,)
• Percentages (by postfixing %)
• Prefix and postfix characters: $, +, -, (, ), :, !, ^,&,’,~,{,}
For example:
Use number_formatRequired string literalNumber literal
####.#1234.61234.56
#.0008.9008.9
0.#0.6.631
#.0#12.012
#.0#1234.571234.568
#,###12,00012000
#,1212000
0.0,,12.212200000
000000001212
#.00%3.46%0.03457
$#.00;($#.00)$12.3012.3
$#.00;($#.00)($12.30)-12.3
+;-+32
+;---32
If either argument is null, or if the conversion fails, null is returned.
56
String FunctionsSAQL Functions
replace(string, searchStr, replaceStr)This function returns string with every occurrence of searchStr replaced by replaceStr. If any of the parameters are null,then the function returns null. If searchStr is an empty string, null is returned. This function is case-sensitive.
replace("Watson, come quickly.", "quickly", "slowly") == "Watson, come slowly."replace("Watson, come quickly.", "o", "a") == "Watsan, came quickly."replace("Watson, come quickly.", "", "Mr.") == null
rtrim(string,chars)This function removes the right part of a string back to the specified characters, or removes trailing spaces.
rtrim returns the value of string with the final characters removed back to the first character not in chars.
chars may contain multiple characters. If chars is omitted, trailing space characters are removed. If string or chars is null,then the result is null.
rtrim("__c__val__", "_") == "__c__val"rtrim(ltrim(string, " \t\r"), " \t\r") == trim(string, " \t\r")
starts_with(string, prefix)This function returns true if string starts with prefix, and false otherwise. String comparison is case-sensitive. If any of theparameters are null, then the function returns null. If prefix is an empty string, then the function returns null.
starts_with("FIT", "F") == truestarts_with("FIT", "BIT") == false
string_to_number(string)Function to convert a string literal to a number literal.
This is the reverse of the number_to_string function. If the conversion fails, null is returned.
substr(string,position[, length])This function returns a substring starting at a specified position and, optionally, of the specified length.
substr returns length characters of string, beginning at character position position. If length is omitted, then length= len(string), so all characters are returned from position to the end of the string. If any of the parameters are null, thenthe function returns null.
The first character in string is at position 1. If position is negative then the position is relative to the end of the string. So aposition of -1 denotes the last character.
If length is negative, then the function returns null. If position > len (string) or position < -len(string) orposition = 0, then the empty string is returned.
substr("CRM", 1, 1) == "C"substr("CRM", 1, 2) == "CR"substr("CRM", -1, 1) == "M"substr("CRM", -2, 2) == "RM"
57
String FunctionsSAQL Functions
substr("CRM", 4, 1) == ""substr("2018-03-16T00:00:03.000Z",10) == "2018-03-16"
trim(string,chars)This function removes the left and right part of a string up to the specified characters, or removes leading and trailing spaces.
trim returns the value of string with the initial and final characters removed to the first character not in chars.
chars may contain multiple characters. If chars is omitted, leading and trailing space characters are removed. If string orchars is null, then the result is null.
trim("__c__val__", "_") == "c__val"trim("__c__val__", "_c") == "val"trim(" c__val ") == "c__val"trim(" c__val ") == ltrim(rtrim(" c__val "))trim("aaaaaa", "a") == ""
upper(string)This function returns string with all characters in uppercase. If string is null, then the result is null.
upper("go") == "GO"upper ("große") == "GROßE"
Note: The behavior of the upper() and lower() functions—and the characters affected by them—is determined by thedefault case mapping of the Unicode standard. The mapping considers each Unicode character in isolation without regard forcontext or language-specific rules. The example above does not reflect the German language handling of the ß character. Anatural-language conversion would produce GROSSE.
Math Functions
To perform numeric operations in a SAQL query, use math functions.
You can use SAQL math functions in foreach statements and in the filter by clause after a foreach statement.
You can't use math functions in a group by clause or in an order by clause. You also can't use math functions in the filterby clause before a foreach statement, but you can use them after the foreach statement.
FunctionsThis is a list of SAQL math functions.
abs(n)Returns the absolute number of n as a numeric value. n can be any real numeric value in the range of -1e308 <= n <= 1e308.
This example is valid:
q = foreach q generate abs(pct_change) as pct_magnitude;
58
Math FunctionsSAQL Functions
These examples are invalid:
q = group q by abs(pct_change);q = order q by abs(pct_change);
ceil(n)Returns the nearest integer of equal or greater value to n. n can be any real numeric value in the range of -1e308 <= n <= 1e308.
This example is valid:
q = foreach q generate ceil(miles) as distance;
These examples are invalid:
q = group q by ceil(miles);q = order q by ceil(miles);
floor(n)Returns the nearest integer of equal or lesser value to n. n can be any real numeric value in the range of -1e308 <= n <= 1e308.
This example is valid:
q = foreach q generate floor(miles) as distance;
These examples are invalid:
q = group q by floor(miles);q = order q by floor(miles);
trunc(n[, m])Returns the value of the numeric expression n truncated to m decimal places. m can be negative, in which case the function returnsn truncated to -m places to the left of the decimal point. If m is omitted, it returns n truncated to the integer place. n can be any realnumeric value in the range of -1e308 <= n <= 1e308. m can be an integer value between -15 and 15 inclusive.
This example is valid:
q = foreach q generate trunc(Price, 2) as Price;
These examples are invalid:
q = group q by trunc(Price, 2);q = order q by trunc(Price, 2);
round(n[, m])Returns the value of n rounded to m decimal places. m can be negative, in which case the function returns n rounded to -m places tothe left of the decimal point. If m is omitted, it returns n rounded to the nearest integer. For tie-breaking, it follows round half way fromzero convention. n can be any real numeric value in the range of -1e308 <= n <= 1e308. m can be an integer value between -15 and15, inclusive.
59
Math FunctionsSAQL Functions
This example is valid:
q = foreach q generate round(Price, 2) as Price;
These examples are invalid:
q = group q by round(Price, 2);q = order q by round(Price, 2);
exp(n)Returns the value of Euler's number e raised to the power of n, where e = 2.71828183… The smallest value for n that will not resultin 0 is 3e-324. n can be any real numeric value in the range of -1e308 <= n <= 700.
These examples are valid:
q = foreach q generate exp(value) as value;q = filter q by exp(value) < 5;
These examples are invalid:
q = group q by exp(value);q = order q by exp(value);
log(m, n)Returns the natural logarithm (base m) of a number n. The values m and n can be any positive, non-zero numeric value in the range 0< m, n <= 1e308 and m ≠ 1.
The smallest number input allowed for m is >0, m!=1. The smallest number for m or n that will not produce 0 is log(10, 0.3e-323).
These examples are valid:
q = foreach q generate log(10, Population) as Population;q = filter q by log(10, Population) < 15;
These examples are invalid:
q = group q by log(10, Population);q = order q by log(10, Population);
power(m, n)Returns m raised to the nth power. m, n can be any numeric value in the range of -1e308 <= m, n <= 1e308. Returns null if m = 0and n < 0.
• If m = 0, n must be a non-negative value.
• If m < 0, n must be an integer value.
• The result of power(m, n) must be within the range expressed by a float64 number.
These examples are valid:
q = foreach q generate power(length, 2) as area, length;q = filter q by power(length, 2) > 10;
60
Math FunctionsSAQL Functions
These examples are invalid:
q = group q by power(length, 2);q = order q by power(length, 2);
sqrt(n)Returns the square root of a number n. The value n can be any non-negative numeric value in the range of 0 <= n <= 1e308.
These examples are valid:
q = foreach q generate sqrt(value) as value;q = filter q by sqrt(value) < 10;
These examples are invalid:
q = group q by sqrt(value);q = order q by sqrt(value);
Windowing Functions
Use SAQL windowing functionality to calculate common business cases such as percent of grand total, moving average, year and quartergrowth, and ranking.
SAQL now supports windowing, using a syntax inspired by SQL. Windowing functions allow you to calculate data for a single groupusing aggregated data from adjacent groups. Windowing does not change the number of rows returned by the query. Windowingaggregates across groups rather than within groups and accepts any valid numerical projection on which to aggregate.
Windowing with an aggregate function uses the following syntax:
<windowfunction>(<projection expression>) over (<row range> partition by <reset groups>order by <order clause>) as <label>
When using ranking functions, use the following syntax:
<rankfunction> over([..] partition by <reset groups> order by <order clause>) as <label>
Where:
windowfunctionAn aggregate function that supports windowing. Currently supported functions are avg, sum, min, max, count, median,percentile_disc, and percentile_cont.
rankfunctionReturns a rank value for each row in a partition. The following ranking functions are supported: rank(), dense_rank(),cume_dist() and row_number(). Refer to the Ranking Functions section for examples.
projection expression
The expression used to generate a projection from the values of specified columns.
row range
Row ranges are specified using the following syntax.
61
Windowing FunctionsSAQL Functions
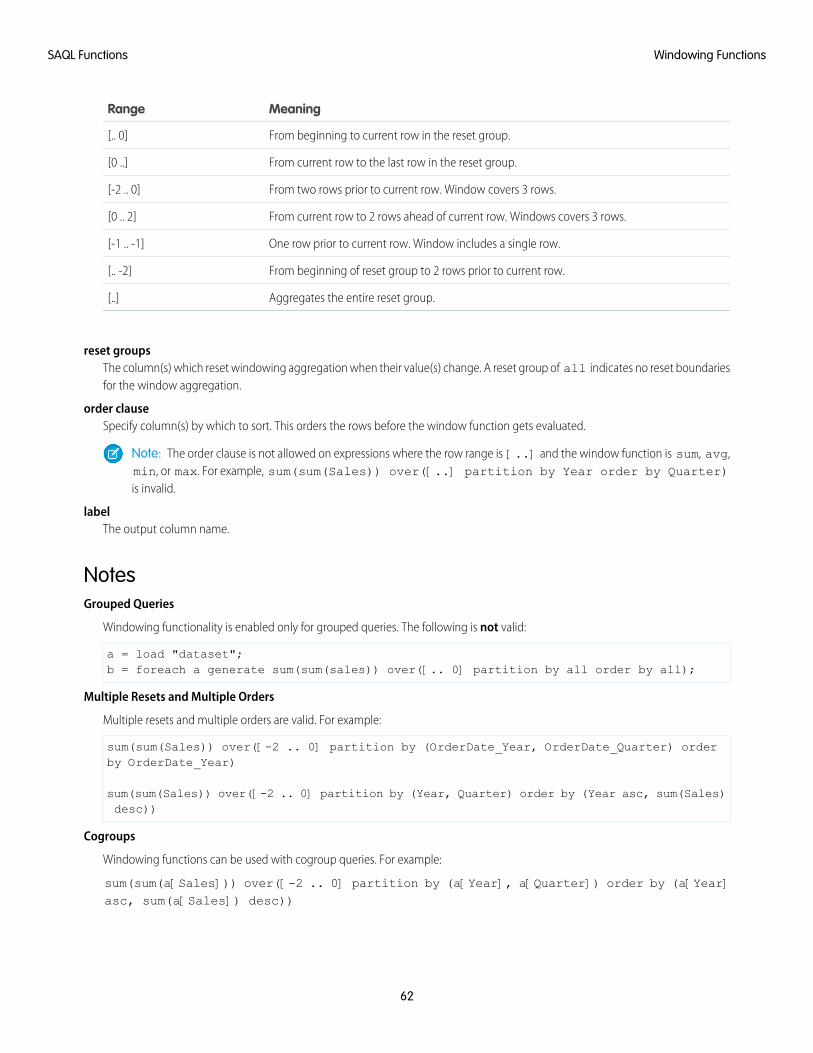
MeaningRange
From beginning to current row in the reset group.[.. 0]
From current row to the last row in the reset group.[0 ..]
From two rows prior to current row. Window covers 3 rows.[-2 .. 0]
From current row to 2 rows ahead of current row. Windows covers 3 rows.[0 .. 2]
One row prior to current row. Window includes a single row.[-1 .. -1]
From beginning of reset group to 2 rows prior to current row.[.. -2]
Aggregates the entire reset group.[..]
reset groupsThe column(s) which reset windowing aggregation when their value(s) change. A reset group of all indicates no reset boundariesfor the window aggregation.
order clauseSpecify column(s) by which to sort. This orders the rows before the window function gets evaluated.
Note: The order clause is not allowed on expressions where the row range is [..] and the window function is sum, avg,min, or max. For example, sum(sum(Sales)) over([..] partition by Year order by Quarter)is invalid.
labelThe output column name.
NotesGrouped Queries
Windowing functionality is enabled only for grouped queries. The following is not valid:
a = load "dataset";b = foreach a generate sum(sum(sales)) over([.. 0] partition by all order by all);
Multiple Resets and Multiple Orders
Multiple resets and multiple orders are valid. For example:
sum(sum(Sales)) over([-2 .. 0] partition by (OrderDate_Year, OrderDate_Quarter) orderby OrderDate_Year)
sum(sum(Sales)) over([-2 .. 0] partition by (Year, Quarter) order by (Year asc, sum(Sales)desc))
Cogroups
Windowing functions can be used with cogroup queries. For example:
sum(sum(a[Sales])) over([-2 .. 0] partition by (a[Year], a[Quarter]) order by (a[Year]asc, sum(a[Sales]) desc))
62
Windowing FunctionsSAQL Functions
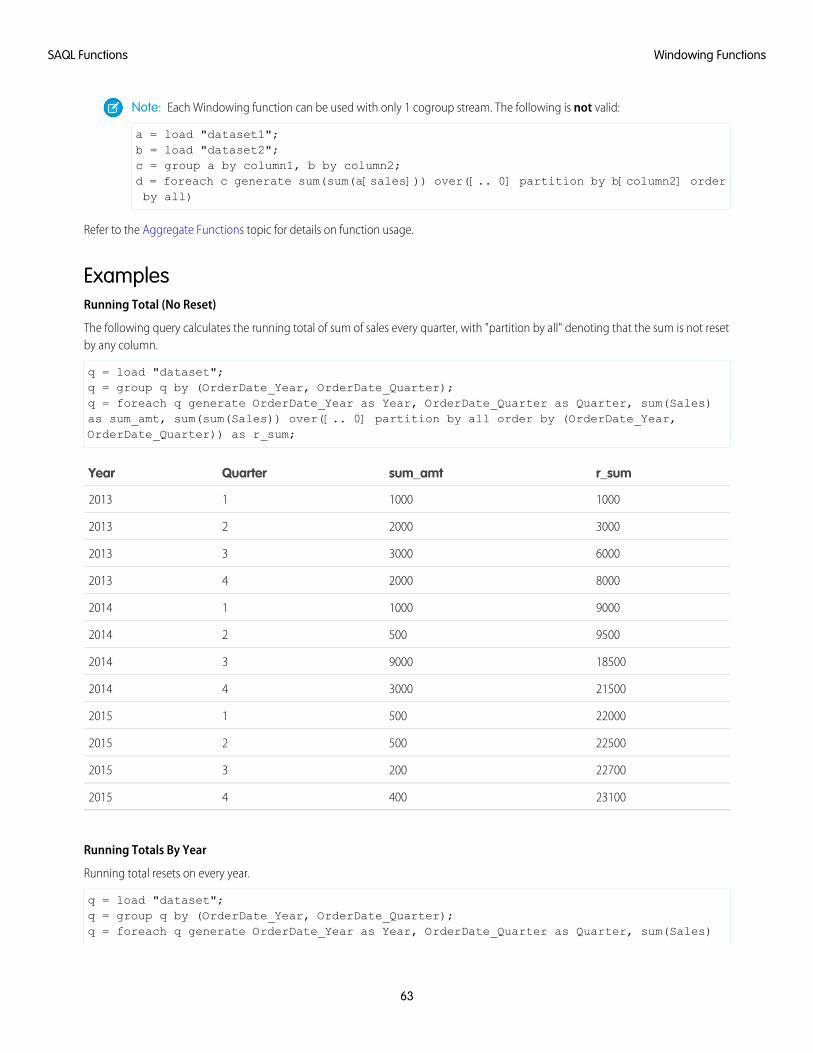
Note: Each Windowing function can be used with only 1 cogroup stream. The following is not valid:
a = load "dataset1";b = load "dataset2";c = group a by column1, b by column2;d = foreach c generate sum(sum(a[sales])) over([.. 0] partition by b[column2] orderby all)
Refer to the Aggregate Functions topic for details on function usage.
ExamplesRunning Total (No Reset)
The following query calculates the running total of sum of sales every quarter, with "partition by all" denoting that the sum is not resetby any column.
q = load "dataset";q = group q by (OrderDate_Year, OrderDate_Quarter);q = foreach q generate OrderDate_Year as Year, OrderDate_Quarter as Quarter, sum(Sales)as sum_amt, sum(sum(Sales)) over([.. 0] partition by all order by (OrderDate_Year,OrderDate_Quarter)) as r_sum;
r_sumsum_amtQuarterYear
1000100012013
3000200022013
6000300032013
8000200042013
9000100012014
950050022014
18500900032014
21500300042014
2200050012015
2250050022015
2270020032015
2310040042015
Running Totals By Year
Running total resets on every year.
q = load "dataset";q = group q by (OrderDate_Year, OrderDate_Quarter);q = foreach q generate OrderDate_Year as Year, OrderDate_Quarter as Quarter, sum(Sales)
63
Windowing FunctionsSAQL Functions
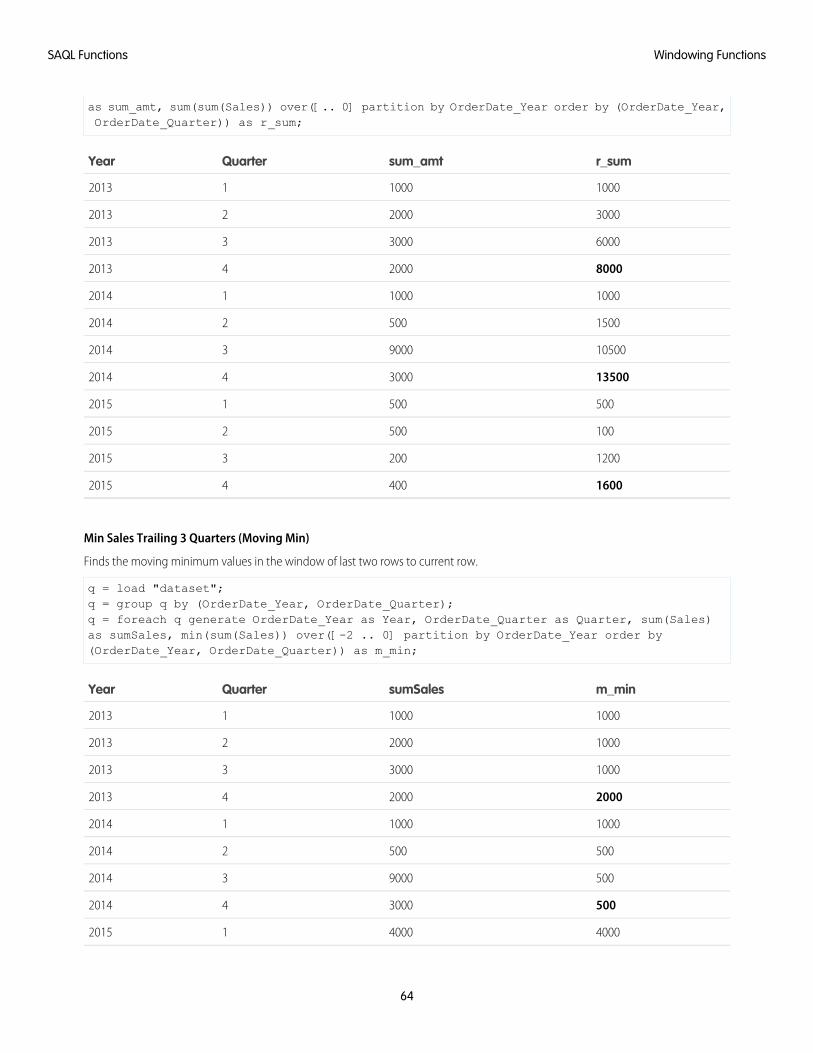
as sum_amt, sum(sum(Sales)) over([.. 0] partition by OrderDate_Year order by (OrderDate_Year,OrderDate_Quarter)) as r_sum;
r_sumsum_amtQuarterYear
1000100012013
3000200022013
6000300032013
8000200042013
1000100012014
150050022014
10500900032014
13500300042014
50050012015
10050022015
120020032015
160040042015
Min Sales Trailing 3 Quarters (Moving Min)
Finds the moving minimum values in the window of last two rows to current row.
q = load "dataset";q = group q by (OrderDate_Year, OrderDate_Quarter);q = foreach q generate OrderDate_Year as Year, OrderDate_Quarter as Quarter, sum(Sales)as sumSales, min(sum(Sales)) over([-2 .. 0] partition by OrderDate_Year order by(OrderDate_Year, OrderDate_Quarter)) as m_min;
m_minsumSalesQuarterYear
1000100012013
1000200022013
1000300032013
2000200042013
1000100012014
50050022014
500900032014
500300042014
4000400012015
64
Windowing FunctionsSAQL Functions
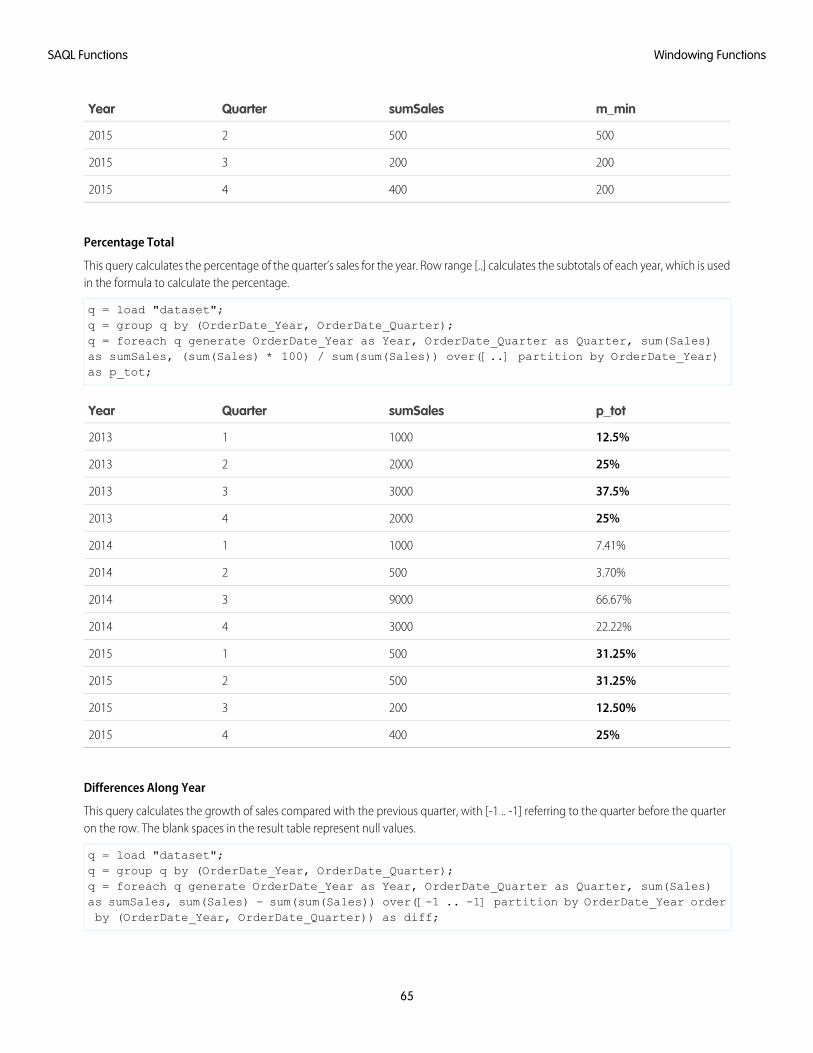
m_minsumSalesQuarterYear
50050022015
20020032015
20040042015
Percentage Total
This query calculates the percentage of the quarter’s sales for the year. Row range [..] calculates the subtotals of each year, which is usedin the formula to calculate the percentage.
q = load "dataset";q = group q by (OrderDate_Year, OrderDate_Quarter);q = foreach q generate OrderDate_Year as Year, OrderDate_Quarter as Quarter, sum(Sales)as sumSales, (sum(Sales) * 100) / sum(sum(Sales)) over([..] partition by OrderDate_Year)as p_tot;
p_totsumSalesQuarterYear
12.5%100012013
25%200022013
37.5%300032013
25%200042013
7.41%100012014
3.70%50022014
66.67%900032014
22.22%300042014
31.25%50012015
31.25%50022015
12.50%20032015
25%40042015
Differences Along Year
This query calculates the growth of sales compared with the previous quarter, with [-1 .. -1] referring to the quarter before the quarteron the row. The blank spaces in the result table represent null values.
q = load "dataset";q = group q by (OrderDate_Year, OrderDate_Quarter);q = foreach q generate OrderDate_Year as Year, OrderDate_Quarter as Quarter, sum(Sales)as sumSales, sum(Sales) - sum(sum(Sales)) over([-1 .. -1] partition by OrderDate_Year orderby (OrderDate_Year, OrderDate_Quarter)) as diff;
65
Windowing FunctionsSAQL Functions
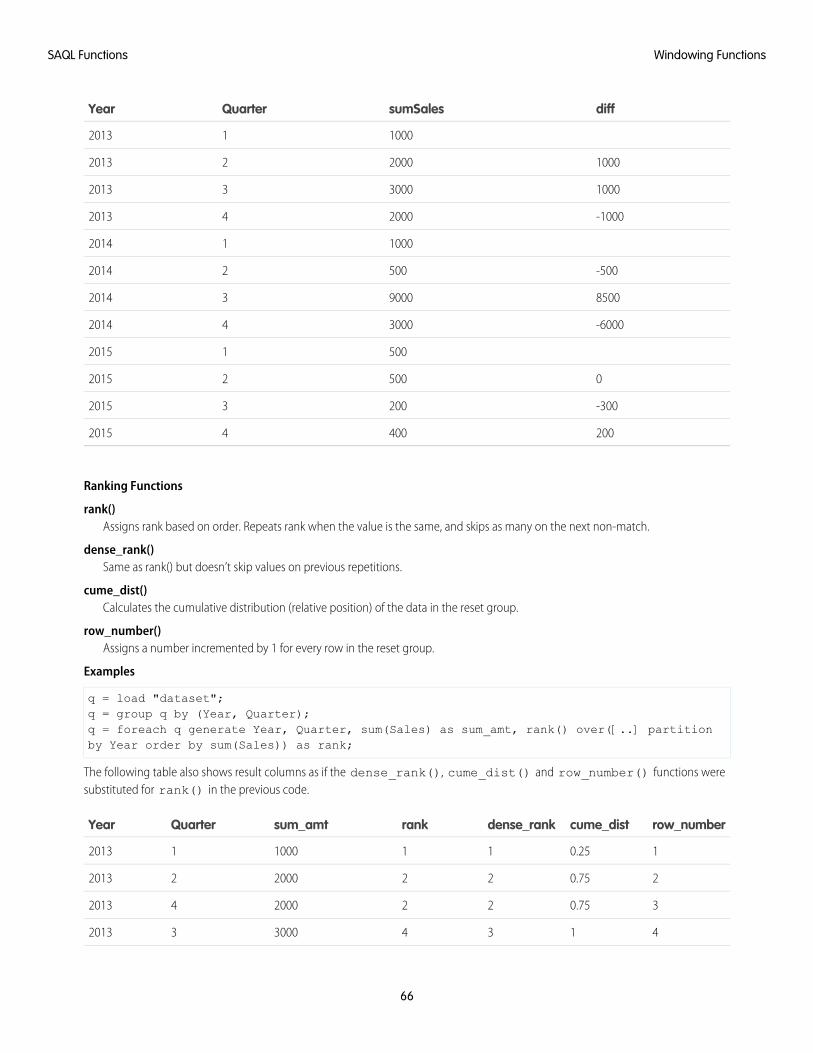
diffsumSalesQuarterYear
100012013
1000200022013
1000300032013
-1000200042013
100012014
-50050022014
8500900032014
-6000300042014
50012015
050022015
-30020032015
20040042015
Ranking Functions
rank()Assigns rank based on order. Repeats rank when the value is the same, and skips as many on the next non-match.
dense_rank()Same as rank() but doesn’t skip values on previous repetitions.
cume_dist()Calculates the cumulative distribution (relative position) of the data in the reset group.
row_number()Assigns a number incremented by 1 for every row in the reset group.
Examples
q = load "dataset";q = group q by (Year, Quarter);q = foreach q generate Year, Quarter, sum(Sales) as sum_amt, rank() over([..] partitionby Year order by sum(Sales)) as rank;
The following table also shows result columns as if the dense_rank(), cume_dist() and row_number() functions weresubstituted for rank() in the previous code.
row_numbercume_distdense_rankranksum_amtQuarterYear
10.2511100012013
20.7522200022013
30.7522200042013
4134300032013
66
Windowing FunctionsSAQL Functions
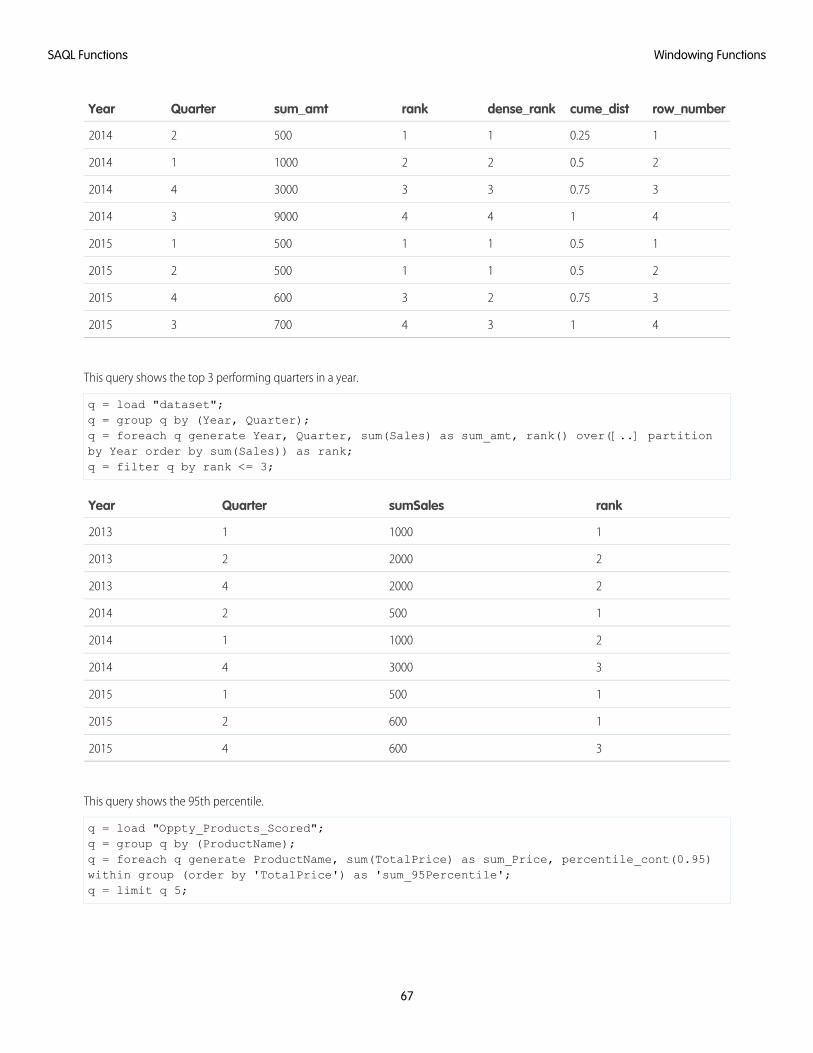
row_numbercume_distdense_rankranksum_amtQuarterYear
10.251150022014
20.522100012014
30.7533300042014
4144900032014
10.51150012015
20.51150022015
30.752360042015
413470032015
This query shows the top 3 performing quarters in a year.
q = load "dataset";q = group q by (Year, Quarter);q = foreach q generate Year, Quarter, sum(Sales) as sum_amt, rank() over([..] partitionby Year order by sum(Sales)) as rank;q = filter q by rank <= 3;
ranksumSalesQuarterYear
1100012013
2200022013
2200042013
150022014
2100012014
3300042014
150012015
160022015
360042015
This query shows the 95th percentile.
q = load "Oppty_Products_Scored";q = group q by (ProductName);q = foreach q generate ProductName, sum(TotalPrice) as sum_Price, percentile_cont(0.95)within group (order by 'TotalPrice') as 'sum_95Percentile';q = limit q 5;
67
Windowing FunctionsSAQL Functions
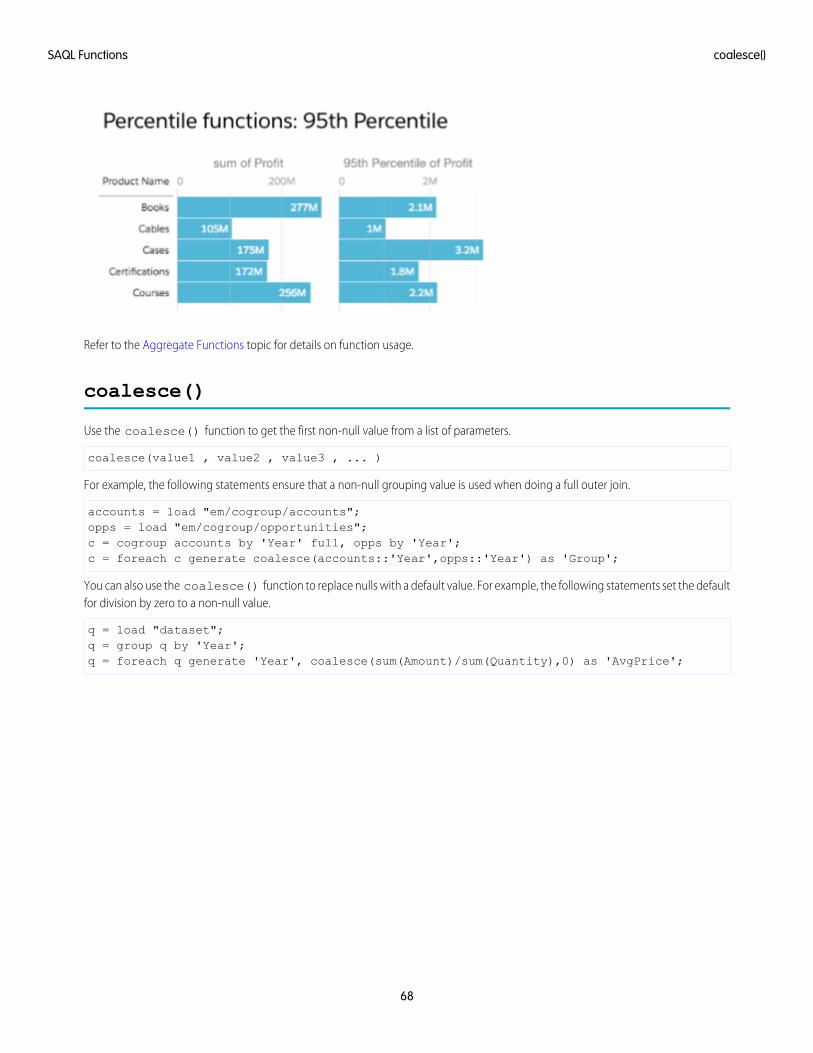
Refer to the Aggregate Functions topic for details on function usage.
coalesce()
Use the coalesce() function to get the first non-null value from a list of parameters.
coalesce(value1 , value2 , value3 , ... )
For example, the following statements ensure that a non-null grouping value is used when doing a full outer join.
accounts = load "em/cogroup/accounts";opps = load "em/cogroup/opportunities";c = cogroup accounts by 'Year' full, opps by 'Year';c = foreach c generate coalesce(accounts::'Year',opps::'Year') as 'Group';
You can also use the coalesce() function to replace nulls with a default value. For example, the following statements set the defaultfor division by zero to a non-null value.
q = load "dataset";q = group q by 'Year';q = foreach q generate 'Year', coalesce(sum(Amount)/sum(Quantity),0) as 'AvgPrice';
68
coalesce()SAQL Functions
QUERY PERFORMANCE
To optimize performance, learn how to structure your query to take advantage of the different stages a SAQL query passes through.
These topics explain common query performance problems and will help you write more efficient queries.
Projection is Important
See how changing the order of the functions in your query can give remarkable performance improvements.
Grouping Order
Consider why the order of fields affects how your query is processed.
Network Traffic and Latency
You might not think there’s much you can do about network latency, but there are ways to reduce traffic.
Redundant Filters
Is your query doing more work than it needs to? Check to see if you have redundant filters.
Use the ELT Process
Is your dataset set up correctly for what you’re trying to do? You may be doing unnessesary work in your queries.
Multi-Value Dimensions
If you use picklists, and find your queries are slow, consider the impact of multi-value dimensions.
Limit the use of Unique()
Sometimes you need to use unique() in a query, but be aware that it can affect performance if there is a large number of uniquevalues.
Projection is Important
See how changing the order of the functions in your query can give remarkable performance improvements.
Think ProjectionWith behind-the-scenes knowledge of how data is queried, it quickly becomes apparent that writing queries to take advantage of thesuper-fast and efficiently indexed layer is key to maximize performance. This before-and-after concept essentially relates to projection.
Tip: What is projection? When a query creates a new stream with a foreach statement—and it’s the first foreach in the query—thatis a projection.
Pre-projection queries, particularly those dealing with rows numbering in the hundreds of thousands or more, will execute much fasterthan post-projection queries dealing with the same number of rows as tabular data. So, instead of:
q = load "something";q = foreach q generate ‘col1’+’col2’ as ‘key’, col3;q = filter q by ‘key’;q = filter q by ‘col3’;q = group q by ‘col3’;
69
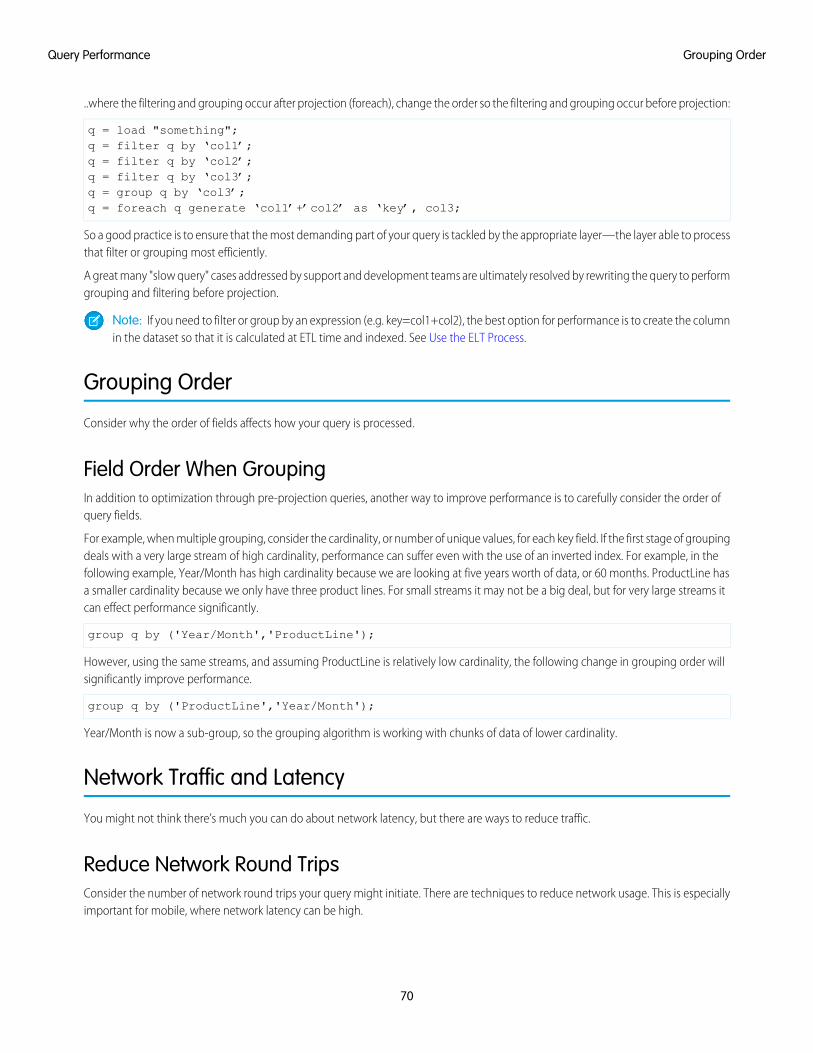
..where the filtering and grouping occur after projection (foreach), change the order so the filtering and grouping occur before projection:
q = load "something";q = filter q by ‘col1’;q = filter q by ‘col2’;q = filter q by ‘col3’;q = group q by ‘col3’;q = foreach q generate ‘col1’+’col2’ as ‘key’, col3;
So a good practice is to ensure that the most demanding part of your query is tackled by the appropriate layer—the layer able to processthat filter or grouping most efficiently.
A great many "slow query" cases addressed by support and development teams are ultimately resolved by rewriting the query to performgrouping and filtering before projection.
Note: If you need to filter or group by an expression (e.g. key=col1+col2), the best option for performance is to create the columnin the dataset so that it is calculated at ETL time and indexed. See Use the ELT Process.
Grouping Order
Consider why the order of fields affects how your query is processed.
Field Order When GroupingIn addition to optimization through pre-projection queries, another way to improve performance is to carefully consider the order ofquery fields.
For example, when multiple grouping, consider the cardinality, or number of unique values, for each key field. If the first stage of groupingdeals with a very large stream of high cardinality, performance can suffer even with the use of an inverted index. For example, in thefollowing example, Year/Month has high cardinality because we are looking at five years worth of data, or 60 months. ProductLine hasa smaller cardinality because we only have three product lines. For small streams it may not be a big deal, but for very large streams itcan effect performance significantly.
group q by ('Year/Month','ProductLine');
However, using the same streams, and assuming ProductLine is relatively low cardinality, the following change in grouping order willsignificantly improve performance.
group q by ('ProductLine','Year/Month');
Year/Month is now a sub-group, so the grouping algorithm is working with chunks of data of lower cardinality.
Network Traffic and Latency
You might not think there’s much you can do about network latency, but there are ways to reduce traffic.
Reduce Network Round TripsConsider the number of network round trips your query might initiate. There are techniques to reduce network usage. This is especiallyimportant for mobile, where network latency can be high.
70
Grouping OrderQuery Performance
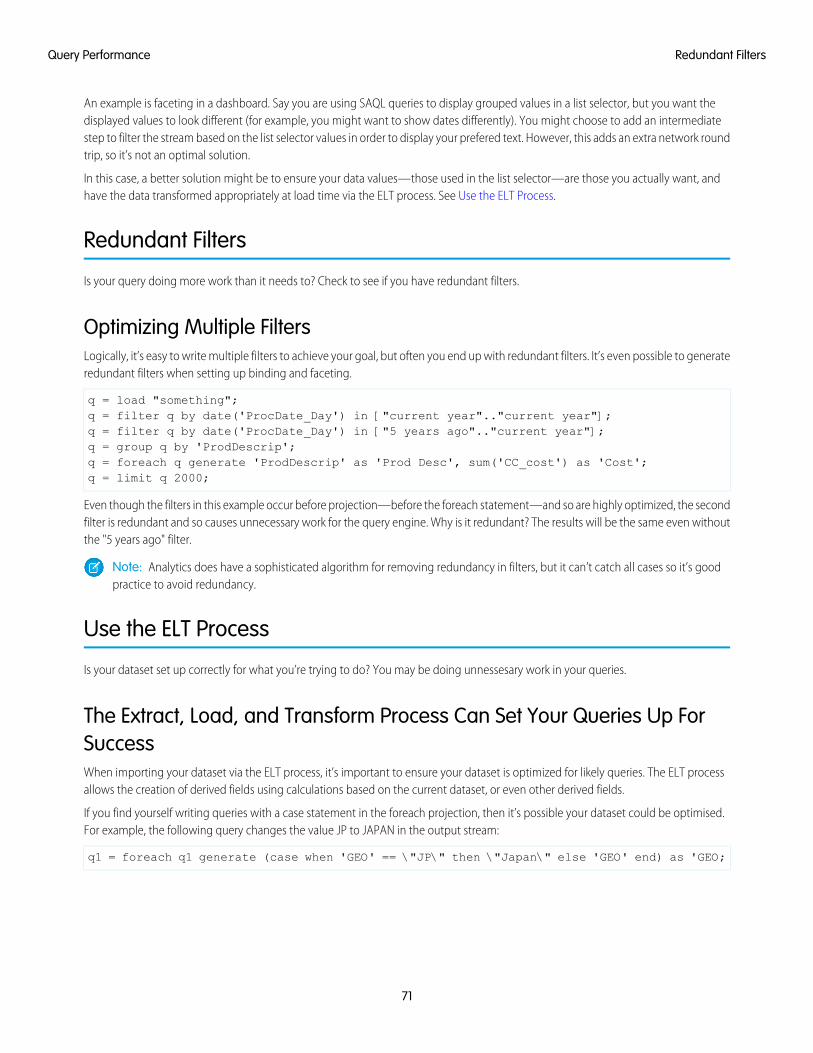
An example is faceting in a dashboard. Say you are using SAQL queries to display grouped values in a list selector, but you want thedisplayed values to look different (for example, you might want to show dates differently). You might choose to add an intermediatestep to filter the stream based on the list selector values in order to display your prefered text. However, this adds an extra network roundtrip, so it’s not an optimal solution.
In this case, a better solution might be to ensure your data values—those used in the list selector—are those you actually want, andhave the data transformed appropriately at load time via the ELT process. See Use the ELT Process.
Redundant Filters
Is your query doing more work than it needs to? Check to see if you have redundant filters.
Optimizing Multiple FiltersLogically, it’s easy to write multiple filters to achieve your goal, but often you end up with redundant filters. It’s even possible to generateredundant filters when setting up binding and faceting.
q = load "something";q = filter q by date('ProcDate_Day') in ["current year".."current year"];q = filter q by date('ProcDate_Day') in ["5 years ago".."current year"];q = group q by 'ProdDescrip';q = foreach q generate 'ProdDescrip' as 'Prod Desc', sum('CC_cost') as 'Cost';q = limit q 2000;
Even though the filters in this example occur before projection—before the foreach statement—and so are highly optimized, the secondfilter is redundant and so causes unnecessary work for the query engine. Why is it redundant? The results will be the same even withoutthe "5 years ago" filter.
Note: Analytics does have a sophisticated algorithm for removing redundancy in filters, but it can’t catch all cases so it’s goodpractice to avoid redundancy.
Use the ELT Process
Is your dataset set up correctly for what you’re trying to do? You may be doing unnessesary work in your queries.
The Extract, Load, and Transform Process Can Set Your Queries Up ForSuccessWhen importing your dataset via the ELT process, it’s important to ensure your dataset is optimized for likely queries. The ELT processallows the creation of derived fields using calculations based on the current dataset, or even other derived fields.
If you find yourself writing queries with a case statement in the foreach projection, then it’s possible your dataset could be optimised.For example, the following query changes the value JP to JAPAN in the output stream:
q1 = foreach q1 generate (case when 'GEO' == \"JP\" then \"Japan\" else 'GEO' end) as 'GEO;
71
Redundant FiltersQuery Performance
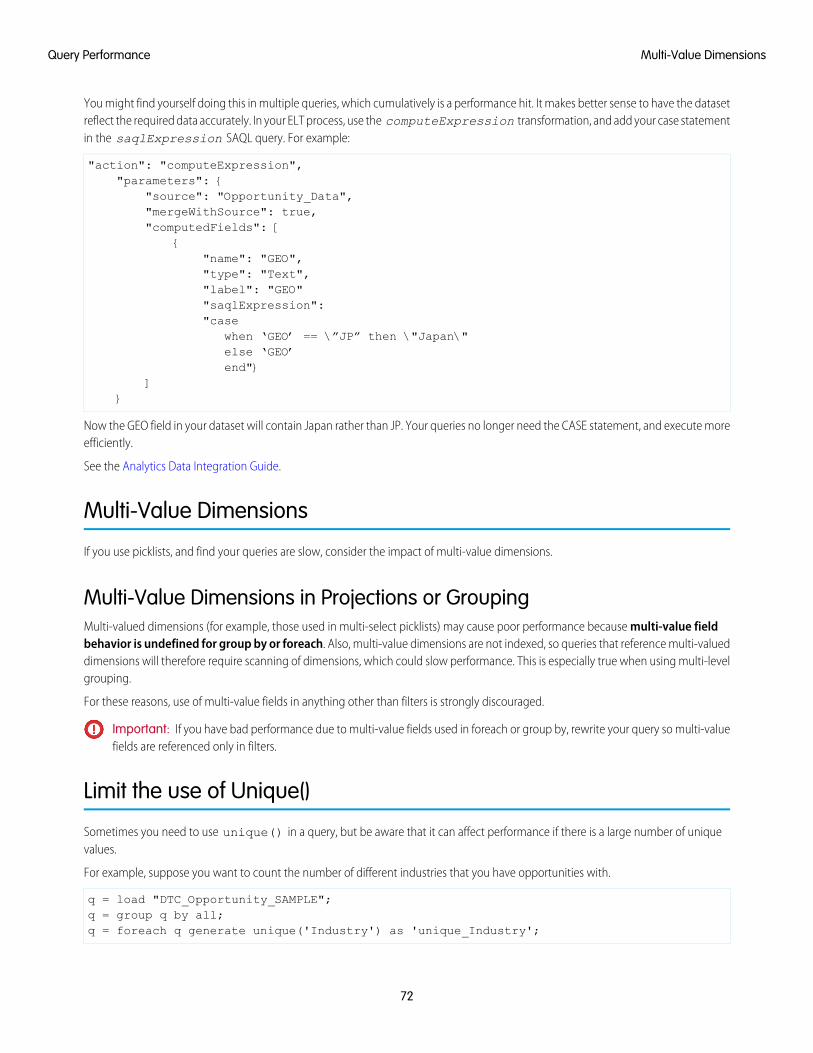
You might find yourself doing this in multiple queries, which cumulatively is a performance hit. It makes better sense to have the datasetreflect the required data accurately. In your ELT process, use the computeExpression transformation, and add your case statementin the saqlExpression SAQL query. For example:
"action": "computeExpression","parameters": {
"source": "Opportunity_Data","mergeWithSource": true,"computedFields": [
{"name": "GEO","type": "Text","label": "GEO""saqlExpression":"case
when ‘GEO’ == \”JP” then \"Japan\"else ‘GEO’end"}
]}
Now the GEO field in your dataset will contain Japan rather than JP. Your queries no longer need the CASE statement, and execute moreefficiently.
See the Analytics Data Integration Guide.
Multi-Value Dimensions
If you use picklists, and find your queries are slow, consider the impact of multi-value dimensions.
Multi-Value Dimensions in Projections or GroupingMulti-valued dimensions (for example, those used in multi-select picklists) may cause poor performance because multi-value fieldbehavior is undefined for group by or foreach. Also, multi-value dimensions are not indexed, so queries that reference multi-valueddimensions will therefore require scanning of dimensions, which could slow performance. This is especially true when using multi-levelgrouping.
For these reasons, use of multi-value fields in anything other than filters is strongly discouraged.
Important: If you have bad performance due to multi-value fields used in foreach or group by, rewrite your query so multi-valuefields are referenced only in filters.
Limit the use of Unique()
Sometimes you need to use unique() in a query, but be aware that it can affect performance if there is a large number of uniquevalues.
For example, suppose you want to count the number of different industries that you have opportunities with.
q = load "DTC_Opportunity_SAMPLE";q = group q by all;q = foreach q generate unique('Industry') as 'unique_Industry';
72
Multi-Value DimensionsQuery Performance

If your data contains a few thousand industries, this query will not negatively affect performance.
However, suppose you want to count the number of unique customers (accounts):
q = load "AcquiredAccount";q = group q by all;q = foreach q generate unique('Account_Id') as 'unique_Account_Id';
If your company has millions of customers, be aware that this query will have some affect on performance.
Note: While counting the number of unique values might impact performance, counting the total number of rows in a table hasalmost no impact.
73
Limit the use of Unique()Query Performance