Embed Size (px)
Citation preview

69REAL & DIGAL | BANWA VOL. 7, NO. 1 (2010): 69–91
Analyzing Marketing Margins and Th eir Implications in Improving Performance of Small-Scale Producers in the Calamansi Chain in Region XI, Southern Philippines
Rodel R. Real1,* and Larry N. Digal1
School of Management, University of the Philippines Mindanao, Mintal, Tugbok District, Davao City, Philippines.
* Corresponding author. Email: [email protected].
Th is article reports on an undergraduate thesis submitted for a BS in Agribusiness Economics undertaken by Mr. Real at the University of the Philippines Mindanao.
Abstract
Due to its wide range of uses and profi tability, calamansi or calamondin (Citrofortunella microcarpa) is considered a high-value crop of the Philippines. But while there are many studies on the various uses of calamansi parts and technologies developed to help farmers, there is a dearth of studies on the structure and operation of the calamansi marketing chain and analysis of marketing margins of producers and other intermediaries. Th e present study aimed to examine marketing margins to understand the marketing system of the calamansi industry in Region XI, Southern Philippines, and identify opportunities, challenges, and solutions to improve the chain. A price transmission model was estimated using secondary data and supplemented by calculation of net margins for farmers, wholesalers, processors, and retailers using primary data collected from key informants. Results show that farm, wholesale, and fuel prices signifi cantly explained changes in selling or retail prices. Price transmission elasticity is higher from farm to wholesale than from farm to retail, which implies that changes in farm prices are refl ected more in wholesale than retail prices. Farmers received better margins even though calamansi is always subjected to seasonality of prices. Processors and wholesalers also earned positive net margins, but some retailers incurred negative net margins because of incidence of shrinkage/wastage. Given that this occurs very rarely, and with better management, retailers can still expect to gain positive net margins. Major actors in the chain may benefi t by eff ectively managing costs, particularly post-production and wastage costs. A package of assistance that includes technology improvement, access to market, and credit is necessary to help farmers, as well as intermediaries, enhance productivity and manage costs to improve their performance in the chain.
2010 © University of the Philippines Mindanao

70 REAL & DIGAL | BANWA VOL. 7, NO. 1 (2010): 69–91
Keywords: calamansi; marketing margin; net margins; price transmission elasticity
Abbreviations: BAS – Bureau of Agricultural Statistics CALABARZON – Cavite, Laguna, Batangas, Rizal, and Quezon
provincesDA – Department of AgricultureDTI – Department of Trade and IndustryMIMAROPA – Mindoro, Marinduque, Romblon and Palawan
provincesPTE – price transmission elasticity
Introduction
Calamansi or calamondin (Citrofortunella microcarpa) is the most commonly grown backyard tree among the citrus species in the Philippines due to its ability to grow in a wide variety of conditions (DA, n.d.). Although it is generally believed to be native to the Philippines (BPRE, ; DA, n.d.), calamansi, in fact, is a hybrid between species in the genus Citrus (Dianxiang and Mabberley, ), originating in China and brought to the Philippines and Indonesia during early times (Morton, ).
Calamansi has various medicinal, culinary, and other practical uses. A rich source of phosphorous, calcium, iron, and, particularly, vitamin C or ascorbic acid, calamansi is well-known for its health benefi ts (Morton, ; DA, n.d). According to the Nutritional Guidelines for Filipinos , consuming two servings (each at – g) of the fruit daily is recommended to meet the daily requirement of vitamin C (Josue, ). Traditionally made into a fruit drink, calamansi is used as a remedy for cough and to promote even blood circulation and normal digestion (DA, n.d). Th e juice is also used as cure for irritation, such as insect bites, acne, and scalp itching. Since it is used as fl avoring in desserts and additive in seafood and meats, calamansi is a staple in many Filipino kitchens (Josue, ; Morton, ). Th e pulp, on the other hand, is used as a major ingredient in beverages, syrups, concentrates, and purees; and the peel is made into jams, candies, and marmalade (Josue, ; DA, n.d.). Th e fruit juice is also used as stain remover and deodorant.
For commercial varieties of calamansi that are supplied fresh to the consumers, the Philippine National Standards (PNS/BAFPS, ) provides grading and classifi cation guidelines in order to maintain certain qualities of the fruit. Th e fruit is classifi ed into three classes according to its general appearance, quality, and condition: () the Extra class, where fruits are of
2010 © University of the Philippines Mindanao

71REAL & DIGAL | BANWA VOL. 7, NO. 1 (2010): 69–91
superior quality and has similar varietal characteristics, mature, fi rm, well-formed, well-trimmed, and free from superfi cial defects such as discoloration, disease, and insect damages; () Class I, where fruits are of good quality and have characteristics similar to Extra class but have slight defects in shape and appearance; and () Class II, where fruits only meet the minimum requirements. Additionally, calamansi is classifi ed according to its size: big ones have a diameter greater than . cm; medium-sized ones, a diameter of .–. cm; and small ones, a diameter of .–. cm.
In terms of production, the calamansi industry has seen a domestic growth for the past years, from to ; and on the average, production increased by . annually. However, the production has declined to , metric tons (.) and , metric tons (.) in and , respectively, due to a typhoon that struck the country in , which devastated the major calamansi-producing areas in Luzon (Sanguyo, ). But it was able to recover by posting a , level of production in . As of , the total production of calamansi was , metric tons (BAS, n.d.). In addition, area planted with calamansi has increased at the rate of . annually from to . Th is increasing trend has continued in the years to , with an annual average of ,. ha. Also, the industry’s total bearing trees has increased at the rate of . annually (BAS, n.d.). For regional distribution, Region IV-B or MIMAROPA still holds the fi rst spot in terms of production (.), area planted (.), and number of bearing trees (.) from to . In terms of production rate, it is then followed by Region IV-A or CALABARZON (.). But Region XI holds the second position in terms of area planted (.) and number of bearing trees (.). In addition, Mindoro Oriental is still the largest-producing province and, in , recorded production of , metric tons of calamansi, which is followed by Quezon (, metric tons) and Nueva Ecija (, metric tons). Likewise, the leading provinces in terms of area planted and bearing trees are Oriental Mindoro (, ha; ,,) and Davao del Norte (, ha; ,). Major export destinations for calamansi juice are Japan ( of the total volume) and the United States (), with Canada (), Hong Kong (), and the Republic of Korea () trailing behind (Sanguyo, ). In , volume and value of calamansi exports grew signifi cantly by . and ., respectively, due to notable increases in export of calamansi juice, concentrate, and fresh fruit to these countries. With these fi gures, the Philippines remained as the sole exporter of fresh and concentrate calamansi in the world (BETP, ; NAFC, n.d.).
Th e profi tability and versatility of calamansi are strengths that need to be further developed to improve the industry, increasing year-round production and supply of high-quality calamansi and enhancing global competitiveness of fresh and processed calamansi (NAFC, n.d.). However, various constraining factors beset the industry, which, upon closer examination, are common to
2010 © University of the Philippines Mindanao

72 REAL & DIGAL | BANWA VOL. 7, NO. 1 (2010): 69–91
several other agriculture commodities. Some of these factors are as follows: () fl uctuating prices from seasonal production, () high spoilage, () inadequate capital to fi nance the buying and selling of goods, () too many competitors, () low price due to low quality of produce and oversupply, and () lack of information in farm technology (AsiaDHRRA, ). To address these, as well as build on the industry’s competencies, the development of a strategic action plan for the calamansi industry, involving the participation of the private sector and spearheaded by the Department of Agriculture (DA) and Department of Trade and Industry (DTI), was launched with the goal of enhancing investments and profi tability of the industry (NAFC, n.d.).
But there has been a dearth of studies particularly on the structure and operation of the calamansi marketing system and analysis of marketing margins of producers and other intermediaries. Th e only extensive study was conducted by the Marketing Studies and Development Section of the Bureau of Agricultural Statistics (BAS) on the marketing cost structure for calamansi in some key areas of Luzon and Visayas. Th e study quantifi ed the diff erent production and marketing costs and mapped the value chain for calamansi, which illustrated how players and intermediaries act, consolidate, and work together within the chain (BAS, ).
Th e present study, using primary and secondary data, aims to examine and determine the price transmission elasticities and the net margins to assess performance of the marketing system of the calamansi industry in the Philippines. Specifi cally, the study sought to () determine the factors that infl uence marketing margins for calamansi and the impact of each factor on the marketing margins; () determine how effi cient the diff erent actors in the supply chain are by calculating their costs and net margins; () determine how prices change across the supply chain; and () identify opportunities and challenges to improve the industry.
Materials and Methods
According to Butler and McCarthy (), marketing margin is the diff erence between the price consumers pay at the retail level and the price producers receive at the farm gate. It includes processes and services required to transfer a particular commodity from the producer to the consumer. As an eff ect, prices change from one level to another. As such, marketing margin analysis provides a way to examine the structure and performance of food chains (Digal et al., ). In this study, two methods were used. First, we analyze how costs are refl ected in selling prices, particularly the cost of raw materials or buying price through price transmission analysis, which provided an indication of the performance of the system—whether the market is effi cient or not. Second, we computed the net margins for each
2010 © University of the Philippines Mindanao

73REAL & DIGAL | BANWA VOL. 7, NO. 1 (2010): 69–91
node of the chain to show the details on the costs of producing, selling, or processing calamansi, which provides us with an indication of the profi tability and distribution of benefi ts across actors in the chain. Estimation of price transmission models used monthly data on farm, wholesale, and retail prices in Region XI from to , the years that had complete datasets for the region (BAS, ). Other sets of secondary data that were collected include agricultural wage rate, price of fertilizer, and price of pesticide (BAS, ), as well as unleaded gasoline price (DOE, ) and lending rate (PIDS, ). Microsoft Excel was used to analyze the time-series data and estimate the price transmission model. Th e regression feature of the software allowed estimation of the price transmission models. T-statistics were generated to determine whether the independent variables are statistically signifi cant or signifi cantly explain variability in selling prices. Statistical signifi cance of the overall model was determined using the F-statistic. Diagnostic tests were also done to determine possible problems of multicollinearity and autocorrelation. Finally, both logarithmic and non-logarithmic functional forms of the model were estimated to improve results. For the case analysis, primary data gathered using survey questionnaires were utilized in analyzing the net margins received by every actor in a specifi c chain. Th e initial step in measuring the net margins is to describe the structure of the marketing chain, which starts at the farm-gate level and through the various intermediaries until it reaches the fi nal consumer; then, the various functions performed at each stage in the marketing process were identifi ed. Th ere were three general marketing chains examined in the case analysis: () farm level in Asuncion wholesalers in Davao; () farm level in Tagum wholesalers in Davao retailers in Davao; and () farm level in Tagum processors in Tagum. Since calculating net margins is like estimating the profi tability of producing or marketing the product expressed in a per-kilo basis, data on the prices of products sold (selling prices) and the amount of product sold, as well as the costs of producing or marketing the product, was collected. However, there are limitations in estimating net margins; for example, the accuracy of volume sold is diffi cult to ascertain, particularly for marketers such as traders, wholesalers, and retailers, as these data are often treated as confi dential. In addition, at the retail level, allocation of costs, especially when the retailers sell diff erent kinds of commodities, may not be accurate. In order to avoid bias, allocation is based on volume sold.
Price Transmission Model Lechanová and Novák () describe a price transmission model as one way to measure the proportion of an input price change that is passed on to the output prices. A positive elasticity would mean that as the buying price increases, selling prices also increase. Moreover, since the magnitude of the
2010 © University of the Philippines Mindanao
74 REAL & DIGAL | BANWA VOL. 7, NO. 1 (2010): 69–91
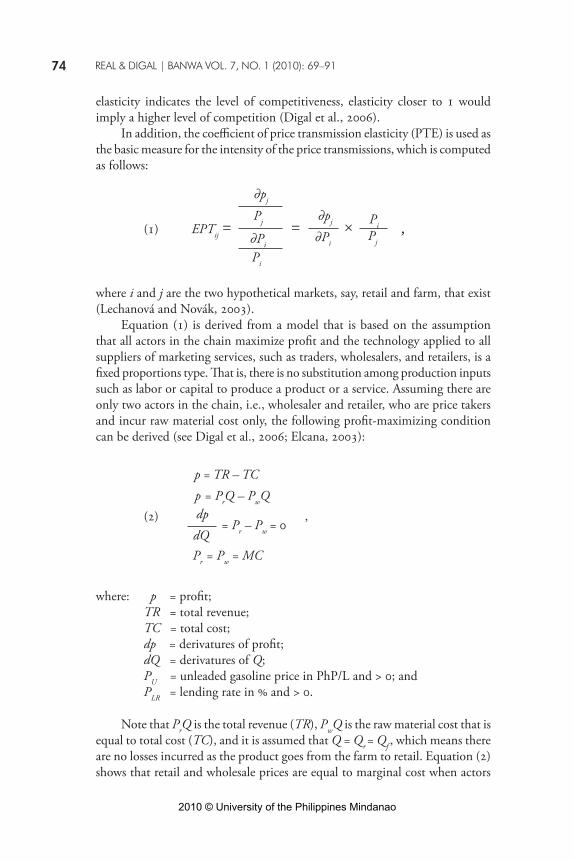
elasticity indicates the level of competitiveness, elasticity closer to would imply a higher level of competition (Digal et al., ). In addition, the coeffi cient of price transmission elasticity (PTE) is used as the basic measure for the intensity of the price transmissions, which is computed as follows:
() EPTij = = × ,
where i and j are the two hypothetical markets, say, retail and farm, that exist (Lechanová and Novák, ). Equation () is derived from a model that is based on the assumption that all actors in the chain maximize profi t and the technology applied to all suppliers of marketing services, such as traders, wholesalers, and retailers, is a fi xed proportions type. Th at is, there is no substitution among production inputs such as labor or capital to produce a product or a service. Assuming there are only two actors in the chain, i.e., wholesaler and retailer, who are price takers and incur raw material cost only, the following profi t-maximizing condition can be derived (see Digal et al., ; Elcana, ):
()
p = TR – TC
p = PrQ – PwQ
Pr = Pw = MC
dp
dQ= Pr – Pw =
,
where: p = profi t; TR = total revenue; TC = total cost; dp = derivatures of profi t; dQ = derivatures of Q; PU = unleaded gasoline price in PhP/L and > ; and PLR = lending rate in and > .
Note that PrQ is the total revenue (TR), PwQ is the raw material cost that is equal to total cost (TC), and it is assumed that Q = Qr = Qf , which means there are no losses incurred as the product goes from the farm to retail. Equation () shows that retail and wholesale prices are equal to marginal cost when actors
∂pj
Pj
∂Pi
Pi
∂pj
∂PiPj
Pi
2010 © University of the Philippines Mindanao

75REAL & DIGAL | BANWA VOL. 7, NO. 1 (2010): 69–91
maximize profi t. Th is can be generalized into the following model:
() Pr = f (Pw , C) ,
where C = other cost; all other variables as previously defi ned.Equation () means that the retailer maximizes profi t by equating its price
to marginal cost, which is composed of the price of raw material and other costs such as labor, water, electricity, etc., incurred in selling the product.
To estimate a model, it is assumed that the functional form of equation () is additive and the retailer incurs costs aside from raw material. Considering the costs involved in producing and marketing the retail product based on interview of key informants, data availability, and previous studies (e.g., Baek and Koo [], Trostle [], and Schnepf []), the cost factors considered were agricultural wage rate, fertilizer price, pesticide price, unleaded gasoline price, and lending rate. Th e empirical counterpart of equation () can now be defi ned as follows:
() Pr = a + bPf + bPw + bPL + bPF + bPPes + bPU + bPLR ,
where: Pr = retail price in PhP/kg; a = constant; Pf = farm price in PhP/kg and > ; Pw = wholesale price in PhP/kg and > ; PL = agricultural wage rate in PhP/day and > ; PF = fertilizer price in PhP/kg and > ; PPes = pesticide in PhP/L and > ; PU = unleaded gasoline price in PhP/L and > ; and PLR = lending rate in and > .
Note that coeffi cients or slopes of these independent variables are expected to have a positive relationship with retail prices as changes in these cost variables should be transmitted or refl ected proportionately in selling prices. Aside from retailing, price transmission in other nodes of the chain was also examined. Th us, the following equations or price transmission models were estimated:
For farm–wholesale level (M1):
() Pw = a + bPf + bPL + bPF + bPPes + bPU + bPLR ,
For wholesale–retail level (M2):
() Pr = a + bPw + bPL + bPU + bPLR ,
2010 © University of the Philippines Mindanao

76 REAL & DIGAL | BANWA VOL. 7, NO. 1 (2010): 69–91
For farm–retail level (M3):
() Pr = a + bPf + bPL + bPF + bPPes + bPU + bPLR .
All variables and parameters are as previously defi ned.
Net MarginsNet margin analysis is a practice of measuring and describing the structure
of the marketing chain, which usually starts at the farm level and tracing the product through the various intermediaries until it reaches the fi nal consumer (BAS, ). In this study, we selected four players or actors in each node of the chain—namely, farm, wholesale, retail, and processing—in the City of Tagum and the Municality of Asuncion, both in Davao del Norte, which are localities that consider calamansi as one of their major crops. Due to time, accessibility, and budget constraints, calamansi supply chains that lead to Bankerohan, one of the largest trading centers in Davao City, were chosen (Figure ).
During the course of data collection, there were six farmers, six wholesalers, three retailers, and two processors who shared their knowledge on the marketing system of calamansi in Region XI. Also, there were four government offi cials/employees who supported the proponent in locating these players.
Price, costs, and activities for every marketing level of the chosen supply chain were collected. Th ese data, particularly those of prices and costs, were then used for the net margins analysis. Moreover, net margins were computed for peak season and off -season prices to show variability of net margins due to seasonality.
At the farm level, actors were identifi ed through a list of farmers provided by the agricultural offi ces in the two locations.
At the wholesale and retail levels, only wholesalers and retailers who sourced out from the two areas were included so that the marketing chains are properly linked. Also, only retailers that dealt with the wholesalers for their produce were included; retailers who sourced directly from the farmers were excluded. Note that the supermarket in Tagum and the retailers sourcing from Asuncion were not included in the interview due to unavailability of these respondents at the time of data collection.
For the processing of calamansi concentrate, those in Tagum City were chosen for the study primarily because three well-known processing plants operate in the region, while in Asuncion, only a single processing plant operates. Furthermore, the processor in Asuncion does not undergo production at a regular basis, only producing calamansi concentrate when the farm price of calamansi is low since production when price of fresh calamansi is high means loss of profi t.
2010 © University of the Philippines Mindanao

77REAL & DIGAL | BANWA VOL. 7, NO. 1 (2010): 69–91
Figu
re
. Sup
ply
chai
n of
cal
aman
si in
Dav
ao d
el N
orte
FARM
LEV
EL
Asu
ncio
n
FARM
LEV
EL
Tagu
m
PRO
CESS
OR
Asu
ncio
n
PRO
CESS
OR
Tagu
m
WH
OLE
SALE
LEV
ELTa
gum
and
Dav
ao
DIR
ECT
BUYE
RS
(mos
tly fr
om
Man
ila)
RETA
IL L
EVEL
Ta
gum
and
Dav
ao
CON
SUM
ERS
Out
side
Reg
ion
XI
CON
SUM
ERS
Tagu
m a
nd D
avao
SUPE
RMA
RKET
Tagu
m a
nd D
avao
2010 © University of the Philippines Mindanao

78 REAL & DIGAL | BANWA VOL. 7, NO. 1 (2010): 69–91
Results and Discussion
Regression OutputIn the regression output generated in estimating the price transmission
model for each marketing node, all coeffi cients and overall models presented are signifi cant at . level, except for fertilizer price at farm–wholesale level (Table ). In employing an autocorrelation test to detect the presence of correlated error terms, the results suggest that there is no signifi cant autocorrelation. Multicollinearity, the correlation of independent variables, is not also present in the generated models, which strengthen the reliability of the models. Finally, with higher R squares, it implies that the variability of the dependent variable, i.e., wholesale and retail prices, is explained by the independent variables for each marketing node.
Specifi cally, primary factors aff ecting wholesale price in farm–wholesale level include farm and fertilizer prices. Th is means that for every increase in farm price, wholesale price will increase by .. Likewise, the negative result of fertilizer price could be explained by the fact that the calamansi farmers do not consider this cost variable to be of great value since fertilizer application is only done once a year. Th us, in a daily basis, it is not considerable enough to aff ect the selling price at the wholesale level.
At the wholesale–retail level, all variables in the model signifi cantly aff ect retail price. Th is means that for every increase in wholesale price, retail price increases by .. Similarly, as unleaded gasoline price and lending rate
Variables Farm–wholesalea Wholesale–retaila Farm–retailb
Constant . . .
Farm price . - .
Wholesale price - . -
Fertilizer price -. - -
Unleaded gasoline price - . .
Lending rate - . -
N
Durbin-Watson . . .
R square . . .
F value . . .
Signifi cance . . .
Table . Regression output
Notes:a Log variables are used.b Nonlog variables are used.
2010 © University of the Philippines Mindanao

79REAL & DIGAL | BANWA VOL. 7, NO. 1 (2010): 69–91
increase by , retail prices increase by . and ., respectively. Finally, farm and gasoline prices positively aff ect retail price at farm–retail level, which means that for every increase in the prices of these two variables, retail price will increase by . and ., respectively.
Price Transmission Elasticities (PTE) At the regional level, price transmission elasticities are positive: farm–wholesale, .; wholesale–retail, .; and farm–retail, .. Among the three marketing nodes, farm–wholesale level has the highest elasticity, which is close to . Th is indicates a higher level of competition, implying that the buying price is a key factor considered in determining the selling price at the wholesale level. On the other hand, the two marketing nodes, wholesale–retail and farm–retail levels, have posted elasticities that are below ., which signify that the system is relatively less competitive in these two nodes of the chain as changes in buying prices are only refl ected in selling by less than . But there are other factors that explain changes in selling prices aside from buying prices, including other costs and barriers to entry such as market power that can lead to ineffi ciency in the market.
Net Margins
Chain 1 (Asuncion Source)
Farm level. Production costs, which include fertilizer and pesticide application, incurred by farmers accounted for the lowest share to the total production and marketing costs. Th is could be explained by the fact that this activity is usually done once or twice a year only, so when computed on a daily basis, the value is minimal; thus, its share to total costs, which includes the cost of procuring inputs, ranges only from . to .5. Accounting for the bulk of the total cost are the marketing costs, such as packing and distribution costs (.–.), and post-production costs (.–.)(Table ). In computing for net margins, peak season and off -season prices were used to show price variability due to seasonality. However, it can be observed that farmers incurred positive net margins regardless of the season. When the buying price of calamansi drops to PhP . per kg, they can still earn at least PhP . per kg. But when it reaches PhP . per kg, they can earn as high as PhP . per kg. Th is positive net margins show that calamansi production in Asuncion is highly profi table (Table ).
2010 © University of the Philippines Mindanao

80 REAL & DIGAL | BANWA VOL. 7, NO. 1 (2010): 69–91
Wholesale level. At the wholesale level, the bulk of the cost is the value of raw materials, which accounted for . to . of the total cost. Th e share of labor, own and hired, and storage cost are less than (Table ). In computing for the net margins, results show that wholesalers and earned more than wholesaler during the regular season, but the latter’s net margin is signifi cantly higher than the two during peak season. While selling prices are the same, cost of raw materials or buying cost incurred by wholesaler is lower, thus earning higher net margins (Table ).
Chain 2 and 3 (Tagum Source)
Farm level. Production cost incurred by farmers is relatively low compared to post-production and marketing costs, with share to total cost ranging only from . to .. However, the share of post-production cost ranged from . to ., which is expected due to high harvesting cost. Marketing cost is also quite high with a share to total cost ranging from . to . because of high packing cost, which includes labor and materials. Th us, the high post-production and marketing costs puts pressure on farmers in terms of fi nancial requirements (Table ). But farmers still managed to earn positive net margins even with seasonality
Variable/Cost Farmer Farmer Farmer
Production . (.) . (.) . (o.)
Post-production . (.) . (.) . (.)
Marketing . (.) . (.) . (.)
Own labor . (.) . (.) . (.)
Total . . .
No. of sacks
Volume (kg)
Table . Costs (PhP/kg) and percent share of farmers in Asuncion
Table . Net margins (PhP/kg) of farmers in Asuncion
Farmer Total costSelling price Net margin
Off -season Peak season Off -season Peak season
. . . . .
. . . . .
. . . . .
2010 © University of the Philippines Mindanao

81REAL & DIGAL | BANWA VOL. 7, NO. 1 (2010): 69–91
Activity/Cost Wholesaler Wholesaler Wholesaler
Labor cost . (.) . (.) . (.)
Cost of storing . (.) . (.) -
Cost of “dropping” - - . (.)
Own labor cost . (.) . (.) . (.)
Cost of buying
Peak season . (.) . (.) . (.)
Off -season . (.) . (.) . (.)
Total Cost
Peak season . . .
Off -season . . .
No. of sacks
Volume (kg)
Table . Costs (PhP/kg)and percent share of wholesalers in Asuncion
Table . Net margins (PhP/kg) for wholesalers in Davao City
WholesalersTotal cost Selling price Net margin
Off -season
Peak season
Off -season
Peak season
Off -season
Peak season
. . . . . .
. . . . . .
. . . . . .
Activity/Cost Farmer Farmer Farmer
Production . (.) . (.) . (.)
Post-production . (.) . (.) . (.)
Marketing . (.) . (.) . (.)
Own labor . (.) . (.) . (.)
Total Cost . . .
No. of sacks
Volume (kg)
Table . Costs (PhP/kg) and percent share for wholesalers in Tagum City
2010 © University of the Philippines Mindanao

82 REAL & DIGAL | BANWA VOL. 7, NO. 1 (2010): 69–91
of prices. During off -season when buying price decreases to as low as PhP . per kg, they were able to earn at least PhP . per kg. When price peaks at PhP . per kg, they earned as high PhP . per kg. Th ese show that calamansi production in Tagum, similar to the case in Asuncion, is highly profi table (Table ).
Wholesale level. At the wholesale level, the cost of raw materials or the cost of calamansi sold to wholesalers from the farmers in Tagum accounted for the bulk of the expenses, ranging from . to . (Table ). Th is implies that aside from buying the produce, there are minimal activities undertaken by wholesalers, i.e, transporting and selling the produce. Similar functions are undertaken when wholesalers source their produce from Asuncion. In computing for net margins, wholesaler earned more than the two
Table . Net margins (PhP/kg) of farmers in Tagum City
Farmers Total costSelling price Net margin
Off -season Peak season Off -season Peak season
. . . . .
. . . . .
. . . . .
Table . Costs (PhP/kg) and percent share of wholesalers in Davao CityActivity/Cost Wholesaler Wholesaler Wholesaler
Labor cost . (.) . (.) . (.)
Cost of storing . (.) - . (.)
Cost of “dropping” - . (.) -
Own labor cost . (.) . (.) . (.)
Transportation cost . (.) . (.) . (.)
Cost of buying
Peak season . (.) . (.) . (.)
Off -season . (.) . (.) . (.)
Total cost
Peak season . . .
Off -season . . .
No. of sacks
Volume (kg)
2010 © University of the Philippines Mindanao

83REAL & DIGAL | BANWA VOL. 7, NO. 1 (2010): 69–91
Table . Net margins (PhP/kg) of wholesalers in Davao City
WholesalerTotal cost Selling price Net margin
Off -season
Peakseason
Off -season
Peak season
Off - season
Peak season
. . . . . .
. . . . . .
. . . . . .
Costs Retailer Retailer Retailer
Labor cost . (.) . (.) . (.)
Cost of renting . (.) . (.) . (.)
Cost of plastic . (.) . (.) . (.)
Own labor cost . (.) . (.) . (.)
Shrinkage/wastage cost . (.) . (.) . (.)
Cost of buying (peak season) . (.) . (.) . (.)
Total cost . . .
No. of sacks
Volume (kg)
Table . Costs (PhP/kg) and percent share of retailers in Davao City
wholesalers during the peak season. However, wholesaler got the highest net margin of PhP . per kg during off -season mainly because the cost of buying during the off -season is somehow inexpensive. Nevertheless, all net margins were positive (Table ).
Retail level. Similar to the wholesalers, the major cost incurred by retailers is cost of raw materials, i.e., cost of calamansi bought from farmers. For retailers, the share of this cost ranged from . to . (Table ). Th is is followed by shrinkage or wastage cost and own labor cost. It should be noted, however, that shrinkage or wastage cost is unique to the retailers as it requires some time to sell the produce relative to wholesalers, which leads to spoilage or deterioration. In terms of net margins, it can be observed that only retailer was able to get a positive net margin even if the cost incurred was higher than retailers and . Th is is mainly due to higher selling price received by retailer compared to the other two. In fact, the selling price, which is the highest among the retailers, was high enough to absorb the cost of shrinkage or wastage incurred
2010 © University of the Philippines Mindanao

84 REAL & DIGAL | BANWA VOL. 7, NO. 1 (2010): 69–91
Retailer Total cost Selling price Net margin
. . .
. . -.
. . -.
Table . Net margins (PhP/kg) of Davao City retailers
Table . Costs (PhP/mL) and percent share of processors in Tagum CityActivity/Cost Processor Processor
Labor . (.) . (.)
Material inputs . (.) . (.)
Own labor . (.) . (.)
Water . (.) . (.)
Transportation - . (.)
Buying cost . (.) . (.)
Cost of bottle
mL . (.) . (.)
L - . (.)
Total cost
mL . .
L - .
by retailer . Th e share of this cost to total cost is quite high relative to the other costs, ranking second to cost of raw materials. Despite this, it was able to generate positive net margins due to high selling price and low cost of buying (Table ).
Processing level. Given the price variability due to seasonality that leads to losses for farmers, with calamansi having the shortest storage life among citrus varieties (BPRE, ), there is an opportunity to process calamansi into concentrate during off -season when prices received cannot recover costs incurred. Based on the data gathered from two processors, the cost of material inputs contributes about . to . of total cost in processing calamansi. Another major cost is labor, accounting for . to . of the total costs (Table ). Net margins received by two processors were all positive, which means that calamansi processing is a profi table enterprise. By selling -mL bottles of calamansi concentrate, processors and earned net margins of PhP . and
2010 © University of the Philippines Mindanao

85REAL & DIGAL | BANWA VOL. 7, NO. 1 (2010): 69–91
Table . Net margins (PhP/mL) of processors in Tagum City
ProcessorTotal cost Selling price Net margin
mL mL mL mL mL mL
. - . - . -
. . . . . .
Chain Season Farm Wholesale Retail Processing
Off . . - -
Peak . . - -
and Off . . - .
Peak . . . .
Table . Net margins (PhP/kg) at various levels during off - and peak seasons
PhP . per mL, respectively. However, they received diff erent net margins by selling the same product because the former has better packaging than the latter; thus, processor can command higher selling price. Processor , however, also earned positive net margin for the -mL bottle of concentrate (PhP . per mL)(Table ).
Summary of Net Margins Based on the results derived from the cases, farmers received greater net margins as compared to other actors in the chain. Specifi cally, farmers in Asuncion are better off compared to farmers in Tagum because the former has larger hectares of land, about . ha, devoted to calamansi production compared to the latter, which devotes only ha of land. In addition, it is clear that of all actors in the chains examined, retailers received the least net margins because of incidence of wastage. In most cases, net margins reached negative levels. However, while this does not consider the volume sold per season, calamansi commands higher demand in the market. Th us, retailers can still expect positive net margins. Other actors in the chain such as wholesalers and processors received positive net margins (Table ). Furthermore, chain maps were developed to show how cost variables and net margins incurred by the four groups of actors diff er from one marketing level to another. Th e data refl ected in these maps were generated based on the average values of the cases covered in the previous discussion (Figures and ).
Conclusions and Recommendations
2010 © University of the Philippines Mindanao

86 REAL & DIGAL | BANWA VOL. 7, NO. 1 (2010): 69–91
Figure . Value chain of calamansi from farm level in Asuncion to wholesalers and retailers in Davao City
WHOLESALE LEVEL (DAVAO)
SELLING PRICE (PhP/kg) Off-season: 11.20
Peak season: 18.00
COSTS (PhP/kg) Production: 0.02 Post-production: 0.94 Marketing: 1.00 Own labor: 0.34
MARGINS (PhP/kg) Off-season: 5.69
Peak season: 13.69
COSTS (PhP/kg) Labor cost: 0.20 Cost of storing: 0.075 Cost of dropping: 0.10
Own labor cost: 0.25 Cost of buying Off-season: 8.00 Peak season: 14.6667
MARGINS (PhP/kg) Off-season: 2.6667 Peak season: 2.1333
RETAIL LEVEL
FARM LEVEL (ASUNCION) SELLING PRICE (PhP/kg)
Off-season: 8.00 Peak season: 16.00
2010 © University of the Philippines Mindanao

87REAL & DIGAL | BANWA VOL. 7, NO. 1 (2010): 69–91
Figure . Two value chains of calamansi: () from farm level in Tagum City to wholesalers and retailers in Davao City and () from farm level to processors in Tagum City
COSTS (PhP/kg) Labor cost: 0.1974
Cost of renting: 0.1639 Cost of plastic: 0.0606
Own labor cost: 0.5983 S/W cost: 3.9160
Cost of buying: 21.3846
MARGINS (PhP/kg) 0.4125
COSTS (PhP/kg)
Labor costs Squeezers: 0.0194
“Slicer”: 0.0256 Washer: 0.0015
Admin Pers.: 0.0119 Store clerk: 0.0109
Driver: 0.0015
Material Inputs Sugar: 0.0492
Vitamin C: 0.0006 Honey: 0.0010
Cap: 0.0045 Label: 0.0060Seal: 0.0015
Own labor: 0.0114 Water: 0.0005
Transportation: 0.0034 Buying cost: 0.0112
Cost of bottle 500 mL: 0.0162
1 L: 0.0123
MARGINS (PhP/kg) 500 mL: 0.0870
1 L: 0.0563
FARM LEVEL (TAGUM)SELLING PRICE (PhP/kg)
Off season: 4.92 Peak season: 12.00
WHOLESALE LEVEL (DAVAO)
SELLING PRICE (PhP/kg) Off-season: 14.65
COSTS (PhP/kg) Production: 0.23
Post-production: 1.17 Marketing: 0.69 Own labor: 0.88
MARGINS (PhP/kg) Off-season: 1.94
Peak season: 9.03
COSTS (PhP/kg) Labor cost: 0.3158
Cost of storing: 0.0635 Cost of dropping: 0.1000
Own labor cost: 0.2145 Cost of buying
Off-season: 9.2840 Peak season: 12.0000
MARGINS (PhP/kg) Off-season: 3.7712
RETAIL LEVEL (DAVAO)SELLING PRICE (PhP/kg)
Peak season: 26.67
PROCESSING LEVEL (TAGUM)
SELLING PRICE (PhP/kg) 500 mL: 0.205
1 L: 0.135
CALAMANSI-CONSUMING PUBLIC
2010 © University of the Philippines Mindanao

88 REAL & DIGAL | BANWA VOL. 7, NO. 1 (2010): 69–91
Th e analysis of marketing margins, particularly the net margins and price transmission elasticities, point to a number of conclusions and recommendations. First, net margins incurred by various actors in the chains selected vary due to several factors, such as the prices received for their produce or products and the costs incurred. Th ese prices vary depending on the season of the year. However, variation of prices does not heavily aff ect the farmers because they were able to earn positive net margins regardless of the season. Th ough there are more activities performed at farm level, farmers did not acquire losses because of improved postharvest practices, such as sorting and cleaning. Because of this, buyers develop confi dence towards their suppliers because they are assured that products are of good quality. Th is is very important in sustaining the farmer-buyer relationship, where trust and confi dence between the two actors are well-established because quality requirements are stringently followed. Second, managing costs is also important to achieve a positive net margin. However, due to high wastage cost (PhP . to PhP . per kg), retailers are not able to recover these costs, even if prices received are high. It is clear that prices and costs need to be managed well to achieve positive net margins. Given the competitive nature of the industry as indicated by the results of the relatively high price transmission elasticities, farmers, wholesalers, and retailers are not able to infl uence price. Since not much can be done to infl uence price without incurring additional costs, actors in the chain should focus on eff ectively managing costs and productivity. In fact, there were farmers who were able to minimize costs that cushioned the impact of low prices. While enhancing quality of produce may require additional costs such as better postharvest handling or production practices, these should be explored as better quality calamansi can fetch higher prices. Th ird, despite the above challenges, it appears that there are opportunities in processing calamansi particularly when prices for fresh calamansi are low. However, this node of the chain is extremely competitive given the number of brands of processed calamansi (juice concentrate and ready to drink) available in the market today. Th us, it is not clear whether farmers may benefi t by venturing into this enterprise to diversify and minimize risks due to variability in prices for fresh calamansi. Moreover, this requires regular supply of fresh calamansi for processing. Hence, it is more profi table to sell in fresh form when prices are high and then process when prices are low during off -season. Th us, supply of fresh calamansi may become a problem for processors during peak season or when prices of fresh calamansi are high, which may lead to undercapacity for some months of the year. To ascertain the feasibility of venturing into this type of enterprise, further study is necessary. Finally, given the challenges and opportunities, a package of interventions is necessary to address challenges to improve productivity and manage costs, which can range from technology improvement, establishment of producer
2010 © University of the Philippines Mindanao

89REAL & DIGAL | BANWA VOL. 7, NO. 1 (2010): 69–91
organization to achieve economies of scale and to lower costs, and marketing assistance to access better markets for better prices.
References
Asian Partnership for the Development of Human Resources in Rural Asia (AsiaDHRRA). . Value chain analysis report: Cambodia, Philippines, and Vietnam. AsiaDHRRA and the ASEAN Foundation, Quezon City, Philippines.
Baek, J., and W.W. Koo. . Analyzing factors aff ecting U.S. food price infl ation. Center for Agricultural Policy and Trade Studies, North Dakota State University: Fargo, North Dakota. January . http://purl.umn.edu/.
Bureau of Agricultural Statistics (BAS), Department of Agriculture (DA). . Marketing costs structure for calamansi. Marketing Costs Structure Study, series . BAS offi cial website. July . http://www.bas.gov.ph/?ids=downloads_view&id=.
Bureau of Agricultural Statistics (BAS), Department of Agriculture (DA). . Performance of Philippine agriculture, January–December . BAS offi cial website. September . http://www.bas.gov.ph/?ids=downloads_view&id=.
Bureau of Agricultural Statistics (BAS), Department of Agriculture (DA). n.d. CountrySTAT Philippines. July . http://countrystat.bas.gov.ph.
Bureau of Export Trade Promotions (BETP), Department of Trade and Industry (DTI). n.d. Summary of Philippine merchandise export markets by product. March . http://tradelinephil.dti.gov.ph/betp/trade_stat.expcod_sumctry.
Bureau of Postharvest Research and Extension (BPRE), Department of Agriculture (DA). . Philippine postharvest industry profi le: Calamansi. September . http://www.bpre.gov.ph/phindustry/calamansi.htm.
Butler, L., and A. McCarthy. . Market power in the Northwest D’Anjou pear industry: Implications for California agriculture. Agricultural and Resource Economics Update (). Giannini Foundation of Agricultural Economics, University of California.
Department of Agriculture (DA). n.d. Calamansi. Farming tips. August . http://www.da.gov.ph/tips/calamansi.html.
Department of Energy (DOE). . Prevailing national pump prices of unleaded gasoline and automotive diesel. DOE Portal. December . http://www.doe.gov.ph/OPM/ArchivesHistorical.htm.
2010 © University of the Philippines Mindanao

90 REAL & DIGAL | BANWA VOL. 7, NO. 1 (2010): 69–91
Dianxiang, Z., and D.J. Mabberley. . Citrus, pp. –. In: Z.Y. Wu, P.H. Raven, and D.Y. Hong (eds.). Flora of China, vol. (Oxalidaceae through Aceraceae). Science Press, Beijing, and Missouri Botanical Garden Press, St. Louis, MO. July . http://fl ora.huh.harvard.edu/china/PDF/PDF/Citrus.pdf.
Digal, L.N., E. Elcana, S.B. Concepcion, L. Hualda, and E.T. Rasco Jr. . Marketing margin analysis: Quality premiums and ineffi ciencies in the Southern Philippine vegetable industry. Stewart Postharvest Review .
Elcana, M.E. . Marketing margins for pineapple in the Philippines. University of the Philippines Mindanao, Undergraduate Th esis.
Josue, C.R.P. . Calamansi: Th e miniature orange. Writers’ Pool Corner. Food and Nutrition Research Institute of the Department of Science and Technology (FNRI¬–DOST). July . http://www.fnri.dost.gov.ph/index.php?option=content&task=view&id=.
Lechanová, I., and P. Novák. . Price transmission analysis in Czech milk commodity chain. Mendel University of Agriculture and Forestry in Brno, Czech Republic.
Morton, J.F. . Calamondin. p. –. In: J.F. Morton. Fruits of warm climates. Miami, FL. July . http://www.hort.purdue.edu/newcrop/morton/calamondin.html.
National Agricultural and Fisheries Council (NAFC), Department of Agriculture (DA). n.d. Strategic action plan: Other fruits—Calamansi. September . http://nafc .da.gov.ph/PDFs/calamansi.pdf.
Philippine Institute for Development Studies (PIDS). . Key indicators of the Philippines. Economic and Social Database, PIDS. December . http://econdb.pids.gov.ph/ index.php?option=com_dirp&tab=&class_id=&sort_id=Place_ID&disp_fl ag=&dat_class=.
Philippine National Standards (PNS) and Bureau of Agricultural and Fisheries Product Standards (BAFPS), Department of Agriculture (DA). . Philippine National Standard: Fresh fruit—Calamondin/Calamansi—Grading and classifi cation. . PNS/BAFPS . Agriculture and Fisheries Market Information System (AFMIS), DA. July . http://afmis.da.gov.ph/index.php/component/docman/doc_download/-calamansi.html.
Sanguyo, E.B. . Situationer on calamansi –. Bureau of Agricultural Statistics (BAS) (). July . http://www.bas.gov.ph/?ids=downloads_view&id=.
Schnepf, R. . Price determination in agricultural commodity markets: A primer. Congressional Research Service, United States Library of Congress, Washington, D.C.
2010 © University of the Philippines Mindanao

91REAL & DIGAL | BANWA VOL. 7, NO. 1 (2010): 69–91
Trostle, R. . Global agricultural supply and demand: Factors contributing to the recent increase in food commodity prices. Economic Research Service, United States Department of Agriculture, Washington, D.C.
Seaforth, C., and T. Tikasingh. . A study for the development of a handbook of selected Caribbean herbs for industry. November . http://www.anancy .net/uploads/fi le_en/_Carribean_Herbs_fi nalreport.pdf.
Van Oirschot, Q.E.A., and K.I. Tomlins. . Applying analytical sensory evaluation techniques, which translate qualitative perceptions to numerical data to research on development issues. Paper presented at the Conference on Combining Qualitative and Quantitative Methods in Development Research, – July , Centre for Development Studies, University of Wales, Swansea.
Wierenga, B. . Model and measurement methodology for the analysis of consumer choice of food products. Journal of Food Quality :–.
2010 © University of the Philippines Mindanao