Embed Size (px)
Citation preview

LAPPEENRANTA UNIVERSITY OF TECHNOLOGY
FACULTY OF TECHNOLOGY MANAGEMENT
Department of Industrial Management
ANALYZING THE COST-EFFICIENCY AND
PERFORMANCE OF A PAYROLL DEPARTMENT BY
BENCHMARKING
Examiner: Professor Tuomo Kässi
Instructor: Lasse Mustonen, Stora Enso Oyj
Lappeenranta 30.8.2009
Turkka Vuoksiala
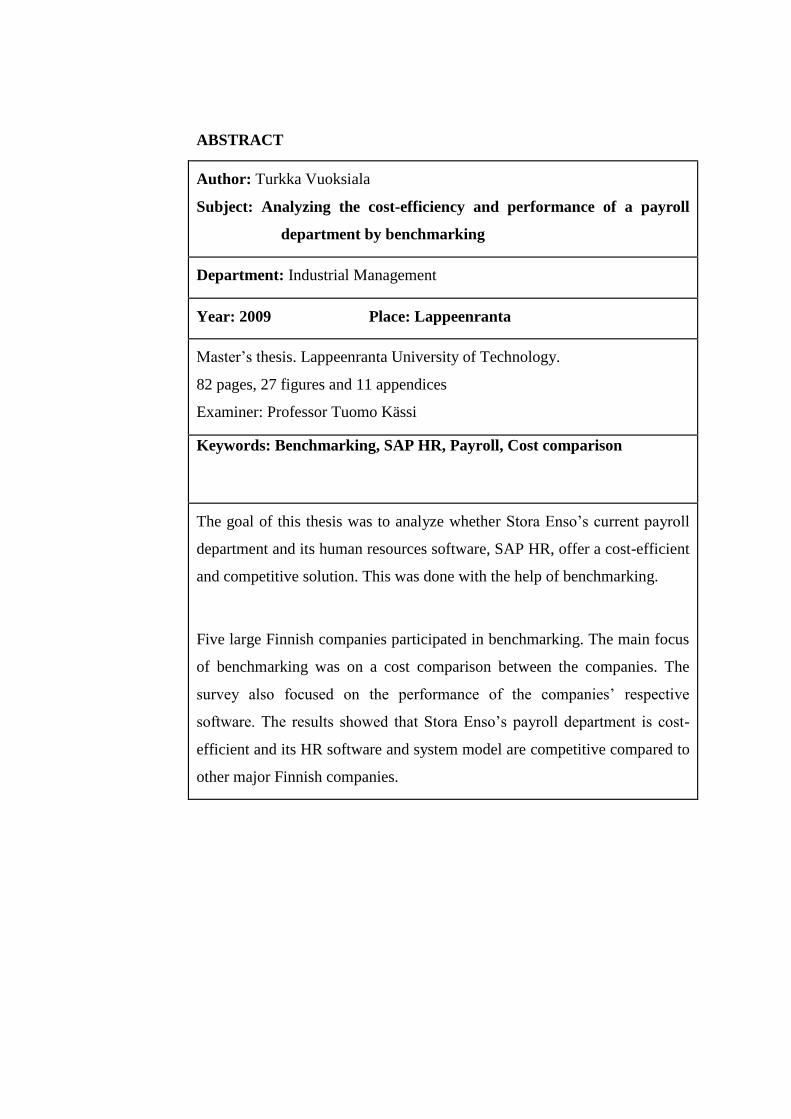
ABSTRACT
Author: Turkka Vuoksiala
Subject: Analyzing the cost-efficiency and performance of a payroll
department by benchmarking
Department: Industrial Management
Year: 2009 Place: Lappeenranta
Master’s thesis. Lappeenranta University of Technology.
82 pages, 27 figures and 11 appendices
Examiner: Professor Tuomo Kässi
Keywords: Benchmarking, SAP HR, Payroll, Cost comparison
The goal of this thesis was to analyze whether Stora Enso’s current payroll
department and its human resources software, SAP HR, offer a cost-efficient
and competitive solution. This was done with the help of benchmarking.
Five large Finnish companies participated in benchmarking. The main focus
of benchmarking was on a cost comparison between the companies. The
survey also focused on the performance of the companies’ respective
software. The results showed that Stora Enso’s payroll department is cost-
efficient and its HR software and system model are competitive compared to
other major Finnish companies.
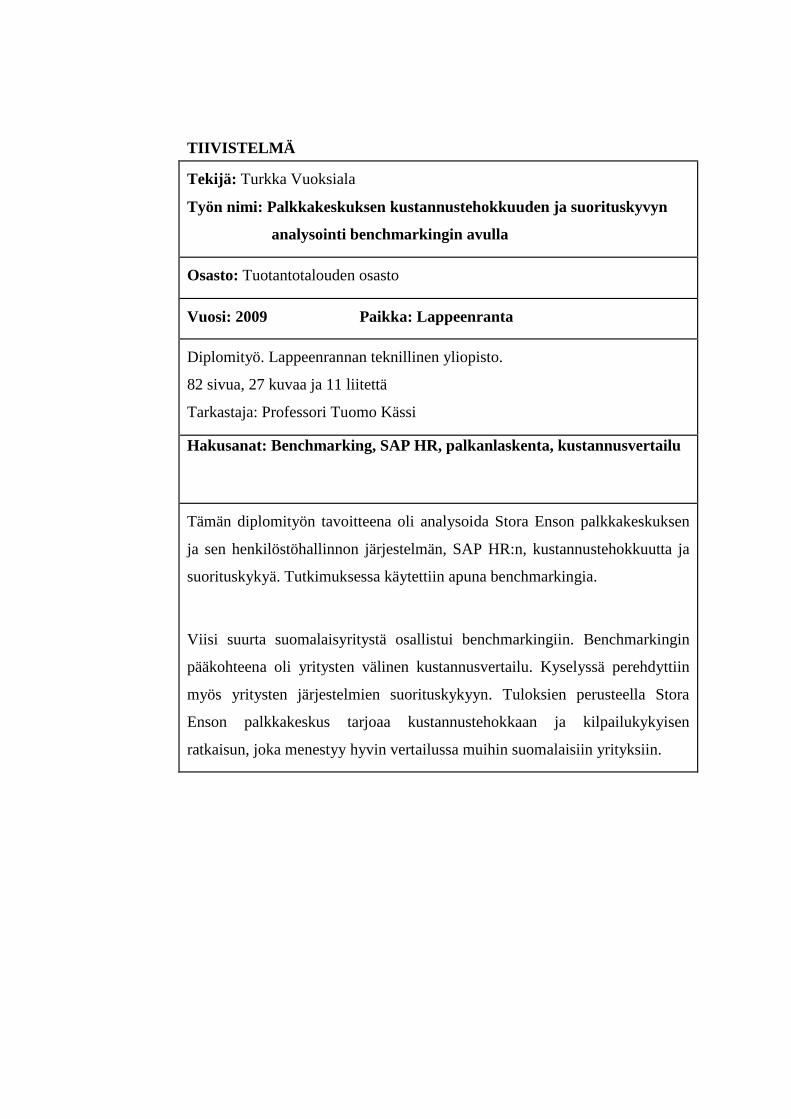
TIIVISTELMÄ Tekijä: Turkka Vuoksiala
Työn nimi: Palkkakeskuksen kustannustehokkuuden ja suorituskyvyn
analysointi benchmarkingin avulla
Osasto: Tuotantotalouden osasto
Vuosi: 2009 Paikka: Lappeenranta
Diplomityö. Lappeenrannan teknillinen yliopisto.
82 sivua, 27 kuvaa ja 11 liitettä
Tarkastaja: Professori Tuomo Kässi
Hakusanat: Benchmarking, SAP HR, palkanlaskenta, kustannusvertailu
Tämän diplomityön tavoitteena oli analysoida Stora Enson palkkakeskuksen
ja sen henkilöstöhallinnon järjestelmän, SAP HR:n, kustannustehokkuutta ja
suorituskykyä. Tutkimuksessa käytettiin apuna benchmarkingia.
Viisi suurta suomalaisyritystä osallistui benchmarkingiin. Benchmarkingin
pääkohteena oli yritysten välinen kustannusvertailu. Kyselyssä perehdyttiin
myös yritysten järjestelmien suorituskykyyn. Tuloksien perusteella Stora
Enson palkkakeskus tarjoaa kustannustehokkaan ja kilpailukykyisen
ratkaisun, joka menestyy hyvin vertailussa muihin suomalaisiin yrityksiin.
ACKNOWLEDGEMENTS
I would like to thank Lasse Mustonen for the opportunity to do my Master’s thesis
at the Stora Enso HR Finland Service Center. Lasse’s comments and thoughts
were an invaluable asset for my thesis. This project taught me a lot and I believe
that the company also benefited from my work.
I would like to thank my examiner Tuomo Kässi for his feedback. Also I want to
thank my co-workers at the Stora Enso HR Finland Service Center in Imatra for
their participation in my work. I would like to thank all the companies for their
co-operation when concluding benchmarking. Finally I would like to say a thank
you to my parents for their on-going support during my studies at Lappeenranta.
Lappeenranta, 30th
of August 2009
Turkka Vuoksiala
TABLE OF CONTENTS
1 INTRODUCTION ....................................................................................................................... 1
1.1 RESEARCH BACKGROUND .............................................................................................................. 2 1.2 RESEARCH OBJECTIVES .................................................................................................................. 2 1.3 RESEARCH IMPLEMENTATION ......................................................................................................... 3 1.4 STRUCTURE OF THE THESIS............................................................................................................. 4 1.5 STORA ENSO COMPANY PROFILE ..................................................................................................... 5
1.5.1 Stora Enso HR Finland Service Center ............................................................................. 6
2 PAYROLL AT STORA ENSO ........................................................................................................ 7
2.1 PAYROLL CALCULATION AT STORA ENSO .......................................................................................... 8 2.1.1 Calculating a wage ......................................................................................................... 9
2.2 “TIME TO MONEY” PROCESS ....................................................................................................... 10 2.3 OTHER PAYROLL FUNCTIONS ........................................................................................................ 13 2.4 PAYROLL SYSTEMS ..................................................................................................................... 13 2.5 PAYROLL PROVIDER ................................................................................................................... 14 2.6 PROBLEMS IN PAYROLL ............................................................................................................... 14
3 PAYROLL IN HUMAN RESOURCES ...........................................................................................15
3.1 MEANS OF PAYMENT .................................................................................................................. 15 3.2 PAYROLL VENDOR SELECTION ...................................................................................................... 16 3.3 PAYROLL SYSTEM SELECTION ....................................................................................................... 17
3.3.1 Application Service Provider ......................................................................................... 18 3.3.2 In-house payroll ............................................................................................................ 19
4 ENTERPRISE RESOURCE PLANNING .........................................................................................21
4.1 SAP ........................................................................................................................................ 22 4.1.1 SAP Modules ................................................................................................................. 22
5 BENCHMARKING ....................................................................................................................24
5.1 PROCESS BENCHMARKING ........................................................................................................... 25 5.1.1 Benchmarking mistakes ................................................................................................ 27
5.2 BENCHMARKING ANALYSIS .......................................................................................................... 28 5.3 KEY SUCCESS FACTORS IN BENCHMARKING ...................................................................................... 28 5.4 ON-SITE VISITING ...................................................................................................................... 29 5.5 CHANGE MANAGEMENT ............................................................................................................. 30 5.6 SENSITIVITY ANALYSIS ................................................................................................................. 31
6 PLANNING BENCHMARKING ...................................................................................................33
6.1 QUESTIONNAIRE ........................................................................................................................ 33 6.2 TESTING .................................................................................................................................. 33
6.2.1 Results .......................................................................................................................... 34 6.3 ON-SITE VISITING ...................................................................................................................... 36
7 BENCHMARKING WITH OTHER COMPANIES ...........................................................................38
7.1 PARTICIPATING COMPANIES ......................................................................................................... 39 7.1.1 Finnair ........................................................................................................................... 39 7.1.2 YLE ................................................................................................................................ 39 7.1.3 Metsäliito...................................................................................................................... 40 7.1.4 Neste Oil ....................................................................................................................... 40
7.2 KEY FIGURES ............................................................................................................................. 41
7.3 COMMON PROCESSES ................................................................................................................. 42
8 BENCHMARKING ANALYSIS ....................................................................................................43
8.1 COSTS ..................................................................................................................................... 45 8.2 SYSTEM PERFORMANCE .............................................................................................................. 47 8.3 OVERALL RESULTS ...................................................................................................................... 51 8.4 SENSITIVITY ANALYSIS ................................................................................................................. 53
8.4.1 Costs ............................................................................................................................. 53 8.4.2 System Performance ..................................................................................................... 54 8.4.3 Overall Performance ..................................................................................................... 55
9 CONCLUSION ..........................................................................................................................57
9.1 SUGGESTIONS FOR FUTURE DEVELOPMENT ..................................................................................... 58 9.2 FUTURE SCENARIOS ................................................................................................................... 60
10 SUMMARY ............................................................................................................................63
11 REFERENCES .........................................................................................................................64
APPENDICES ..............................................................................................................................69

LIST OF FIGURES
FIGURE 1. CURRENT SYSTEM MODEL (TANSKANEN, 2009) ............................................................... 1
FIGURE 2. STRUCTURE OF THE THESIS ............................................................................................... 4
FIGURE 3. STORA ENSO ORGANIZATION (STORA ENSO, 2009) .......................................................... 5
FIGURE 4. HR FINLAND ORGANIZATION (STORA ENSO, 2009) .......................................................... 6
FIGURE 5. PAYROLL FUNCTIONS ........................................................................................................ 8
FIGURE 6. PAYROLL PROCESS “FROM TIME TO MONEY” .................................................................. 11
FIGURE 7. DEVELOPMENT OF ERP SYSTEMS (PAPINNIEMI, 2008) ................................................... 21
FIGURE 8. MAIN CATEGORIES OF ERP PROCESSES (WANG & NAH, 2002) ...................................... 22
FIGURE 9. FIVE PHASES OF PROCESS BENCHMARKING (IOMA, 2008) ............................................ 26
FIGURE 10. MOST SIGNIFICANT CHALLENGES WHEN IMPLEMENTING CHANGE (JORGENSEN ET AL.,
2008)...................................................................................................................................... 30
FIGURE 11. TEST RESULTS ............................................................................................................... 34
FIGURE 12. TEST RESULTS (2) .......................................................................................................... 35
FIGURE 13. KEY FIGURES ................................................................................................................ 42
FIGURE 14. ADJUSTED BUDGETS ...................................................................................................... 43
FIGURE 15. AMOUNT OF PERSONNEL ............................................................................................... 44
FIGURE 16. AMOUNT OF PAYROLL CLERKS ...................................................................................... 45
FIGURE 17. COST OF A PAYSLIP ........................................................................................................ 45
FIGURE 18. PAYROLL COSTS / WORKER ............................................................................................ 46
FIGURE 19. PAYSLIPS / WORKER ...................................................................................................... 47
FIGURE 20. AMOUNT OF PAYSLIPS / YEAR ........................................................................................ 48
FIGURE 21. PAYSLIPS / PERSONNEL .................................................................................................. 48
FIGURE 22. PAYSLIPS / PAYROLL CLERK .......................................................................................... 49
FIGURE 23. IT COSTS / PERSONNEL .................................................................................................. 50
FIGURE 24. OVERALL PERFORMANCE .............................................................................................. 52
FIGURE 25. PRICE OF A PAYSLIP (2) ................................................................................................. 54
FIGURE 26. PAYSLIPS / PAYROLL CLERK (2) ..................................................................................... 55
FIGURE 27. OVERALL PERFORMANCE (2) ......................................................................................... 56
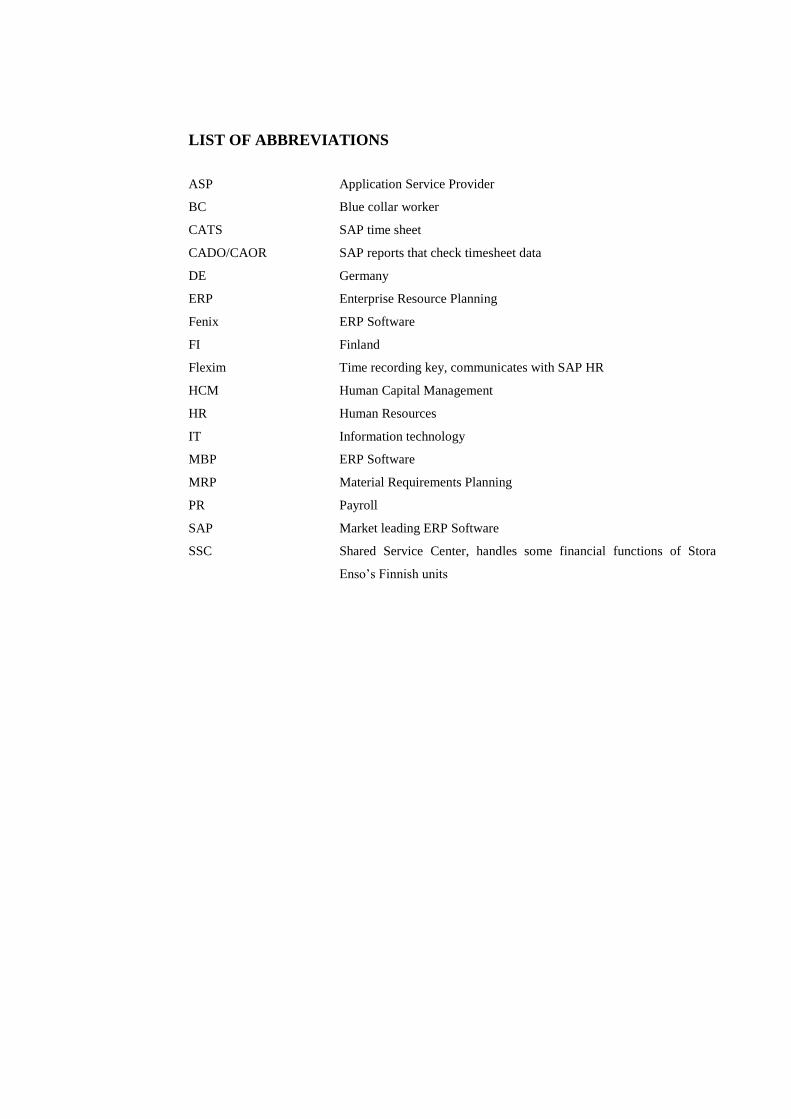
LIST OF ABBREVIATIONS
ASP Application Service Provider
BC Blue collar worker
CATS SAP time sheet
CADO/CAOR SAP reports that check timesheet data
DE Germany
ERP Enterprise Resource Planning
Fenix ERP Software
FI Finland
Flexim Time recording key, communicates with SAP HR
HCM Human Capital Management
HR Human Resources
IT Information technology
MBP ERP Software
MRP Material Requirements Planning
PR Payroll
SAP Market leading ERP Software
SSC Shared Service Center, handles some financial functions of Stora
Enso’s Finnish units
1
1 Introduction
Stora Enso uses SAP HR as its main software for payroll in Finland. All of its
wages go through this system. The installation and updates to the system are taken
care of by its provider, Aditro. Recently Stora Enso has begun researching
whether the current provider offers a cost-efficient solution compared to other
possible alternatives.
In the current financial situation saving costs is critical. Stora Enso wants to know
whether its payroll processes are efficient and how much costs they acquire. The
efficiency of its processes relate to the performance of its software.
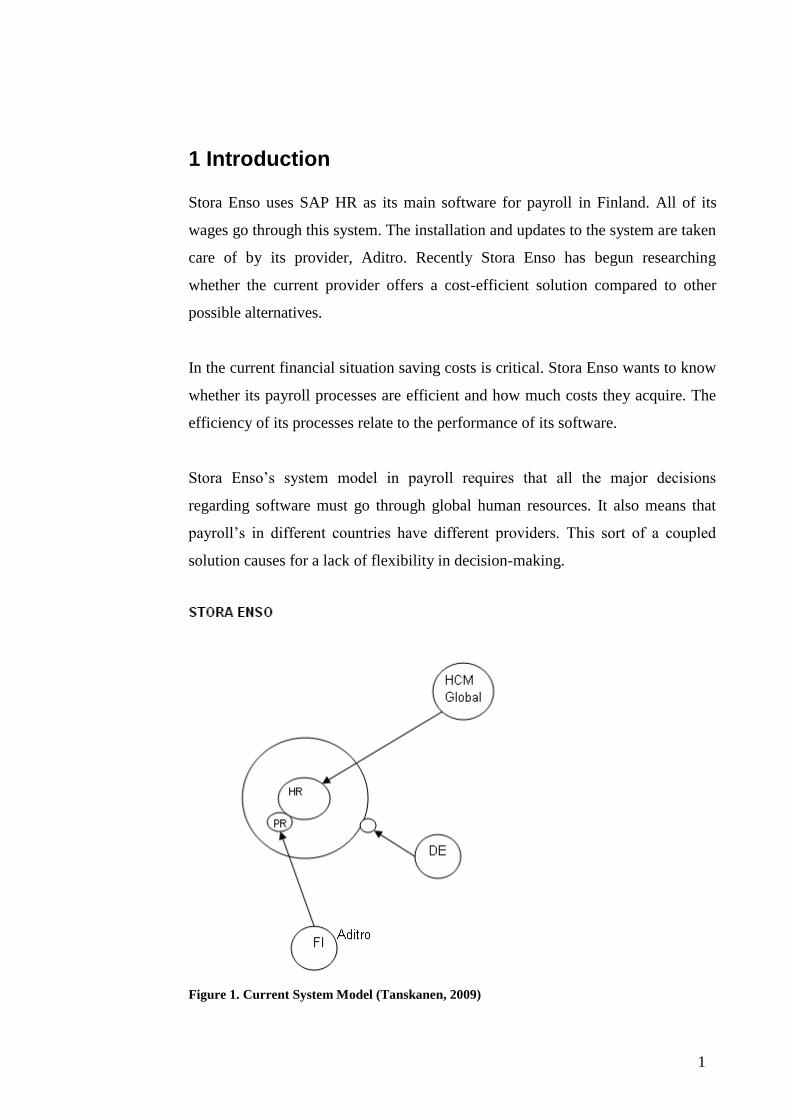
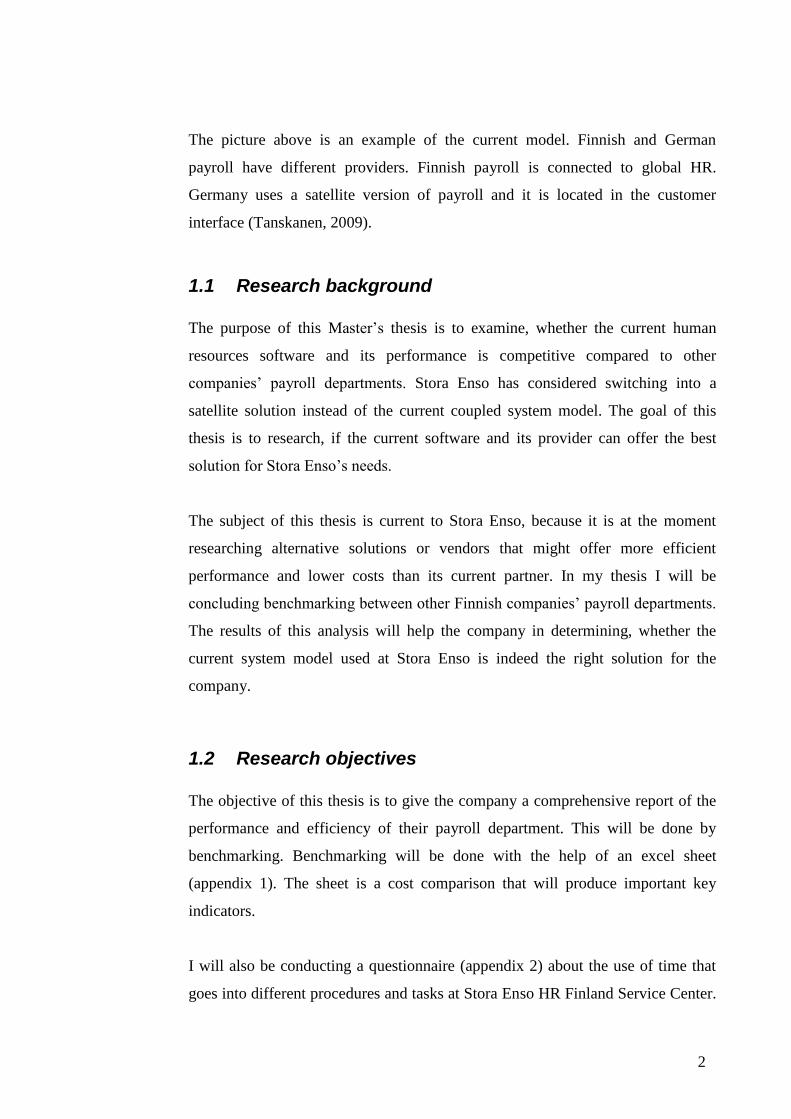
Stora Enso’s system model in payroll requires that all the major decisions
regarding software must go through global human resources. It also means that
payroll’s in different countries have different providers. This sort of a coupled
solution causes for a lack of flexibility in decision-making.
Figure 1. Current System Model (Tanskanen, 2009)
2
The picture above is an example of the current model. Finnish and German
payroll have different providers. Finnish payroll is connected to global HR.
Germany uses a satellite version of payroll and it is located in the customer
interface (Tanskanen, 2009).
1.1 Research background
The purpose of this Master’s thesis is to examine, whether the current human
resources software and its performance is competitive compared to other
companies’ payroll departments. Stora Enso has considered switching into a
satellite solution instead of the current coupled system model. The goal of this
thesis is to research, if the current software and its provider can offer the best
solution for Stora Enso’s needs.
The subject of this thesis is current to Stora Enso, because it is at the moment
researching alternative solutions or vendors that might offer more efficient
performance and lower costs than its current partner. In my thesis I will be
concluding benchmarking between other Finnish companies’ payroll departments.
The results of this analysis will help the company in determining, whether the
current system model used at Stora Enso is indeed the right solution for the
company.
1.2 Research objectives
The objective of this thesis is to give the company a comprehensive report of the
performance and efficiency of their payroll department. This will be done by
benchmarking. Benchmarking will be done with the help of an excel sheet
(appendix 1). The sheet is a cost comparison that will produce important key
indicators.
I will also be conducting a questionnaire (appendix 2) about the use of time that
goes into different procedures and tasks at Stora Enso HR Finland Service Center.
3
This questionnaire will determine what areas need to be improved in order to add
efficiency to the payroll department.
Five major Finnish companies will be participating in benchmarking. The results
of the comparison will give me a good idea about the current situation of Stora
Enso’s payroll services. Benchmarking will also give me material on the current
software’s performance and competitiveness, since two of the other companies
have different software solutions than Stora Enso.
1.3 Research implementation
Cost comparison will be performed with an Excel sheet. I will send out the sheet
to the participating companies and they will fill it according to their own
information. The sheet will be discussed in prior meetings, so that the scope of the
comparison will be the same for each company. That way the results will be
comparable.
I will also prepare a sheet that lists critical tasks to payroll clerks at Stora Enso.
The clerks will fill the questionnaire based on their yearly workload. Most of the
tasks on this sheet are based on different transactions in SAP HR.
The companies participating in benchmarking are the host company Stora Enso,
Finnair, YLE, Metsäliitto and Neste Oil. Of these companies Stora Enso, Finnair
and YLE use SAP HR. Metsäliitto and Neste Oil use different software in their
payroll departments. This will make for an interesting comparison and show me if
there is considerable differences between the performances of different HR
software.
Before the start of the actual benchmarking survey I will be doing work on the
questionnaires and interviewing people for feedback. After the research I will
analyze the results and try to come up with possible alternative solutions that
might benefit the host company.
4
1.4 Structure of the thesis
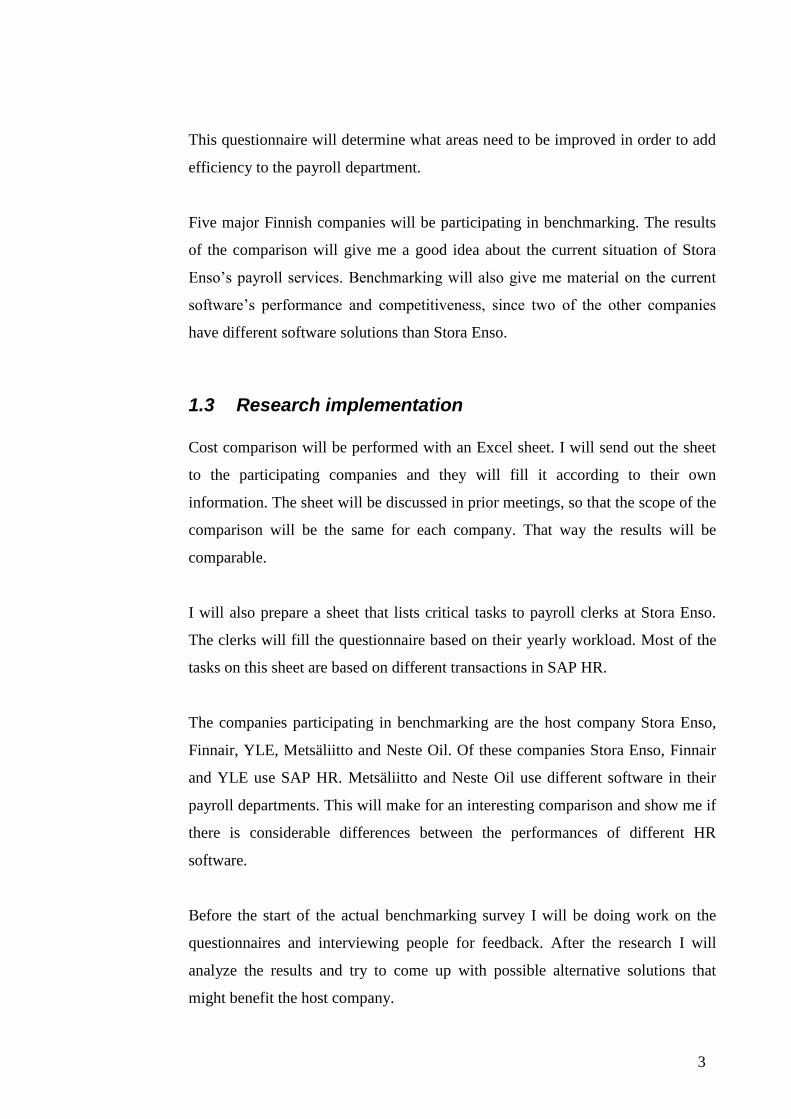
The following figure gives out an input and an output for each chapter of the
Thesis. It presents every chapter’s meaning and purpose to this Master’s thesis.
Figure 2. Structure of the thesis
5
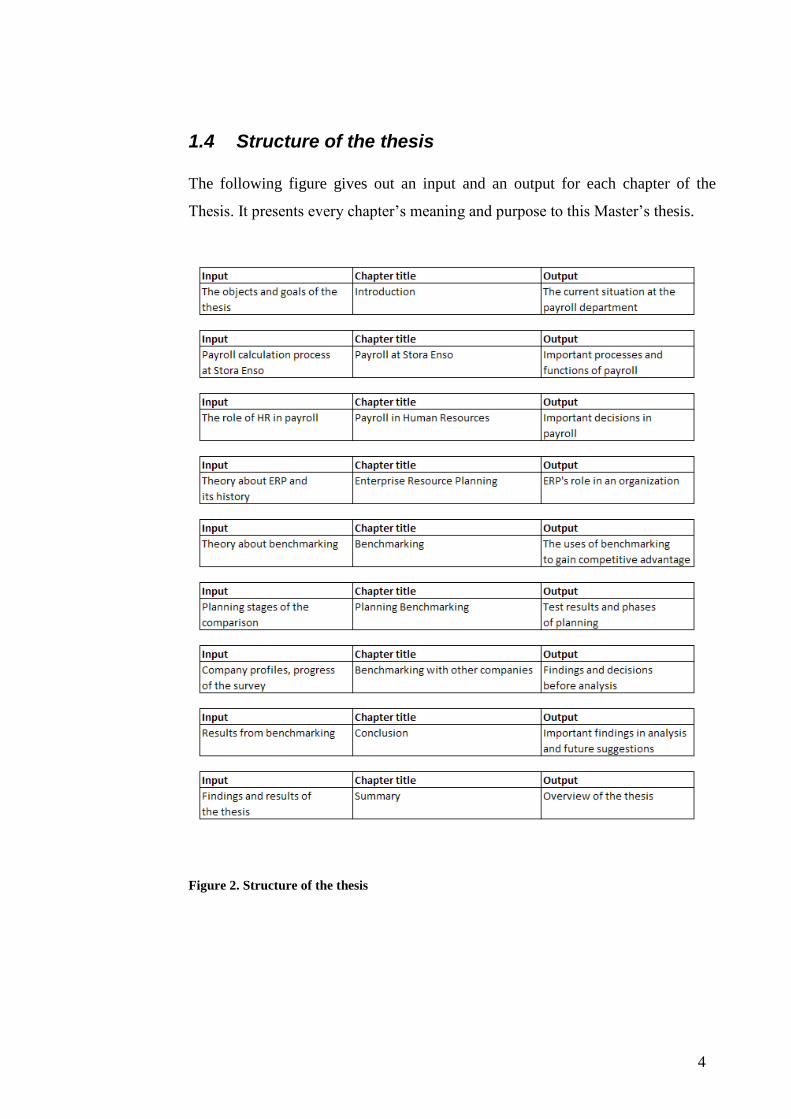
1.5 Stora Enso company profile
Stora Enso is a global paper, packaging and forest products company. Its core
products are newsprint and book paper, magazine paper, fine paper, consumer
board, industrial packaging and wood products (Stora Enso, 2009).
Stora Enso employs 32 000 people in 85 production facilities that are placed in 35
countries worldwide. Stora Enso is a publicly traded company that is listed in
Helsinki and Stockholm. The company’s customers include publishers, printing
houses and paper merchants, as well as the packaging, joinery and construction
industries (Stora Enso, 2009).
Stora Enso’s annual production capacity is 12.7 million tonnes of paper and
board, 1.5 billion square metres of corrugated packaging and 6.9 million cubic
metres of sawn wood products, including 3.2 million cubic metres of value-added
products. The company’s sales in 2008 were 11.0 billion euros, with an operating
profit of 388.4 million euros (Stora Enso, 2009).
Figure 3. Stora Enso Organization (Stora Enso, 2009)
6
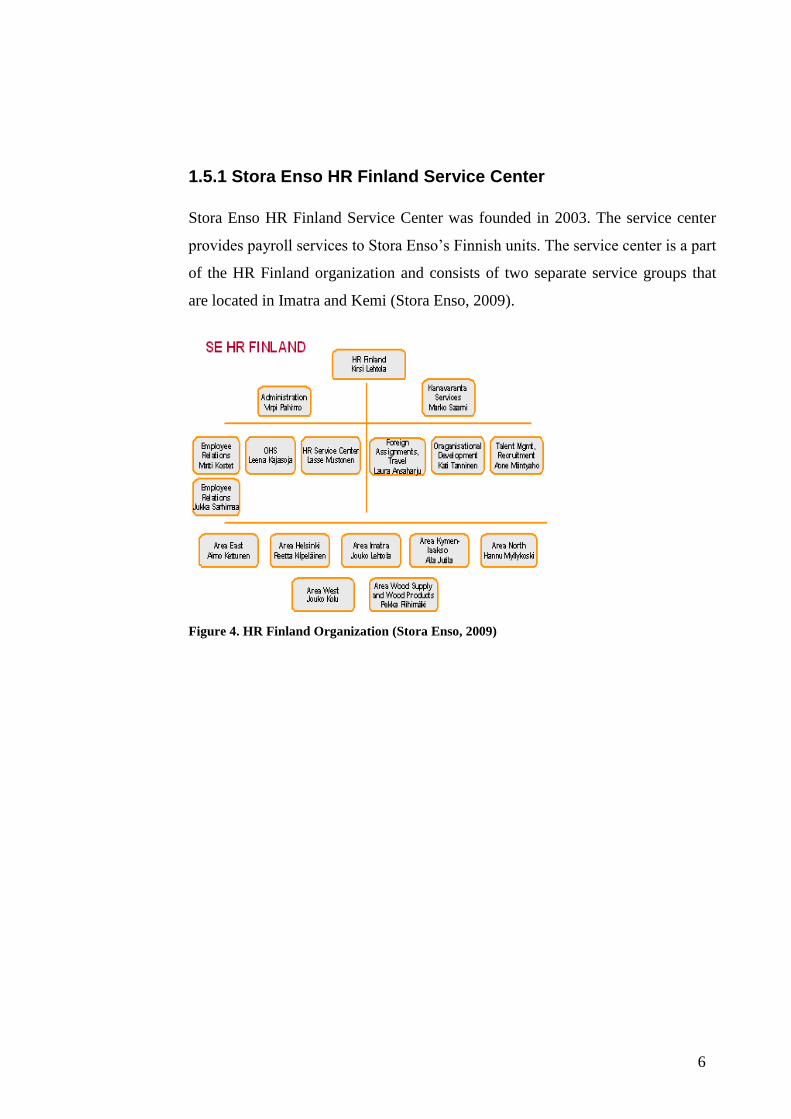
1.5.1 Stora Enso HR Finland Service Center
Stora Enso HR Finland Service Center was founded in 2003. The service center
provides payroll services to Stora Enso’s Finnish units. The service center is a part
of the HR Finland organization and consists of two separate service groups that
are located in Imatra and Kemi (Stora Enso, 2009).
Figure 4. HR Finland Organization (Stora Enso, 2009)
7
2 Payroll at Stora Enso
Finnish payroll is divided into two offices, one in Imatra and one in Kemi. They
are responsible for providing wage calculation to Stora Enso’s employees in
Finland. SAP HR is the main system used in payroll and figures in most of the
payroll functions.
Time recording can be categorized as a part of payroll calculation at Stora Enso’s
Finnish functions. In Germany time recording is done in a different unit by HR
personnel specifically assigned to this area. These persons are called time
managers. In Finland payroll clerks take care of this segment as well.
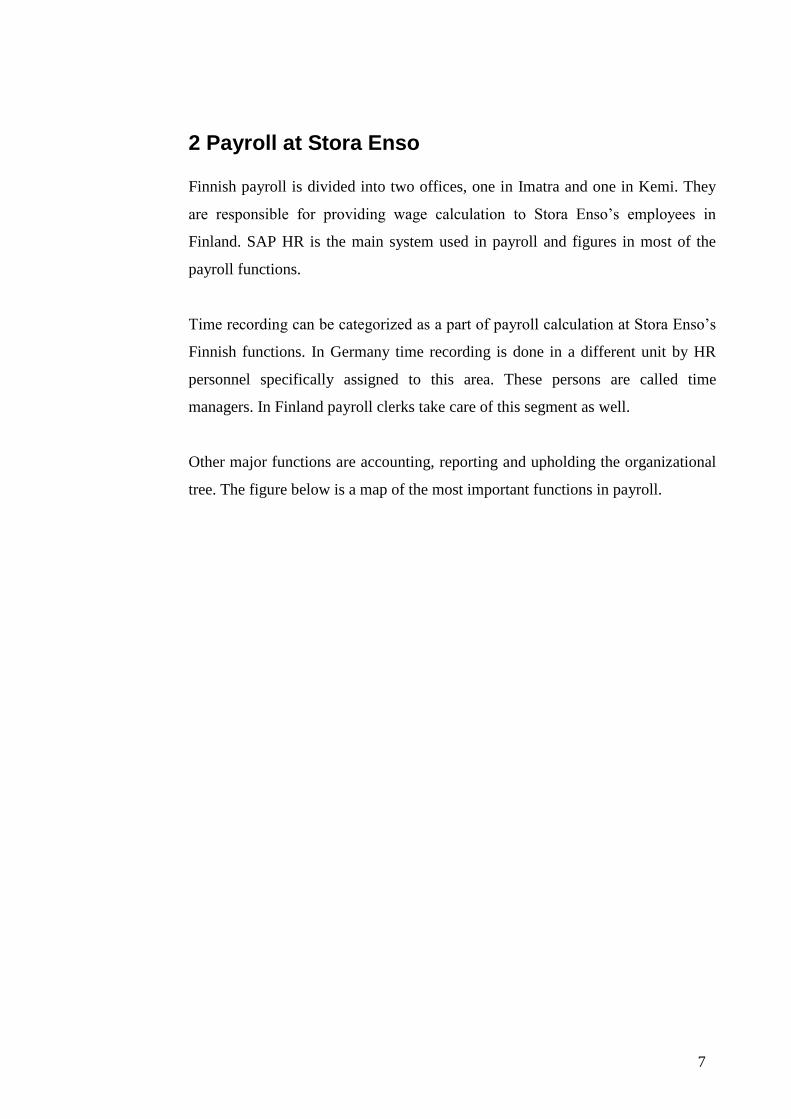
Other major functions are accounting, reporting and upholding the organizational
tree. The figure below is a map of the most important functions in payroll.
8
Figure 5. Payroll functions
2.1 Payroll Calculation at Stora Enso
Stora Enso’s Finnish functions have 9 695 workers. This means that on average a
payroll clerk calculates the wages of 440 workers. In total Stora Enso’s Finnish
payroll produces approximately 232 000 payslips a year.
Payroll calculation in Finland is divided into payroll periods. Blue collar workers
have 26 periods in a year. They receive their wages every two weeks. These are
the employees that usually get their wages based on an hourly fee.
White collar workers have 12 periods in a year, and thus receive their wages once
a month. These employees have a fixed monthly salary that may include some
fringe benefits.
9
There are also pay days for mechanical workers and short time workers. Payoffs
can be done twice every week. Mechanical workers have their own payroll
periods, which differ slightly from the schedule that the blue collar workers have.
Short time workers are usually summer trainees that are contracted to the
company for a month at most.
Stora Enso uses a total of five collective bargaining agreements in wage
calculation. They are separate for white collar and blue collar workers.
Mechanical workers have separate agreements. Employees who work for Stora
Enso Forest also have a different agreement than others which explains for the
amount. These agreements contain rules and regulations for payroll. These rules
include for example pay for overtime and absences.
The two most common types of contracts that employees have are permanent or
temporary contracts. These don’t affect payroll calculation in a major way. Payroll
clerks have to check the temporary worker’s status once in a while especially if
the ending date of their contract is approaching. Before a payoff can be made, a
note from the unit must be sent to the payroll clerk.
2.1.1 Calculating a wage
When calculating a wage, payroll clerks need information about the worker’s
salary, work hours and possible additional bonuses. These are all found in SAP
HR. They are all entered to the system when an employee starts working at Stora
Enso.
During calculation periods this information doesn’t have to be changed in any
way. The system brings them to a person’s payslip in SAP automatically. Most of
the work during payroll periods involves checking for errors, overtime, absences
and bonuses. Sometimes this information needs to be corrected manually to the
10
system, so that the payslip gives out the correct amount of money to the
employee.
The employee’s overtime pay is determined by his salary and the collective
bargaining agreement. The overtime hours should be marked in SAP in the CATS
time sheet and approved by the line managers. The system should then bring this
information to the payslip. In some cases payroll clerks need to manually adjust
the information on the payslips. This happens for example when reporting
weekend work. The collective bargaining agreement states that when a person
works through Saturday and Sunday, he/she will receive extra weekend pay. This
information shows on the CADO/CAOR lists that payroll clerks print out from
SAP during every payroll period.
It can be said that most of the information needed to calculate a person’s wage is
already stored in the system. The main responsibilities for payroll clerks are to
check and see that absences, weekend work and overtime are marked correctly
into the system by employees and line managers. Sometimes this will require a lot
of work though. Correcting errors by line managers and employees can take a lot
of time.
Updating an employee’s master data in SAP brings information to the payslip as
well. Examples of this could be bonuses and seniority allowances. After a payroll
clerk makes updates to the system data, it once again shows on the SAP payslip.
The SAP payslip is an important transaction when calculating wages. When a
payroll clerk makes changes to the system he/she usually checks it from the
payslip after the update. This way the clerk can make sure that the right amount of
money will be paid to the employee.
2.2 “Time to Money” Process
One way to look at benchmarking and payroll is through a process called “from
time-to-money” (Tanskanen, 2009). It involves four actors: Employee, line
11
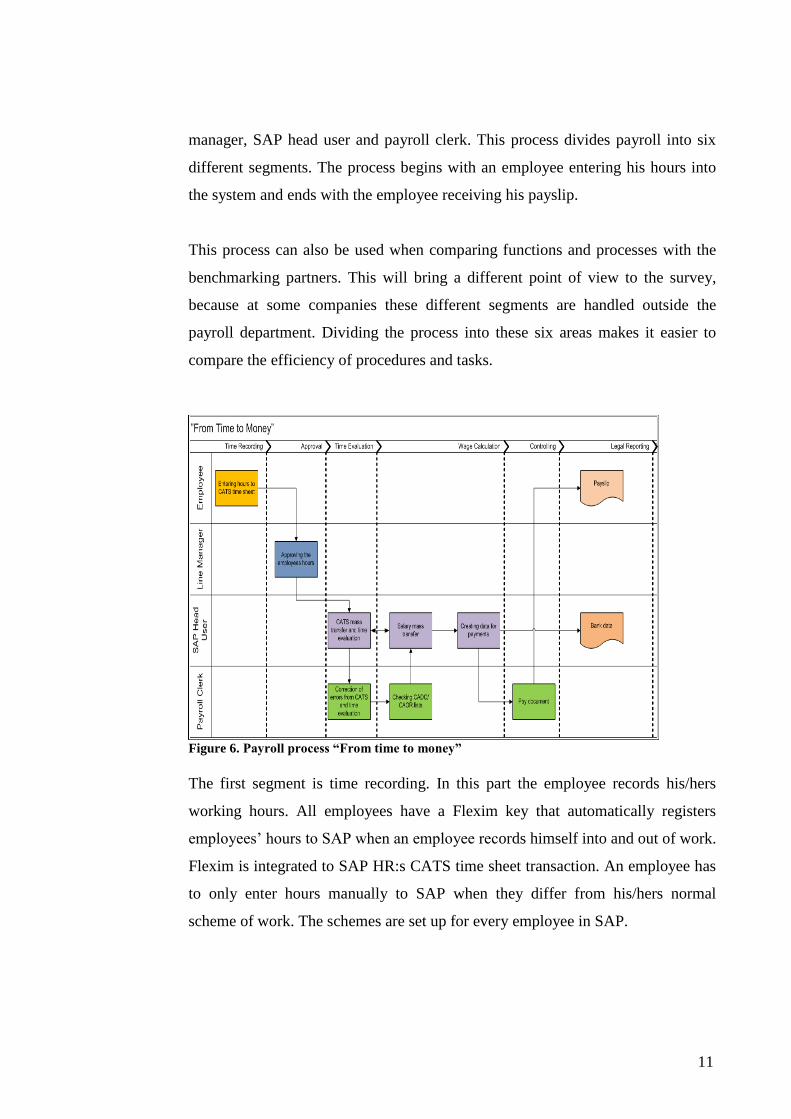
manager, SAP head user and payroll clerk. This process divides payroll into six
different segments. The process begins with an employee entering his hours into
the system and ends with the employee receiving his payslip.
This process can also be used when comparing functions and processes with the
benchmarking partners. This will bring a different point of view to the survey,
because at some companies these different segments are handled outside the
payroll department. Dividing the process into these six areas makes it easier to
compare the efficiency of procedures and tasks.
Figure 6. Payroll process “From time to money”
The first segment is time recording. In this part the employee records his/hers
working hours. All employees have a Flexim key that automatically registers
employees’ hours to SAP when an employee records himself into and out of work.
Flexim is integrated to SAP HR:s CATS time sheet transaction. An employee has
to only enter hours manually to SAP when they differ from his/hers normal
scheme of work. The schemes are set up for every employee in SAP.
12
The second segment is called approval. In the approval phase, the line managers
check the employees’ time sheets from SAP and approve them. If there are some
irregularities, the line managers may make changes to the time sheet.
The third segment is called time evaluation. Time evaluation is also a SAP
transaction that upholds information about time recording. The head users run a
mass transfer for the CATS time sheet and time evaluation. The mass transfer
includes all employees in Finnish functions of Stora Enso. After the run, payroll
clerks will receive information via email about possible errors that occurred
during the transfer.
The fourth segment is payroll calculation. In this part the payroll clerks continue
checking for errors and faults. Running CADO/CAOR lists and checking if the
employees’ absences and vacations are marked correctly on their time sheets are
examples of procedures that are done at this time. After the payroll clerks have
done all the necessary corrections, the head users will run another mass transfer.
This process creates a circle that continues until the end of each payroll period.
When the circle mentioned above is complete, the head users create the material
for bank transfer. After this segment five can begin. It is controlling. In this phase
the payroll accountants will create the pay document. The pay document contains
information about the salaries paid from Stora Enso’s Finnish functions.
Otherwise controlling can be defined as internal calculation that is done in other
units outside of payroll.
Segment six is legal reporting. In this phase the employee should receive his
payslip and the data for bank transfer should be ready, so that the employees can
get their compensation on their bank accounts. Legal reporting in payroll also
includes various kinds of reports such as annual notification and sickness
allowance.
13
The process described above involves a small part of procedures that are done
during payroll. The idea is to give a simplified view of the “time – to – money
process”.
2.3 Other Payroll functions
Payroll calculation isn’t the only function performed at the HR Service Center.
Payroll accounting is also a major part of payroll. Payroll accounting is done by
some payroll clerks. The accountants receive a bonus from doing accounting as
well as payroll calculation.
Most of the accounting work happens right after a payroll period has closed. The
payroll accountants make net payment sheets and transfer them to SharePoint. The
responsibility of the payroll department is to see that the net payments and head
accounts match for all of Stora Enso’s Finnish units. Other functions at the payroll
department include management, development, assisting and reporting and
upholding the SAP organizational tree.
It can be hard to assess detailed job descriptions for some of the people at the
payroll department. Some people have shattered job responsibilities that spread
throughout the organizations procedures. The benchmarking effort done in this
thesis will try to include all of these different responsibilities and tasks.
2.4 Payroll Systems
The main software used for payroll at Stora Enso is SAP HR. The HR module is
suitable for payroll calculation and accounting. Microsoft SharePoint is the other
system used in Finnish payroll.
SAP HR is used for calculating wages, payroll accounting, reporting and
upholding the organizational tree. SharePoint is used as an intermediary system
between the Shared Service Center (SSC) and the Payroll Center. The payroll
14
accountants at the Payroll Center are responsible for providing information to
SharePoint about net payments after every payroll period.
2.5 Payroll Provider
Stora Enso HR Finland Service Center uses Aditro as its provider for payroll.
Aditro provides Stora Enso with a customized version of SAP HR. Installations
and support for the main software are also provided by Aditro.
Global payroll is provided by Siemens. Stora Enso’s Finnish payroll is connected
to Siemens via Aditro. It provides Stora Enso with a coupled system for Finland,
where payroll is connected to global HR. This means that major decisions
regarding payroll systems require the acceptance of global human resources, thus
making Finnish payroll connected to two providers. Having a decoupled situation
as Germany has, would increase freedom and speed up processes. Switching to a
decoupled solution would be costly and require organizational change. In the
current financial situation this change could be hard to sell to management.
2.6 Problems in payroll
Communication between units and the payroll department is one of the bigger
problems in payroll. The lack of communication can slow many processes. People
in units aren’t always good SAP users, and that creates problems for payroll clerks
and increases their already heavy workload.
The lack of common sets of rules and instructions makes it harder for new payroll
clerks and summer workers to adapt to a new workplace. Payroll calculation can
be done in many different ways, but setting up some common instructions for
procedures would be a good idea for the future. A project has been set up for this
purpose at the company.
15
3 Payroll in Human Resources
Foot & Hook (1999) describe the following as the main activities of human
resource management:
o Recruitment and selection
o Training and development
o Human resource planning
o Performance assessment
o Payment and reward of employees
o Health and safety
Payroll belongs to payment and reward of employees. It is an important part of
human resource management. It is critical that payroll works properly in order to
guarantee that the employees in an organization will be kept happy and motivated.
3.1 Means of payment
One of human resource management’s top concerns is that people work as
effectively as possible for the organization. One of the ways that an organization
tries to achieve this is by setting up an appropriate system of payment to
encourage and reward employees (Foot & Hook, 1999). In the following
paragraphs I will go over some of the most common means of payment.
Compensation is often referred to as payment, but in payroll it usually means that
the employee will be compensated for a loss or an injury (Foot & Hook, 1999).
Examples of this could be sick pay or compensation for an injury caused through
work.
Reward can be used when trying to motivate people to work harder. Reward could
also be a non-monetary award. Remuneration can also be used as a term for
16
payment (Foot & Hook, 1999). An example of this could be holiday
remuneration.
Wages are usually paid on a weekly basis. They are based on hourly pay and are
most often the source of payment for white collar workers. Wage-earners usually
do a totally different job compared to management (Foot & Hook, 1999).
Salaries are most likely paid on a monthly basis. Salaries often include fringe
benefits. Salaried employees tend to be in managerial posts or identify themselves
closely with management (Foot & Hook, 1999).
3.2 Payroll Vendor Selection
Choosing a system vendor is a critical choice for a department. It can easily
determine the success of a payroll department (IOMA, 2009).
One of the most important factors when choosing a vendor is its customer-
oriented culture. The vendor should listen to customers, understand their needs
and be able to create innovative solutions. Customer service should also be one of
the top priorities when choosing a vendor (IOMA, 2009).
The vendor needs to be financially sound and reliable. In the current financial
situation this will certainly become a more important criterion. Confidence in the
vendor must be high, when entrusting it to process your sensitive data (IOMA,
2009).
A good software vendor understands a customer’s business and industry. The
vendor’s size and experience is a factor that should be considered given the
volatility of the software industry. A strong customer base will usually benefit all
customers (IOMA, 2009).
17
Technology is without a doubt an important factor as well. The continuing
evaluation of payroll systems and staying current with what’s available in the
marketplace should be some of the vendor’s top priorities. A solid platform is an
essential part of any good software. A good vendor must be ready to constantly
update their software to accommodate for the ever-changing rules and regulations
of payroll (IOMA, 2009).
Other important factors that are discussed in IOMA’s (2009) article about
choosing a payroll vendor are:
- An established infrastructure that supports clients needs
- Internal controls for data security and funds
- The ability to relocate payroll processing in case of an emergency
- Technical knowledge
- Opportunities for training and development
- Long-term cost of ownership
- Customer references
- The ability to support growth in the future
- Accuracy and timeliness of the system
- Options for reporting
3.3 Payroll System Selection
A company may decide to purchase a new payroll system for a variety of reasons.
The age of the old system could be a factor. A lack of support from its current
vendor or new business requirements could lead to the acquisition of a new
system. Selecting and implementing a new system can however be a time-
consuming and expensive project. Payroll managers should think carefully about
the options that are available before making the decision (IOMA, 2008).
There are many alternatives to choose from when picking a system. IOMA’s
article (2008) divides these choices into four categories:
18
1) Application Service Provider
2) An in-house computer with customer-designed software
3) An in-house computer with vendor-supplied software
4) A combination of these elements
3.3.1 Application Service Provider
An application service provider (ASP) is an independent company that takes care
of the client’s entire payroll or a portion of the payroll for a fee. The ASP takes
the raw data provided by the employer and processes it in a way that paychecks
and direct deposits can be created. This can be a good choice for a small firm that
can’t afford to maintain a large payroll department (IOMA, 2008).
The ASP provides the hardware and software used to process payroll.
Communication between the ASP and the employer should be frequent and open
in order to guarantee that the necessary data is provided. The employer and the
ASP should agree on a common way of data transfer to ensure that the process
goes smoothly. Typically ASPs receive data through an Internet transfer (IOMA,
2008).
Hiring an ASP has many advantages. The employer has to pay for processing
only, meaning that fixed costs are low. It also doesn’t require extra room or
employees from the employer. Having an ASP as a payroll system presents
networking possibilities with user groups and offers training and support (IOMA,
2008).
The disadvantages in having an application service provider include the
following:
Lack of control and security over sensitive information
The responsibility for filing errors remains with the employer
Time for changes is limited
19
No control over breakdowns high variable costs
Reference: IOMA, 2008
3.3.2 In-house payroll
An in-house payroll system is situated on company premises. The software or
hardware is owned or leased by the employer. This allows the employer to have
greater control over the hardware system and its security. The system is operated
by the employer’s own employees (IOMA, 2008).
There are different options when selecting hardware. They are as follows:
- Mainframe computers
- Microcomputers (personal computers)
- Servers
- Workstations
- Microcomputer networks
Reference: IOMA, 2008
Mainframe computers require a large organization. Having basic microcomputers
is a common choice. It allows for flexibility especially when dealing with
vendors. Workstations are personal computers that are usually more powerful and
faster than an average microcomputer (IOMA, 2008).
Servers provide communication between work stations and personal computers, as
well as a connection to the Internet/intranet. The final option is choosing
microcomputer networks. This allows computers to communicate with each other
inside a network, thus eliminating unnecessary work (IOMA, 2008). When
choosing software an employer has three alternatives:
1) Off-the-shelf software
2) Vendor-supplied software
20
3) Customized software
Reference: IOMA, 2008
An off-the shelf software can be put in to immediate use. The costs are lower than
in vendor-supplied software. However it is usually PC-based and it doesn’t allow
for modifications. This option is most suitable for small employers (IOMA, 2008).
Having vendor-supplied software allows for speedy implementation, significant
cost savings, vendor updates, easy usability, user-group networking and better
documentation. A disadvantage can be the lack of the vendor’s knowledge about
the specific industry or business of the employer. This may result in the fact that
the employers’ specific needs cannot be met. Other cons might be the cost of the
system and the high capacity required from the employer’s computers (IOMA,
2008).
Customized software will increase control and flexibility. The employer’s needs
are met more often and control over the payroll system is greater. Having
customized software reduces training time since employees are included in the
development of the software (IOMA, 2008).
21
4 Enterprise Resource Planning
ERP-software can be defined as information technology based software, which
supports a corporations’ business activity (Wang & Nah, 2002). Klaus et al.
(2000) describe ERP as a comprehensive, packaged software solution that seeks to
integrate the complete range of a business’s processes and functions in order to
present a view of the business from a single information and IT architecture. In a
global corporation it is essential to use some kind of ERP-software that combines
at least material management and customer relations (Jormanainen, 2008).
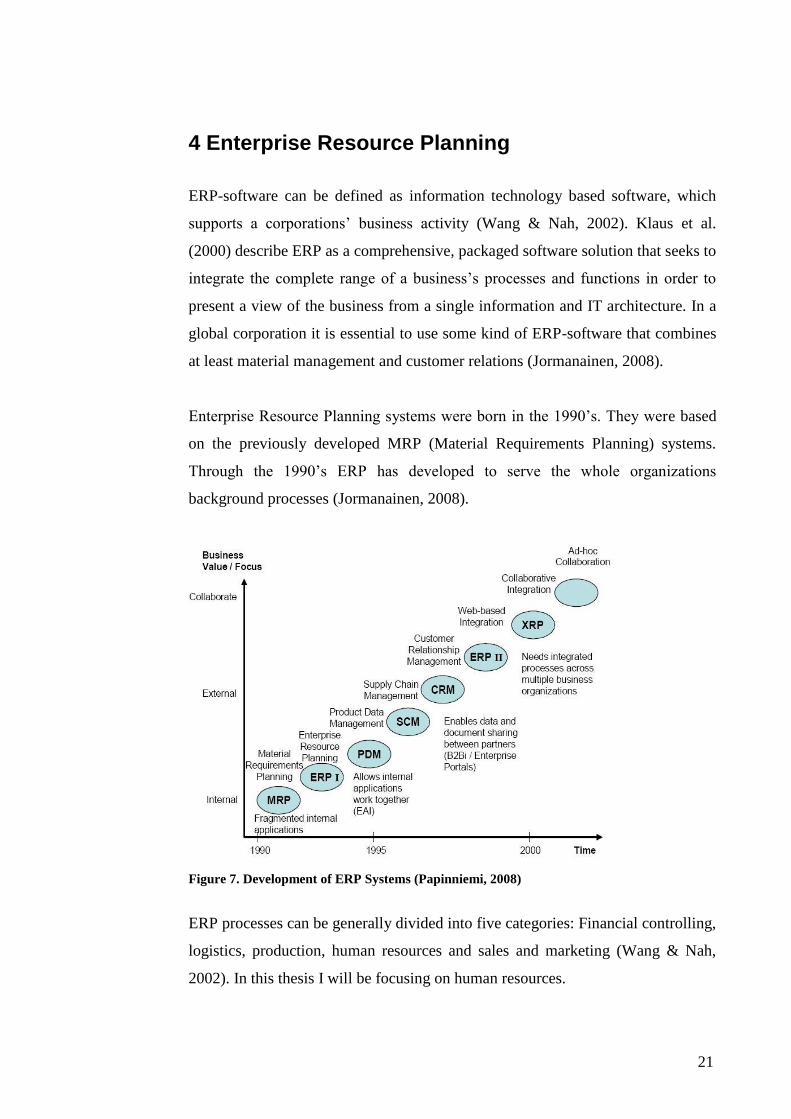
Enterprise Resource Planning systems were born in the 1990’s. They were based
on the previously developed MRP (Material Requirements Planning) systems.
Through the 1990’s ERP has developed to serve the whole organizations
background processes (Jormanainen, 2008).
Figure 7. Development of ERP Systems (Papinniemi, 2008)
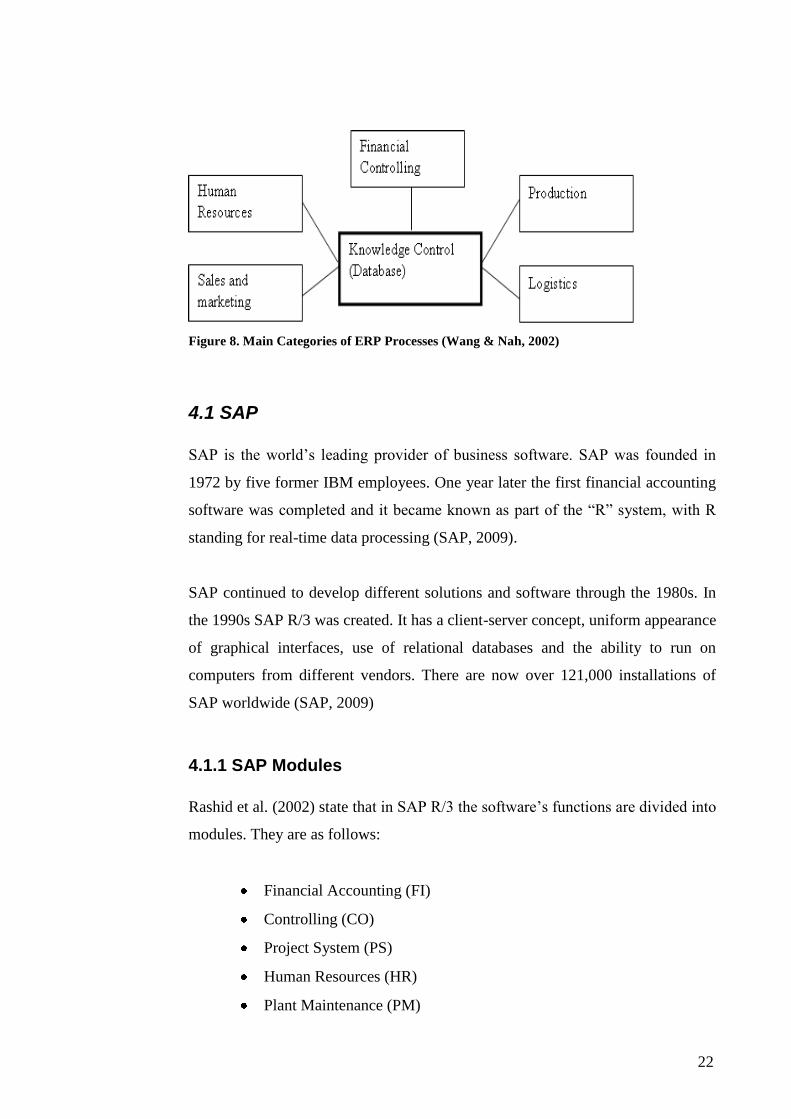
ERP processes can be generally divided into five categories: Financial controlling,
logistics, production, human resources and sales and marketing (Wang & Nah,
2002). In this thesis I will be focusing on human resources.
22
Figure 8. Main Categories of ERP Processes (Wang & Nah, 2002)
4.1 SAP
SAP is the world’s leading provider of business software. SAP was founded in
1972 by five former IBM employees. One year later the first financial accounting
software was completed and it became known as part of the “R” system, with R
standing for real-time data processing (SAP, 2009).
SAP continued to develop different solutions and software through the 1980s. In
the 1990s SAP R/3 was created. It has a client-server concept, uniform appearance
of graphical interfaces, use of relational databases and the ability to run on
computers from different vendors. There are now over 121,000 installations of
SAP worldwide (SAP, 2009)
4.1.1 SAP Modules
Rashid et al. (2002) state that in SAP R/3 the software’s functions are divided into
modules. They are as follows:
Financial Accounting (FI)
Controlling (CO)
Project System (PS)
Human Resources (HR)
Plant Maintenance (PM)
23
Production Planning (PP)
Materials Management (MM)
Investment Management (IM)
Quality Management (QM)
Sales and Distribution (SD)
The newer SAP versions have started using the term solution instead of modules.
The main solutions that SAP ERP offers are Analytics, Financials, Human Capital
Management, Procurement and Logistics Execution, Product Development and
Manufacturing, Sales and Service and Corporate Services (SAP, 2009).
24
5 Benchmarking
Kyrö (2003) cites Kulmala (1999) and Bhutta and Huq (1999) in her article about
the definitions and concepts of benchmarking. Kulmala (1999) refers to
benchmarking as the process of evaluating and applying best practices that
provides possibilities to improve quality. Bhutta and Huq (1999) argue that
benchmarking is a tool for improvement, achieved through comparison with other
organisations that are best within the area. Ahmed and Rahiq (1998) state, that
benchmarking is learning how to improve activities, processes and management.
Benchmarking is an essential tool for continuous improvement of quality and
efficiency (Dattakumar & Jagadeesh, 2003). Besides analyzing competition,
benchmarking also includes analyzing organizational processes and methods
(Mathaisal et al., 2003)
Xerox was the first company to use benchmarking in the late 1970s. Xerox was
keen to understand how Japanese manufacturers could produce less costly but
high quality photocopier machines. Through benchmarking Xerox was able to
increase design and production efficiency and reduce manufacturing costs of their
machines (Mathaisal et al., 2003).
The motivation behind benchmarking and finding best practices is usually in
maintaining and improving the organizations’ competitiveness. By comparing
processes, the level and standard of the company’s own operations will be
clarified. Benchmarking can also accelerate research and development and add
awareness of competitors’ strengths and weaknesses (Karjalainen, 2002).
Karjalainen (2002) describes benchmarking as a four step process. The first step is
self-evaluation. By doing self-evaluation a company determines the processes that
are in critical need of improvement. The next step in doing benchmarking is to
find companies or partners that use similar types of processes. Finding willing
partners to participate in the benchmarking process is vital for the successful
implementation of the survey. After a company has found partners, benchmarking
25
is concluded between these organizations. The final step is to analyze these results
and compare them to the current situation within the company.
Benchmarking can serve as a tool for creating new business relationships. Finding
best practices and comparing them will develop co-operation between companies.
In this way benchmarking can also act as a communal activity (Karjalainen,
2002).
Karjalainen (2002) states, that benchmarking always includes two key actors. The
first of these actors is an estimator. An estimator’s job is to conclude research and
to analyze results at the end of the survey. The second actor is the target of
research. These are the organizations that participate in the benchmarking survey.
It is also important to have specific goals and reasons as to why benchmarking is
done. The tools of research must also be clarified before starting benchmarking.
Comparing costs is one of the key factors in benchmarking. If a company can find
partners that use different process models or software in similar activities, the
benchmarking effort can produce considerable gains to all the participating parties
(IOMA Research, 2008).
5.1 Process Benchmarking
In payroll, cutting costs and seeking new ways of performance improvement is a
must. By finding and developing best practices a payroll department can achieve
these goals. Benchmarking examines best practices from other departments and
thus can improve one’s own processes (IOMA, 2008).
When starting benchmarking it is important to establish a benchmarking program
for the payroll department. There are several different viewpoints to choose from.
The most useful viewpoint when dealing with payroll is usually process
benchmarking. Process benchmarking focuses on specific work processes and
procedures and identifies the best operating practices (IOMA, 2008).
26
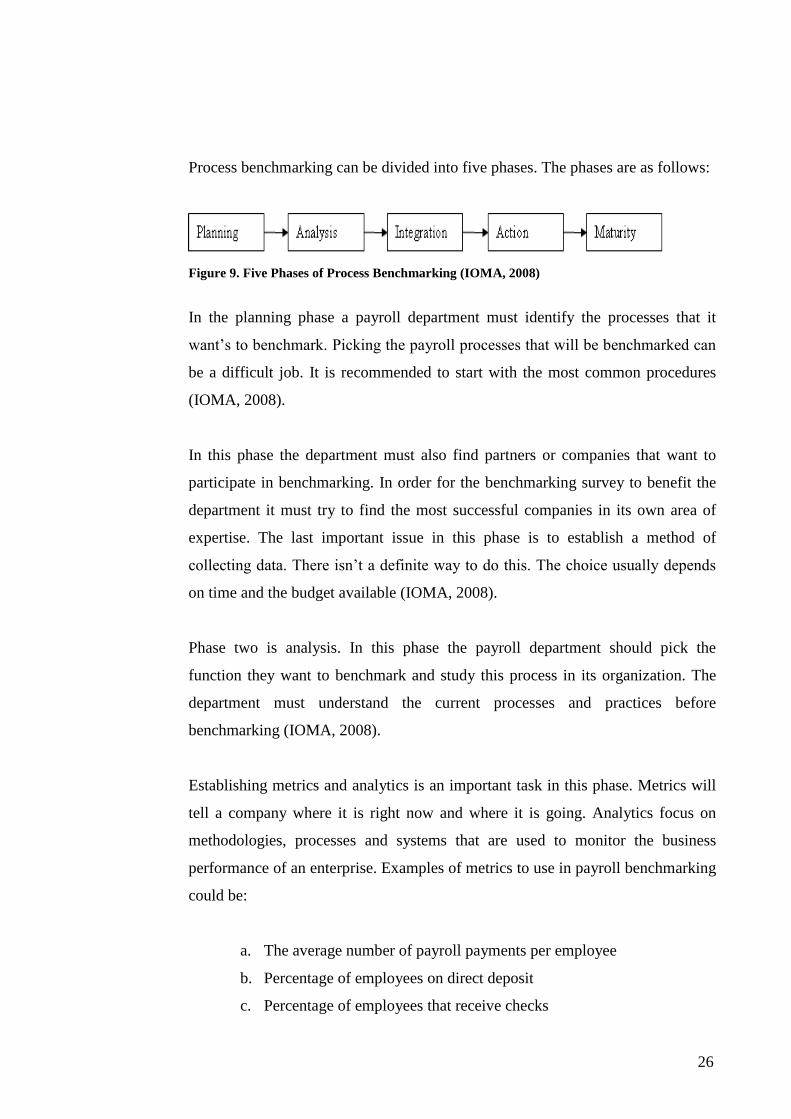
Process benchmarking can be divided into five phases. The phases are as follows:
Figure 9. Five Phases of Process Benchmarking (IOMA, 2008)
In the planning phase a payroll department must identify the processes that it
want’s to benchmark. Picking the payroll processes that will be benchmarked can
be a difficult job. It is recommended to start with the most common procedures
(IOMA, 2008).
In this phase the department must also find partners or companies that want to
participate in benchmarking. In order for the benchmarking survey to benefit the
department it must try to find the most successful companies in its own area of
expertise. The last important issue in this phase is to establish a method of
collecting data. There isn’t a definite way to do this. The choice usually depends
on time and the budget available (IOMA, 2008).
Phase two is analysis. In this phase the payroll department should pick the
function they want to benchmark and study this process in its organization. The
department must understand the current processes and practices before
benchmarking (IOMA, 2008).
Establishing metrics and analytics is an important task in this phase. Metrics will
tell a company where it is right now and where it is going. Analytics focus on
methodologies, processes and systems that are used to monitor the business
performance of an enterprise. Examples of metrics to use in payroll benchmarking
could be:
a. The average number of payroll payments per employee
b. Percentage of employees on direct deposit
c. Percentage of employees that receive checks
27
d. Percentage of errors
Reference: IOMA, 2008
In the integration phase the benchmarking effort should be completed. Then the
payroll department must use the information to make improvements. This requires
communication and acceptance by management. Functional goals for
implementing the new findings must also be set (IOMA, 2008).
The fourth phase in this process is called action. Once the findings and goals are
found, action must be taken. Plans should be made within the payroll department
for the possible implementation of new findings (IOMA, 2008).
The final phase is maturity. This level can be achieved with hard work and
commitment to the plans that were made after the benchmarking study. At this
stage the company should’ve been able to reach the goals that were set after the
results from the survey were done (IOMA, 2008).
5.1.1 Benchmarking mistakes
Payroll managers may make a few mistakes that can be costly when concluding
benchmarking. Confusing benchmarking for a survey is one of them. Although
benchmarking is a survey in itself, it is important to analyze what is behind the
numbers. It is critical to find out more about the methods and procedures that take
a company’s processes to a desired level of efficiency (IOMA, 2008).
Making the process too large or complex can produce problems. It is usually not
recommendable to benchmark the entire payroll department at once. It is also
preferable to avoid benchmarking a procedure that is difficult to measure. An
example of this could be customer satisfaction (IOMA, 2008).
28
A company must remember to analyze its own processes thoroughly before
beginning benchmarking with other companies. Researching the benchmarking
partners and data needs to be also done in a meticulous way (IOMA, 2008).
5.2 Benchmarking Analysis
After the performance data of the benchmarking process is selected, it is time to
start examining the findings. The estimator should try to find superior practices
from the other organizations and analyze them. Camp (1999) suggests questions
that an organization should ask itself when thinking about implementing new
practices:
What is the business impact?
Is it easy to implement the practice?
Does it offer near-term or long-term improvements?
Do the results offer solutions to specified goals or priorities?
Do the practices complement other initiatives that are already under
way?
Camp (1999) also describes ways of recognizing superior practices. They are as
follows:
The practice can be validated from multiple sources
There is a significant magnitude difference between practices
Expert analysis
The practice can be defined as an organization’s core business
The practice and its output is offered for sale by the organization
5.3 Key success factors in benchmarking
There are several key factors that need to be in check, if a company wants their
benchmarking project to be a success. First of all management needs to be
29
committed to the project (Korhonen, 2009). Without the support of management,
the project will lack the necessary resources.
Identifying and knowing your own processes is critical (Korhonen, 2009). The
full range of an organization’s processes should be described. This way the
organization can prioritize the most important ones that will be compared in
benchmarking. Documenting your processes shows the other participants a
commitment to the project (Camp, 1999).
The process owners should be included in benchmarking. They might possess
information that might become useful in benchmarking. Usually those who are
closest to the process, have the most knowledge (Camp, 1999).
Knowledge about benchmarking is required. Organizations should be able to offer
training and information about the process. A common set of ground rules and
ethical principles should also be established. Participants in benchmarking should
commit to giving out right information (Camp, 1999; Korhonen, 2009).
5.4 On-Site visiting
Visiting the other companies that are participating in benchmarking will speed up
the whole process and help the companies set common ground rules and
expectations. When performing visits the companies should have documents that
clarify their standard procedures. Also it would be good for the visiting company
to prepare some questions before the visit (Camp, 1999).
It is always favourable to present created documents that could attract the other
company to benchmarking exchanges. An example of this could be a documented
business process. Sharing this with the other companies will give them the ability
to discover new innovative practices and gain insight to their own process (Camp,
1999).
30
5.5 Change Management
Jorgensen et al. (2008) identify key barriers to change. Changing mindsets and
attitudes, the existing corporate culture and underestimating project complexity
present the biggest challenges to an organization. These “soft challenges” can be
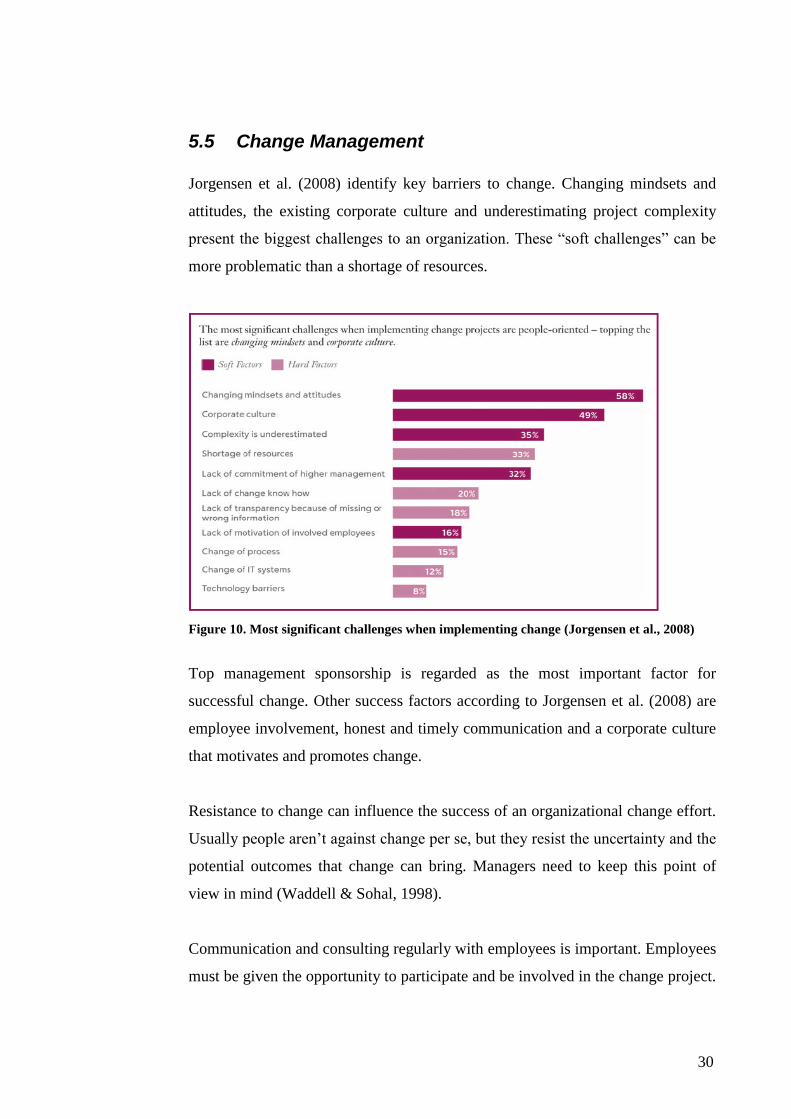
more problematic than a shortage of resources.
Figure 10. Most significant challenges when implementing change (Jorgensen et al., 2008)
Top management sponsorship is regarded as the most important factor for
successful change. Other success factors according to Jorgensen et al. (2008) are
employee involvement, honest and timely communication and a corporate culture
that motivates and promotes change.
Resistance to change can influence the success of an organizational change effort.
Usually people aren’t against change per se, but they resist the uncertainty and the
potential outcomes that change can bring. Managers need to keep this point of
view in mind (Waddell & Sohal, 1998).
Communication and consulting regularly with employees is important. Employees
must be given the opportunity to participate and be involved in the change project.
31
They must also be allowed to give feedback. Considering these factors should be a
top priority for management (Waddell & Sohal, 1998).
5.6 Sensitivity analysis
The values and assumptions of any economic model are prone to change and
error. Sensitivity analysis investigates these potential changes and their impact on
a model (Pannell, 1996).
Pannell (1996) divides the uses of sensitivity analysis to four different categories:
1) Decision making or development of recommendations for decision
makers
2) Communication
3) Increased understanding or quantification of the system
4) Model development
In all models parameters are somewhat uncertain. The modeller is likely to be
unsure of the current values and uncertain about future values. This can be applied
to things such as prices, costs, productivity and technology. Uncertainty is one of
the main reasons for conducting sensitivity analysis. The analysis helps in
recommendations and future decisions (Pannell, 1996).
If and when parameters are uncertain, sensitivity analysis can give information on
the following subjects:
1) How robust (insensitive to change) the optimal solution is when
dealing with different parameter values
2) Under what circumstances and how the optimal solution changes
3) How much worse would the current situation be if decision-makers
stuck to it instead of updating their strategy
Reference: Pannell (1996)

32
If there isn’t a single strategy that would be the most effective choice, sensitivity
analysis can identify the best values in different strategic choices. Sensitivity
analysis can also be used in risk-assessment, when analyzing the trade-off
between risk and benefit within the model. In principle sensitivity analysis has a
simple idea: change the model and observe its behaviour (Pannell, 1996).
33
6 Planning Benchmarking
The benchmarking effort started with creating a questionnaire. The idea of the
questionnaire was to list as many procedures as possible from the payroll
department. Getting the companies to participate in benchmarking wasn’t a
problem. They were all willing to help in conducting research.
6.1 Questionnaire
The first drafts of the questionnaire were supposed to give a comprehensive view
of all the processes and procedures that are performed in the payroll center. The
initial questionnaire included 120 different procedures. The questionnaire was
meant to be divided into personnel areas and units. There was also a separate
column for SAP head users.
After discussing the questionnaire with my thesis instructor I decided to compress
it. The new survey was intended for payroll clerks only and had 35 different
procedures. The new survey wasn’t divided into personal areas and units, thus
making it easier for the payroll clerks to fill and creating more reasonable
answers.
After the first on-site visit the concept of the questionnaire was changed. The form
was divided into 15 larger processes. The idea was to send the form into the
participating companies and then see what the common processes were. After that
the idea was to go into smaller detail inside the processes.
6.2 Testing
Testing began at the middle of March. It was done at the HR Service Center’s
Imatra office. I created a compressed questionnaire (appendix 2) that was to be
filled by payroll clerks. The idea was to get some preliminary results before
making the first on-site visit to Metsäliitto. I sent the questionnaire to 16 people
via e-mail and set the deadline for two weeks.
34
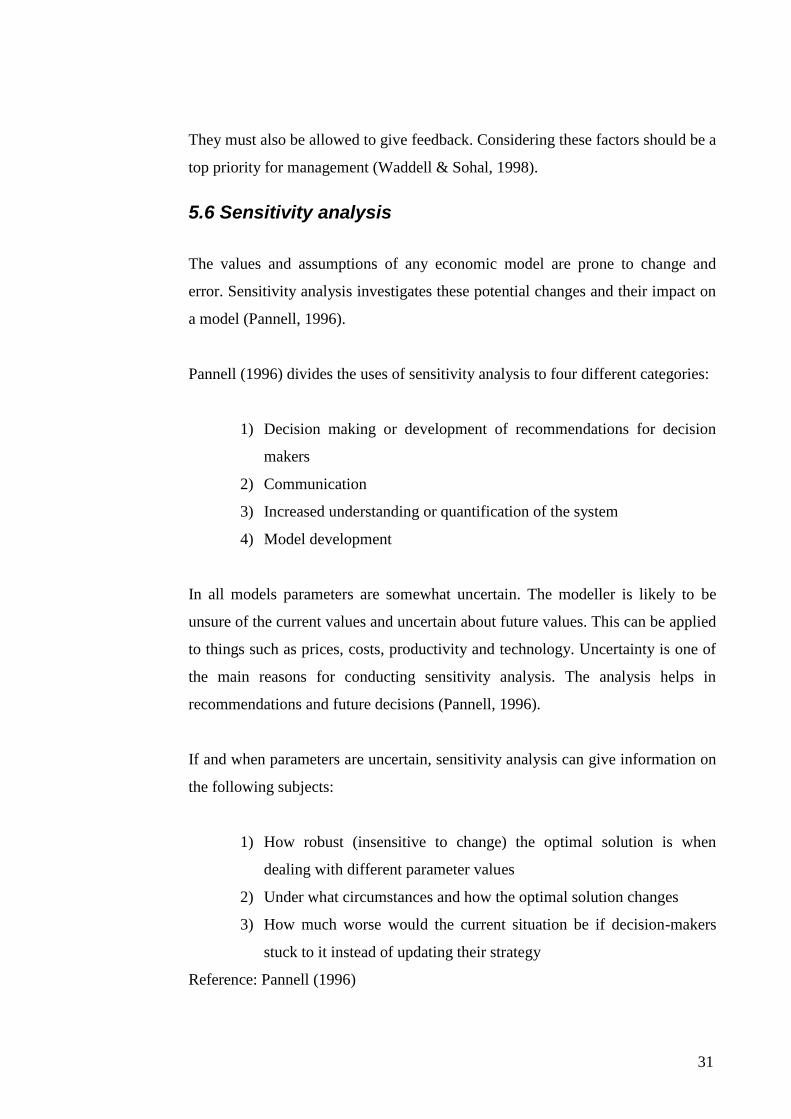
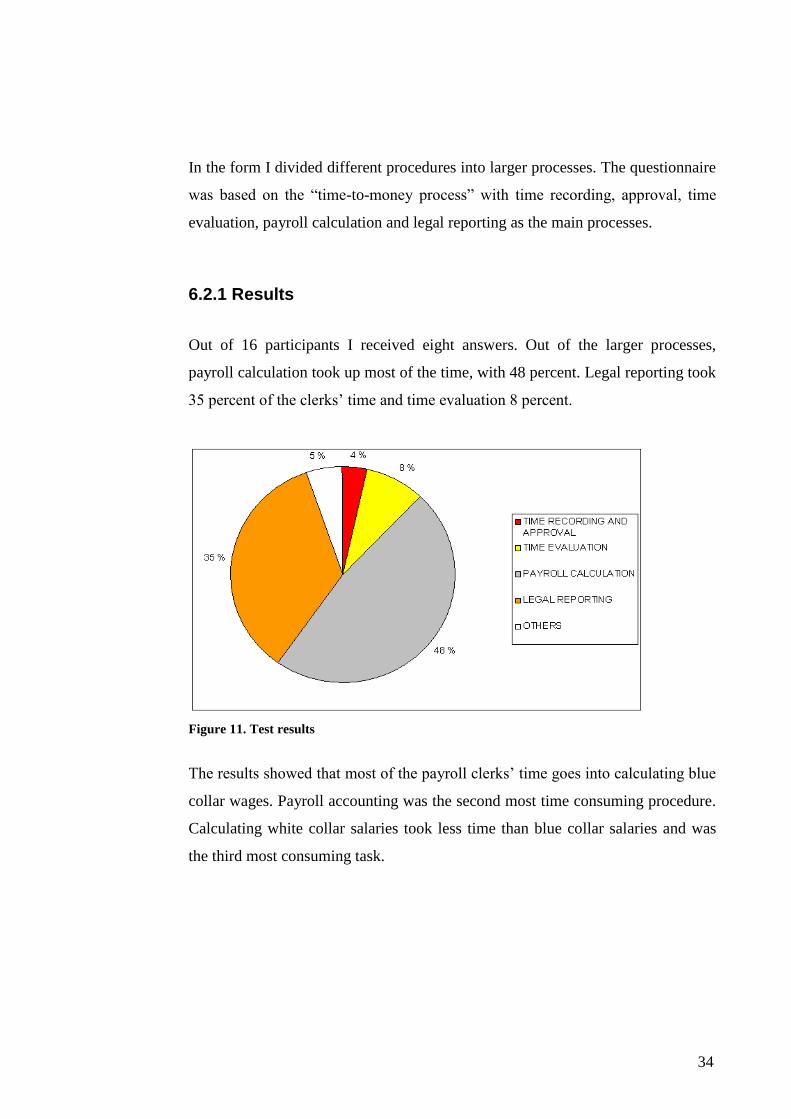
In the form I divided different procedures into larger processes. The questionnaire
was based on the “time-to-money process” with time recording, approval, time
evaluation, payroll calculation and legal reporting as the main processes.
6.2.1 Results
Out of 16 participants I received eight answers. Out of the larger processes,
payroll calculation took up most of the time, with 48 percent. Legal reporting took
35 percent of the clerks’ time and time evaluation 8 percent.
Figure 11. Test results
The results showed that most of the payroll clerks’ time goes into calculating blue
collar wages. Payroll accounting was the second most time consuming procedure.
Calculating white collar salaries took less time than blue collar salaries and was
the third most consuming task.
35
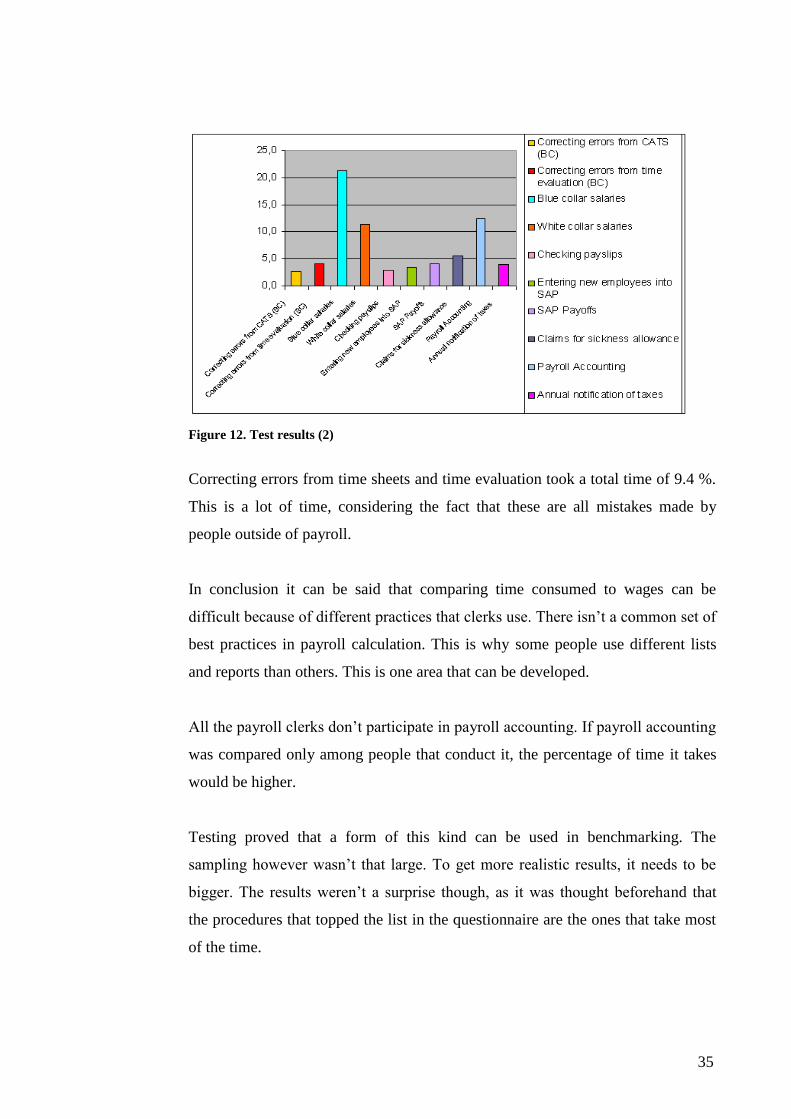
Figure 12. Test results (2)
Correcting errors from time sheets and time evaluation took a total time of 9.4 %.
This is a lot of time, considering the fact that these are all mistakes made by
people outside of payroll.
In conclusion it can be said that comparing time consumed to wages can be
difficult because of different practices that clerks use. There isn’t a common set of
best practices in payroll calculation. This is why some people use different lists
and reports than others. This is one area that can be developed.
All the payroll clerks don’t participate in payroll accounting. If payroll accounting
was compared only among people that conduct it, the percentage of time it takes
would be higher.
Testing proved that a form of this kind can be used in benchmarking. The
sampling however wasn’t that large. To get more realistic results, it needs to be
bigger. The results weren’t a surprise though, as it was thought beforehand that
the procedures that topped the list in the questionnaire are the ones that take most
of the time.
36
6.3 On-Site visiting
The first on-site visit was done with Metsäliitto at the end of March 2009. In the
meeting we discussed the questionnaire I had created for benchmarking. We also
gave a presentation about our own processes.
We decided to alter the questionnaire to a broader level. The new questionnaire
would involve several larger processes. The next step would be to find out which
of these processes are done in the benchmarked companies. After researching for
the common procedures, the benchmarking effort could begin.
At the end of April we sent an email to all the representatives of the participating
firms. The email contained two documents. The first document gave an idea of a
possible cost comparison. The document was an Excel sheet (appendix 6) and was
based on Stora Enso HR Finland Service Center’s budget. The object of this
document was to allow for a fairly simple comparison of budgets between
different payroll departments.
The second document contained 15 processes (appendix 5) that we set up at the
meeting with Metsäliitto. The next step was for the participating companies to go
over these documents and give their comments and ideas. We arranged a meeting
with the representatives of the companies for the beginning of May. The agenda
of the meeting was to go through some key figures and to try to find some
common processes between companies.
The second on-site visit was arranged at Finnair. The representatives of all
companies were present. The idea was to get together and decide on a metric that
could be used in benchmarking. The meeting was successful and produced a lot of
new ideas. We decided to use the price of a payslip as a common metric for the
questionnaire. The next meeting was planned for June. This meeting changed the
agenda of benchmarking; we decided to concentrate on costs instead of more
detailed processes.

37
The third visit was arranged at Vierumäki at the beginning of June. All the
companies were present. We went over a new cost comparison sheet (appendix 1)
I had created for benchmarking. We decided to move forward with this sheet.

38
7 Benchmarking with other companies
The actual benchmarking effort started after our meeting at Vierumäki. I had
presented the companies with a cost comparison sheet, which was based on a
payroll department’s budget. The idea of the sheet was to give out some simple
metrics that could be used in benchmarking. The metrics would be the price of a
payslip and the ratio of payslips per payroll clerk. These would provide the basis
for benchmarking.
Everyone agreed that a basic cost comparison between companies would be the
most efficient way to look at competitiveness. The comparison divided each
company’s budget to certain areas. The areas were:
o Salaries
o Rent
o Consulting
o Telephone expenses
o Mail expenses
o Office supplies
o IT costs
o Travel
o Training fees
o Meeting expenses
o Others
These were all decided as the common scope for the firms participating in
benchmarking. Every company would give out these costs for the comparison.
We didn’t want to go on a procedure level as was done in the testing phase. The
questionnaire used in testing would provide Stora Enso with some useful material
though.
39
7.1 Participating companies
The benchmarking research involved five major Finnish companies. The
following paragraphs will give an overview of the participating companies and
some information about their payroll departments. Stora Enso’s company profile
can be found in chapter 1.
7.1.1 Finnair
Finnair is one of the world’s oldest airlines. It was established in 1923. Finnair’s
operations focus on transporting passengers between Europe and Asia, via
Helsinki. Finnair Group’s operations are passenger traffic and leisure traffic,
technical and ground handling operations, catering, travel agencies and also travel
information and reservation services. Finnair has approximately 9500 personnel.
The Finnish government owns 55.8 percent of Finnair’s shares (Finnair, 2009).
In the year 2008 Finnair carried 8.3 million passengers. In the same year Finnair
reported a turnover of 2.3 billion euros with an operating profit of 7 million euros
(Finnair, 2009).
Finnair’s payroll department consists of 29 people. They have 20 payroll clerks,
with 14 of them working in line organizations. Finnair uses several different
systems in its payroll operations, which make its model hard to describe. SAP HR
is one of the systems they use. Finnair has 9 300 employees in its Finnish payroll
calculation (Finnair presentation, 2009).
7.1.2 YLE
YLE is the Finnish Broadcasting Company. It produces television and radio
programming on the public sector. Its main shareholder is the Finnish
government. It had a turnover of 380.5 million euros in 2008. It made an
operating profit of 0.7 million euros (YLE, 2009).
40
YLE has a total of 10 people working for its payroll department. 9 of them are
payroll clerks. YLE uses SAP HR in its wage calculation. YLE has a lot of
workers with short-term contracts. YLE can have from 2000-8000 freelance
workers in a calendar year. This explains for the high amount of calculated
personnel, 12 619, for such a small payroll department (YLE presentation, 2009).
7.1.3 Metsäliito
Metsäliitto is an international forest industry group operating in 30 countries.
Metsäliitto Group’s five business areas are Wood Supply, Wood Products
Industry, Pulp, Board and Paper, and Tissue Papers. In 2008 Metsäliitto Group’s
sales total was 6.5 billion euros and it had an operating profit of 2 million euros. It
employs 16 000 people (Metsäliitto, 2009).
Metsäliitto employs 21,5 people in its payroll organization with one people
splitting time between HR and payroll. 18,5 work as payroll clerks. Its main
payroll software is MBP, which is provided by Logica. It also uses SAP HR as
storage for master data. Metsäliitto’s payroll functions have a total of 7 800
calculated personnel (Metsäliitto presentation, 2009).
7.1.4 Neste Oil
Neste Oil Corporation is a refining and marketing company that concentrates on
low-emission, high-quality traffic fuels. Neste Oil’s refineries are based in Porvoo
and Naantali and have a combined crude oil refining capacity of approximately
260 000 barrels a day (Neste Oil, 2009).
It the year 2008 Neste Oil had a turnover of 15.0 billion euros. It reported an
operating profit of 186 million euros (Neste Oil, 2009).
Neste uses Fenix as its payroll system. It is provided by Logica, which is also the
provider for Metsäliitto’s software. Neste also uses three different smaller systems
for travel and master data storage. Neste has a total of 9,5 personnel working for
41
payroll, with 7,5 payroll clerks. They have a total of 3 850 workers in its payroll
(Neste Oil presentation, 2009).
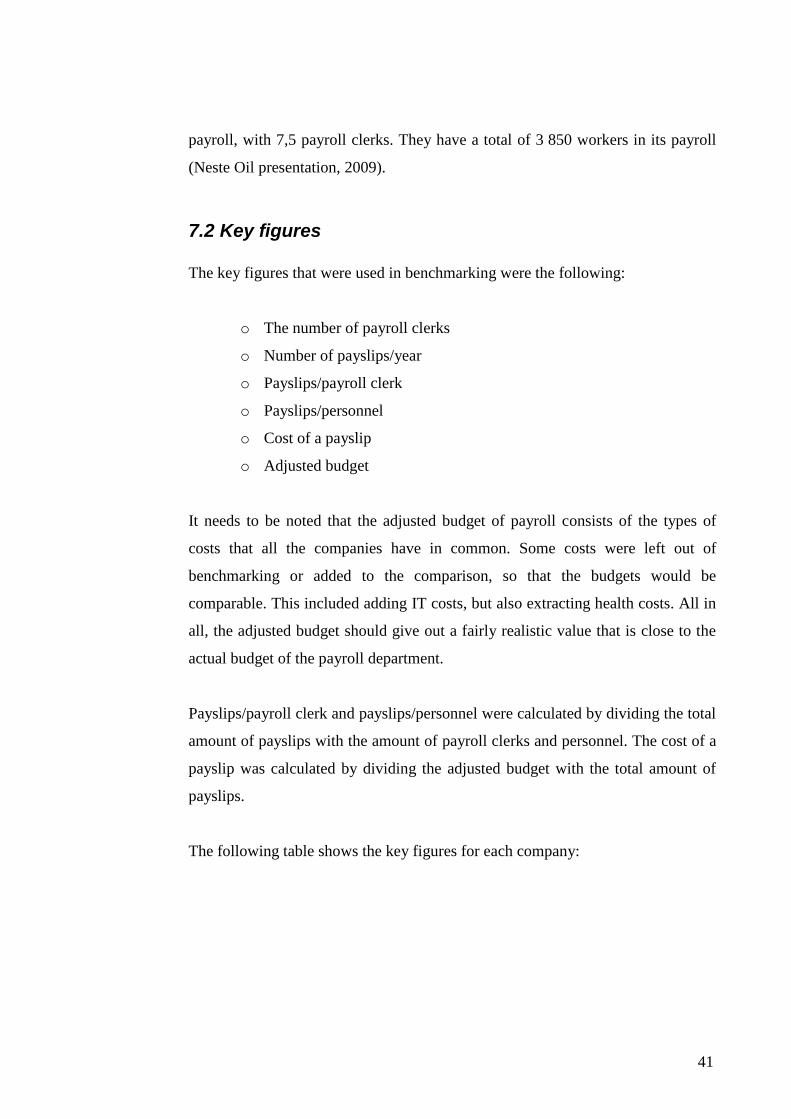
7.2 Key figures
The key figures that were used in benchmarking were the following:
o The number of payroll clerks
o Number of payslips/year
o Payslips/payroll clerk
o Payslips/personnel
o Cost of a payslip
o Adjusted budget
It needs to be noted that the adjusted budget of payroll consists of the types of
costs that all the companies have in common. Some costs were left out of
benchmarking or added to the comparison, so that the budgets would be
comparable. This included adding IT costs, but also extracting health costs. All in
all, the adjusted budget should give out a fairly realistic value that is close to the
actual budget of the payroll department.
Payslips/payroll clerk and payslips/personnel were calculated by dividing the total
amount of payslips with the amount of payroll clerks and personnel. The cost of a
payslip was calculated by dividing the adjusted budget with the total amount of
payslips.
The following table shows the key figures for each company:
42
Figure 13. Key Figures
7.3 Common processes
It is important in benchmarking to find common processes. In a payroll
environment it can be difficult. Different companies can use multiple systems
compared to a company that uses only one. But the common nominator is costs.
Finding the common costs was important for benchmarking.
YLE and Metsäliitto were particularly important comparisons for Stora Enso.
YLE in the case, that they use the same payroll system, SAP HR, and Metsäliitto
as a competitor in the same industry.

43
8 Benchmarking Analysis
When analyzing the results, it is important to take the size of the company into
account. That is why most of the figures are divided by the amount of personnel.
The following table demonstrates the adjusted budgets of the payroll departments.
0
500 000
1 000 000
1 500 000
2 000 000
2 500 000
3 000 000
Metsäliitto Stora Enso Neste Oil Yle Finnair
Adjusted Budget 1 945 438 2 423 091 1 028 096 1 596 086 1 859 153
Adjusted Budget
Metsäliitto
Stora Enso
Neste Oil
Yle
Finnair
Figure 14. Adjusted budgets
As seen in the table Stora Enso has the highest adjusted budget of the companies,
thus meaning it also has the highest costs. These budgets can’t be straight
forwardly compared because of the differences in personnel size. Neste Oil has
the smallest budget of the compared payroll departments.
The following table contains information about the amount of personnel at each
payroll department:
44
0
5
10
15
20
25
30
35
Metsäliitto Stora Enso Neste Oil Yle Finnair
Amount of personnel 21,5 32 9,5 10 29
Amount of personnel
Metsäliitto
Stora Enso
Neste Oil
Yle
Finnair
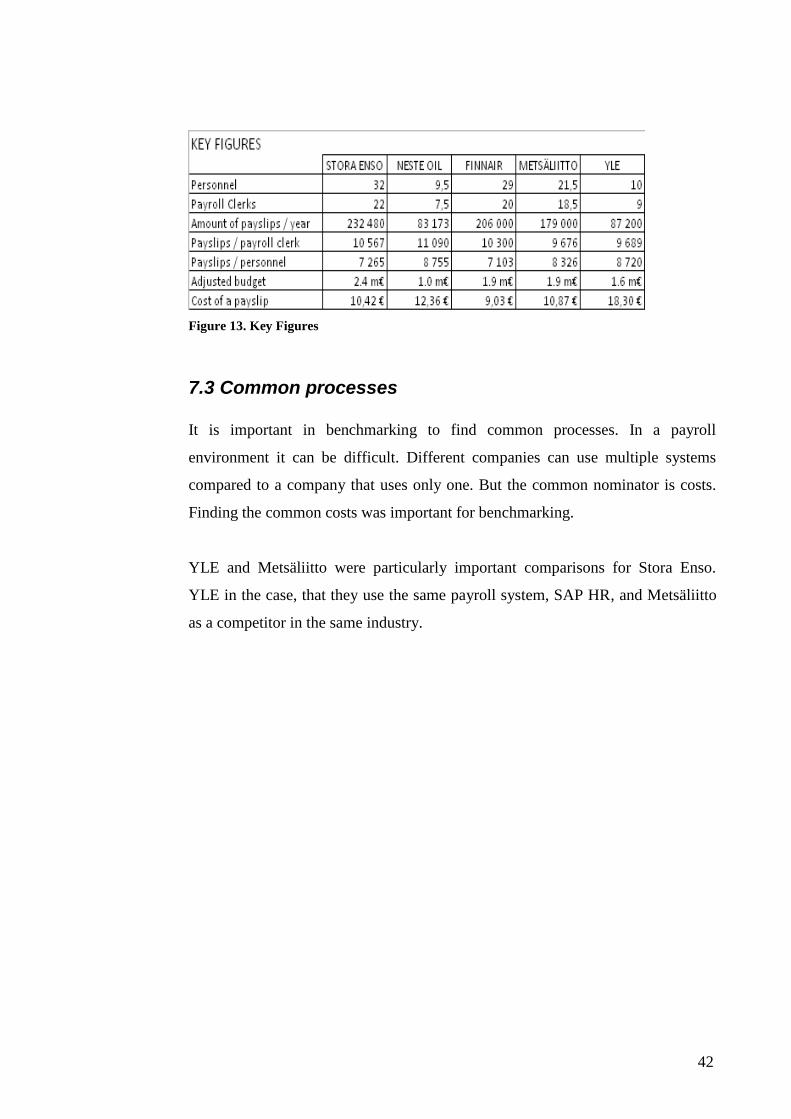
Figure 15. Amount of personnel
This table should be comparable with figure 14. Finnair has a rather high number
of personnel compared to its budget. One of the reasons to this is Finnair’s
complex payroll model. Finnair has 14 payroll clerks working in line
organizations, which makes the amount of personnel high. Stora Enso’s personnel
amount of 32 contains only 22 payroll clerks. This is due to the payroll accountant
work done at the payroll department. In the other companies this kind of work is
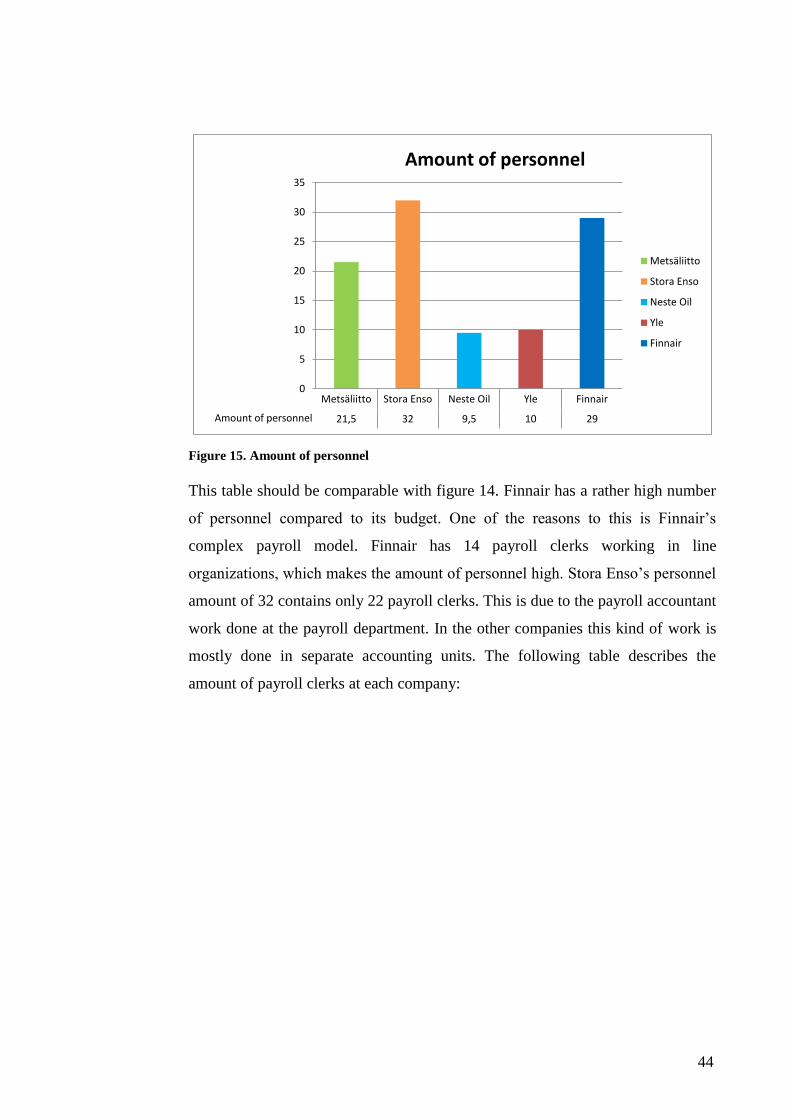
mostly done in separate accounting units. The following table describes the
amount of payroll clerks at each company:
45
0
5
10
15
20
25
Metsäliitto Stora Enso Neste Oil Yle Finnair
Amount of payroll clerks 18,5 22 9,5 9 20
Amount of payroll clerks
Metsäliitto
Stora Enso
Neste Oil
Yle
Finnair
Figure 16. Amount of payroll clerks
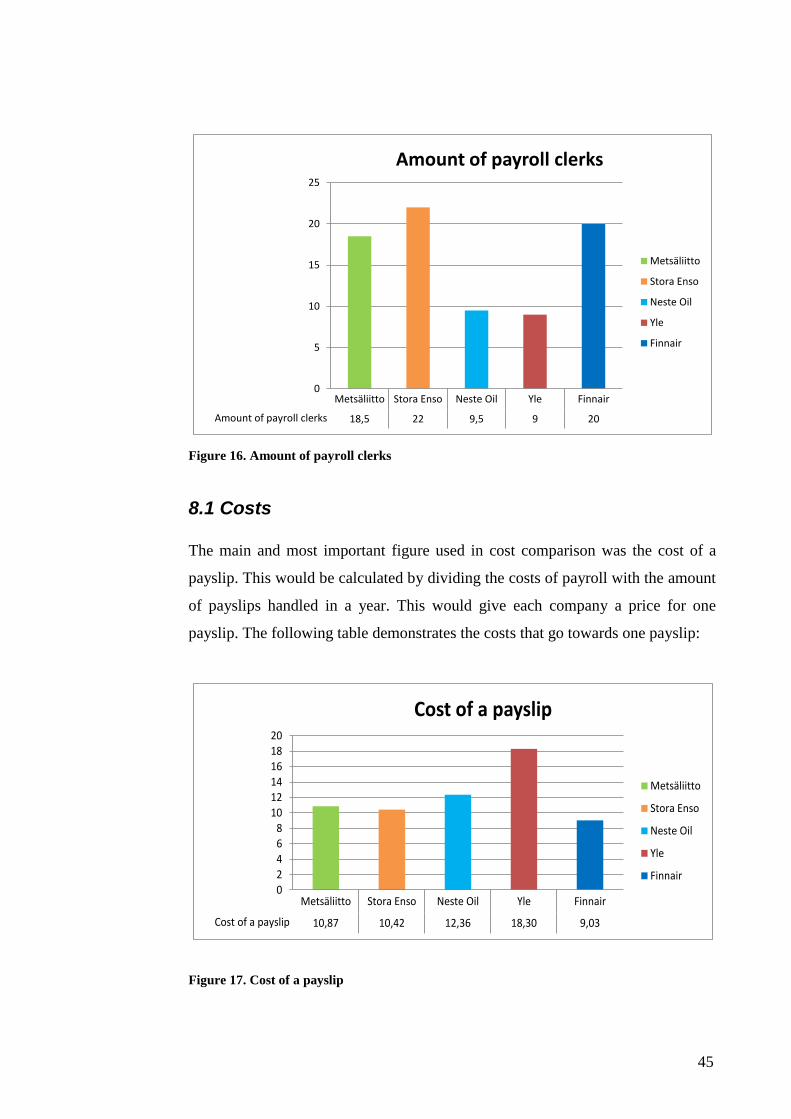
8.1 Costs
The main and most important figure used in cost comparison was the cost of a
payslip. This would be calculated by dividing the costs of payroll with the amount
of payslips handled in a year. This would give each company a price for one
payslip. The following table demonstrates the costs that go towards one payslip:
02468
101214161820
Metsäliitto Stora Enso Neste Oil Yle Finnair
Cost of a payslip 10,87 10,42 12,36 18,30 9,03
Cost of a payslip
Metsäliitto
Stora Enso
Neste Oil
Yle
Finnair
Figure 17. Cost of a payslip
46
Finnair has the cheapest payslip at the price of 9.03 euros. Stora Enso’s
performance in this area is good. It has the second most competitive payslip price
with 10.42 euros.
In terms of this table it can be said that Stora Enso’s payroll department offers a
cost-efficient service. Metsäliitto has a slightly higher price than Stora Enso, with
Neste Oil having the highest priced payslip.
YLE has the highest priced payslip. This is due to their high IT costs. YLE’s
different kind of model is another reason for the high result in this area. This is
because of the large amount of freelance workers that work for the firm. This
produces a rather small amount of payslips for a large amount of workers.
Workers in other companies receive their wages at least on a monthly basis, but
YLE:s different kind of model may produce only one payslip for a person in a
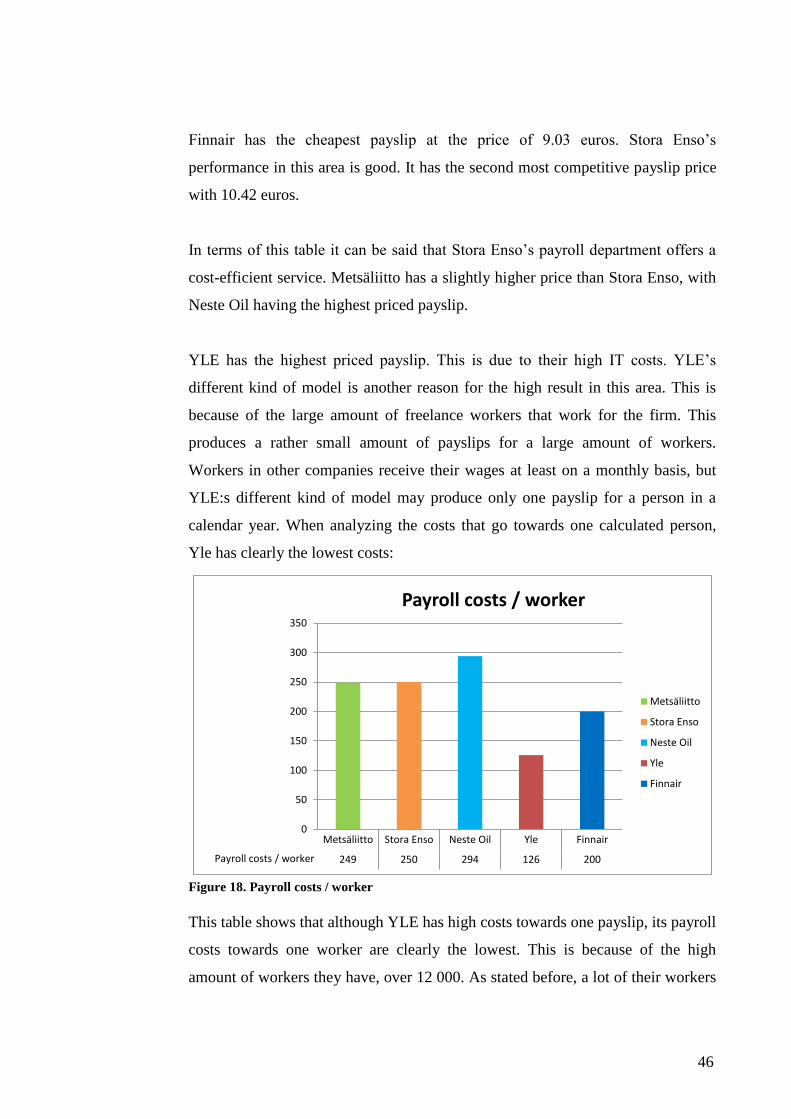
calendar year. When analyzing the costs that go towards one calculated person,
Yle has clearly the lowest costs:
0
50
100
150
200
250
300
350
Metsäliitto Stora Enso Neste Oil Yle Finnair
Payroll costs / worker 249 250 294 126 200
Payroll costs / worker
Metsäliitto
Stora Enso
Neste Oil
Yle
Finnair
Figure 18. Payroll costs / worker
This table shows that although YLE has high costs towards one payslip, its payroll
costs towards one worker are clearly the lowest. This is because of the high
amount of workers they have, over 12 000. As stated before, a lot of their workers
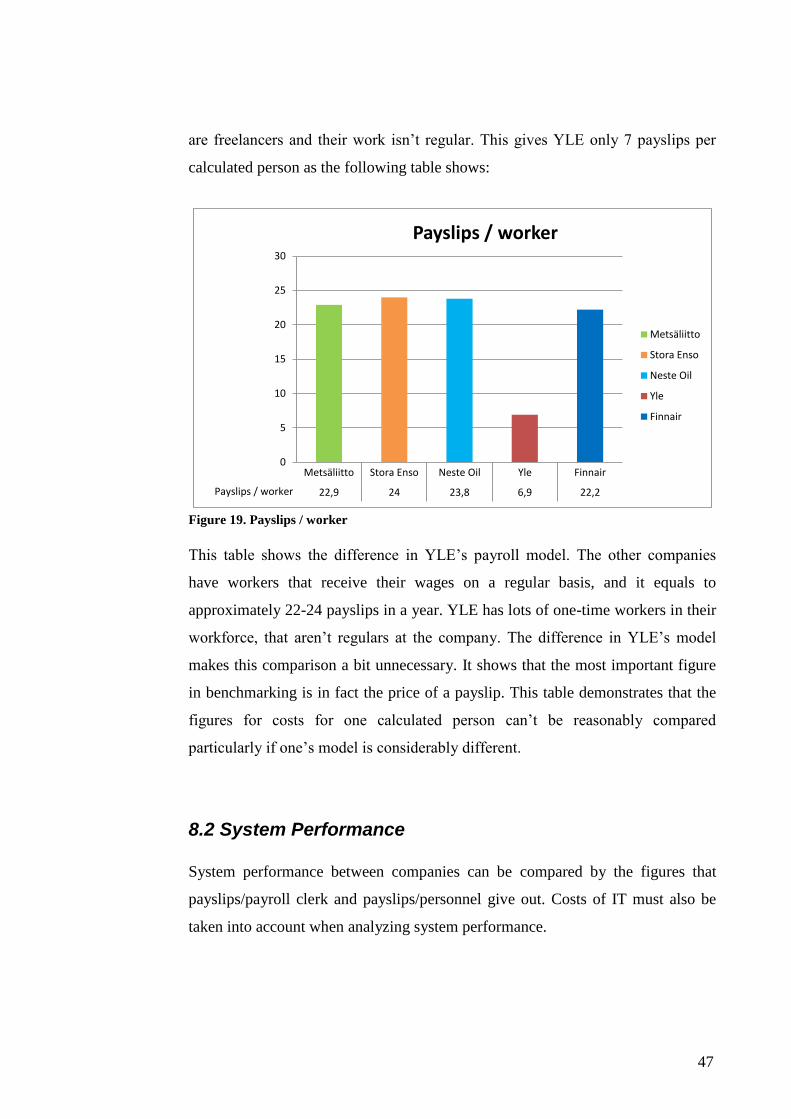
47
are freelancers and their work isn’t regular. This gives YLE only 7 payslips per
calculated person as the following table shows:
0
5
10
15
20
25
30
Metsäliitto Stora Enso Neste Oil Yle Finnair
Payslips / worker 22,9 24 23,8 6,9 22,2
Payslips / worker
Metsäliitto
Stora Enso
Neste Oil
Yle
Finnair
Figure 19. Payslips / worker
This table shows the difference in YLE’s payroll model. The other companies
have workers that receive their wages on a regular basis, and it equals to
approximately 22-24 payslips in a year. YLE has lots of one-time workers in their
workforce, that aren’t regulars at the company. The difference in YLE’s model
makes this comparison a bit unnecessary. It shows that the most important figure
in benchmarking is in fact the price of a payslip. This table demonstrates that the
figures for costs for one calculated person can’t be reasonably compared
particularly if one’s model is considerably different.
8.2 System Performance
System performance between companies can be compared by the figures that
payslips/payroll clerk and payslips/personnel give out. Costs of IT must also be
taken into account when analyzing system performance.
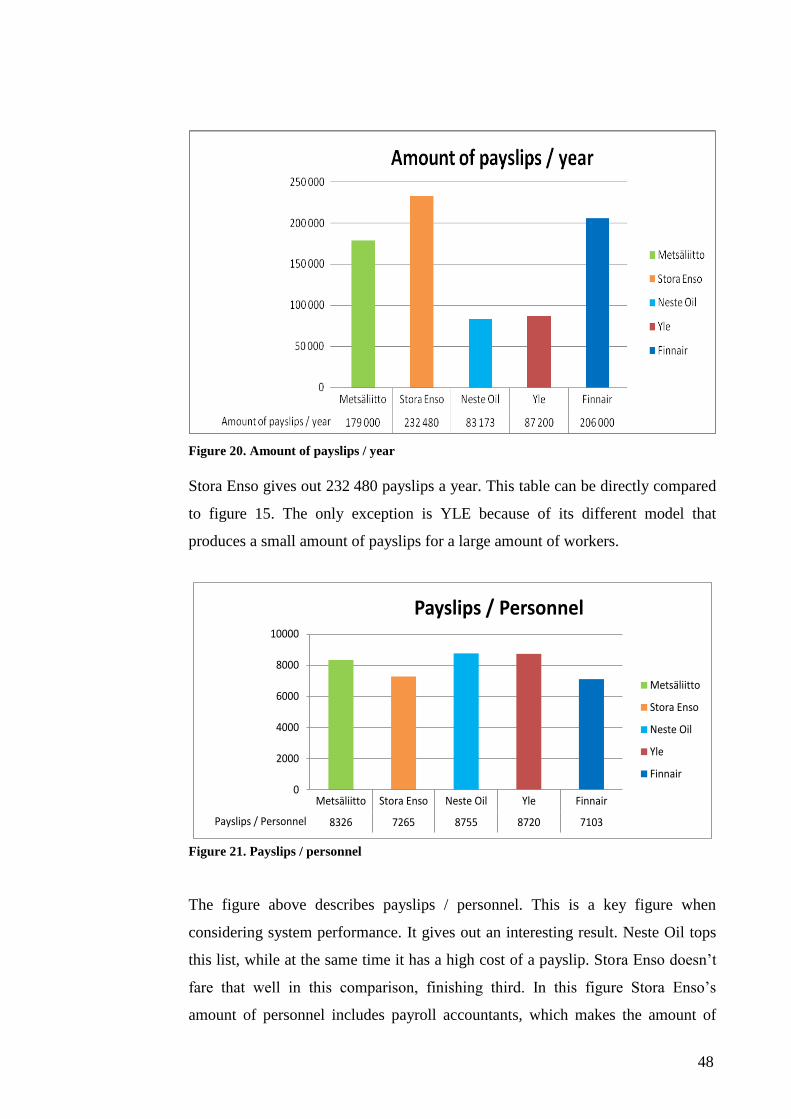
48
Figure 20. Amount of payslips / year
Stora Enso gives out 232 480 payslips a year. This table can be directly compared
to figure 15. The only exception is YLE because of its different model that
produces a small amount of payslips for a large amount of workers.
0
2000
4000
6000
8000
10000
Metsäliitto Stora Enso Neste Oil Yle Finnair
Payslips / Personnel 8326 7265 8755 8720 7103
Payslips / Personnel
Metsäliitto
Stora Enso
Neste Oil
Yle
Finnair
Figure 21. Payslips / personnel
The figure above describes payslips / personnel. This is a key figure when
considering system performance. It gives out an interesting result. Neste Oil tops
this list, while at the same time it has a high cost of a payslip. Stora Enso doesn’t
fare that well in this comparison, finishing third. In this figure Stora Enso’s
amount of personnel includes payroll accountants, which makes the amount of
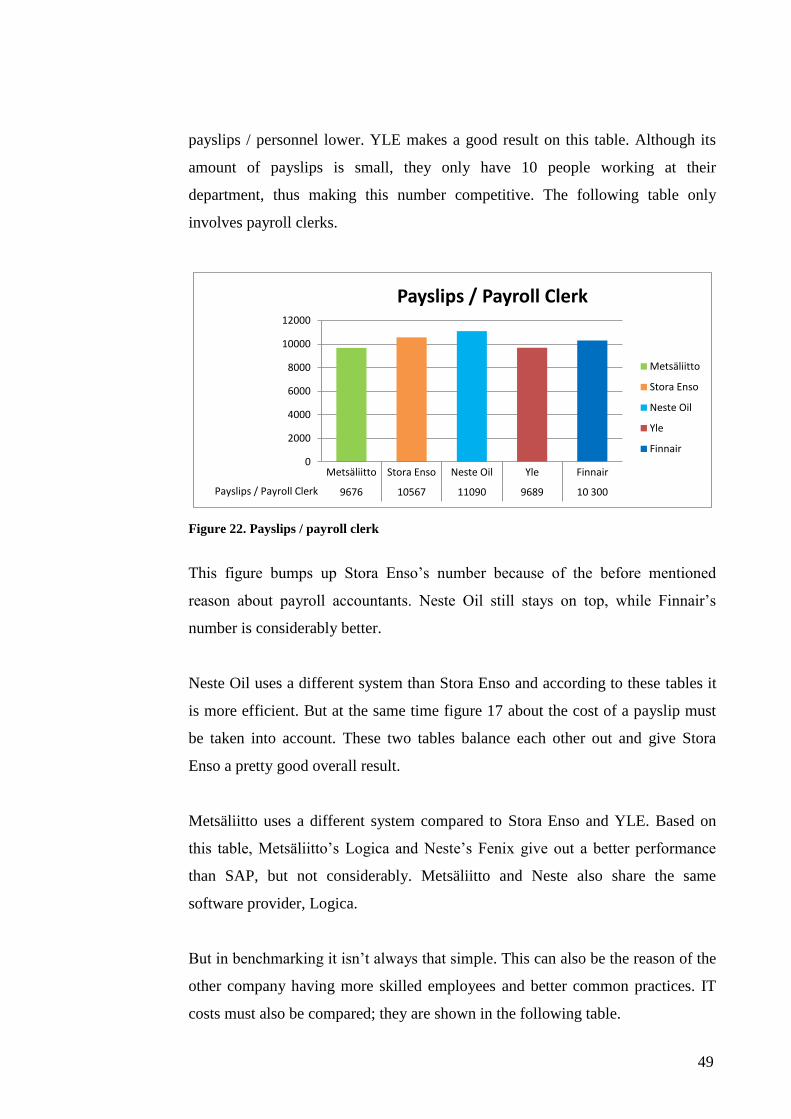
49
payslips / personnel lower. YLE makes a good result on this table. Although its
amount of payslips is small, they only have 10 people working at their
department, thus making this number competitive. The following table only
involves payroll clerks.
0
2000
4000
6000
8000
10000
12000
Metsäliitto Stora Enso Neste Oil Yle Finnair
Payslips / Payroll Clerk 9676 10567 11090 9689 10 300
Payslips / Payroll Clerk
Metsäliitto
Stora Enso
Neste Oil
Yle
Finnair
Figure 22. Payslips / payroll clerk
This figure bumps up Stora Enso’s number because of the before mentioned
reason about payroll accountants. Neste Oil still stays on top, while Finnair’s
number is considerably better.
Neste Oil uses a different system than Stora Enso and according to these tables it
is more efficient. But at the same time figure 17 about the cost of a payslip must
be taken into account. These two tables balance each other out and give Stora
Enso a pretty good overall result.
Metsäliitto uses a different system compared to Stora Enso and YLE. Based on
this table, Metsäliitto’s Logica and Neste’s Fenix give out a better performance
than SAP, but not considerably. Metsäliitto and Neste also share the same
software provider, Logica.
But in benchmarking it isn’t always that simple. This can also be the reason of the
other company having more skilled employees and better common practices. IT
costs must also be compared; they are shown in the following table.
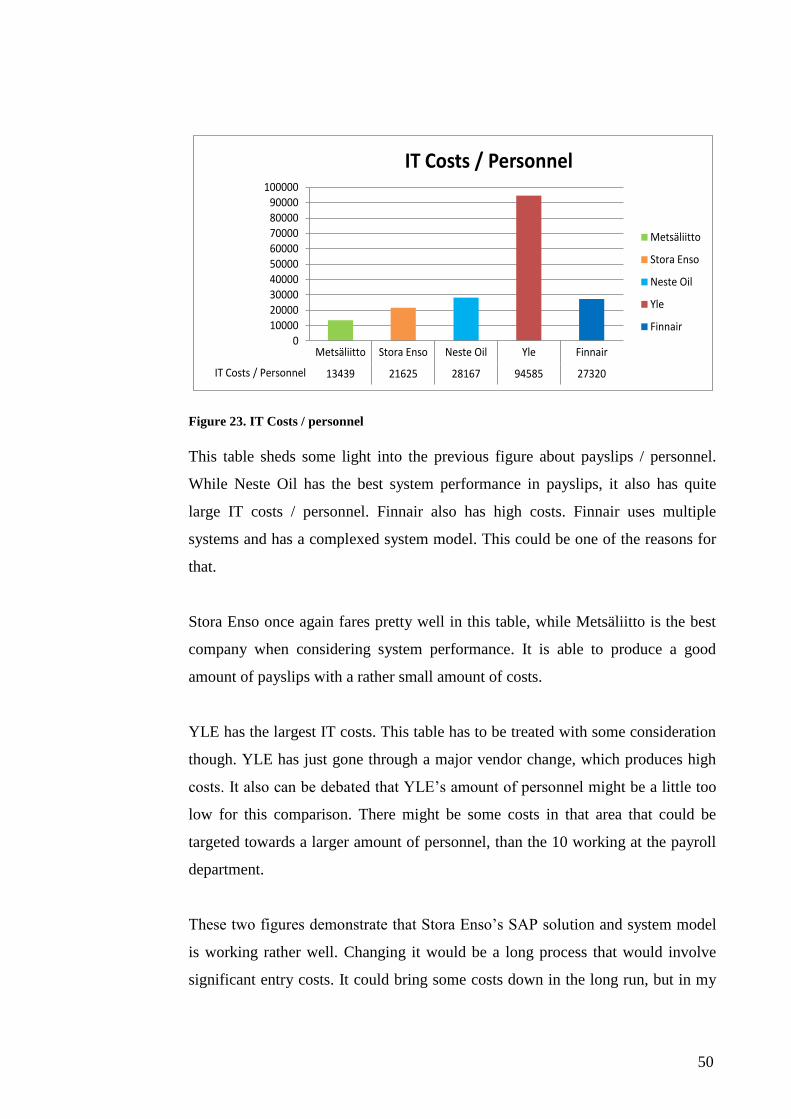
50
0100002000030000400005000060000700008000090000
100000
Metsäliitto Stora Enso Neste Oil Yle Finnair
IT Costs / Personnel 13439 21625 28167 94585 27320
IT Costs / Personnel
Metsäliitto
Stora Enso
Neste Oil
Yle
Finnair
Figure 23. IT Costs / personnel
This table sheds some light into the previous figure about payslips / personnel.
While Neste Oil has the best system performance in payslips, it also has quite
large IT costs / personnel. Finnair also has high costs. Finnair uses multiple
systems and has a complexed system model. This could be one of the reasons for
that.
Stora Enso once again fares pretty well in this table, while Metsäliitto is the best
company when considering system performance. It is able to produce a good
amount of payslips with a rather small amount of costs.
YLE has the largest IT costs. This table has to be treated with some consideration
though. YLE has just gone through a major vendor change, which produces high
costs. It also can be debated that YLE’s amount of personnel might be a little too
low for this comparison. There might be some costs in that area that could be
targeted towards a larger amount of personnel, than the 10 working at the payroll
department.
These two figures demonstrate that Stora Enso’s SAP solution and system model
is working rather well. Changing it would be a long process that would involve
significant entry costs. It could bring some costs down in the long run, but in my
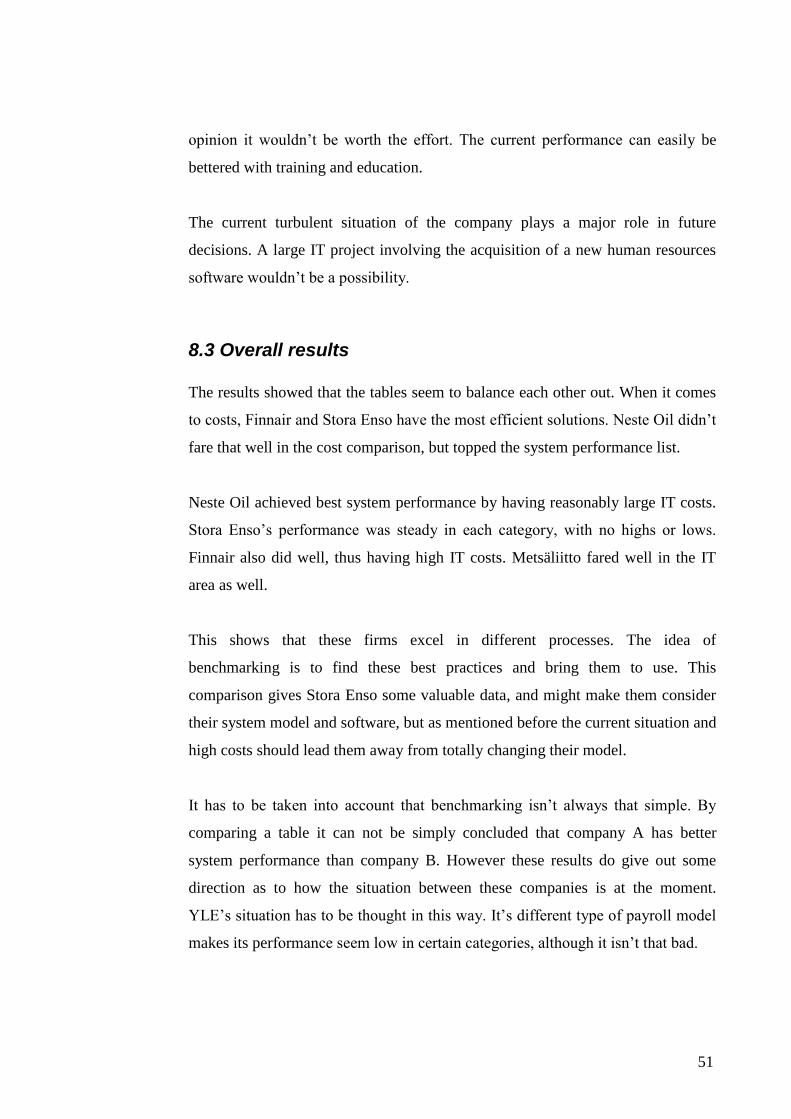
51
opinion it wouldn’t be worth the effort. The current performance can easily be
bettered with training and education.
The current turbulent situation of the company plays a major role in future
decisions. A large IT project involving the acquisition of a new human resources
software wouldn’t be a possibility.
8.3 Overall results
The results showed that the tables seem to balance each other out. When it comes
to costs, Finnair and Stora Enso have the most efficient solutions. Neste Oil didn’t
fare that well in the cost comparison, but topped the system performance list.
Neste Oil achieved best system performance by having reasonably large IT costs.
Stora Enso’s performance was steady in each category, with no highs or lows.
Finnair also did well, thus having high IT costs. Metsäliitto fared well in the IT
area as well.
This shows that these firms excel in different processes. The idea of
benchmarking is to find these best practices and bring them to use. This
comparison gives Stora Enso some valuable data, and might make them consider
their system model and software, but as mentioned before the current situation and
high costs should lead them away from totally changing their model.
It has to be taken into account that benchmarking isn’t always that simple. By
comparing a table it can not be simply concluded that company A has better
system performance than company B. However these results do give out some
direction as to how the situation between these companies is at the moment.
YLE’s situation has to be thought in this way. It’s different type of payroll model
makes its performance seem low in certain categories, although it isn’t that bad.
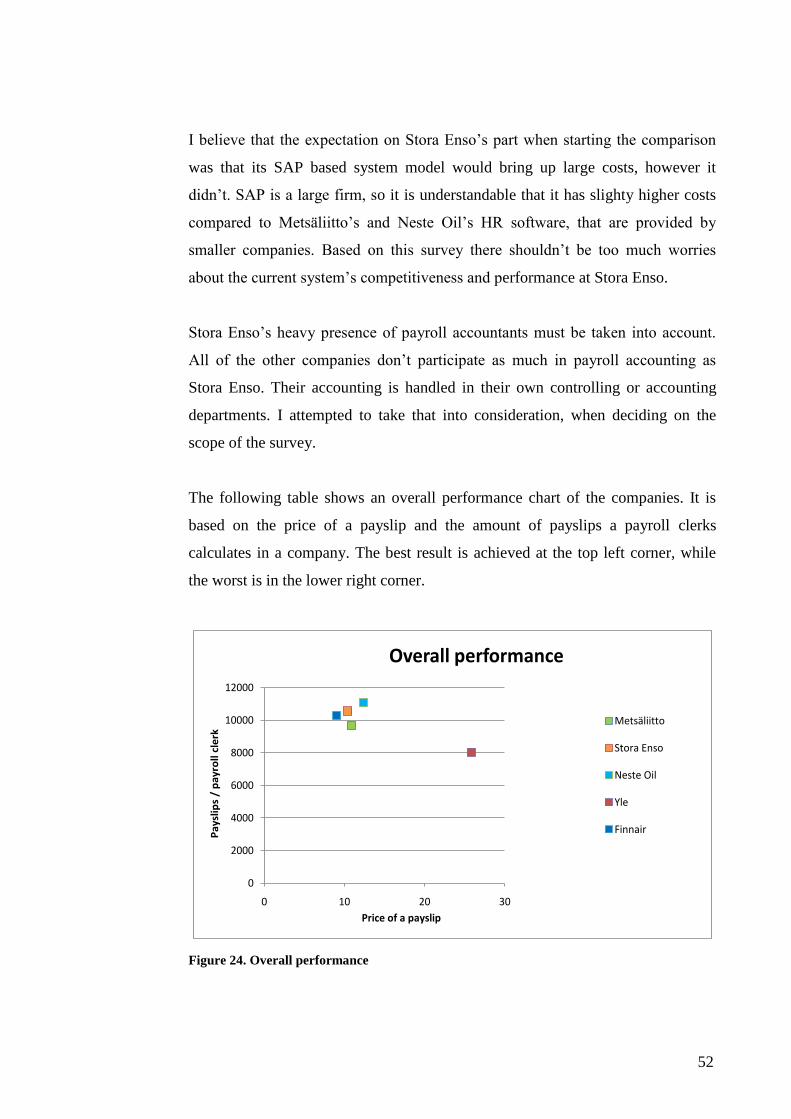
52
I believe that the expectation on Stora Enso’s part when starting the comparison
was that its SAP based system model would bring up large costs, however it
didn’t. SAP is a large firm, so it is understandable that it has slighty higher costs
compared to Metsäliitto’s and Neste Oil’s HR software, that are provided by
smaller companies. Based on this survey there shouldn’t be too much worries
about the current system’s competitiveness and performance at Stora Enso.
Stora Enso’s heavy presence of payroll accountants must be taken into account.
All of the other companies don’t participate as much in payroll accounting as
Stora Enso. Their accounting is handled in their own controlling or accounting
departments. I attempted to take that into consideration, when deciding on the
scope of the survey.
The following table shows an overall performance chart of the companies. It is
based on the price of a payslip and the amount of payslips a payroll clerks
calculates in a company. The best result is achieved at the top left corner, while
the worst is in the lower right corner.
0
2000
4000
6000
8000
10000
12000
0 10 20 30
Pa
yslip
s /
pa
yro
ll cl
erk
Price of a payslip
Overall performance
Metsäliitto
Stora Enso
Neste Oil
Yle
Finnair
Figure 24. Overall performance

53
This table shows that four companies are fairly close to each other. Some sort of a
variation must be taken into account when concluding benchmarking. So because
of that it is hard to say, which of the four companies has the best overall
performance. On the base of this table it would be Finnair, but Stora Enso also
fares very well. One company stands out, and that is YLE. Its high costs in IT
make its price of a payslip a lot more expensive than the other companies.
However YLE still has good scores when comparing the price of a payslip for one
calculated employee, although the main reason for this is the before mentioned
freelance workers, that do not perform regular work for the company. The other
four companies have approximately the same kind on figures but YLE’s are
somewhat different.
8.4 Sensitivity Analysis
The idea of the sensitivity analysis is to find out how certain results changed if
parameters in the economic model were altered. In this example the change comes
in the shape of the amount of payroll clerks. I will demonstrate the results that
Stora Enso would have, if their payroll staff was downsized by five personnel.
It is clear that these results will give out a more cost-efficient result, but will also
add to the workload of the payroll clerks. It is debatable if this change would be
necessary. At the moment in my opinion it wouldn’t be.
Stora Enso is currently cutting over 2000 jobs in its administration. In payroll this
will first show in added job responsibilities. With downsizing, comes layoffs, and
this transforms to a lot of work for clerks. But in the future, when the downsizing
is over, a lighter payroll staff could work.
8.4.1 Costs
When downsizing personnel, obviously costs are also cut. If Stora Enso where to
have 17 payroll clerks instead of 22, it’s price of a payslip would come down from
54
10.42 euros to 9.47 euros. The following table demonstrates the new value of the
price:
02468
101214161820
Metsäliitto Stora Enso Neste Oil Yle Finnair
Cost of a payslip 10,87 9,47 12,36 18,30 9,03
Cost of a payslip
Metsäliitto
Stora Enso
Neste Oil
Yle
Finnair
Figure 25. Price of a payslip (2)
The new price would be a lot closer to Finnair’s price of 9.03 euros. Cutting five
payroll clerks would also bring down personnel costs by approximately 221 000
euros, thus making Stora Enso’s payroll department more cost efficient.
8.4.2 System Performance
When considering system performance with lighter personnel, the amount of
payslips a payroll clerk handles will of course go up. This might give a wrong
perspective on the actual performance of the system. This table mostly shows the
fact that there would be considerably more payslips / payroll clerk to calculate.
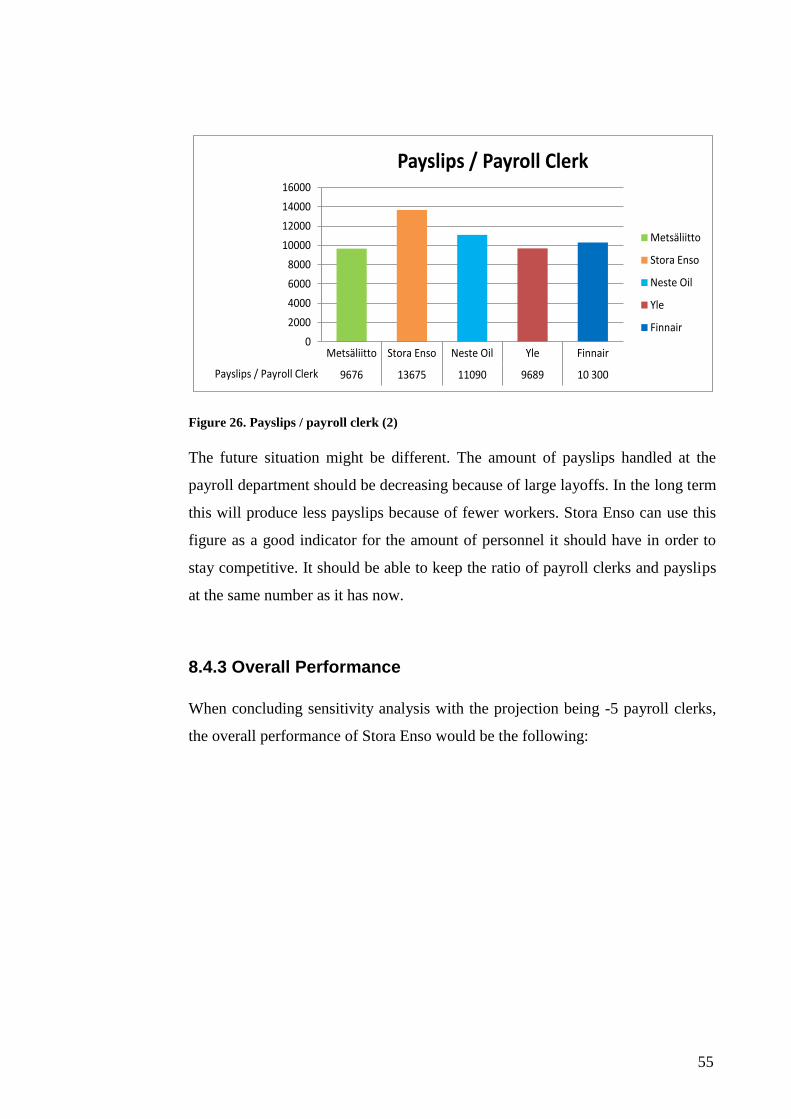
55
0
2000
4000
6000
8000
10000
12000
14000
16000
Metsäliitto Stora Enso Neste Oil Yle Finnair
Payslips / Payroll Clerk 9676 13675 11090 9689 10 300
Payslips / Payroll Clerk
Metsäliitto
Stora Enso
Neste Oil
Yle
Finnair
Figure 26. Payslips / payroll clerk (2)
The future situation might be different. The amount of payslips handled at the
payroll department should be decreasing because of large layoffs. In the long term
this will produce less payslips because of fewer workers. Stora Enso can use this
figure as a good indicator for the amount of personnel it should have in order to
stay competitive. It should be able to keep the ratio of payroll clerks and payslips
at the same number as it has now.
8.4.3 Overall Performance
When concluding sensitivity analysis with the projection being -5 payroll clerks,
the overall performance of Stora Enso would be the following:
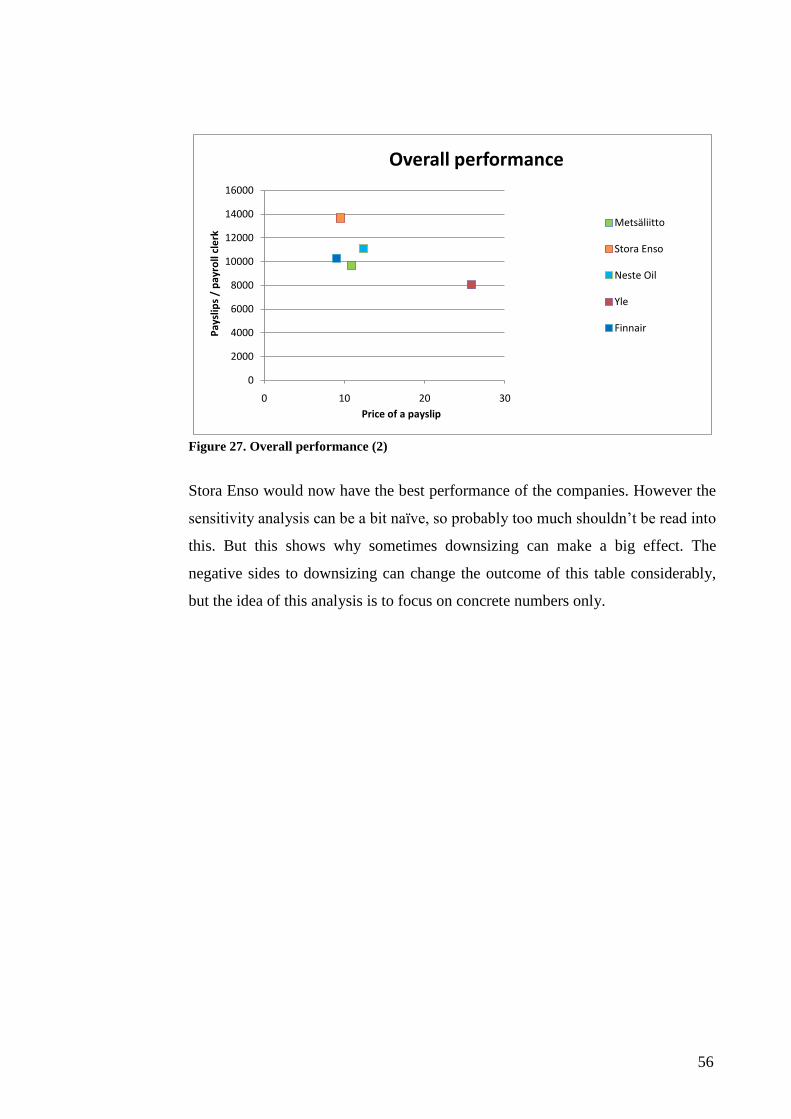
56
0
2000
4000
6000
8000
10000
12000
14000
16000
0 10 20 30
Pay
slip
s /
pay
roll
cle
rk
Price of a payslip
Overall performance
Metsäliitto
Stora Enso
Neste Oil
Yle
Finnair
Figure 27. Overall performance (2)
Stora Enso would now have the best performance of the companies. However the
sensitivity analysis can be a bit naïve, so probably too much shouldn’t be read into
this. But this shows why sometimes downsizing can make a big effect. The
negative sides to downsizing can change the outcome of this table considerably,
but the idea of this analysis is to focus on concrete numbers only.
57
9 Conclusion
Payroll calculation is a complicated process that involves many small procedures.
It is hard to establish a straight-forward process for payroll calculation. It involves
lots of checking and control. Sometimes it even appears that some of this work is
unnecessary and takes time away from possibly more important procedures.
The current system SAP HR is used in payroll calculation and payroll accounting.
The HR module has many good qualities when considering payroll. One of the
most important functions is the chance to calculate retroactive salaries. The
system can easily add compensation to an employee’s next salary if something
was missed during the previous payroll period.
Changes to the current system and its provider would acquire too much costs and
resistance from the workers. The previous change from the old system to SAP HR
was carried out in 2002-2004, and changing the system again in such a short time
span would not go well with the employees. The current system has its problems,
but all in all it is very suitable for payroll.
Stora Enso’s Finnish payroll hasn’t been happy with the current provider and the
lack of freedom in decision-making. However changing to a different provider
and possibly a different system model would require large organizational changes.
These would be hard to realise in a company that has a distinguished corporate
culture. Costs would presumably be high as well. The current financial situation
of the company would definitely become a major hurdle.
The payroll calculation process can be complicated to document. It has many
variables. The current payroll clerks have a good idea of how the payroll process
and the payroll system work. Moe et al. (2005) believe that knowledge and
experience about the system brings competitive advantage to a company. Porter
(1996) also believes that using an ERP system in distinctive ways that enable
distinctive outcomes can promote competitive advantage. So in light of these
58
findings, changing a system wouldn’t necessarily add competitiveness, but
knowledge and training about it will.
Major changes to the current process or the system would probably bring some
resistance from the clerks. I believe that minor changes can be done to make the
payroll process more efficient, but changing the process completely wouldn’t
benefit the company in a clear way.
Benchmarking showed that Stora Enso’s performance in terms of cost-efficiency
and system performance fares well compared to other major Finnish companies.
Stora Enso has a competitive price of a payslip. Stora Enso’s system performance
is also competitive. The only way for the company to produce a higher number in
payslips / payroll clerks is downsizing. In the future Stora Enso needs to keep an
eye on the ratio of calculated personnel and payroll clerks. At some point
downsizing is inevitable at the HR Finland Service Center as well, because of the
future layoffs at Stora Enso’s Finnish functions.
Setting common practices can be a solution for improving system performance
and speeding up processes. Some payroll clerks do unnecessary tasks when
handling payroll, thus taking a lot more time than others. Some of this isn’t bad
because of the nature of the job. Accuracy is a must in the payroll business. But
too much checking and controlling produces a heavy workload on payroll clerks
and adds up to higher costs in terms of overtime pay.
9.1 Suggestions for future development
Testing showed that payroll clerks have to use a lot of time correcting errors or
contacting line managers about hours that haven’t been approved or marked
correctly. Payroll clerks have to contact line managers by email or phone if some
hours haven’t been approved. One suggestion for eliminating this problem would
be to make line managers more involved in this process. At YLE line managers go
through employees’ time sheets by running a check in SAP, before sending them
to payroll clerks. This way line managers see the possible errors and can correct
59
them, thus eliminating some unnecessary work from payroll clerks. However this
might be easier to realize in the media business than in the forest industry. The
prevailing culture within the forest industry seems to be a bit old-fashioned and
possibly against these types of changes.
Another suggestion would be to hire time managers. This would eliminate the
problem discussed above completely. Germany has this kind of a system. They
use time managers that check the employee’s hours from SAP after the line
managers have approved them. The time manager’s job is to correct every error
before transferring the information to head users and payroll clerks.
Bringing in time managers would save up time and resources. It would also mean
that time evaluation wouldn’t have to be done in payroll. This would however
require creating positions for time managers to different areas of payroll. Some of
the payroll clerks could be reassigned to these duties, thus making it possible to
avoid substantial layoffs. This would also decrease resistance towards a change in
the organizational structure.
Stora Enso has recently tried to make its organization more agile. Time managers
wouldn’t most likely be a part of the payroll organization. Making positions for
time managers would also achieve Stora Enso’s goal of making the organization
lighter.
The current process involving entering new employees takes up unnecessary time.
This is because it involves two actors, one from human resources and the payroll
clerk. The payroll clerk must wait for the HR person’s clearance before starting to
enter new data to the system. Sometimes the process can be very slow. Payroll
clerks will receive information about a new employee, but HR might not be able
to enter the new person to the system immediately. It should be considered
whether one actor could be responsible for this whole process. One possibility
would be to shift the whole process to the HR workers, thus giving the payroll
60
personnel more time to focus on other tasks. This is just one example on how to
make processes more simple and effective.
More SAP training is needed in units if the current system and organizational
structure is maintained. The mistakes made in units have to be corrected by the
payroll clerks. Training could decrease errors in CATS time sheets.
Researching best practices for different SAP transactions and reports is also an
important task. It is critical to find ways to use SAP more effectively. There has
been some work in a form of a project on this particular subject in the payroll
department. Changing the way some transactions and procedures are done require
commitment and adaptation from the payroll clerks. Some resistance might be
found on this front, but it should be stressed that in the long run it will benefit the
company and its employees.
Conducting benchmarking should benefit Stora Enso in the future. Stora Enso is
able to see and compare their performance and cost-efficiency to some of the
largest Finnish companies. Stora Enso should be encouraged by these results. It
fared well in the comparisons. It can use the numbers from benchmarking in order
to sustain its competitiveness in the future.
9.2 Future Scenarios
In my opinion there are three different scenarios for Stora Enso’s Finnish payroll
when considering future action. They are:
1) Maintain the current provider and system
2) Change provider/system
3) Outsource payroll – Hire an Application Service Provider
Scenario number one is the most likely one to occur. The current provider and
system can offer a good solution that has been working for the last seven years.
61
With some minor corrections to the system and possibly to the organizational
structure, this would be a good choice for the company.
The costs of the current system model seem to be rather competitive. Keeping
with the Global SAP system should be a good decision for Stora Enso. Even
though there is less freedom for decisions, it still offers a good and cost-efficient
solution. The current system is well known with payroll clerks, and should work
fine in the future.
Scenario number two would require a lot of time and resources. In the current
situation this is very unlikely to happen. Changing the provider could work, if a
different provider that knows the industry can offer a solution that allows Stora
Enso to maintain the same system. If a reasonable offer from a provider would be
brought to the table, it could be cause for consideration. Changing the system
however would not be a smart idea in my opinion. The payroll clerks have learned
to use SAP HR and it offers good functions when talking about the payroll
perspective.
Outsourcing would be unlikely. This option would of course require major layoffs
and shift control of payroll to a third party. Switching to an application service
provider would require a high initial investment. Stora Enso would still have to
maintain payroll accounting services, thus all of the costs of payroll wouldn’t be
cut.
Stora Enso must now decide in which direction it wants to go. The benchmarking
effort done in this thesis has now gone past the integration stage. It means that the
critical findings have been done and next the decisions must be made.
One course of action can be no action at all. This will be the most likely choice.
At the moment it seems like the smartest and most cost-efficient action. Getting a
new vendor or HR software would create huge initial costs, and right now the
company can’t afford to do that. Benchmarking results have shown that the
62
current performance of the company compares well with other major Finnish
organizations.
At the same time it must be said that there is some variation in the number’s found
in the benchmarking study in this thesis. Mainly because of time and budget
constraints some of the numbers might not be the exact ones. But in any case this
study should give a good idea to the participating companies about their
performance.
63
10 Summary
The main focus of this thesis was on benchmarking. Benchmarking between
companies proved out to be a slow and changing process in itself. The lack of a
common idea for a questionnaire and for comparison hindered progress.
The objectives for benchmarking changed many times. First we went into smaller
detail by describing all processes. From that we realised that it would be hard to
perform a questionnaire on such a deep level. At first the objective was to find out
about the use of time.
After talking to companies, costs became more important. The questionnaire
about the use of time was useful for the company itself though. But in the end it
all comes down to costs, so on a larger scale selecting costs as the main variable
was a good and satisfactory choice for the participating companies. In the end the
comparison went well and provided companies with important data.
In this thesis I also focused on some important processes that payroll clerks
perform at the Stora Enso HR Finland Service Center. The survey about the use of
time had a small amount of participants, but it gave the company some ideas about
improvements that could be made in the future.
The theoretical part of this thesis focused on benchmarking and choosing a payroll
vendor and software. The results of the empirical part proved that Stora Enso
doesn’t need to consider changing its vendor or software, as the current one
produces a competitive result.
I believe that Stora Enso benefited a lot from benchmarking with other high
profile Finnish companies. They formed new relationships that allow them to
communicate and share information in order to make payroll more efficient. The
benchmarking results gave the company a good idea on what areas to improve and
what areas are done well at Stora Enso HR Finland Service Center.

64
11 References
Ahmed, P.K. and Rahiq, M. (1998). Integrated benchmarking: a holistic
examination of select techniques for benchmarking analysis, Benchmarking for
Quality Management and Technology, Vol. 5 No. 3, pp. 225-42.
Bhutta, K.S. and Huq, F. (1999). Benchmarking best practices: an integrated
approach, Benchmarking: An International Journal, Vol. 6 No. 3, pp. 254-68.
Camp, Robert. (1999). Business Process Benchmarking: Finding and
Implementing Best Practices. ASQ Quality Press.
Dattakumar, R. and Jagadeesh, R. (2003). A review of Literature on
Benchmarking. Benchmarking: An International Journal, Volume 10, Number 3.
Finnair. Finnair in Brief. [Finnair www-pages]. Cited [26.5.2009]. Available at:
http://www.finnairgroup.com/group/group_1.html
Finnair. Financial Information. [Finnair www-pages]. Cited [26.5.2009].
Available at: http://www.finnairgroup.com/investors/investors_5_1.html
Finnair presentation. Benchmarking meeting – presentation slides 5.6.2009
Foot, M. & Hook C. (1999). Introducing human resource management. Second
Edition. Addison Wesley Longman Limited.
IOMA. Payroll Benchmarking From A to Z. 2008. IOMA's Payroll Manager's
Report, March 1, 1,3-7. http://www.proquest.com/ (accessed February 26, 2009).
IOMA. Proceed With Caution When Choosing a New Payroll System.
2008. IOMA's Payroll Manager's Report, October 1, 1,7+.
http://www.proquest.com/ (accessed February 26, 2009).
65
IOMA. Selecting a Payroll Service Vendor: What Payroll Mgrs. Should Know.
2009. IOMA's Payroll Manager's Report, February 1, 1,9-11.
http://www.proquest.com/ (accessed February 26, 2009).
IOMA. Selecting a New Payroll System. 2008. IOMA's Payroll Manager's
Report, September 1, 1,7+. http://www.proquest.com/ (accessed February 26,
2009).
IOMA Research. Exclusive IOMA Research: The Key Success Factors in Shared
Services. 2008. HR Focus, July 1, 6-7,10. http://www.proquest.com/ (accessed
February 26, 2009).
Jormanainen, Arto. SAP ERP Toiminnanohjausjärjestelmän
laajentamismahdollisuuksien tarkastelua. Master’s thesis. 2008. Available at:
ftp://cs.joensuu.fi/pub/Theses/2008_MSc_Jormanainen_Arto.pdf
Jorgensen H., Owen L., Neus A. Stop Improvising Change Management. 2008.
Available at: https://portti.lut.fi/f5-w-
687474703a2f2f7777772e656d6572616c64696e73696768742e636f6d$$/Insight/v
iewPDF.jsp?contentType=Article&Filename=html/Output/Published/EmeraldFull
TextArticle/Pdf/2610370206.pdf
Karjalainen, Asko. Mitä Benchmarking-arviointi on? 2002. Available at:
http://www.oulu.fi/w5w/benchmarking/bm.RTF
Klaus H., Rosemann M., Gable G. What is ERP? 2000. Available at:
https://portti.lut.fi/f5-w-
H687474703a2f2f7777772e737072696e6765726c696e6b2e636f6d$$/content/lrl0
0l2433m08k63/fulltext.pdf
Korhonen, Kirsi. (2009). Basic course in Total Quality Management, course
material. Lappeenranta University of Technology.
66
Kulmala, J. (1999). Benchmarkingin ammatillisen aikuiskoulutuskeskuksen
toiminnan kehittämisen välineena, Acta Universitatis Tamperensis 663, Tampere.
Kyrö, Paula. Revising the concept and forms of benchmarking. 2003. Available
at: http://huynhthiphuonglan.files.wordpress.com/2008/10/kyro.pdf
Mathaisel D., Cathcart T., Comm C. A Framework for Benchmarking, Classifying
and Implementing Best Sustainment Practices. 2003. Available at:
http://faculty.babson.edu/mathaisel/Pubs/Framework%20for%20Best%20Sustain
ment%20Practices%20Nov%202003.pdf
Metsäliitto. About Metsäliitto Group. [Metsäliitto www-pages]. Cited
[26.5.2009]. Available at:
http://www.metsaliitto.com/page.asp?path=1;2785;2800
Metsäliitto. Key Figures. [Metsäliitto www-pages] [Cited 26.5.2009]. Available
at: http://www.metsaliitto.com/page.asp?path=1;2785;2800;3767
Moe C.E., Fosser E., Leister H., Newman M. How Can Organizations Achieve
Competitive Advantages Using ERP Systems Through Managerial Processes?
2005. Available at: https://portti.lut.fi/f5-w-
H687474703a2f2f7777772e737072696e6765726c696e6b2e636f6d$$/content/ru6
5767m114x1213/fulltext.pdf
Neste Oil. In Brief. [Neste Oil www-pages]. Cited [26.5.2009]. Available at
http://www.nesteoil.com/default.asp?path=1,41,537,2455
Neste Oil. Key Figures. [Neste Oil www-pages]. Cited [26.5.2009]. Available at:
http://www.nesteoil.com/default.asp?path=1,41,537,2455,5896
Neste Oil presentation. Benchmarking meeting – presentation slides 5.6.2009
67
Papinniemi, Jorma. (2008). Information Management of Business Processes,
course material. Lappeenranta University of Technology.
Pannell, David J. (1996). Sensitivity Analysis of normative economic models:
theoretical framework and practical strategies. University of Western Australia.
Porter, M.E. (1996). What is strategy? Harvard Business Review, 74(6), 61-78.
Rashid, M., Hossain, L., Patric, J. The Evolution of ERP systems: A Historical
Perspective. 2002. [Cited 3.3.2009]. Available at: http://www.igi-
pub.com/downloads/excerpts/193070836XExcerp.pdf
SAP. History. [SAP www-pages]. [Cited 3.3.2009]. Available at:
http://www.sap.com/about/company/history/index.epx
SAP. Solutions. [SAP www-pages]. [Cited 3.3.2009]. Available at:
http://www.sap.com/solutions/businessmaps/78590453EC454B8986A933EBB7E
84848/index.epx
Stora Enso. About us. [Stora Enso www-pages]. Updated 26.2.2009. Available at
http://insite.storaenso.com/about-us/Pages/company-profile.aspx
Stora Enso. Group Functions. [Stora Enso www-pages]. Updated 9.2.2009. [Cited
29.4.2009]. Available at: http://insite.storaenso.com/group-functions/human-
resources/hr-in-finland/organisaatio/Documents/HR%20Finland%202009.ppt
Stora Enso. Group Structure. [Stora Enso www-pages]. Updated 25.10.2008.
[cited 29.4.2009]. Available at: http://insite.storaenso.com/about-us/organisation-
charts/group/Pages/group-structure.aspx
68
Waddell D., Sohal A. Resistance: a constructive tool for change management.
1998. Available at:
http://www.icti.ie/articles/Resistance%20a%20constructive%20tool%20for%20ch
ange%20management.pdf
Wang, B., Nah, F. ERP + E-Business = A New Vision of Enterprise System.
2002. [Cited 3.3.2009]. Available at: http://www.idea-
group.com/downloads/excerpts/IRM1931777063.pdf
YLE. Yleistä Ylestä. [YLE www-pages]. Cited [26.5.2009]. Available at:
http://yle.fi/yleista/lyhyesti.shtml
YLE. Talous. [YLE www-pages]. Cited [26.5.2009] Available at:
http://yle.fi/yleista/talous.shtml
YLE Presentation. Benchmarking meeting – presentation slides 5.6.2009
Interviews
Stora Enso Oyj, 4.3.2009, Imatra. HR Process Development Team Leader
Ismo Tanskanen.
69
Appendices Appendix 1: Cost Comparison sheet
Appendix 2: Questionnaire used in testing
Appendix 3: Original questionnaire
Appendix 4: Explanation of terms in the original questionnaire
Appendix 5: Document containing 15 larger processes for benchmarking
Appendix 6: Orginal cost comparison sheet
Appendix 7: Stora Enso cost comparison
Appendix 8: Finnair cost comparison
Appendix 9: Metsäliitto cost comparison
Appendix 10: YLE cost comparison
Appendix 11: Neste Oil cost comparison
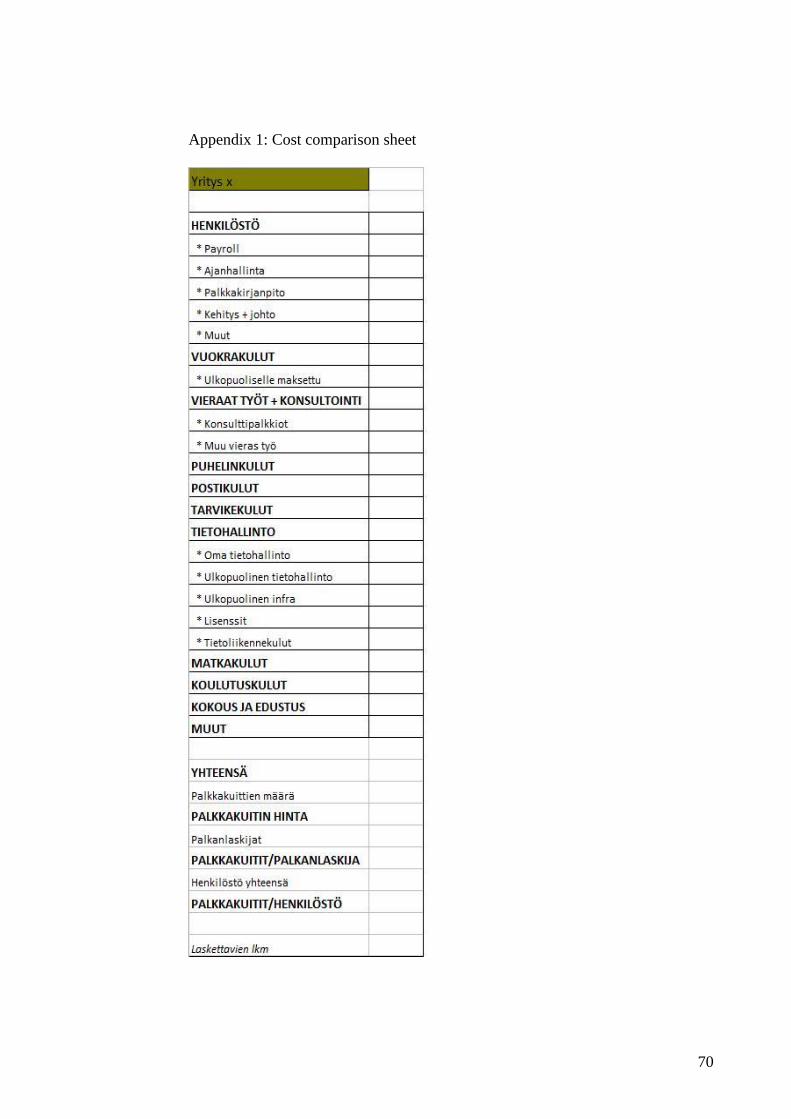
70
Appendix 1: Cost comparison sheet
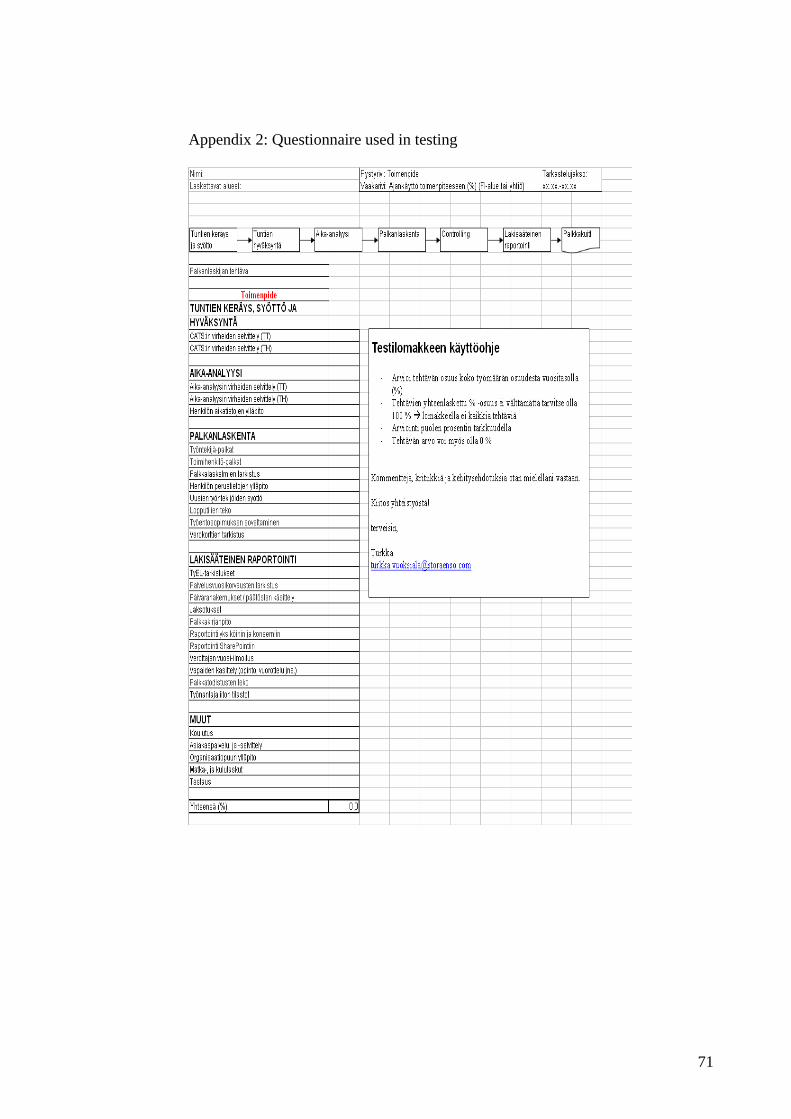
71
Appendix 2: Questionnaire used in testing
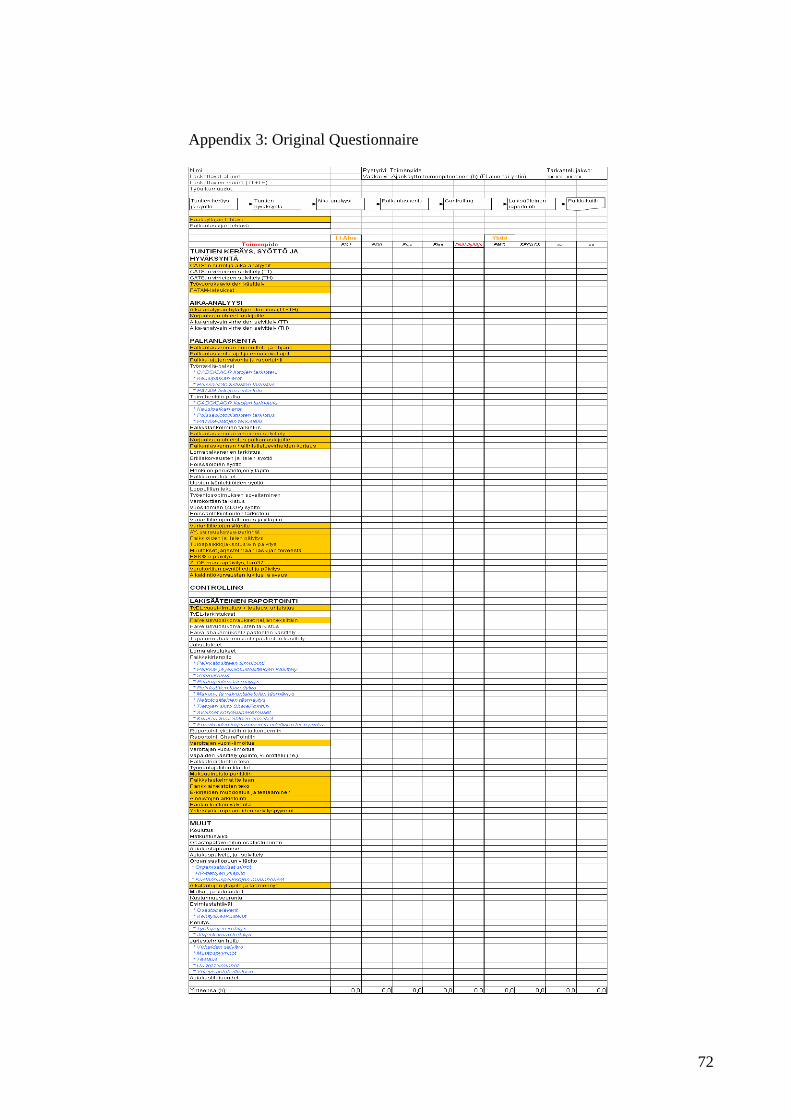
72
Appendix 3: Original Questionnaire
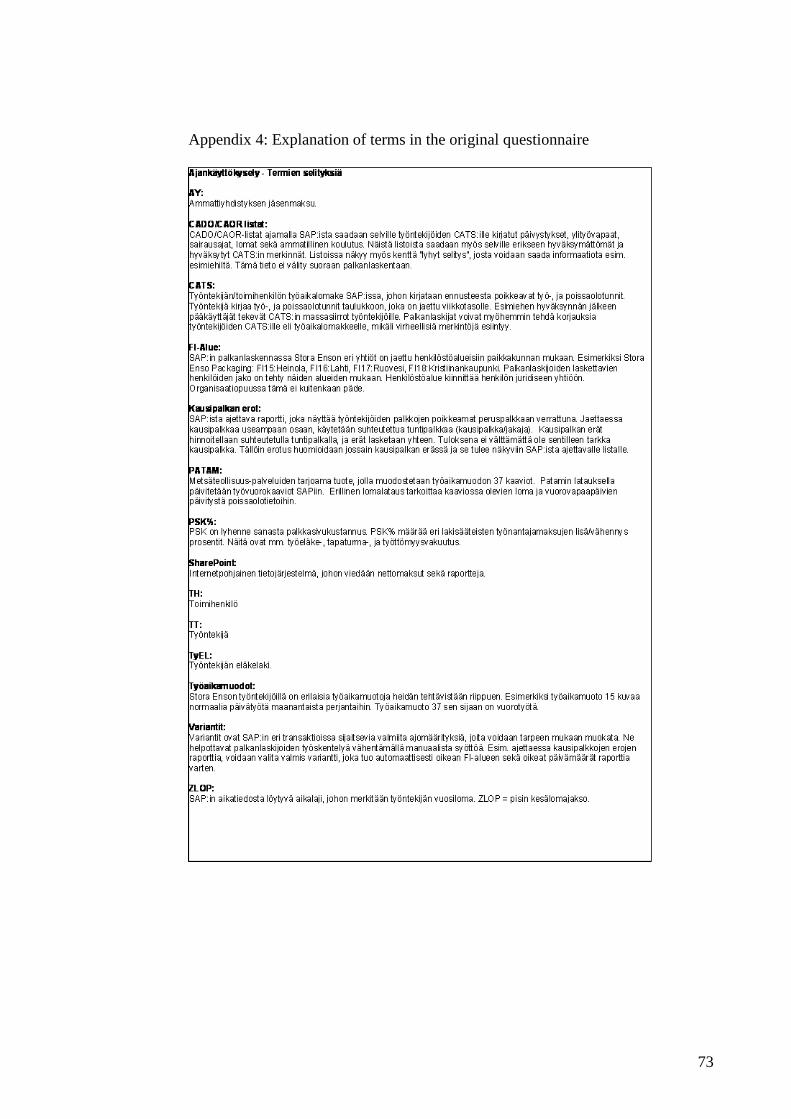
73
Appendix 4: Explanation of terms in the original questionnaire
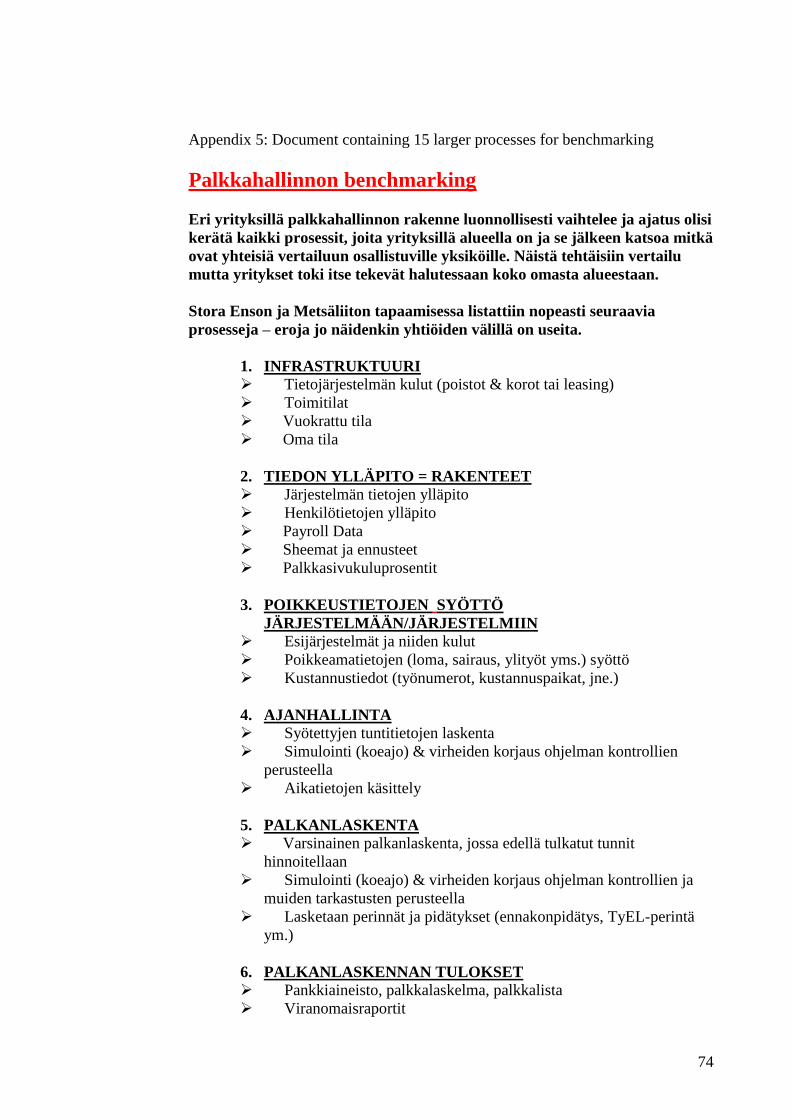
74
Appendix 5: Document containing 15 larger processes for benchmarking
Palkkahallinnon benchmarking
Eri yrityksillä palkkahallinnon rakenne luonnollisesti vaihtelee ja ajatus olisi
kerätä kaikki prosessit, joita yrityksillä alueella on ja se jälkeen katsoa mitkä
ovat yhteisiä vertailuun osallistuville yksiköille. Näistä tehtäisiin vertailu
mutta yritykset toki itse tekevät halutessaan koko omasta alueestaan.
Stora Enson ja Metsäliiton tapaamisessa listattiin nopeasti seuraavia
prosesseja – eroja jo näidenkin yhtiöiden välillä on useita.
1. INFRASTRUKTUURI
Tietojärjestelmän kulut (poistot & korot tai leasing)
Toimitilat
Vuokrattu tila
Oma tila
2. TIEDON YLLÄPITO = RAKENTEET
Järjestelmän tietojen ylläpito
Henkilötietojen ylläpito
Payroll Data
Sheemat ja ennusteet
Palkkasivukuluprosentit
3. POIKKEUSTIETOJEN SYÖTTÖ
JÄRJESTELMÄÄN/JÄRJESTELMIIN
Esijärjestelmät ja niiden kulut
Poikkeamatietojen (loma, sairaus, ylityöt yms.) syöttö
Kustannustiedot (työnumerot, kustannuspaikat, jne.)
4. AJANHALLINTA
Syötettyjen tuntitietojen laskenta
Simulointi (koeajo) & virheiden korjaus ohjelman kontrollien
perusteella
Aikatietojen käsittely
5. PALKANLASKENTA
Varsinainen palkanlaskenta, jossa edellä tulkatut tunnit
hinnoitellaan
Simulointi (koeajo) & virheiden korjaus ohjelman kontrollien ja
muiden tarkastusten perusteella
Lasketaan perinnät ja pidätykset (ennakonpidätys, TyEL-perintä
ym.)
6. PALKANLASKENNAN TULOKSET
Pankkiaineisto, palkkalaskelma, palkkalista
Viranomaisraportit
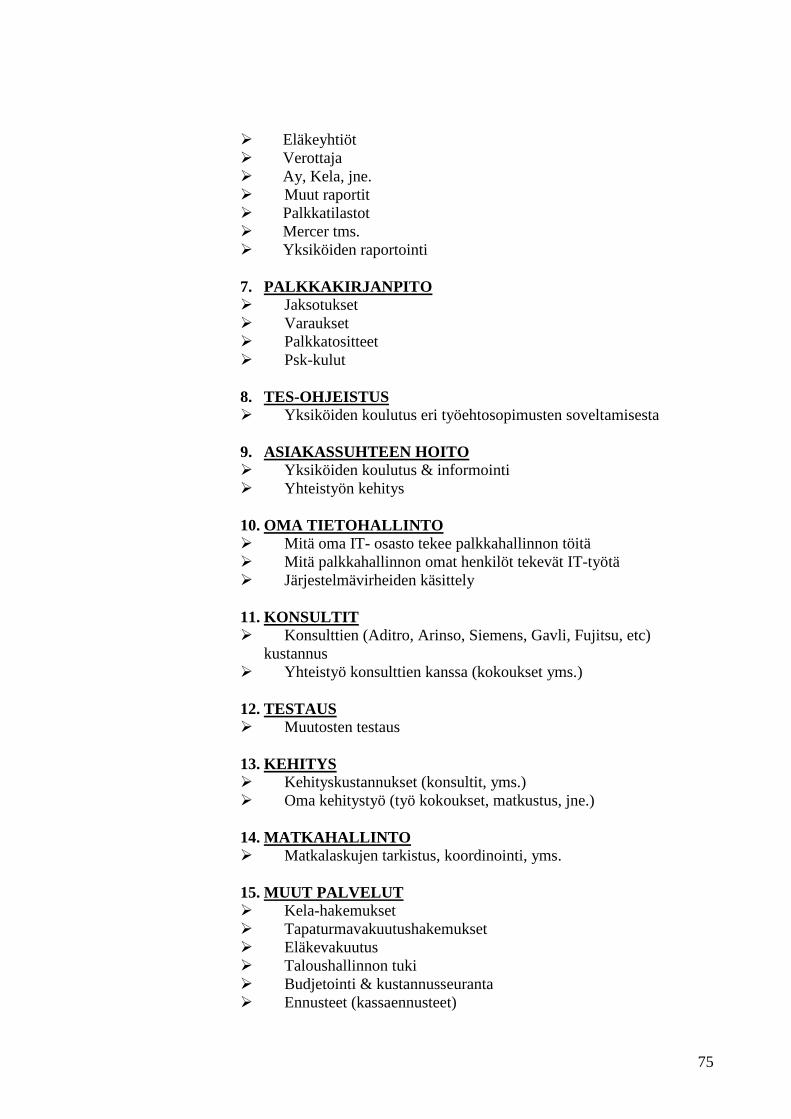
75
Eläkeyhtiöt
Verottaja
Ay, Kela, jne.
Muut raportit
Palkkatilastot
Mercer tms.
Yksiköiden raportointi
7. PALKKAKIRJANPITO
Jaksotukset
Varaukset
Palkkatositteet
Psk-kulut
8. TES-OHJEISTUS
Yksiköiden koulutus eri työehtosopimusten soveltamisesta
9. ASIAKASSUHTEEN HOITO
Yksiköiden koulutus & informointi
Yhteistyön kehitys
10. OMA TIETOHALLINTO
Mitä oma IT- osasto tekee palkkahallinnon töitä
Mitä palkkahallinnon omat henkilöt tekevät IT-työtä
Järjestelmävirheiden käsittely
11. KONSULTIT
Konsulttien (Aditro, Arinso, Siemens, Gavli, Fujitsu, etc)
kustannus
Yhteistyö konsulttien kanssa (kokoukset yms.)
12. TESTAUS
Muutosten testaus
13. KEHITYS
Kehityskustannukset (konsultit, yms.)
Oma kehitystyö (työ kokoukset, matkustus, jne.)
14. MATKAHALLINTO
Matkalaskujen tarkistus, koordinointi, yms.
15. MUUT PALVELUT
Kela-hakemukset
Tapaturmavakuutushakemukset
Eläkevakuutus
Taloushallinnon tuki
Budjetointi & kustannusseuranta
Ennusteet (kassaennusteet)

76
Tulospalkkiot & optiot
Lopputilien käsittely
Lomautusilmoitukset / kassojen informaatio
77
Appendix 6: Original cost comparison sheet
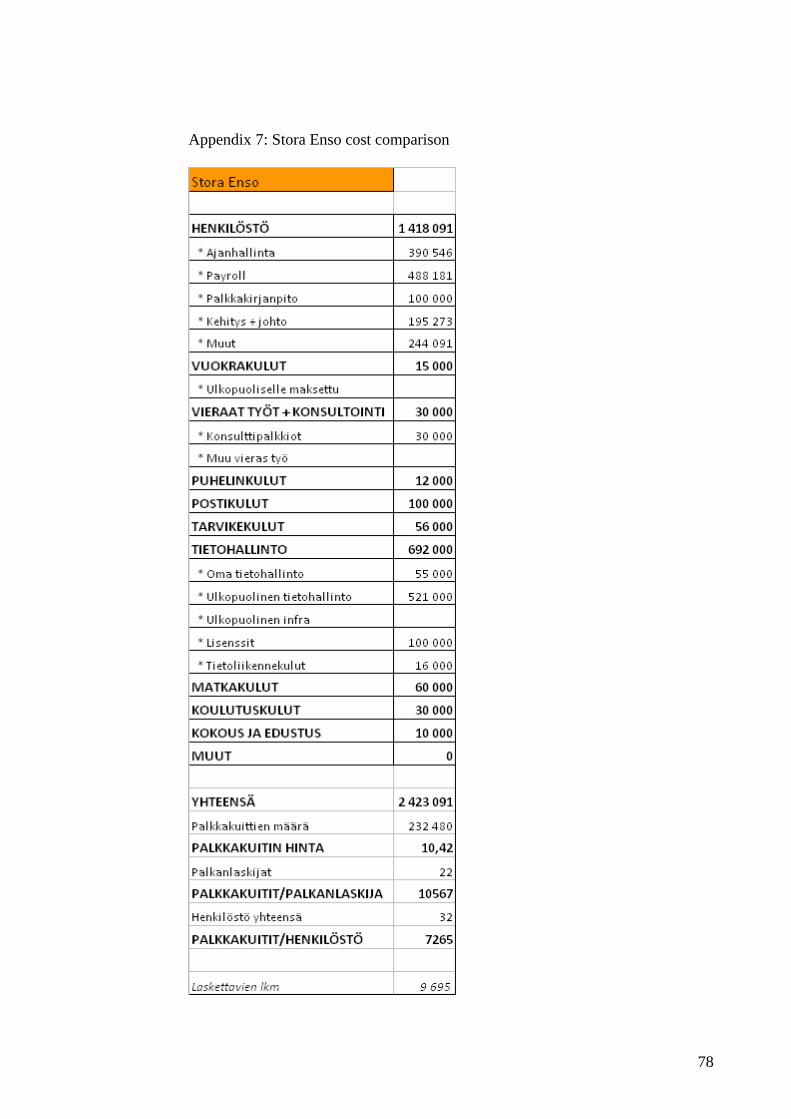
78
Appendix 7: Stora Enso cost comparison
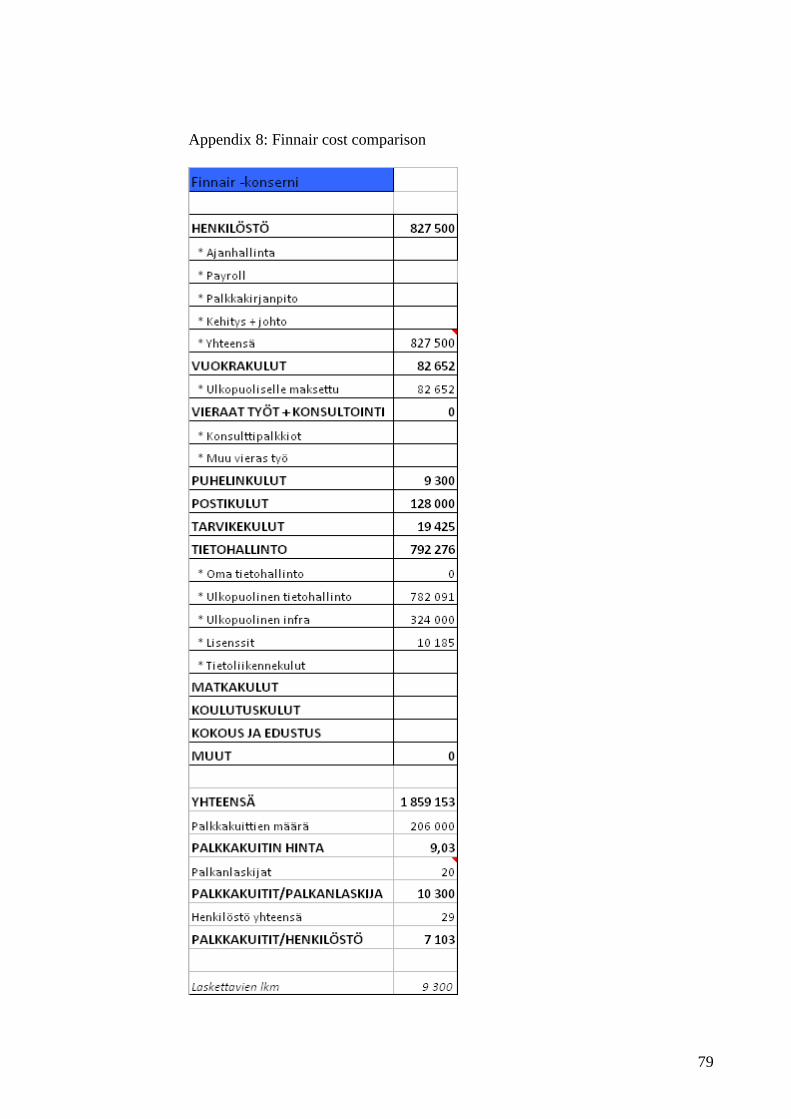
79
Appendix 8: Finnair cost comparison
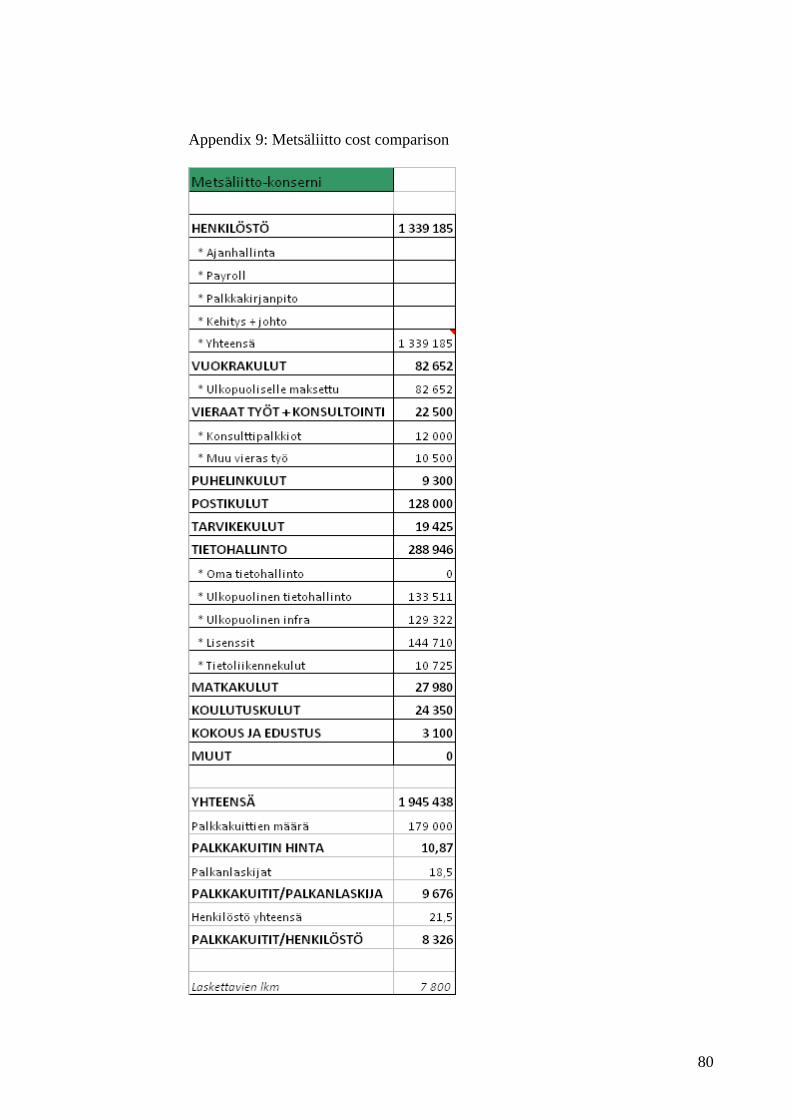
80
Appendix 9: Metsäliitto cost comparison
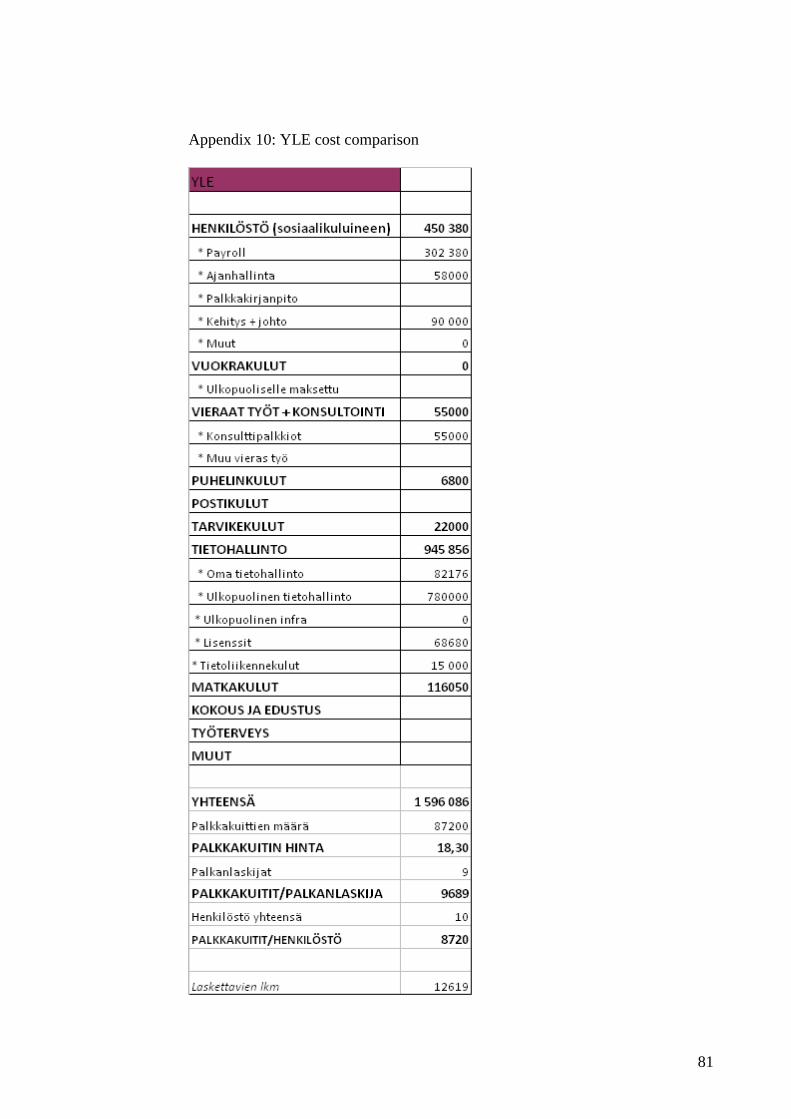
81
Appendix 10: YLE cost comparison
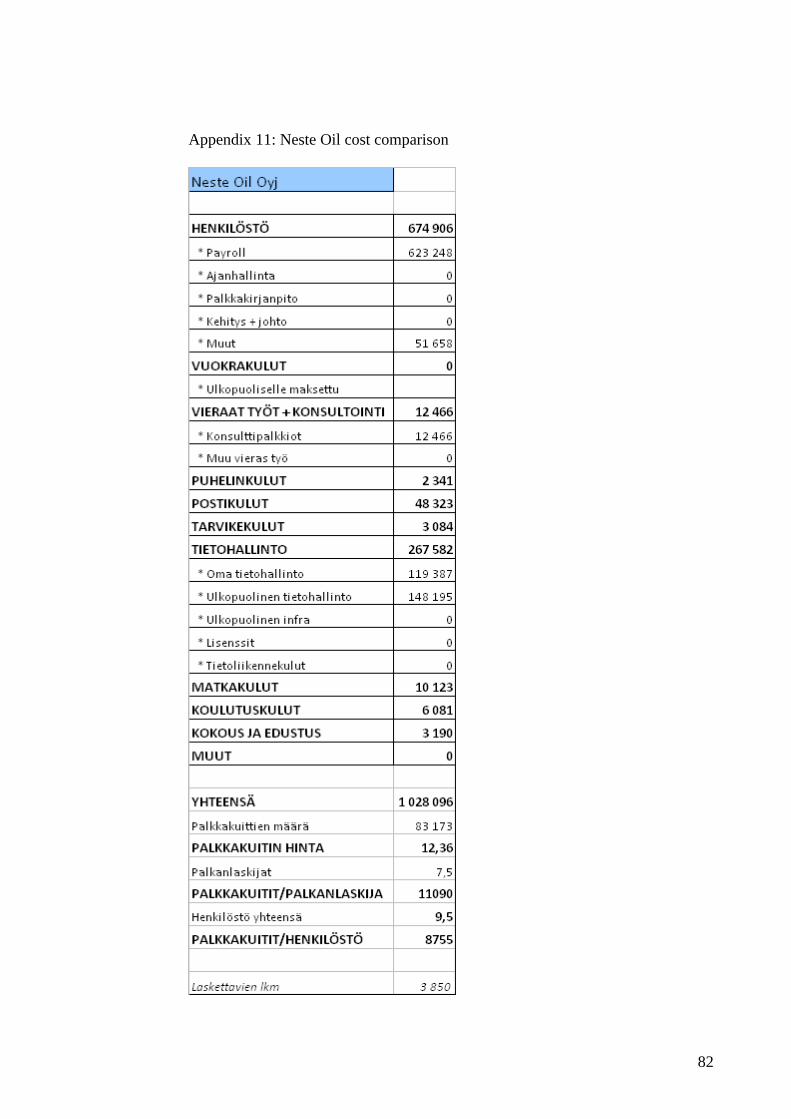
82
Appendix 11: Neste Oil cost comparison