Embed Size (px)
Citation preview
Aalborg Universitet
Analyzing the long-term glucose counter-regulation to hypoglycemia
Johansen, Mette Dencker
Publication date:2009
Document VersionPublisher's PDF, also known as Version of record
Link to publication from Aalborg University
Citation for published version (APA):Johansen, M. D. (2009). Analyzing the long-term glucose counter-regulation to hypoglycemia: methodologicalapproaches. Aalborg: Medical Informatics Group. Department of Health Science and Technology. AalborgUniversity.
General rightsCopyright and moral rights for the publications made accessible in the public portal are retained by the authors and/or other copyright ownersand it is a condition of accessing publications that users recognise and abide by the legal requirements associated with these rights.
? Users may download and print one copy of any publication from the public portal for the purpose of private study or research. ? You may not further distribute the material or use it for any profit-making activity or commercial gain ? You may freely distribute the URL identifying the publication in the public portal ?
Take down policyIf you believe that this document breaches copyright please contact us at [email protected] providing details, and we will remove access tothe work immediately and investigate your claim.
Downloaded from vbn.aau.dk on: maj 02, 2018
PhD-thesis
ANALYZING THE LONG-TERM
GLUCOSE COUNTER-REGULATION
TO HYPOGLYCEMIA
– METHODOLOGICAL
APPROACHES
Mette Dencker Johansen
Medical Informatics Group, Department of Health Science and
Technology
Aalborg University
Denmark
Supervisor Ole K. Hejlesen
This thesis was finished September 2008 and successfully defended December 18th 2008 at Aalborg University.
The assessment committee were:
Chief physician, PhD, Hans-Henrik Lervang
Department of Endocrinology, Aalborg Hospital, Aarhus University, Denmark
Associate professor, PhD, Ricardo Bellazzi
Department of Computer Science and Systems, University of Pavia, Italy
Associate professor, PhD, Winnie Jensen (chairman)
Department of Health Science and Technology, Aalborg University, Denmark
The academic council of The Faculties of Engineering, Science and Medicine conferred the PhD degree at their January meeting 2009.
Published in 2009
ISBN of electronic version: 978-87-7094-016-0
ISBN of printed version: 978-87-7094-015-3

Mette Dencker was born in 1980 in Hjørring, Denmark. She received her M.Sc. in Biomedical Engineering with specialization in medical informatics from Aalborg University in the summer of 2005, being one of the first students in the University’s Master of Biomedical Engineering and Informatics programme. In August 2005 she started her PhD study which was finished and defended in December 2008. Since August 2008 she has been employed as an assistant professor in the Medical Informatics Group, Department of Health Science and Technology, Aalborg University.


1
Abstract The Somogyi effect or long-term glucose counter-regulation to hypoglycemia is a reaction hypothesized to manifest itself as a hypoglycemia-induced (relative) hyperglycemia. Such an effect would pose a potential challenge to blood glucose control in people with type 1 diabetes. Since good blood glucose control is crucial to the health of this patient group, the hypothesis of the long-term glucose counter-regulation has been explored for half a decade. No consensus on the existence and characteristics of the hypothesized effect has been reached.
This PhD-project aims at exploring different methodological approaches to the analysis of the hypothesized long-term glucose counter-regulation and its correlation to hypoglycemia. Therefore, we conducted an apparently ideal study, during which we compared continuously monitored glucose in a period following spontaneous hypoglycemia with that in a control period free from hypoglycemia. Three additional studies were conducted to explore potential solutions to methodology challenges to the apparently ideal study. These were 1) a background data balancing method study employing a metabolic model for normalization of background data, 2) a control data substitution study utilizing a metabolic model's simulations as control data, and 3) an animal study using Göttingen minipigs as a chronic model of type 1 diabetes with tight blood glucose control, equipped to offer the opportunity of easy and frequent blood sampling.
All four evaluated approaches appear feasible and relevant in the study of the long-term glucose counter-regulation. The thesis provides indications of a long-term glucose counter-regulation to hypoglycemia, which means that further exploration of the hypothesis is of importance to the glycemic control of type 1 diabetic patients. Further explorations may apply the methods suggested in this thesis.
2
Danish Summary/Dansk resume Hypoglykæmi-induceret hyperglykæmi kaldet Somogyi-effekten eller langtidsmodreguleringen i blodsukker efter hypoglykæmi har været foreslået på baggrund af observationer hos patienter med type 1-diabetes. En sådan hyperglykæmisk effekt af hypoglykæmi vil udgøre en potentiel udfordring for blodsukkerkontrollen hos denne gruppe. God blodsukkerkontrol er essentiel for sundheden for patienter med type 1-diabetes, så hypotesen om langtidsmodregulering i blodsukker efter hypoglykæmi er blevet undersøgt gennem det sidste halve århundrede. Der er dog ikke opnået konsensus om eksistensen af den.
Formålet med dette PhD-projekt var at beskrive forskellige metodetilgange til analysen af den mulige langtidsmodregulering i blodsukker efter hypoglykæmi. Vi udførte et tilsyneladende ideelt studium, hvor vi sammenlignede kontinuerligt målt vævsglukose i en periode efter hypoglykæmi med kontinuerligt målt vævsglukose i en periode uden foregående hypoglykæmi. Tre yderligere studier blev udført for at udforske mulige løsninger på metodemæssige udfordringer i det tilsyneladende ideelle studium. Disse tre studier var et studium, der balancerede baggrundsdata ved hjælp af en metabolisk model, et studium, der introducerede metaboliske modelsimuleringer som kontroldata, og et dyrestudium, der beskriver implementeringen af en dyremodel for type 1-diabetes med stram blodsukkerkontrol og let adgang til blodprøvetagning i Gøttingen minigrise.
Alle fire anvendte metodetilgange udgør anvendelige og relevante til analysering af langtidsmodreguleringen i blodsukker efter hypoglykæmi. Afhandlingen indikerer, at langtidsmodregulering efter hypoglykæmi forekommer, så yderligere udforskning af fænomenet bør foretages af hensyn til blodsukkerkontrollen hos type 1-diabetikere. En sådan yderligere udforskning kan anvende metoderne præsenteret i dette PhD-projekt.
Preface
3
Preface This PhD-thesis presents the work done during my PhD-study August 2005-September 2008. The work was performed in the Medical Informatics Group, Department of Health Science and Technology, Aalborg University, Denmark. The title of the thesis is Analyzing the long-term glucose counter-regulation to hypoglycemia – methodological approaches.
The thesis comprises 3 sections: Introduction, Studies, and Discussion and Conclusion. The Introduction offers a general introduction to diabetes and the subject of the thesis i.e. the long-term glucose counter-regulation to hypoglycemia. Furthermore, it gives a brief overview of the literature on the subject and outlines the methodological approach applied in the studies presented in this thesis. The Studies section presents the four studies that constitute the thesis. The studies are in their original form (submitted or accepted) though without abstracts and bibliographies. The Discussion and Conclusion section provides a discussion of the work and its relation to previous work, suggests future work, and briefly concludes all work presented in the thesis. Full papers (with abstracts and bibliographies) can be found after the Discussion and Conclusion par. Tables and figures are numbered consecutively in each chapter.
Acknowledgements
This PhD-thesis is the result of 3 years of intensive work. A number of people have provided their knowledge and support, and they have each played an important role in my work.
First, I would like to thank my friends and family, especially my parents, for their support and understanding whenever I was excited or discouraged due to work breakthroughs or difficulties.
The Medical Informatics Group staff, academic as well as administrative and technical, deserves thanks for being good colleagues and for welcoming me going from being a masters’ student to being a PhD-student. In this regard, I would like to express my special appreciation of Pia Elberg for her support and considerate comments regarding research, teaching, and life in general. Also, Simon Eskildsen should receive my thanks for keeping me company in the office.
For starting the work that led up to this PhD-thesis with Ole K. Hejlesen back in the 1990’s, I would like to express my gratitude to David A. Cavan, Bournemouth Endocrine Center, Bournemouth, England. Also, I would like to offer my thanks to Jens Sandahl Christiansen, Medical Department M, Århus Hospital, for facilitating our contact to the Diabetes Glucose Monitoring Study Group.
I would like to thank Trine Hammer Jensen for sharing with me her experiences as a PhD-student and for providing veterinary advice.
The staff at Aalborg Hospital too deserves my sincerest thanks for their help during the animal experiments: Animal technicians Ole Sørensen, Jens Sørensen

Preface
4
and Torben Madsen in the Biomedical Laboratory for taking excellent care of my animals and for providing their practical help, experience, and company during many long hours in the laboratory. Chief physicians Henrik Barlebo and Karsten Nielsen, Department of Pathology and Biomedical Laboratory, for sharing their experience and offering very thoughtful input to the implementation and refinement of the animal model. Chief medical laboratory technician Jan Pedersen, Biochemical Laboratory, for assisting with equipment used in the animal study.
I would also like to thank the large-animal facility staff at Novo Nordisk, Carinalund, Ganløse, for their help during the animal experiments: Veterinarians Bidda Rolin and Marianne Larsen for sharing with me their protocols, for teaching me, and for helping me refining the animal model. Also the laboratory technicians should be thanked for teaching me and giving me all sorts of little tips related to animal experiments.
My co-authors Jens Sandahl Christiansen, David A. Cavan and Karsten Nielsen should receive a thank you for their invaluable help in making the studies possible as well as for their comments to the manuscripts.
For proof-reading the thesis manuscript, Morten Spjuth and Brent M. Witgen are greatly appreciated.
First and last, my supervisor Ole K. Hejlesen, Head of the Medical Informatics Group, Department of Health Science and Technology, Aalborg University, should receive my thanks for nearly everything; his support, his encouraging and yet challenging comments, his efforts to lead me into research and teaching – in short, his way of taking care of me!
Mette Dencker Johansen
Aalborg, September 10th 2008
Table of Contents
5
Table of Contents
Introduction ...................................................................................... 9
1. Diabetes mellitus .................................................................................. 11
Disease characteristics .......................................................................................... 11
Treatment .............................................................................................................. 11
Patient group ......................................................................................................... 11
2. Blood glucose control and the long-term glucose counter-regulation ..... 13
Importance of euglycemia ..................................................................................... 13
Means for achieving good blood glucose control ................................................. 13
Challenges to blood glucose control ..................................................................... 14
The long-term glucose counter-regulation to hypoglycemia as a challenge to blood glucose control ............................................................................................ 14
3. Literature overview .............................................................................. 17
Nocturnal glycemia stratification studies .............................................................. 17
Intervention glycemia control and true control studies........................................ 19
Diabetic subjects’ insulin resistance studies ......................................................... 21
Healthy subjects’ insulin resistance studies .......................................................... 22
Literature overview conclusion ............................................................................. 23
4. Methodological approach ..................................................................... 27
Methodology requirements .................................................................................. 27
The apparently ideal study .................................................................................... 27
Methodology requirement challenges .................................................................. 28
Studies employed in the PhD-thesis ...................................................................... 28
5. Relevance of the methodological approach to other hypotheses rather
than the long-term glucose counter-regulation to hypoglycemia ........... 31
Studies ............................................................................................ 33
6. Retrospective analysis of the long-term glucose counter-regulation to
hypoglycemia in continuous glucose data.............................................. 35
Introduction ........................................................................................................... 35
Materials and methods ......................................................................................... 36
Results ................................................................................................................... 38
Table of Contents
6
Discussion .............................................................................................................. 39
Conclusions ............................................................................................................ 41
7. Model-based balancing of unmatched data in model-generated
hypothesis evaluation ........................................................................... 43
Introduction ........................................................................................................... 43
Method outline ...................................................................................................... 44
Method evaluation and example use .................................................................... 45
Discussion .............................................................................................................. 47
Conclusion ............................................................................................................. 48
8. CGM glucose overshoot after hypoglycemia assessed by a simulation
tool .................................................................................................... 49
Introduction ........................................................................................................... 49
Materials and methods ......................................................................................... 50
Results ................................................................................................................... 52
Discussion .............................................................................................................. 54
Conclusions ............................................................................................................ 56
9. Implementation of an intensive chronic type 1 diabetes model with tight
blood glucose control in Göttingen minipigs .......................................... 57
Introduction ........................................................................................................... 57
Research Design and Methods .............................................................................. 58
Results ................................................................................................................... 64
Discussion .............................................................................................................. 67
Discussion and conclusions ............................................................. 71
10. General discussion ................................................................................ 72
Background, methods, and results ........................................................................ 72
Relations between the studies in the thesis.......................................................... 73
Limitations resulting from the use of existing data sets ....................................... 74
Relation to previous work ..................................................................................... 75
Future work ........................................................................................................... 76
11. Conclusion ............................................................................................ 79
Bibliography ................................................................................................ 81
Table of Contents
7
Submitted and published papers..................................................... 91

Table of Contents
8
9
INTRODUCTION
This section of the thesis provides the background of the work, gives a literature overview, and presents the work included in the thesis
10
Chapter 1: Diabetes mellitus
11
1. Diabetes mellitus
Disease characteristics
Diabetes mellitus is a chronic disease characterized by insufficient or absent insulin production and secretion and/or decreased insulin sensitivity of the tissue, causing blood glucose to be abnormally high. Other metabolism abnormalities are also observed, primarily in the lipid metabolism.
The disease exists in two variants, type 1 and type 2, mainly distinguished by the degree of intact insulin production in the pancreas. Type 1 diabetes is characterized by little or no endogenous insulin production, whereas type 2 diabetes is characterized by depressed insulin sensitivity and, at least in the early disease stages, nearly normal and perhaps even supranormal insulin production.
The etiology of type 1 diabetes is unknown but an autoimmune reaction is known to be involved. The etiology of type 2 diabetes has an important genetic component but is also related to lifestyle and ageing.
Treatment
In order to normalize blood glucose and to avoid acute or chronic complications due to abnormal blood glucose, people with type 1 and also some individuals with type 2 diabetes (in total approximately 20% of a diabetic population depending on treatment schemes applied (1)) must take over the regulation of blood glucose from the pancreas. This is achieved primarily by balancing exogenous insulin supplies, meals, and exercise. Insulin is usually injected by the patient via an insulin pen or a syringe, but insulin pumps for basal infusion and infusion of meal-related boluses may also be applied. Insulin is injected or infused into the subcutaneous adipose tissue, typically in the abdomen, thigh or upper arm. It might also be injected intra muscularly.
Individuals with type 2 diabetes that are not supplied with exogenous insulin are encouraged to keep a diet and reduce weight. Oral anti-diabetic medication (increasing the insulin sensitivity, increasing the pancreatic activity, or decreasing the glucose uptake from the intestine) may also be prescribed. Not all type 2 diabetic patients are diagnosed (2). This population is at a serious risk of long-term diabetic complications which could be avoided by routine therapeutic interventions.
Patient group
It has been estimated that the worldwide number of individuals with diabetes is 180 million (2006 figures). Of these, approximately 10% have type 1 diabetes (2). In 2007, 8% of the American population suffered from diabetes (type 1 or 2) (3), whereas in Spain, the 2002 prevalence of diabetes (type 1 and 2) was 5-6% (4). The 2003 U.S. incidence of diagnosed diabetes (type 1 and 2) was 6.9 per 1,000 persons per year and it is expected to increase in the following years (5). In
Chapter 1: Diabetes mellitus
12
Denmark, the total incidence of type 1 diabetes is approximately 15 per 100,000 persons per year.
The focus of remaining parts of this thesis is type 1 diabetes.
Chapter 2: Blood glucose control and the long-term glucose counter-regulation
13
2. Blood glucose control and the long-term glucose
counter-regulation
Importance of euglycemia
Keeping the blood glucose in the euglycemic range is essential for both type 1 and type 2 diabetic patients to avoid complications and minimize morbidity, premature death, and costs of care. Suboptimal blood glucose control with frequent or persistent episodes of hyperglycemia mainly leads to a substantially increased risk of long-term complications (8). These complications are micro and macro vascular diseases like diabetic retinopathy, diabetic nephropathy, diabetic neuropathies, and atherosclerosis. Intensive control of the blood glucose prevent long-term complications. However, it may also increase the frequency and severity of hypoglycemia (8), which to many patients constitutes the most feared complication to diabetes (9,10).
Diabetes (both type 1 and type 2) is the primary cause of death in 77,000 cases in the U.S. each year. In addition, 16.5% of all U. S. cardiovascular-related deaths are caused by long-term diabetic complications (3). The acute complications of hypoglycemia are associated with 2-4% of all deaths among people with type 1 diabetes (6,7). Diabetes accounted for 11% of the 2007 cost of the American healthcare system (3), whereas 6-7% of the 2002 Spanish healthcare cost was used for diabetes (4).
Means for achieving good blood glucose control
To a large extent, the patient has to take responsibility for managing his or her diabetes (11-14), since it is not practical or economically viable for specialists to manage patients’ diabetes on a day-to-day basis (14). Various approaches intended to facilitate patients’ everyday decisions have been suggested, ranging from educational courses to interactive computer programs (15). Educational courses or diabetes schools, like the Diabetes Teaching and Training Program (the Düsseldorf model) (16), Dafne (17) and the Newcastle Empowerment Programme (18) are usually conducted during inpatient stays (16) or in outpatient clinics (17,18). They aim to educate the patient to adjust insulin doses according to the expected carbohydrate intake and the current blood glucose level in order to achieve normoglycemia as well as to avoid hypoglycemia (16-18). Interactive computer programs are computer-based decision support systems such as DiasNet (19), AIDA (20), and Librae (21), all of which have been developed for educational (general) and advisory (specific) purposes alike. These decision-support systems all simulate a blood glucose profile from input data on meals and insulin doses, some of which are on a patient-specific basis (19,21,22), and some also from information on physical activity (21). Patients may then apply the computer simulation program as a test environment for exploring their bodies’ reactions to insulin doses, insulin regimen alterations, or meal-size alterations.
Chapter 2: Blood glucose control and the long-term glucose counter-regulation
14
From this they can select the insulin or meal action that will provide the desired blood glucose outcome.
Challenges to blood glucose control
Both educational courses and decision support systems aim to facilitate patients’ disease management, but their effectiveness encounters challenges. Both educational courses and decision support systems help the patient predict the outcome of various actions (primarily meal intakes and insulin injections) and help select the optimal action based on these predictions. Consequently, the prediction quality is crucial; if the prediction leading to the action selected is astray, the outcome of the action will not be as it was intended.
A number of possible causes of erroneous predictions exist. Variations in plasma insulin profiles after identical insulin injections have been reported (23,24) as have difficulties in quantifying insulin sensitivity variations due to stress or disease (25). On a hypothetical level, unanticipated variations in blood glucose have been speculated to arise from the long-term glucose counter-regulation to hypoglycemia (26-32). Such unanticipated variations in blood glucose would certainly cause erroneous predictions.
The long-term glucose counter-regulation to hypoglycemia as a
challenge to blood glucose control
The hypothesized long-term glucose counter-regulation to hypoglycemia has gained recent interest (28,30) in addition to the historical interest it was paid in the 50’s, 80’s and 90’s when it was known as the Somogyi effect. The long-term glucose counter-regulation to hypoglycemia is defined as a hypoglycemia-induced hyperglycemia. The hyperglycemia is not necessarily above an absolute blood glucose threshold of approximately 10 mmol/l; it may be elevated only relative to a control, hypoglycemia-free case with the same conditions regarding meal intake, insulin injections, exercise and other issues affecting blood glucose. A delay from hypoglycemia onset to the onset of the long-term counter-regulation hyperglycemia may be seen. However, it should be stressed carefully that no consensus exists on the quantitative characteristics of the manifestation of the long-term glucose counter-regulation to hypoglycemia, so firm definitions cannot be given (33-37). Despite the lack of sound definitions, a diurnal or otherwise recurrent pattern of the long-term glucose counter-regulation to hypoglycemia can be speculated due to the recurrent nature of hypoglycemia in some patients (7,38,39).
Because of the suggested characteristics of the long-term glucose counter-regulation to hypoglycemia, the reaction may pose a challenge to efficient blood glucose control. This would be the case if a recurrent (relative) hyperglycemia is not recognized as hypoglycemia-induced, but perceived instead as regulated solely by recent insulin and meal intake. The individual with diabetes may then
Chapter 2: Blood glucose control and the long-term glucose counter-regulation
15
attempt to treat the hyperglycemia with increased doses of insulin, but this might worsen the hypoglycemia problem, thus triggering a vicious circle.
However, such a vicious circle will be set off only if the long-term glucose counter-regulation to hypoglycemia occurs with prominent characteristics. To establish the relevance of the long-term glucose counter-regulation to hypoglycemia in normal life, the very mechanism is the focus of this thesis.
Chapter 2: Blood glucose control and the long-term glucose counter-regulation
16
Chapter 3: Literature overview
17
3. Literature overview Throughout the 80’s and 90’s, several groups have investigated the hypothesis of a long-term glucose counter-regulation since Michael Somogyi first proposed the hypoglycemia-induced hyperglycemic effect (40,41). This section presents a short overview of the literature of the long-term glucose counter-regulation to hypoglycemia. General methodological approaches and apparent results constitute the main focus of the overview, so specific studies are not explicitly summarized.
The studies of the long-term glucose counter-regulation roughly fall into four design categories:
nocturnal glycemia stratification studies
intervention glycemia control and true control studies
diabetic subjects’ insulin resistance studies
healthy subjects’ insulin resistance studies
The categories are standard study designs, but even within each design category studies vary in terms of specific research protocol characteristics; patient selection, blood sampling frequency, hypoglycemia threshold, assays in addition to glucose, and others.
Other varying designs have also been employed, but the majority of studies falls into one of the four.
Nocturnal glycemia stratification studies
In the nocturnal glycemia stratification studies subjects are stratified from nocturnal blood glucose measurements and morning glycemia in the different strata are compared. (In a variation of this study design stratification is from morning glycemia and comparison is of nocturnal glucose profiles for the different strata.) The nocturnal glycemia stratification study design is retrospective and observational.
The studies by Hoi-Hansen et al. (30), Guillod et al. (28), Havlin and Cryer (42), and Stephenson and Schernthaner (31) employ this design. The study by Gale et al. (27) employs the variation of the design with morning glycemia stratification and comparison of nocturnal blood glucose between strata.
In the nocturnal glycemia stratification design, sampling of blood glucose is initiated in the evening and performed at fixed-time intervals throughout the night until mid-morning. Stratification (hypoglycemia/no hypoglycemia) is performed from one of the nocturnal blood glucose values. The morning blood glucose is compared for the strata with confirmed nocturnal hypoglycemia and the strata with confirmed normo- or hyperglycemia. Hereby, the effect of
Chapter 3: Literature overview
18
spontaneous hypoglycemia in one stratum is compared to the effect of no spontaneous hypoglycemia in another stratum. (In the study design variation employing morning glycemia stratification, only data from subjects with nocturnal hypoglycemia are analyzed, and morning glycemia is stratified into strata of normo-/hyperglycemia and hypoglycemia.) Sampling intervals involving hospitalization of the subjects vary from 1.5 hours (27), over 3 hours (31) and up to 4-6 hours (42). Lately, continuous glucose sensors allowing patients to live their everyday lives have been applied for glucose sampling in studies of this design category. This has introduced frequent glucose sampling (sampling intervals of 1-5 minutes depending on glucose sensor system) (28,30). The study duration is determined by the time of glycemia stratification in the night and the time of morning glycemia analysis, and it ranges from 4 hours (30,31,42), over 6 hours (27) and up to 8 hours (28). Subjects in nocturnal glycemia stratification studies are diabetic, typically with type 1 diabetes. However, in the study by Havlin and Cryer (42) type 2 diabetic subjects treated with insulin were also inrolled. In all studies, the subjects take their usual insulin doses at the usual injection times. In this regard, it should be noted that some of the subjects in the study by Guillod and colleagues (28) used insulin infusion pumps for basal infusion and meal-related bolus infusions instead of subcutaneous insulin injections. In the studies using hospitalized subjects, no meals are ingested between glycemia stratification time and morning blood glucose measurement (27,31,42), whereas this is not controlled in non-hospitalized subjects (28,30).
According to this study design, elevated morning glucose after nocturnal hypoglycemia (compared to morning glucose after nocturnal normoglycemia) should be taken to indicate a long-term glucose counter-regulation to hypoglycemia. Hoi-Hansen and colleagues (30) did not find significantly increased morning sensor glucose after nocturnal hypoglycemia compared to the morning sensor glucose with nocturnal normo- or hyperglycemia. This was also seen by Guillod and colleagues (28), who also found that only about one quarter of sensor hyperglycemic mornings were preceded by sensor hypoglycemic nights. Havlin and Cryer (42) found significant blood glucose elevations of blood glucose (night to morning) in subjects with nocturnal blood glucose <5.5 mmol/l, but morning levels in these subjects were lower than in those subjects with nocturnal normoglycemia. Similarly, Stephenson and Schernthaner (31) found no difference in blood glucose elevation between subjects with and without nocturnal hypoglycemia. Gale and colleagues (27) found blood glucose elevated 7-8 mmol/l on mornings after hypoglycemia in some subjects and sustained hypoglycemia in others.
A major weakness of the nocturnal glycemia stratification design is the lack of comparability ensurance of hypoglycemia conditions and non-hypoglycemia conditions. This is due to the stratification of subjects and their normal ingestion of insulin and meals, which may not be the same in all strata, at least not in non-hospitalized subjects. Even if the study design does not ensure comparability of subjects, data on insulin doses and meals for the subjects in each stratum would
Chapter 3: Literature overview
19
be helpful when interpreting results. The limitation of hypoglycemia occurrence time to the night is also a weakness of the nocturnal glycemia stratification study design. This is because not all hypoglycemic events occur during the night and no indications exist that only nocturnal hypoglycemia may trigger the vicious circle imposed by the possible long-term glucose counter-regulation to hypoglycemia. As only nocturnal glycemia and its effect on morning blood glucose has been explored applying the nocturnal glycemia stratification design, it has not been ensured that the period before the study initiated was hypoglycemia-free for all subjects. If the long-term glucose counter-regulation to hypoglycemia is of a duration longer than 8 hours (the approximate study duration, ending with morning blood glucose sampling), hypoglycemic events before the study period may trigger a long-term glucose counter-regulation to hypoglycemia without presentation in the stratification glycemia sampling period. In such cases, the stratification may not reflect all of the actual triggered long-term glucose counter-regulations to hypoglycemia, but only those triggered by nocturnal hypoglycemic events. The study period, at least in studies applying the morning glycemia stratification design, like employed in Gale et al. (27), may also be insufficient for a counter-regulation to be prominent by the end of the study, as the blood glucose may not yet have normalized and increased to supranormal levels after spontaneous hypoglycemia.
Intervention glycemia control and true control studies
In the intervention glycemia control and true control design the blood glucose profile after induced hypoglycemia is compared with the blood glucose profile after ensured normoglycemia. For reference, also a non-intervention blood glucose profile is compared with the two other profiles. The study design is prospective and interventional.
The design has been employed in Perriello et al. (43), Hirsch et al. (29) and Tordjman et al. (32).
In the intervention glycemia control and true control study design, the subjects are hospitalized and subjected to a session of either a hypoglycemia induction with intravenous insulin infusion, normoglycemia insurance by a glucose infusion or reference without intervention. All subjects participate in all session types, typically in random order. The sessions all begin in the evening so that nocturnal hypoglycemia is investigated in all cases. Each session is associated with preceding (1-5 hours) and subsequent blood sampling for blood glucose measurements and other assays (plasma insulin, glucagon, epinephrine, growth hormone, cortisol (29,32,43) and norepinephrine (29,32)). Sampling intervals are typically 30 minutes (29,32,43), increasing to 60 minutes from 2 hours after hypoglycemia (29). The study period ranges from 4 (32) to 8 (43) and 18 (29) hours after hypoglycemia. Subjects in the intervention glycemia control and true control studies have type 1 diabetes. Subjects inject their usual insulin doses at fixed times together with fixed, standard meals in all sessions (29,43), or they take their usual insulin doses at their usual injection times with their usual meals (32). In the
Chapter 3: Literature overview
20
study by Perriello et al. (43), subjects were all treated with subcutaneous insulin infusions comprising both basal infusion and meal boluses.
According to the conventions of the intervention glycemia control and true control design category, higher blood glucose levels following hypoglycemia compared with those following normoglycemia support the hypothesis of a long-term glucose counter-regulation to hypoglycemia. Perriello and colleagues (43) found significantly higher (3-4 mmol/l) blood glucose levels beginning approximately 6 hours after hypoglycemia and continuing throughout the remaining 2 hours of the study period. Hirsch and colleagues (29) found no blood glucose difference comparing hypoglycemia with hypoglycemia prevention sessions. Careful inspection, however, reveals that the blood glucose was approximately 2-3 mmol/l higher after hypoglycemia nights than after the intervention-free control nights. This small relative hyperglycemia begins 6-10 hours after hypoglycemia nadir time and lasts until study finish time. During the intervention-free control night, only four of the subjects had no spontaneous nocturnal hypoglycemia, however, the hypoglycemic events in the remaining subjects were not as severe as in the intervention night. It could be speculated that prevention of hypoglycemia may have been excessive, as glucose levels in this session were approximately 2 mmol/l higher than in the intervention-free control session. Tordjman and colleagues (32) found no significantly higher blood glucose within 4 hours after hypoglycemia compared to after prevention of hypoglycemia. Also in this study it should be noted that hypoglycemia-prevention may have been excessive.
A major weakness of the intervention glycemia control and true control design is the induction of hypoglycemia that may not be in accordance with the subjects’ own diurnal susceptibility to hypoglycemia. The use of a control day for sampling of blood glucose without intervention mitigates this as the subjects’ overall susceptibility to nocturnal hypoglycemia can be confirmed, but as observed in the study by Hirsch and colleagues (29), some subjects have a tendency to hypoglycemia during the afternoon and the early evening and this may interfere with the induction of hypoglycemia. The possible interference of previous hypoglycemia cannot be assessed when the study periods of each session begins only shortly before hypoglycemia induction time. The use of glucose for hypoglycemia prevention is a relevant methodological feature, especially with the widespread tendency towards spontaneous hypoglycemia on the control days of all studies. However, from the studies conducted, a proven challenge is to infuse glucose in sufficient amounts to prevent hypoglycemia but on the other hand not cause hyperglycemia relative to the control case. The target value for blood glucose during glucose infusion is not evident as the control glucose profiles also contain data after spontaneous hypoglycemia and thus should not be used as target references. The frequent blood sampling and controlled settings in the intervention glycemia control and true control design provide detailed data but cause heavy workload, possibly resulting in small numbers of subjects in each study and short durations of experiment sessions. Thus, the duration may be
Chapter 3: Literature overview
21
insufficient to detect the long-term glucose counter-regulation to hypoglycemia. Induction of hypoglycemia with intravenous insulin infusion and reversal of hypoglycemia with glucose infusion clearly does not mimic the real-life situation with subcutaneous insulin depots. It remains unclear whether this poses a considerable confound for the study design, but subcutaneous insulin waning has been associated with the hypothesized long-term glucose counter-regulation to hypoglycemia (27,44).
Diabetic subjects’ insulin resistance studies
Two forms of insulin resistance studies exist but in both, the hypothesized long-term glucose counter-regulation is assumed to reveal itself in the form of insulin resistance. In one form of this design category, insulin resistance is evaluated as the blood glucose resulting from a fixed insulin infusion rate. Insulin resistance is thus evaluated by comparing blood glucose values after hypoglycemia with those after hypoglycemia prevention, both obtained with the same insulin infusion rate. In the other form, insulin resistance is evaluated as the glucose infusion rates needed for glycemia maintenance for a period after hypoglycemia and after hypoglycemia prevention. The study design is prospective and interventional.
The diabetic subjects’ insulin resistance study design has been employed in the studies by Kollind et al. (45) and Fowelin et al. (26).
In both types of diabetic subjects’ insulin resistance study designs, the subjects are hospitalized and subjected to a session of hypoglycemia induction by high insulin infusion rate (insulin clamp and blood glucose clamp) or to a control, normoglycemia session with a slow insulin infusion rate (insulin clamp) (45) or high insulin infusion rate (as for hypoglycemia induction) together with glucose infusion (blood glucose clamp) (26). In the hypoglycemia session, after hypoglycemia induction, subjects have glucose injected for reversal of hypoglycemia. The sessions are performed in random order. Somatostatin is infused with insulin and glucose for suppression of glucagon and growth hormone production, thus rendering the resulting blood glucose a measure of tissue insulin resistance. Hypoglycemia is induced during the night (45) or in the morning (26). Hypoglycemia counter-regulatory hormones (glucagon, epinephrine, cortisol and growth hormone) are measured before and after hypoglycemia. Blood sampling intervals are one hour, more frequently during hypoglycemia induction, and the study period after hypoglycemia is 8 hours. The subjects in the diabetic subjects’ insulin resistance studies are subjects with type 1 diabetes and have their regular insulin regimen withdrawn 24 (26) to 32-36 (45) hours before hospitalization in order to the insulin and blood glucose clamps to be precise.
According to the conventions of the diabetic subjects’ insulin resistance study category, the existence of a long-term glucose counter-regulation to hypoglycemia is indicated by increased blood glucose after hypoglycemia compared with blood glucose after normoglycemia (under the same insulin clamp conditions), and by decreased glucose requirements for glycemia maintenance
Chapter 3: Literature overview
22
after hypoglycemia compared with glucose requirements after normoglycemia (under the same blood glucose clamp conditions). Kollind and colleagues (45) found markedly increased blood glucose (approximately 5 mmol/) levels after hypoglycemia compared with the post-euglycemia cases, beginning 5 hours after hypoglycemia and extending throughout the remaining 5 hours of the study despite similar blood glucose at the beginning of fixed insulin and glucose infusion. This is interpreted as a higher insulin resistance following hypoglycemia than following normoglycemia. Fowelin and colleagues (26) found significantly lower glucose infusion requirements after hypoglycemia compared with after normoglycemia which is also interpreted as a higher insulin resistance following hypoglycemia than following normoglycemia.
A major weakness of the diabetic subjects’ insulin resistance study design is the induction of hypoglycemia at a time of day that may not be in accordance with the subjects’ diurnal proneness to hypoglycemia. Somatostatin suppresses only the short-acting hyperglycemic hormones glucagon and growth hormone, so in search of a long-term reaction, infusion of somatostatin should not confound matters, and its effects are needed for true insulin resistance determination purposes. The removal of the regular insulin regimen at least 24 hours before hypoglycemia induction and subsequent blood glucose control by intravenous insulin infusion appears to be a feasible approach to hypoglycemia prevention before the experimental hypoglycemia/control periods. However, it creates an artificial baseline constitution with altered plasma insulin levels not resembling the normal situation for individuals with diabetes. Thus, the clinical significance of the indications of a long-term glucose counter-regulation to hypoglycemia from the studies employing this study design remains unknown.
Healthy subjects’ insulin resistance studies
In the healthy subjects’ insulin resistance studies, insulin resistance in healthy subjects is evaluated as the glucose infusion rates needed for glycemia maintenance for a period after hypoglycemia and after hypoglycemia prevention. The study design is prospective and interventional.
The study design is employed in the studies by Attvall et al. (46) and Clore et al. (47).
In the healthy subjects’ insulin resistance study design, healthy subjects are subjected to a session of hypoglycemia induction by high insulin infusion rate (insulin clamp and blood glucose clamp) or to a control, normo- (from insulin clamp and blood glucose clamp via infusion with fixed insulin rate and varying glucose rate (46)) or hyperglycemia (blood glucose clamp via infusion with varying dextrose rate) (47)) session.
The glucose/dextrose infusion rates required for glycemia maintenance is the measure of insulin resistance. Each subject is exposed to both hypoglycemia and sustained euglycemia/mild hyperglycemia in random order (46) or during only one (47) of the sessions. Hypoglycemia induction time is in the morning (47).
Chapter 3: Literature overview
23
Hypoglycemia counter-regulatory hormones (glucagon, epinephrine, cortisol, growth hormone (46,47) and norepinephrine (47)) are measured before and after hypoglycemia. Blood sampling intervals are 20 (46) or 30 minutes (47), more frequently during hypoglycemia induction. The study period after hypoglycemia is 2 (46) to 8 (47) hours. The subjects are healthy volunteers and they are kept fasting throughout the entire study period.
According to the healthy subjects’ insulin resistance study design category, the long-term glucose counter-regulation hypothesis is supported by decreased insulin sensitivity (i.e. decreased glucose/dextrose requirements) after hypoglycemia compared with insulin sensitivity after normo- or mild hyperglycemia. Attvall and colleagues (46) found lower glucose requirements after hypoglycemia compared to the hypoglycemia-free case, whereas the required glucose infusion rates were similar prior to hypoglycemia. This is interpreted as an elevated insulin resistance following hypoglycemia compared with that following normoglycemia. Clore and colleagues (47) also found lower dextrose requirements after hypoglycemia as opposed to in the control period, however in different groups. For maintenance of the same blood glucose level, the dextrose infusion rate in the hypoglycemia group was slightly lower after hypoglycemia than before hypoglycemia. Thus, the results as one can be considered indicative of a higher insulin resistance following hypoglycemia than following non-hypoglycemia.
A major concern regarding the healthy subjects’ insulin resistance studies is the essential non-comparability of healthy subjects with diabetic subjects since impairment of hypoglycemia counter-regulatory mechanisms are common in diabetic populations (6,39,48-51). Also the use of different subjects in the hypoglycemia study group and the control study group is a weakness of the study design in the study by Clore and colleagues (47) due to the variations also observed in healthy subjects’ ability to counter-regulate hypoglycemia. This is especially profound as somatostatin is not infused for suppression of growth hormone, glucagon and insulin secretion, and variations in these hormones are therefore possible. Profound variations in these hormones are indicated by the very different and temporally varying C-peptide levels seen within the two groups of the study by Clore and co-workers (47). Especially in healthy subjects and in particular if not all subjects have been subjected to both hypoglycemia and control sessions, it is alluring to compare the glucose infusion rate needed before hypoglycemia to the one after hypoglycemia. Results from such analysis should be interpreted with great caution, however, as the sessions are separated in time so long, that infusion rates may be artificially elevated in the second clamp due to the fasting state, especially if somatostatin is not used for insulin and counter-regulatory hormones suppression.
Literature overview conclusion
A variety of study designs have been applied until now. The four different study design categories overviewed here include the following variations in addition to
Chapter 3: Literature overview
24
overall study design: patient selection, blood sampling frequency, hypoglycemia threshold, assays in addition to glucose, and others, as well as their varied results.
Definitely indicative of a long-term glucose counter-regulation to hypoglycemia are the prospective intervention studies in various design categories by Perriello and colleagues (43), Kollind and colleagues (45), Fowelin and colleagues (26), Attvall and colleagues (46), and Clore and colleagues (47). All have employed methods with different confounds. The same is the case for the retrospective observational studies in the nocturnal glycemia stratification design category by Havlin and Cryer (42), and Gale and colleagues, though their results are less indicative of a long-term glucose counter-regulation. The studies by Hoi-Hansen and colleagues (30), Guillod and colleagues (28), Stephenson and Schernthaner (31), Hirsch and colleagues (29), and Tordjman (32) and colleagues clearly suggest that a long-term glucose counter-regulation to hypoglycemia does not exist. Especially the very carefully conducted intervention glycemia control and true control study conducted by Hirsch and colleagues (29) raises a powerful voice against the existence of the long-term glucose counter-regulation to hypoglycaemia. This is due to its nearly ideal design, which employs a reliable interventional hypoglycemia prevention paradigm for hypoglycemia-free data collection, frequent blood sampling and a long study period. However, the analysis of induced hypoglycemia and the use of intravenous insulin infusions for hypoglycemia induction and a hypoglycemia reversal glucose dose prohibit immediate translation of the results to the real-life settings which led to the hypothesis of a long-term glucose counter-regulation to hypoglycemia.
From the different study designs and study protocols applied, it becomes evident that the different research groups expect different manifestations of the hypothesized long-term glucose counter-regulation to hypoglycemia, especially regarding its temporal characteristics. To exemplify this, short study durations of 4 hours in the studies by Hoi-Hansen and colleagues (30), Havlin and Cryer (42), Stephenson and Schernthaner (31) and Tordjman and colleagues (32) indicate that the researchers expect the long-term glucose counter-regulation to hypoglycemia to appear shortly after the long-term glucose counter-regulation. The negative findings of these groups may consequently be argued to indicate little about the hypothesized long-term glucose counter-regulation in general, but instead indicate clearly its lack of manifestation within 4 hours after hypoglycemia. This is supported further as, except from the work by Hirsch and colleagues (29), longer study durations after hypoglycemia seem to be correlated with results supporting the hypothesis of a long-term glucose counter-regulation to hypoglycemia. Another example is the rather rigid expectation of the manifestation of the long-term glucose counter-regulation to hypoglycemia as an absolute hyperglycemia compared to other, hypoglycemia free controls in the nocturnal glycemia stratification studies, which may be an explanation for the commonly found indications not supporting the hypothesis in studies of this type. From this, it is evident that study designs evolve from expectation of the manifestation of the
Chapter 3: Literature overview
25
hypothesized mechanism, and that the lack of consensus regarding the manifestation has been an important determinant of the study outcomes.
The previous work in the exploration of the hypothesized long-term glucose counter-regulation thus constitutes a relevant basis for further investigations as the study designs already employed have revealed advantages and pitfalls with different methods.
Chapter 3: Literature overview
26

Chapter 4: Methodological approach
27
4. Methodological approach The focus of this PhD-thesis is the long-term glucose counter-regulation to hypoglycemia. From the literature overview in the previous chapter it is evident that no optimum study design has been identified and applied and that this may have prevented proper investigation of the mechanism. The objective of the work presented in this thesis is therefore to explore different methodological approaches to examining the correlation between hypoglycemia and a long-term glucose counter-regulation to add to the knowledge of the relevance of long-term glucose counter-regulation to hypoglycemia in the real lives of diabetic patients.
Methodology requirements
The aim is to explore the correlation between hypoglycemia and the hypothesized long-term glucose counter-regulation, its magnitude, and its relevance in diabetic every-day life.
First, this requires the methodological approaches evaluated to be based on the direct comparison of blood glucose after hypoglycemia and blood glucose after no hypoglycemia. This is in contrast to comparison of insulin resistance in the diabetic and healthy subjects’ insulin resistance studies. Second, it requires for the methodological approaches in the work presented in this thesis to use the same groups as source of hypoglycemia and hypoglycemia-free control data. This is in contrast to the use of separate hypoglycemia and hypoglycemia-free control groups in the nocturnal blood glucose stratification studies. Third, it requires for the methodological approaches to the investigation to employ real life settings and an observational design. This is in contrast to the use of induced hypoglycemia in interventional studies. All three requirements may be employed in different study designs. However, the current lack of quantitative characterization of the mechanism, especially regarding temporal aspects (i.e., effect duration and delay before effect manifestation), should be considered independently of the study design.
The apparently ideal study
The methodology requirements identified above render one study design apparently ideal: Retrospective observational analysis of frequently measured glucose data collected in every-day lives of people with diabetes, comparing glycemia after spontaneous hypoglycemia with glycemia after hypoglycemia-free control. The subjects should have been instructed to live uniformly during the data collection period to ensure comparable hypoglycemia and control data. The current uncertainties concerning the temporal characteristics of the mechanism should be addressed by comparing the glucose for sufficiently long periods after hypoglycemic events.
Chapter 4: Methodological approach
28
Methodology requirement challenges
The apparently ideal study presented above has at least three pitfalls in terms of the actual conduction of the data collection, and each pitfall results in potential challenges for the data analysis:
Insufficient uniformity in each subject’s life during data collection for comparable background data (i.e., meals and insulin) in hypoglycemia and hypoglycemia-free data. This renders simple blood glucose profile comparison inappropriate.
Too frequent occurrences of hypoglycemia to allow for identification of control periods. This results in impossible comparison of blood glucose after hypoglycemia with hypoglycemia-free control blood glucose due to the non-existence of control periods.
Inappropriate and perhaps faulty or insufficiently detailed expectations regarding the long-term glucose counter-regulation to hypoglycemia leading to inappropriate data collection and inappropriate data analysis, for instance regarding the temporal characteristics and the co-effects of several hypoglycemic events within a short period of time. This causes the existing conditions for blood glucose profile comparison in hypoglycemia and non-hypoglycemia periods to be inappropriate.
Studies employed in the PhD-thesis
This PhD-thesis employs one study resembling the apparently ideal study design and one study for addressing each of the methodology requirement challenges.
The apparently ideal study design is employed by retrospective analysis of already collected continuous glucose monitoring (CGM) sensor data in type 1 diabetic patients living their every-day lives. In general, CGM glucose corresponds well to the blood glucose (52,53), thereby making the CGM technology appropriate for the apparently ideal study. Hypoglycemic events are identified along with corresponding hypoglycemia-free control periods, and the glucose following these paired periods are compared. This is presented in the paper “Retrospective analysis of the long-term glucose counter-regulation to hypoglycemia in continuous glucose data”.
To overcome the challenges caused by insufficient uniformity of each subject’s life, a method is developed for balancing unmatched background data by the use of a metabolic model. The method is intended for retrospective observational studies. The study is presented in the paper “Model-based balancing of unmatched data in model-generated hypothesis evaluation”. In this thesis, the study is referred to as the background data balancing study and the method is called the background data balancing method.
Solving the potential lack of control periods due to frequent hypoglycemic episodes, a method is employed to substitute control data using a metabolic
Chapter 4: Methodological approach
29
model that does not consider the effects of hypoglycemia suggested to be associated with the long-term glucose counter-regulation to hypoglycemia. In the analysis glucose sensor data for high temporal resolution in glucose data is used. This is a retrospective observational approach. The study is presented in the paper “CGM glucose overshoot after hypoglycemia assessed by a simulation tool”. It is referred to as the control data substitution study in this thesis.
The potential (or even likely) insufficient understanding of the long-term glucose counter-regulation to hypoglycemia to correctly manage the situations occurring in real life retrospectively (i.e. in observational studies) is addressed by the implementation of an animal model. The animal model can be used as a continuous, prospective source of data in which different glycemia combinations and correlated long-term glucose counter-regulations can be studied. A prerequisite for such detailed data collection is a very controlled environment, not achievable in human subjects. No specific study in such an animal model has been designed as it should be used for evaluating and refining various hypotheses and study designs regarding the long-term glucose counter-regulation to hypoglycemia. This can only be done when a suitable model is safely established in the laboratory. The implementation of the animal model is described in the paper “Implementation of an intensive chronic type 1 diabetes model with tight blood glucose control in Göttingen minipigs” and in the thesis it is referred to as the animal study.
Together these four studies assess a relevant range of methodological approaches to exploring the long-term glucose counter-regulation to hypoglycemia, despite the quantitative characteristics of the hypothesized mechanism not being established.
Chapter 4: Methodological approach
30
Chapter 5: Relevance of the methodological approach to other hypotheses rather than the long-term glucose counter-regulation to hypoglycemia
31
5. Relevance of the methodological approach to
other hypotheses rather than the long-term
glucose counter-regulation to hypoglycemia The long-term glucose counter-regulation to hypoglycemia is the core focus of this PhD-thesis. However, other hypotheses of the same nature may arise: hypotheses regarding the long-term correlation to a single, measurable result-variable profile of an event or behavior which occurs spontaneously (involuntarily) or intendedly in every-day life. This may be in diabetes or in other diseases or even in the healthy population.
For a description of the correlation between the hypothesized event or behavior and the hypothesized effect in every-day life, the notion of the apparently ideal methodological approach presented can be applied by retrospectively comparing the observed dependent result-variable profile after spontaneously or intended occurrence of the event or behavior to the dependent result-variable profile in the absence of the event or behavior.
However, the same challenges as described in the previous chapter may arise in the application of the apparently ideal methodological approach to a different hypothesis than the long-term glucose counter-regulation to hypoglycemia. The background data balancing model can be used in any field where both data and a suitable experimental model are available. This is also the case with the control data substitution method. When it comes to the case when previously collected data may be insufficient due to the lack of detailed knowledge on the hypothesized correlation and a continuous, prospective source of highly controlled data may be needed, an animal model will only be helpful in areas of disease or physiology which are carefully and definitively mimicked by the animal model.
In the field of type 1 diabetes, the methods explored in this thesis appear immediately applicable for investigation of exercise and alcohol and their correlation to glycemia; correlations that are currently not fully established.
Chapter 5: Relevance of the methodological approach to other hypotheses rather than the long-term glucose counter-regulation to hypoglycemia
32
33
STUDIES
This section of the thesis presents the four scientific works included. Each chapter corresponds to a study and a paper and is identical with the papers published or submitted except from abstract and list of references. Full papers are located after the bibliography

34
Chapter 6: Retrospective analysis of the long-term glucose counter-regulation to hypoglycemia in continuous glucose data (the apparently ideal study)
35
6. Retrospective analysis of the long-term
glucose counter-regulation to hypoglycemia in
continuous glucose data This chapter presents the apparently ideal study. The chapter is equivalent to the paper Retrospective analysis of the long-term glucose counter-regulation to hypoglycemia in continuous glucose data except from the abstract and bibliography, which is omitted in this chapter. The full paper can be found as paper number one in the end of the thesis. The full paper is of status “Submitted” to Journal of Diabetes Science and Technology by September 2008.
Introduction
Hypoglycemia-induced delayed hyperglycemia, first hypothesized by Somogyi in 1951, has received renewed interest (28,30). The recent interest is largely governed by the data resolution potential introduced by the continuous glucose monitoring (CGM) technologies, as these technologies enable reliable, long-term and very frequent sampling of glucose values comparable to blood glucose values (54,55).
Over the years, different labels have been applied to what is apparently the same phenomenon: ‘Somogyi phenomenon’, ‘Somogyi effect’ (26-33,35,56-61), ‘rebound hyperglycemia’ (62), and ‘long-term glucose counter-regulation to hypoglycemia’ (63). This paper uses the latter term.
Various study designs have been applied for analyzing long-term glucose counter-regulation to hypoglycemia (26-30,32,35,36,56,59,61,64-66). Study designs vary in hypoglycemia time, as some researchers have explored only nocturnal hypoglycemia, which is suggested to cause morning hyperglycemia (27-30,42,43,45), whereas others have not restricted themselves to nocturnal hypoglycemia (26,44,47,56,67). Study designs also vary regarding the extent of hyperglycemia, as some groups have considered only absolute hyperglycemia to indicate the existence of a long-term glucose counter-regulation to hypoglycemia (27,42,56), whereas other designs have considered hyperglycemia only relative to glucose values in cases with no preceding hypoglycemia (29,43-45). Finally, study designs vary regarding duration, as they range from rather short (0-6 hours) (27,30-32,47,56) to longer (8-24 hours) (29,42-44,61,68). Study designs have also varied due to different hypotheses regarding manifestations and due to practical methodological limitations, for instance regarding (blood) glucose sampling frequency.
A more cautious approach to the exploration of the long-term glucose counter-regulation to hypoglycemia may be a long-term analysis of high-resolution data with no assumptions regarding the time of day of the occurrence of hypoglycemia, but this has never been applied using the CGM technology.
Chapter 6: Retrospective analysis of the long-term glucose counter-regulation to hypoglycemia in continuous glucose data (the apparently ideal study)
36
This paper presents a retrospective analysis of a blood glucose sensor data set for the evaluation of a hypothesis of a long-term glucose counter-regulation to hypoglycemia, manifested as a delayed hyperglycemia relative to control, hypoglycemia-free glycemia.
Materials and methods
The study was conducted at four centers (Medical Department M, Aarhus University Hospital, Denmark; Profil Institute for Metabolic Research, Neuss; German Diabetes Research Institute at the Heinrich-Heine University of Duesseldorf; and Department of Pharmaceutical Technology and Biopharmacy, University Center of Pharmacy, University of Groningen, The Netherlands). The four centers participated in the clinical in vivo evaluation of the SCGM 1 system (Roche Diagnostics, Mannheim, Germany).
Patients who participated in the experiment were recruited from their respective outpatient clinics. Both type 1 and type 2 diabetics were included. The patients were encouraged to live their normal every-day lives with their normal therapy (primarily insulin), and they were further encouraged to perform the same amount of activities on all study days. They were not given access to CGM data during data collection.
All patients received written and oral information according to the Declaration of Helsinki II and signed consent forms. The study was approved by the local ethics committees of the four centers participating in the study and was performed according to Good Clinical Practice Guidelines.
SCGM 1 system
The SCGM 1 system is based on the glucose oxidase principle and consists of a sensor unit device and a belt-held sensor holding the microdialysis system. The system allows up to 120 hours of minutely dialysate glucose measurements. Data are stored by custom designed software, and on-line display of dialysate glucose is transferred wirelessly from the sensor unit to the portable data manager. Additional information (insulin administration, meals, exercise, etc.) can be entered as separate events in the data managing device. The sensor unit uses a roller pump that provides a push-pull flow, resulting in a perfusion of the microdialysis membrane with 0.3 µl/min. The perfusion fluid (Ringer chloride, Na+147 mmol/liter; K+ 1.4 mmol/liter; Ca2+ 2.3 mmol/liter; Cl- 156 mmol/liter, pH 6; osmolality 290 mosmol/kg) passes through the catheter, achieving approximately 95% equilibration with the interstitial fluid (69). Glucose oxidase is mixed with the dialysate and passes the ex vivo sensor, creating a current in the nanoampere range. The current is averaged over 60 seconds, and data are stored.
Study procedure
The microdialysis probe was inserted into the subcutaneous abdominal adipose tissue after skin puncture with a 16-gauge needle. The sensor was left in place for 4 days. For calibration of the SCGM 1 system, spot capillary glucose measurements were used.
Chapter 6: Retrospective analysis of the long-term glucose counter-regulation to hypoglycemia in continuous glucose data (the apparently ideal study)
37
Data analysis
The sensor glucose profiles were calibrated by fitting the paired meter data and sensor data to a line and adjusting the sensor data to the gain and offset identified by the fitting.
All hypoglycemic events were identified in the calibrated data. An episode of hypoglycemia was defined to be at least 15 minutes of sensor glucose ≤54 mg/dl, and at least 10 minutes of sensor glucose ≥54 mg/dl or missing data defined the end of a hypoglycemic episode. All episodes of missing data were identified in the uncalibrated data. A data missing episode was defined to be at least 10 minutes of missing data (the value 0 saved by the glucose sensor), and at least 10 minutes of non-missing data defined the end of a data missing episode. Near-hypoglycemic events for definitely hypoglycemia-free control periods, despite sensor inaccuracies, were defined to be at least 15 minutes of sensor glucose ≤72 mg/dl, and at least 10 minutes of sensor glucose ≥72 mg/dl or missing data defined the end of a near-hypoglycemic episode
Hypoglycemic events beginning ≤20 hours after the data collection start were excluded. Of the hypoglycemic events beginning >20 after the start of data collection, the hypoglycemias preceded by missing data episodes within 15 hours were excluded. Of the hypoglycemic events not preceded too recently by data collection start or missing data episodes, hypoglycemias preceded by any hypoglycemia (not necessarily without too recent data collection start or missing data episode) within 15 hours were excluded. Of the hypoglycemic events free of recent data start, missing data episodes or hypoglycemia, hypoglycemias followed by any hypoglycemia (not necessarily free of recent data collection start, missing data episodes, or hypoglycemia) within 15 hours were excluded. Control periods were identified at the same time of the day as the hypoglycemia to which they corresponded. Control periods were excluded if they occurred <20 hours before data collection start, or if they were preceded or followed by near-hypoglycemia or missing data episodes within 15 hours (from the time of candidate control period start).
Hypoglycemic events in subjects with no information on insulin injection during the data collection period were excluded, as were patients not treated with multiple insulin injections but with continuous subcutaneous insulin infusion (insulin pump).
For each hypoglycemia, the sensor glucose difference between hypoglycemia day and control day (control days, if more control days were found for a specific hypoglycemia) was calculated as hypoglycemia day sensor glucose minus control day sensor glucose.
Data calibration and hypoglycemia analysis was performed using Matlab (the Mathworks, Inc., Natick, MA). Hypoglycemia and control period data analysis was performed using the Excel spreadsheet program (Microsoft Corporation, Redmond, WA).
Results are given as mean ±SD (range).
Chapter 6: Retrospective analysis of the long-term glucose counter-regulation to hypoglycemia in continuous glucose data (the apparently ideal study)
38
Results
159 subjects were included of which 146 were diabetic (135 type 1 diabetic). Of the diabetics, 91 were male. Age was 36 ± 12 (17-72) years, diabetes duration 15 ± 10 (0-41) years. BMI was 24.9 ± 4.4 (17.9-44.5). HbA1C was 8.1 ± 1.7 (5.3-14.1). Only one subject was not treated with insulin, and 28 were on continuous subcutaneous insulin infusion.
In total, 134 hypoglycemic episodes were identified. Of the 134 hypoglycemic episodes, 36 were excluded because they occurred <20 hours before the start of data collection, none were excluded because they were preceded by missing data within 15 hours, 70 were excluded because they were preceded or followed by other hypoglycemias within 15 hours. This left 64 hypoglycemias for control period identification. There were 23 hypoglycemias in 20 subjects that had corresponding control periods. Of these, 11 hypoglycemias in 11 subjects (6 female) were supported by insulin data, but one female was treated with continuous subcutaneous insulin infusion and excluded. Thus, 10 patients (5 female) were included in the study. Four patients also had carbohydrate intake data. All 10 were type 1 diabetics. Age of included diabetics was 34 ± 12 (20-59), diabetes duration 16 ± 9 (7-34), BMI 24.6 ± 4 (20.4-34.0), HbA1C 7.9 ± 2 (6.1-10.9).
One hypoglycemia was nocturnal (12 pm – 6 am), one was before noon (6 am – 12 am), 7 were after noon (12 am – 6 pm) and one was in the evening (6 pm – 12 pm). No apparent difference in sensor glucose difference was seen with respect to hypoglycemia time.
Data for insulin injections and for carbohydrate intake, where recorded, is shown in table 1. Mean total carbohydrate intake after hypoglycemia was 152 g, in the control period 190 g (n=4). Mean total insulin intake after hypoglycemia was 38.6 IU, in the control period 32.9 IU (n=10).
There was no difference in long-acting insulin on intervention (hypoglycemia) and control periods.
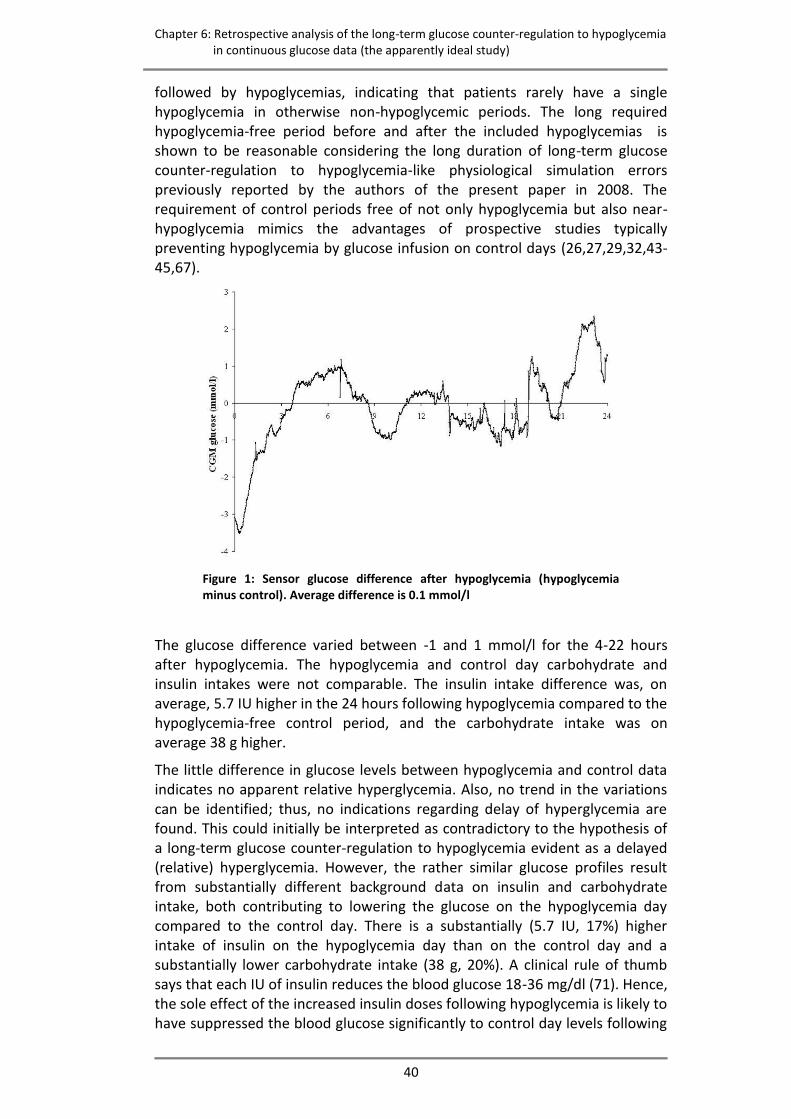
No difference was seen in sensor glucose (hypoglycemia minus control) (Figure 1).

Chapter 6: Retrospective analysis of the long-term glucose counter-regulation to hypoglycemia in continuous glucose data (the apparently ideal study)
39
Table 1: Injected short acting insulin (IU) and carbohydrate intake (g) during 24 hours of intervention or control in 2-hour time slots
Time slot, hours after hypoglycemia time
Sub- ject
Event 0-2 2-4 4-6 6-8 8-10 10-12
12-14
14-16
16-18
18-20
20-22
22-24
Sum
1
CHO-H Ins-H
1
CHO-C Ins-C
1
30 8
20 4 70 15
60 12 60 12
80 18 85 24
200 42 215 51
2
CHO-H Ins-H
2
CHO-C1 Ins-C1
2
CHO-C2 Ins-C2
2
50 14 50 13 70 13
30 10 15
10 10 20
16 60 16 60 16
10 35 20
40
60 16
10 50 16 50 18
30
170 46 285 45 235 47
3
CHO-H Ins-H CHO-C1 Ins-C1
36 8
2
102
12 12
1
1
2
48 11
2
- -
- -
- -
24 2
2
- -
- -
72 23 48
m
23m
4
CHO-H Ins-H
1
CHO-C1 Ins-C1
1
15 55 12 55
30 65 14 65 12
12 50
30
165 38 200 12
5 Ins-H
1
Ins-C11
Ins-C21
12 12 12
8 8 8
-
10 10 -
30 30 20
m
6
Ins-H1
Ins-C11
Ins-C21
8 8 8
10
8 8 -
2 -
6 -
8 -
-
24 24 18
m
7 Ins-H
1
Ins-C1
8
10 9
8
4 4
8 8
6
8 44 29
8
Ins-H1
Ins-C11
Ins-C21
8 8 8
8
8 8
4 4 8
20 20 24
9
Ins-H1
Ins-C11
Ins-C21
10
12
6 10 12 16
22 6
12 10
48 36 32
10
Ins-H Ins-C1 Ins-C2
121 2
1
111
51
10
1
4
1
1
1 10
2 6
1
81
21
51
10
1
161
21
41 32 21
–H: hypoglycaemia (intervention), –C1 (and –C2, if two control periods were found): control period(-s)
1 Regular insulin,
2 Humalog insulin
- No data due to short data collection period, m
Total period includes missing insulin and/or meal data.
Discussion
This study employs a retrospective analysis of blood glucose sensor data set for the evaluation of a hypothesis of a long-term glucose counter-regulation to hypoglycemia. The hyperglycemia manifesting the long-term glucose counter-regulation to hypoglycemia was expected to be delayed and to appear relative to the glycemia in control, hypoglycemia-free cases rather than in absolute terms.
The occurrence of hypoglycemia corresponds to the prevalence of hypoglycemia detected by continuous glucose monitoring systems in unspecific patient groups (70). The included number of hypoglycemic events, however, is low and arises from the exclusion of hypoglycemias preceded or
Chapter 6: Retrospective analysis of the long-term glucose counter-regulation to hypoglycemia in continuous glucose data (the apparently ideal study)
40
followed by hypoglycemias, indicating that patients rarely have a single hypoglycemia in otherwise non-hypoglycemic periods. The long required hypoglycemia-free period before and after the included hypoglycemias is shown to be reasonable considering the long duration of long-term glucose counter-regulation to hypoglycemia-like physiological simulation errors previously reported by the authors of the present paper in 2008. The requirement of control periods free of not only hypoglycemia but also near-hypoglycemia mimics the advantages of prospective studies typically preventing hypoglycemia by glucose infusion on control days (26,27,29,32,43-45,67).
Figure 1: Sensor glucose difference after hypoglycemia (hypoglycemia minus control). Average difference is 0.1 mmol/l
The glucose difference varied between -1 and 1 mmol/l for the 4-22 hours after hypoglycemia. The hypoglycemia and control day carbohydrate and insulin intakes were not comparable. The insulin intake difference was, on average, 5.7 IU higher in the 24 hours following hypoglycemia compared to the hypoglycemia-free control period, and the carbohydrate intake was on average 38 g higher.
The little difference in glucose levels between hypoglycemia and control data indicates no apparent relative hyperglycemia. Also, no trend in the variations can be identified; thus, no indications regarding delay of hyperglycemia are found. This could initially be interpreted as contradictory to the hypothesis of a long-term glucose counter-regulation to hypoglycemia evident as a delayed (relative) hyperglycemia. However, the rather similar glucose profiles result from substantially different background data on insulin and carbohydrate intake, both contributing to lowering the glucose on the hypoglycemia day compared to the control day. There is a substantially (5.7 IU, 17%) higher intake of insulin on the hypoglycemia day than on the control day and a substantially lower carbohydrate intake (38 g, 20%). A clinical rule of thumb says that each IU of insulin reduces the blood glucose 18-36 mg/dl (71). Hence, the sole effect of the increased insulin doses following hypoglycemia is likely to have suppressed the blood glucose significantly to control day levels following
Chapter 6: Retrospective analysis of the long-term glucose counter-regulation to hypoglycemia in continuous glucose data (the apparently ideal study)
41
hypoglycemia. Despite hypoglycemia and control day non-comparability regarding carbohydrate and insulin intake, we therefore interpret the results as indicative of a long-term glucose counter-regulation to hypoglycemia. Comparability of independent variables on hypoglycemia and control days is not ensured in a substantial part of the previous studies of the long-term glucose counter-regulation to hypoglycemia. This may explain the negative findings of the effect, at least in some studies. However, doses and times of insulin injections are reported to be the same in the study by Hirsch and colleagues (29), and non-comparability of insulin background data can thus not explain the negative finding of a long-term glucose counter-regulation. It should be noted that the hypoglycemias studied by Hirsch and colleagues (29) were nocturnal and induced, while the hypoglycemias in the current study were primarily in the daytime and occurred spontaneously. Reactions to induced hypoglycemia, especially in patients where regular subcutaneous insulin injections have been discontinued before the study, may be disrupted by a different native pattern of hypoglycemia. It appears, therefore, that a reasonable approach is to investigate only spontaneous hypoglycemias, as in the current study and in the studies conducted by Høi-Hansen and co-workers (30), Guillod and co-workers (28), Gale and co-workers (27), Stephenson and Schernthaner (31), Havlin and co-workers (42), or to investigate induced hypoglycemias only in patients with hypoglycemia that is also evident on an intervention-free control period, as in the study by Hirsch and co-workers (29).
The limited number of hypoglycemic events included and the lack of comparable data in hypoglycemia and control days in this study underline the weakness of retrospective analysis of phenomena such as the long-term glucose counter-regulation to hypoglycemia, even in large data sets. Further work in the exploration of the long-term glucose counter-regulation to hypoglycemia should thus approach this limitation and carefully design data collection that takes into consideration comparability of days and the influence of native hypoglycemia patterns.
Conclusions
The CGM glucose after hypoglycemia was similar to the CGM glucose in hypoglycemia-free control periods, but larger insulin doses and smaller meals after hypoglycemia indicate that the hypothesis of a long-term glucose counter-regulation to hypoglycemia cannot be rejected but is justified for further research.
Chapter 6: Retrospective analysis of the long-term glucose counter-regulation to hypoglycemia in continuous glucose data (the apparently ideal study)
42
Chapter 7: Model-based balancing of unmatched data in model-generated hypothesis evaluation
(the background data balancing study)
43
7. Model-based balancing of unmatched data in
model-generated hypothesis evaluation This chapter presents the background data balancing method. The chapter is equivalent to the paper Model-based balancing of unmatched data in model-generated hypothesis evaluation except from the abstract and bibliography, which is omitted in this chapter. The full paper can be found as paper number two in the end of the thesis in the form that is published in the proceedings of SHI/term konferansen 2008 .
Introduction
Pharmacokinetic models, including physiological models of human metabolism of a wide range of endogenous compounds, have been developed to aid patients, health care professionals and researchers in monitoring, adjusting and developing treatments.
Observation of systematic deviations in the simulations of such models can generate hypotheses if prominent deviations from data occur exclusively and consistently in relation to one particular event. We have previously used a physiological model of the human carbohydrate metabolism in diabetes as a generator of hypotheses regarding the effect of alcohol (72) and hypoglycemia (unpublished data).
Evaluation of a deviation-related hypothesis can be performed in at least two ways: comparing intervention data (including the event of interest) and control data (not including the event of interest), and comparing intervention data (including the event of interest) with model simulations. The first approach, comparing two data groups, requires the groups to be extensively comparable as regards all other independent variables/event than the one of interest. This similarity may be only scarcely achieved in data collected from patients living their everyday lives, an approach often preferred over controlled, in-hospital experiments due to cost minimization and patient convenience, if patients comply inadequately with instructions regarding their behavior during the experimental period. Incomparability of control data with intervention data precludes reliable interpretation of any significant difference as resulting from the event of interest. Conventional comparison of intervention data with control data may thus not be appropriate for evaluation of deviation-related hypotheses. The second approach, comparing data with model simulations, requires the model to include all relevant independent variables except for the one of interest. This requirement is difficult to meet in practice, as model complexity and computability are opposites. Insufficient model complexity precludes reliable interpretation of any significant difference as resulting from the event of interest, as in the case of incomparable intervention and control data. Thus, both approaches have their imperfections.
Chapter 7: Model-based balancing of unmatched data in model-generated hypothesis evaluation
(the background data balancing study)
44
The aim of this paper is to present a novel model-based method for evaluation of hypotheses when intervention data and control data are not comparable regarding independent variables.
Method outline
The method utilizes comparison of deviations of dependent variables in data from model simulations. The basis of the method is to use simulations from a model as expectancies and by these cancel out deviations between intervention and control data that originate from differences in independent variables. Hereby, only those deviations originating from the investigated event or behavior affect the result, and the imperfections of the purely data-based approach to deviation-related hypothesis evaluation are addressed. Using model simulations as expectancies for both intervention and control data addresses the imperfections of the model-based approach to deviation-related hypothesis evaluation, as systematic errors in model simulations will be present in both expectancies and thereby cancelled out.
For each includable incident of the investigated event or behavior, a model simulation is calculated for intervention and control periods, Si and Sc, respectively, from input of independent variables. These model simulations serve as expectancies that include no incidences of the investigated event or behavior, as the event or behavior is not considered by the model.
The deviation from the model simulation is calculated for both intervention data and control data as Di and Dc, as data minus model simulation in Devi and Devc:
iii SDDev (1)
ccc SDDev (2)
The deviations in Equations (1) and (2) constitute measures of error, error being all aspects included in the data but not included in the model. Thus, the deviation is due to the errors ei and ec as described in Equations (3) and (4):
iii eSD (3)
ccc eSD (4)
where ei and ec are systematic errors in the model. If the independent variables are reasonably similar, the systematic errors are comparable. However, the error component arising from the event or behavior described by the tested hypothesis, ehypothesis, contributes only to ei, not ec:
hypothesisci ece (5)
The error component arising from the event or behavior described by the tested hypothesis is then calculated for each includable incident by re-arranging Equation (5) and combining Equations (1)-(4):
Chapter 7: Model-based balancing of unmatched data in model-generated hypothesis evaluation
(the background data balancing study)
45
)( cciicihypothesis SDSDDevDeve (6)
This difference is a measure of aspects represented in the intervention data (and not in the model) but not in the control data (nor in the model). The differences resulting from all included incidences of the investigated event or behavior can then be analyzed using normal statistical methods. Equation (6) thus describes the calculations involved in the method.
As its primary assumption, the method for comparison of initially non-comparable intervention and control data assumes similarity of all independent variables not included in the model in both intervention and control data for each incident of the investigated event or behavior.
Method evaluation and example use
To illustrate the method, example use of it has been performed on the hypothesis of a long-term glucose counter-regulation to hypoglycemia in diabetes suggested by Hejlesen et al. (73). The hypothesis describes that a hypoglycemic event causes a hyperglycemia relative to if no hypoglycemic event occurred. The hyperglycaemia is hypothesized to onset 6-8 hours after hypoglycemia and to wear off approximately 24 hours after hypoglycemia (73).
Example use of the method outlined above involves comparison of posthypoglycemia blood glucose data with corresponding simulations of blood glucose in two patients. A system for continuous glucose monitoring (CGM) was used as blood glucose data source, and DiasNet (19,74) was used as the source of model simulations.
CGM data (CGMS®, Medtronic-MiniMed, Northridge, California) was collected in type 1 diabetic patients living their everyday lives.
Simulations were performed inputting all meal and insulin data and glucose data from the CGM data sampled at the time of hypoglycemia, and 60 and 120 minutes before and after the hypoglycemia (the time of hypoglycemia in control data). Calculations, except from DiasNet simulations, were performed using Microsoft Office Excel 2003 (Microsoft Corporation, CA).
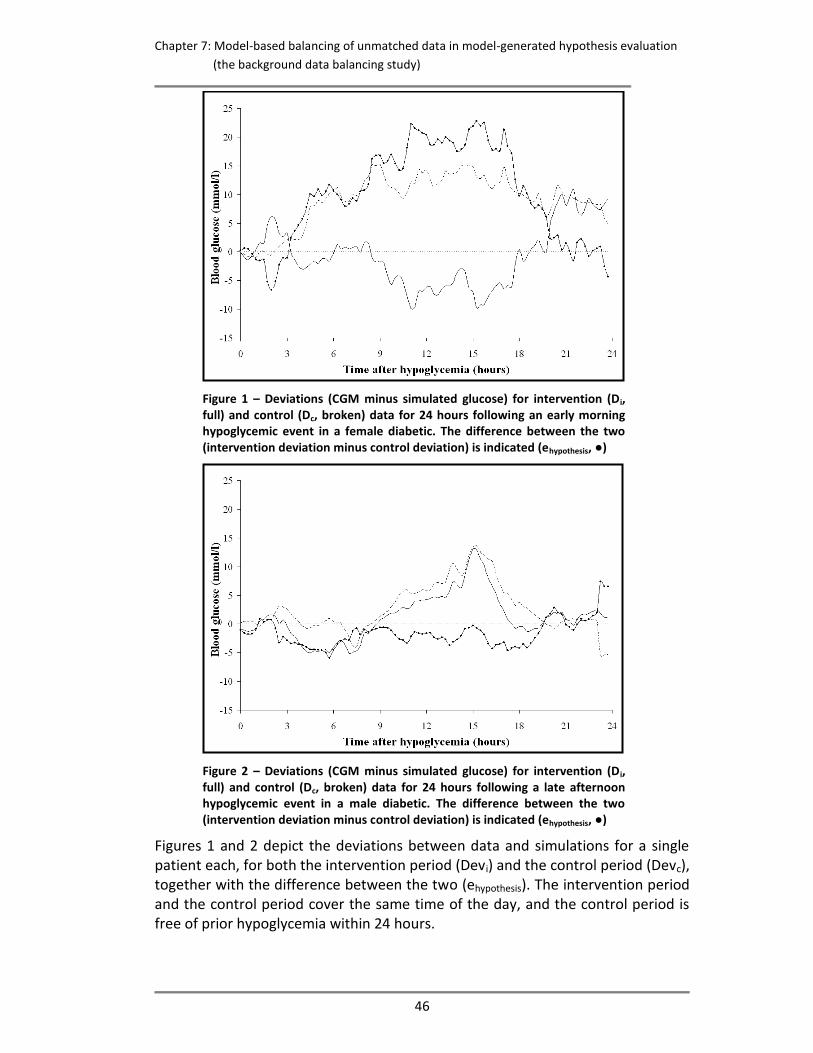
Chapter 7: Model-based balancing of unmatched data in model-generated hypothesis evaluation
(the background data balancing study)
46
Figure 1 – Deviations (CGM minus simulated glucose) for intervention (Di, full) and control (Dc, broken) data for 24 hours following an early morning hypoglycemic event in a female diabetic. The difference between the two (intervention deviation minus control deviation) is indicated (ehypothesis, ●)
Figure 2 – Deviations (CGM minus simulated glucose) for intervention (Di, full) and control (Dc, broken) data for 24 hours following a late afternoon hypoglycemic event in a male diabetic. The difference between the two (intervention deviation minus control deviation) is indicated (ehypothesis, ●)
Figures 1 and 2 depict the deviations between data and simulations for a single patient each, for both the intervention period (Devi) and the control period (Devc), together with the difference between the two (ehypothesis). The intervention period and the control period cover the same time of the day, and the control period is free of prior hypoglycemia within 24 hours.
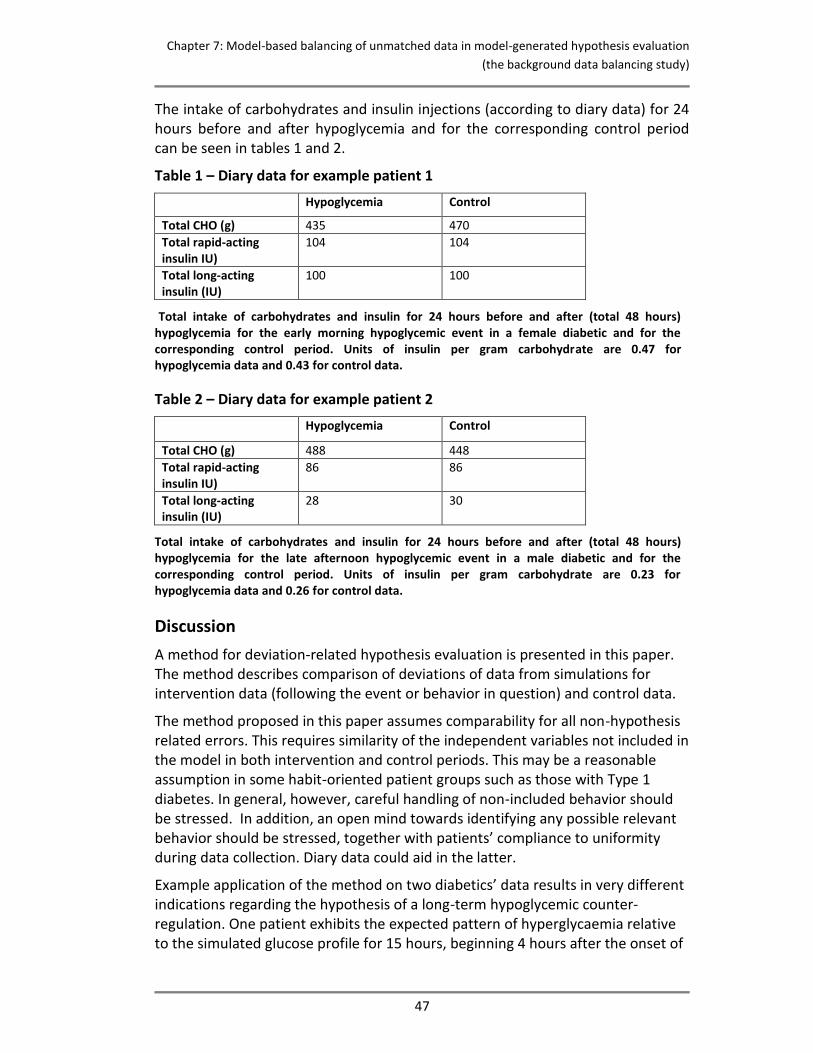
Chapter 7: Model-based balancing of unmatched data in model-generated hypothesis evaluation
(the background data balancing study)
47
The intake of carbohydrates and insulin injections (according to diary data) for 24 hours before and after hypoglycemia and for the corresponding control period can be seen in tables 1 and 2.
Table 1 – Diary data for example patient 1
Hypoglycemia Control
Total CHO (g) 435 470
Total rapid-acting insulin IU)
104 104
Total long-acting insulin (IU)
100 100
Total intake of carbohydrates and insulin for 24 hours before and after (total 48 hours) hypoglycemia for the early morning hypoglycemic event in a female diabetic and for the corresponding control period. Units of insulin per gram carbohydrate are 0.47 for hypoglycemia data and 0.43 for control data.
Table 2 – Diary data for example patient 2
Hypoglycemia Control
Total CHO (g) 488 448
Total rapid-acting insulin IU)
86 86
Total long-acting insulin (IU)
28 30
Total intake of carbohydrates and insulin for 24 hours before and after (total 48 hours) hypoglycemia for the late afternoon hypoglycemic event in a male diabetic and for the corresponding control period. Units of insulin per gram carbohydrate are 0.23 for hypoglycemia data and 0.26 for control data.
Discussion
A method for deviation-related hypothesis evaluation is presented in this paper. The method describes comparison of deviations of data from simulations for intervention data (following the event or behavior in question) and control data.
The method proposed in this paper assumes comparability for all non-hypothesis related errors. This requires similarity of the independent variables not included in the model in both intervention and control periods. This may be a reasonable assumption in some habit-oriented patient groups such as those with Type 1 diabetes. In general, however, careful handling of non-included behavior should be stressed. In addition, an open mind towards identifying any possible relevant behavior should be stressed, together with patients’ compliance to uniformity during data collection. Diary data could aid in the latter.
Example application of the method on two diabetics’ data results in very different indications regarding the hypothesis of a long-term hypoglycemic counter-regulation. One patient exhibits the expected pattern of hyperglycaemia relative to the simulated glucose profile for 15 hours, beginning 4 hours after the onset of
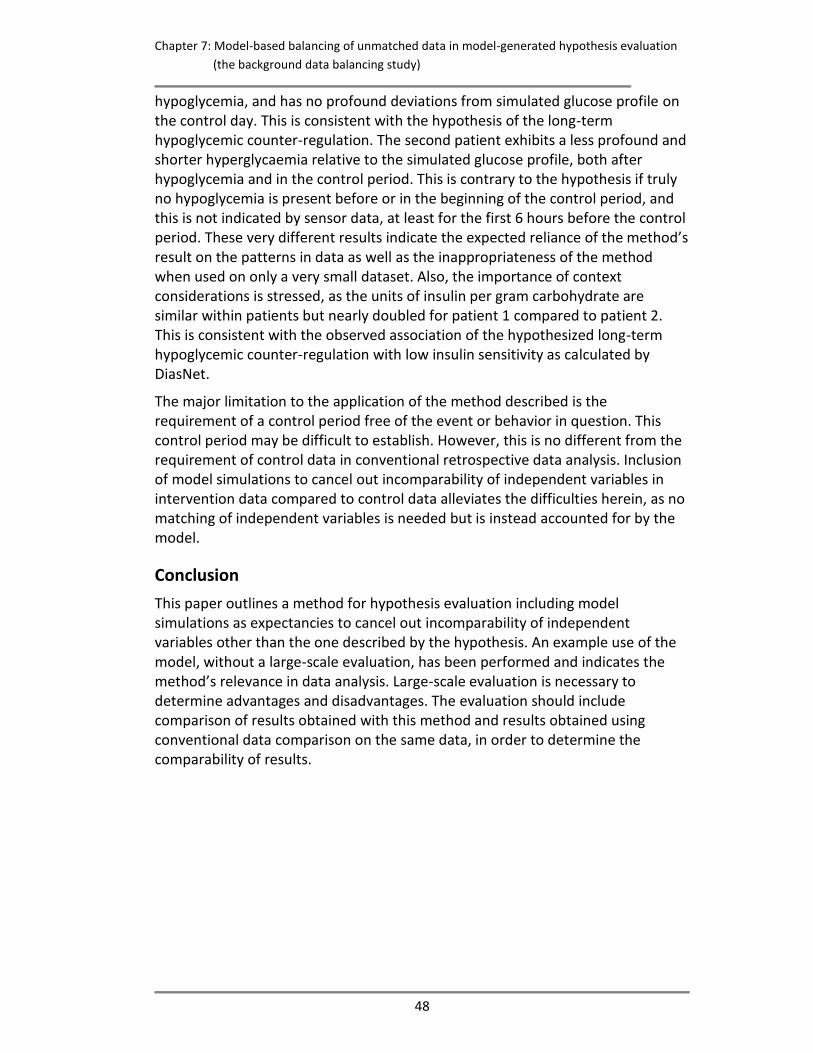
Chapter 7: Model-based balancing of unmatched data in model-generated hypothesis evaluation
(the background data balancing study)
48
hypoglycemia, and has no profound deviations from simulated glucose profile on the control day. This is consistent with the hypothesis of the long-term hypoglycemic counter-regulation. The second patient exhibits a less profound and shorter hyperglycaemia relative to the simulated glucose profile, both after hypoglycemia and in the control period. This is contrary to the hypothesis if truly no hypoglycemia is present before or in the beginning of the control period, and this is not indicated by sensor data, at least for the first 6 hours before the control period. These very different results indicate the expected reliance of the method’s result on the patterns in data as well as the inappropriateness of the method when used on only a very small dataset. Also, the importance of context considerations is stressed, as the units of insulin per gram carbohydrate are similar within patients but nearly doubled for patient 1 compared to patient 2. This is consistent with the observed association of the hypothesized long-term hypoglycemic counter-regulation with low insulin sensitivity as calculated by DiasNet.
The major limitation to the application of the method described is the requirement of a control period free of the event or behavior in question. This control period may be difficult to establish. However, this is no different from the requirement of control data in conventional retrospective data analysis. Inclusion of model simulations to cancel out incomparability of independent variables in intervention data compared to control data alleviates the difficulties herein, as no matching of independent variables is needed but is instead accounted for by the model.
Conclusion
This paper outlines a method for hypothesis evaluation including model simulations as expectancies to cancel out incomparability of independent variables other than the one described by the hypothesis. An example use of the model, without a large-scale evaluation, has been performed and indicates the method’s relevance in data analysis. Large-scale evaluation is necessary to determine advantages and disadvantages. The evaluation should include comparison of results obtained with this method and results obtained using conventional data comparison on the same data, in order to determine the comparability of results.
Chapter 8: CGM glucose overshoot after hypoglycemia assessed by a simulation tool (the control data substitution study)
49
8. CGM glucose overshoot after hypoglycemia
assessed by a simulation tool
This chapter presents the control data substitution study. The chapter is equivalent to the paper CGM glucose overshoot after hypoglycemia assessed by a simulation tool except from the abstract and bibliography, which is omitted in this chapter. The full paper can be found as paper number three in the end of the thesis. The full paper is of status “Submitted” to Journal of Diabetes Science and Technology by September 2008.
Introduction
People with Type 1 diabetes mellitus must take over the regulation of blood glucose from the pancreas in order to avoid acute or chronic complications due to abnormal blood glucose levels. This is achieved primarily by balancing insulin injections, meals, and exercise. Suboptimal blood glucose control with frequent or persistent episodes of hyperglycemia, leads to a substantially increased risk of long-term complications, such as micro- and macro vascular diseases (8). Intensive control of the blood glucose, however, may increase the frequency and severity of hypoglycemia(8), which for many patients is the most feared complication to diabetes (9,10).
To a large extent, the patient has to take responsibility for managing the diabetes (11-14). Quite apart from economic considerations, it is not practical for specialists to manage patients’ diabetes on a day to day basis (14). Various approaches intended to facilitate patients’ everyday decisions have been suggested, ranging from didactic lectures to interactive computer programs (15). Among these computer programs are computer-based decision support systems such as DiasNet (19), AIDA (20), and Libraa (21), all of which have been developed for both educational (general) and advisory (specific) purposes. These decision-support systems all simulate a blood glucose profile from input data on meals and insulin doses, some of which are on a patient-specific basis (19,21,22) and some from information on physical activity (21).
The DiasNet simulation tool is based on a metabolic model, implemented as a compartment model of human glucose metabolism and insulin kinetics in a Bayesian network (19). The tool has been tested in diabetes clinics in Italy, Denmark and England and has been shown to help improve control in patients with poorly controlled diabetes (75). A study has indicated that systematic errors in the metabolic model in hypoglycemia free data are small compared to the day-to-day variation of blood glucose seen in diabetes (22).
It should be noted, however, that these rather encouraging results were based on a basic model, implementing only basal, normal physiology and not taking into account the broad range of events or conditions that may affect blood glucose concentrations and which may be necessary to fully describe and predict blood
Chapter 8: CGM glucose overshoot after hypoglycemia assessed by a simulation tool (the control data substitution study)
50
glucose metabolism. These include alcohol intake, exercise, disease/fever and hypoglycemic episodes. The importance of a particular event or situation and its impact on physiology can be assessed with a simulation tool by comparing blood glucose simulations with actual measurements taken where the event or situation is present and precisely documented, and where the simulation tool is accurate in implementing all known relevant physiology. Substantial deviation of actual data from the simulations would indicate that physiological mechanisms are affecting the data but not the simulations, implying that not all relevant physiology is implemented in the model. In this way, systematic deviations of data from model simulations can be used to generate hypotheses. We have earlier used this approach to investigate the importance of alcohol intake (72).
We have previously reported that in SMBG data with episodes of hypoglycemia, measured blood glucose levels are consistently greater than the levels simulated by the model for a period of 10-12 hours, beginning 6-8 hours after hypoglycemic episodes (73). This systematic discrepancy is seen only in data following hypoglycemia, supporting the hypothesis that hypoglycemia leads to a long-term counter-regulatory effect of some sort. This phenomenon has been recognized for many years and was originally described by Somogyi. It was studied by several groups in the 1980s and 1990s (27,29,32,56). Taken together, the findings have been inconclusive, due probably to discrepancies in the studies’ hypotheses regarding the temporal characteristics of the hyperglycemic response and in study design and patient selection. Currently, the long-term glucose counter-regulation to hypoglycemia is omitted from or even refuted in medical and diabetes textbooks.
In the present work, we describe long-term post-hypoglycemic glucose discrepancy between data and simulations using glucose sensor data in order to ensure maximum resolution in glucose data.
Materials and methods
Study design
We retrospectively analyzed continuous glucose profiles (48-120 hours) by calculating the deviation in simulated (DiasNet) blood glucose profiles compared to measured CGM (CGMS®, Medtronic-MiniMed, Northridge, California) glucose profiles after hypoglycemic episodes. The study was approved by the local ethics committee.
Patients
17 Type 1 diabetics with poorly controlled diabetes (judged by their diabetologist) from the diabetes clinic at the Royal Bournemouth Hospital, England were included after giving written informed consent. The diabetics were referred to the study if the clinic’s diabetologist assessed that there was a clinical indication for continuous glucose monitoring. The mean age of the subjects was 39.5 years (range: 25-63 years). Mean diabetes duration was 11.1 years (range: 3-42 years).
Chapter 8: CGM glucose overshoot after hypoglycemia assessed by a simulation tool (the control data substitution study)
51
Mean BMI was 25.5 (range: 18.6-30.0). All subjects had multiple daily injections of insulin. Mean daily dose of short-acting insulin (primarily Humalog, Eli Lilly) was 34.5 IU (range: 10-56 IU), and mean daily dose of long-acting insulin (Humulin NPH, Eli Lilly or Insulatard, Novo Nordisk or Lantus, Sanofi-Aventis) was 19.5 IU (range: 8-50).
Diary
The patients were instructed to maintain a diary regarding all meals (grams of carbohydrates and time of ingestion) and all insulin injections (units of insulin and time of injection) for three days and to do at least 4 daily capillary blood glucose measurements with their regular glucose meters. The diary should include any meal or insulin related action taken in connection with hypoglycemia. The patients were instructed to live as close to their everyday lives as possible, despite the sensor.
CGM data
A continuous glucose sensor (CGMS®, Medtronic-MiniMed, Northridge, California) was inserted into the subcutaneous fat in the peri-umbilical region, using the insertion needle provided with the sensor. The sensor utilizes the principle of glucose oxidase for its measurements. The sensor was left in place for three to five days for collection of data. The sensor data was transferred to a PC using the data transfer tool from the manufacturer. The patients were not able to see the CGM measurements during the collection period.
Data analysis and statistics
The sensor data was calibrated using the Medtronic MiniMed CGMS® software, which is recommended to be used with at least 4 capillary blood glucose measurements (SMBG) per day. We regarded days of CGM data as valid if the number of measurements available for calibration ranged from 2 to 7 (8 if a nocturnal (0 am-6 am) measurement was present). The lower limit of 2 was the absolute minimum, as at least 2 measurements are needed in order to determine off-set and gain in the Medtronic MiniMed CGMS® calibration algorithm. The upper limit was set to 7 (or 8), as diabetics doing frequent SMBG do up to 7 (eventually 8, including a nocturnal) blood glucose measurements per day. Hereby the included patients, while instructed to do only 4 daily measurements, may actually have done up to 7 (or 8), and the additional measurements could indicate special situations that might compromise the validity of the sensor data. Time with missing (or low voltage) sensor signal was excluded as invalid.
Hypoglycemic episodes were identified in the valid CGM data. We defined an episode of hypoglycemia to consist of at least 4 consecutive measurements (equivalent to 20 minutes) below 63 mg/dl. The beginning of the hypoglycemic episode was defined as the first measurement below 63 mg/dl and the end of the hypoglycemic episode as the last measurement below 63 mg/dl before at least 3 measurements equal to or above 63 mg/dl. Episodes of hypoglycemia preceded by confirmed or possible hypoglycemic episodes up to 20 hours beforehand were
Chapter 8: CGM glucose overshoot after hypoglycemia assessed by a simulation tool (the control data substitution study)
52
excluded in order to avoid interference from the long-term effects of hypoglycemia on simulation error investigated in this study. Thus, hypoglycemic episodes within 20 hours after sensor insertion or lack of data or data invalidity were excluded. CGM data were averaged every 15 minutes (equivalent to every three CGM glucose measurements) in order to obtain the same temporal resolution of CGM data as of simulated glucose data.
The DiasNet simulation tool (19) was used to calculate glucose profiles that could be used as ‘control data’ when analyzing the hypoglycemia data collected by CGM. The input to the model is the diary data: meals (grams of carbohydrates and time of ingestion) and insulin injections (units of insulin and time of injection). The simulation model is calibrated to each individual patient using a few glucose measurements as described below. The output is blood glucose profiles calculated in 15 minute steps based on state-of-the-art knowledge of normal physiology. According to simulation theory, since the simulation tool calculates the average expected blood glucose for each patient, the intra-patient variation in the control data is cancelled or reduced significantly and since the model is calibrated to each individual patient the inter-patient variation in the control data is cancelled or reduced significantly. It should be noted, that also the potential effect of different insulin types on the inter-patient variation is cancelled or reduced significantly by a simulation model implementing average insulin absorption profiles for each type of insulin. This reduction in intra-patient and inter-patient variation in the simulated control data implies that valid results can be produced with a smaller number of hypoglycemic events in the CGM dataset.
A simulated glucose profile, the simulated control data, was calculated for the entire data period for each included episode of hypoglycemia. For each of these episodes, the input was all diary-reported meals and insulin injections for the entire data period. The simulation model was calibrated to each patient using five measurements from the glucose sensor (each constituted by an average of three CGM glucose measurements) around the hypoglycemic episode (one and two hours before the beginning of the episode, at the beginning of the episode, and one and two hours after the beginning of the episode) to adjust the metabolic model to the specific patient. This adjustment is carried out with a patient-specific model parameter, the so-called insulin sensitivity, which is estimated automatically by the DiasNet simulation tool.
CGM and simulated glucose profiles were compared for 24 hours after hypoglycemic episodes. The average CGM and simulated glucose profiles were compared using Student’s one-sided t-test. All analysis was performed using the Excel spreadsheet program (Microsoft Corporation, Redmond, WA).
Results are given as mean±SD.
Results
Total monitoring time was 54 days, valid monitoring time 45 days. Periods of non-valid monitoring were caused by missing (or low-voltage) sensor signals (15 hours)
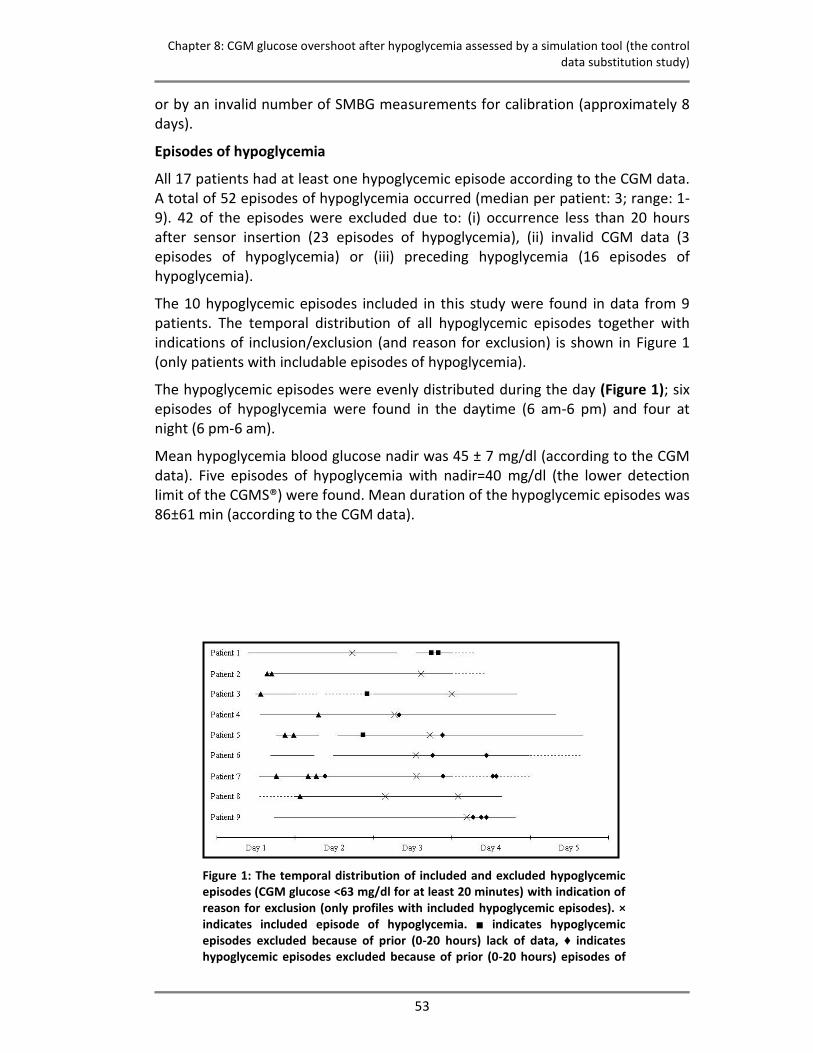
Chapter 8: CGM glucose overshoot after hypoglycemia assessed by a simulation tool (the control data substitution study)
53
or by an invalid number of SMBG measurements for calibration (approximately 8 days).
Episodes of hypoglycemia
All 17 patients had at least one hypoglycemic episode according to the CGM data. A total of 52 episodes of hypoglycemia occurred (median per patient: 3; range: 1-9). 42 of the episodes were excluded due to: (i) occurrence less than 20 hours after sensor insertion (23 episodes of hypoglycemia), (ii) invalid CGM data (3 episodes of hypoglycemia) or (iii) preceding hypoglycemia (16 episodes of hypoglycemia).
The 10 hypoglycemic episodes included in this study were found in data from 9 patients. The temporal distribution of all hypoglycemic episodes together with indications of inclusion/exclusion (and reason for exclusion) is shown in Figure 1 (only patients with includable episodes of hypoglycemia).
The hypoglycemic episodes were evenly distributed during the day (Figure 1); six episodes of hypoglycemia were found in the daytime (6 am-6 pm) and four at night (6 pm-6 am).
Mean hypoglycemia blood glucose nadir was 45 ± 7 mg/dl (according to the CGM data). Five episodes of hypoglycemia with nadir=40 mg/dl (the lower detection limit of the CGMS®) were found. Mean duration of the hypoglycemic episodes was 86±61 min (according to the CGM data).
Figure 1: The temporal distribution of included and excluded hypoglycemic episodes (CGM glucose <63 mg/dl for at least 20 minutes) with indication of reason for exclusion (only profiles with included hypoglycemic episodes). × indicates included episode of hypoglycemia. ■ indicates hypoglycemic episodes excluded because of prior (0-20 hours) lack of data, ♦ indicates hypoglycemic episodes excluded because of prior (0-20 hours) episodes of
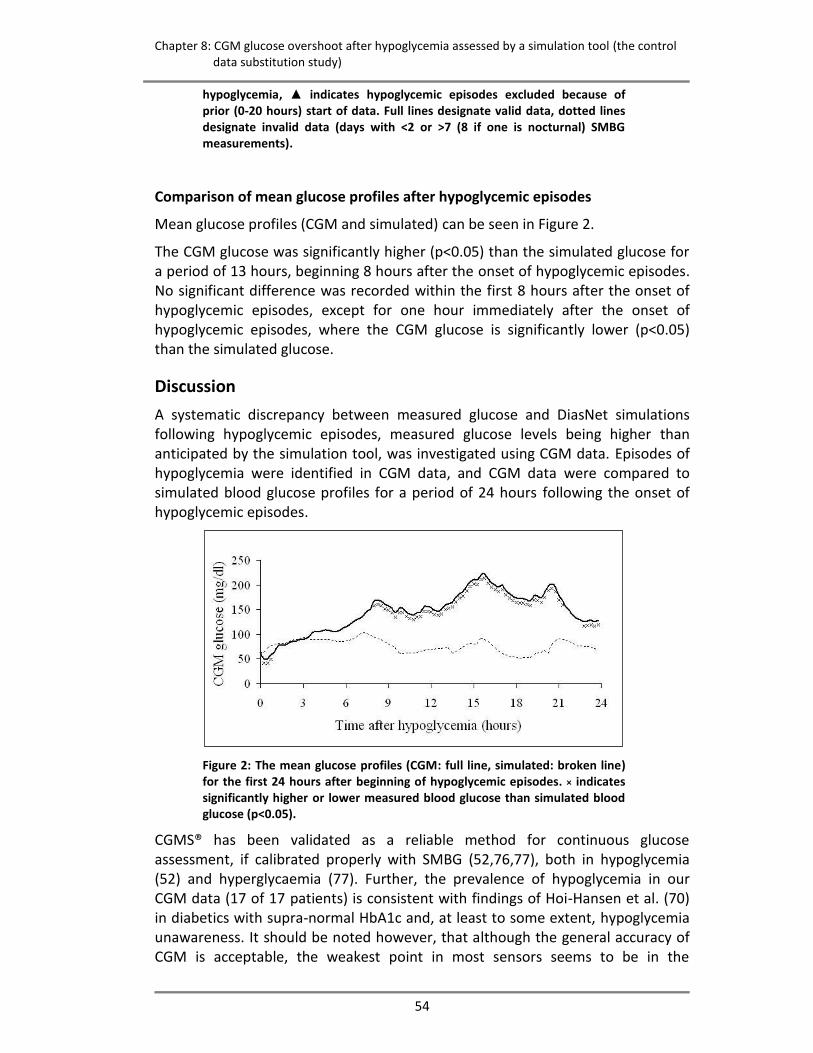
Chapter 8: CGM glucose overshoot after hypoglycemia assessed by a simulation tool (the control data substitution study)
54
hypoglycemia, ▲ indicates hypoglycemic episodes excluded because of prior (0-20 hours) start of data. Full lines designate valid data, dotted lines designate invalid data (days with <2 or >7 (8 if one is nocturnal) SMBG measurements).
Comparison of mean glucose profiles after hypoglycemic episodes
Mean glucose profiles (CGM and simulated) can be seen in Figure 2.
The CGM glucose was significantly higher (p<0.05) than the simulated glucose for a period of 13 hours, beginning 8 hours after the onset of hypoglycemic episodes. No significant difference was recorded within the first 8 hours after the onset of hypoglycemic episodes, except for one hour immediately after the onset of hypoglycemic episodes, where the CGM glucose is significantly lower (p<0.05) than the simulated glucose.
Discussion
A systematic discrepancy between measured glucose and DiasNet simulations following hypoglycemic episodes, measured glucose levels being higher than anticipated by the simulation tool, was investigated using CGM data. Episodes of hypoglycemia were identified in CGM data, and CGM data were compared to simulated blood glucose profiles for a period of 24 hours following the onset of hypoglycemic episodes.
Figure 2: The mean glucose profiles (CGM: full line, simulated: broken line) for the first 24 hours after beginning of hypoglycemic episodes. × indicates significantly higher or lower measured blood glucose than simulated blood glucose (p<0.05).
CGMS® has been validated as a reliable method for continuous glucose assessment, if calibrated properly with SMBG (52,76,77), both in hypoglycemia (52) and hyperglycaemia (77). Further, the prevalence of hypoglycemia in our CGM data (17 of 17 patients) is consistent with findings of Hoi-Hansen et al. (70) in diabetics with supra-normal HbA1c and, at least to some extent, hypoglycemia unawareness. It should be noted however, that although the general accuracy of CGM is acceptable, the weakest point in most sensors seems to be in the

Chapter 8: CGM glucose overshoot after hypoglycemia assessed by a simulation tool (the control data substitution study)
55
hypoglycemic range, and, therefore, future improvements in sensor technology in this region would benefit the validity of clinical studies on hypoglycemia.
For the first hour after the onset of hypoglycemic episodes in our study, the CGM glucose was significantly (p<0.05) lower than expected by the simulation tool. Despite being significant, the limited magnitude of the maximum difference of 22 mg/dl indicates a relatively good fit with the simulation tool. Eight hours after hypoglycemia, our data revealed significantly higher CGM glucose than expected by the simulation tool for a period of more than 13 hours. Maximum difference was 139 mg/dl, 17 hours after beginning of hypoglycemic episodes, and average difference during the time interval 8-21 hours after hypoglycemia onset was 46 mg/dl. Even in the last hour of analysis (23-24 hours after hypoglycemic episode start), the CGM glucose was significantly higher (p<0.05) than anticipated by the simulation tool.
The 8-hour delay of the pronounced difference between CGM measured data (after episodes of hypoglycemia; intervention data) and simulated data (hypoglycemia free; control data) reported here is consistent with the findings of Gale et al. (27), Tordjman et al. (32), Stephenson and Schernthaner (31), and Havlin and Cryer (42) that no significant differences in glucose concentration are seen within the first 4-8 hours after hypoglycemia when comparing blood glucose profiles after hypoglycemic episodes with control blood glucose profiles. It should be noted, however, that though our results for the 0-8 hour period after the beginning of episodes of hypoglycemia are similar to these previous reports, these studies concluded that prolonged hyperglycaemia did not occur following hypoglycemia. Our data, based on the 8-24 hour findings do not support this conclusion. The 8-21 hours overshoot of CGM glucose compared to the simulated glucose profile corresponds very well to the results for the 0-12 hour period after hypoglycemia reported by Bolli et al. (56). The overshoot, however, is not in accordance with the findings of Hirsch (29).
Even though a simulation model reduces intra-patient and inter-patient variation, any significant systematic error in the simulation model would decrease the validity of an analysis based on simulated data. The DiasNet simulation tool has been tested using data not containing hypoglycemic events: In capillary blood glucose (self-monitored blood glucose, SMBG) data, the metabolic model predicts blood glucose profiles with a standard deviation (prediction error) which is about the same as the standard deviation of blood glucose measurements between days in the same data (the intra-patient variation) (22). This indicates that systematic errors in the metabolic model in hypoglycemia free data are small compared to the day-to-day variation of blood glucose seen in diabetes, and that the DiasNet simulation tool therefore can be used to generate the control data in the present study.
Our data support the hypothesis of a long-term glucose counter-regulation to hypoglycemia by comparison of CGM data to model simulations of glucose. Recognition of a long-term glucose counter-regulation to hypoglycemia is
Chapter 8: CGM glucose overshoot after hypoglycemia assessed by a simulation tool (the control data substitution study)
56
important to avoid overly aggressive treatment of (relative) hyperglycemia caused by prior hypoglycemia. We suggest that in order to minimize a possible interference from the simulation tool in a more thorough examination of the hypothesis, further studies of the existence and characteristics of the long-term glucose counter-regulation to hypoglycemia should include analysis of both hypoglycemia-free CGM control data and hypoglycemia CGM intervention data. The assessment could be based on a model/simulation tool.
Conclusions
In conclusion, our findings do not contradict the findings of previous studies. We consider the hypothesis of a long-term glucose counter-regulation to hypoglycemia, as indicated by the overshoot of CGM glucose compared to a verified simulation tool, to be justified for further analysis.
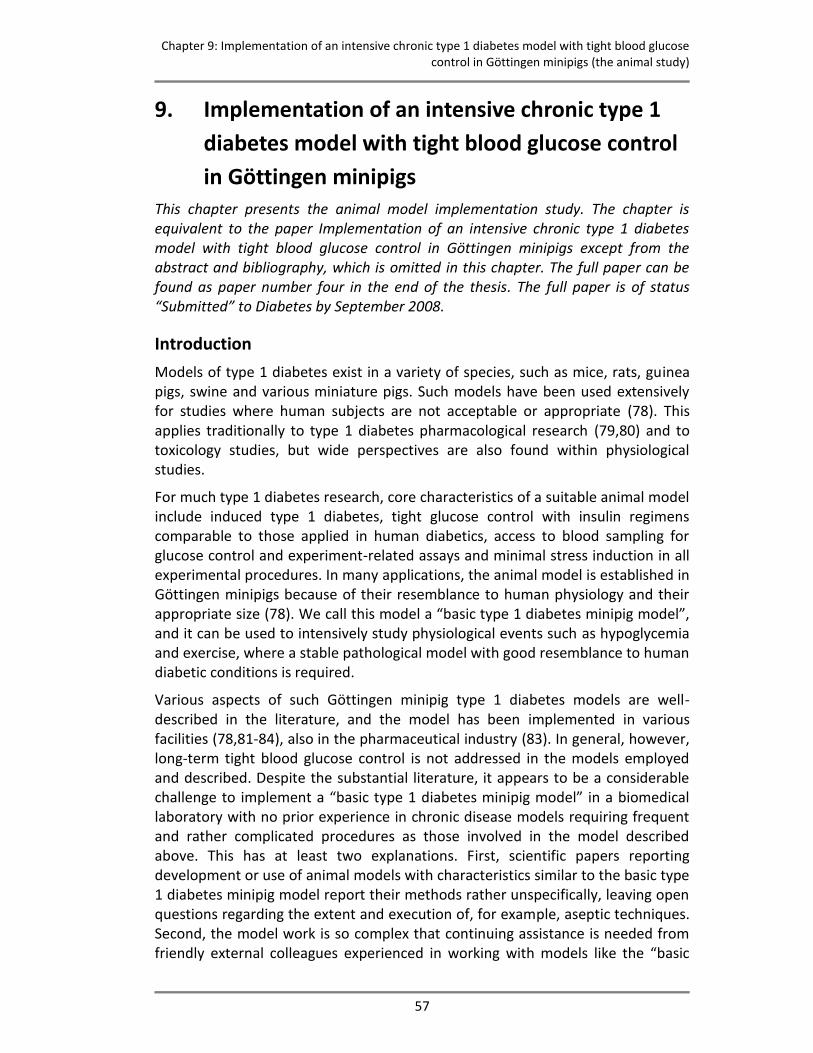
Chapter 9: Implementation of an intensive chronic type 1 diabetes model with tight blood glucose control in Göttingen minipigs (the animal study)
57
9. Implementation of an intensive chronic type 1
diabetes model with tight blood glucose control
in Göttingen minipigs This chapter presents the animal model implementation study. The chapter is equivalent to the paper Implementation of an intensive chronic type 1 diabetes model with tight blood glucose control in Göttingen minipigs except from the abstract and bibliography, which is omitted in this chapter. The full paper can be found as paper number four in the end of the thesis. The full paper is of status “Submitted” to Diabetes by September 2008.
Introduction
Models of type 1 diabetes exist in a variety of species, such as mice, rats, guinea pigs, swine and various miniature pigs. Such models have been used extensively for studies where human subjects are not acceptable or appropriate (78). This applies traditionally to type 1 diabetes pharmacological research (79,80) and to toxicology studies, but wide perspectives are also found within physiological studies.
For much type 1 diabetes research, core characteristics of a suitable animal model include induced type 1 diabetes, tight glucose control with insulin regimens comparable to those applied in human diabetics, access to blood sampling for glucose control and experiment-related assays and minimal stress induction in all experimental procedures. In many applications, the animal model is established in Göttingen minipigs because of their resemblance to human physiology and their appropriate size (78). We call this model a “basic type 1 diabetes minipig model”, and it can be used to intensively study physiological events such as hypoglycemia and exercise, where a stable pathological model with good resemblance to human diabetic conditions is required.
Various aspects of such Göttingen minipig type 1 diabetes models are well-described in the literature, and the model has been implemented in various facilities (78,81-84), also in the pharmaceutical industry (83). In general, however, long-term tight blood glucose control is not addressed in the models employed and described. Despite the substantial literature, it appears to be a considerable challenge to implement a “basic type 1 diabetes minipig model” in a biomedical laboratory with no prior experience in chronic disease models requiring frequent and rather complicated procedures as those involved in the model described above. This has at least two explanations. First, scientific papers reporting development or use of animal models with characteristics similar to the basic type 1 diabetes minipig model report their methods rather unspecifically, leaving open questions regarding the extent and execution of, for example, aseptic techniques. Second, the model work is so complex that continuing assistance is needed from friendly external colleagues experienced in working with models like the “basic
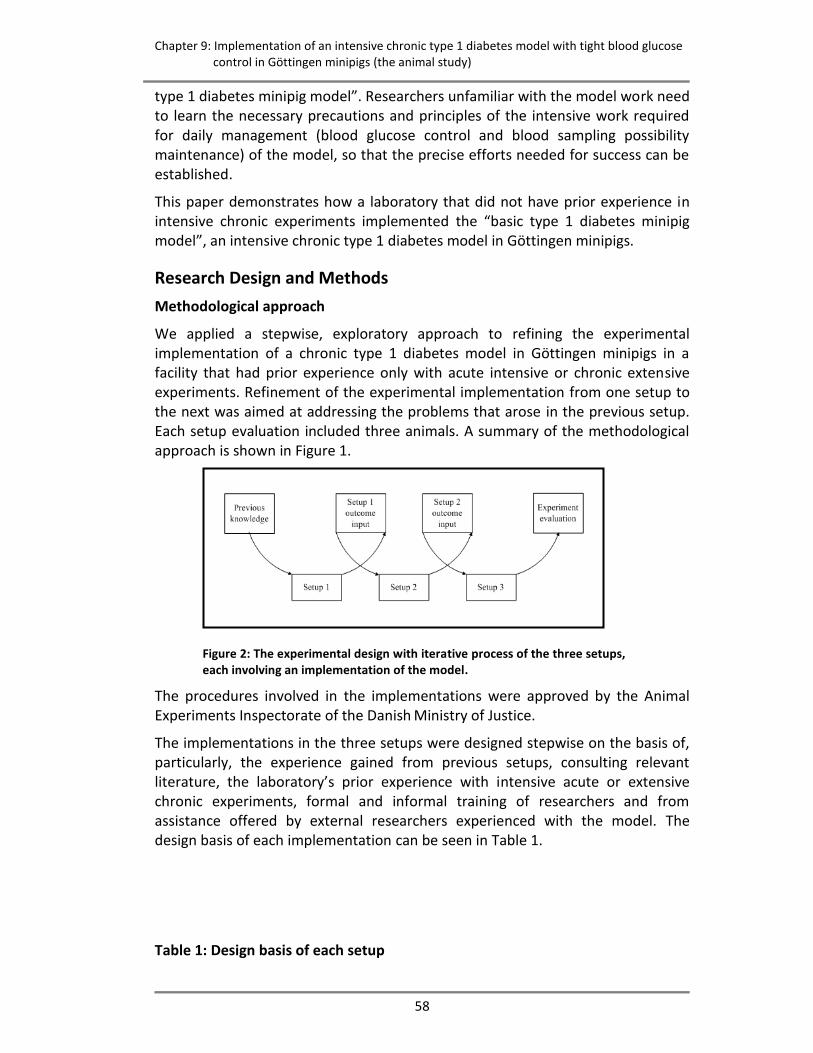
Chapter 9: Implementation of an intensive chronic type 1 diabetes model with tight blood glucose control in Göttingen minipigs (the animal study)
58
type 1 diabetes minipig model”. Researchers unfamiliar with the model work need to learn the necessary precautions and principles of the intensive work required for daily management (blood glucose control and blood sampling possibility maintenance) of the model, so that the precise efforts needed for success can be established.
This paper demonstrates how a laboratory that did not have prior experience in intensive chronic experiments implemented the “basic type 1 diabetes minipig model”, an intensive chronic type 1 diabetes model in Göttingen minipigs.
Research Design and Methods
Methodological approach
We applied a stepwise, exploratory approach to refining the experimental implementation of a chronic type 1 diabetes model in Göttingen minipigs in a facility that had prior experience only with acute intensive or chronic extensive experiments. Refinement of the experimental implementation from one setup to the next was aimed at addressing the problems that arose in the previous setup. Each setup evaluation included three animals. A summary of the methodological approach is shown in Figure 1.
Figure 2: The experimental design with iterative process of the three setups, each involving an implementation of the model.
The procedures involved in the implementations were approved by the Animal Experiments Inspectorate of the Danish Ministry of Justice.
The implementations in the three setups were designed stepwise on the basis of, particularly, the experience gained from previous setups, consulting relevant literature, the laboratory’s prior experience with intensive acute or extensive chronic experiments, formal and informal training of researchers and from assistance offered by external researchers experienced with the model. The design basis of each implementation can be seen in Table 1.
Table 1: Design basis of each setup
Chapter 9: Implementation of an intensive chronic type 1 diabetes model with tight blood glucose control in Göttingen minipigs (the animal study)
59
Design basis Outcome input to next setup
Setup 1 Protocols for diabetes induction from external researchers experienced with chronic models similar to the “basic type 1 diabetes minipig model”
Standard procedures from intensive acute and extensive chronic experiments
Experimental protocols as described in the literature
Mandatory laboratory animal science course
Training of animals to accept all procedures was insufficient
Blood glucose measurements were too scarce for insulin adjustment
Placement of catheter tip was imprecise
Setup 2 Experience from setup 1
General advice from external researchers experienced with chronic models similar to the “basic type 1 diabetes minipig model”
Efforts to ensure aseptic technique with catheter placement and maintenance were insufficient
Setup 3 Experience from setup 2
Training of researcher by external animal facility staff experienced in surgery and catheter maintenance in a similar animal model
Principles of human surgery, catheter maintenance and blood glucose control
Table 1: Design basis of each setup.
Materials
A total of nine Göttingen minipigs were used; three in each setup. All were obtained from the barrier unit of Ellegaard Göttingen minipigs (Dalmose, Denmark) and acclimated for at least two weeks prior to experiment start. The minipigs were housed in single pens with holes for snout contact, under controlled conditions (temperature 18-22°C, relative air humidity 30-70%, 12:12 hours light-dark cycles) and fed twice daily with SDS minipig diet (Special Diets Services, Essex, United Kingdom) at 7:00-7:30 and 14:00-14:30, respectively and had access to water ad libitum. The animals were all acquainted to humans and observed by trained animal technicians and a researcher as to their health status (weight, appetite, behavior, color).
Methods applied in all three setups
Surgical technique for implantation of central venous catheters
Anesthesia was induced with intramuscular injection of 1 ml/10 kg pig zoletil-mixture (xylazin 12.5 mg/ml (Rompun Vet, Bayer Health Care, Leverkusen,
Chapter 9: Implementation of an intensive chronic type 1 diabetes model with tight blood glucose control in Göttingen minipigs (the animal study)
60
Germany), ketamin 12.5 mg/ml (Ketaminol, Intervet International, Boxmeer, Holland), butorphanol 2.5 mg/ml (Torbugesic Vet., ScanVet Animal Health A/S, Fredensborg, Denmark), tiletamin 25 mg/ml (Zoletil 50 Vet., Virbac, Carros, France), zolazepam 25 mg/ml (Zoletil 50 Vet. Virbac, Carros, France)). The animals were intubated and maintained with isoflurane 1-2% in 50% oxygen. An ear vein was cannulated for infusion of perioperative analgesia and muscle relaxation with fentanyl 250 μg (Fentanyl “Hameln”, Hameln Pharmaceuticals, Germany) and rocuronium bromide 50 mg (Esmeron, Organon, Oss, Holland). Postoperative analgesia was provided with intramuscular injections of 100 mg ketoprofen (Orudis, Sanofi-Aventis, Paris, France) for 4 days. Postoperative infection was prevented with intramuscular injection of 2 mill. units of benzylpenicillin (Benzylpenicillin, Panpharma, Fougéres, France) immediately before surgery and for the following 4 days. Animals were shaved carefully, washed and prepared with iodine alcohol. During open surgery and aiming at aseptic procedures (sterile gloves, sterile unpacking of utensils, sterile draping of the entire field), one or two 6.5 Fr catheters (Cook Medical, Bloomington, IN), depending on setup number, were inserted, pre-filled with heparin 5000 U/ml (Heparin SAD, SAD, Copenhagen, Denmark). The catheters were exteriorized via an incision in the dorsal midline, approximately 6-10 cm cranial to the scapulae, and fastened by suture loops and the catheters’ Dacron cuffs. The catheters were tunneled subcutically to a ventral caudal-cranial jugular furrow catheter introduction incision. Blunt dissection to the vena jugularis exterior (and in setup 2 also interior) was performed and the catheters were introduced in them using the insertion kit provided with the catheters. The intended position of the catheter tip was in the anterior vena cava. The vein was ligated around the catheter caudally to the insertion site, and a catheter loop was fastened by sutures. Both incision sites were closed in the muscle and cutical layers. A pouch fastened to the neck using adhesive bands held the exteriorized catheters.
Measurement of baseline blood glucose
The blood glucose was measured pre-prandially and at two hours after feeding on three consecutive days before diabetes induction.
Diabetes induction
The animals were fasted 18 hours before diabetes induction. Type 1-like diabetes was induced by a single infusion of streptozotocin (STZ) (S-0130, Sigma-Aldrich, St. Louis, MO), 125 mg/kg, dissolved in sodium citrate buffer (pH 4.5), 2 ml/kg, over 5 minutes in one of the catheters. Doses of STZ between 100 and 150 mg/kg are commonly used for type 1-like diabetes induction (79,85-88). Isotonic sterile saline was infused before (5 ml) and after (20 ml) STZ infusion.
Animals were offered their normal morning feed with 2 g/kg glucose (Glukose, Matas, Allerød, Denmark) in 1 dl yogurt 3 hours after STZ administration and at normal feeding times for the following 48 hours. During this period, the animals were observed carefully, and blood glucose was measured every 1-4 hours for detection of hypoglycemia due to hyperinsulinemia resulting from β-cell

Chapter 9: Implementation of an intensive chronic type 1 diabetes model with tight blood glucose control in Göttingen minipigs (the animal study)
61
destruction. Hypoglycemia < 2.5 mmol/l was treated with 20 g of glucose in 1 dl yogurt.
Blood glucose measurements
Blood glucose was measured by an ABL725 (Radiometer, Copenhagen, Denmark) with 90 μL or 150 μL glass capillaries (Clinitubes, Radiometer, Copenhagen, Denmark). The ABL725 was calibrated and maintained according to the manufacturer’s instructions. 1.5 ml of catheter lock solution and blood was drawn prior to sampling of blood for analysis.
Insulin treatment
Insulin treatment was initiated after STZ infusion when pre-prandial blood glucose >20 mmol/l. Insulin treatment aimed at pre-prandial blood glucose <7 mmol/l and 2 hours post-prandial blood glucose <10 mmol/l.
Insulin was injected subcutaneously approximately 2-5 cm caudal to the ear, from ear height to approximately 5 cm ventral to the ear. Both sides were used, and injection sites were varied to avoid infiltrates.
For all insulin injections, we used a NovoPen Junior insulin pen (Novo Nordisk, Bagsværd, Denmark) with 12.7 mm needles (BD Ultra-Fine, BD, New Jersey, USA).
Euthanasia
The animals were euthanized with a bolus of 20 ml of pentobarbitone (200 mg/ml; Pharmacy of the Royal Veterinary and Agricultural University, Copenhagen, Denmark) in the central venous catheter.
Methods applied specifically in each setup
Setup 1
The first group consisted of 3 female pigs aged 7-8 months, weight 17-18 kg.
No other training in addition to human acquaintance was performed, so the pigs were placed in a box 50x80 cm for restraint during blood sampling and insulin injection.
The animals were fed 110 g at each feeding before diabetes induction and 140-150 g after diabetes induction for weight maintenance.
One catheter was implanted. This was done with the pig first in ventral recumbency for exteriorization incision and catheter tunneling, then in dorsal recumbency for insertion incision, catheter insertion and incision closure, and again in ventral recumbency for exteriorization incision closure. The pig and also the sterile drapes were thus manipulated twice. Catheter tip location in the anterior vena cava was determined by a sensation of catheter reluctance to blood withdraw using a syringe, indicating a position of the catheter tip in the heart (89) and subsequent catheter retraction of 1-2 cm. The catheter was implanted in its full length with excess catheter length coiled and placed in a muscle/subcutical fat pocket dissected in the dorsal incision.
Chapter 9: Implementation of an intensive chronic type 1 diabetes model with tight blood glucose control in Göttingen minipigs (the animal study)
62
The catheter lock solution and blood drawn before sampling of blood from the catheter for analysis was re-injected before injection of new lock solution (5000 U/ml).
Baseline blood glucose level measurements were initiated 6 days after catheter implantation.
Diabetes was induced 10 days after surgical catheter insertion.
Blood glucose was measured pre-prandially each day following diabetes induction.
Insulatard (Novo Nordisk, Bagsværd, Denmark, 100 IE/ml), initial dose 0.2 IU/kg/feeding, was injected subcutaneously immediately before feeding. Subsequently, insulin doses were adjusted in steps of 0.1/IU at each feeding according to pre-prandial blood glucose.
For an hourly blood sampling session of 32 hours duration for detailed blood glucose profile purposes, a 1.5 m extension of the catheter was constructed to allow for blood sampling without animal contact. For the entire system, 3.1 ml of lock solution (5000 U/ml) was used, and the lock solution withdrawn before blood sampling for analysis was injected before the new lock solution.
Setup 2
The second group consisted of 3 female pigs aged 9-10 months, weight 21-24 kg.
The animals were trained over a 3-week period to accept blood sampling and insulin injections before surgical catheter implantation.
The animals were fed 130 g at each feeding prior to diabetes induction.
Two catheters were implanted to ensure blood sampling possibility. The catheters were implanted and maintained as in setup 1, but with the extra catheter in the right vena jugularis exterior and applying distances measured by necropsy measurements on setup 1 pigs for catheter tip placement.
Baseline blood glucose levels were determined 4 days after catheter insertion.
Diabetes was induced 9 days after catheter insertion.
Blood glucose was measured pre-prandially every day after insulin induction.
Insulatard (Novo Nordisk, Bagsværd, Denmark, 100 IE/ml), initial dose 0.2 IU/kg/feeding, was injected subcutaneously immediately before feeding. No insulin dose adjustment was relevant.
Setup 3
The third group consisted of 3 male pigs aged 9-10 months, weight 20-22 kg.
A staged, evaluation-centered protocol-based training scheme was developed, aiming at acceptance of blood sampling and insulin injections. The protocol utilized positive reinforcement (apple pieces) and consisted of 14-18 incremental sessions over 3 weeks, each of 15-20 minutes duration and with a formulated
Chapter 9: Implementation of an intensive chronic type 1 diabetes model with tight blood glucose control in Göttingen minipigs (the animal study)
63
objective (protocol presented at the Minipig Research Forum Annual Meeting 2007, Copenhagen, Denmark).
The animals were fed 200 g at each feeding prior to diabetes induction. During the first 30 days after diabetes induction, the feeding rations were adjusted to determine an optimal feeding regimen, in total 500 g on two feedings.
Two catheters were implanted, both in the right vena jugularis exterior. The pigs were positioned in lateral recumbency during the entire surgical procedure. The two catheters were introduced via one needle puncture of the vein, applying two guidewires with a sheath each. Catheter tip location in the anterior vena cava was ensured applying necropsy measurements on a pig in setup 2. The catheters were cut with a sharp pair of sterile scissors to appropriate length, leaving no coiling necessary (90).
Catheter maintenance aimed at aseptic procedures utilizing sterile surgical gloves, alcohol swabs for wiping the catheter before connecting syringes to it, and sustained sterility of utensils (syringes for catheter lock removal, syringes for blood sampling, syringes with new lock solution, catheter caps). The catheters were flushed 7 days after insertion but otherwise untouched.
Baseline blood glucose level measurements were performed 12-14 days after catheter insertion.
Diabetes was induced 22 days after catheter insertion.
Ampicillin (Pentrexyl, Bristol-Myers Squibb, Bromma, Sweden) 10 mg/kg was injected intravenously every 10 days for infection-related complications prophylaxis.
The catheter lock and blood drawn before blood sampling for analysis was discarded. The catheter was flushed with 2 ml of isotonic sterile saline before injection of lock solution (expected duration less than 2 hours: 100 IU/ml, 2-5 hours: 500 IU/ml, 5-24 hours: 1000 IU/ml, more than 24 hours: 5000 IU/ml). One catheter was preferred for use, the other was flushed and locked with heparin 5000 IU/ml every week and held in reserve. New, sterile catheter caps were placed after each blood sampling (91).
Blood glucose was measured every three to four hours for 24 or 48 hours after insulin dosage adjustment, beginning on day 2.
A continuous glucose monitoring system (CGMS, Medtronic, Northridge, United Kingdom) was used for easy and precise glucose monitoring for 3-4 days. Sensors were inserted according to the manufacturer’s instructions under anesthesia (1 ml/10 kg pig-zoletil mixture as for anesthesia induction before surgery) and calibrated with 4 or 5 daily blood glucose measurements. They were placed caudally to the area of insulin injection and covered by first a sterile semi-permeable dressing, then the adhesive band holding the catheter pouch. The glucose sensor box was fastened in a home-made vest. Insulin was not injected in
Chapter 9: Implementation of an intensive chronic type 1 diabetes model with tight blood glucose control in Göttingen minipigs (the animal study)
64
the side with the glucose sensor during wear and on the day before sensor insertion.
For blood glucose control after diabetes induction, insulin (Insulatard, Novo Nordisk, Bagsværd, Denmark), initial dose 0.2 IU/kg/feeding, was injected subcutaneously immediately before feeding. To better control post-prandial and morning pre-prandial blood glucose, other insulin regimens were applied. These regimes were: 1) Mixed insulin (Mixtard 50, Novo Nordisk, Bagsværd, Denmark, 100 IE/ml), 2) a combination of separate short acting insulin (Actrapid, Novo Nordisk, Bagsværd, Denmark, 100 IE/ml) and separate regular insulin (Insulatard, Novo Nordisk, Bagsværd, Denmark), both injected at feeding start. Insulin doses were adjusted in steps of 0.05 or 0.1 IU/kg/feeding according to blood glucose measurements, and up to 0.2 IU/kg/feeding in case of extensive hypoglycemia or hyperglycemia. Insulin dosages and feeding rations were adjusted concurrently.
The procedure for diabetes induction with STZ was repeated after 62 days in two animals due to spontaneous, partial recovery from diabetes.
Results
Setup 1
The pigs did not accept blood glucose sampling and insulin injections easily, and some degree of force was indicated.
STZ caused hyperglycemia (blood glucose>20 mmol/l) in all animals, and insulin treatment was initiated. Intended blood glucose control was not achieved.
One catheter lost its patency 10 days after diabetes induction, the others remained patent. The animal with the dysfunctional catheter was euthanized. Necropsy revealed unintended catheter tip location in a small hepatic vein.
One animal developed epistaxis and rectal bleeding due to over-heparinization during hourly blood sampling 25 days after diabetes induction and was euthanized.
One animal became lethargic and developed anorexia, hypoxia, tachycardia and superficial breathing 30 days after diabetes induction. The animal was euthanized, but the disease cause could not be determined by gross pathology.
Main results
The main results of setup 1 were that the animals were insufficiently trained to accept the procedures involved in the experiment and that the blood glucose was measured too rarely to allow tight blood glucose control. An additional result was that correct catheter tip placement could not rely solely on the feeling of reluctance to blood withdrawal.
Setup 2
Chapter 9: Implementation of an intensive chronic type 1 diabetes model with tight blood glucose control in Göttingen minipigs (the animal study)
65
The pigs accepted touching in the neck area and insulin pen needle insertion without injection of insulin before surgery, but after surgery, blood sampling was complicated by pig movement.
One pig died during surgery. No obvious cause was observed, including bleeding, anesthesia overdose and apparatus malfunction. Unfortunately, no necropsy was performed, so the cause of death remains unknown.
One pig exhibited irreversible tachycardia (170 beats per minute) and hypotension (70/30 mm Hg) 10 minutes after isoflurane inhalation was initiated. Mydriasis was observed after four hours, so the animal was euthanized.
One animal developed anorexia, hypoxia including cyanosis, tachycardia and superficial breathing 3 days after diabetes induction and insulin treatment initiation. The animal was euthanized, and necropsy indicated a pulmonary thromboemboli. Correct catheter tip location was observed.
Main result
The main result of setup 2 was that the catheter maintenance procedures employed did not prevent thromboemboli. An important result was also that anatomical fixpoint measurements ensured correct catheter tip placement.
Setup 3
The animals’ responses to training varied only little. The main difficulty was balancing the intensive training with the animal’s ability to focus on the session task objective and not only on the reward, Training 2-5 hours after feeding was optimal. The pigs accepted blood sampling from the catheters and insulin injections easily, even during nightly blood samplings. However, one pig developed evasive and aggressive behavior during insulin injections approximately one month after diabetes induction. Repetition of the initial training protocol over 3 days restored full compliance.
One pig developed an abscess with suppuration of approximate diameter 2 cm in the healed exteriorization incision 35 days after surgery. Nine days of daily intravenous injection of 1000 mg ampicillin cured the infection.
All catheters were patent during the entire experiment (70 days).
3 or 4 subcutaneous glucose sensors were used in each pig. Three sensors dislocated within the wear period despite no problems were observed during sensor insertion.
Feeding rations of 160 g in the morning and 340 in the afternoon apparently provided the easiest insulin dosage without diurnal hypoglycemia or hyperglycemia patterns.
The initial insulin treatment with Insulatard resulted in morning post-prandial and afternoon pre-prandial hyperglycemia and late afternoon/early evening hypoglycemia. Mixtard 50 caused late afternoon hypoglycemia and dose
Chapter 9: Implementation of an intensive chronic type 1 diabetes model with tight blood glucose control in Göttingen minipigs (the animal study)
66
reduction caused morning pre-prandial hyperglycemia. Short acting insulin with the morning feeding and intermediate acting insulin and short acting insulin with the afternoon feeding caused afternoon post-prandial hypoglycemia. The same regimen without short acting insulin with the afternoon feeding caused overall acceptable blood glucose control in 14 days; morning insulin doses were 0.11, 0.13 and 0.21 IU/kg, and afternoon insulin doses were 0.23, 0.29 and 0.53 IU/kg.
50-60 days after diabetes induction blood glucose levels began to decrease in all pigs, both pre-prandially and post-prandially. Insulin doses were reduced but hypoglycemia persisted, and insulin doses were further reduced and finally removed. Pre-prandial blood glucose on day 3 after insulin removal was 14-16 mmol/l. 72 hours after the repeated procedure for induction of diabetes with STZ, blood glucose was 12-18 mmol/l.
Main results
The main results of setup 3 were that strict aseptic technique ensured catheter function for over two months and that blood glucose could be reasonably tightly controlled. However, a very important result was the decreased insulin requirements. The methods applied were insufficient to determine the onset of decreased insulin requirement and its cause.
The results are summarized in figure 2:
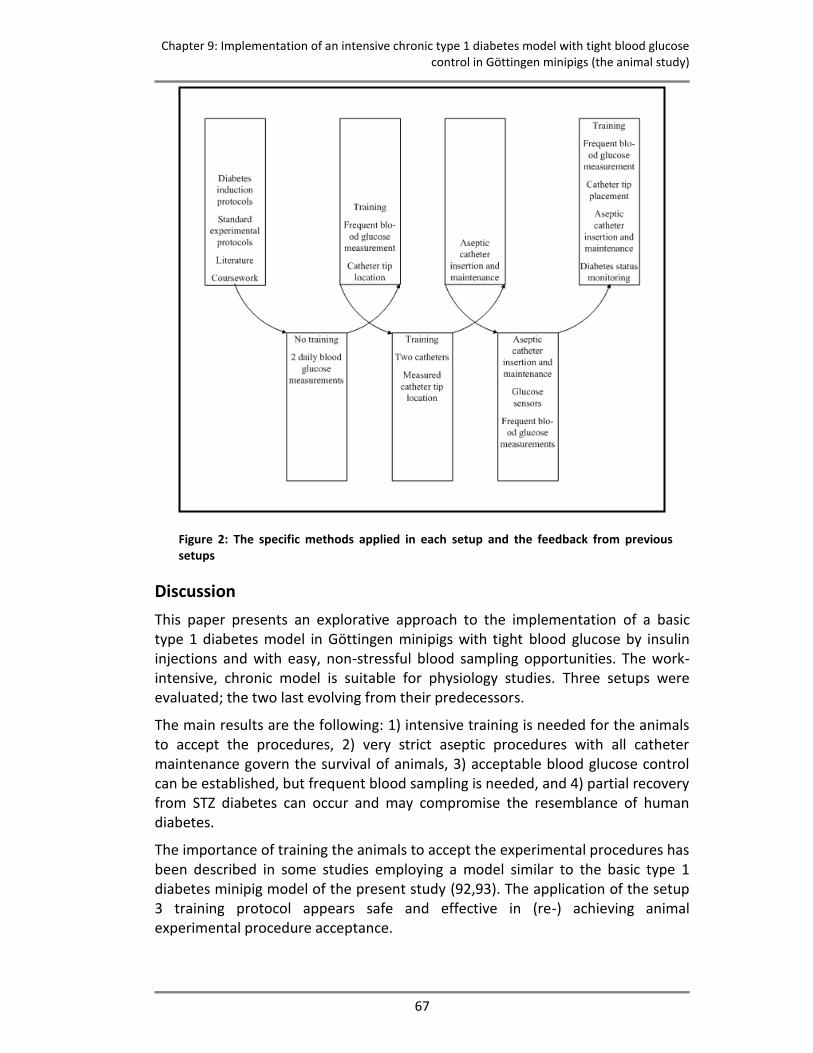
Chapter 9: Implementation of an intensive chronic type 1 diabetes model with tight blood glucose control in Göttingen minipigs (the animal study)
67
Figure 2: The specific methods applied in each setup and the feedback from previous setups
Discussion
This paper presents an explorative approach to the implementation of a basic type 1 diabetes model in Göttingen minipigs with tight blood glucose by insulin injections and with easy, non-stressful blood sampling opportunities. The work-intensive, chronic model is suitable for physiology studies. Three setups were evaluated; the two last evolving from their predecessors.
The main results are the following: 1) intensive training is needed for the animals to accept the procedures, 2) very strict aseptic procedures with all catheter maintenance govern the survival of animals, 3) acceptable blood glucose control can be established, but frequent blood sampling is needed, and 4) partial recovery from STZ diabetes can occur and may compromise the resemblance of human diabetes.
The importance of training the animals to accept the experimental procedures has been described in some studies employing a model similar to the basic type 1 diabetes minipig model of the present study (92,93). The application of the setup 3 training protocol appears safe and effective in (re-) achieving animal experimental procedure acceptance.
Chapter 9: Implementation of an intensive chronic type 1 diabetes model with tight blood glucose control in Göttingen minipigs (the animal study)
68
Strict aseptic procedures in all catheter maintenance, including surgical insertion, have been emphasized in the literature (90-92,94). Very strict aseptic technique in catheter maintenance as a key complication prophylaxis improvement has been reported (95). Important fatal complications in the present study were thrombosis-related, commonly seen in animals with central venous catheters (96,97), even if sepsis-related complications are avoided (95,96,98).
Blood glucose control by insulin injections was the major difficulty encountered in setup 3, while other, basal, method refinements ensured pig survival. To our knowledge, tight blood glucose control with multiple daily injections (compared to insulin pump therapy) in pigs has so far not been explored. However, pre-prandial blood glucose of 5-10 mmol/l by two daily subcutaneous injections of Velosulin and NPH porcine insulins are achievable (82) but accompanied by both hypo- and hyperglycemia (87). Surprisingly, weight-maintaining blood glucose control has required higher insulin doses than we found appropriate for reasonable tight blood glucose control (99-101). Insulin sensitivity variations in our animals may be governed not only by congenital biological variation but also variations in partial diabetes recovery and infection status, which was not investigated.
The partial reversibility of diabetes status was unexpected, as stable diabetes is achievable for periods over 3 months with different STZ regimens (84,100,102-104). However, 1-2 months’ reversibility of diabetes is not uncommon (79,86,100), especially in young animals (86), and is accompanied by non-diabetic C-peptide levels (87,100). Reversibility is probably to some extent dose-dependent (100), but recovery has also been seen after STZ doses larger than 125 mg/kg as used in the present study (86,100). The efficiency of 200 mg/kg STZ for induction of chronic (>16 weeks) duration of C-peptide-negative diabetes was not established until 2008 by Hara and co-workers (100), as Liu and co-workers (105) did not report diabetes duration in their 200 mg/kg STZ pigs. The present failure of repeated STZ-injection to re-establish diabetes could indicate that the partial recovery is caused by isolated beta-cell or small beta-cell cluster hypertrophy, as they, together with immature beta-cells, are less susceptible to STZ-induced destruction (86). Higher STZ doses and close monitoring of diabetes status by C-peptide or intravenous glucose tolerance tests as employed by Canavan and co-workers (82) are indicated.
Diabetes status and infection status are important for effective blood glucose control. In laboratories not experienced with advanced models, this poses challenges to biochemical laboratory facilities, for instance for C-peptide radio-immunoassays. This should be considered carefully when evaluating the feasibility of implementing a chronic diabetes animal model.
Different fatal outcomes or premature euthanasia causes occurred. They can be classified as handling-related, diabetes recovery-related or of unknown cause. Because a single focus area cannot be identified, several setup refinements are needed. Some fatal outcomes, such as handling and catheter related fatalities,
Chapter 9: Implementation of an intensive chronic type 1 diabetes model with tight blood glucose control in Göttingen minipigs (the animal study)
69
may be preventable. Fatalities due to partial diabetes recovery may be preventable, but if not, their potential effects should be considered.
In conclusion, our results indicate the possibility of implementing a chronic Göttingen minipig model of type 1 diabetes with near-normal blood glucose, controlled by insulin injections, and easy, non-stressful venous blood sampling access. A high success rate can be assured with good training of the animals, use of appropriate surgical and catheter maintenance techniques, and systematic diabetes status monitoring.
However, researchers should carefully ensure adequate experience, sufficient time commitments and appropriate laboratory facilities. If these resources are lacking, the use of animals will be highly unethical and the projects will most likely fail.
Chapter 9: Implementation of an intensive chronic type 1 diabetes model with tight blood glucose control in Göttingen minipigs (the animal study)
70
71
DISCUSSION AND CONCLUSIONS
This section of the thesis gives a general discussion of the four works and their relations, suggests further work and provides the conclusions of the PhD-thesis
72
10. General discussion
Background, methods, and results
The Somogyi effect or long-term glucose counter-regulation to hypoglycemia has been explored for half a century due to of the challenges that it poses to blood glucose control, as blood glucose control is crucial to diabetic patients (8). The long-term glucose counter-regulation to hypoglycemia is hypothesized to manifest itself as a (relative) hyperglycemia which may occur after hypoglycemia (27-33,56,58,59), maybe following a delay of a few hours. The previous studies include retrospective (27,28,30,31,42) and prospective approaches (26,29,32,43,45-47). Both the observational (nocturnal) approach (27,28,30,31,42) and the more commonly applied interventional approach (26,29,32,43,45-47) to hypoglycemia have been applied. Despite extensive research, no consensus exists regarding the existence of the long-term glucose counter-regulation or regarding its quantitative characteristics (33,64). This is reflected in the substantial differences between the study protocols applied, for instance regarding study period after hypoglycemia.
The work described in this thesis explores different methodological approaches to the examination of the correlation between hypoglycemia and the hypothesized long-term glucose counter-regulation to add to the knowledge of the relevance of the long-term glucose counter-regulation to hypoglycemia in diabetic individuals’ real lives.
An apparently ideal study (Chapter 6) was designed. The study design considered the every-day life aspect of the thesis objective and the methodological problems in hypoglycemia induction studies. The lack of known quantitative characteristics of the long-term glucose counter-regulation to hypoglycemia was also considered. Thus, in the apparently ideal study we compared CGM sensor glucose after spontaneous hypoglycemia with CGM sensor glucose in control periods free from hypoglycemia and near-hypoglycemia. Three additional studies were designed to explore potential solutions to the methodological challenges of the apparently ideal study. First, to handle the potential lack of uniformity in every-day life conditions and the lack of comparable background data in hypoglycemia and hypoglycemia-free control data, a method was developed for balancing unmatched background data by the use of a metabolic model in retrospective observational studies. This method was presented in the background data balancing study (Chapter 7). Second, to substitute the potentially non-existing hypoglycemia-free control data, a method was applied using a metabolic model as a simulation tool for generation of retrospective control data in observational studies. This method was presented along with the results from the application of it in the control data substitution study (Chapter 8). Third, to proactively approach the potential inappropriateness in data collection caused by insufficient understanding of the long-term glucose counter-regulation and the lack of repetition opportunities in retrospective analyses, an animal model was
Chapter 10: General discussion
73
implemented as a continuous and prospective source of data. The work with the animal was presented in the animal study (Chapter 9).
In the apparently ideal study (Chapter 6), the sensor glucose was similar after hypoglycemia and in the control period free from hypoglycemia and near-hypoglycemia. However, the insulin intake after hypoglycemia, compared with the intake during the control period, was on average 17% higher and the carbohydrate intake was 20% lower. Both differences in background data act to lower the blood glucose, so with similar insulin and carbohydrate on both days, CGM glucose could be anticipated to be higher after hypoglycemia than during control periods. The unmatched background data balancing method presented (Chapter 7) appears to be feasible in a number of applications but currently only pilot use has been employed. In one subject, pilot use indicated a clear hypoglycemia-related hyperglycemia whereas no indications of the hypothesis were observed in another subject. Control data substitution by a computer model (Chaper 8) indicated that the measured CGM glucose was significantly higher after hypoglycemia than anticipated by the simulation tool, the relative hyperglycemia beginning 8 hours following hypoglycemia and lasting for 13 hours. The animal model work (Chapter 9) indicated that insufficiencies in early versions of the model had fatal effects, but with proper animal training, strict aseptic catheter maintenance and acceptable blood glucose control combined with stable and monitored diabetes status, a feasible experimental model could probably be implemented.
Relations between the studies in the thesis
This thesis presents four explorative methodological approaches to the analysis of long-term glucose counter-regulation to hypoglycemia. Two of these methodological approaches (Chapters 7 and 9) focused on method development or method implementation, which means that only two actual method applications have been employed; in the apparently ideal study (Chapter 6) and in the control substitution study (Chapter 8).
The results of the apparently ideal study are not conclusive regarding the correlation between hypoglycemia and a (delayed) hyperglycemia relative to the non-hypoglycemia case. Background data on insulin and carbohydrate intake may suggest that a relative hyperglycemia would be observed if background data were similar after hypoglycemia and in the control period, and would consequently support the hypothesis of a long-term glucose counter-regulation to hypoglycemia. However, it is not evident in the present CGM glucose data. The results from the control substitution study support the suggestions in the apparently ideal study, as they show pronounced hyperglycemia following hypoglycemia compared to the simulations from the computer model. The delay of approximately 8 hours before onset of relative hyperglycemia in the control substitution study may also be argued to correspond with the insulin and carbohydrate intake findings in the apparently ideal study. The short acting insulin doses within 8 hours after hypoglycemia are mainly similar or even smaller than in
Chapter 10: General discussion
74
the first 8 hours of the control period. The higher insulin doses after 8 hours following hypoglycemia can be interpreted as reactions to arising apparent hyperglycemia. It should be stressed, however, that this is highly speculative. It should also be noted that the patient groups differ in glycemic control so the results in one study may not correspond to those of the other.
The relevance of a method for balancing unmatched background data (Chapter 7) is evident from the apparently ideal study as the dissimilar background data found in this study prohibit direct comparison of hypoglycemia data with control data. Indications regarding the correlation between hypoglycemia and a subsequent (relative) hyperglycemia and thus the hypothesis of the long-term glucose counter-regulation can be found in the apparently ideal study only because the differences in average insulin and carbohydrate intake both have hypoglycemic effects. If differences with similar magnitude but opposite directions were seen, no indications could be argued. The method for balancing unmatched background data would, on a patient-specific level, aid in determining the net effect of unequal background data, but the method naturally requires background data which may be a limiting factor in its application.
Also the relevance of control data generation by means of a computer model was illustrated by the apparently ideal study as control periods free from both hypoglycemia and near-hypoglycemia could be identified corresponding to only 23 of 64 of the hypoglycemic events.
Analysis of the data in the apparently ideal study revealed the relevance of a continuous source of data for determination of necessary precautions and requirements for data collection and data analysis due to insufficient present knowledge on the impact of previous hypoglycemia on the effect of later hypoglycemia and its correlation to a relative hyperglycemia in the long-term glucose counter-regulation. Using an animal model as a continuous data source (Chapter 9) could mainly help to determine whether or not interactions from previous hypoglycemia occur, and whether or not the strict hypoglycemia inclusion criteria in the apparently ideal study were required.
The two methods for managing insufficient control data, targeting incomparability of background data or lack of control data, could be applied also in the animal model for detailed data analysis. However, their application requires the construction of a computer metabolic model similar to the DiasNet model used in the control data substitution study serving as an example in the background data balancing method. This construction is certainly feasible, but it may not be required, as very controlled and thus equal conditions may be achieved in animal models and this is one of such animal models’ core advantages. Hereby animals can provide high quality control data.
Limitations resulting from the use of existing data sets
The studies included in the thesis provide a first exploration of various approaches to the analysis of the long-term glucose counter-regulation to hypoglycemia.
Chapter 10: General discussion
75
Regarding the three human studies, this novelty of the work has enforced the use of existing data sets. In the apparently ideal study, the constitution of these existing data sets governed exclusion of otherwise includable hypoglycemic events due to lack of control periods. In the control data substitution study, the constitution of the existing data sets governed the use of subjects of poor glycemic control with frequent hypoglycemia. In addition to the small sample sizes caused by the use of existing data sets, impaired comparability of the results from the apparently ideal study and the control substitution study due to incomparable subject groups is also a consequence of the reuse of existing data sets.
Relation to previous work
The long-term glucose counter-regulation has been studied previously but without the study designs presented in this thesis (analyzing spontaneous hypoglycemia in CGM data with no restrictions on hypoglycemia time and with long study durations).
CGM data analysis has been applied by Hoi-Hansen and colleagues (30) and Guillod and colleagues (28) but only for nocturnal glycemia stratification studies. As the control data substitution method study in this thesis indicated no difference in CGM to simulated glycemia difference after nocturnal and daytime hypoglycemia, the limitation of the analysis to only nocturnal hypoglycemia appears unnecessary, at least if the hypothesized long-term glucose counter-regulation to hypoglycemia is interpreted not to relate to only nocturnal hypoglycemia.
Comparison of glucose after hypoglycemia with glucose in control periods free from hypoglycemia (and near-hypoglycemia) as in the apparently ideal study in this thesis has been applied by Perriello and colleagues (43), Hirsch and colleagues (29), and Tordjman and colleagues (32) in studies applying the intervention glycemia control and true control study design. The use of control periods free from both hypoglycemia and near-hypoglycemia in the apparently ideal study mimics the hypoglycemia prevention by glucose infusion in the three studies just mentioned. However, the use of induced hypoglycemia, hospitalized subjects and glucose infusion for hypoglycemia prevention pose relevant differences between these former studies and the apparently ideal study. Considering the differences in carbohydrate intake found in the apparently ideal study, the glucose infusion for hypoglycemia prevention (and possibly higher glucose supply in the control day than in the hypoglycemia day) in the intervention glycemia control and true control studies mentioned above emphasizes the need for methods capable of canceling or at least minimizing the effect of different background data, like the background data balancing method.
Considering the day-to-day variations in background data found in the dataset analyzed in the apparently ideal study and the frequency of hypoglycemia in the dataset analyzed in the control data substitution study, the controlled settings in the intervention glycemia control and true control studies and the insulin
Chapter 10: General discussion
76
resistance studies are relevant in order to ensure comparability within each patient. Hereby the widespread exclusion of hypoglycemic events due to lack of hypoglycemia-free control data in the apparently ideal study may be avoided, and the study is therefore more cost-effective regarding cost per includable hypoglycemia. This is especially relevant in studies of hospitalized subjects, but the introduction of methods for background data balancing or control data substitution reduces this cost per includable hypoglycemia. More subjects can then be included in the study and the power of the study will subsequently increase.
Considering that only a correlation between hypoglycemia and a (relative) hyperglycemia manifestation of a long-term glucose counter-regulation to hypoglycemia has been explored in the studies in this PhD-thesis, it is not relevant to relate to the causality-oriented studies of Kollind and colleagues (45) and Fowelin and colleagues (26). However, the causal relationship is definitely relevant for exploration, and this can be accomplished in an animal model implemented as described in this thesis. Animal models constituted by spontaneously diabetic cats and dogs have been used for the exploration of the long-term glucose counter-regulation (62,106). Pig models have been used for hypoglycemia studies, but not for studies of the long-term glucose counter-regulation to hypoglycemia.
Future work
Future work should further explore the correlation between hypoglycemia and the long-term glucose counter-regulation to hypoglycemia as well as seek to establish the causal relationships governing the correlation.
Such work could include both application of the methods presented on existing glucose data as presented in this PhD-thesis and collection of new data intended for the exploration of the long-term glucose counter-regulation to hypoglycemia.
Regarding further exploration of the correlation between hypoglycemia and a manifestation of the long-term glucose counter-regulation to hypoglycemia, the apparently ideal study (Chapter 6) proved a feasible approach despite the high rate of exclusion of subjects and hypoglycemic events. Thus, access to and analysis of similar data sets would be relevant and should be possible with the increased use of continuous glucose sensors for numerous research purposes. Thorough application on numerous other datasets of the methods used in the apparently ideal study could also assist in the quantitative characterization of the manifestation of long-term glucose counter-regulation and the variations in manifestations. This is necessary to determine the relevance for diabetic patients’ glycemic control. Also, it appears obvious to apply the background data balancing method and the control data substitution method to the dataset analyzed in the apparently ideal study, but due to the lack of carbohydrate intake data in some of the subjects in this dataset, the control substitution method (Chapter 8) is the only one applicable. Use of an animal model to further characterize the
Chapter 10: General discussion
77
interactions between subsequent hypoglycemia and the effect of subsequent hypoglycemia on the correlation between hypoglycemia and relative hyperglycemia as in the long-term glucose counter-regulation could, however, increase the number of subjects with includable hypoglycemia if such interactions are non-existing. Then, more subjects with sufficient background data are likely to be included as well, allowing the use of the background data balancing and control data substitution methods.
For exploration of the causal relationship governing the correlation between hypoglycemia and the long-term glucose counter-regulation manifestation as a (relative) hyperglycemia, prospective intervention studies as opposed to observational human studies appear relevant. However, such studies make it essential to overcome interference from the subject’s natural hypoglycemia pattern, should such a pattern exist. The animal model could serve as a continuous data source in determining the appropriate design and protocol for human studies.

Chapter 10: General discussion
78
Chapter 11: Conclusion
79
11. Conclusion In this PhD-thesis the exploration of different approaches to the relative hyperglycemia denoting the long-term glucose counter-regulation to hypoglycemia is described. The long-term glucose counter-regulation to hypoglycemia may pose challenges to the important glucose control in type 1 diabetes and it has not been sufficiently researched.
In 2 of 4 studies employed, retrospective comparison of CGM glucose after hypoglycemia and in control data free from hypoglycemia (simulated data in one study) indicated a correlation between hypoglycemia and the long-term glucose counter-regulation. In 2 other studies employed, feasible methods for further exploration of the correlation, and, in one of them, also the causalities relating hypoglycemia and the long-term glucose counter-regulation to hypoglycemia, were identified.
Through this PhD-thesis, the relevance of further studies of the long-term glucose counter-regulation has thus been underlined, and means for related further studies have been indicated.

Chapter 11: Conclusion
80
Bibliography
81
Bibliography 1. Kusnik-Joinville O, Weill A, Salanave B, Ricordeau P, Allemand H: Prevalence and
treatment of diabetes in France: trends between 2000 and 2005. Diabetes Metab 34:266-272, 2008
2. Diabetes. Fact sheet No 312 Fact sheet No. 312:2006
3. Economic costs of diabetes in the U.S. In 2007. Diabetes Care 31:596-615, 2008
4. Oliva J, Lobo F, Molina B, Monereo S: Direct health care costs of diabetic patients in Spain. Diabetes Care 27:2616-2621, 2004
5. Geiss LS, Pan L, Cadwell B, Gregg EW, Benjamin SM, Engelgau MM: Changes in incidence of diabetes in U.S. adults, 1997-2003. Am J Prev Med 30:371-377, 2006
6. Cryer PE, Davis SN, Shamoon H: Hypoglycemia in diabetes. Diabetes Care 26:1902-1912, 2003
7. Cryer PE: Hypoglycaemia: the limiting factor in the glycaemic management of Type I and Type II diabetes. Diabetologia 45:937-948, 2002
8. The Diabetes Control and Complications Trial Research Group: The effect of intensive treatment of diabetes on the development and progression of long-term complications in insulin-dependent diabetes mellitus. The Diabetes Control and Complications Trial Research Group. N Engl J Med 329:977-986, 1993
9. Cox DJ, Irvine A, Gonder-Frederick L, Nowacek G, Butterfield J: Fear of hypoglycemia: quantification, validation, and utilization. Diabetes Care 10:617-621, 1987
10. Richmond J: Effects of hypoglycaemia: patients' perceptions and experiences. Br J Nurs 5:1054-1059, 1996
11. Anderson RM: Patient empowerment and the traditional medical model. A case of irreconcilable differences? Diabetes Care 18:412-415, 1995
12. Berger M, Muhlhauser I: Implementation of intensified insulin therapy: a European perspective. Diabet Med 12:201-208, 1995
13. Assal JP, Jacquemet S, Morel Y: The added value of therapy in diabetes: the education of patients for self-management of their disease. Metabolism 46:61-64, 1997
14. Corbett C: Patient Knowledge and Self-Efficacy for Diabetes Management: Impact of Home Care Nurse Interventions. 261-274, 2001
15. Cavan D: Giving power to the patients. Modern diabetes management 2:15-16, 2001
Bibliography
82
16. Pieber TR, Brunner GA, Schnedl WJ, Schattenberg S, Kaufmann P, Krejs GJ: Evaluation of a structured outpatient group education program for intensive insulin therapy. Diabetes Care 18:625-630, 1995
17. Training in flexible, intensive insulin management to enable dietary freedom in people with type 1 diabetes: dose adjustment for normal eating (DAFNE) randomised controlled trial. BMJ 325:746-2002
18. Lowe J, Linjawi S, Mensch M, James K, Attia J: Flexible eating and flexible insulin dosing in patients with diabetes: Results of an intensive self-management course. Diabetes Res Clin Pract 80:439-443, 2008
19. Plougmann S, Hejlesen OK, Cavan DA: DiasNet--a diabetes advisory system for communication and education via the internet. Int J Med Inform 64:319-330, 2001
20. Lehmann ED: AIDA--a computer-based interactive educational diabetes simulator. Diabetes Educ 24:341-6, 348, 1998
21. Franklin VL, Wilson AW, Butler RA, Greene SA: A predictive tool for the self-management of diabetes (Librae): evaluation using a continuous glucose monitoring system. Diabet Med 23:21-25, 2006
22. Hejlesen OK, Andreassen S, Sando SH: Optimization and evaluation of a probabilistic computer model of the glucose metabolism. Applied medical informatics 1:11-24, 1995
23. Chen JW, Christiansen JS, Lauritzen T: Limitations to subcutaneous insulin administration in type 1 diabetes. Diabetes Obes Metab 5:223-233, 2003
24. Heinemann L: Variability of insulin absorption and insulin action. Diabetes Technol Ther 4:673-682, 2002
25. Lauritzen T: Pharmacokinetic and clinical aspects of intensified subcutaneous insulin therapy. Dan Med Bull 32:104-118, 1985
26. Fowelin J, Attvall S, von SH, Smith U, Lager I: Characterization of the late posthypoglycemic insulin resistance in insulin-dependent diabetes mellitus. Metabolism 39:823-826, 1990
27. Gale EA, Kurtz AB, Tattersall RB: In search of the Somogyi effect. Lancet 2:279-282, 1980
28. Guillod L, Comte-Perret S, Monbaron D, Gaillard RC, Ruiz J: Nocturnal hypoglycaemias in type 1 diabetic patients: what can we learn with continuous glucose monitoring? Diabetes Metab 33:360-365, 2007
29. Hirsch IB, Smith LJ, Havlin CE, Shah SD, Clutter WE, Cryer PE: Failure of nocturnal hypoglycemia to cause daytime hyperglycemia in patients with IDDM. Diabetes Care 13:133-142, 1990
Bibliography
83
30. Hoi-Hansen T, Pedersen-Bjergaard U, Thorsteinsson B: The Somogyi phenomenon revisited using continuous glucose monitoring in daily life. Diabetologia 48:2437-2438, 2005
31. Stephenson JM, Schernthaner G: Dawn phenomenon and Somogyi effect in IDDM. Diabetes Care 12:245-251, 1989
32. Tordjman KM, Havlin CE, Levandoski LA, White NH, Santiago JV, Cryer PE: Failure of nocturnal hypoglycemia to cause fasting hyperglycemia in patients with insulin-dependent diabetes mellitus. N Engl J Med 317:1552-1559, 1987
33. Campbell IW: The Somogyi phenomenon. A short review. Acta Diabetol Lat 13:68-73, 1976
34. Frazier LM, Neelon FA: Insulin can make diabetes worse: the smoldering Somogyi effect. N C Med J 45:396-398, 1984
35. Gerich JE: Lilly lecture 1988. Glucose counterregulation and its impact on diabetes mellitus. Diabetes 37:1608-1617, 1988
36. Mozersky RP, Bahl VK, Patel H, Patel N, Palushock S, Yamakawa H, Mook W, Basuray R, Velez-Giraldo JR: Fasting hyperglycemia in type I diabetes mellitus. J Am Osteopath Assoc 93:769-774, 1993
37. Raskin P: The Somogyi phenomenon. Sacred cow or bull? Arch Intern Med 144:781-787, 1984
38. Cryer PE, Binder C, Bolli GB, Cherrington AD, Gale EA, Gerich JE, Sherwin RS: Hypoglycemia in IDDM. Diabetes 38:1193-1199, 1989
39. Cryer PE: Hypoglycemia-associated autonomic failure in diabetes. Am J Physiol Endocrinol Metab 281:E1115-E1121, 2001
40. Somogyi M: Diabetogenic effect of hyperinsulinism. Am J Med 26:192-198, 1959
41. Somogyi M: Exacerbation of diabetes by excess insulin action. Am J Med 26:169-191, 1959
42. Havlin CE, Cryer PE: Nocturnal hypoglycemia does not commonly result in major morning hyperglycemia in patients with diabetes mellitus. Diabetes Care 10:141-147, 1987
43. Perriello G, De FP, Torlone E, Calcinaro F, Ventura MM, Basta G, Santeusanio F, Brunetti P, Gerich JE, Bolli GB: The effect of asymptomatic nocturnal hypoglycemia on glycemic control in diabetes mellitus. N Engl J Med 319:1233-1239, 1988
44. Bolli GB, Dimitriadis GD, Pehling GB, Baker BA, Haymond MW, Cryer PE, Gerich JE: Abnormal glucose counterregulation after subcutaneous insulin in insulin-dependent diabetes mellitus. N Engl J Med 310:1706-1711, 1984
Bibliography
84
45. Kollind M, Adamson U, Lins PE: Insulin resistance following nocturnal hypoglycaemia in insulin-dependent diabetes mellitus. Acta Endocrinol (Copenh) 116:314-320, 1987
46. Attvall S, Eriksson BM, Fowelin J, von SH, Lager I, Smith U: Early posthypoglycemic insulin resistance in man is mainly an effect of beta-adrenergic stimulation. J Clin Invest 80:437-442, 1987
47. Clore JN, Brennan JR, Gebhart SP, Newsome HH, Nestler JE, Blackard WG: Prolonged insulin resistance following insulin-induced hypoglycaemia. Diabetologia 30:851-858, 1987
48. Dagogo-Jack S, Rattarasarn C, Cryer PE: Reversal of hypoglycemia unawareness, but not defective glucose counterregulation, in IDDM. Diabetes 43:1426-1434, 1994
49. Dagogo-Jack SE, Craft S, Cryer PE: Hypoglycemia-associated autonomic failure in insulin-dependent diabetes mellitus. Recent antecedent hypoglycemia reduces autonomic responses to, symptoms of, and defense against subsequent hypoglycemia. J Clin Invest 91:819-828, 1993
50. Fanelli CG, Epifano L, Rambotti AM, Pampanelli S, Di VA, Modarelli F, Lepore M, Annibale B, Ciofetta M, Bottini P, .: Meticulous prevention of hypoglycemia normalizes the glycemic thresholds and magnitude of most of neuroendocrine responses to, symptoms of, and cognitive function during hypoglycemia in intensively treated patients with short-term IDDM. Diabetes 42:1683-1689, 1993
51. Lingenfelser T, Buettner U, Martin J, Tobis M, Renn W, Kaschel R, Jakober B: Improvement of impaired counterregulatory hormone response and symptom perception by short-term avoidance of hypoglycemia in IDDM. Diabetes Care 18:321-325, 1995
52. Caplin NJ, O'Leary P, Bulsara M, Davis EA, Jones TW: Subcutaneous glucose sensor values closely parallel blood glucose during insulin-induced hypoglycaemia. Diabet Med 20:238-241, 2003
53. Fischer U, Rebrin K, von WT, Abel P: Clinical usefulness of the glucose concentration in the subcutaneous tissue--properties and pitfalls of electrochemical biosensors. Horm Metab Res 26:515-522, 1994
54. Wentholt IM, Vollebregt MA, Hart AA, Hoekstra JB, DeVries JH: Comparison of a needle-type and a microdialysis continuous glucose monitor in type 1 diabetic patients. Diabetes Care 28:2871-2876, 2005
55. Kovatchev B, Anderson S, Heinemann L, Clarke W: Comparison of the numerical and clinical accuracy of four continuous glucose monitors. Diabetes Care 31:1160-1164, 2008
Bibliography
85
56. Bolli GB, Gottesman IS, Campbell PJ, Haymond MW, Cryer PE, Gerich JE: Glucose counterregulation and waning of insulin in the Somogyi phenomenon (posthypoglycemic hyperglycemia). N Engl J Med 311:1214-1219, 1984
57. Bruce GL: The Somogyi phenomenon: insulin-induced posthypoglycemic hyperglycemia. Heart Lung 7:463-466, 1978
58. Faber OK, Binder C, Lauritzen T: In search of Somogyi effect. Lancet 2:701-1980
59. Fowelin J, Attvall S, von SH, Smith U, Lager I: Combined effect of growth hormone and cortisol on late posthypoglycemic insulin resistance in humans. Diabetes 38:1357-1364, 1989
60. Holl RW, Heinze E: [The dawn or Somogyi phenomenon? High morning fasting blood sugar values in young type-1 diabetics]. Dtsch Med Wochenschr 117:1503-1507, 1992
61. Kollind M, Adamson U, Lins PE, Efendic S: Diabetogenic action of GH and cortisol in insulin-dependent diabetes mellitus. Aspects of the mechanisms behind the Somogyi phenomenon. Horm Metab Res 19:156-159, 1987
62. McMillan FD, Feldman EC: Rebound hyperglycemia following overdosing of insulin in cats with diabetes mellitus. J Am Vet Med Assoc 188:1426-1431, 1986
63. Johansen MD, Hejlesen O: Model-based balancing of unmatched data in model-generated hypothesis evaluation. Proceedings of Skandinaviska hälsoinformatik- och termkonferansen 2008 :2008
64. Iseda I, Lins PE, Adamson U, Kollind M: Comment to: Hoi-Hansen T, Pedersen-Bjergaard U, Thorsteinsson B (2005) The Somogyi phenomenon revisited using continuous glucose monitoring in daily life. Diabetologia 48:2437-2438. Diabetologia :2006
65. Somogyi M: Effect of insulin hypoglycemia on alimentary hyperglycemia. J Biol Chem 193:859-871, 1951
66. Watling SM, Lusk JA, III: Glyburide and possible Somogyi effect. Drug Intell Clin Pharm 22:1003-1988
67. De FP, Perriello G, De CS, Ventura MM, Campbell PJ, Brunetti P, Gerich JE, Bolli GB: Comparison of glucose counterregulation during short-term and prolonged hypoglycemia in normal humans. Diabetes 35:563-569, 1986
68. De FP, Perriello G, Bolli GB: Somogyi and dawn phenomena: mechanisms. Diabetes Metab Rev 4:31-49, 1988
69. Meyerhoff C, Bischof F, Sternberg F, Zier H, Pfeiffer EF: On line continuous monitoring of subcutaneous tissue glucose in men by combining portable glucosensor with microdialysis. Diabetologia 35:1087-1092, 1992
Bibliography
86
70. Hoi-Hansen T, Pedersen-Bjergaard U, Thorsteinsson B: Reproducibility and reliability of hypoglycaemic episodes recorded with Continuous Glucose Monitoring System (CGMS) in daily life. Diabet Med 22:858-862, 2005
71. Berger M: Curriculum for a treatment and training program for Patients with type 1 diabetes. 1996
72. Plougmann S, Hejlesen O, Turner B, Kerr D, Cavan D: Modelling the effect of alcohol in Type 1 diabetes. Stud Health Technol Inform 90:66-71, 2002
73. Hejlesen OK, Andreassen S, Cavan DA, Hovorka R: Analysing the hypoglycaemic counter-regulation: a clinically relevant phenomenon? Comput Methods Programs Biomed 50:231-240, 1996
74. Hejlesen OK, Andreassen S, Hovorka R, Cavan DA: DIAS--the diabetes advisory system: an outline of the system and the evaluation results obtained so far. Comput Methods Programs Biomed 54:49-58, 1997
75. Hejlesen OK, Andreassen S, Frandsen NE, Sorensen TB, Sando SH, Hovorka R, Cavan DA: Using a double blind controlled clinical trial to evaluate the function of a Diabetes Advisory System: a feasible approach? Comput Methods Programs Biomed 56:165-173, 1998
76. Sachedina N, Pickup JC: Performance assessment of the Medtronic-MiniMed Continuous Glucose Monitoring System and its use for measurement of glycaemic control in Type 1 diabetic subjects. Diabet Med 20:1012-1015, 2003
77. Pfutzner J, Forst T, Butzer R, Forst S, Weber MM, Pfutzner AH, Pfutzner A: Performance of the continuous glucose monitoring system (CGMS) during development of ketosis in patients on insulin pump therapy. Diabet Med 23:1124-1129, 2006
78. Larsen MO, Rolin B: Use of the Gottingen minipig as a model of diabetes, with special focus on type 1 diabetes research. ILAR J 45:303-313, 2004
79. Lin S, Chen LL, Chien YW: Comparative pharmacokinetic and pharmacodynamic studies of human insulin and analogues in chronic diabetic Yucatan minipigs. J Pharmacol Exp Ther 286:959-966, 1998
80. Qvist MH, Hoeck U, Kreilgaard B, Madsen F, Frokjaer S: Evaluation of Gottingen minipig skin for transdermal in vitro permeation studies. Eur J Pharm Sci 11:59-68, 2000
81. Barb CR, Cox NM, Carlton CA, Chang WJ, Randle RF: Growth hormone secretion, serum, and cerebral spinal fluid insulin and insulin-like growth factor-I concentrations in pigs with streptozotocin-induced diabetes mellitus. Proc Soc Exp Biol Med 201:223-228, 1992

Bibliography
87
82. Canavan JP, Flecknell PA, New JP, Alberti KG, Home PD: The effect of portal and peripheral insulin delivery on carbohydrate and lipid metabolism in a miniature pig model of human IDDM. Diabetologia 40:1125-1134, 1997
83. Larsen MO, Rolin B, Wilken M, Carr RD, Svendsen O, Bollen P: Parameters of glucose and lipid metabolism in the male Gottingen minipig: influence of age, body weight, and breeding family. Comp Med 51:436-442, 2001
84. Mesangeau D, Laude D, Elghozi JL: Early detection of cardiovascular autonomic neuropathy in diabetic pigs using blood pressure and heart rate variability. Cardiovasc Res 45:889-899, 2000
85. Larsen MO, Rolin B, Wilken M, Carr RD, Gotfredsen CF: Measurements of insulin secretory capacity and glucose tolerance to predict pancreatic beta-cell mass in vivo in the nicotinamide/streptozotocin Gottingen minipig, a model of moderate insulin deficiency and diabetes. Diabetes 52:118-123, 2003
86. Dufrane D, van SM, Guiot Y, Goebbels RM, Saliez A, Gianello P: Streptozotocin-induced diabetes in large animals (pigs/primates): role of GLUT2 transporter and beta-cell plasticity. Transplantation 81:36-45, 2006
87. Strauss A, Tiurbe C, Chodnevskaja I, Thiede A, Timm S, Ulrichs K, Moskalenko V: Use of the continuous glucose monitoring system in Goettingen Minipigs, with a special focus on the evaluation of insulin-dependent diabetes. Transplant Proc 40:536-539, 2008
88. Larsen MO, Wilken M, Gotfredsen CF, Carr RD, Svendsen O, Rolin B: Mild streptozotocin diabetes in the Gottingen minipig. A novel model of moderate insulin deficiency and diabetes. Am J Physiol Endocrinol Metab 282:E1342-E1351, 2002
89. Henderson KK, Mokelke EA, Turk JR, Rector RS, Laughlin MH, Sturek M: Maintaining patency and asepsis of vascular access ports in Yucatan miniature swine. Contemp Top Lab Anim Sci 42:28-32, 2003
90. Moritz MW, Dawe EJ, Holliday JF, Elliott S, Mattei JA, Thomas AL: Chronic central vein catheterization for intraoperative and long-term venous access in swine. Lab Anim Sci 39:153-155, 1989
91. O'grady NP, Alexander M, Dellinger EP, Gerberding JL, Heard SO, Maki DG, Masur H, McCormick RD, Mermel LA, Pearson ML, Raad II, Randolph A, Weinstein RA: Guidelines for the prevention of intravascular catheter-related infections. Am J Infect Control 30:476-489, 2002
92. Swindle MM: Surgery, anesthesia, and experimental techniques in swine. Ames, IA, Iowa State University Press, 1998
93. Larsen MO, Rolin B, Sturis J, Wilken M, Carr RD, Porksen N, Gotfredsen CF: Measurements of insulin responses as predictive markers of pancreatic beta-cell
Bibliography
88
mass in normal and beta-cell-reduced lean and obese Gottingen minipigs in vivo. Am J Physiol Endocrinol Metab 290:E670-E677, 2006
94. Swindle MM, Smith AC, Goodrich JA: Chronic cannulation and fistulization procedures in swine: a review and recommendations. J Invest Surg 11:7-20, 1998
95. Cowart RP, Payne JT, Turk JR, Tyler JW, Casteel SW: Factors Optimizing the Use of Subcutaneous Vascular Access Ports in Weaned Pigs. Contemp Top Lab Anim Sci 38:67-70, 1999
96. Chuang M, Orvieto M, Laven B, Gerber G, Wardrip C, Ritch C, Shalhav A: Comparison of external catheters with subcutaneous vascular access ports for chronic vascular access in a porcine model. Contemp Top Lab Anim Sci 44:24-27, 2005
97. Kohler TR, Kirkman TR: Central venous catheter failure is induced by injury and can be prevented by stabilizing the catheter tip. J Vasc Surg 28:59-65, 1998
98. Ege CA, Parra NC, Johnson TE: Noninfectious complications due to vascular access ports (VAPs) in Yucatan minipigs (Sus scrofa domestica). J Am Assoc Lab Anim Sci 45:27-34, 2006
99. Stump KC, Swindle MM, Saudek CD, Strandberg JD: Pancreatectomized swine as a model of diabetes mellitus. Lab Anim Sci 38:439-443, 1988
100. Hara H, Lin YJ, Zhu X, Tai HC, Ezzelarab M, Balamurugan AN, Bottino R, Houser SL, Cooper DK: Safe induction of diabetes by high-dose streptozotocin in pigs. Pancreas 36:31-38, 2008
101. Wilson DE: Excessive insulin therapy: biochemical effects and clinical repercussions. Current concepts of counterregulation in type I diabetes. Ann Intern Med 98:219-227, 1983
102. Gerrity RG, Natarajan R, Nadler JL, Kimsey T: Diabetes-induced accelerated atherosclerosis in swine. Diabetes 50:1654-1665, 2001
103. Roth DA, White CD, Hamilton CD, Hall JL, Stanley WC: Adrenergic desensitization in left ventricle from streptozotocin diabetic swine. J Mol Cell Cardiol 27:2315-2325, 1995
104. Gabel H, Bitter-Suermann H, Henriksson C, Save-Soderbergh J, Lundholm K, Brynger H: Streptozotocin diabetes in juvenile pigs. Evaluation of an experimental model. Horm Metab Res 17:275-280, 1985
105. Liu X, Mellert J, Hering BJ, Brendel MD, Federlin K, Bretzel RG, Hopt UT: Sensitivity of porcine islet beta cells to the diabetogenic action of streptozotocin. Transplant Proc 30:574-575, 1998
106. Feldman EC, Nelson RW: Insulin-induced hyperglycemia in diabetic dogs. J Am Vet Med Assoc 180:1432-1437, 1982

Bibliography
89
Bibliography
90
91
SUBMITTED AND PUBLISHED PAPERS
The four papers are enclosed.
Statuses of the papers of September 2008:
“Retrospective analysis of the long-term glucose counter-regulation to hypoglycemia in continuous glucose data” – submitted to the Journal of Diabetes Science and Technology
“Model-based balancing of unmatched data in model-generated hypothesis evaluation” – published in the Proceedings of 6th Scandinavian Conference on Health Informatics, 26-28 August 2008, Kalmar, Sweden
“CGM glucose overshoot after hypoglycemia assessed by a simulation tool” – submitted to the Journal of Diabetes Science and Technology
“Implementation of an intensive chronic type 1 diabetes model with tight blood glucose control in Göttingen Minipigs” – submitted to Diabetes
Retrospective Analysis of the Long-term Glucose Counter-regulation to Hypoglycemia in Continuous Glucose Data
Dencker Johansen
Retrospective analysis of the
long-term glucose counter-regulation to hypoglycemia in continuous glucose data
Mette Dencker Johansen, M.Sc.1, Jens Sandahl Christiansen, M.D., D.M.Sc., F.R.C.P.I.2,
Ole K. Hejlesen, Ph.D.1
Abstract
Background: The hypothesis of a long-term glucose counter-regulation has gained recent interest with the development of continuous glucose monitoring (CGM) technologies, but no long-term studies have been performed. The aim of this study was to evaluate the hypothesis using CGM. Method: Analysis was conducted of insulin treated diabetics’ CGM data. For each patient, hypoglycemic events were identified when blood glucose was <54 mg/dl for >15 minutes and included for those cases where a hypoglycemia-free period existed within 15 hours before and after and where control, free of near-hypoglycemia (blood glucose <72 mg/dl for 15 minutes) period could be identified at the same time of the day as the hypoglycemia. Blood glucose profiles for each hypoglycemia with near-hypoglycemia-free control were compared. Insulin and carbohydrate intake were also compared. Results: 10 hypoglycemic events in 10 type 1 diabetics were included. No significant difference in blood glucose was seen after hypoglycemia, but insulin intake was 5.7 IU (higher for the first 24 hours after hypoglycemia than in the control period. The carbohydrate intake was 38 g lower after hypoglycemia than in the control periods. Conclusion: The little difference in blood glucose indicates no long-term glucose counter-regulation to hypoglycemia. However, the higher insulin intake and lower carbohydrate intake after hypoglycemia both have hypoglycemic effects, and the blood glucose would therefore
Author affiliations: 1 Medical Informatics Group, Department of Health Science and Technology, Aalborg University, Denmark; 2 Department of Endocrinology and Diabetes, Århus Sygehus, Århus University Hospital, Denmark _____________________________ Abbreviations: (CGM) continuous glucose sensor, (BMI) body mass index, (HbA1C) hemoglobin A1 _____________________________ Keywords: continuous glucose sensors, hypoglycemia, physiopathology, type 1 diabetes mellitus _____________________________ Corresponding Author: Mette Dencker Johansen, M.Sc., Medical Informatics Group, Department of Health Science and Technology, Fredrik Bajersvej 7D, DK-9220 Aalborg E, Denmark, fax: 98154008, email: [email protected]
1
Retrospective Analysis of the Long-term Glucose Counter-regulation to Hypoglycemia in Continuous Glucose Data
Dencker Johansen
probably be higher after hypoglycemia than in the control period if the insulin and carbohydrate intakes had been similar.
Introduction Hypoglycemia-induced delayed hyperglycemia, first hypothesized by Somogyi in 1951, has received renewed interest1;2. The recent interest is largely governed by the data resolution potential introduced by the continuous glucose monitoring (CGM) technologies, as these technologies enable reliable, long-term and very frequent sampling of glucose values comparable to blood glucose values3;4. Over the years, different labels have been applied to what is apparently the same phenomenon: ‘Somogyi phenomenon’, ‘Somogyi effect’1;2;5-17, ‘rebound hyperglycemia’18, and ‘long-term glucose counter-regulation to hypoglycemia’19. This paper uses the latter term. Various study designs have been applied for analyzing long-term glucose counter-regulation to hypoglycemia 1;2;5;9-13;15;17;20-
23. Study designs vary in hypoglycemia time, as some researchers have explored only nocturnal hypoglycemia, which is suggested to cause morning hyperglycemia1;2;11;13;24-26, whereas others have not restricted themselves to nocturnal hypoglycemia5;9;27-29. Study designs also vary regarding the extent of hyperglycemia, as some groups have considered only absolute hyperglycemia to indicate the existence of a long-term glucose counter-regulation to hypoglycemia5;11;24, whereas other designs have considered hyperglycemia only relative to glucose values in cases with no preceding hypoglycemia 13;25-27. Finally, study designs vary regarding duration, as they range from rather short (0-6 hours)1;5;11;16;17;28 to longer (8-24 hours)13;15;24;26;27;30. Study designs have also varied due to different hypotheses regarding manifestations and due to practical methodological limitations, for instance regarding (blood) glucose sampling frequency.
A more cautious approach to the exploration of the long-term glucose counter-regulation to hypoglycemia may be a long-term analysis of high-resolution data with no assumptions regarding the time of day of the occurrence of hypoglycemia, but this has never been applied using the CGM technology. This paper presents a retrospective analysis of a blood glucose sensor data set for the evaluation of a hypothesis of a long-term glucose counter-regulation to hypoglycemia, manifested as a delayed hyperglycemia relative to control, hypoglycemia-free glycemia.
Materials and methods The study was conducted at four centers (Medical Department M, Aarhus University Hospital, Denmark; Profil Institute for Metabolic Research, Neuss; German Diabetes Research Institute at the Heinrich-Heine University of Duesseldorf; and Department of Pharmaceutical Technology and Biopharmacy, University Center of Pharmacy, University of Groningen, The Netherlands). The four centers participated in the clinical in vivo evaluation of the SCGM 1 system (Roche Diagnostics, Mannheim, Germany). Patients who participated in the experiment were recruited from their respective outpatient clinics. Both type 1 and type 2 diabetics were included. The patients were encouraged to live their normal every-day lives with their normal therapy (primarily insulin), and they were further encouraged to perform the same amount of activities on all study days. They were not given access to CGM data during data collection. All patients received written and oral information according to the Declaration
2

Retrospective Analysis of the Long-term Glucose Counter-regulation to Hypoglycemia in Continuous Glucose Data
Dencker Johansen
of Helsinki II and signed consent forms. The study was approved by the local ethics committees of the four centers participating in the study and was performed according to Good Clinical Practice Guidelines. SCGM 1 system The SCGM 1 system is based on the glucose oxidase principle and consists of a sensor unit device and a belt-held sensor holding the microdialysis system. The system allows up to 120 hours of minutely dialysate glucose measurements. Data are stored by custom designed software, and on-line display of dialysate glucose is transferred wirelessly from the sensor unit to the portable data manager. Additional information (insulin administration, meals, exercise, etc.) can be entered as separate events in the data managing device. The sensor unit uses a roller pump that provides a push-pull flow, resulting in a perfusion of the microdialysis membrane with 0.3 µl/min. The perfusion fluid (Ringer chloride, Na+147 mmol/liter; K+ 1.4 mmol/liter; Ca2+ 2.3 mmol/liter; Cl- 156 mmol/liter, pH 6; osmolality 290 mosmol/kg) passes through the catheter, achieving approximately 95% equilibration with the interstitial fluid 31. Glucose oxidase is mixed with the dialysate and passes the ex vivo sensor, creating a current in the nanoampere range. The current is averaged over 60 seconds, and data are stored. Study procedure The microdialysis probe was inserted into the subcutaneous abdominal adipose tissue after skin puncture with a 16-gauge needle. The sensor was left in place for 4 days. For calibration of the SCGM 1 system, spot capillary glucose measurements were used. Data analysis The sensor glucose profiles were calibrated by fitting the paired meter data and sensor data to a line and adjusting the sensor data to the gain and offset identified by the fitting.
All hypoglycemic events were identified in the calibrated data. An episode of hypoglycemia was defined to be at least 15 minutes of sensor glucose ≤54 mg/dl, and at least 10 minutes of sensor glucose ≥54 mg/dl or missing data defined the end of a hypoglycemic episode. All episodes of missing data were identified in the uncalibrated data. A data missing episode was defined to be at least 10 minutes of missing data (the value 0 saved by the glucose sensor), and at least 10 minutes of non-missing data defined the end of a data missing episode. Near-hypoglycemic events for definitely hypoglycemia-free control periods, despite sensor inaccuracies, were defined to be at least 15 minutes of sensor glucose ≤72 mg/dl, and at least 10 minutes of sensor glucose ≥72 mg/dl or missing data defined the end of a near-hypoglycemic episode Hypoglycemic events beginning ≤20 hours after the data collection start were excluded. Of the hypoglycemic events beginning >20 after the start of data collection, the hypoglycemias preceded by missing data episodes within 15 hours were excluded. Of the hypoglycemic events not preceded too recently by data collection start or missing data episodes, hypoglycemias preceded by any hypoglycemia (not necessarily without too recent data collection start or missing data episode) within 15 hours were excluded. Of the hypoglycemic events free of recent data start, missing data episodes or hypoglycemia, hypoglycemias followed by any hypoglycemia (not necessarily free of recent data collection start, missing data episodes, or hypoglycemia) within 15 hours were excluded. Control periods were identified at the same time of the day as the hypoglycemia to which they corresponded. Control periods were excluded if they occurred <20 hours before data collection start, or if they were preceded or followed by near-hypoglycemia or missing data episodes
3
Retrospective Analysis of the Long-term Glucose Counter-regulation to Hypoglycemia in Continuous Glucose Data
Dencker Johansen
within 15 hours (from the time of candidate control period start). Hypoglycemic events in subjects with no information on insulin injection during the data collection period were excluded, as were patients not treated with multiple insulin injections but with continuous subcutaneous insulin infusion (insulin pump). For each hypoglycemia, the sensor glucose difference between hypoglycemia day and control day (control days, if more control days were found for a specific hypoglycemia) was calculated as hypoglycemia day sensor glucose minus control day sensor glucose. Data calibration and hypoglycemia analysis was performed using Matlab (the Mathworks, Inc., Natick, MA). Hypoglycemia and control period data analysis was performed using the Excel spreadsheet program (Microsoft Corporation, Redmond, WA). Results are given as mean ±SD (range).
Results 159 subjects were included, of which 146 were diabetic (135 type 1 diabetic). Of the diabetics, 91 were male. Age was 36 ± 12 (17-72) years, diabetes duration 15 ± 10 (0-41) years. BMI was 24.9 ± 4.4 (17.9-44.5). HbA1C was 8.1 ± 1.7 (5.3-14.1). Only one subject was not treated with insulin, and 28 were on continuous subcutaneous insulin infusion. In total, 134 hypoglycemic episodes were identified. Of the 134 hypoglycemic episodes, 36 were excluded because they occurred <20 hours before the start of data collection, none were excluded because they were preceded by missing data within 15 hours, 70 were excluded because they were preceded or followed by other hypoglycemias within 15 hours. This left 64 hypoglycemias for control period identification. There were 23 hypoglycemias in 20 subjects that had corresponding control periods. Of these, 11 hypoglycemias in 11 subjects (6
female) were supported by insulin data, but one female was treated with continuous subcutaneous insulin infusion and excluded. Thus, 10 patients (5 female) were included in the study. Four patients also had carbohydrate intake data. All 10 were type 1 diabetics. Age of included diabetics was 34 ± 12 (20-59), diabetes duration 16 ± 9 (7-34), BMI 24.6 ± 4 (20.4-34.0), HbA1C 7.9 ± 2 (6.1-10.9). One hypoglycemia was nocturnal (12 pm – 6 am), one was before noon (6 am – 12 am), 7 were after noon (12 am – 6 pm) and one was in the evening (6 pm – 12 pm). No apparent difference in sensor glucose difference was seen with respect to hypoglycemia time. Data for insulin injections and for carbohydrate intake, where recorded, is shown in table 1. Mean total carbohydrate intake after hypoglycemia was 152 g, in the control period 190 g (n=4). Mean total insulin intake after hypoglycemia was 38.6 IU, in the control period 32.9 IU (n=10). There was no difference in long-acting insulin on intervention (hypoglycemia) and control periods. No difference was seen in sensor glucose (hypoglycemia minus control) (Figure 1).
Discussion This study employs a retrospective analysis of blood glucose sensor data set for the evaluation of a hypothesis of a long-term glucose counter-regulation to hypoglycemia. The hyperglycemia manifesting the long-term glucose counter-regulation to hypoglycemia was expected to be delayed and to appear relative to the glycemia in control, hypoglycemia-free cases rather than in absolute terms. The occurrence of hypoglycemia corresponds to the prevalence of hypoglycemia detected by continuous glucose monitoring systems in unspecific patient groups 32. The included number of hypoglycemic events, however, is low
4
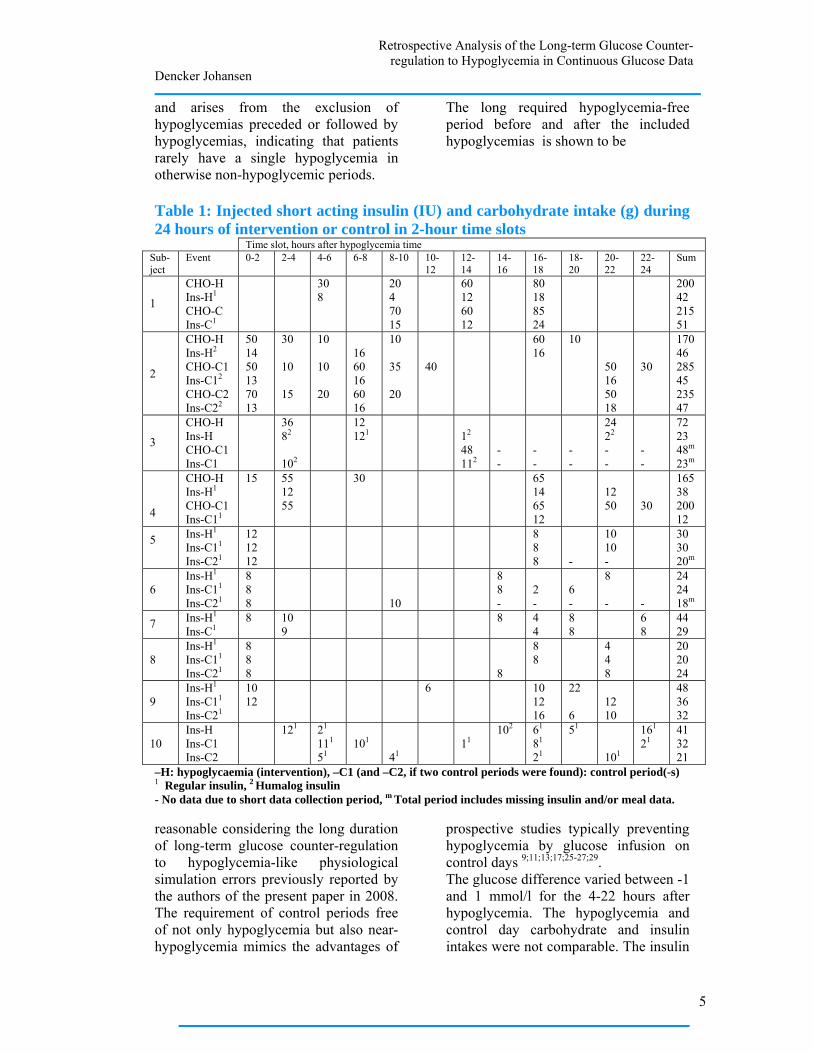
Retrospective Analysis of the Long-term Glucose Counter-regulation to Hypoglycemia in Continuous Glucose Data
Dencker Johansen
and arises from the exclusion of hypoglycemias preceded or followed by hypoglycemias, indicating that patients rarely have a single hypoglycemia in otherwise non-hypoglycemic periods.
The long required hypoglycemia-free period before and after the included hypoglycemias is shown to be
Table 1: Injected short acting insulin (IU) and carbohydrate intake (g) during 24 hours of intervention or control in 2-hour time slots
Time slot, hours after hypoglycemia time Sub- ject
Event 0-2 2-4 4-6 6-8 8-10 10-12
12-14
14-16
16-18
18-20
20-22
22-24
Sum
1
CHO-H Ins-H1
CHO-C Ins-C1
30 8
20 4 70 15
60 12 60 12
80 18 85 24
200 42 215 51
2
CHO-H Ins-H2
CHO-C1 Ins-C12
CHO-C2 Ins-C22
50 14 50 13 70 13
30 10 15
10 10 20
16 60 16 60 16
10 35 20
40
60 16
10 50 16 50 18
30
170 46 285 45 235 47
3
CHO-H Ins-H CHO-C1 Ins-C1
36 82
102
12 121
12
48 112
- -
- -
- -
24 22
- -
- -
72 23 48m
23m
4
CHO-H Ins-H1
CHO-C1 Ins-C11
15 55 12 55
30 65 14 65 12
12 50
30
165 38 200 12
5 Ins-H1
Ins-C11
Ins-C21
12 12 12
8 8 8
-
10 10 -
30 30 20m
6
Ins-H1
Ins-C11
Ins-C21
8 8 8
10
8 8 -
2 -
6 -
8 -
-
24 24 18m
7 Ins-H1
Ins-C18
10 9
8
4 4
8 8
6 8
44 29
8
Ins-H1
Ins-C11
Ins-C21
8 8 8
8
8 8
4 4 8
20 20 24
9
Ins-H1
Ins-C11
Ins-C21
1012
6 10 12 16
22 6
12 10
48 36 32
10
Ins-H Ins-C1 Ins-C2
121 21
111
51
101
41
11
102 61
81
21
51 101
161
2141 32 21
–H: hypoglycaemia (intervention), –C1 (and –C2, if two control periods were found): control period(-s) 1 Regular insulin, 2 Humalog insulin - No data due to short data collection period, m Total period includes missing insulin and/or meal data. reasonable considering the long duration of long-term glucose counter-regulation to hypoglycemia-like physiological simulation errors previously reported by the authors of the present paper in 2008. The requirement of control periods free of not only hypoglycemia but also near-hypoglycemia mimics the advantages of
prospective studies typically preventing hypoglycemia by glucose infusion on control days 9;11;13;17;25-27;29. The glucose difference varied between -1 and 1 mmol/l for the 4-22 hours after hypoglycemia. The hypoglycemia and control day carbohydrate and insulin intakes were not comparable. The insulin
5
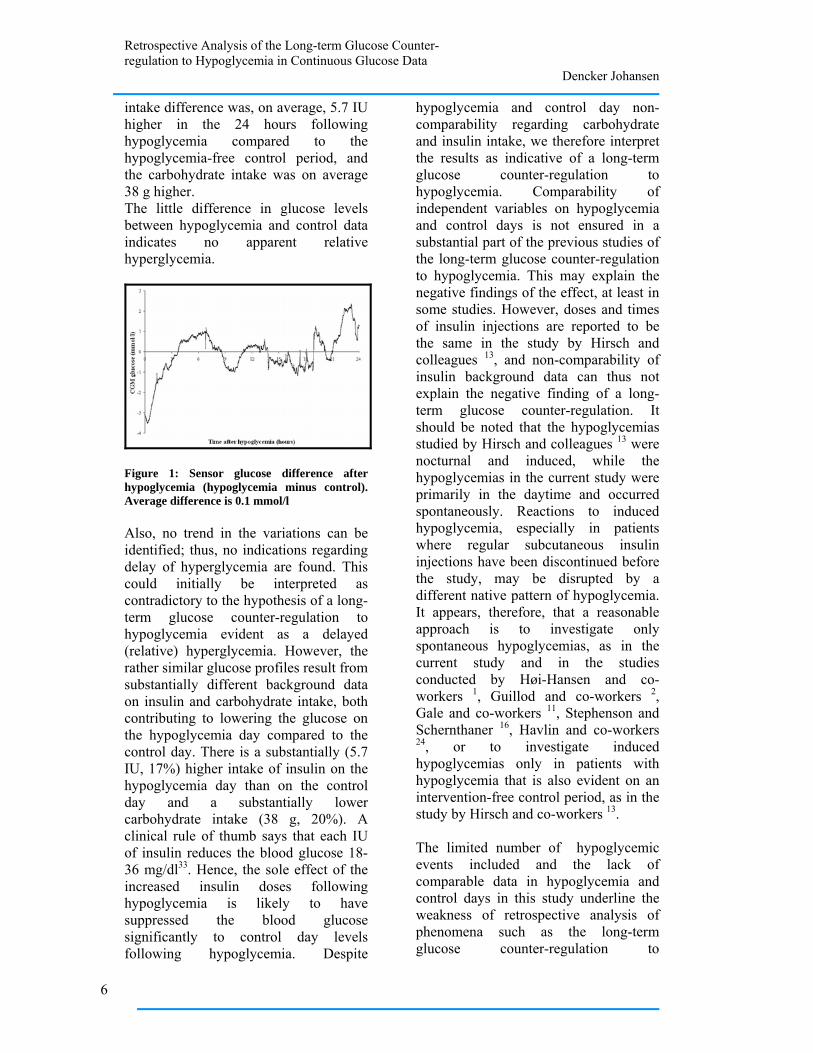
Retrospective Analysis of the Long-term Glucose Counter-regulation to Hypoglycemia in Continuous Glucose Data
Dencker Johansen
intake difference was, on average, 5.7 IU higher in the 24 hours following hypoglycemia compared to the hypoglycemia-free control period, and the carbohydrate intake was on average 38 g higher. The little difference in glucose levels between hypoglycemia and control data indicates no apparent relative hyperglycemia.
Figure 1: Sensor glucose difference after hypoglycemia (hypoglycemia minus control). Average difference is 0.1 mmol/l Also, no trend in the variations can be identified; thus, no indications regarding delay of hyperglycemia are found. This could initially be interpreted as contradictory to the hypothesis of a long-term glucose counter-regulation to hypoglycemia evident as a delayed (relative) hyperglycemia. However, the rather similar glucose profiles result from substantially different background data on insulin and carbohydrate intake, both contributing to lowering the glucose on the hypoglycemia day compared to the control day. There is a substantially (5.7 IU, 17%) higher intake of insulin on the hypoglycemia day than on the control day and a substantially lower carbohydrate intake (38 g, 20%). A clinical rule of thumb says that each IU of insulin reduces the blood glucose 18-36 mg/dl33. Hence, the sole effect of the increased insulin doses following hypoglycemia is likely to have suppressed the blood glucose significantly to control day levels following hypoglycemia. Despite
hypoglycemia and control day non-comparability regarding carbohydrate and insulin intake, we therefore interpret the results as indicative of a long-term glucose counter-regulation to hypoglycemia. Comparability of independent variables on hypoglycemia and control days is not ensured in a substantial part of the previous studies of the long-term glucose counter-regulation to hypoglycemia. This may explain the negative findings of the effect, at least in some studies. However, doses and times of insulin injections are reported to be the same in the study by Hirsch and colleagues 13, and non-comparability of insulin background data can thus not explain the negative finding of a long-term glucose counter-regulation. It should be noted that the hypoglycemias studied by Hirsch and colleagues 13 were nocturnal and induced, while the hypoglycemias in the current study were primarily in the daytime and occurred spontaneously. Reactions to induced hypoglycemia, especially in patients where regular subcutaneous insulin injections have been discontinued before the study, may be disrupted by a different native pattern of hypoglycemia. It appears, therefore, that a reasonable approach is to investigate only spontaneous hypoglycemias, as in the current study and in the studies conducted by Høi-Hansen and co-workers 1, Guillod and co-workers 2, Gale and co-workers 11, Stephenson and Schernthaner 16, Havlin and co-workers 24, or to investigate induced hypoglycemias only in patients with hypoglycemia that is also evident on an intervention-free control period, as in the study by Hirsch and co-workers 13. The limited number of hypoglycemic events included and the lack of comparable data in hypoglycemia and control days in this study underline the weakness of retrospective analysis of phenomena such as the long-term glucose counter-regulation to
6
Retrospective Analysis of the Long-term Glucose Counter-regulation to Hypoglycemia in Continuous Glucose Data
Dencker Johansen
hypoglycemia, even in large data sets. Further work in the exploration of the long-term glucose counter-regulation to hypoglycemia should thus approach this limitation and carefully design data collection that takes into consideration comparability of days and the influence of native hypoglycemia patterns.
Conclusions
The CGM glucose after hypoglycemia was similar to the CGM glucose in hypoglycemia-free control periods, but larger insulin doses and smaller meals after hypoglycemia indicate that the hypothesis of a long-term glucose counter-regulation to hypoglycemia cannot be rejected but is justified for further research. Acknowledgments: The study was supported by an unrestricted grant from Roche Diagnostics and was performed in collaboration with the Glucose Monitoring Study Group. Disclosures The dataset analyzed in this study was collected by researchers who received an unrestricted research grant from Roche Diagnostics. Roche Diagnostics is currently developing continuous glucose monitoring devices for commercial purposes. Jens Sandahl Christiansen has received unrestricted research grants from Novo Nordisk, Pfizer, and Roche. He has received honoraries for an ad hoc advisory from Roche, PreciSense, OrSense, and Novo Nordisk and has received lecture fees from Roche, Novo Nordisk, and Pfizer. Reference list (1) Hoi-Hansen T, Pedersen-Bjergaard
U, Thorsteinsson B. The Somogyi phenomenon revisited using continuous glucose monitoring in
daily life. Diabetologia 2005; 48(11):2437-2438.
(2) Guillod L, Comte-Perret S, Monbaron D, Gaillard RC, Ruiz J. Nocturnal hypoglycaemias in type 1 diabetic patients: what can we learn with continuous glucose monitoring? Diabetes Metab 2007; 33(5):360-365.
(3) Wentholt IM, Vollebregt MA, Hart AA, Hoekstra JB, DeVries JH. Comparison of a needle-type and a microdialysis continuous glucose monitor in type 1 diabetic patients. Diabetes Care 2005; 28(12):2871-2876.
(4) Kovatchev B, Anderson S, Heinemann L, Clarke W. Comparison of the numerical and clinical accuracy of four continuous glucose monitors. Diabetes Care 2008; 31(6):1160-1164.
(5) Bolli GB, Gottesman IS, Campbell PJ, Haymond MW, Cryer PE, Gerich JE. Glucose counterregulation and waning of insulin in the Somogyi phenomenon (posthypoglycemic hyperglycemia). N Engl J Med 1984; 311(19):1214-1219.
(6) Bruce GL. The Somogyi phenomenon: insulin-induced posthypoglycemic hyperglycemia. Heart Lung 1978; 7(3):463-466.
(7) Campbell IW. The Somogyi phenomenon. A short review. Acta Diabetol Lat 1976; 13(1-2):68-73.
(8) Faber OK, Binder C, Lauritzen T. In search of Somogyi effect. Lancet 1980; 2(8196):701.
(9) Fowelin J, Attvall S, von SH, Smith U, Lager I. Characterization of the late posthypoglycemic insulin resistance in insulin-dependent diabetes mellitus. Metabolism 1990; 39(8):823-826.
7
Retrospective Analysis of the Long-term Glucose Counter-regulation to Hypoglycemia in Continuous Glucose Data
Dencker Johansen
(10) Fowelin J, Attvall S, von SH, Smith U, Lager I. Combined effect of growth hormone and cortisol on late posthypoglycemic insulin resistance in humans. Diabetes 1989; 38(11):1357-1364.
(11) Gale EA, Kurtz AB, Tattersall RB. In search of the Somogyi effect. Lancet 1980; 2(8189):279-282.
(12) Gerich JE. Lilly lecture 1988. Glucose counterregulation and its impact on diabetes mellitus. Diabetes 1988; 37(12):1608-1617.
(13) Hirsch IB, Smith LJ, Havlin CE, Shah SD, Clutter WE, Cryer PE. Failure of nocturnal hypoglycemia to cause daytime hyperglycemia in patients with IDDM. Diabetes Care 1990; 13(2):133-142.
(14) Holl RW, Heinze E. [The dawn or Somogyi phenomenon? High morning fasting blood sugar values in young type-1 diabetics]. Dtsch Med Wochenschr 1992; 117(40):1503-1507.
(15) Kollind M, Adamson U, Lins PE, Efendic S. Diabetogenic action of GH and cortisol in insulin-dependent diabetes mellitus. Aspects of the mechanisms behind the Somogyi phenomenon. Horm Metab Res 1987; 19(4):156-159.
(16) Stephenson JM, Schernthaner G. Dawn phenomenon and Somogyi effect in IDDM. Diabetes Care 1989; 12(4):245-251.
(17) Tordjman KM, Havlin CE, Levandoski LA, White NH, Santiago JV, Cryer PE. Failure of nocturnal hypoglycemia to cause fasting hyperglycemia in patients with insulin-dependent diabetes mellitus. N Engl J Med 1987; 317(25):1552-1559.
(18) McMillan FD, Feldman EC. Rebound hyperglycemia following overdosing of insulin in cats with
diabetes mellitus. J Am Vet Med Assoc 1986; 188(12):1426-1431.
(19) Johansen MD, Hejlesen O. Model-based balancing of unmatched data in model-generated hypothesis evaluation Proceedings of Skandinaviska hälsoinformatik- och termkonferansen 2008: Proceedings of the Skandinaviska hälsoinformatik- och termkonferansen; 26-8-2008; Kalmar, Sweden: 2008
(20) Iseda I, Lins PE, Adamson U, Kollind M. Comment to: Hoi-Hansen T, Pedersen-Bjergaard U, Thorsteinsson B (2005) The Somogyi phenomenon revisited using continuous glucose monitoring in daily life. Diabetologia 48:2437-2438. Diabetologia 2006.
(21) Mozersky RP, Bahl VK, Patel H, Patel N, Palushock S, Yamakawa H et al. Fasting hyperglycemia in type I diabetes mellitus. J Am Osteopath Assoc 1993; 93(7):769-774.
(22) Somogyi M. Effect of insulin hypoglycemia on alimentary hyperglycemia. J Biol Chem 1951; 193(2):859-871.
(23) Watling SM, Lusk JA, III. Glyburide and possible Somogyi effect. Drug Intell Clin Pharm 1988; 22(12):1003.
(24) Havlin CE, Cryer PE. Nocturnal hypoglycemia does not commonly result in major morning hyperglycemia in patients with diabetes mellitus. Diabetes Care 1987; 10(2):141-147.
(25) Kollind M, Adamson U, Lins PE. Insulin resistance following nocturnal hypoglycaemia in insulin-dependent diabetes mellitus. Acta Endocrinol (Copenh) 1987; 116(3):314-320.
(26) Perriello G, De FP, Torlone E, Calcinaro F, Ventura MM, Basta G
8
Retrospective Analysis of the Long-term Glucose Counter-regulation to Hypoglycemia in Continuous Glucose Data
Dencker Johansen
et al. The effect of asymptomatic nocturnal hypoglycemia on glycemic control in diabetes mellitus. N Engl J Med 1988; 319(19):1233-1239.
(27) Bolli GB, Dimitriadis GD, Pehling GB, Baker BA, Haymond MW, Cryer PE et al. Abnormal glucose counterregulation after subcutaneous insulin in insulin-dependent diabetes mellitus. N Engl J Med 1984; 310(26):1706-1711.
(28) Clore JN, Brennan JR, Gebhart SP, Newsome HH, Nestler JE, Blackard WG. Prolonged insulin resistance following insulin-induced hypoglycaemia. Diabetologia 1987; 30(11):851-858.
(29) De FP, Perriello G, De CS, Ventura MM, Campbell PJ, Brunetti P et al. Comparison of glucose counterregulation during short-term and prolonged hypoglycemia in normal humans. Diabetes 1986; 35(5):563-569.
(30) De FP, Perriello G, Bolli GB. Somogyi and dawn phenomena:
mechanisms. Diabetes Metab Rev 1988; 4(1):31-49.
(31) Meyerhoff C, Bischof F, Sternberg F, Zier H, Pfeiffer EF. On line continuous monitoring of subcutaneous tissue glucose in men by combining portable glucosensor with microdialysis. Diabetologia 1992; 35(11):1087-1092.
(32) Hoi-Hansen T, Pedersen-Bjergaard U, Thorsteinsson B. Reproducibility and reliability of hypoglycaemic episodes recorded with Continuous Glucose Monitoring System (CGMS) in daily life. Diabet Med 2005; 22(7):858-862.
(33) Berger, M. Curriculum for a treatment and training program for Patients with type 1 diabetes. Department of Metabolic Diseases and Nutrition (WHO Collaborating Center for Diabetes). Heinrich-Heine University Duesseldorf, Germany
9
RESEARCH Model-based balancing of unmatched data in model-generated
hypothesis evaluation
Mette Dencker Johansena, Ole Hejlesena
aDepartment of Health Science and Technology, Aalborg University, Denmark
Abstract
Systematic deviations between data and pharmacokinetic models can be a source of test-relevant hypotheses. Incomparability of independent variables in intervention and control data compromises hypothesis evaluation using conventional statistical methods. This paper proposes a method for hypothesis evaluation utilizing a physiological model for balancing out incomparable independent variables. The method prescribes calculation of the deviation of data from model simulations in an intervention period featuring the event or behavior described by the hypothesis and in a control period not featuring it, resulting in two deviations. These can be compared by conventional statistical methods. Model inclusion of all independent variables except for that described by the hypothesis is required. An example of the use of the model in diabetes hypoglycemia data underlines its potential. The main disadvantage is the need for control data, which may be difficult to identify. Further evaluation is needed to explore the method’s appropriateness compared to conventional hypothesis evaluation. Keywords: Biological models, Computer Simulation, Computing Methodologies, Type 1 Diabetes Mellitus.
Introduction
Pharmacokinetic models, including physiological models of human metabolism of a wide range of endogenous compounds, have been developed to aid patients, health care professionals and researchers in monitoring, adjusting and developing treatments.
Observation of systematic deviations in the simulations of such models can generate hypotheses if prominent deviations from data occur exclusively and consistently in relation to one particular event. We have previously used a physiological model of the human carbohydrate metabolism in diabetes as a generator of hypotheses regarding the effect of alcohol[1] and hypoglycemia (unpublished data).
Evaluation of a deviation-related hypothesis can be performed in at least two ways: comparing intervention data (including the event of interest) and control data (not including the event of interest), and comparing intervention data (including the event of interest) with model simulations. The first approach, comparing two data groups, requires the groups to be extensively comparable as regards all other independent variables/event than the one of interest. This similarity may be only scarcely achieved in data collected from patients living their everyday lives, an approach often preferred over controlled, in-hospital experiments due to cost minimization and patient
convenience, if patients comply inadequately with instructions regarding their behavior during the experimental period. Incomparability of control data with intervention data precludes reliable interpretation of any significant difference as resulting from the event of interest. Conventional comparison of intervention data with control data may thus not be appropriate for evaluation of deviation-related hypotheses. The second approach, comparing data with model simulations, requires the model to include all relevant independent variables except for the one of interest. This requirement is difficult to meet in practice, as model complexity and computability are opposites. Insufficient model complexity precludes reliable interpretation of any significant difference as resulting from the event of interest, as in the case of incomparable intervention and control data. Thus, both approaches have their imperfections.
The aim of this paper is to present a novel model-based method for evaluation of hypotheses when intervention data and control data are not comparable regarding independent variables.
Method outline
The method utilizes comparison of deviations of dependent variables in data from model simulations. The basis of the method is to use simulations from a model as expectancies and by these cancel out deviations between intervention and control data that originate from differences in independent variables. Hereby, only those deviations originating from the investigated event or behavior affect the result, and the imperfections of the purely data-based approach to deviation-related hypothesis evaluation are addressed. Using model simulations as expectancies for both intervention and control data addresses the imperfections of the model-based approach to deviation-related hypothesis evaluation, as systematic errors in model simulations will be present in both expectancies and thereby cancelled out.
For each includable incident of the investigated event or behavior, a model simulation is calculated for intervention and control periods, Si and Sc, respectively, from input of independent variables. These model simulations serve as expectancies that include no incidences of the investigated event or behavior, as the event or behavior is not considered by the model.
The deviation from the model simulation is calculated for both intervention data and control data as Di and Dc, as data minus model simulation in Devi and Devc:
iii SDDev −= (1)
ccc SDDev −= (2)
22
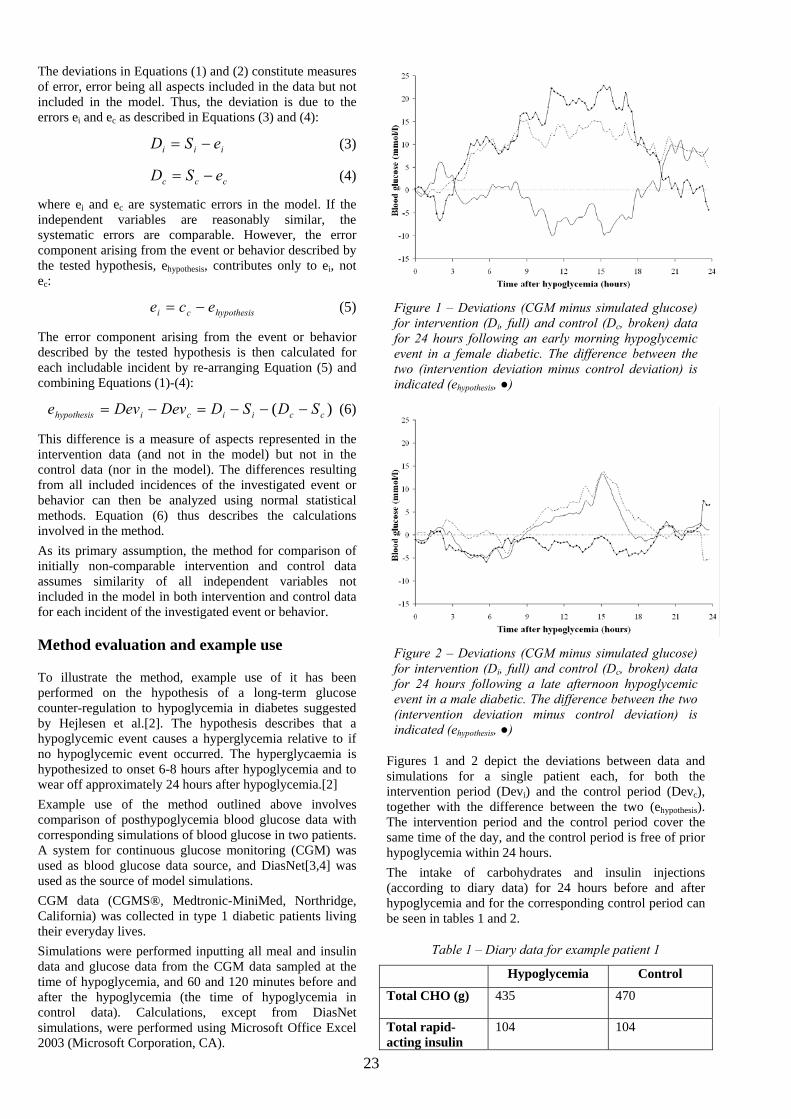
The deviations in Equations (1) and (2) constitute measures of error, error being all aspects included in the data but not included in the model. Thus, the deviation is due to the errors ei and ec as described in Equations (3) and (4):
iii eSD −= (3)
ccc eSD −= (4)
where ei and ec are systematic errors in the model. If the independent variables are reasonably similar, the systematic errors are comparable. However, the error component arising from the event or behavior described by the tested hypothesis, ehypothesis, contributes only to ei, not ec:
hypothesisci ece −= (5)
The error component arising from the event or behavior described by the tested hypothesis is then calculated for each includable incident by re-arranging Equation (5) and combining Equations (1)-(4):
)( cciicihypothesis SDSDDevDeve −−−=−= (6)
This difference is a measure of aspects represented in the intervention data (and not in the model) but not in the control data (nor in the model). The differences resulting from all included incidences of the investigated event or behavior can then be analyzed using normal statistical methods. Equation (6) thus describes the calculations involved in the method.
As its primary assumption, the method for comparison of initially non-comparable intervention and control data assumes similarity of all independent variables not included in the model in both intervention and control data for each incident of the investigated event or behavior.
Method evaluation and example use
To illustrate the method, example use of it has been performed on the hypothesis of a long-term glucose counter-regulation to hypoglycemia in diabetes suggested by Hejlesen et al.[2]. The hypothesis describes that a hypoglycemic event causes a hyperglycemia relative to if no hypoglycemic event occurred. The hyperglycaemia is hypothesized to onset 6-8 hours after hypoglycemia and to wear off approximately 24 hours after hypoglycemia.[2]
Example use of the method outlined above involves comparison of posthypoglycemia blood glucose data with corresponding simulations of blood glucose in two patients. A system for continuous glucose monitoring (CGM) was used as blood glucose data source, and DiasNet[3,4] was used as the source of model simulations.
CGM data (CGMS®, Medtronic-MiniMed, Northridge, California) was collected in type 1 diabetic patients living their everyday lives.
Simulations were performed inputting all meal and insulin data and glucose data from the CGM data sampled at the time of hypoglycemia, and 60 and 120 minutes before and after the hypoglycemia (the time of hypoglycemia in control data). Calculations, except from DiasNet simulations, were performed using Microsoft Office Excel 2003 (Microsoft Corporation, CA).
Figure 1 – Deviations (CGM minus simulated glucose) for intervention (Di, full) and control (Dc, broken) data for 24 hours following an early morning hypoglycemic event in a female diabetic. The difference between the two (intervention deviation minus control deviation) is indicated (ehypothesis, ●)
Figure 2 – Deviations (CGM minus simulated glucose) for intervention (Di, full) and control (Dc, broken) data for 24 hours following a late afternoon hypoglycemic event in a male diabetic. The difference between the two (intervention deviation minus control deviation) is indicated (ehypothesis, ●)
Figures 1 and 2 depict the deviations between data and simulations for a single patient each, for both the intervention period (Devi) and the control period (Devc), together with the difference between the two (ehypothesis). The intervention period and the control period cover the same time of the day, and the control period is free of prior hypoglycemia within 24 hours.
The intake of carbohydrates and insulin injections (according to diary data) for 24 hours before and after hypoglycemia and for the corresponding control period can be seen in tables 1 and 2.
Table 1 – Diary data for example patient 1
Hypoglycemia Control
Total CHO (g)
435 470
Total rapid-acting insulin
104 104
23
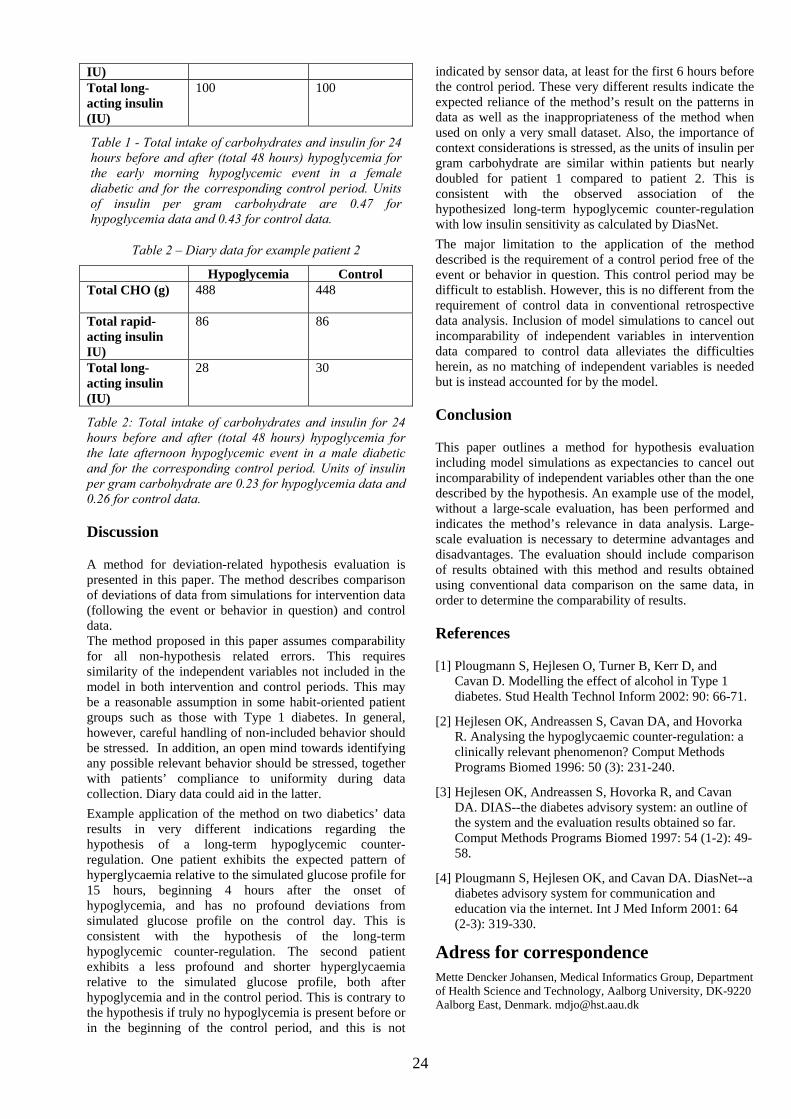
24
IU) Total long-acting insulin (IU)
100 100
Table 1 - Total intake of carbohydrates and insulin for 24 hours before and after (total 48 hours) hypoglycemia for the early morning hypoglycemic event in a female diabetic and for the corresponding control period. Units of insulin per gram carbohydrate are 0.47 for hypoglycemia data and 0.43 for control data.
Table 2 – Diary data for example patient 2
Hypoglycemia Control Total CHO (g)
488 448
Total rapid-acting insulin IU)
86 86
Total long-acting insulin (IU)
28 30
Table 2: Total intake of carbohydrates and insulin for 24 hours before and after (total 48 hours) hypoglycemia for the late afternoon hypoglycemic event in a male diabetic and for the corresponding control period. Units of insulin per gram carbohydrate are 0.23 for hypoglycemia data and 0.26 for control data.
Discussion
A method for deviation-related hypothesis evaluation is presented in this paper. The method describes comparison of deviations of data from simulations for intervention data (following the event or behavior in question) and control data. The method proposed in this paper assumes comparability for all non-hypothesis related errors. This requires similarity of the independent variables not included in the model in both intervention and control periods. This may be a reasonable assumption in some habit-oriented patient groups such as those with Type 1 diabetes. In general, however, careful handling of non-included behavior should be stressed. In addition, an open mind towards identifying any possible relevant behavior should be stressed, together with patients’ compliance to uniformity during data collection. Diary data could aid in the latter.
Example application of the method on two diabetics’ data results in very different indications regarding the hypothesis of a long-term hypoglycemic counter-regulation. One patient exhibits the expected pattern of hyperglycaemia relative to the simulated glucose profile for 15 hours, beginning 4 hours after the onset of hypoglycemia, and has no profound deviations from simulated glucose profile on the control day. This is consistent with the hypothesis of the long-term hypoglycemic counter-regulation. The second patient exhibits a less profound and shorter hyperglycaemia relative to the simulated glucose profile, both after hypoglycemia and in the control period. This is contrary to the hypothesis if truly no hypoglycemia is present before or in the beginning of the control period, and this is not
indicated by sensor data, at least for the first 6 hours before the control period. These very different results indicate the expected reliance of the method’s result on the patterns in data as well as the inappropriateness of the method when used on only a very small dataset. Also, the importance of context considerations is stressed, as the units of insulin per gram carbohydrate are similar within patients but nearly doubled for patient 1 compared to patient 2. This is consistent with the observed association of the hypothesized long-term hypoglycemic counter-regulation with low insulin sensitivity as calculated by DiasNet.
The major limitation to the application of the method described is the requirement of a control period free of the event or behavior in question. This control period may be difficult to establish. However, this is no different from the requirement of control data in conventional retrospective data analysis. Inclusion of model simulations to cancel out incomparability of independent variables in intervention data compared to control data alleviates the difficulties herein, as no matching of independent variables is needed but is instead accounted for by the model.
Conclusion
This paper outlines a method for hypothesis evaluation including model simulations as expectancies to cancel out incomparability of independent variables other than the one described by the hypothesis. An example use of the model, without a large-scale evaluation, has been performed and indicates the method’s relevance in data analysis. Large-scale evaluation is necessary to determine advantages and disadvantages. The evaluation should include comparison of results obtained with this method and results obtained using conventional data comparison on the same data, in order to determine the comparability of results.
References
[1] Plougmann S, Hejlesen O, Turner B, Kerr D, and Cavan D. Modelling the effect of alcohol in Type 1 diabetes. Stud Health Technol Inform 2002: 90: 66-71.
[2] Hejlesen OK, Andreassen S, Cavan DA, and Hovorka R. Analysing the hypoglycaemic counter-regulation: a clinically relevant phenomenon? Comput Methods Programs Biomed 1996: 50 (3): 231-240.
[3] Hejlesen OK, Andreassen S, Hovorka R, and Cavan DA. DIAS--the diabetes advisory system: an outline of the system and the evaluation results obtained so far. Comput Methods Programs Biomed 1997: 54 (1-2): 49-58.
[4] Plougmann S, Hejlesen OK, and Cavan DA. DiasNet--a diabetes advisory system for communication and education via the internet. Int J Med Inform 2001: 64 (2-3): 319-330.
Adress for correspondence Mette Dencker Johansen, Medical Informatics Group, Department of Health Science and Technology, Aalborg University, DK-9220 Aalborg East, Denmark. [email protected]
CGM glucose overshoot after hypoglycemia assessed by a simulation tool
Dencker Johansen
CGM glucose overshoot after hypoglycemia assessed by a simulation tool
Mette Dencker Johansen, M.Sc.1, Ole K. Hejlesen, Ph.D.1, David A. Cavan, M.D.2
Abstract Background: The DiasNet simulation tool is based on accepted principles of physiology and simulates blood glucose concentrations accurately in type 1 diabetics during periods with no hypoglycemia. However, we have observed that following hypoglycemia, model simulations deviate significantly and systematically from actual blood glucose data. This led us to generate a hypothesis that delayed and prolonged hyperglycaemia occurs following hypoglycemia. This study tests that hypothesis by comparing simulated and continuously measured blood glucose data. Methods: CGM (CGMS®, Medtronic-MiniMed, Northridge, California) data and diary (meals, insulin, self-monitored blood glucose) data were collected for 2 to 5 days from 17 Type 1 diabetics with poor glycemic control. Hypoglycemic episodes (CGM <63 mg/dl for ≥20 minutes) were identified in valid (well-calibrated) CGM data. For 24 hours after each hypoglycemic episode, a simulated (DiasNet) glucose profile was compared to the CGM glucose. Results: 52 episodes of hypoglycemia were identified in valid data. All subjects had minimum one hypoglycemic episode. Ten episodes of hypoglycemia from 9 subjects were eligible for analysis. CGM glucose was significantly (p<0.05) higher than simulated blood glucose for a period of 13 hours, beginning 8 hours after hypoglycemia onset. Conclusions: The present data support the hypothesis of a long-term glucose counter-regulation to hypoglycemia. The onset is typically 8 hours following the hypoglycemia and the duration up to 16 hours. The lack of evidence for this phenomenon in previous studies
1 Medical Informatics Group, Department of Health Science and Technology, Aalborg University, Denmark 2David A. Cavan, Bournemouth Diabetes and Endocrine Centre, Bournemouth Royal Hospital, United Kingdom _____________________________ The basic idea was presented at the Third Diabetes Technology Meeting in San Francisco, 2003 _____________________________ Abbreviations: (CGM) continuous glucose sensor, (SMBG) self-monitored blood glucose, (BMI) body mass index _____________________________ Keywords: Continuous glucose sensors, Hypoglycemia, Physiopathology, Type 1 diabetes mellitus _____________________________ Corresponding author: David A. Cavan, Bournemouth Diabetes and Endocrine Centre, Bournemouth Royal Hospital, email: [email protected]
1
CGM glucose overshoot after hypoglycemia assessed by a simulation tool
Dencker Johansen
may be explained by the 8 hour delay. Further studies are required to fully determine the existence of the proposed long-term glucose counter-regulation to hypoglycemia.
Introduction People with Type 1 diabetes mellitus must take over the regulation of blood glucose from the pancreas in order to avoid acute or chronic complications due to abnormal blood glucose levels. This is achieved primarily by balancing insulin injections, meals, and exercise. Suboptimal blood glucose control with frequent or persistent episodes of hyperglycemia, leads to a substantially increased risk of long-term complications, such as micro- and macro vascular diseases.1 Intensive control of the blood glucose, however, may increase the frequency and severity of hypoglycemia1, which for many patients is the most feared complication to diabetes.2;3 To a large extent, the patient has to take responsibility for managing the diabetes 4-7. Quite apart from economic considerations, it is not practical for specialists to manage patients’ diabetes on a day to day basis.7 Various approaches intended to facilitate patients’ everyday decisions have been suggested, ranging from didactic lectures to interactive computer programs.8 Among these computer programs are computer-based decision support systems such as DiasNet9, AIDA10, and Librae11, all of which have been developed for both educational (general) and advisory (specific) purposes. These decision-support systems all simulate a blood glucose profile from input data on meals and insulin doses, some of which are on a patient-specific basis9;11;12 and some from information on physical activity.11 The DiasNet simulation tool is based on a metabolic model, implemented as a compartment model of human glucose metabolism and insulin kinetics in a Bayesian network.9 The tool has been tested in diabetes clinics in Italy, Denmark and England and has been
shown to help improve control in patients with poorly controlled diabetes.13 A study has indicated that systematic errors in the metabolic model in hypoglycemia free data are small compared to the day-to-day variation of blood glucose seen in diabetes. 12 It should be noted, however, that these rather encouraging results were based on a basic model, implementing only basal, normal physiology and not taking into account the broad range of events or conditions that may affect blood glucose concentrations and which may be necessary to fully describe and predict blood glucose metabolism. These include alcohol intake, exercise, disease/fever and hypoglycemic episodes. The importance of a particular event or situation and its impact on physiology can be assessed with a simulation tool by comparing blood glucose simulations with actual measurements taken where the event or situation is present and precisely documented, and where the simulation tool is accurate in implementing all known relevant physiology. Substantial deviation of actual data from the simulations would indicate that physiological mechanisms are affecting the data but not the simulations, implying that not all relevant physiology is implemented in the model. In this way, systematic deviations of data from model simulations can be used to generate hypotheses. We have earlier used this approach to investigate the importance of alcohol intake.14 We have previously reported that in SMBG data with episodes of hypoglycemia, measured blood glucose levels are consistently greater than the levels simulated by the model for a period of 10-12 hours, beginning 6-8 hours after hypoglycemic episodes.15
2
CGM glucose overshoot after hypoglycemia assessed by a simulation tool
Dencker Johansen
This systematic discrepancy is seen only in data following hypoglycemia, supporting the hypothesis that hypoglycemia leads to a long-term counter-regulatory effect of some sort. This phenomenon has been recognized for many years and was originally described by Somogyi. It was studied by several groups in the 1980s and 1990s16-19. Taken together, the findings have been inconclusive, due probably to discrepancies in the studies’ hypotheses regarding the temporal characteristics of the hyperglycemic response and in study design and patient selection. Currently, the long-term glucose counter-regulation to hypoglycemia is omitted from or even refuted in medical and diabetes textbooks. In the present work, we describe long-term post-hypoglycemic glucose discrepancy between data and simulations using glucose sensor data in order to ensure maximum resolution in glucose data.
Materials and methods Study design We retrospectively analyzed continuous glucose profiles (48-120 hours) by calculating the deviation in simulated (DiasNet) blood glucose profiles compared to measured CGM (CGMS®, Medtronic-MiniMed, Northridge, California) glucose profiles after hypoglycemic episodes. The study was approved by the local ethics committee. Patients 17 Type 1 diabetics with poorly controlled diabetes (judged by their diabetologist) from the diabetes clinic at the Royal Bournemouth Hospital, England were included after giving written informed consent. The diabetics were referred to the study if the clinic’s diabetologist assessed that there was a clinical indication for continuous glucose monitoring. The mean age of the subjects was 39.5 years (range: 25-63 years). Mean diabetes duration was 11.1 years (range: 3-42 years). Mean
BMI was 25.5 (range: 18.6-30.0). All subjects had multiple daily injections of insulin. Mean daily dose of short-acting insulin (primarily Humalog, Eli Lilly) was 34.5 IU (range: 10-56 IU), and mean daily dose of long-acting insulin (Humulin NPH, Eli Lilly or Insulatard, Novo Nordisk or Lantus, Sanofi-Aventis) was 19.5 IU (range: 8-50). Diary The patients were instructed to maintain a diary regarding all meals (grams of carbohydrates and time of ingestion) and all insulin injections (units of insulin and time of injection) for three days and to do at least 4 daily capillary blood glucose measurements with their regular glucose meters. The diary should include any meal or insulin related action taken in connection with hypoglycemia. The patients were instructed to live as close to their everyday lives as possible, despite the sensor. CGM data A continuous glucose sensor (CGMS®, Medtronic-MiniMed, Northridge, California) was inserted into the subcutaneous fat in the peri-umbilical region, using the insertion needle provided with the sensor. The sensor utilizes the principle of glucose oxidase for its measurements. The sensor was left in place for three to five days for collection of data. The sensor data was transferred to a PC using the data transfer tool from the manufacturer. The patients were not able to see the CGM measurements during the collection period. Data analysis and statistics The sensor data was calibrated using the Medtronic MiniMed CGMS® software, which is recommended to be used with at least 4 capillary blood glucose measurements (SMBG) per day. We regarded days of CGM data as valid if the number of measurements available for calibration ranged from 2 to 7 (8 if a nocturnal (0 am-6 am) measurement was present). The lower limit of 2 was
3
CGM glucose overshoot after hypoglycemia assessed by a simulation tool
Dencker Johansen
the absolute minimum, as at least 2 measurements are needed in order to determine off-set and gain in the Medtronic MiniMed CGMS® calibration algorithm. The upper limit was set to 7 (or 8), as diabetics doing frequent SMBG do up to 7 (eventually 8, including a nocturnal) blood glucose measurements per day. Hereby the included patients, while instructed to do only 4 daily measurements, may actually have done up to 7 (or 8), and the additional measurements could indicate special situations that might compromise the validity of the sensor data. Time with missing (or low voltage) sensor signal was excluded as invalid. Hypoglycemic episodes were identified in the valid CGM data. We defined an episode of hypoglycemia to consist of at least 4 consecutive measurements (equivalent to 20 minutes) below 63 mg/dl. The beginning of the hypoglycemic episode was defined as the first measurement below 63 mg/dl and the end of the hypoglycemic episode as the last measurement below 63 mg/dl before at least 3 measurements equal to or above 63 mg/dl. Episodes of hypoglycemia preceded by confirmed or possible hypoglycemic episodes up to 20 hours beforehand were excluded in order to avoid interference from the long-term effects of hypoglycemia on simulation error investigated in this study. Thus, hypoglycemic episodes within 20 hours after sensor insertion or lack of data or data invalidity were excluded. CGM data were averaged every 15 minutes (equivalent to every three CGM glucose measurements) in order to obtain the same temporal resolution of CGM data as of simulated glucose data. The DiasNet simulation tool9 was used to calculate glucose profiles that could be used as ‘control data’ when analyzing the hypoglycemia data collected by CGM. The input to the model is the diary data: meals (grams of
carbohydrates and time of ingestion) and insulin injections (units of insulin and time of injection). The simulation model is calibrated to each individual patient using a few glucose measurements as described below. The output is blood glucose profiles calculated in 15 minute steps based on state-of-the-art knowledge of normal physiology. According to simulation theory, since the simulation tool calculates the average expected blood glucose for each patient, the intra-patient variation in the control data is cancelled or reduced significantly and since the model is calibrated to each individual patient the inter-patient variation in the control data is cancelled or reduced significantly. It should be noted, that also the potential effect of different insulin types on the inter-patient variation is cancelled or reduced significantly by a simulation model implementing average insulin absorption profiles for each type of insulin. This reduction in intra-patient and inter-patient variation in the simulated control data implies that valid results can be produced with a smaller number of hypoglycemic events in the CGM dataset. A simulated glucose profile, the simulated control data, was calculated for the entire data period for each included episode of hypoglycemia. For each of these episodes, the input was all diary-reported meals and insulin injections for the entire data period. The simulation model was calibrated to each patient using five measurements from the glucose sensor (each constituted by an average of three CGM glucose measurements) around the hypoglycemic episode (one and two hours before the beginning of the episode, at the beginning of the episode, and one and two hours after the beginning of the episode) to adjust the metabolic model to the specific patient. This adjustment is carried out with a patient-specific model parameter, the
4

CGM glucose overshoot after hypoglycemia assessed by a simulation tool
Dencker Johansen
so-called insulin sensitivity, which is estimated automatically by the DiasNet simulation tool. CGM and simulated glucose profiles were compared for 24 hours after hypoglycemic episodes. The average CGM and simulated glucose profiles were compared using Student’s one-sided t-test. All analysis was performed using the Excel spreadsheet program (Microsoft Corporation, Redmond, WA). Results are given as mean±SD.
Results Total monitoring time was 54 days, valid monitoring time 45 days. Periods of non-valid monitoring were caused by missing (or low-voltage) sensor signals (15 hours) or by an invalid number of SMBG measurements for calibration (approximately 8 days). Episodes of hypoglycemia All 17 patients had at least one hypoglycemic episode according to the CGM data. A total of 52 episodes of hypoglycemia occurred (median per patient: 3; range: 1-9). 42 of the episodes were excluded due to: (i) occurrence less than 20 hours after sensor insertion (23 episodes of hypoglycemia), (ii) invalid CGM data (3 episodes of hypoglycemia) or (iii) preceding hypoglycemia (16 episodes of hypoglycemia). The 10 hypoglycemic episodes included in this study were found in data from 9 patients. The temporal distribution of all hypoglycemic episodes together with indications of inclusion/exclusion (and reason for exclusion) is shown in Figure 1 (only patients with includable episodes of hypoglycemia). The hypoglycemic episodes were evenly distributed during the day (Figure 1); six episodes of hypoglycemia were found in the daytime (6 am-6 pm) and four at night (6 pm-6 am). Mean hypoglycemia blood glucose nadir was 45 ± 7 mg/dl (according to
the CGM data). Five episodes of hypoglycemia with nadir=40 mg/dl (the lower detection limit of the CGMS®) were found. Mean duration of the hypoglycemic episodes was 86±61 min (according to the CGM data). Comparison of mean glucose profiles after hypoglycemic episodes Mean glucose profiles (CGM and simulated) can be seen in Figure 2. The CGM glucose was significantly higher (p<0.05) than the simulated glucose for a period of 13 hours, beginning 8 hours after the onset of hypoglycemic episodes. No significant difference was recorded within the first 8 hours after the onset of hypoglycemic episodes, except for one hour immediately after the onset of hypoglycemic episodes, where the CGM glucose is significantly lower (p<0.05) than the simulated glucose.
Figure 1: The temporal distribution of included and excluded hypoglycemic episodes (CGM glucose <63 mg/dl for at least 20 minutes) with indication of reason for exclusion (only profiles with included hypoglycemic episodes). × indicates included episode of hypoglycemia. ■ indicates hypoglycemic episodes excluded because of prior (0-20 hours) lack of data, ♦ indicates hypoglycemic episodes excluded because of prior (0-20 hours) episodes of hypoglycemia, ▲ indicates hypoglycemic episodes excluded because of prior (0-20 hours) start of data. Full lines designate valid data, dotted lines designate invalid data (days with <2 or >7 (8 if one is nocturnal) SMBG measurements).
Discussion A systematic discrepancy between measured glucose and DiasNet
5
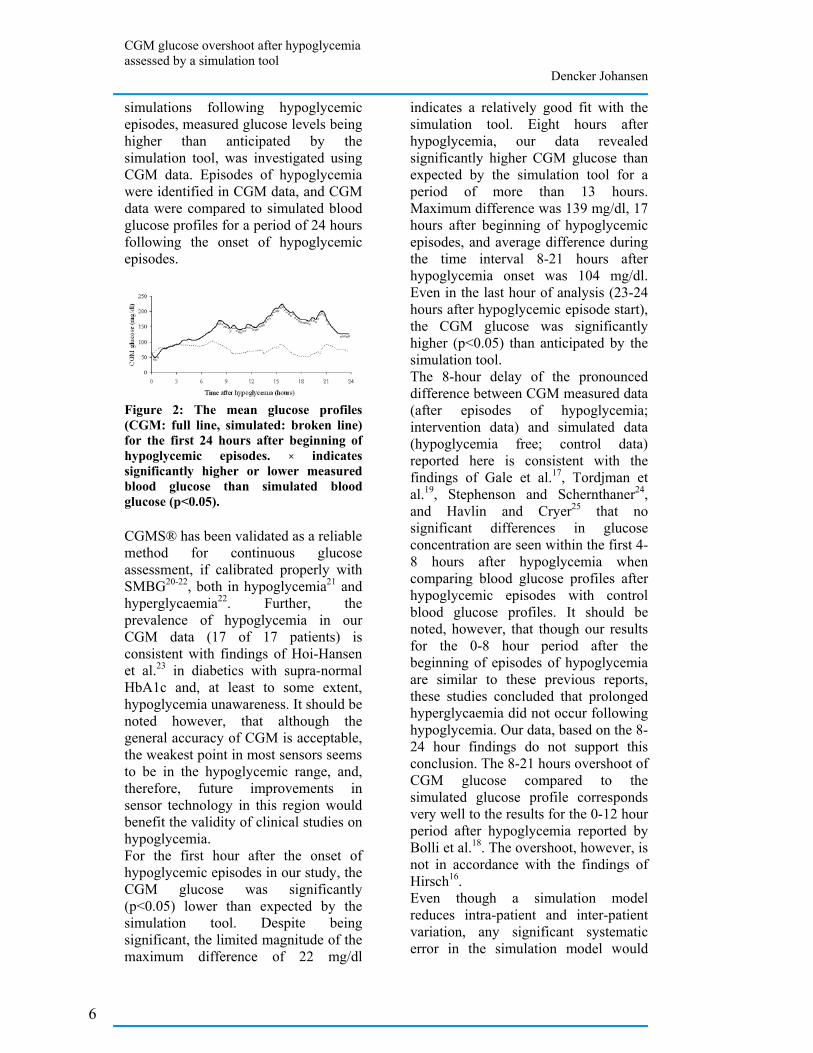
CGM glucose overshoot after hypoglycemia assessed by a simulation tool
Dencker Johansen
simulations following hypoglycemic episodes, measured glucose levels being higher than anticipated by the simulation tool, was investigated using CGM data. Episodes of hypoglycemia were identified in CGM data, and CGM data were compared to simulated blood glucose profiles for a period of 24 hours following the onset of hypoglycemic episodes.
Figure 2: The mean glucose profiles (CGM: full line, simulated: broken line) for the first 24 hours after beginning of hypoglycemic episodes. × indicates significantly higher or lower measured blood glucose than simulated blood glucose (p<0.05). CGMS® has been validated as a reliable method for continuous glucose assessment, if calibrated properly with SMBG20-22, both in hypoglycemia21 and hyperglycaemia22. Further, the prevalence of hypoglycemia in our CGM data (17 of 17 patients) is consistent with findings of Hoi-Hansen et al.23 in diabetics with supra-normal HbA1c and, at least to some extent, hypoglycemia unawareness. It should be noted however, that although the general accuracy of CGM is acceptable, the weakest point in most sensors seems to be in the hypoglycemic range, and, therefore, future improvements in sensor technology in this region would benefit the validity of clinical studies on hypoglycemia. For the first hour after the onset of hypoglycemic episodes in our study, the CGM glucose was significantly (p<0.05) lower than expected by the simulation tool. Despite being significant, the limited magnitude of the maximum difference of 22 mg/dl
indicates a relatively good fit with the simulation tool. Eight hours after hypoglycemia, our data revealed significantly higher CGM glucose than expected by the simulation tool for a period of more than 13 hours. Maximum difference was 139 mg/dl, 17 hours after beginning of hypoglycemic episodes, and average difference during the time interval 8-21 hours after hypoglycemia onset was 104 mg/dl. Even in the last hour of analysis (23-24 hours after hypoglycemic episode start), the CGM glucose was significantly higher (p<0.05) than anticipated by the simulation tool. The 8-hour delay of the pronounced difference between CGM measured data (after episodes of hypoglycemia; intervention data) and simulated data (hypoglycemia free; control data) reported here is consistent with the findings of Gale et al.17, Tordjman et al.19, Stephenson and Schernthaner24, and Havlin and Cryer25 that no significant differences in glucose concentration are seen within the first 4-8 hours after hypoglycemia when comparing blood glucose profiles after hypoglycemic episodes with control blood glucose profiles. It should be noted, however, that though our results for the 0-8 hour period after the beginning of episodes of hypoglycemia are similar to these previous reports, these studies concluded that prolonged hyperglycaemia did not occur following hypoglycemia. Our data, based on the 8-24 hour findings do not support this conclusion. The 8-21 hours overshoot of CGM glucose compared to the simulated glucose profile corresponds very well to the results for the 0-12 hour period after hypoglycemia reported by Bolli et al.18. The overshoot, however, is not in accordance with the findings of Hirsch16. Even though a simulation model reduces intra-patient and inter-patient variation, any significant systematic error in the simulation model would
6
CGM glucose overshoot after hypoglycemia assessed by a simulation tool
Dencker Johansen
decrease the validity of an analysis based on simulated data. The DiasNet simulation tool has been tested using data not containing hypoglycemic events: In capillary blood glucose (self-monitored blood glucose, SMBG) data, the metabolic model predicts blood glucose profiles with a standard deviation (prediction error) which is about the same as the standard deviation of blood glucose measurements between days in the same data (the intra-patient variation).12 This indicates that systematic errors in the metabolic model in hypoglycemia free data are small compared to the day-to-day variation of blood glucose seen in diabetes, and that the DiasNet simulation tool therefore can be used to generate the control data in the present study. Our data support the hypothesis of a long-term glucose counter-regulation to hypoglycemia by comparison of CGM data to model simulations of glucose. Recognition of a long-term glucose counter-regulation to hypoglycemia is important to avoid overly aggressive treatment of (relative) hyperglycemia caused by prior hypoglycemia. We suggest that in order to minimize a possible interference from the simulation tool in a more thorough examination of the hypothesis, further studies of the existence and characteristics of the long-term glucose counter-regulation to hypoglycemia should include analysis of both hypoglycemia-free CGM control data and hypoglycemia CGM intervention data. The assessment could be based on a model/simulation tool.
Conclusions In conclusion, our findings do not contradict the findings of previous studies. We consider the hypothesis of a long-term glucose counter-regulation to hypoglycemia, as indicated by the overshoot of CGM glucose compared to a verified simulation tool, to be justified for further analysis.
Reference list (1) The Diabetes Control and
Complications Trial Research Group. The effect of intensive treatment of diabetes on the development and progression of long-term complications in insulin-dependent diabetes mellitus. The Diabetes Control and Complications Trial Research Group. N Engl J Med 1993; 329(14):977-986.
(2) Cox DJ, Irvine A, Gonder-Frederick L, Nowacek G, Butterfield J. Fear of hypoglycemia: quantification, validation, and utilization. Diabetes Care 1987; 10(5):617-621.
(3) Richmond J. Effects of hypoglycaemia: patients' perceptions and experiences. Br J Nurs 1996; 5(17):1054-1059.
(4) Anderson RM. Patient empowerment and the traditional medical model. A case of irreconcilable differences? Diabetes Care 1995; 18(3):412-415.
(5) Berger M, Muhlhauser I. Implementation of intensified insulin therapy: a European perspective. Diabet Med 1995; 12(3):201-208.
(6) Assal JP, Jacquemet S, Morel Y. The added value of therapy in diabetes: the education of patients for self-management of their disease. Metabolism 1997; 46(12 Suppl 1):61-64.
(7) Corbett C. Patient Knowledge and Self-Efficacy for Diabetes Management: Impact of Home Care Nurse Interventions. In: Funk S, Tornquist E, Leeman J, Miles M, Harrell J, editors. Key Aspects of Preventing and Managing Chronic Illness. New York:
7
CGM glucose overshoot after hypoglycemia assessed by a simulation tool
Dencker Johansen
Springer Publishing Company; 2001. 261-274.
(8) Cavan D. Giving power to the patients. Modern diabetes management 2001;2(4):15-16.
(9) Plougmann S, Hejlesen OK, Cavan DA. DiasNet--a diabetes advisory system for communication and education via the internet. Int J Med Inform 2001; 64(2-3):319-330.
(10) Lehmann ED. AIDA--a computer-based interactive educational diabetes simulator. Diabetes Educ 1998; 24(3):341-6, 348.
(11) Franklin VL, Wilson AW, Butler RA, Greene SA. A predictive tool for the self-management of diabetes (Librae): evaluation using a continuous glucose monitoring system. Diabet Med 2006; 23(1):21-25.
(12) Hejlesen OK, Andreassen S, Sando SH. Optimization and evaluation of a probabilistic computer model of the glucose metabolism. Applied medical informatics 1995; 1(1):11-24.
(13) Hejlesen OK, Andreassen S, Frandsen NE, Sorensen TB, Sando SH, Hovorka R et al. Using a double blind controlled clinical trial to evaluate the function of a Diabetes Advisory System: a feasible approach? Comput Methods Programs Biomed 1998; 56(2):165-173.
(14) Plougmann S, Hejlesen O, Turner B, Kerr D, Cavan D. Modelling the effect of alcohol in Type 1 diabetes. Stud Health Technol Inform 2002; 90:66-71.
(15) Hejlesen OK, Andreassen S, Cavan DA, Hovorka R. Analysing the hypoglycaemic counter-regulation: a clinically relevant phenomenon? Comput Methods Programs Biomed 1996; 50(3):231-240.
(16) Hirsch IB, Smith LJ, Havlin CE, Shah SD, Clutter WE, Cryer PE. Failure of nocturnal hypoglycemia to cause daytime hyperglycemia in patients with IDDM. Diabetes Care 1990; 13(2):133-142.
(17) Gale EA, Kurtz AB, Tattersall RB. In search of the Somogyi effect. Lancet 1980; 2(8189):279-282.
(18) Bolli GB, Gottesman IS, Campbell PJ, Haymond MW, Cryer PE, Gerich JE. Glucose counterregulation and waning of insulin in the Somogyi phenomenon (posthypoglycemic hyperglycemia). N Engl J Med 1984; 311(19):1214-1219.
(19) Tordjman KM, Havlin CE, Levandoski LA, White NH, Santiago JV, Cryer PE. Failure of nocturnal hypoglycemia to cause fasting hyperglycemia in patients with insulin-dependent diabetes mellitus. N Engl J Med 1987; 317(25):1552-1559.
(20) Sachedina N, Pickup JC. Performance assessment of the Medtronic-MiniMed Continuous Glucose Monitoring System and its use for measurement of glycaemic control in Type 1 diabetic subjects. Diabet Med 2003; 20(12):1012-1015.
(21) Caplin NJ, O'Leary P, Bulsara M, Davis EA, Jones TW. Subcutaneous glucose sensor values closely parallel blood glucose during insulin-induced hypoglycaemia. Diabet Med 2003; 20(3):238-241.
(22) Pfutzner J, Forst T, Butzer R, Forst S, Weber MM, Pfutzner AH et al. Performance of the continuous glucose monitoring system (CGMS) during development of ketosis in patients on insulin pump therapy. Diabet Med 2006; 23(10):1124-1129.
8
CGM glucose overshoot after hypoglycemia assessed by a simulation tool
Dencker Johansen
(23) Hoi-Hansen T, Pedersen-Bjergaard U, Thorsteinsson B. Reproducibility and reliability of hypoglycaemic episodes recorded with Continuous Glucose Monitoring System (CGMS) in daily life. Diabet Med 2005; 22(7):858-862.
(24) Stephenson JM, Schernthaner G. Dawn phenomenon and Somogyi
effect in IDDM. Diabetes Care 1989; 12(4):245-251.
(25) Havlin CE, Cryer PE. Nocturnal hypoglycemia does not commonly result in major morning hyperglycemia in patients with diabetes mellitus. Diabetes Care 1987; 10(2):141-147.
9

Implementation of an intensive chronic type 1 diabetes model with tight blood glucose control in Göttingen
minipigs Dencker Johansen
Implementation of an intensive chronic type 1 diabetes model with tight blood glucose control in Göttingen
minipigs Mette Dencker Johansen, M.Sc. 1, Karsten Nielsen, M.D., D.M.Sc.2, Ole K. Hejlesen,
Ph.D.1
Abstract Background: Type 1 diabetes models have been developed in various species. The Göttingen minipig is a particularly well-known relevant large-model animal. We have explored the implementation of an intensive chronic type 1-like diabetes with insulin adjusted near-normal blood glucose and with easy, non-stressful blood sampling possibilities in a laboratory experienced only with intensive acute and extensive chronic models. Method: A stepwise, explorative approach was applied consisting of three setups. The setups were designed from standard procedures, known protocols, principles of human surgery and experiments, and the experience from former setups. In addition, advice, instructions and researcher training offered by external experienced researchers were used. Key experimental procedures included animal training, surgical insertion of jugular vein catheter(-s), streptozotocin diabetes induction and blood glucose control by insulin injections. Results: Insufficiencies regarding animal training and blood sampling frequency and reliability were identified in setup 1. In setup 2, insufficiencies regarding extent of aseptic technique in catheter maintenance were identified. The feasibility of efficient animal training, the efficiency of strict aseptic catheter maintenance and the achievement of acceptable blood glucose control were identified in setup 3. Partial diabetes recovery was also observed in setup 3. Conclusion: These results indicate that the intended model may be implemented in an inexperienced laboratory, but there are considerable requirements in terms of researcher skills, development time, and biochemical laboratory facilities.
Author affiliations: 1 Medical Informatics Group, Department of Health Science and Technology, Aalborg University, Denmark. 2 Department of Pathology, Aalborg Hospital, Århus University, Denmark _____________________________ Keywords: Animal model, central venous catheters, insulin, streptozotocin, type 1 diabetes mellitus _____________________________ Corresponding author: Mette Dencker Johansen, M.Sc., Medical Informatics Group, Department of Health Science and Technology, Fredrik Bajersvej 7D, DK-9220 Aalborg E, Denmark, fax: 98154008, email: [email protected]
1
Implementation of an intensive chronic type 1 diabetes model with tight blood glucose control in Göttingen minipigs
Dencker Johansen
Introduction Models of type 1 diabetes exist in a variety of species, such as mice, rats, guinea pigs, swine and various miniature pigs. Such models have been used extensively for studies where human subjects are not acceptable or appropriate 1. This applies traditionally to type 1 diabetes pharmacological research 2;3 and to toxicology studies, but wide perspectives are also found within physiological studies. For much type 1 diabetes research, core characteristics of a suitable animal model include induced type 1 diabetes, tight glucose control with insulin regimens comparable to those applied in human diabetics, access to blood sampling for glucose control and experiment-related assays and minimal stress induction in all experimental procedures. In many applications, the animal model is established in Göttingen minipigs because of their resemblance to human physiology and their appropriate size 1. We call this model a “basic type 1 diabetes minipig model”, and it can be used to intensively study physiological events such as hypoglycemia and exercise, where a stable pathological model with good resemblance to human diabetic conditions is required. Various aspects of such Göttingen minipig type 1 diabetes models are well-described in the literature, and the model has been implemented in various facilities 1;4-7, also in the pharmaceutical industry 6. In general, however, long-term tight blood glucose control is not addressed in the models employed and described. Despite the substantial literature, it appears to be a considerable challenge to implement a “basic type 1 diabetes minipig model” in a biomedical laboratory with no prior experience in chronic disease models requiring frequent and rather complicated
procedures as those involved in the model described above. This has at least two explanations. First, scientific papers reporting development or use of animal models with characteristics similar to the basic type 1 diabetes minipig model report their methods rather unspecifically, leaving open questions regarding the extent and execution of, for example, aseptic techniques. Second, the model work is so complex that continuing assistance is needed from friendly external colleagues experienced in working with models like the “basic type 1 diabetes minipig model”. Researchers unfamiliar with the model work need to learn the necessary precautions and principles of the intensive work required for daily management (blood glucose control and blood sampling possibility maintenance) of the model, so that the precise efforts needed for success can be established. This paper demonstrates how a laboratory that did not have prior experience in intensive chronic experiments implemented the “basic type 1 diabetes minipig model”, an intensive chronic type 1 diabetes model in Göttingen minipigs.
Materials and methods Methodological approach We applied a stepwise, exploratory approach to refining the experimental implementation of a chronic type 1 diabetes model in Göttingen minipigs in a facility that had prior experience only with acute intensive or chronic extensive experiments. Refinement of the experimental implementation from one setup to the next was aimed at addressing the problems that arose in the previous setup. Each setup evaluation included three animals. A summary of the methodological approach is shown in Figure 1.
2
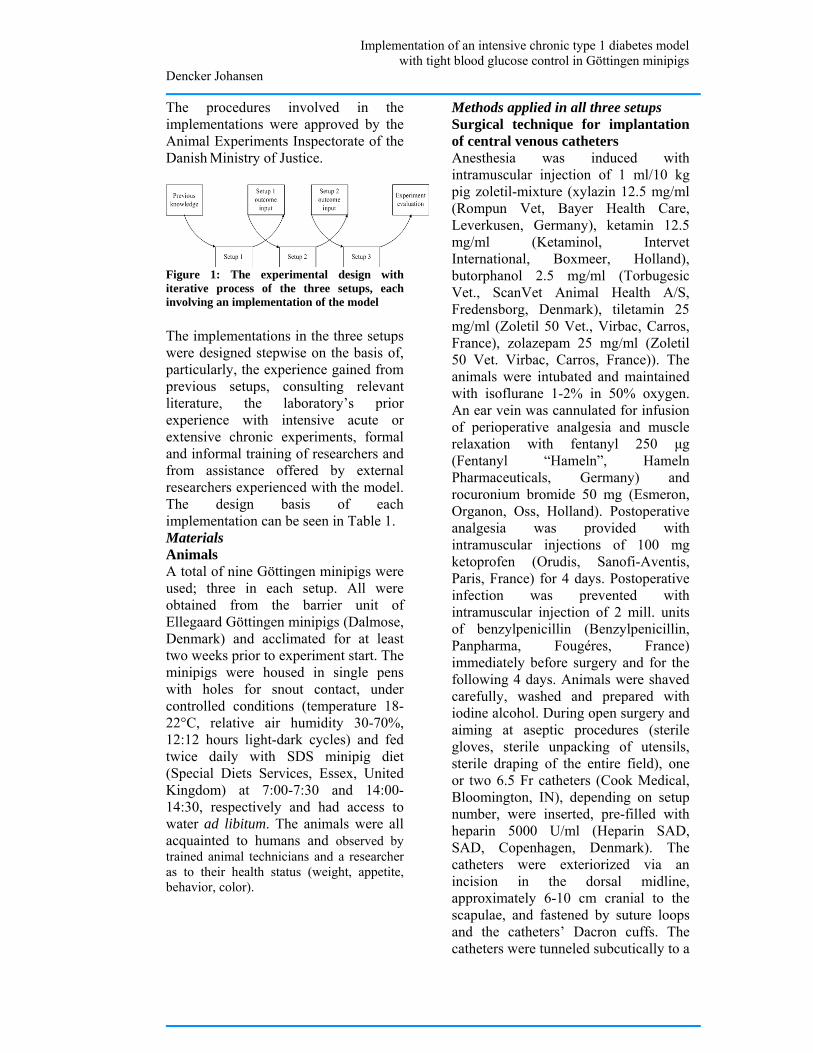
Implementation of an intensive chronic type 1 diabetes model with tight blood glucose control in Göttingen minipigs
Dencker Johansen
The procedures involved in the implementations were approved by the Animal Experiments Inspectorate of the Danish Ministry of Justice.
Figure 1: The experimental design with iterative process of the three setups, each involving an implementation of the model The implementations in the three setups were designed stepwise on the basis of, particularly, the experience gained from previous setups, consulting relevant literature, the laboratory’s prior experience with intensive acute or extensive chronic experiments, formal and informal training of researchers and from assistance offered by external researchers experienced with the model. The design basis of each implementation can be seen in Table 1. Materials Animals A total of nine Göttingen minipigs were used; three in each setup. All were obtained from the barrier unit of Ellegaard Göttingen minipigs (Dalmose, Denmark) and acclimated for at least two weeks prior to experiment start. The minipigs were housed in single pens with holes for snout contact, under controlled conditions (temperature 18-22°C, relative air humidity 30-70%, 12:12 hours light-dark cycles) and fed twice daily with SDS minipig diet (Special Diets Services, Essex, United Kingdom) at 7:00-7:30 and 14:00-14:30, respectively and had access to water ad libitum. The animals were all acquainted to humans and observed by trained animal technicians and a researcher as to their health status (weight, appetite, behavior, color).
Methods applied in all three setups Surgical technique for implantation of central venous catheters Anesthesia was induced with intramuscular injection of 1 ml/10 kg pig zoletil-mixture (xylazin 12.5 mg/ml (Rompun Vet, Bayer Health Care, Leverkusen, Germany), ketamin 12.5 mg/ml (Ketaminol, Intervet International, Boxmeer, Holland), butorphanol 2.5 mg/ml (Torbugesic Vet., ScanVet Animal Health A/S, Fredensborg, Denmark), tiletamin 25 mg/ml (Zoletil 50 Vet., Virbac, Carros, France), zolazepam 25 mg/ml (Zoletil 50 Vet. Virbac, Carros, France)). The animals were intubated and maintained with isoflurane 1-2% in 50% oxygen. An ear vein was cannulated for infusion of perioperative analgesia and muscle relaxation with fentanyl 250 µg (Fentanyl “Hameln”, Hameln Pharmaceuticals, Germany) and rocuronium bromide 50 mg (Esmeron, Organon, Oss, Holland). Postoperative analgesia was provided with intramuscular injections of 100 mg ketoprofen (Orudis, Sanofi-Aventis, Paris, France) for 4 days. Postoperative infection was prevented with intramuscular injection of 2 mill. units of benzylpenicillin (Benzylpenicillin, Panpharma, Fougéres, France) immediately before surgery and for the following 4 days. Animals were shaved carefully, washed and prepared with iodine alcohol. During open surgery and aiming at aseptic procedures (sterile gloves, sterile unpacking of utensils, sterile draping of the entire field), one or two 6.5 Fr catheters (Cook Medical, Bloomington, IN), depending on setup number, were inserted, pre-filled with heparin 5000 U/ml (Heparin SAD, SAD, Copenhagen, Denmark). The catheters were exteriorized via an incision in the dorsal midline, approximately 6-10 cm cranial to the scapulae, and fastened by suture loops and the catheters’ Dacron cuffs. The catheters were tunneled subcutically to a
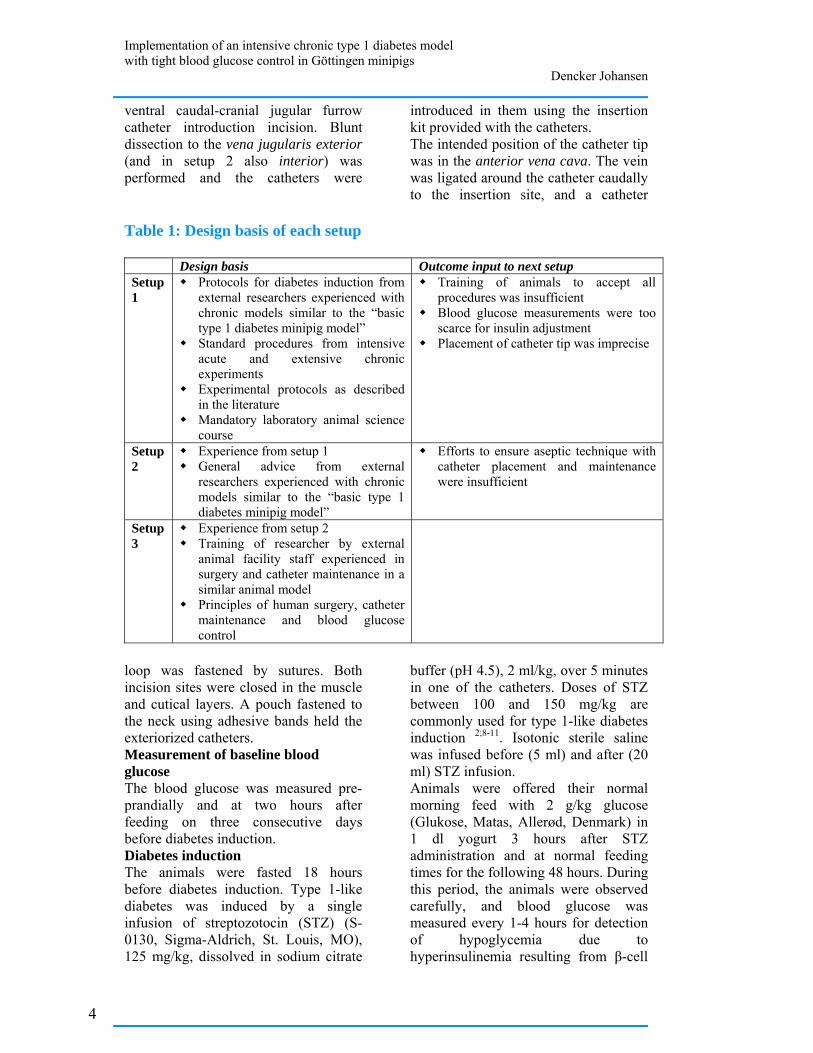
Implementation of an intensive chronic type 1 diabetes model with tight blood glucose control in Göttingen minipigs
Dencker Johansen
ventral caudal-cranial jugular furrow catheter introduction incision. Blunt dissection to the vena jugularis exterior (and in setup 2 also interior) was performed and the catheters were
introduced in them using the insertion kit provided with the catheters. The intended position of the catheter tip was in the anterior vena cava. The vein was ligated around the catheter caudally to the insertion site, and a catheter
Table 1: Design basis of each setup
Design basis Outcome input to next setup Setup 1
Protocols for diabetes induction from external researchers experienced with chronic models similar to the “basic type 1 diabetes minipig model”
Standard procedures from intensive acute and extensive chronic experiments
Experimental protocols as described in the literature
Mandatory laboratory animal science course
Training of animals to accept all procedures was insufficient
Blood glucose measurements were too scarce for insulin adjustment
Placement of catheter tip was imprecise
Setup 2
Experience from setup 1 General advice from external
researchers experienced with chronic models similar to the “basic type 1 diabetes minipig model”
Efforts to ensure aseptic technique with catheter placement and maintenance were insufficient
Setup 3
Experience from setup 2 Training of researcher by external
animal facility staff experienced in surgery and catheter maintenance in a similar animal model
Principles of human surgery, catheter maintenance and blood glucose control
loop was fastened by sutures. Both incision sites were closed in the muscle and cutical layers. A pouch fastened to the neck using adhesive bands held the exteriorized catheters. Measurement of baseline blood glucose The blood glucose was measured pre-prandially and at two hours after feeding on three consecutive days before diabetes induction. Diabetes induction The animals were fasted 18 hours before diabetes induction. Type 1-like diabetes was induced by a single infusion of streptozotocin (STZ) (S-0130, Sigma-Aldrich, St. Louis, MO), 125 mg/kg, dissolved in sodium citrate
buffer (pH 4.5), 2 ml/kg, over 5 minutes in one of the catheters. Doses of STZ between 100 and 150 mg/kg are commonly used for type 1-like diabetes induction 2;8-11. Isotonic sterile saline was infused before (5 ml) and after (20 ml) STZ infusion. Animals were offered their normal morning feed with 2 g/kg glucose (Glukose, Matas, Allerød, Denmark) in 1 dl yogurt 3 hours after STZ administration and at normal feeding times for the following 48 hours. During this period, the animals were observed carefully, and blood glucose was measured every 1-4 hours for detection of hypoglycemia due to hyperinsulinemia resulting from β-cell
4
Implementation of an intensive chronic type 1 diabetes model with tight blood glucose control in Göttingen minipigs
Dencker Johansen
destruction. Hypoglycemia < 2.5 mmol/l was treated with 20 g of glucose in 1 dl yogurt. Blood glucose measurements Blood glucose was measured by an ABL725 (Radiometer, Copenhagen, Denmark) with 90 µL or 150 µL glass capillaries (Clinitubes, Radiometer, Copenhagen, Denmark). The ABL725 was calibrated and maintained according to the manufacturer’s instructions. 1.5 ml of catheter lock solution and blood was drawn prior to sampling of blood for analysis. Insulin treatment Insulin treatment was initiated after STZ infusion when pre-prandial blood glucose >20 mmol/l. Insulin treatment aimed at pre-prandial blood glucose <7 mmol/l and 2 hours post-prandial blood glucose <10 mmol/l. Insulin was injected subcutaneously approximately 2-5 cm caudal to the ear, from ear height to approximately 5 cm ventral to the ear. Both sides were used, and injection sites were varied to avoid infiltrates. For all insulin injections, we used a NovoPen Junior insulin pen (Novo Nordisk, Bagsværd, Denmark) with 12.7 mm needles (BD Ultra-Fine, BD, New Jersey, USA). Euthanasia The animals were euthanized with a bolus of 20 ml of pentobarbitone (200 mg/ml; Pharmacy of the Royal Veterinary and Agricultural University, Copenhagen, Denmark) in the central venous catheter. Methods applied specifically in each setup Setup 1 The first group consisted of 3 female pigs aged 7-8 months, weight 17-18 kg. No other training in addition to human acquaintance was performed, so the pigs were placed in a box 50x80 cm for restraint during blood sampling and insulin injection. The animals were fed 110 g at each feeding before diabetes induction and
140-150 g after diabetes induction for weight maintenance. One catheter was implanted. This was done with the pig first in ventral recumbency for exteriorization incision and catheter tunneling, then in dorsal recumbency for insertion incision, catheter insertion and incision closure, and again in ventral recumbency for exteriorization incision closure. The pig and also the sterile drapes were thus manipulated twice. Catheter tip location in the anterior vena cava was determined by a sensation of catheter reluctance to blood withdraw using a syringe, indicating a position of the catheter tip in the heart 12 and subsequent catheter retraction of 1-2 cm. The catheter was implanted in its full length with excess catheter length coiled and placed in a muscle/subcutical fat pocket dissected in the dorsal incision. The catheter lock solution and blood drawn before sampling of blood from the catheter for analysis was re-injected before injection of new lock solution (5000 U/ml). Baseline blood glucose level measurements were initiated 6 days after catheter implantation. Diabetes was induced 10 days after surgical catheter insertion. Blood glucose was measured pre-prandially each day following diabetes induction. Insulatard (Novo Nordisk, Bagsværd, Denmark, 100 IE/ml), initial dose 0.2 IU/kg/feeding, was injected subcutaneously immediately before feeding. Subsequently, insulin doses were adjusted in steps of 0.1/IU at each feeding according to pre-prandial blood glucose. For an hourly blood sampling session of 32 hours duration for detailed blood glucose profile purposes, a 1.5 m extension of the catheter was constructed to allow for blood sampling without animal contact. For the entire system, 3.1 ml of lock solution (5000
Implementation of an intensive chronic type 1 diabetes model with tight blood glucose control in Göttingen minipigs
Dencker Johansen
U/ml) was used, and the lock solution withdrawn before blood sampling for analysis was injected before the new lock solution. Setup 2 The second group consisted of 3 female pigs aged 9-10 months, weight 21-24 kg. The animals were trained over a 3-week period to accept blood sampling and insulin injections before surgical catheter implantation. The animals were fed 130 g at each feeding prior to diabetes induction. Two catheters were implanted to ensure blood sampling possibility. The catheters were implanted and maintained as in setup 1, but with the extra catheter in the right vena jugularis exterior and applying distances measured by necropsy measurements on setup 1 pigs for catheter tip placement. Baseline blood glucose levels were determined 4 days after catheter insertion. Diabetes was induced 9 days after catheter insertion. Blood glucose was measured pre-prandially every day after insulin induction. Insulatard (Novo Nordisk, Bagsværd, Denmark, 100 IE/ml), initial dose 0.2 IU/kg/feeding, was injected subcutaneously immediately before feeding. No insulin dose adjustment was relevant. Setup 3 The third group consisted of 3 male pigs aged 9-10 months, weight 20-22 kg. A staged, evaluation-centered protocol-based training scheme was developed, aiming at acceptance of blood sampling and insulin injections. The protocol utilized positive reinforcement (apple pieces) and consisted of 14-18 incremental sessions over 3 weeks, each of 15-20 minutes duration and with a formulated objective (protocol presented at the Minipig Research Forum Annual Meeting 2007, Copenhagen, Denmark).
The animals were fed 200 g at each feeding prior to diabetes induction. During the first 30 days after diabetes induction, the feeding rations were adjusted to determine an optimal feeding regimen, in total 500 g on two feedings. Two catheters were implanted, both in the right vena jugularis exterior. The pigs were positioned in lateral recumbency during the entire surgical procedure. The two catheters were introduced via one needle puncture of the vein, applying two guidewires with a sheath each. Catheter tip location in the anterior vena cava was ensured applying necropsy measurements on a pig in setup 2. The catheters were cut with a sharp pair of sterile scissors to appropriate length, leaving no coiling necessary 13. Catheter maintenance aimed at aseptic procedures utilizing sterile surgical gloves, alcohol swabs for wiping the catheter before connecting syringes to it, and sustained sterility of utensils (syringes for catheter lock removal, syringes for blood sampling, syringes with new lock solution, catheter caps). The catheters were flushed 7 days after insertion but otherwise untouched. Baseline blood glucose level measurements were performed 12-14 days after catheter insertion. Diabetes was induced 22 days after catheter insertion. Ampicillin (Pentrexyl, Bristol-Myers Squibb, Bromma, Sweden) 10 mg/kg was injected intravenously every 10 days for infection-related complications prophylaxis. The catheter lock and blood drawn before blood sampling for analysis was discarded. The catheter was flushed with 2 ml of isotonic sterile saline before injection of lock solution (expected duration less than 2 hours: 100 IU/ml, 2-5 hours: 500 IU/ml, 5-24 hours: 1000 IU/ml, more than 24 hours: 5000 IU/ml). One catheter was preferred for use, the other was flushed
6
Implementation of an intensive chronic type 1 diabetes model with tight blood glucose control in Göttingen minipigs
Dencker Johansen
and locked with heparin 5000 IU/ml every week and held in reserve. New, sterile catheter caps were placed after each blood sampling 14. Blood glucose was measured every three to four hours for 24 or 48 hours after insulin dosage adjustment, beginning on day 2. A continuous glucose monitoring system (CGMS, Medtronic, Northridge, United Kingdom) was used for easy and precise glucose monitoring for 3-4 days. Sensors were inserted according to the manufacturer’s instructions under anesthesia (1 ml/10 kg pig-zoletil mixture as for anesthesia induction before surgery) and calibrated with 4 or 5 daily blood glucose measurements. They were placed caudally to the area of insulin injection and covered by first a sterile semi-permeable dressing, then the adhesive band holding the catheter pouch. The glucose sensor box was fastened in a home-made vest. Insulin was not injected in the side with the glucose sensor during wear and on the day before sensor insertion. For blood glucose control after diabetes induction, insulin (Insulatard, Novo Nordisk, Bagsværd, Denmark), initial dose 0.2 IU/kg/feeding, was injected subcutaneously immediately before feeding. To better control post-prandial and morning pre-prandial blood glucose, other insulin regimens were applied. These regimes were: 1) Mixed insulin (Mixtard 50, Novo Nordisk, Bagsværd, Denmark, 100 IE/ml), 2) a combination of separate short acting insulin (Actrapid, Novo Nordisk, Bagsværd, Denmark, 100 IE/ml) and separate regular insulin (Insulatard, Novo Nordisk, Bagsværd, Denmark), both injected at feeding start. Insulin doses were adjusted in steps of 0.05 or 0.1 IU/kg/feeding according to blood glucose measurements, and up to 0.2 IU/kg/feeding in case of extensive hypoglycemia or hyperglycemia. Insulin dosages and feeding rations were adjusted concurrently.
The procedure for diabetes induction with STZ was repeated after 62 days in two animals due to spontaneous, partial recovery from diabetes.
Results Setup 1 The pigs did not accept blood glucose sampling and insulin injections easily, and some degree of force was indicated. STZ caused hyperglycemia (blood glucose>20 mmol/l) in all animals, and insulin treatment was initiated. Intended blood glucose control was not achieved. One catheter lost its patency 10 days after diabetes induction, the others remained patent. The animal with the dysfunctional catheter was euthanized. Necropsy revealed unintended catheter tip location in a small hepatic vein. One animal developed epistaxis and rectal bleeding due to over-heparinization during hourly blood sampling 25 days after diabetes induction and was euthanized. One animal became lethargic and developed anorexia, hypoxia, tachycardia and superficial breathing 30 days after diabetes induction. The animal was euthanized, but the disease cause could not be determined by gross pathology.
Main results The main results of setup 1 were that the animals were insufficiently trained to accept the procedures involved in the experiment and that the blood glucose was measured too rarely to allow tight blood glucose control. An additional result was that correct catheter tip placement could not rely solely on the feeling of reluctance to blood withdrawal. Setup 2 The pigs accepted touching in the neck area and insulin pen needle insertion without injection of insulin before surgery, but after surgery, blood sampling was complicated by pig movement.
Implementation of an intensive chronic type 1 diabetes model with tight blood glucose control in Göttingen minipigs
Dencker Johansen
One pig died during surgery. No obvious cause was observed, including bleeding, anesthesia overdose and apparatus malfunction. Unfortunately, no necropsy was performed, so the cause of death remains unknown. One pig exhibited irreversible tachycardia (170 beats per minute) and hypotension (70/30 mm Hg) 10 minutes after isoflurane inhalation was initiated. Mydriasis was observed after four hours, so the animal was euthanized. One animal developed anorexia, hypoxia including cyanosis, tachycardia and superficial breathing 3 days after diabetes induction and insulin treatment initiation. The animal was euthanized, and necropsy indicated a pulmonary thromboemboli. Correct catheter tip location was observed.
Main result The main result of setup 2 was that the catheter maintenance procedures employed did not prevent thromboemboli. An important result was also that anatomical fixpoint measurements ensured correct catheter tip placement. Setup 3 The animals’ responses to training varied only little. The main difficulty was balancing the intensive training with the animal’s ability to focus on the session task objective and not only on the reward, Training 2-5 hours after feeding was optimal. The pigs accepted blood sampling from the catheters and insulin injections easily, even during nightly blood samplings. However, one pig developed evasive and aggressive behavior during insulin injections approximately one month after diabetes induction. Repetition of the initial training protocol over 3 days restored full compliance. One pig developed an abscess with suppuration of approximate diameter 2 cm in the healed exteriorization incision 35 days after surgery. Nine days of daily intravenous injection of 1000 mg ampicillin cured the infection.
All catheters were patent during the entire experiment (70 days). 3 or 4 subcutaneous glucose sensors were used in each pig. Three sensors dislocated within the wear period despite no problems were observed during sensor insertion. Feeding rations of 160 g in the morning and 340 in the afternoon apparently provided the easiest insulin dosage without diurnal hypoglycemia or hyperglycemia patterns. The initial insulin treatment with Insulatard resulted in morning post-prandial and afternoon pre-prandial hyperglycemia and late afternoon/early evening hypoglycemia. Mixtard 50 caused late afternoon hypoglycemia and dose reduction caused morning pre-prandial hyperglycemia. Short acting insulin with the morning feeding and intermediate acting insulin and short acting insulin with the afternoon feeding caused afternoon post-prandial hypoglycemia. The same regimen without short acting insulin with the afternoon feeding caused overall acceptable blood glucose control in 14 days; morning insulin doses were 0.11, 0.13 and 0.21 IU/kg, and afternoon insulin doses were 0.23, 0.29 and 0.53 IU/kg. 50-60 days after diabetes induction blood glucose levels began to decrease in all pigs, both pre-prandially and post-prandially. Insulin doses were reduced but hypoglycemia persisted, and insulin doses were further reduced and finally removed. Pre-prandial blood glucose on day 3 after insulin removal was 14-16 mmol/l. 72 hours after the repeated procedure for induction of diabetes with STZ, blood glucose was 12-18 mmol/l.
Main results The main results of setup 3 were that strict aseptic technique ensured catheter function for over two months and that blood glucose could be reasonably tightly controlled. However, a very important result was the decreased insulin requirements. The methods
8
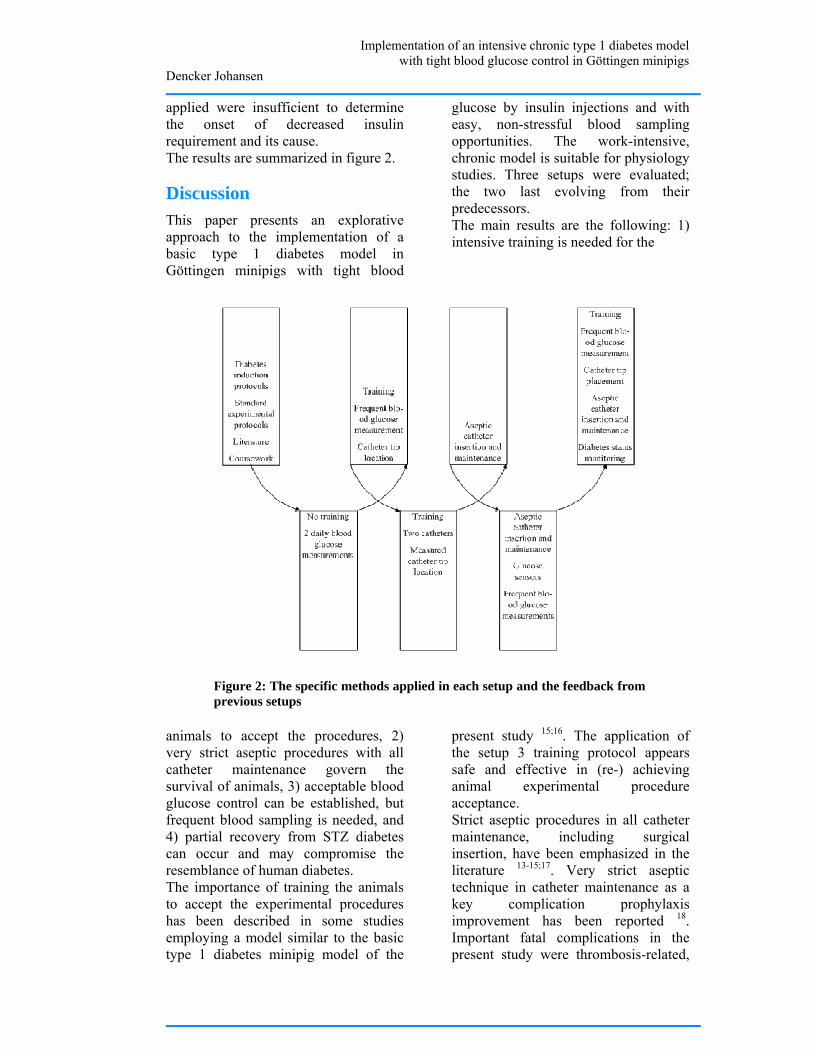
Implementation of an intensive chronic type 1 diabetes model with tight blood glucose control in Göttingen minipigs
Dencker Johansen
applied were insufficient to determine the onset of decreased insulin requirement and its cause. The results are summarized in figure 2.
Discussion This paper presents an explorative approach to the implementation of a basic type 1 diabetes model in Göttingen minipigs with tight blood
glucose by insulin injections and with easy, non-stressful blood sampling opportunities. The work-intensive, chronic model is suitable for physiology studies. Three setups were evaluated; the two last evolving from their predecessors. The main results are the following: 1) intensive training is needed for the
Figure 2: The specific methods applied in each setup and the feedback from previous setups
animals to accept the procedures, 2) very strict aseptic procedures with all catheter maintenance govern the survival of animals, 3) acceptable blood glucose control can be established, but frequent blood sampling is needed, and 4) partial recovery from STZ diabetes can occur and may compromise the resemblance of human diabetes. The importance of training the animals to accept the experimental procedures has been described in some studies employing a model similar to the basic type 1 diabetes minipig model of the
present study 15;16. The application of the setup 3 training protocol appears safe and effective in (re-) achieving animal experimental procedure acceptance. Strict aseptic procedures in all catheter maintenance, including surgical insertion, have been emphasized in the literature 13-15;17. Very strict aseptic technique in catheter maintenance as a key complication prophylaxis improvement has been reported 18. Important fatal complications in the present study were thrombosis-related,
Implementation of an intensive chronic type 1 diabetes model with tight blood glucose control in Göttingen minipigs
Dencker Johansen
commonly seen in animals with central venous catheters 19;20, even if sepsis-related complications are avoided 18;19;21. Blood glucose control by insulin injections was the major difficulty encountered in setup 3, while other, basal, method refinements ensured pig survival. To our knowledge, tight blood glucose control with multiple daily injections (compared to insulin pump therapy) in pigs has so far not been explored. However, pre-prandial blood glucose of 5-10 mmol/l by two daily subcutaneous injections of Velosulin and NPH porcine insulins are achievable 5 but accompanied by both hypo- and hyperglycemia 10. Surprisingly, weight-maintaining blood glucose control has required higher insulin doses than we found appropriate for reasonable tight blood glucose control 22-24. Insulin sensitivity variations in our animals may be governed not only by congenital biological variation but also variations in partial diabetes recovery and infection status, which was not investigated. The partial reversibility of diabetes status was unexpected, as stable diabetes is achievable for periods over 3 months with different STZ regimens 7;23;25-27. However, 1-2 months’ reversibility of diabetes is not uncommon 2;9;23, especially in young animals 9, and is accompanied by non-diabetic C-peptide levels 10;23. Reversibility is probably to some extent dose-dependent 23, but recovery has also been seen after STZ doses larger than 125 mg/kg as used in the present study 9;23. The efficiency of 200 mg/kg STZ for induction of chronic (>16 weeks) duration of C-peptide-negative diabetes was not established until 2008 by Hara and co-workers 23, as Liu and co-workers 28 did not report diabetes duration in their 200 mg/kg STZ pigs. The present failure of repeated STZ-injection to re-establish diabetes could indicate that the partial recovery is
caused by isolated beta-cell or small beta-cell cluster hypertrophy, as they, together with immature beta-cells, are less susceptible to STZ-induced destruction 9. Higher STZ doses and close monitoring of diabetes status by C-peptide or intravenous glucose tolerance tests as employed by Canavan and co-workers 5 are indicated. Diabetes status and infection status are important for effective blood glucose control. In laboratories not experienced with advanced models, this poses challenges to biochemical laboratory facilities, for instance for C-peptide radio-immunoassays. This should be considered carefully when evaluating the feasibility of implementing a chronic diabetes animal model. Different fatal outcomes or premature euthanasia causes occurred. They can be classified as handling-related, diabetes recovery-related or of unknown cause. Because a single focus area cannot be identified, several setup refinements are needed. Some fatal outcomes, such as handling and catheter related fatalities, may be preventable. Fatalities due to partial diabetes recovery may be preventable, but if not, their potential effects should be considered.
Conclusions In conclusion, our results indicate the possibility of implementing a chronic Göttingen minipig model of type 1 diabetes with near-normal blood glucose, controlled by insulin injections, and easy, non-stressful venous blood sampling access. A high success rate can be assured with good training of the animals, use of appropriate surgical and catheter maintenance techniques, and systematic diabetes status monitoring.However, researchers should carefully ensure adequate experience, sufficient time commitments and appropriate laboratory facilities. If these resources are lacking, the use of animals will be
10
Implementation of an intensive chronic type 1 diabetes model with tight blood glucose control in Göttingen minipigs
Dencker Johansen
highly unethical and the projects will most likely fail.
Acknowledgements The authors thank the veterinarians and laboratory technicians in the large-animal facility of Novo Nordisk, especially Bidda Rolin, Marianne O. Larsen and Helle Nygaard Laerke for their helpful advice and training. Also, the authors would like to thank Aalborg Hospital, especially Jan F. Pedersen, for putting the ABL 725 at disposition for the study. We also acknowledge the C. W. Obel foundation for financial support of the work. References (1) Larsen MO, Rolin B. Use of the
Gottingen minipig as a model of diabetes, with special focus on type 1 diabetes research. ILAR J 2004; 45(3):303-313.
(2) Lin S, Chen LL, Chien YW. Comparative pharmacokinetic and pharmacodynamic studies of human insulin and analogues in chronic diabetic Yucatan minipigs. J Pharmacol Exp Ther 1998; 286(2):959-966.
(3) Qvist MH, Hoeck U, Kreilgaard B, Madsen F, Frokjaer S. Evaluation of Gottingen minipig skin for transdermal in vitro permeation studies. Eur J Pharm Sci 2000; 11(1):59-68.
(4) Barb CR, Cox NM, Carlton CA, Chang WJ, Randle RF. Growth hormone secretion, serum, and cerebral spinal fluid insulin and insulin-like growth factor-I concentrations in pigs with streptozotocin-induced diabetes mellitus. Proc Soc Exp Biol Med 1992; 201(2):223-228.
(5) Canavan JP, Flecknell PA, New JP, Alberti KG, Home PD. The effect of portal and peripheral insulin delivery on carbohydrate and lipid metabolism in a miniature pig model of human IDDM.
Diabetologia 1997; 40(10):1125-1134.
(6) Larsen MO, Rolin B, Wilken M, Carr RD, Svendsen O, Bollen P. Parameters of glucose and lipid metabolism in the male Gottingen minipig: influence of age, body weight, and breeding family. Comp Med 2001; 51(5):436-442.
(7) Mesangeau D, Laude D, Elghozi JL. Early detection of cardiovascular autonomic neuropathy in diabetic pigs using blood pressure and heart rate variability. Cardiovasc Res 2000; 45(4):889-899.
(8) Larsen MO, Rolin B, Wilken M, Carr RD, Gotfredsen CF. Measurements of insulin secretory capacity and glucose tolerance to predict pancreatic beta-cell mass in vivo in the nicotinamide/streptozotocin Gottingen minipig, a model of moderate insulin deficiency and diabetes. Diabetes 2003; 52(1):118-123.
(9) Dufrane D, van SM, Guiot Y, Goebbels RM, Saliez A, Gianello P. Streptozotocin-induced diabetes in large animals (pigs/primates): role of GLUT2 transporter and beta-cell plasticity. Transplantation 2006; 81(1):36-45.
(10) Strauss A, Tiurbe C, Chodnevskaja I, Thiede A, Timm S, Ulrichs K et al. Use of the continuous glucose monitoring system in Goettingen Minipigs, with a special focus on the evaluation of insulin-dependent diabetes. Transplant Proc 2008; 40(2):536-539.
(11) Larsen MO, Wilken M, Gotfredsen CF, Carr RD, Svendsen O, Rolin B. Mild streptozotocin diabetes in the Gottingen minipig. A novel model of moderate insulin deficiency and diabetes. Am J Physiol Endocrinol Metab 2002; 282(6):E1342-E1351.
Implementation of an intensive chronic type 1 diabetes model with tight blood glucose control in Göttingen minipigs
Dencker Johansen
(12) Henderson KK, Mokelke EA, Turk JR, Rector RS, Laughlin MH, Sturek M. Maintaining patency and asepsis of vascular access ports in Yucatan miniature swine. Contemp Top Lab Anim Sci 2003; 42(6):28-32.
(13) Moritz MW, Dawe EJ, Holliday JF, Elliott S, Mattei JA, Thomas AL. Chronic central vein catheterization for intraoperative and long-term venous access in swine. Lab Anim Sci 1989; 39(2):153-155.
(14) O'grady NP, Alexander M, Dellinger EP, Gerberding JL, Heard SO, Maki DG et al. Guidelines for the prevention of intravascular catheter-related infections. Am J Infect Control 2002; 30(8):476-489.
(15) Swindle MM. Surgery, anesthesia, and experimental techniques in swine. Ames, IA: Iowa State University Press; 1998.
(16) Larsen MO, Rolin B, Sturis J, Wilken M, Carr RD, Porksen N et al. Measurements of insulin responses as predictive markers of pancreatic beta-cell mass in normal and beta-cell-reduced lean and obese Gottingen minipigs in vivo. Am J Physiol Endocrinol Metab 2006; 290(4):E670-E677.
(17) Swindle MM, Smith AC, Goodrich JA. Chronic cannulation and fistulization procedures in swine: a review and recommendations. J Invest Surg 1998; 11(1):7-20.
(18) Cowart RP, Payne JT, Turk JR, Tyler JW, Casteel SW. Factors Optimizing the Use of Subcutaneous Vascular Access Ports in Weaned Pigs. Contemp Top Lab Anim Sci 1999; 38(3):67-70.
(19) Chuang M, Orvieto M, Laven B, Gerber G, Wardrip C, Ritch C et al. Comparison of external catheters
with subcutaneous vascular access ports for chronic vascular access in a porcine model. Contemp Top Lab Anim Sci 2005; 44(2):24-27.
(20) Kohler TR, Kirkman TR. Central venous catheter failure is induced by injury and can be prevented by stabilizing the catheter tip. J Vasc Surg 1998; 28(1):59-65.
(21) Ege CA, Parra NC, Johnson TE. Noninfectious complications due to vascular access ports (VAPs) in Yucatan minipigs (Sus scrofa domestica). J Am Assoc Lab Anim Sci 2006; 45(6):27-34.
(22) Stump KC, Swindle MM, Saudek CD, Strandberg JD. Pancreatectomized swine as a model of diabetes mellitus. Lab Anim Sci 1988; 38(4):439-443.
(23) Hara H, Lin YJ, Zhu X, Tai HC, Ezzelarab M, Balamurugan AN et al. Safe induction of diabetes by high-dose streptozotocin in pigs. Pancreas 2008; 36(1):31-38.
(24) Wilson DE. Excessive insulin therapy: biochemical effects and clinical repercussions. Current concepts of counterregulation in type I diabetes. Ann Intern Med 1983; 98(2):219-227.
(25) Gerrity RG, Natarajan R, Nadler JL, Kimsey T. Diabetes-induced accelerated atherosclerosis in swine. Diabetes 2001; 50(7):1654-1665.
(26) Roth DA, White CD, Hamilton CD, Hall JL, Stanley WC. Adrenergic desensitization in left ventricle from streptozotocin diabetic swine. J Mol Cell Cardiol 1995; 27(10):2315-2325.
(27) Gabel H, Bitter-Suermann H, Henriksson C, Save-Soderbergh J, Lundholm K, Brynger H. Streptozotocin diabetes in juvenile pigs. Evaluation of an experimental
12
Implementation of an intensive chronic type 1 diabetes model with tight blood glucose control in Göttingen minipigs
Dencker Johansen
model. Horm Metab Res 1985; 17(6):275-280.
(28) Liu X, Mellert J, Hering BJ, Brendel MD, Federlin K, Bretzel RG et al. Sensitivity of porcine islet beta cells to the diabetogenic action of streptozotocin. Transplant Proc 1998; 30(2):574-575.