Embed Size (px)
Citation preview

UNIVERSITY OF GHANA
CUSTOMER RETENTION STRATEGIES IN THE AIRLINE INDUSTRY IN
GHANA
BY
ANANI SIMON
(10178972)
THIS THESIS IS SUBMITTED TO THE UNIVERSITY OF GHANA, LEGON IN
PARTIAL FULFILLMENT OF THE REQUIREMENT FOR THE AWARD OF
MPHIL MARKETING DEGREE
JUNE, 2013
University of Ghana http://ugspace.ug.edu.gh

i
DECLARATION
I do hereby declare that this thesis is the result of my own research towards the award of
MPhil degree in Marketing and that, to the best of my knowledge, it contains no material
previously published by another person nor material which has been accepted for the
award of any other degree of this or any other University, except where due
acknowledgement has been made in the text.
…………………………. …………………….
SIMON ANANI DATE
(10178972)
University of Ghana http://ugspace.ug.edu.gh

ii
CERTIFICATION
I hereby certify that this thesis was supervised in accordance with procedures laid down by
University of Ghana, Legon.
……………………………………. …………………….
DR. SAMUEL C.K. BUAME DATE
(PRINCIPAL SUPERVISOR)
………………………………… ……………………..
PROF. ROBERT EBO HINSON DATE
(CO- SUPERVISOR)
University of Ghana http://ugspace.ug.edu.gh

iii
DEDICATION
I dedicate this work to the glory of God Almighty whose unfailing love and unflinching
support have sustained me and have successfully seen me through my studies and for the
wisdom he granted me to produce this piece of work.
Again, I dedicate this work to my mother Ms. Olivia Gborglah of blessed memory for
giving me life but left me rather at a tender age. Mum rest in perfect peace!
I also dedicate this work to all airline industry professionals and enthusiasts who continue
to contribute their quota to the development and the sustenance of air transport for the
generation yet unborn.
University of Ghana http://ugspace.ug.edu.gh

iv
ACKNOWLEDGEMENT
Indeed to God be the Glory for great things he has done, his mercies and unending love
has kept faith with me throughout my entire education without much rancor. If it is the
case that I can see farther, it is because I stood on the shoulders of giants. My sincerest
gratitude goes to my academic mentors, Dr. Samuel C. K. Buame and Prof. Robert E.
Hinson, their patience, critical comments and constructive criticisms and suggestions on
every page, gave meaning to this research. You both are indeed a great source of
inspiration for me. In particular I wish to acknowledge my lead supervisor, Dr. Samuel C.
K. Buame who despite his heavy schedule did not only provide guidance and
encouragement at every stage of this thesis but was also a source of inspiration and the
flame which kept my candle of hope burning. Giants like you need special mention.
I would also want to extend my noble thanks and appreciation to my dearest sister Ms.
Selina Agor for performing a motherly role in my life and for making me who I am today.
I am forever indebted to Mrs. Jewel Kudjawu for your love, care and support during my
education. You for one have restored my waning confidence in humanity.
In no particular order I also wish to acknowledge the love, encouragement and support I
received from the following persons; Mr./Mrs. Martin Odum, Mrs. Doreen Annan, Mrs.
Doreenda Voado, Mrs. Cynthia Abole, Dr. E. M. Atua, Mr. Maclean Sarbah, Mr. Cartious
Enyonyoge Aziedu, Mr. Philip-Neri Jayson Quashigah and Mr. Bright Addo. To you all I
say thank you and may God bless you all. If you hear the cock crows the next morning, it
is my thanks and appreciation being extended to you in quantities.
Last but not the least, I am sincerely grateful to Mr. Edward Forson the Manager of
Corporate Planning, Ghana Airport Company Limited, Ms. Sandra Nyarko Koduah
Assistant Airport Manager (Terminal Operations), of Ghana Airports Company Limited
and Mr. Bright L. Adjokacher, the Corporate Planning Manager of Ghana Civil Aviation
Authority for their immeasurable contributions towards the success of this study.
University of Ghana http://ugspace.ug.edu.gh

v
TABLE OF CONTENTS
Content Page
DECLARATION ................................................................................................................... i
CERTIFICATION ................................................................................................................ ii
DEDICATION .................................................................................................................... iii
ACKNOWLEDGEMENT ................................................................................................... iv
TABLE OF CONTENTS ...................................................................................................... v
LIST OF TABLES ................................................................................................................ x
LIST OF FIGURES ............................................................................................................ xii
LIST OF ABBREVIATIONS ........................................................................................... xiii
ABSTRACT ....................................................................................................................... xiv
CHAPTER ONE: BACKGROUND OF THE STUDY ........................................................ 1
1.0 Introduction ..................................................................................................................... 1
1.1 Scope of the Study .......................................................................................................... 3
1.2 Statement of the Problem ................................................................................................ 4
1.3 Research Gap .................................................................................................................. 5
1.4 Objectives of the Study ................................................................................................... 8
1.5 Research Questions ......................................................................................................... 8
1.6 Research Hypotheses ...................................................................................................... 9
1.7 Significance/Justification of the Study............................................................................ 9
1.8 Organization of the Study ............................................................................................. 11
1.8.1 Chapter One- Research Overview .......................................................................... 11
1.8.2 Chapter Two- Literature Review and Conceptual Framework .............................. 11
1.8.3 Chapter Three- Context of the Study ..................................................................... 12
1.8.4 Chapter Four- Research Methodology ................................................................... 12
1.8.5 Chapter Five- Data Analysis and Discussion ......................................................... 12
University of Ghana http://ugspace.ug.edu.gh

vi
1.8.6 Chapter Six- Summary, Conclusion and Recommendation ................................... 13
1.8.7 Operational Definition of Terms and Concepts...................................................... 13
CHAPTER TWO: LITERATURE REVIEW AND CONCEPTUAL FRAMEWORK ..... 15
2.1 Introduction ................................................................................................................... 15
2.2 Background Information ............................................................................................... 15
2.3. Theoretical Perspectives to Customer Retention ......................................................... 18
2.3.1 Theoretical Framework of the Study .................................................................... 20
2.4 The Concept of Customer Retention ............................................................................. 21
2.5 Reasons for Customer Defections ................................................................................. 25
2.6. Relationship Marketing ................................................................................................ 27
2.6.1 Trust and Commitment in Relationship Marketing ................................................ 29
2.6.2 Relationship Commitment ...................................................................................... 30
2.6.3 Customer Trust ....................................................................................................... 31
2.6.4 Complaint Handling ............................................................................................... 32
2.7 Service Quality .............................................................................................................. 34
2.7.1 Airline Service Quality ........................................................................................... 36
2.8 Switching Barriers ......................................................................................................... 38
2.8.1 Switching cost ........................................................................................................ 41
2.8.2 Customer Service and Interpersonal relationship ................................................... 42
2.9 Service Recovery .......................................................................................................... 44
2.9.1 Service Failure and Service Recovery in the Airline Industry ............................... 47
2.9.2 Loyalty Rewards and Frequent Flyer Programs ..................................................... 50
2.10. Conceptual Framework .............................................................................................. 52
2.10.1 Components of the Conceptual Framework ......................................................... 53
2.10.2 Relationship Marketing ........................................................................................ 53
2.10.3 Airline Service Quality ......................................................................................... 54
University of Ghana http://ugspace.ug.edu.gh

vii
2.10.4 Switching Barriers ................................................................................................ 56
2.10.5 Frequent Flyer Programs (FFPs) .......................................................................... 57
2.10.6 Global Alliance ..................................................................................................... 57
2.10.7 Service Recovery .................................................................................................. 58
CHAPTER THREE: CONTEXT OF THE STUDY ........................................................... 60
3.0 Introduction ................................................................................................................... 60
3.1 The Physical Setting of Ghana and Kotoka International Airport ................................ 60
3.2 Historical Background of the Airline Industry in Ghana .............................................. 61
3.3 Operations of GCAA..................................................................................................... 62
3.4 Functions of GCAA ...................................................................................................... 63
3.5 Brief History of Ghana Airport Company Limited ....................................................... 63
3.6 Regional Airports .......................................................................................................... 66
3.6.1 Kumasi Airports ..................................................................................................... 66
3.6.2 Tamale Airport ....................................................................................................... 67
3.6.3 Takoradi Airport ..................................................................................................... 68
3.6.4 Sunyani Airport ...................................................................................................... 68
3.7 Developments in the Airline Industry in Ghana ........................................................... 69
3.8 The Domestic Airlines in Ghana ................................................................................... 71
3.8.1 Antrak Air ............................................................................................................... 71
3.8.2 Starbow ................................................................................................................... 72
3.8.3 Fly 540 .................................................................................................................... 73
3.8.4 Africa World Airlines ............................................................................................. 74
3.9 Contribution of the Airline Industry to the Economy of Ghana ................................... 74
University of Ghana http://ugspace.ug.edu.gh

viii
CHAPTER FOUR: RESEARCH METHODOLOGY ........................................................ 76
4.0 Introduction ................................................................................................................... 76
4.1 Research Purpose .......................................................................................................... 76
4.2 Research Approach ....................................................................................................... 77
4.3 Research Design and Strategy ....................................................................................... 78
4.4 Sample Design and Sample Size Selection Technique ................................................. 79
4.5 Sources of Data and Data Collection Methods ............................................................. 82
4.6 Pre Test ......................................................................................................................... 83
4.7 Analysis of Data ............................................................................................................ 84
4.8 Ethical Consideration .................................................................................................... 85
CHAPTER FIVE: DATA ANALYSIS AND DISCUSSION ............................................ 87
5.0 Introduction ................................................................................................................... 87
5.1 Socio-Demographic and General Background of Respondents .................................... 87
5.1.1 Age and Sex Distribution of Respondents ............................................................. 87
5.1.2 Educational Qualification of Respondents ............................................................. 89
5.1.3 Occupation of Respondents .................................................................................... 89
5.1.4 Place of Origin of Respondents .............................................................................. 90
5.1.5 Travel Frequency of Respondents .......................................................................... 91
5.1.6 Travel Frequency per Year ..................................................................................... 91
5.1.7 Airline Often Patronized ........................................................................................ 92
5.1.8 Most Important Factor in the Choice of an Airline ................................................ 93
5.9 Descriptive statistics of variables of Customer Retention Strategies ............................ 94
5.10 Assessment of Normality of Regression of Variables ................................................ 96
5.11 Assessing the level of correlation between variables .................................................. 97
5.12 Checking Variables for the presence of Multicollinearity .......................................... 97
5.13 Reliability of the Constructs........................................................................................ 98
University of Ghana http://ugspace.ug.edu.gh

ix
5.14 Regression Analysis .................................................................................................... 99
5.15 Discussion of Major Findings ................................................................................... 101
CHAPTER SIX: SUMMARY, CONCLUSIONS AND RECOMMNDATIONS ........... 109
6.0 Introduction ................................................................................................................. 109
6.1 Summary ..................................................................................................................... 109
6.2 Major Findings ............................................................................................................ 110
6.3 Conclusion .................................................................................................................. 111
6.4 Recommendations and Suggestion for Further Studies .............................................. 112
6.5 Recommendation to industry for practice and policy making .................................... 113
REFERENCES .................................................................................................................. 114
APPENDICES .................................................................................................................. 133
Appendix 1: Questionnaire ............................................................................................ 133
Appendix 2: Domestic Airline Statistics Actual ........................................................... 138
Appendix 3: International Airline Movement In Ghana ............................................... 139
Appendix 4: Market Share Analysis Of Major International Airlines In Ghana-2012 . 139
University of Ghana http://ugspace.ug.edu.gh

x
LIST OF TABLES
Table 3.1: Total Scheduled Airlines Operating in Ghana………………………… 65
Table 5.1: Sex of Respondents………………………………………………… 88
Table 5.2: Age of Respondents…………………………………………………. 88
Table 5.3: Education background of Respondents………………………………… 89
Table 5.4: Occupation of Respondent……………………………………………. 90
Table 5.5: Place of Origin……………………………………………………….. 90
Table 5.6: Travel Frequency…………………………………………………….. 91
Table 5.7: Travel Frequency per year………………………………………….. 92
Table 5.8: Relationship Marketing as Measured by CRS……………………….. 94
Table 5.9: Airline Service Quality as Measured by CRS……………………… 95
Table 5.10: Airline Switching Barrier as Measured by CRS……………………. 95
Table 5.11: Service Recovery as Measured by CRS……………………………. 96
Table 5.12: Skewness and Kurtosis Test for Normality…………………………… 96
Table 5.13: Pearson Correlation Matrix………………………………………….. 97
Table 5.14: Assessment of Multicollinearity……………………………………… 98
Tables 5:15: Reliability Test with the Cronbach‟s Alpha……………………… 99
Table 5.16: Regression Model for Customer Retention Strategies………………. 100
University of Ghana http://ugspace.ug.edu.gh

xi
Table 5.17: Association between relationship marketing and customer retention… 105
Table 5.18: Association between Airline Service Quality and Customer Retention. 106
Table 5.19: Association between Airline Switching Barrier and Customer
Retention…………………………………………………………………………… 107
Table 5.20: Association between Service Recovery and Customer
Retention…………………………………………………………………………… 107
Table 5.21: A Summary of the Tested a priori Hypotheses of the Study…………. 108
University of Ghana http://ugspace.ug.edu.gh

xii
LIST OF FIGURES
Figure 2.1 Conceptual Framework on Customer Retention Strategies in the
Airline Industry Ghana……………………………………... 59
Figure 3.1 A Map of Ghana Showing the Airports and Airstrips……… 69
Figure 5.1 Airline Often Patronized………………………..................... 92
Figure 5.2 Most Important Factor when Choosing an Airline………….. 93
University of Ghana http://ugspace.ug.edu.gh

xiii
LIST OF ABBREVIATIONS
AAGR Annual Average Growth Rate
ASB Airline Switching Barriers
ASQ Airline Service Quality
AWA Africa World Airlines
CLTV Customer Lifetime Value
CR
CRS
Customer Retention
Customer Retention Strategies
DME Distance Measurement Equipment
FIR Flight Information Region
GACL Ghana Airports Company Limited
GCAA Ghana Civil Aviation Authority
GDP Gross Domestic Product
GSS Ghana Statistical Service
IATA International Air Transport Association
KIA Kotoka International Airport
NPV Net Present Value
PNDC Provisional National Defense Council
PWD Public Works Department
RFFS Rescue and Fire Fighting Services
RM
SET
SPSS
Relationship Marketing
Social Exchange Theory
Statistical Package for Social Sciences
SR Service Recovery
SSNIT Social Security and National Insurance Trust
TARP Technical Assistance Research Program
US DOT
VIF
United States Department of Transportation
Variance Inflation Factor
VOR Very-high Omnidirectional Range
University of Ghana http://ugspace.ug.edu.gh

xiv
ABSTRACT
Customer Retention is a cine qua non for the survival and sustainability of firms in today‟s
competitive but volatile business environment. Retaining the customer is good for the
health and the general wellbeing of firms. The economic benefits of customer retention
cannot be over-emphasized as it culminates in the overall profitability of firms.
The open skies policy in the air transport industry in Ghana sparked intense competition
and has witnessed proliferation of airlines into the industry. This calls for deliberate
workable strategies aimed at not only acquiring customers but also keeping them as well
so as to prevent customers from defecting to competitors.
Several studies have been conducted to identify the importance of customer retention
especially in the banking sector. Little is known about the design of workable customer
retention strategies in the airline industry in Ghana.
The aim of this study was to find out the correlation between constructs of Relationship
Marketing (RM), Airline Service Quality (ASQ), Airline Switching Barriers (ASB) and
Service Recovery (SR) and Customer Retention in the airline industry in Ghana.
A quantitative method and researcher-administered questionnaire was used to investigate
the problem. The survey design was a cross-sectional non-experimental study of 337
respondents which was sampled by using a multistage probability and non-probability
sampling techniques. Bivariate and standard multiple regression models were used for
analysis.
The analysis of the study clearly revealed that all the four constructs used in the study
namely; RM, ASQ, ASB, and SR are significantly and positively associated with customer
retention with the duo constructs of ASQ and ASB being the most significant.
Despite limitations such as generalizability, the findings of this study provides evidence
that airline industry professionals need to pay close attention to these strategies especially
Airline Service Quality and Airline Switching Barriers and fine-tuning them to reflect the
exigencies of the time and also to ensure their continued use and adoption for an improved
Customer Lifetime Value.
University of Ghana http://ugspace.ug.edu.gh

1
CHAPTER ONE
BACKGROUND OF THE STUDY
1.0 Introduction
The airline industry plays an important role in the global economy. It is a vital component
of the travel and tourism industry and remains essential to the conduct of international
business (Tiernan et al., 2008). The airline industry is known to be the major catalyst for
the socio-economic development of emerging economies such as ours (GACL, 2012). The
airline industry is the engine that drives global economic and social progress as it connects
people, countries, cultures, and provides access to global markets and generates trade and
tourism. It forges links between developed and developing nations.
The aviation industry has experienced phenomenal growth since World War II. From an
almost zero level, to an approximate of 2,000 airlines operates a total fleet of 23,000
aircrafts around the world. They serve some 3750 airports through a route network of
several million kilometers managed by around 160 air navigation service providers. The
aviation industry today transports over 2.2 billion passengers annually both for business
and leisure (IATA, 2012).
In terms of worldwide trade, the total value of goods transported by air represents 35% of
all international trade. The industry also caters for 40% of international tourist travel. The
aviation industry today has 32 million jobs worldwide and contributes over 8% (US$ 3557
billion) to the world‟s GDP (IATA, 2011).
IATA‟s forecast show that this growth in the aviation sector in expected due to trade and
air transport deregulation and liberalization, new leisure patterns, high income elasticity of
demand and increasing value of goods to be transported. Meanwhile, international
passenger growth is expected to slow slightly whilst domestic passenger growth would
University of Ghana http://ugspace.ug.edu.gh

2
improve slightly. International passenger numbers are forecasted to grow at an average
annual rate (AAGR) of 5.1% and the domestic passenger numbers at an AAGR of 5.3%
between 2008 and 2012. However, the airline industry and these forecasts by IATA
remain exposed to several risks ranging from temporary negative impacts such as natural
disasters, security scares and high fuel prices and the slower than expected growth in the
global economy. Despite these, the fundamental factors driving growth remain reasonably
positive. The air transport industry in Africa also shows a strong growth of 11.4% which
has been sustained since 2007 (GACL, 2012).
In like manner, the airline industry in the Ghana has also seen a massive growth in recent
times with an average growth rate of over 8% and has also witnessed passenger
throughput increased from 293,613 to 543379 in 2012 alone (GACL, 2012). The growth
of the sector especially the domestic sub-sector is attributable to increasing confidence in
safety and security of domestic air transport coupled with the deregulation and
liberalization of the airline sector which culminated into the influx of a lot of airlines into
Ghana including the domestic sub-sector. This brought fierce competition into the industry
which forced industry professionals to devise workable strategies so as to stay in business.
The best strategy is to focus on developing programs aimed at retaining acquired
customers in the face of the competition.
Traditionally, superior marketing and customer service were viewed as providing the right
product in the right place and at the right time. However, a new version of marketing has
emerged where the “focus is on the customer and on their needs and preferences”
(Christopher et al., 1993).
The tremendous rapid growth of the services industry has changed the face of business
globally. As the market become more competitive, firms are more likely to attempt to
University of Ghana http://ugspace.ug.edu.gh

3
maintain their market share by focusing on retaining the current customer (Lee et al.,
2001). Customer retention has been advocated as the most ideal, the more reliable and
potent source of superior performance (Reichhled & Sasser, 1990).
The sole purpose of business is to create the customer (Drucker, 1964). However,
retaining the created customer has been regarded as equally, if not more important.
Dawkins & Reichheld, (1990) indicated that a 5% increase in customer retention can
generate an increase in customer net present value of between 25% and 85% across a wide
range of business environments. This generated growing interest and recognition of the
fact that customers like products have a life-cycle that firms can manage. This implies that
customers can be acquired, retained and can also be grown to generate value over time.
Customers are said to climb a value staircase (Gordon, 1998) or value ladder (Christopher
et al., 1991) from suspect, prospect and first-time customer to majority customers and
ultimately to partner or advocate status (Ang & Buttle, 2006).
1.1 Scope of the Study
Quite a number of studies have established the significance of retaining customers and its
impact on overall profitability of firms especially in the financial services sector, but these
studies failed to identify workable strategies geared towards retaining the customer. This
study is based on the premise that a set of four proximate a priori strategies combine to
significantly determine customer retention rate in the airline industry.
The study therefore identified four main proximate strategies that can ensure customer
retention in an organization especially in the airline industry. Many research works have
sought to establish the importance of customer retention, but this study dilates mainly on
four constructs of Relationship Marketing, Airline Service Quality, Airline Switching
University of Ghana http://ugspace.ug.edu.gh

4
Barriers, and Service Recovery and their correlation and association with Customer
Retention.
This study again limits itself to reviewing only self identified measuring variables that are
related and relevant to the study in order to ensure consistency and make the study more
rigorous and robust.
1.2 Statement of the Problem
The need to reduce customer attrition and churn rates in the face of fierce competition
coupled with technological advancements in a highly volatile business environment like
that of the airline industry has become a more arduous task than ever thought. The major
preoccupation of modern airlines is to acquire customers but this has not been the case.
Airlines all over the world have lost and continue to lose customers to the extent that it has
direct impact on their returns on investment and a practical implication for their very
existence and survival.
Undoubtedly most airlines lose some customers one way or the other, but few ever
measure how many of their customers become inactive. Many airlines ironically invest an
enormous amount of time, effort and money building that initial customer relationship.
They then let that relationship go unattended to and, in some cases losing interest as soon
as the sale has been made, or even worse, they abandon the customer as soon as an
unavoidable problem occurs, only to have to spend another resource to replace the lost
customer. This high degree of customer churn rate in the airline industry is what is
referred to as the leaky bucket (Lovelock, 1995). The reality is that customer retention in
today‟s airline service environment is very difficult to tackle in a market that is highly
volatile and that it takes more than just advertisements and incentives.
University of Ghana http://ugspace.ug.edu.gh

5
As intimated earlier the services industry such as that of the airline is fraught with wide
array of challenges including fierce and increasing competition (Tiernan et al., 2008),
global economic decline that led to decreased demand (Fodness & Murray, 2007),
declining profitability in the industry; as net profit margin for global commercial airlines
decreased from 2.9% in 2010 to 1.4% in 2011 (IATA, 2011), rising fuel prices (IATA,
2011), airlines are prone to service failures due to the service processes employed in the
service delivery (Bejou & Palmer , 1998). Given these encumbrances, airlines continue to
struggle to retain their customers in order to reduce customer attrition and churn rates.
1.3 Research Gap
A cursory look at extant literature on customer retention revealed that researchers
concentrated much of their attention and works on customer acquisition to the neglect of
customer retention strategies. Furthermore, quite a number of studies have recounted on
the importance of customer retention which was only limited to the banking sector and
their studies focus mostly on Europe.
Again, previous works also dilated mostly on the significance of customer retention in the
banking and the financial sector (Cohen et al 2006; Liu & Wu, 2007; Fisher, 2001; Page et
al 1996; Reihheld & Kenny, 1990; Dwakins & Reichheld, 1990; Marple & Zimmerman,
1999; Mirza et al., 2007). Other researchers focus on switching process and customer
defection only in the banking sector (Trubik & Smith, 2000; Desouza, 1992). Other
studies looked at service quality issues in the banking sector (Petridou et al., 2007;
Ganguli & Roy, 2011; Roig et al,. 2006; Ladhari et al., 2011).
University of Ghana http://ugspace.ug.edu.gh

6
More works on customer retention strategies has been championed by Ahmad & Buttle,
(2001) when they conducted a research to test the extent to which theoretical perspectives
relating to strategies for retaining customers reflected practices in industry. After their
study, they professed some strategies for retaining customers but failed to demonstrate the
relationship between these strategies and their overall contribution to customer retention
and firm profitability which this study seeks to do.
In the Ghanaian context, quite a number of studies have been conducted in service quality
(Arko, 2006; Hinson et al., 2011). There is also work on relationship marketing and its
impacts on customer retention (Baah, 2005). A similar study on customer retention was
conducted by (Agudze-Tordzro, 2012) where she developed customer retention strategies
in the banking sector in Ghana.
In the airline industry, most studies focus mainly on service quality issues only (Rhoades,
2006; Tiernan et al., 2008; see Jordan, 1970). Literature is also cited on service failure and
service recovery on airline passengers (Mostert et al., 2009), but failed to link it to
customer retention.
There has been little research into the development of customer retention strategies, per se
especially in the airline industry (DeSouza, 1992). Meanwhile there has been research
findings showing the relative weights attached to customer retention budgets. According
to Weinstein, (2002), “most companies spend a majority of their time, energy and
resources chasing new business”. He suggested that “80% or more of marketing budgets
are often earmarked for getting new business”. This is in line with Payne et al., (2001)
findings which concluded that only 23% of marketing budgets in UK organizations is
spent on customer retention. In contrast, Aspinall et al., (2001), found out that 54% of
companies reported that customer retention was more important than customer acquisition.
University of Ghana http://ugspace.ug.edu.gh

7
Earlier studies concluded on the simple premise that- satisfied customers continue service
patronage, resulting in positive financial benefits to the service provider. But it is now
common knowledge that mere satisfaction does not ensure continued service patronage.
This is because, in addition to satisfaction, other factors combine to influence service
patronage. It is these factors that this research seeks to investigate and they are service
quality, customer loyalty, switching barriers and service recovery strategies.
Few key studies have already established the links between service quality and customer
satisfaction, and between satisfaction and firm financial performance. For example,
Johnston, (1995) examined the link between service transactions and overall satisfaction,
Fornell et al., (1995) linked customer satisfaction and quality initiatives to firm financial
performance, Ittner & Larcher, (1996) undertook a similar study where the main focus was
the link between quality initiatives (closely linked to customer satisfaction) and firm
financial performance, Reichheld & Sasser, (1990); Heskett et al., (1994) and Rucci et al.,
(1998) established the link between customer satisfaction and improved financial
performance.
Given this serious gap in the literature, most industry practitioners especially in the airline
industry in Ghana depended heavily on the wholesale import and reception of foreign
literature on customer retention and recommended for Ghanaian practice which in most
cases does not apply in our local context.
Therefore, the direction of this research is to focus on developing an integrated but
independent constructs that draws on relationship marketing, service quality, switching
barriers and service recovery strategies and its relationship on customer retention and
overall profitability of firms. To date, no study has been conducted yet that incorporates
University of Ghana http://ugspace.ug.edu.gh

8
the concepts of RM, ASQ, ASB and SR in a single study with special focus on customer
retention in the airline industry.
1.4 Objectives of the Study
On the basis of the background overview and statement of the problem, this study set out
to identify the customer retention strategies that can adequately ensure customer retention
in the airline industry in Ghana. To this end, the following specific objectives were
formulated:
1. To find out whether Relationship Marketing is significantly associated with
Customer Retention.
2. To investigate the correlation between Service Quality and Customer Retention.
3. Determine whether Switching Barriers significantly relates to Customer Retention.
4. Explore if Service Recovery significantly correlates with customer retention.
1.5 Research Questions
In order to achieve the objectives enumerated above, the following questions were asked:
1. What is the connection that exists between Relationship Marketing and Customer
Retention?
2. Is there any significant correlation between Airline Service Quality and Customer
Retention?
3. Does Switching Barriers significantly associate with Customer Retention?
4. Does Service Recovery increase the rate of Customer Retention?
University of Ghana http://ugspace.ug.edu.gh

9
1.6 Research Hypotheses
On the basis of the research objectives and questions as well as review of extant literature
on customer retention, I draw the following hypotheses which could either be rejected or
accepted and would be tested at 0.01 level of significance.
H1: Relationship Marketing is significantly related to Customer Retention.
H2: There is significant positive relationship between Airline Service
Quality and Customer Retention Rate.
H3: The higher the Switching Barrier the lower the Customer Retention
Rate.
H4: There will be a significant relationship between service recovery and
Customer Retention.
1.7 Significance/Justification of the Study
It has long be acknowledged that the fundamental purpose of marketing is the getting and
keeping of customers (Levitt, 1986). It is widely accepted that it costs more to generate
new customers than it does to keep hold of existing clients.
In other words, it is an established fact that it is far more expensive to find new customers
than to keep your current ones happy. Customer retention matters in times of tough
economic times as we have currently. This is because the consequences of customer
retention compounds over time and in some cases in unexpected ways. A minute change in
customer retention can cascade through the entire fabrics of all business activities and
multiply over time.
The resulting effect of adopting customer retention on long-term profit and growth should
not be underestimated. The argument for customer retention is not in dispute at all because
many researchers and scholars have long recognized the economic value in retaining
University of Ghana http://ugspace.ug.edu.gh

10
customers than acquiring new ones (Reichheld & Sasser 1990, Dawkins & Reichheld
1990; Fornell, 1992,; Healy, 1999; Fisher, 2001; Hogan et a.,l 2003; Lee-Kelly et al.,
2003).
In more specific terms Rust & Zahorik (1993), asserts that the financial implication of
acquiring new customers to “replace” those who have been lost may be five times as
costly as keeping existing customers. The significance of focusing on customer retention is
based on the principle that it is easier and considerably less expensive to retain a customer
than to continuously attempt to acquire new customers (Kim & Cha 2002; Magnini &
Ford 2004; Murphy 2001; Rosenburg & Czepiel 1983). This is because the cost of
acquiring new customers would only have been incurred only in the initial stages of the
commercial relationship (Reichheld & Kenny, 1990). A more succinct argument has been
made which suggest that a 5% improvement of customer retention would increase a firm‟s
profit margins from between 25% to 85% (Reichheld & Sasser, 1990).
The high cost of customer acquisition compared to the lower cost of serving repeat
customers and the consequent increase in profitability is an important reason why firms
are advised to increase levels of customer retention. Drucker, (1963) believed that
marketing is much concerned with acquiring as well as retaining customers. This is
because the significance of retaining customers in an organization is not a new
phenomenon in marketing. The high cost of customer acquisition compared to the lower
cost of serving repeat customers, and the consequent increase in profitability, is an
important reason why firms are advised to increase levels of customer retention (Colgate
& Danaher, 2000).
A number of studies have identified the benefits of retention to an organization (Reichheld
& Sasser, 1990). Since replacing cost are high, customers defection must be a key
University of Ghana http://ugspace.ug.edu.gh

11
performance gauge for practitioners and scholars alike and a fundamental component of
incentive programs (Zeithaml et al., 2006). Other researchers also suggest that, customer
longevity is not synonymous with customer loyalty. Retained customers do demonstrate
immunity to competitive pull to the extent that a customer may however graduate from
being a client, to supporter and finally an advocate.
1.8 Organization of the Study
The study is organized into six major chapters which include the introduction and
background to the study, literature review and conceptual framework, context of the study,
research methodology, data analysis and discussions and summary, conclusions and
recommendations. These are briefly explained below.
1.8.1 Chapter One- Research Overview
This is the first chapter of the study and therefore presents the introduction and
background to the study, statement of the problem, research objectives, hypothesis and
questions, significance or justification of the study, research gap, scope of the study,
definition of terms and the chapter layout of the study.
1.8.2 Chapter Two- Literature Review and Conceptual Framework
This second chapter dealt with review of extant literature to elucidate existing theories and
concepts that underpin this study. The review involves an in-depth and empirical review of
the literature on the subject matter of the study which is customer retention strategies with
special emphasis on the customer retention strategies in the airline industry in Ghana, why
or the benefits derived from retaining customers, customer defection, relationship
marketing, airline service quality, airline switching barriers and service recovery strategies
University of Ghana http://ugspace.ug.edu.gh

12
in the airline industry. These retention strategies are encapsulated in the conceptual
framework which also forms part of this chapter.
1.8.3 Chapter Three- Context of the Study
This chapter focuses more on the issues relating to the airline industry in Ghana. It also
discusses the performance of the airline industry in Ghana giving the historical
background of the airline industry in Ghana, nature and structure of the airline industry,
developments taking place in the industry, the major policies and reforms in the airline
sector and the role of the airline industry to the socio-economic development of Ghana.
1.8.4 Chapter Four- Research Methodology
This chapter dwells more on the research methodology of study adopted for the study.
This chapter talks about the philosophical stance of the researcher. This chapter also deals
with the research approach, design, sample size, sources of data, data collection
procedures, data analysis and discussion and the limitation of this study. Statistical
Package for Social Sciences (SPSS v20) was used to analyze the data gathered.
1.8.5 Chapter Five- Data Analysis and Discussion
Chapter five presents the major findings of this research using Statistical Package for
Social Sciences (SPSS version 20) as the major tool of analysis. The interpretation of the
findings was done using multiple regression method. This allows for further discussion of
major findings of the study taking into consideration the hypothesis and extant literature of
this research.
University of Ghana http://ugspace.ug.edu.gh

13
1.8.6 Chapter Six- Summary, Conclusion and Recommendation
This is the final chapter of this study and reports on the previous chapter giving summaries
of work done so far, major findings of the study, drawing conclusions and proffering some
recommendations for airlines operating in Ghana and the entire academic community to
serve as the basis for further studies to be conducted in this area.
1.8.7 Operational Definition of Terms and Concepts
This study adopts an operational definition of major terms and concepts used throughout
this research. The author uses and offer definitions and explanations that best describe the
concepts as used in the main text. By doing so the main terms and concepts used in the
study are being put in the right perspective though not limited to these definitions offered.
Marketing- An organizational function and set of processes for creating, communicating,
exchanging offerings, delivering of value to customers and managing customer
relationships in ways that benefits the organization, clients, partners and society at large
(AMA, 2004).
Firm- A commercial entity that operates on a for-profit basis and participates in the
delivery of services to customers. It must be noted that in this study terms such as firm,
organization and company are used interchangeably.
Service- An activity or series of activities of a more or less intangible nature that normally
take place in interactions between the customer and the service employee or systems of the
provider, which are provided as solutions to customer needs or problems (Hinson 2004).
Zeithaml and Bitner(2000) in a succinct way put it as deeds, processes and performances.
Airline or Carrier- An organization providing a regular passenger air service.
University of Ghana http://ugspace.ug.edu.gh

14
Customer Retention- Refers to the way in which organizations focus their efforts on
existing customers in an effort to continue doing business with particular customers in the
future (Murphy et al 2006 and Hoffman et al 2003).
Relationship Marketing- Refers to efforts by organizations to retain customers by
building and maintaining long-term relationships with them (Christopher et al 2002;
Torres & Kline, 2006). Relationship marketing therefore focuses on customer retention by
designing, developing and maintaining customer relationships over the lifetime of the
customer rather than focusing on attracting new customers (Zineldin & Phiilipson, 2007).
Customer Commitment- Defined as “an ongoing relationship with another that is so
important as to warrant maximum efforts at maintaining it”. Or an enduring desire to
maintain a valued relationship.
Customer Trust- (Morgan and Hunt, 1994) conceptualizes trust as “the willingness to rely
on an exchange partner in whom one has confidence”. It also means confidence in an
exchange partner‟s reliability and integrity.
Switching Barriers- these are deliberate structures imposed by a service provider to
prevent customer from switching to competitors.
Service Failure- a service failure refers to a real or perceived service related problem or a
situation in the service delivery process where something went wrong in dealing with the
organization (Palmer 2001). That is the customer‟s expectations of the service encounter
are therefore not met by the organization.
Service Recovery- Refers to those actions taken by an organization in response to a service
failure in order to change customer‟s dissatisfaction to satisfaction and ultimately to retain
those customers (Miller et al 2000; Gronroos, 1990).
University of Ghana http://ugspace.ug.edu.gh

15
CHAPTER TWO
LITERATURE REVIEW AND CONCEPTUAL FRAMEWORK
2.1 Introduction
In order to better understand and position this research in the right perspective, it is the
belief of the researcher that a cursory look is taken at extant works on customer retention
and the various theoretical and empirical literature that underpin the topic in order to
develop a framework that better explains the various concepts in the literature reviewed.
This would give an insight on how far scholarly work has gone on this topic as well as
address any gap in knowledge.
2.2 Background Information
The fundamental argument that has been continuously made is that the main purpose of
marketing is “getting and keeping of customers” (Levitt, 1986). However it appears in
practice that more attention is placed on getting customers than keeping them. This makes
valid the argument for airlines to deliberately initiate strategic programs aimed at customer
retention. This is attributable to the many empirical studies which demonstrate the
economic gains arising from customer retention than acquiring new ones (Dawkins &
Reichheld, 1990, Reichheld & Sasser, 1990; Fornell, 1992; Healey, 1999; Fisher, 2001).
The financial implications of acquiring new customers to “replace” those who have been
lost may be five (5) times as costly as keeping existing customers (Rust & Zahorik, 1993)
because the financial cost is only incurred at the beginning stages of the relationship
(Reichheld & Kenny, 1990). Again a 5% improvement in customer retention can cause
increase in profitability between 25% and 90% (Reichheld & Sasser, 1990) and that loyal
customers are less likely to change service providers due to price increases as they tend to
recommend the business to others (Healey, 1999 and Reichheld & Sasser, 1990).
University of Ghana http://ugspace.ug.edu.gh

16
This observation by these scholars offers very useful insights into the importance of the
adoption of customer retention as a panacea to the challenges in the airline sector in order
to ensure survival and profitability of airlines in Ghana in the face of the fierce
competition which has characterized the industry of late as a result of government open
skies policy.
Some authors were of the opinion that when carriers are able to reduce customer defection
by as little as 5%, they would be able to double their profit margins (Healey, 1999). Given
the competitive nature of the airline sector in Ghana, airlines that want to keep their
businesses afloat needs to develop strategies to satisfy the needs of their customers which
would make the customer continue to patronize the services of the airline in order to keep
them loyal. In this regard, the focus of this study is to assess the relationship of a priori
retention strategies that can be used to retain customers within an increasingly competitive
and turbulent airline industry.
The support for retaining customers in the marketing literature (Ennew & Binks, 1996;
Reichheld 1996; Ahmad & Buttle 2002a; Ahmad & Buttle, 2002b) is very extensive. The
arguments which justify the customer retention as a business strategy as opposed to
acquiring new customers are rooted in economics and the concept customer lifetime value
CLTV (Ahmad & Buttle 2001). CLTV comes as a result of a continuous future purchases,
referrals and avoidance of negative word-of-mouth (Zineldin, 2006).
For a customer retention strategy to be successful firms must project the value of
individual customers over time rather than focusing on customer numbers. It must also be
noted that longevity of relationship leads to an increase in retention rates and thus a
corresponding increase in profit (Dawkins & Reichheld, 1990; Reichheld & Sasser, 1990;
Reichheld, 1996).
University of Ghana http://ugspace.ug.edu.gh

17
The support for retaining customers in the marketing literature (Ennew & Binks, 1996;
Reichheld 1996; Ahmad & Buttle 2002a; Ahmad & Buttle, 2002b) is very extensive.
Sigala, (2005) suggested that service industries are undergoing significant developments
so much so that the focus is shifting from customer acquisition to customer retention.
It is therefore imperative that organizations not only attract new customers and satisfy
their immediate needs, but also do their utmost to retain customers as this will give them a
greater chance of survival than organizations that do not actively try to retain customers
(Choi & Chu, 2001). The arguments that have been adduced to justify customer retention
as a business strategy as opposed to acquiring new customers are rooted in economics and
the concept of Customer Lifetime Value CLTV (Ahmad & Buttle, 2001). CLTV comes as
a result of a continuous future purchases, referrals and avoidance of negative word-of-
mouth (Zineldin, 2006).
The economic benefits include the possibility of organizations to forecast customers‟
future purchases, sales, marketing and the acquisition costs of customers can be reduced;
satisfied customers may be willing to pay premium prices and often make referrals to
others and the per customer income is likely to grow as customers are likely to increase
their spending with the organization as the relationship grows through cross-selling
(Desouza, 1992; Payne, 1993; Reichheld 1996; Rosenburg & Czepiel 1983).
Non-economic benefits include the willingness of customers to work with the organization
to improve product and service offerings as well as the formation of relationships with
other partners, such as employees and suppliers (Ahmad & Buttle, 2001).
For a customer retention strategy to be successful firms must project the value of
individual customers over time rather than focusing on customer numbers. It must also be
noted that longevity of relationship leads to an increase in retention rates and thus a
University of Ghana http://ugspace.ug.edu.gh

18
corresponding increase in profit (Dawkins & Reichheld, 1990; Reichheld & Sasser, 1990;
Reichheld, 1996).
Six economic benefits have been put forward by Reichheld, (1996) and have been
summarized below;
a. Savings on customer acquisition or replacement costs,
b. A guarantee of base profits as existing customers are likely to have minimum
spending per period;
c. Growth in per-customer revenue as, over a period of time, existing customers are
likely to earn more, have more varied needs and spend more;
d. Price premiums as existing customers do not usually wait for promotions or price
reductions before deciding to purchase, in particular with new models or versions
of existing products or services;
e. A reduction in relative operating costs as the firms can spread the cost over many
more customers and over a longer period;
f. Free of charge referrals of new customers from existing customers which would
otherwise be costly in terms of commissions or introductory fees.
2.3. Theoretical Perspectives to Customer Retention
Researchers have employed variety of theories and conceptual perspectives to explain the
adoption of customer retention as strategy for organizational success and profitability.
Prominent among these studies include those highlighted in this study. Theoretical
positions relating to customer retention management emerged from three main
perspectives (Hinson, 2006). They are services marketing, industrial marketing and
general management perspectives.
University of Ghana http://ugspace.ug.edu.gh

19
From the service marketing perspective, the way to retain customers is to improve
customer service quality and satisfaction (Berry & Parasuraman 1991, Zeithaml & Bitner,
1996). A related study (Ennew & Binks, 1996) examined the links between defection and
service quality in the context of relationships.
From the industrial marketing perspective, the way to retain customers is by forging multi-
level bonds comprising financial, social and structural bonds. Turnbull & Wilson (1989)
examined the potential benefits of protecting profitable customer relationships through not
just social but also structured bonds in the context of industrial marketing. They refer to
social bonds as positive interpersonal relationships between buyers and sellers.
From a general management perspective, DeSouza, (1992), Rosenburg & Czepiel, (1984)
and Reichheld, 1996) offered theoretical positions from their observation and consulting
experience. DeSouza, (1992) advocated retention measurement and the implementation of
measures to prevent customers from defecting by learning from former customers,
analyzing complaints and service data and identifying and raising barriers to prevent
customer switching.
Rosenburg & Czepiel (1984) advocated an analysis of a firm‟s customer portfolio with the
view of creating specific balance which may include the first time buyers, repeat buyers,
switched away then return, and last time buyers and reorganizing the firm‟s strategies for
customer retention.
Reichheld (1996) advocated the adoption of a three-pronged approach to keeping
investors, employees and customers and the adjustment of the firm‟s mission which should
be about creating value for its three above mentioned constituencies. His idea rests on the
notion that disloyal employees are not likely able to build an inventory of loyal customers
and disloyal investors do not support long term relationship program and vice versa.
University of Ghana http://ugspace.ug.edu.gh

20
2.3.1 Theoretical Framework of the Study
This study however, draws its theoretical underpinnings mainly from the social or
economic exchange theory (Homans, 1961).
Social and economic exchange theory
Social Exchange Theory (SET) arose out of the philosophical traditions of utilitarianism,
behaviorism, and neoclassical economics. Social exchange theory proposes that social
behavior is the result of an exchange process. The purpose of this exchange is to maximize
benefits and minimize cost for partners involved in the exchange relationship. According
to this theory, people weigh the potential benefits and risks of social relationships. When
the risks outweigh the rewards, people will terminate or abandon that relationship.
Cost according to the theory involves things that are seen as negatives to the individual
such as having to put money, time and effort into the relationship. The benefits are the
things that the individual gets out of a relationship such as increased market share and
profitability on the part of the organization whilst on the customer‟s part customized and
specialized product and services.
SET suggests that we as rational beings will essentially take the benefits and minus the
costs in order to determine how much a relationship is worth. Positive relationships are
those whose benefits outweighs the costs, whilst negative relationship occur when the cost
are greater than benefits.
Social exchange theory is a socio-psychological and sociological perspective that explains
social change and stability as a process of negotiated exchanges between parties. The
theory posits that all human relationships are formed by the use of a subjective cost-
benefit analysis and the comparison of alternatives. Both parties in a social exchange take
responsibility for one another and depend on each other‟s social interaction. Blau (1964)
University of Ghana http://ugspace.ug.edu.gh

21
defined exchange behavior as voluntary actions of individuals that are motivated by the
returns they are expected to bring. It is likened to transactions in economic marketplace. In
other words, exchange is a theory which attempts to explain interpersonal behavior in
terms of the exchange of rewards and costs.
Though social exchange and economic exchange are synonymous in their characteristics,
according to Stafford (2008), economic exchanges and social exchanges have some
differences: Social exchanges involve a connection with another person; social exchanges
involve trust, no legal obligations; social exchanges are more flexible; and social
exchanges rarely involve explicit bargaining. Economic exchange however is otherwise of
the aforementioned.
Therefore with regards to customer retention strategies, relationships are established
between the customer and a firm with mutually beneficial exchanges. The firm in an
attempt to create value for the customer does so at a profit. Therefore both the firm and the
customer will conduct an audit to ascertain whether the relationship is worth pursuing.
2.4 The Concept of Customer Retention
Blattberg et al (2001) intimated succinctly that customer retention takes place when a
customer keeps on buying. Customer retention is seen as a primary goal of firms that
practice relationship marketing (Coviello et al, 2002). The precise meaning and
measurement of customer retention can vary between industries and firms Aspinall et al
(2001) but there appears to be a general consensus that focusing on customer retention can
yield several economic benefits (Dawkins & Reichheld 1990; Reichheld, 1996; Buttle,
2004).
University of Ghana http://ugspace.ug.edu.gh

22
Put differently, Ahmad & Buttle (2001) observed customer retention as the “mirror image”
of customer defection because they assert that a high customer retention rate is equal to
low defection and vice versa. They went further to argue that a precise definition of
customer retention can be problematic in the sense that any definition that does not
incorporate a firm‟s motive for being in business can be misleading because defining the
concept of customer retention come with myriads of difficulties since definitions vary
based on what the author aims to achieve. They concluded that any definition of customer
retention must encompass the percentage share of the customer‟s wealth or what the
customer is willing to spend on the organization instead of total aggregate number of
customers.
This argument is valid because customers exhibit different spending and buying behaviors.
It is not unusual for a small proportion of customers to yield the greatest proportion of a
company‟s revenue (Storbacka, 1997).
Another meaning put forward by Zineldin (2006) encapsulates the idea that firms that
adopts customer retention strategies and programs must first of all be responsive to
customers‟ needs and concerns through an effective program that addresses customers‟
concerns through a good complaint management system.
From relationship marketing viewpoint, Keiningham et al (2007) defines customer
retention as customers‟ stated continuation of a business relationship with a firm. This
definition suggests that the decision as to whether to stay or not in an exchange
relationship is the sole prerogative of the customer rather than organizational efforts. Liu
& Wu (2007) also arguing from relationship perspective, viewed customer retention as a
measure of relationship concerned with minimizing customer defections. Another
University of Ghana http://ugspace.ug.edu.gh

23
authority Ranaweera & Prabhu (2003) sees customer retention as the future propensity of
customers to stay with their service providers.
Whilst some scholars use the term future behavioral intentions to describe the concept of
customer retention (Zeithaml et al, 1996), others like Cronin et al (2000) treat behavioral
intention and customer retention as synonymous construcst. For the purposes of this
research, which seek to analyze the relationship of retention strategies in the airline
industry, the study will adopt the definition put forward by Keningham et al (2007).
In my view customer retention implies a long term commitment on the part of the
customer and the firm to maintaining a relationship through the development of mutually
beneficial exchanges so as to create a long term buyer-seller business relationship.
Any attempt in measuring customer retention rate is construed to mean an initial step in
improving loyalty to, and the profitability of, a service organization (Payne, 2000). Yet
many firms do not understand the importance of improving customer retention rates and
the impact of these on profitability (Clark, 1997). DeSouza in 1992 offered some useful
lessons on how to measure customer retention when she submitted that customer retention
must be measured and managed and can be calculated in two ways;
a. A crude customer retention rate and
b. Weighted customer retention one.
The crude customer retention rate measures the total percentage of customers the
organization retains based on the decline or escalation of customers over a specific period
of time whereas the weighted retention rate is calculated by weighting customers
according to the volume of their purchases.
University of Ghana http://ugspace.ug.edu.gh
24
Carroll & Rose (1993) took an economic view of customer retention noting that all
customers do not generate the same value and suggest that firms should focus retention
strategies on the value producing segments of customers.
As researchers try to provide answers to concerns of firms with regards to their customer
retention efforts (Ganesh et al, 2000), there arise pertinent questions which continue to
engage the attention of researchers, practitioners and non-practitioners alike. Should
retention of every customer be the goal or should retention efforts be focused on subsets or
even individual? These are the perfectly legitimate questions which demand answers.
A research conducted by Price Waterhouse Coopers in (2002) observed that poor
management of customer churn is a major value destroyer and that the key to its
prevention is to predict and avert attrition of the “right customers”. The right customers in
this case are those that contribute most significantly to the company‟s growth and
profitability. The implication of there being “right” or “wrong” customers to retain is that
companies are advised to segment their customer base for retention efforts in much the
same way that they would segment the market for acquisition efforts (Weinstein, 2002).
Evans (2002) also suggested that the “right” customers are those with the highest residual
lifetime value.
This viewpoint rooted in economics affirms the statement which states that firms should
only concentrate their retention efforts on only high yielding customers. This argument is
further accentuated by the works of Cziepel & Reddy (1992 and 1993) in which they use
the concept of relationship strength and relative perceived performance as mediating
variables as they attempt to predict the economic value of customers for retention efforts.
In their research they concluded that “in business-to-business and business-to-consumer
University of Ghana http://ugspace.ug.edu.gh

25
settings, committed long term relationships between buyers and sellers are based on a
strong and economically rational foundation”.
2.5 Reasons for Customer Defections
Customer defection is defined as „customers forsaking one service provider for another‟
(Garland, 2002). Reichheld (1996) postulated that an increase in the defection rate results
in dwindling cash inflow to an organization. Although customer defection has a negative
impact on profits, few organizations do anything about it. A reduction in the customer
defection rate can increase profits substantially more than growth in market share,
improved profit margins, or factors related to competitive advantage (Colgate et al., 1996).
Many service organizations turn not to be attentive to customer defections, that is,
customers who change service providers or forsake one organization for another.
According to Desouza (1992), Matin-Consuegra et al (2007) and Seawright et al. (2008)
the following customer defection groups can be demystified;
a. Customers which switch to a competitor offering lower prices,
b. Customers who switch to a competitor offering a better product,
c. Customers who leave because of inadequate service,
d. Customers who are lost because they go out of business,
e. Customers who switch to a product or service from outside the industry and
f. Customers who leave because of internal and external political considerations.
Ahmad (2002) asserts that managers have to make extra efforts at instituting control
mechanisms that keep track of customer defections. Dove & Robinson (2002) also
advocated the developments of systems to alert the organizations when customers threaten
to defect so that it can be averted.
University of Ghana http://ugspace.ug.edu.gh

26
Owing to the benefits of customer retention, it stands to reason that organizations must
hold on to their already acquired customers and pay greater attention to customer
defection. This is because in the estimation of Desouza, 1992, organizations can gain
valuable information as to the reasons why customers defect by inquiring from customers
why they defect. By conducting an audit into why customers defect, organizations are
better informed to implement strategies to address any shortcomings in an effort to retain
customers.
There are a number of reasons why customers defect to competitors. Among them are the
following;
1. For product reasons; where customers experience better quality product from a
competitor and would therefore perceive the competitor‟s product as being
superior.
2. Marketing reasons; the customer could leave the market and are therefore lost to
the organization and its competitors
3. Technological reasons; customers may defect due to technological discoveries that
can better satisfy their needs
4. Price reasons; customers may defect to competitors offering lower prices and
would usually defect as soon as they can obtain better prices elsewhere (Martin-
Consuerigra et al, 2007).
5. Service reasons; customers could defect due to poor service from the organization
(Seawright et al, 2008).
By identifying the reason why customers defect, organizations are in position to draft
strategies to combat customer defection in order to attain high levels of customer retention
by satisfying their needs through good customer service delivery (Mostert et al., 2009).
University of Ghana http://ugspace.ug.edu.gh
27
2.6. Relationship Marketing
A major shift is occurring in the way that companies deal with their customers and
suppliers in the past two decades (Ellram, 1995; Han et al.1993; Christopher et al, 1991).
This change is happening because firms recognized that sustainable competitive advantage
in a new turbulent economy requires organizations to become trusted participants in the
various business networks. As noted by Story & Hess (2006), relationship marketing is
emerging as an exciting area of marketing and it is now the dominant paradigm in
marketing. Marketers have now accepted relationship marketing in explaining the realms
of customer behavior that lies beyond the bounds of simple loyalty (Hess, 1995).
Although a number of authorities have suggested that relationship marketing represents a
paradigm shift (Christopher et al, 1991) from a longer established transactional orientation
to customer management, Gronroos, (2000) noted that the relational perspective on
marketing is in fact “older than the transactional perspective in marketing” and is
“probably as old as the history of trade and commerce. He went further to conclude that
“management of customer relationships in business is not a new phenomenon” although
the term relationship marketing was only recently introduced to marketers by Berry
(1983).
Relationship marketing involves efforts by organizations to retain customers by building
and maintaining long-term relationships with them (Christopher et al., 2002; Torres and
Kline 2006). Relationship marketing therefore focuses on customer retention by
developing and maintaining customer relationships over the lifetime of the customer rather
than focusing on attracting new customers (Zineldin & Philipson 2007). Customer
retention has been shown to be a primary goal in firms that practice relationship marketing
(Gronroos, 1991, Coviello et al 2002).
University of Ghana http://ugspace.ug.edu.gh
28
According to Gronroos (1994), relationship marketing has to do with identifying,
establishing, maintaining and enhancing and when necessary, terminating relationships
with customers and other partners at a profit so that the objectives of the parties involved
are met, and this is achieved by mutual exchange and fulfillment of promises. This means
that relationship marketing is a long-term arrangement where both buyers and sellers have
an interest in providing a more satisfying exchange. This conceptualization of relationship
marketing transcends the simple purchase-exchange process with a customer to make
more meaningful and richer contact by providing a more holistic, personalized purchase,
customized product and exceptional and deliberate customer relationship management
practices that ensures customer supremacy.
The term Relationship Marketing has been variously defined. A close look at existing
literature revealed that there is no universally acceptable definition for relationship
marketing as a field of study. Different scholars and practitioners see relationship
marketing from their own perspectives and what they aim to achieve. Relationship
marketing was first conceived as a form of marketing developed in direct response to
marketing campaigns that emphasizes customer retention as opposed to a sheer focus on
sales transactions.
According to practitioners relationship marketing differs from other forms of marketing in
that it recognizes the long term value of customer relationships and extends
communication beyond internal advertising and sales promotional campaigns. Any
relationship marketing strategy should have long term sustainability, commitment to the
fulfillment of promises, concerned with customer share instead of market share to
guarantee customer lifetime value.
University of Ghana http://ugspace.ug.edu.gh
29
The importance of RM is explained by the fact that building relationships with customers
and retaining them can contribute to the success of the organization (Patterson et al.,
2006), since the length of the customer relationship can influence the organization‟s
profitability (Buckinx & Van den Poel, 2005). This gives rise to the notion that repeat
business can be regarded as the lifeblood of the organization (Zineldin & Philipson, 2007).
RM is the foundation on which organizations build and improve relationships with
customers. Indeed, the ability to build relationships with and retain customers has become
a key factor for many organizations (Nasir & Nasir, 2005), and that offers organizations
competitive advantage.
In this vein, organizations that successfully retain customers will be able to build a more
enduring relationship them (Reichheld & Sasser, 1990; Hoffman, Kelly & Chung, 2003).
The importance of building relationships with customers lies in the fact that repeat
business not only promotes profitability, it can actually be the lifeblood of the organization
(Zineldin & Philipson, 2007). Due to the many challenges they face, airlines in particular
must build relationships with their customers and retain them as customer retention leads
to lower customer acquisition costs (Steyn et al., 2011).
2.6.1 Trust and Commitment in Relationship Marketing
Morgan & Hunt (1994) see relationship marketing as being anchored on the two concepts
of trust and commitment. The two variables appears to be among the most important
variables for understanding the strength of a marketing relationship, and they are very
useful constructs for measuring the likelihood of customer loyalty as well as for predicting
future purchase frequency (Morgan & Hunt, 1994). Whilst trust and commitment provide
countervailing effects for alliance stability, they do not evolve overnight and seldom come
easy; they can be built only over time. Generally trust emerges based on norms of
University of Ghana http://ugspace.ug.edu.gh

30
reciprocity and it can be extended to an organization with a reputation of trustworthiness
(Ring & Van de Van, 1994).
It is a truism that satisfied customers generate that positive word of mouth (Schneider &
Bowen, 1999), but customer satisfaction alone does not ensure continuing customer
patronage. Whiles satisfaction and loyalty are important drivers, trust, commitment and
communication also have potential influence and are central constructs of relationship
marketing (Ranaweera & Prubho, 2003).
2.6.2 Relationship Commitment
Whilst commitment is the most common dependent variable used in buyer-seller
relationship studies (Wilson, 1995), Morgan & Hunt (1994) regard relationship
commitment as the “keystone” of relationship marketing. They conceptualized
commitment as “an ongoing relationship with another that is so important as to warrant
maximum efforts at maintaining it”. This means that commitment to a relationship is a
continuous process and from relational exchange perspective, commitment signifies the
highest form of relational bonding among firm and contributes to the longevity of
relationship (Gundlach et al., 1995).
Mooman et al (1997) defines commitment as the attitude that reflects the desire to
continue a valued relationship and as the willingness to make short-term sacrifices to
maintain that relationship (Anderson & Weitz, 1992). The concept of commitment in
relationship marketing has been examined by researchers extensively in consumer
contexts (Sharma & Patterson 2000) work-place contexts (Allen & Meyer, 1990), and
business-to-business contexts (Morgan & Hunt 1994). They moves the commitment
University of Ghana http://ugspace.ug.edu.gh

31
literature further to involve work place commitment to a relationship. He sees commitment
to mean a predisposition that comprises the actor‟s willingness to
a. Stay long in the relationship
b. Accept the norms and values that govern the relationship and
c. Contribute maximally for the welfare of the relationship.
Whereas scholars such as Morgan & Hunt (1994) viewed relationship commitment as a
one-dimensional construct, a vast majority of researchers regarded it as a multi-
dimensional construct in a variety of business context including the airline industry (Allen
and Meyer, 1990, Geyskens et al, 1996, Kumar et al 1994). Geyskens et al (1996) went
further to differentiate between affective commitment and calculative commitment. Allen
& Meyer (1990) also revealed three dimensions of commitment to include;
a. continuance commitment (cost-based attachment)
b. affective commitment (desire-based attachment) and
c. normative commitment (obligation-based attachment)
It is important to submit that considerable research has established strong support for these
three dimensions of commitment irrespective of the industry involved and that these
dimensions were appropriate regardless of target of commitment (Bansal et al 2004).
2.6.3 Customer Trust
Trust is seen as a multifaceted construct that can be viewed from different perspectives.
Trust is defined in one of two ways; as a confident belief or expectation and as the
willingness or intention to depend on the trustee.
University of Ghana http://ugspace.ug.edu.gh

32
From relationship perspective trust has been seen as the expectation that an actor can be
relied on to fulfill obligations (Anderson & Weitz, 1989) and will behave in a predictable
manner and also will act and negotiate fairly when the possibility for opportunism is
present early in the relationship are keys for the development of trust. Communication and
fairness are also crucial but only in the early phase of the relationship they form a key
component in the formation and development of trust.
In more specific terms trust emerges from mutually beneficial successive collaboration
cycles among the participating nodes. Trust is a critical variable in relationships as it is
indicated in extant marketing literature (Moorman et al. 1993). Trust in simple terms
means the confidence of customers in suppliers‟ products and offerings. Trust is so crucial
that Spekman (1988) postulated it to be the “cornerstone of strategic partnership” and that
relational trust is a major determinant of relationship commitment, especially in risky
situations.
Due to the fact that commitment entails vulnerability especially when perceived risk is
high as in the case of volatile or turbulent business environments, parties involved in an
exchange relationship seek only trustworthy partners (Morgan & Hunt, 1994). Partners in
business-to-consumer settings such as the airline industry needs to continuously earn
mutual trust so as to fuel the longevity of the relationship.
2.6.4 Complaint Handling
The sources of complaints involves mostly of inefficiencies on the part of the service
providers to provide solutions to customers complaints on time. It also includes
unexplained delays, rudeness, inflexibility on the part of the service provider, ineptitude
and incompetent service (Hinson, 2006).
University of Ghana http://ugspace.ug.edu.gh

33
The nature of service delivery in the airline industry makes it susceptible to occasional and
sometimes unavoidable mistakes. However, a well instituted complaint handling can solve
and even avert some of these failures. It is also important that service firms institute proper
complaint handling procedures and policies geared towards customer satisfaction hence
retention.
Moreover, most firms do not accord customer complaint the needed attention despite its
strategic importance to firms especially those in the airline industry. Most customers who
complain are more often than not dissatisfied with the complaint handling processes
(Andreassen, 2001). This should not be the case because complaints itself is a major
source of gathering market intelligence. When organizations do not pay much attention to
customer complaints, customers will switch service providers to competitors and also
engage in negative word-of-mouth which can culminate in the high cost of acquiring new
customers (Hart et al., 1990).
Stauss & Seidel, (2004) identified four types of complaint handling benefits that firms can
derive from a successful management of its customers, complaints;
1. The information benefits; involves the value that is generated by using information
from customer complaints to improve products and services provided in order to
enhance efficiency and to reduce failure costs.
2. The attitude benefits; involves the attitudinal changes the customer exhibits as a
result of achieved complaint satisfaction.
3. The repurchased benefits; this comes as a result of customers who complain are
satisfied and for that matter remain with the organization instead of switching to a
competitor‟s offerings.
University of Ghana http://ugspace.ug.edu.gh
34
4. Communication benefits; this has to do with the effects of complaint management.
This comes as a result of complainants whose concerns are properly addressed
with the highest level of satisfaction so that the customer engages in positive word-
of-mouth campaigns by recommending the organization to others.
2.7 Service Quality
Although the definitions of service quality vary, these definitions are all formulated from
the customer perspective. That is what customers perceive are important dimensions of
quality (Lewis, 1989). Gronroos (1982) and Parasurama et al (1988) were the pioneers in
the conceptualization of the service quality construct. These authors maintained that the
overall perception of quality was a disconfirmation of a customer‟s expectation and his or
her evaluation of a service. Parasuraman et al (1988) developed a disconfirmation
measurement, the SERQUAL instrument, to measure service quality and its dimensions.
Previously, service quality is measured as a proxy measure of customer satisfaction,
implying a perfect correlation between the two constructs. What has been the practice of
late is the fact that service quality is perceived as an antecedent of customer satisfaction
(Cronin et al., 2000).
Service quality is considered a critical determinant of competiveness and when firms pay
specific attention to service quality, it can help organizations to differentiate itself from
other organizations.
The provision of products and services of high quality enhances reputation, improves
customer retention, attract new customers through word-of-mouth, and increase financial
performance and profitability ( Zeithaml 1996).
University of Ghana http://ugspace.ug.edu.gh
35
Service quality was perceived as the difference between customer expectations of service
to be received and perceptions of what is actually received (Gronroos 1984, Parasuraman
et al 1988, 1991). These researchers posited that measuring service quality as
“disconfirmation” (the difference between perceptions and expectations) is valid and that
such a model allows service providers to identify certain defined gaps in the service
provided. However several subsequent studies have found a poor „fit‟ for the
disconfirmation model in certain settings.
As a result, the SERVQUAL scale (Parasuraman et al 1988) has been criticized by an
increasing number of researchers on several grounds including; the use of gap scores, the
measurement of expectations, the generalizability of its dimensions, the defining of a
baseline to mean good quality (Cronin & Taylor 1992, Brown et al 1993).
As a result of these deficiencies, some researchers have tried to combine expectations and
perceptions into a single measure to alleviate these problems, and have found that such a
measure actually outperforms the SERVQUAL scale in terms of both reliability and
validity (Babakus & Boller 1992, Brown et al 1993).
Cronin & Taylor (1992) in their paper adopted a single-measure scale and measures
service quality by customer perceptions only through the SERVPERF model. To this end,
(Dabholkar et al 2000) went further to propose that, it is better to consider factors
associated with service quality (such as reliability and responsiveness) as being
antecedents to customer perceptions of service quality rather than as dimensions or
components of the construct.
University of Ghana http://ugspace.ug.edu.gh

36
2.7.1 Airline Service Quality
Research into airline service quality has increased rapidly since its relationship with
passenger satisfaction and profitability has been established (Heskett et al, 1994). Much of
the literature suggests that airline passengers perceive service quality as a multi-
dimensional construct, which is in accordance with the conception of service quality
proposed by (Parasuraman et al., 1988) in their well-known service quality measuring
instrument called SERVQUAL.
This instrument which measures service quality in terms of five dimensions (Reliability,
Assurance, Tangibles, Empathy, Responsiveness) is based on the premise that customer‟s
assessments of overall service quality are determined by the “gap” between their
expectations of service and their perceptions of actual service performance.
The SERVQUAL instrument has been used by several researchers to measure airline
service quality (Sultan & Simpson, 2000). However, in the context of the airline industry‟s
service quality, Zagat, an aviation research firm, rated airline service on the basis of five
criteria namely;
a. Overall performance,
b. Comfort,
c. Service,
d. Food and
e. Web site (Rhoades, 2006)
Again, the US Department of Transportation‟s conceptualization of service quality in its
regular reports on airline service quality provides data on the following operational
measures;
University of Ghana http://ugspace.ug.edu.gh
37
i. Flight delays,
ii. Mishandled baggage,
iii. Oversold flights and
iv. Consumer complaints.
A number of papers have studied airline service quality using a combination of
performance only, disconfirmation, and importance-performance approaches. The leading
theme in the airline service quality literature is the evaluation of service performance
based on technical and operational measures.
Another approach followed in the airline service quality literature is the link between
quality and financial performance. Although the theoretical justification of the link
between the two has been criticized by many, a number of studies have attempted to
connect them. The bulk of the studies connecting the two make use of a diverse set of
measures to determine an organization‟s financial performance and ultimately link it to its
service quality. While some studies have approached airline service performance from a
service quality perspective, others have viewed it through an operations research lens and
performance improvement paths (Le et al 1997).
Two important bases on which buyers evaluate competing airline offers are schedules and
price. However, there are other secondary but important quality of service aspects that a
consumer may consider in their ultimate choice of an airline. Such aspects include safety,
comfort of the seat, in-flight amenities (e.g. food and beverages), and attitude of the
ground and flight crew, financial stability of the airline, on-time performance of the flight,
assurance that bags arrive with the passengers, the perceived likelihood of being bumped
from a flight, and frequent flyer programs may also be important evaluation criteria (Chan,
2000).
University of Ghana http://ugspace.ug.edu.gh

38
Gilbert & Wong, (2002) attempted to identify the service quality dimensions that matter
most to airline passengers in terms of reliability, assurance facilities, employees, flight
patterns, customization, and responsiveness and reported that passengers consistently
ranked assurance as the most important service quality dimension. Furthermore Natalisa &
Subroto, (2003) who studied the effects of management commitment to service quality on
the customer‟s level of customer‟ satisfaction in domestic airlines, also found that
assurance had the strongest effect on the level of customer‟s satisfaction.
Furthermore a study conducted in North Cyprus by Johns et al (2004) both concluded that
the dimensions of the SERVQUAL scale that is tangibles, reliability, responsiveness,
assurance, and empathy were not validating enough in measuring service quality. This led
to the development of an AIRQUAL (Ekiz et al., 2006) scale to overcome the problems
associated with the application of the existing service quality measuring scales. The scale
is made up of five distinct dimensions guided by the works of Churchill (1979) and
Parasuraman et al (1985, 1988). The dimensions are airline tangibles, terminal tangibles,
personnel, empathy and image. Although, they successfully developed the AIRQUAL
scale, they failed to demonstrate the causal relationship between AIRQUAL and customer
retention which is the crux of this study.
2.8 Switching Barriers
As defined by Jones et al (2000) a switching barrier is any factor that makes it difficult or
costly for customers to change service providers. From this definition it can be inferred
that the term switching barrier or switching cost can both be used interchangeably though
some authorities try to differentiate the two concepts based on what they aim to achieve.
University of Ghana http://ugspace.ug.edu.gh

39
Another authority Bansal & Taylor (1999) defined switching barriers as customer‟s
assessment of the resources and opportunities needed to perform the switching act, or
alternatively defined by Ranaweera & Prabhu, (2003) as the constraints that prevent the
switching act.
Switching barriers also encompass the customer‟s perception of uncertainty and adverse
consequences of buying a product or service according to Dowling & Staelin, 1994.
While business goods suppliers primarily strengthen switching costs through “hard
assets”, such as installed proprietary equipment that cannot be transferred to other
exchange relationships (Wilson et al, 1995), providers of business service often cannot
utilize hard assets to lock in current customers (Liu, 2006). Consequently, business service
providers explore the establishment of “soft assets”, such as procedural investments and
customer-specific expertise which enhance switching cost perceptions (Wilson et al,
1995).
Switching barriers are conceptualized as the customer‟s perception of the magnitude of the
attitudinal costs required to terminate the current relationship, and secure an alternative
(Porter 1980, Jackson 1985, Ping 1993).
Gronhaug and Gilly (1991) argue that a dissatisfied customer may remain loyal because of
high switching costs. It has been argued again that the costs of switching providers tend to
be higher for services than for goods (Gremler & Brown 1996)
A number of studies have empirically tested switching costs as a main determinant of
customer loyalty in consumer markets (Gremler, 1995) as well as business-to-business
service context. Further, the main effect of some switching barriers on customer retention
has been empirically validated in consumer settings (Lee et al, 2001) as well as the effect
University of Ghana http://ugspace.ug.edu.gh

40
of barriers (such as interpersonal relationships, switching costs, and attractiveness of
alternatives) regarding the propensity to stay with service providers (Jones et al 2000,
Patterson & Smith 2003).
In as much as customer satisfaction and loyalty are viewed as an important component of
customer retention strategy, Bendapudi & Berry, (1997) put forward that these two
components are not the only strategies to be considered for customer retention but barriers
to customer defection such as the development of strong interpersonal relationships or the
imposition of switching costs may also represent additional customer retention strategies.
In this vein, Jones et al, (2000) also added that a well trained staff can also provide
positive switching barriers. I must hasten to add that apart from a well trained staff, it is
important for companies to ensure that employee satisfaction should be a major
consideration if customer retention is to be realized. As intimated earlier, switching
barriers have been deliberately erected by organizations as a marketing strategy to make it
difficult and costly for customers to switch to competitors offerings.
When switching barriers are high, service firms are more likely to retain even those
customers who are less satisfied. Researches by Bansal & Taylor (1999) Jones et al.,
(2000) Lee et al 2001) Ranaweera & Prabhu (2003) among others have researched and
confirmed the positive effect of erecting switching barriers on customer retention. It is
therefore important for industry players in the airline sector to work at devising result
oriented switching barriers as a strategy towards retaining their customers.
In classifying switching barriers, Jones et al., 2000; Vazquez-Carrasco & Foxall, 2006)
have attempted to categorize them under the following factors;
a. Switching cost
b. Interpersonal relationships and
University of Ghana http://ugspace.ug.edu.gh

41
c. Attractiveness of competing alternatives.
Apart from the factors mentioned above, Daniell in (2000) identified cross-selling as a
very important factor to be considered when it comes to customer switching.
2.8.1 Switching cost
Switching costs are the buyer‟s perceived costs (both monetary and non-monetary)
involved in switching from the existing to a new supplier (Heide & Weiss, 1995). These
include the cost of changing services in terms of time, monetary and psychological
expenditure (Dick & Basu, 1994). Porter, (1998) defines switching cost as the cost that is
involved in changing from one service provider to another. According to Patterson &
Smith (2003) switching costs are the perception of the magnitude of the additional costs
required in terminating a relationship and securing an alternative one.
However, multiple conceptualizations exist for switching cost and this is reflected in
diversity of forms including psychological, physical, and economic (Jackson, 1985);
continuity costs, learning costs, and sunk costs (Guiltinan, 1989). Brunhan et al. 2003
attempted a more detailed and comprehensive but succinct categorization of switching cost
in terms of procedural, financial and relational costs. Despite these multiple
conceptualization and typologies, switching cost can broadly be categorized as economical
and psychological. For example, the economic risk cost identified within the procedural
dimension of switching cost refers to the psychological costs due to perceived risk from
the uncertainty of trying new products or service. The psychological switching cost such
as uncertainty related or loss in relational investments and social bonds or other procedural
costs (relating to time, search, evaluation and set up) have been found to have major
impact on switching barrier (Jones et al 2002).
University of Ghana http://ugspace.ug.edu.gh

42
Even the sunk cost which is primarily economic in nature becomes psychologically
important in evaluating the perceived switching cost (Jones et al, 2002). These
psychological costs span the entire switching process and beyond, making switching cost
more than just a one-time cost ( Wan-Ling, 2006). This is because customers may consider
even the post switching behavioral and cognitive dissonance costs while switching and can
therefore be considered as part of switching cost (Klemperer, 1995).
Switching cost is consumer specific and its nature varies depending upon the industry and
the product or service characteristics (Gummesson, 2006). Therefore in the particular
context of the airline industry, switching cost stems mainly from search, time and
evaluation cost and the risk associated with trying a new provider (Klemperer, 1995).
Instead of being more monetary in nature as pertains in other industries, switching cost in
the airline industry is largely psychological in nature.
Cross-selling is yet another potent switching barrier that drives customer retention. This is
the effort made by the airlines to sell as many different products and services as possible
to a particular customer (Daniell, 2000). Cross-selling is known to have a positive impact
on a firms return on investment and overall profitability. This is because loss of market
share and diminishing opportunities to engage in cross-selling weighs heavily on a firm‟s
profitability and continued existence.
2.8.2 Customer Service and Interpersonal relationship
Interpersonal relationship that is established between the customer and the service
provider is deemed important as it goes a long way to benefit the two parties mutually and
at the same time serve as a switching barrier that help keep customers to a particular
service provider. For superior customer service to come to fruition, there must be a well
University of Ghana http://ugspace.ug.edu.gh

43
trained, motivated and satisfied employees. Wong & Sohal (2003) posited that good
relationship through good customer service can improve satisfaction, and help keep
customers stay loyal to a company. Customers are willing to commit themselves to
establishing, developing and maintaining relationships with airline companies to provide
superior valued benefits through superior customer service.
Customer service is a process that takes place between a buyer, a seller, and third party
and can influence demand in the market. This third party may include companies that have
been licensed by an organization to provide customer service. Customer service is used in
a wider sense and goes far beyond the value chain. Customer service is a system of
activities that comprises customer support systems, complaint processing, speed of
complaint processing, ease of activities complained about and friendliness when reporting
complaints (Kim et al., 2004).
Customer service can produce customer behaviors that can indicate whether a customer
will remain with or defect from an organization (Zeithaml et al., 1996). In a more specific
relation with the airline industry in Ghana, the high level of competition that pertains in
the travel industry has necessitated the adoption of excellent customer service techniques
to satisfy and retain the customer. The effectiveness of the level of customer service will
enhance customer retention and reduce switching between and among service providers.
Therefore superior customer service includes all help and assistance airlines offer to
customers directly or indirectly prior to, during and/or after travel to provide exciting
customer travel experience. If well leveraged, it has the potential to serve as a switching
barrier and at the same time offer a competitive advantage to airlines and also enable them
attract and retain customers.
University of Ghana http://ugspace.ug.edu.gh

44
2.9 Service Recovery
The term service recovery refers to how a service provider rectifies a service-related
failure (Kelley & Davis, 1994). According to Bell, 1994, service recovery includes “…..all
the actions taken to get a disappointed customer back to a state of satisfaction”. Although
customers who receive poor recovery efforts might dissolve the buyer-seller relationship
and purchase elsewhere, there is evidence that most dissatisfied customers will do business
again if their problems are solved satisfactorily (Brown, 1987).
However, customers are often more dissatisfied by an organization‟s failure to recover
than by the service failure itself (Bitner et al., 1990 and La and Kandampully, 2004)
therefore recommended the adoption of a strategic perspective on service-failure
management.
Most organizations strive to provide a seamless service to their customers in order to
facilitate customer delight (Hinson, 2006), but it is common knowledge that services do
fail, but what is most important is that recovery strategies put in place could change a
dissatisfied customer into a loyal one. Customer dissatisfaction has the potential to;
Diminish an organizations customer base
Require the firm to rely on a more volatile customer mix and
Erode the firm‟s reputation (Levesque & McDougall, 1996).
This is particularly true in service industries like that of the airline industry, in which
customer dissatisfaction is a significant problem (Fornell, 1992 and Singh, 1990). It is
common for customers to be dissatisfied with the relationship they have with their service
providers (Colgate & Lang 2001, Colgate & Noriss 2001, Gronhaug & Gilly, 1991,White
& Yanamandram, 2004) but how customers react to dissatisfaction is the crucial issue for
marketing manage. Just as satisfied customers are not necessarily loyal, dissatisfied
University of Ghana http://ugspace.ug.edu.gh

45
customers are not always disloyal. Some customers take no action at all when dissatisfied,
whereas others take various actions-such as complaining directly to the service provider
about the service or switch suppliers. Ultimately, the buyer‟s actions, and how the supplier
reacts to those actions, determine whether that customer is retained (Singh, 1988).
Mistakes, failures and complaints are frequent occurrences in service encounters. But it is
the management and resolution of the complaint that are essential if dissatisfied customers
are to be converted into satisfied and loyal customers (Johnston and Mehra, 2002).
Many studies have investigated the reason for customers switching service providers
(Colgate et al, 1996, Colgate & Hedge 2001) and the significance of switching behavior
(Fornell & Wernerfelt 1987, Reichheld & Sasser 1990). Other studies have investigated
why customers do not always defect to competing providers. Variety of factors (switching
barriers) includes the following;
Switching costs(Colgate & Lang 2001,Fornell 1992; Gronhaug & Gilly 1991;
Jones et al 2000; Patterson 2004)
Interpersonal relationships (Colgate and Danaher 2000, Colgate & Lang 2001, G,
Jones et al 2000, Kim et al 2004, Patterson & Smith 2003)
Availability and attractiveness of alternatives (Bendapudi & Berry 1997, Patterson
and Smith 2003, Sharma and Patterson 2000, Panther & Farquhar 2004)
Service recovery (Hess et al 2003; Smith et al 1999; Spreng et al 1995) and
Inertia (Colgate and Lang 2001,Ranaweera & Neely 2003, White & Yanamandram
2004)
It is a well established fact that a well-executed complaints-handling and service recovery
process is of strategic relevance because it can have a positive effect on customer retention
(Fornell & Werner 1987, Brown et al, 1996; Strauss & Seidel, 2004).
University of Ghana http://ugspace.ug.edu.gh

46
Indeed, customers who complain and are well recovered can be more satisfied and less
likely to switch than customer who had no cause for complaint at all (TARP, 1979, Nyer
2000). Complainants who enjoy high standards of complaints handling experience the
service quality attributes of empathy and responsiveness, which are not routinely on
display when services are delivered right first time (Buttle, 2004). Despite the strategic
relevance of complaint handling, it is a process which it appears to be accorded little
importance in many companies (Strauss & Schoeler, 2004).
Unresolved complaints may lead to double deviation from role expectations that
complainants holds for service providers (Bitner et al, 1990) and this can result in
detrimental outcomes such as negative word-of-mouth communication and permanent loss
of customers (Kelly et al., 1993; Boshoff, 1999). In view of this service firms must seek
effective organizational complaint management systems that would ensure speedy and
satisfactory resolution of the complaint of an aggrieved and unhappy customer (Hinson,
2006).
Research findings of Zairi (2000) postulated that complaints are useful for the following
reasons;
1. They are a way of receiving feedback from customers and therefore a necessary
means for putting into action improvement plans
2. They are a useful way of measuring performance and allocating resources to deal
with the deficient areas of the service business.
3. They are a tool for preventing complacency and harnessing internal competencies
for optimizing products and services.
4. They are a useful “mirror” for gauging internal performance against competition
University of Ghana http://ugspace.ug.edu.gh

47
5. They are a useful exercise for getting nearer to the customer and understanding
them better.
6. Complaining customers are among the most loyal customers.
2.9.1 Service Failure and Service Recovery in the Airline Industry
A service failure can be defined as an error, a mistake or problem that occurs in the service
delivery process leading to expectation not met or a service performance that falls below a
customer‟s expectation (Hedrick et al., 2007).
Due to human element inherent in service delivery, services do fail but what is most
important is the recovery strategy instituted to address any failure that occurs. It is the
specific response to a service failure ( that is service recovery strategy) that could give
airlines a competitive advantage, as an organization‟s response to a service failure could
either restore customer satisfaction and reinforce loyalty, or aggravate the situation by
driving the customer to the competitor (Mostert et al., 2009). It is therefore important for
airline organizations to understand how customers respond to service failures and how
service recovery influences their relationship with the organization (Bejou & Palmer 1998;
Schoefer & Diamantopoulos 2008). In specific reference to the airline industry, Cheng et
al., (2008) suggested that the airlines face a very peculiar problem that could influence
their relationships with customers as airlines offer multiple opportunities for mistakes to
occur during service delivery and are therefore particularly prone to service failures and
many internal mistakes or external disruptions could cause customers to experience
service failure.
Despite the possible negative consequences of a service failure, the outcomes do not
necessarily have to be negative. Magnini et al (2007) and Ngai et al (2007) suggested that
University of Ghana http://ugspace.ug.edu.gh
48
an effective service recovery can result in a win-win situation for the customer and the
organization as well. Torres & Kline (2006), Magnini & Ford (2004) and Miller et al.,
(2000) explained that a well- executed service recovery could enhance customer
satisfaction and loyalty and may have a direct influence on whether dissatisfied customers
remain with or defect from an organization and could also lead to a higher level of
satisfaction than the customer would have experienced if the service failure had not
occurred at all (Lorenzoni & Lewis 2004; Schoefer, 2008). Service recovery in the airline
industry could therefore possibly be seen as equal to, if not more than, initially providing
good service (Eccles & Durand 1998)
In respect of a specific service recovery strategy, McDougall & Levesques (1999)
identified the provision of assistance, compensation and an apology as one of the
commonest and most frequently used recovery strategies in the airline industry. Assistance
in this case means recovery efforts geared at rectifying the problem in order to bring the
customer back to experience the initial level of service quality. Matilla (2001) went further
to elaborate that for service recovery strategy to be successful, it must match the
customer‟s perception of the gravity of the failure.
A number of suggestions exist in literature as to what strategies are ideal and can be
implemented to achieve a desired service recovery, including recovering the service
failure immediately or offering customers alternative options that will meet their
requirements; communicating with customers who are experiencing service failures
(including providing feedback and offering an explanation for the reason for the service
failure); and ensuring that service recovery personnel are professional in their actions (La
& Kandampully 2004; Boshoff & Staude 2003).
University of Ghana http://ugspace.ug.edu.gh

49
Airlines should apologize for service failures and consider presenting customers with
some form of tangible compensations for example offering disconunts or vouchers
(Mostert et al., 2009; Boshoff & Leong 1998; Mattila & Cranage 2005; Smith et al 1999,).
Since the success or otherwise of service recovery largely rest on the actions, decision-
making skills and judgment of employees, Magnini et al., 2007; La & Kandampully 2007
and Boshoff & Leong 1998 recommended that employees must be trained and empowered
to deal with service failure effectively. Service recovery is particularly relevant in the
airline industry as airlines will by effectively recovering from service failures minimize
customer defections and strengthen relationships with their customers (Mostert et al 2009
and Christopher et al 2002).
Three major factors in the view of Colgate & Norris (2001) influence the decision of a
customer of an airline whether to remain with a service provider or leave the organization
after a service failure has been experienced. The first and foremost is the level of
satisfaction with the service recovery after a complaint has been lodged. Some customers
leave anyway even though they are happy with the service recovery for reason best known
to them. The second is the level of loyalty customers have towards specific airlines.
Customers who have a strong sense of loyalty tend to remain with the organization even as
a service failure has been experienced. Customers who are less loyal tend to leave. The
third factor is the perceived barriers to exit. It is important to note that high barriers to exit
discourage customers from leaving. Service employees must be trained in order to carry
out a successful service recovery strategy especially in the airline industry where customer
attrition rates are high.
Magnini & Ford (2004), furthermore states that there are five areas that needs to be
covered in any service recovery training program in the airline industry. They are;
University of Ghana http://ugspace.ug.edu.gh
50
a. Information processing
b. Emotional responses
c. Arousing guest (clients) self assurance
d. Empowerment of employees and
e. Demonstration of how service failure recovery can positively influence employee
satisfaction.
For a successful service recovery strategy to be achieved in the airline industry, Boshoff &
Staude (2003) suggested that service employees must be in constant communication with
the unhappy customer, must be compassionate, providing feedback, supplying an
explanation for the service failure, empowering employees to respond suitably when
receiving complaints, ensuring that employees who deal with customers are professional
when doing so.
In reiterating the above guidelines, Little & Marandi (2003) contends that, in addition to
these steps, the airlines should ensure that they put in measures to make it easy for the
customer to complain by making sure that employees are trained to set the customer at
ease.
2.9.2 Loyalty Rewards and Frequent Flyer Programs
One very important customer retention strategy in the airline industry is loyalty rewards.
For customer retention to be successful in the airline industry, loyalty rewards cannot be
overlooked. Loyalty rewards simply refers to incentives given to customers based on
frequency of purchase, value purchase or continuous patronage of a particular airline over
a period. These rewards or incentives can be in a form of financial, non-financial as well
University of Ghana http://ugspace.ug.edu.gh

51
as recognition and appreciation. In this vein, the one most important and popular loyalty
reward adopted in the airline industry is the frequent flyer programs.
The Frequently Flyer Program (FFP) is a loyalty rewards program introduced by airlines
to recognize and reward their loyal customers. The program was first introduced in the US
in the beginning of the 1980‟s by airline operating in the deregulated airline market. It has
since spread to other markets. The FFP therefore became an important factor in the fight
for airline survival and was recognized as a highly successful marketing tool for retaining
customers.
FFPs are designed to ensure customer loyalty by offering various forms of bonuses to
customers which the customers can save each time they fly. The more they fly with an
airline the more points or air mileage they accumulate. These increasing marginal benefits
that are built into the reward schedules of FFPs give customers an incentive to concentrate
their flying with a single carrier rather than choose carriers on flight-by-flight basis. This
help keep customers to one airline for long period of time.
2.9.3 The Frequent Flyer Programs and Global Alliance
A frequent flyer program (FFP) is a loyalty program offered by many airlines. Typically,
airline customers that are enrolled in the program accumulate frequent-flyer miles
corresponding to the distance flown on that airline or its partners. Acquired miles can be
redeemed for free air travel, for other goods or services or for increased benefits, such as
travel class upgrades, airport lounge access or priority bookings.
As the global airline markets become liberalized, the forces of competition has lead to
intense and constant realignments of customer loyalties between airlines, various forms of
partnerships arrangements and cooperation schemes such global alliance and code sharing
agreements resulting in competitive fares and changing in frequency of services and other
University of Ghana http://ugspace.ug.edu.gh

52
attributes which are aimed at capturing markets share and increasing profits. Frequent
flyer programs are one such innovation introduced to induce and capture loyalty of
travelers.
Frequent flyer programs offer free travel and upgrades as incentives to fly with an airline
and is the most popular and successful marketing strategy devised to build customer
loyalty and sell the highly priced seats. The introduction of frequent flyer program grew
50% in less than half a decade (Bhagwanani, 2000). Frequent flyer programs are designed
to achieve a high degree of brand loyalty particularly among business travelers, effectively
discourage new carrier competition and give airlines direct and efficient communication
links with their best individual customers (Brancatelli 1986).
2.10. Conceptual Framework
The conceptual framework illustrates the interconnectedness between the research
objectives in the first chapter and theories in extant literature in chapter two and at the
same time addresses the hypothesis of the study.
Based on the review of the literature, the researcher developed a conceptual framework
describing the link that exist between the various independent constructs that work in
tandem to impact on customer retention. The framework has these main features; first the
four main construct operates independently of each other with various variables and
secondly the framework also examines the degree of relationship each of the four
constructs have on customer retention and the impact of the various variables in each
independent construct on the overall retention of the customer and profitability of the
organization.
University of Ghana http://ugspace.ug.edu.gh

53
The framework also explains the interactive effects of relationship marketing, airline
service marketing, airline switching barriers and the service recovery strategies instituted
by airlines to address any service failures that may occur.
2.10.1 Components of the Conceptual Framework
This study encompasses four main conceptual components that works either individually
or together to influence the rate of customer retention and repurchase intentions. They
include, Relationship Marketing (RM), Airline Service Quality (ASQ), Airline Switching
Barriers (ASB), and Service Recovery (SR). From the Fig. 1.1 below, it is clear that the
four constructs namely, RM, ASQ, ASB, and SR are independent of each other. But it
must be stated despite the fact that they are independent they contain variables that can
work together as strategies for retaining customers. Below is the explanation for the four
constructs.
2.10.2 Relationship Marketing
As a retention strategy relationship marketing is seen as a strategy designed to foster
customer trust, commitment, satisfaction, loyalty, interaction and long-term engagement.
Thus customer relationship focuses more on customer retention than acquisition. It
develops strong connections with customers by providing them with information directly
suited to their needs and interest and by promoting open communication.
A comprehensive process of acquiring and retaining customers can only be realized only
if a long-term partnership is maintained as a means to achieving superior competitive
advantage and profitability for the company and customers (Lambert, 2009; Zablah et al.,
2005). The establishment of this long-term relationship with customers is possible through
the creation of social bonds through information sharing and customer involvement. From
the argument above, this study proposes that, airlines can successfully retain their
University of Ghana http://ugspace.ug.edu.gh

54
customer if they build strong relationships (i.e. social bonds) through friendly and
professional employees. This retention strategy often results in increased customer trust,
commitment, social bonds, service recovery and eventual overall customer retention and
profitability of the organization. The components of relationship marketing are explained
below.
In relationship marketing literature, commitment has widely been acknowledged to be an
integral part of any long-term business relationship (Anderson & Weitz, 1992, Gundlach
et al., 1995, Morgan & Hunt 1994). Commitment in most cases is seen as a lasting
intention to build and maintain a long-term relationship.
Like commitment, trust is one of the most widely examined and confirmed constructs in
relationship marketing research. Trust is an important factor in affecting relationship
commitment and customer loyalty.
According to Morgan & Hunt (1994), relationships can be viewed as a series of
transactions that foster an awareness of a shared relationship through trust and
commitment. Higher levels of trust and commitment in turn are related to higher levels of
customer retention and this could result in higher organizational profitability.
2.10.3 Airline Service Quality
It is the belief of the researcher that, for customer retention to be successful in the airline
industry, it is important for airlines, to continuously and consistently work at improving on
their ASQ because in the words of Taylor & Baker (1994) service quality is described as
“a critical prerequisite for satisfying and retaining valued customers”.
Following the deregulation of the airline industry in 1978 in the United States, the issues
of airline service quality gained utmost attention among airline scholars. A deregulated
University of Ghana http://ugspace.ug.edu.gh

55
and liberalized airline industry has transformed the industry and brought about intense
competition and led to the emergence of a variety of new entrants into the airline industry
(Tiernan et al, 2008).
In a pre-deregulation era in the airline industry, airline service quality was assessed with
respect to industry and managerial variables such as flight frequency, load factors, transit
times and aircraft type (Clifford et al 1994 and see Jordan, 1970). However, in the post
deregulation and liberalized environment the provision of superior service quality has been
accepted as an important source of customer retention and loyalty, which may ultimately
lead to superior competitive performance (Tiernan et al., 2008).
Parasuraman et al (1985) argued that service quality is the difference or gap between
customer expectations and perceptions of the service. Therefore understanding theses gaps
could help identify potential shortfalls from a consumer perspective. This led Parasuraman
et al in 1984 to develop a five prong dimensions of tangibles, reliability, responsiveness,
assurance, empathy which this study have adopted and modified to include safety and
security which have major impact on customer retention in the airline industry. The five
dimensional scales developed by Parasuraman in 1988 have been modified to make it six
by the inclusion of safety and security. Safety and security issues in the airline industry
has gained so much currency and attention in the aftermath of September 11 2001 terrorist
attack in the United States. They include the following;
Tangibility is measuring the appearance of the physical facilities, equipment,
appearance of personnel and communication materials (e.g. Aircraft type and the
appearance of airline staff
University of Ghana http://ugspace.ug.edu.gh

56
Reliability is measuring the ability of the airline employees to perform the
promised service accurately and dependably. (e.g. flight arriving on time, flight
frequency and flight operate as scheduled).
Empathy measures the level of caring and individualized attention provided by
employees to solved customers complaints (e.g. Complaints handling on
mishandled baggage)
Responsiveness is measuring the willingness of airline staff to provide on-time and
prompt service. (e.g. Lost baggages).
Assurance measures employee‟s ability to convey trust and confidence in the
delivery of services to customers dependably and accurately.
Safety and Security measures cabin safety, security in the air and safety and
security at the airport lounges.
2.10.4 Switching Barriers
Switching barriers are generally seen as marketing strategies adopted by organization to
reduce customer attrition and churn rates. In the airline industry any strategies carriers use
to make it costly for customers to switch to other airlines is referred to as airline switching
barriers. In the airline industry due to deregulation and liberalization of the sector leading
to more carriers entering the industry and thereby increasing competition, customers
become more empowered to switch service providers if services do not meet their
standards. Hence the erection barriers to make it difficult for customers to leave even as
they work at improving on service delivery. As intimated by Fornell (1992), switching
barriers serve as disincentives for customers who want to leave their present organization.
University of Ghana http://ugspace.ug.edu.gh

57
2.10.5 Frequent Flyer Programs (FFPs)
The FFPs function as a marketing strategy introduced by airlines for the purpose of
keeping their customers loyal and thus preventing them from flying with any other airline
even though a competing airline particularly a new entrant on the market may be able to
offer a better bargain or a more convenient flight. FFPs are designed to ensure customer
loyalty by offering various forms of bonuses to customers where the customers save up
each time they fly. The more they fly with an airline the more points or air miles they will
accumulate. These air miles are redeemed and are used when one travels either at a
discounted or free flight or class upgrade or free baggage allowance.
In a more sophisticated form, these accrued points are used in restaurants or using credit
cards, renting a car, staying in a hotel as airlines often have partnership agreements with
those businesses.
2.10.6 Global Alliance
An airline alliance may be defined simply as an agreement between two or more airlines to
cooperate on a substantial level. However, Oum et al (1993) offers a more comprehensive
definition to describe airline alliance as a global airline network formed by a group of
affiliated airlines to provide seamless services to consumers through a joint use of
computer reservation systems, through fares and ticketing, automatic baggage transfer,
coordinated flight schedules, code-sharing of flights, joint marketing, sharing of a frequent
flyer programs, etc.
The strategic alliances represent one of the strategies developed by carriers to gain a
competitive advantage in the global marketplace and at the same time as a strategic tool
for customer retention.
University of Ghana http://ugspace.ug.edu.gh

58
Many researchers have examined the various reasons that have led to the formation and
sustenance of strategic alliances within the airline industry. To this end, Burton & Hanlon
(1994) opined that alliances are central to the formulation of airline business strategy such
as increasing access to foreign market to expand the scope operation thereby benefiting
from economies of scale and also to acquire and retain their customers in those markets.
The three well known global alliances are the Star Alliance, SkyTeam and Oneworld.
In respect of this study the dominant switching barriers in the airline industry is the
frequent flyer programs and the global alliance as illustrated in the conceptual framework
in Fig 2.1 below.
2.10.7 Service Recovery
Service recovery is said to be one of the potent retention strategy in the airline industry. A
service in an industry like that of the airline is prone to fail due to the human element
involved but it is how he service failure is handled and recovered that would determine
whether the customer would stay with the service provider or would leave. This involves
system failure, complaint and interpersonal relationship and recovery strategies.
University of Ghana http://ugspace.ug.edu.gh

59
Figure 1: Conceptual Framework for the Study on Customer Retention Strategies in
the Airline Industry.
Source: Author‟s Own Construct, 2013.
CUSTOMER
RETENTION
RELATIONSHIP
MARKETING
Commitment
Trust
Complaint Handling
Social Bonds
AIRLINE SERVICE
QUALITY
Tangibles
Empathy
Reliability
Responsiveness
Assurance
Safety & Security
AIRLINE
SWITCHING
BARRIERS
Frequent Flyer
Programs
Airline Global
Alliances
Loyalty Rewards
SERVICE
RECOVERY
Customer service
Management
Interpersonal
Relationship
Service Recovery
Strategy
University of Ghana http://ugspace.ug.edu.gh

60
CHAPTER THREE
CONTEXT OF THE STUDY
3.0 Introduction
This chapter examines the geographical settings and the physical characteristics of the
study area. This would help the reader situate the study in a particular context that would
aid understanding of the study area. This chapter also gives historical account of the airline
industry in Ghana, developments and future prospects of the industry.
3.1 The Physical Setting of Ghana and Kotoka International Airport
Ghana formerly called Gold Coast is located on the western coast of Africa, along the Gulf
of Guinea and is bordered by Burkina Faso to the north, Togo to the East, Cote d‟Ivoire to
west and Atlantic ocean or the Gulf of Guinea to the south. Ghana covers a total landmass
of approximately 238,540 sq km with a population of over 24 million people (GSS, 2010).
The KIA occupies total land area of about 1610 acres (651 hectares) within the city of
Accra and is about 10 kilometers from the city centre. The geographical reference point
co-ordinates of KIA are 050 35‟ 47‟‟ North Latitude by 000
0 10‟ 12‟‟ West Longitude. The
elevation of the airport is 63.3 meters (205ft) above sea level and has a South-West and
North- East runway measuring 3410 meters long. It is important to note that KIA is
located at the center of the universe that is on Equator (Latitude 00) or the Greenwich
Meridian and this makes it easily accessible from any part of the world.
KIA, the only international airport in Ghana presently is the first point of call for business
executives as well as tourists. The KIA is regarded as the gateway to the sub-region and
has become the most preferred and most favorite airport in West Africa.
University of Ghana http://ugspace.ug.edu.gh
61
A number of major international airlines have opened new routes into Accra whiles some
major existing airlines have increased their weekly frequencies. The terminals consist of
domestic and international terminals; the international departure hall has 27 check-in
counters to accommodate thirty five (35) scheduled airlines, the tarmac has the capacity
for thirteen (17) parking bays. KIA also has a freight terminal, equipped with three
parking bays to accommodate wide-body aircraft and is currently managed by one of the
two ground handling companies known as Aviance.
Ghana‟s Air Traffic Control serves as the coordination centre of the Accra Flight
Information Region (FIR) which also has jurisdiction over the air spaces (3658metres and
above) of the Republic of Benin and Togo. Currently the airport is served by 35 scheduled
passenger airlines including six cargo/ general aviation carriers and four domestic airlines.
3.2 Historical Background of the Airline Industry in Ghana
Ghana was colonized by Britain and the development of the aviation sector in Ghana was
spearheaded by the British colonial administration. The first time an airline was operated
in Ghana was in the Second World War where the Kotoka International Airport was
initially used as a military aerodrome by the Royal Air Force from Britain during the war
but was handed over to civilian authority in 1946 following military pullout.
By January 1956 a development project was launched for the construction of a proper
international airport for Accra which culminated in the commissioning of the first
international airline known as Ghana Airways which started operation in March 1958 with
Accra Airport as base. Due to the growth in passenger traffic a new passenger terminal
was commissioned to take care of the growth. In the same year the Accra Airport was
renamed Kotoka International Airport. Later in 1969 there was the promulgation of law
known as PNDC law 151 which established Ghana Civil Aviation Authority as an
University of Ghana http://ugspace.ug.edu.gh

62
autonomous entity. This was followed by the enactment of the Civil Aviation Act in 2004,
Act 678.
In line with this Act, there was a decoupling of Ghana Civil Aviation Authority into two
separate entities namely Ghana Civil Aviation Authority and Ghana Airport Company
Limited in January 2006 and by January 2007 the two entities came into being. The Ghana
Civil Aviation Authority was mandated by the new Civil Aviation Law as the main
regulatory agency of government on all issues pertaining to air transportation in Ghana
whilst the Ghana Airport Company Limited was mandated by the new law to manage and
maintain airport infrastructure.
3.3 Operations of GCAA
As stated earlier in this chapter the GCAA was established by PNDC law 151 of May 16,
1986 as the regulatory agency of government on air transportation in Ghana. The
development of GCAA dates back to 1918 when the idea of aerial transportation for the
then Gold Coast was conceived.
In 1930, the GCAA operated as a unit under the Public Works Department and later
granted Departmental status in1953 under the Ministry of Transport and Communications
and remained a department until May 16, 1986 when it assumed full status of a corporate
body under the Ministry.
In November 2004, a new civil aviation law, the Civil Aviation Act, 2004 (Act 678) was
enacted. The law mandated the ceding of the airports management functions to the GCAA
to the new company, the Ghana Airport Company Limited (GACL) which was set up for
this purpose. The reason was to enable GCAA focus on its core regulatory and licensing
role. Again under the law the GCAA is also mandated to provide air navigation services. It
University of Ghana http://ugspace.ug.edu.gh

63
is envisaged that with time Air Navigation Services Provider would also be separated from
the regulator, GCAA after all the necessary regulations have been enacted.
3.4 Functions of GCAA
The role of the GCAA as stipulated in Section 3 of its enabling statute is to provide safe
and secure air transport services through the following functions inter alia:
Provision of air navigation services within the Accra Flight Information Region
The regulation, promotion, development and enforcement of safe air transport
operations and services
The licensing of air transport and all personnel engaged in the air transport services
The licensing of the provision of accommodation in aircraft and licensing and
certification of aerodromes and navigational sites.
The co-ordination of search and rescue services within the Accra FIR and taking
security measures to safeguard air transport, life and property.
3.5 Brief History of Ghana Airport Company Limited
The Ghana Airports Company Limited (GACL) was established as a result of the
decoupling of the existing Ghana Civil Aviation Authority (GCAA). The company was
registered in January 2006 with the responsibility for planning, developing, managing and
maintaining all airports and aerodromes in Ghana namely Kotoka International Airport
(KIA) and the regional airports namely, Kumasi Tamale Sunyani and Takoradi as well as
the many airstrips. The company commenced operations officially on 1st January
2007(GACL, 2012).
The GACL was tasked by the law establishing it to provide world class airport facilities
and services to delight valued customers and to meet the expectations of stakeholders with
University of Ghana http://ugspace.ug.edu.gh

64
innovative and cutting edge solutions provided by a well-trained and motivated staff and
also to become the preferred global gateway and a leader in airport business.
Currently GACL serves and manages a total of 35 scheduled passenger airlines including
four domestic airlines and eight cargo airlines. There are also two charter airlines namely
Air Ghana and Gianair.
The table below gives information about the airlines operating scheduled flights in Ghana.
University of Ghana http://ugspace.ug.edu.gh

65
Table 3.1: Total Scheduled Airlines Operating in Ghana
S/N AIRLINES CODE DESTINATION A/C TYPE
1 Aero Contractors AJ Lagos B 737
2 Africa World Airlines AW KIA, Accra ERJ 145LR
3 Afriqiyah Airways 8U Tripoli A 320/ A 330
4 Air Burkina 2J Ouagadougou MD 87
5 Air Ghana (Cargolux) GHN Accra B 737
6 Air Ivoire VU Abidjan B 737
7 Air Mali I5 Bamako B 737
8 Air Namibia SW Windhoek B737
9 Air Nigeria VK Lagos E 90, B 737
10 Alitalia AZ Rome B 767, A 330
11 Antrak Air O4 Accra ATR 72-500
12 Arik Air W3 Lagos B 737/B727
13 Asky Air KP Lome A 343
14 Bellview Airlines B3 Lagos B737
15 British Airways BA London, Heathrow B 767
16 Brussels Airlines SN Brussels A 343
17 Ceiba International C2 Malabo ATR 72
18 Delta Airlines DL JFK, New York B 767
19 Egypt Air MS Cairo B 738
20 Emirates Airlines EK Dubai B767/ A 343
21 Ethiopian Airlines ET Adis Ababa B 757
22 Fly 540 5G KIA, Accra CRJ100/200
23 Gambia Bird 3G Bangul A 319
24 Kenya Airways KQ Nairobi B 738
25 Lufthansa LH Frankfurt A 333/ A 343
26 Middle East Airlines ME Beirut A 332
27 Portugal Airlines TAP Lisbon A 343
28 Royal Air Maroc AT Casablanca B 738
29 Royal Dutch Airlines (KLM) KL Amsterdam B 777
30 South African Airways SA Johannesburg B 747
31 Starbow S9 KIA, Accra BAe 146-300
32 Turkish Airlines TK Ankara B 757
33 United Airlines UA Dulles, Washington DC B 747
34 UNMIL UN Monrovia B 757
35 Virgin Atlantic Airlines VK Gatwick, London B 757
Source: GACL, 2013
University of Ghana http://ugspace.ug.edu.gh

66
3.6 Regional Airports
There are four regional airports under the supervision of GACL namely Kumasi, Tamale ,
Takoradi and Sunyani as well as airstrips under its jurisdiction. These airports however,
have to be maintained in accordance with the regulations for continued certification for
safety, security and service standards. It is also necessary to position the domestic airports
to accommodate the increase traffic as expected to be generated from rapid economic
growth envisaged for the near future. Each of them is headed by a Manager and is
responsible for the airport and terminal operations, ramp services and RFFS. There are a
total of over 85 flights to and from the regional airports operated by the four main
domestic airlines; Antrak Air, Starbow, Fly 540 and recently Africa World Airlines
(AWA).
3.6.1 Kumasi Airports
The Kumasi Airports was started in 1940 and was completed by 1943 but it was not until
1947 that the final documentation for land acquisition was completed and paid for. The
runway was 1097.82 meters long by 37.36 wide, middle: 45.72 meters consolidated for
landing and two flanking widths of 45.72 meters each for parking.
After the Second World War, the PWD constructed a Control Tower, Terminal Building,
RFFS Station and staff quarters which covered an area of about 3 acres for the department
of civil aviation which is the body that manages the facilities. 1958/59 saw extensive
developments by the Ghana government to the runway, navigational facilities and human
resources, to enhance internal airline operations.
The installation of runway ad taxiway lights and the extension of the main runway to the
southern part in the late 1970s was yet another major improvement to the Kumasi Airport.
University of Ghana http://ugspace.ug.edu.gh

67
Whilst the lights enhanced night flying, the extension of the runway enabled operations of
short haul jets like the F8. The construction of a new Terminal and the installation of a
VOR/DME completed the modernization process on the 1st of December 1993. By 2003
Kumasi was declared an International Airport primarily for regional operations with full
complement of security, customs and immigration staff.
The geographical coordinates of the Kumasi Airport is 06 43‟ 09‟‟ and W01 34‟ 59‟‟. It
stands a distance of 3.5kilometres from the city of Kumasi and is North East from the city
centre. The surface of the runway is asphaltic and has runway dimension of 1981metres by
45metres and is 287metres (942ft) above sea level and operates throughout the year.
3.6.2 Tamale Airport
The Tamale Airport was constructed as a military operational base for troops during the
World War II. The landing strips were acquired at Nyohene, some miles west of Tamale in
December, 1940.
By 1948, there was massive expansion of the airport to take care of airline operations. This
culminated in the building of airline facilities with assistance from GCAA including
Aerodrome Control Tower, Rescue and Fire Fighting Service (RFFS) and Air Traffic
Control Offices for operational use.
The Tamale Airport is located in the city of Tamale with geographical coordinates of 09‟‟
43‟ 00N and 00 52‟‟W and a height of 168m (552ft) above sea level. The runway length is
about 2438metres (8000ft) and 150ft width with a runway slope varying from both ends
and is asphaltic.
The Tamale Airport is earmarked to be developed into standard airport for international
operations to serve as a hub for the sahelian region to support the industrialization drive of
University of Ghana http://ugspace.ug.edu.gh

68
government and also to support eco-tourism in order to boost economic activity of the area
and also to serve as an alternative to supplement KIA for handling international
operations.
The proposed rehabilitation of Tamale Airport will develop a high level infrastructure by
optimizing existing levels of infrastructure that will leverage the integrated development
of agriculture and tourism being the competitive sectors of the region to eventually
catalyze industrialization and rapid socio-economic development of the savanna regions.
3.6.3 Takoradi Airport
The Takoradi Airport is a military base and is therefore currently under management of
the Ghana Air force. Despite the fact that it is a military base, the facility is now being
used for civil operations.
Due the fact there is huge tourism potential in that part of the country, a massive capital
investment in transforming the Takoradi Air force base into a fully fledged international
airport would be a step in the right direction. To this end, new terminal facilities for
handling aircraft and passengers will have to be constructed for this purpose.
3.6.4 Sunyani Airport
Development of the Sunyani Airport dates back to the 1940s when a communication
outpost and aerodrome was built for the use of Allied Forces during World War II.
However, before the end of the war, the airstrip was abandoned.
In 1969, the Busia Government realizing the urgent need for an airport for Sunyani
initiated the construction work of the airstrip into a complete airport of international
standards. The airport was completed and opened on 13th
July 1974.
University of Ghana http://ugspace.ug.edu.gh

69
The Sunyani Airport is located in the city with geographical coordinates of 7 21‟ 33‟‟ N
and 2 19‟ 45‟‟ W. The airport has about 4600 meters runway length with an elevation of
1041ft above sea level.
Figure 3.1 Map of Ghana Showing the Various Airports and Airstrips in Ghana
3.7 Developments in the Airline Industry in Ghana
The airline industry in Ghana has witnessed massive growth as passenger traffic has
reached an all time high. This is as a result of buoyant economic indices, rich cultural
diversity and huge tourism potential of the country and more importantly the recent
discovery of oil in commercial quantities in Ghana (GACL, 2012). Aircraft movement has
also soared in recent years making Ghana a preferred destination and a major aviation hub
in the sub-region. No wonder the domestic aviation sector has also witnessed a
University of Ghana http://ugspace.ug.edu.gh

70
proliferation of airlines in recent years. This is mainly attributed to the deregulation and
liberalization of the industry by the GCAA which opened up the industry to private
industry players to take advantage of and also the discovery of oil in commercial
quantities in Ghana. This saw intense competition in the domestic sub-sector which
resulted in price wars among the domestic airlines. This considerably brought prices down
and the customer became the ultimate beneficiary.
This meant that more people can afford to travel by air hence the boom in the domestic
sector. Again the airlines increased their daily schedules and they made it flexible to suit
the needs and desires of passengers thereby making it convenient to travel by air.
The aviation industry is known to be the major catalyst for the socio-economic
development of emerging economies such as ours. In this regard, Ghana‟s aviation
industry stands out as one the fastest growing and perhaps most competitive in the West
African sub-region. There are number of scheduled carriers flying in and out of Ghana and
has doubled from 15 in the year 2000 to thirty (30) in 2011. Again, passenger throughput
has improved from 900,000 in 2007 to over the projected figure of 1.7million by the end
of the year 2011.
The prospects for Ghana‟s aviation industry look very impressive as there is high demand
for increase of flight frequencies by the scheduled airlines servicing the airport owing to
the open skies policy. There is also a high demand by new countries to initiate bilateral
arrangements leading to commencement of flight operations into Ghana by designated
carriers as a result of the production of oil in commercial quantities in Ghana. In light of
this, aircraft movement annual total is projected to rise from 28,063 in 2010 to 36,510 in
the year 2013. Directly related to this is the projected aggregate passenger growth from
1,428,424 in 2010 to 1,710,884 in 2013 representing an annual average growth rate of
30% and 20% respectively (GACL, 2012). There is therefore no doubt that the airline
University of Ghana http://ugspace.ug.edu.gh

71
industry is playing a major role in the reported 20% expected growth of the national
economy which is noted as the fastest growing economy in the world. In order to sustain
this sterling performance there is the need for huge capital investment in airports
development in Ghana. The main challenge however is funding infrastructure projects.
3.8 The Domestic Airlines in Ghana
The domestic aviation sub-sector in Ghana shows great prospects in airline operations and
profitability on the back of the open skies policy and oil discovery in Ghana. There are
currently four (4) passenger scheduled airlines flying Ghana‟s domestic airspace and
airstrips and there are indications of more airlines to join. The four are Antrak Air,
Starbow, Fly 540 and recently African World Airline (AWA).
3.8.1 Antrak Air
Antrak Air Ghana is a wholly Ghanaian owned limited liability company incorporated in
December 2001. It is the oldest scheduled airline in Ghana which commenced operations
in September 2003. Antrak Air is mandated to offer passenger and cargo services for
domestic, regional and international routes.
Antrak Air aims to become the domestic and regional airline of choice in Ghana by
providing competitive, safe, reliable and efficient services delivered by customer focused
employees. Antrak Air services are summed up in their approach to flying that is their
aircrafts are modern and reliable with convenient, safe and punctual schedules at an
affordable price. They also make sure their employees are friendly and responsive to
customer‟s needs.
Antrak Air is the largest domestic operator in Ghana, offering more frequency and
carrying more passengers than any of its competitors. It offers up to 6 daily services from
University of Ghana http://ugspace.ug.edu.gh

72
Accra to Kumasi, 3 daily services to Takoradi, double daily services to Tamale and once
daily service to Sunyani. The airline also offers tailor-made charter services to meet
individual demands. Antrak Air also intends to commence services to the West African
Sub-region with Lagos, Nigeria for a start.
Antrak Air operates three (3) ATR 72-500 turbo prop aircraft on lease from Swiftair from
Spain. Antrak has agreed a transfer of technology with Swiftair of Spain to bring Antrak
technical staff and operations up to international standards of excellence.
3.8.2 Starbow
Starbow is a regional airline focusing on the West African market. Aero Surveys Limited a
licensed airline company trading under the commercial name “Starbow” started domestic
flights out of KIA in September 26, 2011 serving Kumasi twice daily, Tamale daily and
Takoradi daily. Starbow plans to start regional operations in the nearest future. The
company was originally founded in 2007 as Aero Surveys Limited and later rebranded as
Air Shuttle. In 2011, the ownership of the airline changed which resulted in a further
rebranding under the commercial name Starbow with regional flights in mind.
With over 110 employees supporting guests from local international travelers, Starbow
combines a highly intelligent corps of airline officials who provides a world-class outlook,
best services and an upbeat travelling experience, Starbow seeks to win the hearts and
minds of the West African region by opening the doors to regional and international trade
and bringing people together.
The Starbow fleets consist of three BAe 146-300 and one BAe 146-200 jets aircraft.
Starbow fleets especially the BAe 146-300 are known to have slender sizes with unique
quality of handling, maneuverability and airfield access.
University of Ghana http://ugspace.ug.edu.gh

73
Starbow adheres to the highest safety and operational standards with well trained and
experienced pilots. With their FFP, Starbow aims at providing services that would benefit
to their loyal customers.
Starbow‟s international route commenced in August 2012 with up to 5 times weekly
service from Accra to Cotonou in Benin. The second international destination for the
carrier is Abidjan in Ivory Coast operating 5 times weekly from Accra. However, all the
international services were suspended in early 2013 due to poor performance.
3.8.3 Fly 540
Five Forty Aviation Ltd, trading as Fly 540, is a low cost airline based in Nairobi, Kenya.
Fly540 is said to be the world‟s number one destination for cheap flights within the
African continent. Fly 540 started operations between Nairobi and Mombasa on
November 24, 2006. Fly 540 is specialized in cheap flights to Ghana and Angola using
Ghana as the West African hub. Despite their lowest fare in Africa, Fly 540 does not
compromise on their excellent customer service and safety record.
The vision of Fly 540 is to consistently offer excellent customer service and safety in
addition to providing great value on all African flights to Angola and Ghana. Fly 540 have
also invested heavily in the acquisition of fleets of fuel efficient aircraft including the
modern ATR turbo-prop as well as CRJ-100/200 jet aircraft. These aircraft use about 50%
less fuel than other types of aircraft which helps us to keep our carbon footprint to an
absolute minimum.
The airline endeavors to offer flight that are accessible to all leisure and business travelers
and work hard to operate as efficiently as possible on order to allow the company to give
the best prices on flights to African cities and destination throughout Ghana and Angola.
University of Ghana http://ugspace.ug.edu.gh

74
3.8.4 Africa World Airlines
Africa World Airline (AWA) was incorporated on November 15, 2010 and received its
Air Carrier License from GCAA in March 2011 and is the newest kid on the block. Africa
World Airline (AWA) newly registered private-sector company in Ghana formed with the
sole vision of making air travel an option for majority of travelers within the markets in
which they operate was founded by Togbe Afede XIV, the chief of Asogli State and the
CEO of SAS Finance Group. The shareholders include SAS Finance Group (Ghana),
SSNIT (Ghana), HNA Aviation Holding in China and China-African Development Fund
(China).
AWA took delivery of its first aircraft Embraer 145 on 30th
August 2012 and the second
on 13 September 2012. The airline has currently two new and modern ER 145LR jets for
its domestic and regional operations. The route is structured to create a hub-and-spoke
model centered upon Accra. This will allow a seamless one-change connection between
multiple city pairs. AWA flies twice daily to Kumasi and daily to that of Takoradi and
Tamale.
Taking cognizance of the intense competition that has characterized the domestic aviation
sub-sector, AWA entered the market with aggressive marketing strategies to capture the
share of the customers. The considerable reduction in prices coupled with unparalleled
customer service gave AWA a bright start and is doing pretty well. They also introduced a
Frequent Flyer Program of a 50% discount on all flight within Africa.
3.9 Contribution of the Airline Industry to the Economy of Ghana
Transportation is a sine qua non to the progress and development of every nation. Among
various modes of transportation, air transport constitutes an essential element that meets
the needs of domestic and international transportation of goods and human beings. Air
University of Ghana http://ugspace.ug.edu.gh

75
transport in Ghana is responsible for the highest number of tourists and passenger traffic
internationally, benefiting the nation in exchange of ideas, technology, thereby
contributing to the success of government‟s Better Ghana Agenda.
Air transport also rakes in foreign exchange as government gets a lot of revenues from
airport tax levied on airlines that ply our airspace. This generates hard currency for the
nation that can be used to aid development in other areas.
The aviation sector also generate huge amount of jobs for the people. In this regard over
two million people are employed in mainstream aviation business as well as other allied
services such as hotels, tourist site, restaurants, etc.(GCAA, 2012).
The airline sector also provides aeronautical facilities used by aircrafts to spray farms and
aquatic parasites and other insects that evade communities that are harmful to humans.
Aircraft are also used in rescue operation during natural disasters such as flooding,
earthquakes, etc. It is also used for aerial cartography and surveys.
The air transport industry is also expected to contribute substantially to the achievement of
the objectives of government trade and investment policies as the transport of traditional
and non-traditional exports and the imports of essential good cannot be overemphasized.
This would open up KIA and other airports in the country as gateways to trade and
investment destinations in the country.
University of Ghana http://ugspace.ug.edu.gh
76
CHAPTER FOUR
RESEARCH METHODOLOGY
4.0 Introduction
This chapter provides description on the method employed in the study and discuses how
the study itself was conducted so as to be able to achieve the objectives set in chapter one
of this study. It also presents the methodological framework adopted to tackle the research
hypothesis in this study.
The pivot of every study depends largely on the various methods employed in collecting
and analyzing statistical data. It is important to note that, the method and techniques used
eventually determines the conclusions that are drawn and for that matter the method must
be seen to be rigorous and robust in order to draw conclusions that would be dependable,
reliable and objective.
The chapter also presents the process of data collection, data management and analysis
and also talks about ethical issues to be considered in conducting researches of this nature.
4.1 Research Purpose
The main purposes of conducting research are exploratory, descriptive and explanatory
(Robson, 2002). Exploratory research is characterized by seeking new insights, looking
around and asking questions or putting research phenomenon into proper perspective. The
descriptive research is characterized by giving accurate profiles of people, events or
situations whiles the explanative research on the other hand aims at gaining an
understanding into specific situations or problems.
This research is primarily explanative in character as it delved into how service firms
manage retain their customers with an explanation of what customers consider the best
strategy in keeping them to a particular service provider. Saunders et al., (2007) when they
intimated that explanatory research is practical because of its attempt at clarifying the
University of Ghana http://ugspace.ug.edu.gh

77
understanding of a specific research problem. Furthermore, this research is also descriptive
in nature because this research describes previous works on customer retention and how
companies adopt customer retention strategies to create value.
4.2 Research Approach
The two most important approaches used in conducting this research are the inductive and
deductive approaches (Saunders et al, 2007, Amaratunga et al, 2002; McGiven, 2006). The
inductive approach is when data is collected first and after analyzing the data, a theory is
developed consequently. On the other hand, if a theory or hypothesis is first developed and
then later a research strategy is designed to test the hypothesis, then the approach is of
deductive nature. In this research therefore, the data collected was analyzed based on
existing literature on the topic hence adopting the deductive approach. Some scholars refer
the deductive approach to mean quantitative and the inductive as qualitative.
The quantitative research (deductive) is seen as an extreme of empiricism in which
theories are not only justified by the extent to which they can be verified, but also by an
application of facts acquired (Amaratunga et al., 2002)
The qualitative method is said to be the most convenient since it measures people‟s way of
living such as the way they feel, think or behave in a particular way. But this research
method tries to quantitatively explains and apply statistical analysis which is often
formalized, well structured and data is usually obtained from larger sample (Tull &
Hawkins, 1990). This justification is buttressed by Saunders et al (2009) when they
intimated that for a quantitative study to be successful, the most important ingredient
needed for the researcher is his ability to develop hypotheses and test them with proper
statistical techniques, and interpreted the statistical information into descriptive
University of Ghana http://ugspace.ug.edu.gh
78
information. In as much as the quantitative method so adopted seems workable, Yin,
(2003) caution of the demerits associated with this method. This is because this research
approach is characterized by generalization and analysis does not apply to local or peculiar
situations. It is also criticized as being too abstract in nature.
On the other hand, the qualitative (inductive) research emphasizes getting close to the
subject(s) of study and assumes the role of participants to describe a phenomenon in a
social reality from the perspective of the subject rather than the observer.
4.3 Research Design and Strategy
Research design refers to the framework or the blueprint used for collecting, measuring
and the final analysis of the data (Copper & Schinder, 2001). It also talks about the
procedure for data collection and analysis in order to reveal theoretical perspectives of the
study. The main reason for the research design is to structure the research to answer
research problems as accurately, clearly and unequivocally as possible (McGivern, 2006).
The use of research design is to ensure that the objectivity of the research can be assured
(Guy et al., 1987).
This study was a cross-sectional non-experimental survey design which utilized both
probability and non-probability and convenient sampling with a structured researcher
administered questionnaire for the collection of quantitative data involving multi variables
that were examined to detect patterns of relationship and association. Due to the multi
dimensional approach adopted in tackling the research problem, this dual strategy is
deemed appropriate because it mostly draws on the strengths on the two strategies (i.e.
probability and non-probability research designs and strategies).
University of Ghana http://ugspace.ug.edu.gh

79
4.4 Sample Design and Sample Size Selection Technique
Sample design is a definite plan for obtaining a sample from a given population (Cemba,
2008). The population in the context of this study means the aggregate or the totality of all
members under study. It involves the procedure the researcher used to select the units to
be included or excluded from the sample. In conducting research of this nature one cannot
study everybody everywhere (Miles & Huberman, 1994). In most social research, the
researcher is confronted with the task of collecting data from everyone who fall within the
research threshold. It is therefore important for the researcher to identify persons who fits
into and possess certain features that he researcher needs. As put forward by Salant &
Dillman (1994) a major prerequisite in sample selection is to define the target population
as narrowly as possible so as to achieve the desired result of the researcher. This is true
because the entire population is difficult if not nearly impossible to sample so it makes
sense to consider a narrowly define population as it saves time, efforts and resources as
well. Defining the sample population also help focus the research so that readers can put
the findings and recommendations in proper perspective as not all findings are applicable
in all situations.
In data collection, it is necessary to consider the entire population within which the
research is conducted. With respect to this research, the entire customers of all the airlines
operating in Ghana were realized to be too voluminous to be studied individually. It
became necessary consequently to randomly sample the customers in order to obtain a
sample size that was representative and manageable for the study.
All airlines operating in Ghana were given equal consideration which constitutes the
sample frame with 337 airline customers were purposively selected to represent the final
University of Ghana http://ugspace.ug.edu.gh

80
sample size for the study. Accra being the capital was used because the only international
airport happens to be in Accra and also all airlines both domestic and international have
their head offices or Sales offices or agents in Accra.
In relation to this study a sample size of 337 respondents was selected from airlines
customers of the five major airlines namely, Emirates, KLM, Delta, British Airways and
Kenyan Airways. Both convenience and random sampling techniques were employed in
the selection of customers of these airlines. The determination of an appropriate sample
size is a function of the homogeneity or heterogeneity of the population on a particular
variable. When the population is homogeneous, a small sample size is representative
enough. However, if the population is heterogeneous then a larger sample size is required.
With regards this study, the respondents (that is airline customers) are heterogeneous in
the sense that they are individuals who come from different destinations, cultures,
nationalities and interests.
A sample size is the number of elements to be included in a study. Determining the sample
size is complex and involves several qualitative and quantitative considerations (Malhotra,
2007). As a result a large sample size of 337 customers of the various airlines from
different backgrounds is representative enough for an estimation to be made about the
entire population.
The aforementioned sample size was deemed appropriate because it conforms to Edwards
(1985) and Stevens (1996) recommendation that the researcher should consider a
minimum of 15 participants for each predictor variable to be used in any multivariate
analysis. Again, both Pallant (2007) and Tabachnick and Fidell (2007) suggested a
University of Ghana http://ugspace.ug.edu.gh

81
formula on the adequate sample size to use for a multivariate analysis; N > 50 + 8m
where N is the number of participants and m is the number of predictor variables.
In respect of the sampling techniques and using the objectives of the study as a guide, the
researcher used a two prong technique for selecting the sample for this study. Both
probability and non-probability sampling techniques were demystified. A probability
sampling is a procedure in which each elements of the population has a fixed probabilistic
chance of being selected for the sample (Malhotra, 2007). In this technique, sampling units
are selected by chance and the researcher can pre-specify every potential sample of a
given size that could be drawn from the population. A non-probability sampling technique
tries to attempt to obtain a sample of convenient element. Unlike the probability sampling,
the non-probability sampling technique leaves the selection of sampling units primarily to
the interviewer.
In this study, a probability and non-probability sampling technique has been used where
the airline customers have been randomly selected for the administering the questionnaire.
This means that the respondents are selected independently of every other respondent and
every respondent has the same or equal probability of being sampled. Secondly, the study
adopted a convenient sample with structured questionnaire for collection quantitative data
involving multiple variables. This dual strategy is deemed appropriate because it mostly
draws on the strengths on the two strategies (i.e. probability and non-probability research
designs and strategies) and this helps improve rigour.
University of Ghana http://ugspace.ug.edu.gh

82
4.5 Sources of Data and Data Collection Methods
Sources that are used for data collection can be categorized into two main forms namely,
primary and secondary data sources. The primary data for micro level analysis was
obtained through direct personal interviews at Ghana‟s Kotoka International Airport. That
is to say the primary sources of data are collected and gathered from customers of various
airlines that operate in Ghana with specific consideration of the research objectives under
study. The most appropriate research instrument used as far as this study is concerned is
principally researcher administered questionnaire and an initial personal interview and
interaction with aviation professionals. To this end, interview guide was designed for
practitioners in the airline industry to solicit additional information to augment what has
been obtained and to put the study in the right perspective. The purpose for using this
participatory approach is to avail the respondent the opportunity to freely give information
that would be relevant to the study.
The self-administered questionnaire was used mainly because it is usually cheaper
especially when data collection involve large sample size, respondents‟ confidentiality can
be assured and the standardized nature of self administered questionnaire makes it more
suitable over the other methods of data gathering (Saunders et al., 2009). In view of this a
close-ended and well structured questions were administered to gather data from the field
that would be used to test the model adopted in the second chapter. This led to designing
questions that would help investigate and examine the validity of the hypothesis and
objectives were developed.
The four main constructs adopted in this study (Relationship Marketing, Airline Service
Quality, Airline Switching Barriers and Service Recovery) were represented by a number
of variables as captured in the questionnaire with each of the variables measured on a five
University of Ghana http://ugspace.ug.edu.gh

83
point likert scale from strongly disagree to strongly agree for all the four constructs under
customer retention strategies whereas the first section of the questionnaire captures
demographics (gender, age, educational qualification, occupation) and other general
information about the respondents with regards to customer retention. The main data
collection instrument used is a researcher-administered questionnaire with options in order
to illicit the right kind of information needed for the purposes of this research.
Secondary data was sourced from published works relevant to the study including from
articles, newspapers publications, historical records, journals, newsletters, maps, previous
research works related to this study, government bulletins and reports as well as the
internet are used for macro level analysis such as policy guideline for airline operations
and airline industry performance. This sources form the reference information with which
my primary information was compared. With regards to the non-numeric interview results,
an unconventional analytical technique (that is qualitative) was also employed at the initial
stages of the study.
4.6 Pre Test
Pretesting refers to the testing of the questionnaire on a small sample of respondents to
identify and eliminate potential problems. In a research of this nature, pre-testing of the
questionnaire is necessary in determining the suitability and applicability of the questions
before the main data collection is started. This helps in identifying ambiguous questions
which could or may not be understood by the respondent or cannot run properly in the
analytical tool to be used. All aspects of the questionnaire were tested including question
content, wording, sequence, form and layout, question difficulty and instructions.
University of Ghana http://ugspace.ug.edu.gh

84
A pilot study was therefore conducted to determine the clarity and reliability of the
questionnaire and to discover any discrepancy with regards to the wording and the
administration of the questionnaire
Respondents were also asked to freely express their reservation and views regarding
difficulties experienced in completing the pilot questionnaire. Thirty (30) airline customers
and fifteen (15) aviation experts were carefully selected for pretesting of the questionnaire.
The duration for the pretest exercise took five days and at the end it was very helpful for
redesigning the final questionnaire for the main field work.
4.7 Analysis of Data
The largely quantitative nature of this study meant that a statistical tool is employed for
the analysis of the data gathered from the field. The survey data analysis involved the
application of Statistical Package for Social Sceinces (SPSS) version 20.0 software. This
analytical instrument enabled the researcher to offer descriptive and also draws statistical
inferences based on the responses from the respondents.
In order to achieve the objective stated in the study, and also to test the causal relationship
between the main constructs found in the framework of this research, the study adopted
statistical tool called the standard multiple regression analysis. Since the study involved
four main independent variables (that is RM, ASQ, ASB and SR) with one dependent
variable (CR), a standard multiple regression statistical tool was deemed appropriate for a
study of this nature. This is because in multiple regression, one is able to determine how
well a set of variables is able to predict the other and which variable in the set is the best
predictor of the other. Multiple regression also helps determine whether a particular
University of Ghana http://ugspace.ug.edu.gh

85
predictor variable is still able to predict an outcome when the effect of another variable is
controlled. In standard multiple regression, all the independent or predictor variables are
entered into the equation simultaneously to generate the formula as follows;
Equation 4.1: ,
where
CR= the dependent variable, i.e. Customer Retention (CR)
RMi = Relationship Marketing
ASQi = Airline Service Quality
ASBi = Airline Switching Barriers
SRi = Service Recovery
β0 = Intercept term
β1,....., β4 = Represent the coefficients to be estimated and
µi = the error term
4.8 Ethical Consideration
Ethical issues are of paramount importance to this study. Some of these relates to
researcher-respondent relationships such as asking sensitive questions, openness with the
respondents, long questionnaires, combining of more than one question in the same
questionnaire, deliberately biasing the questionnaire, appropriate use of words, handling of
confidential information from respondents among others.
The study ensured that information provided by the respondents is kept confidential and
that no participant is victimized in any way. Since the respondents are volunteering their
University of Ghana http://ugspace.ug.edu.gh

86
time and information the researcher made sure that respondents are not overburdened by
soliciting too much information. The study also made sure that prior approval is sought
from the respondents and institutions concerned before the findings of this research are
made public. The study also made it clear to respondents that the questions asked are for
academic and research purposes only and not for any other inordinate purposes that would
be injurious to their persons.
4.9 Limitations of the Study
The combination of both quantitative and qualitative research methods is without
problems as the two methods contain in them inherent lapses that conflict combination of
the two methods in one research.
Again the study is seen to be limited in scope because the airline industry embodies other
allied and subsidiary services such as catering, hotel, and car rental services run by the
airline which this study failed to include.
Major problems were encountered especially at the pretesting stage of the questionnaire.
This led to redesigning of the questionnaire. Even during the real questionnaire
administration, quite a number of challenges were encountered. Due to the busy nature of
the airport environment and the fact that airlines customers are most often are visitors,
they feel reluctant to volunteer information as they cannot trust the identity and integrity
of the interviewer. Everyone seems to be minding their business and many customers
barely have any time on their hands to spare. The researcher has to go to the airport
several times because it was difficult to get air passengers who are willing to complete the
questionnaire. This delayed a bit the data gathering process coupled with constraints of
time and resources which were considered as major drawbacks.
University of Ghana http://ugspace.ug.edu.gh

87
CHAPTER FIVE
DATA ANALYSIS AND DISCUSSION
5.0 Introduction
This chapter presents the discussion, interpretation and analysis of the responses of
respondents sampled for this study. The study is concerned with the effects of a priori
customer retention strategies in the airline industry in Ghana was conducted on three
hundred and thirty seven patrons of the various scheduled airlines of the Kotoka
International Airport.
This chapter starts with descriptive information of the respondents‟ socio-demographic
and primary variables. It further deals with a presentation of the results of bivariate
analysis to establish the relationship between the independent and dependent variables of
this study.
5.1 Socio-Demographic and General Background of Respondents
Descriptive statistics was used to provide data on the distribution of research variables. In
the section A of the CRS questionnaire, the frequencies distribution were determined on
the following categorical variables of gender, age, occupation, place of origin, educational
qualification, frequency of travel, preferred airline, most important factor to consider in
choosing an airline. It also involves descriptive measures of sample size (N), mean (M),
standard deviation (SD) for the independent variables in order to examine the central
tendency of the various variables within the RM, ASQ, SB and CH&SR sub-scales.
5.1.1 Age and Sex Distribution of Respondents
Table 5.1 depicts the sex distribution of the 337 study participants whose views were
sought for the study. Of the three hundred and thirty seven airline passengers sampled, one
hundred and ninety one (191) of the respondents representing 56.7% of the respondents
University of Ghana http://ugspace.ug.edu.gh

88
are males whiles 146 of the people surveyed representing 43.3% of the respondents are
females. This shows the male dominance in travel but also shows quite an appreciable
number of females (43.3%) who travel by air at the time of the survey.
Table 5.1: Sex of Respondents
Sex Frequency Percent
Male 191 56.7
Female 146 43.3
Total 337 100.0
Source: Field Survey, March, 2013
With regards to age, majority of respondents sampled making (37.4%) of the respondents
were between the ages of 46-60years followed closely by age groups of 26-45years
representing 36.2% whereas those within the ages of 18-25years and those that are 60 and
above constitute 8.6% and 17.8% respectively. This is an indication that majority of the
respondent who travel are concentrated in the active or the working class. The table 5.2
below illustrates this.
Table 5.2: Age of Respondents
Age (years) Frequency Percent
18-25 29 8.6
26-45 122 36.2
46-60 126 37.4
60 + 60 17.8
Total 337 100.0
Source: Field Survey, March, 2013
University of Ghana http://ugspace.ug.edu.gh

89
5.1.2 Educational Qualification of Respondents
The frequency table 5.3 below for educational qualification indicates that 51.3% of the
respondents have obtained either a degree or an HND whilst 45.1% have a postgraduate or
professional qualification. Travelers with no education constitute only 0.6% and those
with ordinary level or advanced level certificates constitute 3% of the respondents
sampled. This shows a strong indication yet that greater numbers of air travelers sampled
are educated.
Table 5.3: Education background of Respondents
Level of Education Frequency Percent
No formal education 2 0.6
Ordinary/Advanced Level 10 3.0
HND/Degree 173 51.3
Professional/Postgraduate 152 45.1
Total 337 100.0
Source: Field Survey, March, 2013
5.1.3 Occupation of Respondents
In table 5.4 below, 36.2% of the respondents sampled are business men and women who
are in the private sector whilst 34.1% are engaged in the civil or the public sector and
those who are 21.1%. This is an indication that most of the respondents are business
travelers and it can be deduced that they are traveling for business purposes.
University of Ghana http://ugspace.ug.edu.gh

90
Table 5.4: Occupation of Respondent
Occupation Frequency Percent
Student 29 8.6
Self-Employed 71 21.1
Civil/Public Servant 115 34.1
Businessman/woman/Private Sector 122 36.2
Total 337 100.0
Source: Field Survey, March, 2013
5.1.4 Place of Origin of Respondents
The frequency table 5.5 for place of origin of travelers below shows majority of
respondents making 39.5% come from Europe followed by North America representing
24.6%. Twenty (20.2%) are respondents who were coming from sister African countries
and the rest 15.7% come from the Middle East. From the table below it can be deduced
that most of Ghana‟s development partners are mostly from Europe and North America as
most of them come for business purposes.
Table 5.5: Place of Origin
Place of origin Frequency Percent
Africa 68 20.2
Europe 133 39.5
Middle East 53 15.7
North America 83 24.6
Total 337 100.0
Source: Field Survey, March, 2013
University of Ghana http://ugspace.ug.edu.gh
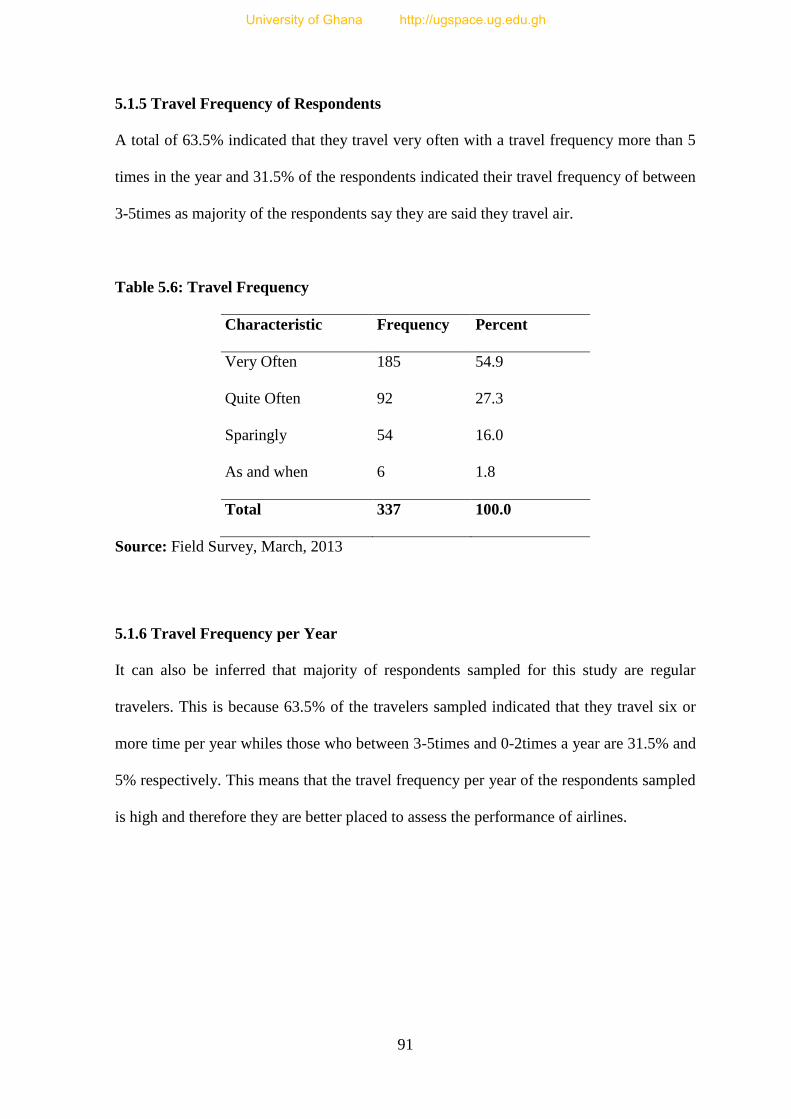
91
5.1.5 Travel Frequency of Respondents
A total of 63.5% indicated that they travel very often with a travel frequency more than 5
times in the year and 31.5% of the respondents indicated their travel frequency of between
3-5times as majority of the respondents say they are said they travel air.
Table 5.6: Travel Frequency
Characteristic Frequency Percent
Very Often 185 54.9
Quite Often 92 27.3
Sparingly 54 16.0
As and when 6 1.8
Total 337 100.0
Source: Field Survey, March, 2013
5.1.6 Travel Frequency per Year
It can also be inferred that majority of respondents sampled for this study are regular
travelers. This is because 63.5% of the travelers sampled indicated that they travel six or
more time per year whiles those who between 3-5times and 0-2times a year are 31.5% and
5% respectively. This means that the travel frequency per year of the respondents sampled
is high and therefore they are better placed to assess the performance of airlines.
University of Ghana http://ugspace.ug.edu.gh

92
Table 5.7: Travel Frequency per year
Travel per year
Frequency Percent
0 – 2 times 17 5.0
3 – 5 times 106 31.5
6 times + 214 63.5
Total 337 100.0
Source: Field Survey, March, 2013
5.1.7 Airline Often Patronized
Most (30%) travelers patronize the services of Emirates Airline followed by KLM (22%),
Delta Airlines (20%), British Airways (19%) and Kenyan Airways (9%) respectively. This
is illustrated in figure 5.1 below.
Figure 5.1: Showing Airline often patronized.
Source: Field Survey, March, 2013
University of Ghana http://ugspace.ug.edu.gh

93
5.1.8 Most Important Factor in the Choice of an Airline
The probe into which factor to consider as the most important when choosing an airline
revealed majority (47.8%) of participants indicates that safety and security is their most
important to consider when choosing an airline to travel with. Service quality (26.1%),
price (17.2%) and the reputation (8.9%) of the airline respectively were also considered.
This suggests that air passengers are more concerned with their safety and security in the
air as this was rated ahead of service quality, the cost of the air fare and the reputation of
the airline. This means that players in the airline industry need to focus more attention on
security and safety standards as well as service quality issues as well.
Figure 5.2: Most Important Factor in the choice of an airline
Source: Field Survey, March, 2013.
FACTORS
University of Ghana http://ugspace.ug.edu.gh
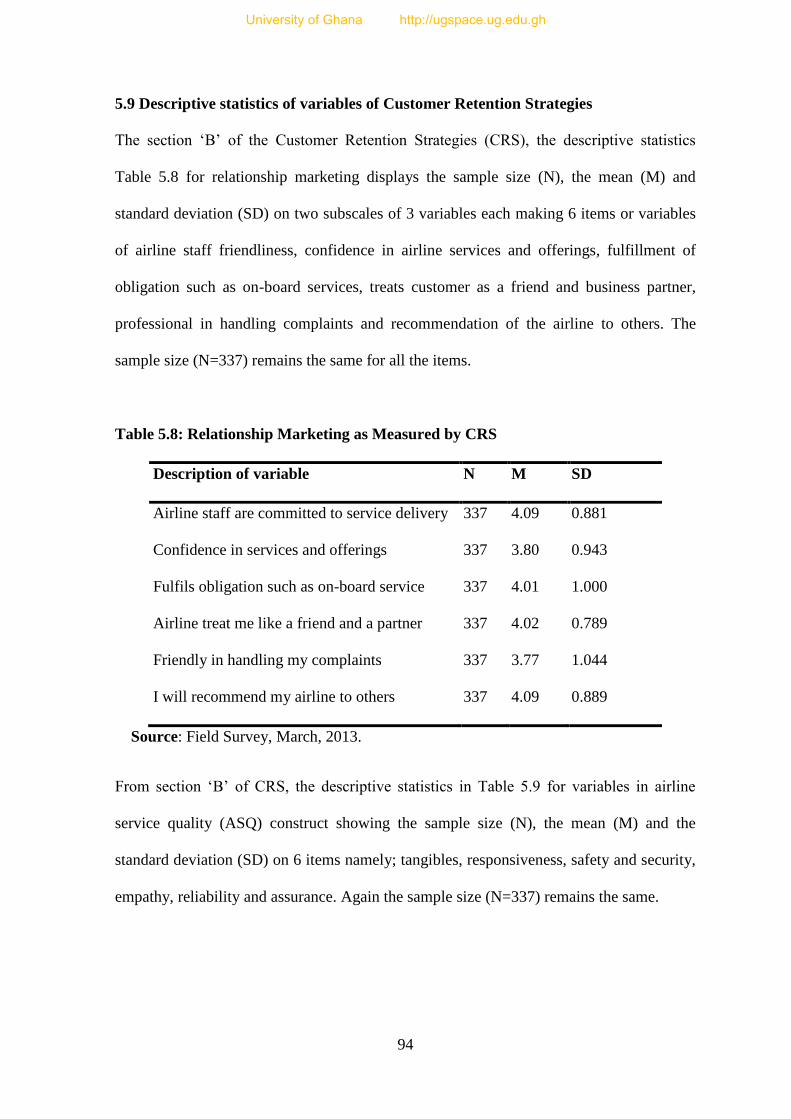
94
5.9 Descriptive statistics of variables of Customer Retention Strategies
The section „B‟ of the Customer Retention Strategies (CRS), the descriptive statistics
Table 5.8 for relationship marketing displays the sample size (N), the mean (M) and
standard deviation (SD) on two subscales of 3 variables each making 6 items or variables
of airline staff friendliness, confidence in airline services and offerings, fulfillment of
obligation such as on-board services, treats customer as a friend and business partner,
professional in handling complaints and recommendation of the airline to others. The
sample size (N=337) remains the same for all the items.
Table 5.8: Relationship Marketing as Measured by CRS
Description of variable N M SD
Airline staff are committed to service delivery 337 4.09 0.881
Confidence in services and offerings 337 3.80 0.943
Fulfils obligation such as on-board service 337 4.01 1.000
Airline treat me like a friend and a partner 337 4.02 0.789
Friendly in handling my complaints 337 3.77 1.044
I will recommend my airline to others 337 4.09 0.889
Source: Field Survey, March, 2013.
From section „B‟ of CRS, the descriptive statistics in Table 5.9 for variables in airline
service quality (ASQ) construct showing the sample size (N), the mean (M) and the
standard deviation (SD) on 6 items namely; tangibles, responsiveness, safety and security,
empathy, reliability and assurance. Again the sample size (N=337) remains the same.
University of Ghana http://ugspace.ug.edu.gh

95
Table 5.9: Airline Service Quality as Measured by CRS
Description of variable N M SD
Airline staff appearance 337 4.25 0.827
Timely response to complaints 337 4.12 0.887
Safety and security 337 4.28 0.949
Empathy with baggage handling 337 4.13 0.879
Departure and arrival time is reliable 337 4.01 0.886
Service delivery accuracy 337 4.02 0.887
Source: Field Survey, March, 2013.
From section “B” of CRS, the descriptive statistics in Table 5:10 for airline switching
barriers depicts the sample size (N), the mean (M) and the standard deviation (SD) on 4
variables based on the frequent flyer programs (FFPs) offered by airlines namely; FFPs
availability, customer appreciation, retention and loyalty. The sample size (N = 337)
remains the same for all variables.
Table 5.10: Airline Switching Barrier as Measured by CRS
Description of variable N M SD
Availability of FFPs 337 3.78 0.944
Appreciation for FFPs 337 3.81 1.008
Potential of FFPs to keep customers 337 4.34 0.882
Loyalty to airline irrespective of fares 337 3.93 1.113
Source: Field Survey, March, 2013
From section „B‟ of CRS , the descriptive statistics in Table 5.11 service recovery displays
the sample size (N), the mean (M) and the standard deviation (SD) on 3 variable; courtesy
University of Ghana http://ugspace.ug.edu.gh

96
in handling complaints, satisfaction with recovery strategy and potential of recovery
strategy to keeping customers.
Table 5.11: Service Recovery as Measured by CRS
Description of variable N M SD
Professional in handling service failures 337 4.14 1.012
Satisfaction with service recovery 337 4.18 0.933
Recovery strategy can keep customers 337 4.33 0.926
Source: Field Survey, March, 2013
5.10 Assessment of Normality of Regression of Variables
This aspect of the analysis also known as the summated scale examines the normality of
the constructs for the regression using the skewness and kurtosis test to ensure that there is
no violation whatsoever of any regression rule before you proceed. As depicted on table
5.12, all the four main constructs namely; RM, ASQ, ASB and SR) met the assumption as
far as the skewness and kurtosis criteria is concerned as of ±1 and ±3 as stated by DeCarlo
(1997).
Table 5.12: Skewness and Kurtosis Test for Normality
Constructs Skewness Kurtosis
RM 0.104 0.098
ASQ 0.355 0.119
ASB 0.99 0.284
SR 0.233 0.110
CR 0.133 0.190
Source: Field Survey, March, 2013
University of Ghana http://ugspace.ug.edu.gh

97
5.11 Assessing the level of correlation between variables
To have a better understanding of the relationship that exist between the predictor variable
customer retention (CR) and the four main independent variables or constructs (RM, ASQ,
ASB and SR) a Pearson Product-Moment Correlation Matrix was constructed. This is
illustrated in table 5.13 below. Drawing from the table it is evident that all the independent
variables have a positive relationship with the dependent variable (CR). It can also be
observed that ASQ is the highest correlated construct with the dependent variable CR with
a Pearson (r) value of 0.65 followed by ASB (r =0.60) and the least correlated construct is
RM with (r =0.50).
Table 5.13: Pearson Correlation Matrix
RM ASQ ASB SR CR
RM 1.0000 0.5518 0.0801 0.3781 0.5018
ASQ 1.0000 0.1422 0.4556 0.6508
ASB 1.0000 0.2416 0.6096
SR 1.0000 0.5818
CR 1.0000
Source: Field Survey, March, 2013
5.12 Checking Variables for the presence of Multicollinearity
One major assumption for multivariate analysis is that there should be no or better still a
minimum presence of multicollinearity. Multicollinearity is a diagnostic test in
multivariate regression whereby two or more independent variables in a multiple
regression tend to correlate highly against each other or turn to explain each other. The
Correlation Matrix shown above can also be used to detect multicollinearity. Another way
of detecting it is by conducting the Variance Inflation Factor (VIF) test. The VIF test
University of Ghana http://ugspace.ug.edu.gh

98
detects multicollinearity by showing to what extent individual independent variables
inflate the variances in the regression. For the purposes of this study, a tolerance or
acceptance level of 10% or 0.1 is adopted which is line with that Neter et al., (1989)
recommended. This means that the four construct have VIF of less than 10. I can
confidently say that the model is devoid with the problem of multicollinearity and can
therefore meet the multivariate assumption of no or minimal multicollinearity among the
predictor variables in any regression model. Table 5.14 below displays an assessment of
multicollinearity.
Table 5.14: Assessment of Multicollinearity
Variable VIF
RM 1.08 0.93
ASQ 1.78 0.56
ASB 1.56 0.64
SR 1.27 0.79
Mean VIF 1.42
Source: Field Survey, March, 2013
5.13 Reliability of the Constructs
In testing for reliability, one is doing an assessment of the degree of consistency between
the variables (Hair et al., 2006). The most popular measure of reliability assesses the
Cronbach‟s Alpha. This measures reliability coefficient of the level of consistency of the
entire scale. The generally agreed lower limit for the alpha value is 0.70 or 70% degree of
consistency of reliability (Robinson, (1991). Nunnally, (1978) also proposes that a lower
limit of 0.60 is acceptable.
University of Ghana http://ugspace.ug.edu.gh

99
In this study, all the four constructs have alpha values more than 0.70 with ASQ having
the highest alpha value and SR having the lowest value. This is shown in table 5.15 below.
Based on the acceptable limits proposed by both Robinson, (1991) and Nunnally, (1978), I
can confidently conclude that the constructs used in this are all very reliable. This clearly
illustrated in the table below.
Tables 5:15: Reliability Test with the Cronbach’s Alpha
Construct Cronbach’s Alpha No. of items
RM 0.78 6
ASQ 0.84 6
ASB 0.81 4
SR 0.79 3
CR 0.72 2
Source: Field Survey, March, 2013
5.14 Regression Analysis
The standard multiple regression is a multivariate data analysis tool that enables the
researcher to relate one or more variables (independent) in a study to another variable
(dependent) in order to establish the relationship that exist between them. It also explains
how well a predictor variable contributes to the dependent variable. Taking this study into
consideration, the researcher sought to investigate the causal relationship between RM,
ASQ, ASB and SR and how best each of the four constructs is significantly associated
with customer retention in the airline industry in Ghana. This is illustrated in table 5.16
below.
University of Ghana http://ugspace.ug.edu.gh

100
Table 5.16: Regression Model for Customer Retention Strategies
Variable Coef. Std. Error t P> |t|
RM 0.125 .0.075 6.56 0.000***
ASQ 0.485 0.667 9.06 0.000***
ASB 0.365 0.216 8.68 0.000***
SR 0.1504 0.028 6.44 0.000***
Note: Dependent Variable is CR; ***denotes significance level at 0.01
Source: Field Survey, March, 2013.
From table 5.16, all the independent variables (RM, ASQ, ASB and SR) are statistically
significant in explaining the customer retention rate in the airline industry at 0.01
significance level (p-value =0.01).
From the table 5.16 it can be deduced that a unit increase in RM will result in 0.13 unit
increase in CR. For ASQ, a unit increase will result in 0.49 unit increase (i.e. 49%) in
customer retention in the airline industry. With regards to ASB we can infer that a unit
increase will positively affect airline customer retention by 37%. As far as SR is
concerned an increase will result in 0.15 unit increase in CR.
To assess the model fit, the R2 value from the regression model is used. This explains the
extent of variation that exists between the dependent variable (CR) and the independent
variables (RM, ASQ, ASB and SR). Therefore in this case our R2 value is 0.68. This can
also be interpreted as 68% of the variation in CR is being explained by the predictor
variables. Based on the fact that all the variables significantly contribute to customer
retention the CR equation model can be written as:
University of Ghana http://ugspace.ug.edu.gh

101
5.15 Discussion of Major Findings
The main purpose of this study is to ascertain the relationship between customer retention
and four main constructs with a number of variables included in them. The construct are
RM, ASQ, ASB and SR which are used as used as strategies to determine the extent of
association they have on airline customer retention. From the analysis so far, it is
abundantly clear that all the four constructs have positive association with customer
retention in the airline industry. This is discussed below taking into consideration works
done in relation to extant literature.
5.15.1 Relationship between Relationship Marketing and Customer Retention
The study sought to test the extent of association between RM and CR. In literature, RM
means the establishment of a long-term relationship that involves social bonds,
commitment and trust, and complaint management which are all used as variables under
RM in this study (Sin et al., 2005). The results show that, there is positive relationship
between RM and CR. The import of this on the airline industry is that, owing to the
proliferation of airlines into the country in recent times, it makes good reason for airlines
to build stronger relationships through good complaint handling processes, customer
service and building social bonds in order to guarantee continuous and repeat patronage.
This confirms research findings that state that a RM strategy can improve relationships
with customers hence culminate in customer satisfaction and loyalty and subsequently
retention (Colgate &Danaher, 2000; Huang & Lin, 2005 and Shafia et al., 2011)
University of Ghana http://ugspace.ug.edu.gh
102
5.15.2 Relationship between Airline Service Quality and Customer Retention
An avalanche of literature reported a positive significant relationship between Airline
Service Quality (ASQ) and Customer Retention. The study revealed that ensuring a good
service quality in the airline industry is a major prerequisite and a necessary precondition
for customer satisfaction and retention (Cronin & Taylor, 1992 & Taylor, Ekiz et al., 2006
and Baker 1994). This study made use of a modified SERVQUAL model developed by
Parasuranman et al., (1988) to include safety and security which is a major consideration
as far as the airline industry is concerned especially after the September 11, 2001 terrorist
attack. The results after running the regression clearly illustrate a positively significant
correlation between airline service quality and customer retention.
The result of the analysis is consistent with what is in literature which talks about service
quality being important and a prerequisite for customer retention (Ladhari et al., 2011 and
Berry & Parasuraman, 1991). The result of this study reiterated what is found in extant
literature that superior service quality reduces the rate of customer defection (Desouza,
1992), enhances customer loyalty hence retention (Cronin et al., 2000; Bauman et al.,
2007 and Wang et al., 2003).
Despite the fact that, Airline Service Quality is the single most significant predictor of
customer retention as far as this study is concerned, it is important to state that airline
professionals must constantly improve the various variables that are constituted in the
construct especially safety and security issues which is of paramount concern in the airline
industry. ASQ is therefore, the number one driver of customer retention in the airline
industry as indicated by the result of this study.
University of Ghana http://ugspace.ug.edu.gh

103
5.15.3 Relationship between Airline Switching Barriers and Customer Retention
With regard the relationship between switching barriers and customer retention in the
airline industry, the result as indicated in the regression model shows yet another positive
relationship between switching barriers and customer retention. But this positive
association nevertheless rejects the null hypothesis of this study which states that „the
higher the switching barrier, the lower the customer retention rate‟ and the alternate
hypothesis is accepted.
The result rather revealed otherwise which sought to explain that customers perceive
switching barriers as a driver of repeat business with airlines. Therefore retention in the
airline industry is dependent on the level of switching barriers airlines erect. The result
illustrates a rather direct relationship between Airline Switching Barrier and Customer
Retention. That is the higher the switching barriers the higher the customer retention rate.
This finding appears to be in tandem with existing and empirical studies found in
literature. Research conducted by Bansal & Taylor (1999); Jones et al., (2000); Gremler &
Brown (1996); Lee et al., (2001); Ranaweera & Prabhu (2003) and Valenzuela (2010) all
tested and confirmed the positive effect of switching barriers on customer retention.
In line with this study, ASB is the second most statistically significant construct variable
among the four strategies for customer retention in the airline industry apart from ASQ. It
presupposes that, airline industry professionals should consider focusing more attention on
erecting more barriers such as the frequent flyer programs (FFPs) and forming network of
global alliances with other airlines to make airlines interlining possible.
University of Ghana http://ugspace.ug.edu.gh

104
5.15.4 Effect of Service Recovery on Customer Retention
The result of the regression demonstrates a positive correlation between Service Recovery
as a strategy for customer retention. This means that service failure does not necessarily
negatively affect repurchase intentions but the recovery strategies instituted to recover the
failure. This statement is in line with existing research by Lewis, (2004); Smith et al.,
(2003). These empirical findings conform to theses research findings and therefore
provides a solid basis for generalization that service recovery has a positive impact on
customer retention in the airline industry.
5.16 Analysis of data to test Hypothesis
This section reports the use of Pearson product-moment correlation coefficient to test the
research hypothesis to determine associations and relationships between the independent
variable (Relationship Marketing) and the dependent variable (customer retention). All the
hypotheses were tested at the 0.01 significance level.
Hypothesis 1:
Relationship Marketing is significantly related to Customer Retention.
In order to determine whether the results of the analysis support the first a priori
hypothesis, a bivariate correlation (that is the Pearson product-moment correlation
coefficient) was conducted to determine the relationship between relationship marketing
and customer retention. Preliminary analyses were performed to ensure no violation of the
assumption of normality, linearity and homoscedasticity.
The result of the analysis from Table 5.17 indicates a large (Cohen 1988), positive and
significant correlation between the two variables (r = 0.49, N = 337, p < 0.01). Therefore,
based on the results of the analysis conducted, the first a priori hypothesis supported and
therefore accepted.
University of Ghana http://ugspace.ug.edu.gh

105
Table 5.17: Association between relationship marketing and customer retention
Correlation Relationship Marketing
Customer Retention
Pearson Correlation 0.487**
Sig. (2-tailed) 0.000
Sample size (N) 337
** Correlation is significant at the 0.01 level (2-tailed).
Hypothesis 2:
There is significant positive relationship between Airline Service Quality and Customer
Retention Rate.
In order to determine if the results of the analysis support the second a priori hypothesis, a
bivariate correlation (with Pearson product-moment correlation coefficient) was conducted
to determine the relationship between airline service quality and customer retention as
measured by the likert scale of 1 to 5 with 1 indicating strongly disagree, 2 disagree, 3
uncertain, 4 agree and 5 strongly agree. Preliminary analyses were performed to ensure no
violation of the assumption of normality, linearity and homoscedasticity.
The result of the analysis from Table 5.18 indicates a large (Cohen 1988), positive and
statistically significant correlation between the two variables (r = 0.62, N = 337, p =
0.01), with high scores of airline service quality being associated with customer retention
hence the higher the airline service quality the higher the customer retention rate.
Therefore based on the results of the analysis conducted, the second a priori hypothesis is
supported and therefore accepted.
University of Ghana http://ugspace.ug.edu.gh

106
Table 5.18: Association between Airline Service Quality and Customer Retention
Correlation Airline Service Quality
Customer Retention
Pearson Correlation 0.615**
Sig. (2-tailed) 0.000
Sample size (N) 337
** Correlation is significant at the 0.01 level (2-tailed).
Hypothesis 3:
The higher the Switching Barriers the lower the Customer Retention Rate.
In order to determine if the study supports the third a priori hypothesis, a Pearson product-
moment correlation matrix was conducted to determine the extent of the relationship
between switching barrier and customer retention.
The result of the analysis shown in table 5.18 below indicates a large (Cohen, 1988)
positive and statistically significant relationship (r =0.058, N=337, p>0.000) between the
two variables.
Therefore based on the results of the analysis conducted, the third a priori hypothesis is
not support whiles the alternate hypothesis is accepted which states that the higher the
switching barrier, the higher the customer retention rate. The rejection of the null
hypothesis is explained by the fact that erecting barriers to prevent customers from
switching to competitors can actually lead to customer retention.
University of Ghana http://ugspace.ug.edu.gh

107
Table 5.19: Association between Airline Switching Barrier and Customer Retention.
Correlation Airline Switching Barriers
Customer Retention
Pearson Correlation 0.587**
Sig. (2-tailed) 0.000
Sample size (N) 337
** Correlation is significant at the 0.01 level (2-tailed).
Hypothesis 4:
There will be a significant relationship between service recovery and Customer Retention.
In order to determine if the results of the analysis support the first a priori hypothesis, a
bivariate correlation (with Pearson product-moment correlation coefficient) was conducted
to determine the relationship between service recovery and customer retention.
Preliminary analyses were performed to ensure no violation of the assumption of
normality, linearity and homoscedasticity. The result of the analysis from Table 5.19
indicates a large (Cohen, 1988), positive and significant correlation between the two
variables (r = 0.52, n = 337, p<0.000). Therefore, based on the results of the analysis
conducted, the fourth a priori hypothesis is supported.
Table 5.20: Association between Service Recovery and Customer Retention
Correlation Service Recovery
Customer Retention
Pearson Correlation 0.526**
Sig. (2-tailed) 0.000
Sample size (N) 337
** Correlation is significant at the 0.01 level (2-tailed).
University of Ghana http://ugspace.ug.edu.gh
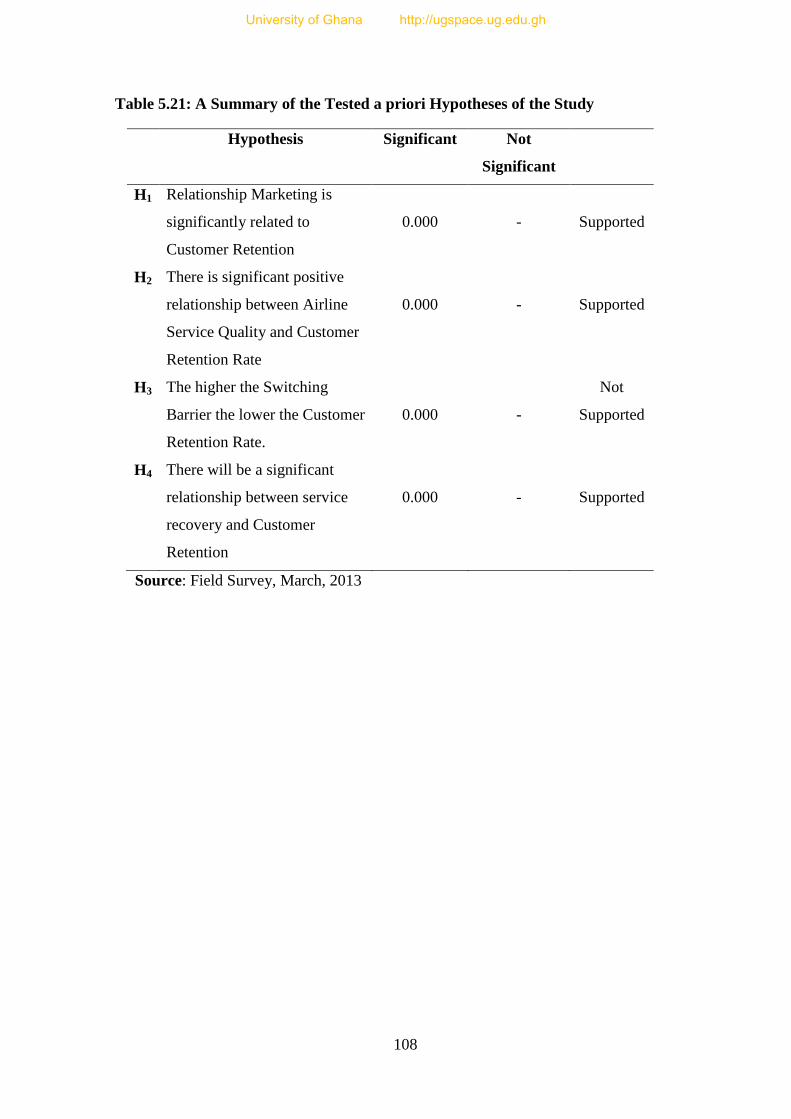
108
Table 5.21: A Summary of the Tested a priori Hypotheses of the Study
Hypothesis Significant Not
Significant
H1 Relationship Marketing is
significantly related to
Customer Retention
0.000
-
Supported
H2 There is significant positive
relationship between Airline
Service Quality and Customer
Retention Rate
0.000
-
Supported
H3 The higher the Switching
Barrier the lower the Customer
Retention Rate.
0.000
-
Not
Supported
H4 There will be a significant
relationship between service
recovery and Customer
Retention
0.000
-
Supported
Source: Field Survey, March, 2013
University of Ghana http://ugspace.ug.edu.gh

109
CHAPTER SIX
SUMMARY, CONCLUSIONS AND RECOMMNDATIONS
6.0 Introduction
This study employs quantitative research method to explain the extent of impact and
relationship that exist between customer retention strategies in the airline industry in
Ghana. The study identifies a set of four proximate customer retention strategies known in
this study as constructs in the airline industry that potentially influence the level of
customer retention and repurchase intention of customers in the airline industry. This last
chapter summarizes the major findings and implications of the study and also highlights
striking revelations and lessons drawn from the study which will guide the conclusions
which would be drawn based on the interpretation of output result of the study and related
literature reviewed. This chapter concludes by proffering suggestions and
recommendations for further research.
6.1 Summary
In today‟s increasingly competitive and volatile business environment like that of the
airline industry, customer retention has become an ideal goal and has therefore become the
lifeblood of every organization. It is therefore of prime importance for airline
professionals to identify and have a better understanding of the factors that drive customer
retention and adopt them in order to prevent customers from defecting to competitors. This
study dwell more on existing literature and developed a research model aimed at
identifying the extent of association and relationship that exist between the four
independent variable constructs of (RM, ASQ, ASB and SR) and customer retention (CR)
as the dependent variable.
University of Ghana http://ugspace.ug.edu.gh

110
6.2 Major Findings
Objective I
The first and foremost objective of this study is to find out whether Relationship
Marketing significantly associates with customer retention. A multiple regression model
was employed to test how the four variables found in the RM construct influence airline
customers‟ repurchase decisions of a continual patronage of airlines services in Ghana.
The result of the analysis clearly revealed that there is positive significant relationship
between RM and customer retention. The meaning here is that retentions strategies such as
long term relationship through commitment, trust, social bonds and complaint handling
processes all determine the propensity of the customer to be retained.
Objective II
The second objective of this study sought to investigate the correlation between airline
services quality and customer retention. Literature clearly indicated airline service quality
as a necessary precondition for retaining customers (Taylor & Baker 1994). This study
used a modified SERVQUAL model of tangibles, reliability, responsiveness, assurance,
empathy and safety and security which together constitute the Airline Service Quality.
An analysis of the regression model depicts clearly that Airline Service Quality has a
positive significant relationship with customer retention in the airline industry in Ghana. It
can confidently be stated that Airline Service Quality result in customer retention in the
airline industry.
Objective III
The third research objective was to determine whether switching barrier significantly
relates to customer retention in the airline industry in Ghana. The findings of the
regression model portray a positive statistically significant effect of airline switching
University of Ghana http://ugspace.ug.edu.gh

111
barrier on customer retention. The study revealed that interpersonal relationships, frequent
flyer programs (FFPs) and airline global alliance shows a strong correlation with customer
retention in the airline industry. Industry professionals must carefully watch out on
erecting barriers to prevent customers from switching to their competitors. It is reasonable
to put forward the idea that the higher the switching barrier, the higher the customer
retention rate.
Objective IV
The last objective of this study sought to explore if service recovery significantly
correlates with customer retention. Using the multiple regression statistical tool, it has
been established that, service recovery significantly correlate with customer retention. The
key findings revealed in this study that service failure in itself is not the issue per se, but
the strategy instituted to recover the service failure is what is of paramount importance to
customers. A well recovered service failure can engender satisfaction, repurchase
intentions hence customer retention.
6.3 Conclusion
Extant literature is replete with researches that emphasize the importance of customer
retention in the life of an organization. This study however, has developed and built a
comprehensive but integrative framework which works independently or collectively to
influence customer retention in the airline industry. The study also formulated hypothesis
based on literature reviewed. The study developed four constructs namely (RM, ASQ,
ASB and SR) that has a positive statistical significance with customer retention.
Consistent with existing findings, the study revealed that these four constructs are
antecedents or are a necessary precondition for customer retention to occur in the airline
industry in Ghana. In addition, the study also revealed that all the four constructs are
University of Ghana http://ugspace.ug.edu.gh

112
positively associated with customer retention. However, both ASQ and ASB are the two
most statistically significant contributors to customer retention. Firms must therefore focus
more of their attention and investments on service quality issues as well erecting more
barriers to prevent customers from switching to their competitors.
From the foregoing discussion and analysis so far, it is reasonable to conclude that,
airlines can only survive in today‟s competitive but volatile business environment when
they pay particular attention to the effective implementation and monitoring of the four
strategies to ensure their continued use and application to guarantee customer retention
and overall profitability of airlines.
6.4 Recommendations and Suggestion for Further Studies
As it pertains to all original researches, replication of this study would serve as a guide and
a check on the reliability and generalizability of present findings. Beyond mere
replication, however, the findings from this study suggest several promising directions for
future research.
Researchers may wish to extend this study by undertaking more detailed analysis of the
predictors used in this study that are found to be an important determinant of customer
retention. To this end, Relationship Marketing, Airline Service Quality, Airline Switching
Barriers, and Service Recovery all are significantly associated with customer retention. It
is therefore highly recommended that researchers and airlines alike should endeavor to
concentrate their attention on these strategies to ensure their continued existence.
Considering the importance of employee satisfaction in ensuring customer retention, an
analysis of the impact of employee satisfaction on customer retention for further study is
worth researching.
University of Ghana http://ugspace.ug.edu.gh

113
6.5 Recommendation to industry for practice and policy making
The study indicated that two predictor variables of Airline Service Quality and Airline
Switching Barriers are the most significant and therefore industry professionals should
focus more of their attention and resources on these two predictor variables so as to be
ahead of the competition. Furthermore, in light of the undeniable strength of Airline
Service Quality, it would be very useful for airline professionals to take safety and security
issues very seriously because it was ranked by respondents sampled as the most significant
and the most important factor in the choice of which airline to travel with and also among
the six airline service quality variables and also based on the fact that it has attracted much
attention in recent times in the wake of the infamous September 11, 2001 terrorist attack.
University of Ghana http://ugspace.ug.edu.gh

114
REFERENCES
.Agudze-Tordzro, K. (2012). Customer Retention Strategies in the banking sector: A case
of Ghanaian Banks. Unpublished Mphil Thesis, university of Ghana Business
School, Legon.
Ahmad, R., & Buttle, F. (2001). Customer retention: A potentially potent marketing
strategy, Journal Strategy Marketing, 9, 29-45.
Ahmad, S. (2002). Service failures and customer defection: a closer look at online
shopping experiences. Managing Service Quality, 12(2)19-29.
Ahmed, R., & Buttle, F. (2002a). Retaining telephone banking customers at the Frontier
Bank Intenation. Journal of Bank Marketing, 20 (1), 5-16
Ahmed, R., & Buttle, F. (2002b). Customer retention management, a reflection of theory
and practice: Marketing Intelligence and planning, 20(3),144-161.
Allen, N. J., & Meyer, J. P. (1990). The measurement of antecedents of affective,
continuous and normative commitment to the organization. Journal of
occupational Psychology, 63, 1-18
Amarantunga, D., Baldry, D., Sarshar, M., & Newton, R. (2002). Quantitative and
Qualitative research in built environment; application of mixed research
approach, Work Study, 54(1), 17-31
American Marketing Association (2004) . Journal of Public Policy and Marketing Vol.
26. No. 2 (Fall, 2007).
Anderson, E. & Weitz, B. (1992). The Use of Pledges to Build and Sustain Commitment
in Distribution Channels. Journal of Marketting Research, Chicago, 29(1), 18-34.
Anderson, E. W., & Sullivan, M. W. (1993). The Antecedents and Consequences of
Customer for Firms, Marketing Science, 12 (2), 125-143.
Andreassen, T. W. (2001). “From disgust to delight: do customers hold a grudge?”
Journal of Service Research, 4(1),39-49.
Ang, L., & Buttle, F. (2006). Customer retention management processes: A quantitative
study. European Journal of Marketing, 40(2), 83-99.
Appiah-Adu, K. (1999). Marketing Effectiveness and Customer Retention in the Service
Sector”.The Service Industry Journal, 19 (3), 26-41.
Appiah-Adu, K., Fyal, A., & Singh, S. (2000). Marketing culture and customer retention
in the tourism industry. The Service Industry Journal. 20, 95-113.
University of Ghana http://ugspace.ug.edu.gh

115
Arko, C. E. (2006). Providing quality customer service in a financial institution: A case of
ECOBANK Ghana Limited Unpublished MBA Long Essay, University of Ghana,
Legon.
Aspinall, E., Nancarrow, C. & Stone, M. (2001). The meaning and measurement of
customer retention. Journal of Target Measurement and Analytical Marketing 10
(1), 79-87.
Bagozzi, R. P. (1994). Principles of Marketing Research. Cambridge, MA: Blackwell
Publishers.
Bansal, H. S. & Taylor, S. F. (2002) Investigating interactive effects in the theory of
planned behavior in a service-provider switching context. Psychology and
Marketing, 19, 407-425.
Bejou, D., & Palmer, A. (1998). Service failure and loyalty: an exploratory empirical
study of airline customers‟, Journal of Services Marketing, 12(1), 7-22.
Bell, T. (1994) International Aviation Marketing Journal, 3 (1), 12-27.
Bendapudi, N., & Berry, L. L. (1997). Customer Motivations for maintaining relationships
with service providers, Journal of Retailing, 73(1),15-37.
Berry, L. L. (1983). Relationship Marketing. In Berry L.L Shostack G.L. and Upah G.D.
Emerging Perspectives on Services Marketing, American Marketing Association,
Chicago IL, Pg.25-28.
Berry, L. L., & Parasuraman, A. (1991). Marketing Services: Competing through quality.
Free Press, New York, NY.
Bhagawanani, R. (2000). Keeping the High Fliers Airline Business, June pp88-93
Bhote, K. R. (1996). Beyond Customer Satisfaction to Customer Loyalty, AMA
Management Briefing, New York, NY.
Bitner, M., Booms, B., & Tetreault, M. (1990). The Service encounter: Diagnosing
favorable and unfavorable incidents, Journal of Market. 54, 71-84.
Blattberg, R. C., Getz, G. & Thomas, J. S. (2001). Customer equity: Building and
managing relationships as valuable assets. Boston, Massachusetts: Harvard
Business School Press.
Blau, P. M. (1964). Exchange and Power in social life. New York. John Wiley and Sons.
Boshoff, C. & Leong, J. (1998). Empowerment, attribution and apologizing as dimensions
of service recovery: an experimental study. International Journal of Service
Industry Management, 9(1),24-47.
University of Ghana http://ugspace.ug.edu.gh

116
Boshoff, C. A., & Klemz, R. B. (2005). The importance of doing it right the second time:
two experimental studies of service recovery. Paper presented at Southern Africa
Institute for Management Scientists Conference, Bloemfontein.
Boshoff, C., & Staude, G. (2003). Satisfaction with service recovery: its measurement and
its outcomes. S. Afr.J.Bus. Manag. 34(3), 9-6.
Bowen, J. T., & Shoemaker, S. (1998). Loyalty: A strategic commitment. Cornell Hotel
and Restaurant Administration Quaterly. 39(1),12-25, February.
Brown, S, 1997, Service recovery through IT. Complaint handling will differentiate firms
in the future. Marketing Management , 25-27.
Brown, S. W., Cowles, D. L., & Tuten, T. L. (1996). Service Recovery”: Its Value and
Limitations as a Retail Strategy, International Journal of Service Management, 7
(5), 32-46.
Buckinx, W., & Van den Poel, D. (2005). Customer base analyses: partial defection of
behaviorally loyal clients in a non-contractual FMCG retail setting. European
Journal of Operational Research, 164, 252-268.
Burnham, T. A., Frels J. K. &Mahajan, V. (2003). Consumer Swithcing Cost a typology
antecedents and Consequences. Journal of Acdemy of Marketing Science, 31(2),
109-126.
Burton, J., & Hanlon, P. (1994). Airline Alliance: Cooperating to Compete? Journal of Air
Transport Management, 1(4), 209-227.
Buttle, F. (2004). Customer Relationship Management: Concepts and Tools, Elsevier,
Oxford.
Buttle, F., Ahmad, R., & Aldlaigan, A. (2002). The Theory and Practice of Customer
Bonding. Journal of Business-to-Business Marketing, 9 (2),3-27.
Carroll, P., & Rose, S. (1993). Revisiting Customer Retention. Journal of Retail Banking
15 (1), 5-13.
Chan, D. (2000). The development of the airline industry from 1978 to 1998. A strategic
global overview. Journal of Management Development, 19 (6), 489-514
Choi, T. & Chu, R. (2001). Determinants of hotel guests‟ satisfaction and repeat patronage
in the Hong Kong hotel industry. International Journal of Hospitality
Management, 20(3),277-297.
Christopher, G., Michael, D. C., Tzu-Hui K. & Michelle, C. (2008). “An empirical
analysis of customer satisfaction in international air travel. Innovative Marketing
4(2), 49-62.
University of Ghana http://ugspace.ug.edu.gh
117
Christopher, M., Payne, A., & Ballantyne, D. (1991). Relationship Marketing,
Butterworth-Heinemann, Oxford.
Christopher, M., Payne, A., & Ballantyne, D. (1993). Relationship Marketing.
Butterworth-Heinemann, Oxford.
Christopher, M., Payne, A., & Ballantyne, D. (2002). Relationship marketing: creating
stakeholder value. Oxford: Butterworth Heinemann.
Churchill, C. (1979). A paradigm for developing better measures of marketing constructs.
Journal of Marketing Research. 16, 64-73.
Clark, M. (1997). Modelling the impact of customer-employee relationships on customer
retention rates in a major UK retail bank. Management Decision, 35(4), 293-301.
Clifford Y., Cunningham, L., & Moom Kyu L. (1994) Assessing Service Quality as an
effective management tool the case of the airline industry, Journal of Marketing
Theory and Practice, Spring pp76-96.
Cohen, J. (1988). Statistical power analysis for the behavioral sciences 2nd
Ed. Hillsdale,
New Jersey. Lawrence Erlbaum Associates Publishers.
Cohen, M.D Gan, C. Yong, H. H. A., & Choong, E. (2006). Customer Satisfaction: A
study of bank customer retention in New Zealand. Commerce Division, Discussion
Paper No. 109 Lincoln University, Canterbury.
Colgate M., Stewart, K., & Kinsella, R. (1996). Customer defection: a study of the student
market in Ireland. International Journal Bank Marketing, 14 (3),23-29.
Colgate, M., & Danaher, P. J. (2000). Implementing a Customer Relationship Strategy:
The Asymmetric impact of Poor Versus Excellent Execution. Journal of Academic
Marketing Science, 28(3), 375-387.
Colgate, M., & Hedge, R. (2001). An investigstion into the switching process in retail
banking services. International Journal of Bank Marketing. 19 (5), 201-212.
Colgate, M., & Lang, B. (2001). Switching barriers in consumer markets: an investigation
of the financial services industry, Journal of Consumer Marketing, 18 (4), 332-
347.
Colgate, M., & Norris, M. (2001). Developing a comprehensive picture of service failure.
International Journal of Service Industry Management, 12(3),215-233.
Cooper, D. R, & Schindler, P. S. (2001). Business Research Methods (7th
Ed) McGraw-
Hill Irwin, New York, NY.
University of Ghana http://ugspace.ug.edu.gh

118
Covielo, N. E., Brodie, R. J., Danaher, P. J., & Johnston, W. J. (2002). How Firms Relate
to their Markets: An Empirical Examination of Contemporary Marketing Practices.
Journal of Marketing, 66(3),33-46.
Cranage, D. (2004). Plan to do to right: and plan for recovery. International Journal of
Contemporary Hospitality Management, Vol.16 No.4 pp. 210-219.
Cranage, D. (2004). Plan to do to right: and plan for recovery. International Journal of
Contemporary Hospitality Management, 16(4),210-219.
Credle, F. E. (1995). Want to increase profits? Stop customer defections! Quality progress,
[online], June. Available: [http://www.proquest.umi.com] (accessed 13 December
2002).
Creswell, J. W. (2008). Research Design: Qualitative, Quantitative and Mixed Methods
Approaches. 3rd ed. Thousand Oaks, CA: Sage.
Cronin, J. Brady, M. K, & Hult, G. (2000). Assessing the effects of quality, value and
customer, behavioral intentions in service in service environment. Journal of
Retailing, 76 (2),193-218.
Cronin, J. J. & Taylor, S. A. (1994). “SERVPERF vs SERVQUAL”; Reconciling
Performance Based and Perception – Minus – Expectation Measurement of
Service Quality. Journal of Marketing, 58, 125-31.
Customer Focus across the Firm. (5th
Ed), McGraw-Hill, New York, NY.
Cziepiel, J. A. (1993). “Service Encounters and Service Relationships: Implications for
Research, January, 13-21
Dabholkar, P. A., Thorpe, D. & Rentz, J. (2000). A Measure of Service quality for
retailing stores: Scale development and Validation. Journal of the Academy of
Marketing Science, 24 (1), 3-16
Daniell, A. (2000). The Myth of Cross Selling, American Banker, Vol.165 No. 53.
Dawkins, P. M. & Reichheld, F. F. (1990). Customer Retention as a Competitive Weapon,
Directors and Board, 14, 42-47.
Dawling, G., & Staelin, R. (1994). A model of perceived risk and intended risk-handling
activity, Journal of Consumer Research, 21(1),119-134.
DeCarlo, T. L. (1997). On the Meaning and Use of Kurtosis, Psychological Methods, 2
(3), 292-307.
Desai, K. K., & Mahajan, V. (1998). Strategic Role of Affect-Based Attitudes in the
Acquisition, Development and Retention of Customers. Journal of Business
Research, 42, 309-324.
University of Ghana http://ugspace.ug.edu.gh
119
DeSouza, G. (1992). Designing a customer retention plan, Journal of Business Strategy,
March/April: 24-28.
Dick, A. S., & Basu, K. (1994). Customer Loyalty: Towards an integrated conceptual
framework. Journal of the Academy of Marketing Science. 22 (2), 99-113.
Dove, D. W., & Robinson, D. (2002). Mind that back door while you greet new customers.
American Banker, [online] August, 22. Available: [http://www.proquest.umi.com]
(accessed 13 December 2002).
Dowling, R., & Uncles, M. (1997). Do Customer Loyalty Programmes Really Work?”
Sloan Management Review, 71-82.
Drucker, P. (1963). The Practice of Management, Heinmann, London.
Eccles, G., & Durand, P. (1998). Complaining customers, service recovery continuous
improvement, Managing Service Quality, 8(1), 68-71.
Egan, J. (2004) Relationship Marketing: Exploring Relational Strategies in Marketing.
Pearson Education, London.
Egan, J. (2004) Relationship Marketing: Exploring Relational Strategies in Marketing.
Pearson Education, London.
Ekiz, E., Halil, N., Hussain, K., & Erdogan H. (2008). An investigation on the factors
influencing passengers”. Loyalty in the North Cyprus national airline. The TQM
Journal, 20(3), 265-280
Ellram, L. M. (1995). Total cost of ownership: An analysis approach for purchasing.
International Journal of Physical Distribution and Logistics Management, 25
4-23.
Ennew, C. T., & Binks, M. R. (1996). The impact of Service Quality and Service
Characteristics on Customer Reention: Small Business and their Banks in the UK.
British Journal of Management, 7, 219-230.
Evans, M. (2002). Prevention is better than cure: redoubling the effort on customer
retention. Journal of Financial Services Marketing, 7 (2), 186-98.
Fisher, A. (2001). Winning the Battle for Customers. Journal of Financial Services
Marketing, 6(1), 77-84.
Fodness, D., & Murray, B. (2007). Passengers‟ Expectations of airport service quality.
Journal of Service Marketing. 21 (7),492-506.
Fornell, C. (1992). A National Customer Satisfaction Barometer: The Swidish Experience.
Journal of Marketing, 56, 77.
University of Ghana http://ugspace.ug.edu.gh

120
Fornell, C., & Wernerfelt, B. (1987). Defensive Marketing Strategy by Consumer
Complaint Management: A Theoretical Analysis. Journal of Marketing Research,
24(4), 337-346.
Ganesh, J., Arnold, J. M., & Ryenolds, K. E. (2000). Understanding the customer base of
service providers: an examination of the differences between stayers and switchers.
Journal of Marketing, 64 (3), 65-78.
Ganguli, S., & Roy, S. K. (2011) Generic technology-based service quality dimension in
banking: Impact on customer satisfaction and loyalty. International Journal of
Bank Marketing, 29(2),186-189.
Garland, R. (2002). Estimating customer defection in personal retail banking.
International Journal of Bank Marketing, 20(7), 317-324.
Geyskens, I., Steenkamp L. and Kumar, N. (1996). The effects of trust and
interdependence on relationship commitment: Transatlantic Study. International
Journal of Research in Marketing, 13(4), 303-317.
Ghana Airport Company Limited (2012). “Business, Travel and Flight Information
Journal”. April, 2012.
Ghana Civil Aviation Authority. (1996) Profit Plan.
Ghana Statistical Service, (2010). Population and Housing Census.
Gibb, S. (1998) Exploring Career Chaos: Patterns of Belief. Career Development
International, 3(4),149-153.
Gilbert, D., & Wong, R. K. (2002). Passenger expectations and Airline Services: A Hong
Kong based study. Tourism Management
Gordon, I. (1998). Relationship Marketing. John Wiley, Etobicoke.
Gremler, D. D. (1995). The Effect of Satisfaction, Switching costs, and interpersonal
bonds, on service loyalty. Unpublished Dissertation, Arizona State University.
Gremler, D. D., & Brown, S. W. (1996). Service Loyalty: Its Nature, Importance, and
Implications in Edwardson, B., Brown, S.W. & Johnston R. Advancing Service
Quality: A Global Perspective, International Service Quality Association, pp.171-
180.
Gronhaug, K., & Gilly, M. C. (1991). A transaction cost approach to consumer
dissatisfaction and complaint actions. Journal of Economic Psychology, 12,165-
183.
University of Ghana http://ugspace.ug.edu.gh

121
Grönroos, C. (1990). Relationship marketing approach to the marketing function in service
contexts: the marketing and organizational behavior influence. Journal of Business
Research, 20(1), 3-12.
Gronroos, C. (2004). Service Management and Marketing: A Customer Relationship
Management Approach, 2nd
ed. John Wiley and Sons Ltd. Chickester.
Guiltinan, J. P. (1989) A classification of Switching Costs with implications for
relationship marketing.
Gummerson, E. (2006) “Implementing the market concept: from service and value to lean
consumption. Marketing Theory, 6, 291-293.
Gundlach, G. T., & Ernest, R. (1995). “Exchange Interdependence and interfirm
Interaction: Research in a Simulated Channel Setting: Journal of Marketing
Research, 31,516-532.
Gupta, S., Lehmann, D. R., & Stuart, J. A. (2004). Valuing Customers. Journal of
Marketing Research. 41, 7-19.
Guy, R. F., Edgley, C. E., Arafat, I. & Allen, D. E. (187). Social Research Methods;
Puzzles and Solutions, Allyu Newton, Massachusetts.
Hart, C,. Heskett, J. & Sasser, W. (1990). The profitable art of service recovery, Harvard
Business Review, 68 (4),148-57.
Healey, T. J. (1999). Why You Should Retain Your Customers. America’s Community
Banker, 8(9), 22-26
Hedrick, N., Berverland, M., & Minahan, S. (2007). An exploration of relational
customers‟ response to service failure. J. Serv. Mark. 21(1),64-72.
Heide, J. B., & Weiss, A. M. (1995). Vendor Consideration and switching behavior in
high-technology markets. Journal of Marketing,59,30-33.
Heskett, J. L., Jones, T. O., Loveman, G.W., Sasser, W. E., & Schlesinger, L. A., (1994).
Putting the Service-Profit Chain to Work. Harvard Business Review, pp.164-174.
Hess, J. (1995). Construction and Assessment of a Scale to measure consumer trust AMA.
Educators‟ Conference, Enhancing knowledge Development in marketing eds.
Stern B. B and Zinkhan, G. M., 6, 20 -25.
Hinson, R .(2006). Marketing of Services: A Managerial Perspective. Sedco Publishing
pp.1-8.
Hinson, R. Owusu-Frimpong, N. and Dasah, J. (2011). Key motivations for bank
patronage in Ghana. International Journal of Bank Marketing, 27(5), 381-399.
University of Ghana http://ugspace.ug.edu.gh
122
Hogan, J. E., Katherine, N. L., & Barak, L. (2003). What is the true value of a lost
Customer? Journal of Service Research, 5(3), 196-208.
Homans, G. C. (1961). Social Behaviour. New York: Harcourt, Brace and World.
International Air Transport Association (2011). March 2011 Industry Financial Forecast.
http://www.iata.org/whatwedo/documents/economics/industry-outlook-
march2011.pdf Date of access May 18 2011.
International Air Transport Association (2012). Economic briefing: The value added by
airlines. Available at www.iata.org/economic.
Ittner, C. D, & Larcker D. F. (1996). Measuring the Impact of Quality Initiatives on Firm
Financial Performance. In Advance in the Management of Organizational Quality,
Vol.1, JAI Press, Greenwich, CT,Pg.1-37.
Jackson, B. B. (1985). Winning and keeping Industrial Customers: The Dynamics of
Customer Relationships, Lexington, MA: D.C. Heath and Company.
Johns, N., Avci, T., & Karatepe, O. (2004). Measuring Service quality of travel agents:
evidence from Northern Cyprus. The Service Industries Journal, 24(3), 82-100
Johnston, R. (2001). Linking Complaints Management to Profit. International Journal of
Service Industry Management, 12(1),60-69.
Johnston, R., & Mehra, S. (2002). Best-Practice complaint management: Academy of
Management Executive, 16 (4),145-154
Jones, M. A., Mothersbaugh, D. L., & Beatty, S. E. (2002). Switching barriers and
repurchase intentions in services. Journal of Retailing, 76,259-274.
Keininggham, T. L., Cooil, B. Aksoy, L., Andreassen, T. W., & Weiner, J. (2007). The
value of different customer satisfaction and Loyalty metrics in predicting customer
retention, recommendation and share-of-wallet. Managing Service Quality. 17
(4),361-384.
Kelly, S. W., & Davis, M. A. (1984). Antecedents to customer expectations for service
recovery. Journal of the Academy of Marketing Science, 22(1),52-61.
Kim, M., Kliger, D., & Vale, B. (2004). Estimating Switching costs: the case of banking,
Journal of Financial intermediation, 12 (1), 25-56.
Kim, W.G., & Cha, Y. (2002). Antecedents and consequences of relationship quality in
hotel industry. Hospitality Management, 21, 321-328.
Kivetz, R., & Simmonson, I. (2003). The Idiosyncratic fit Heuristic: Effort Advantage
as a Determinant of Consumer Response to Loyalty Programs. Journal of
Marketing Research, (4th
Ed), 454-467.
University of Ghana http://ugspace.ug.edu.gh

123
Klemperer, A. (1987). The competiveness of markets with switching costs. Rand Journal
of Economics, 39, 138-50.
Kumar, N., Hibbard, J., & Stern, L. (1994). The Nature and Consequences of Marketing
channel intermediary commitment, MSI Working Paper, Report No94-115.
La, K.V., & Kandampully, J. (2004). Market orientated learning and customer value
enhancement through service recovery management. Managing Service Quality.
14(5),. 390-401.
Ladhari, R. Ladhari, I. and Morales, M. (2011), Bank service quality: comparing Canadian
and Tunisian customer perceptions. International Journal of Business & Industrial
Marketing, 29 (3), 224-246.
Lambert, D. M. (2009). Customer Relationship Management as a business process. A
journal of Business and Industrial Marketing, 25 (1), 417.
Lee J., Lee, J., & Feick, L.(2006). Incorporating word-of-mouth effects in estimating
customer lifetime value, the service quality perspective. Journal of Database
Marketing and Customer Strategy Management, 4(1), 29-39.
Lee, J., Lee J., & Feick, L. (2001). The impact of switching cost on the customer
satisfaction-loyalty link: mobile phone service in France. Journal of Services
Marketing, 15 (1), 35-48.
Levesque, T., & McDougall, G. (1996). Determinants of customer satisfaction in retail
banking.
Levis, B. R. & Mscann, P. (2004). Service failure and recovery: evidence from the hotel
industry; International Journal of Contemporary Hospitality management, 16 (1),
6-17.
Levitt, T. (1986). The marketing Imagination, Free press, New York.
Little, E., & Marandi, E. (2003). Relationship Marketing Management. Australia
Thomson.
Liu, T. C., & Wu, L. I. (2007). Customer retention and cross-buying in the banking
industry: An integration of service attributes satisfaction and trust, Journal of
Financial Service Marketing, 2,132-145.
Lorenzoni, N., & Lewis, B. R. (2004). Service recovery in the airline industry: A cross-
cultural comparison of the attitudes and behaviors of British and Italian front-line
personnel‟, Managing Service Quality. 141, 11-25.
Lovelock, C. and Wirtz, J. (2007). Services Marketing: People, Technology, Strategy. (6th
Ed), Pearson Prentice Hall, USA.
University of Ghana http://ugspace.ug.edu.gh

124
Magnini, V. P., Ford, J. B., Markowski, E. P., & Honeycutt, E. D. (Jr) (2007). The service
recovery paradox: justifiable theory of smoldering myth?. Journal Services
Marketing. 21 (3), 213-225.
Magnini, V.P. & Ford, J.B. (2004). Service failure recovery in China. International
Journal of Contemporary Hospitality management, 16 (5), 279-286.
Malhotra, N. K. (2007). Marketing Research: An applied approach (3rd
ed), Prentice Hall,
UK.
Marple, M., & Zimmerman, M. (1999). A Customer Retention Strategy, Mortgage
Banking, 59 (11), 45-50.
Martin-Consuegra, D., Molina A., & Esteban, A. (2007). An integrated model of price,
satisfaction and loyalty: An empirical analysis in the service sector. Journal
Product Brand Management. 16(7),459-468.
Matilla, A. S. (2001). The effectiveness of service recovery in a multi-industry setting.
Journal Service Marketing. 15 (7),583-596.
Mattila, A. S., & Cranage, D. (2005). The impact of choice on fairness in the context of
service recovery. Journal of Services Marketing. 19 (5), 271-279.
McAlexander, J. H., Kim S. K & Roberts S. D. (2003). Loyalty: the Influences of
Satisfaction and Brand Community Integration. Journal of Marketing Theory and
Practice, 1-11.
McDougall, G. H. G., &Levesque, T. J. (1999). Waiting for service: the effectiveness of
recovery strategies. International Journal of Contemporary Hospitality
Management. 11(1), 6-15.
McGivern, Y. (20060 „The Practice of Market and Social Research: An introduction (2nd
Ed) Prentice Hall, Great Britain.
Miller, J. L., Craighead, C.W., & Karwan, K. R. (2000). Service recovery: a framework
and empirical investigation. Journal of Operations Management, 18, 387-400.
Miller, J. L., Craighead, C.W., & Karwan, K. R. (2000). Service recovery: a framework
and empirical investigation. Journal of Operations Management, 18, 387-400.
Moorman, C., Deshpande, R., & Zaltman, G. (1993). Factors affecting trust in Market
research relationships. Journal of Marketing, 57, 81-101.
Morgan, R. M. & Hunt, S. D. (1994). The Commitment-Trust Theory of Relationship
Marketing, Journal of Marketing, 58 (3), 20-28.
University of Ghana http://ugspace.ug.edu.gh

125
Mostert, P. G., De Meyer, C. F., & Van Rensburg, L. R. The influence of service failure
and service recovery on airline passengers; relationships with domestic airlines: an
exploratory study. Southern African Business Review, 13, 2.
Nasir, S., & Nasir, V. A. (2005). Analyzing the role of customer-base differences in
developing customer relationship management strategies. Journal of American
Academy of business. Cambridge, 7 (2),32-38.
Natalisa, D., & Subrofo, B. (2003). Effect of Management Commitment on Service
Quality to increase Customer Satisfaction of Domestic airlines in Indonesia.,
Singapore, Management Review, 25 (1), 852-104.
Neter, J., Wasserman, W. & Kutner, M. (1989). Applied Linear Regression Miodels
Richard D. Irwin, Homewood, IL.
Ngai, E. W. T, Heung, V. C. S., Wong, Y. H. &Chan, F. K. Y. (2007). Customer
complaint behavior of Asians and non-Asians about hotel services: an empirical
analysis. European Journal of Marketing, 41 (12),1375-1391.
Nunnally, J. C. (1978). Psychometric Theory. McGraw-Hill, New York, NY.
Nyer, P. U. (2000). An Investigation into Whether Complaining can cause Increased
Consumer Satisfaction. Journal of Consumer Marketing. 17 (1), 9-19.
Oliver, R. L. (1999). Whence Consumer Loyalty? Journal of Marketing. 63(4),33-44.
Oum, Taylor, H., & Zhang, A. (1993) Strategic Airline Policy in the Globalizing Airline
Networks Transportation Journal, (Spring), 14-30.
Page, M., Pitt, L., Berthon, P., & Money, A. (1996). Analysing customer defection and
their effects on corporate performance: the case of Indico. Journal of Marketing
Management, 12,617-627.
Pallant, J. (2007). SPSS Survival Manual: A step by step guide to data analysis using
SPSS for windows 3rd
Ed. McGraw-Hill, Open University Press, England.
Palmer, A. (1997). Defining relationship marketing: an international perspective.
Management Decision, 35(4),319-321.
Palmer, A. (2001). Principles of Services Marketing (3rd
Ed). Singapore: McGraw-Hill.
Palmer, A. (2005) Principle of Service Marketing. McGraw-Hill Education.
Palmer, A., Beggs, R., & Keown-McMullan, C. (2000). Equity and repurchase intention
following service failure. Journal of Services Marketing, 14(6),513-528.
Panther, T., & Farquhar, J. (2004). Customer responses to dissatisfaction with financial
service prouders: an exploration of why some stay while other switch, Journal of
Financial Services Marketing, 18 (4),343-353.
University of Ghana http://ugspace.ug.edu.gh

126
Parasuraman A. Zeithaml, V. & Berry, L. (1991). Refinement and Reassessment of the
SERVQUAL scale”. Journal of Retailing. 67.
Parasuraman, A., Zeithaml, V., & Berry, L. (1985). A Conceptual Model of Service
Quality and its Implications for Future Research. Journal of Marketing, 49, 22-38.
Parasuraman, A., Zeithaml, V. & Berry, L. (1998). SERONAL, a Multiple-item scale for
measuring consumers perceptions of Service quality, Journal of Retailing, 64
(1),12-37.
Patterson, P. G. & Smith, T. (2003). A cross cultural study of switching barriers and
propensity to stay with service providers. Journal of Retailing, 79, 107-20.
Payne, A. (2000a). Customer retention. Cranfield School of Management. (ed). Marketing
Management: A relationship marketing perspective. Houndmills: Macmillan Press,
pp. 110-122).
Payne, A. (1993). The Essence of Services Marketing. Hertfordshire: Prentice-Hall
International.
Payne, A. (2000b). Relationship marketing: managing multiple markets’. (In Cranfield
School of Management. (ed). Marketing Management: a relationship marketing
perspective. Houndmills: Macmillan Press, pp. 16-30).
Payne, A., Holt, S. & Frow, P. (2001). Relationship Value Management; Exploring the
Integration of Employee, Customer and Shareholder Value and Enterprise
Performance Models. Journal of Marketing Management. 17 (8), 785-817.
Pearson, M. M., & Gessner, G. H. (1999). Transactional segmentation to slow customer
defections. Marketing Management, [Online], Summer, 17. Available:
[http://web20.epnet.com.ezproxy.lib.monash.edu.au].
Petrick, J. F. (2004). Are Loyal Visitors Desired Visitors? Tourism Management 4th
ed. pp.
463-470.
Petridou, E., Spathis, C., Glaveli, N., & Liassides, C. (2007). Bank Service Quality:
empirical evidence gfrom Greek and Bulgarian retail customers. International
Journal of Quality & Reliability Management. 24 (6), 568-585.
Pi, W., & Huang, H. (2011). Effects of promotion on relationship quality and customer
loyalty in the airline industry: the relationship marketing approach. African
Journal of Business Management, 5(11),1-6.
Ping, R. (1993) “The Effects of Satisfaction and Structural constraints on retailer exiting,
voice, loyalty, opportunism and neglect, Journal of Retailing, 69, 320-352.
University of Ghana http://ugspace.ug.edu.gh

127
Porter, M. E. (1998) Competitive Advantage: Creating and Sustaining Superior
performance with a new introduction, New York, Free Press.
PricewaterhouseCoopers (2002). Are they Worth it? Managing the value of customers in
the UK Financial Services Market, London.
Ranaweera, C., & Prabhu, J. (2003). The influence of satisfaction, trust and switching
barriers on customer retention in a continuous purchasing setting. International
Journal of Service Industry Management, 14 (4), 374-395.
Reichheld, F. F. (1996). Learning from customer defections, Harvard Business Review,
56-69, March/April.
Reichheld, F. (1996). Learning from Customer Defection. Harvard Business Review, Pg.
56-59.
Reichheld, F. F. (1995). Loyalty and the Renaissance of Marketing. Marketing
Management, 2(4), 10-21.
Reichheld, F. F. (1996). The Loyalty Effect, Bain and Company, Boston, MA.
Reichheld, F. F., & Aspinall, K. (1993). Building high loyalty business systems, Journal
of Retail Banking, 15(4), 21-9.
Reichheld, F. F., & Kenny, D. W. (1990). The Hidden Advantages of Customer Retention,
Journal of Retail Banking, 11 (14), 19-23.
Reichheld, F. F., & Kenny, D. W. (1990). The hidden advantages of customer retention,
Journal of Retail Banking, 12(4), 19-23.
Reichheld, F. F., & Sasser, W. E. (1990). Zero Defection: Quality Comes to Service.
Harvard Business Review, 101.
Rhoades, D. L., & Waguespack, B. (2005). Strategic imperative and the pursuit of quality
in the US airline industry. Managing Service Quality, 15 (4), 307-16.
Ring, P. S., & Van de Van, A. H. (1992). Structuring Cooperative Relationships between
Organisations. Strategic Management Journal, 13,483-98.
Ring, P. S., & Van de Van, A. H. (1992). Structuring Cooperative Relationships between
Organisations. Strategic Management Journal, 13, 483-98.
Roberts-Lombard, M., Van Vuuren T., & Van Tonder E. (2012). Customer satisfaction,
trust and commitment as predictors of customer loyalty within an optometric
environment. South African Business Review, 16(3), 31-93.
Robinson, J.P., Shaver, P. R., & Wrightman, L. S. (1991). Measures of Personality and
social Psychology Attitudes San Diego: Academic Press.
Robson, C. (2002). Reel World Research (2nd
Ed) Blackwell, Oxford; Patton.
University of Ghana http://ugspace.ug.edu.gh

128
Roig J.C.F, Garcia, J. S., Tena M.A.M., & Monzonis J. L. (2006). Customer perceived
value in banking services; International Journal of Bank Marketing, 24(5),266-
283.
Rosenberg, F., & Czepiel, J. (1984). A Marketing Approach for Customer Retention:
Journal Implication of Consumer Marketing, 1,45-51.
Rosenburg, L. J., & Czepiel, J. A. (1983). A marketing approach for customer retention‟,
Journal of Consumer Marketing, 1(2), 45-51.
Rowley, J. (2000). From users to customers? OCLC Systems and Services, 16(4),157-
167.
Rucci, J. A., & Kirn, S. P. (1998). The Employee-Customer Profit Chain at SEARS,
Harvard Business Review Pg.82-97.
Rust, R. T., & Subramanian, B. (1992). Making Complaints a Management Tool”.
Marketing Management. 3, 41-45.
Rust, R., & Zahorik, A. (1993). Customer Satisfaction, Customer Retention and Market
Share. Journal of Retailing. 69 (2), 193-215.
Salant, P., & Dillman, D. A. (1994). How to conduct your own survey, New York John
Wiley, and Sons - sales automation, in proceedings of DCI customer relationship
management conference.
Sauders M., Levis, P., & Thornhill, A. (2009). Research for Business Students (5th
Ed),
Pearson Education, Edinburgh Gate, England.
Scheider, B. & Bowen, D. (1999). Winning the Service Game, Harvard Business School
Press, Boston, MA.
Schoefer, K. (2008). The role of cognition and affect in the formation of customer
satistfaction judgements concerning service recovery encounters. Journal of
Consumer Behaviour, 7, 210-221.
Schoefer, K., & Diamantopoulus, A. (2008). Measuring experienced emotions during
service recovery encounters: construction and assessment of the ESRE scale‟,
Service Business, 2, 65-81.
Seawright, K. K., DeTienne, K. B. Bernhisel, M. P., & Hoopes Larson, C. L. (2008). An
empirical examination of service recovery design. Marketing Intelligence and
Planning, 26 (3), 253-274.
Sharma, N., & Patterson, P. (2000) Switching costs, alternative attractiveness and
experience as moderators of relation commitment in professional consumer
services. International Journal of Service Industry management, 11, 470-490.
University of Ghana http://ugspace.ug.edu.gh
129
Sheth, N., & Parvatiyar, A. (1995). Relationship Marketing in Consumer Markets:
Antecedents and consequences. Journal of the Academy of Marketing Science
pp.225-271.
Shoemaker, S., & Lewis, R. C. (1999). Customer Loyalty: the Future of Hospitality
Marketing. International Journal of Hospitality Management, 18th
Ed. pp. 345-
370.
Sigala, M. (2005). Integrating Customer Relationship Management in Hotel Operations:
Manageral and operational Implications. Hospitality management, 24,391-413.
Sin L.Y.M., Tse, A.C. B., &Yim, F. H. K. (2005), “CRM: Conceptualization Journal of
MarketinG, 39 (12),1264-1290.
Singh, J. (1998). Customer Complaints Intentions and Behavior: And Taxonomical Issues.
Journal of Marketing, 52, 93-107.
Spekman, R. E., (1988). Strategic Supplier Selection: Understanding Long-term Buyer
Relationships. Business Horizons, pp. 75-81
Spreng, R. A., Harrel, G. D., & Mackoy, R. D. (1995). Service Recovery: Impact on
Satisfaction and Intentions. Journal of Services Marketing. 9 (1),15-23.
Stafford, L. (2008). Social Exchange Theories: Engaging theories in interpersonal
communication: multiple perspectives. Thousand Oaks.
Stauss, B. (2002). The dimensions of complaint satisfaction: process and outcome
complaint satisfaction versus cold fact and warm act complaint satisfaction.
Managing Service Quality, 12(3),173-183.
Stauss, B., & Seidel, W. (2004) Complaint Management: The Heart of CRM, Thomson,
Mason, OH.
Stauss, B., Chojnacki, K., Decker, A., & Hoffman, F. (2001). Retention Effects of a
Customer club. International Journal of Service Industry Management, 12(1),7-19.
Steyn, T., Mostert, P., Meyer, C., & Rensburg, L. (2011). The effect of service failure
and recovery on airline-passenger relationships: A comparison between South
African and United States Airline passengers. Journal of Management Policy and
Practice, 12(5), 105-107.
Storbacka, K. (1997). Segmentation based on Customer Profitability- retrospective
analysis of retail bank customer bases. Journal of Marketing Management. 13(1),
479-492.
Story, J., & Hess, J. (2006). Segmenting customer-brand relations: Beyond the personal
relationship metaphor. Journal of Consumer Marketing, 23 (7),406-413.
University of Ghana http://ugspace.ug.edu.gh

130
Sultan, F. & Simpson, M. (2000). International Service Variants: airline passenger
expectations and perceptions of service quality. Journal of Services Marketing,
14(3), 188-216.
Tabachnik, B. G. & Fidell, L. S. (2007). Using multivariate statistics. 5th
Ed. Boston:
Allyn and Bacon.
Taylor, S. (1994). Waiting for Services: evaluations of Services. Journal of Marketing, 58
56-69.
Technical Assistance Research Program (TARP), (1979). Consumer Complaint Handling
in America. Final Report, US Office of Consumer Affairs, Washington, DC.
Tiernan, S., Rhoades. D. L., & Waguespack, B. (2008). Airline service quality:
exploratory analysis of consumer perceptions and operational performance in the
USA and EU. Managing Service QualitY, 18 (3), 212-224.
Torres, E. N. & Kline, S. (2006). From satisfaction to delight: a model for the hotel
industry. International Journal of Contemporary Hospitality Management, 18(4),
290-301.
Trubik, E., & Smith, M. (2000). Developing a model of customer defection in the
Australian banking industry. Management Auditing Journal, 15 (5),1-12.
Tull, D. S. & Hawkins, D.I.(2002). Marketing research meaning measurement and
method A‟ text write cases (5th
Ed) Macmillan, New York.
Turnbull, P., & Wilson, D. (1989). Developing and Protecting Profitable Customer
Relationships. Industrial Marketing Management, 18 (1), 1-6.
Turnbull, P.W., & Valla, J. P. (1986). Strategies for International Industrial Marketing;
The Management of Customer Relationships in European Industrial Markets,
Croom Helm, London.
Valenzuela, F. (2010). Switching barriers used to retain retailed banking customers: Some
empirical evidence from South American country, Management Research Review,
33(6), 749-766.
Vasquez-Carrasco, R. & Foxall, G. R. (2006). Influencing of personality traits on
satisfaction, perception of relationalbenefits, and loyalty in a pernal service
context. Journal of Retailing and Consumer Services, 13, 205 219.
Weinstein, A. (2002). Customer Retention: A Usage Segmentation and Customer Value
Approach, Journal of Targeting, Measurement, and Analysis for Marketing, 10(3),
259- 268.
University of Ghana http://ugspace.ug.edu.gh

131
White, L., & Yanamandram, V. (2004). Why Customers Stay: reasons and consequences
of inertia in financial services, Managing Service Quality, 14 (3),183-194.
Whyte, R. (2003). Frequent Flyer Programs: Is it a Relationship, or do the Schemes
Create Spurious Loyalty? Journal of Targeting, Measurement and Analysis for
Marketing 3rd
ed. pp. 269-280.
Wilson, D. T. (1995). An integrated model of buyer-seller relationship. Journal of the
Academy of Marketing Science Vol. 23 No. 4 pp. 335-345.
Wong, A. and Sohal, A. (2003). Service Quality and Customer loyalty Perspectives on two
levels of retail relationship. Journal of Services Marketing, Vol. 17 No. 5 pp. 945-
513.
Yanmandram, V. & White, L. (2006). Switching barriers in business-to-business services:
a qualitative study. International Journal of Service Industry Management, Vol. 31
No. 2, pp. 158-92.
Zablah, A. R., Bellenger, D. N. and Johnston, W. J. (2005). An evaluation of divergent
perspectives on customer relationship management: towards a common
understanding of an emerging phenomenon. Industrial Marketing Management,
Vol. 33 No. 6 pp. 475-89.
Zagat Research, (2005). Press Release. Available at www.zagat.com
Zagat, (1992), Zagat United States Travel Survey, Zagat, New York.
Zairi, M. (2000). Internal transfer of best practice for performance excellence: a global
survey, Benchmarking: An international Journal Vol. 7 No. 4 pp. 239- 246.
Zeithaml, V. & Bitner, M. (2000). Services Marketing Integrating Customer Focus
Across the Firm. McGraw Hill, London pp.77-88.
Zeithaml, V. A, Bitner, M. J, & Gremler, D. D. (2006). Services marketing: Integrating
customer focus across the firm. 4th
ed. New York, New York: Mac-Graw Hill.
Zeithaml, V. A., Berry, L. L. and Parasuraman, A. (1996). The behavioral consequences of
service quality. Journal of Marketing. Vol. 60 pp. 31-46.
Zeithaml, V. A., Bitner, M. J. and Gremler, D. D (2009). Services Marketing: Integrating
Customer Focus across the Firm. (5th
Ed), McGraw-Hill, New York, NY.
Zethaml, V. A, Berry, L. L and Parasuraman, A. (1996). The Behavioral Consequences of
Service Quality”. Journal of Marketing, Vol.60 Pg. 31-46.
Zineldin, M. (2000). Total Relationship Management, Studentlitteratur, Lund.
University of Ghana http://ugspace.ug.edu.gh

132
Zineldin, M. & Philipson, S. (2007). Kotler and Borden are not dead: myth of relationship
marketing and truth of the 4Ps. Journal of Consumer Marketing. Vol.24 No.4
pp.229-241.
Zineldin, M. & Philipson, S. (2007). Kotler and Borden are not dead: myth of relationship
marketing and truth of the 4Ps. Journal of Consumer Marketing. Vol.24 No.4
pp.229-241.
WEBOGRAPHY
www.iata.org
www.ghanaairports.com.gh
www.gcaa.com.gh
www.antrakair.com
www.flyafricaworld.com
www.flystarbow.com
www.fly540africa.com/ghana.aspx
University of Ghana http://ugspace.ug.edu.gh

133
APPENDICES
Appendix 1: Questionnaire
UNIVERSITY OF GHANA BUSINESS SCHOOL
DEPARTMENT OF MARKETING AND CUSTOMER MANAGEMENT
UNIVERSITY OF GHANA, LEGON
This study is being conducted by an M.Phil Marketing Student of the University of Ghana
Business School on the topic “Customer Retention Strategies in the Airline Industry in
Ghana” from the Department of Marketing and Customer Management.
I humbly request you to fill the questionnaire below by ticking the most suitable option
that applies to you. Please be informed that all the information that would be obtained
through this questionnaire administration is purely for academic purposes only and a study
to expand the frontiers of knowledge in the field and that respondents are assured of
uttermost confidentiality of information provided.
SECTION A
GENERAL DATA ON RESPONDENTS
1. Sex: Male [ ] Female [ ]
2. Age: [a] 18-25years [b] 26-45years [c] 46-60years [ d] 60+
3. Educational Qualification.
[a] No Education [b] O/A level [c] HND/Degree [d] Professional/Postgraduate
University of Ghana http://ugspace.ug.edu.gh

134
4. Occupation [a] Student [b] Self-employed [c] Civil/Public Servant [d]
Businessman/Woman/Private Sector
5. Place of Origin [a] Africa [b] Europe [c] Middle East [d] North America
6. How often do you travel? [a] Very often [b] Quite often [c] Sparingly [d] As and when
7. Travel frequency per year [a] 0-2times [b] 3-5times [c] More than 5 times
8. Do you often travel by air [a] Yes [b] No
9. Which airline do you often travel with? [a] Delta [b] Emirates [c] KLM [d] Kenyan
Airways
[e] British Airways.
10. What would you consider the most important factor to consider when choosing an
airline?
[a] Price [b] Safety and Security [c] Service Quality [d] Reputation [e] Other, specify
University of Ghana http://ugspace.ug.edu.gh

135
SECTION B: CUSTOMER RETENTION STRATEGIES
On a liker scale of 1-5, please indicate by ticking the level to which you agree or disagree
with the following statements.
Key to options
1. Strongly Disagree 2. Disagree 3. Uncertain 4. Agree 5. Strongly Agree
1. RELATIONSHIP MARKETING
a. Commitment and Trust
S/N Statement on Research Variable 1 2 3 4 5
11 Airline staff show respect to customers and are friendly
12 I have absolute confidence in the airline‟s services and offerings
13 My carrier fulfils its obligation to me such as on-board service by
airline staff
b.Social Bond and Complaint Handling
S/N Statement on Research Variable 1 2 3 4 5
14 The airline checks on me regularly and treats me as a friend and a
partner as compared to other competitors.
15 Airline staff are courteous and friendly in handling my complaints
16 I will recommend my airline to others
University of Ghana http://ugspace.ug.edu.gh

136
2. AIRLINE SERVICE QUALITY
S/N Statement on Research Variable 1 2 3 4 5
17 The airline and its staff looks professional and attractive in their
outfit
18 The airline responds quickly and timely to my complaints
19 My safety and security is assured by the airline
20 The airline handles my mishandled baggage with empathy
21 Departure and arrival time is reliable
22 Airline staff deliver services dependably and accurately
3. AIRLINE SWITCHING BARRIER
S/N Statement on Research Variable 1 2 3 4 5
23 There is a frequent flyer program operated by the airline
24 I benefited from the frequent flyer program and I appreciated it
25 The frequent flyer program has the potential of keeping me
with the airline
26 I will continue to patronize the airline irrespective of higher air
fares
4. SERVICE RECOVERY
S/N Statement on Research Variable 1 2 3 4 5
27 The airline is professional and institute a complaint management
process which I benefited from
28 I am satisfied with the recovery strategy instituted by the airline
in addressing my complaints
29 I will stay longer because of good service recovery strategy
University of Ghana http://ugspace.ug.edu.gh

137
SECTION C: CUSTOMER RETENTION
S/N Statement on Research Variable 1 2 3 4 5
30 I will continue to patronize the service offerings of this airline
31 I will always travel with this airline.
I appreciate you for taking time off your busy schedules to fill this questionnaire. Thank
you!
University of Ghana http://ugspace.ug.edu.gh

138
Appendix 2: Domestic Airline Statistics Actual
DOMESTIC AIRLINE STATISTICS ACTUALS FOR 2011
Aircraft Movement
Passenger Through Put
Months Arrival Departure Total Months Arrival Departure Total
January 342 400 742 January 6,602 4,986 11,588
February 404 418 822 February 6,303 7,407 13,710
March 411 512 923 March 7,506 9, 918 17,424
April 335 437 772 April 5,735 6,330 12,065
May 379 486 865 May 6,557 8,000 14557
June 359 446 805 June 5,607 7,542 13149
July 317 430 747 July 4,966 7,433 12399
August 346 435 781 August 6,428 8,384 14812
September 350 454 804 September 5,332 9,432 14764
October 345 455 800 October 6,369 9,219 15,588
November 405 513 918 November 10,494 14,205 24,699
December 490 622 1,112 December 15,736 18,582 34,318
TOTALS 4,483 5,608 10,091 TOTAL 87,635 111,438 199,073
Source: GACL, 2013
DOMESTIC AIRLINE STATISTICS ACTUAL FOR 2012
Aircraft Movement
Passenger Through Put
Months Arrival Departure Total Months Arrival Departure Total
January 596 596 1,192 January 16,164 19,122 35,286
February 524 524 1,048 February 14,968 16,134 31,102
March 656 656 1,312 March 18,725 21,483 40,208
April 640 640 1,280 April 19,320 21,746 41,066
May 527 527 1,054 May 18,421 22,484 40,905
June 415 415 830 June 17,669 21,180 38,849
July 462 462 924 July 19,543 23,557 43,100
August 536 536 1,072 August 20,817 25,276 46,093
September 612 612 1,224 September 23,081 27,758 50,839
October 677 677 1,354 October 23,587 29,058 52,645
November 806 806 1,612 November 29,166 34,327 63,493
December 725 725 1,450 December 28,305 31,488 59,793
TOTALS 7,176 7,176 14,352 TOTAL 249,766 293,613 543,379
Source: GACL, 2013
University of Ghana http://ugspace.ug.edu.gh

139
Appendix 3: International Airline Movement In Ghana
Aircraft Movement Passenger Movement Freight (Tonnes)
Transit Year Arrival Departure Total Arrival Departures Total Arrival Departures Total
2000 5,130 5,284 10,414 311,474 280,802 592,276 14,447 32,379 46,826
2001 4,513 4,551 9,064 329,731 292,794 622,525 13,933 30,846 44,779 68,590
2002 4,084 4,077 8,161 316,295 319,819 636,114 12,322 28,555 40,877 60,062
2003 4,586 4,641 9,227 332,980 351,525 684,505 15,056 32,627 47,683 66,822
2004 5,283 5,327 10,610 338,518 366,852 705,370 15,410 31,504 46,914 70,306
2005 6,249 6,224 12,473 382,244 429,981 812,225 16,667 30,495 47,162 50,706
2006 6,868 6,865 13,733 458,903 467,692 926,595 16,306 33,150 49,456 95,336
2007 7,952 7,771 15,723 524,613 541,385 1,065,998 26,014 33,496 59,510 70,731
2008 8,738 87,743 96,481 587,745 598,812 1,186,557 22,807 32,706 55,513 99,302
2009 8,655 8,646 17,301 601,584 603,202 1,204,786 17,368 28,326 45,694 103,586
2010 10,534 10,538 21,072 694,927 692,814 1,387,741 19,462 26,498 45,960 117,478
2011 11,145 11,139 22,284 796,384 790,218 1,586,602 22,907 27,353 50,260 145,761
2012 11,041 11,041 22,082 792,353 933,698 1,726,051 21,231 25,346 46,577 154,723
Source: GACL, March, 2013
Appendix 4: Market Share Analysis Of Major International Airlines In Ghana-2012
Market Share Analysis of Major International Airlines in Ghana-2012
Aircraft Movement
Passenger Movement
Airline Name Percentage Share % Airline Name Percentage Share %
Arik Air 9.3 Emirates 12
Asky 6.8 KLM 11
Kenyan Airways 6.9 British Airways 8.1
Emirates 6.6 Delta 7.3
Air/Virgin Nigeria 5.6 Kenyan Airways 7.3
Aero Contractors 5.7 Arik Air 6.5
South African Airlines 4.5 Aero Contractors 5.6
Others 11.8 Others 10.6
Source: GACL, March, 2013
University of Ghana http://ugspace.ug.edu.gh