Embed Size (px)
Citation preview

AND
,N ASA TECHNICAL I NASA TR R-430z
REPORT
9-S(NASA-TR-R-
4 30) HOLOGRAPHIC
NONDESTRUCTIVE TESTS PERFORMED ON
COMPOSITE SAMPLES OFCERAMIC-EPOXY-FIBERGLASS SANDWICH STRUCTURE
Unclas
(1ASA) --33-p HC $3.25 CSCL 20K 81/32 40560 _
.HOLOGRAPHIC NONDESTRUCTIVE TESTS
PERFORMED ON COMPOSITE SAMPLES
vOF CERAMIC-EPOXY-FIBERGLASS
:SANDWICH STRUCTURE
y Robert L. Kurtz and H. K. Liu
SGeorge C. Marshall Space Flight Center o4o
Marshall Space Flight Center, Ala. 35812
NATIONAL AERONAUTICS AND SPACE ADMINISTRATION * WASHINGTON, D. C. * JUNE 1974
https://ntrs.nasa.gov/search.jsp?R=19740018254 2018-06-13T12:03:16+00:00Z
1. REPORT NO. 2. GOVERNMENT ACCESSION NO. 3. RECIPIENT'S CATALOG NO.
TR R- 4304. TITLE AND SUBTITLE 5. REPORT DATE
Holographic Nondestructive Tests Performed on Composite Samples June 1974
of Ceramic-Epoxy-Fiberglass Sandwich Structure * 6. PERFORMING ORGANIZATION CODE
7. AUTHOR(S) 8.PERFORMING ORGANIZATION REPORF #
Robert L. Kurtz and H. K. Liu** M461
9. PERFORMING ORGANIZATION NAME AND ADDRESS 10. WORK UNIT NO.
983-15-28-0000George C. Marshall Space Flight Center CONTRACT OR GRANT NO.
Marshall Space Flight Center, Alabama 35812 1 CONTRACT OR GRANT NO.
13. TYPE OF REPORY' & PERIOD COVERED
12. SPONSORING AGENCY NAME AND ADDRESS
National Aeronautics and Space Administration Technical Report
Washington, D.C. 2054614. SPONSORING AGENCY CODE
15. SUPPLEMENTARY NOTES
Prepared by Space Sciences Laboratory, Science and Engineering. *This work was supported in part
by the Pershing Missile System Office Act. Clas. 21X4992. 631 63 S01021.
**University of Alabama, Tuscaloosa16, ABSTRACT
When a hologram storing more than one wave is illuminated with coherent light, the
reconstructed wave fronts interfere with each other or with any other phase-related wave front
derived from the illuminating source. This multiple wave front comparison is called holographic
interferometry, and its application is called holographic nondestructive testing (HNDT).
The theoretical aspects of HNDT techniques and the sensitivity of the holographic system to
the geometrical placement of the optical components are briefly discussed. A unique HNDT system
which is mobile and possesses variable sensitivity to stress amnplitude is described, and experimental
evidence of the application of this system to the testing of the hidden debonds in a
ceramic-epoxy-fiberglass structure used for sample testing of the radome of the Pershing missile
system is presented.
EDITOR'S NOTE
Use of trade names or names of manufacturers in this report does not constitute an official
endorsement of such products or manufacturers, either express or implied, by the National
Aeronautics and Space Administration or any other agency of the United States government.
17. KEY WORDS 18. DISTRIBUTION STATEMENT
32
19. SECURITY CLASSIF. (of this reportl 20. SECURITY CLASSIF. (of this page) 21. NO. OF PAGES 22. PRICE
Unclassified Unclassified 31 $5.25
MSFC - Form 3292 (Rev December 1972) For sale by National Technical Information Service, Spriingfield. Virginia 2 1 51
/

TABLE OF CONTENTS
Page
INTRODUCTION ...... ...................................... 1
THEORETICAL DISCUSSION OF RECOGNIZED HOLOGRAPHICNONDESTRUCTIVE TESTING TECHNIQUES ...................... 1
Real-Time HNDT Technique .................. .......... 1Double-Exposure HNDT Technique .......................... 4Time-Averaged HNDT Technique .......................... 8
DEPENDENCE OF HOLOGRAPHIC SENSITIVITY ON THE GEOMETRYOF OPTICAL COMPONENTS ................................. 11
DESCRIPTION OF A COMPOSITE MOBILE HOLOGRAPHIC NONDESTRUCTIVETESTING TECHNIQUE - A VARIABLE SENSITIVITY SYSTEM ........... 14
EXPERIMENTAL RESULTS ......................... ........ 16
The Test Samples ............................... ..... 16The Sample Holder ................................ 20The Experimental Procedure ................................ 21
DISCUSSION OF RESULTS ............. ........... ..... 22
REFERENCES .......................................... 26
BIBLIOGRAPHY .................. .............. ........ 26
PRECEDING PAGE BLANK NOT FILMED
Iii

LIST OF ILLUSTRATIONS
Figure Title Page
1. Phase change of light due to the movement of the object . ......... 5
2. Geometry for calculating the phase shift 6(x,t) for thetime-averaged method ...................... .......... 8
3. Minimum motion geometry ...... .... . ..................... . 12
4. Maximum motion geometry ...... . . . .. ..... .... ........... . 13
5. Composite mobile holographic nondestructive test system . ......... 15
6. Results of controlled object movement ................... .. 17
7. The structure of test samples . .................. ... . . . . . 19
8. Photograph of test samples .... ............ . . . . . . . . . . . . 19
9. Sample holder assembly schematic .. .............. ...... .. . 20
10. Photograph of sample holder ................. ........... . 21
11. Real-time hologram of plate number 2,P = 1.1 X 10' dyne/cm2 (0.5 psi) . .................. ..... 23
12. Real-time hologram of plate number 2,P = 4.4 X 10³ dyne/cm 2 (2.0 psi) ........................ 24
13. Real-time hologram of plate number 3,P = 6.76 X 10⁴ dyne/cm2 (30.375 psi) . .................. . 25
iv

FOREWORD
With the advent of modern technology, the need has arisen for components and
structures of unprecedented efficiency, the design of which requires that the constituent
materials be exploited close to their ultimate capability. Such a design approach requires
both a greatly improved understanding and exploitation of the engineering properties of
classical materials and the development and use of new materials, such as nonmetallics
and composites. With these developments has come the need for commensurate
improvements in the HNDT technology.
In response to this need, the Space Sciences Laboratory of the Marshall Space
Flight Center designed the Composite Mobile System for Holographic Nondestructive
Testing. (This system has patent disclosure number MFS-21704 by the United States
Government.) The general purpose of this system is to provide a single system for HNDT
which will be mobile and versatile enough to allow any one of the three main
nondestructive test methods to be employed.
Recognizing the potential of this system and possessing a very specific need for
HNDT of some composite samples of the radome for the Pershing missile system, the
Army Missile Command, Redstone Arsenal, Alabama, funded the Space Sciences
Laboratory to investigate the composite samples. This simultaneously allowed the further
design and development of this unique system for use on Marshall Space Flight Center
mainstream programs.
The most recent and present application of this HNDT is in the evaluation of the
integrity of electroplate bonds on the Space Shuttle main engine.
v

HOLOGRAPHIC NONDESTRUCTIVE TESTS PERFORMED ON COMPOSITESAMPLES OF CERAMIC-EPOXY-FIBERGLASS SANDWICH STRUCTURE
INTRODUCTION
When a hologram storing more than one wave is illuminated with coherent light,the reconstructed wave fronts interfere with each other or with any other phase-relatedwave front derived from the illuminating source. This multiple wave front comparison iscalled holographic interferometry, and one application is called holographic nondestructivetesting (HNDT). Holographic interferometry, or nondestructive testing, is concerned withthe formation and interpretation of the fringe patterns which appear when a wavegenerated at some earlier time and stored in a hologram is later reconstructed and causedto interfere with a comparison wave. It is this storage or time delay aspect which givesthe holographic method a unique advantage over conventional optical interferometry.Holography permits diffusely reflecting or scattering surfaces which are subjected to stressto be interferometrically compared with their nonstressed state. It accomplishes thiswithout the requirement for surface preparation of the test object so necessary for theconventional interferometer.
The purpose of this report is to describe a unique HNDT system which is mobileand possesses variable sensitivity to stress amplitude and to present the experimentalevidence of the application of this unique system to the testing of the hidden debonds ina ceramic-epoxy-fiberglass structure used for sample testing of the radome of the Pershingmissile system. The theoretical aspects of HNDT techniques and the sensitivity of the
holographic system to the geometrical placement of the optical components are brieflydiscussed.
THEORETICAL DISCUSSION OF RECOGNIZED HOLOGRAPHICNONDESTRUCTIVE TESTING TECHNIQUES
In any discussion of holographic nondestructive testing it is generally concededthat there are three general types or modes of such testing: real time, double pulse, andtime averaged. These will be discussed separately; however, it is submitted here that
time-averaged testing is basically not a different type of HNDT but, rather, just a specific
loading technique for the other two types. This is a point which should be pursued;however, it will not be pursued further here.
Real-Time HNDT Technique
When the interference of a subject wave with a reference wave is properly
recorded in a hologram, a wave whose complex amplitude is linearly proportional to that
of the original subject wave can be reconstructed. Reconstruction is best achieved by

placing the hologram plate back in the position it occupied during its exposure andilluminating it with the original reference beam. If it is assumed that the hologram platehas been replaced exactly in its original position, then, apart from a constant amplitudeand phase factor, the reconstructed wave will be an exact replica of the original subjectwave. (The ratio between the amplitudes of the original and reconstructed waves can bemade unity by altering the illumination intensity.) Suppose that during the time betweenexposure of the hologram and its replacement, while the hologram is being processed, thesubject stays fixed in position and continues to be illuminated with laser light. One maynow inquire as to what is observed when looking through the replaced hologram in thedirection of the subject. Since most holographic interferometry has been carried out usingholograms formed in photographic emulsion, assume this to be the case here and recallthat the reconstructed wave amplitude will then have a negative sign relative to theoriginal subject wave. Provided that (1)processing of the hologram does not distort theemulsion, (2) the replacement has been exact, and (3) the illumination has been adjustedto equalize the absolute values of the original and reconstructed subject wave amplitudes,the reconstructed wave fronts will cancel the original subject wave fronts at every pointon the viewer's side of the hologram. To the viewer looking through the hologram, thesubject will, therefore, not be visible. (In practice, at least one broad, bright fringe isusually observed because the processing of the hologram inevitably distorts the emulsionto some small degree.)
If the subject of the hologram is a plane mirror surface, the holographic methoddescribed above does no more than can be accomplished with a Michelson interferometerilluminated with uniform coherent light. Because the mirror surfaces can be polished sosmooth that any surface microstructure is of negligible consequence, one good mirrorsurface is the equivalent of another. By means of the beam splitter in the Michelsoninstrument, a given mirror surface can be interferometrically compared with itsequivalent. Totally destructive or constructive interference can be observed as with theholographic method.
It is, however, the unique property of the holographic method that an arbitrarilyshaped, rough scattering surface with complex microstructure can be interferometricallycompared to another similar surface with no more difficulty (in principle) than isencountered with polished mirrors. The virtual image of a diffusely scattering subjectgenerated by the hologram may be considered to provide one such surface. The other isthe actual subject surface itself. If the original reference wave illuminates an exactlyreplaced hologram, the virtual image will appear to the viewer to be not only amacroscopic replica of the subject, but to lie coincident with it in space and to bear asurface microstructure whose light-scattering properties are identical to those of thesubject. It would be a formidable task to attempt to replace the two mirrors of theMichelson interferometer with two such identical physical surfaces. Holography in effectdoes this.
Once an effective coincidence of the virtual image with the subject is achieved,the latter may be placed under stress and caused to deform, or it may be released fromstress and allowed to flow, creep, deflate, or expand. As a result, the optical distance
2
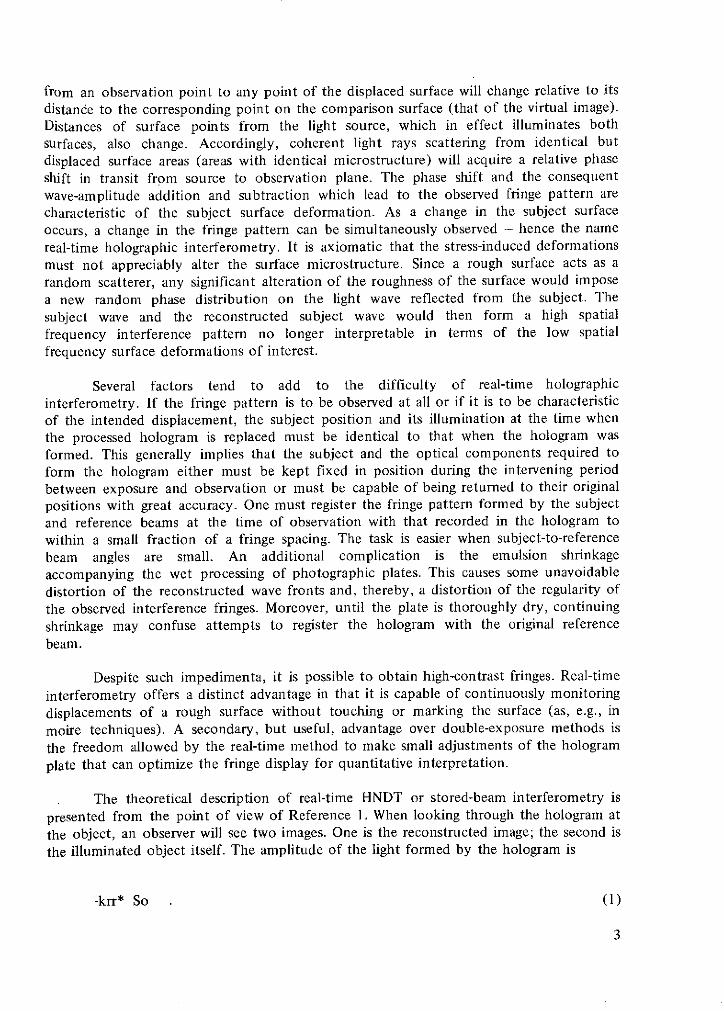
from an observation point to any point of the displaced surface will change relative to its
distance to the corresponding point on the comparison surface (that of the virtual image).
Distances of surface points from the light source, which in effect illuminates both
surfaces, also change. Accordingly, coherent light rays scattering from identical but
displaced surface areas (areas with identical microstructure) will acquire a relative phase
shift in transit from source to observation plane. The phase shift and the consequent
wave-amplitude addition and subtraction which lead to the observed fringe pattern are
characteristic of the subject surface deformation. As a change in the subject surface
occurs, a change in the fringe pattern can be simultaneously observed - hence the name
real-time holographic interferometry. It is axiomatic that the stress-induced deformations
must not appreciably alter the surface microstructure. Since a rough surface acts as a
random scatterer, any significant alteration of the roughness of the surface would impose
a new random phase distribution on the light wave reflected from the subject. The
subject wave and the reconstructed subject wave would then form a high spatial
frequency interference pattern no longer interpretable in terms of the low spatial
frequency surface deformations of interest.
Several factors tend to add to the difficulty of real-time holographic
interferometry. If the fringe pattern is to be observed at all or if it is to be characteristic
of the intended displacement, the subject position and its illumination at the time when
the processed hologram is replaced must be identical to that when the hologram was
formed. This generally implies that the subject and the optical components required to
form the hologram either must be kept fixed in position during the intervening period
between exposure and observation or must be capable of being returned to their original
positions with great accuracy. One must register the fringe pattern formed by the subject
and reference beams at the time of observation with that recorded in the hologram to
within a small fraction of a fringe spacing. The task is easier when subject-to-reference
beam angles are small. An additional complication is the emulsion shrinkage
accompanying the wet processing of photographic plates. This causes some unavoidable
distortion of the reconstructed wave fronts and, thereby, a distortion of the regularity of
the observed interference fringes. Moreover, until the plate is thoroughly dry, continuing
shrinkage may confuse attempts to register the hologram with the original reference
beam.
Despite such impedimenta, it is possible to obtain high-contrast fringes. Real-time
interferometry offers a distinct advantage in that it is capable of continuously monitoring
displacements of a rough surface without touching or marking the surface (as, e.g., in
moire techniques). A secondary, but useful, advantage over double-exposure methods is
the freedom allowed by the real-time method to make small adjustments of the hologram
plate that can optimize the fringe display for quantitative interpretation.
The theoretical description of real-time HNDT or stored-beam interferometry is
presented from the point of view of Reference 1. When looking through the hologram at
the object, an observer will see two images. One is the reconstructed image; the second is
the illuminated object itself. The amplitude of the light formed by the hologram is
-krr* So (1)
3

The object scatters light denoted by S. The amplitudes sum, resulting in an amplitude
A = S - krr* So (2)
The eye integrates the intensity, resulting in
Ir = f IS - krr* So12 dt . (3)
The loading of the object must now be considered and related to thescattering, S , and the stationary amplitude, So [1].
Double-Exposure HNDT Technique
Continuous comparison of surface displacement relative to an initial state may incertain cases supply more information than is necessary. If it is sufficient to form apermanent record of the relative surface displacement occurring after a fixed interval oftime, a method obviating the experimental difficulties of real-time interferometry may beemployed. Two exposures of the hologram, once to the initial state of the surface andonce to its strained state, are superimposed prior to processing. Each exposure is madewith the identical reference wave. With this double-exposure, or time-lapse method, theproblems of registering a reconstructed wave with an original are eliminated. After theexposure of the hologram is completed, the subject and the optical components used toilluminate the subject are no longer of concern. Both the comparison wave, characteristicof the surface in its initial state, and the wave representing a later, altered state of thesurface are reconstructed in register by illuminating the hologram with a wave similar tothe original reference wave. No more care in illumination is necessary than is taken inilluminating any pictorial hologram. Distortion due to emulsion shrinkage is identical forboth reconstructed waves and is, therefore, not a factor in determining the spacing of thefringes formed by the interference of the two waves. However, limitations on the changeof subject surface microstructure apply here as in the real-time method.
Illumination of the doubly exposed hologram not only effects the simultaneousreconstruction of two waves which had been scattered from the subject at different timesbut causes them to interfere under ideal conditions. The waves can share the diffractionefficiency of the hologram equally. Thus, their intensities are equal and the intereferencefringes they produce can have high visibility or contrast. For purposes of analysis, thetwo virtual images of the subject surface generated by the reconstructed waves may beconsidered to be two slightly different physical surfaces. One can imagine these
4

initial-state and final-state surfaces to be simultaneously illuminated with the coherent
light originally illuminating the subject. One difference in the interference resulting from
the double-exposure method as compared to that obtained from the real-time technique
may be observed when initial and final states of the subject surface are identical. Each
reconstructed wave is negative with respect to the original subject wave; and,
consequently, when the initial and final states are identical, the reconstructed waves add
to give a bright image of the subject.
Suppose a hologram was made of an object having a scene beam amplitude S . If
the object is strained and a second exposure made corresponding to scene beam
amplitude S2 on the same hologram, upon reconstruction, two virtual images will be seen
when viewing through the hologram. Their composite amplitude is given by
A = -krr* (S, + S 2 ) (4)
These two scene beams will interfere with each other constructively or destructively,
depending on their relative phase. Areas of destructive interference will cause fringes
(absence of light). The intensity of the composite image, Ir , is given by IA 12 or
Ir = IA12 = (krr*) 2 (S 1 + S2)(S1* + S 2 *) . (5)
The two scene beam amplitudes, S, and S2 , can be related by simple geometry.
Let , + V2 be the path of light taken by the scene beam when the film is exposed to
the unstrained object. Similarly, Q'1 + V'2
is the path length of the scene beam when
the second exposure is made. Then, LASER - REFERENCE BEAM MIRROR
referring to Figure I, SCE
R, 2 = 2 + m z2 2m2 cos 0, a
OBJECT BEFOREDISPLACEMENT
'22 = 22 + m 2 - 2m2 cos 2 . HOLOGRAM OBJECT AFTERV2m 2 DISPLACEMENT
Figure 1. Phase change of light due to
Solving for £', and V'2 , the movement of the object.
QI = V, [ +m V2 m C m COS 0 1
'[ = [ ( 1 + - -m cos O - l 1 -' cos O )for < 1 ,
V'2 = V2 I(j) 2 2 COS ] 2 2 (1 - COS 2 for - <
5

Therefore,
k'1 - I = -mcos 0 or RI -=1 'I = m cos O1
R'2 - R2 = -mcos0 2 or k2 - k' 2 = mcosO 2
Total pathlength change is determined by
AL = (, + k2) - (' + k'2) = m(cos01 + cos 02)
The difference in phase is given by
= 2rr 27rA = XAL - m(cos0 1 + cos 02 ) (6)
The scene beam, S, , during the first exposure is given by
S, = S ei ,
and the scene beam, S2 , during the second exposure is given by
2niS2 = Se ¢ + r m(cos 8 1 + cos0 2 ) (7)
2riS2 = S,e - m(cos0 8 + cos 02) (8)
6

Then equation (5) becomes
Ir = (krr*) 2 S IS* 1 + e 2im(cos, + cos 02
1 x= (krr*)2 Is12 2 + 2 cos m(cos 018, + cos 82)
= 2k 2 irP Si2 1 + Cos 2 m(cos01 + cos 02) (9)
Note that the intensity given by equation (9) has zeros indicating the presence of fringes,
namely, when
1 + cos m(cos, + cos 2)] =0
or
2 (cos01 + cos0 2 )m = (2n-1) , n = 1, 2,3 .. , (10)
or
2n - 1m = 2- (11)
2(cos 0 1 + cos 02)
If 01 = 02 = 0, that is, normal incidence and reflection of the illuminating light and
normal displacement, then
2n - 1m = X (12)
4
This says that a fringe will be formed when the body moves an odd number of quarter
wavelengths between exposures.
7
Time-Averaged HNDT Technique
The method for forming a time-averaged hologram of a vibrating surface is
identical to that used for forming a hologram when a surface is stationary. If the
maximum amplitude of the vibration is limited to some 10's of light wavelengths,illumination of the hologram yields an image of the surface on which is superimposed a
number of observable interference fringes. It should be emphasized that these fringes are
contour lines of equal displacement of the surface. Whereas a few of these may be nodal
contours, most are contours of equal displacement plotted on the moving regions of the
surface.
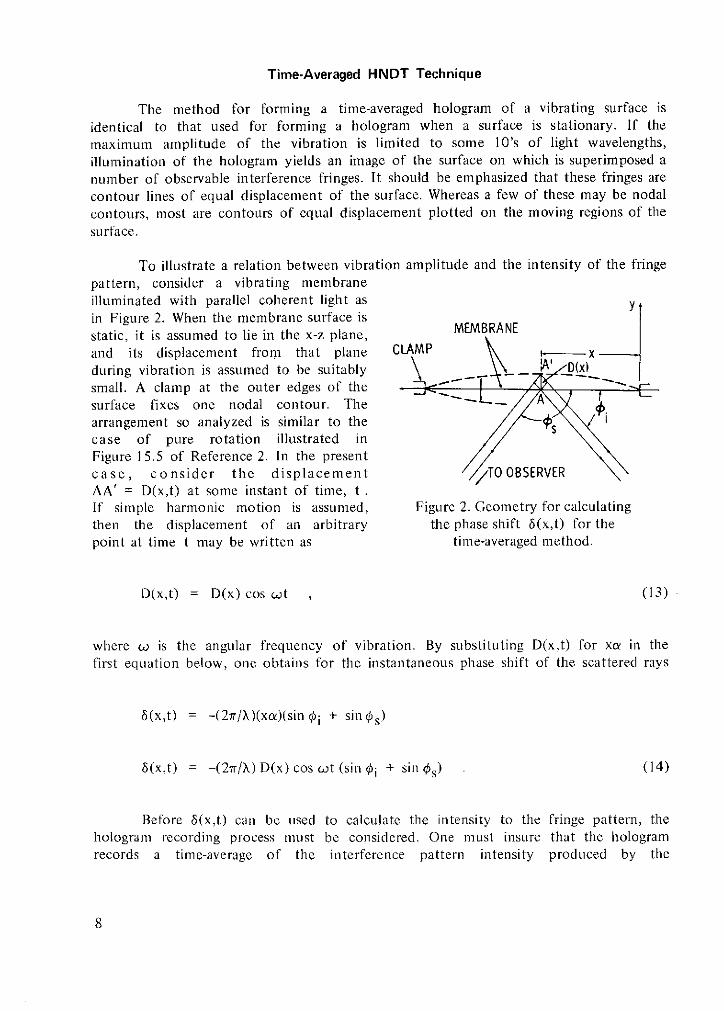
To illustrate a relation between vibration amplitude and the intensity of the fringe
pattern, consider a vibrating membraneilluminated with parallel coherent light asin Figure 2. When the membrane surface isstatic, it is assumed to lie in the x-z plane,and its displacement from that plane CLAMP--during vibration is assumed to be suitably IA' D(x)
small. A clamp at the outer edges of thesurface fixes one nodal contour. Thearrangement so analyzed is similar to thecase of pure rotation illustrated in
Figure 15.5 of Reference 2. In the presentcase, consider the displacement / TO00BSERVERAA' = D(x,t) at some instant of time, t.If simple harmonic motion is assumed, Figure 2. Geometry for calculatingthen the displacement of an arbitrary the phase shift 6(x,t) for thepoint at time t may be written as time-averaged method.
D(x,t) = D(x) cos wt (13)
where w is the angular frequency of vibration. By substituting D(x,t) for xo in the
first equation below, one obtains for the instantaneous phase shift of the scattered rays
6(x,t) = -(27r/X)(xa)(sin 0i + sin s)
6(x,t) = -(27r/X) D(x) cos wt (sin 0i + sin s) (14)
Before 6(x,t) can be used to calculate the intensity to the fringe pattern, thehologram recording process must be considered. One must insure that the hologramrecords a time-average of the interference pattern intensity produced by the
8
time-dependent subject complex amplitude at the hologram plane. In practice this means
that the exposure time should be long compared to the vibration period; in the present
calculation, however, one can average over exactly one period of vibration.
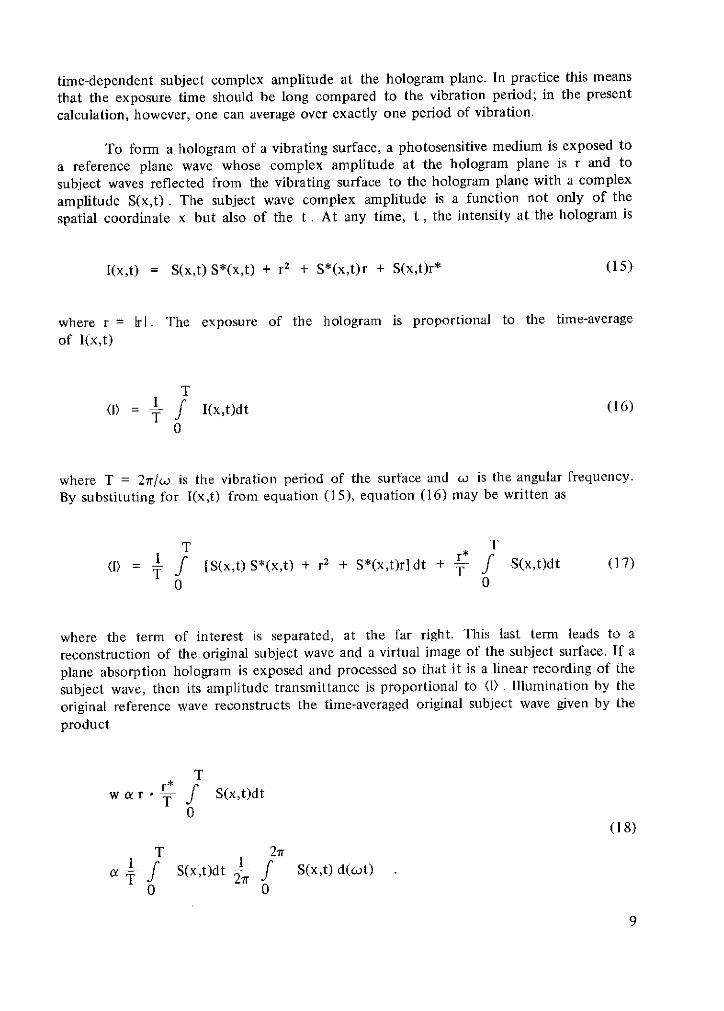
To form a hologram of a vibrating surface, a photosensitive medium is exposed to
a reference plane wave whose complex amplitude at the hologram plane is r and to
subject waves reflected from the vibrating surface to the hologram plane with a complex
amplitude S(x,t). The subject wave complex amplitude is a function not only of the
spatial coordinate x but also of the t . At any time, t , the intensity at the hologram is
I(x,t) = S(x,t) S*(x,t) + r2 + S*(x,t)r + S(x,t)r* (15)
where r = r I. The exposure of the hologram is proportional to the time-averageof I(x,t)
T(1) f I(x,t)dt (16)
0
where T = 27r/co is the vibration period of the surface and o is the angular frequency.By substituting for I(x,t) from equation (15), equation (16) may be written as
T T1 *
(I) = [S(x,t) S*(x,t) + r2 + S*(x,t)r]dt + f S(x,t)dt (17)
0 0
where the term of interest is separated, at the far right. This last term leads to a
reconstruction of the original subject wave and a virtual image of the subject surface. If a
plane absorption hologram is exposed and processed so that it is a linear recording of the
subject wave, then its amplitude transmittance is proportional to (I) . Illumination by the
original reference wave reconstructs the time-averaged original subject wave given by theproduct
Tr*
wa r f S(x,t)dt0
(18)
T 2rr
a - f S(x,t)dt 2- f S(x,t) d(ct)0 0
9

The mathematical form of equation (17) holds for the light coming from anysubject point and for the wave front of the subject light at an arbitrary distance from thesubject. Suppose a(x,t) represents the instantaneous complex amplitude of the lightarriving at an observation point P from a point A on the vibrating surface. One maywrite a(x,t) as
a(x,t) = a(x) exp[ib(x,t)] (19)
where a(x) is the complex amplitude at P when the vibrating surface lies in the x-zplane and where 6(x,t) [given in equation (14)] is the extra phase difference producedby the displacement of the surface D(x,t) . If a(x,t) is substituted for S(x,t) in equation(18), the complex amplitude of the reconstruction of the wave originally travelingfrom A to P may be written as
2rr
wA a a(x) = f exp[i5(x,t)] d(wt) , (20)0
The integral in equation (20) presents interference at the point P of light from theundisplaced point A with that from corresponding points A', A", etc., where the latterare all the displaced positions of A produced by the vibration. By substituting 6(x,t)from equation (14) into equation (20), one can evaluate the factor modulating thecomplex amplitude a(x) of the wave coming from the undisplaced surface. Thus,
27r
Ir f exp[i5(x,t)] d(wt)27r0
2 exp.-i 27 D(x) - (sin 0i + sin s) cos cot d(wt)
0
= D(x) - (sin + sin0s) ]
10

where J0 is the zero-order Bessel function of argument (2nr/X)D(x) - (sin 0i + sin 0s).The intensity at the observation point is
WA w* a a(x) a*(x) [Jo D(x) - (sin 0i + sin s)}2 . (21)
Equation (21) indicates that the dark fringes in the observed interference pattern of asinusoidally vibrating surface correspond to the zeros of the J 0
2 function, and the brightfringes correspond to the maxima of the function. These maxima decrease with increasingvalues of the argument with increasing displacement amplitude D(x). The fall-off ofintensity limits the number of fringes which have sufficient visibility to be seen by anobserver.
Time-averaged holography enables the vibrational amplitudes of diffuselyreflecting surfaces to be measured with interferometric precision. It eliminates the needto place sensing elements of any sort in contact with the vibrating surface. Curvature ofthe surface is not a factor as it is when Chladni patterns are employed. The method hasbeen applied to the study of a variety of vibrating objects ranging from quartz crystals totreble-viol plates and can yield greater detail about the antinodal region than previoustechniques. There are, however, limitations which have prompted an investigation ofother means to extend holography to the study of vibrating objects. One of theselimitations, the diminution in fringe visibility as the vibration amplitude increases, hasalready been cited. Another is that the relative phase of the vibration is not given by themeasurement.
DEPENDENCE OF HOLOGRAPHIC SENSITIVITY ON THE GEOMETRYOF OPTICAL COMPONENTS
Because holography is an interference phenomenon, the total change in pathlength, Ad, of the object beam during the exposure must be less than X/2 (i.e., k 2-r/X =r). Due to this severe restriction, the geometry of the optical arrangement employedbecomes of utmost importance to the successful recording of a moving object or particle.Therefore, attention is directed to two limiting cases of sideband geometry.
Consider the holographic arrangement of Figure 3. This constitutes a verydesirable arrangement for a stationary object because of the high energy return from theobject to the film plate. For this case, the radiation propagation vector Z is both paralleland antiparallel to the direction of the intended object motion, Ax . Consider that duringthe exposure the object moves from position x0 to a new position x,; the objecttranslation is Ax. Then the total optical path length change is
Ad = 2Ax
11

B/S MIRROR
LASER \-
OBJECTOBJECT t--- x
BEAM to 1 ax
k REFERENCE/BEAM
MIRRORMIRROR
PLATE
Figure 3. Minimum motion geometry.
yet, using the limiting requirement for the allowed change in optical path length of aholographic arrangement,
2Ax < X/2
or
Ax < /4
and the object cannot travel a total distance greater than X/4 if one is to successfullyrecord a hologram. This was an obvious result when the object motion, Ax , was allowedto be along the direction of the radiation propagation vector, r. This geometry allowsthe minimum object motion during the exposure.
A contrasting case is afforded by Figure 4. The basic difference in geometrybetween this and the previous arrangement is the rotation of one mirror. Everything is asbefore except that now the direction of motion, Ax , of the object is perpendicular to
12

LASER B/S REFERENCE BEAM MIRROR
OBJECTBEAM
MIRROR MIRROR
X0 X1
PHOTOGRAPHIC PLATE
Figure 4. Maximum motion geometry.
the propagation vector Z. The result is, of course, that now the magnitude of Ax maybe as large as desired without any change occurring in the object beam path length. Forthis geometrical arrangement then
Ad - 0
Of course, if one expects to resolve the object in the hologram with such anarrangement, the allowed Ax is not totally unlimited. As a rule of thumb, it may nottravel further than one-tenth of its length during the exposure due to resolutionrequirements. But this is an unusually large distance compared to X/2 . The price paid forthis large motion is that no resolution of front surface detail has been recorded. Theimage simply appears as a black silhouette against a lighted background.
Because the sensitivity of holography is a function of the geometry employed forthe optical components, a unique HNDT system with variable sensitivity has been devisedwhich allows any form of loading, i.e., change in subject amplitude as a result of loading.This is accomplished by proper selection of geometry which allows minimum change inoptical components to control the expected sensitivity. This system will be described inthe following section.
13

DESCRIPTION OF A COMPOSITE MOBILE HOLOGRAPHIC NONDESTRUCTIVETESTING TECHNIQUE - A VARIABLE SENSITIVITY SYSTEM
Using a variable sensitivity system, all methods of HNDT can be accommodated
with basically the same holographic arrangement. Attention is directed to Figure 5.
Configuration No. 1 may be described as follows: Radiation emitted from the laser is
incident on the field mirror assembly which contains a spatial filter and essentially abeam splitter. This assembly or unit is translatable to the left along the path ASb . The
reflected portion of the radiation is made incident on the micrometer translatable object
in such a direction as to make an angle 0 = 0 with the perpendicular bisector of this
object. This radiation is then turned antiparallel to itself where it passes on to the film
recorder. The film recorder is itself translatable to the right along the path Af.
The radiation transmitted through the field mirror assembly is incident on
mirror M , which is itself translatable to the right along path Am . From here it is turned
to be incident on the film. recorder and interferes with the object beam.
Configuration No. 2 may be traced in a similar fashion, except that the object
beam makes some angle 0 > 0 with the perpendicular bisector of the object.
The system is composite because ones needs to only slightly manipulate three
components (field mirror assembly, mirror M , and film recorder) to change from one
method of HNDT to another. It is not necessary to establish a new geometry in order to
perform the various HNDT methods. The system is mobile because all of the optical
components are mounted on a precalibrated rigid table and may be locked in any
position along their translatable paths. The system has variable sensitivity (which affords
the composite structure) by virtue of the control over the angle 0 which the objectbeam makes with the perpendicular bisector of the object.
Attention is directed to equation (11) of the double-exposure technique where.itwas shown that zeros indicating the presence of fringes occur for
2n - 1m =2(cos Bi + cos.0 s)
Consider the case of 0i = 02 = 0, X = 5145A ; then equation (11) becomes
= 5145Am = (2n - 1) = (2n - 1) 4
14

CONFIGURATION #1 MICROMETER
0i = 0 x TRANSLATABLEOBJECT
81 02 = 0
FIELDMIRRORASSEMBLY Am
LASER I
ASb
FILM Af
CONFIGURATION #2
Oi > 0x
FIELD MIRRORASSEMBLY
1102 01 =02> 0
MICROMETERTRANSLATABLEOBJECT
LASER
ASb
Af
Figure 5. Composite mobile holographic nondestructive test system.
15

which says that the movement of the object (parallel or antiparallel to the k vector) of0.1286 pm will be sufficient to cause one fringe to appear on the object.
On the other hand, consider the case of 01 = 02 = 75 deg and,again, X = 5145A; then equation (11) becomes
X 5145Am = (2n - 1) 1.0353 - (2n - 1) 1.3531.0353 1.353
which says that in order to obtain one fringe on the object the movement of the object(in the same direction) must be as great as 0.4970 pm. While both of these movementsare small, their relative values differ by about one-half order of magnitude. This providesan indication of the variation of sensitivity of this system by the minute adjustment ofthree single components on a precalibrated mobile table. The table is precalibrated interms of the desired sensitivity.
Figure 6 shows the result of movement along the k vector for the twoconfigurations of the system. For both configurations, the translation of the object isalong the negative z direction (see Figure 5).
EXPERIMENTAL RESULTS
The composite mobile holographic technique was applied to severalsandwich-structured samples of the radome of the Pershing missile system in which somespecific programmed flaws had been placed. The technique was applied to determine andlocate these flaws in order to develop a confidence in this technique as a possiblecandidate for use as a testing technique on the radome itself.
The Test Samples
The test samples were fiberglass-epoxy-ceramic sandwich structures as illustratedin Figure 7. Three kinds of flaws, or debonds, were programmed into the structure; thelocations of these are represented by the dashed lines of Figure 7. Three test samples,15.24 cm X 15.24 cm (6 in. X 6 in.), were provided for these tests. Figure 8 is aphotograph showing the fiberglass side, the ceramic side, and one edge. Common to thethree samples, called plates 1, 2, and 3, respectively, was an AF-32 plug which wasformed and precured prior to installation into the epoxy layer of the sandwichedstructure. Plates 1 and 2 had fingerprints of grease at the epoxy-ceramic interface, and
16

= 2 = 0 Ad = 0.1286t m
Az = 0
Figure 6. Results of controlled object movement.
17

81 = 12 = 15deg Ad = 1.333pm
Az = 1.5 lim
Az = 0.25 jm
Figure 6. (Concluded).
18

the same type of fingerprints were placed at the fiberglass-epoxy interface on plate 3. Thearea location of the 2.54-cm diameter Teflon disc was identical for all three plates, yet
the interface position was different for allEPOXY, 0.08 cm (0.03 in.) THICK / CERAMIC, 1.3 cm (0.5 in.) THICK three. The disc was placed at the.EGA fiberglass-epoxy interface on plate 1, at the
(0.09 in.)THICK 5.08cm ceramic-epoxy interface for plate 2, and inin (2 in.) . the middle of four plies of epoxy for
A2, .25 in.) plate 3.DIA. AF32
FINGER - PLUG, PRECURED
PRINTSOF GREASE .0 The physical characteristics of the
2.54 cm (1.0 in.)1 cm TEFLON CIRCLE ample components and programmed flaws
5.08 .w -are described as follows:(2 in.) (1.5 in.)
15.24 an ( in.) -The ceramic material employed forthe sandwich structures tested was a high
Figure 7. The structure of test samples. purity, slip-cast fused silica (SiO 2 ). It is anoncrystalline or amorphous materialobtained from melting any of the crystalline
forms of silica. Its density is about 3.75 gm/cm3 (234 lb/ft3 ) and its softening point is17290C (31440 F). The tensile strength of the material ranges from 1.33 X 10⁷
dyne/cm2 (6 X 10³ psi) to 2.2 X 10⁷ dyne/cm2 (104 psi) in the temperature range 93to 538 0C (200 to 1000°F). The compressive strength in the corresponding temperaturerange is an order of magnitude higher than the tensile strength. The thermal conductivityis approximately 4.2 X 10- 3 cal/cm-sec-oC (0.5 BTU/ft-hr-oF), with a specific heat of0.18 cal/gm-oC (0.18 BTU/lb-oF) and a flexural strength of 1.08 dyne/cm2 (6.5 X 10³psi).
An S fiberglass was used which consisted of eight layers of glass cloth heldtogether by 30 to 33 percent epoxy resin (ERL epoxy 2256-tonox 6040). It had a
Figure 8. Photograph of test samples.
19

thermal conductivity of 0.198 cal/gm-°C (0.198 BTU/lb-°F) and a density of 1.76
gm/cm 3 (110 lb/ft3 ). The fiberglass and ceramic were bonded together by the AF-32
epoxy (3M Company). The thermal conductivity of this epoxy was 2.94 X 10⁻³
cal/cm-sec-'C (0.35 BTU/ft-hr-'F), the specific heat was 0.45 cal/gm-C (0.45
BTU/lb-oF), and the density was 1.52 gm/cm3 (95 lb/ft3 ). Four plies of the epoxy were
used, resulting in a total thickness of 0.2286 cm (0.09 in.).
The Sample Holder
A schematic of the sample holder, for the positive pressure loading, is shown in
Figure 9. The test sample is clamped from the front by a set of eight set screws; then
positive gas pressure is applied from the air inlet located in the center of the holder back.
Because of the positive air pressure acting on the "0" ring, all leaks are sealed and a
positive pressure may be maintained for a reasonable time. Photographs showing the front
and rear views of the holder are presented in Figure 10.
3/8-16 BOLTS, 3.2 cm (1.25 in.)
A LONG, 8 REQUIRED
0.64 cm (0.25 in.) NOM.O O O DIA. "O-RING" MATERIAL
AS REQUIREDSAMPLE SAMPLE HOLDER BASE,
DWG. NO. 30232 1 REQ'D
PLATEDWG. NO.
302301 REQ'D
SECTION A-AAJ
Figure 9. Sample holder assembly schematic.
20

a. Front view. b. Rear view.
Figure 10. Photograph of sample holder.
The Experimental Procedure
The experimental procedure for this testing consisted of the following steps:
1. Loading a test sample in the holder, checking for pressure leaks, and placingthis holder properly in the holographic system.
2. Obtaining a reference hologram of the test sample and accurately replacingthis hologram back into position in the holographic system such that the virtual image ofthe reference hologram was superimposed on the real test object.
3. Observing the interference pattern for sequential continuous changes in thepositive pressure loading.
4. Recording the fringe variations by taking photographs of the virtual imagethrough the hologram.
These steps constitute the real-time observation of the fringe pattern (real-timeinterferometry) and the search mode necessary to determine if the loading techniqueemployed is adequate to locate the flaws or debonds. Finally, a double-exposurehologram is obtained as a permanent holographic record of the observed flaw or debond.This hologram is based on the information obtained from the real-time search modediscussed above.
21

DISCUSSION OF RESULTS
Several hundred holograms were taken during the testing series of the positive
pressure loading technique. The holographic results from three of the tests are shown in
Figures 11, 12, and 13, which are photographs taken through the hologram.
Figure 11 displays some results of test sample plate 2, which was positioned in
the sample holder with the fiberglass side facing outward. The hologram in the precision
holder was taken while the plate was at a pressure of 5.5 X 10³ dyne/cm 2 (2.5 psi). The
interference pattern of Figure 11 was photographed after a pressure change of 1.1 X 10³
dyne/cm 2 (0.5 psi). The figure depicts two distorted regions in an otherwise concentric
elliptical fringe pattern. One is in the center of the left-hand side of the plate; the other
distortions are the kinks observed in the lower right-hand corner. These distortions
persisted when the pressure was increased. The first distorted region (to the left)
coincided with the position of the programmed flaw of the grease fingerprints. The
second distorted region (lower left) coincided with the location of the Teflon disc. As the
pressure was lowered to 1.1 X 10' dyne/cm 2 (0.5 psi), the fringes appeared to
completely surround the Teflon disc. This phenomenon is shown in Figure 12, which was
photographed with the overhead lights off. Although a third flaw, the AF-32 plug, was
said to be present in the right-hand corner, it was never observed on this plate. Also,
throughout the testing using the positive pressure technique, no flaws were observed for
plate 1. Figure 13 presents a photograph of the real-time fringes of plate 3. The reference
pressure on the test plate was 6.6 X 10⁴ dyne/cm 2 (30 psi), and the observed fringes
were formed at the pressure of 6.76 X 10⁴ dyne/cm 2 (30.375 psi). This fringe distortion
in the right-hand corner essentially coincides with the position of the programmed flaw
of the AF-32 plug. Incidentally, this flaw on this plate was persistent in some form of
distortion over a wide range of pressure loading.
A similar procedure when applied to all three test plates with the ceramic side
facing outward provided no observable distortions in an otherwise concentric fringe
pattern.
In summary, with the pressure loading technique the following observations were
made on the fiberglass side: two of the programmed flaws in plate 2, one programmed
flaw in plate 3, and none in plate 1. No significant distortions of the fringes were
observed on the ceramic side. Since all three kinds of flaws have been observed and since
the system is highly sensitive to minute surface variations on the order of a quarter of a
micron, the only explanation for its nondetection of all flaws on all plates is that these
undetected flaws must have rebonded to the epoxy during the curing process. It has been
learned subsequently from the test sample supplier that the rebonding probability does
exist. The fact that no indications of any programmed flaws appeared on the ceramic side
is probably because the ceramic material is both harder and many times thicker than the
fiberglass. Efforts at higher pressures for the ceramic case proved negative since the
ceramic tends to crack.
22

occ
u CI
WE
S.
1:41 a
v~co N
%i
E )

Figure 12. Real-time hologram of plate number 2,P = 4.4 X 10³ dyne/cm2 (2.0 psi).
Thermal and vibration loading studies of these samples are presently under way,and the data are being analyzed. These different loading techniques are being employedto see if the flaws which failed to show up in the pressure loading tests will appear as aresult of their different characteristics with regard to thermal conductivity and resonantfrequencies.
George C. Marshall Space Flight CenterNational Aeronautics and Space Administration
Marshall Space Flight Center, Alabama, October 1973983-15-28-0000
24

Figure 13. Real-time hologram of plate number 3,P = 6.76 X 10⁴ dyne/cm2 (30.375 psi).
25
REFERENCES
1. Schliekelmann, R.J.: Holographic Interference as a Means for Quality Determinationof Adhesive Bonded Metal Joints. International Council of the Aeronautical Sciences,8th Congress, Amsterdam, Netherlands, Aug. 28 - Sept. 2, 1972.
2. Aprahamian, R.: Some Useful Equations of Holography. TRW Systems Group ReportNo. AM 70-2, Jan. 1970.
BIBLIOGRAPHY
Chu, W.P.; Robinson, D.M.; and Goad, J.H.: Holographic Nondestructive Testing withImpact Excitation. App. Opt., vol. 11, July 1972, pp. 1644-1645.
Collier, Burckhardt, and Lin: Optical Holography. Academic Press, New York, 1971.
The Thermal and Mechanical Properties of Slip-Cast Fused Silica from 70 0F to 22000F.Final Report to Georgia Institute of Technology, Southern Research Institute.
Walton, J. D., Jr.: Radome Engineering Handbook. Marcel Dekker, Inc., New York, 1970,pp. 275-283.
NASA-Langley, 1974