Embed Size (px)
Citation preview
RIGOL – Uncompromised Performance... Unprecedented Value ` PAGE 1
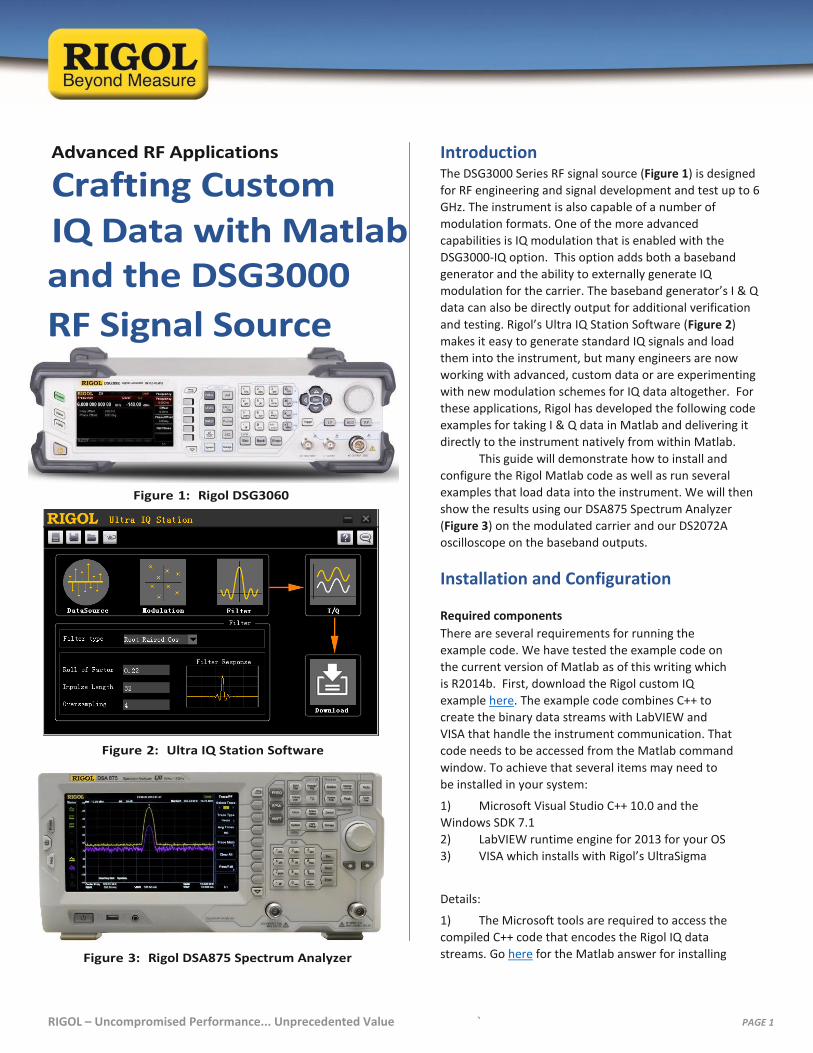
Introduction The DSG3000 Series RF signal source (Figure 1) is designed
for RF engineering and signal development and test up to 6
GHz. The instrument is also capable of a number of
modulation formats. One of the more advanced
capabilities is IQ modulation that is enabled with the
DSG3000-IQ option. This option adds both a baseband
generator and the ability to externally generate IQ
modulation for the carrier. The baseband generator’s I & Q
data can also be directly output for additional verification
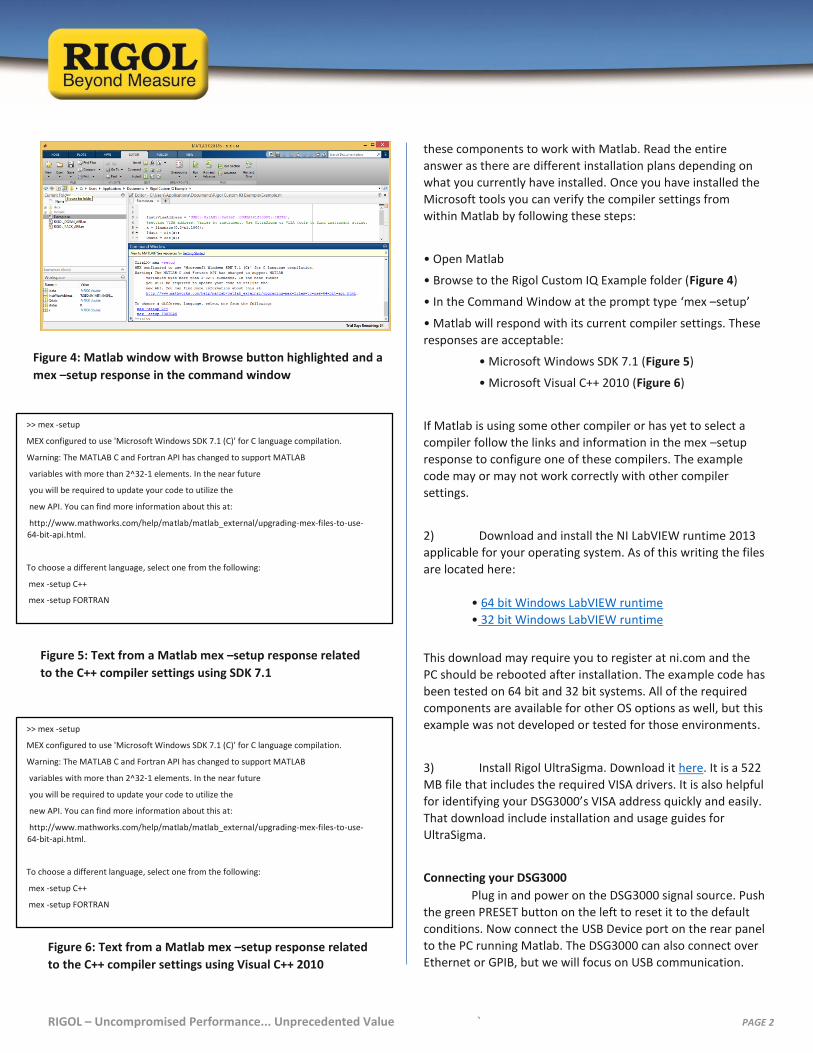
and testing. Rigol’s Ultra IQ Station Software (Figure 2)
makes it easy to generate standard IQ signals and load
them into the instrument, but many engineers are now
working with advanced, custom data or are experimenting
with new modulation schemes for IQ data altogether. For
these applications, Rigol has developed the following code
examples for taking I & Q data in Matlab and delivering it
directly to the instrument natively from within Matlab.
This guide will demonstrate how to install and
configure the Rigol Matlab code as well as run several
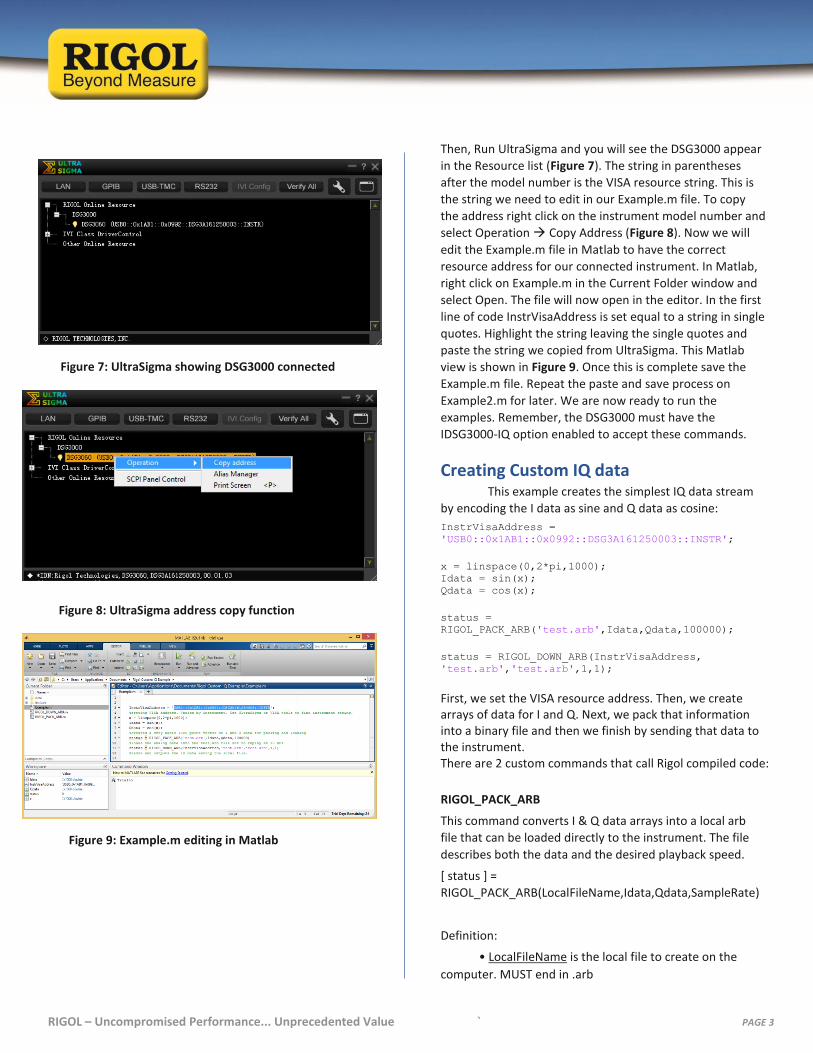
examples that load data into the instrument. We will then
show the results using our DSA875 Spectrum Analyzer
(Figure 3) on the modulated carrier and our DS2072A
oscilloscope on the baseband outputs.
Installation and Configuration
Required components There are several requirements for running the
example code. We have tested the example code on
the current version of Matlab as of this writing which
is R2014b. First, download the Rigol custom IQ
example here. The example code combines C++ to
create the binary data streams with LabVIEW and
VISA that handle the instrument communication. That
code needs to be accessed from the Matlab command
window. To achieve that several items may need to
be installed in your system:
1) Microsoft Visual Studio C++ 10.0 and the
Windows SDK 7.1
2) LabVIEW runtime engine for 2013 for your OS
3) VISA which installs with Rigol’s UltraSigma
Details:
1) The Microsoft tools are required to access the
compiled C++ code that encodes the Rigol IQ data
streams. Go here for the Matlab answer for installing
and the DSG3000
RF Signal Source
RIGOL – Uncompromised Performance... Unprecedented Value ` PAGE 2
these components to work with Matlab. Read the entire
answer as there are different installation plans depending on
what you currently have installed. Once you have installed the
Microsoft tools you can verify the compiler settings from
within Matlab by following these steps:
• Open Matlab
• Browse to the Rigol Custom IQ Example folder (Figure 4)
• In the Command Window at the prompt type ‘mex –setup’
• Matlab will respond with its current compiler settings. These
responses are acceptable:
• Microsoft Windows SDK 7.1 (Figure 5)
• Microsoft Visual C++ 2010 (Figure 6)
If Matlab is using some other compiler or has yet to select a
compiler follow the links and information in the mex –setup
response to configure one of these compilers. The example
code may or may not work correctly with other compiler
settings.
2) Download and install the NI LabVIEW runtime 2013
applicable for your operating system. As of this writing the files
are located here:
• 64 bit Windows LabVIEW runtime
• 32 bit Windows LabVIEW runtime
This download may require you to register at ni.com and the
PC should be rebooted after installation. The example code has
been tested on 64 bit and 32 bit systems. All of the required
components are available for other OS options as well, but this
example was not developed or tested for those environments.
3) Install Rigol UltraSigma. Download it here. It is a 522
MB file that includes the required VISA drivers. It is also helpful
for identifying your DSG3000’s VISA address quickly and easily.
That download include installation and usage guides for
UltraSigma.
Connecting your DSG3000 Plug in and power on the DSG3000 signal source. Push
the green PRESET button on the left to reset it to the default
conditions. Now connect the USB Device port on the rear panel
to the PC running Matlab. The DSG3000 can also connect over
Ethernet or GPIB, but we will focus on USB communication.
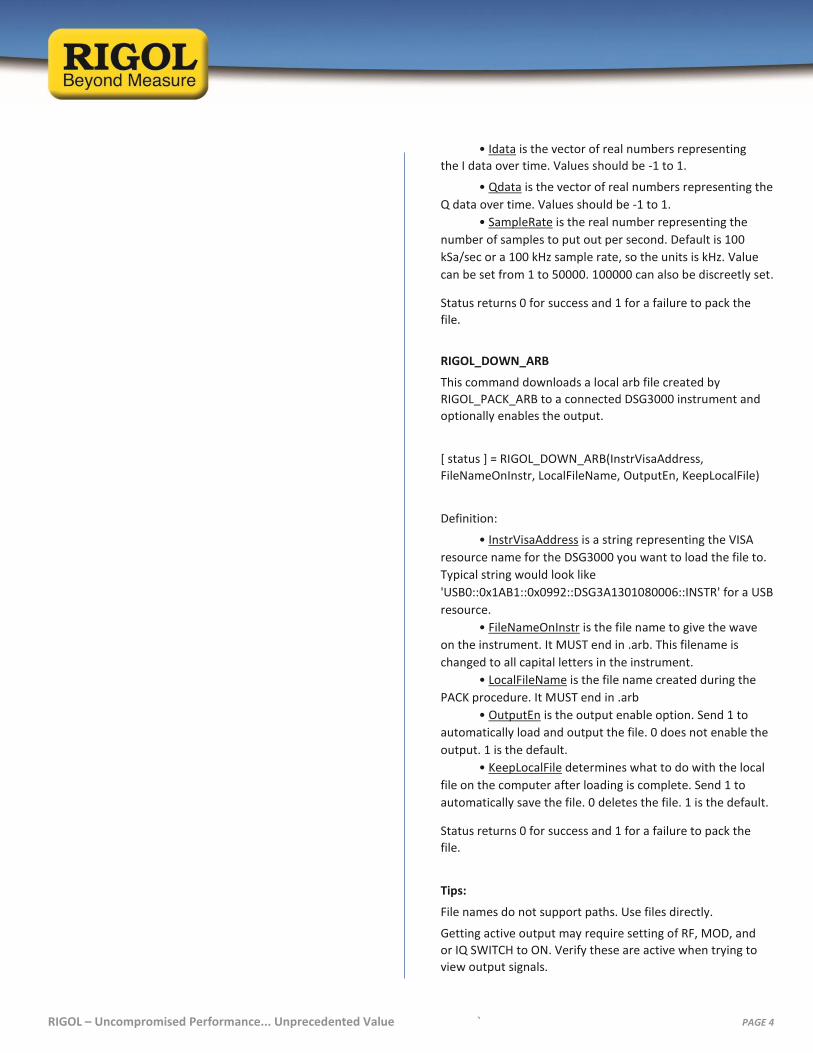
Figure 4: Matlab window with Browse button highlighted and a
mex –setup response in the command window
Figure 5: Text from a Matlab mex –setup response related
to the C++ compiler settings using SDK 7.1
>> mex -setup
MEX configured to use 'Microsoft Windows SDK 7.1 (C)' for C language compilation.
Warning: The MATLAB C and Fortran API has changed to support MATLAB
variables with more than 2^32-1 elements. In the near future
you will be required to update your code to utilize the
new API. You can find more information about this at:
http://www.mathworks.com/help/matlab/matlab_external/upgrading-mex-files-to-use-
64-bit-api.html.
To choose a different language, select one from the following:
mex -setup C++
mex -setup FORTRAN
Figure 6: Text from a Matlab mex –setup response related
to the C++ compiler settings using Visual C++ 2010
RIGOL – Uncompromised Performance... Unprecedented Value ` PAGE 3
Then, Run UltraSigma and you will see the DSG3000 appear
in the Resource list (Figure 7). The string in parentheses
after the model number is the VISA resource string. This is
the string we need to edit in our Example.m file. To copy
the address right click on the instrument model number and
select Operation Copy Address (Figure 8). Now we will
edit the Example.m file in Matlab to have the correct
resource address for our connected instrument. In Matlab,
right click on Example.m in the Current Folder window and
select Open. The file will now open in the editor. In the first
line of code InstrVisaAddress is set equal to a string in single
quotes. Highlight the string leaving the single quotes and
paste the string we copied from UltraSigma. This Matlab
view is shown in Figure 9. Once this is complete save the
Example.m file. Repeat the paste and save process on
Example2.m for later. We are now ready to run the
examples. Remember, the DSG3000 must have the
IDSG3000-IQ option enabled to accept these commands.
Creating Custom IQ data This example creates the simplest IQ data stream
by encoding the I data as sine and Q data as cosine:
InstrVisaAddress =
'USB0::0x1AB1::0x0992::DSG3A161250003::INSTR';
x = linspace(0,2*pi,1000);
Idata = sin(x);
Qdata = cos(x);
status =
RIGOL_PACK_ARB('test.arb',Idata,Qdata,100000);
status = RIGOL_DOWN_ARB(InstrVisaAddress,
'test.arb','test.arb',1,1);
First, we set the VISA resource address. Then, we create arrays of data for I and Q. Next, we pack that information into a binary file and then we finish by sending that data to the instrument. There are 2 custom commands that call Rigol compiled code:
RIGOL_PACK_ARB
This command converts I & Q data arrays into a local arb
file that can be loaded directly to the instrument. The file
describes both the data and the desired playback speed.
[ status ] =
RIGOL_PACK_ARB(LocalFileName,Idata,Qdata,SampleRate)
Definition:
• LocalFileName is the local file to create on the
computer. MUST end in .arb
Figure 7: UltraSigma showing DSG3000 connected
Figure 8: UltraSigma address copy function
Figure 9: Example.m editing in Matlab
RIGOL – Uncompromised Performance... Unprecedented Value ` PAGE 4
• Idata is the vector of real numbers representing
the I data over time. Values should be -1 to 1.
• Qdata is the vector of real numbers representing the
Q data over time. Values should be -1 to 1.
• SampleRate is the real number representing the
number of samples to put out per second. Default is 100
kSa/sec or a 100 kHz sample rate, so the units is kHz. Value
can be set from 1 to 50000. 100000 can also be discreetly set.
Status returns 0 for success and 1 for a failure to pack the
file.
RIGOL_DOWN_ARB
This command downloads a local arb file created by
RIGOL_PACK_ARB to a connected DSG3000 instrument and
optionally enables the output.
[ status ] = RIGOL_DOWN_ARB(InstrVisaAddress,
FileNameOnInstr, LocalFileName, OutputEn, KeepLocalFile)
Definition:
• InstrVisaAddress is a string representing the VISA
resource name for the DSG3000 you want to load the file to.
Typical string would look like
'USB0::0x1AB1::0x0992::DSG3A1301080006::INSTR' for a USB
resource.
• FileNameOnInstr is the file name to give the wave
on the instrument. It MUST end in .arb. This filename is
changed to all capital letters in the instrument.
• LocalFileName is the file name created during the
PACK procedure. It MUST end in .arb
• OutputEn is the output enable option. Send 1 to
automatically load and output the file. 0 does not enable the
output. 1 is the default.
• KeepLocalFile determines what to do with the local
file on the computer after loading is complete. Send 1 to
automatically save the file. 0 deletes the file. 1 is the default.
Status returns 0 for success and 1 for a failure to pack the
file.
Tips:
File names do not support paths. Use files directly.
Getting active output may require setting of RF, MOD, and
or IQ SWITCH to ON. Verify these are active when trying to
view output signals.
RIGOL – Uncompromised Performance... Unprecedented Value ` PAGE 5
Custom IQ Test and Verification Now that we have explained the functions we can
run the examples provided. The first example, which we
have already discussed, creates a simple sine wave and
cosine wave in the I & Q data respectively. We test and
verify this with our DS2072A oscilloscope. First, connect the
Baseband I & Q outputs on the rear panel of the DSG3000
to the channel 1 and channel 2 inputs of the oscilloscope. I
out should be connected to channel 1. Q out is connected
to channel 2.
Then, run Example.m by right clicking on the name in
the current folder window in Matlab. Select Run from the
popup. The code will execute and after a few seconds the
outputs will appear on the oscilloscope. You can reset the
DS2072A oscilloscope to the factory defaults:
• Push Storage
• Select Default
Then, from the factory settings Push AUTO. For our
purposes we want to see the relationship in phase between
I & Q. While it is a simple comparison because the sine and
cosine are 90° out of phase, it is still instructive to view in XY
mode. Push the HORIZONTAL MENU button and under TIME
BASE select XY. By adjusting the channel scales and offsets
you can center that image to get to Figure 10. This view is
relevant because it is similar to a basic constellation
decoding view used for signals encoded with phase
information.
Lastly, we can run Example2.m the same way. This
file generates IQ data that traverses a basic 4 x 4
constellation diagram and repeats as shown in Figure 11.
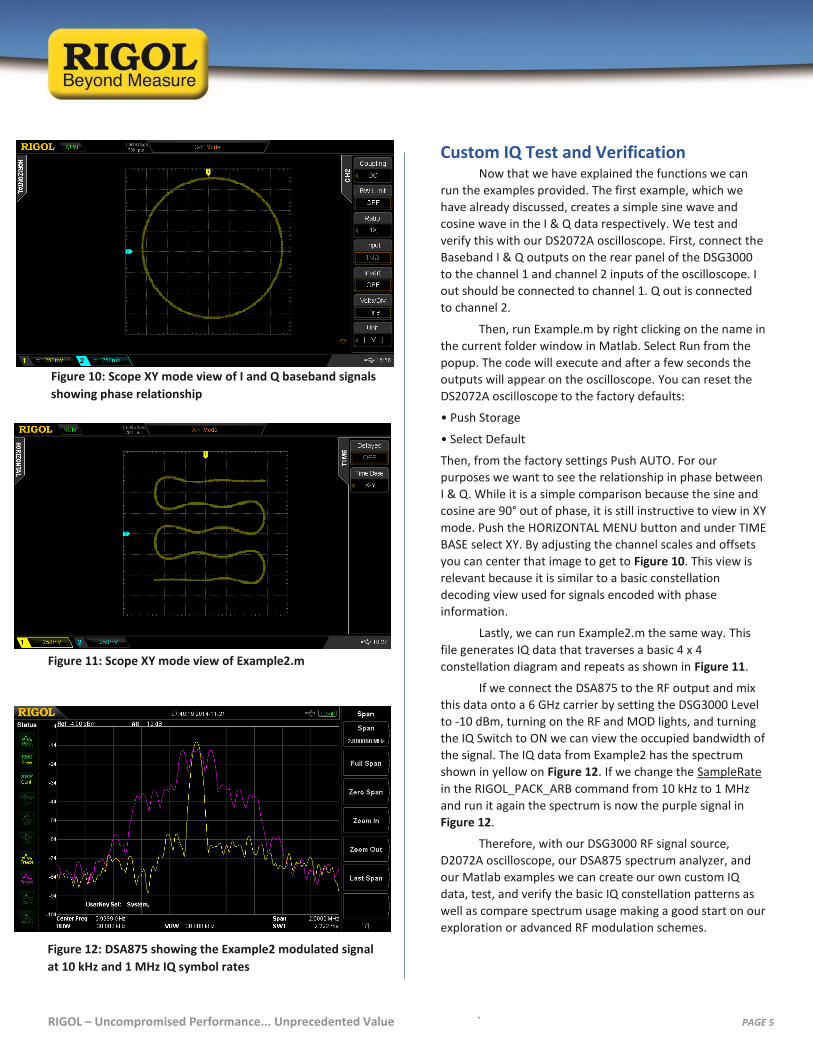
If we connect the DSA875 to the RF output and mix
this data onto a 6 GHz carrier by setting the DSG3000 Level
to -10 dBm, turning on the RF and MOD lights, and turning
the IQ Switch to ON we can view the occupied bandwidth of
the signal. The IQ data from Example2 has the spectrum
shown in yellow on Figure 12. If we change the SampleRate
in the RIGOL_PACK_ARB command from 10 kHz to 1 MHz
and run it again the spectrum is now the purple signal in
Figure 12.
Therefore, with our DSG3000 RF signal source,
D2072A oscilloscope, our DSA875 spectrum analyzer, and
our Matlab examples we can create our own custom IQ
data, test, and verify the basic IQ constellation patterns as
well as compare spectrum usage making a good start on our
exploration or advanced RF modulation schemes.
Figure 10: Scope XY mode view of I and Q baseband signals
showing phase relationship
Figure 11: Scope XY mode view of Example2.m
Figure 12: DSA875 showing the Example2 modulated signal
at 10 kHz and 1 MHz IQ symbol rates

RIGOL – Uncompromised Performance... Unprecedented Value ` PAGE 6
For more information please go to rigolna.com, contact us
directly at [email protected] or call us toll free at 877-4-
RIGOL-1.
Rigol Technologies USA
10200 SW Allen Blvd, Suite C
Beaverton, OR 97005
877.474.4651

![RF - AdvanIDe...Data rate = F RF /16 0 01 NRZ data stream Manchester coded RF field Manchester coded Modulator signal 4 4681C–RFID–09/05 ATA5558 [Preliminary] Figure 2-2. Bi-phase](https://img.pdfslide.net/doc/110x75/60fea832d961fb4d750fd53a/rf-advanide-data-rate-f-rf-16-0-01-nrz-data-stream-manchester-coded-rf.jpg)