Embed Size (px)
Citation preview
Central fatigue after prolonged running
Andrezza Saldanha de Oliveira Guimarães
THE SWEDISH SCHOOL OF SPORT
AND HEALTH SCIENCES
Essay for the degree of Master in Sports 2006: 12
Supervisor: Maria Ekblom, PhD
2
Abstract
Purpose
The aim of this study was to examine fatigue in the plantar flexor muscle group after a prolonged
running exercise.
Methods
Eight healthy, habitually active male subjects ran on a motorized treadmill during 2 hours at a
speed chosen to promote 70-75% VO2max. To evaluate fatigue the twitch interpolation technique
was employed in the plantar flexor muscle group before and immediately after running. To
achieve this, the isometric maximal voluntary contraction (MVC) as well as the electrically
induced twitch produced during the MVC (IT) and with the muscle at rest (RT) were measured.
The level of activation (LOA) during each MVC was calculated as LOA (%) = 100 · (1 – IT · RT-
1). Fatigue was defined as a decrease in MVC after running. Central fatigue was defined as a
decrease in the LOA, and peripheral fatigue as a decrease in the RT.
Results
MVC decreased significantly from before to after running (from 148.3 ± 16 to 120.8 ± 30.7 Nm;
-19 ± 19%). There was central fatigue with a reduction of 19 ± 15% in the LOA (from 83 ± 16 %
to 68 ± 20 % after running). Peripheral fatigue did not occur as the RT did not change
significantly between before and after running (61.2 ± 10.0 and 57.4 ± 9.5 Nm, respectively). The
changes in MVC were correlated to the changes in LOA (r = 0.90; p = 0.02), and could explain
82% (r2 = 0.82) of the changes in MVC. On the contrary, no significant relationship existed
between the changes in MVC and changes in RT (r = -0.35; p = 0.39). However, when using
multiple regression analysis the changes in LOA and RT together were able to explain 83% (r2 =
0.83; p = 0.01) of the changes in MVC.
Conclusion
In contrast to some previous studies using the twitch interpolation technique to investigate fatigue
during whole body prolonged exercise, this study employed supramaximal electrical stimulation
over a nerve that activates only agonists and no antagonist muscles. The results demonstrates that
after 2 h of continuous treadmill running the reduction on isometric maximal voluntary
contraction during plantar flexion was caused by central fatigue.
Key words: central fatigue, peripheral fatigue, twitch interpolation technique

3
Contents
1 INTRODUCTION..................................................................................................................4
2 METHODS .............................................................................................................................6
2.1 Subjects ...............................................................................................................................6
2.2 First session.........................................................................................................................6
2.3 Main session ........................................................................................................................6
2.4 Measurement and experimental procedures ...................................................................7
2.4.1 Strength measurements ....................................................................................................7
2.4.2 Electrical stimulation........................................................................................................9
2.4.3 Electromyographic recordings .......................................................................................10
2.4.4 Level of activation..........................................................................................................10
2.4.5 Definitions of fatigue .....................................................................................................10
2.5 Statistics.............................................................................................................................11
3 RESULTS..............................................................................................................................12
4 DISCUSSION .......................................................................................................................16
5 REFERENCES.....................................................................................................................22
6 APPENDIX ...........................................................................................................................26
4
1 INTRODUCTION
Fatigue has been defined as any exercise-induced reduction in the ability of a muscle to generate
force or power1. The terminology most commonly used to describe neuromuscular adaptations to
fatigue, refers to the factors situated in the central nervous system as being central, whereas the
factors situated in the peripheral nervous system, or in the muscle itself, are termed peripheral2.
The twitch interpolation technique is commonly used to assess fatigue. It includes
electrical stimulation of the motor nerve to a muscle as the subject performs a maximal voluntary
contraction (MVC) and when the muscle is relaxed3. The amplitude of the interpolated twitch
(IT) produced during a voluntary contraction compared with that elicited from the relaxed muscle
(RT) provides a means of assessing the relative level of muscle activation (LOA) during any type
of voluntary contraction, i.e., how well subjects can drive a muscle to produce force. It allows the
extent to which this may change during fatigue to be measured. An increase in the IT/RT with
exercise indicates impairment of LOA and thus, central fatigue.
While most studies on central fatigue, using the twitch interpolation technique, have
observed effects of isometric exercise4,5,6, recent studies have investigated fatigue induced by
functional movements, such as running 7,8,9,10. Contradictory results were found regarding central
fatigue during running. While the capacity to voluntarily activate the quadriceps femoris muscle
1 Gandevia, S. C., “Spinal and supraspinal factors in human muscle fatigue”, Physiological Reviews, 8 1(2001:4), pp. 1725-1789 2 Bigland-Ritchie, B. & Woods, J. J., “Changes in muscle contractile properties and neural control during human muscular fatigue”, Muscle & Nerve, 7 (1984), pp. 691-699 3 Merton P. A., “Voluntary strength and fatigue”, Journal of Physiology, 123 (1954), pp. 553-564 4 Bigland-Ritchie, B., Furbush, F. & Woods, J. J., “Fatigue of intermittent submaximal voluntary contractions: central and peripheral factors”, Journal of Applied Physiology, 61 (1986), pp. 421-429 5 Löscher W. N., Cresswell, A. G. & Thorstensson, A., “Excitatory drive to α-motoneuron pool during a fatiguing submaximal contraction in man”, Journal of Physiology, 491 (1996), pp. 271-280 6 Nordlund M. M., Thorstensson, A. & Cresswell, A. G., “Central and peripheral contributions to fatigue in relation to level of activation during repeated maximal voluntary isometric plantar flexions”, Journal of Applied Physiology, 96 (2004), pp. 218-225 7 Millet G. Y., Leppers, R., Maffiuletti, N. A., Babault, N., Martin, V., Lattier, G., “Alterations of neuromuscular function after an ultramarathon”, Journal of Applied Physiology, 92 (2002), pp. 486-492 8 Millet G. Y., Martin, V., Lattier, G., Ballay, Y., “Mechanisms contributing to knee extensor strength loss after prolonged running exercise”, Journal of Applied Physiology , 94 (2003), pp. 193-198 9 Place N., Lepers, R., Deley, G., Millet, G. Y., “Time course of neuromuscular alterations during a prolonged running exercise”, Medicine and Science in Sports and Exercise, 36 (2004:8), pp. 1347-1356 10 Finni, T., Kyröläinen, H., Avela, J., Komi, P. V., “Maximal but not submaximal performance is reduced by constant-speed 10-km run”, Journal of Sports Medicine and Physical Fitness, 43 (2003:4), pp. 411-417
5
group was decreased after 30 km running11 for the plantar flexor muscle group, such a decrease
was not observed after 10 km of running12. The divergent results regarding central fatigue can be
related to the diverse fatigue protocols adopted as well as to the muscle group under
investigation. Furthermore, the twitch interpolation technique originally developed for the
adductor pollicis13, may work differently when stimulating the tibial nerve for activation of the
plantar flexors than when stimulating the femoral nerve to activate the quadriceps femoris (see
discussion).
At velocities ranging from 1.0 to 9.0 m · s-1, Nilsson and collaborators14 demonstrated that
gastrocnemius was activated after the touch down, at about 13-18% and 75 and 85% of the stride
cycle. Kyröläinen and collaborators15 showed that the activity of the gastrocnemius was higher
during all phases of running, at maximal speed, than during MVC. Millet and colaborators16
found central fatigue in the quadriceps femoris and no evidence of peripheral fatigue in the
plantar flexors after an ultramarathon. Surprisingly though, despite the importance of the plantar
flexor muscle group during running its central and peripheral contributions to fatigue after long
distance running have not been investigated concomitantly.
The aim of this study was to examine fatigue in the plantar flexor muscle group after a
prolonged running exercise. To accomplish this, the twitch interpolation technique was employed
in this muscle group before and after two hours of continuous treadmill running.
11 Millet et al., 2003 12 Finni et al., 2003 13 Merton,1954 14 Nilsson, J., Thorstensson, A. & Halbertsma, J., “Changes in leg movements and muscle activity with speed of locomotion and mode of progression in humans”, Acta Physiologica Scandinavica, 123 (1985:4), pp. 457-475 15 Kyröläinen, H., Avela, J. & Komi, P. V., “Changes in muscle activity with increasing running speed”, Journal of Sports Sciences, 23 (2005:10), pp. 1101-1109 16 Millet et al., 2002
6
2 METHODS
2.1 Subjects
Eight healthy, habitually active male subjects [age 27.1 ± 2.7 (SD) yr, height 1.80 ± 0.10 m, body
mass 73.7 ± 10 kg] gave their written informed consent to participate in the study. The
investigation was conducted in compliance with the Declaration of Helsinki and was approved by
the Regional Ethics Committee in Stockholm (2005/295-31/1). The subjects were asked to
perform no intense physical activities within 24h before each session.
2.2 First session
During the first session that took place at least one week before the main experiment, the subjects
ran 5 min on a motorized treadmill at a self-selected speed as warm-up and were then
familiarized with the strength measurement and the electrical stimulation procedures. At the end
of this familiarization the measurements were recorded to be used for test-retest comparisons.
Subsequently, the subjects underwent an incremental treadmill exercise with a rise in the
inclination of 1 degree uphill every minute until volitional exhaustion (10 ± 1 min). Expired air
was analysed continuously (Amis 2001 Innovision, Denmark, Respicare) and heart rate was
recorded (Polar, Finland). From the results of the incremental exercise the maximal oxygen
uptake (VO2max) was defined and a regression of VO2 max against heart rate was used to find the
heart rate range that corresponded to 70-75% VO2max.
2.3 Main session
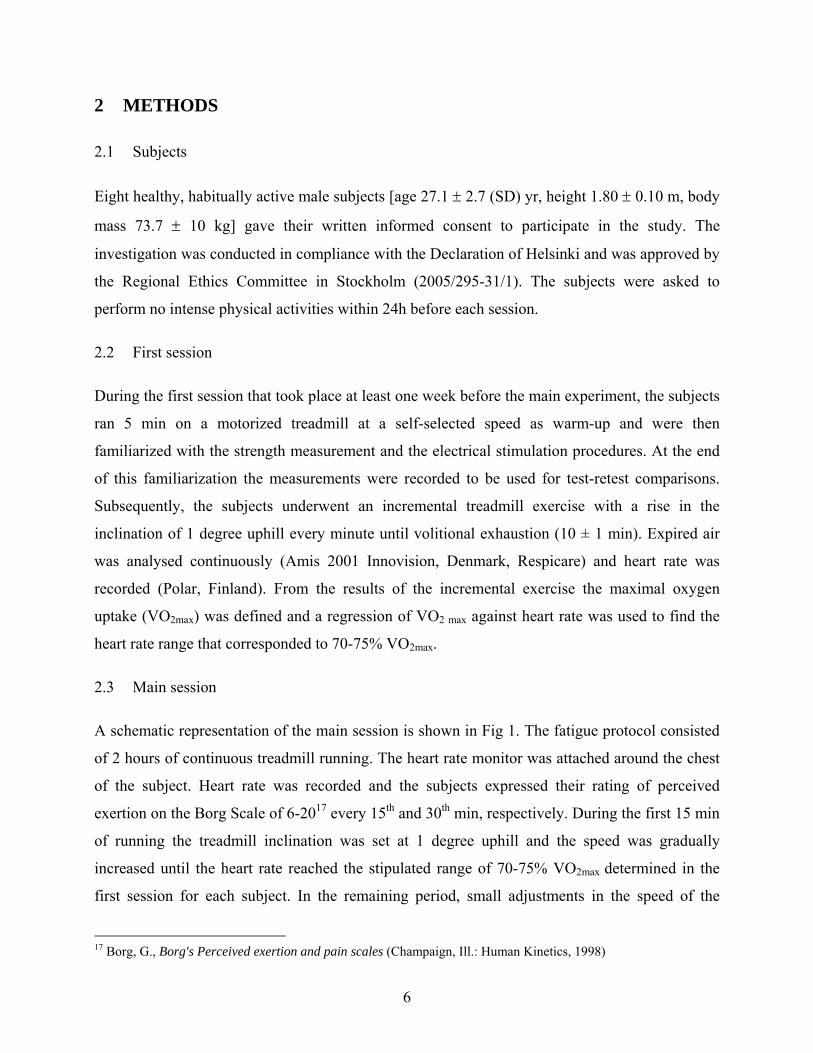
A schematic representation of the main session is shown in Fig 1. The fatigue protocol consisted
of 2 hours of continuous treadmill running. The heart rate monitor was attached around the chest
of the subject. Heart rate was recorded and the subjects expressed their rating of perceived
exertion on the Borg Scale of 6-2017 every 15th and 30th min, respectively. During the first 15 min
of running the treadmill inclination was set at 1 degree uphill and the speed was gradually
increased until the heart rate reached the stipulated range of 70-75% VO2max determined in the
first session for each subject. In the remaining period, small adjustments in the speed of the
17 Borg, G., Borg's Perceived exertion and pain scales (Champaign, Ill.: Human Kinetics, 1998)
7
treadmill were made individually, in order to provide a high running velocity that the subjects
could tolerate for 2 h. The heart rate range stipulated and the rating of perceived exertion on the
Borg Scale were taken into account to set the running velocity. Fluid in form of water was
available to the subjects on demand during the experiments, and intake was recorded.
Figure 1 Schematic representation of the experiment in the main session. The first preparatory procedures consisted
of strapping the foot of the subject appropriately, applying the electrodes and conducting the electrical stimulation
process; for more details see text. In the second preparatory procedures the foot was strapped and the electrodes were
applied to the marked positions (a). The strength measurements indicated in a) are magnified (b). The grey boxes
indicate an isometric maximal voluntary contraction (MVC). Arrows indicate when supramaximal electrical
stimulations were applied to the tibial nerve. During the MVC electric stimulation induced an interpolated twitch
(IT), and at rest electric stimulation evoked a twitch (RT) 5 s after the end of each MVC.
2.4 Measurement and experimental procedures
2.4.1 Strength measurements
The strength measurements were conducted on the right plantar flexor muscles with the subjects
lying prone on a bench with their right ankle at 90o and their right foot strapped tightly to a
0 5 15 20 50 80 110 140 145 150
War
m-u
p
1st p
repa
rato
ry
proc
edur
es
Stre
ngth
m
easu
rem
ents
2 hours running
2nd
prep
arat
ory
pr
oced
ures
Stre
ngth
m
easu
rem
ents
a
1-min resting
5-s
3-s
Time (min)
MVC MVC MVC
IT IT IT RT RT RT b
8
vertical footplate, instrumented with a force transducer (Nobel, KRG-4)18. The axis of rotation of
the footplate was aligned with the lateral maleollus. Subjects were asked to perform submaximal
contractions preceding the strength measurements to optimise the strapping. They were instructed
not to perform extraneous movement of the upper body during the trials, i.e. not to grasp the
bench or elevate the pelvis. The force signal was analog-to-digital converted and sampled at 1
kHz. The force measured by the transducer was multiplied by its lever arm (0.3 m) to achieve the
plantar flexor torque (strength) value. The strength measurements included isometric maximal
voluntary contraction (MVC) and electrically evoked twitches. Subjects were asked to perform
three 3-s-MVCs with a 1-min-rest between the trials. During the MVCs electric stimulation
induced an interpolated twitch (IT) on the plateau reached during each MVC (Fig 1b and 2c). An
electrical evoked twitch was also performed at rest (RT) after 5 s of the end of each MVC (Fig 1b
and 2d). Subjects were verbally encouraged during MVCs. The strength measurements before
running were accomplished succeeding a similar warm-up to the first session. The strength
measurements after running started within 5 min after the end of running and lasted no longer
than 10 min.
18 Nordlund, M. M., Thorstensson, A. & Cresswell, A. G., “Variations in the soleus H-reflex as a function of activation during controlled lengthening and shortening actions”, Brain Research, 952 (2002:2), pp. 301-307
9
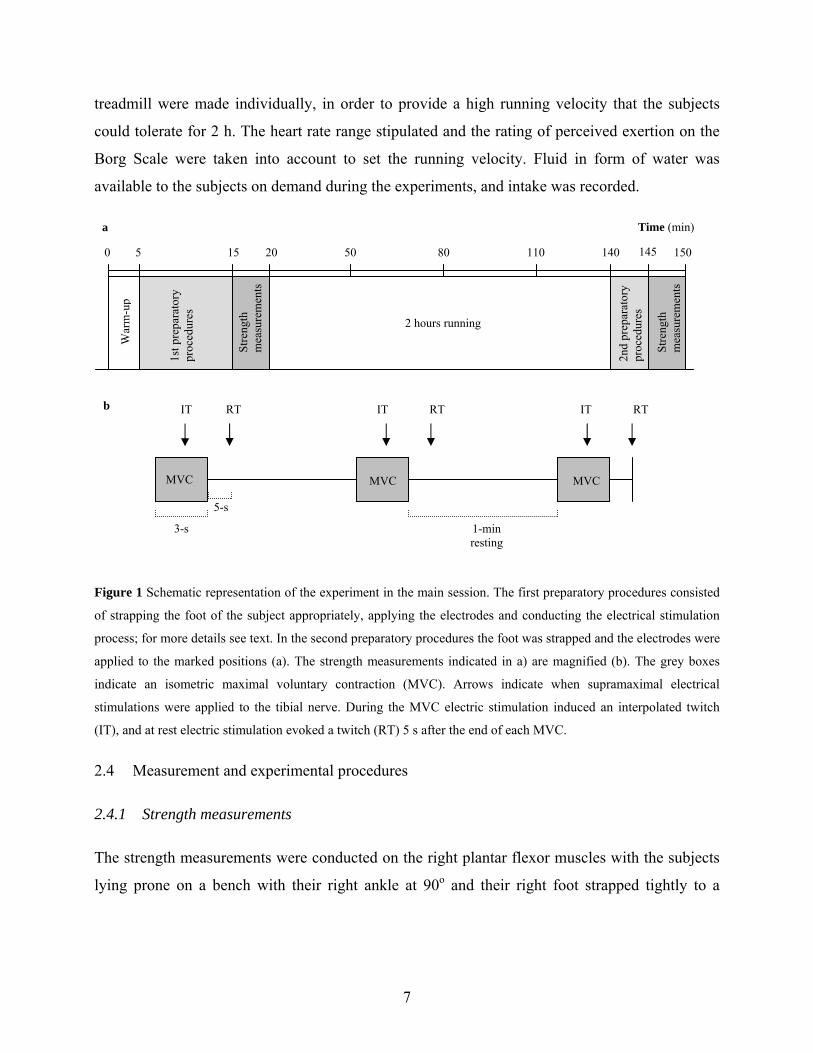
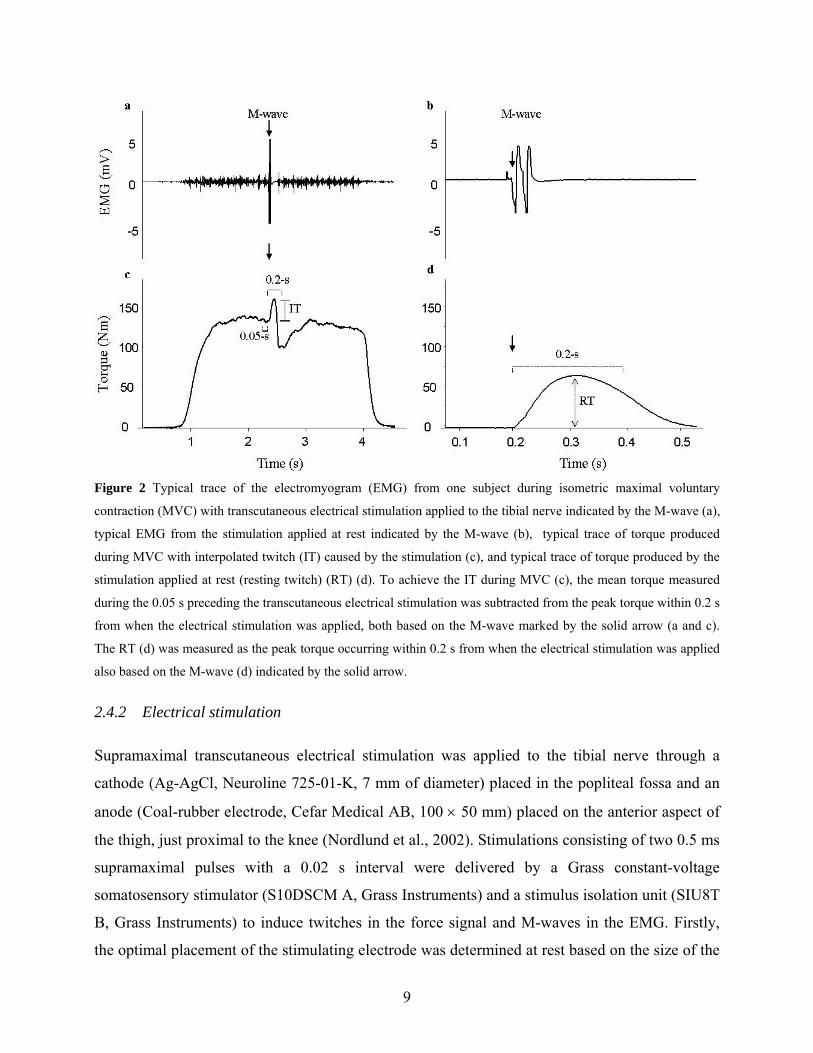
Figure 2 Typical trace of the electromyogram (EMG) from one subject during isometric maximal voluntary
contraction (MVC) with transcutaneous electrical stimulation applied to the tibial nerve indicated by the M-wave (a),
typical EMG from the stimulation applied at rest indicated by the M-wave (b), typical trace of torque produced
during MVC with interpolated twitch (IT) caused by the stimulation (c), and typical trace of torque produced by the
stimulation applied at rest (resting twitch) (RT) (d). To achieve the IT during MVC (c), the mean torque measured
during the 0.05 s preceding the transcutaneous electrical stimulation was subtracted from the peak torque within 0.2 s
from when the electrical stimulation was applied, both based on the M-wave marked by the solid arrow (a and c).
The RT (d) was measured as the peak torque occurring within 0.2 s from when the electrical stimulation was applied
also based on the M-wave (d) indicated by the solid arrow.
2.4.2 Electrical stimulation
Supramaximal transcutaneous electrical stimulation was applied to the tibial nerve through a
cathode (Ag-AgCl, Neuroline 725-01-K, 7 mm of diameter) placed in the popliteal fossa and an
anode (Coal-rubber electrode, Cefar Medical AB, 100 × 50 mm) placed on the anterior aspect of
the thigh, just proximal to the knee (Nordlund et al., 2002). Stimulations consisting of two 0.5 ms
supramaximal pulses with a 0.02 s interval were delivered by a Grass constant-voltage
somatosensory stimulator (S10DSCM A, Grass Instruments) and a stimulus isolation unit (SIU8T
B, Grass Instruments) to induce twitches in the force signal and M-waves in the EMG. Firstly,
the optimal placement of the stimulating electrode was determined at rest based on the size of the
10
twitch produced by moving a stimulator probe. The placement was marked on the skin to enable
fixing the stimulating electrode at the same place before and after running. The electrical stimulus
intensity was then adjusted and considered maximal when increasing the intensity no longer
induced a higher twitch. This intensity was further increased to reach the supramaximal value to
be used throughout the protocol with attention to not cause a reduction in the twitch due to
antagonist activation.
2.4.3 Electromyographic recordings
Surface electromyographic recordings (EMG) were collected from the soleus muscle with the
purpose to use the compound motor action potential (M-wave) induced by the electric stimulation
as the reference for the strength analyses, i.e. timing for the twitch. A pair of electrodes (Ag-
AgCl, Grass F-E9M-40-5 Reusable, 11 mm) was placed in a belly-tendon configuration over the
soleus muscle and Achilles tendon. A ground electrode (Ag-AgCl, Bluesensor M-00-5, 10 mm)
was placed on the fibular head. The EMG signal was amplified 1000 times (AD Instruments Dual
Bio Amp), band-pass filtered between 3 Hz and 1 kHz (NL 125, Digitimer) and analog-to-digital
converted at a sampling frequency of 1 kHz. Both strength and EMG were sampled using the
Powerlab SP data collection system with the Chart (version 4.0) software.
2.4.4 Level of activation
The level of activation (LOA) was assessed by means of the twitch interpolation technique19. To
achieve the IT during MVC, the mean torque measured during the 0.05 s preceding the electrical
stimulation (M-wave, Fig 2a and c) was subtracted from the peak torque within 0.2 s from when
the electrical stimulation was applied (Fig 2b and d). RT was measured as the peak torque
occurring within 200 ms from when the electrical stimulation was applied (Fig 2b and d). The
LOA during each MVC was calculated as LOA (%) = 100 · (1 – IT · RT-1 induced after the same
MVC). The trial with the highest LOA was chosen for further analyses.
2.4.5 Definitions of fatigue
Fatigue was defined as a decrease in MVC after running. Central fatigue was defined as a
decrease in the LOA, and peripheral fatigue as a decrease in the RT. 19 Merton, 1954
11
2.5 Statistics
Normality of the data was confirmed by using the Shapiro-Wilk W test. To test the reliability of
the measurements for MVC, RT, and LOA done in the first session and before running the
coefficient of variation (CV), the Intra Class Coefficient (ICC2,1), and a paired t-test were applied.
A paired t-test was also used to identify differences in MVC, LOA and RT between before and
after running. Correlation and multiple regression analyses were employed to investigate to what
extent the changes in MVC could be explained by the changes in LOA and RT. Correlation was
also used to investigate the relation between the water intake and MVC, RT, and LOA after
running. Friedman and repeated-measures ANOVA were used to detect alteration during the
exercise period in RPE and heart rate, respectively. Spearman was used to assess the correlation
between RPE and central fatigue. The analyses were performed using Statistica 6 (StatSoft). The
level of significance was set to p < 0.05. Unless elsewhere stated, all data are presented as means
± 1 SD.
12
3 RESULTS
The coefficient of variation (CV) and intra class correlation (ICC2,1) between the values obtained
during the first session and before running for MVC, RT and LOA were 6.4%, 0.48 (ICC2,1),
6.8%, 0.82 (ICC2,1), and 4.8%, 0.89 (ICC2,1), respectively. A paired t-test confirmed no difference
for MVC, RT and LOA between the first session and before running.
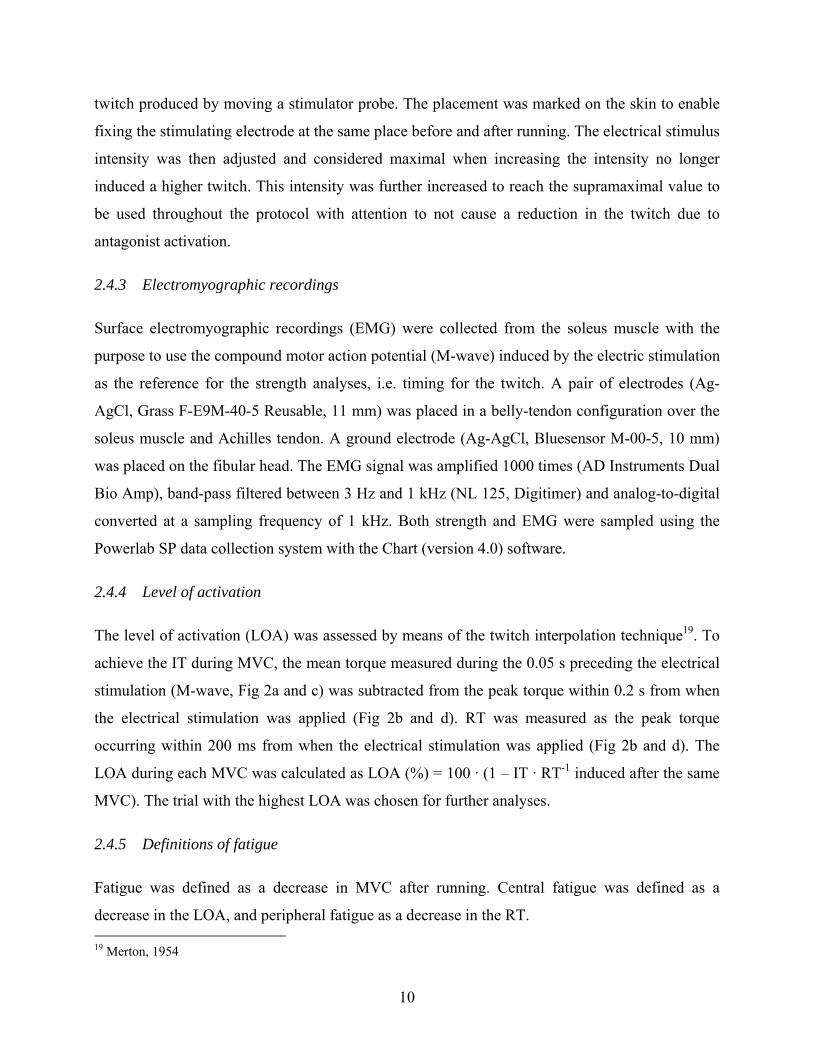
The mean VO2max, velocity during the 2 h running and total distance covered were 67.01
± 5.9 ml · kg-1 · min-1, 13.4 ± 1.1 km · h-1 and 26.8 ± 2.0 km, respectively. Heart rate gradually
increased from 159 ± 9 bpm at 15 min to 167 ± 8 bpm at the end of 120 min running, but the rise
became significant (p < 0.05) only from 60 min of exercise differing from the value at 15 min
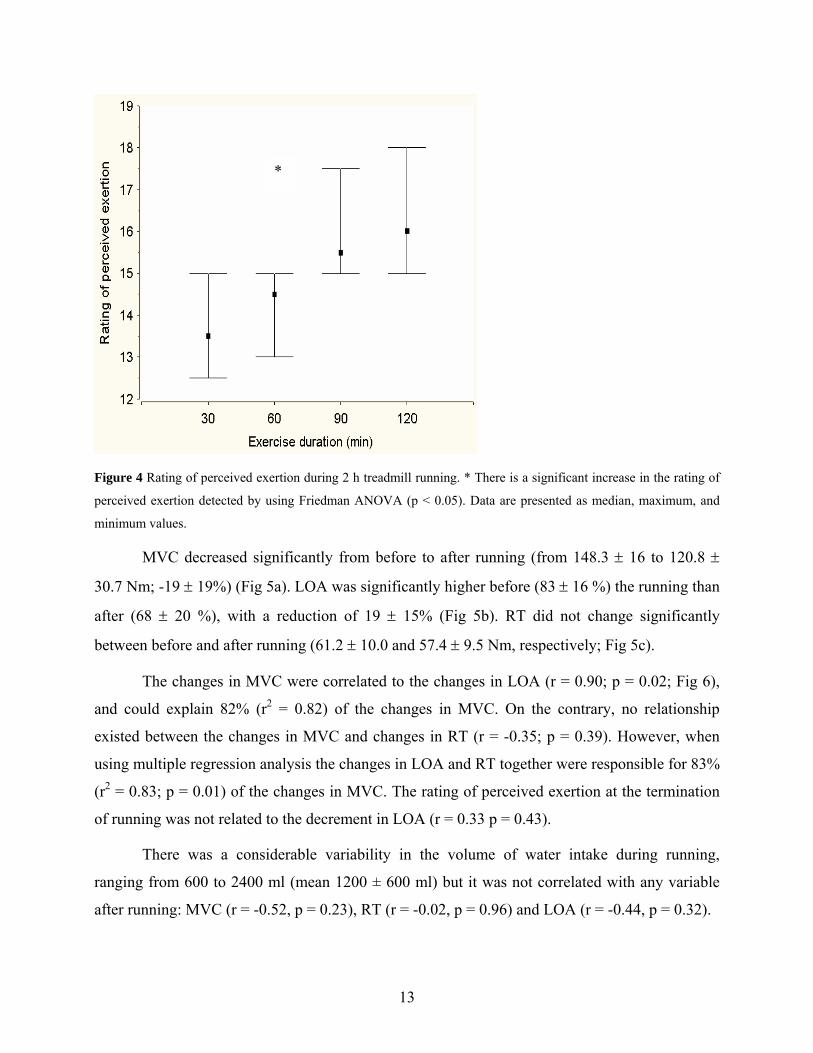
(Fig 3). At the termination of running the mean rating of perceived exertion was 16.2 (between
hard and very hard) (Fig 4).
Figure 3 Heart rate during 2 h treadmill running. Data are presented as means ± SE of means. * denotes a
significantly lower HR at 15 min compared to the HR measurements performed at 60 min through 120 min.
13
Figure 4 Rating of perceived exertion during 2 h treadmill running. * There is a significant increase in the rating of
perceived exertion detected by using Friedman ANOVA (p < 0.05). Data are presented as median, maximum, and
minimum values.
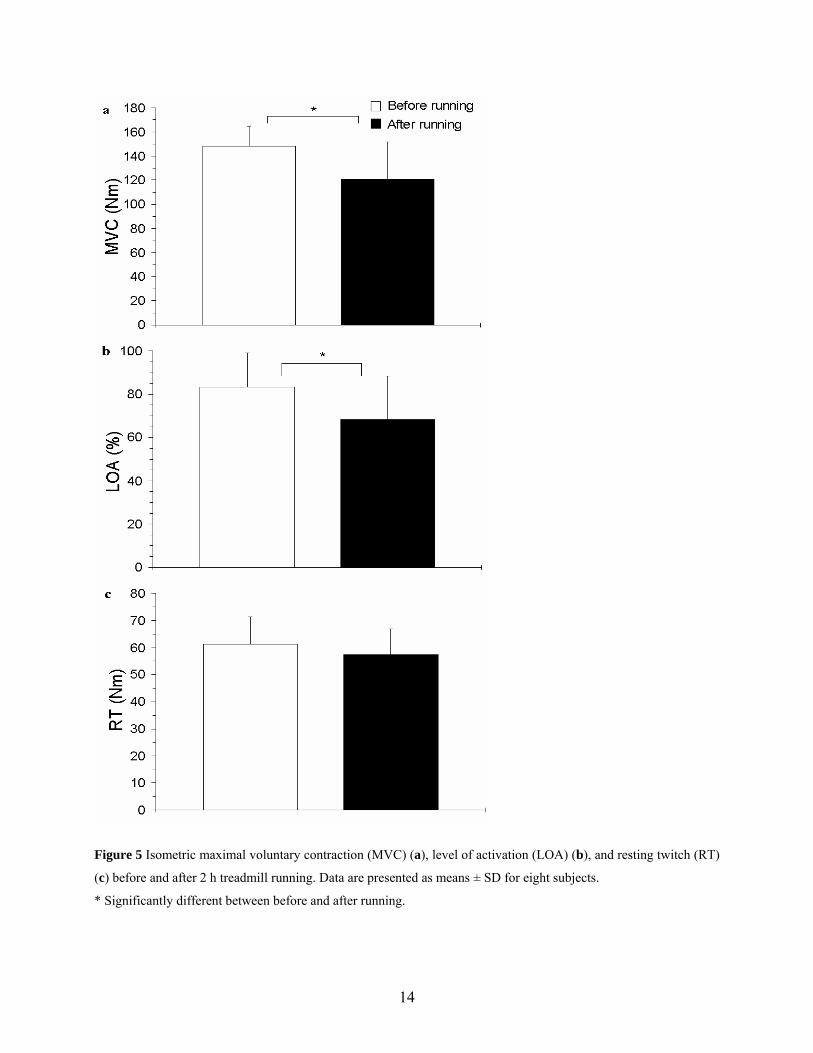
MVC decreased significantly from before to after running (from 148.3 ± 16 to 120.8 ±
30.7 Nm; -19 ± 19%) (Fig 5a). LOA was significantly higher before (83 ± 16 %) the running than
after (68 ± 20 %), with a reduction of 19 ± 15% (Fig 5b). RT did not change significantly
between before and after running (61.2 ± 10.0 and 57.4 ± 9.5 Nm, respectively; Fig 5c).
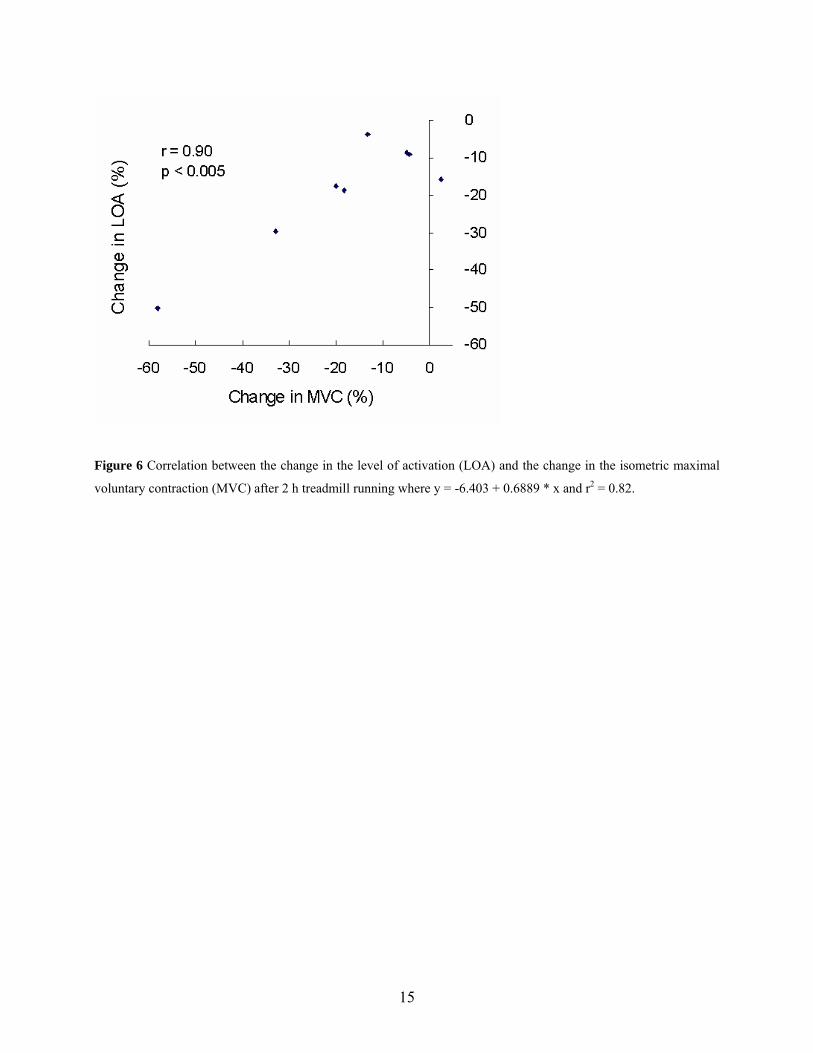
The changes in MVC were correlated to the changes in LOA (r = 0.90; p = 0.02; Fig 6),
and could explain 82% (r2 = 0.82) of the changes in MVC. On the contrary, no relationship
existed between the changes in MVC and changes in RT (r = -0.35; p = 0.39). However, when
using multiple regression analysis the changes in LOA and RT together were responsible for 83%
(r2 = 0.83; p = 0.01) of the changes in MVC. The rating of perceived exertion at the termination
of running was not related to the decrement in LOA (r = 0.33 p = 0.43).
There was a considerable variability in the volume of water intake during running,
ranging from 600 to 2400 ml (mean 1200 ± 600 ml) but it was not correlated with any variable
after running: MVC (r = -0.52, p = 0.23), RT (r = -0.02, p = 0.96) and LOA (r = -0.44, p = 0.32).
*
14
Figure 5 Isometric maximal voluntary contraction (MVC) (a), level of activation (LOA) (b), and resting twitch (RT)
(c) before and after 2 h treadmill running. Data are presented as means ± SD for eight subjects.
* Significantly different between before and after running.
15
Figure 6 Correlation between the change in the level of activation (LOA) and the change in the isometric maximal
voluntary contraction (MVC) after 2 h treadmill running where y = -6.403 + 0.6889 * x and r2 = 0.82.
16
4 DISCUSSION
The aim of this study was to examine the fatigue after 2 h treadmill running using the twitch
interpolation technique in the plantar flexor muscles. The main findings were that central fatigue,
i.e. decrement in LOA, was involved in the reduction of MVC after 2 h treadmill running,
subjects with the greatest plantar flexor strength loss after running experienced the largest central
fatigue and there was no peripheral fatigue, i.e. no difference in the RT.
The most important finding of the present study was that central fatigue could be
demonstrated during maximal voluntary isometric plantar flexion after two hours of running. One
criticism against previous studies on central fatigue induced by prolonged exercise has been that
electrical stimulation of the femoral nerve does not recruit the whole muscle group20.
Furthermore, through electrical stimulation of the femoral nerve, both quadriceps femoris
(agonist) and sartorius (antagonist) can be activated which can make it difficult to distinguish the
force increments, produced by the electrical stimulation, during maximal voluntary contractions.
This fact can give the impression that the agonist muscles are fully activated even if they are only
submaximally activated21. Also, an increased antagonist coactivation with fatigue might reduce
the antagonist contribution to the interpolated twitch during MVC and thus increase the net
interpolated twitch which will be interpreted as a reduced LOA. On the other hand,
transcutaneous electrical stimulation of the tibial nerve activates almost all plantar flexor muscles
(medial and lateral gastrocnemius, soleus, plantaris, tibialis posterior, flexor digitorum longus,
and flexor hallucis longus), with exception only for peroneus brevis and longus, without
activating any antagonist muscle. Further, it has been reported, that during electrical stimulation
of the tibial nerve, the subjects tolerate the use of supramaximal intensities22. Consequently, even
if the threshold of the motor axons increases during a fatiguing exercise, by using supramaximal
intensity the muscle can still be fully activated. In the present study, the maximal electrical
stimulus intensity was further increased to reach the supramaximal value with attention to not
cause a reduction in the twitch due to antagonist activation.
20 Nybo, L. & Nielsen, B., “Hyperthermia and central fatigue during prolonged exercise in humans”, Journal of Applied Physiology, 91(2001:3), pp. 1055-1060 (b) 21 Shield, A. & Zhou, S., “Assessing voluntary muscle activation with the twitch interpolation technique”, Sports Medicine, 34 (2004:4), pp. 253-267 22 Nordlund et al., 2004
17
In the present investigation, the central fatigue induced by running could explain 82% of
the reduction in the MVC. Millet and others23 also observed decreased MVC and LOA, in the
quadriceps, after 30 km race running. It is difficult to compare the exercise intensity current used
with the one used by Millet and collaborators24 since their subjects ran outdoors at approximately
9.5 km · h-1 with 800 m uphill. Whether these two distinct exercise protocols induce central
fatigue in both the quadriceps and the plantar flexor muscle groups remains to be established.
Even so, the mechanisms involved in the central fatigue in both studies may be similar as they
were both caused by whole body prolonged exercise.
In contrast to our study, Finni and collaborators25 looking at the plantar flexor muscles did
not observe central fatigue after 10 km running even though the MVC, RT and the 20 m sprint
speed were reduced. This different result may be related to the duration and intensity of the
exercise, as in their study the running lasted for less than one hour and the mean velocity was
12.6 km · h-1 while in ours the subjects ran for 2 h with the mean velocity of 13.4 km · h-1.
Central fatigue can be related to a variety of mechanisms from supraspinal and spinal
sites. Possible mechanisms for the supraspinal fatigue include reduced descending output from
the motor cortex and/or reduced efficacy of output from the motor cortex in generating force26. It
could be hypothesized that central fatigue occurs due to usage within the supraspinal circuits27.
However, in the present study, there was no such evidence as the subjects with higher ability to
voluntary activate the plantar flexor muscle group before running did not exhibit more central
fatigue (r = -0.16; p = 0.70). On the other hand, the exercise used in the present study consisted of
repeated submaximal contractions that probably did not require high levels of activation.
In this study, the fatigue experienced during the 2 h treadmill running was evaluated via
RPE on the Borg Scale of 6-20. In agreement with the literature28,29, the perceived exertion to
exercise at the same intensity increased throughout the running, where the median rate at 30 min 23 Millet et al., 2003 24 Millet et al., 2003 25 Finni et al., 2003 26 Taylor, J. L., Todd, G. & Gandevia, S. C., “Evidence for a supraspinal contribution to human muscle fatigue”, Clinical and Experimental Pharmacology & Physiology, 33 (2006:4), pp. 400-405 27 Petersen, N. T., Taylor, J. L., Butler, J. E., Gandevia, S. C., “Depression of activity in the corticospinal pathway during human motor behavior after strong voluntary contractions”, The Journal of Neuroscience, 23 (2003:22), pp. 7974-7980 28 Saboisky, J., Marino, F. E., Kay, D., Cannon, J., “Exercise heat stress does not reduce central activation to non-exercised human skeletal muscle”, Experimental Physiology, 88 (2003:6), pp. 783-790 29 Place et al., 2004
18
was 13.5 (between somewhat hard and hard) and at 120 min had increased to 16.2 (between hard
and very hard). In a study of Jones and Hunter30 a linear increase in the perceived force during
sustained submaximal contractions was found. The change in force sensation was paralleled by
an increase in the EMG of the fatiguing muscle. However, the mechanisms behind increased
sense of exertion during 2 h running is likely to be different since there was no muscle fatigue
and hence no need for increased neural activation during running. Interestingly, Nybo &
Nielsen31 investigating cycling exercise until exhaustion, in a hot environment, did not observe
increased activation (EMG) in the vastus lateralis despite a RPE of 20 ± 0 at the point of
exhaustion. They instead, described that a cerebral activation over the prefrontal cortex was
positively correlated to the RPE (r = 0.98 p < 0.001). In another study by Nybo & Nielsen32 the
twitch interpolation technique was used during sustained isometric contraction before and after a
cycling exercise. Based on these two studies the authors argue that there may be a relation
between decreased arousal and hindered ability of the brain to sustain motor activity. Moreover,
in the present study, there was no correlation between RPE and central fatigue (r = 0.33; p =
0.43). However, to the best of our knowledge, no study had correlated RPE to central fatigue
measured via the twitch interpolation technique. To investigate such possible relation further, the
same subjects should express their rating of perceived exertion while being under different levels
of central fatigue. Furthermore, evaluating fatigue only via RPE does not allow for a clear
discrimination between peripheral and central factors contributing to fatigue.
Although the current fatigue exercise was performed indoors, the influence of an
increased core temperature on central fatigue cannot be ruled out. In the investigation of Davies
& Thompson33 (1986) where the subjects ran indoors (21° C environment) during four hours
there was an increase in the core temperature from 38.43 ± 0.31° C at the end of the first hour to
39.09 ± 0.50° C at the fourth hour. Nybo & Nielsen34 examined the influence of hyperthermia
(40° C environment) on central fatigue after cycling exercise. They observed that after exercise
both exercised (leg) and non exercised (arm) muscles developed reduction in voluntary strength
30 Jones, L. A. & Hunter, I. W., “Effect of fatigue on force sensation”, Experimental Neurology, 81 (1983:3), pp. 640-650 31 Nybo, L. & Nielsen, B., “Perceived exertion is associated with an altered brain activity during exercise with progressive hyperthermia”, Journal of Applied Physiology, 91(2001:5), pp. 2017-2023 (a) 32 Nybo & Nielsen, 2001 (b) 33 Davies, C. T. & Thompson, M. W., “Physiological responses to prolonged exercise in ultramarathon athletes”, Journal of Applied Physiology, 61 (1986:2), pp. 611-617 34 Nybo & Nielsen, 2001 (b)
19
during sustained MVC. Furthermore, the LOA at the end of the hyperthermic trial was lower
compared to the control trial (54 ± 5% and 82 ± 5%, respectively).
Moreover, it has been reported that the motoneurons are affected in fatigued conditions
also via spinal mechanisms and peripheral feedback mainly via decreased excitation from Ia
afferents35, increased activity of group III and IV afferents36 and increased recurrent inhibition37.
In fact, decreased stretch reflexes and Hoffman-reflexes have been observed after marathon
running and it was suggested to occur due to increased presynaptic inhibition of Ia-afferents.
However, there was no measurement of central fatigue and thus it can not be clearly concluded
that the decreased reflexes cause central fatigue38.
Furthermore, changes in neurotransmitters concentration in the brain can be involved in
supraspinal fatigue during prolonged exercise, where 5-HT has received most of the attention as
its synthesis is increased in such exercise39,40, and increases in brain tryptophan (precursor of 5-
HT), via intracerebro-ventricular injection, reduced mechanical efficiency and running
performance in rats41. So far, in humans, during prolonged exercise, using nutritional factors that
affect tryptophan availability to the brain, controversial results have been reported regarding the
role of 5-HT on central fatigue42,43,44,45,46,47. However, these investigations have been based on
35 Nordlund et al., 2004 36 Garland, S. J., “Role of small diameter afferents in reflex inhibition during human muscle fatigue”, Journal of Physiology, 435 (1991), pp. 547-558 37 Löscher et al., 1996 38 Avela, J., Kyröläinen, H., Komi, P. V., Rama, D., “Reduced reflex sensitivity persists several days after long-lasting stretch-shortening cycle exercise”, Journal of Applied Physiology, 86 (1999:4), pp. 1292-1300 39 Barchas, J. D. & Freedman, D. X., “Brain Amines: Response to Physiological Stress”, Biochemical Pharmacology, 12 (1963), pp. 1232-1235 40 Chaouloff, F., Laude, D. & Elghozi, J. L., “Physical exercise: evidence for differential consequences of tryptophan on 5-HT synthesis and metabolism in central serotonergic cell bodies and terminals”, Journal of Neural Transmission, 78 (1989:2), pp. 121-130 41 Soares, D. D., Lima, N. R., Coimbra, C. C., Marubayashi, U., “Evidence that tryptophan reduces mechanical efficiency and running performance in rats”, Pharmacology, Biochemistry and Behaviour, 74 (2003:2), pp. 357-362 42 Blomstrand, E., Celsing, F. & Newlsholme, E. A., “Changes in plasma concentrations of aromatic and branched-chain amino acids during sustained exercise in man and their possible role in fatigue”, Acta Physiologica Scandinavica, 133 (1988:1), pp. 115-121 43 Blomstrand, E., Hassmen, P., Ekblom, B., Newslholme, E. A., “Administration of branched-chain amino acids during sustained exercise--effects on performance and on plasma concentration of some amino acids”, European Journal of Applied Physiology, 63 (1991:2), pp. 83-88 (a) 44 Blomstrand, E., Hassmen, P. & Newlsholme, E. A., “Effect of branched-chain amino acid supplementation on mental performance”, Acta Physiologica Scandinavica, 143 (1991:2), pp. 225-226 (b) 45 Segura, R. & Ventura, J. L., “Effect of L-tryptophan supplementation on exercise performance”, International Journal of Sports Medicine, 9 (1988:5), pp. 301-305
20
psychological aspects (perceived exertion scale, word and colour tests) and on physical
performance, restricted to time to exhaustion, to judge central fatigue.
Although central fatigue did occur in the present study, it is not possible with the
currently applied technique to specify the individual contribution of the mechanisms, cited above,
to central fatigue. The test-retest reliability of the RT (CV = 4.8%; ICC2,1 = 0.89) and LOA (CV
= 6.8%; ICC2,1 = 0.82) suggests that the methods presented here can be used in future studies that
concomitantly investigate possible mechanisms of central fatigue after running. For example, the
fatigue exercise as well as the twitch interpolation technique, in the plantar flexor muscle group,
employed in the present investigation associated to a nutritional supplementation would help to
clarify the role of 5-HT on central fatigue. Since, however, there was a large inter individual
variability in central fatigue (from 4 to 50%), such investigations would need a large number of
subjects or a selection of only subjects who display a relatively large amount of central fatigue.
The ICC2,1 was lower for the MVC measurement (0.48) than for the LOA and the RT. This was
most likely due to one subject who produced lower MVC before running than in the first session
(202.4 and 151.2 Nm, respectively).
In the present study there was no peripheral fatigue, that is, no significant (p > 0.05)
reduction in the RT. Potentiation and fatigue combined effects may have occurred impairing the
analyses of peripheral fatigue as the strength measurements after running lasted 7-10-min48. This
result is in agreement with the literature49,50 where an increase in the RT has been observed after
exercise.
Some authors51,52 have criticized the use of the RT to measure peripheral fatigue and
suggest the use of tetanic stimulation with high and low frequencies to avoid the potentiation
46 van Hall, G., Raaymakers, J. S., Saris, W. H., Wagenmakers, A. J., “Ingestion of branched-chain amino acids and tryptophan during sustained exercise in man: failure to affect performance”, Journal of Physiology, 486 (1995), pp. 789-794 47 Nybo, L., Nielsen, B., Blomstrand, E., Moller, K., Secher, N., “Neurohumoral responses during prolonged exercise in humans”, Journal of Applied Physiology, 95 (2003:3), pp. 1125-1131 48 Sale, D. G., “Postactivation potentiation: role in human performance”, Exercise and Sport Sciences Reviews, 30 (2002:3), pp. 138-143 49 Millet et al., 2002 50 Place et al., 2004 51 Millet et al., 2003 52 Lattier, G., Millet, G. Y., Martin, A., Martin, V., “Fatigue and recovery after high-intensity exercise part I: neuromuscular fatigue”, International Journal of Sports Medicine, 25 (2004:6), pp. 450-456
21
effect. However, even using tetanic stimulation Millet and collaborators53 reported potentiation
using stimulation of 20 Hz after 30 km running. Furthermore, it is well documented in the
literature that the discomfort using supramaximal electrical intensity is augmented along with the
number of stimuli54. Based on the discomfort and that the main purpose of the present study was
to examine central fatigue, we choose do not exposure our subjects to a tetanic stimulation, i.e.,
more than two stimuli.
In conclusion, this investigation demonstrated that after 2 h of continuous treadmill
running there was central fatigue during isometric maximal voluntary plantar flexion and subjects
with the greatest plantar flexor strength loss after running experienced the largest central fatigue.
53 Millet et al., 2003 54 Sale, D., Quinlan, J., Marsh, E., McComas, A. J., Belanger, A. Y., “Influence of joint position on ankle plantarflexion in humans”, Journal of Applied Physiology, 52 (1982:6), pp. 1636-1642
22
5 REFERENCES
Avela, J., Kyröläinen, H., Komi, P. V., Rama, D., “Reduced reflex sensitivity persists several
days after long-lasting stretch-shortening cycle exercise”, Journal of Applied Physiology, 86
(1999:4), pp. 1292-1300
Barchas, J. D. & Freedman, D. X., “Brain Amines: Response to Physiological Stress”,
Biochemical Pharmacology, 12 (1963), pp. 1232-1235
Bigland-Ritchie, B., Furbush, F. & Woods, J. J., “Fatigue of intermittent submaximal voluntary
contractions: central and peripheral factors”, Journal of Applied Physiology, 61 (1986), pp. 421-
429
Bigland-Ritchie, B. & Woods, J. J., “Changes in muscle contractile properties and neural control
during human muscular fatigue”, Muscle & Nerve, 7 (1984), pp. 691-699
Blomstrand, E., Hassmen, P., Ekblom, B., Newslholme, E. A., “Administration of branched-
chain amino acids during sustained exercise--effects on performance and on plasma concentration
of some amino acids”, European Journal of Applied Physiology, 63 (1991:2), pp. 83-88 (a)
Blomstrand, E., Hassmen, P. & Newlsholme, E. A., “Effect of branched-chain amino acid
supplementation on mental performance”, Acta Physiologica Scandinavica, 143 (1991:2), pp.
225-226 (b)
Blomstrand, E., Celsing, F. & Newlsholme, E. A., “Changes in plasma concentrations of
aromatic and branched-chain amino acids during sustained exercise in man and their possible role
in fatigue”, Acta Physiologica Scandinavica, 133 (1988:1), pp. 115-121
Borg, G., Borg's Perceived exertion and pain scales (Champaign, Ill.: Human Kinetics, 1998).
Chaouloff, F., Laude, D. & Elghozi, J. L., “Physical exercise: evidence for differential
consequences of tryptophan on 5-HT synthesis and metabolism in central serotonergic cell bodies
and terminals”, Journal of Neural Transmission, 78 (1989:2), pp. 121-130
Davies, C. T. & Thompson, M. W., “Physiological responses to prolonged exercise in
ultramarathon athletes”, Journal of Applied Physiology, 61 (1986:2), pp. 611-617
23
Finni, T., Kyröläinen, H., Avela, J., Komi, P. V., “Maximal but not submaximal performance is
reduced by constant-speed 10-km run”, Journal of Sports Medicine and Physical Fitness, 43
(2003:4), pp. 411-417
Gandevia, S. C., “Spinal and supraspinal factors in human muscle fatigue”, Physiological
Reviews, 8 1(2001:4), pp. 1725-1789
Garland, S. J., “Role of small diameter afferents in reflex inhibition during human muscle
fatigue”, Journal of Physiology, 435 (1991), pp. 547-558
Jones, L. A. & Hunter, I. W., “Effect of fatigue on force sensation”, Experimental Neurology, 81
(1983:3), pp. 640-650
Kyröläinen, H., Avela, J. & Komi, P. V., “Changes in muscle activity with increasing running
speed”, Journal of Sports Sciences, 23 (2005:10), pp. 1101-1109
Lattier, G., Millet, G. Y., Martin, A., Martin, V., “Fatigue and recovery after high-intensity
exercise part I: neuromuscular fatigue”, International Journal of Sports Medicine, 25 (2004:6),
pp. 450-456
Löscher W. N., Cresswell, A. G. & Thorstensson, A., “Excitatory drive to α-motoneuron pool
during a fatiguing submaximal contraction in man”, Journal of Physiology, 491 (1996), pp. 271-
280
Merton P. A., “Voluntary strength and fatigue”, Journal of Physiology, 123 (1954), pp. 553-564
Millet G. Y., Leppers, R., Maffiuletti, N. A., Babault, N., Martin, V., Lattier, G., “Alterations of
neuromuscular function after an ultramarathon”, Journal of Applied Physiology, 92 (2002), pp.
486-492
Millet G. Y., Martin, V., Lattier, G., Ballay, Y., “Mechanisms contributing to knee extensor
strength loss after prolonged running exercise”, Journal of Applied Physiology , 94 (2003), pp.
193-198
Nilsson, J., Thorstensson, A. & Halbertsma, J., “Changes in leg movements and muscle activity
with speed of locomotion and mode of progression in humans”, Acta Physiologica Scandinavica,
123 (1985:4), pp. 457-475
24
Nordlund M. M., Thorstensson, A. & Cresswell, A. G., “Central and peripheral contributions to
fatigue in relation to level of activation during repeated maximal voluntary isometric plantar
flexions”, Journal of Applied Physiology, 96 (2004), pp. 218-225
Nordlund, M. M., Thorstensson, A. & Cresswell, A. G., “Variations in the soleus H-reflex as a
function of activation during controlled lengthening and shortening actions”, Brain Research,
952 (2002:2), pp. 301-307
Nybo, L., Nielsen, B., Blomstrand, E., Moller, K., Secher, N., “Neurohumoral responses during
prolonged exercise in humans”, Journal of Applied Physiology, 95 (2003:3), pp. 1125-1131
Nybo, L. & Nielsen, B., “Perceived exertion is associated with an altered brain activity during
exercise with progressive hyperthermia”, Journal of Applied Physiology, 91(2001:5), pp. 2017-
2023 (a)
Nybo, L. & Nielsen, B., “Hyperthermia and central fatigue during prolonged exercise in
humans”, Journal of Applied Physiology, 91(2001:3), pp. 1055-1060 (b)
Petersen, N. T., Taylor, J. L., Butler, J. E., Gandevia, S. C., “Depression of activity in the
corticospinal pathway during human motor behavior after strong voluntary contractions”, The
Journal of Neuroscience, 23 (2003:22), pp. 7974-7980
Place N., Lepers, R., Deley, G., Millet, G. Y., “Time course of neuromuscular alterations during a
prolonged running exercise”, Medicine and Science in Sports and Exercise, 36 (2004:8), pp.
1347-1356
Saboisky, J., Marino, F. E., Kay, D., Cannon, J., “Exercise heat stress does not reduce central
activation to non-exercised human skeletal muscle”, Experimental Physiology, 88 (2003:6), pp.
783-90
Sale, D. G., “Postactivation potentiation: role in human performance”, Exercise and Sport
Sciences Reviews, 30 (2002:3), pp. 138-143
Sale, D., Quinlan, J., Marsh, E., McComas, A. J., Belanger, A. Y., “Influence of joint position on
ankle plantarflexion in humans”, Journal of Applied Physiology, 52 (1982:6), pp. 1636-1642
Segura, R. & Ventura, J. L., “Effect of L-tryptophan supplementation on exercise performance”,
International Journal of Sports Medicine, 9 (1988:5), pp. 301-305
25
Shield, A. & Zhou, S., “Assessing voluntary muscle activation with the twitch interpolation
technique”, Sports Medicine, 34 (2004:4), pp. 253-267
Soares, D. D., Lima, N. R., Coimbra, C. C., Marubayashi, U., “Evidence that tryptophan reduces
mechanical efficiency and running performance in rats”, Pharmacology, Biochemistry and
Behaviour, 74 (2003:2), pp. 357-362
Taylor, J. L., Todd, G. & Gandevia, S. C., “Evidence for a supraspinal contribution to human
muscle fatigue”, Clinical and Experimental Pharmacology & Physiology, 33 (2006:4), pp. 400-
405
van Hall, G., Raaymakers, J. S., Saris, W. H., Wagenmakers, A. J., “Ingestion of branched-chain
amino acids and tryptophan during sustained exercise in man: failure to affect performance”,
Journal of Physiology, 486 (1995), pp. 789-794

26
6 APPENDIX
KÄLL- OCH LITTERATURSÖKNING Frågeställningar: Is there central fatigue after prolonged running? VAD? Vilka ämnesord har du sökt på? Ämnesord Synonymer
central fatigue prolonged exercise central fatigue running human
VARFÖR? Varför har du valt just dessa ämnesord? The main purpose of the present study was to investigate central fatigue caused by prolonged exercise.
HUR? Hur har du sökt i de olika databaserna? Databas Söksträng Antal
träffar Antal relevanta träffar
Pub Med central fatigue prolonged exercise central fatigue running human
71 24
12 10
KOMMENTARER: Firstly I followed the references list of some papers I had already read. Then I searched in the
Pub Med databases to look for other references and also to find recent publications in the
field. I used the “related articles” function to find articles in the same field.