Embed Size (px)
Citation preview
Legrain, Eluru & El-Geneidy
Am stressed, must travel: The relationship between mode choice and commuting stress
Alexander LegrainSchool of Urban PlanningMcGill University*E-mail: [email protected]
Naveen EluruDepartment of Civil, Environmental and Construction EngineeringUniversity of Central FloridaE-mail: [email protected]
Ahmed M. El-GeneidySchool of Urban PlanningMcGill University*E-mail: [email protected]
* McGill UniversitySuite 400, 815 Sherbrooke St. W.Montréal, Québec, H3A 2K6CanadaTel.: 514-398-8741Fax: 514-398-8376
October 10, 2014; Revised February 14, 2015, Final submission June 2015
Prepared for consideration in Transportation Research Part F
1
123456789
101112131415161718192021222324252627
28293031
32
333435363738394041424344
Legrain, Eluru & El-Geneidy
ABSTRACT
The stress of commuting has serious public health and social implications. By comparing stress
across different modes it is possible to determine which modes are more heavily contributing to
this potential health and social issue. This study uses a large-scale university travel survey to
compare commuter stress across three modes of transportation (walking, driving, and using
public transit). It also investigates the specific factors that contribute to stress using these modes.
Using ordered logistic regressions, the study develops a general model of stress and three mode-
specific models. Results show that driving is the most stressful mode of transportation when
compared to others. We also find that stressors for some modes are not stressors for others.
Knowing which specific factors make certain modes stressful will help transportation and public
health professionals make commuting a safer, more enjoyable, and less stressful activity; in turn
this could mitigate the potentially serious health outcomes of a stressful commute.
2
1234
5
6
7
8
9
10
11
12
13
14
151617181920212223242526272829303132333435
Legrain, Eluru & El-Geneidy
INTRODUCTION
Many recent studies in transportation have focused on the personal experience of
commuters. A person’s satisfaction with their trip, overall life satisfaction, and stress
experienced while commuting have become increasingly crucial parts of our understanding of
travel behavior, especially regarding mode-choice. Mode-switching may be inhibited because
certain physical and mental health implications are associated with a mode (Abou-Zeid, Witter,
Bierlaire, Kaufmann, & Ben-Akiva, 2012). Findings from studies that focus on the personal
experiences of commuters can have real policy implications by suggesting that factors that may
inhibit the uptake of more sustainable modes of transportation should be minimized, while
factors that make these modes more attractive to users should be explored.
Stress is one of the most serious physical and mental health implications of commuting.
Almost all commuting can be stressful—rushing to get to work or school in the morning is often
an unpleasant experience—and some modes may be causing more stress than others.
Discovering the mode-specific factors that contribute to a stressful commute highlights where
policy focused on increasing sustainable mode-share can be effective. Sustainable mode use can
be made more attractive by minimizing the factors that make sustainable modes stressful.
Perhaps more importantly, commuting is almost ubiquitous: a hefty share of any population
travels daily and, correspondingly, the stress experienced while commuting affects a large
number of people.
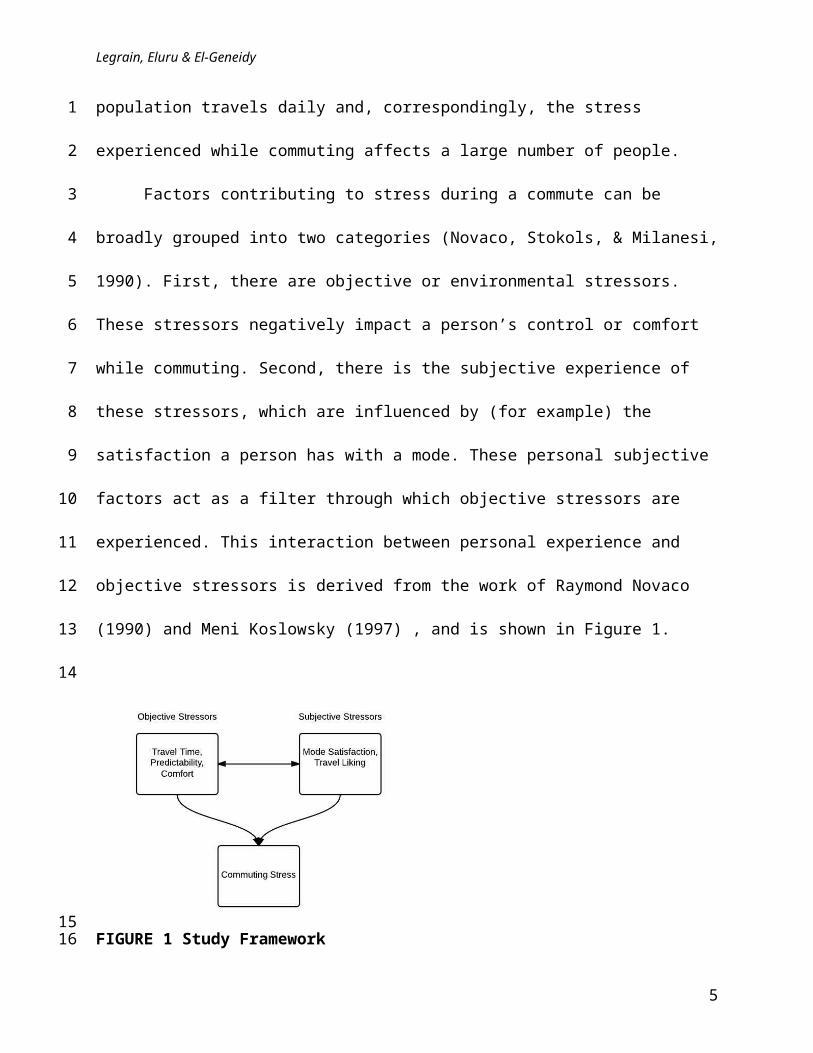
Factors contributing to stress during a commute can be broadly grouped into two
categories (Novaco, Stokols, & Milanesi, 1990). First, there are objective or environmental
stressors. These stressors negatively impact a person’s control or comfort while commuting.
Second, there is the subjective experience of these stressors, which are influenced by (for
3
1
2
3
4
5
6
7
8
9
10
11
12
13
14
15
16
17
18
19
20
21
22
23
Legrain, Eluru & El-Geneidy
example) the satisfaction a person has with a mode. These personal subjective factors act as a
filter through which objective stressors are experienced. This interaction between personal
experience and objective stressors is derived from the work of Raymond Novaco (1990) and
Meni Koslowsky (1997) , and is shown in Figure 1.
FIGURE 1 Study Framework
In order to better understand the factors leading to a stressful commute, this study uses a
large-scale university travel survey to compare commuter stress across three modes of
transportation (walking, driving, and using public transit) during a cold snowy day. By
highlighting which factors lead to stress on different modes, transportation planners, engineers
and policy makers can better understand the factors that can make the commute more enjoyable
and provide a less stressful experience.
LITERATURE REVIEW
What is stress? Lazarus and Launier (1978) define stress as a situation where the
environment overwhelms the person: “these relationships refer neither to person nor environment
as separate variables, but they describe a balance of forces such that environmental demands tax
4
1
2
3
4
5
6789
10
11
12
13
14
15
16
17
18
19
Legrain, Eluru & El-Geneidy
or exceed the resources of the person.” Other seminal work on stress echo this definition (see, for
instance, Fink, 2000; Selye, 1976). Furthermore, commuting has been linked to stress numerous
times (for a review see, Novaco & Gonzales, 2009). The experience of being stuck in traffic or
waiting for a delayed train is understandably a hardship and quite common. These and other
demands experienced while commuting often lead to stress. Yet, the relationship between
commuting and stress is not clear. For example, just because a delay is experienced does not
mean that the user experiencing that delay is necessarily stressed.
The Effects of Stress
Commuting stress (especially if it is unduly associated with specific modes) may inhibit
people switching to a more sustainable mode of transportation. Certainly, this is a concern. Also
of concern are the potential public health effects of stress, and, consequently, the serious health
and life satisfaction implications of stressful commuting. Longer commutes by car, for instance,
have been related to an increased risk of heart attack and obesity (Hoehner, Barlow, Allen, &
Shootman, 2012). In particular, the stress of commuting has been linked to poor quality sleep,
exhaustion, depression, and feelings of poor health (Gee & Takeuchi, 2004; Hansson, Mattisson,
Björk, Ostergren, & Jakobsson, 2011). Commuting stress has also been shown to negatively
impact a person’s ability to focus or complete tasks (Wener, Evans, & Boately, 2005). Poor job
performance and shortened job tenure, no doubt exacerbated by these health and mental effects,
are also linked to commuting stress (Koslowsky, Kluger, & Reich, 1995; Novaco, et al., 1990).
Nevertheless, the view that commuting, and travel in general, is an unavoidable burden
has come under much criticism. Mohktarian and Salomon (2001) have argued that travel is not
always a derived demand. Rather, travel, including commuting, can be enjoyed for its own sake.
5
1
2
3
4
5
6
7
8
9
10
11
12
13
14
15
16
17
18
19
20
21
22
23
Legrain, Eluru & El-Geneidy
A recent study showed that travel is linked to higher life satisfaction (Ory, et al., 2004). Morris
and Guerra (2014) have argued that those who are happy are more likely to travel. A recent
Swedish study demonstrated that feelings while commuting are generally positive or neutral
(Olsson, Garling, Ettema, Friman, & Fujii, 2013). Enjoying one’s commute may be linked to
notions of a desired minimum distance between a person’s home and work locations.
Commuting time may be enjoyed as a time to decompress or unwind, and as a necessary
transition between home and work. Interestingly, this may have an effect on stress as well. Those
who have no commute report being more stressed than those who commute less than thirty
minutes (Haider, Kerr, & Badami, 2013). In this way, commuting, as an activity that both
positively and negatively affects the commuter, is a significant player in a person’s overall
subjective well-being (Reardon & Abdallah, 2013).
The Causes of Stress
There are two major objective variables that help explain the forces that cause stress:
measurements of control and comfort. These two variables come out of the wealth of literature
focusing on the impedance model of commuting stress, first developed by Novaco et al. (1979).
Travel impedance is the notion that specific stressors (traffic congestion, for instance) impede
one’s commute. At its most basic form, the degree of impedance is defined by the distance
traveled and the time it took to travel that distance; high impedance occurs when one is traveling
slowly (Novaco, et al., 1979). Recent studies have also investigated how lengthy travel distances
relate to commuting stress (Ettema, Garling, Olsson, & Friman, 2010; Stutzer & Frey, 2008)
However, the stress of this impedance is mediated by a variety of factors. Control is seen as a
mediator of commuting stress. The level of impedance during the trip may be a cause of stress,
6
1
2
3
4
5
6
7
8
9
10
11
12
13
14
15
16
17
18
19
20
21
22
23
Legrain, Eluru & El-Geneidy
but having personal control of one’s own trip lessens this stress (Novaco, et al., 1990; Schaeffer,
Street, Singer, & Baum, 1988).
Yet, the task of determining a person’s level of control while travelling is not
straightforward. A number of factors have been used as proxies for personal control, such as
travel predictability (Evans & Wener, 2002). A commute is seen to be less predictable when
factors outside of a person’s control (traffic congestion, train delays) occur (Wener, Evans,
Phillips, & Nadler, 2003). For public transit, transfers are also seen as a cause for less
predictability, and thus less control (Wener, et al., 2005). However, Wener et al. (2005) also
argue that shorter travel times mitigate the stressful effects of transfers. One recent study used
self-reported ratings of predictability to determine this variable, using questions concerning
consistency and predictability of arrival time (Sposato, Röderer, & Cervinka, 2012). In addition
to predictability, having a variety of commuting options, such as different driving routes, have
been posited as mitigating the stress of impeded travel (Novaco, et al., 1990).
Comfort, or the lack of it, is also seen as a mediator of impedance. Discomfort from
crowding has long been associated with commuting stress, especially the stress associated with
public transportation (Koslowsky, et al., 1995; Lundberg, 1976). Uncomfortable heat or noise is
also seen to cause stress while travelling (Novaco & Gonzales, 2009; Wyon, Wyon, & Norin,
1996).
These physical or environmental occurrences, which result in a slower moving trip, lack
of control, or discomfort, are objective stressors that lead to a stressful commute. The subjective
experience of these stressors, however, is a crucial filter between the occurrence and the stress
experienced (refer to Figure 1, above). Ory (2004) argues that there is a difference between
objective mobility (the actual distance and frequency of travel using a certain mode) and
7
1
2
3
4
5
6
7
8
9
10
11
12
13
14
15
16
17
18
19
20
21
22
23
Legrain, Eluru & El-Geneidy
subjective mobility. Both objective measures of mobility and self-reported subjective measures
of mobility (responses to questions like “how often do you feel like you travel”) have an effect
on a person’s “travel-liking” (Ory, et al., 2004).
Novaco et al. (1979); Novaco, et al. (1990); and Koslowsky (1997) argue that the stress
of commuting is similarly derived not just from objective impedance but also from the mediating
experience of subjective impedance. How one feels about one’s trip has a mediating effect on
one’s experience of impedance, and thus an effect on stress. Subjective ratings by the commuter
regarding their satisfaction with the commute, the pleasantness of the trip (Novaco, et al., 1990),
or feelings about bus conditions or commuting environment (Koslowsky, 1997), have all been
used as measures of subjective impedance. Although both authors put forth this notion of
subjective impedance, they mainly focus on the subjective experience of one or two modes,
driving or taking public transit. Furthermore, their goal is not comparative; they are not focusing
on the experience of driving or public transit per se, but are using these modes as a petri dish
from which to derive a broad (mode-independent) understanding of commuting stress. This
study, on the other hand, argues that mode is intimately related to commuting stress. A
comparison of stress between modes and a comparison of mode-specific stressors offer insight
into the causes of commuting stress.
Mode and Stress
Surprisingly little work has been done comparing stress across all major modes of
transportation. We argue that a broad understanding of commuting stress cannot be derived from
a study of just one or two modes. Rather, mode must be understood as an important component
of commuting stress: different modes have inherently different variables that contribute to the
8
1
2
3
4
5
6
7
8
9
10
11
12
13
14
15
16
17
18
19
20
21
22
23
Legrain, Eluru & El-Geneidy
stress of that commute. Notions of control or lack of control vary whilst driving, walking, or
taking transit, and discussions of comfort and crowding vary depending on which mode is under
scrutiny.
Of the studies that have been done, many focus on the stressful effects of using an
automobile for commuting (for instance, Novaco, et al., 1979; Novaco, et al., 1990; Rasmussen,
Knapp, & Garner, 2000). Some studies have compared the stress of driving to the stress of
commuting on a train, finding that driving is more stressful (Wener & Evans, 2011). Very little
work has been done on the stress of active modes of transportation. This relative dearth is
perhaps because recent studies have linked active modes with higher overall life satisfaction (St-
Louis, Manaugh, Lierop, & El-Geneidy, 2014). In one broad comparative study, Abou-Zeid
(2009) found that (using self-reported stress levels on a 5-point Likert scale) active commuters
were the least likely to report being stressed during their commute. Drivers, on the other hand,
were the most likely to report stress. However, discovering mode-specific stressors may further
our understanding of commuting stress. It is clear that commuting using a car is a radically
different experience compared to walking, and, thus, the stress of these commutes occurs for
different reasons.
One recent study compared stress across active, transit, and driving modes, and found
that active modes of transportation are less stressful when compared to public transit or driving,
and that public transit is the most stressful (Gatersleben & Uzzell, 2007). However, this study
was not devoted to stress in itself, but was interested in ‘affective appraisals’ of a person’s
commute, both positive and negative. They included stress as one factor for understanding the
pleasantness of a commute, and, thus, the attractiveness of the mode. They found that transit was
the most stressful and least pleasant mode. Our study compares stress across modes and delves
9
1
2
3
4
5
6
7
8
9
10
11
12
13
14
15
16
17
18
19
20
21
22
23
Legrain, Eluru & El-Geneidy
deeper into understanding the variables, both subjective and objective, that are important
stressors during the use of specific modes. In this way the reasons behind the stress experienced
on a mode can be discovered. This comprehension is crucial for understanding commuting stress
and the steps that can be taken to lessen it. Furthermore, Gatersleben and Uzell (2007) were
limited by a small sample size (n=389), which only consisted of university employees
commuting in a semi-rural environment. Our study, focused on a large and diverse sample of
commuters in an urban environment, is better suited to discovering findings pertinent for urban
policy decisions.
METHODOLOGY
Survey
The data used for this study is compiled from a large-scale commuter survey
administered at McGill University in Montreal, Canada. The survey targeted a sample of
students (one-third of the student population), and all faculty and staff. Administered online,
every participant was emailed an invitation with a list of prizes that were offered as an incentive.
The survey was online for thirty-five days between March and April of 2013. A total of 20,851
survey invitations were distributed, with a response rate of 31.7%. This response rate is
comparable to a previous study (Whalen, Paez, & Carrasco, 2013) where they had a 22%
response rate. After removing partial or inadmissible cases, 5,599 surveys were kept as usable
responses. Because of further data requirements, discussed below, a smaller set of responses is
used for this study. The survey asked for a description of respondents’ commute on a typical cold
snowy day and a typical warm dry day. Respondents were asked for in-depth details about each
leg of their trip, specifying the mode used and the time spent using that mode. General questions
10
1
2
3
4
5
6
7
8
9
10
11
12
13
14
15
16
17
18
19
20
21
22
23
Legrain, Eluru & El-Geneidy
regarding their satisfaction, habits, and preferences for travel were also asked, and socio-
demographic information was gathered.
Sample
The final sample used for this study included 3,794 responses. This sample is composed
of 30% staff, 20% faculty, and 50% students. The sample includes respondents who commute to
McGill’s downtown campus (93.3%) and its Macdonald campus (located in a suburban area on
the island of Montreal). For this study we focused our attention on ‘cold-snowy day’ responses.
The survey was administered at the end of a long winter (snowy weather regularly continues into
early April in Montreal). At the time the survey was conducted the temperature was below
freezing for the majority of the time. Therefore, the responses to questions pertaining to winter
conditions, especially regarding reported levels of trip satisfaction and stress, are, we feel, better
representative of the levels of stress associated with commuting than questions regarding
summer (warm-dry) conditions. We expect that levels of satisfaction or stress reported by
respondents for warm-dry days is biased due to the fact that the survey was conducted at the tail-
end of a long winter. The temperature was below freezing in Montreal between early November
2012 until March 2013 and the survey was conducted in March and April. Also, respondents
who reported using more than one mode of transportation or stopping on their way to campus are
excluded from the study.
Respondents are assigned a variable based on their mode of transportation. If a
respondent only walked to their destination, they are deemed a pedestrian. Similarly, if they
drove to McGill they are deemed a driver (in our final sample, only 11 respondents are
passengers in automobiles, and are excluded from the study). Those who used public transit for
11
1
2
3
4
5
6
7
8
9
10
11
12
13
14
15
16
17
18
19
20
21
22
23
Legrain, Eluru & El-Geneidy
one leg of their trip are deemed public transit users. We originally included a sample of bicycling
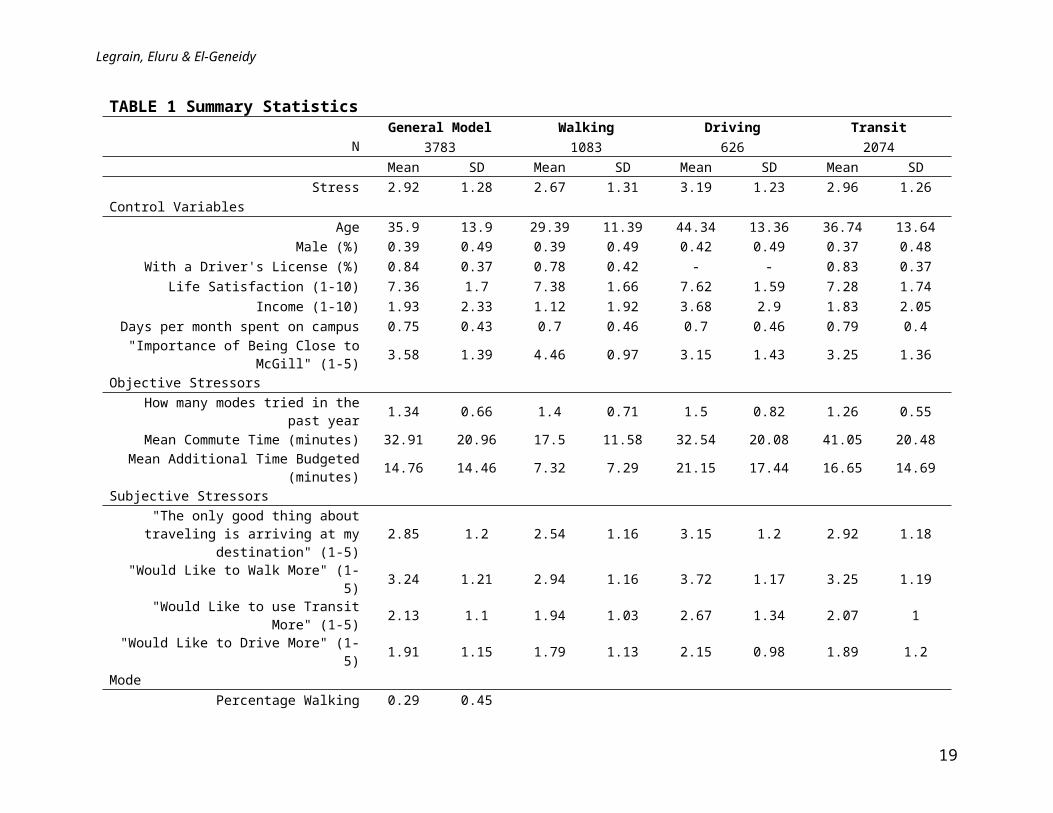
respondents (n=64), but this sample is excluded for being too small. Table 1 shows summary
statistics regarding each of the included travel mode groups. This breakdown by mode is desired
for two reasons. First, we wish to isolate the mode specific factors that contribute to commuting
stress; this categorization allows us to investigate what factors affect pedestrians and compare
these factors to those for drivers, for example. Second, this also allows us to compare the
explanatory power of a general stress model (where all respondents are included) to mode
specific models (where one model is generated for each mode).
12
1
2
3
4
5
6
7
8

Legrain, Eluru & El-Geneidy
TABLE 1 Summary Statistics
NGeneral Model Walking Driving Transit
3783 1083 626 2074 Mean SD Mean SD Mean SD Mean SD
Stress 2.92 1.28 2.67 1.31 3.19 1.23 2.96 1.26Control Variables
Age 35.9 13.9 29.39 11.39 44.34 13.36 36.74 13.64Male (%) 0.39 0.49 0.39 0.49 0.42 0.49 0.37 0.48
With a Driver's License (%) 0.84 0.37 0.78 0.42 - - 0.83 0.37Life Satisfaction (1-10) 7.36 1.7 7.38 1.66 7.62 1.59 7.28 1.74
Income (1-10) 1.93 2.33 1.12 1.92 3.68 2.9 1.83 2.05Days per month spent on campus 0.75 0.43 0.7 0.46 0.7 0.46 0.79 0.4
"Importance of Being Close to McGill" (1-5) 3.58 1.39 4.46 0.97 3.15 1.43 3.25 1.36Objective Stressors
How many modes tried in the past year 1.34 0.66 1.4 0.71 1.5 0.82 1.26 0.55Mean Commute Time (minutes) 32.91 20.96 17.5 11.58 32.54 20.08 41.05 20.48
Mean Additional Time Budgeted (minutes) 14.76 14.46 7.32 7.29 21.15 17.44 16.65 14.69Subjective Stressors
"The only good thing about traveling is arriving at my destination" (1-5) 2.85 1.2 2.54 1.16 3.15 1.2 2.92 1.18
"Would Like to Walk More" (1-5) 3.24 1.21 2.94 1.16 3.72 1.17 3.25 1.19"Would Like to use Transit More" (1-5) 2.13 1.1 1.94 1.03 2.67 1.34 2.07 1
"Would Like to Drive More" (1-5) 1.91 1.15 1.79 1.13 2.15 0.98 1.89 1.2Mode
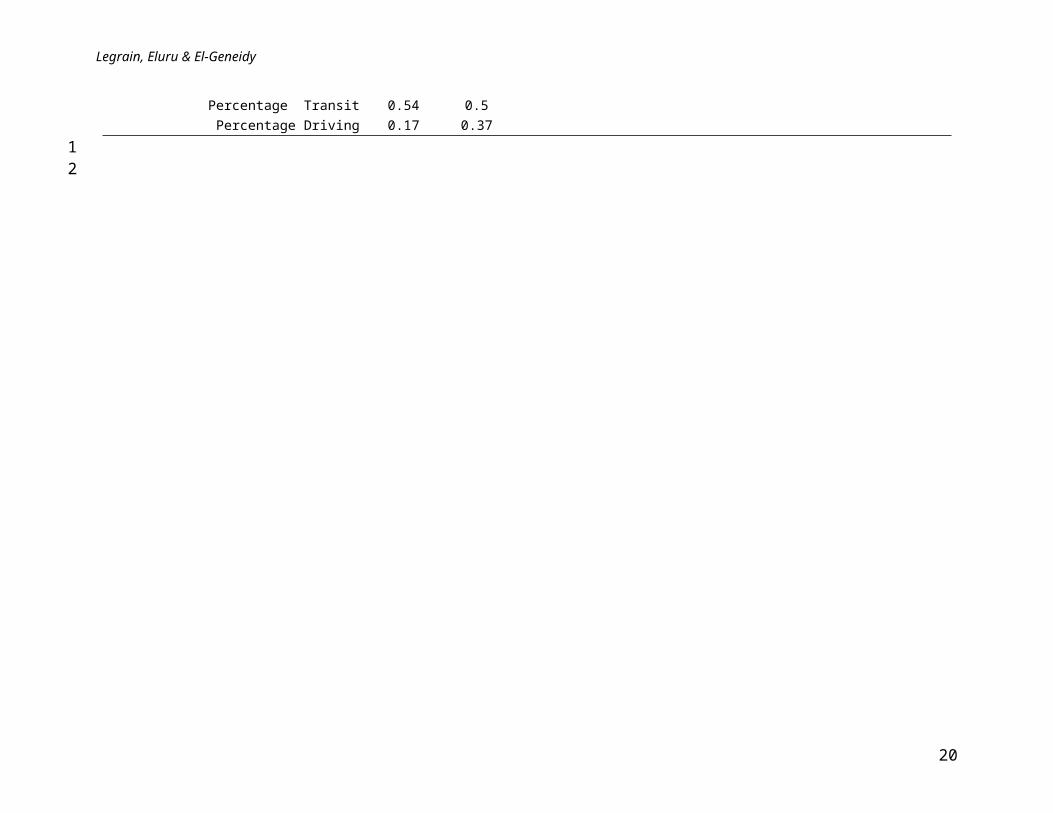
Percentage Walking 0.29 0.45 Percentage Transit 0.54 0.5 Percentage Driving 0.17 0.37
13
12
Legrain, Eluru & El-Geneidy
The summary statistics shown above only include variables that are applicable across all
groups (except percentage with a driver’s license for drivers, which is redundant). Transit users
are the most prominent group in our sample, with over a fifty percent share. Pedestrians have a
higher desire to live close to McGill than the other groups (with a mean of 4.46 out of five),
especially when compared to drivers. A quick comparison of the mean levels of stress across the
different mode groups show that drivers report the highest mean stress, with transit users
following closely behind. Drivers also tend to be older (mean of 44 years) have the highest life
satisfaction of all mode groups, and tend to have a higher income than the rest of the sample, all
factors that are related to less stress in our models. Interestingly, they also have the highest mean
additional time budgeted, indicating that circumstances beyond a drivers’ control necessitate
additional time. They also seem to have lower satisfaction with their commute, indicating that
subjective stressors are important components for this mode. They also tend to agree, more than
the other groups, that arriving at their destination is the only important component of their trip,
and they would like to use other modes more.
Modeling Technique
This study uses a series of ordered logit regressions to examine the relationship between
subjective and objective factors, modal influence, and stress. For all models, reported stress is the
dependent variable. The survey asked respondents if they agreed or disagreed (on a 5-point
Likert scale) that they “felt stressed during their commute to McGill.” Since this response is
inherently ordinal, an ordered logit modeling technique is appropriate. For independent variables,
we use pertinent variables based on previous studies concerning stress and subjective well-being.
Control variables are included to accommodate for demographic differences and residential
14
1
2
3
4
5
6
7
8
9
10
11
12
13
14
15
16
17
18
19
20
21
22
23
Legrain, Eluru & El-Geneidy
location choices. Other variables are included to capture both objective stressors and subjective
experiences related to these stressors.
Basic personal data including age, gender, and income (divided into four levels) are
included. Gender has been consistently included in studies of stress and stressful commuting.
The common consensus is that, ceteris peribus, women are more likely to be stressed than men
(Novaco & Collier, 1994). Age squared is tested to see if there is a change in effect among
different age groups. Also, the respondent’s main campus (downtown or at Macdonald) is tested
to control for any effect. Similarly, the respondent’s status (student, faculty, or staff) is
considered. To control for the effect of residential choice (self-selection), various residential-
location choice variables are tested: Importance of living close to transit, importance of living in
a location where driving is not necessary, and importance of living close to campus (all rated on
a 5-point Likert scale) are evaluated. Car ownership, is another variable which should be
controlled for. This can be done through a variable indicating how many vehicles each household
has. Also, a variable indicating how many days per month spent on campus (e.g., on campus
twenty days a month or approximately five days a week) is used to see if the repetition of the
commute has any effect, both positive and negative. Finally, overall life satisfaction is also
included.
Two major objective impedance variables are included, the time of the commute, and, for
transit users, if they transferred or not during their commute. Beyond these objective measures, a
number of mediating stressor variables, approximating the level of control the person has and the
level of discomfort the person is experiencing, are included. The survey asked respondents to
report how much additional time they budgeted (in minutes) for their daily commute. This
variable can be used to approximate how unpredictable a commute is, and, thus, how much
15
1
2
3
4
5
6
7
8
9
10
11
12
13
14
15
16
17
18
19
20
21
22
23
Legrain, Eluru & El-Geneidy
control a person has during her trip. Another variable is included to approximate how much
choice a commuter has: The survey asked respondents to count how many modes (different
from their primary mode) they used in the last year to commute to school or work. A mode used
at least once in the last year indicates that this mode is at least a potential or viable option for the
user; those with more options available have potentially more choice and control over their
commute.
Stressors dealing with the level of comfort experienced during the commute are mode-
specific and hard to gather objectively. Self-rated feelings of comfort, ‘safety from crime,’ and
‘safety from traffic’ are included to gain insight into these stressors. Connected to feelings of
comfort is the fact that a commute that is long or has an additional time budget that is excessive
does not directly correspond to a stressful commute. As has been discussed, the subjective
experience of these objective stressors is also important. To capture these subjective stressors’
effects, a series of variables dealing with self-reported feelings towards travel mode and
satisfaction with specific components of that mode are included. Respondents are asked to rate
their satisfaction with their commute time, cost of their commute, and other specific satisfaction
variables (to be discussed below). Respondents are also asked to rate whether or not they felt that
travel had a purpose besides arriving, and if they would like to use each mode more than they
currently do. These variables indicate if they have any enjoyment for their trip (beyond arriving)
and approximate their satisfaction with their commute and mode of the moment. These variables
attempt to capture similar sentiments as the ‘Travel Liking’ variable used by Ory et al. (2004).
In order to come to a better understanding of the effect mode has on commuter stress, and
to discover in greater detail the stressors of specific modes, a series of models is developed. First,
a general model for the entire sample is generated and includes the universal (not mode-specific)
16
1
2
3
4
5
6
7
8
9
10
11
12
13
14
15
16
17
18
19
20
21
22
23
Legrain, Eluru & El-Geneidy
variables, described above. It also includes dummy variables indicating which mode is used
(walking, driving, or taking transit) to measure the effect different modes have on stress. Three
further models are also developed, one for each mode under study. All the variables included in
the original general model are also present in the mode-specific models, unless they are found to
be insignificant. If a variable is insignificant, it is removed, and the change in the Log-Likelihood
of the model as well as the change in effect of other variables is studied. If little change occurs,
the insignificant variable is not included in our final analysis. In addition to these general
variables, other, mode specific variables are included.
All variables originally recorded using 5-point Likert responses are recoded into dummy
variables, where responses (1) and (2) are categorized as a ‘Low’ response, (3) as a ‘Medium’
response and (4) and (5) as a ‘High’ response.
Walking Model
In the walking model, only those respondents who used walking as their primary mode of
commuting to campus are included. For walking specific variables, ‘safety from traffic’ and
satisfaction with comfort are included. Safety from crime, having a driver’s license, days spent
on campus, and the number of viable options available are also tested.
Driving Model
Similar to the walking model, only those respondents who used an automobile as their
primary commuting mode are included, and these respondents are only drivers. A very small
sample size of automobile passengers present in the sample (n=11) limits our ability to
investigate this subset of automobile users, and they are excluded. Satisfaction with time and cost
17
1
2
3
4
5
6
7
8
9
10
11
12
13
14
15
16
17
18
19
20
21
22
23
Legrain, Eluru & El-Geneidy
are included as driving specific variables. Safety from crime, satisfaction with comfort, and
satisfaction with consistency are included as well.
Transit Model
We determine that those who use transit are those who use a public bus, train, or subway
for at least on leg of their trip. Included are dummy variables for the transit type used: subway,
bus, or commuter train. In addition, a dummy variable indicating if the respondent walked to the
transit station (versus drove) and if the respondent used two different modes (necessitating a
transfer) versus one, are included.
Subjective transit variables offer a unique challenge because the pertinent questions in
the survey are transit-type specific. These questions (dealing with respondents satisfaction with
time, for instance) are asked not regarding a commuter’s satisfaction with time on transit in
general, but satisfaction with her time on the bus, her time on the subway, or her time on the
train, depending on which type(s) she used. To explore this level of detail but to avoid
developing models for each transit type, we collapsed these three subsets of the transit sample
into one. Most respondents did not use every transit type, and therefore did not report
information on their subjective experience of unused modes. For these cases, their answers to
these un-asked questions are coded as a 0. This code is categorized under the ‘Low’ level of
dummy variables for ranked responses. In the transit model the lowest level is excluded from
testing. In this manner, we have three layers of transit subjective experience, one for train, one
for bus, and another for subway riders. The dummy levels that remained (Medium and High)
explain the effect of having such an opinion for those who used that mode. These ranked
variables are similar to the ones included in the pedestrian and driving models. ‘Satisfaction with
18
1
2
3
4
5
6
7
8
9
10
11
12
13
14
15
16
17
18
19
20
21
22
23
Legrain, Eluru & El-Geneidy
the consistency’ of the transit type, a rating of how comfortable the type is, how satisfied the
rider is with the time it takes to reach the station, and the waiting time at the station are all
included. Satisfaction with time and safety from crime are also tested.
RESULTS
Table 2 shows the results of our regression analyses. Prior to discussing the model
results, we provide a comparison of the general model and the mode specific models. The reader
should note that the general model would usually tend toward a parsimonious structure, while the
mode-specific models would provide additional flexibility with higher number of model
parameters. Hence, any comparisons of these model structures need to weigh the advantage of
the mode specific models while penalizing for additional parameters. We employ the Likelihood
Ratio (LR) test to compare the models. The LR test statistic is defined as 2 * (LLU – LLR) where
LLU and LLR represent log-likelihood (LL) values at convergence of the unrestricted and
restricted models respectively. In our case, the sum of log-likelihood values of all mode-specific
models corresponds to the unrestricted model LL, while the general model LL corresponds to the
restricted model LL. The LR test statistic thus computed is compared with the chi-square
distribution value of k degrees of freedom where k corresponds to the additional parameters in
the unrestricted model, i.e. k = sum of the number of parameters in all mode-specific models
minus the number of parameters in the general model. The LL value sum for the mode specific
models is -5248.99, and the general model is -5419.93. These values yield an LR test statistic of
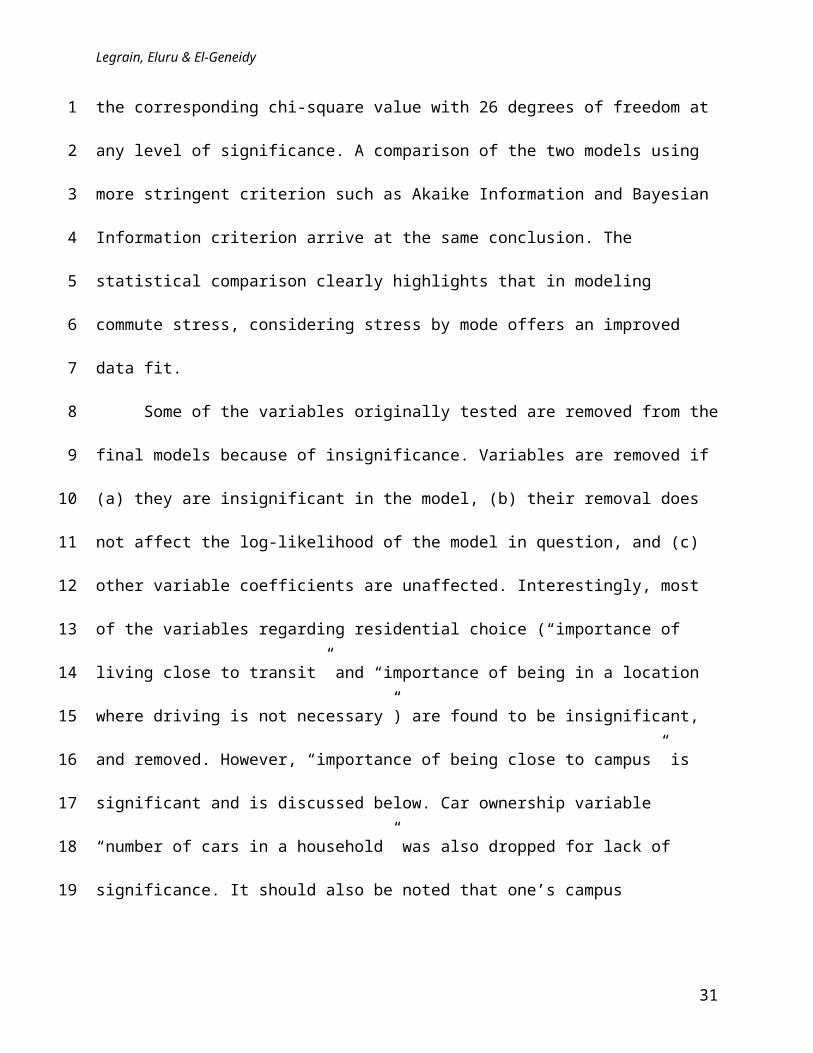
341.89, which is considerably higher than the corresponding chi-square value with 26 degrees of
freedom at any level of significance. A comparison of the two models using more stringent
criterion such as Akaike Information and Bayesian Information criterion arrive at the same
19
1
2
3
4
5
6
7
8
9
10
11
12
13
14
15
16
17
18
19
20
21
22
23
Legrain, Eluru & El-Geneidy
conclusion. The statistical comparison clearly highlights that in modeling commute stress,
considering stress by mode offers an improved data fit.
Some of the variables originally tested are removed from the final models because of
insignificance. Variables are removed if (a) they are insignificant in the model, (b) their removal
does not affect the log-likelihood of the model in question, and (c) other variable coefficients are
unaffected. Interestingly, most of the variables regarding residential choice (“importance of
living close to transit” and “importance of being in a location where driving is not necessary”)
are found to be insignificant, and removed. However, “importance of being close to campus” is
significant and is discussed below. Car ownership variable “number of cars in a household” was
also dropped for lack of significance. It should also be noted that one’s campus (Macdonald or
downtown) or one’s status (faculty, staff, or student) are both found to be insignificant.
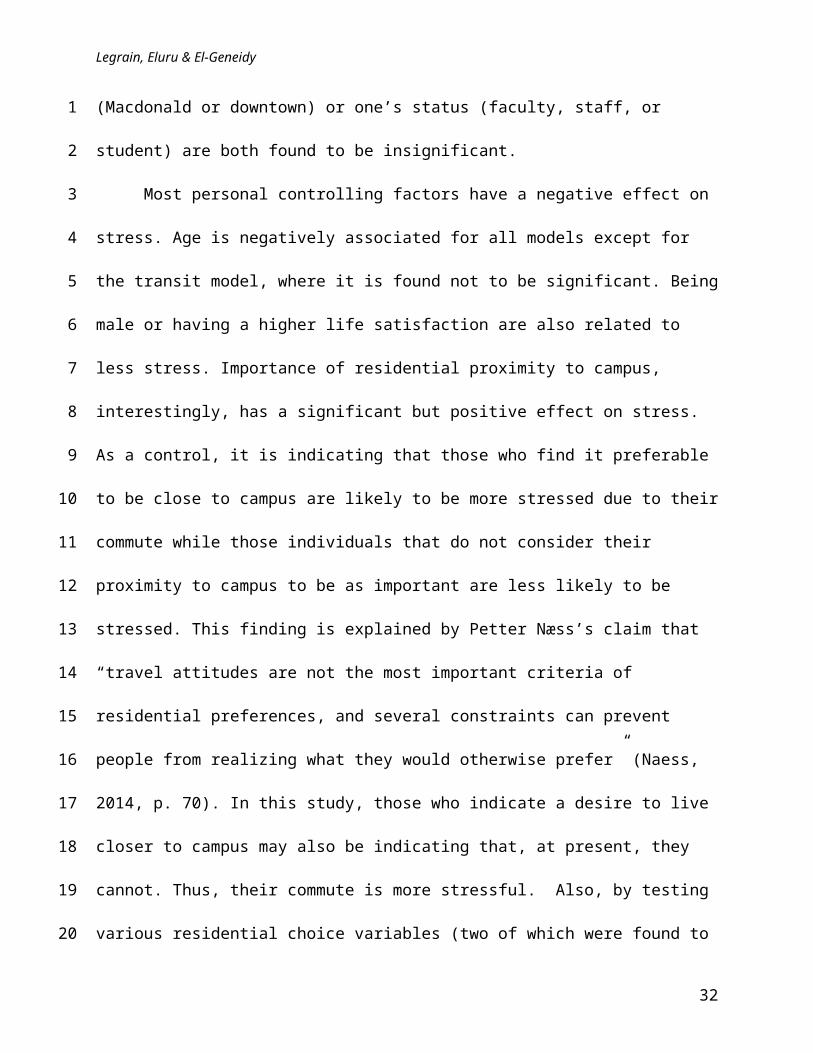
Most personal controlling factors have a negative effect on stress. Age is negatively
associated for all models except for the transit model, where it is found not to be significant.
Being male or having a higher life satisfaction are also related to less stress. Importance of
residential proximity to campus, interestingly, has a significant but positive effect on stress. As a
control, it is indicating that those who find it preferable to be close to campus are likely to be
more stressed due to their commute while those individuals that do not consider their proximity
to campus to be as important are less likely to be stressed. This finding is explained by Petter
Næss’s claim that “travel attitudes are not the most important criteria of residential preferences,
and several constraints can prevent people from realizing what they would otherwise prefer”
(Naess, 2014, p. 70). In this study, those who indicate a desire to live closer to campus may also
be indicating that, at present, they cannot. Thus, their commute is more stressful. Also, by
testing various residential choice variables (two of which were found to be insignificant) we are
20
1
2
3
4
5
6
7
8
9
10
11
12
13
14
15
16
17
18
19
20
21
22
23
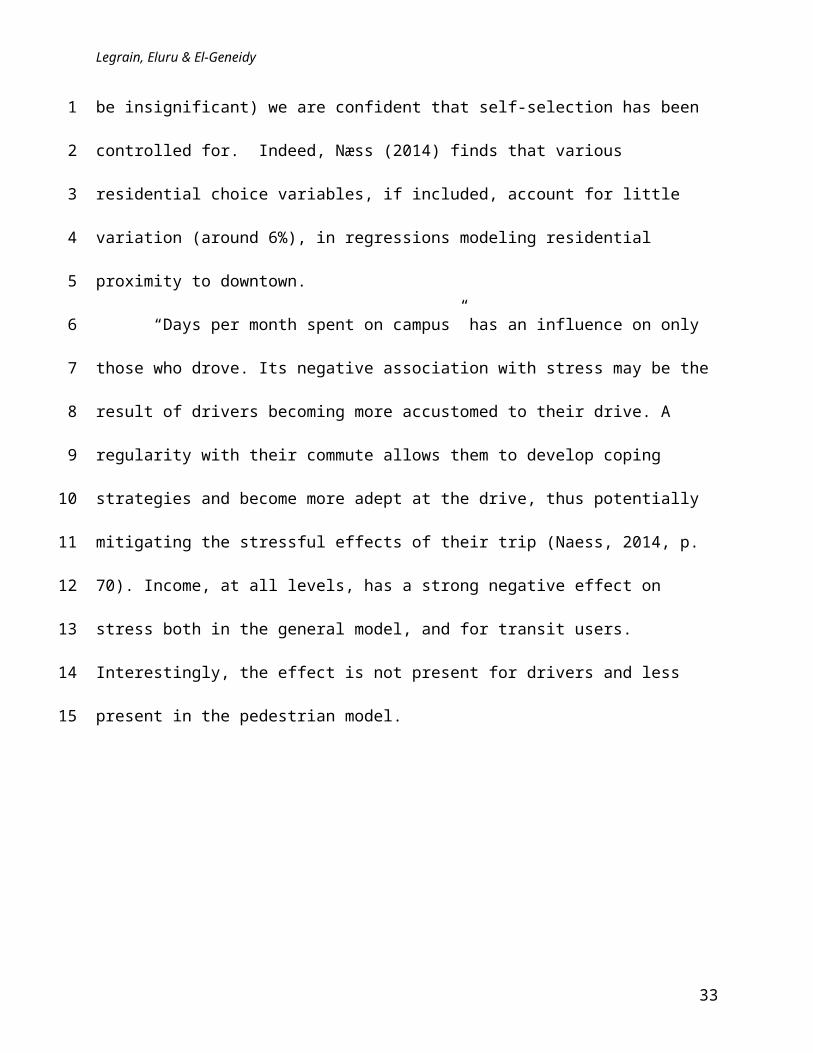
Legrain, Eluru & El-Geneidy
confident that self-selection has been controlled for. Indeed, Næss (2014) finds that various
residential choice variables, if included, account for little variation (around 6%), in regressions
modeling residential proximity to downtown.
“Days per month spent on campus” has an influence on only those who drove. Its
negative association with stress may be the result of drivers becoming more accustomed to their
drive. A regularity with their commute allows them to develop coping strategies and become
more adept at the drive, thus potentially mitigating the stressful effects of their trip (Naess, 2014,
p. 70). Income, at all levels, has a strong negative effect on stress both in the general model, and
for transit users. Interestingly, the effect is not present for drivers and less present in the
pedestrian model.
21
1
2
3
4
5
6
7
8
9
10
Legrain, Eluru & El-Geneidy
TABLE 2 Ordered Regression Results General Pedestrian Driver TransitLog-Likelihood -5419.93 -1512.59 -855.72 -2880.681
Dummy Level B B B B
Controlling Variables Age*10-2 -1.347*** -2.303** -1.264 -0.573
Male -0.512*** -0.408*** -0.406* -0.487***With a driver's license -0.373*** − na -0.438***
Life satisfaction (1-10) -0.157*** -0.214*** -0.055 -0.107***Income
(Comparison variable) $0-$19,999 $20,000-$79,999 -0.304*** -0.378** -0.083 -0.335**
$80,000-$119,999 -0.43** -0.666** -0.034 -0.565**$120000+ -0.451** -0.402 -0.31 -0.607**
Days per month spent on campus*10-2 − − -3.071** −Importance of being close to McGill High 0.327*** 0.643 0.316 0.292**
Objective Stressors How many modes tried in the past year -0.127** − − -0.224**
Commute time*10-2 1.356*** 1.228** 1.363** 1.031***Additional time budgeted*10-2 2.69*** 3.291*** 2.075*** 2.229***
Subjective Stressors The only good thing about traveling is arriving at my destination Low − -0.393** − −The only good thing about traveling is arriving at my destination High 0.494*** 0.028 0.27 0.534***
Would Like to Walk More Med -0.215** − − −Would Like to Walk More High − 0.433** −
Would Like to use Transit More Low -0.273*** − − − Would Like to use Transit More High − − 0.58**
Would Like to Drive More Low -0.285*** − − −Would Like to Drive More High − − − 0.291*
Mode (Comparison Variable) Driver na na na na
Pedestrian -0.702*** na na naTransit -0.628*** na na na
22
Legrain, Eluru & El-Geneidy
General Pedestrian Driver TransitPedestrian and Driver Variables
Satisfied with Time Low na − 1.052*** naComfortable High na -0.81*** − na
Safe from traffic Low na 0.42*** − naSafe from traffic Med na 0.52*** − na
Satisfied with Cost High na − -0.519** naTransit Variables
Mode Used Subway na na na -0.282Mode Used Train na na na 0.068
Walked to Transit Station na na na -0.322*two modes used na na na 1.188***
Train Satisfaction Satisfied with the time it takes to reach the station Med na na na -1.152* Satisfied with the time it takes to reach the station High na na na -0.901*
Satisfied with waiting time in station High na na na -0.49*Subway Satisfaction
Consistent high na na na -0.337** Comfortable Med na na na -0.457** Comfortable High na na na -0.51***
Satisfied with waiting time in station Med na na na -0.439**Bus Satisfaction
Consistent Med na na na -0.392*Consistent High na na na -0.295*
Satisfied with waiting time in station Med na na na -0.44** Satisfied with waiting time in station High na na na -0.793***
* p<0.05, **p<0.01, ***p<0.001, − "found insignificant, and removed", na "not applicable"
23
Legrain, Eluru & El-Geneidy
To determine the general effect that mode has on stress, we include dummy variables
indicating which mode is used in the general model. Both walking and taking transit have a
strong negative effect on stress when compared to driving. This finding is not unanimously
supported in other papers. A recent study looking at 33 urban areas in Canada found transit to be
the most stressful mode (Haider, et al., 2013). Ory etl al. (2004) also found that transit is the
most stressful. Gatersleben and Uzzell (2007) find that both driving and taking public transit are
stressful when compared to active modes. These discrepancies with our study can be explained
because of differences in study area. Our study is focused on a primarily urban population, with
corresponding access to a relatively wide variety of public transit options (indeed, over half of
our sample uses transit on a daily basis). These two other studies (Gatersleben & Uzzell, 2007;
Haider, et al., 2013) are focused on either a wide range of urban and semi-urban areas of Canada
(many of which have limited public transportation access), or a semi-rural area of England, not a
dense urban center.
Our objective stressors are aimed at measuring the direct impedance of the commute and
the mediating effect control and comfort have on that impact. First, our measure of commuting
options did have a negative effect in the general model. The result indicates that individuals who
have used multiple mode options are likely to feel less stressed. However, in the mode specific
models, this variable is only significant for transit users. This indicates that for transit users,
having other (possibly non-transit) commuting options lessens the stress experienced. Commute
time is found to be positively associated with stress both in the general model and across modes.
Those with a lengthier commute are, on the whole, more stressed. What is interesting is that our
main mediating variable, additional time budgeted, has an almost twice as large impact on stress
24
1
2
3
4
5
6
7
8
9
10
11
12
13
14
15
16
17
18
19
20
21
22
Legrain, Eluru & El-Geneidy
than simple commute time in all models. The more time a respondent must budget to deal with
unpredictable situations on her commute, the more stressed the respondent will be.
The subjective stressors accommodate for the impact of individual perceptions and
attitudes on commute stress. Similar to control and comfort, these variables have a mediating
effect between the actual objective instigator of stress (traffic congestion, for instance) and the
stress actually experienced by the commuter.
Agreeing with the statement that ‘the only good thing about traveling is arriving’ is
positively associated with stress in all models except for the pedestrian model, where not
agreeing is negatively associated with stress. This result indicates that those who do not enjoy
their travel for reasons other than arriving (reading, listening to music, the experience of speed,
for example, are more stressed, a finding corroborated by Gatersleben and Uzzell (2007). Related
to this effect are the variables concerning a respondent’s desire to use other modes more often. In
the general model, not wanting to use transit or drive more is negatively associated with stress.
This may indicate that if a commuter is satisfied with their mode (and therefore does not wish to
use another mode more often) they are less stressed. Also, in the transit model, wanting to use
transit or drive more is positively associated with stress. This indicates that, for transit
commuters, not being content with one’s commuting habits (and thus wanting to use transit or
drive more) leads to more stress. Similarly, for drivers, wanting to walk more than one currently
does means they are more likely to be more stressed during their commute. Perhaps a component
of the stress certain drivers feel is related to feelings of control; they feel more stressed because
they wish to walk to work or school, but cannot.
25
1
2
3
4
5
6
7
8
9
10
11
12
13
14
15
16
17
18
19
20
21
22
23

Legrain, Eluru & El-Geneidy
Mode Specific Variables
Comfort is a mode-specific measure: comfort while walking has nothing to do with seat
availability, for instance. Also, comfort is inherently a subjective occurrence. One cannot directly
measure the comfort a person is experiencing. Having a (self-reported) high comfort rating has a
negative effect on stress and is significant in the pedestrian and transit models.
Pedestrian and Driver Subjective Stressors
For pedestrians, satisfaction with time is not significantly associated with stress.
However, not feeling safe from traffic is positively related, which indicates that perhaps the most
stressful possibility of the pedestrian experience is dealing with automobiles. Our finding that
time is insignificance for pedestrians corroborates previous studies that find that a pedestrian’s
satisfaction with their commute is related to the motivations (environment, finances, or
convenience) behind their mode choice, and has less to do with the time spent walking
(Mokhtarian & Salomon, 2001).
Conversely, for drivers, time satisfaction is important. Having a low satisfaction with
time is strongly and positively associated with stress. Considering they have the highest mean
time budget (see Table 1), time and predictability are important, and more stressful, variables for
drivers when compared to other modes.
Transit Specific Stressors
For transit users, no one specific transit type (subway, train, or bus) is associated with a
stressful commute. However, walking to your transit station, compared to driving, is negatively
associated with stress, and having used two modes (versus one) is strongly positively associated
26
1
2
3
4
5
6
7
8
9
10
11
12
13
14
15
16
17
18
19
20
21
22
23
Legrain, Eluru & El-Geneidy
with stress. This indicates that the unpredictability of transit commuting (which occurs when a
transfer between modes or driving is necessary) is a clear objective stressor. This claim is
substantiated by the findings related to subjective stressors.
For commuter-train users, being satisfied with both the time it takes to reach the station
and the time waiting at the station are negatively associated with stress. The unpredictability of
the trip to the train station, and the tense time waiting for the train once there, may help explain
these variables’ importance. This is interesting, because for the two other transit mode types
(subway and bus) satisfaction with the time to reach the station is not a concern. This may
indicate that bus and subway stations are much more conveniently located; the trip to the station
does not present a potentially stressful situation.
However, unlike train users, feeling that one’s metro or bus trip is consistent is negatively
associated with stress. Here, it indicates that for train users, once they are on the train the
consistency of the trip is not an issue, but it is an issue for metro and bus users. For subway
riders, comfort is also a concern. Having a high satisfaction with comfort is negatively associated
with stress. Finally, like train users, for subway and bus users waiting times are significantly
associated with stress. This indicates where perhaps the most stressful occurrence of any transit
trip can occur, when waiting for the service, wondering when it is going to come.
CONCLUSION
The results of this study support previous research findings regarding commuting and
stress (Manaugh & El-Geneidy, 2013). More importantly, this study demonstrates that the stress
of commuting is intimately related to the mode being used: A general conception of commuting
stress is not as powerful as mode-specific models. Similar to other studies, this study finds
27
1
2
3
4
5
6
7
8
9
10
11
12
13
14
15
16
17
18
19
20
21
22
23
Legrain, Eluru & El-Geneidy
driving to be the most stressful commute. However, unlike previous studies, it finds that transit is
not as stressful as driving.
Furthermore, our study confirms that commuting stress is caused by an interaction
between objective stressors and mediators (time, control, and comfort) and subjective stressors
which act as mediators (feelings, desires, and satisfaction). Driving is the most stressful mode
because drivers must budget a considerable amount of extra time to deal with unexpected delays
(their additional time budget has a mean of 21 minutes), and are more likely to be stressed when
they are less satisfied with the time of their commute. This additional time budget indicates that
they have, perhaps paradoxically, less control over their commute than commuters on other
modes. Frequent and unpredictable occurrences require of them a peremptory stance towards
their commute, where extra time becomes the best way to assure arriving to work or school on
time.
This study also indicates that public transit users, although they are not as stressed as
drivers, have a variety of stressors to contend with. The mode used to get to the station,
satisfaction with the time to reach the station (for train riders), and waiting time at the station are
all related to stress. All these factors can be seen as areas where control is wrested from the
transit user. Unpredictability can occur at any moment in the transit experience, dissatisfaction
with these moments may indicate a decrease in feelings of control over their situation, and thus
more stress. Interestingly, only in the transit model is having used other modes related to less
stress. It seems that having ‘a plan B’ for their commute lessens the stress of their trip. Transit
agencies should consider policies that could better inform users (such as accurate bus or train
arrival information) to lessen the stress experienced while traveling. Also, providing viable
alternatives could further lessen transit stress.
28
1
2
3
4
5
6
7
8
9
10
11
12
13
14
15
16
17
18
19
20
21
22
23
Legrain, Eluru & El-Geneidy
Pedestrians are our least stressed mode group. For them, satisfaction with comfort and
safety seem to have an important mediating effect on stress. These findings have notable policy
implications. Active transportation modes are not only environmentally and socially more
sustainable, they are also a less stressful way to travel. On way to increase pedestrian mode-share
is to protect walkers from traffic and provide more pleasant and more comfortable streets to walk
on. Furthermore, public transportation is also less stressful than driving, which is found to
involve (somewhat perversely) less control for commuters. Increasing the predictability and
range of transit options in an era of increasing driving unpredictability could lead to a greater
transit mode share. Further investigation into the choice commuters have as a way to compare
transportation modes should be studied in greater detail. For public transit users, measures of
viable route options, including options not using the public transit network, can be gathered. This
information could be easily provided to commuters, which would lessen the stress they
experience and potentially increase their transit use. Having these choices, it is shown, has a
negative effect on stress for transit users.
As a final note, a number of variables not included in this study impose limitations on our
findings, and also offer avenues for future research. Our research uses one Likert scale response
to measure stress. However, using a more standard stress scale while also incorporating
outcomes of stress (missed days at work or school, mental or physical side effects) could make
our findings more robust, and could be incorporated into future research. Also, a more direct
question relating to a respondent’s subjective experience of predictability might be useful. This
variable could be used in conjunction with a respondent’s additional time budget to measure both
subjective and objective effects of predictability. In this study we collected data during a cold
weather condition, so questions regarding good weather were excluded, as we felt some bias
29
1
2
3
4
5
6
7
8
9
10
11
12
13
14
15
16
17
18
19
20
21
22
23
Legrain, Eluru & El-Geneidy
especially towards active modes. Future research collecting data to measure stress due to a
commute need to be conducted across a longer time frame allowing for weather variation. Such
expansion in the data collected period will make the reported levels of stress more accurate and
representative of the impacts of different weather condition. Finally, subjective questions
regarding a respondent’s feelings of control or a personal estimate of how much effort (physical
and mental) expended can greatly expand this study’s findings.
ACKNOWLEDGEMENTS
This research was partially funded by the Natural Sciences and Engineering Research Council of
Canada collaborative research and development (NSERC-CRD) program. The authors would
like to thank Kathleen Ng and Brian Karasick from the McGill Office of Sustainability for their
feedback and guidance. Thank you to Daniel Schwartz from IT Customer Services, Colin
Stewart, and Dea Van Lierop for the design and implementation of the survey. Thanks to the two
anonymous reviewers for their feedback on the earlier stages of this paper.
30
1
2
3
4
5
6
7
8
9
10
11
12
13
14
15
16
Legrain, Eluru & El-Geneidy
REFERENCES
Abou-Zeid, M. (2009). Measuring and modeling activity and travel well-being. Massachusetts Institute of Technology, Cambridge, MA.
Abou-Zeid, M., Witter, R., Bierlaire, M., Kaufmann, V., & Ben-Akiva, M. (2012). Happiness and travel mode switching: Findings from a Swiss public transportation experiment. Transport Policy, 19, 93-104.
Ettema, D., Garling, T., Olsson, L., & Friman, M. (2010). Out-of-home activities, daily travel, and subjective well-being. Transportation Research Part A, 44, 723-732.
Evans, G., & Wener, R. (2002). The morning rush hour: Predictability and commuter stress. Environment and Behavior, 34, 521-530.
Fink, G. (2000). Encyclopedia of Stress. New York: Academic Press.
Gatersleben, B., & Uzzell, D. (2007). Affective appraisals of the daily commute. Environment and Behavior, 39, 416-431.
Gee, G., & Takeuchi, D. (2004). Traffic stress, vehicular burden and well-being: a multilevel analysis. Social Science & Medecine, 59, 405-414.
Haider, M., Kerr, K., & Badami, M. (2013). Does commuting cause stress? The public health implications of traffic congestion. Social Science Research Network.
Hansson, E., Mattisson, K., Björk, J., Ostergren, P.-O., & Jakobsson, K. (2011). Relationship between commuting and health outcomes in a cross-sectional population survey in southern Sweden. BMC Public Health, 11.
Hoehner, C. M., Barlow, C. E., Allen, P., & Shootman, M. (2012). Commuting Distance, Cariorespiratory Fitness, and Metabolic Risk. American Journal of Preventative Medicine, 42, 571-578.
Koslowsky, M. (1997). Commuting stress: Problems of definition and variable identification. Applied Psychology: An International Review, 46, 153-173.
Koslowsky, M., Kluger, A. N., & Reich, M. (1995). Commuting stress: Causes, effects, and methods of coping. New York: Plenum Press.
Lazarus, R., & Launier, R. (1978). Stress-related transactions between person and environment. In L. Pervin (Ed.), Perspectives in Interactional Psychology. New York: Plenum Press.
Lundberg, U. (1976). Urban commuting: Crowdedness and catecholamine excretion. Journal of Human Stress, 2, 26-32.
31
1234
567
89
1011
12
1314
1516
1718
192021
222324
2526
2728
2930
3132
Legrain, Eluru & El-Geneidy
Manaugh, K., & El-Geneidy, A. (2013). Does distance matter? Exploring the links among values, motivations, home location, and satisfaction in walking trips. Transportation Research Part A, 50, 198-208.
Mokhtarian, P. L., & Salomon, I. (2001). How derived is the demand for travel? Some conceptual and measurement considerations. Transportation Research Part A, 35, 695-719.
Morris, E. A., & Guerra, E. (2014). Mood and mode: does how we travel affect how we feel? Transportation.
Naess, P. (2014). Tempest in a teapot: the exaggerated problem of transport-related residential self-selection as a source of error in empirical studies. Journal of Transport and Land Use, 7, 57-79.
Novaco, R., & Collier, C. (1994). Commuting stress, ridesharing, and gender: Analyses from the 1993 state of the commute study in Southern California (Working Paper).
Novaco, R., & Gonzales, O. (2009). Commuting and well-being. In Y. Amichai-Hamburger (Ed.), Technology and Well-Being. New York: Cambridge University Press.
Novaco, R., Stokols, D., Campbell, J., & Stokols, J. (1979). Transportation, stress, and community psychology. American Journal of Community Psychology, 7, 361-380.
Novaco, R., Stokols, D., & Milanesi, L. (1990). Objective and subjective dimensions of travel impedance as determinants of commuting stress. American Journal of Community Psychology, 18, 231-257.
Olsson, L., Garling, T., Ettema, D., Friman, M., & Fujii, S. (2013). Happiness and satisfaction with work commute. Social Indicators Research, 255-263.
Ory, D., Mokhtarian, P. L., Redmond, L. S., Salomon, I., Collantes, G. O., & Choo, S. (2004). When is commuting desirable to the individual. Growth and Change, 35, 334-359.
Rasmussen, C., Knapp, T., & Garner, L. (2000). Driving-induced stress in urban college students. Perceptual and Motor Skills, 90, 437-443.
Reardon, L., & Abdallah, S. (2013). Well-being and transport: Taking stock and looking forward. Tranport Reviews: A Transnational Transdisciplinary Journal, 33, 634-657.
Schaeffer, M., Street, S., Singer, J., & Baum, A. (1988). Effects of control on the stress reactions of commuters. Journal of Applied Social Psychology, 18, 944-957.
Selye, H. (1976). The stress of life (2 ed.). New York: McGraw-Hill.
Sposato, R., Röderer, K., & Cervinka, R. (2012). The influence of control and related variables on commuting stress. Transportation Research Part F, 15, 581-587.
32
123
456
78
91011
1213
1415
1617
181920
2122
2324
2526
2728
2930
31
3233
Legrain, Eluru & El-Geneidy
St-Louis, E., Manaugh, K., Lierop, D. v., & El-Geneidy, A. (2014). The happy commuter: A comparison of commuter satisfaction across modes. Transportation Research Part F: Traffic Psychology and Behaviour, 26, 160-170.
Stutzer, A., & Frey, B. S. (2008). Stress that doesn't pay: The commuting paradox. The Scandinavian Journal of Economics, 110, 339-366.
Wener, R., & Evans, G. (2011). Comparing stress of car and train commuters. Transportation Research Part F, 14, 111-116.
Wener, R., Evans, G., & Boately, P. (2005). Commuting stress: psychophysiological effects of a trip and spillover into the workplace. Transportation Research Record: Journal of the Transportation Research Board, 1924, 112-117.
Wener, R., Evans, G., Phillips, D., & Nadler, N. (2003). Running for the 7:45: The effects of public transit improvements on commuter stress. Transportation, 30, 203-220.
Whalen, K., Paez, A., & Carrasco, J. (2013). Mode choice of university students commuting to school and the role of active travel. Journal of Transport Geography, 31, 132-142.
Wyon, D., Wyon, I., & Norin, F. (1996). Effects of moderate heat stress on driver vigilance in a moving vehicle. Ergonomics, 39, 61-75.
33
123
45
67
89
10
1112
1314
151617


![Eluru - Andhra Pradesh Eluru Rural Total 20 Divisions ... [31 Koyyalagudem Mandal [4] Kukkunuru Mandal [5] Velerupadu Mandal [6] Jeelugumilli Mandal Ol- Municipality Total 04 Mandals](https://img.pdfslide.net/doc/110x75/5b00d8c27f8b9ad85d8d2eec/eluru-andhra-eluru-rural-total-20-divisions-31-koyyalagudem-mandal-4-kukkunuru.jpg)