Embed Size (px)
Citation preview

Monetary Policy Volatility Shocks in Brazil Brazil
Angelo Marsiglia Fasolo
August 2018
480

ISSN 1518-3548 CGC 00.038.166/0001-05
Working Paper Series Brasília no. 480 AugustAugust 2018 p. 1-31

Working Paper Series
Edited by the Research Department (Depep) – E-mail: [email protected]
Editor: Francisco Marcos Rodrigues Figueiredo – E-mail: [email protected]
Co-editor: José Valentim Machado Vicente – E-mail: [email protected]
Head of the Research Department: André Minella – E-mail: [email protected]
The Banco Central do Brasil Working Papers are all evaluated in double-blind refereeing process.
Reproduction is permitted only if source is stated as follows: Working Paper no. 480.
Authorized by Carlos Viana de Carvalho, Deputy Governor for Economic Policy.
General Control of Publications
Banco Central do Brasil
Comun/Divip
SBS – Quadra 3 – Bloco B – Edifício-Sede – 2º subsolo
Caixa Postal 8.670
70074-900 Brasília – DF – Brazil
Phones: +55 (61) 3414-3710 and 3414-3565
Fax: +55 (61) 3414-1898
E-mail: [email protected]
The views expressed in this work are those of the authors and do not necessarily reflect those of the Banco Central do
Brasil or its members.
Although the working papers often represent preliminary work, citation of source is required when used or reproduced.
As opiniões expressas neste trabalho são exclusivamente do(s) autor(es) e não refletem, necessariamente, a visão do Banco Central do Brasil.
Ainda que este artigo represente trabalho preliminar, é requerida a citação da fonte, mesmo quando reproduzido parcialmente.
Citizen Service Division
Banco Central do Brasil
Deati/Diate
SBS – Quadra 3 – Bloco B – Edifício-Sede – 2º subsolo
70074-900 Brasília – DF – Brazil
Toll Free: 0800 9792345
Fax: +55 (61) 3414-2553
Internet: http//www.bcb.gov.br/?CONTACTUS

Non-technical Summary
This paper provides empirical evidence on the effects of an increase in the volatility of monetary
policy on the Brazilian economy. It is important to understand the difference between the effects of
monetary policy surprises (shocks) – in the sense of unexpected decisions about interest rates from
the monetary policy authority – and changes in the volatility of such surprises – the dispersion
around these unexpected decisions. An increase in the volatility of monetary policy surprises
might result in an increase in overall economic uncertainty, with well-documented consequences
on employment, investment and consumption. From this perspective, the methodology employed
is capable to quantitatively separate the effects of both changes on the economy.
Empirical results show that a monetary policy shock – meaning, a surprise in the response of
interest rates to the state of the economy – presents the usual responses described in the literature,
where an unexpected increase in nominal interest rates temporarily reduces output and inflation.
However, a monetary policy volatility shock – an increase in the dispersion of the surprise in the
response of interest rates –, while reducing output, results in a small increase in inflation. This
result is robust to several specifications of the model, including changes in the time span of data,
the number of time series included in the model, among other features of the empirical exercise.
Despite robust in several dimensions, results on the effects of monetary policy volatility shocks
are at odds with international literature, where an increase in volatility also results in a decrease
in inflation. The last part of this paper argues that, among other possible factors, the pattern
of the response of monetary policy to the state of the economy might play a significant role in
explaining results. When the monetary authority puts a significant weight in output stabilization,
agents in the economy are able to anticipate that the increase in volatility will be compensated
with average lower interest rates over time, in order to keep output closer to its potential. As a
consequence, aggregate demand remains stable and prices do not fall.
3

Sumario Nao Tecnico
Este trabalho oferece evidencias empıricas sobre os efeitos de um aumento da volatilidade da
polıtica monetaria na economia brasileira. E importante separar entre os efeitos de surpresas
(choques) de polıtica monetaria – no sentido de decisoes inesperadas da autoridade monetaria sobre
a taxa de juros – e mudancas na volatilidade destas surpresas – a dispersao ao redor destas decisoes
inesperadas. Um aumento na volatilidade das surpresas de polıtica monetaria pode resultar em
um aumento na incerteza sobre a economia como um todo, com consequencias bem documentadas
em termos de emprego, investimento e consumo. Nessa perspectiva, a metodologia empregada e
capaz de quantitativamente separar os efeitos de ambas as mudancas na economia.
Resultados empıricos mostram que um choque de polıtica monetaria – ou seja, uma surpresa
na resposta das taxas de juros em relacao ao estado da economia – apresenta as respostas usuais
descritas na literatura, onde um aumento inesperado na taxa de juros nominal reduz temporaria-
mente o produto e a inflacao. Entretanto, um choque de volatilidade da polıtica monetaria – um
aumento na dispersao da surpresa na resposta das taxas de juros –, enquanto reduz o produto,
resulta em um pequeno aumento da inflacao. Esse resultado e robusto a diversas variacoes do
modelo, incluindo mudancas no perıodo de cobertura da amostra, o numero de series de tempo
incluıdas no modelo, alem de outras especificacoes do exercıcio empırico.
Apesar de robusto em varias dimensoes, os resultados sobre os efeitos de choques de volatilidade
da polıtica monetaria nao estao de acordo com a literatura internacional, onde um aumento da
volatilidade tambem resulta em uma queda da inflacao. A ultima parte deste trabalho argumenta
que, entre outras possibilidades, o padrao de respostas da polıtica monetaria ao estado da economia
pode ter um papel importante para explicar os resultados. Quando a autoridade monetaria atribui
um peso significativo na estabilizacao do produto, os agentes economicos sao capazes de antecipar
que o aumento de volatilidade sera compensado com taxas medias de juros mais baixas ao longo do
tempo, de tal forma que o produto se mantenha mais proximo do potencial. Como consequencia,
a demanda agregada permanece estavel e os precos nao caem.
4

Monetary Policy Volatility Shocks in Brazil
Angelo Marsiglia Fasolo∗
Abstract
This paper provides empirical evidence for the impact of changes in volatility of monetary
policy in Brazil using a SVAR where the time-varying volatility of shocks directly affects the
level of observed variables. Contrary to the literature, an increase in monetary policy volatil-
ity results in higher inflation, combined with reduction in output. The qualitative differences
of impulse responses functions, compared to the literature for developed economies, are ex-
plained using a calibrated small-scale DSGE model with habit persistence in consumption
and stochastic volatility shocks in the Taylor rule. The DSGE model is capable of explaining
the increase of inflation in the medium term after a monetary policy volatility shock.
JEL Codes: C11, C13, C15, E30, E43, E52
Keywords: Time-varying volatility; DSGE models; Volatility shocks; Small Open Economies;
Bayesian SVAR models
The Working Papers should not be reported as representing the views of the Banco Central
do Brasil. The views expressed in the papers are those of the author(s) and do not
necessarily reflect those of the Banco Central do Brasil.
∗Research Department, Banco Central do Brasil. I would like to thank Haroon Mumtaz and Francesco Zanettifor early discussions on the ideas presented here, Carlos Viana de Carvalho, Andre Minella, Marco Bonomo, MarcoDel Negro, Hedibert Freitas and Pablo Guerron Quintana for comments and suggestions, and the participants ofseminars at the Catholic University of Brasılia (UCB), Insper, Banco Central do Brasil, ICEF-2018 and the XXInflation Targeting Conference of the Banco Central do Brasil. Preliminary versions of this paper circulated withthe title “The Effects of the Volatility of Monetary Policy Shocks in an Emerging Economy”. This paper does notnecessarily represent the views and opinions of Banco Central do Brasil. E-mail: [email protected]
5

1 Introduction
What are the effects of monetary policy volatility in an Emerging Economy like Brazil? Consider-
ing the case of developed economies, it seems that there is a consensus in the literature with respect
to the impact of monetary policy volatility shocks on economic activity and prices. Mumtaz and
Zanetti (2013)[23] provide evidence from a time-varying volatility structural vector autoregression
(SVAR) estimated for the US that monetary policy volatility shocks have a similar effect of a
demand shock, with a positive correlation between prices and economic activity. For a panel of
open, developed economies, Benigno, Benigno and Nistico (2012)[4] find similar results. Taking
a step further in the open economy framework, they also provide evidence that monetary policy
volatility shocks tend to generate an appreciation of domestic currency.
The literature has not fully explored the consequences of the volatility of monetary policy
shocks, especially in Emerging Economies. Identifying and measuring the impact of unexpected
changes in monetary policy have been a common exercise, with a wide range of techniques available
to simulate the effects of unexpected changes in nominal interest rates over prices and economic
activity. However, given the characteristics of the business cycle in Emerging Economies compared
to developed economies1, not only in terms of higher volatility but also with respect to correlations
between consumption, investment and trade balance with output, it is worth investigating the
contribution of unexpected monetary policy changes, both in terms of first and second moments,
as a driving force of such economies.
This paper provides evidence on the impact of second moments of monetary policy shocks us-
ing an SVAR with time-varying volatility estimated for Brazil. Despite using the same framework
as in Mumtaz and Zanetti (2013)[23], results show that prices tend to increase with the increase
in the volatility of monetary policy shocks. Also, the exchange rate depreciates, both in nominal
and in real terms, contrary to results in Benigno, Benigno and Nistico (2012)[4]. After presenting
the empirical evidence, the same theoretical model presented in Mumtaz and Zanetti (2013)[23]
is modified in order to understand some possible causes for results from the SVAR. Two simple
modifications in the model, combined with a more realistic calibration of the labor supply, are
enough to generate inflation after a monetary policy volatility shock. The argument is based on
the asymmetric shape of the firms’ profit function with respect to price adjustments, in a simi-
lar argument presented in Fernandez-Villaverde, Guerron-Quintana, Kuester and Rubio-Ramırez
(2015)[12].
Results in the empirical section show that responses of prices and interest rates presented in
Mumtaz and Zanetti (2013)[23] should be re-evaluated when dealing with an Emerging Economy,
such as Brazil. Besides the source of the dataset, one of the key differences in the procedure adopted
here is data frequency. The use of monthly data results in smaller persistence of monetary policy
volatility shocks. In the theoretical part, it is shown that persistence of shocks is one of the key
elements to understand the transmission mechanism from volatility to prices. The other two are
the design of the monetary policy rule in terms of response to output and the presence of habit
persistence in consumption. These three elements combined are capable of generating positive
inflation after an increase in volatility.
Brazil is an interesting case for the use of SVARs for measuring the effects of time-varying
volatility in two important directions. First, the SVAR is estimated using monthly data in a
period (2000-2016) when, despite the presence of significant shocks, monetary policy regime was
1See Aguiar and Gopinath (2007)[1], table 1.
6

kept the same2. As a consequence, Brazil is one of a few Emerging Economies that has a relatively
large and stable sample for inference on the subject. The use of monthly data also allows for a
richer description of monetary policy, including short-lived episodes of high volatility. Second, as
a small open economy, business cycles in Brazil are also influenced by foreign shocks, requiring
an appropriate empirical strategy in order to characterize monetary policy shocks. From this per-
spective, the SVAR is expanded beyond the simple three-variable system observed in the literature
to include the nominal exchange rate.
As said before, the empirical section of this paper is an application of the SVAR used in Mumtaz
and Zanetti (2013)[23], with contemporaneous and lagged time-varying volatility of structural
shocks included as regressors in the measurement equation. Models with heteroskedastic errors
became common in the literature, as recent hardware advances provided a computational structure
that made feasible the estimation of these models using Bayesian methods. Examples include
Cogley and Sargent (2005)[10], Primiceri (2005)[25], Sims and Zha (2006)[26], among others.
Gambetti, Pappa and Canova (2008)[16] explore not only the impact of the volatility of shocks,
but also changes in the parameters of the SVAR for the US. Nakajima (2011)[24] provides a review
of the methodology with an application for Japanese data. Mumtaz and Zanetti (2013)[23] and
Creal and Wu (2014)[11] provide a link between the volatility of shocks and the first moments of
data. Early literature provided only the identification and the estimation of time-varying volatility
in a SVAR, without testing for their effects on first moments of data. Creal and Wu (2014)[11]
decompose the volatility of monetary policy into two components, with the long run volatility
factor presenting a positive correlation between uncertainty and inflation.
This paper is also connected with a broader research agenda on the estimation of macroeco-
nomic models to measure the effects of volatility on prices and the business cycle, as in Bloom
(2009)[5] and Fernandez-Villaverde and Rubio-Ramırez (2010)[15]. While this paper does not
present an estimation of a structural macroeconomic model measuring how changes in volatil-
ity of monetary policy affect the economy, the estimated stochastic process for the volatility of
interest rates, after a proper identification for monetary policy shocks, is used in a calibrated
DSGE model to evaluate the ability of such model to replicate the empirical features found in
the data, as in Fernandez-Villaverde, Guerron-Quintana, Rubio-Ramırez and Uribe (2011)[14] and
Fernandez-Villaverde, Guerron-Quintana, Kuester and Rubio-Ramırez (2015)[12].
Beyond this introduction, this paper has three sections. The next section shows the procedure
to estimate the SVAR and explores the empirical results found in data. Section 3 describes the
small-scale DSGE model, trying to match moments with the SVAR and providing some rationale
for results. Section 4 concludes.
2 Empirical analysis
The SVAR with stochastic volatility (SVAR-SV) is represented by a measurement equation of a
vector of n endogenous demeaned observables yt:
yt =
K∑k=1
Bkyt−k +
L∑l=0
Clht−l + Σtut
2The absence of changes in monetary policy regime does not mean, however, that the relative weight of othervariables compared to inflation in the monetary policy rule remained constant over time. It does mean that theframework and the implementation of monetary policy, including the monetary policy instrument, were the sameduring this period.
7

In the model, ut is a vector of standard independent gaussian shocks, Bk is an n × n and Cl is
an n× 1 matrix of coefficients. In order to understand vector ht, assume that covariance matrix
ΣtΣ′t might be decomposed in the following way:
ΣtΣ′t = A−1HtA
−1′
A =
1 0 ... 0
α21 1 ... 0
... ... ... 0
αn1 ... αnn−1 1
Ht =
exp(h1,t) 0 ... 0
0 exp(h2,t) ... 0
... ... ... 0
0 ... 0 exp(hn,t)
From the decomposition, matrix A incorporates the structural information on the contempo-
raneous correlations between elements of yt, while Ht matrix stacks the vector of the (log-)
volatility of shocks of the model. The model is closed defining processes for the vector of states
ht = [h1,t, h2,t, ..., hn,t] . Following Mumtaz and Zanetti (2013)[23], assume that the dynamics of
ht is given by a set of independent AR(1) processes:
ht = c+ θht−1 + ηt
ηt ∼ N(0, Q) E(ηt, ut) = 0
In this case, θ and Q are defined as diagonal matrices, while c is a vector of size n × 1. Note
that the stochastic process estimated in the SVAR-SV is later used to calibrate the DSGE model.
One interesting feature of using the stochastic volatility estimated from the SVAR-SV in the
DSGE model is the possibility of avoiding endogeneity issues generated from partial information
estimations. As an example, Fernandez-Villaverde, Guerron-Quintana, Rubio-Ramırez and Uribe
(2011)[14] use a simple stochastic volatility model to compute the second moments of the risk
premium for some Emerging Economies. Implicit in the estimation is the hypothesis that the
risk premium is exogenous to movements in the Emerging Economy. In Fernandez-Villaverde,
Guerron-Quintana Kuester and Rubio-Ramırez (2015)[12], the authors estimate fiscal policy rules
with the output gap as a regressor, assuming that the second-order effects from a change in
volatility in the business cycle are negligible for the exercise.
The SVAR-SV is estimated with four observables for the period between 2000M01 to 2016M12:
the log of end-of-period nominal exchange rate (domestic currency per dollar), the log of industrial
production index, the log of the consumer price index (IPCA), the nominal end of period Selic
rate – which is the monetary policy instrument in Brazil. Sample from 1995M01 to 1999M12 was
used to build the priors for matrices A, Bk and Cl, for all k and l. Despite the adoption of the
inflation targeting regime in June 1999, data for that period was not incorporated in the main
estimation because it was necessary to incorporate in the priors some information for the period
under free-floating exchange rate regime. Data on economic activity and inflation has its seasonal
component removed using ARIMA X-12 procedure.
2.1 Identification strategy
A critical step in defining the impact of volatility on economic aggregates is the identification of
structural shocks. The use of recursive identification schemes, based on a Choleski decomposition
of the covariance matrix, brings a difficult task of choosing the order of variables between the
monetary policy instrument and the nominal exchange rate. On the one hand, it is difficult to
8

support the idea that monetary policy authority does not react immediately to changes in exchange
rates; on the other hand, it is also hard to justify, at monthly frequency, that currency markets
will not react to unexpected changes in monetary policy.
Given the issues above, the identification scheme adopted is based on sign restrictions for
matrices A and B, as in Uhlig (2005)[27]. Instead of reducing the problem, simply identifying
monetary policy shocks, as in Mumtaz and Zanetti (2013)[23], this paper proceeds on also iden-
tifying a supply shock and a demand shock. There are two reasons for working with additional
structural shocks in the model: first, identification based on sign restrictions may be sensitive
to the number of structural shocks imposed on the model or to the number of variables whose
sign are restricted during the procedure3; second, the identification of supply and demand shocks
allows for direct comparison of the effects of monetary policy volatility with other conventional
shocks in the literature.
Sign restrictions are imposed on impact and for five lags, implying restrictions for a total of two
quarters. Restrictions could be reduced to only one quarter, but at the cost of impulse response
function of demand shocks generating implausible short-run dynamics, with GDP expanding on
impact and contracting in the next quarter. However, every other identified shock and the re-
sponses to volatility shocks remained the same as in the baseline estimation4. Adding additional
time periods to the set of restriction does not influence results, while, at the same time, reduces
the number of draws in the Gibbs sampling accepted as valid for simulation. Low acceptance
rates compromise the estimation of second moments of the simulations. Table 1 summarizes the
identification scheme, describing the sign of correlations derived from matrices A and B.
Table 1: Sign Identification
Monetary Policy Supply Shock Demand ShockExc.Rate (–)Output (–) (+) (+)Inflation (–) (–) (+)
Selic Rate (+) (–) (+)
A few comments are worth mentioning on the set of identification restrictions. First, there are
no restrictions imposed on the correlation between nominal exchange rates and both supply and
demand shocks. This option is mostly due to the nature of the propagation of these shocks in
an open economy. Transitory and permanent productivity shocks generate different responses of
real exchange rates in estimated DSGE models. By the same token, demand from an exogenous
increase in the demand for domestic goods from the rest of the world generates different exchange
rate responses when compared to shocks from government spending shocks.
Second, the use of sign restrictions eliminates the need of additional variables to handle prob-
lems like the so-called ”price puzzle” in VAR models. For Emerging Economies, the inclusion of
an additional measure of commodity prices or risk premium is necessary to eliminate the result
that prices increase after a contractionary monetary policy shock5. Sign restrictions use a subset
of the parameter distribution, generating moments consistent with economic theory.
3Canova and Paustian (2011)[8] recommend that, given the significant flexibility provided by identification fromsign restrictions, researchers should not be very agnostic with respect to both the number of shocks imposed foridentification and the number of variables restricted in each shock.
4Section 2.3 and appendix B present other results in terms of robustness of the baseline estimation.5Minella (2003)[21], estimating a VAR model for Brazil, includes the EMBI spread to correct the ”price puzzle”
using the IPCA to measure inflation.
9

2.2 Model estimation: priors and Gibbs sampling
The SVAR-SV is estimated using Bayesian techniques, based on a Gibbs sampler. As mentioned
before, in order to set priors, a training sample with information between 1995M01 and 1999M12
(60 observations) is used. Priors for matrices c, θ and Q assume a low-persistence and high-
variance process for stochastic volatility shocks. Both priors, however, are set with a relatively
flat weight around the mean6.
The Gibbs sampler is based on the following steps:
1. Given the information set yt and draws of Ht and A, the Kalman Filter is used to estimate
matrices Bk and Cl, for all k and l, based on the procedure described in Carter and Kohn
(1994)[9].
2. Given draws for Bk and Cl, for all k and l, and Ht, draws for A are based on a Normal
distribution, since the elements of the matrix can be derived from a GLS transformation of
a linear system of equations to make the errors homoskedastic. These draws, however, are
accepted only if parameters in A and B respect the sign restrictions. In the case of rejection,
the sampler takes new draws for A until acceptance.
3. Given draws Bk and Cl, for all k and l, A and Ht, parameters for matrices c, θ and Q are
obtained using standard results for linear regressions.
4. Finally, given draws for Bk and Cl, for all k and l, and A, c, θ and Q, the multivariate
non-linear state-space representation uses a modified particle filter to obtain draws of Ht.
Related to the last step of the Gibbs sampler, instead of the usual procedure in Primiceri
(2005)[25] and Mumtaz and Zanetti (2013)[23], based on a Metropolis draw for each point of Ht,
the particle filter proposed in Andrieu, Doucet and Holenstein (2010)[3], also used in Mumtaz and
Theodoridis (2016)[22], is adopted in order to provide a better mixing of states. One drawback of
the procedure is related to the number of particles. With a long and stable dataset at quarterly
frequency, Mumtaz and Theodoridis (2016)[22] were capable of getting proper draws of the state
vector using a swarm of only 50 particles. When using monthly data from a highly volatile
economy like Brazil, a larger swarm of particles is needed in order to avoid degeneracy of states.
Indeed, the particle filter here is set with a swarm of 10,000 particles, resulting in a significant
computational cost. Statistics on the performance of the particle filter show that the number is,
indeed, appropriate for the purposes of this paper7.
Parameter moments are extracted after 25,000 replications of the Gibbs sampler, with the first
5,000 draws discarded. Tests on the remaining 20,000 draws provide support for the convergence
of the procedure, despite being a slow moving process characterizing the chains. Appendix A
provides more information on the convergence of the algorithm.
2.3 Empirical results: time-varying volatility of monetary policy
The model is estimated setting k = 2 and l = 2, implying two autoregressive components and
two lags of volatility of shocks, plus the contemporaneous effect, affecting the level of observed
6Priors for θ are set at 0.75, with variance of 0.16. Priors for Q are based on an Inverse-Gamma distributionwith 5 degrees of freedom and scale parameter set at one.
7Based on Liu and Chen (1995)[19], the average number of effective particles over the sample size is estimatedaround 300, while a negligible number of draws at the Gibbs sampler collapsed because of the particle filter.
10

variables. While the literature adopts a larger number of lags when working with monthly data,
the sample available for both estimation and setting priors does not allow for significant variation
when setting both k and l8. Lower values of k could not properly describe the dynamics of the
economy, as it was clear observing impulse response functions and the simulated paths of volatility.
Moving k and l for values above the benchmark did not significantly alter the simulated paths
of time-varying volatility or the impulse response functions from volatility shocks. It did change,
however, the sign of impulse response functions from demand and supply shocks. In part, this
result is a consequence of poorly specified priors, and it can not be properly addressed scaling the
prior variance for larger values. Due to the loss in estimation precision and the excessive volatility
in impulse response functions for output and interest rates generated by the use of monthly data,
the option for the model with k = 2 seemed more appropriate.
The Gibbs sampling algorithm had a quick convergence and seems to properly explore the whole
parameter space. Appendix A explores several statistics showing the convergence of the algorithm,
based on the autocorrelation function of draws for stochastic volatility and the CUMSUM statistic
for all parameters. There are signs of independence of draws after 30 lags, meaning that, with
a total of 20,000 draws, there is a significant number of independent simulations. Inefficiency
factors, also presented in appendix A, also signal to a proper coverage region of the posterior
density. Figure 1 shows the median (red line), mode (blue line) and the distribution of matrices
C, θ and Q.
Exchange rate
-10 -5 00
500
1000
1500
2000
2500Output gap
-10 -5 00
500
1000
1500
2000
2500Inflation
-10 -5 00
500
1000
1500
2000
2500Interest rate
-10 -5 00
500
1000
1500
2000
2500
Exchange rate
0 0.5 10
500
1000
1500
2000
2500Output gap
0 0.5 10
500
1000
1500
2000
2500Inflation
0 0.5 10
500
1000
1500
2000
2500Interest rate
0 0.5 10
500
1000
1500
2000
2500
Exchange rate
0 0.1 0.2 0.30
500
1000
1500
2000
2500Output gap
0 0.1 0.2 0.30
500
1000
1500
2000
2500Inflation
0 0.1 0.2 0.30
500
1000
1500
2000
2500Interest rate
0 0.1 0.2 0.30
500
1000
1500
2000
2500
Stochastic volatility: C
Stochastic volatility:
Stochastic volatility: Q
Figure 1: Histogram of estimated parameters: stochastic volatility
8Sample available for estimation has 204 observations. It is necessary to estimate 22 parameters just to computethe variance of the system (10 parameters in matrix A, plus 12 parameters for the stochastic process of ht).Considering that each lag in the VAR adds 16 parameters, and also the need to properly characterize the impact ofvolatility in the mean (4×(l+1) parameters), the relation between sample size and number of estimated parametersquickly becomes unfavorable for statistical inference.
11

Figure 2 shows the median conditional standard deviation of each shock with a band of 68%. It is worth noting the high volatility of CPI, exchange rate and interest rates at the beginning of the sample, characterized by the transition to a new monetary regime. The figure also shows two short-lived increases in volatility: during the 2002-03 confidence crisis associated with the presidential election, and during the 2008-09 crisis, mostly associated with economic activity. The end of the sample shows an increase in inflation and exchange rate volatility. Despite the significant decline in output gap observed between 2014 and 2016, volatility of output actually remained below its historical level.
Jan00 Oct02 Aug05 Jun08 Apr11 Feb14 Dec16
2
4
6
8
10Exchange rate (%)
Jan00 Oct02 Aug05 Jun08 Apr11 Feb14 Dec161
1.5
2
2.5
3
3.5
4
4.5
Output gap (%)
Jan00 Oct02 Aug05 Jun08 Apr11 Feb14 Dec16
0.1
0.2
0.3
0.4
0.5
Inflation (p.p.)
Jan00 Oct02 Aug05 Jun08 Apr11 Feb14 Dec16
0.1
0.2
0.3
0.4
0.5
0.6
Interest rate (p.p.)
Figure 2: Conditional standard deviation of time series
The simulated volatility of Selic rate allows for a structural interpretation of the non-systematic
changes in monetary policy. Evaluating the lower-right panel of figure 2, notice that periods of
high volatility of monetary policy shocks are not directly associated with movements of raising
nominal interest rates. Besides the beginning of the sample, characterized by the transition to the
inflation targeting regime and the 2002-03 crisis, the simulated volatility of monetary policy shows
three other peaks: i) at the 2008-09 crisis; ii) during the monetary policy easing episode started in
August 2011, when interest rates reached 7.25% – at the time, the historical minimum observed;
and iii) in early 2015, after a period of constant nominal interest rates. It is worth noting that, in
the last two episodes, interest rates were not increased, while interest rates showed a significant
decline during the 2008-09 crisis, as a response to the external shock.
Figure 3 shows the median impulse response function to a change in the volatility of Selic
rate and the 68% band from the posterior of draws. As shown in the figure, a monetary policy
volatility shock results in an immediate increase of inflation in the short run, with significant
persistence up to one year after the shock. Despite significant, the increase in inflation does not
seem to be quantitatively relevant. Most of the effects, however, are felt in the long run: there is
12

a significant exchange rate depreciation combined with a negative output gap. Both movements
remain significant five years after the initial shock, and their magnitudes are relevant, with a
devaluation of almost 2 percentage points two years after the shock and a fall of 0.3p.p. in the
output gap. Evidence on the endogenous response of interest rate is mixed, with the confidence
band including zero in the whole simulation, but with a small bias towards higher rates at the
longer horizons.
10 20 30 40 50 60
0
2
4
Exchange rate (%)
10 20 30 40 50 60
-0.5
0
0.5
Output gap (p.p.)
10 20 30 40 50 60
-0.02
0
0.02
0.04
0.06
Inflation (p.p.)
10 20 30 40 50 60
-0.1
0
0.1
Interest rate (p.p.)
10 20 30 40 50 60
0
0.1
0.2
0.3
Vol. Monetary Policy
Figure 3: Impulse response function: volatility of monetary policy
Qualitative results from impulse response functions are in sharp contrast with those in Mumtaz
and Zanetti (2013)[23] and Benigno, Benigno and Nistico (2012)[4]. The sequence of events in
Mumtaz and Zanetti (2013)[23] suggest that a monetary policy volatility shock is similar to a
negative demand shock: an increase in volatility of interest rates induces households to pay debt
by reducing current consumption. Lower aggregate demand results in lower inflation and interest
rates. From the SVAR-SV estimated for Brazil, an increase in volatility generates an increase
in inflation while keeping nominal interest rates almost constant. At the same time, nominal
exchange rate devaluates and output falls. Changes in opposite directions between economic
activity and prices suggest that the view of volatility shocks as a negative demand shock does not
hold for Brazil.
Two significant robustness checks were performed. First, the model was estimated using a
partial sample, starting in January 2005, in order to eliminate the high volatility period from the
beginning of the inflation targeting regime and the 2002-03 crisis. Then, back with the whole
sample, the model was augmented using the country risk premium, measured by JP Morgan’s
EMBI+, and the log of CRB commodity index. In both cases, it should be noted that the
alternative models are much less precisely estimated, when compared to the baseline estimation,
either because of the shorter sample or because of the larger number of parameters in the model.
Figure 4 compares the histogram of the kernel from estimates of the stochastic volatility process.
13

The six-variable VAR shows a very similar histogram for matrices c and θ, but smaller standard
deviation of volatility, when compared to the baseline estimation. The short sample VAR, as
expected, displays smaller values for c and θ, compared to both the baseline and the six-variable
VAR. However, as expected, interest rate volatility still shows significant persistence, with a mode
of the kernel around 0.7.
-10 -5 0 50
0.2
0.4
0.6Exchange rate
-10 -5 0 50
0.1
0.2
0.3
0.4Output gap
-20 -10 0 100
0.1
0.2
0.3
0.4Inflation
-20 -10 0 100
0.1
0.2
0.3
0.4
0.5Interest rate
-0.5 0 0.5 10
1
2
3
4Exchange rate
-0.5 0 0.5 10
1
2
3Output gap
-0.5 0 0.5 10
1
2
3
4
5Inflation
0 0.5 10
2
4
6Interest rate
0 0.2 0.40
5
10
15Exchange rate
0 0.1 0.2 0.30
5
10
15
20Output gap
0 0.1 0.2 0.30
10
20
30
40Inflation
0 0.2 0.40
5
10
15
20
25Interest rate
Baseline Sample 2005-2016 VAR + EMBI + CRB
Stochastic volatility: C
Stochastic volatility:
Stochastic volatility: Q
Figure 4: Kernel of histogram – Baseline, short sample and 6-variable SVAR-SV
Figure 5 adds to the simulated stochastic volatility in figure 2 the median path estimated in
both alternative models. Overall, both alternative models do not significantly diverge from the
baseline estimation, especially the model with a short sample. Most of the differences from the
baseline estimation appear during stress periods, notably during the 2003-04 period for inflation
in the 6-variable SVAR-SV and the 2008-10 period for output in both alternative models. Even
with the discrepancy, both alternative simulations still move close to the baseline estimation.
Finally, figure 6 compares the IRFs of a monetary policy volatility shock with those generated
in alternative estimations. Despite some differences in short-run dynamics and the magnitude of
shock propagation, general results remain for three of the four endogenous variables of the baseline
estimation remains: nominal exchange rate devaluates, output gap falls and inflation remains
positive at least for some time. The major difference compared to the baseline estimation refers to
interest rates, with both alternative estimations showing lower responses. In the estimation with
a short sample, it is possible that the monetary policy reaction function is different from the early
part of the sample, since the simulated path of stochastic volatility is very similar to the baseline
estimation. For the case of the six-variable SVAR-SV, it is possible that the baseline estimation is
missing on dynamics during the 2003-04 crisis, when there are significant differences in the path
14

Jan00 Oct02 Aug05 Jun08 Apr11 Feb14 Dec16
2
4
6
8
10Exchange rate
Jan00 Oct02 Aug05 Jun08 Apr11 Feb14 Dec161
1.5
2
2.5
3
3.5
4
4.5
Output gap
Jan00 Oct02 Aug05 Jun08 Apr11 Feb14 Dec16
0.1
0.2
0.3
0.4
0.5
Inflation
Jan00 Oct02 Aug05 Jun08 Apr11 Feb14 Dec16
0.1
0.2
0.3
0.4
0.5
0.6
Interest rate
Baseline Sample 2005-2016 VAR + EMBI + CRB
Figure 5: Stochastic Volatility – Baseline, short sample and 6-variable SVAR-SV
of stochastic volatility of inflation.
For further checks, the SVAR-SV was also estimated: (i) using a larger particle swarm (30,000
particles); (ii) using a centered prior for the persistence of volatility shocks (prior for θ set at 0.5);
(iii) using the real effective exchange rate, instead of the nominal exchange rate as an observed
variable; (iv) reducing the number of periods sign restrictions are active to only one quarter; (v)
removing the sign restriction on exchange rates after a monetary policy shock; (vi) increasing
the number of lags of the impact of volatility on aggregate levels (l = 5). Results confirm that
simulated stochastic volatility seems to be properly estimated in the model, and its impact in the
economy is very similar to a supply shock, with a decline in output combined with an increase in
prices. In these alternative estimations, interest rates followed closely the dynamics of the baseline
estimation. These alternative estimations also show that the stochastic process for volatility is
very well defined in terms of level and persistence.9.
3 The model
Results from the empirical section show that an increase in monetary policy volatility has the
following consequences: i) as in the literature, output decreases; ii) contrary to the literature,
inflation rises, at least in the short run; iii) there is no significant reaction from monetary policy
over time; iv) exchange rate depreciates, probably in line with the argument in Benigno, Benigno
and Nistico (2012)[4] that exchange rate movements are a function of the hedging properties of the
9Appendix B show some results of these tests.
15

10 20 30 40 50 60
0
2
4Exchange rate
10 20 30 40 50 60
-0.5
0
0.5
Output gap
10 20 30 40 50 60
-0.02
0
0.02
0.04
0.06
Inflation
10 20 30 40 50 60
-0.1
0
0.1
Interest rate
10 20 30 40 50 600
0.1
0.2
0.3
Vol. Monetary Policy
Baseline Sample 2005-2016 VAR + EMBI + CRB
Figure 6: IRF monetary policy volatility – Baseline, short sample and 6-variable SVAR-SV
currency. In order to develop some intuition from results (i) to (iii), the DSGE model presented in
Mumtaz and Zanetti (2013)[23] is generalized with (external) habit persistence in order to obtain
the structural and parametric conditions under which a positive inflation follows an increase in
monetary policy volatility. The main objective of this section is to show that it is possible to
generate positive inflation after a monetary policy volatility shock, even without an adjustment
of relative prices from real exchange rate.
3.1 Description of the model
Mumtaz and Zanetti (2013)[23] use a simplified version of the model in Ireland (2004)[17] to
describe a closed economy with sticky prices based on quadratic adjustment costs and a linear
technology using only labor as an input. The model is augmented with external habit persistence
for households. Habit persistence is one of the simplest forms in DSGE models to deal with the
equity premium puzzle10, where returns on risky assets are not consistent with the low volatility of
consumption. Augmenting the model with external habit persistence is based only on convenience,
since it is possible that other mechanisms affecting the stochastic discount factor are capable of
qualitatively generating the same results presented in this section. As it will become clear, the
main causes for an inflation increase after a monetary policy volatility shock are the shape of the
(expected) profit function and the design of monetary policy. Therefore, the stochastic discount
factor plays a critical role in the analysis.
Households choose, in the intertemporal problem, consumption (Ct), the amount of debt to
10See Mehra and Prescott (1985)[20].
16

hold (Dt) and the labor supply (Ht) given current nominal wage (Wt), prices (Pt) and interest
rates (Rt). Households maximize the expected discounted value of utility, having as source of
income wages and profits from the firms, Πt. A lump-sum transfer from the monetary authority,
Tt, closes the budget constraint. The problem is given by:
maxCt,Dt,Ht
E0
∞∑t=0
βtU(Ct, Ht)
s.t. : Dt +WtHt + Tt + Πt ≥ PtCt +Rt−1Dt−1
Define πt = Pt/Pt−1 as inflation, rt,t+1 as the stochastic discount factor between periods t and
t+ 1. The solution to the intertemporal problem is based on the set of first-order conditions:
λt = Uc(Ct, Ht) (1)
λt = βEtλt+1
(Rtπt+1
)(2)
rt,t+1 = 1/Rt (3)
λtWt
Pt= −Uh(Ct, Ht) (4)
Household’s utility function in Mumtaz and Zanetti (2013)[23] is augmented with external
habit persistence, where the household keeps its consumption profile over time as close as possible
to the average of the economy. In a symmetric competitive equilibrium, every household makes
the same decisions in each period. As a consequence, Ct = Ct:
U(Ct, Ht) = ln(Ct − αCt−1)− (1/η)Hηt
=⇒ Uc(Ct, Ht) = 1/(Ct − αCt−1)
=⇒ Uh(Ct, Ht) = −Hη−1t
A firm producing an intermediate good i decides the amount of labor to hire, Ht(i) and the
price, Pt(i). The production function is linear in terms of labor:
Yt(i) = Ht(i)
Every firm i sets Pt(i) and Ht(i) in each period in order to maximize the present discount value
of profits Πt(i), subject to a linear production function and the demand function for product i
based on a CES aggregator across all intermediate goods. Firms face a quadratic adjustment cost
in order to change prices in each period. Given r0,t – the stochastic discount factor between time
0 and t – the intertemporal problem of the firm is given by:
maxHt(i),Pt(i)
E0
∞∑t=0
r0,tPt
[Pt(i)Pt
Yt(i)− Wt
PtHt(i)− φ
2Yt
(Pt(i)
Pt−1(i)π− 1)2]
s.t. : Yt(i) =(Pt(i)Pt
)−θYt
Yt(i) = Ht(i)
17
Replacing both restrictions in the objective function and using the definition of the stochastic
discount factor in equations 2 and 3, the first-order condition in terms of Pt(i) results in:
(θ − 1)YtPt
(Pt(i)
Pt
)−θ= θ
Wt
Pt
YtPt
(Pt(i)
Pt
)−(1+θ)− φ
(Pt(i)
πPt−1(i)− 1
)(Yt
πPt−1(i)
)+ βφEt
[λt+1
λt
(Pt+1(i)
πPt(i)− 1
)(Pt+1(i)
πPt(i)
)(Yt+1
Pt(i)
)]The symmetric equilibrium of the model is characterized by all firms equally setting the demand
for labor, prices and, as a consequence, having the same production level and profits in each period
t: Pt(i) = Pt, Ht(i) = Ht and Yt(i) = Yt. As a consequence, the first order condition for Pt(i)
reduces to:
θ − 1 = θWt
Pt− φ
(πtπ− 1)(πt
π
)+ βφEt
[λt+1
λt
(πt+1
π− 1)(πt+1
π
)(Yt+1
Yt
)](5)
The aggregate resource constraint of the economy considers the equivalence between production
and consumption, with a wedge given by the adjustment cost imposed on prices:
Yt = Ct +φ
2Yt
(πtπ− 1)2
(6)
Monetary policy is set by a standard Taylor rule augmented with heteroskedastic shocks:
RtR
=
(Rt−1R
)ρr (πtπ
)ρπ ( YtYt−1
)ρyeσr,tεr,t εr,t ∼ N(0, 1) (7)
σr,t = ρσσr,t−1 + qσεσ,t εσ,t ∼ N(0, 1) (8)
A critical feature of the Taylor rule estimated in Ireland (2004)[17] is the response of interest
rates to economic activity. The author estimates the Taylor rule with a response to both output
growth and the output gap. In Mumtaz and Zanetti (2013)[23], the authors use only the response
of interest rates to output growth. It is true that the estimated coefficient for the response
to the output gap in Ireland (2004)[17] is significantly smaller, but the qualitative response of
inflation after a monetary policy volatility shock is directly affected by the functional form and
parametrization of the Taylor rule, as seen in section 3.3.
Now, it is time to define the competitive equilibrium of the economy. Given initial values D0
and exogenous shocks {εr,t, εσ,t}∞t=0, a (symmetric) competitive equilibrium of the economy is a
set of allocations {Yt, Ct, Ht, Dt}∞t=0, interest rates {Rt}∞t=0 and prices {πt,Wt/Pt}∞t=0 such that:
i) given prices {πt,Wt/Pt}∞t=0, households solve the utility maximization problem; ii) given prices
{πt,Wt/Pt}∞t=0, firms solve the profit maximization problem; iii) all markets clear.
3.2 Calibration and model solution
Calibration of the model is presented in table 2. Parameters describing the economy follow Mumtaz
and Zanetti (2013)[23] and Ireland (2004)[17]. Despite presenting results for Brazil, the objective of
this section is to provide qualitative evidence on the transmission mechanism capable of generating
such results, instead of matching the empirical moments found in the SVAR-SV. From the per-
spective of highlighting the transmission mechanism, it is more useful to reset the baseline model
with parameters from the literature. Matching specific moments from the SVAR-SV to obtain
18

quantitative evidence could prove a difficult task, given that the DSGE model describes a closed
economy, without a proper description of the non-linearities observed in Emerging Economies.
Evaluating the parameters for the exercise, habit persistence was set at 0.76, based on the
estimation in Altig, Christiano, Eichenbaum and Linde (2005)[2]. Parameters calibrating the
steady state of monetary policy volatility and the standard deviation of the stochastic volatility
of interest rates were kept the same as in Mumtaz and Zanetti (2013)[23]. Despite significant
diferences found in the estimation of the stochastic process for volatility, the fact that the SVAR-
SV is estimated using data at monthly frequency would require additional changes in calibration to
change the model to another frequency. However, the persistence parameter of stochastic volatility
of interest rates is incorporated from the estimation of the SVAR-SV, set to match quarterly data.
Table 2: Baseline Calibration
Parameter Value Meaningβ 0.99 Discount factorθ 11 Elasticity of substitution across goodsφ 1620.7 Degree of price rigidityη 16.2 Inverse of Frisch elasticityα 0.76 Habit persistenceπ 1.005 Trend (gross) inflation rateρr 1.0 Taylor rule: interest rate smoothnessρπ 0.3597 Taylor rule: response to inflationρy 0.2536 Taylor rule: response to output growth
Exogenous shocksqσ 0.68800.5 Standard deviation of interest rate volatilityρσ 0.731 Persistence of interest rate volatility
The presence of stochastic volatility in the model demands a non-linear approximation of policy
functions, since linearized models do not capture effects from changes in second moments. Thus,
irrespective of the joint dynamics between shocks in the level and in second moment of interest
rates11, the model is solved using a third-order approximation of the policy functions. According
to Caldara et al (2012)[7], third-order solutions provide a good approximation of models with
stochastic volatility without a major compromise of computational time.
Impulse response functions were computed using the approach in Koop, Pesaran and Potter
(1996)[18], where the generalized impulse response functions are simulated considering different
paths for the set of shocks of the economy. A total of 5,000 paths were simulated and figures
report the median impulse response function from those draws.
3.3 Model simulation
The baseline model from Mumtaz and Zanetti (2013)[23] with the calibration provided in table 2
and no habit persistence (α = 0) is not capable of generating a positive response of inflation after
a monetary policy volatility shock. However, the smaller persistence of volatility shocks generates
an increase of nominal interest rates, suggesting that monetary policy response is a function of the
persistence of the shock. Persistent increases in monetary policy volatility result in lower interest
rates over time, as a response to lower output in the economy.
11A second-order approximation of models with stochastic volatility generates impulse responses from volatilityshocks as long as shocks to the level of state variables are not equal to zero, as noted in Fernandez-Villaverde,Guerron-Quintana and Rubio-Ramırez (2010)[13].
19

Figure 7 shows the IRFs of a monetary policy volatility shock, starting with the baseline model
of Ireland (2004)[17], followed by cumulative changes in model structure and parameterization:
1. Habit persistence: α = 0.76;
2. Frisch elasticity of labor supply: η = 1.0;
3. Taylor rule with response to output gap, instead of growth rate of GDP.
On the new calibration of the Frisch elasticity, it is worth mentioning that the value used in
Ireland (2004)[17] implies a very low elasticity for the labor supply. According to the author, MLE
estimations of the model using US data favored a specification where preference shocks have a
significant role describing consumption dynamics at the expense of a lower elasticity of the labor
supply. Calibration here is in line with standard values found in the literature.
Figure 7 highlights the role of the additional features incorporated in the model described in
Mumtaz and Zanetti (2013)[23]. While the inclusion of habit persistence alone does not signifi-
cantly changes the response to a monetary policy volatility shock, the combination with a more
elastic labor supply significantly amplifies the impact on output, inflation and the feedback to
interest rates. Figure 8, for the sake of the argument, provides impulse response functions for a
traditional monetary policy shock, showing the same amplification mechanism from the combina-
tion of habit persistence and an elastic labor supply. In both shocks, the volatility of output and
inflation only returns for lower levels when the Taylor rule with response to the growth rate of
output is replaced by the rule with response to the output gap12.
5 10 15 20 25 30
-0.3
-0.25
-0.2
-0.15
-0.1
-0.05
0Output
Ireland (2004) = 0.76 = 1.0 Taylor
5 10 15 20 25 30
-0.025
-0.02
-0.015
-0.01
-0.005
0
Inflation (%)
Ireland (2004) = 0.76 = 1.0 Taylor
5 10 15 20 25 300
0.05
0.1
0.15
0.2
0.25
Interest Rates (p.y.)
Ireland (2004) = 0.76 = 1.0 Taylor
5 10 15 20 25 300
0.2
0.4
0.6
0.8
1Interest Rates Vol
Ireland (2004) = 0.76 = 1.0 Taylor
Figure 7: IRF DSGE: Shock to volatility of monetary policy
There are two important issues to discuss from the impulse response functions. First, why is the
combination of an elastic labor supply and habit persistence in consumption important for firms’
12For convenience, the elasticity of the interest rates to output growth and to output gap was kept the same.
20

price setting? Second, how important is the design of monetary policy? For the first question, the
combination of elastic labor supply and habit persistence directly affects the asymmetry of the
profit function of the firm in terms of the relative price of good i. In order to find positive inflation
after the increase in volatility, it is necessary that the model generates enough incentives for firms
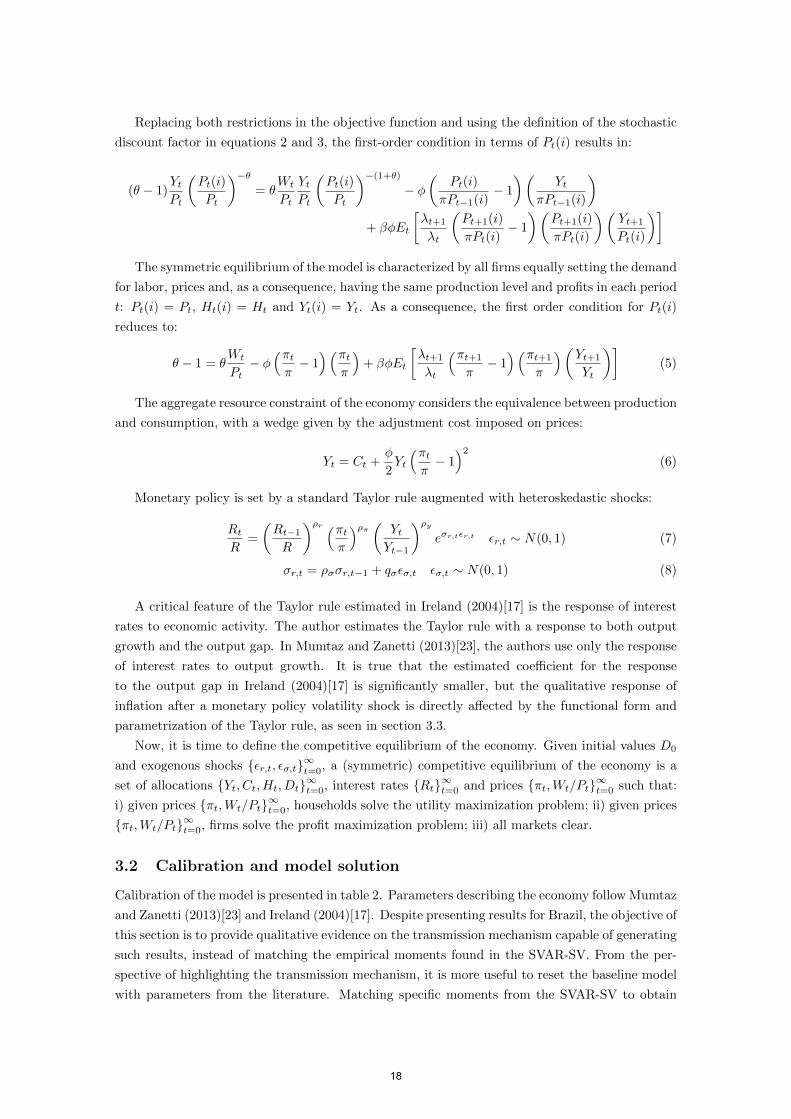
to alter their price decision, and the shape of the profit function is critical13. In figure 9, the instant
profit function and its first derivative14, both evaluated in the steady state of the model with the
calibration in Ireland (2004)[17], are compared under alternative calibrations. While, individually,
changing the degree of habit persistence and the Frisch elasticity of labor supply does not really
alter the asymmetry of the profit function, the combination of both changes in parameters shifts
up the curve and increases asymmetry around price dispersion. Both effects generate a significant
incentive for firms to have an upward bias in price formation, avoiding product prices below the
average price level of the economy. Note, again, that results in figure 9 do not depend on the
degree of price rigidity in the economy, since, in a model with quadratic adjustment costs, the
steady state of the model is not affected by nominal rigidities.
5 10 15 20 25 30
-0.7
-0.6
-0.5
-0.4
-0.3
-0.2
-0.1
0Output
Ireland (2004) = 0.76 = 1.0 Taylor
5 10 15 20 25 30
-0.12
-0.1
-0.08
-0.06
-0.04
-0.02
0
Inflation (%)
Ireland (2004) = 0.76 = 1.0 Taylor
5 10 15 20 25 30
0
0.2
0.4
0.6
0.8
1Interest Rates (p.y.)
Ireland (2004) = 0.76 = 1.0 Taylor
5 10 15 20 25 30-1
-0.5
0
0.5
1Interest Rates Vol
Ireland (2004) = 0.76 = 1.0 Taylor
Figure 8: IRF DSGE: monetary policy shock
Relative to the second issue, on the design of monetary policy, notice that results presented
in figure 9 are not associated with the structure of the Taylor rule. However, back to figures 7
and 8, it is clear that the volatility of output and inflation are closely related to the dynamics
resulting from the design of monetary policy. The move from a Taylor rule reacting to the growth
rate of output to a reaction to the output gap is enough to generate some mild inflation after
the monetary policy volatility shock. Figure 10 explores some other typical rules observed in
13The same argument here is also developed in Fernandez-Villaverde, Guerron-Quintana, Kuester and Rubio-Ramırez (2015)[12] and Born and Pfeifer (2017)[6]
14The instant profit function, after combining the constraints in the problem of the firm and considering the
equilibrium and steady state of the economy, is given by Π = Y(P(i)
P
)(1−θ)− W
PY
(P(i)
P
)(−θ)
21
0.85 0.9 0.95 1 1.05 1.1 1.15
Pi/P
-0.3
-0.2
-0.1
0
0.1
0.2
0.3
0.4
Period p
rofits
Period Profits
0.85 0.9 0.95 1 1.05 1.1 1.15
Pi/P
-2
0
2
4
6
8
10
12
14
16
18
20
(Pro
fits
)/(P
i/P)
Derivative of Period Profits
= 0, = 16.2 = 0.76, = 16.2 = 0, = 1.0 = 0.76, = 1.0
Figure 9: Period profits, habit persistence and labor supply
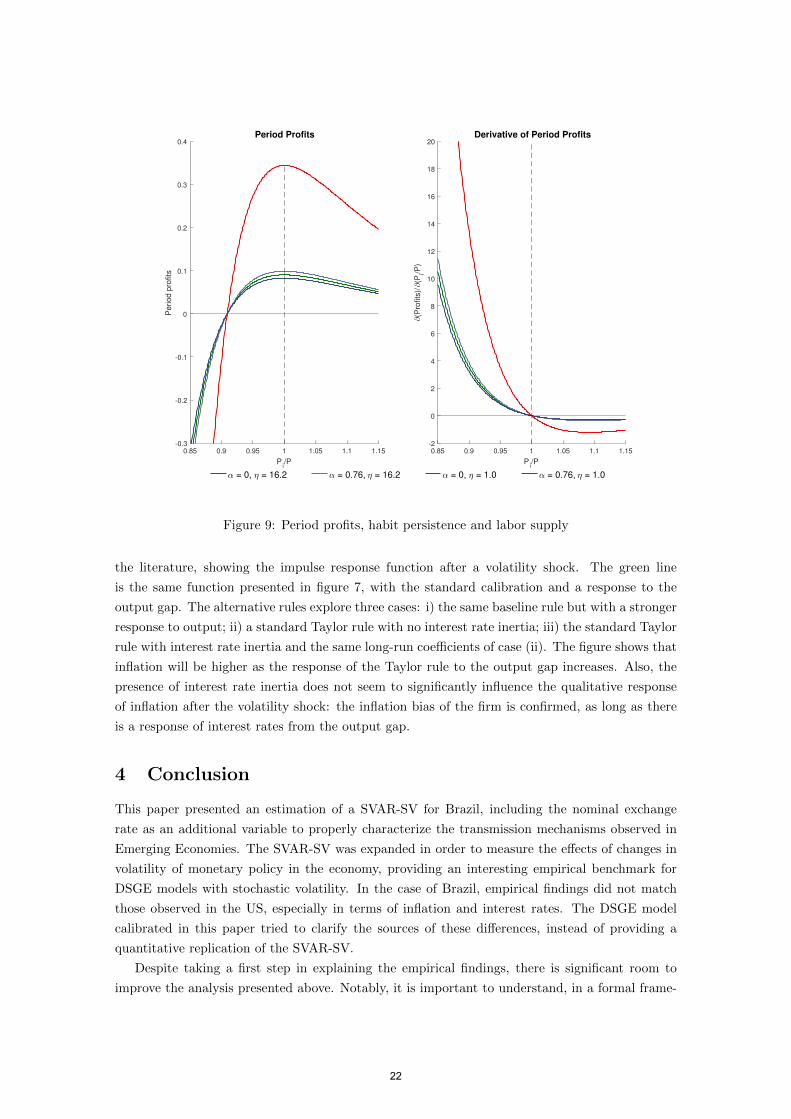
the literature, showing the impulse response function after a volatility shock. The green line
is the same function presented in figure 7, with the standard calibration and a response to the
output gap. The alternative rules explore three cases: i) the same baseline rule but with a stronger
response to output; ii) a standard Taylor rule with no interest rate inertia; iii) the standard Taylor
rule with interest rate inertia and the same long-run coefficients of case (ii). The figure shows that
inflation will be higher as the response of the Taylor rule to the output gap increases. Also, the
presence of interest rate inertia does not seem to significantly influence the qualitative response
of inflation after the volatility shock: the inflation bias of the firm is confirmed, as long as there
is a response of interest rates from the output gap.
4 Conclusion
This paper presented an estimation of a SVAR-SV for Brazil, including the nominal exchange
rate as an additional variable to properly characterize the transmission mechanisms observed in
Emerging Economies. The SVAR-SV was expanded in order to measure the effects of changes in
volatility of monetary policy in the economy, providing an interesting empirical benchmark for
DSGE models with stochastic volatility. In the case of Brazil, empirical findings did not match
those observed in the US, especially in terms of inflation and interest rates. The DSGE model
calibrated in this paper tried to clarify the sources of these differences, instead of providing a
quantitative replication of the SVAR-SV.
Despite taking a first step in explaining the empirical findings, there is significant room to
improve the analysis presented above. Notably, it is important to understand, in a formal frame-
22
5 10 15 20 25 30
-0.08
-0.06
-0.04
-0.02
0Output
y = 0.2536 = 0.3597
r = 1.0
y = 0.70 = 0.3597
r = 1.0
y = 0.5 = 1.5
r = 0.0
y = 0.25 = 0.75
r = 0.5
5 10 15 20 25 30
-10
-5
0
10-4 Inflation (%)
y = 0.2536 = 0.3597
r = 1.0
y = 0.70 = 0.3597
r = 1.0
y = 0.5 = 1.5
r = 0.0
y = 0.25 = 0.75
r = 0.5
5 10 15 20 25 300
0.05
0.1
0.15
0.2
0.25
Interest Rates (p.y.)
y = 0.2536 = 0.3597
r = 1.0
y = 0.70 = 0.3597
r = 1.0
y = 0.5 = 1.5
r = 0.0
y = 0.25 = 0.75
r = 0.5
5 10 15 20 25 300
0.2
0.4
0.6
0.8
1Interest Rates Vol
y = 0.2536 = 0.3597
r = 1.0
y = 0.70 = 0.3597
r = 1.0
y = 0.5 = 1.5
r = 0.0
y = 0.25 = 0.75
r = 0.5
Figure 10: IRF DSGE: volatility of monetary policy and Taylor rule
work, the transmission mechanism that generates exchange rate devaluations as a response of an
increase in monetary policy volatility. It is also interesting to investigate in a more detailed model
the quantitative implications of monetary policy volatility. The model presented here generated
only an approximation of results in the empirical section. Further evaluating the relevance of the
role of output stabilization in the Taylor rule as the source of this type of fluctuations is very
important both from a theoretical and from a practical perspective for economic policy.
References
[1] M. Aguiar and G. Gopinath. Emerging Market Business Cycles: The Cycle Is the Trend.
Journal of Political Economy, 115:69–102, 2007.
[2] D. Altig, L. J. Christiano, M. Eichenbaum, and J. Lind. Firm-specific capital, nominal
rigidities and the business cycle. Review of Economic Dynamics, 14(2):225–247, 2011.
[3] C. Andrieu, A. Doucet, and R. Holenstein. Particle Markov Chain Monte Carlo Methods.
Journal of the Royal Statistical Society: Series B (Statistical Methodology), 72(3):269–342,
2010.
[4] G. Benigno, P. Benigno, and S. Nistico. Risk, Monetary Policy, and the Exchange Rate.
NBER Macroeconomics Annual, 26(1):247–309, 2012.
[5] N. Bloom. The Impact of Uncertainty Shocks. Econometrica, 77(3):623–685, 2009.
[6] B. Born and J. Pfeifer. Uncertainty-Driven Business Cycles: Assessing the Markup Channel.
Technical Report 11745, C.E.P.R. Discussion Papers, Jan. 2017.
23

[7] D. Caldara, J. Fernandez-Villaverde, J. F. Rubio-Ramırez, and W. Yao. Computing DSGE
Models with Recursive Preferences and Stochastic Volatility. Review of Economic Dynamics,
15(2):188–206, 2012.
[8] F. Canova and M. Paustian. Business Cycle Measurement with Some Theory. Journal of
Monetary Economics, 58(4):345–361, 2011.
[9] C. K. Carter and R. Kohn. On Gibbs Sampling for State Space Models. Biometrika,
81(3):541–553, 1994.
[10] T. Cogley and T. J. Sargent. Drift and Volatilities: Monetary Policies and Outcomes in the
Post WWII U.S. Review of Economic Dynamics, 8(2):262–302, 2005.
[11] D. D. Creal and J. C. Wu. Monetary Policy Uncertainty and Economic Fluctuations. Working
Paper 20594, National Bureau of Economic Research, 2014.
[12] J. Fernandez-Villaverde, P. Guerron-Quintana, K. Kuester, and J. Rubio-Ramırez. Fiscal
Volatility Shocks and Economic Activity. American Economic Review, 105(11):3352–3384,
2015.
[13] J. Fernandez-Villaverde, P. Guerron-Quintana, and J. F. Rubio-Ramırez. Fortune or Virtue:
Time-Variant Volatilities Versus Parameter Drifting in U.S. Data. Working Paper 15928,
National Bureau of Economic Research, 2010.
[14] J. Fernandez-Villaverde, P. Guerron-Quintana, J. F. Rubio-Ramırez, and M. Uribe. Risk
Matters: The Real Effects of Volatility Shocks. American Economic Review, 101(6):2530–61,
2011.
[15] J. Fernandez-Villaverde and J. Rubio-Ramırez. Macroeconomics and Volatility: Data, Mod-
els, and Estimation. Working Paper 16618, National Bureau of Economic Research, 2010.
[16] L. Gambetti, E. Pappa, and F. Canova. The Structural Dynamics of U.S. Output and
Inflation: What Explains the Changes? Journal of Money, Credit and Banking, 40(2-3):369–
388, 2008.
[17] P. N. Ireland. Technology Shocks in the New Keynesian Model. The Review of Economics
and Statistics, 86(4):923–936, 2004.
[18] G. Koop, M. H. Pesaran, and S. M. Potter. Impulse Response Analysis in Nonlinear Multi-
variate Models. Journal of Econometrics, 74(1):119–147, 1996.
[19] J. S. Liu and R. Chen. Blind Deconvolution via Sequential Imputations. Journal of the
American Statistical Association, 90(430):567–576, 1995.
[20] R. Mehra and E. Prescott. The equity premium: A puzzle. Journal of Monetary Economics,
15(2):145–161, 1985.
[21] A. Minella. Monetary Policy and Inflation in Brazil (1975-2000): A VAR Estimation. Revista
Brasileira de Economia, 57(3):605–635, 2003.
[22] H. Mumtaz and K. Theodoridis. Dynamic Effects of Monetary Policy Shocks on Macroeco-
nomic Volatility. Working Paper 760, Queen Mary University of London, School of Economics
and Finance, 2016.
24

[23] H. Mumtaz and F. Zanetti. The Impact of the Volatility of Monetary Policy Shocks. Journal
of Money, Credit and Banking, 45(4):535–558, 2013.
[24] J. Nakajima. Time-Varying Parameter VAR Model with Stochastic Volatility: An Overview
of Methodology and Empirical Applications. IMES Discussion Paper Series 11-E-09, Institute
for Monetary and Economic Studies, Bank of Japan, 2011.
[25] G. E. Primiceri. Time Varying Structural Vector Autoregressions and Monetary Policy. The
Review of Economic Studies, 72(3):821–852, 2005.
[26] C. A. Sims and T. Zha. Were There Regime Switches in U.S. Monetary Policy? American
Economic Review, 96(1):54–81, 2006.
[27] H. Uhlig. What Are the Effects of Monetary Policy on Output? Results from an Agnostic
Identification Procedure. Journal of Monetary Economics, 52(2):381–419, 2005.
25

Appendices
A Convergence of Gibbs sampler
The plot of autocorrelation functions show a fast decay rate, with negligible autocorrelation from
draws of the Gibbs sampler after 30 to 40 iterations of the algorithm. Figure 11 shows the pattern
of the function for stochastic volatility parameters. It is interesting to note the high first-order
autocorrelation of draws, the significant decline in the tenth lag, and the relative stability of the
function after 30 lags.
Autocorrelation:
1 10 20 30 40
Lag
-0.1
0
0.1
0.2
0.3
0.4
0.5
0.6
0.7
0.8Autocorrelation: C
1 10 20 30 40
Lag
-0.1
0
0.1
0.2
0.3
0.4
0.5
0.6
0.7
0.8Autocorrelation: Q
1 10 20 30 40
Lag
-0.1
0
0.1
0.2
0.3
0.4
0.5
0.6
0.7
0.8
Exchange rate Output gap Inflation Interest rate
Figure 11: Autocorrelation function: θ, C and Q
Indeed, in figure 12, the recursive values for the mean and standard deviation of parameters
in the stochastic volatility functions become stable around the middle of the remaining 20,000
draws of the Gibbs sampler, with small fluctuations in the later draws, mainly in terms of second
moments of the simulations.
However, despite relative stability after 10,000 remaining draws, a smaller number of simula-
tions would not be ideal. Figures 13 to 15 show the CUMSUM statistic for all parameters of the
model. It is possible to observe that the chains converge slowly, resulting in a significant amount
of simulations in order to properly cover the whole space of parameter distribution.
Finally, inefficiency factors were computed using 5,000 lags of the autocorrelation function.
Factors are in the range of 0.91 to 7.85, with a mean of 2.36. It implies that it is necessary to
sample around 785 observations to obtain a precision equivalent to 100 draws from a theoretical
iid sampler. Figure 16 show the inefficiency factors for all parameters of the SVAR-SV.
26

Figure 12: Recursive mean and standard deviation of stochastic volatility
Figure 13: CUMSUM: stochastic volatility
27

Figure 14: CUMSUM: covariance matrix A
Figure 15: CUMSUM: matrix B
28

10 20 30 40 50 60 70 80 90 1000
1
2
3
4
5
6
7
Matrix A Matrix B Stochastic Volatility
Figure 16: Inefficiency factors
B Robustness Checks
This appendix compares results of the baseline model with six alternative formulations, namely:
(i) larger particle swarm (30,000 particles); (ii) mean of prior for θ at 0.5; (iii) model with real
effective exchange rate; (iv) sign restrictions during one quarter; (v) no sign restriction on exchange
rates; (vi) more lags of volatility on levels (l = 5). Figures compare the histogram of estimated
parameters, the historical path of simulated volatility and the impulse response functions to a
shock in monetary policy volatility. More results are available upon request.
-8 -6 -4 -2 0 20
0.2
0.4
0.6Exchange rate
-10 -5 0 50
0.1
0.2
0.3
0.4Output gap
-15 -10 -5 0 50
0.1
0.2
0.3
0.4Inflation
-15 -10 -5 0 50
0.1
0.2
0.3
0.4
0.5Interest rate
-0.5 0 0.5 10
1
2
3
4Exchange rate
-0.5 0 0.5 10
1
2
3Output gap
-0.5 0 0.5 10
1
2
3
4
5Inflation
0 0.2 0.4 0.6 0.8 10
2
4
6Interest rate
0 0.1 0.2 0.3 0.40
5
10
15
20Exchange rate
0 0.1 0.2 0.30
5
10
15
20
25Output gap
0 0.05 0.1 0.15 0.2 0.250
10
20
30
40Inflation
0 0.1 0.2 0.3 0.40
5
10
15
20
25Interest rate
Baseline Prior AR 0.5 Sign 1Q Npart = 30000 l = 5 No Sign ER REER
Stochastic volatility: C
Stochastic volatility:
Stochastic volatility: Q
Figure 17: Histogram: θ, C and Q
29

2000Q1 2002Q1 2004Q1 2006Q2 2008Q2 2010Q3 2012Q3 2014Q4 2016Q4
2
4
6
8
10Exchange rate
2000Q1 2002Q1 2004Q1 2006Q2 2008Q2 2010Q3 2012Q3 2014Q4 2016Q41
1.5
2
2.5
3
3.5
4
4.5
Output gap
2000Q1 2002Q1 2004Q1 2006Q2 2008Q2 2010Q3 2012Q3 2014Q4 2016Q4
0.1
0.2
0.3
0.4
0.5
Inflation
2000Q1 2002Q1 2004Q1 2006Q2 2008Q2 2010Q3 2012Q3 2014Q4 2016Q4
0.1
0.2
0.3
0.4
0.5
0.6
Interest rate
Baseline Prior AR 0.5 Sign 1Q Npart = 30000 l = 5 No Sign ER REER
Figure 18: Stochastic Volatility
10 20 30 40 50 60
0
1
2
3
4Exchange rate
10 20 30 40 50 60
-0.5
0
0.5Output gap
10 20 30 40 50 60
-0.02
0
0.02
0.04
0.06
Inflation
10 20 30 40 50 60
-0.1
0
0.1
Interest rate
10 20 30 40 50 600
0.1
0.2
0.3
Vol. Monetary Policy
Baseline Prior AR 0.5 Sign 1Q Npart = 30000 l = 5 No Sign ER REER
Figure 19: Impulse response function: volatility of monetary policy
30

C Summary of the theoretical model
The model in is fully described by the following sets of variables:
• Prices: πt, Wt/Pt, rt,t+1
• Interest rates: Rt
• Allocations: Ct, Yt, Ht, λt
• Shocks: σr,t, εr,t, εσ,t
Equations describing the model are given by:
λt = 1/(Ct − αCt−1)
λt = βEtλt+1
(Rtπt+1
)rt,t+1 = 1/Rt
λtWt
Pt= Hη−1
t
Yt = Ht
θ − 1 = θWt
Pt− φ
(πtπ− 1)(πt
π
)+ βφEt
[λt+1
λt
(πt+1
π− 1)(πt+1
π
)(Yt+1
Yt
)]Yt = Ct +
φ
2Yt
(πtπ− 1)2
RtR
=
(Rt−1R
)ρr (πtπ
)ρπ ( YtYt−1
)ρyeσr,teεr,t
σr,t = ρσσr,t−1 + qσεσ,t
εr,t ∼ N(0, 1)
εσ,t ∼ N(0, 1)
The deterministic steady state, given parameters set in calibration, is described by:
π = 1.005
R = π/β
r = 1/RWP = θ−1
θ(1−α)
H =(
θ−1θ(1−α)
)1/ηY =
(θ−1
θ(1−α)
)1/ηC =
(θ−1
θ(1−α)
)1/ηλ =
(θ(1−α)θ−1
)1/η
31