Embed Size (px)
Citation preview
Angus Maddison
Growth Accounts, Technological Change, and the Role of Energy in Western Growth in Economia e Energia, secc.XIII-XVIII, Istituto Internazionale di Storia Economica “F. Datini” Prato,
Le Monnier, Florence, April 2003. Growth Accounts for 1820-1998 For the period since 1820, it is possible to present quantitative evidence of causal factors which ex-
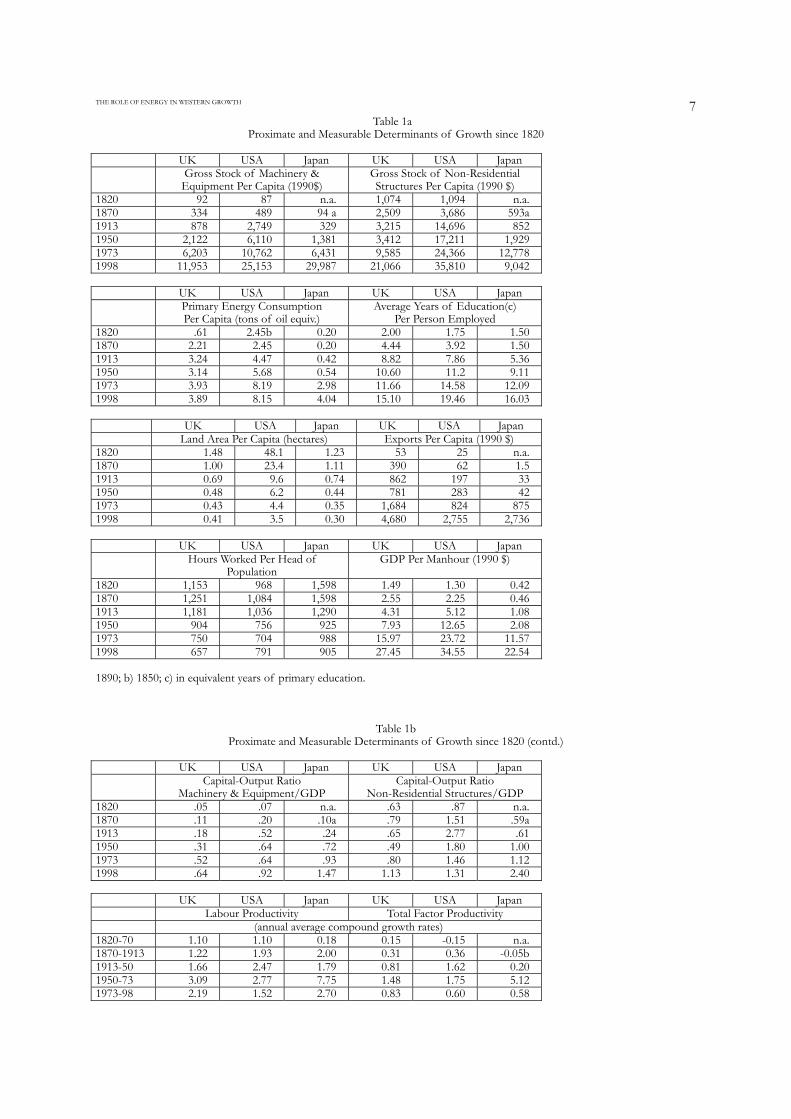
plain the performance of three major capitalist economies: the UK, USA and Japan in the form of growth accounts-see tables 1a and 1b. They show the growth of the physical and human capital stock, hours worked, the availability of land, primary energy consumption and exports per capita. They also show the capital-output ratio for machinery and for non-residential structures, the progress of labour and total factor productivity. The UK was the lead country in terms of labour productivity in the nineteenth century and played a strongly diffusionist role in world development through export of capital and its policy of free trade. The USA overtook the UK as the productivity leader in the 1890s, and had faster productivity growth thereafter. Japan is the archetype catch-up country, overtaking Chinese levels of per-formance in the Tokugawa period, catching up with Western Europe in terms of per capita GDP (but not productivity) by the 1990s. The Japanese catch-up effort involved high rates of investment in human and physical capital (which is also characteristic of other Asian economies - Korea, Taiwan, China, Hong Kong and Singapore - where there has been substantial catch-up in the past half century). Instead of overtaking the USA, as was once predicted, the Japanese economy has stagnated in the past decade.
The most dynamic feature of the three countries has been explosive growth in the stock of machin-ery and equipment per head. It rose by a multiple of 130 in the UK and 289 in the USA between 1820 and 1998, 319 in Japan after 1890. The stock of non-residential structures rose much less, 20 fold in the UK, 32 in the USA and 83 in Japan. Their relative importance has declined dramatically, most markedly in the USA since 1913.
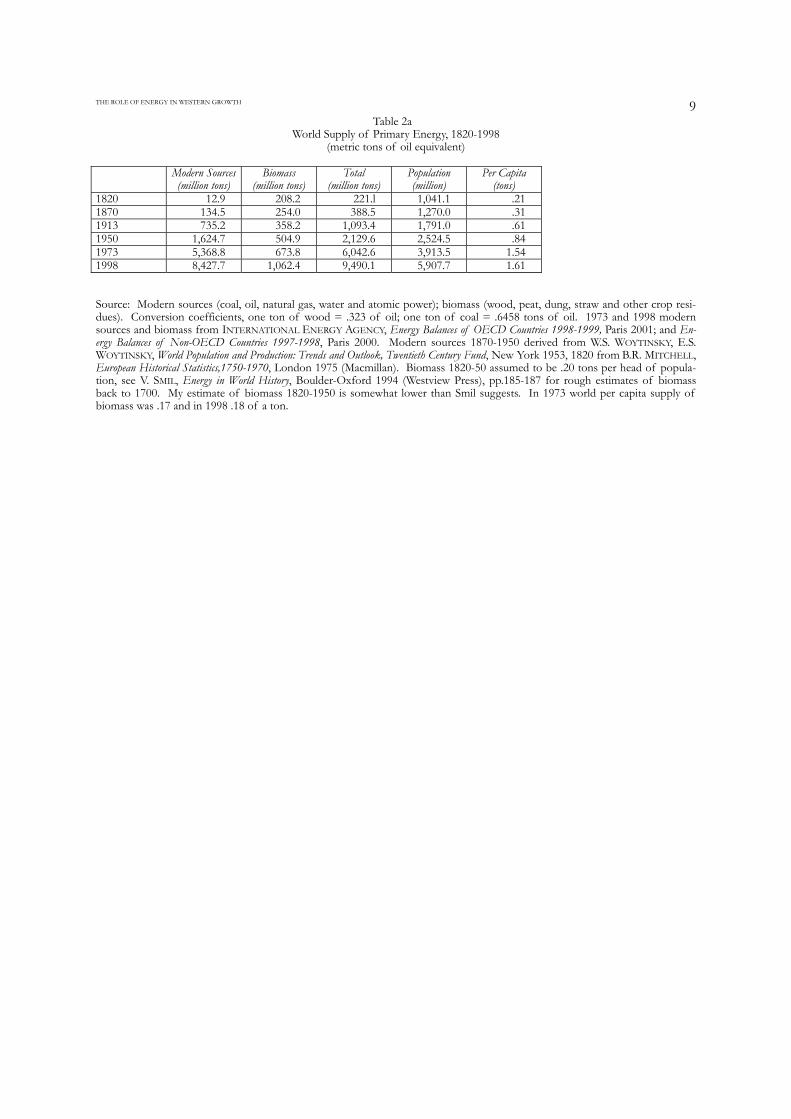
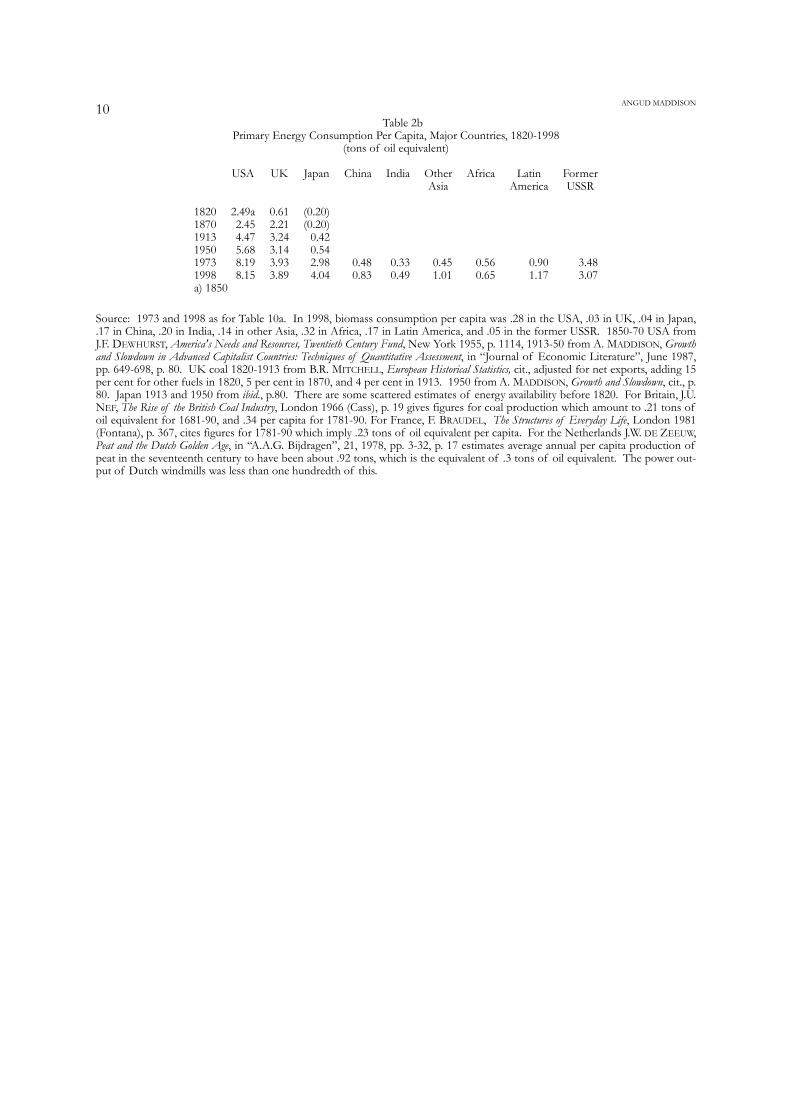
Most machinery is power-driven, but energy consumption rose much more slowly than the stock of machines. In the USA, where there was an abundance of easily available timber in 1820, per capita con-sumption of primary energy has risen only threefold, against six in the UK and twenty fold growth in Ja-pan since 1820 (see tables 2a and 2b). There has been enormous progress in the efficiency of energy conversion, which was also facilitated by the switch from biomass to coal and then oil.
In the course of the nineteenth century, great increases in the efficiency of steam engines were achieved by development of compound and turbine technology. Landes (1966) illustrated this by compar-ing the 60 horsepower engine of a P&O paddlewheeler of 1829 with the twin-turbines generating 136,000 horsepower for the Cunard liner Mauretania in 1907. Thereafter, ships shifted increasingly to oil and diesel engines, which produced much more power than the same weight of coal, and eliminated the need for stokers. Steam engines also revolutionised passenger and freight transport by land in the nine-teenth century. Starting from scratch in 1826, almost a million kilometres of rail track had been built by 1913. The internal combustion engine reinforced the momentum of change, added greatly to individual and family freedom of movement, and choice of industrial and commercial activity. In 1913, the fleet of passenger cars was about 1.5 million vehicles. By 1999, it was 520 million. In the second half of the twen-tieth century, air passenger miles rose from 28 billion in 1950 to 2.6 trillion in 1998. Development of elec-tricity had at least as big an impact. It provided a multipurpose, efficient and convenient source of heat, light and power, whose availability transformed household operation, office work, the nature and locus of industrial activity, and the potential for scientific research1.
Human capital, i.e. the average number of years of education (weighted by level attained) rose by a factor of 11 in the USA and Japan and 8 in the UK.
It was profitable to invest in this rapid expansion of physical and human capital because the rhythm of technical progress was much faster in the nineteenth and twentieth centuries than ever before. Some idea of the aggregate rate of technical progress can be derived by looking at the pace of advance in total factor productivity in the lead country. It is clear from Table 1b that the pace of advance in total factor
1 See D.S. LANDES, Technological Change and Development in Western Europe, 1750-1914, in The Cambridge Economic History of
Europe, ed. H.J. HABAKKUK, M.M. POSTAN, Cambridge 1966-1989, pp. 504-521, for a masterly survey of technical change in the use of energy and power. For development of rail and automobile transport, see A. MADDISON, Monitoring the World Economy, 1820-1992, Paris 1995 (OECD), pp. 64 and 72. For 1998 passenger miles by air and the 1999 passenger car fleet, see WORLD-WATCH INSTITUTE, Vital signs : the environmental trends that are shaping our future, London 1999 and 2001 editions. See W.D. NORD-HAUS, Do Real-Output and Real-Wage Measures Capture Reality? The History of Lighting Suggests Not, in The Economics of New Goods, eds. T.F. BRESNAHAN, R.J. GORDON (1197), Chicago-London 1997 (NBER), for an assessment of the economic impact of electric light.
ANGUD MADDISON 2productivity has not been even. It was fastest in the period 1913-73 in the USA, but has dropped off
sharply since then, even though the technique of estimation of US GDP has recently been modified to impute what seem to me excessive gains in the information technology sector.
International trade increased rapidly after 1820. The volume of exports per head of population rose 88 fold in the UK, 110 in the USA and by a much higher proportion in Japan (whose economy was closed to foreign trade until 1855). It was important in enabling countries to specialise in the types of product at which they were most efficient. It eliminated the handicap of countries with limited natural resources. It was also important in diffusing new products and new technologies.
Analysis of Growth Causality Before 1820
Before 1820, economic growth was very much slower than it has been since. For the world as a whole the increase in per capita income was hardly perceptible, and productivity growth was slower, as labour input probably increased more than population. Nevertheless Western growth was faster than that in the rest of the world for several centuries before 1820.
It is not possible to construct growth accounts prior to 1820, but one can identify significant and steady technical progress in fields where Western leadership is incontrovertible, notably in navigation and shipbuilding. Progress in these areas permitted Western countries to harness wind power much more effi-ciently between 1000-1820. Without these advances, the West would not have achieved a dominant role in world trade. Nor would it have discovered and captured huge areas of land, precious metals, and biologi-cal resources in the Americas.
Before turning to the analysis of technical progress, we must not ignore three features which were of fundamental importance in Western Europe's economic and political ascension. These were: a) development of property rights and legal protection which fostered entrepreneurship and willingness
to take business risks. They were already established in urban mercantile centres in Flanders and Northern Italy by the twelfth century. These rights permitted the creation and development of fi-nancial institutions which provided credit and insurance. They made it possible to organise business on a large scale and undertake distant ventures;
b) emergence of a system of competitive nation states in close propinquity, with significant trading rela-tions, and easy intellectual interchange. This stimulated competition and transfer of technology. It provided the option of migration or refuge in neighbouring countries to adventurous and innovative minds;
c) changes in intellectual horizons which occurred between the sixteenth and seventeenth centuries, when medieval notions of a five thousand year old earth-centred universe were abandoned. They were replaced by a very different conception of time and space. Thanks to the renaissance, the sev-enteenth century scientific revolution and the eighteenth century enlightenment, Western elites gradually abandoned superstition, magic and submission to religious authority. The scientific ap-proach gradually impregnated the educational system. Circumscribed horizons were abandoned. A Promethean quest for progress was unleashed. The impact of science was reinforced by the creation of scientific academies and observatories which inaugurated empirical research, observation and ex-periment with a very direct impact on shipping and navigation, and a delayed impact in other fields; e.g. in the development of the steam engine. Systematic recording of experimental results and their diffusion in written form were a key element in their success. These three aspects of West European development had no counterpart in other continents.
Quantitative evidence on growth causality is relatively meagre for the centuries before 1820, but there
is reason to believe that the same forces were operative, though their conjunction was different and their combined impact more gradual.
It is not difficult to demonstrate that there was important technical advance – as shown below in the case of shipping and navigation. The progress of innovation was reinforced by the scientific revolution of the seventeenth century, which also improved the quality of human capital. The relative importance of international trade increased. Innovations in this era were not particularly capital intensive, but some in-crease in capital-output ratios undoubtedly occurred.
It is possible to get a crude measure of the stock of world shipping back to 1500 (see tables 3a and b), and from that to derive a crude estimate of the growth in volume of world trade. The pace of growth from 1500 to 1820 was much slower than it has been since, but the relative importance of trade as a force for growth was bigger. Table 4 provides a confrontation of the growth in volume of trade and in world GDP. The ratio between the two rates of growth is shown in the third column. One can see that it was higher between 1500 and 1870 than it has been since.
THE ROLE OF ENERGY IN WESTERN GROWTH 3
The dynamism in world trade from the sixteenth to nineteenth century had its origins exclusively in Western Europe. Between 1470 and 1820, Western Europe's merchant fleet increased about 17 fold and per head of population more than sixfold. Its effective carrying capacity rose more than this because of technical progress in design of ships, sails and rigging, improvements in instruments and techniques of navigation, in cartography, in knowledge of geography, winds and currents. In this period voyages became less dangerous for ships and their crews. Travel time became more predictable and regular, ships became bigger and the crew required per ton of cargo was reduced. European domination of the world's oceans was reinforced by advances in naval armament, and the capacity to organise business on a large scale in ventures which required significant capital outlays over a relatively long period.
Developments in Sea Transport and Navigational Technology, 1000-1820
Advances in ship design and navigational knowledge were the most dynamic form of technical pro-gress in Western Europe from 1000-1820. These advances were derived in part from a pragmatic process of trial and error but they were also heavily dependent on progress in science.
In the year 1000, Mediterranean ships were no better and navigation inferior to the situation a thou-sand years earlier. Ships were rigged with square sails which were efficient only when the wind was astern. Voyages against the wind could be extremely lengthy and uncertain2. Harbour facilities were infe-rior to those constructed by the Emperor Claudius at Portus for the food supply of Rome, and Alexan-dria’s great port and lighthouse had disappeared. Some navigational aids were the same as in Roman times - lead lines for sounding depth of water and a windrose which helped identify the direction of winds. The stars and the sun provided guidance on position and time of day. There were no charts or sailing in-structions (periploi) showing depths, anchorages, tides etc.- which the Greeks and Romans had had. Ptolomy’s second-century Geography provided the Roman world with an atlas of the world as it was then known and a projection system for measuring position in terms of latitude and longitude. With the fall of the empire, it had been lost, and it was only in 1400 that a manuscript copy was found in Constantinople. It was translated into Latin in 1409.
In the thirteenth century there were three significant improvements. The most important was the magnetic compass showing 32 directional points, somewhat like a windrose, but with a pointer directed continuously to the north. The other two were the Venetian sandglass, designed to measure the elapse of time accurately over a given interval, and the wooden traverse board which made it possible to plot the course of a voyage. The board had a face like a compass with eight holes in each compass point, and eight pegs attached in the centre. At each half-hour of the 4 hour watch, a peg was placed in the appro-priate hole to indicate the course of the ship in that interval. Traverse tables provided some trigonomet-rical guidance in estimating daily progress and calculation was made easier by the adoption of Arabic numerals.
About the same time, portolans (charts with an indication of ports, anchorages, tides, depths and winds) began to appear. They provided sailing instructions derived from the experience of earlier mari-ners. They showed coastal outlines and distances between ports, with an array of alternative courses (rhumb lines). If none of these lines was appropriate for the intended voyage, they nevertheless helped the mariner design and pursue his own trajectory, using a ruler and a pair of dividers. The portolans were made of vellum (a single sheepskin up to 5 feet long and half as wide) with directions inscribed in black and red ink.
These changes increased the productivity of Venetian ships, which had previously not ventured the trip to Egypt between October and April when the sky was frequently overcast. With these instruments the ship could make two return journeys a year from Venice to Alexandria instead of one.
Innovations in shipbuilding technique reduced costs and improved efficiency. In Roman times the hull had been constructed first. Ships were held together by a careful watertight cabinetwork of mortice and tenon. The second stage was the insertion of ribs and braces. From the eleventh century, the keel and ribs were made first, and a hull of nailed planks was added, using fibre and pitch to make the hull wa-tertight. Somewhat later, the stern-post rudder replaced trailing oars as a more effective means of steer-ing. The power of rudders was strengthened by use of cranks and pulleys, so it was much easier to maintain course in bad weather. There were improvements in Mediterranean sails, notably the use of the
2 see A.E. NORDENSKIÖLD, Periplus : an Essay on the Early History of Charts and Sailing-Directions, Stockholm 1897 (Norstedt), p.
4 on the uncertainties. He cites the experience of St. Paul who was sent as a prisoner from Syria to Rome.The vessel, with 276 people aboard, skirted the coast northward, intending to winter in Crete, but was hit a storm, driven for two weeks in damaged condition, and shipwrecked in Malta. In 533, the Byzantine emperor, Justinian, sent a large fleet with 15000 soldiers and 20000 sailors from Constantinople to attack the Vandals in Carthage. The journey took three months, rowing through the Aegean to Sicily,and Malta, then blown by a storm to Tunis.
ANGUD MADDISON 4Arab lateen rig set at an angle to the mast, instead of a rectangular sail set square to the mast. This made
it possible to sail in a wider range of wind conditions, and reduced the time spent idling in port or at an-chor.
In the fifteenth century, the locus of maritime progress switched to Portugal which was exploring the Atlantic islands and the African coast. There were big changes in rigging which permitted sails to harness wind energy with much greater efficiency than earlier Mediterranean vessels. With more masts and a much more complex array of sails, ships became more manoeuvrable and faster. They could tack into the wind with much greater ease. The Venetian galley, whose motive power depended on oarsmen, became obsolete. A new type of vessel - the caravel - was more robust and able to operate successfully in the stormier seas and stronger currents of the Atlantic.
The Portuguese made major progress in navigation, developing new instruments and much better charts. In the northern hemisphere, the pole star provided a more or less constant bearing and altitude. On a north-south passage, a navigator could observe the pole star each day at dawn and dusk (when he could see both the star and the horizon). By noting changes in altitude he could get some idea of changes in his position. In sailing east-west, he could keep a steady course by maintaining a constant po-lar altitude. All this had been done very crudely using finger spreads or other rough means of measuring altitude. In the fifteenth century, the Portuguese developed the quadrant, which made it possible to judge latitudes and distance sailed. They also devised techniques of correction for the slight rotation of the po-lar star. In the southern hemisphere which Portuguese ships had now begun to enter, there was no star with the same properties and the sun was used instead. The sun's altitude could not be measured with a quadrant, as its light was too bright for the naked eye, so a variant of the astronomer's astrolabe was de-veloped for mariners. Because of the earth's movement, the altitude of the sun was different every day, so altitude readings had to be adjusted for daily changes in the sun's declination. These tables were con-structed by the astronomer Zacuto in the 1470s. After practical tests of the instruments and tables on trial voyages, a naval almanac, Regimento do Astrolabio et do Quadrante was compiled which was available to da Gama when he sailed to India in 1497.
In the fifteenth century, there were improvements in measuring speed and distance travelled at sea. The nautical mile became the standard unit of distance and the log-line which trailed from the stern was marked by knots spaced uniformly to mark fractions of a mile. The running time of the sandglass was adjusted to match.
European knowledge of world geography was revolutionised by the establishment of the new routes in the southern hemisphere, the discovery of the Americas, and Magellan's circumnavigation of the globe. New maps were needed, charts were improved, atlases began to appear, and the invention of printing greatly facilitated their diffusion. Globes were produced to give a more accurate idea of world geography on long routes. In 1569, the Flemish mapmaker, Gerard Mercator, developed a projection technique to represent the world's sphericity on a flat surface. On his charts, parallels of latitude and me-ridians of longitude cut each other at right angles. Meridians were spread apart as they approached the poles. As a counterbalance, the spacing of latitude degrees was increased progressively toward the poles. As a result, the line of a constant compass bearing was straight. This was of great potential use for navi-gators but not generally used until the seventeenth century. Calculation of a ship's course was greatly simplified in the seventeenth century by Napier's 1614 invention of logarithms, which soon became avail-able to mariners in the form of decimal tables (invented by Briggs in 1631). Logarithmic slide-rules were available to mariners from the middle of the seventeenth century along with other trigonometric short-cuts. In 1594, the English navigator, John Davis, invented a simple backstaff which could be used to measure solar altitude, without sighting the sun directly. By the end of the seventeenth century it had re-placed the seaman's quadrant and astrolabe. It was superseded by a much more precise reflecting octant invented by the English mathematician, Hadley, in 1731 as a by-product of his work on reflecting tele-scopes. This was further improved in 1757 by a sextant developed by the British navy. This permitted a quick and accurate reading of any celestial object against the horizon.
The search for accurate measurement of longitude had been under way for a long time. Philip III of Spain offered large financial rewards in 1598 and similar incentives had been offered in France and Hol-land. The British government created a Board of Longitude in 1714 which offered a £20,000 prize for an invention accurate within narrow specifications. The prize was won by John Harrison, who after 25 years of effort, made a watch in 1760 (about twice the size of a pocket watch), which was unaffected by the movement of a ship and changes in the weather. This was successfully tested in trials to the West Indies in 1762-4. Captain Cook, who had used the new Nautical Almanac and lunar method of estimating longi-tude in his first Pacific voyage in 1768-71, used a copy of Harrison's watch in his 1772-5 circumnaviga-
THE ROLE OF ENERGY IN WESTERN GROWTH 5tion of the world. When he returned to Plymouth three years later, the cumulative error in longitude was less than eight miles.
By the end of the eighteenth century, great progress had been made in the design of ships and rig-ging, in gunnery, in meteorological and astronomical knowledge and in the precision of navigational in-struments. Maps had been enormously improved and were supplemented by detailed coastal surveys. Sailing had become safer, the duration of voyages more predictable, and the incidence of shipwreck had fallen significantly. There was also progress in reducing disease mortality on long voyages .
In Anson's voyage round the world in 1740-4, he successfully harried the Spanish in the Pacific and captured a huge treasure ship with loss of only four men by enemy action, but lost over 1300 from dis-ease, mainly scurvy. Anson's experience led the British naval physician James Lind to carry out dietary experiments. In 1753 he published his results and recommended orange and lemon juice as a sure spe-cific against the disease. Captain Cook, in his voyage of 1768-71, followed Lind's advice, and experi-mented with a number of anti-scorbutic items, including oranges, lemons and sauerkraut. He had only one case of scurvy, but it was not until 1795 that regular issue of lemon juice was adopted by the royal navy.
Development of Naval Weaponry
European naval weaponry and modes of warfare had changed completely by the sixteenth century. The armed galley, which was used for close combat, ramming and boarding, was last used at the battle of Lepanto in 1571. It was replaced by ships manoeuvrable enough to engage the enemy at a distance with broadsides from heavy artillery pieces. Bronze guns had been replaced by much improved and cheaper iron weaponry.
At first naval guns were fired from the superstructure and the size of ships was enlarged to maximise firepower. Very large ships of this kind (the English Harry Grace à Dieu 1514, the French Grand Fran-çois 1534, the Portuguese São Jão, and the Swedish Elefant 1559) were unstable and sank very quickly. The British developed a more successful design-the galleon-around 1550, which was a medium sized ship, fast and manoeuvrable with guns on the main deck, firing cannon through ports cut in the hull. They proved successful against bigger Spanish ships in the Armada of 1588. The Dutch found them effective against Portuguese carracks in the Asian trade.
The Scientific Revolution of the Seventeenth Century
From the middle of the sixteenth century to the end of the seventeenth there was fundamental pro-gress in Western science which and brought revolutionary changes in European perceptions of the uni-verse, and the interaction between the earth, the other planets, the sun and the stars. This also had important consequences for navigation.
The revolution started in 1543 with the publication of Copernicus' heliocentric theory rejecting the scholastic notion that the earth was the centre of the universe. This was followed by detailed observation of the movement of celestial bodies and the nature and mutability of their orbits by Kepler and Galileo, estimates of celestial distance and new conclusions about the laws of motion. From 1610, Galileo made his own refractor telescopes and used them to make spectacular discoveries. He saw the mountains and craters of the moon, the spots on the sun, the satellites of Jupiter, the phases of Venus and the stars of the Milky Way. His quarter century of observation greatly enriched the empirical evidence for the Coper-nican hypothesis. In 1632 he published his Dialogue on the Two Chief Systems of the World (Ptolemaic and Copernican). As a result he was detained by the Church authorities, and under threat of torture was forced to recant. He remained sequestered and his works were banned in Italy. In Italy, the counter-reformation made the papacy militant in its persecution of heresy and heretical books. The new Jesuit order and the Inquisition were major instruments of this policy, and intellectual freedom was further weakened by Spanish control of Lombardy and Southern Italy.
In its final phases the locus of the scientific revolution moved to Northern Europe, notably England, France and Holland. The climax was Newton's publication of his Principia in 1687, which showed that the whole universe was subject to the same laws of motion and gravitation. Newton's conclusions, like those of Galileo were carefully tested against empirical evidence of celestial phenomena. He constructed a new type of reflecting telescope for his own observations and followed closely the results of research in the Royal Society founded in 1662 in England (of which he was President from 1703 to 1727). The French Académie des Sciences was created more or less simultaneously and the astronomical research of both institutions was buttressed by astronomical observatories. The Paris Observatoire was established in 1672 and the Greenwich Observatory in 1675. Interaction between the two academies was close. Newton
ANGUD MADDISON 6
was influenced by the research at the French Academy by the Dutch scientist Huygens and the precise measurements of celestial distance by Picard and Cassini at the Paris Observatory3.
Progress in astronomy and physics was accompanied by major advances in mathematics and design of new instruments (telescopes, micrometers, microscopes, thermometers, barometers, airpumps, clocks and watches and the steam engine)..
The link between scientific research and practical matters of navigation is clear from the work of Edmond Halley (1656-1742). Halley wrote his first paper for the Royal Society in 1676 when he was 19. It dealt with irregularities he had observed in the orbits of Jupiter and Saturn which were then believed to be uniformly elliptic. Over the next 65 years he wrote another 80 scientific papers (see MacPike, 1932). He encouraged Newton to finish his Principia, financed its publication and read the proofs. He served as Secretary of the Royal Society, was Professor of Geometry at Oxford, from 1704, Astronomer Royal from1720, and an honorary member of the French Académie des Sciences from 1729.
In 1677 he went to St. Helena for eighteen months to make the first catalogue of stars observable in the southern hemisphere. He used a telescope with a micrometer to measure their position and coordi-nates. In 1679 the Society sent him to Danzig for 2 months to check the accuracy of Hevelius' catalogue of stars of the Northern hemisphere. From 1680 to 1705 he made a comparative analysis of the orbits of 24 comets, explained the reasons for their apparently erratic variation and predicted correctly the re-turn of Halley's comet in 1758. He studied the orbits of the planets Mercury and Venus which are nearer the sun than the earth is. He had used his 1677 observation of the transit of Mercury to make a crude measure of the sun's distance from the earth. In 1691 he predicted transits of Venus for 1761 and 1769 and suggested that they be observed at extreme points of the earth in order to measure the dimen-sions of the solar system. The suggestion was implemented, the 1769 transit being observed in Captain Cook's expedition to Tahiti.
Halley made three important contributions of great practical significance for mariners. Between 1683 and 1715 he measured the earth's atmosphere, the causes of variation in air pressure, the origins of trade winds and monsoons. He produced the first meteorological chart of wind patterns in the Atlantic, Indian and Pacific
Oceans in 1686. He followed this by studies of rates of evaporation and replenishment of water. He estimated the daily evaporation of water in the Mediterranean to be 5.3 billion tons, and analysed the ways this was replaced by rainfall, river flows etc.
In 1683 he started collecting observations of variance in terrestrial magnetism (which caused puzzling effects on compass readings), speculated on their origin at different levels within the earth's surface and the effect of the earth's rotation. In 1698-1700 he directed a naval expedition in the Atlantic to measure magnetic variation systematically, and in 1701 published the first chart showing isogonic lines of equal magnetic variation distributed over the earth's surface. Thereafter charts of this kind became an essential part of the navigator`s equipment.
Halley's third major contribution was painstaking daily lunar observation over a period of two dec-ades in order to provide tables for accurate measurement of longitude. The results were incorporated in the annual Nautical Almanacs published at Greenwich from 1767 onwards.
The scientific revolution had a very direct influence on European navigation and capacity to penetrate distant oceans. It was of fundamental long-term importance in virtually all areas of activity. Advances in knowledge were closely linked with empirical investigation and production of precision instruments (tele-scopes, microscopes, clocks, watches, etc.). The revolution in cosmology stirred the European imagina-tion and promoted Promethean ambitions. These developments in Europe were an essential prelude to the much faster economic development which occurred in the nineteenth and twentieth centuries. They had no counterpart in other parts of the world.
3 see F. MARGUET, Histoire generale de la navigation de XVe au XXe siecle, Paris 1931 and P. HAUDRERE, The Compagnie des Indes and
Maritime Matters, in Ships, Sailors and Spices, eds. J.R. BRUIJN, F.S. GAASTRA, Amsterdam 1993 (NEHA) for an account of French scientific research on Navigational problems.
THE ROLE OF ENERGY IN WESTERN GROWTH 7Table 1a
Proximate and Measurable Determinants of Growth since 1820 UK USA Japan UK USA Japan Gross Stock of Machinery &
Equipment Per Capita (1990$) Gross Stock of Non-Residential Structures Per Capita (1990 $)
1820 92 87 n.a. 1,074 1,094 n.a. 1870 334 489 94 a 2,509 3,686 593a 1913 878 2,749 329 3,215 14,696 852 1950 2,122 6,110 1,381 3,412 17,211 1,929 1973 6,203 10,762 6,431 9,585 24,366 12,778 1998 11,953 25,153 29,987 21,066 35,810 9,042 UK USA Japan UK USA Japan Primary Energy Consumption
Per Capita (tons of oil equiv.) Average Years of Education(c)
Per Person Employed 1820 .61 2.45b 0.20 2.00 1.75 1.50 1870 2.21 2.45 0.20 4.44 3.92 1.50 1913 3.24 4.47 0.42 8.82 7.86 5.36 1950 3.14 5.68 0.54 10.60 11.2 9.11 1973 3.93 8.19 2.98 11.66 14.58 12.09 1998 3.89 8.15 4.04 15.10 19.46 16.03 UK USA Japan UK USA Japan Land Area Per Capita (hectares) Exports Per Capita (1990 $) 1820 1.48 48.1 1.23 53 25 n.a. 1870 1.00 23.4 1.11 390 62 1.5 1913 0.69 9.6 0.74 862 197 33 1950 0.48 6.2 0.44 781 283 42 1973 0.43 4.4 0.35 1,684 824 875 1998 0.41 3.5 0.30 4,680 2,755 2,736 UK USA Japan UK USA Japan Hours Worked Per Head of
Population GDP Per Manhour (1990 $)
1820 1,153 968 1,598 1.49 1.30 0.42 1870 1,251 1,084 1,598 2.55 2.25 0.46 1913 1,181 1,036 1,290 4.31 5.12 1.08 1950 904 756 925 7.93 12.65 2.08 1973 750 704 988 15.97 23.72 11.57 1998 657 791 905 27.45 34.55 22.54 1890; b) 1850; c) in equivalent years of primary education.
Table 1b Proximate and Measurable Determinants of Growth since 1820 (contd.)
UK USA Japan UK USA Japan Capital-Output Ratio
Machinery & Equipment/GDP Capital-Output Ratio
Non-Residential Structures/GDP 1820 .05 .07 n.a. .63 .87 n.a. 1870 .11 .20 .10a .79 1.51 .59a 1913 .18 .52 .24 .65 2.77 .61 1950 .31 .64 .72 .49 1.80 1.00 1973 .52 .64 .93 .80 1.46 1.12 1998 .64 .92 1.47 1.13 1.31 2.40 UK USA Japan UK USA Japan Labour Productivity Total Factor Productivity (annual average compound growth rates) 1820-70 1.10 1.10 0.18 0.15 -0.15 n.a. 1870-1913 1.22 1.93 2.00 0.31 0.36 -0.05b 1913-50 1.66 2.47 1.79 0.81 1.62 0.20 1950-73 3.09 2.77 7.75 1.48 1.75 5.12 1973-98 2.19 1.52 2.70 0.83 0.60 0.58

ANGUD MADDISON 8a) 1890; b) 1890-1913
Source: The procedure and sources were the same as in Appendix K of A. MADDISON, Monitoring the World Economy, cit., with amendments and updating. There were significant changes in OECD national accounts in 2000, with a switchover to the 1993 SNA system, and other significant revisions. The most important was the move to chain indices, hedonic measures, and an in-crease in the scope of the capital measure to include computer software. OECD published retrospective adjustments back to 1988 at best. The degree to which the accounts were revised varied significantly. The changes were biggest for the USA, which the BEA have carried back to 1929. I disregarded the new US estimates for 1929-50 which involve a major rewriting of econo-mic history for reasons which are not clear. Hedonic price indices are not used in the UK or Japan and Japan has not yet adopted SNA 1993. The official US statistical procedures now impute quality changes on a scale unprecedented in US national accounts, and the recent upward revisions are bigger than in the UK or Japan (see IDEM, The World Economy: A Millennial Perspective, Paris 2001 (OECD), p. 138, for a demonstration of the importance of the revisions).
THE ROLE OF ENERGY IN WESTERN GROWTH 9Table 2a
World Supply of Primary Energy, 1820-1998 (metric tons of oil equivalent)
Modern Sources
(million tons) Biomass
(million tons) Total
(million tons) Population (million)
Per Capita (tons)
1820 12.9 208.2 221.l 1,041.1 .21 1870 134.5 254.0 388.5 1,270.0 .31 1913 735.2 358.2 1,093.4 1,791.0 .61 1950 1,624.7 504.9 2,129.6 2,524.5 .84 1973 5,368.8 673.8 6,042.6 3,913.5 1.54 1998 8,427.7 1,062.4 9,490.1 5,907.7 1.61 Source: Modern sources (coal, oil, natural gas, water and atomic power); biomass (wood, peat, dung, straw and other crop resi-dues). Conversion coefficients, one ton of wood = .323 of oil; one ton of coal = .6458 tons of oil. 1973 and 1998 modern sources and biomass from INTERNATIONAL ENERGY AGENCY, Energy Balances of OECD Countries 1998-1999, Paris 2001; and En-ergy Balances of Non-OECD Countries 1997-1998, Paris 2000. Modern sources 1870-1950 derived from W.S. WOYTINSKY, E.S. WOYTINSKY, World Population and Production: Trends and Outlook, Twentieth Century Fund, New York 1953, 1820 from B.R. MITCHELL, European Historical Statistics,1750-1970, London 1975 (Macmillan). Biomass 1820-50 assumed to be .20 tons per head of popula-tion, see V. SMIL, Energy in World History, Boulder-Oxford 1994 (Westview Press), pp.185-187 for rough estimates of biomass back to 1700. My estimate of biomass 1820-1950 is somewhat lower than Smil suggests. In 1973 world per capita supply of biomass was .17 and in 1998 .18 of a ton.
ANGUD MADDISON 10Table 2b
Primary Energy Consumption Per Capita, Major Countries, 1820-1998 (tons of oil equivalent)
USA UK Japan China India Other
Asia Africa Latin
AmericaFormer USSR
1820 2.49a 0.61 (0.20) 1870 2.45 2.21 (0.20) 1913 4.47 3.24 0.42 1950 5.68 3.14 0.54 1973 8.19 3.93 2.98 0.48 0.33 0.45 0.56 0.90 3.48 1998 8.15 3.89 4.04 0.83 0.49 1.01 0.65 1.17 3.07 a) 1850
Source: 1973 and 1998 as for Table 10a. In 1998, biomass consumption per capita was .28 in the USA, .03 in UK, .04 in Japan, .17 in China, .20 in India, .14 in other Asia, .32 in Africa, .17 in Latin America, and .05 in the former USSR. 1850-70 USA from J.F. DEWHURST, America's Needs and Resources, Twentieth Century Fund, New York 1955, p. 1114, 1913-50 from A. MADDISON, Growth and Slowdown in Advanced Capitalist Countries: Techniques of Quantitative Assessment, in “Journal of Economic Literature”, June 1987, pp. 649-698, p. 80. UK coal 1820-1913 from B.R. MITCHELL, European Historical Statistics, cit., adjusted for net exports, adding 15 per cent for other fuels in 1820, 5 per cent in 1870, and 4 per cent in 1913. 1950 from A. MADDISON, Growth and Slowdown, cit., p. 80. Japan 1913 and 1950 from ibid., p.80. There are some scattered estimates of energy availability before 1820. For Britain, J.U. NEF, The Rise of the British Coal Industry, London 1966 (Cass), p. 19 gives figures for coal production which amount to .21 tons of oil equivalent for 1681-90, and .34 per capita for 1781-90. For France, F. BRAUDEL, The Structures of Everyday Life, London 1981 (Fontana), p. 367, cites figures for 1781-90 which imply .23 tons of oil equivalent per capita. For the Netherlands J.W. DE ZEEUW, Peat and the Dutch Golden Age, in “A.A.G. Bijdragen”, 21, 1978, pp. 3-32, p. 17 estimates average annual per capita production of peat in the seventeenth century to have been about .92 tons, which is the equivalent of .3 tons of oil equivalent. The power out-put of Dutch windmills was less than one hundredth of this.
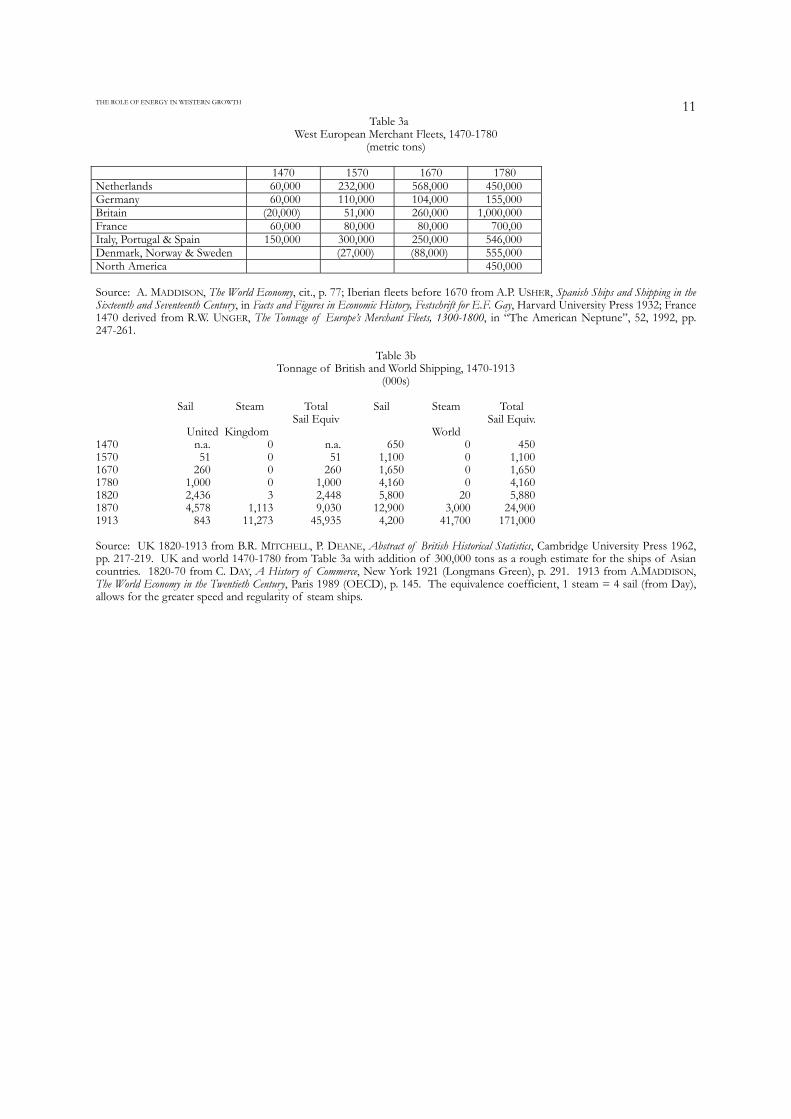
THE ROLE OF ENERGY IN WESTERN GROWTH 11Table 3a
West European Merchant Fleets, 1470-1780 (metric tons)
1470 1570 1670 1780 Netherlands 60,000 232,000 568,000 450,000 Germany 60,000 110,000 104,000 155,000 Britain (20,000) 51,000 260,000 1,000,000 France 60,000 80,000 80,000 700,00 Italy, Portugal & Spain 150,000 300,000 250,000 546,000 Denmark, Norway & Sweden (27,000) (88,000) 555,000 North America 450,000 Source: A. MADDISON, The World Economy, cit., p. 77; Iberian fleets before 1670 from A.P. USHER, Spanish Ships and Shipping in the Sixteenth and Seventeenth Century, in Facts and Figures in Economic History, Festschrift for E.F. Gay, Harvard University Press 1932; France 1470 derived from R.W. UNGER, The Tonnage of Europe’s Merchant Fleets, 1300-1800, in “The American Neptune”, 52, 1992, pp. 247-261.
Table 3b Tonnage of British and World Shipping, 1470-1913
(000s)
Sail Steam Total Sail Steam Total Sail Equiv Sail Equiv. United Kingdom World 1470 n.a. 0 n.a. 650 0 450 1570 51 0 51 1,100 0 1,100 1670 260 0 260 1,650 0 1,650 1780 1,000 0 1,000 4,160 0 4,160 1820 2,436 3 2,448 5,800 20 5,880 1870 4,578 1,113 9,030 12,900 3,000 24,900 1913 843 11,273 45,935 4,200 41,700 171,000 Source: UK 1820-1913 from B.R. MITCHELL, P. DEANE, Abstract of British Historical Statistics, Cambridge University Press 1962, pp. 217-219. UK and world 1470-1780 from Table 3a with addition of 300,000 tons as a rough estimate for the ships of Asian countries. 1820-70 from C. DAY, A History of Commerce, New York 1921 (Longmans Green), p. 291. 1913 from A.MADDISON, The World Economy in the Twentieth Century, Paris 1989 (OECD), p. 145. The equivalence coefficient, 1 steam = 4 sail (from Day), allows for the greater speed and regularity of steam ships.
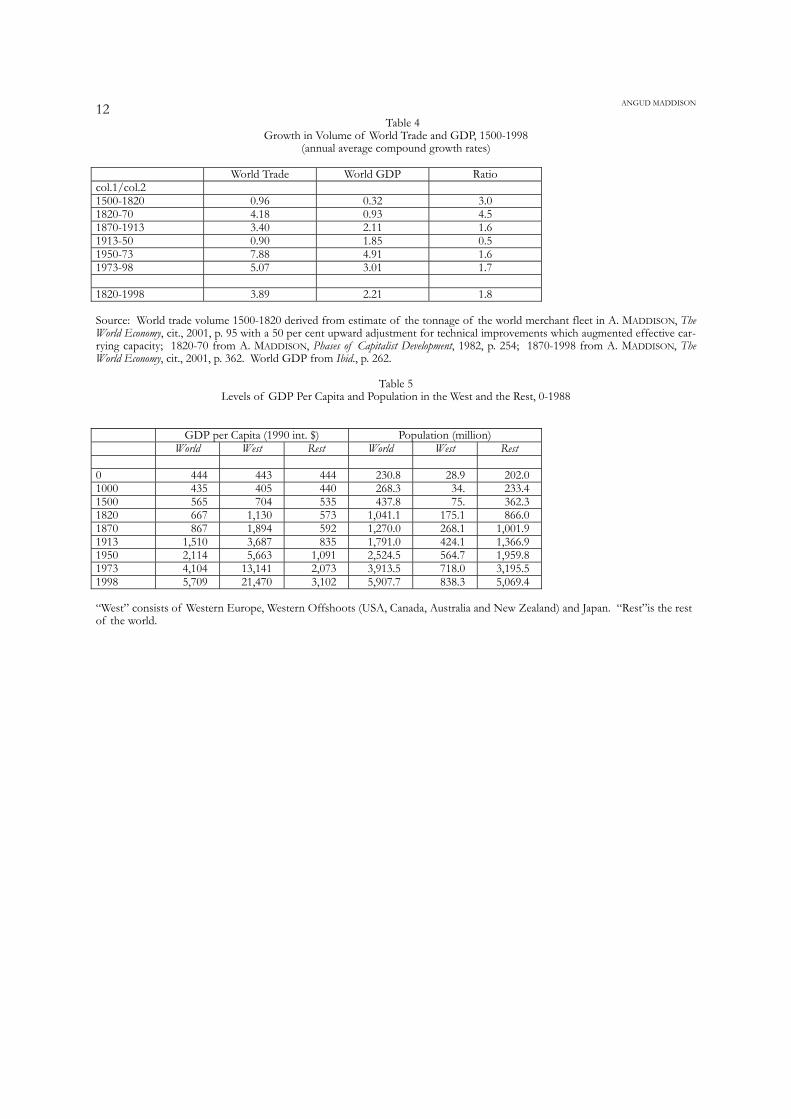
ANGUD MADDISON 12Table 4
Growth in Volume of World Trade and GDP, 1500-1998 (annual average compound growth rates)
World Trade World GDP Ratio col.1/col.2 1500-1820 0.96 0.32 3.0 1820-70 4.18 0.93 4.5 1870-1913 3.40 2.11 1.6 1913-50 0.90 1.85 0.5 1950-73 7.88 4.91 1.6 1973-98 5.07 3.01 1.7 1820-1998 3.89 2.21 1.8 Source: World trade volume 1500-1820 derived from estimate of the tonnage of the world merchant fleet in A. MADDISON, The World Economy, cit., 2001, p. 95 with a 50 per cent upward adjustment for technical improvements which augmented effective car-rying capacity; 1820-70 from A. MADDISON, Phases of Capitalist Development, 1982, p. 254; 1870-1998 from A. MADDISON, The World Economy, cit., 2001, p. 362. World GDP from Ibid., p. 262.
Table 5 Levels of GDP Per Capita and Population in the West and the Rest, 0-1988
GDP per Capita (1990 int. $) Population (million) World West Rest World West Rest 0 444 443 444 230.8 28.9 202.0 1000 435 405 440 268.3 34. 233.4 1500 565 704 535 437.8 75. 362.3 1820 667 1,130 573 1,041.1 175.1 866.0 1870 867 1,894 592 1,270.0 268.1 1,001.9 1913 1,510 3,687 835 1,791.0 424.1 1,366.9 1950 2,114 5,663 1,091 2,524.5 564.7 1,959.8 1973 4,104 13,141 2,073 3,913.5 718.0 3,195.5 1998 5,709 21,470 3,102 5,907.7 838.3 5,069.4 “West” consists of Western Europe, Western Offshoots (USA, Canada, Australia and New Zealand) and Japan. “Rest”is the rest of the world.