Embed Size (px)
Citation preview

C O M P R E H E N S I V E H O U S I N G M A R K E T A N A L Y S I S
Ann Arbor, MichiganU.S. Department of Housing and Urban Development Office of Policy Development and Research As of October 1, 2015
Washtenaw
Oakland
Lenawee
Wayne
Monroe
Ingham
Jackson
Livingston
Housing Market Area
The Ann Arbor Housing Market Area (HMA) is coterminous with the Ann Arbor, MI Metropolitan Statistical Area (MSA) and comprises Washtenaw County in southeast Michigan. The HMA is 45 miles west of Detroit along Interstate 94 and has two main cities: Ann Arbor and Ypsilanti. It is home to an estimated 359,700 people and has two large public universities: the University of Michigan (UM) and Eastern Michigan University (EMU).
SummaryEconomy Nonfarm payrolls in the Ann Arbor HMA are growing but at a slower rate than in the previous 12 months. During the 12 months ending September 2015, nonfarm payrolls totaled 210,400 jobs, up 1,800 jobs, or 0.9 percent, from a year earlier and 4,400 jobs more than the prerecession high reached during the 12 months ending June 2005. During the 3-year forecast period, nonfarm payrolls are expected to increase at an average of 1.0 percent annually. The 10 largest employers include 3 healthcare pro-viders, 3 companies in the automotive industry, and 2 public universities.
Sales MarketSales housing market conditions in the HMA are tight, with a current vacancy rate estimated at 1.2 percent, down from 2.1 percent in April 2010. Demand is expected for 2,450 new homes during the next 3 years (Table 1). The 230 homes currently under construction and a portion of the 3,025 other vacant units that may return to the market are expected to satisfy some of the demand during the forecast period.
Rental MarketRental housing market conditions in the HMA are currently tight, with an overall estimated vacancy rate of 3.3 percent, down from 7.8 percent in 2010. Most of the recent apartment construc-tion is concentrated in the city of Ann Arbor because of a zoning change in 2012 that allowed for higher-density buildings. Demand is expected for 1,850 new market-rate rental units during the next 3 years. The 820 units under construction and 360 units in planning are expected to meet a portion of the anticipated demand (Table 1).
Table 1. Housing Demand in the Ann Arbor HMA During the Forecast Period
Ann Arbor HMA
SalesUnits
RentalUnits
Total demand 2,450 1,850
Under construction 230 820
Notes: Total demand represents estimated production necessary to achieve a balanced market at the end of the forecast period. Units under construction as of October 1, 2015. A portion of the estimated 3,025 other vacant units in the HMA will likely satisfy some of the forecast demand. The forecast period is October 1, 2015, to October 1, 2018.Source: Estimates by analyst
Market DetailsEconomic Conditions ............... 2
Population and Households ..... 6
Housing Market Trends ............ 8
Data Profile ............................. 12

An
n A
rbo
r, M
I •
CO
MP
RE
HE
NS
IVE
HO
US
ING
MA
RK
ET
AN
ALY
SIS
2Economic Conditions
Economic conditions in the Ann Arbor HMA have continued
to strengthen since 2010, but growth slowed during the past 12 months be-cause of lower levels of hiring in the government and the mining, logging, and construction sectors. During the 12 months ending September 2015, nonfarm payroll jobs averaged
210,400, an increase of 1,800 jobs, or 0.9 percent, from the previous 12 months (Table 2). Only two sectors—leisure and hospitality and financial activities—lost jobs. By comparison, during the 12 months ending Septem-ber 2014, the number of jobs increased by 2,700, or 1.3 percent.
During the past 15 years, the HMA continued its multidecade-long transition from a manufacturing center to one better known for its public universities, research and development, and healthcare services. Since 2000, manufacturing sector payrolls have declined 54 percent, but the education and health services, financial activities, and government sectors each have grown more than 30 percent (Figure 1). During 2002 and 2003, nonfarm payrolls declined by an average of 3,400 jobs, or 1.6 percent, annually. Losses in the manufacturing and the professional and business services sectors and the retail trade subsector were only slightly offset by gains in the
Table 2. 12-Month Average Nonfarm Payroll Jobs in the Ann Arbor HMA, by Sector
12 Months EndingAbsolute Change
Percent ChangeSeptember
2014September
2015
Total nonfarm payroll jobs 208,600 210,400 1,800 0.9Goods-producing sectors 17,800 17,900 100 0.6
Mining, logging, & construction 3,700 3,800 100 2.7Manufacturing 14,100 14,100 0 0.0
Service-providing sectors 190,800 192,500 1,700 0.9Wholesale & retail trade 21,400 22,000 600 2.8Transportation & utilities 3,400 3,400 0 0.0Information 4,900 5,100 200 4.1Financial activities 7,800 7,700 – 100 – 1.3Professional & business services 26,600 27,300 700 2.6Education & health services 26,200 26,500 300 1.1Leisure & hospitality 16,300 15,700 – 600 – 3.7Other services 6,700 6,700 0 0.0Government 77,400 78,200 800 1.0
Notes: Numbers may not add to totals because of rounding. Based on 12-month averages through September 2014 and September 2015. Source: U.S. Bureau of Labor Statistics
Figure 1. Sector Growth in the Ann Arbor HMA, Percentage Change, 2000 to Current
Note: Current is based on 12-month averages through September 2015. Source: U.S. Bureau of Labor Statistics
Total nonfarm payroll jobs
Goods-producing sectors
Mining, logging, & construction
Manufacturing
Service-providing sectors
Information
Financial activities
Professional & business services
Education & health services
Government
Other services
Leisure & hospitality
Transportation & utilities
Wholesale & retail trade
40 500 20 3010– 60 – 50 – 20 – 10– 40 – 30

An
n A
rbo
r, M
I •
CO
MP
RE
HE
NS
IVE
HO
US
ING
MA
RK
ET
AN
ALY
SIS
3
education and health services sector and the state government subsector, primarily in university-affiliated jobs. From 2004 through 2006, at a time when national payrolls were growing, HMA payrolls were mostly unchanged, declining by 100 jobs, or less than 0.1 percent per year. Job growth in the education and health services sector, the state government subsector, and the transportation and utilities sector offset losses, while declines in the manufacturing sector slowed. From 2007 through 2009, the HMA continued to lose jobs during the national recession, heavily influ-enced by Detroit-based automobile manufacturer bankruptcies. Payrolls declined by 3,600 jobs, or 1.8 percent, annually, and growth in state govern-ment of 2.8 percent was insufficient
to offset the continued loss of manu-facturing, professional and business services, and mining, logging, and construction sector jobs. Since 2010, nonfarm payrolls have expanded by 2,900 jobs, or 1.5 percent, annually. The state government subsector added the most jobs, but nearly all sectors have grown, including manufacturing. Current payroll levels exceed the prerecession high reached in 2005 by 5,000 jobs but are still 900 jobs less than the HMA high reached during 2001. The unemployment rate averaged 3.7 percent during the 12 months ending September 2015, an improvement from the 5.2-percent unemployment rate a year earlier and the high of 8.6 percent reached in 2009. Figure 2 shows trends in the labor force, resident employment, and the unemployment rate in the HMA from 2000 through 2014.
Government is the largest sector in the Ann Arbor HMA, with 78,200 jobs during the 12 months ending September 2015, accounting for approximately 37 percent of all payrolls (Figure 3). During the past 12 months, the sector added 800 jobs, or 1.0 percent, the largest absolute increase in the HMA. The state government subsector accounts for 79 percent of all government jobs. Since 2001, the subsector has grown at an average of 2.5 percent, or by 1,300 jobs, annually compared with the fed-eral and local government subsectors, which have remained relatively flat.
Of the 10 largest employers in the HMA, 3 are part of the state govern-ment subsector: the University of Michigan Medical Center (UMMC), UM, and EMU (Table 3). Combined, these institutions have 30,800 employ- ees (Ann Arbor SPARK). UM and UMMC are expecting $7.1 billion in
Figure 2. Trends in Labor Force, Resident Employment, and Unemploy - ment Rate in the Ann Arbor HMA, 2000 Through 2014
Source: U.S. Bureau of Labor Statistics
Figure 3. Current Nonfarm Payroll Jobs in the Ann Arbor HMA, by Sector
Note: Based on 12-month averages through September 2015. Source: U.S. Bureau of Labor Statistics
Economic Conditions Continued
Government 37.2%
Leisure & hospitality 7.5%
Other services 3.2%
Education & health services 12.6%
Professional & business services 13.0%
Wholesale & retail trade 10.4%
Manufacturing 6.7%Mining, logging, & construction 1.8%
Information 2.4%
Transportation & utilities 1.6%
Financial activities 3.7%
Une
mpl
oym
ent r
ate
Labo
r fo
rce
and
resi
dent
em
ploy
men
t 210,000
200,000
190,000
180,000
170,000
160,000
150,000
2000
2002
2004
Labor force Resident employment Unemployment rate
10.0
8.0
6.0
4.0
2.0
0.0
2006
2001
2003
2005
2007
2009
2010
2008
2012
2013
2014
2011

An
n A
rbo
r, M
I •
CO
MP
RE
HE
NS
IVE
HO
US
ING
MA
RK
ET
AN
ALY
SIS
4
Table 3. Major Employers in the Ann Arbor HMA
Name of Employer Nonfarm Payroll Sector Number of Employees
University of Michigan Medical Center Government 18,200University of Michigan Government 10,900Trinity Health Education & health services 5,850General Motors Milford Proving Ground Professional & business services 3,750VA Ann Arbor Healthcare System Government 2,450Faurecia Interior Systems Manufacturing 1,850Eastern Michigan University Government 1,725Toyota Technical Center Professional & business services 1,525Washtenaw County Government 1,325Thompson Reuters Professional & business services 1,200
Note: Excludes local school districts. Source: Ann Arbor SPARK, January 2015
revenue for the 2015–2016 academic year, including $3.9 billion in research funding (UM). Since 2006, revenue has grown by an average of $260 million annually. As of August 2015, UM had 50 capital projects approved or under way, with a total budget of $1.6 billion (Mlive). In partnership with 45 companies and $20 million in investment, in July 2015 UM opened Mcity, a 32-acre course designed to test driverless car technologies. Together with Michigan State University (MSU) and Wayne State University (WSU), which are outside the HMA, UM and UMMC make up the University Research Corridor. The statewide economic impact of the Corridor and the affiliated hospitals and extension programs was $16.8 billion in 2013, an increase of $8 billion since 2007.
The education and health services sector has consistently contributed to long-term stability and growth in the HMA. During the 12 months ending September 2015, payrolls increased by 300 jobs, or 1.1 percent, from the pre-vious 12 months. Most of the growth occurred in the healthcare and social assistance industry, which added 290 jobs. During 2002 and 2003, the education and health services sector grew by 1,300 jobs, or 6.7 percent, annually, slowing to 400 jobs, or 1.8
percent, annually from 2004 through 2006 and then to 300 jobs, or 1.3 percent, annually from 2007 through 2009. From 2000 to 2010, the total population grew 0.7 percent, but the population age 55 and older grew by an average of 2,500, or 5.1 percent, annually, faster than the 2.2-percent growth for the same age cohort in the Detroit-Warren-Dearborn, MI MSA, creating stronger demand for health care. Since 2010, job growth in the sector has increased by an average of 400 jobs, or 1.5 percent, annually.
The professional and business services sector has contributed to job growth in the HMA since 2012. During the 12 months ending September 2015, the sector added the second most jobs of any sector, with 700 payroll jobs, an increase of 2.6 percent. Some of the growth during the past 12 months is attributed to high-technology startups, five of which were named “Startups Spark-ing Change in Detroit” by re/code, a technology news website in February 2015 and secured $46 million in venture funding. During the previous decade, the professional and business services sector lost jobs. During 2002 and 2003, the sector lost an average of 1,700 jobs, or 5.7 percent, annually. Layoffs at a Pfizer research facility contributed to the job loss. From 2004
Economic Conditions Continued

An
n A
rbo
r, M
I •
CO
MP
RE
HE
NS
IVE
HO
US
ING
MA
RK
ET
AN
ALY
SIS
5
through 2006, the sector was stable, growing by an average of less than 50 jobs, or 0.1 percent, annually, but it then declined by 1,000 jobs, or 3.6 percent, annually from 2007 through 2009. Closure of the Pfizer facility in 2008, affecting 2,100 employees, and layoffs at the Borders Group, Inc., corporate headquarters contributed to the decline. The sector has added jobs at an average of 600 jobs, or 2.4 per-cent, annually since 2012, supported by growth in technology companies such as Barracuda Networks and Google AdWords.
During the 12 months ending Septem-ber 2015, the manufacturing sector averaged 14,100 jobs, unchanged since 2011. Payrolls in the manufacturing sector, which totaled 30,700 jobs, or 15 percent of all jobs in the HMA in 2000, now comprise less than 7 percent of all HMA jobs. Continuing the decline that began two decades earlier, from 2001 through 2006, manufacturing payrolls decreased 6.1 percent annu-ally, or by an average of 1,600 jobs. The decline worsened from 2007 through 2009, losing an average of 2,400 jobs annually, or 12.9 percent, mostly because of bankruptcies in the automotive industry. Willow Run, a General Motors (GM) plant, announced closure in 2009 after GM declared bankruptcy, displacing more than 3,000 workers. Automotive Components Holdings, a Ford sub-sidiary, owned four plants, employing 3,400 people in 2008. Two plants are now closed; one was sold to Faurecia, Inc., and currently employs 1,850 people; and the fourth was returned to Ford and employs 790 people. Despite unchanged payroll counts, job postings for skilled trade and technicians grew 26 percent during the past year (Michigan Workforce
Intelligence Network), an indication that jobs in this sector are likely to increase in the coming months.
Since the beginning of 2014, more than 27 companies have announced hiring plans based on support from SPARK, a local economic develop-ment organization. Companies in the manufacturing, printing/information, software/information technology, and research and development industries are expected to add approximately 1,250 employees and invest $175 mil-lion in capital during the next 3 years. Toyota Technical Center plans to invest $109 million to expand its fa-cilities, relocating 250 manufacturing jobs and 85 engineering jobs into the HMA. Thomson Reuters, an informa-tion services company, will spend $19.2 million to consolidate offices and add 300 employees. XanEdu, a publishing company, plans to invest $1 million on facilities and produc-tion equipment, adding 50 jobs. TD Ameritrade, an online brokerage firm, opened an Ann Arbor office in 2014 and is expected to invest $3 million and hire 50 employees. Average weekly wages have increased 2.4 percent annually since 2010 (QCEW), which is expected to support growth in the retail trade subsector and the leisure and hospitality sector. In addition to the hiring announcements facilitated by SPARK, the Ann Arbor Area Transportation Authority announced transit service frequency and hours of service expansions to provide better access to job centers. The expansion is expected to increase access to employment opportunities with late evening and weekend hours.
During the next 3 years, nonfarm payrolls in the HMA are expected to increase by an average of 2,100 jobs, or 1.0 percent, annually, with job
Economic Conditions Continued

An
n A
rbo
r, M
I •
CO
MP
RE
HE
NS
IVE
HO
US
ING
MA
RK
ET
AN
ALY
SIS
6
growth higher in the first year and then slowing through the third year. The state government subsector and the professional and business services sector are expected to have the most
growth, because UM and UMMC are expanding facilities and because many of the announced job additions are in the professional and business services sector.
Population and Households
As of October 1, 2015, the population in the Ann Arbor
HMA is estimated to be 359,700, re- flecting a growth rate of 0.8 percent, or 2,700, annually since 2010 (Figure 4). From 2000 to 2005, population growth in the HMA averaged 3,675 people, or 1.1 percent, annually (Census Bureau population estimates, as of July 1).
Net in-migration averaged 1,300 people annually during this period, which accounted for 35 percent of population gains, despite fluctuating levels of employment. From 2005 to 2010, the population grew at a slower rate, with an average annual increase of 540, or 0.2 percent. Net out-migration averaged 1,525 people annually, coinciding with a decline in resident employment. A large portion of the out-migration occurred from 2007 to 2008, when 5,700 people moved out of the HMA. Closure of a Pfizer research facility, transferring employ-ees out of state, caused much of the out-migration. Since 2010, population growth has increased to 0.8 percent annually, with net in-migration accounting for more than 40 percent of recent growth (Figure 5). Young adults ages 20 to 24 and baby boomers ages 60 and older were the fastest growing age cohorts.
The population is expected to continue to grow during the forecast period because of an increasing number of jobs in high-technology industries, but it grew at a slower rate because of declining enrollment at EMU. The population of the HMA is expected to increase by an average annual rate of 2,400, or 0.7 percent, to 366,900, during the 3-year forecast period.
Figure 4. Population and Household Growth in the Ann Arbor HMA, 2000 to Forecast
Notes: The current date is October 1, 2015. The forecast date is October 1, 2018.Sources: 2000 and 2010—2000 Census and 2010 Census; current and forecast—estimates by analyst
Figure 5. Components of Population Change in the Ann Arbor HMA, 2000 to Forecast
Notes: The current date is October 1, 2015. The forecast date is October 1, 2018.Sources: 2000 and 2010—2000 Census and 2010 Census; current and forecast—estimates by analyst
Economic Conditions Continued
Population Households
3,000
2,500
2,000
1,500
1,000
500
02000 to 2010 2010 to current Current to forecast
Ave
rage
ann
ual c
hang
e
2,500
2,000
1,500
1,000
500
0
– 5002000 to 2010 2010 to current
Ave
rage
ann
ual c
hang
e
Net natural change
Current to forecast
Net migration

An
n A
rbo
r, M
I •
CO
MP
RE
HE
NS
IVE
HO
US
ING
MA
RK
ET
AN
ALY
SIS
7
Full-time student enrollment at UM and EMU combined is 55,200 students, of whom approximately 53,000 live within the HMA, account-ing for 25 percent of the renter households. Enrollment grew each year from academic year 2009–2010 through academic year 2013–2014, ranging from a high of 2,425 ad-ditional students in the fall of 2010 to a low of 100 additional students in the fall of 2013. Student enrollment declined by 1,150 in academic year 2014–2015, and preliminary data show an additional decline of 600 for academic year 2015–2016. Nearly the entire decline of the past 2 academic years occurred at EMU, a regional university, where 91 percent of the students are from Michigan and many are graduates of high schools within a 1-hour drive of the EMU campus. At UM, where overall enrollment has been stable for the past 4 years, at
43,600, enrollment of students most likely to move to the HMA and need housing (that is, out-of-state and inter-national students) has grown from 49 to 51 percent of total enrollment, a total increase of 1,225 students.
An estimated 145,000 households currently reside in the HMA, reflect-ing an annual increase of 1,425 households, or 1.0 percent, since 2010. By comparison, from 2000 to 2010, the number of households grew at the slightly slower rate of 0.9 percent, or 1,175 households, annually. Since 2000, the number of households has grown at a slightly faster rate than the population. An estimated 85,000 households cur-rently residing in the HMA, or 58.6 percent of all households, are homeowners, and the remaining 41.4 percent are renters (Figure 6). The homeownership rate declined from 60.9 percent in 2010 because of growth in student population and a shift in preferences. An average of 1,275 households, or 0.9 percent, are expected to be added annually during the next 3 years. The additional households are expected to be smaller, comprised mostly of young profes-sionals and empty nesters, because population in cohorts ages 20 to 24, ages 60 to 74, and ages 85 and older have been growing at a rate of more than 1 percent annually from 2010 to 2013, faster than the overall popula-tion growth rate of 0.9 percent for same period in the HMA.
Figure 6. Number of Households by Tenure in the Ann Arbor HMA, 2000 to Current
Note: The current date is October 1, 2015.Sources: 2000 and 2010—2000 Census and 2010 Census; current—estimates by analyst
Population and Households Continued
2000 2010 Current
Renter Owner
90,000
80,000
70,000
60,000
50,000
40,000
30,000
20,000
10,000
0

An
n A
rbo
r, M
I •
CO
MP
RE
HE
NS
IVE
HO
US
ING
MA
RK
ET
AN
ALY
SIS
8Housing Market Trends
Sales Market
Sales housing market conditions in the Ann Arbor HMA are currently tight, with an estimated vacancy rate of 1.2 percent, down from 2.1 percent in April 2010. The tightening is attributed to growth in higher wages and payroll stability, bringing new buyers into the market, combined with limited growth in homes avail-able for sale (Ann Arbor Realtors® Association).
During the 12 months ending June 2015 (the best representative data available), existing home sales, includ-ing single-family homes, townhomes, and condominiums, increased by 210, or 4 percent, to 5,150 homes sold (CoreLogic, Inc., with adjustments by the analyst), but the inventory of homes for sale has increased only 0.1 percent (National Association of Realtors®). Sales of existing homes averaged 6,125 homes per year from 2000 through 2004 as a result of growing resident employment and in-migration. Home sales began to decline in early 2005 and continued through 2009, decreasing an average of 10 percent annually, to a low of 3,725 in 2009, and coinciding with job losses and significant out-migration. From 2010 through 2013, home sales increased to an average of 4,350 homes annually.
The average home sales price for an existing home was $235,200 during the 12 months ending June 2015, up 7 percent from the previous 12 months, marking 5 consecutive years of increasing sales prices going back to 2010. In the HMA, sales prices were influenced by availability of homes sold through distressed sales (real estate owned [REO] and short sales). Average sales prices for
distressed sales were approximately $100,000 below average regular resale prices for the 12 months ending June 2015. From 2000 through 2006, sales prices of existing homes increased an average of 5 percent annually to an annual high of $243,000, with distressed sales accounting for less than 2 percent of all sales. Prices declined 15 percent annually from 2007 through 2009, to $167,400, while distressed sales increased from 15 to 43 percent of all sales. Since 2010, sales prices have increased 6 percent annually but remain 5 percent below the prerecession high in 2006, and distressed sales declined from 37 to 9 percent of all sales.
Effects of the national foreclosure crisis were less severe in the HMA compared with the rest of southeast-ern Michigan. The share of seriously delinquent loans (home loans 90 or more days delinquent or in foreclo-sure) or loans that had transitioned to REO status peaked at 5.7 percent in early 2010 (Black Knight Financial Services, Inc.). By comparison, seriously delinquent loans and REO properties in the adjacent Detroit-Warren-Dearborn, MI MSA peaked in 2010, at 12.7 percent. The share of seriously delinquent loans and REO properties in the HMA declined to 1.8 percent as of September 2015. This rate is lower than both the Michigan rate of 3.5 percent and the national rate of 4.2 percent. REO home sales in the HMA increased steadily in 2006 and 2007, growing from an annual average of 80 homes in early 2006 to 490 homes at the end of 2007. From 2008 through 2012, REO sales averaged 1,050 homes annually, or approximately 26 percent of all homes sold. REO sales have

An
n A
rbo
r, M
I •
CO
MP
RE
HE
NS
IVE
HO
US
ING
MA
RK
ET
AN
ALY
SIS
9
been steadily declining since 2013 and averaged 370 homes sold for the 12 months ending June 2015, or 7 per- cent of all sales. REO sales are still elevated compared with prerecession levels of less than 60 each year from 2000 through 2005, but with increas-ing payrolls and weekly wages up an average of $23, or 2.4 percent, an-nually from the first quarter of 2010 through the first quarter of 2015, and a change to a Michigan law resulting in a shorter foreclosure process in 2014, the number of REO sales are expected to continue to decline.
Sales of newly constructed homes, including single-family homes, townhomes, and condominiums, are down. During the 12 months ending June 2015, new home sales accounted for 7 percent of total home sales in the HMA, with approximately 360 new homes sold, a decline of 5 percent from the previous 12 months. New home sales averaged 1,450 annually from 2000 through 2005, accounting for 20 percent of all sales. From 2006 through 2009, new home sales declined an average of 43 percent annually, to a low of 140 new homes sold in 2009, as a result of job losses and out-migration. From 2010 through 2013, new home sales averaged 240 annually, up by 75 homes per year as a result of the increasing number of jobs and in-migration. Sales prices have been
rising since 2012, with the average price of a newly built home currently at $278,300, an increase of 7 percent during the past 12 months and aver-age annual growth of 8 percent since 2011. Home prices are still $6,000 below the prerecession high reached in June 2008.
Homebuilding activity, as measured by the number of single-family homes permitted, increased to 460 homes during the 12 months ending September 2015, up 65 homes, or 16 percent, from the previous 12 months (Southeast Michigan Council of Governments). New home construc-tion was strong from 2000 through 2004, averaging 1,800 single-family homes permitted each year (Figure 7). From 2005 through 2009, the number of single-family homes permitted de-clined by an average of 250 annually, reaching a low of 160 units permitted in 2009. Since early 2010, the number of single-family homes permitted has been increasing by an average of 45 per year. Townhomes and condo-miniums made up approximately 10 percent of all owner-occupied housing in 2000 and are currently estimated at 11 percent of owner-occupied housing. From 2006 through 2009, condominium construction accounted for an average of 460 units annually, or 50 percent of multifamily units permitted, but declined to an average of only 337 units, or 15 percent of multifamily units permitted, since 2010.
Most active subdivisions and lower-priced condominiums in the HMA are in townships near the city of Ann Arbor, and higher-priced condomin-ium projects are concentrated in the city center. The Westridge of Dexter subdivision, a 223-lot project with single-family homes ranging from
Figure 7. Single-Family Homes Permitted in the Ann Arbor HMA, 2000 to Current
Note: Current includes data through September 2015.Source: Southeast Michigan Council of Governments
Housing Market TrendsSales Market Continued
2000
2001
2002
2003
2004
2005
2006
2,000
1,500
1,000
500
0
2008
2009
2010
2011
2013
2015
2014
2012
2007

An
n A
rbo
r, M
I •
CO
MP
RE
HE
NS
IVE
HO
US
ING
MA
RK
ET
AN
ALY
SIS
10
$260,000 to $400,000 for a 1,400- to 2,800-square-foot home, is estimated to have more than 90 percent of its lots under contract. In Superior Township east of Ann Arbor, The Woodlands of Geddes Glen, a luxury home community with houses selling for $800,000 to $1,100,000, has 16 of 32 lots sold. Austin Commons II, outside the city of Saline, is a condominium
complex with 28 four-unit buildings, with prices starting at $125,000. Four condominium projects are under construction in downtown Ann Arbor: (1) 410 First, (2) Kerrytown Place/414 Main, (3) Kingsley West, and (4) The Mark, with 71 units total for the four developments. Prices range from $390,000 for a one-bedroom unit to $1.15 million for a three-bedroom unit.
During the 3-year forecast period, demand is expected for 2,450 new homes (Table 1), beginning with about 800 in the first year, increasing slightly during the second and third years. The 230 units currently under construction, 60 additional units in the pipeline, and a portion of the 3,025 other vacant units that may return to the market will satisfy a portion of the demand. Demand is expected to be greatest for homes priced at less than $350,000 (Table 4).
Table 4. Estimated Demand for New Market-Rate Sales Housing in the Ann Arbor HMA During the Forecast Period
Price Range ($) Units of PercentFrom To Demand of Total
125,000 149,999 240 10.0150,000 199,999 370 15.0200,000 249,999 390 16.0250,000 299,999 420 17.0300,000 349,999 490 20.0350,000 399,999 150 6.0400,000 449,999 150 6.0450,000 and higher 240 10.0
Notes: The 230 homes currently under construction and a portion of the estimated 3,025 other vacant units in the HMA will likely satisfy some of the forecast demand. The fore-cast period is October 1, 2015, to October 1, 2018.Source: Estimates by analyst
Rental MarketThe rental housing market in the Ann Arbor HMA is tight, with an overall estimated vacancy rate of 3.3 percent, down from 7.8 percent in April 2010 (Figure 8). Of renter-occupied housing in 2014, single-family homes accounted for approximately 25 percent, units in multifamily buildings accounted for 74 percent, and mobile
homes accounted for 1 percent. Apartment market conditions are also tight, with a 1.8-percent vacancy rate as of the third quarter of 2015, down from 2.5 percent in the third quarter of 2014 and a high of 6.8 percent in 2009 (Reis, Inc.). Asking rent is $1,044, up 4 percent from a year ago. Average rents are $824 for a studio unit, $909 for a one-bedroom unit, $1,110 for a two-bedroom unit, and $1,386 for a three-bedroom unit.
Students, who factor significantly in the housing market, comprise an estimated 25 percent of all renter households in the HMA. Approxi-mately 55,200 full-time students are enrolled at the two universities (UMMC enrollment is counted as part of UM student enrollment), of whom nearly 75 percent live in 14,700
Figure 8. Rental Vacancy Rates in the Ann Arbor HMA, 2000 to Current
Note: The current date is October 1, 2015.Sources: 2000 and 2010—2000 Census and 2010 Census; current—estimates by analyst
Housing Market TrendsSales Market Continued
2000 Current2010
4.2
3.3
7.88.0
7.0
6.0
5.0
4.0
3.0
2.0
1.0
0.0
An
n A
rbo
r, M
I •
CO
MP
RE
HE
NS
IVE
HO
US
ING
MA
RK
ET
AN
ALY
SIS
11
rental units in the private market in the HMA. Students are concentrated near their respective campuses, with UM students in Ann Arbor and EMU students in Ypsilanti. Local sources note that some UM students choose to live in Ypsilanti because of its lower rents. During the 2015–2016 academic year, UM opened two new dormitories: a 400-bed undergradu-ate dorm and a 650-bed graduate dorm, bringing the total UM student housing to 9,500 beds. EMU, with 3,500 beds, recently closed a 325-bed dorm for remodeling, with plans for reopening in the next 3 years.
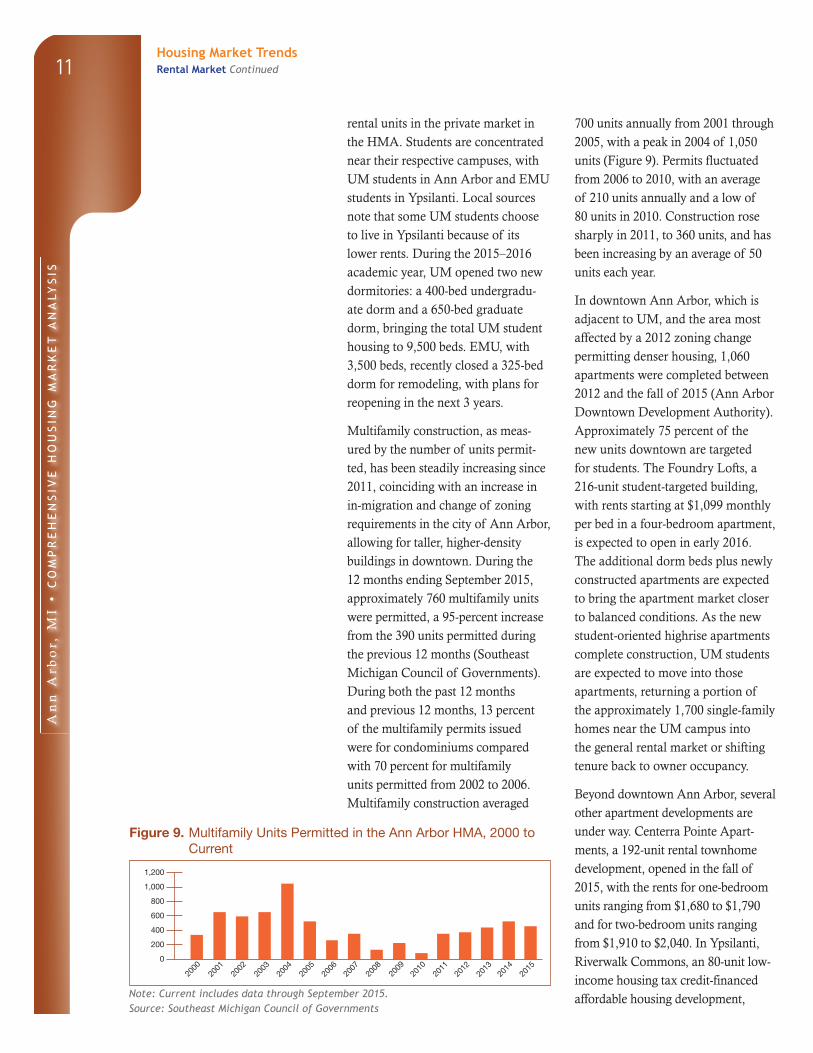
Multifamily construction, as meas-ured by the number of units permit-ted, has been steadily increasing since 2011, coinciding with an increase in in-migration and change of zoning requirements in the city of Ann Arbor, allowing for taller, higher-density buildings in downtown. During the 12 months ending September 2015, approximately 760 multifamily units were permitted, a 95-percent increase from the 390 units permitted during the previous 12 months (Southeast Michigan Council of Governments). During both the past 12 months and previous 12 months, 13 percent of the multifamily permits issued were for condominiums compared with 70 percent for multifamily units permitted from 2002 to 2006. Multifamily construction averaged
700 units annually from 2001 through 2005, with a peak in 2004 of 1,050 units (Figure 9). Permits fluctuated from 2006 to 2010, with an average of 210 units annually and a low of 80 units in 2010. Construction rose sharply in 2011, to 360 units, and has been increasing by an average of 50 units each year.
In downtown Ann Arbor, which is adjacent to UM, and the area most affected by a 2012 zoning change permitting denser housing, 1,060 apartments were completed between 2012 and the fall of 2015 (Ann Arbor Downtown Development Authority). Approximately 75 percent of the new units downtown are targeted for students. The Foundry Lofts, a 216-unit student-targeted building, with rents starting at $1,099 monthly per bed in a four-bedroom apartment, is expected to open in early 2016. The additional dorm beds plus newly constructed apartments are expected to bring the apartment market closer to balanced conditions. As the new student-oriented highrise apartments complete construction, UM students are expected to move into those apartments, returning a portion of the approximately 1,700 single-family homes near the UM campus into the general rental market or shifting tenure back to owner occupancy.
Beyond downtown Ann Arbor, several other apartment developments are under way. Centerra Pointe Apart-ments, a 192-unit rental townhome development, opened in the fall of 2015, with the rents for one-bedroom units ranging from $1,680 to $1,790 and for two-bedroom units ranging from $1,910 to $2,040. In Ypsilanti, Riverwalk Commons, an 80-unit low-income housing tax credit-financed affordable housing development,
Figure 9. Multifamily Units Permitted in the Ann Arbor HMA, 2000 to Current
Note: Current includes data through September 2015.Source: Southeast Michigan Council of Governments
Housing Market TrendsRental Market Continued
2000
2001
2002
2003
2004
2005
2006
1,200
1,000
800
600
400
200
0
2008
2009
2010
2011
2013
2015
2014
2012
2007
An
n A
rbo
r, M
I •
CO
MP
RE
HE
NS
IVE
HO
US
ING
MA
RK
ET
AN
ALY
SIS
12
targeted to low- and moderate-income households, which is part of a larger Water Street mixed-use redevelopment site, is expected to begin construction in late 2015 or early 2016. Rents will range from $655 for a studio unit to $1,022 for a four-bedroom unit.
Demand is expected for 1,850 ad-ditional market-rate apartment units during the 3-year forecast period, with
most of the demand being for one- and two-bedroom units (Table 5). The 820 units currently under construction (Table 1) and 360 units in planning are expected to meet all the demand in the first year and a portion of demand in the second year. Total demand is expected to increase slightly each year because of contin-ued job growth and in-migration.
Table 5. Estimated Demand for New Market-Rate Rental Housing in the Ann Arbor HMA During the Forecast Period
Zero Bedrooms One Bedroom Two Bedrooms Three or More Bedrooms
Monthly Gross Rent ($)
Units of Demand
Monthly Gross Rent ($)
Units of Demand
Monthly Gross Rent ($)
Units of Demand
Monthly Gross Rent ($)
Units of Demand
850 to 1,049 55 1,000 to 1,199 140 1,200 to 1,399 160 1,500 to 1,699 401,050 or more 35 1,200 to 1,399 140 1,400 to 1,599 120 1,700 or more 240
1,400 to 1,599 210 1,600 to 1,799 801,600 or more 210 1,800 to 1,999 200
2,000 or more 240Total 90 Total 680 Total 790 Total 280
Notes: Numbers may not add to totals because of rounding. Monthly rent does not include utilities or concessions. The 820 units currently under construction will likely satisfy some of the estimated demand. The forecast period is October 1, 2015, to October 1, 2018.Source: Estimates by analyst
Data Profile
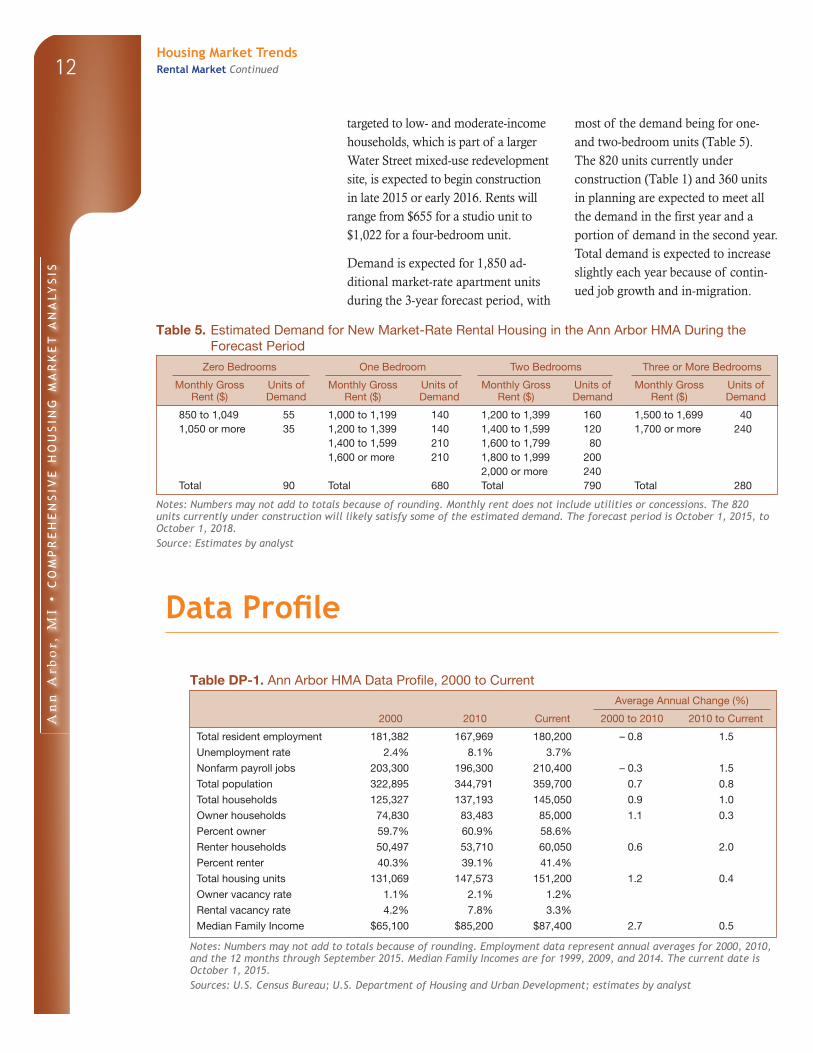
Table DP-1. Ann Arbor HMA Data Profile, 2000 to Current
Average Annual Change (%)
2000 2010 Current 2000 to 2010 2010 to Current
Total resident employment 181,382 167,969 180,200 – 0.8 1.5
Unemployment rate 2.4% 8.1% 3.7%
Nonfarm payroll jobs 203,300 196,300 210,400 – 0.3 1.5
Total population 322,895 344,791 359,700 0.7 0.8
Total households 125,327 137,193 145,050 0.9 1.0
Owner households 74,830 83,483 85,000 1.1 0.3
Percent owner 59.7% 60.9% 58.6%
Renter households 50,497 53,710 60,050 0.6 2.0
Percent renter 40.3% 39.1% 41.4%
Total housing units 131,069 147,573 151,200 1.2 0.4
Owner vacancy rate 1.1% 2.1% 1.2%
Rental vacancy rate 4.2% 7.8% 3.3%
Median Family Income $65,100 $85,200 $87,400 2.7 0.5
Notes: Numbers may not add to totals because of rounding. Employment data represent annual averages for 2000, 2010, and the 12 months through September 2015. Median Family Incomes are for 1999, 2009, and 2014. The current date is October 1, 2015.Sources: U.S. Census Bureau; U.S. Department of Housing and Urban Development; estimates by analyst
Housing Market TrendsRental Market Continued
An
n A
rbo
r, M
I •
CO
MP
RE
HE
NS
IVE
HO
US
ING
MA
RK
ET
AN
ALY
SIS
13
Data Definitions and Sources
2000: 4/1/2000—U.S. Decennial Census
2010: 4/1/2010—U.S. Decennial Census
Current date: 10/1/2015—Analyst’s estimates
Forecast period: 10/1/2015–10/1/2018—
Analyst’s estimates
The metropolitan statistical area definitions
in this report are based on the delineations
established by the Office of Management and
Budget (OMB) in the OMB Bulletin dated
February 28, 2013.
Demand: The demand estimates in the analysis
are not a forecast of building activity. They are
the estimates of the total housing production
needed to achieve a balanced market at the end
of the 3-year forecast period given conditions on
the as-of date of the analysis, growth, losses, and
excess vacancies. The estimates do not account
for units currently under construction or units in
the development pipeline.
Other Vacant Units: In the U.S. Department of
Housing and Urban Development’s (HUD’s)
analysis, other vacant units include all vacant
units that are not available for sale or for rent.
The term therefore includes units rented or sold
but not occupied; held for seasonal, recreational,
or occasional use; used by migrant workers; and
the category specified as “other” vacant by the
Census Bureau.
Building Permits: Building permits do not neces-
sarily reflect all residential building activity that
occurs in an HMA. Some units are constructed
or created without a building permit or are issued
a different type of building permit. For example,
some units classified as commercial structures
are not reflected in the residential building permits. As a
result, the analyst, through diligent fieldwork, makes an
estimate of this additional construction activity. Some of
these estimates are included in the discussions of single-
family and multifamily building permits.
For additional data pertaining to the housing market
for this HMA, go to huduser.gov/publications/pdf/
CMARtables_AnnArborMI_16.pdf.
Contact Information
Marissa Dolin, Economist
Chicago HUD Regional Office
312–913–8893
This analysis has been prepared for the assistance and
guidance of HUD in its operations. The factual informa-
tion, findings, and conclusions may also be useful to
builders, mortgagees, and others concerned with local
housing market conditions and trends. The analysis
does not purport to make determinations regarding the
acceptability of any mortgage insurance proposals that
may be under consideration by the Department.
The factual framework for this analysis follows the
guidelines and methods developed by HUD’s Economic
and Market Analysis Division. The analysis and findings
are as thorough and current as possible based on informa -
tion available on the as-of date from local and national
sources. As such, findings or conclusions may be modi-
fied by subsequent developments. HUD expresses its
appreciation to those industry sources and state and local
government officials who provided data and information
on local economic and housing market conditions.
For additional reports on other market areas, please go to huduser.gov/portal/ushmc/chma_archive.html.