Embed Size (px)
Citation preview


Anna Ruzik-Sierdzinska, Maciej Lis, Monika Potoczna, Michele Belloni, Claudia Villosio
CASE Network Reports No. 114 2
Materials published here have a working paper character. They can be subject to further publication. The views and opinions expressed here reflect the author(s) point of view and not necessarily those of CASE Network.
This report was prepared within a research project entitled NEUJOBS financed by the European Commission, under the 7th Framework Programme.
Keywords: Productivity, Age-Earning Profiles, Lifelong Learning
JEL codes: J24, J31
© CASE – Center for Social and Economic Research, Warsaw, 2012
Graphic Design: Agnieszka Natalia Bury
EAN 9788371785962
Publisher:
CASE-Center for Social and Economic Research on behalf of CASE Network
al. Jana Pawla II 61, office 212, 01-031 Warsaw, Poland
tel.: (48 22) 206 29 00, 828 61 33, fax: (48 22) 206 29 01
e-mail: [email protected]
http://www.case-research.eu

AGE AND PRODUCTIVITY. HUMAN CAPITAL ACCUMULATION AND…
CASE Network Reports No. 114 3
The CASE Network is a group of economic and social research centers in Poland, Kyrgyzstan, Ukraine, Georgia, Moldova, and Belarus. Organizations in the network regularly conduct joint research and advisory projects. The research covers a wide spectrum of economic and social issues, including economic effects of the European integration process, economic relations between the EU and CIS, monetary policy and euro-accession, innovation and competitiveness, and labour markets and social policy. The network aims to increase the range and quality of economic research and information available to policy-makers and civil society, and takes an active role in on-going debates on how to meet the economic challenges facing the EU, post-transition countries and the global economy.
The CASE network consists of:
CASE – Center for Social and Economic Research, Warsaw, est. 1991, www.case-research.eu
CASE – Center for Social and Economic Research – Kyrgyzstan, est. 1998, www.case.elcat.kg
Center for Social and Economic Research – CASE Ukraine, est. 1999, www.case-ukraine.kiev.ua
CASE –Transcaucasus Center for Social and Economic Research, est. 2000, www.case-transcaucasus.org.ge
Foundation for Social and Economic Research CASE Moldova, est. 2003, www.case.com.md
CASE Belarus – Center for Social and Economic Research Belarus, est. 2007, www.case-belarus.eu
Center for Social and Economic Research CASE Georgia, est. 2011

Anna Ruzik-Sierdzinska, Maciej Lis, Monika Potoczna, Michele Belloni, Claudia Villosio
CASE Network Reports No. 114 4
Contents
The authors ............................................................................................................ 5
Abstract .................................................................................................................. 7
1. Introduction ....................................................................................................... 8
2. Literature Review ............................................................................................ 10 2.1. Age and productivity ................................................................................ 10 2.2. Lifelong Learning ..................................................................................... 11
3. Analyses of Age-Earnings Profiles and Productivity for Selected EU Countries .............................................................................................................. 16
3.1. Age-Earnings Profiles, Employment and Institutions .............................. 16 3.2. Individual Career Paths ............................................................................ 32 3.3. Age-Earnings Profiles in Different Groups of Employees ....................... 58
4. Possibility of Improving Productivity at Older Ages via LLL .................... 71 4.1. Descriptive Analysis Based on SHARE and ELSA Databases ................ 72 4.2. Estimation Results of the Effect of LLL on Older Workers’ Wages .............. 81
5. Conclusions ...................................................................................................... 91
References............................................................................................................. 93

AGE AND PRODUCTIVITY. HUMAN CAPITAL ACCUMULATION AND…
CASE Network Reports No. 114 5
The authors
Anna Ruzik-Sierdzińska, Ph.D., works at the Warsaw School of Economics. She cooperated with CASE Foundation in various projects from the areas of social policy, pension systems and labour market. From September 2002 until March 2003 she was a Marie Curie Fellow at the Center for Economic Research (CentER) in Tilburg, NL.
Claudia Villosio is senior researcher of LABORatorio R. Revelli – Centre for Employment Studies (Turin, Italy) and member of the board of directors. She received the Master in Economics at Coripe Piemonte (1993) and the Degree in Economics at the University of Turin (1992). She specializes in labour migration and assimilation and economics of ageing. She participated in various research projects funded by the European Commission, EUROFOUND and by the Italian Ministry of Labour and Welfare Policies. She has also collaborated with ISFOL on the Monitoring of the implementation for Italy of the UNECE Regional Strategy of the Madrid international Plan of Action on Ageing. Her works have been published on different books and on national and international peer-reviewed journals such as Oxford Review of Economic Policy, International Labour Review, Journal of Labor Research, International Review of Applied Economics, Labour, Lavoro e Relazioni Industriali.
Michele Belloni, Ph.D., is post-doctoral researcher at the Department of Economics, University Ca’ Foscari of Venice. He is a fellow of the Network for Studies on Pensions, Aging and Retirement (NETSPAR, Tilburg University), the Center for Research on Pension and Welfare Policies (CeRP, Collegio Carlo Alberto) and a member of the Survey of Health, Ageing and Retirement in Europe (SHARE) working group. His research interests include Ageing, Health economics, Labor economics and Demography. He has published his works on international peer-reviewed Journals such as Labour Economics, Oxford Bulletin of Economics and Statistics, and The Geneve Papers on Risk and Insurance. He was teaching at the University of Turin, the Maastricht Graduate School of Governance and Social Security Financing at the International Training Center of the ILO. He participated in various research projects financed by the European Commission, NETSPAR, and the Italian Ministry of Labor.
Maciej Lis is a PhD Student at Warsaw School of Economics. He holds a position of Senior Economist at Institute for Structural Research. He is an author of publications in the fields of health economics, labour market, human capital and poverty. He specializes in micro-econometrics and panel data analysis.

Anna Ruzik-Sierdzinska, Maciej Lis, Monika Potoczna, Michele Belloni, Claudia Villosio
CASE Network Reports No. 114 6
Monika Potoczna holds BA in Economics and graduated Econometrics in 2013 from the University of Warsaw. She has worked for Institute for Structural Research since 2012, participating in projects: Employment in Poland 2011, Employment in Poland 2012, NEUJOBS – Employment 2025: How will multiple transitions affect the European labour market.

AGE AND PRODUCTIVITY. HUMAN CAPITAL ACCUMULATION AND…
CASE Network Reports No. 114 7
Abstract
This NEUJOBS research report focuses on links between age, productivity and lifelong learning. Various data sources (EU-SILC, LFS, Structure of Earnings Survey, SHARE, ELSA, SHARELIFE) and methodological approaches were used in this report.
Our analysis identifies clusters of countries with common characteristics of age-earnings profiles (for certain groups of employees) and allows for an explanation of those differences. Some differences can be attributed to the share of sectors, education types, and occupations in country-specific employment. Others are due to labour market institutions and the (dis)incentives to work at older ages provided by social security systems. Additionally, the dynamics of earnings after age 50 differ less between educational and occupational groups than at earlier ages. We show that the dynamics of average wages are strongly influenced by the timing of entering and leaving labour market. An estimation of the impact of LLL on productivity (measured by earnings) at older ages shows that for employees aged 50+, participation in training increases wages in the short-term.

Anna Ruzik-Sierdzinska, Maciej Lis, Monika Potoczna, Michele Belloni, Claudia Villosio
CASE Network Reports No. 114 8
1. Introduction
This report has been prepared as deliverable 17.2 for the NEUJOBS project by researchers from the Center for Socio-Economic Research (CASE) and the Institute of Structural Research (IBS), Poland, with input from (CeRP), Italy.
Due to ageing, the population structure of the labour force is changing. The demographic transition will especially affect the European labour market. Additionally, due to rapid technological change, labour markets in many countries require skill transition and lifelong learning to increase the possibility of work until older age. That makes it very important to analyse the impact of ageing on average participation rates or labour productivity and, consequently, on economic growth.
The general aim of this working paper is to analyse the links between age, labour productivity and human capital using various (mainly European) datasources and methods. The focus of the research was earnings in the life-cycle of individuals who are active in the labour market. We looked at age-earnings profiles and their connection to individual and employment characteristics, life-long learning, and labour market institutions. Different empirical approaches have been used in order to utilise information from various datasets in the best possible ways. We adopted the assumption that the observed wages of employees are correlated with their productivity, so they can be used as a proxy for productivity1.
After reviewing relevant literature in chapter 2, in chapter 3, we focus on age-earnings profiles and productivity for the EU countries.
Part 3.1 presents a comparison of age-earnings profiles in relation to age-employment structures, using cross section data from EU SILC. We check if the productivity losses postulated by the literature after age 50 affect the earnings profiles, and to what extent the average profiles are affected by the selectivity of retirement transition. We use non-parametric kernel estimators and semi-parametric regression models. The results show that the falling employment rate
1 Such an assumption should hold for at least certain types of professions. We are also aware about the possible pay-productivity gap at older ages but due to a lack of access to matched employer-employee data, such an analysis was not possible.

AGE AND PRODUCTIVITY. HUMAN CAPITAL ACCUMULATION AND…
CASE Network Reports No. 114 9
after qualifying for retirement benefits can hardly be attributed to decreasing personal productivity or earnings ability.
Part 3.2. uses data from the SHARELIFE retrospective survey on labour market careers in order to check the validity of the results obtained for individual careers. It turns out that the dynamics of the average wage are strongly influenced by the timing of entering and leaving the labour market. Additionally, technological and institutional change seems to influence the wage dynamics of subsequent cohorts. We have also found out that the dynamics of earnings after the age of 50 differ less between educational and occupational groups than earlier.
The aim of part 3.3 is to analyse the relative age-earnings profiles in EU countries. The individual Structure of Earnings Survey (SES) data were used to estimate age-monthly earnings profiles as a loglinear empirical wage models. We show how much earnings change with age and what is the age of maximum expected monthly earnings for full-time employees in different countries, education, types of professions and sectors.
Chapter 3 shows that European countries could be grouped into clusters distinguished on the basis of the employment rate in the 51-55 age groupand the average length of professional life. In separate clusters, certain similarities in age-earning profiles can be observed.
In chapter 4 we analyse lifelong learning and its potential to improve productivity at older ages. In this chapter, we use SHARE and ELSA datasets as a source of information on individual wages and participation in training activities. Estimated models suggest that the impact of training at older ages on wages may be sizable.
Understanding mechanisms governing change of age-earnings or age-productivity profiles helps to formulate appropriate advice for policymakers in order to adapt labour markets to an ageing workforce. Thus, in the conclusion, we discuss the policy implications of our results.

Anna Ruzik-Sierdzinska, Maciej Lis, Monika Potoczna, Michele Belloni, Claudia Villosio
CASE Network Reports No. 114 10
2. Literature Review
2.1. Age and productivity
Individual productivity is hard to measure directly and therefore the change of productivity in workers during their lifespan is not directly observable. What is more, the productivity of a worker does not depend only on his abilities and skills but also on the workplace characteristics. However, there are observable variables that signal intrinsic productivity. By change in intrinsic productivity, we understand the shifts that are driven by personal and not workplace-related traits. First, the general health status can be observed. Then, the ability to perform specific tasks (physical or intellectual) during a lifetime might be tested. Finally, the employment rates and earnings of various age groups and cohorts are measured through the use of social surveys. Neoclassical economics contends that wages mirror marginal productivity and apart from personal wealth and preferences, it is low productivity that pushes people out of work. There are also some studies that research firms’ productivity, trying to disentangle the effects of age structure on its workforce. In this part of the report, we overview the main conclusions from the enumerated strands of literature.
The literature on changes in ability to perform working tasks with age concludes that it rises in the first 10 years of working life due to general education and learning-by-doing and maxes out at about 30-35 years old. Then it becomes stable until around 50, when it starts declining. The process of declining productivity is rather slow and strongly depends on both personal and job characteristics (Göbel and Zwick 2009). The ability to work and the age interval of rapid depreciation varies greatly among workers depending on the type of tasks and human capital they possess. Some abilities like reading, vocabulary or ability to cooperate depreciate very slowly, whereas cognitive speed and memory activities are more prone to evaporate with age. Fitness levels (e. g. hand precision, body coordination) are lost most quickly (Verhaegen and Salhouse 1997, Waldman and Avolio 1986, Park et al. 1999, Maitland et al. 2000). This dimension of ageing is common not only to human beings but also to other primates (Minois and Bourg 1997). These processes might be partially offset by certain behaviours. Katzman (1993) argues that participating in educational courses increases synaptic density in the neocortical association cortex, and could therefore delay the onset of dementia by up to 4–5 years.

AGE AND PRODUCTIVITY. HUMAN CAPITAL ACCUMULATION AND…
CASE Network Reports No. 114 11
An important aspect of the loss of productivity is not only the loss of ability to perform tasks, but also the changing nature of the tasks, which speeds up the deterioration of competences (Keyfitz 1984, Autor et al. 2003). The more rapid the technological change, the faster competences become out-of-date. When this is combined with the loss of ability and motivation to gain new competences, accompanied by the shorter expected working time of older persons, then they become more prone to a loss in productivity, employment and earnings.
Wages do not precisely reflect the pattern of intrinsic productivity as in some types of jobs, the youngest workers are underpaid and the oldest are overpaid. This is a result of information asymmetry between employer and employee, which affects labour contracts in such a way, that it is optimal to underpay young workers and overpay those with more experience (Lazear 1979). However, with the use of an employer-employee dataset for the Netherlands, van Ours and Stoeldraijer (2010) found little evidence of age-related pay-productivity gap. Other empirical results on this phenomenon are not definitive (see Skirbekk 2008 for an overview).
Most studies dealing with age-productivity or age-earnings relation focus on one country on even one industry within a country, with the exception of the OECD 1998 report. Therefore any evidence on the relation between labour market institutions and the life-cycle dynamics of productivity and wages with relation to employment is rather scarce. We try to fill this gap in Chapter 3.
2.2. Lifelong Learning
Another interesting strand of literature is focused on the ability to maintain or increase productivity through education, especially lifelong learning. The concept of lifelong learning (LLL) was introduced during the 1970s. The OECD report entitled Recurrent Education: A Strategy for Lifelong Learning (OECD 1973) was one of the first official documents assessing the importance of LLL among the education policy priorities. Since then, the consensus on the importance of LLL for providing countries with the skills and competences necessary for maintaining and enhancing the competitiveness of the firms and the economy, and for reducing socioeconomic disparities within countries, has steadily grown among the international research and policy community and national policy makers (see e.g. OECD 1996, European Commission 2000).
In spite of its longstanding tradition, LLL is still a vague concept. The European Commission defines it as “all learning activity undertaken

Anna Ruzik-Sierdzinska, Maciej Lis, Monika Potoczna, Michele Belloni, Claudia Villosio
CASE Network Reports No. 114 12
throughout life, with the aim of improving knowledge, skills/competences and/or qualifications for personal, social and/or professional reasons” (European Commission 2001). LLL encompasses the traditional formal education system (schools, training institutions, universities, etc.), non-formal learning (structured on-the-job training) and informal learning (such as skills learned from family members or people in the community) (Sohnesen and Blom 2005, see also Badescu and Saisana 2008)2.
The effect of training on workers’ productivity: a review
Many studies analyse the effect of training on various labour market outcomes such as (un)employment (Bonnal et al. 1997, Gritz 1993, Dieckhoff 2007, Picchio and van Ours 2013, Crépon et al. 2007; Lechner et al. 2008), reintegration into work (Ok and Tergeist 2003, Dieckhoff 2007), career advancement (Dieckhoff 2007), early retirement (Kristensen 2012, de Luna et al. 2010, Montizaan et al. 2007), job satisfaction and perceived job security (Lang 2012). Much of the research attention has been devoted to studying the effects of training on workers’ productivity.
The theoretical foundations of the effects of training on workers’ productivity lie in the human capital theory (Becker 1964, 1993). According to this theory, expenditure on training and education should be considered an investment, since it is undertaken to increase personal incomes. An individual's decision to invest in training is based on a comparison of the net present value of the costs and benefits of such an investment. Individuals are assumed to invest in training during an initial period and to receive returns on the investment in subsequent periods. Workers pay for training by receiving a lower wage while being trained. Since training is thought to make workers more productive, workers collect the returns from their investment in later periods through higher marginal products and higher wages. Human capital models usually decompose training into specific training, which increases productivity in only one firm, and general training, which increases productivity in more than one firm. General training is financed by workers, and the workers receive all of the returns to this training. In contrast, employees and employers share both the costs and the returns of specific training.
2 Bengtsson (2009) claims that such a wide definition of LLL has contributed to preventing the efficient development and implementation of education policies which are alternative to the traditional front-end model. On average, in OECD countries, an individual can expect to receive 988 hours of instruction in non-formal education during his or her working life, 715 of which are instruction in job-related education. There is a huge heterogeneity across countries in the number of expected hours of non-formal education, with Nordic countries (DK, SW, FI, NO) being at the top of the ranking and southern and eastern EU countries (PL, TUR, HU, EL, IT) at the bottom (OECD 2011).
AGE AND PRODUCTIVITY. HUMAN CAPITAL ACCUMULATION AND…
CASE Network Reports No. 114 13
A lot of research efforts have been dedicated to empirically testing Becker’s theory.
One branch of the literature attempts to measure the effects on productivity directly, by modeling and estimating the firm production function. These studies commonly exploit information from linked employer-employee datasets or from a survey of firms which contains information on firms’ value added and/or turnover. Among them, it is worth mentioning Ichniowski et al. (1997), Black and Lynch (2001), Dearden et al., (2006), Göbel and Zwick (2010), and Heywood et al. (2010), which report a positive association between company training and productivity. The second branch of this literature evaluates the effect of training on productivity indirectly, by means of its effect on workers’ wages. It assumes that wages are a sufficient statistic for productivity (Dearden et al. 2006) and relies on the traditional neoclassical labour market model with perfectly competitive wages.
One of the first studies belonging to this second type of literature is by Lynch (1992), who estimated wage returns to training for the US, using the early waves of NLSY data (1981 and 1983). She shows that private-sector training plays a significant role in the determination of wages and causes a wage growth of 70 percent among young workers in the United States who do not graduate from college. Using more recent waves of the same dataset, a series of studies such as Loewenstein and Spletzer (1998), Parent (1999), Veum (1995) and Frazis and Loewenstein (2005) confirm Lynch’s findings and find training has a positive effect on wages in the US.
Similarly to the US, the positive effects of training on wages are commonly found in European countries. Nevertheless, the size of the estimated effect varies widely across countries and, for the same country, depends on the data and analytical methods used. An extended empirical literature on this topic exists for the UK. Booth (1991) finds high returns (11percent for men and 18 percent for women) of company training on UK workers’ earnings. Relying on different data and methods, however, Booth (1993) finds a much lower effect (1 percent). Using NCDS data, Blundell et al. (1996, 1999) find positive returns ranging from 3 percent to 6 percent depending on the method and sample used; similar results are finally obtained by Arulampalam and Booth (2001). Positive effects of training on wages have also been found for other European countries: Norway (1 percent increase; Schøne 2004), Switzerland (2 percent increase; Gerfin 2004), and Portugal (30 percent for men and 38 percent for women; Budria and Pereira 2007).
Results for Germany and France are less clear. Using the German GSOEP data, Pischke (2001) finds insignificant wage returns to training, while Mühler et al. (2007) report a significant effect of about 5 to 6 percent for general training and no effect

Anna Ruzik-Sierdzinska, Maciej Lis, Monika Potoczna, Michele Belloni, Claudia Villosio
CASE Network Reports No. 114 14
for firm-specific training. Kuckulenz and Zwick (2003) use data from the Qualification and Career Survey and show that internal training does not translate into higher earnings while external training does. Goux and Maurin (2000) find no significant wage effect of trained French workers; however this result is at odds with Fougère et al. (2001) who find positive returns to training for French job-switchers.
Cross-country comparisons of these results are not straightforward because of the different methods and models used, different specifications and also different definitions of training. A first comparative perspective is offered by the OECD (1999), according to which workers who have undergone further training have a higher level of hourly wages in Australia, Canada, Germany, Italy and Great Britain, whereas the effect of training is insignificant in the case of France and the Netherlands. Bassanini et al. (2007), using ECHP data, estimate a positive impact of training incidence on hourly earnings for all analysed countries, ranging from 3.7 percent for the Netherlands to 21.6 percent for Greece. Similar findings on the same data and countries are obtained by Ok and Tergeist (2003)3.
In a study presented in chapter 4, we focus on older workers. The incidence (and return) of training is often found to decrease with age (e.g. Booth 1991, Bassanini et al. 2007, D´Addio et al. 2010). This result is consistent with Becker’s human capital theory (Becker 1964), since older workers have a shorter working life to amortize investments in training and therefore have less incentive to participate (Warr and Fay, 2001). At the same time, personnel managers tend to have the perception that older employees are less able or willing to learn (Warr and Birdi 1998). Finally, some empirical studies argue that training is less effective for older than for younger employees (e.g. Zwick 2011).
In addition to age, wage returns to training are often found to be heterogeneous with respect to the individual characteristics of the trained employees such as gender, (formal) educational attainments, and professional background. For instance, Parent (2003) for Canada and Blundell et al. (1996) for the UK find lower returns for women than for men. The association between returns to training and returns to education is unclear. For example, Lynch (1992) for the US, Blundell et al. (1996) for the UK, and Kuckulenz and Zwick (2006) for Germany find that returns are higher for more educated workers than for less educated, while Long (2001) for Australia, Budria and Pereira (2007) for Portugal and OECD (1999)
3 When applying fixed effects, Bassanini et al. (2007) find returns to training which are sensibly lower and statistically significant only in Denmark, the UK, Italy, Greece, Finland, Portugal and Belgium.

AGE AND PRODUCTIVITY. HUMAN CAPITAL ACCUMULATION AND…
CASE Network Reports No. 114 15
for a variety of countries suggest the opposite4. Concerning returns heterogeneity with respect to professional background, Budria and Pereira (2007) e.g. report that experienced workers earn more from training than workers with less experience, especially in the private sector. On the contrary, Kuckulenz and Zwick (2006) for Germany find that returns to training are higher for job entrants than for tenured employees.
Returns to training are sometimes found to be higher for workers who switch to a different job than for workers who stay at the same job after having finished training (Loewenstein and Spletzer 1998, Booth and Bryan 2007). In line with what the human capital model predicts, the existence of differential returns between job-switchers and non-switchers crucially depends on the type of training: the latter profit more from internal training (Budria and Pereira 2007), whereas the former gain more from external and general training. Kuckulenz and Zwick (2003) for Germany report that employees with a permanent job contract benefit from higher training returns than those employed on a temporary basis.
Finally, it is debatable whether the amount of training (i.e. number of episodes of training throughout the working life, length of the courses, etc.) affects returns. The evidence is, once again, mixed. Booth and Bryan (2007) find that wages increase with the number of training courses. In contrast, Arulampalam and Booth (2001) only find significant returns to incidence, while the number of training courses is insignificant. Franzis and Loewenstein (2005) report that the wage return to an extra hour of training diminishes rapidly with the amount of training received.
4 It has been stressed that the association between returns to education and returns to training may give rise to important equity issues. For example, if the returns to training are higher for the less educated, then policies targeted at increasing the program participation of less educated individuals can reduce income inequality; this is especially important if returns to education are high. On average, in OECD countries, individuals with a tertiary education will receive three times as many hours of instruction in non-formal education as those with low levels of education (OECD 2011).

Anna Ruzik-Sierdzinska, Maciej Lis, Monika Potoczna, Michele Belloni, Claudia Villosio
CASE Network Reports No. 114 16
3. Analyses of Age-Earnings Profiles and Productivity for Selected EU Countries
3.1. Age-Earnings Profiles, Employment and Institutions
The aim of this part of the report is to present a comparison of age-earnings profiles in various European countries in relation to age-employment structures. We use cross section data, taking into account the limits of such an analysis compared to a longitudal approach. We check if the universal individual productivity losses after age of 50 as postulated by the literature affect the earnings profiles in various countries, and to what extent the average age-earnings profiles are affected by the selectivity of the transition to retirement.
This work adds to the existing results by presenting a cross-country comparison of hourly wages by yearly age, trying to take into consideration the general and specific human capital. In most of the available results, the age-earnings profiles are presented in 5-10-year age groups, with the oldest being 65+. That makes it impossible to draw any conclusions about the earnings of the oldest workers. What is more, the presented results are not restricted to wages, but all labour related earnings are taken into consideration. The analysis sheds light on the interaction between the employment and productivity profiles among European countries.
We show that there are significant differences in the age-wage patterns across countries which can hardly be attributed to changes in ability to perform certain tasks with age. The regression results let us ascribe most of the differences in the behaviour of average hourly earnings to the changes in the working force structure. The decline of hourly wages is smallest in countries with the longest working life and with the lowest retirement replacement rate, indicating that the construction of pension entitlements strongly affects not only employment, but also the wage structure of the population. Additionally, our work delivers some evidence in favour of moving the retirement age to 65-75 years as we did not find proof of significant losses of hourly wages in that lifespan.

AGE AND PRODUCTIVITY. HUMAN CAPITAL ACCUMULATION AND…
CASE Network Reports No. 114 17
Data description
EU-SILC is a harmonized household income survey run in 29 European countries delivering reliable data on labour income, working time and job-related characteristics, that is comparable among countries. Income is reported for the whole previous year. It includes all sources of personal and household income, with a distinction for wages and self-employment, as well as the earnings structure (wage, taxes, social system contribution). In practice, however, the data on gross earnings are available for the biggest sample for most countries and therefore we decided to use gross earnings. The results from surveys from the years 2004-2009 (earnings from 2003-2008) are pooled together, previously normalized with the mean hourly earnings for given country. The hourly earnings are based on the variables indicating gross yearly earnings (from self-employment and wage labour), number of months in work, and usual number of hours worked per week. Due to unreliable data for the number of months spent working, especially for youngsters in Iceland and the UK, the sample was cut to only those working the whole year. The results do not change without this restriction. Taking these remarks into consideration, we test the results after excluding the controversial country/years observation. We have also excluded Malta from the analysis. To remove outliers, one percent of the highest and lowest earners were excluded. As a result, we obtain the relative hourly earnings for every person, with 1 indicating average hourly earnings in the country.
Table 1. Number of observations of hourly earnings for every country and every year
Country 2004 2005 2006 2007 2008 2009 Total AT 4 499 5 326 6 070 6 870 5 708 5 629 34 102 BE 4 684 4 430 5 306 5 907 5 913 5 649 31 889 BG - - - 4 042 4 656 5 994 14 692 CY - 4 728 4 647 4 453 4 238 3 773 21 839 CZ - 4 341 7 328 9 581 11 359 9 735 42 344 DE - 11 132 12 374 12 611 11 750 11 683 59 550 DK 7 844 7 062 6 835 6 936 6 859 3 331 38 867 EE 4 332 4 738 6 620 6 162 5 668 5 372 32 892 ES - - 12 465 13 023 13 374 12 061 50 923 FI 12 499 12 556 11 942 12 514 12 225 - 61 736 FR 9 378 9 212 9 390 9 957 9 935 9 844 57 716 GR - - - 5 423 6 238 - 11 661 HU - 6 201 6 866 7 995 7 941 8 374 37 377 IE 5 055 5 597 5 209 4 913 4 370 4 111 29 255 IS 4 465 4 569 4 570 4 799 4 893 - 23 296 IT - - - 19 281 19 051 18 190 56 522 LT - 4 590 4 729 5 262 4 997 4 921 24 499 LU 3 775 3 921 4 232 4 417 4 376 4 583 25 304

Anna Ruzik-Sierdzinska, Maciej Lis, Monika Potoczna, Michele Belloni, Claudia Villosio
CASE Network Reports No. 114 18
Country 2004 2005 2006 2007 2008 2009 Total LV - - - 4 505 5 367 5 180 15 052 NL - 9 321 10 010 11 459 11 375 5 496 47 661 NO 7 565 7 375 6 862 6 996 6 680 - 35 478 PL - 14 349 14 171 13 880 13 847 12 352 68 599 PT 396 320 281 4 234 4 184 4 305 13 720 RO - - - 7 226 6 764 6 391 20 381 SE 6 146 6 371 7 328 8 186 8 622 - 36 653 SI - 10 882 12 970 12 010 12 363 12 606 60 831 SK - 6 338 6 328 6 476 7 398 7 115 33 655 UK - 9 798 9 321 8 807 8 139 6 961 43 026 Total 70 638 153 157 175 854 227 925 228 290 177 084 1 032 948
Source: own calculations based on EU-SILC 2004-2009.
In the final sample, there were almost 3.1 Mio observations of people over 15 years old, and over 1 Mio observations of earners. Their distribution among years-countries is presented in Table 1. There are differences in the year-country composition of the sample, but we do not expect it to influence the results. However, we check it by adding year-dummies to the regressions.
Methods
We use the non-parametric kernel estimators and semi-parametric regression models, that best enable us to show the hourly earnings profiles. Every model is estimated separately for every country. The kernel estimators are well-suited for checking the continuous relation between age and earnings without a need for any functional form assumption. To deepen the analysis, the semi-parametric regression models are estimated. In the semi-parametric approach, an assumption about functional relations among some variables are made, but the key relation between age and earnings remains free from functional assumptions. Therefore, we can present the changes in the smooth wage-earnings profile after factoring out some variables. In all specifications, we choose the Epanechnikov kernel with degree 0 (mean smoothing), and the bandwidth is chosen based on the ROT method for asymptotically optimal constant bandwidth (Fan and Gijbels 1996). The semi-parametric estimator is double residual Robinson’s (1988) estimator.
Employment profiles and clusters of countries
The actual loss in productivity and the ability to work at older ages manifests itself on the extensive side – quitting employment - as well as on the intensive side: shortening the working hours and reducing the hour wage rate. They all mirror the loss of productivity, ability, and motivation to work as well as labour

AGE AND PRODUCTIVITY. HUMAN CAPITAL ACCUMULATION AND…
CASE Network Reports No. 114 19
market institutions arrangements in the country, including common beliefs, laws, and political institutions. Therefore, we first present the age-employment profiles to groups of countries with similar patterns. We expect that the employment rates in the age groups contain most of the information on important dimensions of labour market institutions.
The differences among countries in age-employment profiles obtained a great deal of attention in the economic and sociological literature. The older part of the profile was studied by Riedel and Hofer (2012), who show the determinants of the transitions from work to retirement. On the contrary, we focus our analysis on the effects of the employment rates on earnings profiles. We start by presenting a comparison of the employment rates based on a kernel estimator for one-year age groups from EU-SILC 2005-2008, with the official employment rates calculated using the LFS in 5 year age groups for the year 2008, as LFS is the source for official employment rate reporting (see Figure 1).

Anna Ruzik-Sierdzinska, Maciej Lis, Monika Potoczna, Michele Belloni, Claudia Villosio
CASE Network Reports No. 114 20
Figure 1. Employment rates in European countries based on different definitions from EU-SILC and EU-LFS data
0.5
10
.51
0.5
10
.51
0.5
10
.51
0.5
1
15 25 35 45 55 65 75 15 25 35 45 55 65 75 15 25 35 45 55 65 75 15 25 35 45 55 65 75
AT BE BG CY
CZ DE DK EE
ES FI FR GR
HU IE IS IT
LT LU LV NL
NO PL PT RO
SE SI SK UK
EU-SILC - labour income LFS
EU-SILC - declared state
empl
oym
ent
rat
e
age
Source: Own calculation based on EU-SILC 2006-2009 and EU-LFS 2008. Notes: The LFS employment rate for every 5-year age group is presented for the mean
age of the group (e. g. 23) and the points connected. For EU-SILC, all employment rates
for a single cohort are calculated using a kernel estimator.

AGE AND PRODUCTIVITY. HUMAN CAPITAL ACCUMULATION AND…
CASE Network Reports No. 114 21
The general pattern of employment rates across age groups is the following. It starts with low levels of around 20% for the 15-19 age group and grows to about 80% for 25-55, only to drop below 20% at about 65 years old. Despite the differences among datasets, it seems that the EU-SILC shows very similar employment patterns to the LFS, even though there are some differences in the definition of employment. LFS define an employed person as someone who worked in a paid job for at least 1 hour in the week prior to the survey. On the contrary, based on EU-SILC, we define an employed person as someone whose main declared state for at least six months last year was employment or someone who earned anything from employment in the previous year. The differences in definitions manifest themselves in employment rates in age groups, but general differences among countries remain similar. EU-SILC seems to lower the employment rates for people below 30 in Austria, Germany, Denmark and to move down the entire profile for Ireland, Poland and United Kingdom, especially when it is based on earnings. It indicates a larger share of people working only for part of the year than in other countries. For some countries, the LFS and labour earnings employment rates are more similar (UK, Iceland), but generally the EU-SILC employment rates are more similar to each other than to the LFS one. It indicates that the differences might come from differences between the surveys and taking LFS from only 2008, whereas EU-SILC is taken from 2003-2008.
There are some interesting outliers in the employment rates with relation to the average ones. In Denmark, Norway, Sweden, Iceland and the United Kingdom, the whole employment profile lies over the mean for all countries. Despite their institutional differences, these countries seem to be the best examples of effective activation policies, especially among people 45+. On the other side of the spectrum are countries where the generally low level of employment is magnified in older age groups, such as Poland or Hungary. They are characterized by very low levels of effective retirement age, especially among women.

Anna Ruzik-Sierdzinska, Maciej Lis, Monika Potoczna, Michele Belloni, Claudia Villosio
CASE Network Reports No. 114 22
Figure 2. Employment rates by age for European countries against the mean employment rate for all countries
0.5
10
.51
0.5
10
.51
0.5
10
.51
0.5
10
.51
0.5
1
15 25 35 45 55 65 75 15 25 35 45 55 65 75
15 25 35 45 55 65 75 15 25 35 45 55 65 75
High-short:, AT High-short:, BG High-short:, CZ High-short:, FR
High-short:, SK
Low-long:, CY Low-long:, ES Low-long:, GR Low-long:, IE
Low-long:, LT Low-long:, PT Low-long:, RO
Low-short:, BE Low-short:, HU Low-short:, IT Low-short:, LU
Low-short:, PL Low-short:, SI
High-long:, DE High-long:, DK High-long:, EE High-long:, FI
High-long:, IS High-long:, LV High-long:, NL High-long:, NO
High-long:, SE High-long:, UK
ER for specific country
Mean ER for all countries
empl
oym
ent
rat
e
age
Source: Own calculation, EU-SILC 2006-2009.
Notes: EU-SILC employment rate definition - at least 6 months in employment.

AGE AND PRODUCTIVITY. HUMAN CAPITAL ACCUMULATION AND…
CASE Network Reports No. 114 23
To sum up the analysis of employment rates, we conducted a cluster analysis based on the LFS employment rates of 50+ year old, which creates a framework for further analysis. With the use of LFS employment rates for 5-year age groups from 50 years old, four groups of countries can be distinguished. The clusters of countries are best characterized in two dimensions: the employment rate at 51-55 years and the average length of employment. The first group (Austria, France, Czech Republic, Slovakia and Bulgaria) is called “high-short” because it contains countries with high employment rates of 50 year olds though not necessarily throughout the whole prime age, but the employment rate falls rapidly with age afterwards. On the contrary, in the second group, entitled “low long” (Ireland, Cyprus, Portugal, Spain, Greece, Lithuania, Romania), employment is not so high at the prime age, but it remains quite high after age 50. Countries with the weakest labour market are named “low-short” (Belgium, Luxemburg, Italy, Hungary, Slovenia, Poland) as they have low employment rates which drop quickly after age 50. The final group of countries with the healthiest labour markets is characterized by high employment rates at all ages and is named “high-long” (Norway, Sweden, Finland, Netherlands, Denmark, Germany, Latvia, Estonia, Iceland, United Kingdom – see Figure 3). We will stick to these clusters in further analysis because they are more informative in the context of age-earnings than the traditional institutional classifications such as North, Central-East, South, Continental or Liberal (e.g. Ebbinghaus and Whiteside 2012).
Figure 3. Employment rates by cluster
0.5
10
.51
15 20 25 30 35 40 45 50 55 60 65 70 15 20 25 30 35 40 45 50 55 60 65 70
High-short employment Low-long employment
Low-short employment High-long employment
emp
loym
ent r
ate
age
Source: Own calculation, EU-LFS 2008.
Remarks: Dot stands for particular countries, line represents unweighted mean
of employment rates for all countries.

Anna Ruzik-Sierdzinska, Maciej Lis, Monika Potoczna, Michele Belloni, Claudia Villosio
CASE Network Reports No. 114 24
There is some controversial classification among the countries in the clusters. In Belgium and Slovenia, the employment rates at the prime age are similar to the average of all countries, but as they start to drop before 50, we classify these countries in the Low-short group and not in the High-short group. In Romania, employment rates start to go down before fifty but remain high after 65 and therefore it is classified as low-long and not low-short. To be sure that the final results are not attributed to these decisions, we check if these cases affect the final results.
Differences among countries in the age-employment profiles for people below 45 are commonly attributed to the variety of labour market institutions and cultural differences for cohorts older than 50 are mostly ascribed to the construction of the pension system. The younger people are entitled to retirement benefits, the earlier they leave the labour market and the employment rate drops (Blöndal and Scarpetta 1999).
Figure 4. Mean employment rates in clusters by age group
0.2
.4.6
.8em
plo
ymen
t rat
e
15 20 25 30 35 40 45 50 55 60 65 70age
High-long employment High-short employmentLow-short employment Low-long employment
Source: Own calculation, EU-LFS 2008.
Remarks: The profiles for a cluster obtained by averaging the profile for all countries
from given cluster.
Age-hourly earnings profiles
The employment rates at older ages and working time affect average wages. If older people work part-time, combining retirement and social benefits with labour income, one can expect a loss in monthly wages. As this phenomenon

AGE AND PRODUCTIVITY. HUMAN CAPITAL ACCUMULATION AND…
CASE Network Reports No. 114 25
is quite well documented (O’Reilly and Fagan 1998), we focus our attention strictly on hourly wages which should not be affected by working time. It is however susceptible to be influenced by the average across the population. Leaving employment is not a purely random process. On the one hand, the least productive persons may leave first, turning the average wage to racket. On the other hand, low-paid workers may have the lowest retirement benefits and therefore may be forced to work longer than better paid persons with higher benefits and savings. Finally, various abilities depreciate at different rates which might also make the labour-retirement transition not random. To control these factors, we show not only average age-wage profiles, but we also run a semi-parametric regression to control for such characteristics as education, occupation and sex.
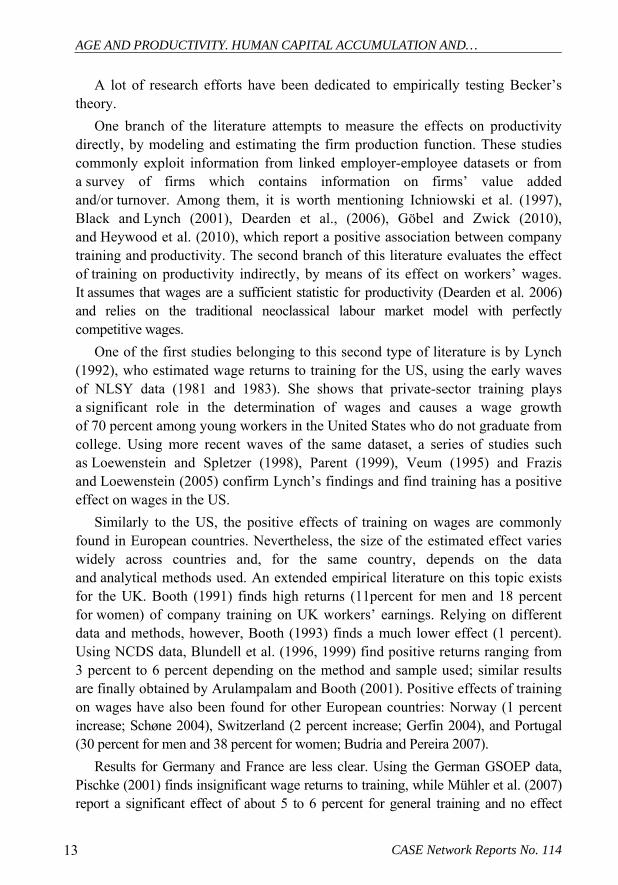
The average hourly earnings-age profiles are quite similar among countries. They double to triple from 15 to 35 years of age, partly due to higher educated people entering the labour market after age of 20, then they become flat with a slight downturn after 50 or 60 years. It is hard to say much about earnings after age 70, as for most countries, due to the drop in the sample size (employment rates are less than 10%) and growth in variance, the standard error becomes too big to draw any conclusions.
There are some countries in which earning patterns behave strangely. In Luxemburg, the profile is much steeper than average with the top at around 60. It may however reflect the true behaviour of earnings, as the Luxemburg economy structure differs vastly from that of other countries; it is just one big city with a huge financial sector and many affluent residents. In Romania it is quite the opposite; the profile plunges after 60 with quite high employment rates after that time indicating many elderly people working. We attribute this effect to low retirements benefits and a huge and low productive agricultural sector in which elderly workers are concentrated (Roman and Roman 2002, OECD 2008). It is hard to find an explanation for the top at 25 years and then the steep drop in earnings afterwards in Latvia and Estonia (see Figure 5). It could be that these are small post-communist countries with a high premium for people with qualifications that are more adequate to the technology-based market economy, than for workers with qualifications better suited to the past economy. It is therefore a consequence of the interaction of age and technological progress in these countries. Taking the above points into account, we check our results by excluding the questionable countries from the sample.
Anna Ruzik-Sierdzinska, Maciej Lis, Monika Potoczna, Michele Belloni, Claudia Villosio
CASE Network Reports No. 114 26
Figure 5. Hourly earnings by age in European countries .5
11.
5.5
11.
5.5
11.
5.5
11.
5.5
11.
5.5
11.
5.5
11.
5.5
11.
5.5
11.
5
20 30 40 50 60 70 80 20 30 40 50 60 70 80
20 30 40 50 60 70 80 20 30 40 50 60 70 80
High-short, AT High-short, BG High-short, CZ High-short, FR
High-short, SK
Low-long, CY Low-long, ES Low-long, GR Low-long, IE
Low-long, LT Low-long, PT Low-long, RO
Low-short, BE Low-short, HU Low-short, IT Low-short, LU
Low-short, PL Low-short, SI
High-long, DE High-long, DK High-long, EE High-long, FI
High-long, IS High-long, LV High-long, NL High-long, NO
High-long, SE High-long, UK
HE for specific country conf. int.
Mean HE for all countries
hour
ly e
arni
ngs
age
Source: Own calculation, EU-SILC 2004-2009.
Notes: Hourly earnings are normalized so that the mean hourly earnings equals 1 for every
country, 95% confidence interval.

AGE AND PRODUCTIVITY. HUMAN CAPITAL ACCUMULATION AND…
CASE Network Reports No. 114 27
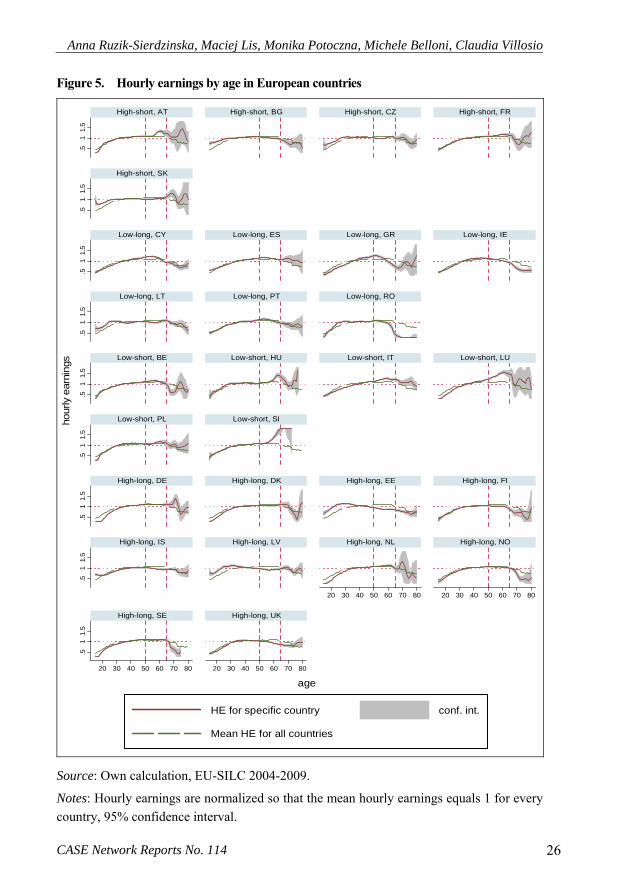
Averaging the profiles within clusters reveals the relation between employment and earnings age patterns. For the countries with the healthiest labour market (high employment rates, long employment), hourly productivity profiles are flattest, and between 35 and 67 years almost do not change. On the contrary, for all remaining clusters, there are quite interesting dynamics after 45. In low-long countries, there is no flat interval in the whole profile; the peak of average earnings comes at 50 and then drops afterwards quickly. In countries with low-short employment, the average hourly wages start to grow at about 50 years old and top at sixty and then drop sharply after 65. The profile for countries with a high-short employment pattern combines features of high-long and low-short countries. It is flat until age 55 as in high-long countries, and then it resembles the low-short countries as it grows until 60 and then drops.
We attribute the dynamics of the hourly earnings at 50-65 mainly to averaging effects for the following reasons:
The drop in employment rates is the most prevailing phenomenon in that lifespan on the labour market.
A jump in wages in the late fifties does not correspond to any convincing theory of wage determination.
The individual life-cycle earnings profiles do not show any hump-shapes in this part of life (see section 3.2 for details).
The following regression results flatten the profiles, especially at that age.
Sticking to averaging effects leads to the conclusion that in high-long employment countries, the transitions to retirement are evenly distributed across workers and these transitions are quite smooth. The drop in earnings around age 70 takes place due to the drop in personal productivity and because only those with very low retirement benefits or capital income remain employed. The argument for that is that the employment rate at age 70 exceeds 10 percent only in countries with quite liberal pension systems – with either low replacement rates (Estonia, Latvia, United Kingdom) or a high effective retirement age (Romania, Portugal). Furthermore, earnings start to drop quite steeply after 70, which should, however, be treated with caution due to the small samples (see Figure 6).
In countries with high-short and low-short employment patterns, the growth in average hourly wages reflects the pattern of low-paid workers leaving the labour market prematurely. In such systems, the availability of early retirement benefits or social aid discourages lower-paid workers from working, as the replacement rate for them is high compared to higher paid workers. The average replacement rate for countries with short employment is around 53%, whereas in countries with long employment it is around 45%. Unfortunately,
Anna Ruzik-Sierdzinska, Maciej Lis, Monika Potoczna, Michele Belloni, Claudia Villosio
CASE Network Reports No. 114 28
the OECD reports only the average replacement rate and does not report the replacement rate by age or wage-decile. Additionally the effective age of retirement for short employment countries is about 60 and for long employment it is almost 655. Therefore we argue that the rising average hourly earnings before age 60 are a result of acquiring the right to benefits at a younger age and higher replacement rates in these countries6.
The profile for low-long countries presents a similar story. The effect of prematurely leaving employment starts earlier and the loss of average productivity after age 60 is deeper than in other countries. Although the employment rates after 65 are quite high, among those who remain in employment, lower paid workers dominate. In effect, the average hourly earnings drop below the mean before 65, the earliest among all clusters of countries.
Figure 6. Mean hourly earnings profiles for clusters: all countries included (upper plot) and excluding outliers in respect to the classification to employment clusters - Belgium, Slovenia, Romania (lower left plot) and in respect to specific productivity profiles - Estonia, Latvia, Luxemburg, Romania, Slovenia (lower right plot)
.4.7
11.
3ho
urly
ea
rnin
gs
20 30 40 50 60 70 80age
High-long employment High-short employment
Low-short employment Low-long employment
Source: Own calculation, EU-SILC.
To check the results presented above, we factor out the observable characteristics of workers running semi-parametric regressions for each country for workers at age 50+. We want to differentiate between general and specific human capital. Therefore we first include the variables reflecting general human capital (sex, education, occupation) and specific aspects (experience, job change in the previous year). We present the results for every country (Figure 7) but for analytical purposes the profiles for every cluster are averaged (Figure 8).
5 OECD, 2008. 6 Eurostat, 2008.

AGE AND PRODUCTIVITY. HUMAN CAPITAL ACCUMULATION AND…
CASE Network Reports No. 114 29
Figure 7. Hourly earnings by age and countries – semi-parametric regression results .5
11.
5.5
11.
5.5
11.
5.5
11.
5.5
11.
5.5
11.
5.5
11.
5.5
11.
5.5
11.
5
50 55 60 65 70 75 80 50 55 60 65 70 75 80
50 55 60 65 70 75 80 50 55 60 65 70 75 80
High-short, AT High-short, BG High-short, CZ High-short, FR
High-short, SK
Low-long, CY Low-long, ES Low-long, GR Low-long, IE
Low-long, LT Low-long, PT Low-long, RO
Low-short, BE Low-short, HU Low-short, IT Low-short, LU
Low-short, PL Low-short, SI
High-long, DE High-long, DK High-long, EE High-long, FI
High-long, IS High-long, LV High-long, NL High-long, NO
High-long, SE High-long, UK
conf. int. factoring out: sex, education, occupation
raw factoring out also: experience, job change
hour
ly e
arni
ngs
age
Source: Own calculation, EU-SILC. Notes: Occupation groups gathered in four groups: highly skilled non-manual, lower
skilled non-manual, skilled manual, elementary occupation (Whelan, Maitre and Nolan,
2011). Including experience and job change was not possible for some countries due to data quality. Confidence interval for regression with sex, education and occupation.

Anna Ruzik-Sierdzinska, Maciej Lis, Monika Potoczna, Michele Belloni, Claudia Villosio
CASE Network Reports No. 114 30
The results for specific clusters differ greatly. For high-long countries, the profiles do not change when the characteristics are taken into account whereas for all other clusters, the results differ significantly. The effect of factoring out sex, education and occupation generally influences the patterns much more than further including general experience and recent job change. Taking into account all characteristics flattens the earning profiles in all clusters. In high-short and low-short countries, the hump-shape noticed after 50 years almost disappears and the resulting profiles become much more alike among clusters. In low-short employment countries, there still seems to be a more important drop in hourly earnings after ending 65 years.
Romania delivers a great example of the strength of averaging effects. Quite a high level of employment after age 60 leads to a drop in average earnings by about 70%, but when taking into account sex, education and occupation, this drop is reduced to just 20%. This confirms the previous result, that a high employment rate for older persons in Romania can be attributed to low-qualified persons leaving employment due to the lack of retirement benefits.
Figure 8. The effects of factoring out general and specific human capital for hourly earnings-age profiles by clusters
.51
1.5
.51
1.5
50 55 60 65 70 75 80 50 55 60 65 70 75 80
High-short Low-long
Low-short High-long
factoring out: sex, education, occupation raw earningsfactoring out also: experience, job change
hour
ly e
arn
ings
age
Source: Own calculation, EU-SILC.

AGE AND PRODUCTIVITY. HUMAN CAPITAL ACCUMULATION AND…
CASE Network Reports No. 114 31
Figure 9. Hourly earnings after factoring out sex, education and occupation averaged for clusters, age group 50+
.6.8
11.
2ho
urly
ear
nin
gs
50 55 60 65 70 75 80age
High-short Low-longLow-short High-long
Source: Own calculation, EU-SILC.
Conclusions
The comparison of only employment rates among countries shows that there are huge differences in labour market participation at all ages and there is lot of space for increasing the employment levels in some countries, especially at older ages. There are also huge drops in employment rates when people become eligible for retirement benefits. As the literature shows, the quick decline in the employment rate does not correspond with a loss of ability to perform work-related tasks. Therefore the retirement age seems to artificially shorten the working life of individuals in all countries, but these phenomena do vary greatly among countries.
The decline in the hourly earnings of older persons is smallest in countries with the highest employment rates in all age groups and it rises in importance after 70 years of age. Most of the dynamics of the average wage can be attributed to changes in the labour force structure and not to personal productivity changes. Combining evidence for quite a large group of countries (28) enables us to observe that countries with higher employments rates after 60 do not show any quicker decline in wages than countries with a lower employment rate of older persons. This would be the case if the personal productivity dropped quickly afterwards. Therefore we can conclude that the falling employment rates at the age when one qualifies for retirement benefits can hardly be attributed to a drop in personal productivity or earning ability.

Anna Ruzik-Sierdzinska, Maciej Lis, Monika Potoczna, Michele Belloni, Claudia Villosio
CASE Network Reports No. 114 32
The intellectual ability to perform more complicated and productive tasks depreciates slower with age than fitness, which is mostly needed in lower-paid jobs. The expected consequence of this would be that people who are engaged in non-manual tasks would work longer, thus driving the earnings profile up. We find evidence of average earnings rising before 65 only in countries were employment rates after 50 are low and flat earning profiles in countries with high employment rates. In the 65-75 age group, we observe a decline in average hourly earnings in almost all countries. The last result remains true after factoring out personal and job-related characteristics which seem to reflect not only averaging effects but also the loss of productivity at that age. However, losses in earnings are not bigger that 2-3 percent a year after age 65. Therefore, we find evidence that it is lower-paid individuals who are leaving the labour market prematurely in countries with low employment rates and some signals of actual loss of hourly earnings after age 65. Most changes in average wages before age 65 should be attributed to institutional differences among European countries and not to individual life-cycle productivity profiles.
We tried to deliver preliminary answers to the question: to what extent do labour market institutions and pension systems affect the average and individual life-cycle earnings profiles? We find evidence that younger eligibility for retirement and higher replacement rates make lower-paid individuals exit labour market prematurely, i.e. before they lose the ability to perform work-related tasks. This conclusion still needs to be tested with the use of longitudal data.
Additionally, we found that the age structure of the work force strongly affects the dynamics of average earnings and therefore the comparison of dynamics of wages ignoring the age structure of the population might lead to confusing results. As we used cross section data, we could not take into account the cohort effects, so this issue remains open for further research.
3.2. Individual Career Paths
Introduction
In the previous section, the results based on hourly earnings-age profiles with the use of cross-section dataset were discussed. We now turn to a retrospective survey in order to check the validity of the results obtained for individual careers. Moreover, we enrich the analysis by including more dimensions of human capital

AGE AND PRODUCTIVITY. HUMAN CAPITAL ACCUMULATION AND…
CASE Network Reports No. 114 33
accumulation and depreciation. Firstly, the SHARELIFE retrospective survey and imputing methods are carefully discussed. Then, we present the results on the frequency of job changes and work experience during a lifetime. We find a bipolar pattern when looking at the working time in the population. Thereafter, the age-employment and age-earning patterns in all countries are presented. To explain the differences among countries, additional characteristics such as cohorts, gender, education and occupation are applied to the analysis. We identify the patterns of the occupational flows in subsequent stages of life.
Sample description
The Survey of Health, Ageing and Retirement in Europe (SHARE) is the only recent study which allows for the examination of the paths of life of the 50+ population living across European countries. The first wave of the survey was conducted in 2004 in twelve countries (Austria, Belgium, Denmark, France, Germany, Greece, Israel, Italy, Netherlands, Spain, Sweden, Switzerland) for more than 30,000 respondents. In the second wave (2006), three new countries joined the project: Czech Republic, Poland and Ireland, increasing the sample size to nearly 35,000. Wave 3 took place in 2008 and covered the respondents who participated in waves 1 and/or 2. The fourth and final wave was held in 2011 and included several new countries: Estonia, Hungary, Portugal and Slovenia, again increasing the sample size to almost 60,000 observations. The SHARE questionnaire contains comprehensive questions about demographic characteristics, relations with children, physical and mental health, employment, pensions, income, consumption and other activities of people aged 50 and older. SHARE interviewers must reach every respondent who participated in even one of the previous waves, thereby enabling a longitudinal analysis.
In our analysis we use data from the third wave of the SHARE survey run in 2008, which focuses on people’s life history. A retrospective structure of the questionnaire allows us to recreate individual job and wage paths. Everyone who had ever worked was asked about the characteristics of each job during his/her work career. From the work history section of SHARELIFE, we obtained information about the years each job started and ended, the first monthly (after tax) wage, the last monthly (after tax) wage in the main job, and current earnings if still working. Moreover, individuals from SHARELIFE also took part in waves 1 and/or 2 and answered questions about their current earnings.
We investigate the life-cycle earnings for 11 countries: Austria, Belgium, Denmark, France, Germany, Greece, Italy, Netherlands, Spain, Sweden and Switzerland. Poland and the Czech Republic are excluded due to data quality issues. In Poland, it is hardly possible to determine whether earnings were

Anna Ruzik-Sierdzinska, Maciej Lis, Monika Potoczna, Michele Belloni, Claudia Villosio
CASE Network Reports No. 114 34
in the new or old Polish zlotys (the devaluation took place in 1995 and there were some periods of high inflation). All means taken to cope with these problems did not provide the minimum quality of data needed. In the Czech Republic, median earnings between 1987 and 1988 increased from 3 thousand to 13 thousand and remain at that level and there is no easy way to eliminate the effect of this change on final results. The sample was restricted to individuals who reported earnings in the national currency, which led us to 9222 observations. The structure of the sample is presented in Table 2.
Table 2. Sample size in SHARE wave 2, SHARELIFE and our samples by country
Country SHARE wave 2 SHARELIFE Sample 1 Sample 2 Austria 1341 847 412 213 Belgium 3169 2832 1284 736 Czech Republic 2830 1873 - - Denmark 2616 2141 779 408 France 2968 2483 1187 722 Germany 2568 1852 699 449 Greece 3243 2951 628 319 Ireland 1134 - - - Italy 2983 2492 703 348 Netherlands 2661 2210 699 401 Poland 2467 1918 - - Spain 2228 2048 1156 522 Sweden 2745 1893 1163 567 Switzerland 1462 1296 714 552 Total 34415 26836 9222 5237
Source: Own calculation based on SHARE.
Remarks: Sample 1 - whole sample: everyone who had ever worked and reported earnings
in national currency, Sample 2 - only-long-work-experience sample: respondents who
gained a minimum of 30 years of work experience between ages 25 and 65.
In all countries except for France, more than 60% of respondents are above 60 years old (see Figure 10). Employment rates for persons aged 60 to 64 are approximately two times lower than in 55-59 age group – 34% vs. 63% (LFS, 2011). Therefore, for most respondents, their whole work history is available.
Restricting the sample to respondents with work experience of more than 30 years results in a decrease in the share of women in all countries. The largest decrease can be observed in the Netherlands, Spain and Switzerland. Women in Europe, especially in Southern countries, tend to leave the labour market more often and for longer periods mainly due to raising children (see Figure 11). In the Netherlands and Switzerland, the duration of labour market breaks

AGE AND PRODUCTIVITY. HUMAN CAPITAL ACCUMULATION AND…
CASE Network Reports No. 114 35
due to maternity lasts more than three years in 70% of cases, while in the other countries of interest this is true in about 40% of cases (Lyberaki et al. 2011). Figure 10. Sample structure by age of respondents in 2008
0%
10%
20%
30%
40%
50%
60%
70%
80%
90%
100%
Sweden Austria Italy Netherlands Germany Switzerland Spain Denmark Belgium Greece France
50‐54 55‐59 60‐64 65‐69 above 70
Source: Own calculation based on SHARELIFE.
Countries differ strongly in terms of education attainment of people over 50 years of age, which might have an impact on the earnings profile, but it is much less linked with work experience than gender. Eliminating respondents with short work experience does not change the sample structure in terms of education. Unfortunately, the educational structure of the final sample is not representative in some countries. In Switzerland, the share of people with tertiary education is about three times lower than in the Eurostat database statistics (30% vs. 8%, 2008), as opposed to in Denmark, where that share in our sample is about twice as large (28% vs. 45%, 2008). Among other countries, the structure of the sample by education is close to Eurostat data (see Figure 12).

Anna Ruzik-Sierdzinska, Maciej Lis, Monika Potoczna, Michele Belloni, Claudia Villosio
CASE Network Reports No. 114 36
Figure 11. Percent of females in the samples
Figure 12. Educational structure of the sample
Source: Own calculation based on SHARELIFE.
Table 3. Number of jobs by gender, education and birth year Whole sample
Country Total Gender Education Birth year
males female test primary secondary tertiary test 1949-58 1939-48 1929-38before 1929
test
Austria 2,53 2,73 2,37 *** 2,63 2,55 2,33 * 2,56 2,93 2,56 2,27 *** Belgium 2,20 2,48 1,91 2,33 2,16 2,09 2,30 2,61 2,30 2,12 *** Switzerland 3,44 3,70 3,22 3,40 3,57 2,64 3,73 3,93 3,82 2,63 Germany 2,79 2,87 2,70 *** 2,79 2,76 2,80 * 2,80 2,80 2,76 2,83 ** Denmark 3,81 4,28 3,25 3,96 4,01 3,64 *** 3,84 4,28 4,00 3,62 ** Greece 1,37 1,43 1,30 1,34 1,44 1,30 * 1,42 1,40 1,52 1,33 *** Spain 2,15 2,55 1,73 2,22 2,22 1,87 * 2,39 2,54 2,55 1,84 France 2,49 2,94 2,08 2,53 2,44 2,42 * 2,65 2,78 2,56 2,54 Italy 2,16 2,50 1,80 2,24 2,04 2,06 ** 2,42 2,69 2,11 2,14 * Netherlands 2,95 3,16 2,72 2,80 3,07 3,06 ** 3,17 3,13 3,24 3,14 Sweden 3,39 3,69 3,10 3,51 3,38 3,20 * 3,39 3,61 3,36 3,08 ** Total 2,65 2,92 2,38 2,55 2,77 2,64 2,82 2,89 2,91 2,66
Only-long-work experience sample
Country Total Gender Education Birth year
males female test primary secondary tertiary test 1949-58 1939-48 1929-38before 1929
test
Austria 2,56 2,73 2,19 *** 2,93 2,56 2,27 * 2,37 2,57 2,73 2,64 *** Belgium 2,30 2,49 1,91 2,61 2,30 2,12 2,25 2,17 2,58 2,52 ** Switzerland 3,73 3,67 3,87 * 3,93 3,82 2,63 3,71 3,90 3,77 2,98 *** Germany 2,80 2,82 2,75 * 2,80 2,76 2,83 *** 2,58 3,03 2,66 2,53 * Denmark 3,84 4,27 3,06 4,28 4,00 3,62 * 3,86 3,89 3,89 3,31 *** Greece 1,42 1,48 1,25 1,40 1,52 1,33 *** 1,51 1,48 1,27 1,23 *** Spain 2,39 2,47 2,10 *** 2,54 2,55 1,84 2,47 2,49 2,39 1,90 *** France 2,65 3,04 2,10 2,78 2,56 2,54 *** 2,78 2,68 2,28 1,81 * Italy 2,42 2,56 2,08 2,69 2,11 2,14 2,53 2,43 2,37 2,17 *** Netherlands 3,17 3,13 3,43 * 3,13 3,24 3,14 *** 3,10 3,28 3,10 2,98 *** Sweden 3,39 3,66 3,05 3,61 3,36 3,08 * 3,26 3,52 3,34 3,20 *** Total 2,82 2,94 2,56 2,89 2,91 2,66 2,75 2,93 2,80 2,61 *
Source: Own calculation based on SHARELIFE.
Remarks: To test statistically significant difference between samples we use the following
as variables: (1) with two samples, the Wilcoxon rank-sum test and (2) with more than two samples, the Kruskal-Wallis equality-of-populations rank test. ***, ** and * indicates
respectively significance at level 1, 5 and 10%.

AGE AND PRODUCTIVITY. HUMAN CAPITAL ACCUMULATION AND…
CASE Network Reports No. 114 37
Imputing methods
Recreating the life-earnings profiles based on information about a few moments of life from a retrospective survey entails several methodological challenges. The growth rate of wages is an outcome of three factors: individual lifecycle dynamics of income, economic growth, and inflation. Firstly, some currencies were liquidated or denominated and the money lost its value due to inflation. Secondly, there are various observations of earnings for individuals at varying ages. Furthermore, the dynamics of average wage influences the profile and the data on average wage are hardly available for most countries before 1960. Finally, only the data on net wages are available in SHARE, whereas during 3-4 decades of working life, the tax wedge changes hugely in some countries and most average wage dynamics from international databases include only gross wage data. In this section we present the ways we cope with these problems.
A person with median work experience in our sample worked two jobs during his or her life and reported earnings in three moments of his working life, mostly at the beginning of each job, at the end of the main job, the end of his or her last job or current earnings (see Table 3). This was the raw information which helped us recreate the working life earnings profile for every worker. Depending on the country, we have an average of 2 to 5 sources of information on earnings per individual respondent, according to the characteristics of work in each country (see Figure 14), especially changing jobs.
The socio-demographic structure of the sample has little impact on the number of jobs during a person’s life time and hence on the amount of information about earnings. Variation within education groups and year of birth in most countries is not statistically significant (see Table 3). The opposite is true of gender, which strongly differentiates the number of jobs during one’s lifetimes. Females take up new jobs less often, especially in Spain, France and Italy. In Southern Europe, family ties are strong and family policy does not have much impact. Table 4. Comparison of inflation and growth rate of SHARELIFE nominal earnings (%)
Country Average annual rate of inflation
Average annual growth rate of SHARELIFE nominal earnings after imputation
1950-1960
1960-1970
1970-1980
1990-2000
2000-2008
1970-2008
1950-1960
1960-1970
1970-1980
1990-2000
2000-2008
1970-2008
Sweden 3 3 5 2 1 3 7 9 6 2 1 4
Denmark 2 2 5 2 2 3 9 9 7 2 1 4
Austria 4 3 6 2 2 4 10 11 6 4 1 4
France 8 4 7 2 2 4 7 5 10 2 -2 5
Belgium 3 3 7 2 2 4 8 6 6 3 3 4
Germany 6 4 9 2 2 5 5 5 4 3 3 4
Switzerland 18 7 9 2 2 5 6 7 5 2 2 3
Netherlands 5 4 8 2 2 5 8 10 7 3 1 4
Spain 4 3 12 3 2 7 16 12 11 5 2 7
Italy 13 6 14 4 3 8 10 11 10 6 5 7
Greece 2 2 13 8 3 11 7 8 9 5 0 6
Source: Own calculation based on OECD and SHARELIFE.

Anna Ruzik-Sierdzinska, Maciej Lis, Monika Potoczna, Michele Belloni, Claudia Villosio
CASE Network Reports No. 114 38
All amounts in euro after joining the monetary union were converted using the official exchange rate. We applied the exchange rate from the SHARE methodology to convert wages from Waves 1 and 2 from euros to national currency. Amounts given by respondents refer to different points in time, therefore we use the procedure proposed by Trevisan et al. (2011) to obtain monetary values comparable across time. Time series for consumer price inflation were derived from OECD data. The first information about earnings in our sample comes from the 1950s and the last information comes from 20087.
Using information about earnings from various points in a respondent’s life allowed us to calculate the individual earnings dynamics. The growth rates between subsequent observations of wages were averaged for all years in which an individual worked. For 9% of all respondents in our sample, we have no information about their last or current earnings. Taking into account that all persons in the sample are at least 50 years old, we use average dynamics of wages in their country to recreate their wage path.
Factoring out the loss of the nominal value of currency in time measured by the inflation rate resulted in some strange results for the period of high inflation during the stagflation following the first oil crisis (1973) and for Denmark. The average growth rate of inflation was higher than the average growth rate of SHARELIFE imputed nominal earnings between 1970 and 1980 in 7 out of 11 countries (see Table 4). This signals a decrease in real wages, which is not confirmed from data on aggregate wages. In Denmark, the nominal earnings growth was slower than inflation, but too high to be recognized as real earnings dynamics. This strongly influences further analysis (see Figure 13).
The largest growth rate of earnings in SHARELIFE took place in 1950-1980, when most cohorts entered the labour market. In subsequent years, respondents got older and the increase in earnings was lower, which can by partly attributed to slower economic growth thereafter and partly to individual age-wage dynamics.
7 Due to availability of CPI information.

AGE AND PRODUCTIVITY. HUMAN CAPITAL ACCUMULATION AND…
CASE Network Reports No. 114 39
Figure 13. Dynamics of earnings from SHARELIFE and inflation (1950=1)
Source: Own calculations based on OECD and SHARELIFE.
Remarks: Earnings before imputation.
Calculating relative earning-age profiles requires data on average wage dynamics. Real hourly earnings in manufacturing increased by about three times in OECD countries within the last 30 years. The growth rate varies over time and it is not easy to obtain long reliable time series on average wages in analysed countries. Average earnings from 1950 to 2008 are calculated with the combined data from Eurostat, OECD database and Penn World Table Version 7.1 (PWT). From Eurostat, we obtained data on monthly net earnings in the national currency. Using the dynamics of real hourly earnings in manufacturing from the OECD, we recreate average earnings from 1950 to 2008. If the data on the dynamics of earnings were not available, the dynamics of GDP per worker from PWT are applied. If the technology and institutions do not change much, the dynamics of labour income should not differ from the dynamics of GDP per capita in the medium run. We confirm this for time periods for which both variables are available (see Table 5). Taking into account the growth of the tax wedge does not change the results. In the end, to make real and relative profiles comparable, we referenced earnings during the life cycle to earnings at the age of 45.

Anna Ruzik-Sierdzinska, Maciej Lis, Monika Potoczna, Michele Belloni, Claudia Villosio
CASE Network Reports No. 114 40
Table 5. Comparison of growth rates of real earnings and real GDP per capita (%)
Country
Average growth rate of real earnings in: Average growth rate of real GDP per worker in:
1950
- 19
60
1960
- 19
70
1970
- 19
80
1990
- 20
00
2000
- 20
10
1970
- 20
10
1950
- 19
60
1960
- 19
70
1970
- 19
80
1990
- 20
00
2000
- 20
10
1970
- 20
10
Austria 3,88 3,49 1,27 0,44 1,76 5,15 5,05 3,02 1,33 0,75 1,63 Belgium 2,62 4,31 2,43 1,48 0,67 1,66 Denmark 1,36 1,40 2,70 3,40 0,92 2,72 0,33 1,38 France 3,81 3,74 1,03 1,03 1,75 4,11 4,47 2,46 0,99 0,52 1,45 Germany 5,26 2,54 1,05 0,17 1,37 1,91 1,24 2,08 1,12 0,33 1,22 Greece 3,14 8,91 3,42 1,18 1,21 1,33 Italy 4,75 4,84 0,19 0,60 1,81 5,65 5,78 2,69 1,71 -0,12 1,57 Netherlands 2,18 0,43 0,33 0,85 3,46 3,60 1,59 1,39 0,41 0,77 Spain 1,20 1,19 4,84 6,44 2,84 1,32 -0,56 1,36 Sweden 1,73 1,41 2,94 0,54 1,84 1,15 1,30 Switzerland 3,02 3,15 0,29 0,12 0,65 0,30
Source: Own calculation based on OECD and PWT 7.1.
Frequency of job changes during working life
SHARE data delivers some interesting results on the stability of employment in European countries. It also brings some insight on the origins of the variation of aggregate employment rates. In countries with a high employment rate, people change jobs more often. Respondents from countries with high employment rates change jobs about three times and work in each job for an equal timespan. In countries with short employment, the chances of changing jobs after age 45 decrease rapidly – on average by about 70% compared to the 25-34 age group. In countries with long employment patterns, even after 45 years of life, a worker has 40% chance of changing jobs until the end of his lifetime (see Figure 16). Thus, prolonging work time is connected with changing jobs and not necessarily working longer in one place.

AGE AND PRODUCTIVITY. HUMAN CAPITAL ACCUMULATION AND…
CASE Network Reports No. 114 41
Figure 14. Amount of information about earnings by country
Figure 15. Work experience by country (median, in years)
Source: Own calculation based on SHARELIFE.
Figure 16. Chances of changing jobs by age among people with long work experience
Figure 17. Fraction of employees who work part-time by work experience
Source: Own calculation based on SHARELIFE.
Remarks: Calculations for respondents with a minimum of 30 years of work experience
gained between the ages of 25 and 65.
Changing from full-time to part-time is another possibility for increasing
the participation of older workers in the labour market. Countries also differ greatly in the dimension of frequency of part-time jobs. In Switzerland, almost a quarter of employers work part-time, while in Spain, part-time jobs are rare. But there is no apparent upward trend in the faction of part-time workers with increasing seniority. Only in Denmark and Sweden does the proportion of part-time workers increase with time (see Figure 17).

Anna Ruzik-Sierdzinska, Maciej Lis, Monika Potoczna, Michele Belloni, Claudia Villosio
CASE Network Reports No. 114 42
Greeks have the lowest number of jobs in their lifetimes. Greece is also the country with the shortest work experience among other SHARELIFE countries – the median is 33 years (see Figure 15). People in Switzerland work the longest throughout their lives – on average 40 years. Nevertheless, in Southern Countries and in Denmark and Sweden, the elimination of people with short work experience resulted in a median increase from five (Greece) to eight (Italy) years. This indicates that in these countries, the share of people with atypical work patterns is significant. However, if respondents work in one job for almost their whole lives, we can only approximate the dynamics of his/her earnings using maximally two reported earnings (from the beginning and end of that job). In Greece, even people with two jobs during their lives spend the majority in one job (see Figure 18). In Denmark, France, the Netherlands, Sweden and Switzerland, the vast majority of employees work an equal amount of time in each job.
Figure 18. Average job duration among people with minimum 30 years of work experience
Source: Own calculation based on SHARELIFE.
In all countries, the distribution of job duration is bipolar, which cannot
be attributed only to differences between genders (see Figure 18). There seems to be a group of employees who work about 20 years and another who work about 40 years. These results needs further research if it is confirmed that there is potential space for effective policies to make people move from one group to another.

AGE AND PRODUCTIVITY. HUMAN CAPITAL ACCUMULATION AND…
CASE Network Reports No. 114 43
Age-earnings profiles
We first present the results of the real wages profile in the lifetime. Real earnings double to triple in all analysed countries thought work life. Then the relation of wages and the probability of working by age is discussed. The following analysis is focused on relative wages, i.e. in regards to average wages. The differences in relative earnings dynamics by country as well as by education and occupations during the whole working life are studied. Either wage or employment profiles are normalized to 1 at the age of 45 as only the dynamics, not the levels are important in the following analysis.
Real earnings in most countries show similar dynamics. Wages increase until the age of 60 (see Figure 19). The youngest workers (15-30) experience the largest increase in wages – about 6% per year. For persons over 45, wage growth is significantly lower – below 1.5% (see Figure 21). Those employedat age 55 earn about 20% more than at age 45 in all countries, except for Denmark and Sweden. In Denmark and Sweden, earnings growth stops as early as 30, which might be the effect of data quality (see Imputing methods section).
Figure 19. Real earnings-age profiles and employment rates by age
0%
10%
20%
30%
40%
50%
60%
70%
80%
90%
100%
0,0
0,5
1,0
1,5
15 25 35 45 55 65
Austria
employment rate (right axis) real earnings (left axis)
average earnings average employment rate
0%
10%
20%
30%
40%
50%
60%
70%
80%
90%
100%
0,0
0,5
1,0
1,5
15 25 35 45 55 65
Belgium
employment rate (right axis) real earnings (left axis)
average earnings average employment rate

Anna Ruzik-Sierdzinska, Maciej Lis, Monika Potoczna, Michele Belloni, Claudia Villosio
CASE Network Reports No. 114 44
0%
10%
20%
30%
40%
50%
60%
70%
80%
90%
100%
0,0
0,5
1,0
1,5
15 25 35 45 55 65
Denmark
employment rate (right axis) real earnings (left axis)
average earnings average employment rate
0%
10%
20%
30%
40%
50%
60%
70%
80%
90%
100%
0,0
0,5
1,0
1,5
15 25 35 45 55 65
France
employment rate (right axis) real earnings (left axis)
average earnings average employment rate
0%
10%
20%
30%
40%
50%
60%
70%
80%
90%
100%
0,0
0,5
1,0
1,5
15 25 35 45 55 65
Germany
employment rate (right axis) real earnings (left axis)
average earnings average employment rate
0%
10%
20%
30%
40%
50%
60%
70%
80%
90%
100%
0,0
0,5
1,0
1,5
15 25 35 45 55 65
Greece
employment rate (right axis) real earnings (left axis)
average earnings average employment rate

AGE AND PRODUCTIVITY. HUMAN CAPITAL ACCUMULATION AND…
CASE Network Reports No. 114 45
0%
10%
20%
30%
40%
50%
60%
70%
80%
90%
100%
0,0
0,5
1,0
1,5
15 25 35 45 55 65
Italy
employment rate (right axis) real earnings (left axis)
average earnings average employment rate
0%
10%
20%
30%
40%
50%
60%
70%
80%
90%
100%
0,0
0,5
1,0
1,5
15 25 35 45 55 65
Greece
employment rate (right axis) real earnings (left axis)
average earnings average employment rate
0%
10%
20%
30%
40%
50%
60%
70%
80%
90%
100%
0,0
0,5
1,0
1,5
15 25 35 45 55 65
Spain
employment rate (right axis) real earnings (left axis)
average earnings average employment rate
0%
10%
20%
30%
40%
50%
60%
70%
80%
90%
100%
0,0
0,5
1,0
1,5
15 25 35 45 55 65
Sweden
employment rate (right axis) real earnings (left axis)
average earnings average employment rate

Anna Ruzik-Sierdzinska, Maciej Lis, Monika Potoczna, Michele Belloni, Claudia Villosio
CASE Network Reports No. 114 46
0%
10%
20%
30%
40%
50%
60%
70%
80%
90%
100%
0,0
0,5
1,0
1,5
15 25 35 45 55 65
Switzerland
employment rate (right axis) real earnings (left axis)
average earnings average employment rate
Source: Own calculation based on SHARELIFE.
Remarks: Profiles after the weighted local polynomial estimation. In all estimations, we use the Epanechnikov kernel function and rule-of-thumb bandwidth estimator. Bandwidth for real earnings and for employment rate are respectively by countries: Austria 2.72, 2.52, Belgium 2.44, 1.86, Denmark 2.14, 1.65, France 2.61, 3.09, Germany 2.42, 1.71, Greece 1.97, 2.11, Italy 2.20, 1.70, Netherlands 2.74, 1.93, Spain 1.84, 2.06, Sweden 1.89, 1.88Switzerland 2.18, 1.88. All individual profiles are expressed as the rate of earnings at 45 years of age and then the median is computed. The earnings ratio for people above 65 is averaged. The employment rate is the proportion of respondents, who work at that age and at 45.
Countries differ in the age of leaving labour market. In countries where policies encourage long employment (Sweden, Netherlands, Denmark), the employment rate among older people is higher. In Sweden, the employment rate falls below 50% when the individual is about 60 years old, while in Greece it is five years earlier. For countries with a rather short employment life cycle (France, Italy, Austria and Belgium), the employment rate falls by 9% per year between the ages of 50 and 65 and it reaches 5% by age 65 (see Figure 19). On the contrary, in countries with long employment, it falls by 5% per year and reaches 19% at the age of 658.
There is a strong negative relation between the dynamics of the employment rate and earnings among older workers. In countries with the quickest employment decreases after age 45, we observe significant growth in earnings (see Figure 20). This implies that after 45 years, the less productive workers outbalance others in leaving the labour market.
8 Employment rates for 60-64 age groups based on LFS data (2011) are respectively: 20% and 45%. They cannot be directly compared as the employment rates in this section are normalized to one at the age of 45.

AGE AND PRODUCTIVITY. HUMAN CAPITAL ACCUMULATION AND…
CASE Network Reports No. 114 47
Figure 20. Employment vs. earnings among older workers
Figure 21. Growth rate of earnings among younger and older workers
AT
BE
CH
DE
DK
GR
ES
FR
IT
NL
SE
‐12%
‐8%
‐4%
0%
‐2% ‐1% 0% 1% 2% 3%
average earnings growth rate in age
45‐60
average employment growth rate in age
45‐60
AT
BE
CH
DE
DK
GR
ES
FR IT
NL
SE
0%
4%
8%
12%
‐2% ‐1% 0% 1% 2% 3%
average earnings growth rate in age
45‐60
average earnings growth rate in age
15‐30
Source: Own calculation based on SHARELIFE.
Figure 22. Relative earnings-age profiles by country
Source: Own calculation based on SHARELIFE.
Remarks: Profiles are smoothed with the use of the kernel smoother. The mean for all
countries is a unweighted mean of all country profiles.
Wages throughout the lifetime are driven by economic growth, which manifests itself in the increase of the average wage. Factoring out average wage

Anna Ruzik-Sierdzinska, Maciej Lis, Monika Potoczna, Michele Belloni, Claudia Villosio
CASE Network Reports No. 114 48
growth results in the profile of relative earnings in the life-cycle. This enables checking to what extent technological change affects the incomes of all cohorts and to what extent it is embodied in the rise of productivity of new labour market entrants. Additionally, we study differences in relative wages among countries that differ in institutional arrangements.
The dynamics of relative earnings vary among countries. In Belgium, Denmark, Germany, Greece and Italy, the earnings of young respondents increase strongly at the age of 20 and remain stable for the next 15 years. After a period of stabilization, relative earnings decrease until the age of 50 and then stabilize again9. In France, Spain and Sweden, earnings grow until the age of 35, and then fall until the age of 50. After 50, in France and Spain, wages start to rise until they reach the age of 65. In Sweden, earnings fall dramatically between 35 and 65 and then stabilize. In the last group of countries (Austria, Netherlands and Switzerland), relative earnings grow throughout one’s whole life, but the growth rate is getting lower (see Figure 22).
In order to find out if the observed dynamics are not just the result of more or less productive workers entering and leaving the labour market, we check the distribution of changes of individual profiles. This confirms the shape of the averaged profiles (see Figure 23). The relative earnings growth dominates until the age of 25, then there is stabilization until age 35, and then wage growth is slower than the average of all employed. For those remaining on the labour market after 55 years of life, wages grow in relation to the average. The potential for wage growth strongly influences the decision of whether or not to retire.
9 Except for Denmark, where earnings fall dramatically after the age of 30. This may be a result of the lower growth rate of earnings than of inflation and relatively flat real age-earnings profiles (see Figure 13).

AGE AND PRODUCTIVITY. HUMAN CAPITAL ACCUMULATION AND…
CASE Network Reports No. 114 49
Figure 23. Distribution of the dynamics of relative earnings in individual profiles
Source: Own calculation based on SHARELIFE.
The dynamics of wages are more similar in countries with similar employment rates by age in 2008 than in countries which have similar labour market institutions. The institutional classification follows the proposition of Esping-Andersen (1990). In countries in the Continental group, the labour market is regulated to a large extent and wage mobility is low. In South Europe, wage mobility is relatively high, as well as in social-democratic countries, but in the social-democratic regime, labour market regulations are greater than in South Europe. These regimes do not coincide with the division of countries due to the employment rates by age in 2008, which are carefully described in the ‘Employment profiles and clusters of countries’ section of this report.
There is a negative correlation between the average growth rate of earnings in age groups 15-30 and 55-65 among all countries. Low growth rates of earnings during youth are associated with high decreases at the ages of 55-65. In countries with low-short employment (Belgium, Italy), earnings increase strongly between 15-25 (6% per year) and then gradually decrease until the individuals reach age 45. In countries with high-short employment (Austria, France), earnings increase strongly between 15-25 (5% per year) and then gradually until the age of 45. On the contrary, in countries with long employment, it is hard to find common patterns. The social-democratic regime is characterized by a relatively high decrease in earnings after 55 (1% per year). In the Continental regime, the average growth rate of earnings at the ages of 15 30 is relatively low - about 4% per year. No clear patterns within institutional regimes might indicate that the wage paths are affected by many other factors.
Real wage paths vary across cohorts, but only in the beginning of work. The earnings of the oldest cohorts increase fivefold during first thirty years

Anna Ruzik-Sierdzinska, Maciej Lis, Monika Potoczna, Michele Belloni, Claudia Villosio
CASE Network Reports No. 114 50
of work. In low-long employment and high-short employment countries, earnings profiles for people born between 1939 and 1948 look like the ones of the oldest cohort. However, in high-long employment and low-short employment countries, successive cohorts reach the wage of 45 quicker. For the youngest cohort (born between 1949-1958), earnings remain stable from age 30 until ago 50. In all countries with a low employment rate, wages rise after age 50 for all cohorts, which confirms the previous conclusion that after that age, persons with higher productivity are more prone to stay on the market.
The aggregate profile is a mix of low and high productive workers, who might differ not only with regard to the level but also to the dynamics of earnings. Therefore we study the earnings profiles of groups that are homogenous in terms of education, occupation and gender. This provides insight into the nature of the changes of aggregates and delivers further evidence on the premature departure from the market by low-productive individuals.
Figure 24. Real earnings-age profiles by cohort
Source: Own calculations based on SHARELIFE.
Remarks: Constant 2005 prices. Profiles are smoothed with the use of the kernel smoother. Countries in groups: (1) high-short employment: Austria, France, (2) high-long employment: Denmark, Germany, Netherlands, Switzerland, Sweden, (3) low-short employment: Belgium, Italy, (4) low-long employment: Greece, Spain.

AGE AND PRODUCTIVITY. HUMAN CAPITAL ACCUMULATION AND…
CASE Network Reports No. 114 51
Figure 25. Relative earnings-age profiles by cohort
Source: Own calculation based on SHARELIFE.
Remarks: Profiles are smoothed with the use of the kernel smoother. Countries in groups:
(1) high-short employment: Austria, France, (2) high-long employment: Denmark,
Germany, Netherlands, Switzerland, Sweden, (3) low-short employment: Belgium, Italy, (4) low-long employment: Greece, Spain.
The most important result is that the differences in terms of the dynamics of earnings among various educational and occupational groups are not significant after the age of 50. We have not found evidence that the loss of relative wages varies much among people with different levels of human capital. Due to positive and quite high returns to education, the level of wages differs, but their dynamics after age 50 are quite similar. Employment rates among people with primary education and elementary occupations (about 8% per year in age between 45 and 60) decrease more than in the other groups (about 5.5% - see Figure 26, Figure 27). The employment rate of over 100% for skilled manual labour is a result of the fact that many such workers move to other occupational groups before age 45 (see Figure 30). This is an effect of the normalization of the employment rate at this age to 1.

Anna Ruzik-Sierdzinska, Maciej Lis, Monika Potoczna, Michele Belloni, Claudia Villosio
CASE Network Reports No. 114 52
Figure 26. Life cycle employment profiles by education
Figure 27. Life cycle employment profile by occupation
Source: Own calculation based on
SHARELIFE.
Remarks: Profiles are smoothed with the
use of the kernel smoother.
Source: Own calculation based on
SHARELIFE.
Remarks: Employment rates are the proportion
of respondents who work at that age and at 45.
Occupation aggregation in accordance with Whelan et al. (2011). Profiles are smoothed
with the use of the kernel smoother.
In the high-short employment countries (Austria, France), the differences among educational and occupational groups are most evident and show a different pattern than in other countries. Workers with the lowest general (education) and specific (occupations) human capital experience the largest variation of wages over their lifetimes. The lack of possibility to accumulate skills seem to result in a decrease in the relative wage after age 25. This is also influenced by the fact that in these countries, workers move to other occupational groups.

AGE AND PRODUCTIVITY. HUMAN CAPITAL ACCUMULATION AND…
CASE Network Reports No. 114 53
Figure 28. Relative earnings age profiles by level of education attained
Source: Own calculation based on SHARELIFE.
Remarks: Profiles are smoothed with the use of the kernel smoother. Countries in groups:
(1) high-short employment: Austria, France, (2) high-long employment: Denmark,
Germany, Netherlands, Switzerland, Sweden, (3) low-short employment: Belgium, Italy, (4) low-long employment Greece, Spain.

Anna Ruzik-Sierdzinska, Maciej Lis, Monika Potoczna, Michele Belloni, Claudia Villosio
CASE Network Reports No. 114 54
Figure 29. Relative age-earnings profiles by occupation
Source: Own calculation based on SHARELIFE.
Remarks: Profiles are smoothed with the use of the kernel smoother. Countries in groups: (1) high-short employment: Austria, France, (2) high-long employment: Denmark,
Germany, Netherlands, Switzerland, Sweden, (3) low-short employment: Belgium, Italy,
(4) low-long employment Greece, Spain.

AGE AND PRODUCTIVITY. HUMAN CAPITAL ACCUMULATION AND…
CASE Network Reports No. 114 55
Figure 30. Probability of changing occupational group during subsequent life stages
Source: Own calculation based on SHARELIFE.
Remarks: The bars show the probability of the changing state during a given timespan.
For example, the first bar on the left shows that 75% of highly skilled non-manual workers
at the age of 20 remain in the same occupational group after 10 years, 10% of them are out of the labour market and 14% change their occupational group.

Anna Ruzik-Sierdzinska, Maciej Lis, Monika Potoczna, Michele Belloni, Claudia Villosio
CASE Network Reports No. 114 56
Figure 31. Relative age-earnings profiles by gender
Source: Own calculation based on SHARELIFE.
Remarks: Profiles are smoothed with the use of the kernel smoother. Countries in groups:
(1) high-short employment: Austria, France, (2) high-long employment: Denmark,
Germany, Netherlands, Switzerland, Sweden, (3) low-short employment: Belgium, Italy, (4) low-long employment Greece, Spain.
The accumulation of human capital is reflected in changing occupations during one’s lifetime, especially in the first stage of working life. However, even in 20 to 30 age group, only 1/5 of workers change their occupational group. During that time, the most important flows are moving from skilled manual to non-manual occupations. After the age of 30, the probability of changing occupational group is less than 12% for all groups except for skilled manual labourers, who still face a 15% probability of working as a non-manual worker at the age of 50. Interestingly, the intensity of the flow out of the labour market after the age of 50 is similar among all occupational groups. The changes appear at earlier stages. The higher the skills, the lower the probability of leaving the labour market before the age of 50 and the longer the working life.
On average, earnings vary less with age among women than among men. In almost all countries, except for countries with high-short employment, we observe a difference between genders in earnings growth until the age of 40 and after that

AGE AND PRODUCTIVITY. HUMAN CAPITAL ACCUMULATION AND…
CASE Network Reports No. 114 57
point, changes in wages are similar. Denmark and Sweden are the only countries with high employment rates among women aged less than 30 and their dynamics for the youngest are similar for both genders (see Figure 31).
Conclusions
With the use of the SHARELIFE retrospective survey on work career, the most important properties of wage dynamics in a life-cycle were identified. The dynamics of the average wage are strongly influenced by the timing of entering and leaving the labour market by persons with various human capital and productivity levels. Although the earnings rise throughout one’s whole working life, after the age of 35, growth is slower than the average wage and workers seem to lose in relative terms. Among those who remain on the market after the age of 55, it is common to experience wage growth in all observed countries. The technological and institutional change seems to influence the wage dynamics of subsequent cohorts. As we found out, the generation born after 1949 is characterized by a steeper earnings-age profile than the older generations. Above all, their growth in wages early in lifetime is much stronger.
We distinguish the features of countries with high employment rates among older cohorts. They achieve this result not by prolonging work with the same employer but rather by finding new jobs after the age of 50 and therefore remaining on the labour market. Additionally we have identified an interesting pattern of bipolar distribution of working time during life. In all countries, the working life length of the first subpopulation is concentrated at 20 years and at about 40 years for the other. If these results are confirmed by other research, the possibility arises for policymakers to use different tools for these two subpopulation in order to increase the labour market participation and to better address ALMP.
We have also found out that although the level and dynamics of earnings until age of 50 differ greatly among educational and occupational groups, the dynamics thereafter are more coherent. This suggests that the rate of human capital depreciation is quite similar no matter how much of it was accumulated earlier in life at least for persons remaining on the market. This would also explain the dropping employment rates of less skilled individuals with ageing. The depreciation of human capital quickly reaches the threshold at which people decide to retire. These are preliminary results which need to be tested on other datasets.

Anna Ruzik-Sierdzinska, Maciej Lis, Monika Potoczna, Michele Belloni, Claudia Villosio
CASE Network Reports No. 114 58
3.3. Age-Earnings Profiles in Different Groups of Employees
The aim of this part of the paper is to analyse age-earnings profiles in different (groups of) countries based on the individual Structure of Earnings Survey (SES) data for the years 2002 and 2006. We show how much earnings change with age and what is the age of maximum expected monthly earnings for full-time employees in different countries, education, types of professions and sectors.
Contrary to the study presented above, we focus on the relative earnings of different age groups, not only the oldest group of employees. One of the reasons is that information on age in SES is presented in 10-year age groups, with the oldest one coded as 60+.
As suggested in the existing literature, loss of productivity with age should be more visible when job performance depends on physical power or speed of working, than in jobs where experience is more important. Productivity decline with age will not be homogenous across countries, as it also depends on the characteristics of the workforce (education - its level and adequacy) and the economy (share of employment in sectors, pace of technological change).
We adopt the assumption that the observed wages of employees are correlated with their productivity, so they can be used as a proxy for productivity, at least for jobs in manual professions.
Data
The database used provides information for all EU countries and is an employer-based survey conducted in companies with at least 9 employees. So it does not cover earnings by the same employee elsewhere in a second or third job. The anonymised and partially aggregated SES datasets include, to a large extent, comparable information on remuneration (total and its components), individual characteristics of employees, and their employers.
The available information on wages is the gross monthly earnings in the reference month (usually October) and annual earnings. The database made available from Eurostat also includes information on hourly earnings. However, to diminish possible reasons for differences in hourly wages other than changes in productivity, we focused only of full-time employees. For this group of companies and employees, we checked if older workers' earnings (productivity) in relation to their younger counterparts varied between countries and by estimations of age-earnings profiles on SES data. We also discuss the age of maximum earnings for selected in-depth analyses of age-earning profiles for countries representing the four groups identified above on the basis of the average length of professional life and employment rates.

AGE AND PRODUCTIVITY. HUMAN CAPITAL ACCUMULATION AND…
CASE Network Reports No. 114 59
As in the previous part, we present estimations and conclusions for four clusters of countries distinguished on the basis of employment rate in the age group 51-55 and the average length of professional life:
High-short
Low long
Low-short
High-long
The sets of data available from Eurostat include information on age grouped in the following age groups: 14-19 years, 20-29, 30-39, 40-49, 50-59, 60+ (60-68). So in the calculations value, the middle of a range was taken for every age group.
Due to some incompatibilities in coding or a lack of information for both 2002 and 2006, 18 countries have finally been chosen for a detailed analysis. The table below presents some characteristics of SES data used in estimations for those countries.
Table 6. Basic characteristics of datasets used in estimations
Country No of obs. 2002 Range with a median
age in the sample 2002
No of obs. 2006 Range with a median
age in the sample 2006
“High-short” CZ 926 563 40-49 1 840 853 40-49 FR 103 864 30-39 98 811 40-49 SK 403 030 40-49 641 451 40-49
“Low-long” CY 12 919 30-39 26 047 40-49 ES 195 229 30-39 200 881 30-39 GR 46 633 30-39 45 041 30-39 LT 123 643 40-49 112 475 40-49 PT 61 603 30-39 102 570 40-49
“Low-short” HU 451 114 40-49 728 605 40-49 LU 26 002 30-39 26 741 30-39 PL 647 386 40-49 594 818 40-49
"High-long" EE 72 548 40-49 111 619 40-49 FI 113 330 40-49 272 571 40-49 LV 166 763 40-49 257 011 40-49 NL 43 822 40-49 78 931 40-49 NO 469 139 40-49 718 892 40-49 SE 851 633 40-49 203 053 40-49 UK 112 285 30-39 95 933 40-49
Source: Own calculation base on SES 2002 and 2006.

Anna Ruzik-Sierdzinska, Maciej Lis, Monika Potoczna, Michele Belloni, Claudia Villosio
CASE Network Reports No. 114 60
Estimation method
We estimated simple age-monthly earnings profiles as loglinear empirical wage models of the following form:
ln(w) = α1+ α2(a) + α3(a2) + e
where “w” stands for relative gross monthly earnings to the earnings of the 20-29 age group in the country, “a” for age, for age squared “a2”.
The model has been estimated for full-time employees and the (log of) relatively gross monthly wage in the reference month (usually October) has been used as the dependent variable.
The bivariate age-earnings profiles estimated above did not control for some important characteristics that may influence earnings: e.g. education level, type of profession, or sector of employment. So we chose four countries representing separate clusters and calculated profiles and the estimated age of highest earnings for those countries. We run estimates on individual data from 2006 separately in eight groups:
for those performing more demanding jobs (ISCO-88 professions codes 1 to 4),
for more manual jobs (ISCO-88 from 5 to 9),
for employees with pre-primary, primary, basic and lower secondary education,
for employees with upper secondary and post-secondary (non-tertiary) education,
for employees with tertiary education,
for firms from the industry and manufacturing sector (NACE Rev.1.1 codes from C to F),
for market services (NACE codes G to K),
for non-market services (NACE codes from L to O).
Results
Below we compare 2002 and 2006 age-earnings profiles for full-time employees in countries grouped in the four clusters. There is not much difference between profiles in both years. The ages of maximum earnings were slightly higher in the majority of countries in 2006 (a better year for most economies), except for the Baltic States.

AGE AND PRODUCTIVITY. HUMAN CAPITAL ACCUMULATION AND…
CASE Network Reports No. 114 61
Figure 32. Age-earnings profiles for "high-short" countries in 2002 and 2006
Source: Own calculations based on SES.
In this cluster there are countries with relatively strong old-age premia for SK and FR, with the ages of maximum earnings equal to 47-48 years in the Czech Republic, 60-62 years in France, 49-52 years in Slovakia. Analyses based on monthly earnings for full-time employees differ slightly from those on hourly wages and more detailed age groups over 50.

Anna Ruzik-Sierdzinska, Maciej Lis, Monika Potoczna, Michele Belloni, Claudia Villosio
CASE Network Reports No. 114 62
Figure 33. Age-earnings profiles for "low-long" countries in 2002 and 2006
Source: Own calculations based on SES.
Countries in the second cluster differ from each other despite having similar average labour market performance. Spain and Greece show relatively flat profiles after reaching the age of maximum earnings. Age-earnings profiles in Portugal are similar to those expected based on the findings in the literature, with the age of maximum earnings at 51-53 years. This resembles the Cyprus profile.

AGE AND PRODUCTIVITY. HUMAN CAPITAL ACCUMULATION AND…
CASE Network Reports No. 114 63
A different type of profile has been estimated for Lithuania, which is more in line with the Latvian or Estonian profiles, suggesting that labour markets in Baltic States are the most youth-oriented of all countries.
Figure 34. Age-earnings profiles for "low-short" countries in 2002 and 2006
Source: Own calculations based on SES.
Profiles for countries with low employment rates of 50+ and short professional lives show that those who stay in the labour market until old age seem to be the most productive and earn the most, which confirms our findings in the estimations on EU-SILC data.

Anna Ruzik-Sierdzinska, Maciej Lis, Monika Potoczna, Michele Belloni, Claudia Villosio
CASE Network Reports No. 114 64
Figure 35. Age-earnings profiles for "high-long" countries in 2002 and 2006

AGE AND PRODUCTIVITY. HUMAN CAPITAL ACCUMULATION AND…
CASE Network Reports No. 114 65
Source: Own calculations based on SES.
With concave age profiles, which are relatively flat in the prime-age, and the age of maximum earnings not exceeding 50 years, the countries in this group have higher employment at older ages. Even less productive workers or those who cannot expect old-age premia remain in the labour market.
The estimated profiles in the subgroups allowed us to conduct a more detailed analysis of the observed profiles (and productivity) in Estonia, France, Poland and Spain. Estonia and Poland represent countries that underwent a transition from a centrally planned to a market economy in the 1990s and France and Spain represent two Western European countries.

Anna Ruzik-Sierdzinska, Maciej Lis, Monika Potoczna, Michele Belloni, Claudia Villosio
CASE Network Reports No. 114 66
Table 7. Age of maximum monthly earnings (turning point of the profile)
2002 2006 ISCO 1-4
ISCO 5-9
Edu 1 Edu 2 Edu 3 Sec 1 Sec 2 Sec3
EE 36 34 36 26 26 27 36 37 34 33 PL 62 59 68 46 57 61 56 56 48 90 FR 60 62 63 50 68 110 64 59 60 113 ES 58 60 63 64 78 77 70 65 57 55
Source: Own calculations based on SES.
Figure 36. Age earnings profiles by occupation, education and sector - Estonia
Source: Own calculations based on SES.

AGE AND PRODUCTIVITY. HUMAN CAPITAL ACCUMULATION AND…
CASE Network Reports No. 114 67
Figure 37. Age earnings profiles by occupation, education and sector - Poland
Source: Own calculations based on SES.

Anna Ruzik-Sierdzinska, Maciej Lis, Monika Potoczna, Michele Belloni, Claudia Villosio
CASE Network Reports No. 114 68
Figure 38. Age earnings profiles by occupation, education and sector - France
Source: Own calculations based on SES.

AGE AND PRODUCTIVITY. HUMAN CAPITAL ACCUMULATION AND…
CASE Network Reports No. 114 69
Figure 39. Age earnings profiles by occupation, education and sector - Spain
Source: Own calculations based on SES.
In all countries, apart from Spain, the productivity and wages of unskilled workers starts to fall earlier than for the skilled ones. The comparison of profiles for employees with more intellectually demanding occupations (ISCO 1-4) and more manual occupations (ISCO 5-9) also shows a much higher wage premium at older ages in the first group.
Estonia is the country with a very low age of maximum earnings, especially for the lowest educated employees from firms providing data for SES. However, working in the non-market services sector or having a better education

Anna Ruzik-Sierdzinska, Maciej Lis, Monika Potoczna, Michele Belloni, Claudia Villosio
CASE Network Reports No. 114 70
do not assure an increase in expected earnings with age.
Poland, which has average profiles similar to those of many Western European countries, has much more variation between employees from different sectors or occupations. It has an especially high age wage premia in the non-market services sector.
France and Spain are similar, however in France, the age of highest earnings for manual occupations is much lower (50 years) than in Spain (over 60).
Conclusions
In the following part we show that labour market performance, represented here by four clusters of countries, is to some extent correlated with similarities in age-earning profiles for full-time employees. Some findings are in line with e.g. Walewski (2007) that estimated profiles on LFS data for selected European countries.
However, certain differences exist, and they can possibly be attributed to differences in labour market institutions and in incentives to work provided by social security systems.
Latvia, Estonia and Lithuania are small economies with similar characteristics of the age-earning profiles, differing from what we observed in other countries. The profiles suggest very weak age premia and would be an interesting field of further research.
We also confirmed that age-earnings profiles differ for subgroups with specific sectors, occupations or education characteristics. So it is not only the age structure of the work force that affects the dynamics of average earnings but also the structure of the economy.

AGE AND PRODUCTIVITY. HUMAN CAPITAL ACCUMULATION AND…
CASE Network Reports No. 114 71
4. Possibility of Improving Productivity at Older Ages via LLL
Lifelong investments in education are especially important in today’s world, which is characterized by population aging and rapid technical progress. Increased life expectancy (together with low economic growth) has put pressure on the financial equilibrium of many PAYGO pension systems and has forced governments to increase the average retirement age (see, e.g., Gruber and Wise 2004). A longer working life may make investments in adult education more profitable for firms and workers; due to technological changes, firms need to upgrade the skills of their workers, which may lead to higher productivity and lower unemployment, and an increase in economic growth.
Linking the general concept of LLL to quantitative lifelong learning variables has proven to be a difficult task (OECD 2007). Most of the empirical literature on LLL analyses training, which is a well-defined and relatively easily measurable variable. Information on training has started to be gathered in national surveys such as the National Longitudinal Survey of Youth (NLSY) in the United States and the British Social Attitudes Survey (Lynch 1992, Booth 1991). More recent studies have also exploited the Follow-Up to the School Leavers Survey (FSLS) for Canada (Parent 2003) and the National Child Development Survey (NCDS) for Britain (Blundell et al. 1996, Aralumpalam and Booth 2001). In addition, employer-based and matched employer-employee surveys are also becoming quite popular in national studies (Göbel and Zwick 2010, Roger and Wasmer 2011, Heywood et al. 2010, Kristensen 2012).
At the international level, there are three adult literacy surveys carried out by the OECD: the International Adult Literacy Survey (IALS) carried out in 1994, 1996 and 1998, the Adult Literacy and Lifeskills Survey (ALL) conducted in 2003 and 2006, and the forthcoming Programme for the International Assessment of Adult Competencies (PIAAC)10. Few European countries fall
10 The survey was implented in 2011-2012. The first results will be released in October 2013.

Anna Ruzik-Sierdzinska, Maciej Lis, Monika Potoczna, Michele Belloni, Claudia Villosio
CASE Network Reports No. 114 72
in the ALL sample (Italy, Norway and Switzerland), while the IALS survey covers a larger number of European countries, but has limited information on the labour market status of trainees. None of these three sources has a longitudinal dimension. Moreover, CEDEFOP carries the Continuing Vocational Training Survey (CVTS), an employer survey covering firms with more than 10 employees in 25 European countries. This survey contains information on firms providing training but has little aggregate information on trainees and no data at the individual employee level11. The OECD and CEDEFOP surveys have mainly been used in international institutional reports (OECD 2004, 2005, CEDEFOP 2010)12. Thanks to its longitudinal dimension and to the provision of detailed information on individuals’ socioeconomic characteristics, the European Community Household Panel (ECHP) has been used more extensively than the above-mentioned datasets to analyse training participation in EU countries (Dieckhoff 2007, Arulampalan et al. 2010, Bassanini et al. 2007)13. The EU Labour Force Survey (EULFS) and the corresponding national labour force surveys have also been frequently used for this scope (Dearden et al. 2006 for the UK, Gerfin 2004 for Switzerland)14.
4.1. Descriptive Analysis Based on SHARE and ELSA Databases
Sources of data
In this section we use data from the “Survey of Health, Ageing and Retirement in Europe” (SHARE) and from the “English Longitudinal Study of Ageing” (ELSA). The SHARE project, which started in 2004, is a multidisciplinary, cross-national bi-annual household panel survey. The target population consists of individuals aged 50 and over who speak the official language of the respective country and do not live abroad or in an institution, plus their spouses or partners irrespective of age. The questionnaire includes individual and household characteristics, physical and mental health, cognitive abilities and functioning, 11 The CVTS provides information on employer-sponsored training offered during the year prior to the survey. 12 Relevant exceptions are Oosterbeek (1998) and Leuven and Oosterbeek (2000). 13 The ECHP covers 15 EU Countries. The question on training in the survey is: “Have you at any time since January in the previous year been in vocational education or training, including any part-time or short-courses?”. 14 Three out of five European benchmarks to monitor progress in education and training at the European level are based on the LFS dataset (Badescu 2006). An additional source of information on training is the Eurobarometer Survey.

AGE AND PRODUCTIVITY. HUMAN CAPITAL ACCUMULATION AND…
CASE Network Reports No. 114 73
current socio–economic status (including information on employment, income, wealth, pensions), housing, subjective psychological health and wellbeing, social participation and social support and expectations for the future.
Four waves of SHARE are currently available, for which data is available for the years 2004, 2006-2007, 2008-2009 and 2010-2011. The third wave, known as SHARELIFE, asked all previous respondents (in waves 1 and 2) and their partners to provide information on their entire life histories. The retrospective information ranges from childhood health to relationships to housing to work careers. The survey design of SHARELIFE was implemented following the literature on retrospective data collection in order to improve the respondents’ recall ability (Schröder, 2011).
Changes from the first wave to the fourth wave resulted in total 17 countries participating in the survaz. These represent 4 different European regions: Northern Europe (Denmark, Sweden), Continental Europe (Austria, Belgium, France, Germany, the Netherlands, Switzerland), Southern Europe (Greece, Italy, Spain, Portugal), Eastern Europe (Poland, Czech Republic, Hungary, Slovenia, and Estonia). The common questionnaire and interview mode and the standardization of procedures ensure cross-country comparability (Börsch-Supan and Jürges 2005).
Similarly to SHARE, ELSA is a longitudinal multidisciplinary survey from a representative sample of the English population aged 50 and older. It collects both objective and subjective data related to health and disability, biological markers of disease, economic circumstance, social participation, networks and well-being. The third wave of ELSA includes “The Life History Interview” (ELSA LHI) aimed at collecting retrospective data in a number of different areas including housing and geographic mobility, cohabiting relationships, children, and jobs and earnings. This module represented the basis for the SHARELIFE design. The similarity of scopes and survey design between SHARE and ELSA increases the comparability of results between the SHARE countries and England.
The most relevant feature of the SHARE data for the analysis of LLL consists in its wide (and widening) country coverage, which facilitates the international comparability of results. Particular caution is in fact needed when trying to document cross-country differences in training using separate sources of data, due to the idiosyncratic definition of the concept of training in each specific survey (see, e.g., Bassanini et al. 2007)15. SHARE and ELSA contain very similar information on LLL. They potentially allow for an analysis of LLL which 15 Nevertheless, the comparability of results across countries included in a cross-country dataset such as SHARE remains a critical issue. The concept and perceived meaning of training is in fact heterogeneous across countries.

Anna Ruzik-Sierdzinska, Maciej Lis, Monika Potoczna, Michele Belloni, Claudia Villosio
CASE Network Reports No. 114 74
complements (i) (flow measures of) current/recent training, i.e. training taken at ages 50 and over (henceforth “older-age training”) with (ii) (stock measure of) external general training, mainly undertaken by job-switchers throughout their whole working career until age 50 (henceforth “younger-ages general training”). Information on (i) is gathered from the standard cross-sectional waves of the two datasets, whereas information on (ii) is collected from SHARELIFE and the corresponding ELSA LHI.
In the standard waves of SHARE and ELSA, the interviewees (in particular those currently employed) are asked whether they attended any educational or training course in the last period (month or year, see tables for details)16. In SHARELIFE and ELSA LHI, individuals are asked to reconstruct their entire working career. Job spells are recorded over the timeline; if there is a gap of 6 months or more between the end of continuous full-time education and the start of a first job or between jobs, the interviewee is asked about what (s)he has done during that gap and “training” in one response option. Moreover, only in SHARELIFE, are individuals who declared to have worked part-time in one of the spells asked for the reason they worked part-time and “education/training” is offered as a possible response. For the purposes of our analysis, we thus categorise episodes of education/training into: 1) training after full-time education, 2) training between jobs and 3) training during part-time employment17.
We selected individuals from the original data sources. First, we excluded those (partners) younger than 50, and those who never worked (in total about 9% of the initial samples). In SHARELIFE and ELSA LHI, we further selected people who attended full-time education. The final SHARELIFE sample consists of 23,482 individuals, who declared to have taken a total of 1282 episodes of training/education during life; most of these episodes occurred between job spells (707). The final sample from ELSA LHI includes 7,035 individuals taking 561 training activities between jobs and 191 episodes after having finished full-time education and before the first job.
In the cross-sectional waves of SHARE and ELSA, to measure the incidence of older-age training, we sub-select employed (both employees and self-employed) individuals. To compare statistics from SHARE and ELSA which refer to similar periods of time, as well as to increase the sample size, we pooled together SHARE
16 Little additional information on the training activity is recorded in SHARE. Trainees are asked the details on the frequency of the training activities (“how often in the last month/year…”) and the motivation for their attendance. We do not exploit this information in this analysis because it is not included in ELSA, and because the set of alternative responses was changed across SHARE waves. 17 There are no further questions on the characteristics of the training activities in SHARELIFE and ELSA LHI.

AGE AND PRODUCTIVITY. HUMAN CAPITAL ACCUMULATION AND…
CASE Network Reports No. 114 75
waves 1 (year 2004) and 2 (year 2006-2007) and compared the resulting data with ELSA pooled waves 1 (2002-2003), 2 (2004-2005) and 3 (2006-2007). In addition, to have more recent evidence on LLL, we compared the newly available wave 4 of SHARE (year 2010) with ELSA waves 4 (year 2008-2009) and 5 (2010-2011). These samples include the following number of employed individuals: 17,650 in SHARE waves 1 and 2 (receiving 2,457 episodes of training in the last month); 14,776 in SHARE wave 4 (receiving 3,818 episodes of training in the last year); 10,776 in ELSA waves 1, 2 and 3; 7,292 in ELSA waves 4 and 5.
Results
We present the training participation rates disaggregated by key individual characteristics - gender, cohort, educational attainment (ISCED for SHARE countries) – and by country and macro European area of residence. We first comment on findings for younger-ages general training, which we obtain from the retrospective interviews of SHARE and ELSA, and then we show the results for older-age training from the standard waves of the two datasets. Notice that while participation rates for older-age training are computed as a ratio between the number of trained and employed individuals, for younger-ages general training, the denominator of the ratio is given by the entire selected population, regardless of the employment condition at the time of the interview.
Table 8. Younger-ages general training participation rate by type of gap in the working career during which training was taken, gender, cohort and educational attainment – SHARELIFE and ELSA LII
Total * After full time
education Between jobs
During part-time employment
SHARE
LIFE ELSA
LII SHARE
LIFE ELSA
LII SHARE
LIFE ELSA
LII SHARE
LIFE Total 4.3% 8.5% 1.1% 1.5% 2.3% 7.3% 1.1% Gender Male 4.4% 8.5% 0.7% 0.8% 2.6% 7.9% 1.2% Female 4.3% 8.5% 1.4% 2.2% 2.1% 6.7% 1.1% Cohort 1940 and before 3.1% 6.4% 1.2% 1.6% 1.4% 5.0% 0.6% 1941-1950 4.4% 9.4% 0.9% 1.5% 2.6% 8.3% 1.1% 1951-1960 6.2% 12.0% 1.2% 1.3% 3.5% 10.9% 1.9% Educational attainment** Primary and lower secondary education (ISCED 1-2)
3.2% - 1.4% - 1.1% - 0.8%
Upper and post-secondary education (ISCED 3-4)
3.2% - 0.8 - 1.7% - 0.9%
Tertiary education (ISCED 5-6) 9.3% - 1.1% - 6.5% - 2.6% missing/don't know/other 3.3% - 1.0% - 1.6% - 0.8%
Note: Weighted statistics; * ELSA LII does not provide information on training during part-time employment, ** not available in ELSA LII.

Anna Ruzik-Sierdzinska, Maciej Lis, Monika Potoczna, Michele Belloni, Claudia Villosio
CASE Network Reports No. 114 76
Table 8 reports the percentage of individuals who attended at least one educational/training course during their lifetime, by type of gap in the working career during which the training was taken (either after full-time education, between jobs or during part-time job). The overall participation rate is equal to 4.3% in SHARE countries (3.4% excluding during part-time) and it is much higher (8.5%) in England. Most of the participation in younger-ages general training occurs between jobs (2.3% in SHARE countries and 7.3% in England). Younger cohorts tended to participate more in general training than older cohorts. This outcome is not surprising, given the technical progress which characterizes the labour market and frequent skill upgrading required; moreover the working careers of younger cohorts tend to be more interrupted than those of older ones, as changing job needs mean they are more likely to have to acquire new competences. Females participate much more than males to training after full-time education (e.g. in England the female general training participation rate before starting to work is equal to 2.2%, versus a corresponding value of 0.8% for males), whereas they participate somewhat less in the middle of their careers. These gender gaps may be driven by a lower labour force participation rate of females; note that there is basically no difference in training participation rates by gender during part-time employment. Finally, the rates of participation to younger-ages general training increase with the level of education if the training activity was undertaken during jobs by job-switchers, while they decrease with educational attainment if the training activity was taken after full-time education. We find a sizable difference in the training participation rate between individuals holding an upper- and post-secondary education degree and those holding a tertiary education degree (e.g. 2.6% versus 9.1% considering time between jobs and during part-time employment).
Table 9 shows younger-ages general training participation rates by country (SHARELIFE). The table reveals a wide heterogeneity in participation in general training across European countries. Participation rates are much higher in the North (especially Sweden, total 24.7%) than in the other analysed countries. A remarkably high participation rate is also found for Switzerland (total 12.2%). Continental countries have quite homogenous training participation rates, with the exceptions of Switzerland and Austria, which are characterized by a very low rate, ranging from 3% to 5%. The total participation rate in Southern EU countries (4%) is similar to what is found for Continental countries (4.2%). Nevertheless, most of the training in Southern European countries is taken after full-time education and before entering the labour market (this type of training participation rate is higher than 2% in Italy and Spain, and is only comparable with the value of Switzerland), whereas in Continental countries, training is mostly performed either between jobs or while working part-time. Finally, Eastern European countries (together with Greece) show the lowest rates

AGE AND PRODUCTIVITY. HUMAN CAPITAL ACCUMULATION AND…
CASE Network Reports No. 114 77
of participation in training in Europe, with the Czech Republic showing a total rate as low as 0.5%.
Table 9. Younger-ages general training participation rate by country - SHARELIFE
Total After full time
education Between jobs
During part-time employment
Country Austria 1,1% 0,3% 0.6% 0.2% Germany 3,4% 0,2% 2.9% 0.4% France 5,3% 1,0% 2.7% 2.1% Netherlands 3,6% 0,3% 1.1% 2.3% Switzerland 12,2% 3,2% 7.3% 3.4% Belgium 2,3% 0,8% 0.7% 0.8% Continental EU 4.2% 0.6% 2.6% 1.2% Denmark 6,5% 1,0% 4.1% 1.6% Sweden 24,7% 1,2% 21.6% 2.6% Northern EU 18.0% 1.1% 15.2% 2.2% Czech Republic 0,5% 0,2% 0.0% 0.2% Poland 1,3% 0,5% 0.1% 0.7% Eastern EU 1.1% 0.4% 0.1% 0.6% Spain 4,0% 2,2% 0.4% 1.5% Italy 4,3% 2,5% 1.1% 0.9% Greece 1,8% 1,0% 0.1% 0.7% Southern EU 4.0% 2.3% 0.8% 1.1% Total 4,3% 1,1% 2.3% 1.1%
Note: Weighted statistics.
The life course design of SHARELIFE and ELSA LHI allows for an analysis of the number of training episodes that each individual has undertaken during his or her life time (details available upon request), as well as the age at which such episodes have taken place. The share of workers participating in more than one training episode during their lives is rather low among the group of studied countries. Only 7% (11.7%) of workers reporting training episodes over their lifetime in SHARELIFE (ELSA LHI) attended more than one course, the vast majority of them report having taken two training courses. The distribution of training episodes by age at training (see Figure 40) confirms theory predictions of a higher incidence of training in the first years of a worker’s career. Most ofthe training occurs at young ages: 50% of the training episodes for workers in SHARELIFE and 38% of the training episodes for English workers occurred before the age of 25. Training participation at higher ages is somehow more frequent in England than, on average, in the countries included in SHARE; however a clear declining path with age emerges in both samples.

Anna Ruzik-Sierdzinska, Maciej Lis, Monika Potoczna, Michele Belloni, Claudia Villosio
CASE Network Reports No. 114 78
Figure 40. Training episodes for job switchers (“training between jobs”) by age at training SHARELIFE and ELSA LHI
0%
5%
10%
15%
20%
25%
30%
35%
40%
15-19 20-24 25-29 30-34 35-39 40-44 45-49 50-54 55-59
SHARELIFE ELSA LII
Note: Weighted statistics.
We now turn to results for older-age training participation, obtained from the standard waves of SHARE and ELSA. Table 10 shows the percentage of employed individuals who attended educational or training courses in the last month or year, by gender, age and educational attainment. We present two alternative sets of results which refer to training received either in the last month (in this case evidence refers to 2002–2007) or in the last year (in this case the analysis refers to a more recent period – the years 2008-2011). The table shows that participation in training is higher for females than for males, declines with age,18 and increases with level of educational attainment. These results are common in the literature (see Arulampalam et al. 2004) and in line with results found for younger-ages general training (with the exception of gender, note that here the condition is being employed).
18 This result is however less clear if one looks at the fourth wave of SHARE, where we observe a decline in the incidence only starting at age 70.

AGE AND PRODUCTIVITY. HUMAN CAPITAL ACCUMULATION AND…
CASE Network Reports No. 114 79
Table 10. Older-age training participation rate by gender, age and educational attainment SHARE and ELSA, various cross sections
Activities in last MONTH:
Attended an educational or training course
Activities in last YEAR: Attended an educational or training
course SHARE(1) ELSA(2) SHARE(3) ELSA(4) Total 10.8% 9.8% 20.6% 14.2% gender male 9.7% 7.8% 18.1% 13.6% female 12.3% 12.2% 23.6% 14.9% age: 50-60 11.0% 10.9% 20.6% 15.3% 61-70 9.7% 6.4% 21.5% 12.5% 71 + 2.9% 4.0% 11.7% 4.8% Educational attainment* Primary and lower secondary education (ISCED 1-2)
4.3% 6.1%
Upper and post-secondary education (ISCED 3-4)
9.1% 16.5%
Tertiary education (ISCED 5-6)
18.5% 33.8%
missing/don't know/other 11.4% 23.1% nvq4/nvq5/degree 17.4% 19.8% higher ed below 15.6% 17.3% nvq3/gce a level 9.7% 16.6% nvq2/gce o level 10.1% 13.0% nvq1/cse other g 5.5% 9.2% foreign/other 9.2% 12.8% no qualification 3.1% 4.7%
Notes: Weighted statistics; (1) waves 1 and 2; (2) waves 1, 2 and 3; (3) wave 4; (4) waves
4 and 5; * educational classification in ELSA not converted in ISCED.
In Table 11, older-age training participation rates are disaggregated by country. The overall picture is similar to that illustrated for younger-ages general training (Table 9), with some remarkable exceptions. Northern European countries have the highest levels of participation in training at older ages, followed by the Continental countries. Among the Continental countries, France appears to have a relatively lower participation rate (8.9% in the last month, cf. with a group average of 12.4%). This result is confirmed by looking at more recent rates computed on an annual basis. England (see table 10) shows participation rates equal to 9.8% (monthly) and 14.2% (on an annual basis). The most remarkable evidence from Table 11 is the very low incidence of training at older ages in Southern European countries, which is lower than in Eastern European countries. Italy is the country

Anna Ruzik-Sierdzinska, Maciej Lis, Monika Potoczna, Michele Belloni, Claudia Villosio
CASE Network Reports No. 114 80
with the lowest incidence of older-age training (3.9% on monthly basis) between the analysed European countries19. Interestingly, Estonia (data are only available for older-age training in recent years) shows a remarkable participation rate (28.5%), which is much higher than in the other Eastern EU countries and in line with most of the Continental countries.
Finally, we compare the results in Table 11 (second column) with training participation rates for the whole working population (age 15-64) reported in Bassanini et al. (2007)20. The comparison shows a strong positive association between total rates and rates at older ages21 and highlights a general (expected) reduction of training rates at older ages in almost all countries.
Table 11. Older-age training participation rate by country – SHARE, various cross sections
Activities in last MONTH: Attended an educational or training course*
Activities in last YEAR: Attended an educational or
training course**
Austria 12.4% 27.2% Germany 12.3% 25.0% France 8.9% 19.5% Netherlands 14.6% 39.0% Switzerland 27.2% 33.5% Belgium 16.1% 33.8% Continental EU 12.4% 25.2% Denmark 19.3% 31.7% Sweden 24.9% 33.8% Northern EU 23.0% 33.1% Check Republic 10.7% 18.6% Poland 7.7% 8.6% Hungary 19.3% Slovenia 16.2% Estonia 28.5% Eastern EU 8.7% 14.7%
19 Bassanini et al. (2007) exploit ECHP data and show that there is a lot of within country heterogeneity in training participation rates in EU countries. Even more remarkably, the authors point out that the regional dispersion of participation rates is somewhat negatively related to the country average. In Finland and especially in Sweden, almost no regional variation is found. Conversely, Italy, Greece and Portugal are by far the countries with the greatest disparities. In Italy, the best performing region (Nord-West) shows training incidence rates which are six times higher than the least performing ones (Abruzzo-Molise). 20 See Bassanini et al. (2007) p. 191. Training rates refer to the second half of the 1990s. 21 A few relevant exceptions are worth mentioning: England, France, and Italy, which we found are characterized by a low or very low training participation rate at older ages, show high rates in the overall labour market.

AGE AND PRODUCTIVITY. HUMAN CAPITAL ACCUMULATION AND…
CASE Network Reports No. 114 81
Activities in last MONTH: Attended an educational or training course*
Activities in last YEAR: Attended an educational or
training course**
Spain 5.4% 17.4% Italy 3.9% 4.9% Greece 5.5% Portugal 17.3% Southern EU 4.7% 10.8% Total 10.8% 20.6%
Notes: Weighted statistics; Check Republic and Poland are not present in wave 1, Israel is
only in wave 1 and is not reported, * SHARE waves 1-2; ** SHARE wave 4.
4.2. Estimation Results of the Effect of LLL on Older Workers’ Wages
In this section, we estimate the impact of LLL on older workers’ wages using SHARE data. Like most of the existing literature, we use training as a measure for LLL. We focus on the short-term impact (one to three years) of training on wages.
The econometric model
We consider the following equation for log-wages:
log (w_it)=x_it^' β+τ_(it-k) γ+ε_it (1)
where log (w_it) is the logarithm of weekly wages of an individual i at time t. x is a vector of exogenous demographic and an individual’s job-related characteristics, τ is a dummy variable equal to one if an individual i participated in any training activity at time t-k where k=1,2,3 (distance between interview years), and ε is a random term which satisfies the standard i.i.d. assumptions. The key parameter to be estimated is γ, which measures the causal impact of training on wages.
Under the additional assumption E(τ_(it-k) ε_it |x_it )=0, an OLS estimate of γ is consistent. It is however known that training participation can be correlated with an individual’s unobserved characteristics, such as cognitive ability, which enter the error term ε. To account for this selectivity/omitted variable problem, besides OLS, we estimate equation (1) with the method of instrumental variables (IV).
In the main empirical specification of equation (1), x includes a second order polynomial for age, (log of) tenure, dummy variables for main educational ISCED groups, gender, working in the public or private sector, country of residence,

Anna Ruzik-Sierdzinska, Maciej Lis, Monika Potoczna, Michele Belloni, Claudia Villosio
CASE Network Reports No. 114 82
sector of work, occupation (ISCO 1-digit), and year of interview. In an exploratory alternative specification, equation (1) additionally includes the interaction terms between (group of) country dummies and τ. This specification allows for the effect of training on wages to be heterogeneous across groups of European countries22.
Data and sample selection
We estimate equation (1) using SHARE data, panel component of waves 1 (years 2004-5) and 2 (years 2006-7)23. Therefore, we estimate the short-term impact (one to three years) of training on wages24. From this data, we sub-select employees aged 50 and over, working between 15 and 70 hours per week, and residing in one of the following 11 countries: Austria, Germany, Sweden, Netherlands, Spain, Italy, France, Denmark, Greece, Switzerland, Belgium. These countries cover Continental, Northern and Southern Europe25.
We reconstruct the dependent variable log (w_it) from the second wave of SHARE, exploiting a question on the last payment taken home from work (net of tax, national insurance or pension and health contributions) as well as frequency of payments and weeks worked during the year. To account for outliers, we exclude the top and bottom 1% of the obtained weekly wage distribution. Training activities were measured in SHARE wave one. As outlined earlier, individuals were asked whether they attended any educational or training course in the last month.
Figure 41 reports the resulting (log-) weekly wage distribution, distinguishing between untrained and trained workers. It highlights that the distribution of trained workers is somewhat shifted to the right with respect to that of untrained workers
22 We also experimented interacting training with individuals’ demographic and work-related characteristics (such as gender, public/private sector, educational levels, etc.). We did not find any significant effect for the interaction terms. Too little information in many of the interaction variables limits the feasibility of this exercise. 23 Unfortunately, we could not exploit the recently released 4th wave of the SHARE questionnaire. The dependent variable of our model could not, in fact, be reconstructed for the last available wave. Having 3 waves of data at our disposal would have allowed us to estimate a panel data version of equation (1), which is an advantage in handling the endogeneity problem outlined above. Alternatively, with 3 waves, we could have extended the country coverage, keeping in this case a pooled cross-sectional version of equation (1). 24 The parameter estimate of an interaction term of training with the variable “distance from training” - ranging from 1 to 3 years - turned out to be insignificant. 25 Eastern Europe could not be represented in the econometric analysis, since Czech Republic and Poland joined SHARE in its second wave (the estimation of equation 1 requires individuals to be observed in both waves 1 and 2).

AGE AND PRODUCTIVITY. HUMAN CAPITAL ACCUMULATION AND…
CASE Network Reports No. 114 83
(the means of the two distributions are statistically different at 1% significance level).
Figure 41. Log weekly wage distribution by training status
0.5
11
.5
1 2 3 4 5lwage
Untrained workers Trained workers
Source: Own estimations.
Table 12 below shows descriptive statistics for the estimation sample, distinguishing between untrained and trained workers. The selected sample consists of 2,312 individuals, 17.78% of which undertook training recently. The majority of the trained workers (55%) are females, while the majority of untrained workers are males. 28% of trained workers work in the public sector, mostly in the education sector; the quota of public sector workers is lower (22%) among untrained workers. More than 50% of trained workers have a tertiary education degree (ISCED 5-6), whereas among untrained workers, upper and post secondary education (ISCED 3-4) is the dominating education level (40%).
As an exclusion restriction for the IV estimation of equation (1), we construct the instrumental variable: “frequency in attending activities (excluding training) over

Anna Ruzik-Sierdzinska, Maciej Lis, Monika Potoczna, Michele Belloni, Claudia Villosio
CASE Network Reports No. 114 84
the last 4 weeks”26. The idea behind this choice is to classify individuals according to their “activism”; those more active and lively are more likely to also participate in training activities (assuming that activism does not affect weekly wages). We will come back to the validity of our selected instrument later on27. The instrumental variable “frequency in attending activities in the last four weeks” is on average higher for trained than for untrained workers (2.07 versus 1.40, Table12).
Table 12. Estimation sample: descriptive statistics Variable
Untrained workers Trained workers Mean Std. Dev. Mean Std. Dev.
Log of weekly wage 2.48 0.45 2.68 0.42 Log of tenure 2.84 0.91 2.93 0.88 Female 0.43 0.50 0.55 0.50 Age 54.89 3.63 54.45 3.30 age^2 (/100) 30.26 4.12 29.75 3.67 public sector 0.22 0.42 0.28 0.45 Education No education (ISCED 0) 0.02 0.15 0.01 0.07 Primary and lower Secondary education (ISCED 1-2) 0.28 0.45 0.09 0.29 Upper and post-Secondary education (ISCED 3-4) 0.40 0.49 0.39 0.49 Tertiary education (ISCED 5-6) 0.29 0.46 0.51 0.50 Sector of economic activity agriculture. hunting. forestry. fishing 0.01 0.08 0.00 0.04 mining and quarrying 0.01 0.09 0.01 0.08 Manufacturing 0.19 0.39 0.11 0.31 electricity. gas and water supply 0.01 0.12 0.00 0.07 Construction 0.08 0.27 0.03 0.17 wholesale and retail trade 0.06 0.24 0.03 0.18 hotels and restaurants 0.03 0.18 0.01 0.10 transport. storage and communication 0.06 0.24 0.03 0.18 financial intermediation 0.03 0.17 0.02 0.12 real estate. renting and business activities 0.07 0.26 0.05 0.21 public administration and defence; compulsory social security 0.12 0.32 0.13 0.34 Education 0.11 0.32 0.34 0.47
26 Individuals were asked the frequency with which they attended the following activities over the last 4 weeks: a) participated in voluntary or charity work, b) provided help to friends or neighbors, c) went to a sport, social or other kind of club, d) took part in activities of a religious organization (church, synagogue, mosque etc.), e) took part in a political or community-related organization. Codification of the frequency of attendance is: Almost daily =3, Almost every week = 2, Less often =1, Never=0. For each individual, we sum up over a-e to obtain the variable “frequency in attending activities (excluding training) over the last 4 weeks”. 27 Due to the characteristics of the SHARE data, it was not possible to use frequently used instruments such as supply-side sources of variation in training (Card 2000, Kuckulens and Zwick 2004) or pre-training individual characteristics (Blundell et al. 1996 and 1999, Arulampalam and Booth 2001). Following Nudra and Pereira (2007), we unsuccessfully tried “having a second job” and “marital status” as instruments.

AGE AND PRODUCTIVITY. HUMAN CAPITAL ACCUMULATION AND…
CASE Network Reports No. 114 85
Variable
Untrained workers Trained workers Mean Std. Dev. Mean Std. Dev.
health and social work 0.13 0.34 0.18 0.39 other community. social and personal services 0.08 0.28 0.06 0.24 Occupation legislator. senior official or manager 0.09 0.28 0.11 0.32 Professional 0.19 0.40 0.35 0.48 technician or associate professional 0.18 0.38 0.22 0.42 Clerk 0.14 0.35 0.14 0.34 service worker and shop and market sale 0.11 0.32 0.11 0.31 skilled agricultural or fishery worker 0.01 0.10 0.00 0.04 craft and related trades worker 0.09 0.29 0.04 0.19 plant and machine operator or assembler 0.08 0.27 0.02 0.13 elementary occupation 0.11 0.31 0.02 0.13 Country Austria 0.03 0.18 0.03 0.18 Germany 0.27 0.44 0.34 0.47 Sweden 0.07 0.25 0.12 0.33 Netherlands 0.05 0.23 0.05 0.22 Spain 0.13 0.33 0.07 0.25 Italy 0.13 0.34 0.07 0.25 France 0.18 0.39 0.13 0.33 Denmark 0.04 0.21 0.06 0.24 Greece 0.02 0.14 0.02 0.13 Switzerland 0.02 0.15 0.06 0.24 Belgium 0.05 0.21 0.06 0.24 Year of interview 2006 0.68 0.47 0.69 0.46 Instrumental variables: frequency in attending activities over the last 4 weeks 1.40 1.73 2.07 2.04 Number of observations 1901 411
Source: Own calculations.
Results
Table 13 shows parameter estimates for equation (1). Column (i) reports OLS estimates, whereas columns (ii-iii) display IV estimates. The OLS point estimate for the training variable is equal to 0.0648 and is significant at the 1% level (see column i) thereby suggesting that taking training determines a wage increase of about 6.5%. This effect is sizable, and is similar to the return to primary and lower secondary education (0.223-0.161=6.2 %). It is also consistent with existing literature. All the control variables in column (i) have the expected sign and are highly significant: weekly wages increase with tenure, age, and education attainment; moreover there is wide heterogeneity in wages across countries, sectors and occupations.
We then turn to the IV estimates (columns ii-iii). It is worth commenting on the selection into training (first stage regression, column ii). Higher educated workers (ISCED > 2) are more likely to participate in training. Moreover, females participate in more trainings than males. Public sector workers (depending on the sector) participate in fewer training activities than private sector workers

Anna Ruzik-Sierdzinska, Maciej Lis, Monika Potoczna, Michele Belloni, Claudia Villosio
CASE Network Reports No. 114 86
(these last two variables are significant at the 10% level). Participation in training increases with tenure and decreases with age; however these parameters are imprecisely estimated. The education sector is characterized by a higher participation rate in training than other sectors. Most of these results are consistent with the descriptive findings illustrated in the previous section (see Table 10). In comparison with Germany, workers in Switzerland and Sweden participate significantly more in training, while they participate significantly less in Italy, France, and (surprisingly) the Netherlands. Although coefficients for some countries are imprecisely estimated, we generally find a ranking of countries similar to that outlined in Table 11. Northern European countries having the highest levels of training participation, followed by Continental countries (with a few exceptions) and finally by Southern European countries. The instrumental variable “frequency in attending activities in the last four weeks” is highly significant (t=7.46, partial R-squared = 0.0239).
The IV parameter estimate (columns iii) for the impact of training on wages has a positive sign (and is similar in size to the OLS estimate, 0.09); however, it is very imprecise (s.e. 0.14) and not significantly different from zero. This result would suggest that the OLS estimated impact of training on wages is likely due to unobserved heterogeneity. However, the evidence obtained with the IV method is too weak to be considered as the unique basis upon which to draw firm conclusions. Standard tests for endogeneity do not reject the null hypothesis that the training variable is exogenous (Durbin (score) χ2 (1) = 0.040, p = 0.84). Additional valid instruments would be needed to provide a more solid ground for the IV analysis.
Table 13. Estimation results
VARIABLES
(i) (ii) (iii) OLS Instrumental Variables
log weekly wage participation into
training log weekly wage
Training 0.0648*** 0.0919 (0.0213) (0.137) log tenure 0.0672*** 0.0074 0.0670*** (0.00873) (0.008) (0.00870) Female -0.167*** 0.028* -0.168*** (0.0163) (0.016) (0.0166) Public -0.0635*** -0.0349* -0.0627*** (0.0198) (0.019) (0.0200) age-50 0.0174*** -0.0042 0.0176*** (0.00567) (0.006) (0.00566) (age-50)^2 -0.00170*** -0.0001 -0.00170*** (0.000427) (0.000) (0.000423) No education (ISCED 0) -0.274*** -0.0586 -0.273*** (0.0554) (0.054) (0.0554) Primary and lower secondary education -0.223*** -0.0738*** -0.221***

AGE AND PRODUCTIVITY. HUMAN CAPITAL ACCUMULATION AND…
CASE Network Reports No. 114 87
VARIABLES
(i) (ii) (iii) OLS Instrumental Variables
log weekly wage participation into
training log weekly wage
(ISCED 1-2) (0.0261) (0.025) (0.0278) Upper and post-secondary education (ISCED 3-4)
-0.161*** -0.0284 -0.161***
(0.0202) (0.020) (0.0203) Austria -0.0367 -0.0349 -0.0358 (0.0417) (0.041) (0.0416) Sweden 0.00518 0.0578* 0.00297 (0.0312) (0.030) (0.0328) Netherlands 0.156*** -0.0565* 0.157*** (0.0348) (0.034) (0.0348) Spain 0.0540* -0.0253 0.0550** (0.0276) (0.027) (0.0277) Italy -0.103*** -0.0848*** -0.100*** (0.0271) (0.026) (0.0298) France 0.183*** -0.0772*** 0.185*** (0.0270) (0.026) (0.0289) Denmark 0.0781** -0.0128 0.0779** (0.0363) (0.035) (0.0360) Greece 0.0102 0.0104 0.0104 (0.0530) (0.052) (0.0525) Switzerland 0.426*** 0.1524*** 0.422*** (0.0467) (0.045) (0.0513) Belgium 0.0993*** -0.0046 0.0989*** (0.0353) (0.034) (0.0351) mining and quarrying -0.0570 0.0143 -0.0578 (0.127) (0.124) (0.126) Manufacturing -0.0308 -0.04 -0.0292 (0.105) (0.102) (0.104) electricity, gas and water supply 0.135 -0.0785 0.138 (0.122) (0.118) (0.121) Construction -0.126 -0.0321 -0.125 (0.107) (0.104) (0.106) wholesale and retail trade -0.190* -0.0485 -0.188* (0.107) (0.104) (0.107) hotels and restaurants -0.368*** -0.0497 -0.366*** (0.112) (0.109) (0.111) transport, storage and communication -0.122 -0.0245 -0.120 (0.108) (0.105) (0.107) financial intermediation -0.0658 -0.0755 -0.0630 (0.112) (0.109) (0.112) real estate, renting and business activities -0.178* -0.0197 -0.177* (0.106) (0.103) (0.105) public administration and defence; comp. social security
-0.0788 0.0228 -0.0792
(0.105) (0.102) (0.104) Education -0.0306 0.1919* -0.0354 (0.106) (0.103) (0.107) health and social work -0.0989 0.0381 -0.0993 (0.105) (0.102) (0.104) other community, social and personal services
-0.141 -0.0155 -0.140
(0.106) (0.103) (0.105) Professional -0.00370 -0.0296 -0.00316

Anna Ruzik-Sierdzinska, Maciej Lis, Monika Potoczna, Michele Belloni, Claudia Villosio
CASE Network Reports No. 114 88
VARIABLES
(i) (ii) (iii) OLS Instrumental Variables
log weekly wage participation into
training log weekly wage
(0.0302) (0.029) (0.0300) technician or associate professional -0.148*** 0.0467 -0.149*** (0.0299) (0.029) (0.0302) Clerk -0.248*** 0.0109 -0.248*** (0.0321) (0.031) (0.0318) service worker and shop and market sale -0.249*** 0.0096 -0.250*** (0.0351) (0.034) (0.0349) skilled agricultural or fishery worker -0.683*** -0.0118 -0.682*** (0.0931) (0.091) (0.0925) craft and related trades worker -0.349*** -0.005 -0.348*** (0.0371) (0.036) (0.0369) plant and machine operator or assembler -0.267*** -0.029 -0.266*** (0.0396) (0.039) (0.0395) elementary occupation -0.359*** -0.0454 -0.357*** (0.0369) (0.036) (0.0374) year of interview = 2006 -0.0500** -0.0009 -0.0501** (0.0198) (0.019) (0.0196) Constant 2.736*** 0.1392 2.731*** (0.109) (0.106) (0.112) frequency in attending activities in the last four weeks
0.0333***
(0.004) Observations 2,312 2,312 R-squared 0.431 0.430
Source: SHARE wave 1-2.
Note: Standard errors in parentheses. *** p<0.01, ** p<0.05, * p<0.1.
Excluded categories: Tertiary education (ISCED 5-6), agriculture, hunting, forestry,
fishing, legislator, senior official or manager, Germany, year of interview=2007.
Finally, in an exploratory specification, we allowed for the impact of training on wages to be heterogeneous across a group of European countries: Northern (Denmark, Sweden), Continental (Austria, Belgium, France, Germany, The Netherlands, Switzerland) and Southern (Greece, Italy, Spain)28. In the model, we included a set of interaction terms between training and group of country dummies. We assumed that training is exogenous when performing this exercise. In the literature, evidence has been found of a negative association between incidence and return to training across countries at all working ages (see, e.g., Bassanini et.al., 2007). To provide confirmation of this evidence for older workers, we also estimate an equation for training participation, similar
28 We preliminarily re-estimate equation (1), replacing country dummies with dummies for the group of countries to check for consistency with previous findings.

AGE AND PRODUCTIVITY. HUMAN CAPITAL ACCUMULATION AND…
CASE Network Reports No. 114 89
to that reported in Table 13 column (ii) but replacing country dummies with a group of country dummies.
The results of this exploratory exercise are reported in Table 14 (OLS estimates). The upper part of the table shows estimates for participation in training, whereas its bottom part reports results for the return to training. The highest training incidence is found for Northern countries, followed by Continental (reference country group) and finally by Southern countries. These two estimated differences are sizable and statistically significant. Returns to training are higher in Continental and Southern than in Northern countries29. Therefore, this evidence confirms the existence of a negative association between incidence and returns to training previously found in other studies which do not explicitly focus on older workers.
Table 14. Incidence and return to training by group of European countries – OLS estimates Incidence of training Dep. Variable= participation in training Coeff. Continental (constant) 0.1043 (0.119) Northern 0.0641*** (0.023) Southern -0.0499*** (0.019) Return to training Dep. Variable= log weekly wage Training (base=Continental) 0.1079*** (0.026) Northern*training -0.1575*** (0.057) Southern*training -0.0404 (0.059)
Source: SHARE wave 1-2.
Note: Standard errors in parentheses. *** p<0.01, ** p<0.05, * p<0.1. Other variables included: gender, tenure, age, education, public/private sector, economic activity,
occupation, year of interview.
To summarize, our econometric exercise shows that for employees older than age 50 residing in one of the eleven analysed European countries, participation in training increases wages in the short-term by about 6.5 %. This return
29 We prefer a qualitative interpretation of our findings; confidence intervals are large due to the small sample size. From a purely statistical point of view, these findings indicate that training has a significant impact on wages only in Continental countries.

Anna Ruzik-Sierdzinska, Maciej Lis, Monika Potoczna, Michele Belloni, Claudia Villosio
CASE Network Reports No. 114 90
is comparable to that of primary and lower secondary education. We consider this effect as sizable, since it concerns older workers for which the human capital theory would predict low or no returns. With the data at our disposal, however, we cannot rule out the possibility that returns to training are overestimated, due to unobserved individual heterogeneity. Returns to training are prima facie higher in Continental and Southern countries than in Northern countries, the latter group of countries being characterized by the highest incidence. Therefore, our data reveals the existence of a negative association between incidence and returns to training for older workers, previously found in studies which look at the whole working population.
AGE AND PRODUCTIVITY. HUMAN CAPITAL ACCUMULATION AND…
CASE Network Reports No. 114 91
5. Conclusions
The main aim of this report was to explore different dimensions of links between age, productivity, and lifelong learning. We did it using data from various surveys: LFS, SHARE, ELSA, EU SILC and SES.
We found that age-earning profiles (both for hourly and monthly earnings) in countries with high or low employment at older ages or short or long professional careers have some common characteristics. Some of the similarities can be explained by looking at the structure of the workforce (age, education) and employment (prevailing occupations, sectors). This is in line with the existing literature on different changes in abilities with age in different types of work.
The level and dynamics of earnings until age 50 differ greatly among educational and occupational groups, but the dynamics thereafter are more coherent. Differences can be partially attributed to differences in labour market institutions and in incentives to work provided by social security systems.
Additionally, we showed that the dynamics of average wage are strongly influenced by the timing of entry to and exit from the labour market by persons with various human capital and productivity levels.
The estimation of the impact of LLL on productivity (measured by training and earnings, respectively) at older ages showed that for employees aged 50 and older, participation in training activities may increase wages even by about 6.5 percent. These returns are comparable to that of primary and lower secondary education. Returns to training are prima facie higher in Continental and Southern countries than in Northern countries, the latter group of countries being characterized by the highest incidence. Therefore, consistent with prior evidence concerning the whole working population, we find evidence of a negative association between incidence and returns to training for older workers.
Some of our results have important policy implications. We recommend increasing average labour market participation rates in countries with ageing populations.
Preliminary results of the study using SHARELIFE show that there seems to be a group of employees who work for about 20 years and another group that works for about 40 years. If this result is confirmed by other datasources, there is potential space for effective policies to make people move from one group

Anna Ruzik-Sierdzinska, Maciej Lis, Monika Potoczna, Michele Belloni, Claudia Villosio
CASE Network Reports No. 114 92
to another or to prepare better suited Active Labour Market Programmes. We also show that in some countries, longer activity results not from prolonging work with the same employer but rather by finding new jobs after the age of 50, thereby remaining on the labour market.
Longer working lives also means more profitable investments in adult training and learning for firms and workers. Avoiding older workers’ skills obsolescence through training may lead to higher productivity and lower unemployment, and increase economic growth.

AGE AND PRODUCTIVITY. HUMAN CAPITAL ACCUMULATION AND…
CASE Network Reports No. 114 93
References
Arulampalam, W. and A. Booth (2001): Learning and earning: Do multiple training events pay? a decade of evidence from a cohort of young British men, Economica, 68: pp. 379–400.
Arulampalam, W., A. Booth, and M. Bryan (2010): Are There Asymmetries in the Effects of Training on the Conditional Male Wage Distribution? Journal of Population Economics, 23 (1), pp. 251-272.
Autor, D. H., F. Levy, and R.J. Murnane (2003): The Skill Content Of Recent Technological Change: An Empirical Exploration, Quarterly Journal of Economics,118(4), Nov. 2003.
Badescu, M. (2006): Measuring the outputs and outcomes of vocational training – towards a coherent framework for indicators, CRELL Research Paper 2-May 2006 Luxemburg.
Badescu, M. and M. Saisana (2008): Participation in lifelong learning in Europe: What can be measured and compared? CRELL Research Paper, Luxemburg.
Bassanini, A., A. Booth, G. Brunello, M. de Paola, and E. Leuven (2007): Workplace Training in Europe, [in:] Brunello, Garibaldi and Wasmer (eds.), Education and Training in Europe, Oxford University Press, Ch. 8-13.
Becker, G. (1964): Human Capital: a Theoretical and Empirical Analysis, with special reference to education, The University of Chicago Press, Chicago.
Becker, G. (1993): Human Capital: a Theoretical and Empirical Analysis, with special reference to education, 3rd ed., The University of Chicago Press, Chicago.
Bengtsson, J. (2009): National Strategies for Implementing Life Long Learning (LLL): an International Perspective, PASCAL International Observatory, http://pascalobservatory.org/
Black, S.E. and M.L. Lynch (2001): How to Compete: the Impact of Workplace Practices and Information Technology on Productivity, The Review of Economics and Statistics, August 2001, 83(3): pp. 434–445.
Blöndal, S. and S. Scarpetta (1999): The retirement decisions in OECD countries, DP No. 202, OECD Publishing.
Blundell, R., L. Dearden, and C. Meghir (1996): The Determinants and Effects of Work Related Training in Britain. London: Institute of Fiscal Studies.

Anna Ruzik-Sierdzinska, Maciej Lis, Monika Potoczna, Michele Belloni, Claudia Villosio
CASE Network Reports No. 114 94
Blundell, R., L. Dearden, and C. Meghir (1999): Work-related training and earnings. Mimeo, Institute of Fiscal Studies.
Bonnal, L., D. Fougère, and A. Sérandon (1997): Evaluating the impact of French employment policies on individual labour market histories. Review of Economic Studies 64: pp. 683–713.
Booth, A. (1991): Job-related formal training: who receives it and what is it worth? Oxford Bulletin of Economics and Statistics, 53: pp. 281–294.
Booth, A. (1993): Private sector training and graduate earnings. Review of Economics and Statistics, 75(1), pp. 64–170.
Booth, A. and M. Bryan (2007): Who pays for general training? New evidence for British men and women, Research in Labour Economics, 26, pp. 85-123.
Börsch-Supan, A. and H. Jürges (eds.) (2005): The Survey of Health, Ageing and Retirement in Europe – Methodology. Mannheim: MEA.
Budria, S. and P. T. Pereira (2007): The wage effects of training in Portugal: differences across skill groups, genders, sectors and training types, Applied Economices, 39(6),
pp. 787-807.
CEDEFOP (2010): Employer-provided vocational training in Europe. Evaluation and interpretation of the third continuing vocational training survey, Research Paper No 2, Luxemburg.
Crépon, B., M. Ferracci, and D. Fougère (2007): Training the unemployed in France: How does it affect unemployment duration and recurrence? Annales d’Economie et de Statistique, 2012, 107-108, pp. 175-199
D’Addio, A., M. Keese, and E. Whitehouse (2010): Population Ageing and Labour Markets, Oxford Review of Economic Policy 26 (4), pp. 613-635.
de Luna, X., A. Stenberg, and O. Wetserlund (2010): Can adult education delay retirement from the labour market? Journal of Population Economics; 25(2); pp. 677-696.
Dearden, L., H. Reed, and J. Van Reenen (2006): The Impact of Training on Productivity and Wages: Evidence from British Panel Data, Oxford Bulletin of Economics and Statistics 68(4), pp. 397-421.
Dieckhoff, M. (2007): Does it Work? The Effect of Continuing Training on Labour Market Outcomes: A Comparative Study of Germany, Denmark, and the United Kingdom, European Sociological Review, 23(3), pp. 295-308.
Ebbinghaus, B. and N. Whiteside (2012): Shifting responsibilities in Western European pension systems: What future for social models?, Global Social Policy 12.3 (2012): pp. 266-282.

AGE AND PRODUCTIVITY. HUMAN CAPITAL ACCUMULATION AND…
CASE Network Reports No. 114 95
Esping-Andersen, G. (1990), The three worlds of welfare capitalism, Cambridge: Polity Press & Princeton: Princeton University Press.
European Commission (2000): A Memorandum on Lifelong Learning, Staff Working Paper, Brussels, Commission of the European Communities, SEC(2000) 1832.
European Commission (2001): Making a European Area of Lifelong Learning a Reality, Communication from the Commission to the Council, COM(2001) 678 final, Brussels.
Fan, J. and I. Gijbels (1996): Local polynomial modelling and its applications. Chapman & Hall.
Fougère, D., D. Goux, and E. Maurin (2001): Formation continue et carrières salariales. une évaluation sur données individuelles, Annales d’Économie et de Statistique, 62: pp. 49–69.
Frazis, H. and M. Loewenstein (2005): Reexamining the returns to training: Functional form, magnitude, and interpretation, The Journal of Human Resources Vol. 40, No. 2 (Spring, 2005), pp. 453-476.
Gerfin, M. (2004): Work-Related Training and Wages: An Empirical Analysis for Male Workers in Switzerland, IZA DP n. 1078.
Göbel, C. and T. Zwick (2009): Age and productivity-Evidence from linked employer employee data, ZEW-Centre for European Economic Research Discussion Paper 09-020 (2009).
Göbel, C. and T. Zwick (2010): Which personnel measures are effective in increasing productivity of old workers?, ZEW Discussion Papers, No. 10-069, http://hdl.handle.net/10419/41432
Goux, D. and E. Maurin (2000): Returns to firm-provided training: Evidence from French worker-firm matched data. Labour Economics, 7: pp. 1–19.
Gritz, R. (1993): The impact of training on the frequency and duration of employment, Journal of Econometrics 57: pp. 21–51.
Gruber, J. and D.A. Wise (2004): Introduction and summary, in Social Security Programs and Retirement around the World: Micro-Estimation, Jonathan Gruber and David A. Wise, eds., chapter 1, pp. 1-40. National Bureau of Economic Research, University of Chicago Press.
Heywood, J. S., U. Jirjahn, and G. Tsertsvardze (2010): Hiring older workers and employing older workers: German evidence, Journal of Population Economics (2010) 23: pp. 595–615.

Anna Ruzik-Sierdzinska, Maciej Lis, Monika Potoczna, Michele Belloni, Claudia Villosio
CASE Network Reports No. 114 96
Ichniowski, C., K. Shaw, and G. Prennushi (1997): The Effects of Human Resource Management Practices on Productivity: A Study of Steel Finishing Lines, American Economic Review 87 (3), pp. 291-313.
Katzman, R. (1993): "Education and the prevalence of dementia and Alzheimer's disease." Neurology 1993 Jan;43(1), pp. 13-20.
Keyfitz, N. (1984): Age and productivity, Journal of Policy Analysis, No.3, pp. 629-640.
Kristensen, N. (2012): Training and Retirement, IZA Discussion Paper No. 6301, January 2012.
Kuckulenz, A. and T. Zwick (2003): The impact of training on earnings – Differences between participant groups and training forms. ZEW Discussion Paper 03–57.
Lang, J. (2012): The aims of lifelong learning: Age-related effects of training on wages and job security, SOEPpapers on Multidisciplinary Panel Data Research, n 478 / 2012
Lazear, E. (1979): Why is there mandatory retirement, Journal of Political Economy, 87, pp. 1261-1284.
Lechner, M., R. Miquel, and C. Wunsh (2008): The curse and blessing of training the unemployed in a changing economy: The case of East Germany after unification. German Economic Review 8: pp. 468–509.
Leuven, E. and H. Oosterbeek (2000): The Demand and Supply of Work-Related Training: Evidence from Four Countries, in Polacheck S. and J. Robst (eds), Research in Labour Economics, 18, pp. 303-330.
Loewenstein, M. and J. Spletzer (1998): Dividing the Costs and Returns to General Training, Journal of Labour Economics, 16(1), pp. 142-171.
Long, M. (2001): The effect of firm-based training on earnings. Working Paper 37, Monash University.
Lyberaki, A., P. Tinios, and G. Papadoudis (2011): Atypical Work Patterns of Women in Europe: What Can We Learn From SHARELIFE? [in:] The Individual and the Welfare State. Life Histories in Europe, eds. A. Börsch-Supan, M. Brandt, K. Hank, M. Schröder, 2011.
Lynch, L. (1992): Private-sector training and the earnings of young workers, American Economic Review, 82(1) pp. 299-312.
Maitland, S. B., R. C. Intrieri, K. W. Schaie, and S. L. Willis (2000): Gender differences and changes in cognitive abilities across the adult life span, Aging, Neuropsychology, and Cognition, Vol. 7, No. 1, pp. 32-53.

AGE AND PRODUCTIVITY. HUMAN CAPITAL ACCUMULATION AND…
CASE Network Reports No. 114 97
Minois, N. and E. Le Bourg (1997): Hypergravity and Aging in Drosophila Melonagaster. 9. Conditioned suppression and Habituation of the Proboscis Extension Response, Aging, Experimental and Clinical Research, Vol. 9. No. 4, pp. 1-11.
Montizaan, R., F. Cörvers, and A. de Grip (2007): Training and early Retirement, ROA-RM-2007/3.
Mühler, G., M. Beckmann, and B. Schauenberg (2007): The Returns to Continuous Training in Germany: New Evidence from Propensity Score Matching Estimators, Review of Managerial Science, 1(3) pp. 209-235.
OECD (1996): Lifelong Learning for All, OECD, Washington DC.
OECD (1998): “Work-force ageing in OECD countries”, Ch.4 in OECD Outlook 1998.
OECD (1999): Employment Outlook, Paris.
OECD (2004): Employment Outlook, Paris.
OECD (2005): Learning a Living. First Results of The Adult Literacy and Life Skills Survey, Paris.
OECD (2007): Qualifications Systems: Bridges to Lifelong Learning, Paris.
OECD (2008): Jante Parlevliet, Theodora Xenogiani, “Report on Informal Employment in Romania”, OECD Working Papier No. 271.
OECD (2011): Education at a Glance, Paris.
Ok, W. and P. Tergeist (2003): Improving Workers’ Skills: Analytical Evidence and the Role of the Social Partners. OECD Social, Employment and Migration Working Papers No. 10, Paris.
Oosterbeek, H. (1998): Unravelling Supply and Demand Factors in Work-Related Training, Oxford Economic Papers, Vol. 50, No. 2, pp. 266-283.
O'Reilly, J. and C. Fagan (1998): Part-time prospects: an international comparison of part-time work in Europe, North America and the Pacific Rim, Routledge, 1998.
Ours, J.C. van, and L. Stoeldraijer (2010): Age, wage and productivity, CESifo Working Paper Series No. 2965.
Parent, D. (1999): Wages and mobility: The impact of employer-provided training. Journal of Labour Economics, 17(2): pp. 298–317.
Parent, D. (2003): Employer-supported training in Canada and its impact on mobility and wages. Empirical Economics, 28: pp. 431–459.
Park, D. C., R. E. Nisbett, and T. Hedden (1999): Culture, Cognition, and Aging, Journal of Gerontology, No. 54 B, pp. 75-84.

Anna Ruzik-Sierdzinska, Maciej Lis, Monika Potoczna, Michele Belloni, Claudia Villosio
CASE Network Reports No. 114 98
Picchio, M. and J.C. van Ours (2013): Retaining through Training: Even for Older Workers, Economics of Education Review, 32 (1) pp. 29-48.
Pischke, J.-S. (2001): Continuous training in Germany, Journal of Population Economics, 14: pp. 523–548.
Riedel, M. and H. Hofer (2012): Determinants of the Transition from Work into Retirement, NEUJOBS Working Paper No. 17.1.
Robinson, P.M. (1988): Root-N-consistent semiparametric regression, Econometrica 56: pp. 931-954.
Roger, M. and M. Wasmer (2011): Heterogeneity matters: labour productivity differentiated by age and skills, wp n 2011/04, INSEE, Direction des Études et Synthèses Économiques.
Roman, M.M. and M.D. Roman (2002): Activity tendencies among Romanian elderly people after 1989, http://pascal.iseg.utl.pt/~cisep/conferencias/ conferencia_20021016/Papers/mroman85.PDF
Schøne, P. (2004): Why is the return to training so high? Labour, 18(3) pp. 363-378.
Schröder, M. (2011): Retrospective Data Collection in the Survey of Health, Ageing and Retirement in Europe. SHARELIFE Methodology, Mannheim: MEA.
Skirbekk, V. (2008): Age and productivity capacity: Descriptions, causes and policy options, Ageing horizons 8.4 (2008): p. 12.
Sohnesen, T. P. and A. Blom (2005): Is Formal Lifelong Learning a Profitable Investment for All of Life? How age, education level, and flexibility of provision affect rates of return to adult education in Colombia. World Bank Policy Research Working Paper 3800, December.
Trevisan, E., G. Pasini, and R. Rainato (2011): Cross-country comparison of monetary values from SHARELIFE, SHARE Working Papers, 02-2011.
Verhaegen, P. and T. A. Salthouse (1997): Meta-Analyses of Age-Cognition Relations in Adulthood. Estimates of Linear and Nonlinear Age Effects and Structural Models, Psychological Bulletin, Vol. 122, No. 3, pp. 231-249.
Veum, J. R. (1995): Sources of training and their impact on wages, Industrial and Labour Relations Review, 48(4): pp. 812–826.
Waldman, D. A. and B. J. Avolio (1986): A Meta-Analysis of Age Differences in Job Performance, Journal of Applied Psychology, No. 71, pp. 33-38.
Walewski, M. (2007): Analysis of Cross-Country Differences in the Shape of the Age-Wage Relationship with an Attempt to Tackle Age-Productivity Differences within the EU, CASE Network Studies and Analyses No. 351.

AGE AND PRODUCTIVITY. HUMAN CAPITAL ACCUMULATION AND…
CASE Network Reports No. 114 99
Warr, P. and D. Fay (2001): Short report: age and personal initiative at work, European Journal of Work and Organizational Psychology: 10 (3), pp. 343-353.
Warr, P. and K. Birdi (1998): Employee Age and Voluntary Development Activity, International Journal of Training and Development 2, pp. 190-204.
Whelan, Ch., B. Maitre, and B. Nolan (2011): Analysing Intergenerational Influences on Income Poverty and Economic Vulnerability with EU-SILC, University College Dublin Working Papers, No. 201125.
Zwick, T. (2006): The Impact of Training Intensity on Establishment Productivity, Industrial Relations 45 (1), pp. 26-46.
Zwick, T. (2011): Why Training Older Employees is Less Effective, ZEW Discussion Paper No. 11-046.