Embed Size (px)
Citation preview
Annexes
Annex I Classification of Regional Member Countries
Annex II Selected Statistics on Regional Member Countries
II-1 Africa: Selected Social Indicators II-2 Africa: Selected Macroeconomic Indicators
data on Bank Group Operations
II-3 Bank Group Transfer of Resources to RMCs, 1967-2009
II-4 Bank Group Transfer of Concessional Resources to RMCs, 1974-2009
II-5 Bank Group Payments to Supplying Countries for Procurement by Origin of Supply, 2008-2009
II-6 Bank Group Payments to Supplying Countries for Procurement by Source of Supply, 2008-2009
II-7 Bank Group Loan and Grant Approvals by Subregion, 1967-2009
II-8 ADB Loan and Grant Approvals by Country, 1967-2009
II-9 ADF Loan and Grant Approvals by Country, 1974-2009
II-10 NTF Loan and Grant Approvals by Country, 1976-2009
II-11 Bank Group Loan and Grant Approvals by Sector, 1967-2009
II-12 ADB Loan and Grant Approvals by Sector, 1967-2009
II-13 ADF Loan and Grant Approvals by Sector, 1974-2009
II-14 NTF Loan and Grant Approvals by Sector, 1976-2009
II-15 Status of HIPC Debt Relief Implementation as at December 31, 2009
II-16 ADF-Multilateral Debt Relief Initiative (MDRI) – Cost Estimates for 33 Beneficiary RMCs
II-17 Instruments of Commitment Received for the MDRI by Donors at December 31, 2009
II-18 Summary of Loan Arrears as at December 31, 2009
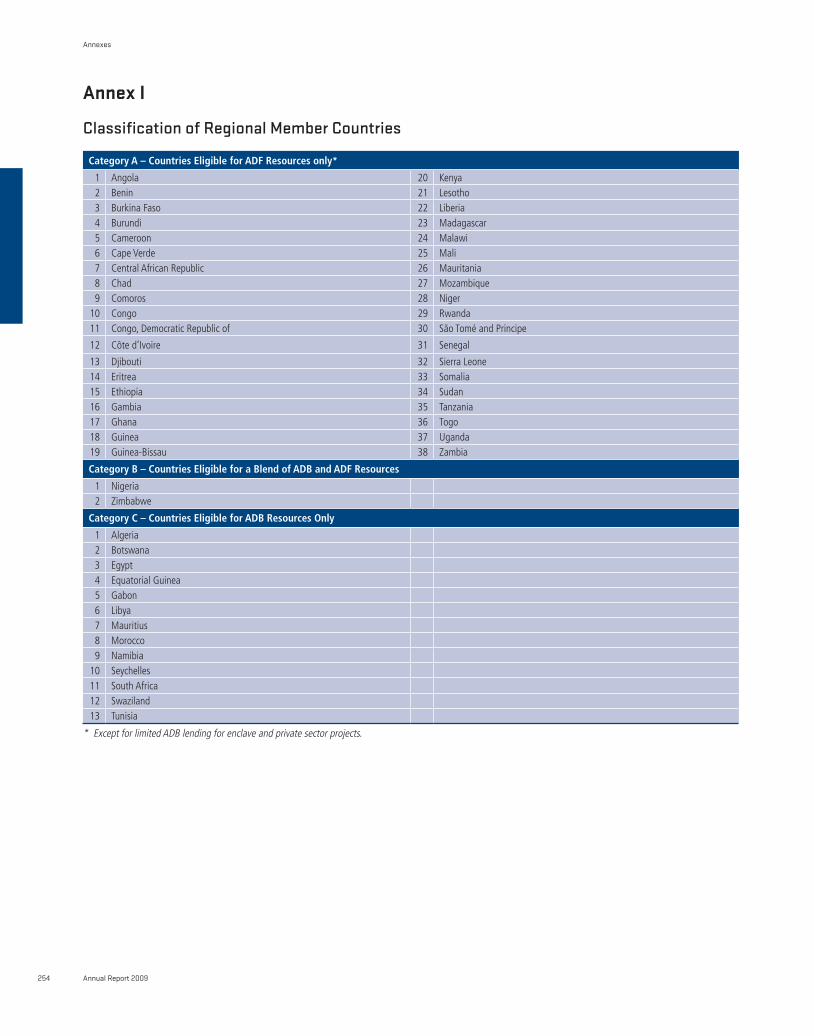
category A – countries eligible for AdF resources only*
1 Angola 20 Kenya2 Benin 21 Lesotho3 Burkina Faso 22 Liberia4 Burundi 23 Madagascar5 Cameroon 24 Malawi6 Cape Verde 25 Mali7 Central African Republic 26 Mauritania8 Chad 27 Mozambique9 Comoros 28 Niger
10 Congo 29 Rwanda11 Congo, Democratic Republic of 30 São Tomé and Principe
12 Côte d’Ivoire 31 Senegal
13 Djibouti 32 Sierra Leone14 Eritrea 33 Somalia15 Ethiopia 34 Sudan16 Gambia 35 Tanzania17 Ghana 36 Togo18 Guinea 37 Uganda19 Guinea-Bissau 38 Zambia
category B – countries eligible for a Blend of AdB and AdF resources
1 Nigeria2 Zimbabwe
category c – countries eligible for AdB resources Only
1 Algeria2 Botswana3 Egypt4 Equatorial Guinea5 Gabon6 Libya7 Mauritius8 Morocco9 Namibia
10 Seychelles11 South Africa12 Swaziland13 Tunisia
* Except for limited ADB lending for enclave and private sector projects.
Annex I
Classification of Regional Member Countries
Annual Report 2009254
Annexes
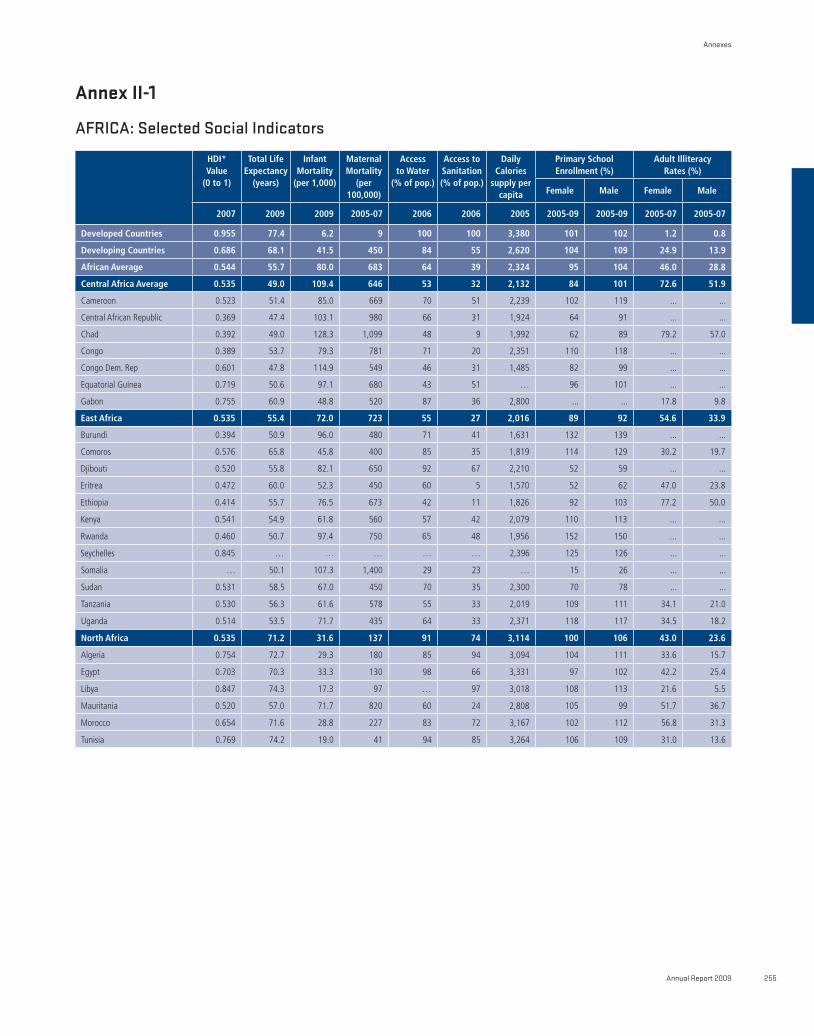
Annex II-1
AFRICA: Selected Social Indicators
HdI* Value
(0 to 1)
Total Life expectancy
(years)
Infant Mortality
(per 1,000)
Maternal Mortality
(per 100,000)
Access to Water
(% of pop.)
Access to sanitation (% of pop.)
daily calories
supply per capita
Primary school enrollment (%)
Adult Illiteracy rates (%)
Female Male Female Male
2007 2009 2009 2005-07 2006 2006 2005 2005-09 2005-09 2005-07 2005-07
developed countries 0.955 77.4 6.2 9 100 100 3,380 101 102 1.2 0.8
developing countries 0.686 68.1 41.5 450 84 55 2,620 104 109 24.9 13.9
African Average 0.544 55.7 80.0 683 64 39 2,324 95 104 46.0 28.8
central Africa Average 0.535 49.0 109.4 646 53 32 2,132 84 101 72.6 51.9
Cameroon 0.523 51.4 85.0 669 70 51 2,239 102 119 ... ...
Central African Republic 0.369 47.4 103.1 980 66 31 1,924 64 91 ... ...
Chad 0.392 49.0 128.3 1,099 48 9 1,992 62 89 79.2 57.0
Congo 0.389 53.7 79.3 781 71 20 2,351 110 118 ... ...
Congo Dem. Rep 0.601 47.8 114.9 549 46 31 1,485 82 99 ... ...
Equatorial Guinea 0.719 50.6 97.1 680 43 51 … 96 101 ... ...
Gabon 0.755 60.9 48.8 520 87 36 2,800 ... ... 17.8 9.8
east Africa 0.535 55.4 72.0 723 55 27 2,016 89 92 54.6 33.9
Burundi 0.394 50.9 96.0 480 71 41 1,631 132 139 ... ...
Comoros 0.576 65.8 45.8 400 85 35 1,819 114 129 30.2 19.7
Djibouti 0.520 55.8 82.1 650 92 67 2,210 52 59 ... ...
Eritrea 0.472 60.0 52.3 450 60 5 1,570 52 62 47.0 23.8
Ethiopia 0.414 55.7 76.5 673 42 11 1,826 92 103 77.2 50.0
Kenya 0.541 54.9 61.8 560 57 42 2,079 110 113 ... ...
Rwanda 0.460 50.7 97.4 750 65 48 1,956 152 150 ... ...
Seychelles 0.845 … … … … … 2,396 125 126 ... ...
Somalia … 50.1 107.3 1,400 29 23 … 15 26 ... ...
Sudan 0.531 58.5 67.0 450 70 35 2,300 70 78 ... ...
Tanzania 0.530 56.3 61.6 578 55 33 2,019 109 111 34.1 21.0
Uganda 0.514 53.5 71.7 435 64 33 2,371 118 117 34.5 18.2
north Africa 0.535 71.2 31.6 137 91 74 3,114 100 106 43.0 23.6
Algeria 0.754 72.7 29.3 180 85 94 3,094 104 111 33.6 15.7
Egypt 0.703 70.3 33.3 130 98 66 3,331 97 102 42.2 25.4
Libya 0.847 74.3 17.3 97 … 97 3,018 108 113 21.6 5.5
Mauritania 0.520 57.0 71.7 820 60 24 2,808 105 99 51.7 36.7
Morocco 0.654 71.6 28.8 227 83 72 3,167 102 112 56.8 31.3
Tunisia 0.769 74.2 19.0 41 94 85 3,264 106 109 31.0 13.6
Annual Report 2009 255
Annexes
HdI* Value
(0 to 1)
Total Life expectancy
(years)
Infant Mortality
(per 1,000)
Maternal Mortality
(per 100,000)
Access to Water
(% of pop.)
Access to sanitation (% of pop.)
daily calories
supply per capita
Primary school enrollment (%)
Adult Illiteracy rates (%)
Female Male Female Male
2007 2009 2009 2005-07 2006 2006 2005 2005-09 2005-09 2005-07 2005-07
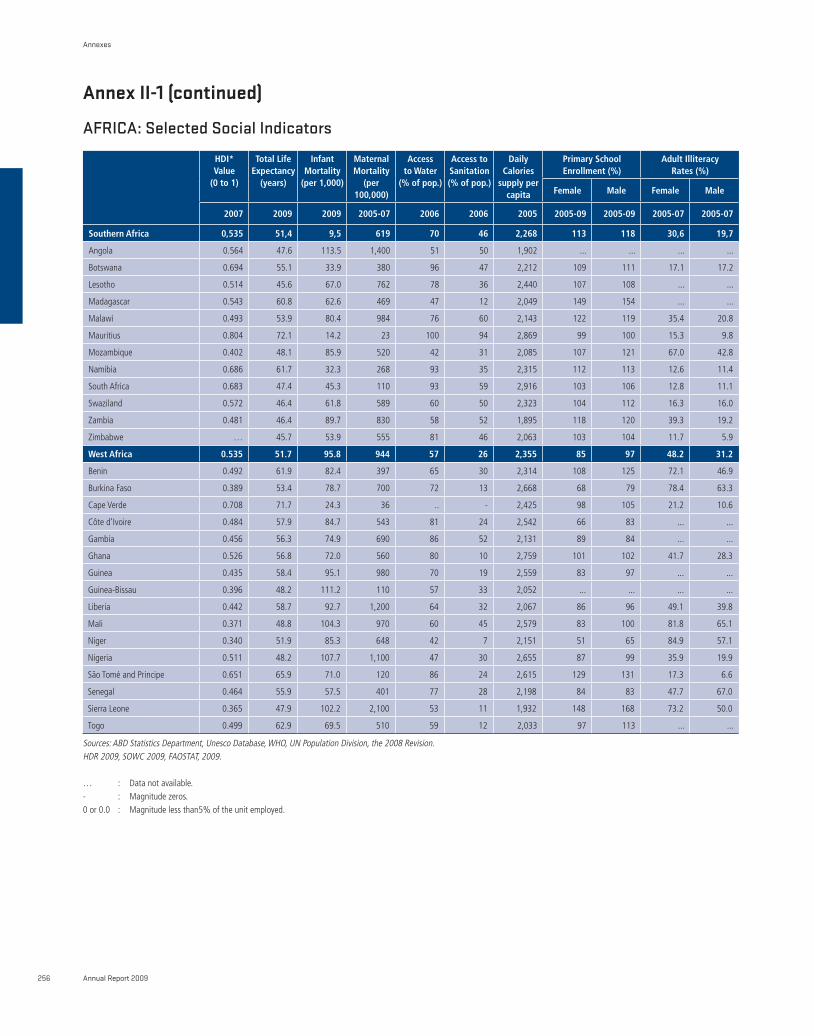
southern Africa 0,535 51,4 9,5 619 70 46 2,268 113 118 30,6 19,7
Angola 0.564 47.6 113.5 1,400 51 50 1,902 ... ... ... ...
Botswana 0.694 55.1 33.9 380 96 47 2,212 109 111 17.1 17.2
Lesotho 0.514 45.6 67.0 762 78 36 2,440 107 108 ... ...
Madagascar 0.543 60.8 62.6 469 47 12 2,049 149 154 ... ...
Malawi 0.493 53.9 80.4 984 76 60 2,143 122 119 35.4 20.8
Mauritius 0.804 72.1 14.2 23 100 94 2,869 99 100 15.3 9.8
Mozambique 0.402 48.1 85.9 520 42 31 2,085 107 121 67.0 42.8
Namibia 0.686 61.7 32.3 268 93 35 2,315 112 113 12.6 11.4
South Africa 0.683 47.4 45.3 110 93 59 2,916 103 106 12.8 11.1
Swaziland 0.572 46.4 61.8 589 60 50 2,323 104 112 16.3 16.0
Zambia 0.481 46.4 89.7 830 58 52 1,895 118 120 39.3 19.2
Zimbabwe … 45.7 53.9 555 81 46 2,063 103 104 11.7 5.9
West Africa 0.535 51.7 95.8 944 57 26 2,355 85 97 48.2 31.2
Benin 0.492 61.9 82.4 397 65 30 2,314 108 125 72.1 46.9
Burkina Faso 0.389 53.4 78.7 700 72 13 2,668 68 79 78.4 63.3
Cape Verde 0.708 71.7 24.3 36 .. - 2,425 98 105 21.2 10.6
Côte d’Ivoire 0.484 57.9 84.7 543 81 24 2,542 66 83 ... ...
Gambia 0.456 56.3 74.9 690 86 52 2,131 89 84 ... ...
Ghana 0.526 56.8 72.0 560 80 10 2,759 101 102 41.7 28.3
Guinea 0.435 58.4 95.1 980 70 19 2,559 83 97 ... ...
Guinea-Bissau 0.396 48.2 111.2 110 57 33 2,052 ... ... ... ...
Liberia 0.442 58.7 92.7 1,200 64 32 2,067 86 96 49.1 39.8
Mali 0.371 48.8 104.3 970 60 45 2,579 83 100 81.8 65.1
Niger 0.340 51.9 85.3 648 42 7 2,151 51 65 84.9 57.1
Nigeria 0.511 48.2 107.7 1,100 47 30 2,655 87 99 35.9 19.9
São Tomé and Principe 0.651 65.9 71.0 120 86 24 2,615 129 131 17.3 6.6
Senegal 0.464 55.9 57.5 401 77 28 2,198 84 83 47.7 67.0
Sierra Leone 0.365 47.9 102.2 2,100 53 11 1,932 148 168 73.2 50.0
Togo 0.499 62.9 69.5 510 59 12 2,033 97 113 ... ...
Sources: ABD Statistics Department, Unesco Database, WHO, UN Population Division, the 2008 Revision.HDR 2009, SOWC 2009, FAOSTAT, 2009.
… : Data not available.- : Magnitude zeros.0 or 0.0 : Magnitude less than5% of the unit employed.
Annex II-1 (continued) AFRICA: Selected Social Indicators
Annual Report 2009256
Annexes
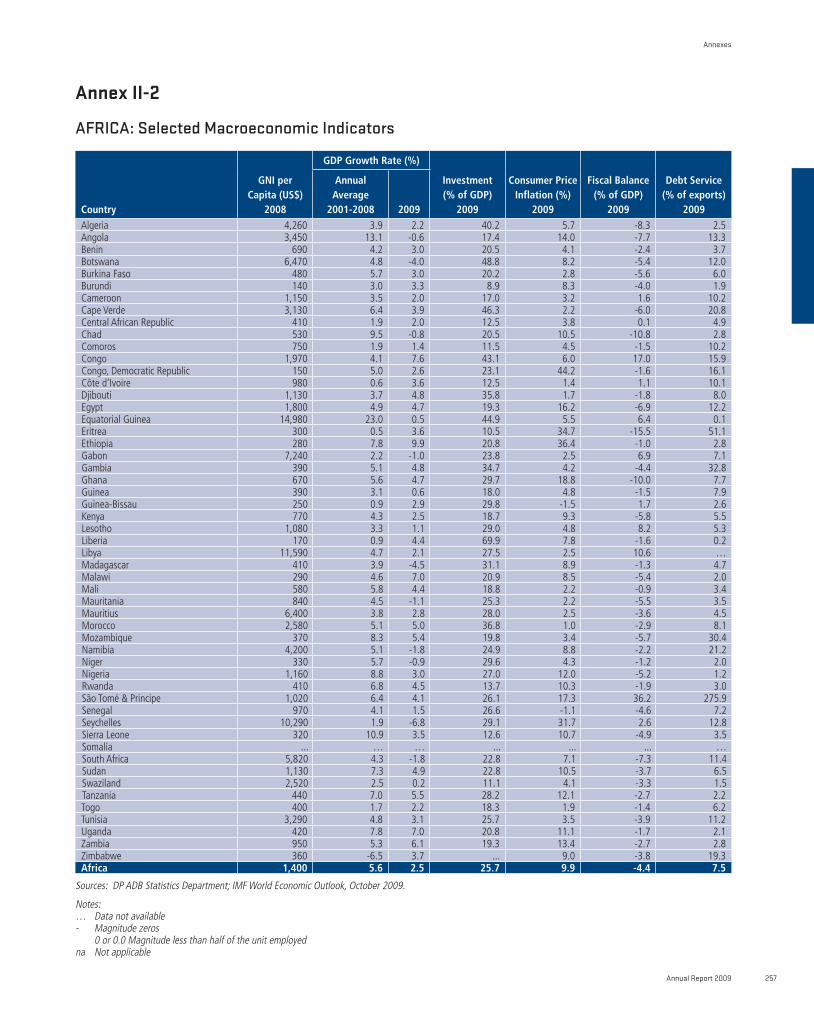
Annex II-2
AFRICA: Selected Macroeconomic Indicators
country
GnI per capita (Us$)
2008
GdP Growth rate (%)
Investment(% of GdP)
2009
consumer Price Inflation (%)
2009
Fiscal Balance(% of GdP)
2009
debt service (% of exports)
2009
Annual Average
2001-2008 2009Algeria 4,260 3.9 2.2 40.2 5.7 -8.3 2.5Angola 3,450 13.1 -0.6 17.4 14.0 -7.7 13.3Benin 690 4.2 3.0 20.5 4.1 -2.4 3.7Botswana 6,470 4.8 -4.0 48.8 8.2 -5.4 12.0Burkina Faso 480 5.7 3.0 20.2 2.8 -5.6 6.0Burundi 140 3.0 3.3 8.9 8.3 -4.0 1.9Cameroon 1,150 3.5 2.0 17.0 3.2 1.6 10.2Cape Verde 3,130 6.4 3.9 46.3 2.2 -6.0 20.8Central African Republic 410 1.9 2.0 12.5 3.8 0.1 4.9Chad 530 9.5 -0.8 20.5 10.5 -10.8 2.8Comoros 750 1.9 1.4 11.5 4.5 -1.5 10.2Congo 1,970 4.1 7.6 43.1 6.0 17.0 15.9Congo, Democratic Republic 150 5.0 2.6 23.1 44.2 -1.6 16.1Côte d’Ivoire 980 0.6 3.6 12.5 1.4 1.1 10.1Djibouti 1,130 3.7 4.8 35.8 1.7 -1.8 8.0Egypt 1,800 4.9 4.7 19.3 16.2 -6.9 12.2Equatorial Guinea 14,980 23.0 0.5 44.9 5.5 6.4 0.1Eritrea 300 0.5 3.6 10.5 34.7 -15.5 51.1Ethiopia 280 7.8 9.9 20.8 36.4 -1.0 2.8Gabon 7,240 2.2 -1.0 23.8 2.5 6.9 7.1Gambia 390 5.1 4.8 34.7 4.2 -4.4 32.8Ghana 670 5.6 4.7 29.7 18.8 -10.0 7.7Guinea 390 3.1 0.6 18.0 4.8 -1.5 7.9Guinea-Bissau 250 0.9 2.9 29.8 -1.5 1.7 2.6Kenya 770 4.3 2.5 18.7 9.3 -5.8 5.5Lesotho 1,080 3.3 1.1 29.0 4.8 8.2 5.3Liberia 170 0.9 4.4 69.9 7.8 -1.6 0.2Libya 11,590 4.7 2.1 27.5 2.5 10.6 … Madagascar 410 3.9 -4.5 31.1 8.9 -1.3 4.7Malawi 290 4.6 7.0 20.9 8.5 -5.4 2.0Mali 580 5.8 4.4 18.8 2.2 -0.9 3.4Mauritania 840 4.5 -1.1 25.3 2.2 -5.5 3.5Mauritius 6,400 3.8 2.8 28.0 2.5 -3.6 4.5Morocco 2,580 5.1 5.0 36.8 1.0 -2.9 8.1Mozambique 370 8.3 5.4 19.8 3.4 -5.7 30.4Namibia 4,200 5.1 -1.8 24.9 8.8 -2.2 21.2Niger 330 5.7 -0.9 29.6 4.3 -1.2 2.0Nigeria 1,160 8.8 3.0 27.0 12.0 -5.2 1.2Rwanda 410 6.8 4.5 13.7 10.3 -1.9 3.0São Tomé & Principe 1,020 6.4 4.1 26.1 17.3 36.2 275.9Senegal 970 4.1 1.5 26.6 -1.1 -4.6 7.2Seychelles 10,290 1.9 -6.8 29.1 31.7 2.6 12.8Sierra Leone 320 10.9 3.5 12.6 10.7 -4.9 3.5Somalia ... … … ... ... ... …South Africa 5,820 4.3 -1.8 22.8 7.1 -7.3 11.4Sudan 1,130 7.3 4.9 22.8 10.5 -3.7 6.5Swaziland 2,520 2.5 0.2 11.1 4.1 -3.3 1.5Tanzania 440 7.0 5.5 28.2 12.1 -2.7 2.2Togo 400 1.7 2.2 18.3 1.9 -1.4 6.2Tunisia 3,290 4.8 3.1 25.7 3.5 -3.9 11.2Uganda 420 7.8 7.0 20.8 11.1 -1.7 2.1Zambia 950 5.3 6.1 19.3 13.4 -2.7 2.8Zimbabwe 360 -6.5 3.7 ... 9.0 -3.8 19.3Africa 1,400 5.6 2.5 25.7 9.9 -4.4 7.5
Sources: DP ADB Statistics Department; IMF World Economic Outlook, October 2009.
Notes:… Data not available- Magnitude zeros 0 or 0.0 Magnitude less than half of the unit employedna Not applicable
Annual Report 2009 257
Annexes
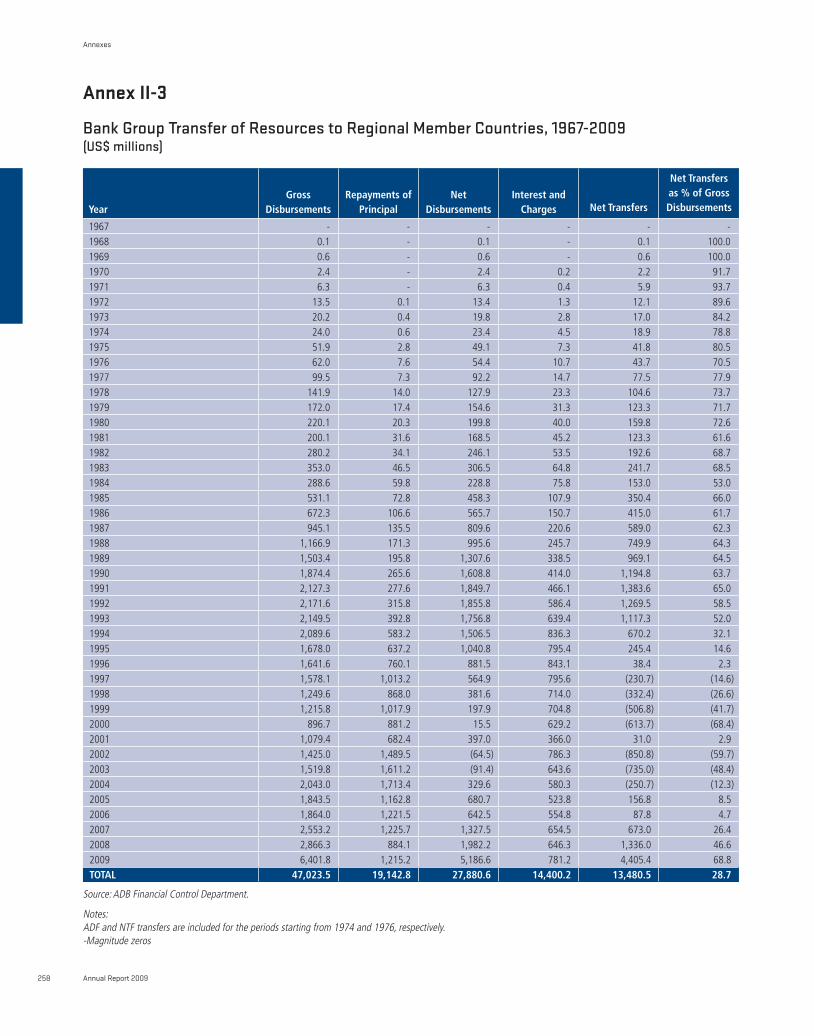
year Gross
disbursementsrepayments of
Principalnet
disbursementsInterest and
charges net Transfers
net Transfers as % of Gross disbursements
1967 - - - - - -1968 0.1 - 0.1 - 0.1 100.01969 0.6 - 0.6 - 0.6 100.01970 2.4 - 2.4 0.2 2.2 91.71971 6.3 - 6.3 0.4 5.9 93.71972 13.5 0.1 13.4 1.3 12.1 89.61973 20.2 0.4 19.8 2.8 17.0 84.21974 24.0 0.6 23.4 4.5 18.9 78.81975 51.9 2.8 49.1 7.3 41.8 80.51976 62.0 7.6 54.4 10.7 43.7 70.51977 99.5 7.3 92.2 14.7 77.5 77.91978 141.9 14.0 127.9 23.3 104.6 73.71979 172.0 17.4 154.6 31.3 123.3 71.71980 220.1 20.3 199.8 40.0 159.8 72.61981 200.1 31.6 168.5 45.2 123.3 61.61982 280.2 34.1 246.1 53.5 192.6 68.71983 353.0 46.5 306.5 64.8 241.7 68.51984 288.6 59.8 228.8 75.8 153.0 53.01985 531.1 72.8 458.3 107.9 350.4 66.01986 672.3 106.6 565.7 150.7 415.0 61.71987 945.1 135.5 809.6 220.6 589.0 62.31988 1,166.9 171.3 995.6 245.7 749.9 64.31989 1,503.4 195.8 1,307.6 338.5 969.1 64.51990 1,874.4 265.6 1,608.8 414.0 1,194.8 63.71991 2,127.3 277.6 1,849.7 466.1 1,383.6 65.01992 2,171.6 315.8 1,855.8 586.4 1,269.5 58.51993 2,149.5 392.8 1,756.8 639.4 1,117.3 52.01994 2,089.6 583.2 1,506.5 836.3 670.2 32.11995 1,678.0 637.2 1,040.8 795.4 245.4 14.61996 1,641.6 760.1 881.5 843.1 38.4 2.31997 1,578.1 1,013.2 564.9 795.6 (230.7) (14.6)1998 1,249.6 868.0 381.6 714.0 (332.4) (26.6)1999 1,215.8 1,017.9 197.9 704.8 (506.8) (41.7)2000 896.7 881.2 15.5 629.2 (613.7) (68.4)2001 1,079.4 682.4 397.0 366.0 31.0 2.92002 1,425.0 1,489.5 (64.5) 786.3 (850.8) (59.7)2003 1,519.8 1,611.2 (91.4) 643.6 (735.0) (48.4)2004 2,043.0 1,713.4 329.6 580.3 (250.7) (12.3)2005 1,843.5 1,162.8 680.7 523.8 156.8 8.52006 1,864.0 1,221.5 642.5 554.8 87.8 4.72007 2,553.2 1,225.7 1,327.5 654.5 673.0 26.42008 2,866.3 884.1 1,982.2 646.3 1,336.0 46.62009 6,401.8 1,215.2 5,186.6 781.2 4,405.4 68.8TOTAL 47,023.5 19,142.8 27,880.6 14,400.2 13,480.5 28.7
Source: ADB Financial Control Department.
Notes:ADF and NTF transfers are included for the periods starting from 1974 and 1976, respectively.-Magnitude zeros
Annex II-3
Bank Group Transfer of Resources to Regional Member Countries, 1967-2009(US$ millions)
Annual Report 2009258
Annexes
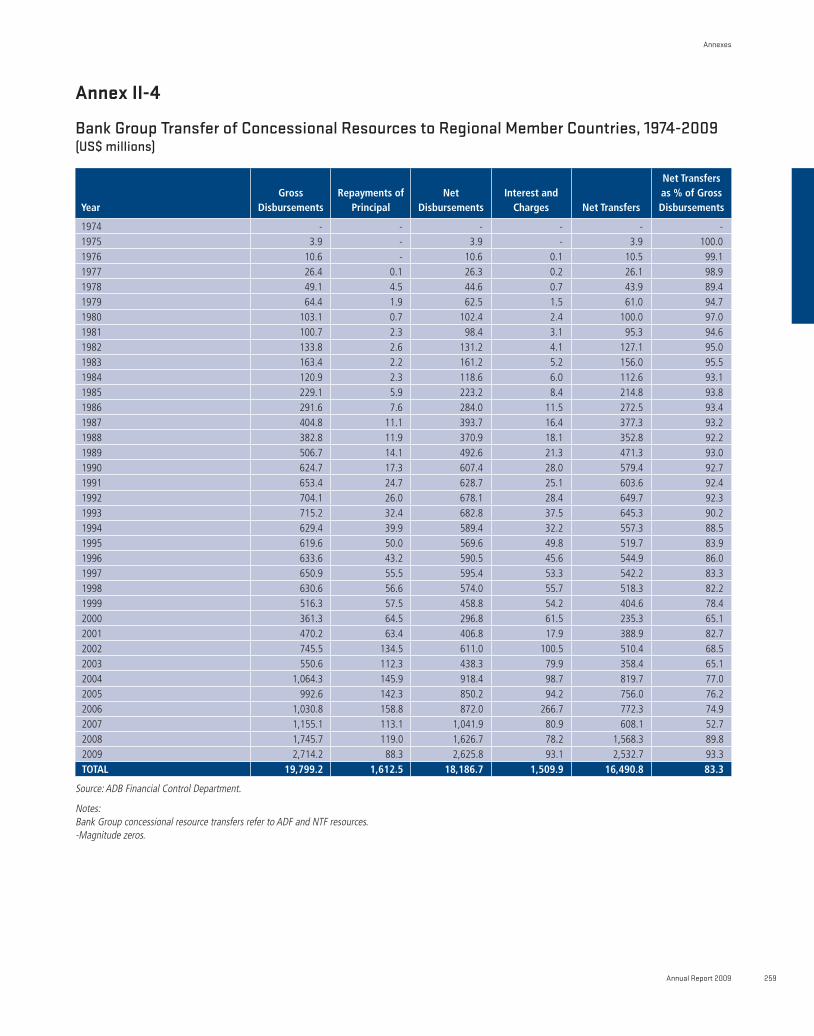
year Gross
disbursementsrepayments of
Principalnet
disbursementsInterest and
charges net Transfers
net Transfers as % of Gross disbursements
1974 - - - - - -1975 3.9 - 3.9 - 3.9 100.01976 10.6 - 10.6 0.1 10.5 99.11977 26.4 0.1 26.3 0.2 26.1 98.91978 49.1 4.5 44.6 0.7 43.9 89.41979 64.4 1.9 62.5 1.5 61.0 94.71980 103.1 0.7 102.4 2.4 100.0 97.01981 100.7 2.3 98.4 3.1 95.3 94.61982 133.8 2.6 131.2 4.1 127.1 95.01983 163.4 2.2 161.2 5.2 156.0 95.51984 120.9 2.3 118.6 6.0 112.6 93.11985 229.1 5.9 223.2 8.4 214.8 93.81986 291.6 7.6 284.0 11.5 272.5 93.41987 404.8 11.1 393.7 16.4 377.3 93.21988 382.8 11.9 370.9 18.1 352.8 92.21989 506.7 14.1 492.6 21.3 471.3 93.01990 624.7 17.3 607.4 28.0 579.4 92.71991 653.4 24.7 628.7 25.1 603.6 92.41992 704.1 26.0 678.1 28.4 649.7 92.31993 715.2 32.4 682.8 37.5 645.3 90.21994 629.4 39.9 589.4 32.2 557.3 88.51995 619.6 50.0 569.6 49.8 519.7 83.91996 633.6 43.2 590.5 45.6 544.9 86.01997 650.9 55.5 595.4 53.3 542.2 83.31998 630.6 56.6 574.0 55.7 518.3 82.21999 516.3 57.5 458.8 54.2 404.6 78.42000 361.3 64.5 296.8 61.5 235.3 65.12001 470.2 63.4 406.8 17.9 388.9 82.72002 745.5 134.5 611.0 100.5 510.4 68.52003 550.6 112.3 438.3 79.9 358.4 65.12004 1,064.3 145.9 918.4 98.7 819.7 77.02005 992.6 142.3 850.2 94.2 756.0 76.22006 1,030.8 158.8 872.0 266.7 772.3 74.92007 1,155.1 113.1 1,041.9 80.9 608.1 52.72008 1,745.7 119.0 1,626.7 78.2 1,568.3 89.82009 2,714.2 88.3 2,625.8 93.1 2,532.7 93.3TOTAL 19,799.2 1,612.5 18,186.7 1,509.9 16,490.8 83.3
Source: ADB Financial Control Department.
Notes:Bank Group concessional resource transfers refer to ADF and NTF resources.-Magnitude zeros.
Annex II-4
Bank Group Transfer of Concessional Resources to Regional Member Countries, 1974-2009(US$ millions)
Annual Report 2009 259
Annexes
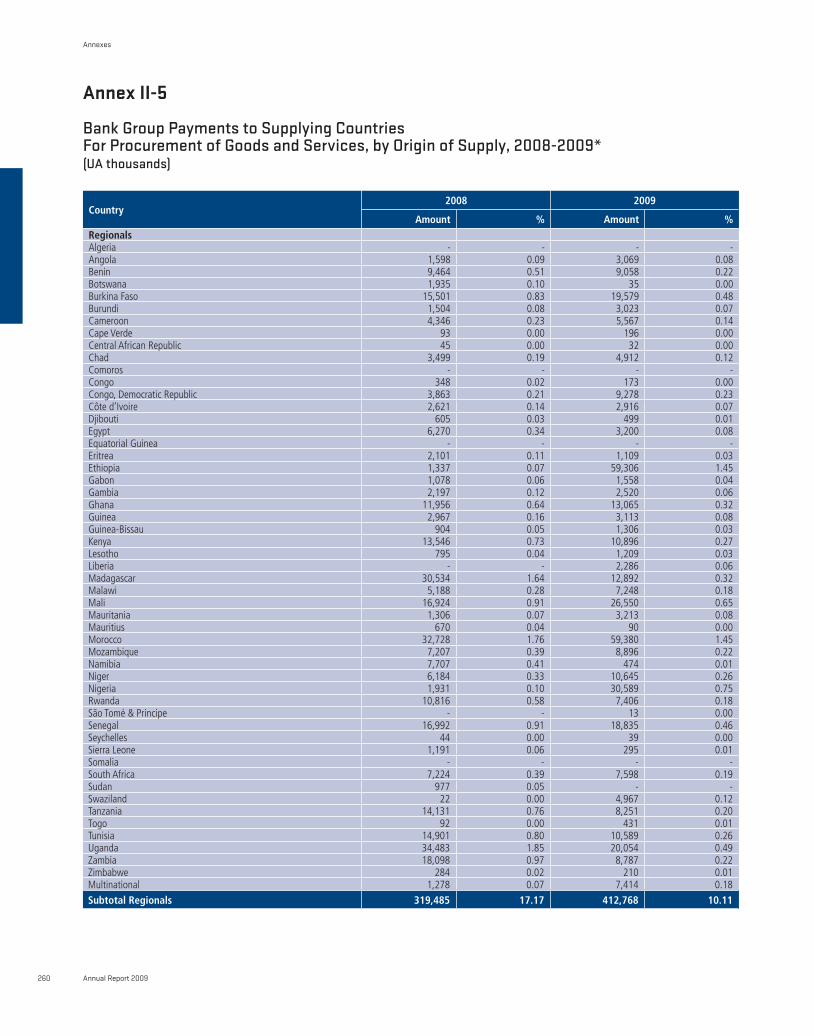
Annex II-5
Bank Group Payments to Supplying CountriesFor Procurement of Goods and Services, by Origin of Supply, 2008-2009*(UA thousands)
country2008 2009
Amount % Amount %regionalsAlgeria - - - -Angola 1,598 0.09 3,069 0.08Benin 9,464 0.51 9,058 0.22Botswana 1,935 0.10 35 0.00Burkina Faso 15,501 0.83 19,579 0.48Burundi 1,504 0.08 3,023 0.07Cameroon 4,346 0.23 5,567 0.14Cape Verde 93 0.00 196 0.00Central African Republic 45 0.00 32 0.00Chad 3,499 0.19 4,912 0.12Comoros - - - -Congo 348 0.02 173 0.00Congo, Democratic Republic 3,863 0.21 9,278 0.23Côte d’Ivoire 2,621 0.14 2,916 0.07Djibouti 605 0.03 499 0.01Egypt 6,270 0.34 3,200 0.08Equatorial Guinea - - - -Eritrea 2,101 0.11 1,109 0.03Ethiopia 1,337 0.07 59,306 1.45Gabon 1,078 0.06 1,558 0.04Gambia 2,197 0.12 2,520 0.06Ghana 11,956 0.64 13,065 0.32Guinea 2,967 0.16 3,113 0.08Guinea-Bissau 904 0.05 1,306 0.03Kenya 13,546 0.73 10,896 0.27Lesotho 795 0.04 1,209 0.03Liberia - - 2,286 0.06Madagascar 30,534 1.64 12,892 0.32Malawi 5,188 0.28 7,248 0.18Mali 16,924 0.91 26,550 0.65Mauritania 1,306 0.07 3,213 0.08Mauritius 670 0.04 90 0.00Morocco 32,728 1.76 59,380 1.45Mozambique 7,207 0.39 8,896 0.22Namibia 7,707 0.41 474 0.01Niger 6,184 0.33 10,645 0.26Nigeria 1,931 0.10 30,589 0.75Rwanda 10,816 0.58 7,406 0.18São Tomé & Principe - - 13 0.00Senegal 16,992 0.91 18,835 0.46Seychelles 44 0.00 39 0.00Sierra Leone 1,191 0.06 295 0.01Somalia - - - -South Africa 7,224 0.39 7,598 0.19Sudan 977 0.05 - -Swaziland 22 0.00 4,967 0.12Tanzania 14,131 0.76 8,251 0.20Togo 92 0.00 431 0.01Tunisia 14,901 0.80 10,589 0.26Uganda 34,483 1.85 20,054 0.49Zambia 18,098 0.97 8,787 0.22Zimbabwe 284 0.02 210 0.01Multinational 1,278 0.07 7,414 0.18
subtotal regionals 319,485 17.17 412,768 10.11
Annual Report 2009260
Annexes
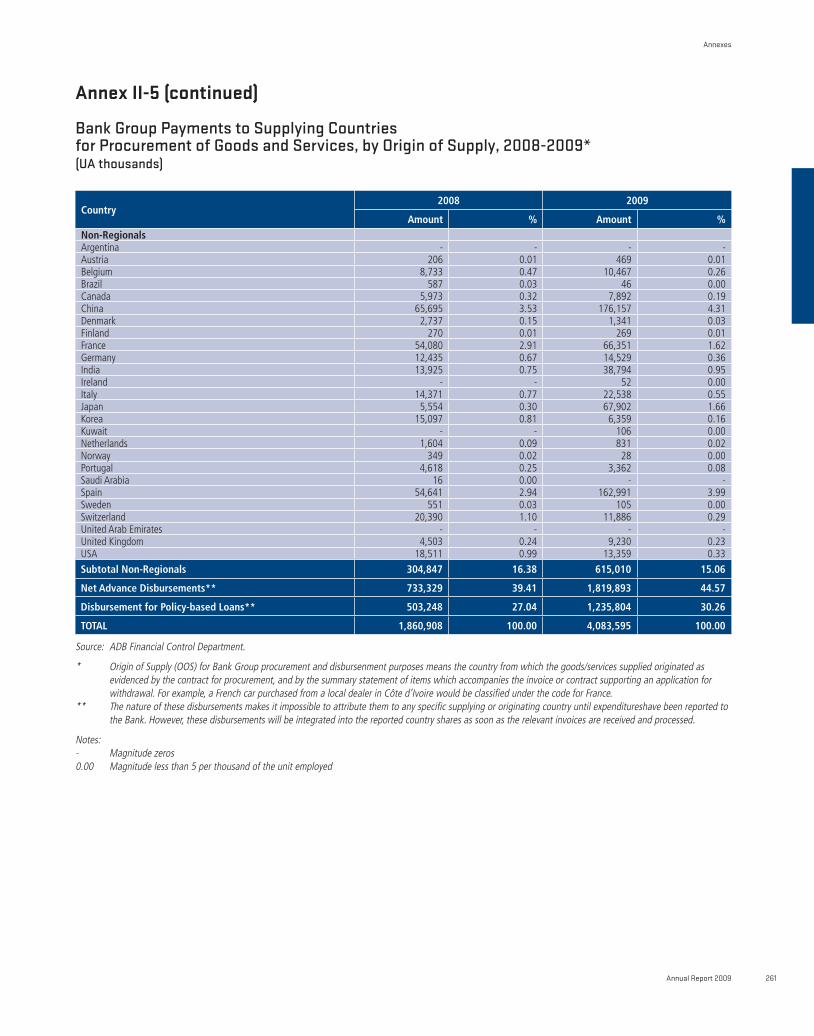
Annex II-5 (continued)
Bank Group Payments to Supplying Countriesfor Procurement of Goods and Services, by Origin of Supply, 2008-2009*(UA thousands)
country2008 2009
Amount % Amount %non-regionalsArgentina - - - -Austria 206 0.01 469 0.01Belgium 8,733 0.47 10,467 0.26Brazil 587 0.03 46 0.00Canada 5,973 0.32 7,892 0.19China 65,695 3.53 176,157 4.31Denmark 2,737 0.15 1,341 0.03Finland 270 0.01 269 0.01France 54,080 2.91 66,351 1.62Germany 12,435 0.67 14,529 0.36India 13,925 0.75 38,794 0.95Ireland - - 52 0.00Italy 14,371 0.77 22,538 0.55Japan 5,554 0.30 67,902 1.66Korea 15,097 0.81 6,359 0.16Kuwait - - 106 0.00Netherlands 1,604 0.09 831 0.02Norway 349 0.02 28 0.00Portugal 4,618 0.25 3,362 0.08Saudi Arabia 16 0.00 - -Spain 54,641 2.94 162,991 3.99Sweden 551 0.03 105 0.00Switzerland 20,390 1.10 11,886 0.29United Arab Emirates - - - -United Kingdom 4,503 0.24 9,230 0.23USA 18,511 0.99 13,359 0.33
subtotal non-regionals 304,847 16.38 615,010 15.06
net Advance disbursements** 733,329 39.41 1,819,893 44.57
disbursement for Policy-based Loans** 503,248 27.04 1,235,804 30.26
TOTAL 1,860,908 100.00 4,083,595 100.00
Source: ADB Financial Control Department.
* Origin of Supply (OOS) for Bank Group procurement and disbursenment purposes means the country from which the goods/services supplied originated as evidenced by the contract for procurement, and by the summary statement of items which accompanies the invoice or contract supporting an application for withdrawal. For example, a French car purchased from a local dealer in Côte d’Ivoire would be classified under the code for France.
** The nature of these disbursements makes it impossible to attribute them to any specific supplying or originating country until expenditureshave been reported to the Bank. However, these disbursements will be integrated into the reported country shares as soon as the relevant invoices are received and processed.
Notes: - Magnitude zeros0.00 Magnitude less than 5 per thousand of the unit employed
Annual Report 2009 261
Annexes
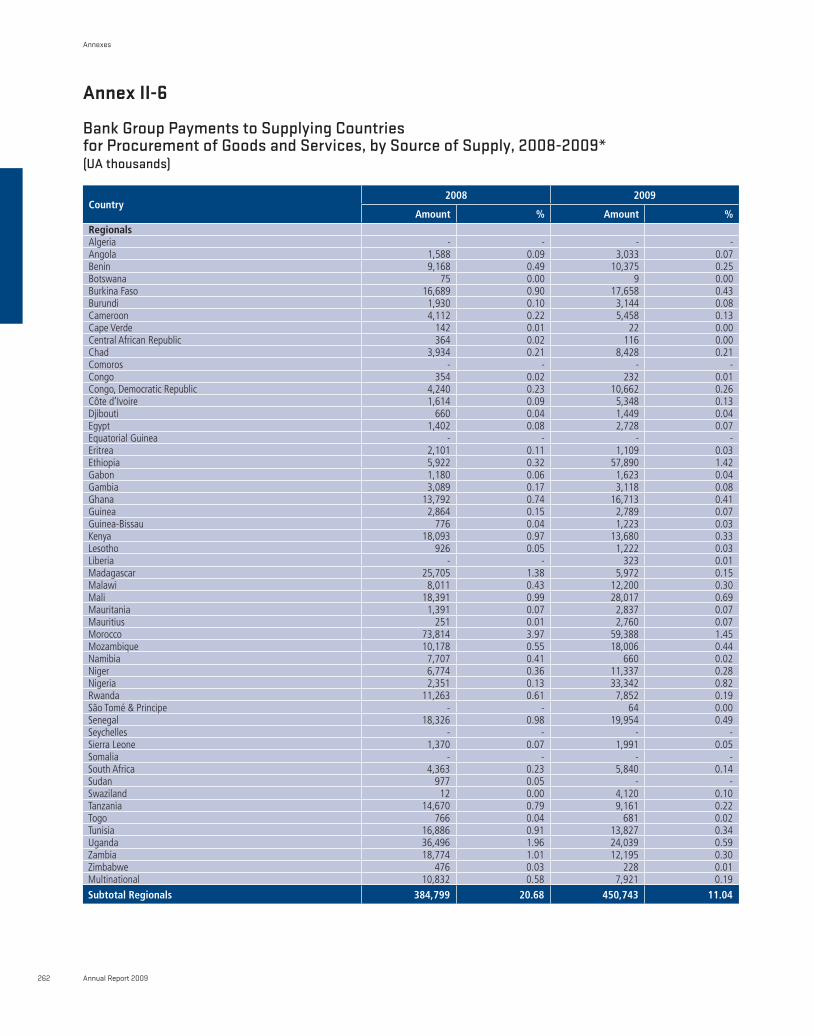
country2008 2009
Amount % Amount %regionalsAlgeria - - - -Angola 1,588 0.09 3,033 0.07Benin 9,168 0.49 10,375 0.25Botswana 75 0.00 9 0.00Burkina Faso 16,689 0.90 17,658 0.43Burundi 1,930 0.10 3,144 0.08Cameroon 4,112 0.22 5,458 0.13Cape Verde 142 0.01 22 0.00Central African Republic 364 0.02 116 0.00Chad 3,934 0.21 8,428 0.21Comoros - - - -Congo 354 0.02 232 0.01Congo, Democratic Republic 4,240 0.23 10,662 0.26Côte d’Ivoire 1,614 0.09 5,348 0.13Djibouti 660 0.04 1,449 0.04Egypt 1,402 0.08 2,728 0.07Equatorial Guinea - - - -Eritrea 2,101 0.11 1,109 0.03Ethiopia 5,922 0.32 57,890 1.42Gabon 1,180 0.06 1,623 0.04Gambia 3,089 0.17 3,118 0.08Ghana 13,792 0.74 16,713 0.41Guinea 2,864 0.15 2,789 0.07Guinea-Bissau 776 0.04 1,223 0.03Kenya 18,093 0.97 13,680 0.33Lesotho 926 0.05 1,222 0.03Liberia - - 323 0.01Madagascar 25,705 1.38 5,972 0.15Malawi 8,011 0.43 12,200 0.30Mali 18,391 0.99 28,017 0.69Mauritania 1,391 0.07 2,837 0.07Mauritius 251 0.01 2,760 0.07Morocco 73,814 3.97 59,388 1.45Mozambique 10,178 0.55 18,006 0.44Namibia 7,707 0.41 660 0.02Niger 6,774 0.36 11,337 0.28Nigeria 2,351 0.13 33,342 0.82Rwanda 11,263 0.61 7,852 0.19São Tomé & Principe - - 64 0.00Senegal 18,326 0.98 19,954 0.49Seychelles - - - -Sierra Leone 1,370 0.07 1,991 0.05Somalia - - - -South Africa 4,363 0.23 5,840 0.14Sudan 977 0.05 - -Swaziland 12 0.00 4,120 0.10Tanzania 14,670 0.79 9,161 0.22Togo 766 0.04 681 0.02Tunisia 16,886 0.91 13,827 0.34Uganda 36,496 1.96 24,039 0.59Zambia 18,774 1.01 12,195 0.30Zimbabwe 476 0.03 228 0.01Multinational 10,832 0.58 7,921 0.19
subtotal regionals 384,799 20.68 450,743 11.04
Annex II-6
Bank Group Payments to Supplying Countriesfor Procurement of Goods and Services, by Source of Supply, 2008-2009*(UA thousands)
Annual Report 2009262
Annexes
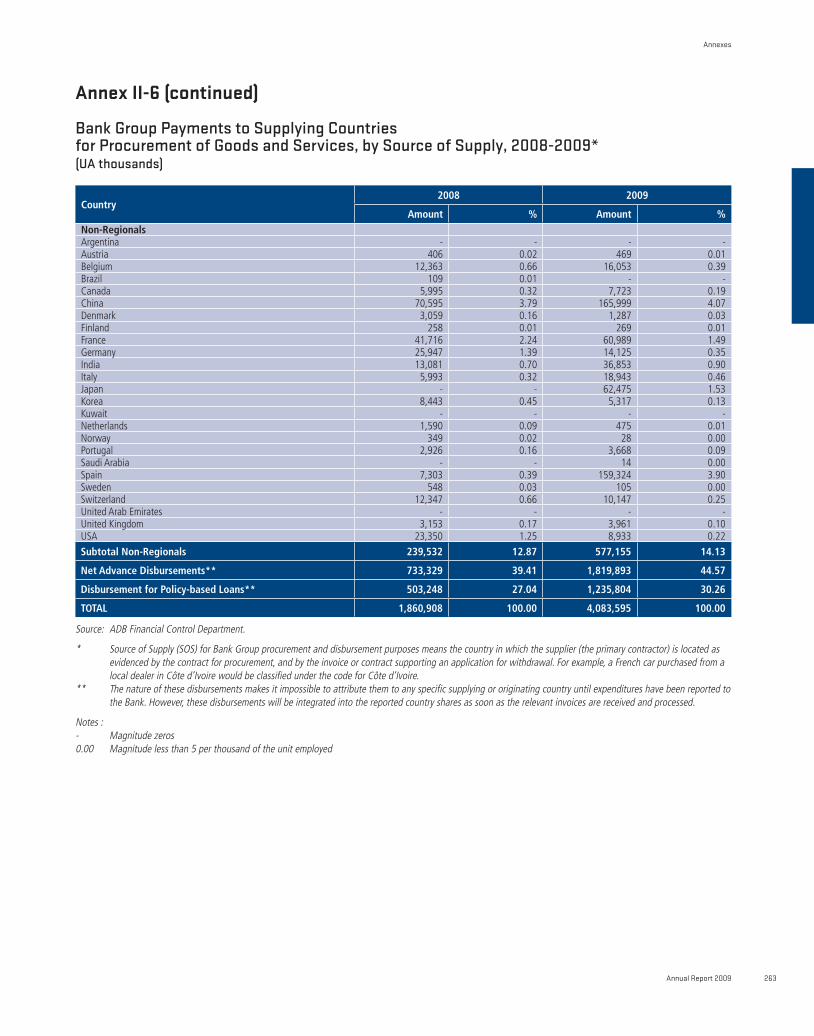
country2008 2009
Amount % Amount %non-regionalsArgentina - - - -Austria 406 0.02 469 0.01Belgium 12,363 0.66 16,053 0.39Brazil 109 0.01 - -Canada 5,995 0.32 7,723 0.19China 70,595 3.79 165,999 4.07Denmark 3,059 0.16 1,287 0.03Finland 258 0.01 269 0.01France 41,716 2.24 60,989 1.49Germany 25,947 1.39 14,125 0.35India 13,081 0.70 36,853 0.90Italy 5,993 0.32 18,943 0.46Japan - - 62,475 1.53Korea 8,443 0.45 5,317 0.13Kuwait - - - -Netherlands 1,590 0.09 475 0.01Norway 349 0.02 28 0.00Portugal 2,926 0.16 3,668 0.09Saudi Arabia - - 14 0.00Spain 7,303 0.39 159,324 3.90Sweden 548 0.03 105 0.00Switzerland 12,347 0.66 10,147 0.25United Arab Emirates - - - -United Kingdom 3,153 0.17 3,961 0.10USA 23,350 1.25 8,933 0.22
subtotal non-regionals 239,532 12.87 577,155 14.13
net Advance disbursements** 733,329 39.41 1,819,893 44.57
disbursement for Policy-based Loans** 503,248 27.04 1,235,804 30.26
TOTAL 1,860,908 100.00 4,083,595 100.00
Source: ADB Financial Control Department.
* Source of Supply (SOS) for Bank Group procurement and disbursement purposes means the country in which the supplier (the primary contractor) is located as evidenced by the contract for procurement, and by the invoice or contract supporting an application for withdrawal. For example, a French car purchased from a local dealer in Côte d’Ivoire would be classified under the code for Côte d’Ivoire.
** The nature of these disbursements makes it impossible to attribute them to any specific supplying or originating country until expenditures have been reported to the Bank. However, these disbursements will be integrated into the reported country shares as soon as the relevant invoices are received and processed.
Notes :- Magnitude zeros0.00 Magnitude less than 5 per thousand of the unit employed
Annex II-6 (continued)
Bank Group Payments to Supplying Countriesfor Procurement of Goods and Services, by Source of Supply, 2008-2009*(UA thousands)
Annual Report 2009 263
Annexes
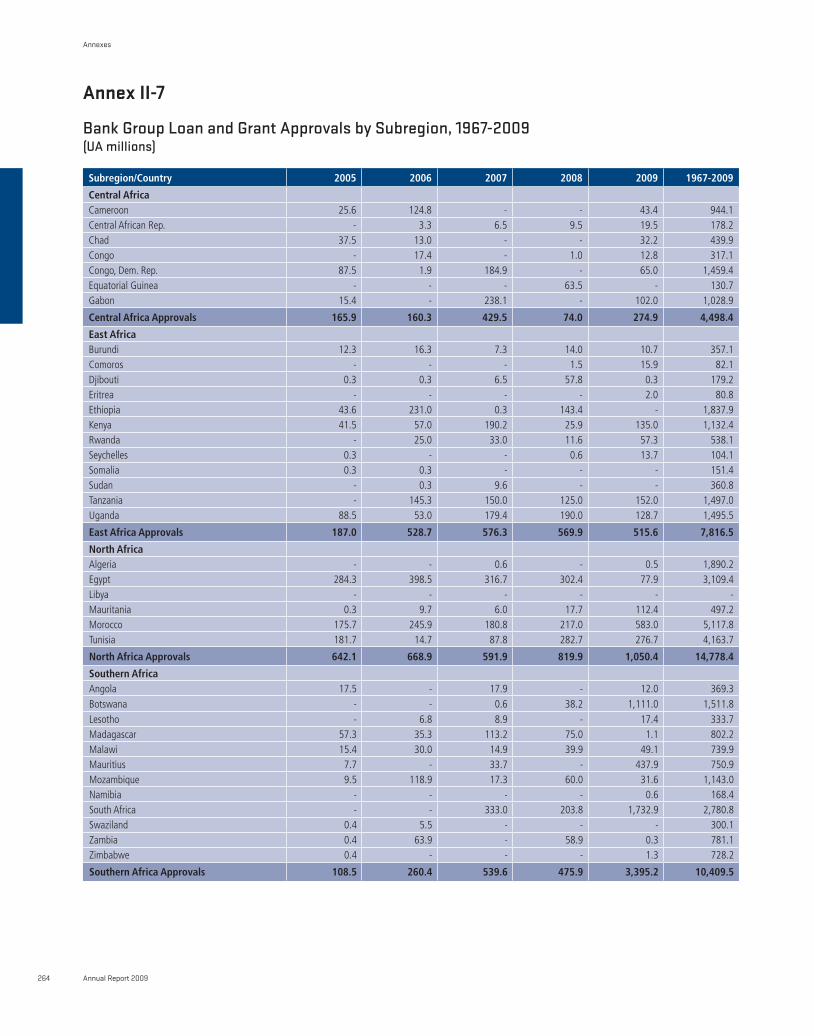
Annex II-7
Bank Group Loan and Grant Approvals by Subregion, 1967-2009(UA millions)
subregion/country 2005 2006 2007 2008 2009 1967-2009
central Africa Cameroon 25.6 124.8 - - 43.4 944.1 Central African Rep. - 3.3 6.5 9.5 19.5 178.2 Chad 37.5 13.0 - - 32.2 439.9 Congo - 17.4 - 1.0 12.8 317.1 Congo, Dem. Rep. 87.5 1.9 184.9 - 65.0 1,459.4 Equatorial Guinea - - - 63.5 - 130.7 Gabon 15.4 - 238.1 - 102.0 1,028.9
central Africa Approvals 165.9 160.3 429.5 74.0 274.9 4,498.4
east Africa Burundi 12.3 16.3 7.3 14.0 10.7 357.1 Comoros - - - 1.5 15.9 82.1 Djibouti 0.3 0.3 6.5 57.8 0.3 179.2 Eritrea - - - - 2.0 80.8 Ethiopia 43.6 231.0 0.3 143.4 - 1,837.9 Kenya 41.5 57.0 190.2 25.9 135.0 1,132.4 Rwanda - 25.0 33.0 11.6 57.3 538.1 Seychelles 0.3 - - 0.6 13.7 104.1 Somalia 0.3 0.3 - - - 151.4 Sudan - 0.3 9.6 - - 360.8 Tanzania - 145.3 150.0 125.0 152.0 1,497.0 Uganda 88.5 53.0 179.4 190.0 128.7 1,495.5
east Africa Approvals 187.0 528.7 576.3 569.9 515.6 7,816.5
north Africa Algeria - - 0.6 - 0.5 1,890.2 Egypt 284.3 398.5 316.7 302.4 77.9 3,109.4 Libya - - - - - - Mauritania 0.3 9.7 6.0 17.7 112.4 497.2 Morocco 175.7 245.9 180.8 217.0 583.0 5,117.8 Tunisia 181.7 14.7 87.8 282.7 276.7 4,163.7
north Africa Approvals 642.1 668.9 591.9 819.9 1,050.4 14,778.4
southern AfricaAngola 17.5 - 17.9 - 12.0 369.3 Botswana - - 0.6 38.2 1,111.0 1,511.8 Lesotho - 6.8 8.9 - 17.4 333.7 Madagascar 57.3 35.3 113.2 75.0 1.1 802.2 Malawi 15.4 30.0 14.9 39.9 49.1 739.9 Mauritius 7.7 - 33.7 - 437.9 750.9 Mozambique 9.5 118.9 17.3 60.0 31.6 1,143.0 Namibia - - - - 0.6 168.4 South Africa - - 333.0 203.8 1,732.9 2,780.8 Swaziland 0.4 5.5 - - - 300.1 Zambia 0.4 63.9 - 58.9 0.3 781.1 Zimbabwe 0.4 - - - 1.3 728.2
southern Africa Approvals 108.5 260.4 539.6 475.9 3,395.2 10,409.5
Annual Report 2009264
Annexes
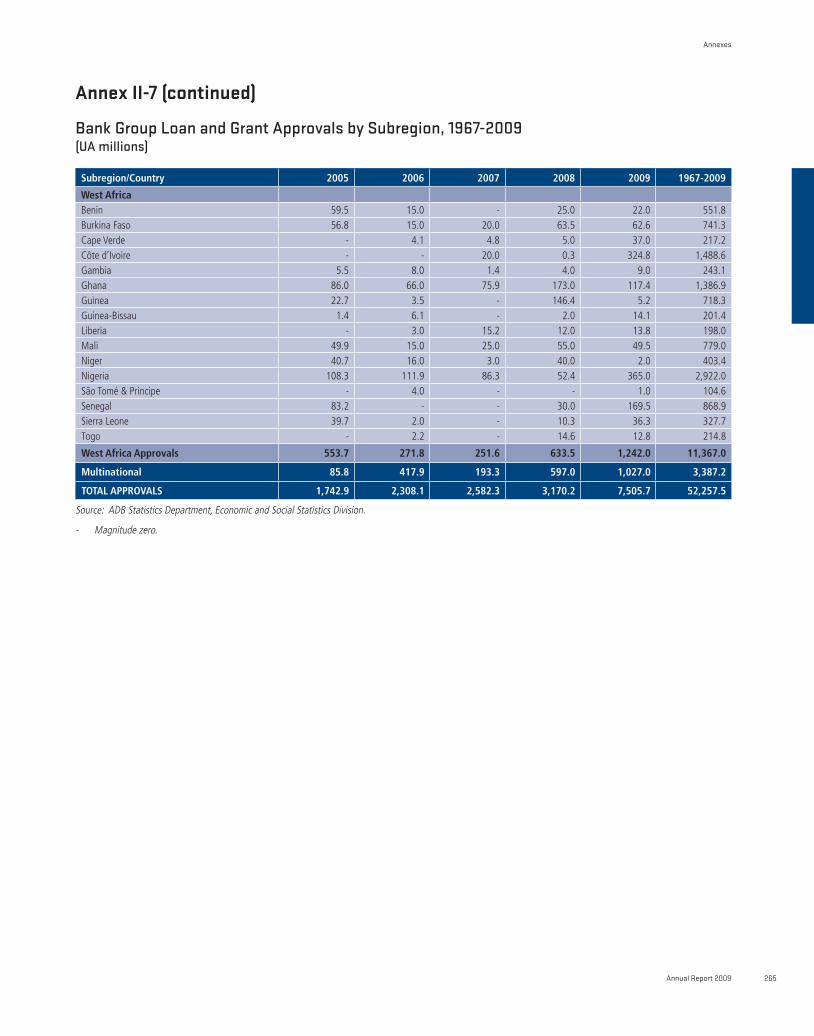
Annex II-7 (continued)
Bank Group Loan and Grant Approvals by Subregion, 1967-2009(UA millions)
subregion/country 2005 2006 2007 2008 2009 1967-2009
West AfricaBenin 59.5 15.0 - 25.0 22.0 551.8 Burkina Faso 56.8 15.0 20.0 63.5 62.6 741.3 Cape Verde - 4.1 4.8 5.0 37.0 217.2 Côte d’Ivoire - - 20.0 0.3 324.8 1,488.6 Gambia 5.5 8.0 1.4 4.0 9.0 243.1 Ghana 86.0 66.0 75.9 173.0 117.4 1,386.9 Guinea 22.7 3.5 - 146.4 5.2 718.3 Guinea-Bissau 1.4 6.1 - 2.0 14.1 201.4 Liberia - 3.0 15.2 12.0 13.8 198.0 Mali 49.9 15.0 25.0 55.0 49.5 779.0 Niger 40.7 16.0 3.0 40.0 2.0 403.4 Nigeria 108.3 111.9 86.3 52.4 365.0 2,922.0 São Tomé & Principe - 4.0 - - 1.0 104.6 Senegal 83.2 - - 30.0 169.5 868.9 Sierra Leone 39.7 2.0 - 10.3 36.3 327.7 Togo - 2.2 - 14.6 12.8 214.8
West Africa Approvals 553.7 271.8 251.6 633.5 1,242.0 11,367.0
Multinational 85.8 417.9 193.3 597.0 1,027.0 3,387.2
TOTAL APPrOVALs 1,742.9 2,308.1 2,582.3 3,170.2 7,505.7 52,257.5
Source: ADB Statistics Department, Economic and Social Statistics Division.
- Magnitude zero.
Annual Report 2009 265
Annexes
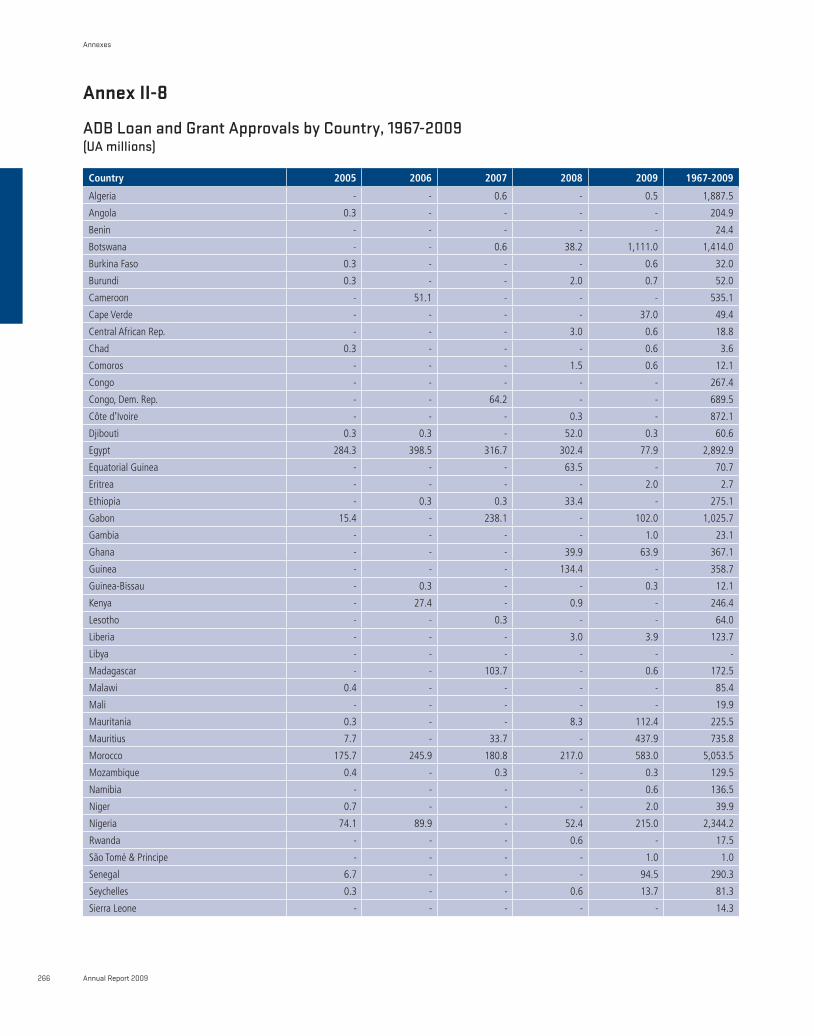
Annex II-8
ADB Loan and Grant Approvals by Country, 1967-2009(UA millions)
country 2005 2006 2007 2008 2009 1967-2009
Algeria - - 0.6 - 0.5 1,887.5
Angola 0.3 - - - - 204.9
Benin - - - - - 24.4
Botswana - - 0.6 38.2 1,111.0 1,414.0
Burkina Faso 0.3 - - - 0.6 32.0
Burundi 0.3 - - 2.0 0.7 52.0
Cameroon - 51.1 - - - 535.1
Cape Verde - - - - 37.0 49.4
Central African Rep. - - - 3.0 0.6 18.8
Chad 0.3 - - - 0.6 3.6
Comoros - - - 1.5 0.6 12.1
Congo - - - - - 267.4
Congo, Dem. Rep. - - 64.2 - - 689.5
Côte d’Ivoire - - - 0.3 - 872.1
Djibouti 0.3 0.3 - 52.0 0.3 60.6
Egypt 284.3 398.5 316.7 302.4 77.9 2,892.9
Equatorial Guinea - - - 63.5 - 70.7
Eritrea - - - - 2.0 2.7
Ethiopia - 0.3 0.3 33.4 - 275.1
Gabon 15.4 - 238.1 - 102.0 1,025.7
Gambia - - - - 1.0 23.1
Ghana - - - 39.9 63.9 367.1
Guinea - - - 134.4 - 358.7
Guinea-Bissau - 0.3 - - 0.3 12.1
Kenya - 27.4 - 0.9 - 246.4
Lesotho - - 0.3 - - 64.0
Liberia - - - 3.0 3.9 123.7
Libya - - - - - -
Madagascar - - 103.7 - 0.6 172.5
Malawi 0.4 - - - - 85.4
Mali - - - - - 19.9
Mauritania 0.3 - - 8.3 112.4 225.5
Mauritius 7.7 - 33.7 - 437.9 735.8
Morocco 175.7 245.9 180.8 217.0 583.0 5,053.5
Mozambique 0.4 - 0.3 - 0.3 129.5
Namibia - - - - 0.6 136.5
Niger 0.7 - - - 2.0 39.9
Nigeria 74.1 89.9 - 52.4 215.0 2,344.2
Rwanda - - - 0.6 - 17.5
São Tomé & Principe - - - - 1.0 1.0
Senegal 6.7 - - - 94.5 290.3
Seychelles 0.3 - - 0.6 13.7 81.3
Sierra Leone - - - - - 14.3
Annual Report 2009266
Annexes

Annex II-8 (continued)
ADB Loan and Grant Approvals by Country, 1967-2009(UA millions)
country 2005 2006 2007 2008 2009 1967-2009
Somalia 0.3 0.3 - - - 8.5
South Africa - - 333.0 203.8 1,732.9 2,780.8
Sudan - 0.3 - - - 105.4
Swaziland 0.4 5.5 - - - 240.7
Tanzania - 0.3 - - - 60.3
Togo - - - - 2.8 35.9
Tunisia 181.7 14.7 87.8 282.7 276.7 4,163.7
Uganda - - 72.2 5.5 - 273.0
Zambia 0.4 28.9 - 8.9 0.3 331.3
Zimbabwe 0.4 - - - 1.3 646.3
Multinational - 70.4 52.2 68.3 459.3 1,064.8
TOTAL 750.7 934.4 1,484.7 1,522.8 5,337.3 30,643.4
Source: ADB Statistics Department, Economic and Social Statistics Division.
- Magnitude zero.
Annual Report 2009 267
Annexes
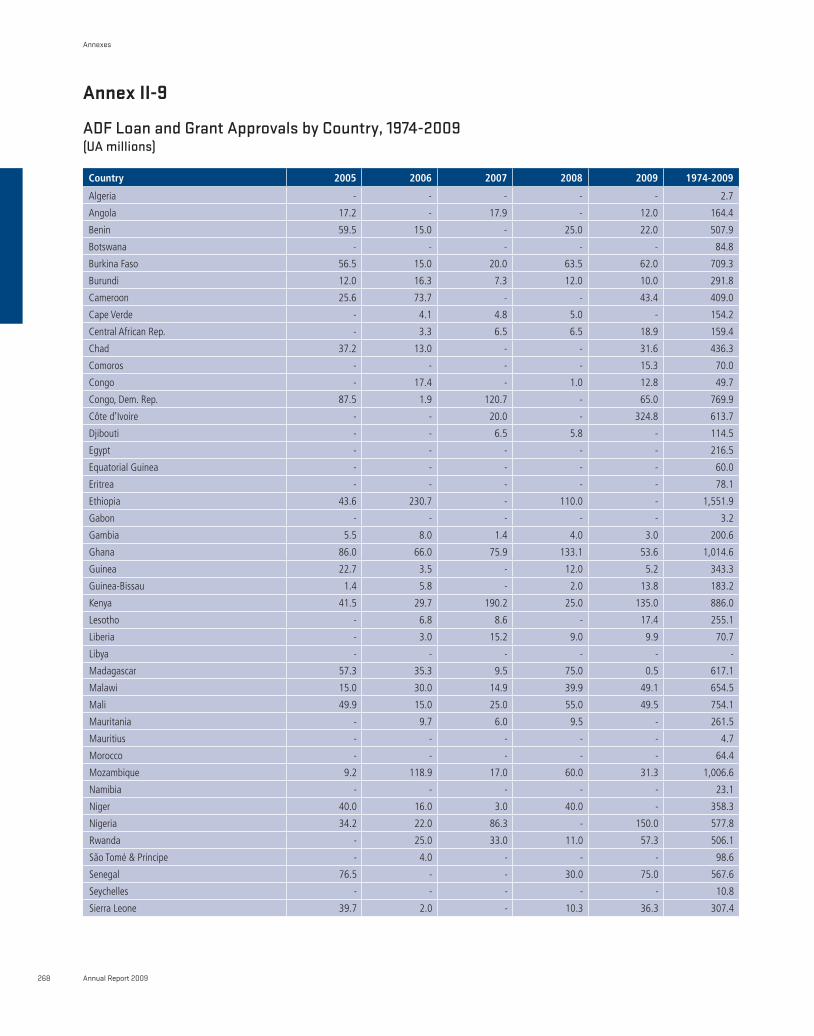
Annex II-9
ADF Loan and Grant Approvals by Country, 1974-2009(UA millions)
country 2005 2006 2007 2008 2009 1974-2009
Algeria - - - - - 2.7
Angola 17.2 - 17.9 - 12.0 164.4
Benin 59.5 15.0 - 25.0 22.0 507.9
Botswana - - - - - 84.8
Burkina Faso 56.5 15.0 20.0 63.5 62.0 709.3
Burundi 12.0 16.3 7.3 12.0 10.0 291.8
Cameroon 25.6 73.7 - - 43.4 409.0
Cape Verde - 4.1 4.8 5.0 - 154.2
Central African Rep. - 3.3 6.5 6.5 18.9 159.4
Chad 37.2 13.0 - - 31.6 436.3
Comoros - - - - 15.3 70.0
Congo - 17.4 - 1.0 12.8 49.7
Congo, Dem. Rep. 87.5 1.9 120.7 - 65.0 769.9
Côte d’Ivoire - - 20.0 - 324.8 613.7
Djibouti - - 6.5 5.8 - 114.5
Egypt - - - - - 216.5
Equatorial Guinea - - - - - 60.0
Eritrea - - - - - 78.1
Ethiopia 43.6 230.7 - 110.0 - 1,551.9
Gabon - - - - - 3.2
Gambia 5.5 8.0 1.4 4.0 3.0 200.6
Ghana 86.0 66.0 75.9 133.1 53.6 1,014.6
Guinea 22.7 3.5 - 12.0 5.2 343.3
Guinea-Bissau 1.4 5.8 - 2.0 13.8 183.2
Kenya 41.5 29.7 190.2 25.0 135.0 886.0
Lesotho - 6.8 8.6 - 17.4 255.1
Liberia - 3.0 15.2 9.0 9.9 70.7
Libya - - - - - -
Madagascar 57.3 35.3 9.5 75.0 0.5 617.1
Malawi 15.0 30.0 14.9 39.9 49.1 654.5
Mali 49.9 15.0 25.0 55.0 49.5 754.1
Mauritania - 9.7 6.0 9.5 - 261.5
Mauritius - - - - - 4.7
Morocco - - - - - 64.4
Mozambique 9.2 118.9 17.0 60.0 31.3 1,006.6
Namibia - - - - - 23.1
Niger 40.0 16.0 3.0 40.0 - 358.3
Nigeria 34.2 22.0 86.3 - 150.0 577.8
Rwanda - 25.0 33.0 11.0 57.3 506.1
São Tomé & Principe - 4.0 - - - 98.6
Senegal 76.5 - - 30.0 75.0 567.6
Seychelles - - - - - 10.8
Sierra Leone 39.7 2.0 - 10.3 36.3 307.4
Annual Report 2009268
Annexes
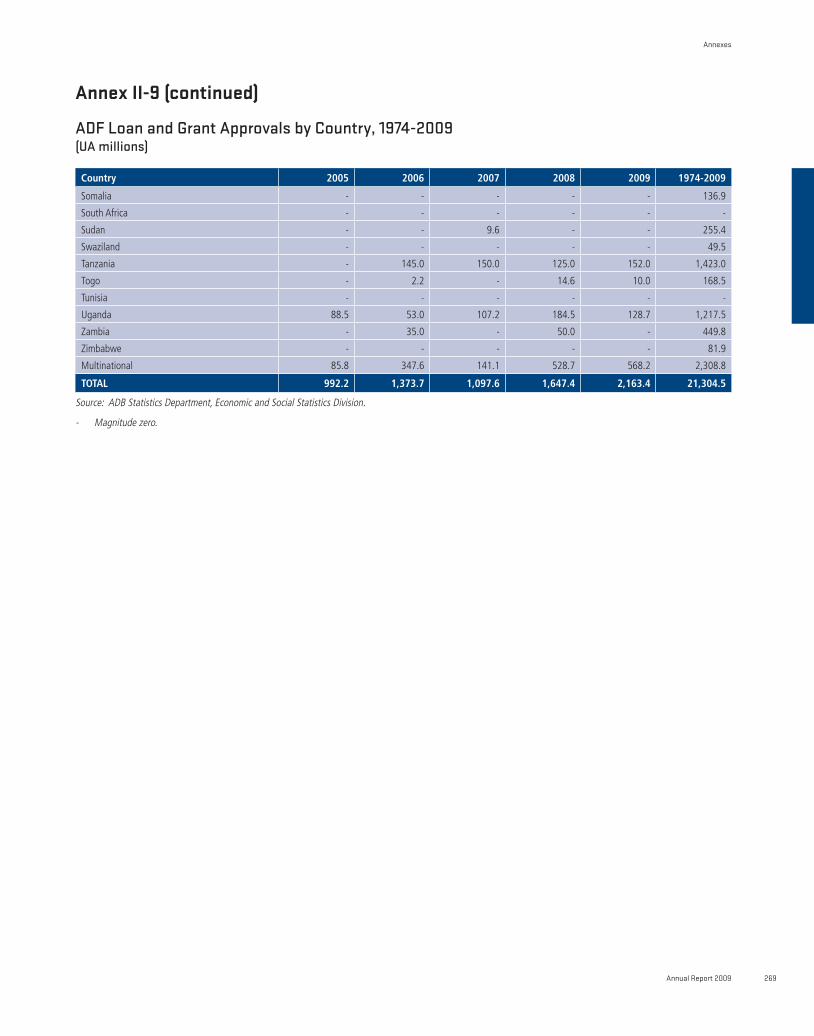
Annex II-9 (continued)
ADF Loan and Grant Approvals by Country, 1974-2009(UA millions)
country 2005 2006 2007 2008 2009 1974-2009
Somalia - - - - - 136.9
South Africa - - - - - -
Sudan - - 9.6 - - 255.4
Swaziland - - - - - 49.5
Tanzania - 145.0 150.0 125.0 152.0 1,423.0
Togo - 2.2 - 14.6 10.0 168.5
Tunisia - - - - - -
Uganda 88.5 53.0 107.2 184.5 128.7 1,217.5
Zambia - 35.0 - 50.0 - 449.8
Zimbabwe - - - - - 81.9
Multinational 85.8 347.6 141.1 528.7 568.2 2,308.8
TOTAL 992.2 1,373.7 1,097.6 1,647.4 2,163.4 21,304.5
Source: ADB Statistics Department, Economic and Social Statistics Division.
- Magnitude zero.
Annual Report 2009 269
Annexes
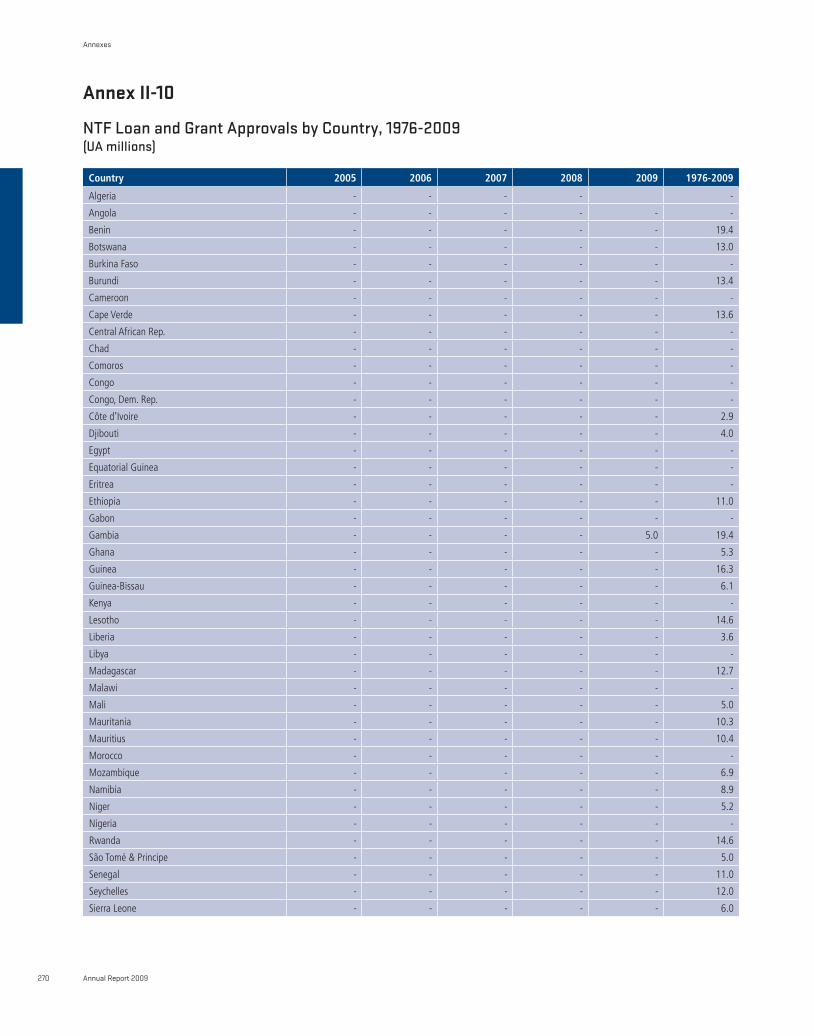
Annex II-10
NTF Loan and Grant Approvals by Country, 1976-2009(UA millions)
country 2005 2006 2007 2008 2009 1976-2009
Algeria - - - - -
Angola - - - - - -
Benin - - - - - 19.4
Botswana - - - - - 13.0
Burkina Faso - - - - - -
Burundi - - - - - 13.4
Cameroon - - - - - -
Cape Verde - - - - - 13.6
Central African Rep. - - - - - -
Chad - - - - - -
Comoros - - - - - -
Congo - - - - - -
Congo, Dem. Rep. - - - - - -
Côte d’Ivoire - - - - - 2.9
Djibouti - - - - - 4.0
Egypt - - - - - -
Equatorial Guinea - - - - - -
Eritrea - - - - - -
Ethiopia - - - - - 11.0
Gabon - - - - - -
Gambia - - - - 5.0 19.4
Ghana - - - - - 5.3
Guinea - - - - - 16.3
Guinea-Bissau - - - - - 6.1
Kenya - - - - - -
Lesotho - - - - - 14.6
Liberia - - - - - 3.6
Libya - - - - - -
Madagascar - - - - - 12.7
Malawi - - - - - -
Mali - - - - - 5.0
Mauritania - - - - - 10.3
Mauritius - - - - - 10.4
Morocco - - - - - -
Mozambique - - - - - 6.9
Namibia - - - - - 8.9
Niger - - - - - 5.2
Nigeria - - - - - -
Rwanda - - - - - 14.6
São Tomé & Principe - - - - - 5.0
Senegal - - - - - 11.0
Seychelles - - - - - 12.0
Sierra Leone - - - - - 6.0
Annual Report 2009270
Annexes
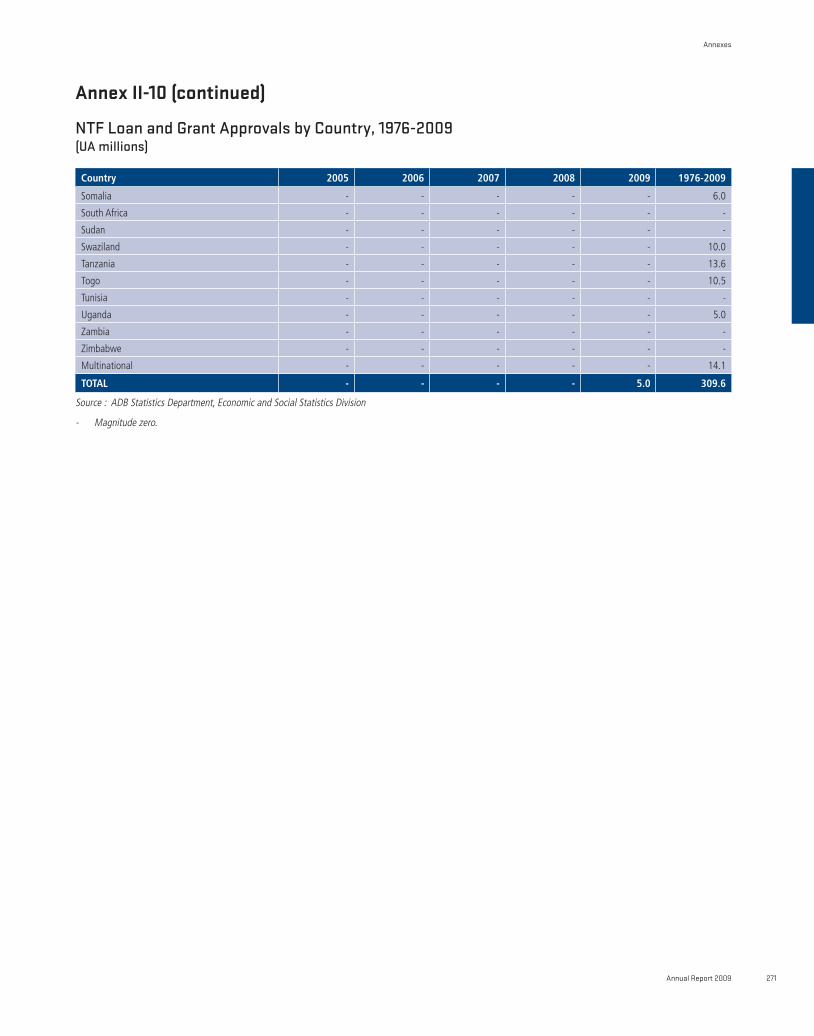
Annex II-10 (continued)
NTF Loan and Grant Approvals by Country, 1976-2009(UA millions)
country 2005 2006 2007 2008 2009 1976-2009
Somalia - - - - - 6.0
South Africa - - - - - -
Sudan - - - - - -
Swaziland - - - - - 10.0
Tanzania - - - - - 13.6
Togo - - - - - 10.5
Tunisia - - - - - -
Uganda - - - - - 5.0
Zambia - - - - - -
Zimbabwe - - - - - -
Multinational - - - - - 14.1
TOTAL - - - - 5.0 309.6
Source : ADB Statistics Department, Economic and Social Statistics Division
- Magnitude zero.
Annual Report 2009 271
Annexes
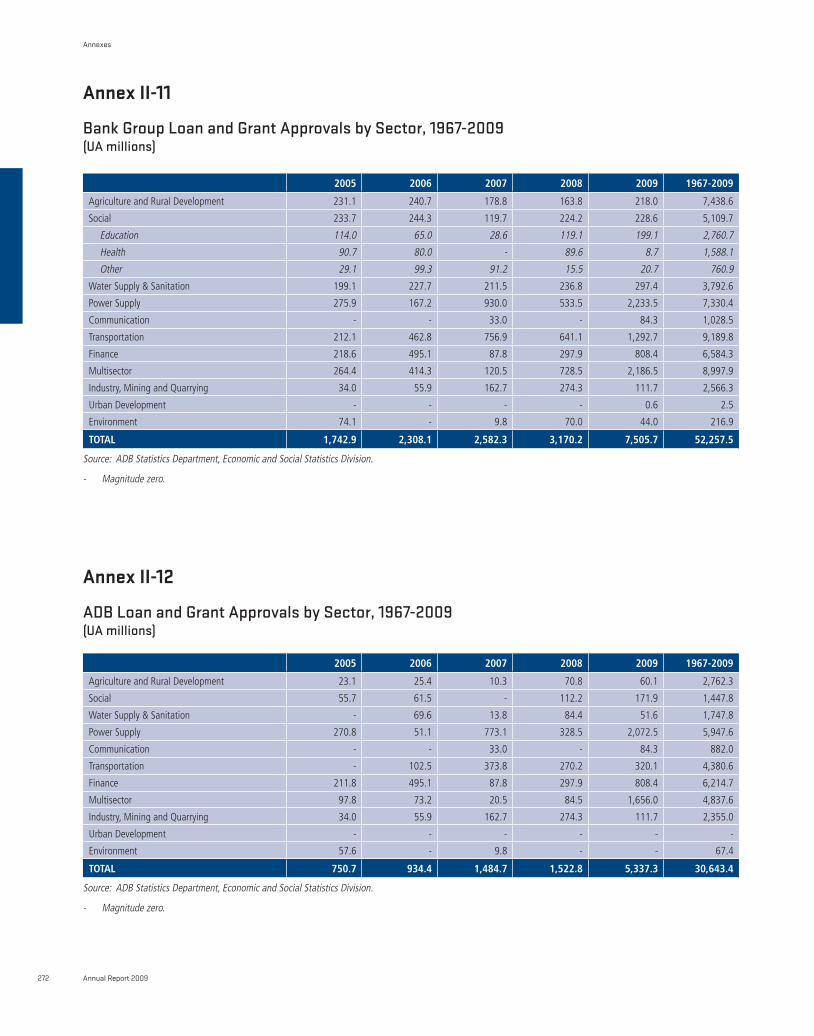
Annex II-11
Bank Group Loan and Grant Approvals by Sector, 1967-2009(UA millions)
Annex II-12
ADB Loan and Grant Approvals by Sector, 1967-2009(UA millions)
2005 2006 2007 2008 2009 1967-2009
Agriculture and Rural Development 231.1 240.7 178.8 163.8 218.0 7,438.6
Social 233.7 244.3 119.7 224.2 228.6 5,109.7
Education 114.0 65.0 28.6 119.1 199.1 2,760.7
Health 90.7 80.0 - 89.6 8.7 1,588.1
Other 29.1 99.3 91.2 15.5 20.7 760.9
Water Supply & Sanitation 199.1 227.7 211.5 236.8 297.4 3,792.6
Power Supply 275.9 167.2 930.0 533.5 2,233.5 7,330.4
Communication - - 33.0 - 84.3 1,028.5
Transportation 212.1 462.8 756.9 641.1 1,292.7 9,189.8
Finance 218.6 495.1 87.8 297.9 808.4 6,584.3
Multisector 264.4 414.3 120.5 728.5 2,186.5 8,997.9
Industry, Mining and Quarrying 34.0 55.9 162.7 274.3 111.7 2,566.3
Urban Development - - - - 0.6 2.5
Environment 74.1 - 9.8 70.0 44.0 216.9
TOTAL 1,742.9 2,308.1 2,582.3 3,170.2 7,505.7 52,257.5
Source: ADB Statistics Department, Economic and Social Statistics Division.
- Magnitude zero.
2005 2006 2007 2008 2009 1967-2009
Agriculture and Rural Development 23.1 25.4 10.3 70.8 60.1 2,762.3
Social 55.7 61.5 - 112.2 171.9 1,447.8
Water Supply & Sanitation - 69.6 13.8 84.4 51.6 1,747.8
Power Supply 270.8 51.1 773.1 328.5 2,072.5 5,947.6
Communication - - 33.0 - 84.3 882.0
Transportation - 102.5 373.8 270.2 320.1 4,380.6
Finance 211.8 495.1 87.8 297.9 808.4 6,214.7
Multisector 97.8 73.2 20.5 84.5 1,656.0 4,837.6
Industry, Mining and Quarrying 34.0 55.9 162.7 274.3 111.7 2,355.0
Urban Development - - - - - -
Environment 57.6 - 9.8 - - 67.4
TOTAL 750.7 934.4 1,484.7 1,522.8 5,337.3 30,643.4
Source: ADB Statistics Department, Economic and Social Statistics Division.
- Magnitude zero.
Annual Report 2009272
Annexes
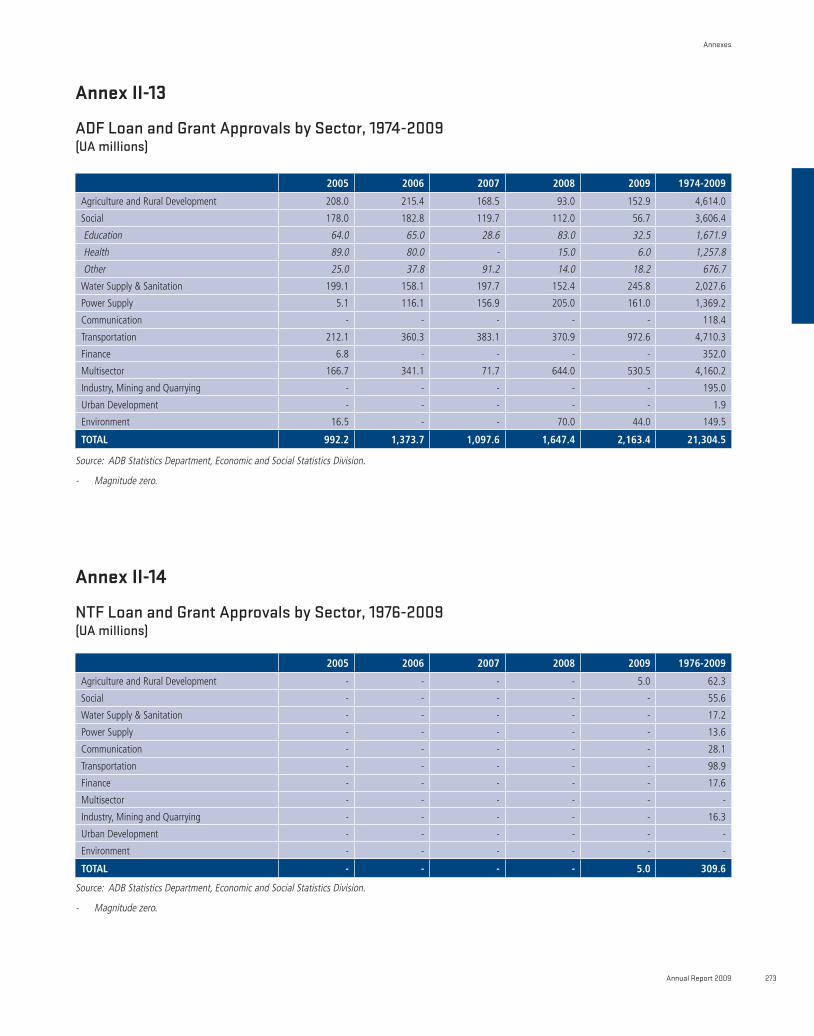
Annex II-13
ADF Loan and Grant Approvals by Sector, 1974-2009(UA millions)
Annex II-14
NTF Loan and Grant Approvals by Sector, 1976-2009(UA millions)
2005 2006 2007 2008 2009 1974-2009
Agriculture and Rural Development 208.0 215.4 168.5 93.0 152.9 4,614.0
Social 178.0 182.8 119.7 112.0 56.7 3,606.4
Education 64.0 65.0 28.6 83.0 32.5 1,671.9
Health 89.0 80.0 - 15.0 6.0 1,257.8
Other 25.0 37.8 91.2 14.0 18.2 676.7
Water Supply & Sanitation 199.1 158.1 197.7 152.4 245.8 2,027.6
Power Supply 5.1 116.1 156.9 205.0 161.0 1,369.2
Communication - - - - - 118.4
Transportation 212.1 360.3 383.1 370.9 972.6 4,710.3
Finance 6.8 - - - - 352.0
Multisector 166.7 341.1 71.7 644.0 530.5 4,160.2
Industry, Mining and Quarrying - - - - - 195.0
Urban Development - - - - - 1.9
Environment 16.5 - - 70.0 44.0 149.5
TOTAL 992.2 1,373.7 1,097.6 1,647.4 2,163.4 21,304.5
Source: ADB Statistics Department, Economic and Social Statistics Division.
- Magnitude zero.
2005 2006 2007 2008 2009 1976-2009
Agriculture and Rural Development - - - - 5.0 62.3
Social - - - - - 55.6
Water Supply & Sanitation - - - - - 17.2
Power Supply - - - - - 13.6
Communication - - - - - 28.1
Transportation - - - - - 98.9
Finance - - - - - 17.6
Multisector - - - - - -
Industry, Mining and Quarrying - - - - - 16.3
Urban Development - - - - - -
Environment - - - - - -
TOTAL - - - - 5.0 309.6
Source: ADB Statistics Department, Economic and Social Statistics Division.
- Magnitude zero.
Annual Report 2009 273
Annexes
Annex II-15
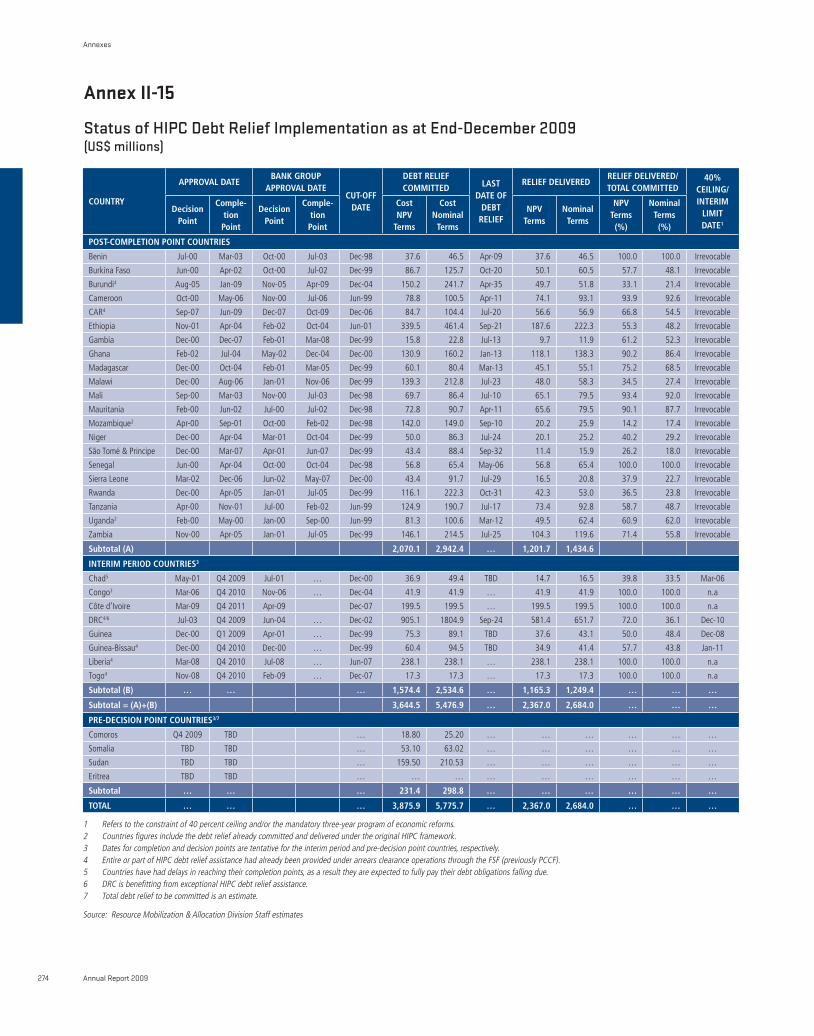
Status of HIPC Debt Relief Implementation as at End-December 2009(US$ millions)
cOUnTry
APPrOVAL dATe BAnK GrOUP
APPrOVAL dATe cUT-OFF
dATe
deBT reLIeF cOMMITTed LAsT
dATe OF deBT
reLIeF
reLIeF deLIVeredreLIeF deLIVered/ TOTAL cOMMITTed
40% ceILInG/ InTerIM
LIMIT dATe1
decision Point
comple- tion Point
decision Point
comple- tion Point
cost nPV
Terms
cost nominal
Terms
nPV Terms
nominal Terms
nPV Terms (%)
nominal Terms (%)
POsT-cOMPLeTIOn POInT cOUnTrIes
Benin Jul-00 Mar-03 Oct-00 Jul-03 Dec-98 37.6 46.5 Apr-09 37.6 46.5 100.0 100.0 Irrevocable
Burkina Faso Jun-00 Apr-02 Oct-00 Jul-02 Dec-99 86.7 125.7 Oct-20 50.1 60.5 57.7 48.1 Irrevocable
Burundi4 Aug-05 Jan-09 Nov-05 Apr-09 Dec-04 150.2 241.7 Apr-35 49.7 51.8 33.1 21.4 Irrevocable
Cameroon Oct-00 May-06 Nov-00 Jul-06 Jun-99 78.8 100.5 Apr-11 74.1 93.1 93.9 92.6 Irrevocable
CAR4 Sep-07 Jun-09 Dec-07 Oct-09 Dec-06 84.7 104.4 Jul-20 56.6 56.9 66.8 54.5 Irrevocable
Ethiopia Nov-01 Apr-04 Feb-02 Oct-04 Jun-01 339.5 461.4 Sep-21 187.6 222.3 55.3 48.2 Irrevocable
Gambia Dec-00 Dec-07 Feb-01 Mar-08 Dec-99 15.8 22.8 Jul-13 9.7 11.9 61.2 52.3 Irrevocable
Ghana Feb-02 Jul-04 May-02 Dec-04 Dec-00 130.9 160.2 Jan-13 118.1 138.3 90.2 86.4 Irrevocable
Madagascar Dec-00 Oct-04 Feb-01 Mar-05 Dec-99 60.1 80.4 Mar-13 45.1 55.1 75.2 68.5 Irrevocable
Malawi Dec-00 Aug-06 Jan-01 Nov-06 Dec-99 139.3 212.8 Jul-23 48.0 58.3 34.5 27.4 Irrevocable
Mali Sep-00 Mar-03 Nov-00 Jul-03 Dec-98 69.7 86.4 Jul-10 65.1 79.5 93.4 92.0 Irrevocable
Mauritania Feb-00 Jun-02 Jul-00 Jul-02 Dec-98 72.8 90.7 Apr-11 65.6 79.5 90.1 87.7 Irrevocable
Mozambique2 Apr-00 Sep-01 Oct-00 Feb-02 Dec-98 142.0 149.0 Sep-10 20.2 25.9 14.2 17.4 Irrevocable
Niger Dec-00 Apr-04 Mar-01 Oct-04 Dec-99 50.0 86.3 Jul-24 20.1 25.2 40.2 29.2 Irrevocable
São Tomé & Principe Dec-00 Mar-07 Apr-01 Jun-07 Dec-99 43.4 88.4 Sep-32 11.4 15.9 26.2 18.0 Irrevocable
Senegal Jun-00 Apr-04 Oct-00 Oct-04 Dec-98 56.8 65.4 May-06 56.8 65.4 100.0 100.0 Irrevocable
Sierra Leone Mar-02 Dec-06 Jun-02 May-07 Dec-00 43.4 91.7 Jul-29 16.5 20.8 37.9 22.7 Irrevocable
Rwanda Dec-00 Apr-05 Jan-01 Jul-05 Dec-99 116.1 222.3 Oct-31 42.3 53.0 36.5 23.8 Irrevocable
Tanzania Apr-00 Nov-01 Jul-00 Feb-02 Jun-99 124.9 190.7 Jul-17 73.4 92.8 58.7 48.7 Irrevocable
Uganda2 Feb-00 May-00 Jan-00 Sep-00 Jun-99 81.3 100.6 Mar-12 49.5 62.4 60.9 62.0 Irrevocable
Zambia Nov-00 Apr-05 Jan-01 Jul-05 Dec-99 146.1 214.5 Jul-25 104.3 119.6 71.4 55.8 Irrevocable
subtotal (A) 2,070.1 2,942.4 … 1,201.7 1,434.6
InTerIM PerIOd cOUnTrIes3
Chad5 May-01 Q4 2009 Jul-01 … Dec-00 36.9 49.4 TBD 14.7 16.5 39.8 33.5 Mar-06
Congo3 Mar-06 Q4 2010 Nov-06 … Dec-04 41.9 41.9 … 41.9 41.9 100.0 100.0 n.a
Côte d’Ivoire Mar-09 Q4 2011 Apr-09 Dec-07 199.5 199.5 … 199.5 199.5 100.0 100.0 n.a
DRC4/6 Jul-03 Q4 2009 Jun-04 … Dec-02 905.1 1804.9 Sep-24 581.4 651.7 72.0 36.1 Dec-10
Guinea Dec-00 Q1 2009 Apr-01 … Dec-99 75.3 89.1 TBD 37.6 43.1 50.0 48.4 Dec-08
Guinea-Bissau4 Dec-00 Q4 2010 Dec-00 … Dec-99 60.4 94.5 TBD 34.9 41.4 57.7 43.8 Jan-11
Liberia4 Mar-08 Q4 2010 Jul-08 … Jun-07 238.1 238.1 … 238.1 238.1 100.0 100.0 n.a
Togo4 Nov-08 Q4 2010 Feb-09 … Dec-07 17.3 17.3 … 17.3 17.3 100.0 100.0 n.a
subtotal (B) … … … 1,574.4 2,534.6 … 1,165.3 1,249.4 … … …
subtotal = (A)+(B) 3,644.5 5,476.9 … 2,367.0 2,684.0 … … …
Pre-decIsIOn POInT cOUnTrIes3/7
Comoros Q4 2009 TBD … 18.80 25.20 … … … … … …
Somalia TBD TBD … 53.10 63.02 … … … … … …
Sudan TBD TBD … 159.50 210.53 … … … … … …
Eritrea TBD TBD … … … … … … … … …
subtotal … … … 231.4 298.8 … … … … … …
TOTAL … … … 3,875.9 5,775.7 … 2,367.0 2,684.0 … … …
1 Refers to the constraint of 40 percent ceiling and/or the mandatory three-year program of economic reforms.2 Countries figures include the debt relief already committed and delivered under the original HIPC framework.3 Dates for completion and decision points are tentative for the interim period and pre-decision point countries, respectively.4 Entire or part of HIPC debt relief assistance had already been provided under arrears clearance operations through the FSF (previously PCCF).5 Countries have had delays in reaching their completion points, as a result they are expected to fully pay their debt obligations falling due.6 DRC is benefitting from exceptional HIPC debt relief assistance.7 Total debt relief to be committed is an estimate.
Source: Resource Mobilization & Allocation Division Staff estimates
Annual Report 2009274
Annexes
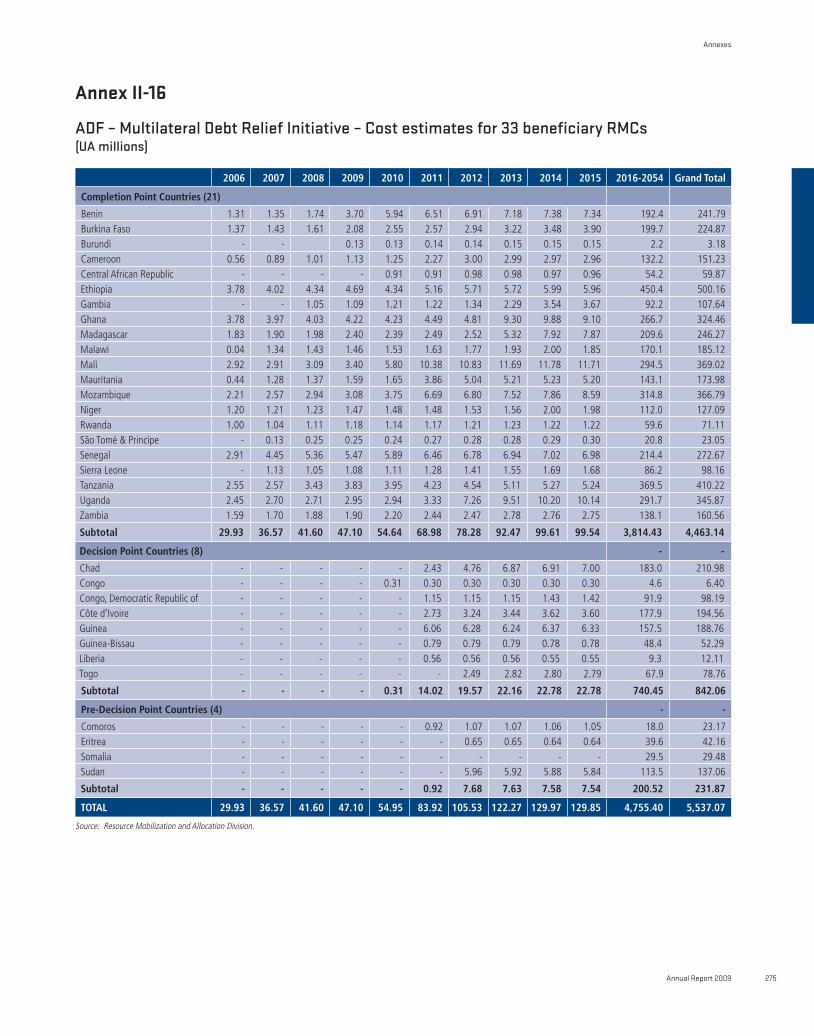
Annex II-16
ADF – Multilateral Debt Relief Initiative – Cost estimates for 33 beneficiary RMCs(UA millions)
2006 2007 2008 2009 2010 2011 2012 2013 2014 2015 2016-2054 Grand Total
completion Point countries (21)
Benin 1.31 1.35 1.74 3.70 5.94 6.51 6.91 7.18 7.38 7.34 192.4 241.79 Burkina Faso 1.37 1.43 1.61 2.08 2.55 2.57 2.94 3.22 3.48 3.90 199.7 224.87 Burundi - - 0.13 0.13 0.14 0.14 0.15 0.15 0.15 2.2 3.18 Cameroon 0.56 0.89 1.01 1.13 1.25 2.27 3.00 2.99 2.97 2.96 132.2 151.23 Central African Republic - - - - 0.91 0.91 0.98 0.98 0.97 0.96 54.2 59.87 Ethiopia 3.78 4.02 4.34 4.69 4.34 5.16 5.71 5.72 5.99 5.96 450.4 500.16 Gambia - - 1.05 1.09 1.21 1.22 1.34 2.29 3.54 3.67 92.2 107.64 Ghana 3.78 3.97 4.03 4.22 4.23 4.49 4.81 9.30 9.88 9.10 266.7 324.46 Madagascar 1.83 1.90 1.98 2.40 2.39 2.49 2.52 5.32 7.92 7.87 209.6 246.27 Malawi 0.04 1.34 1.43 1.46 1.53 1.63 1.77 1.93 2.00 1.85 170.1 185.12 Mali 2.92 2.91 3.09 3.40 5.80 10.38 10.83 11.69 11.78 11.71 294.5 369.02 Mauritania 0.44 1.28 1.37 1.59 1.65 3.86 5.04 5.21 5.23 5.20 143.1 173.98 Mozambique 2.21 2.57 2.94 3.08 3.75 6.69 6.80 7.52 7.86 8.59 314.8 366.79 Niger 1.20 1.21 1.23 1.47 1.48 1.48 1.53 1.56 2.00 1.98 112.0 127.09 Rwanda 1.00 1.04 1.11 1.18 1.14 1.17 1.21 1.23 1.22 1.22 59.6 71.11 São Tomé & Principe - 0.13 0.25 0.25 0.24 0.27 0.28 0.28 0.29 0.30 20.8 23.05 Senegal 2.91 4.45 5.36 5.47 5.89 6.46 6.78 6.94 7.02 6.98 214.4 272.67 Sierra Leone - 1.13 1.05 1.08 1.11 1.28 1.41 1.55 1.69 1.68 86.2 98.16 Tanzania 2.55 2.57 3.43 3.83 3.95 4.23 4.54 5.11 5.27 5.24 369.5 410.22 Uganda 2.45 2.70 2.71 2.95 2.94 3.33 7.26 9.51 10.20 10.14 291.7 345.87 Zambia 1.59 1.70 1.88 1.90 2.20 2.44 2.47 2.78 2.76 2.75 138.1 160.56
subtotal 29.93 36.57 41.60 47.10 54.64 68.98 78.28 92.47 99.61 99.54 3,814.43 4,463.14
decision Point countries (8) - -
Chad - - - - - 2.43 4.76 6.87 6.91 7.00 183.0 210.98 Congo - - - - 0.31 0.30 0.30 0.30 0.30 0.30 4.6 6.40 Congo, Democratic Republic of - - - - - 1.15 1.15 1.15 1.43 1.42 91.9 98.19 Côte d’Ivoire - - - - - 2.73 3.24 3.44 3.62 3.60 177.9 194.56 Guinea - - - - - 6.06 6.28 6.24 6.37 6.33 157.5 188.76 Guinea-Bissau - - - - - 0.79 0.79 0.79 0.78 0.78 48.4 52.29 Liberia - - - - - 0.56 0.56 0.56 0.55 0.55 9.3 12.11 Togo - - - - - - 2.49 2.82 2.80 2.79 67.9 78.76
subtotal - - - - 0.31 14.02 19.57 22.16 22.78 22.78 740.45 842.06
Pre-decision Point countries (4) - -
Comoros - - - - - 0.92 1.07 1.07 1.06 1.05 18.0 23.17 Eritrea - - - - - - 0.65 0.65 0.64 0.64 39.6 42.16 Somalia - - - - - - - - - - 29.5 29.48 Sudan - - - - - - 5.96 5.92 5.88 5.84 113.5 137.06
subtotal - - - - - 0.92 7.68 7.63 7.58 7.54 200.52 231.87
TOTAL 29.93 36.57 41.60 47.10 54.95 83.92 105.53 122.27 129.97 129.85 4,755.40 5,537.07
Source: Resource Mobilization and Allocation Division.
Annual Report 2009 275
Annexes
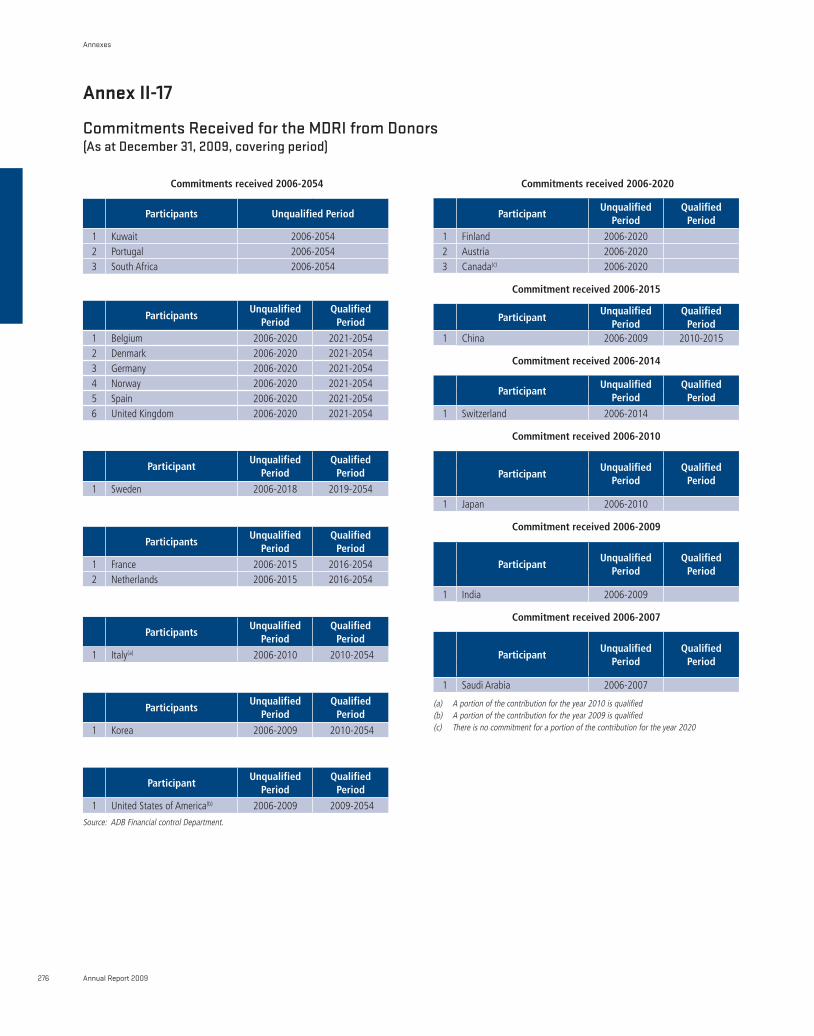
Annex II-17
Commitments Received for the MDRI from Donors(As at December 31, 2009, covering period)
commitments received 2006-2054
Participants Unqualified Period
1 Kuwait 2006-20542 Portugal 2006-20543 South Africa 2006-2054
ParticipantsUnqualified
PeriodQualified
Period
1 Belgium 2006-2020 2021-20542 Denmark 2006-2020 2021-20543 Germany 2006-2020 2021-20544 Norway 2006-2020 2021-20545 Spain 2006-2020 2021-20546 United Kingdom 2006-2020 2021-2054
ParticipantUnqualified
PeriodQualified
Period
1 Sweden 2006-2018 2019-2054
ParticipantsUnqualified
PeriodQualified
Period
1 France 2006-2015 2016-20542 Netherlands 2006-2015 2016-2054
ParticipantsUnqualified
PeriodQualified
Period
1 Italy(a) 2006-2010 2010-2054
ParticipantsUnqualified
PeriodQualified
Period
1 Korea 2006-2009 2010-2054
ParticipantUnqualified
PeriodQualified
Period
1 United States of America(b) 2006-2009 2009-2054
Source: ADB Financial control Department.
commitments received 2006-2020
ParticipantUnqualified
PeriodQualified
Period
1 Finland 2006-20202 Austria 2006-20203 Canada(c) 2006-2020
commitment received 2006-2015
ParticipantUnqualified
PeriodQualified
Period1 China 2006-2009 2010-2015
commitment received 2006-2014
ParticipantUnqualified
PeriodQualified
Period
1 Switzerland 2006-2014
commitment received 2006-2010
ParticipantUnqualified
PeriodQualified
Period
1 Japan 2006-2010
commitment received 2006-2009
ParticipantUnqualified
PeriodQualified
Period
1 India 2006-2009
commitment received 2006-2007
ParticipantUnqualified
PeriodQualified
Period
1 Saudi Arabia 2006-2007
(a) A portion of the contribution for the year 2010 is qualified(b) A portion of the contribution for the year 2009 is qualified(c) There is no commitment for a portion of the contribution for the year 2020
Annual Report 2009276
Annexes
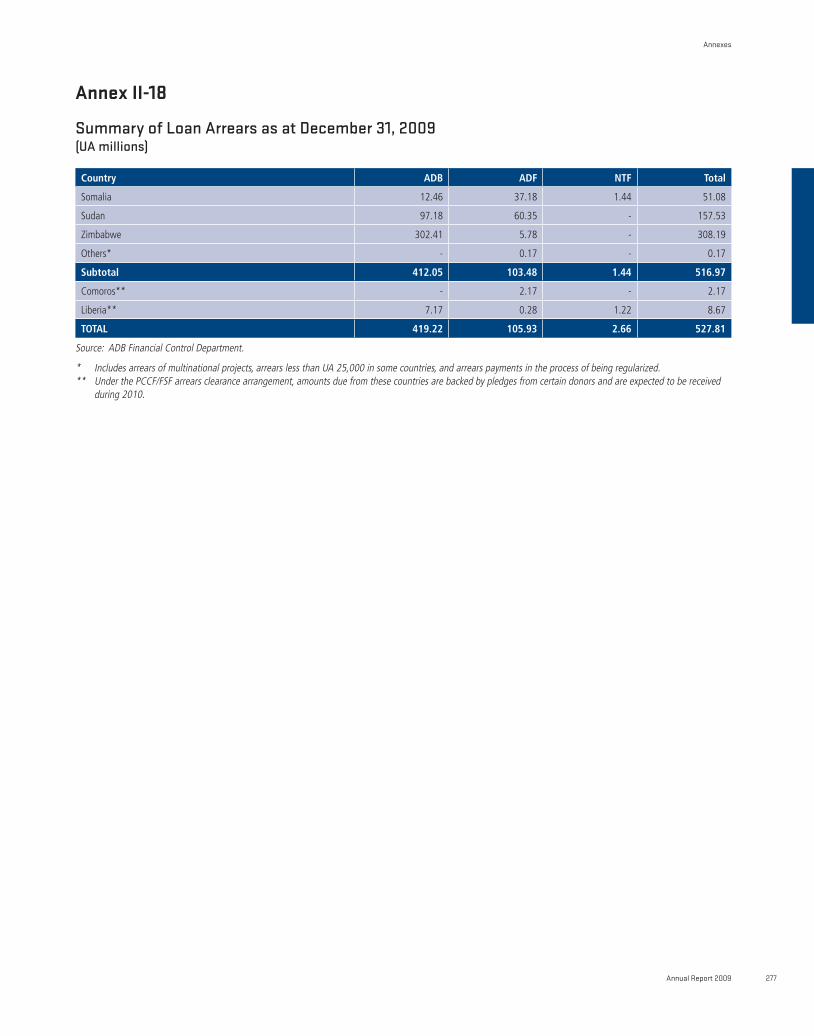
Annex II-18
Summary of Loan Arrears as at December 31, 2009(UA millions)
country AdB AdF nTF Total
Somalia 12.46 37.18 1.44 51.08
Sudan 97.18 60.35 - 157.53
Zimbabwe 302.41 5.78 - 308.19
Others* - 0.17 - 0.17
subtotal 412.05 103.48 1.44 516.97
Comoros** - 2.17 - 2.17
Liberia** 7.17 0.28 1.22 8.67
TOTAL 419.22 105.93 2.66 527.81
Source: ADB Financial Control Department.
* Includes arrears of multinational projects, arrears less than UA 25,000 in some countries, and arrears payments in the process of being regularized.** Under the PCCF/FSF arrears clearance arrangement, amounts due from these countries are backed by pledges from certain donors and are expected to be received
during 2010.
Annual Report 2009 277
Annexes
Index
Abbreviations: viiAction Plan for Quality and Results: 17ADB, see African Development Bank ADF, see African Development Fund ADF-XI Midterm Review: 35ADF-XII Replenishment Consultations: 35Adjudication Services: 61 Administrative Expenses and Capital Expenditure Budget: 8Administrative Services: 61Administrative Tribunal: 61ADOA: 23, 57
Africa:Overview of Macroeconomic Situation: 10Selected social indicators: 256Selected macroeconomic indicators: 257
African Development Bank:Administrative Budget for 2010: 189Approvals by country: 42, 266-7Approvals by financing instrument: 42, 43Approvals by sector: 272 Bank ratings: 105Board of Directors: voting powers and countries represented: 247-8Board of Governors: voting powers of member countries: 245Borrowings: 105Capital subscriptions: 105Cumulative approvals by institution, 1967-2009: xxivCumulative approvals by sector, 1967-2009: xxivCumulative approvals by subregion: 42, 44Disbursements: 44, 106Financial management: 105Financial products: 106Financial results: 107Financial statements: 110-187
Balance sheet: 110Income statement: 112Notes to the Financial Statements: 116Report of the Independent Auditor: 187Statement of cash flows: 115Statement of comprehensive income: 113
Investments: 106Loan and grant approvals and disbursements, 2000-2009: xxivLoan portfolio: 44, 106Net income, 2000-2009: xxvResolutions adopted by Board of Governors in 2009: 244Risk management policies and processes: 107Total approvals: 42
African Development Bank Group:Approvals by sector: 40, 272Approvals by subregion: 47, 264-5Approvals by window: 40Background to Bank Group Establishment: xi-xiiCumulative approvals by sector, 1967-2009: xxv, 41Loan and grant approvals and disbursements, 2000-2009: xxvOperations: 40Payments to supplying countries for procurement of goods & services by origin of supply: 260-1Payments to supplying countries for procurement of goods & services by source of supply: 262-3Strategic directions and priorities: 16Summary of approvals, 2009: xxivSummary of operations, resources, and finance, 2000-2008: xxiiiTransfer of resources to RMCs, 1967-2009: 258Transfer of concessional resources to RMCs, 1974-2009: 259
African Development Fund:Administrative budget for 2010: 212Approvals by country: 268-9Approvals by financing instrument: 44, 45Approvals by sector: 273Board of Directors: voting powers and countries represented: 251Board of Governors and resolutions adopted: 249Board of Governors: voting powers of State Participants and of the ADB: 250Commitments under MDRI: 190Cumulative approvals by subregion: 46, 48Disbursements: 46, 190Financial management: 190Financial results: 190Investments: 190Loan and grant approvals by country, 2009Loan portfolio: 46Resolutions adopted by Board of Governors in 2009: 249
Annual Report 2009278
Index