Embed Size (px)
Citation preview

2016 2017
ANNUAL REPORTA workers’ compensation and injury management scheme that works for all

3 Introduction 3 About this report
4 About us
6 Year in review
11 Section 1: Agency in focus12 Agency brief
12 Organisational structure
14 Leadership
18 Strategic planning
22 Enabling legislation
23 Governance
30 Performance Management Framework
32 People
33 Section 2: Scheme performance34 Open and transparent reporting
34 Comparative overview
35 Scheme performance report
39 Section 3: Report on operations40 Service 1: Scheme Regulation
52 Service 2: Scheme Services
67 Section 4: Opportunities and challenges68 Opportunity and accessibility
70 Equality and inclusion
71 Safety, health and wellbeing
72 Agency challenges
74 Information technology initiatives
75 Section 5: Disclosures and legal compliance76 Report on funds management
78 Other financial disclosures
83 Ministerial directives
83 Governance disclosures
88 Legal compliance
90 Government policy requirements
91 Section 6: Key Performance Indicators92 Additional Key Performance Indicator information
94 Key Performance Indicators
107 Section 7: Financial statements and notes108 Financial statements
113 Notes to the financial statements
The Good Governance Guide Checklist is on pages 84–85.
WorkCover WAAnnual Report 2016/17
© WorkCover WA, Government of Western Australia 2017
ISSN 1839 - 1281 ISSN 1839 - 129X
Contents
Agency in focus Scheme performance
Report on operations
Opportunities and challenges
Disclosures and legal compliance
Key performance indicators
Financial statements and notes
GGG Checklist
2
Introduction

This report provides a comprehensive account of our oversight and regulation of Western Australia’s workers’ compensation and injury management scheme over the past year. An introduction to WorkCover WA (the Agency) and our year in review begins on page 4. For detailed information refer to section(s):
1. Agency in focus » page 11
2. Scheme performance » page 33
3. Report on operations » page 39
4. Opportunities and challenges » page 67
5. Disclosures and legal compliance » page 75
6. Key Performance Indicators » page 91
7. Financial statements and notes » page 107
Greg Joyce Chairman WorkCover WA 24 August 2017
Chris White A/Chief Executive Officer WorkCover WA 24 August 2017
Statement of complianceTo the Hon. William (Bill) Johnston MLA, Minister for Commerce and Industrial Relations, Mines and Petroleum, Electoral Affairs, and Asian Engagement.
In accordance with section 63 of the Financial Management Act 2006, we hereby submit for your information and presentation to Parliament the report of the WorkCover Western Australia Authority for the financial year ended 30 June 2017.
The Annual Report has been prepared in accordance with the provisions of the Financial Management Act 2006 and, where applicable, a statement acknowledging the incorporation within the Report of any special reporting requirements imposed upon WorkCover Western Australia Authority by any other written law.
This report is consistent with the Public Sector Commission’s Western Australian Public Sector Annual Reporting Framework for the 2016/17 Reporting Year and the Department of Treasury’s Model Annual Report for Net Cost of Service Statutory Authorities.
In compliance with these guidelines, costs were minimised for production and printing. As printed copies are limited, reports are published on the WorkCover WA website www.workcover.wa.gov.au. The report conforms to State Government requirements for accessibility and readability and can be viewed in PDF format as a whole, in sections or in an accessible Microsoft Word format. Alternative formats are available on request.
This publication may be copied in whole or part, with acknowledgement of WorkCover WA.
About this reportWelcome to our 2016/17 Annual Report
3
Scheme performance
Report on operations
Opportunities and challenges
Disclosures and legal compliance
Key performance indicators
Financial statements and notes
GGG ChecklistAgency in focusIntroduction

Our valuesService
• We are clear about what we will deliver
• We consider our customers and their needs
• We commit, act and deliver
Excellence
• We are proactive, positive, flexible and act strategically
• We recognise that change is constant and that it can bring opportunity
• We build on opportunities
Respect
• We embrace diversity and individual differences
• We seek to understand and recognise people’s interests and rights
• We are fair and prompt in our actions and dealings with others
Integrity
• We are trustworthy and accountable
• We act in a consistent and impartial manner
• We are transparent in our decision making
Collaboration
• We work as a team
• We value the contribution of others
• We embrace a culture of open communication
Our purposeWorkCover WA’s purpose is to lead a contemporary, healthy and integrated workers’ compensation scheme that is fair, accessible and cost-effective for all stakeholders through:
• providing advice and guidance about workers’ compensation, injury management and return to work practices
• active, responsive and transparent management of the scheme
• focused information, education and compliance activities
• fair and timely dispute resolution
• a strong service focus.
Our strategic directionThis year was the second year of WorkCover WA’s 2015–2018 Strategic Plan (see page 18 for more detail).
The 2015–2018 Strategic Plan sets out three goals directing WorkCover WA’s activities:
Goal 1: Strategic scheme management We will ensure the sustainability and strong performance of the scheme.
Goal 2: Leadership We will lead continuous improvement of the scheme.
Goal 3: Agile and innovative organisation We will strive to ensure WorkCover WA has the right people, culture, systems and processes.
About usOur profileWorkCover WA is the government agency responsible for managing the workers’ compensation and injury management scheme (the scheme) in Western Australia (WA).
Our role includes:
• providing strategic policy advice to Government regarding workers’ compensation
• regulating employers and service providers, and monitoring compliance with the Workers’ Compensation and Injury Management Act 1981 (the Act)
• educating workers, employers and others about workers’ compensation and injury management
• providing an independent dispute resolution service for workers’ compensation issues.
4
Scheme performance
Report on operations
Opportunities and challenges
Disclosures and legal compliance
Key performance indicators
Financial statements and notes
GGG ChecklistAgency in focusIntroduction

Our stakeholders Workers and employers are the primary stakeholders of the WA scheme.
Many other stakeholders support the effective operation of the scheme by providing services to workers who have a work-related injury or disease and assisting employers to meet their obligations under the Act.
The following stakeholders in Figure 1 contribute to the objective of returning an injured worker to safe and sustainable work.
Figure 1: WorkCover WA stakeholders
Our vision is a workers’ compensation and injury management scheme that works for all.
Key:a. Primary stakeholders
b. Stakeholders who provide services for injury management and return to work
c. Stakeholders who provide services for claims assessment, claims management and dispute resolution
d. Stakeholders who provide the services listed in both b and c
Workers and employers
Workplace rehabilitation
providers
General practitioners and
medical specialists
Allied health practitioners such as physiotherapists and
psychologists
Insurers and self-insurers
Insurance brokers
Approved medical specialists
Approved audiometric officers
Legal practitioners and registered agents
5
Scheme performance
Report on operations
Opportunities and challenges
Disclosures and legal compliance
Key performance indicators
Financial statements and notes
GGG ChecklistAgency in focusIntroduction

Year in reviewWorkCover WA Chairman and CEO report
This financial year WorkCover WA continued to lead a workers’ compensation and injury management scheme that is fair, accessible and cost effective for injured workers, employers and service providers. The sustained high performance of the scheme is reflective of strong strategic planning, engagement and collaboration with industry representatives, and the ongoing development of the systems, people and processes that govern and facilitate our operations. Refer to Section 1: Agency in focus on page 11 for more information about WorkCover WA’s management of the scheme.
The strength of the scheme is made more apparent by the challenging economic environment in WA. Despite these challenges, the WA scheme continues to deliver low premium rates for employers, with no change to compensation entitlements for workers. In 2016/17, nearly three quarters of scheme costs were expended on services and payments to more than 30,000 workers who lodged a claim for work-related injury or disease. The healthy state of the scheme is outlined in more detail in Section 2: Scheme performance from page 33.
WorkCover WA is well aware the performance of the scheme is dependent on effective service providers operating within it. Regular contact with stakeholders enables the Agency to monitor scheme issues and influence best practice service provision through education and professional development opportunities for service providers and other stakeholders. In 2016/17, this was notably achieved with the delivery of the WorkCover WA Return to Work Conference on 3 and 4 May 2017. Nearly 400 injury management and workers’ compensation professionals listened to local and national experts, viewed an exhibition and discussed learnings. The successful delivery of the event is detailed on page 64 within Section 3: Report on operations.
To maintain contemporary organisational arrangements and operational high standards, a number of internal systems and processes were refined in 2016/17. This included the implementation of changes resulting from last year’s review of the Conciliation and Arbitration Services. This
contributes to the WA disputation rate remaining amongst the lowest in Australia. Under its ‘Digital First’ banner, WorkCover WA undertook work to remodel its Insurance Online Services to improve reporting systems for insurers. This work forms part of a larger body of work to deliver our services through online systems. For more detail refer to page 74 within Section 4: Opportunities and challenges.
Our Agency’s performance against key indicators and the financial management of Agency operations can be further analysed in Section 6: Key Performance Indicators from page 91 and Section 7: Financial statements and notes from page 107 respectively.
As the Agency approaches the final year of its current Strategic Plan 2015–2018, the WA community can remain confident in the leadership and management of the scheme. We take this opportunity to thank all members of the WorkCover WA Board and the continued excellence of our Agency operational staff.
A/CEO Chris
White
Chairman Greg Jo
yce WorkCover WA strives to ensure the sustainability of the WA workers’ compensation scheme
and is committed to achieving the best possible outcomes for injured workers and employers- Chris White, A/CEO WorkCover WA
6
Scheme performance
Report on operations
Opportunities and challenges
Disclosures and legal compliance
Key performance indicators
Financial statements and notes
GGG ChecklistAgency in focusIntroduction

11,911 enquiries into expired policies and cancellations
241 infringement notices and
prosecutions issued or completed
against non-compliant employers
4,116 registrations of Memoranda of
Agreement for finalising workers’ compensation claims via settlement
20,348 requests for advice and assistance handled by the Advice and Assistance Unit
1,492 hours of staff training
completed
2,090 conciliations
and 513 arbitrations completed
275,439 visits to the
WorkCover WA website
10,384 publications mailed to workers, employers and service providers
1,161 investigations into potential
breaches of the Act
Year in numbers
7
Scheme performance
Report on operations
Opportunities and challenges
Disclosures and legal compliance
Key performance indicators
Financial statements and notes
GGG ChecklistAgency in focusIntroduction

Year in dollarsThe majority of funding (85.79 percent) for WorkCover WA’s activities is derived from insurer and self-insurer contributions and by a direct levy on employers who are approved by WorkCover WA to self-insure.
The snapshot in Table 1 represents a consolidation of both the General and Supplementation Funds. Please refer to Section 7: Financial statements and notes on page 107 for more detailed analysis and disclosure.
Employee benefits (wages, salaries and superannuation) account for the majority of Agency expenditure. The remaining funds were expended on supplies and services, accommodation, grants, uninsured claims and other expenses.
Refer to Figure 3 for details on expenditure.
For full financial analysis and disclosures see:
• Report on funds management ›› page 76
• Financial statements and notes ›› page 107
Table 1: WorkCover WA totals for 2016/17
Revenue $23.247 million
Expenditure $22.291 million
Year scorecard2016/17 performance snapshotThe outcomes of WorkCover WA’s activities and services are measured by Key Performance Indicators (KPIs) indicating effectiveness and efficiency. The 2016/17 scorecard provides a snapshot view of our performance for the year.
Full explanations on all measures, analysed against previous years and set targets, are located on the page(s) referenced beside each indicator in Figures 4 and 5 on page 9.
A summary of the delivery of our 2016/17 Strategic Initiatives is located on page 10.
Figure 2: WorkCover WA income for 2016/17
85.79% Insurer
contribution
9.98% Interest revenue0.52%
Employers' Indemnity Supplementation Fund
3.71% Other
revenue
Figure 3: WorkCover WA expenditure for 2016/17
65.02% Employee benefits
expense
12.21% Supplies
and services
2.90% Accommodation
expenses
4.36% Depreciation
and amortisation expense
9.06% Claims
expense6.20% Other
expenses
0.02% Loss on
disposal of non-current
assets
0.23% Grants and subsidies
8
Scheme performance
Report on operations
Opportunities and challenges
Disclosures and legal compliance
Key performance indicators
Financial statements and notes
GGG ChecklistAgency in focusIntroduction

Figure 4: 2016/17 indicators of effectiveness snapshot Figure 5: 2016/17 indicators of efficiency snapshot
Number of non-compliance events identified as a result of a claim on the General Account
(Reference page 96)
Target: 6 Result: 2
Proportion of conciliations completed within eight weeks
(Reference page 98)
Target: 97.0% Result: 97.1%
1.1
1.2
Proportion of disputes resolved within six months
(Reference page 99)
Target: 90.0% Result: 87.9%
1.3
Average cost per employer compliance activity (Reference page 101)
Target: $288 Result: $251
Average cost per approved and monitored service provider
(Reference page 102)
Target: $3,659 Result: $3,177
1.1
1.2
Average cost per client contact to provide information and advice
(Reference page 103)
Target: $107 Result: $110
1.3
Average cost to complete a conciliation (Reference page 104)
Target: $2,144 Result: $2,208
Average cost to complete an arbitration (Reference page 105)
Target: $10,790 Result: $9,587
2.1
2.2
Average cost to process a Memorandum of Agreement
(Reference page 106)
Target: $331 Result: $341
2.3
9
Scheme performance
Report on operations
Opportunities and challenges
Disclosures and legal compliance
Key performance indicators
Financial statements and notes
GGG ChecklistAgency in focusIntroduction

Review of self-insurance regulationWorkCover WA completed a review of self-insurance regulation and will develop new guidelines in 2017/18 for the approval and regulation of self-insurers.
02 delivered
Legislative ReviewIn June 2017 the Government approved the drafting of legislation to increase compensation for workplace fatalities. It is anticipated the Bill will be introduced in 2017/18. Subject to Government priorities, the balance of the reform agenda will also be progressed in 2017/18.
01 in progress
Digital First ProgramDigital First is a multi-year initiative to transform a greater portion of WorkCover WA’s business to an online or digital environment. In 2016/17 WorkCover WA updated its Insurance Online Services to improve reporting systems for insurers.
04 delivered
Future of work – Implications for workers’ compensationWorkCover WA identified possible implications of technological, demographic and organisational trends for workers’ compensation. The issues identified will assist WorkCover WA in strategic planning initiatives, and in the future design of the scheme and legislative framework.
03 delivered
Delivery of 2016/17 Strategic Initiatives
10
Scheme performance
Report on operations
Opportunities and challenges
Disclosures and legal compliance
Key performance indicators
Financial statements and notes
GGG ChecklistAgency in focusIntroduction

Section 1: Agency in focus12 Agency brief12 Organisational structure14 Leadership18 Strategic planning22 Enabling legislation23 Governance30 Performance Management Framework32 People
11
Scheme performance
Report on operations
Opportunities and challenges
Disclosures and legal compliance
Key performance indicators
Financial statements and notes
GGG ChecklistIntroduction Agency in focus

Agency briefThe Western Australian contextThe Western Australian (WA) workers’ compensation and injury management scheme (the scheme) is designed to ensure workers suffering a work-related injury or illness are compensated for lost wages, medical expenses and other associated costs.
WorkCover WA regulates the scheme in accordance with the Workers’ Compensation and Injury Management Act 1981 (the Act) and the primary objective is to ensure work-related injuries are actively managed to assist injured workers to achieve a safe and sustained return to work.
The WA scheme is based on a ‘no-fault’ principle, meaning an injured worker does not need to establish anyone was at fault or negligent to make a claim. The WA scheme is also the largest privately underwritten workers’ compensation scheme in Australia, with insurance coverage provided by eight private insurers, 24 self-insurers and the Insurance Commission of WA.
The Act requires employers to maintain current workers’ compensation insurance coverage for all their workers, including those engaged in casual, part-time, contract and sub-contract arrangements. WorkCover WA provides advice and education to assist employers to comply with their obligations.
The scheme also includes entitlements and processes related to noise induced hearing loss, assessment of permanent impairment, and claims finalised through settlement by lump sum. WorkCover WA regulates, monitors and approves a range of health providers and other service providers which support injured workers to recover and return to work.
DivisionsConciliation and Arbitration ServicesThe Conciliation and Arbitration Services Division is responsible for resolving disputes in the WA scheme. The Division includes the:
• Workers’ Compensation Conciliation Service (where the objective is assisting parties to resolve their disputes by agreement)
• Workers’ Compensation Arbitration Service (where disputes unresolved by conciliation are determined according to their substantial merits, with as little formality and technicality as possible).
Legislation and Scheme InformationThe Legislation and Scheme Information Division maintains scheme viability and effectiveness through:
• collection, quality assurance, analysis and reporting of data provided by insurers and self-insurers to assist in setting recommended premium rates and inform overall effective scheme management
• robust, evidence-based policy and legislation development.
The Division also has a strategic focus on activities to assist the Board and Government to effectively manage the scheme.
Agency overview Responsible Minister
The Hon. Bill Johnston MLA, Minister for Commerce and Industrial Relations, Mines and Petroleum, Electoral Affairs, Asian Engagement.
The Minister is responsible for the Agency through the WorkCover WA Board and in accordance with the Act.
Administration
The day-to-day administration of WorkCover WA is delegated by the WorkCover WA Board to the Chief Executive Officer (CEO), who directs the Agency’s operations.
Board responsibilities are outlined in Section 5: Disclosures and legal compliance on page 75.
Agency funding
Funding for the Agency’s activities is derived from:
• insurer contributions in the form of an annual levy on workers’ compensation premiums paid by employers
• a direct levy on employers who are approved by WorkCover WA to self-insure.
Organisational structure
WorkCover WA consists of four divisions as outlined in the following divisional descriptions and organisational chart.
Organisational structure
12
Scheme performance
Report on operations
Opportunities and challenges
Disclosures and legal compliance
Key performance indicators
Financial statements and notes
GGG ChecklistIntroduction Scheme performance
Report on operations
Opportunities and challenges
Disclosures and legal compliance
Key performance indicators
Financial statements and notes
GGG ChecklistIntroduction Agency in focus

Regulatory ServicesThe Regulatory Services Division contributes to the integrity of the scheme by:
• educating and assisting stakeholders
• ensuring only appropriately qualified service providers operate in the scheme
• establishing and monitoring performance standards for service providers
• conducting compliance activities where breaches of statutory obligations are suspected and detected.
Corporate ResourcesThe Corporate Resources Division provides business services that ensure human, financial, technological, informational and physical resources are available to support WorkCover WA’s operations.
Minister for Commerce and Industrial Relations
WorkCover WA Board
Executive Services
Legislation and Scheme Information
Division
• Legislation
• Scheme information
• Policy and scheme development
• Business intelligence services
Regulatory Services Division
• Compliance, investigation and enforcement
• Standards and review
• Complaints management
• Customer assistance and advice
• Communications and education
Audit
Conciliation and Arbitration Services
• Provision of dispute resolution services
• Registration of agreements
• Applications for common law
Corporate Resources Division
• Financial and budget management
• Facilities, asset and procurement management
• Records management
• Information and communications technology and systems
• Human resource services
Chief Executive Officer
Organisational chart
13
Scheme performance
Report on operations
Opportunities and challenges
Disclosures and legal compliance
Key performance indicators
Financial statements and notes
GGG ChecklistIntroduction Scheme performance
Report on operations
Opportunities and challenges
Disclosures and legal compliance
Key performance indicators
Financial statements and notes
GGG ChecklistIntroduction Agency in focus

LeadershipWorkCover WA BoardThe WorkCover Western Australia Authority (the Board) is responsible for the governance of the Agency, the provision of independent advice to the Minister, and the approval of certain service providers. The Act provides for the Board to operate under the name ‘WorkCover WA’.
The CEO, who is a member of the Board, directs the operations and day-to-day administration of WorkCover WA through the implementation of the Board’s strategic direction. The CEO and all other staff of WorkCover WA are employed under the provisions of the Public Sector Management Act 1994.
Michelle Reynolds has served as CEO of WorkCover WA since 25 December 2008. Since commencing in the role, Ms Reynolds has successfully delivered a legislative reform agenda resulting in the abolition of age restrictions in the Act, along with other progressive changes. Ms Reynolds has over 30 years’ experience in the WA public sector, the past 15 years in senior executive roles, and has played a key role in shaping public sector management policy. Ms Reynolds has a Bachelor of Arts and a Masters of Business Administration (University of Western Australia).
*Ms Reynolds was seconded to the Rottnest Island Authority from January 2017. Mr Chris White was Acting CEO from January to June 2017. Mr White’s profile is available in the ‘Senior officers’ section on page 16.
Greg Joyce has been a member and Chair of WorkCover WA’s Board since 1 May 2005. Mr Joyce was reappointed for a further three year term from 4 January 2017. Mr Joyce was the Director General of the Department of Housing and Works from July 2001 until his retirement in January 2005. Mr Joyce has a law degree from the University of Western Australia and is qualified to practise as a barrister and solicitor in WA.
Anne Driscoll commenced in the role of Director General, Department of Commerce in August 2015. Prior to this, Ms Driscoll was the Executive Director of the Consumer Protection Division for over seven years. Ms Driscoll is a member of the WorkCover WA Board by virtue of office.
Chairman Appointed by the Governor on the recommendation of the Minister
Member Chief Executive Officer of WorkCover WA*
Member Chief Executive Officer of the Department of the Public Service of the State principally assisting the Minister charged with the administration of the Occupational Safety and Health Act 1984
14
Scheme performance
Report on operations
Opportunities and challenges
Disclosures and legal compliance
Key performance indicators
Financial statements and notes
GGG ChecklistIntroduction Scheme performance
Report on operations
Opportunities and challenges
Disclosures and legal compliance
Key performance indicators
Financial statements and notes
GGG ChecklistIntroduction Agency in focus

Member Experienced in employers’ interests
Warren Edwardes is the General Manager Workplace Consulting at the Chamber of Commerce and Industry WA. Mr Edwardes was appointed to the WorkCover WA Board on 30 December 2015 for a three year term. Mr Edwardes is also a qualified solicitor and is the Director of the Chamber’s law firm, Business Law WA.
Member Experienced in accounting and financial management
Victoria Wilmot has been a member of the WorkCover WA Board since 4 January 2005 and was reappointed on 4 January 2017 for a three year term. She previously had a 24 year career at the University of Western Australia where she held various roles including Business Manager Finance and Resources, Associate Director Treasury and Investments, and the Deputy Director Financial Services. Ms Wilmot is a member of the Institute of Chartered Accountants (CA) in Australia, a Fellow of the Financial Services Institute of Australasia and a Graduate of the Australian Institute of Company Directors.
Member Experienced in insurance matters
Steven Burns has been a member of the WorkCover WA Board since 1 October 2013 and was reappointed on 1 October 2016 for a three year term. Mr Burns has had a 24 year career in the insurance and injury management industries, including general management and product management responsibility in Tasmania, Northern Territory, WA, Australian Capital Territory and New Zealand.
Member Experienced in workers’ interests
Owen Whittle has been a member of the WorkCover WA Board since 4 January 2014 and was reappointed on 30 December 2014 for a three year term. Mr Whittle is the Assistant Secretary of UnionsWA, with responsibility for workers’ compensation and occupational health and safety matters. Mr Whittle was previously employed by the Australian Manufacturing Workers’ Union and is a member of the ACTU’s Occupational Health and Safety Committee.
Table 2: Board meeting attendance
Member Number of meetings
eligible to attend
Number of meetings attended
Greg Joyce 10 10
Michelle Reynolds 6 6
Anne Driscoll 8 6
Warren Edwardes 10 10
Steven Burns 10 9
Owen Whittle 10 9
Victoria Wilmot 10 10
Chris White 4 4
15
Scheme performance
Report on operations
Opportunities and challenges
Disclosures and legal compliance
Key performance indicators
Financial statements and notes
GGG ChecklistIntroduction Agency in focus

Senior officersThe Corporate Executive is WorkCover WA’s senior management team who work with the CEO to lead the Agency’s corporate and business operations through:
• collaboratively achieving WorkCover WA’s vision and purpose
• sharing information across divisions
• modelling desired values and behaviours
• ensuring compliance across the Agency with relevant government directives, guidelines and legislation
• developing and monitoring the Agency’s operational budget
• developing, implementing and monitoring organisational performance outcomes
• evaluating the effectiveness of corporate policies.
The Corporate Executive met on 10 occasions during 2016/17. Regular meetings of the divisional leadership and branch teams are conducted to facilitate dissemination of Corporate Executive decisions to operational areas.
Acting Chief Executive Officer*; General Manager Legislation and Scheme InformationChris White has been Acting CEO since January 2017. Mr White is General Manager Legislation and Scheme Information and has more than 30 years’ experience in workers’ compensation and occupational safety and health policy in WA. Mr White has held senior policy and management roles at both WorkCover WA and WorkSafe WA. Mr White holds a Master of Arts (Public Policy) from Murdoch University.
*CEO Michelle Reynolds was seconded to the Rottnest Island Authority from January 2017.
Chief Finance OfficerJohn Hull commenced with WorkCover WA as Chief Finance Officer in July 2010. He has extensive public sector experience and has undertaken senior finance, compliance and corporate management roles across a range of agencies including the Department of Treasury and Finance and the Office of the Auditor General. Mr Hull is a Certified Practising Accountant and has a Bachelor of Business in Finance and Accounting.
General Manager, Corporate ResourcesHarley White is General Manager, Corporate Resources. He has been employed in workers’ compensation and related fields since 1994, and has held positions in a range of areas within WorkCover WA including dispute resolution, policy and legislation, and regulation. He is a career public sector employee, having worked with the Crown Law Department, WA Police and FESA (now DFES), and holds a Diploma in Legal Studies.
16
Scheme performance
Report on operations
Opportunities and challenges
Disclosures and legal compliance
Key performance indicators
Financial statements and notes
GGG ChecklistIntroduction Agency in focus

General Manager, Regulatory ServicesStephen Psaila-Savona commenced at WorkCover WA in May 2016. Mr Psaila-Savona has been employed in the public sector for 23 years, and has previously worked at the Health and Disability Services Complaints Office, Public Sector Commission, Department of the Premier and Cabinet, WorkCover WA (2005–2007), and the Disability Services Commission. Mr Psaila-Savona holds a Bachelor of Psychology, Diploma in Education and a Graduate Diploma in Business.
Registrar, ArbitrationNilan Ekanayake is the Registrar, Arbitration and was appointed to the role in June 2015. Mr Ekanayake joined WorkCover WA from the independent Bar. He holds a Bachelor of Laws and a Bachelor of Arts from Victoria University of Wellington.
General Manager, Conciliation and Arbitration Services; Director, ConciliationWendy Attenborough is General Manager Conciliation and Arbitration Services. Ms Attenborough joined WorkCover WA in July 2008 and has since undertaken a number of Corporate Executive roles including General Manager Scheme Development and General Manager Regulatory Services. Prior to joining WorkCover WA, Ms Attenborough was employed in a number of senior policy roles within the WA Department of the Premier and Cabinet, including the Intergovernmental Relations Unit. Ms Attenborough holds a Bachelor of Arts from the University of Western Australia.
17
Scheme performance
Report on operations
Opportunities and challenges
Disclosures and legal compliance
Key performance indicators
Financial statements and notes
GGG ChecklistIntroduction Agency in focus

Strategic planningAll WorkCover WA’s activities and operations are guided by a strategic plan that is renewed on a three-yearly basis. Progress against the strategic plan is reviewed annually. This year the Agency committed to the second year of its 2015–2018 Strategic Plan (the Plan).
Strategic goalsThe Plan articulates three strategic goals with associated themes from which strategic projects are identified and delivered. These goals and themes (articulated below) provide opportunities to further strengthen the Agency’s performance and make the WA scheme the best in Australia. The three goals are:
1. Strategic scheme management
We will achieve this by:
• implementing a risk-based approach to regulation
• continuing delivery of effective and timely dispute resolution services
• remaining a high-performing scheme as measured by national benchmarks
• empowering scheme participants through advice and education
• promoting effective injury management
2. Leadership
We will achieve this by:
• delivering a contemporary workers’ compensation legislative framework
• influencing national and local workers’ compensation policy and scheme design
• extending our business intelligence to support informed decision making
• engaging with stakeholders to improve the scheme
• continuing to positively influence stakeholder behaviour
3. Agile and innovative organisation
We will achieve this by:
• investing in technology to improve service delivery
• developing innovative responses to organisational and scheme challenges
• enhancing the expertise of our staff through focused professional development
• strengthening governance and risk management frameworks
• maintaining a customer focus
View the 2015–2018 Strategic Plan at www.workcover.wa.gov.au/about-us/workcover-wa-at-a-glance/strategic-direction/
18
Scheme performance
Report on operations
Opportunities and challenges
Disclosures and legal compliance
Key performance indicators
Financial statements and notes
GGG ChecklistIntroduction Agency in focus

Report against 2016/17 Strategic InitiativesWorkCover WA commits resources to achieve a number of Strategic Initiatives aligned with the Plan. WorkCover WA’s performance against the 2016/17 Strategic Initiatives is detailed below.
As per the Agency’s Performance Management Framework, the following projects relate to State Government objectives embedded within Government Goal 3: ‘Results-Based Service Delivery’ and the achievement of WorkCover WA’s Agency Desired Outcome as outlined on page 30 of this report.
Initiative 1: Legislative ReviewThis initiative is aligned with WorkCover WA strategic goals:
1 - Strategic scheme management
2 - Leadership
In early June 2017, the Minister for Commerce and Industrial Relations announced the Government had approved the drafting of legislation to increase compensation for workplace fatalities.
The intent of the Bill is to significantly increase the level of compensation and support for dependants of workers killed in the workplace.
Specific measures of the Bill will include:
• an increase in the lump sum compensation amount to over half a million dollars
• more than doubling of the weekly allowance for each dependent child
• de facto partners having access to compensation on a similar footing to married spouses
• an expedited claims process.
It is anticipated the Bill will be introduced into the WA Parliament in 2017/18.
In progressKey points:
• In June 2017 the Government approved the drafting of legislation to increase compensation for workplace fatalities
• It is anticipated the Bill will be introduced into the WA Parliament in 2017/18
The Policy and Legislative Services team at W
orkC
over
WA.
19
Scheme performance
Report on operations
Opportunities and challenges
Disclosures and legal compliance
Key performance indicators
Financial statements and notes
GGG ChecklistIntroduction Agency in focus

DeliveredKey points:
• WorkCover WA identified possible implications of technological, demographic and organisational trends for workers’ compensation
• The issues identified will assist WorkCover WA in strategy planning initiatives, and in the future design of the scheme and legislative framework
Initiative 3: Future of work – Implications for workers’ compensationThis initiative is aligned with WorkCover WA strategic goals:
1 - Strategic scheme management
2 - Leadership
WorkCover WA completed a research project to better understand technology and workforce trends, and their potential impact on the workers’ compensation scheme.
On 12 July 2016, WorkCover WA conducted a stakeholder workshop on the future of work focussed on emerging demographic and economic trends, including a presentation from Phil Ruthven from IBISWorld. The discussion session involved a broad cross-section of scheme participants.
In June 2017 a report was provided to the WorkCover WA Board with an overview of the major technological, demographic and organisational trends which may impact on work and employment.
Possible implications for workers’ compensation and WorkCover WA over the medium term include:
• the need for flexibility in legislation to enable timely response to change in new forms of employment and models of service delivery
• the importance of moving towards a digital first strategy as an agency and fostering innovation in the insurance industry
• the need to foster a culture which focuses on scheme and regulatory outcomes rather than process
• the need to appreciate the growth of technology and artificial intelligence and how it will alter current work practices.
The issues identified in the future of work research project will assist in strategic planning initiatives of the Agency, and in the future design of the scheme and legislative framework.
DeliveredKey points:
• In 2017/18 WorkCover WA will develop new guidelines for the approval and regulation of self-insurers based on the review findings
Initiative 2: Review of self-insurance regulationThis initiative is aligned with WorkCover WA strategic goal:
1 - Strategic scheme management
The 2014 Legislative Review Final Report recommended legislative reform to enhance the licensing arrangements for self-insurance and clarify when and how deposited securities are to be managed.
This project reviewed the self-insurance regulatory and administrative framework underpinning the legislation.
The Review of Self Insurance Regulation identified a number of improvements to the approval and regulatory approach for self-insurers across the following areas:
1. eligibility or entry requirements
2. financial and prudential requirements
3. exit arrangements
4. claims and injury management
5. regulatory oversight.
20
Scheme performance
Report on operations
Opportunities and challenges
Disclosures and legal compliance
Key performance indicators
Financial statements and notes
GGG ChecklistIntroduction Agency in focus

Initiative 4: Digital First ProgramThis initiative is aligned with WorkCover WA strategic goal:
3 - Agile and innovative organisation
Digital First is a multi-year ‘umbrella’ initiative adopted to coordinate a range of technology and business related projects that will see WorkCover WA transform a greater proportion of its business to an online or digital environment.
The 2016/17 projects focused on the establishment of the WorkCover WA Online platform and the transition has been delivered successfully. Under the Digital First Program, a number of these projects will have flow-on effects into the next financial year.
DeliveredKey points:
• The 2016/17 Digital First projects have been delivered successfully
Outlook for the future WorkCover WA’s Strategic Initiatives for 2017/18 are outlined below.
Legislative ReviewDuring 2017/18 WorkCover WA will continue its legislative review and development program. Subject to Government priorities we will progress a Bill to modernise workers’ compensation laws. Amendments will also be introduced into the Parliament to increase compensation for dependants of deceased workers and to address equality of access for de facto partners and married spouses.
Digital First ProgramWorkCover WA will continue its Digital First Program through which business processes are redesigned for online and digital delivery. In 2017/18 key regulatory activities will be moved to the WorkCover WA Online platform. Planning will also be undertaken for the transition of dispute resolution services to the online environment.
2018–2021 Strategic Plan With our current strategic plan concluding in 2018, the WorkCover WA Board and executive will develop a new three year strategic plan. This process will involve a review of long term scheme trends and Agency challenges, and build on the research into the future of work conducted in 2016/17.
2017/18 Strategic Initiatives
03
02
01
21
Scheme performance
Report on operations
Opportunities and challenges
Disclosures and legal compliance
Key performance indicators
Financial statements and notes
GGG ChecklistIntroduction Agency in focus

Enabling legislationThe WorkCover Western Australia Authority is constituted under the Act.
Legislation administeredIn the performance of its functions, WorkCover WA administers the following legislation:
• Workers’ Compensation and Injury Management Act 1981
• Employers’ Indemnity Supplementation Fund Act 1980
• Workers’ Compensation and Injury Management (Acts of Terrorism) Act 2001
• Workers’ Compensation (Common Law Proceedings) Act 2004
• Waterfront Workers’ (Compensation for Asbestos Related Diseases) Act 1986
• Employers’ Indemnity Policies (Premium Rates) Act 1990
Subsidiary legislation
• Workers’ Compensation and Injury Management Regulations 1982
• Workers’ Compensation Code of Practice (Injury Management) 2005
• Workers’ Compensation and Injury Management (Scales of Fees) Regulations 1998
• Workers’ Compensation (Legal Practitioners and Registered Agents) Costs Determination 2015
• Workers’ Compensation and Rehabilitation (Acts of Terrorism) (Final Day) Regulations 2002
• WorkCover Western Australia Guideline for the Evaluation of Permanent Impairment – Fourth Edition
• Workers’ Compensation and Injury Management Conciliation Rules 2011
• Workers’ Compensation and Injury Management Arbitration Rules 2011
Key legislation impacting on WorkCover WA’s activities
• A New Tax System (Fringe Benefits Reporting) Act 1999 (Commonwealth)
• A New Tax System (Goods and Services Tax) Act 1999 (Commonwealth)
• Auditor General Act 2006
• Corruption and Crime Commission Act 2003
• Disability Services Act 1993
• Electoral Act 1907
• Electronic Transactions Act 2011
• Equal Opportunity Act 1984
• Financial Management Act 2006
• Freedom of Information Act 1992
• Industrial Relations Act 1979
• Minimum Conditions of Employment Act 1993
• Occupational Safety and Health Act 1984
• Occupiers’ Liability Act 1985
• Public and Bank Holidays Act 1972
• Public Interest Disclosure Act 2003
• Public Sector Management Act 1994
• Public Sector Management (Redeployment and Redundancy) Regulations 1994
• Salaries and Allowances Act 1975
• Superannuation Guarantee (Administration) Act 1992 (Commonwealth)
• State Supply Commission Act 1991
• State Records Act 2000
Other written laws impacting on WorkCover WA’s activities
• Competition Policy Reform (WA) Act 1996
• Constitution Act 1889
• Constitution Acts Amendment Act 1899
• Coroners’ Act 1996
• Criminal Code Act Compilation Act 1913
• Defence Act 1903 (Commonwealth)
• Evidence Act 1906
• Interpretation Act 1984
• State Administrative Tribunal Act 2004
• Statutory Corporations (Liability of Directors) Act 1996
22
Scheme performance
Report on operations
Opportunities and challenges
Disclosures and legal compliance
Key performance indicators
Financial statements and notes
GGG ChecklistIntroduction Agency in focus

GovernanceDelegation of authorityTo contribute to the effectiveness of the Board and meet specific legislative obligations, an Audit and Risk Management Committee, Costs Committee and Medical Committee are established. These committees provide objective administration and advice on discrete elements of the scheme.
As part of governance arrangements, these committees are supported by:
• documented terms of reference/standing orders
• an appointed Chair who is also a Board member
• committee members with expertise relevant to their respective roles
• mechanisms for regular reporting to the Board
• appropriate administrative resources.
WorkCover WA maintains a Manual of Delegations, Authorisations and Powers assigned to various officers under relevant governing legislation. The manual is reviewed annually or as required, and the Board is kept informed of all management strategies and ongoing activities relevant to its delegated powers.
Audit and Risk Management CommitteeThe Audit and Risk Management Committee provides assurance and assistance to the Board on WorkCover WA’s risk, control and compliance framework, and its external accountability responsibilities.
The Audit and Risk Management Committee is chaired by a WorkCover WA Board member, Ms Victoria Wilmot, and meets bi-monthly or as required.
Refer to page 86 under ‘Committees’ in Section 5: Disclosures and legal compliance for full disclosures on this Committee.
Costs CommitteeThe Costs Committee is an independent committee established under the Act reporting directly to the Minister for Commerce and Industrial Relations. It is empowered to make, amend or revoke a determination fixing maximum costs for legal and registered agent services.
The Costs Committee is chaired by the WorkCover WA CEO and meets as required.
Refer to page 86 under ‘Committees’ in Section 5: Disclosures and legal compliance for full disclosures on this Committee.
Medical CommitteeThe Medical Committee is an advisory committee established under section 100A of the Act primarily to provide guidance on permanent impairment assessments and other matters of a medical nature relevant to the scheme.
The Medical Committee is chaired by the WorkCover WA CEO and meets as required.
Refer to page 86 under ‘Committees’ in Section 5: Disclosures and legal compliance for full disclosures on this Committee.
23
Scheme performance
Report on operations
Opportunities and challenges
Disclosures and legal compliance
Key performance indicators
Financial statements and notes
GGG ChecklistIntroduction Agency in focus

Workplace consultationWorkCover WA has a number of internal committees, all chaired by a member of the Corporate Executive. The committees include staff members with relevant skills, knowledge or insights from across the Agency. These arrangements provide leadership and oversight from an executive level, whilst offering avenues for all staff to engage with senior management about policy and operational matters.
Minutes of all internal committees are provided to the next Corporate Executive meeting along with any matters from the meetings for consideration. Similarly, divisional leadership team and flow-on branch meetings are conducted on a regular basis to ensure dissemination of Corporate Executive decisions to operational areas.
Meeting actions are recorded, tracked and progress reported back to each committee by relevant support staff.
Equity and Diversity CommitteeThe Equity and Diversity Committee supports the delivery of a workplace culture compliant with and committed to equal employment opportunity and diversity principles, in which all people are treated with fairness, dignity and respect.
This Committee meets quarterly and develops and monitors policies relating to equity and diversity in employment, disability and indigenous matters, and associated action plans. This includes the development of initiatives to raise staff awareness and understanding of equity and diversity, and employment strategies supporting diversity at WorkCover WA.
In 2016/17, the Committee:
• monitored progress against the Agency’s Reconciliation Action Plan
• published intranet articles on NAIDOC and Reconciliation weeks
• presented a lunchtime screening of Aboriginal stories of the land and its history
• monitored progress against the Agency’s Disability Access and Inclusion Plan (the Plan)
• developed a new Plan, with approval from the Disability Services Commission, to cover the period 1 July 2017 to 30 June 2022. Internal staff members with disability were consulted to gain feedback and input into the Plan and the strategies it will use to achieve the outcomes where practicable
WorkCover WA OSH representatives, Domini
c Dist
ante
and
Beth Edgar, investigating a potential O
SH ha
zard
.
• extended staff training on mentoring co-workers with disability to supervisors of employees with disability
• improved accessibility to the Customer First Feedback system
• ensured the Agency met all diversity targets.
Equity and Diversity is a standing agenda item for all meetings of the Corporate Executive.
24
Scheme performance
Report on operations
Opportunities and challenges
Disclosures and legal compliance
Key performance indicators
Financial statements and notes
GGG ChecklistIntroduction Agency in focus

Emergency Planning CommitteeThe Emergency Planning Committee is responsible for the development, implementation and maintenance of emergency plans, emergency response procedures and related training.
The Emergency Planning Committee meets bi-annually or as required, and met once during 2016/17.
The Emergency Management Manual and Evacuation Diagrams for WorkCover WA have been updated and are valid until July 2021.
There was an unplanned evacuation of the premises in 2016/17. It was noted that:
• the evacuation of the building was completed in a timely and efficient manner
• the evacuation was conducted in accordance with WorkCover WA’s emergency response procedures.
Innovation CommitteeThe Innovation Committee was formed to manage the implementation of innovation as a specific initiative within WorkCover WA. This involved the establishment of the systems, training and cultivation of the innovation concept. That process has reached a level of maturity and the Innovation Committee is now convened only as required.
The Innovation Committee did not meet in 2016/17.
Joint Consultative CommitteeThe Joint Consultative Committee consists of WorkCover WA’s elected union delegates, the CEO and senior management representatives. The Committee meets quarterly (or as required) to ensure consultation occurs between staff and management on major issues affecting the working conditions of employees.
In 2016/17, the Joint Consultative Committee was consulted on:
• a structural review of the Regulatory Services Division
• a structural review of the Case Management Teams in the Conciliation and Arbitration Services
• the arrangement of the ‘Christmas/New Year reduced services’ period
• the development of guidelines to assist managers in dealing with requests for part-time employment.
Occupational Safety and Health CommitteeThe Occupational Safety and Health (OSH) Committee facilitates consultation and cooperation across WorkCover WA by:
• examining issues affecting the health and wellbeing of staff
• developing and implementing measures to prevent workplace accidents and injuries.
The OSH Committee makes recommendations to the Agency regarding the establishment, maintenance and monitoring of programs, measures and procedures in the workplace relating to the safety and health of all employees.
The OSH Committee is comprised of a member of the Corporate Executive as Chair, a Human Resources Branch delegate, the Business Services Administration Officer, and three elected employee representatives who meet on a quarterly basis.
The terms of appointment of the three employee representatives expired in April 2017. Nominations were called for the positions and three nominees were appointed for two year terms expiring in 2019.
OSH remains a standing agenda item for all meetings of the Corporate Executive, ensuring a direct link to the Agency’s senior management team.
25
Scheme performance
Report on operations
Opportunities and challenges
Disclosures and legal compliance
Key performance indicators
Financial statements and notes
GGG ChecklistIntroduction Agency in focus

KPI Performance Reporting CommitteeThe KPI Performance Reporting Committee reviews and manages the Agency’s Outcome Based Management (OBM) structure.
The KPI Performance Reporting Committee is chaired by the CEO and consists of the Corporate Executive and relevant senior officers. The Committee meets quarterly or as required. The Committee ensures the Agency complies with relevant government directives, guidelines and legislation in developing, implementing and monitoring organisational performance outcomes.
The KPI Performance Reporting Committee has integrated the Agency’s Key Performance Indicators (KPIs) with operational processes to ensure KPIs are regarded as integral to the Agency’s reporting framework.
The Committee met five times in 2016/17.
Each year since 2011/12, the Auditor General has acknowledged WorkCover WA as one of the ‘Best Practice Top 20 Small Agencies’ for the management and reporting of its finances and KPIs.
Risk Management Review GroupThe Risk Management Review Group oversees WorkCover WA’s risk management processes and is responsible for maintaining the Agency’s risk management framework. The Risk Management Review Group:
• identifies, monitors and reviews Agency risks (both strategic and operational)
• encourages and promotes greater awareness and understanding of risk management throughout all levels of the Agency
• provides guidance on risk management to the Agency.
During 2016/17, the Risk Management Review Group continued to grow risk management knowledge, awareness and adoption across the Agency. This was achieved through:
• quarterly meetings to monitor risk management activities
• oversight of changes to risks and controls within the risk management register
• implementation of audit findings and process improvements identified in the risk management audit conducted in March 2016
• ensuring risk owners monitor and review risks in accordance with set schedules
• reporting regularly to the Corporate Executive, Audit and Risk Management Committee, and Board.
Complaints handlingCustomer First Feedback policy and proceduresWorkCover WA recognises feedback from customers is the most immediate and effective measurement of public perception of its performance.
WorkCover WA’s Customer First Feedback System complies with the Australian Standard on Complaints Handling (AS 10002-2014) and Public Sector Commission Circular 2009-27: Complaints Management. The system provides customers with an avenue to deliver feedback (positive or negative) about the Agency’s services, decisions, procedures, policies and facilities.
Customer First processes increase WorkCover WA’s understanding of customer needs and expectations and identifies opportunities for organisational improvement. Customer feedback is reported regularly to the Agency’s Corporate Executive to identify trends and implement positive change.
Customer feedback is recorded either verbally (in person or by telephone) or in writing (by Customer First Feedback Form, email, website, letter, fax or ministerial). A response to verbal feedback must be provided within five working days, and written feedback must be provided within 10 working days. More complex complaints are expected to be resolved within 30 working days.
All customer feedback was actioned within the agreed deadline of five working days for verbal feedback and 10 working days for written feedback.
In 2016/17 WorkCover WA received seven compliments, four complaints and one suggestion.
26
Scheme performance
Report on operations
Opportunities and challenges
Disclosures and legal compliance
Key performance indicators
Financial statements and notes
GGG ChecklistIntroduction Agency in focus

Review of the Complaints Management Framework and proceduresIn 2016/17, WorkCover WA conducted a review of its Complaints Management Framework and procedures for service providers. The review aimed to streamline the early triaging or processing of complaints, and set out relevant and specific guidance on progressing complaints against particular service providers.
For further information refer to the ‘Complaints Management Framework and procedures’ section on page 50.
In March 2017, WorkCover WA was awarded the Ombudsman Western Australia Award for Complaints Handling at the Institute of Public Administration’s W.S. Lonnie Awards which recognise excellence in annual reporting.
The Judges commented that WorkCover WA’s treatment of complaints serves as an example of best practice that other agencies are encouraged to study and emulate. The judges were impressed by the quality of the Agency’s reporting in this area.
Complaints against service providersWorkCover WA (as the scheme regulator) places great importance on investigation of complaints about service providers who participate in the scheme. Management of these complaints during 2016/17 is detailed in Section 3: Report on operations under ‘Regulating service providers’:
• Complaints against approved insurers and self-insurers – page 47
• Complaints against registered agents – page 47
• Complaints against approved workplace rehabilitation providers – page 47
• Complaints against approved audiometric officers, audiologists and audiometrists – page 48
• Complaints against approved medical specialists – page 48.
WorkCover WA Investigator Scott Fletcher-Terry.
In 2016/17 WorkCover WA received seven compliments, four complaints and one suggestion.
27
Scheme performance
Report on operations
Opportunities and challenges
Disclosures and legal compliance
Key performance indicators
Financial statements and notes
GGG ChecklistIntroduction Agency in focus

Communications policiesWorkCover WA publishes policies which govern internal communications between staff and external communications, and ensures staff are made aware of these policies. These policies are supported by WorkCover WA’s Freedom of Information Policy, Records Management Policy and Code of Conduct.
A strict governance schedule ensures each policy is periodically reviewed for adequacy, currency and effectiveness. All policies were reviewed in accordance with the schedule and all policies were adhered to in 2016/17.
Customer Service CharterThe WorkCover WA Customer Service Charter identifies the Agency’s commitment to our customers and outlines the service they can expect to receive when dealing with WorkCover WA. The Customer Service Charter is supported by the Agency’s Customer First Feedback Policy and Procedures, and managed through the online Customer First Feedback System as detailed under ‘Complaints handling – Customer First Feedback policy and procedures’ on page 26.
Communications ProtocolIn accordance with the Public Sector Management Act 1994, WorkCover WA has a Communications Protocol which outlines the manner and circumstances in which the CEO and Agency employees interact with the Minister’s Office.
Ministerial correspondenceTo ensure precise and timely provision of information to the Minister, and accurate recordkeeping, WorkCover WA actively manages all Ministerial communications as matters of priority. Detailed procedures exist to assist all officers involved in ministerial communication.
Statistical information regarding Ministerial communication is regularly reviewed by the Board and Corporate Executive.
Board Governance Policy: Official CommunicationThis policy governs the flow of information between members of the Board, Board Committees and stakeholders, as well as the dissemination of information from the CEO to Agency employees.
This policy establishes:
• communication approvals and authority (including authorisation to make public comment on behalf of WorkCover WA)
• the extent of what should be communicated
• confidentiality considerations.
Public Interest DisclosureWorkCover WA is committed to the objectives of the Public Interest Disclosure Act 2003 which provides protection of sensitive, public interest information for those who disclose and those who are the subject of disclosures.
The Agency’s intranet and external website contains information on what can be considered a matter of public interest for disclosure, the information to be included in the disclosure, how to make the disclosure, and to whom.
There were no public interest disclosures in 2016/17.
Freedom of InformationThe Freedom of Information Act 1992 gives a general right of access to documents held by State and local government agencies.
WorkCover WA publishes a Freedom of Information Statement outlining the Agency’s processes for dealing with and responding to freedom of information requests which is accessible on the Agency’s external website.
There were 169 accepted freedom of information requests in 2016/17.
28
Scheme performance
Report on operations
Opportunities and challenges
Disclosures and legal compliance
Key performance indicators
Financial statements and notes
GGG ChecklistIntroduction Agency in focus
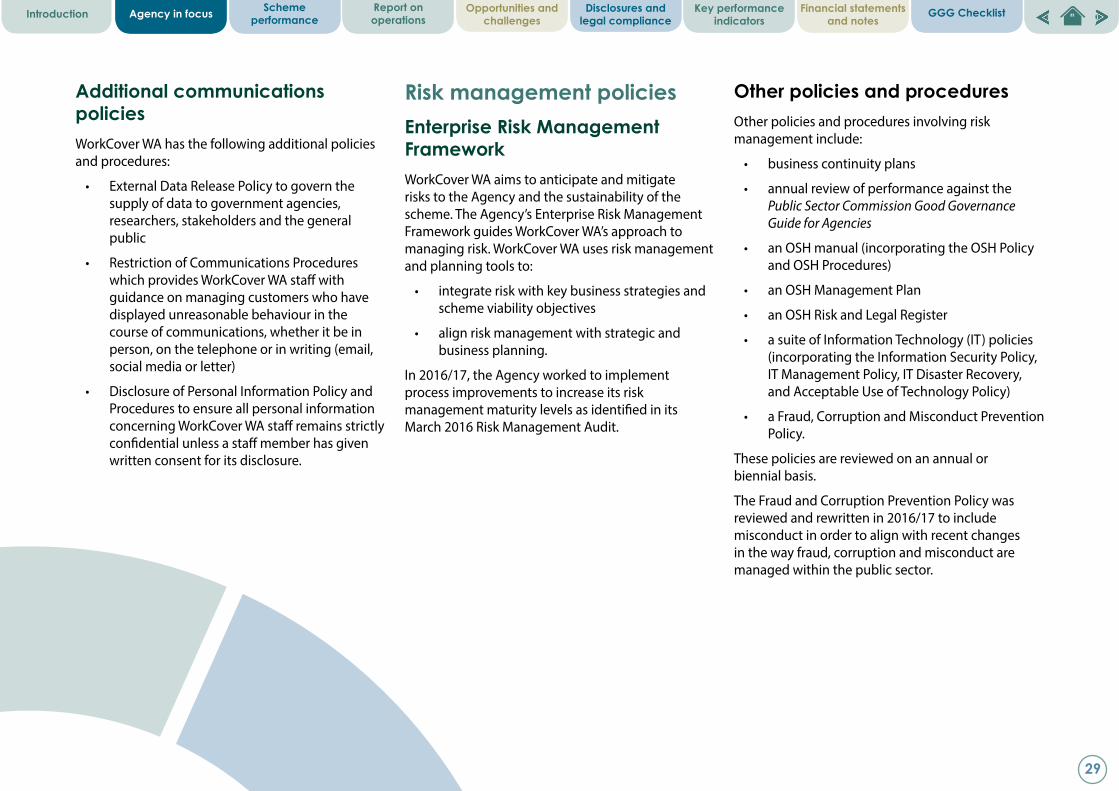
Additional communications policies WorkCover WA has the following additional policies and procedures:
• External Data Release Policy to govern the supply of data to government agencies, researchers, stakeholders and the general public
• Restriction of Communications Procedures which provides WorkCover WA staff with guidance on managing customers who have displayed unreasonable behaviour in the course of communications, whether it be in person, on the telephone or in writing (email, social media or letter)
• Disclosure of Personal Information Policy and Procedures to ensure all personal information concerning WorkCover WA staff remains strictly confidential unless a staff member has given written consent for its disclosure.
Risk management policies Enterprise Risk Management FrameworkWorkCover WA aims to anticipate and mitigate risks to the Agency and the sustainability of the scheme. The Agency’s Enterprise Risk Management Framework guides WorkCover WA’s approach to managing risk. WorkCover WA uses risk management and planning tools to:
• integrate risk with key business strategies and scheme viability objectives
• align risk management with strategic and business planning.
In 2016/17, the Agency worked to implement process improvements to increase its risk management maturity levels as identified in its March 2016 Risk Management Audit.
Other policies and proceduresOther policies and procedures involving risk management include:
• business continuity plans
• annual review of performance against the Public Sector Commission Good Governance Guide for Agencies
• an OSH manual (incorporating the OSH Policy and OSH Procedures)
• an OSH Management Plan
• an OSH Risk and Legal Register
• a suite of Information Technology (IT) policies (incorporating the Information Security Policy, IT Management Policy, IT Disaster Recovery, and Acceptable Use of Technology Policy)
• a Fraud, Corruption and Misconduct Prevention Policy.
These policies are reviewed on an annual or biennial basis.
The Fraud and Corruption Prevention Policy was reviewed and rewritten in 2016/17 to include misconduct in order to align with recent changes in the way fraud, corruption and misconduct are managed within the public sector.
29
Scheme performance
Report on operations
Opportunities and challenges
Disclosures and legal compliance
Key performance indicators
Financial statements and notes
GGG ChecklistIntroduction Agency in focus

Performance Management Framework Outcome Based Management structure The scheme delivers services to minimise the social and economic impact of work-related injury and illness on workers, employers and the WA community. WorkCover WA is the regulator of that scheme.
WorkCover WA contributes to a range of State Government objectives related to Government Goal 3: ‘Results-Based Service Delivery’, which demands a ‘greater focus on achieving results in key service delivery areas for the benefit of all Western Australians’.
Figure 6 outlines the WorkCover WA OBM structure, including the Agency Desired Outcome and Agency Services.
Results-Based Service Delivery
Greater focus on achieving results in key service delivery areas for the benefit
of all Western Australians.
Government Goal
WorkCover WA’s Agency Desired Outcome
WorkCover WA’s Agency Services
To ensure a workers’ compensation and injury management scheme that is financially viable, contemporary and integrated, whilst providing services that are fair, accessible, timely and cost
effective for all participants.
1. Scheme Regulation (regulation of workers’ compensation
scheme participants to promote compliance with legislative requirements).
2. Scheme Services (provision of effective and equitable dispute resolution and other services
to scheme participants).
Figure 6: WorkCover WA OBM Structure
WorkCover WA Policy Offi cer C
raig Donohu
e.
30
Scheme performance
Report on operations
Opportunities and challenges
Disclosures and legal compliance
Key performance indicators
Financial statements and notes
GGG ChecklistIntroduction Agency in focus

Other government goalsWorkCover WA also contributes to the following State Government goals:
Goal 2 – Financial and economic responsibility
By maintaining a cost/benefit balance in managing a viable workers’ compensation and injury management scheme.
Goal 4 – Stronger focus on the regions
By providing information, education and services to employers and injured workers in regional areas and ensuring compliance with statutory obligations in regional workplaces.
Goal 5 – Social and environmental responsibility
By ensuring the scheme is managed in a socially responsible manner for the long-term benefit of the State.
Shared responsibilities with other agenciesWorkCover WA did not share any responsibilities under the Act with other agencies in 2016/17.
How we measure our performance In order to evaluate its contribution to State Government Goal 3 ‘Results-Based Service Delivery’, WorkCover WA measures its performance in the delivery of two services:
Service 1: Scheme Regulation
Regulation of scheme participants’ compliance with legislative and other requirements.
Service 2: Scheme Services
Provision of effective dispute resolution and other services to scheme participants.
Key Performance IndicatorsWorkCover WA’s services are linked to effectiveness and efficiency KPIs which indicate the extent to which WorkCover WA achieved its Agency Desired Outcome.
WorkCover WA did not make any changes to its OBM and KPIs in 2016/17.
Refer to Section 6: Key Performance Indicators on page 91 for full KPI information.
Number of non-compliance events identified as a result of a claim on the General Account
Proportion of conciliations completed within eight weeks
Proportion of disputes resolved within six months
Key Effectiveness Indicators
Key Efficiency Indicators
Average cost per employer compliance activity
Average cost per approved and monitored service provider
Average cost per client contact to provide information and advice
Average cost to complete a conciliation
Average cost to complete an arbitration
Average cost to process a Memorandum of Agreement
2.22.3
Figure 7: WorkCover WA’s KPIs
1.1
1.2
1.3
1.1
1.2
1.3
2.1
31
Scheme performance
Report on operations
Opportunities and challenges
Disclosures and legal compliance
Key performance indicators
Financial statements and notes
GGG ChecklistIntroduction Agency in focus

PeopleWorkforce profile Figure 8 summarises WorkCover WA’s 2016/17 workforce profile. WorkCover WA’s complete full-time equivalent (FTE) profile is provided on page 78 under ‘Employment and industrial relations’ in Section 5: Disclosures and legal compliance.
Workforce policiesWorkCover WA’s workforce policies are outlined under ‘Opportunity and accessibility’ in Section 4: Opportunities and challenges, and the entries disclosed under ‘Legal compliance’ in Section 5: Disclosures and legal compliance.
Staff engagement Staff perceptionsAn Employee Climate Survey was conducted in 2016/17 and 112 (81 percent) of staff took part. The results were overwhelmingly positive, including:
• the Agency’s leadership team is perceived positively
• most staff perceive their immediate manager as trustworthy, fair and generally did what he/she said they would do
• clear job requirements and organisational direction were identified as areas of strength
• deadlines were considered reasonable and work of a high quality
• staff have a good understanding of the Agency’s values.
These results demonstrate ongoing improvement throughout the Agency. The variability in employee ratings was less than previous years, suggesting a more cohesive workforce overall.
Results also indicated the Agency needed to focus some attention on:
• communication between divisions, and in some cases between sections within divisions
• the management of staff who did not perform appropriately.
Strategies are being implemented to address these and other areas where improvement is required.
Figure 8: Staff by FTE
Full-time permanent
Full-time contract
Part-time permanent (FTE)
Part-time contract (FTE)
Staff on secondment
Staff on traineeship
Staff in graduate program
Key:
71%
11%
10%
2%3%
1%2%
WorkCover WA sta
ff.
32
Scheme performance
Report on operations
Opportunities and challenges
Disclosures and legal compliance
Key performance indicators
Financial statements and notes
GGG ChecklistIntroduction Agency in focus

Section 2: Scheme performance34 Open and transparent reporting34 Comparative overview35 Scheme performance report
33
Report on operations
Opportunities and challenges
Disclosures and legal compliance
Key performance indicators
Financial statements and notes
GGG ChecklistIntroduction Agency in focus Scheme performance

Open and transparent reportingWorkCover WA closely monitors the performance of all aspects of the Western Australian (WA) workers’ compensation and injury management scheme (the scheme). Understanding scheme trends through the collection and analysis of relevant data is vital to ensuring the ongoing stability of the scheme, and that emerging issues are detected early.
WorkCover WA communicates new scheme developments through information sessions and regular publication of statistical information on the WorkCover WA website.
Eoin Byrne, Franky Ku and Han Chan fro
m th
e
Business Intelligence Services branch at Wor
kCov
er W
A.
WorkCover WA works with the scheme actuary to produce annual recommended premium rates and quarterly statistical summaries from an actuarial perspective. These reports are available on the ‘Statistical reports’ page at workcover.wa.gov.au.
Comparative overviewThe WA scheme is working well. According to Safe Work Australia’s Comparative Performance Monitoring Report, Eighteenth Edition, analysis of the most recent comparative statistics shows WorkCover WA leads a scheme with:
• the second lowest standardised average premium rate across the States and Territories
• nearly three quarters of scheme costs expended on services and payments for claimants, on par with the national average
• approximately 88 percent of claim disputes resolved within six months, well above the national average of 79 percent
• a disputation rate of 3.9 percent, the second lowest of all Australian jurisdictions.
• Scheme Status Report
• Insurer Claim Status Report
• Scheme Exits Report
• Conciliation and Arbitration Services Status Report
• Workers’ Compensation Scheme Trends
• Stress-related Claims Statistical Note
• Ageing Workforce Statistical Note
• Workers’ Compensation Annual Statistical Report
• Services Status Report (Medical, Allied Health and Vocational Rehabilitation)
• Industry Benchmark Report
• Industry-specific Statistical Reports (Construction, Health care and social assistance, Manufacturing, and Mining).
During 2016/17, the Agency published the following reports:
34
Report on operations
Opportunities and challenges
Disclosures and legal compliance
Key performance indicators
Financial statements and notes
GGG ChecklistIntroduction Agency in focus Scheme performance

Important: Due to the nature of the processes involved in the capture, verification and analysis of claims data, information relating to time lost as a result of workers’ compensation claims is only available one year retrospectively. Therefore, some information from 2016/17 was unavailable at the time of publishing this report and we have therefore, in line with established practice, reported on information from 2015/16.
Claim numbersIn 2015/16, 30,939 claims were lodged. Of these, 55 percent involved at least one day or shift off work (lost-time claims). Of all lost-time claims lodged in 2015/16, 33 percent had 60 or more days or shifts lost (long duration claims).
Further information on scheme performance is available from workcover.wa.gov.au under ‘Resources – Research, evaluation and statistics’.
Figure 9: Claim numbers - 2015/16
58
Table xx: Claim numbers – 2015/16
No lost time claims 14,049
Lost-time claims 16,890
Total number of 1–59 days/shifts lost claims
11,337
Total number of long duration claims (60+ days/shifts lost)
5,553
Claim trends
From 2011/12 to 2015/16, the annual number of claims lodged in the WA scheme decreased by 20 percent from 38,679 to 30,939.
The number of long duration claims (claims with 60 or more days/shifts lost) increased over the last four years, whereas claims with shorter duration and no lost-time decreased.
1-59 days lost
60+ days lost
No lost-time claims
Lost-time claims
14,049 45%
16,890 55%
11,337 67%
5,553 33%
Claim trendsFrom 2011/12 to 2015/16, the annual number of claims lodged in the WA scheme decreased by 20 percent from 38,679 to 30,939.
The number of long duration claims (claims with 60 or more days/shifts lost) increased over the last four years, whereas claims with shorter duration and no lost-time decreased.
59
Table xx: Claim trends
Lodgement year 2011/12 2012/13 2013/14 2014/15 2015/16
Total number of workers’compensationclaims lodged
38,679 37,301 35,465 32,639 30,939
Total number of no lost-time claims lodged
19,835 18,688 17,779 15,772 14,049
Total number of 1–59 days/shifts lost claims
14,131 13,806 12,708 11,970 11,337
Total number of long duration claims (60+ days/shifts lost)
4,713 4,807 4,978 4,897 5,553
19,835 18,688 17,779 15,772 14,049
14,131 13,806 12,708 11,970
11,337
4,713 4,807 4,978
4,897 5,553
38,679 37,301 35,465
32,639 30,939
2011/12 2012/13 2013/14 2014/15 2015/16
Clai
m n
umbe
rs
Lodgement year
No lost-time claims 1-59 days lost 60+ days lost All claims
Figure 10: Claim trends
Scheme performance report
35
Report on operations
Opportunities and challenges
Disclosures and legal compliance
Key performance indicators
Financial statements and notes
GGG ChecklistIntroduction Agency in focus Scheme performance

Frequency ratesThe frequency rate (number of lost-time claims per million hours worked) decreased by 14 percent between 2011/12 and 2015/16. However, the frequency rate of longer duration claims increased for this reporting period.
Figure 11: Frequency rates
62
Frequency of lost-time claims by industry In 2015/16, the industries with the highest lost-time claim frequencies were Agriculture, forestry and fishing, Manufacturing, and Construction.
Figure 12: Frequency of lost-time claims by industry - 2015/16
63
Scheme payments 2016/17
During 2016/17, 67.4 percent of scheme payments were paid directly to workers in the form of income payment and common law and lump sum payouts, while 22.4 percent of payments were made for treatment services, such as medical, allied health and vocational rehabilitation services. The remaining 10.2 percent of payments were related to legal and other services.
14.1
13.5
12.3
12.2
11.0
9.5
9.4
8.4
8.0
7.7
7.7
7.3
7.1
5.6
5.2
4.5
2.9
2.3
1.5
1.4
Agriculture, forestry and fishing
Manufacturing
Construction
Arts and recreation services
Health care and social assistance
Transport, postal and warehousing
Wholesale trade
Education and training
Industry average
Public administration and safety
Electricity, gas, water and waste services
Accommodation and food services
Retail trade
Other services
Mining
Administrative and support services
Rental, hiring and real estate services
Information media and telecommunications
Professional, scientific and technical services
Financial and insurance services
36
Report on operations
Opportunities and challenges
Disclosures and legal compliance
Key performance indicators
Financial statements and notes
GGG ChecklistIntroduction Agency in focus Scheme performance
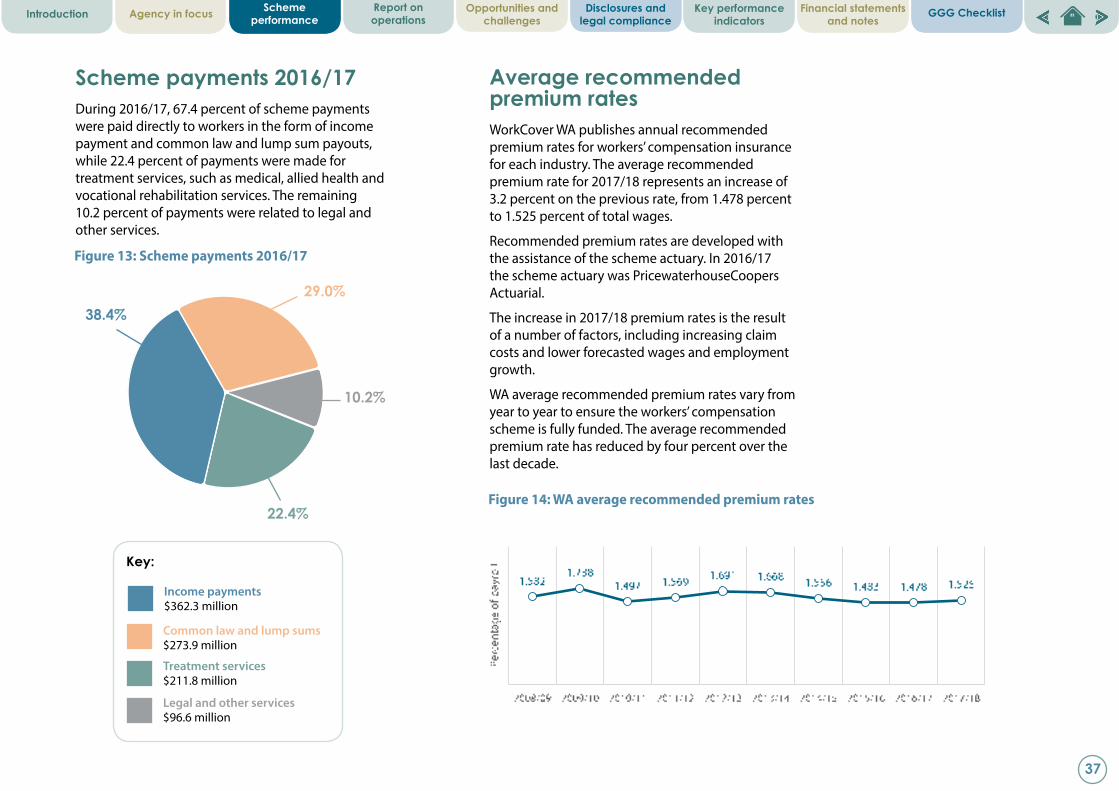
Scheme payments 2016/17 During 2016/17, 67.4 percent of scheme payments were paid directly to workers in the form of income payment and common law and lump sum payouts, while 22.4 percent of payments were made for treatment services, such as medical, allied health and vocational rehabilitation services. The remaining 10.2 percent of payments were related to legal and other services.
Income payments $362.3 million
Key:
29.0%
10.2%
38.4%
22.4%
Common law and lump sums $273.9 million
Treatment services $211.8 million
Legal and other services $96.6 million
Average recommended premium ratesWorkCover WA publishes annual recommended premium rates for workers’ compensation insurance for each industry. The average recommended premium rate for 2017/18 represents an increase of 3.2 percent on the previous rate, from 1.478 percent to 1.525 percent of total wages.
Recommended premium rates are developed with the assistance of the scheme actuary. In 2016/17 the scheme actuary was PricewaterhouseCoopers Actuarial.
The increase in 2017/18 premium rates is the result of a number of factors, including increasing claim costs and lower forecasted wages and employment growth.
WA average recommended premium rates vary from year to year to ensure the workers’ compensation scheme is fully funded. The average recommended premium rate has reduced by four percent over the last decade.
Figure 13: Scheme payments 2016/17
66
The increase in 2017/18 premium rates is the result of a number of factors, including increasing claim costs and lower forecasted wages and employment growth.
Western Australian average recommended premium rates vary from year to year to ensure the workers’ compensation scheme is fully funded. The average recommended premium rate has reduced by four percent over the last decade.
Table xx: WA Average recommended premium rates
2008/09 2009/10 2010/11 2011/12 2012/13 2013/14 2014/15 2015/16 2016/17 2017/18
1.582 1.738 1.497 1.569 1.691 1.668 1.556 1.483 1.478 1.525
Scheme payments and premium income
This table shows changes in premiums collected and compensation paid during the past five financial years. Variations in claim payments and premium income over time reflect changes in numbers of employees, wage growth and inflationary pressures.
Figure 14: WA average recommended premium rates
37
Report on operations
Opportunities and challenges
Disclosures and legal compliance
Key performance indicators
Financial statements and notes
GGG ChecklistIntroduction Agency in focus Scheme performance
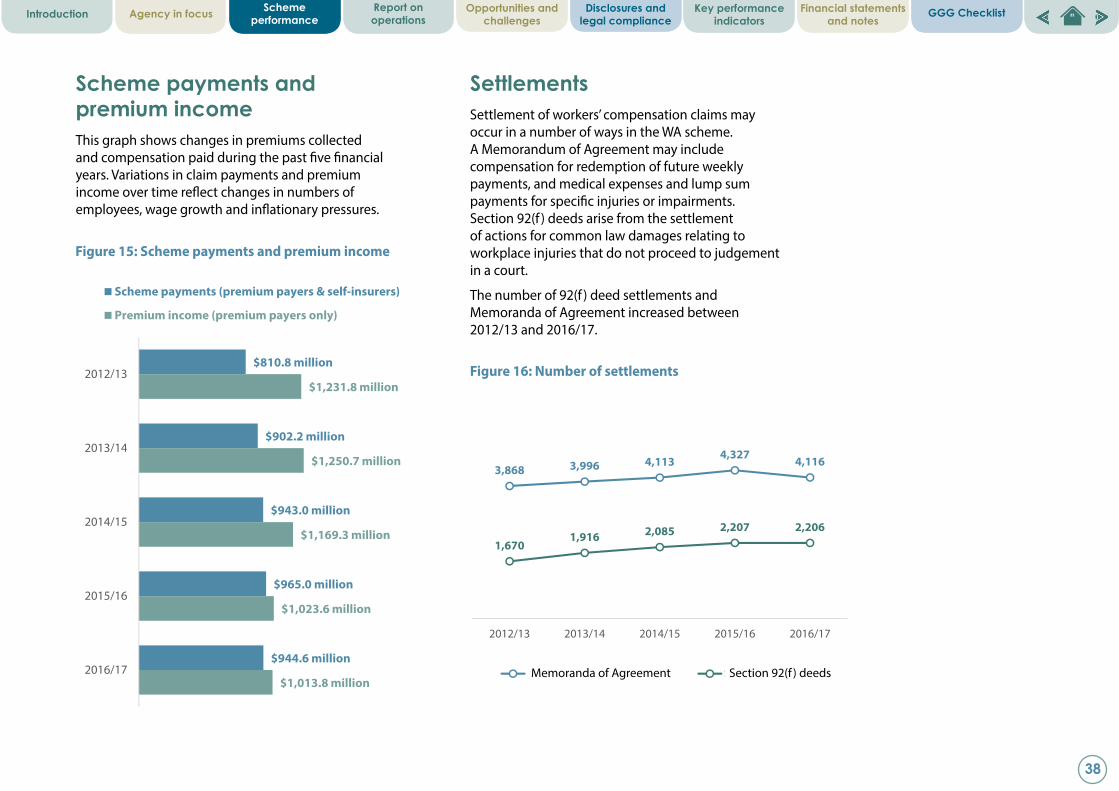
Scheme payments and premium income This graph shows changes in premiums collected and compensation paid during the past five financial years. Variations in claim payments and premium income over time reflect changes in numbers of employees, wage growth and inflationary pressures.
66
Table xx: Scheme payments and premium income
Scheme payments and premium income
2012/13 2013/14 2014/15 2015/16 2016/17
Total workers’ compensation premiums (premium payers only)
$1,231.8million
$1,250.7million
$1,169.3million
$1,023.6million
$1,013.8million
Total workers’ compensation payments (premium payers and self-insurers)
$810.8million
$902.2million
$943.0million
$965.0million
$944.6million
$810.8 million
$902.2 million
$943.0 million
$965.0 million
$944.6 million
$1,231.8 million
$1,250.7 million
$1,169.3 million
$1,023.6 million
$1,013.8 million
2012/13
2013/14
2014/15
2015/16
2016/17
Scheme payments (premium payers & self-insurers)
Premium income (premium payers only)
Figure 15: Scheme payments and premium income
Settlements Settlement of workers’ compensation claims may occur in a number of ways in the WA scheme. A Memorandum of Agreement may include compensation for redemption of future weekly payments, and medical expenses and lump sum payments for specific injuries or impairments. Section 92(f ) deeds arise from the settlement of actions for common law damages relating to workplace injuries that do not proceed to judgement in a court.
The number of 92(f ) deed settlements and Memoranda of Agreement increased between 2012/13 and 2016/17.
Figure 16: Number of settlements
67
Settlements
Settlement of workers’ compensation claims may occur in a number of ways in the WA scheme. A Memorandum of Agreement may include compensation for redemption of future weekly payments, and medical expenses and lump sum payments for specific injuries or impairments. Section 92(f) deeds arise from the settlement of actions for common law damages relating to workplace injuries that do not proceed to judgement in a court.
The number of 92(f) deed settlements and Memoranda of Agreement increased between 2012/13 and 2016/17.
Table xx: Number of settlements
Settlements 2012/13 2013/14 2014/15 2015/16 2016/17
Section 92(f) deeds
1,670 1,916 2,085 2,207 2,206
Memoranda of Agreement 3,868 3,996 4,113 4,327 4,116
3,868 3,996 4,113 4,327 4,116
1,6701,916 2,085 2,207 2,206
2012/13 2013/14 2014/15 2015/16 2016/17
Memorandum of Agreements Section 92(f) deedsMemoranda of Agreement Section 92(f ) deeds
38
Report on operations
Opportunities and challenges
Disclosures and legal compliance
Key performance indicators
Financial statements and notes
GGG ChecklistIntroduction Agency in focus Scheme performance

Section 3: Report on operations40 Service 1: Scheme Regulation52 Service 2: Scheme Services
39
Opportunities and challenges
Disclosures and legal compliance
Key performance indicators
Financial statements and notes
GGG ChecklistIntroduction Agency in focus Scheme performance
Report on operations

Regulating employers
WorkCover WA devotes significant resources to regulating employers for compliance with their obligations under the Workers’ Compensation and Injury Management Act 1981 (the Act) through the application of an Employer Compliance Framework.
During 2016/17, Scheme Regulation activities included:
• expired policy enquiries
• assessment of policy cancellation requests
• investigations into suspected:
à breaches of an employer’s legal requirement to hold workers’ compensation insurance to cover all their workers
à late/irregular weekly payments to injured workers
à fraud
• regional compliance visits to the Peel, South West, Wheatbelt and Great Southern regions, and the Cocos/Keeling Islands (Indian Ocean Territories).
Figure 17 outlines the outcomes of the Agency’s 2016/17 employer regulatory activities.
Compliance inspections
1,161
194
211
30
6,728
5,183
Compliance investigations
Letters of caution sent
Infringement notices issued
Prosecutions completed
Enquiries into lapsed/expired policies
Enquiries into policy cancellations
678
Service 1: Scheme RegulationRegulation of scheme participants for compliance with legislative requirements
Figure 17: 2016/17 compliance outcomes
This scheme service contributes to, and is aligned with:
Government Goals:
3 - Results-Based Service Delivery
Also: 4 - Stronger focus on the regions 5 - Social and environmental responsibility
WorkCover WA strategic goal:
1 - Strategic scheme management
40
Opportunities and challenges
Disclosures and legal compliance
Key performance indicators
Financial statements and notes
GGG ChecklistIntroduction Agency in focus Scheme performance
Report on operations

WorkCover WA’s effective regulation of employers is also demonstrated through the following Agency Key Performance Indicator (KPI) of effectiveness:
The above result indicates the low number of claims registered against employers who do not hold a current workers’ compensation policy to cover all their workers for workplace injury or disease. Whilst this is a decrease of seven from 2015/16, it is consistent with previous years. The nine claims for 2015/16 included four long term claims for injuries sustained in previous years and shows 2015/16 to be an anomaly. The continued low number of uninsured claims can be attributed in part to WorkCover WA’s compliance activities and the consistent provision of information and education to employers and other scheme stakeholders. Refer to ‘Indicator 1.1’ within Section 6: Key Performance Indicators for further explanatory detail on this KPI.
Review of employer compliance activitiesThis project finalised work from the 2015/16 Strategic Initiative – Employer Compliance Review. The project:
• ensured WorkCover WA had a contemporary approach to employer compliance
• explored the use of technology for efficiency gains
• ensured our organisational structure supports our compliance goals.
Figure 18: 2016/17 KPI effectiveness indicator related to employer compliance
Staff from various WorkCover WA divi
sions
.
Employer Compliance FrameworkIn 2016/17, the Employer Compliance Framework was reviewed in its entirety, resulting in significant changes. The review resulted in:
• process improvements
• better use of technology
• extended use of data sources
• improved risk assessments
• a comprehensive review of the Enforcement Criteria in December 2016.
A trial of an alternative investigative model was also undertaken that is planned to be fully implemented in 2017/18.
Number of non-compliance events identified as a result of a claim on the General Account
(Reference page 96)
Target: 6 Result: 2
1.1
41
Opportunities and challenges
Disclosures and legal compliance
Key performance indicators
Financial statements and notes
GGG ChecklistIntroduction Agency in focus Scheme performance
Report on operations

WorkCover WA Investigator D
onna N
owot
ny.
Compliance case backlog trialIn April/May 2017, a streamlined approach to investigations was trialled on a backlog of 100 outstanding investigative cases. The trial involved sending clear and transparent correspondence to 76 employers to advise them of their legal responsibility to hold workers’ compensation insurance, and the consequences of not doing so.
Where ‘low risk’ breaches were confirmed, administrative processes were utilised to fast-track an enforcement response. For higher risk breaches, prosecutorial investigative processes were continued. The trial was successful in achieving the correct balance of regulation without disadvantaging and imposing excessive enforcement processes on employers.
Dataset collaboration with Australian Taxation OfficeTo improve the targeting of employers at risk of non-compliance with their workers’ compensation obligations, WorkCover WA initiated a data sharing collaboration with the Australian Taxation Office in 2016/17.
The collaboration involved the Australian Taxation Office providing WorkCover WA with data enabling improved identification of employers who employ workers, yet do not appear to hold a workers’ compensation policy. Despite further work needing to be undertaken in 2017/18, early indications of successful outcomes from data matching are positive.
Review of WorkCover WA’s regulatory toolsReflecting the strategic themes of the Strategic Plan 2015–18, this project streamlined the various functions of the Regulatory Services Division.
The project involved a review and integration of employer and service provider regulatory policies, processes and activities, resulting in a consistent approach to regulating scheme stakeholders.
The Regulatory Framework embeds the Agency’s values and principles into all regulatory activities from employer compliance checks to service provider renewals and stakeholder education seminars.
Regional planWorkCover WA aims to ensure all employers, irrespective of where they operate within the State, comply with their obligations in relation to workers’ compensation and injury management.
To increase WorkCover WA’s presence in the regional areas of Western Australia (WA) and to monitor compliance of over 47,000 regional employers, WorkCover WA launched a new Regional Plan in 2016/17 to ensure systematic compliance and regulatory educational activities within the regions for the 2016−2018 period.
Refer to Case study 1 on the following page for further information on our regional activities.
42
Opportunities and challenges
Disclosures and legal compliance
Key performance indicators
Financial statements and notes
GGG ChecklistIntroduction Agency in focus Scheme performance
Report on operations

Under the Regional Plan, WorkCover WA visited five regional centres in 2016/17, conducting compliance visits and inspections, and delivering education seminars to medical clinics, employer groups and regional insurance branches.
Peel RegionIn November 2016, WorkCover WA held an information stall at the ‘Open for business’ event in the Shire of Waroona. The event was hosted by Peel Chamber of Commerce and drew over 100 employers and business owners from the region. WorkCover WA also carried out 70 inspections in the Peel Region in October 2016.
South West RegionIn November 2016, WorkCover WA delivered a presentation at the annual general meeting of the Collie Chamber of Commerce. Educational visits were also made to general practitioners, hospitals and local businesses in the area.
Cocos Island (Indian Ocean Territories)WorkCover WA has a biennial Services Delivery Agreement with the Commonwealth Government. This Agreement ensures compliance obligations are being met in the Indian Ocean Territories, and education and advice is available to local employers and injured workers.
In May 2017, WorkCover WA visited the Cocos (Keeling) Islands to deliver an education seminar to local employers and met with the Island’s medical practitioner. WorkCover WA also inspected 41 local businesses on the islands.
Wheatbelt RegionIn November/December 2016, WorkCover WA carried out 119 inspections on businesses in Northam, York and Narrogin. WorkCover WA also met with local businesses and provided them with educational resources.
Great Southern RegionIn April 2017, WorkCover WA coordinated an educational visit to Albany with Local Government Insurance Services (LGIS) Hopetoun. WorkCover WA delivered a presentation to representatives from the Shires of Albany and Denmark, and held educational meetings with general practitioners in the area.
Principal Communications and Education Offi c
er Lind
a Pa
isley
delivering an education seminar on Cocos Isla
nd.Case study 1: Regional activity
43
Opportunities and challenges
Disclosures and legal compliance
Key performance indicators
Financial statements and notes
GGG ChecklistIntroduction Agency in focus Scheme performance
Report on operations

Targeted regulatory educationScheme trends inform the delivery of regulatory education for all stakeholders. In the employer context, educational activities are targeted at industries that present a higher risk of non-compliance with the duty to maintain workers’ compensation insurance.
Charities and not-for-profit organisationsIn late 2015, an uninsured claim was registered against a not-for-profit arts organisation in WA and liability for the claim fell on members of the organisation’s Executive Committee. In 2016/17, WorkCover WA developed a communications campaign targeting charities, not-for-profit organisations and associations to mitigate the risk of future uninsured claims in similar organisations.
The campaign involved publishing a number of articles in industry magazines and online resources in early 2017. Messages were further directed at this sector during WorkCover WA educational seminars and WorkCover WA also provided content to the Australian Charities and Not-for-profit Commission to update their website and include detail about workers’ compensation in an educational webinar. The Australian Institute of Company Directors was also provided content for inclusion in their WA training courses.
Noise induced hearing loss In 2016/17, WorkCover WA continued to offer advice and guidance to workers and employers across the State with regards to noise induced hearing loss related tests and claims.
Figure 19 outlines the Agency’s activities to monitor and manage noise induced hearing loss claims.
Michelle Matthews, Carolyn Parker a
nd Bill R
oger
s fro
m
Workers identified with potential noise induced hearing loss claims
208
220
153
139
14
Full audiological assessments arranged
Otorhinolaryngology (ear, nose and throat) assessments of occupational hearing loss arranged
Successful claims for work-related gradual onset noise induced hearing loss
First election claims (10 percent permanent hearing loss)
Subsequent election claims (additional five percent permanent hearing loss)
831
Figure 19: Involvement in noise induced hearing loss
the Noise Induced Hearing Loss
branc
h.
44
Opportunities and challenges
Disclosures and legal compliance
Key performance indicators
Financial statements and notes
GGG ChecklistIntroduction Agency in focus Scheme performance
Report on operations

Regulation of service providers in 2016/17 included:
• renewal of seven approved insurers
• annual review of the performance of approved insurers and self-insurers to measure compliance and identify areas for service improvement
• audits of workplace rehabilitation providers, independent registered agents, insurers and self-insurers
• approval, renewal and reinstatement of workplace rehabilitation providers and registered agents
• revocation of a self-insurer
• investigation of complaints
• regular meetings with service providers and representative bodies
• delivery of regulatory education to influence best practice service provision (see ‘Case study 2: Return to Work Conference 2017’ on page 64).
Regulating service providers
This scheme service contributes to, and is aligned with:
Government Goals:
3 - Results-Based Service Delivery
Also: 5 - Social and environmental responsibility
WorkCover WA strategic goals:
1 - Strategic scheme management
2 - Leadership
WorkCover WA approves and monitors service providers to ensure compliance with the Act and an appropriate standard of service is delivered. WorkCover WA approves and monitors the following service providers:
• insurers and self-insurers
• registered agents
• approved workplace rehabilitation providers
• approved medical specialists
• approved audiometric officers, audiologists and audiometrists.
Table 3: Approved and monitored service providers
Type of service provider
Approved in 2015/16
Approved in 2016/17
Monitored as at
30/6/2017*
Insurers 0 7# 9^
Self-insurers 0 0 24
Registered agents
261 221 227
Workplace rehabilitation providers
41 3 44
Audiometric officers, audiologists & audiometrists
50 58 480
Approved medical specialists
27 7 257
Totals 379 296 1,041
* Reflects the total number of approved service providers in the scheme as at 30 June 2017.
# Seven insurers were renewed in November 2016 as a consequence of the expiry of their current period of approval. The approval of one private insurer had not yet expired.
^ This figure includes eight private insurers and the Insurance Commission of WA.
45
Opportunities and challenges
Disclosures and legal compliance
Key performance indicators
Financial statements and notes
GGG ChecklistIntroduction Agency in focus Scheme performance
Report on operations

Insurers and self-insurers WorkCover WA monitors approved insurers and self-insurers to ensure compliance with performance indicators and statutory requirements.
Annual performance reviewThe performance of all approved insurers is reviewed annually by WorkCover WA. The Annual Review Report 2015/16 was considered by the Board in November 2016. The report provided an assessment of approved insurer performance under the following categories:
• economic and financial status
• service delivery and claims management
• settlements and disputes
• data submission.
All insurers were considered to meet service expectations. Two specific improvement areas identified for further monitoring included:
• increasing the use of internal dispute resolution processes
• improving timeliness and quality of policy data submitted to WorkCover WA.
Renewal of approved insurersIn 2016/17, WorkCover WA reviewed and renewed the approval of seven of the eight private insurers who are approved to underwrite the scheme. The existing approval of the seven insurers was due to expire on 31 March 2017.
The renewal was completed in November 2016 when Ministerial approval was obtained to renew the seven insurers for a further five years effective from 1 April 2017. Learnings from the 2012 renewal process facilitated a significantly more efficient process this year, involving a reduced administrative burden for both insurers and WorkCover WA.
WorkCover WA held debrief meetings with each of the insurers to discuss the findings of the renewal and review processes. These meetings were beneficial for all parties.
Insurers’ performance will continue to be monitored over the next five years through WorkCover WA’s audits, annual performance reviews and ongoing monitoring of data.
Table 4: Complaints against service providers
Type of service provider
2013/14
2014/15
2015/16
2016/17
Insurers 4 11 7 4
Self-insurers 0 0 2 0
Registered agents
1 7 2 2
Workplace rehabilitation providers
1 2 7 0
Audiometric officers, audiologists & audiometrists
0 0 0 0
Approved medical specialists
5 2 0 2
Total complaints
11 22 18 8
46
Opportunities and challenges
Disclosures and legal compliance
Key performance indicators
Financial statements and notes
GGG ChecklistIntroduction Agency in focus Scheme performance
Report on operations

Registered agentsWorkCover WA registers agents who may represent parties in proceedings in the Workers’ Compensation Conciliation and Arbitration Services.
Registered agents are approved and regulated by WorkCover WA and are subject to performance monitoring for compliance with the Registered Agents Code of Conduct, as well as a gazetted scale of costs.
Most registered agents are employees of insurers, self-insurers, law firms or representative organisations and act under the instruction of their employer. Some agents are approved to operate as independent registered agents. Independent registered agents are not legal practitioners and cannot provide advice about matters other than the resolution of workers’ compensation disputes.
In 2016/17 there were 221 registered agent approvals, of which seven were for independent registered agents.
Complaints against registered agentsThere were two complaints about registered agents in 2016/17, both relate to one independent registered agent. One complaint was substantiated, the other did not proceed as the agent’s registration was cancelled.
Workplace rehabilitation providers Approved workplace rehabilitation providers assist injured workers to return to work through a range of services including workplace visits, vocational assessment, host employment placements, workplace support and redeployment.
Workplace rehabilitation provider approvals are valid for three years. In 2016/17, WorkCover WA approved three new workplace rehabilitation providers and audited 13. At 30 June 2017, there were 44 workplace rehabilitation providers operating within the scheme.
Complaints against workplace rehabilitation providers No complaints were received against workplace rehabilitation providers in 2016/17, compared with seven in the previous financial year.
Complaints against approved insurers and self-insurersWorkCover WA manages complaints about approved insurers and self-insurers in accordance with the Complaints Against Scheme Participants Policy. Processes and procedures for making a complaint are available on the WorkCover WA website.
WorkCover WA encourages the use of insurers’ internal dispute resolution process to resolve complaints and disputes in the first instance.
In 2016/17, there were four complaints against approved insurers, compared with seven in the previous year. Of these complaints, one was substantiated, one was unable to be investigated, and two were found to be unsubstantiated.
No complaints against self-insurers were received in 2016/17, compared with two complaints in 2015/16.
47
Opportunities and challenges
Disclosures and legal compliance
Key performance indicators
Financial statements and notes
GGG ChecklistIntroduction Agency in focus Scheme performance
Report on operations

Improving scheme performance
This scheme service contributes to, and is aligned with:
Government Goals:
3 - Results-Based Service Delivery
Also: 2 - Financial and economic responsibility 5 - Social and environmental responsibility
WorkCover WA strategic goals:
1 - Strategic scheme management2 - Leadership
WorkCover WA ensures the stability and fairness of the scheme by ensuring worker entitlements, premium rates and provider fees remain fair and reasonable.
During 2016/17, WorkCover WA made adjustments to:
• the entitlement limits of injured workers
• recommended premium rates for workers’ compensation insurance policies
• fees payable to medical and health providers operating in the workers’ compensation scheme.
Other scheme performance initiatives are outlined in this section.
Audiometric officers, audiologists and audiometrists Audiometric officers, audiologists and audiometrists are approved by WorkCover WA to conduct baseline hearing tests and full audiological assessments for the purposes of the scheme. A regulatory framework ensures high standards are maintained for the processing of hearing tests and audiological testing.
In 2016/17, WorkCover WA approved 58 audiometric officers, audiologists and audiometrists to operate within the scheme.
Complaints against approved audiometric officers, audiologists and audiometristsThere were no complaints recorded against approved audiometric officers, audiologists and audiometrists in 2016/17.
Approved medical specialists Approved medical specialists assess injured workers’ degree of permanent impairment in accordance with the WorkCover WA Guidelines for the Evaluation of Permanent Impairment (WA Guidelines).
In order to become an approved medical specialist, a medical practitioner must meet specific criteria and complete formal training on the fifth edition of the American Medical Association’s Guides to the Evaluation of Permanent Impairment and the WA Guidelines. WorkCover WA may then designate a medical practitioner as an approved medical specialist qualified to assess an injured worker’s degree of permanent impairment.
In 2016/17, WorkCover WA designated seven approved medical specialists and as at 30 June 2017 there were 257 operating within the WA scheme.
In December 2016, WorkCover WA implemented a new set of WA Guidelines based on the National Permanent Impairment Guidelines. For further information on the new set of WA Guidelines see ‘Implementation of National Guidelines for the Evaluation of Permanent Impairment’ on the next page.
Complaints against approved medical specialists Two complaints against approved medical specialists were received in 2016/17, compared to no complaints in the previous financial year. Both complaints were substantiated and WorkCover WA has provided education to the two approved medical specialists involved.
48
Opportunities and challenges
Disclosures and legal compliance
Key performance indicators
Financial statements and notes
GGG ChecklistIntroduction Agency in focus Scheme performance
Report on operations

Implementation of National Guidelines for the Evaluation of Permanent Impairment The WA Guidelines is a statutory publication used to guide the evaluation of an injured worker’s degree of permanent impairment by approved medical specialists.
WorkCover WA has worked with other workers’ compensation jurisdictions, under the auspices of Safe Work Australia, to develop a nationally consistent impairment assessment guide and a training package for assessors.
During 2016/17, WorkCover WA finalised and implemented the fourth edition of the WA Guidelines, based on the national template. The WA Guidelines were published in the Government Gazette on 17 October 2016, with an operational date of 1 December 2016. WorkCover WA delivered a series of workshops outlining the changes for approved medical specialists and other scheme participants.
Publication of the WA Guidelines was also supported by revised Guidance Notes and explanatory material. The explanatory material and format of the workshops enabled stakeholder queries to be addressed and shared amongst the group. Positive feedback on these events was received.
Through Safe Work Australia, WorkCover WA will continue to participate in the development and implementation of a nationally consistent training package, which may include options for mutual recognition.
Focus on injury management and return to workWorkCover WA continues to explore ways to improve injury management and return to work outcomes and practices for workers and employers by considering the role played by health and service providers operating within the scheme.
In recognition and understanding of the important role undertaken by general practitioners, WorkCover WA has participated in a national, multi-year project since 2015/16 led by Monash University. The project aims to develop clinical guidelines to assist general practitioners to assess, diagnose and manage work-related mental health conditions.
The project brings together two related injury management focus areas for the WA workers’ compensation and injury management scheme (the scheme):
• the engagement of general practitioners in injury management and return to work processes
• minimising the impact of psychological injury and mental health conditions.
Recent and ongoing efforts in injury management and return to work were showcased at WorkCover WA’s Return to Work Conference 2017. For more information about the Conference refer to ‘Case study 2: Return to Work Conference 2017’ on page 64.
Senior Policy Offi cer, Tom Samuels, holding the new
WorkCover WA Guidelines.
49
Opportunities and challenges
Disclosures and legal compliance
Key performance indicators
Financial statements and notes
GGG ChecklistIntroduction Agency in focus Scheme performance
Report on operations

Bereavement support projectThe current legislation relating to entitlements for dependants of deceased workers is complex and difficult to navigate, particularly in the context of having lost a family member to a workplace accident.
A project was initiated in 2016/17 to improve the communication and engagement with dependants of deceased workers who may be entitled to compensation under the Act.
WorkCover WA has commenced consulting with insurers to seek further details about the current process and how it might be improved in relation to communication, timeliness and the level of support provided to dependants.
Outcomes from the project will be reported in 2017/18, including expected updates to the current Workers’ Compensation Claim Form for Dependants of Deceased Workers.
Complaints Management Framework and proceduresA review of WorkCover WA’s Complaints Management Framework and associated procedures was undertaken in 2016/17 to:
• streamline the early triaging or processing of complaints
• set out relevant and specific guidance on progressing complaints against particular scheme participants by addressing the critical aspects of the investigative and determinative processes.
Completed in February 2017, the project resulted in the implementation of a single point of triage for all complaints and a four stage process for the management of service provider complaints.
The initial triage process involves a nominated officer contacting complainants within 24 hours with a view to resolving the complaint. A total of 26 complaints have been received since February 2017 and 21 were resolved at the triage stage.
WorkCover WA software systems have also been updated to better manage and record the complaints handling process.
Prescription medications for injured workersIn response to stakeholder concerns about the cost of prescription pharmaceuticals, WorkCover WA conducted a review of pharmaceutical costs and billing practices. Research revealed while most injured workers are eligible for subsidised medications under the Pharmaceutical Benefits Scheme (PBS), most workers were prescribed non-PBS prescriptions.
In consultation with key stakeholders, WorkCover WA finalised a policy position outlining the Agency’s expectation that injured workers are prescribed medications under the PBS (where clinically appropriate and available) and that pharmacies will charge the applicable PBS rate for medications upon presentation of the injured worker’s Medicare card.
The increased use of PBS prescriptions will ensure an injured worker’s capped medical entitlements cover more of their expenses and reduce the overall cost of medication in the WA scheme.
Following consultation with key stakeholders, the project was finalised in 2016 with the publication of a notice outlining WorkCover WA’s policy position and a mail-out to all pharmacies operating in the State.
50
Opportunities and challenges
Disclosures and legal compliance
Key performance indicators
Financial statements and notes
GGG ChecklistIntroduction Agency in focus Scheme performance
Report on operations

Progressing legislative reform
This scheme service contributes to, and is aligned with:
Government Goals:
3 - Results-Based Service Delivery
Also: 2 - Financial and economic responsibility 5 - Social and environmental responsibility
WorkCover WA strategic goals:
1 - Strategic scheme management
2 - Leadership
Legislative ReviewThe Minister for Commerce and Industrial Relations prioritised the drafting of legislation to improve entitlements for the dependants of deceased workers.
The drafting of a bill to develop a new workers’ compensation statute based on WorkCover WA’s Review of the Workers’ Compensation and Injury Management Act 1981: Final Report is expected to commence in 2017/18.
Regulation amendment: Declaration by interstate and overseas workersSection 69 of the Act requires a worker residing outside WA to prove their identity and incapacity in accordance with the regulations in order to continue to be entitled to weekly compensation.
Amendment regulations were developed to improve the regulated form and provide clarity in relation to the timeframes within which a worker must comply. Other changes, such as the flexibility for the declaration to be sent electronically, are intended to reduce unnecessarily strict requirements which can have an undue impact on an injured worker’s entitlement.
The regulations were published in the Government Gazette on 4 October 2016 with an operational date of 17 October 2016.
Specific cancers contracted by firefightersDivision 4A of the Act provides for a rebuttable presumption that supports claims by firefighters employed by the Department of Fire and Emergency Services (DFES) who contract one of 12 specified cancers. These special arrangements came into effect on 13 November 2013.
Part 4 of the Firefighters and Emergency Volunteers Legislation Amendment (Compensation) Act 2016 came into operation on 21 January 2017 and expands the current presumption under Division 4A. In addition to DFES firefighters, the presumption now covers:
• former firefighters employed by DFES
• current and former firefighters employed by the State such as Department of Parks and Wildlife and Forest Products Commission firefighters.
In 2016/17, a number of amendments were made to clarify the application of the laws to current and former State employed firefighters.
51
Opportunities and challenges
Disclosures and legal compliance
Key performance indicators
Financial statements and notes
GGG ChecklistIntroduction Agency in focus Scheme performance
Report on operations

This scheme service contributes to, and is aligned with:
Government Goals:
3 - Results-Based Service Delivery
Also: 2 - Financial and economic responsibility
WorkCover WA strategic goals:
1 - Strategic scheme management
2 - Leadership
Resolving disputesWorkCover WA’s Conciliation and Arbitration Services provide a fair and cost effective system to resolve disputes that:
• is timely
• is accessible, approachable and professional
• minimises costs to parties to disputes
• in the case of conciliation, leads to final and appropriate agreements between parties in relation to disputes
• in the case of arbitration, enables disputes not resolved by conciliation to be determined with as little formality and technicality as practicable.
In addition to facilitating the resolution of disputes by conciliation, the Conciliation Service is responsible for recording workers’ compensation claims finalised through settlement (i.e. registration of Memoranda of Agreement and common law settlement deeds) and the processing of documents submitted in relation to common law matters. The Conciliation Services registered 4,116 Memoranda of Agreement in 2016/17.
Initiatives of the Conciliation and Arbitration Service to improve service delivery in 2016/17 included:
• improved security arrangements, including development of a risk assessment tool to identify high risk matters
• introducing technology enabling parties based outside the metropolitan area to participate in conciliation conferences and arbitration hearings
• assessment of the case management resources supporting the Conciliation and Arbitration Service
• a continuation of the pilot of a pre-arbitration conference program, which brings together parties ahead of a scheduled arbitration hearing
• investment in professional development for conciliation officers and arbitrators, including managing mental health issues which arise in the dispute context, and making decisions regarding costs applications in workers’ compensation disputes.
Service 2: Scheme ServicesProvision of effective and equitable dispute resolution and other services to scheme participants
52
Opportunities and challenges
Disclosures and legal compliance
Key performance indicators
Financial statements and notes
GGG ChecklistIntroduction Agency in focus Scheme performance
Report on operations

Dispute resolution performanceThe objective of the Conciliation Service is to provide a timely and effective service to assist parties to resolve their dispute by agreement. The focus of the Arbitration Service is resolving disputes according to their substantial merits.
Figure 20 illustrates WorkCover WA’s achievement of these objectives, including numbers of applications accepted and cases completed. In Figure 21, KPI effectiveness indicator 1.2 relates to Conciliation Services and 1.3 to Conciliation and Arbitration Services combined.
* The figures for conciliation and arbitration cases ‘completed’ include some applications which were accepted for lodgement in previous financial years.
Conciliation applications accepted
2,090
554
513
Conciliation cases completed
Arbitration applications accepted
Arbitration cases completed
2,083
Figure 20: 2016/17 Conciliation and Arbitration Services applications and cases*
Figure 21: 2016/17 KPI effectiveness indicators related to the Conciliation and Arbitration Service
WorkCover WA Senior Conciliation Offi cer Peter Brash.
Proportion of conciliations completed within eight weeks
(Reference page 98)
Target: 97.0% Result: 97.1%
1.2
Proportion of disputes resolved within six months
(Reference page 99)
Target: 90.0% Result: 87.9%
1.3
53
Opportunities and challenges
Disclosures and legal compliance
Key performance indicators
Financial statements and notes
GGG ChecklistIntroduction Agency in focus Scheme performance
Report on operations

Evaluation of the pre-arbitration conferenceA pilot program of pre-arbitration conferences commenced in 2016 in response to frequent discontinuance or settlement of arbitration matters just prior to a scheduled arbitration hearing.
As part of a pre-arbitration conference, parties agree to participate, on a voluntary basis, in a meeting held one month prior to the scheduled arbitration hearing. This is intended to narrow the issues in dispute prior to the arbitration date, and to minimise the resource impact related to the late discontinuance of matters.
In 2016/17, approximately 19 percent of arbitration applications underwent a pre-arbitration conference. The pilot was conducted on a controlled scale to allow for its impact, benefits and risks to be properly identified. The expected benefits included the ability to re-use hearing dates, possible early resolution of disputes and identification of notional cost savings.
An examination after the first 12 months of the pre-arbitration conferences (2 March 2016 to 31 March 2017) found:
• 85 pre-arbitration conferences were held and of these only three matters proceeded to an arbitration hearing
• the number of re-usable hearing days equated to 102 days
• a notional saving of more than $600,000 to WorkCover WA was identified through the timely cancellation of arbitration hearings.
Stakeholder feedback on the pilot has been generally positive, with parties recognising the benefits of coming together, in a facilitated manner, prior to a formal arbitration hearing.
Dispute Services Users GroupThe Dispute Services Users Group was established as a means of engaging and consulting with key stakeholders involved with Conciliation and Arbitration Services, including legal practitioners and registered agents. It provides an effective forum for the two-way exchange of information regarding the operations of the Conciliation and Arbitration Service and workers’ compensation dispute resolution matters in general.
In 2016/17, the Dispute Services Users Group met on three occasions and considered a range of initiatives and issues including:
• outcomes of the Monash Review of the Conciliation and Arbitration Services (see page 55)
• the availability of medical specialists to conduct medico-legal assessments
• feedback on practice directions within the Arbitration Service
• participation in pre-arbitration conferences.
Conciliation Officer Development ProgramThe Conciliation Officer Development Program (the Program) was first established in April 2014 to develop a pool of suitably skilled WorkCover WA staff to undertake the role of Conciliation Officer. This is a graduated program which builds skills and knowledge over a 13 week period in a supportive environment.
The Program continued throughout 2016/17 with one WorkCover WA staff member successfully completing the 13 week program. This has increased the capacity of the Conciliation Service to maintain appropriate staffing levels and service delivery.
Conciliation and Arbitration Services Training ProgramThe Conciliation and Arbitration Services successfully delivered the first Advocacy Training Program in March 2016. In March 2017, a second training opportunity was offered for representatives titled Managing Mental Health Issues in Workers’ Compensation Disputes.
This event was attended by 43 legal practitioners and registered agents. Most found the session useful and believed they had gained new insight into managing disputes where mental health issues were present.
WorkCover WA will continue offering training sessions to those acting as advocates within the Conciliation and Arbitration Services.
54
Opportunities and challenges
Disclosures and legal compliance
Key performance indicators
Financial statements and notes
GGG ChecklistIntroduction Agency in focus Scheme performance
Report on operations

Arbitrator and Conciliation Officer Professional DevelopmentWorkCover WA continually invests in the professional development of Conciliation Officers and Arbitrators, through a combination of in-house and external training opportunities.
In 2016/17, in-house professional development opportunities were provided in:
• making costs decisions in workers’ compensation disputes
• managing mental health issues in conciliation and arbitration.
External training opportunities were made available to arbitrators to enable them to meet continuous professional development obligations under the Legal Profession Act 2008.
Conciliation and Arbitration Services Digital First RoadmapAs part of the WorkCover WA IT Strategic Plan, the Conciliation and Arbitration Service has begun the journey to shift current services to an online environment by 2020.
In 2016/17, WorkCover WA identified legislative and other impediments to moving services online and commenced communication with external stakeholders regarding the intended changes.
Evaluation of WorkCover WA’s Conciliation and Arbitration ServicesA new model for workers’ compensation dispute resolution was established in 2011. To evaluate its success, the Australian Centre for Justice Innovation at Monash University was engaged to undertake an evaluation of the services in 2015/16.
The Australian Centre for Justice Innovation focused on the extent to which the services are cost effective, fair, accessible and operate in a timely manner.
Feedback was collected from stakeholders who use the services via focus groups and individual interviews.
The review found the Conciliation and Arbitration Services met core objectives and services are timely, cost effective, fair and accessible when compared with similar workers’ compensation arrangements across Australia. The review also found the vast majority of stakeholders consider the Conciliation and Arbitration Services work well overall.
The following initiatives were undertaken in 2016/17 in response to the recommendations of the Monash Review:
• Establishing performance standards for the Arbitration Service
WorkCover WA has established operational performance protocols for the delivery of services by the Arbitration Service Registry. These procedures help guide staff in the management of applications and associated documents. Standards have also been established for case management of disputes before the Arbitration Service.
• Using technology to improve access to the Conciliation and Arbitration Service
In 2016/17, WorkCover WA established a pilot project enabling the use of digital communications technology in hearings. This enables parties to participate via video conferencing if they are based outside the Perth metropolitan area and are unable to attend in person.
• Understanding participant experiences
Following the Monash Review of the Conciliation and Arbitration Service, WorkCover WA has examined the best way to gain feedback from those who use the services. This project examined the use of technology to seek more immediate feedback from parties.
55
Opportunities and challenges
Disclosures and legal compliance
Key performance indicators
Financial statements and notes
GGG ChecklistIntroduction Agency in focus Scheme performance
Report on operations

This scheme service contributes to, and is aligned with:
Government Goals:
3 - Results-Based Service Delivery
Also: 4 - Stronger focus on the regions
WorkCover WA strategic goals:
1 - Strategic scheme management
2 - Leadership
Education and information
WorkCover WA offers education, advice and assistance to workers, employers and other stakeholders via a range of methods and resources. The provision of education and information is a vital WorkCover WA service aimed at establishing and increasing stakeholders’ knowledge of rights and responsibilities in regards to workers’ compensation and injury management.
WorkCover WA continued to conduct initiatives in line with the External Communications Strategy 2016–18, ensuring a systematic approach to all communications and education activities.
Injury management videos and resourcesWorkCover WA’s Return to Work Conference held in May 2017 provided a well-timed platform for the launch of new WorkCover WA injury management resources, including four videos.
The injury management videos and resources aim to provide information and support for a range of workers’ compensation and injury management topics including making a claim, case conferences and post-injury return to work.
The videos are available under the Educational videos section of the WorkCover WA website. Additional videos on a further range of topics are scheduled to be released in 2017/18.
PublicationsWorkCover WA publishes a range of educational resources providing workers, employers and service providers with relevant and comprehensive information on workers’ compensation and injury management rights, obligations and entitlements.
In 2016/17, the Workers’ Compensation and Injury Management: A Guide for Workers (Workers’ Guide) was again the most requested publication by mail, comprising 65 percent of all publications ordered. The Workers’ Guide was also the most downloaded publication, recording 30 percent of all downloads.
WorkCover WA publications can be downloaded from the resources section on the WorkCover WA website – www.workcover.wa.gov.au/resources/forms-publications.
Communications and Education team members
Meg
an G
oss
and Carrie Fisher with an injury management v
ideo
.
56
Opportunities and challenges
Disclosures and legal compliance
Key performance indicators
Financial statements and notes
GGG ChecklistIntroduction Agency in focus Scheme performance
Report on operations

Workers’ Compensation and Injury Management: A Guide for Workers
Mail: 6,783 Web: 2,846
Injury Management: A Guide for Employers
Mail: 996 Web: 1,473
A Guide to Noise Induced Hearing Loss
Mail: 290 Web: 512
Insurance Brokers’ Code of Practice
Mail: 62 Web: 180
Workers’ Compensation: A Guide for Employers
Mail: 1,205 Web: 2,776
A technical note on contractors and workers’ compensation
Mail: 639 Web: 1,544
What happens if there is a dispute?
Mail: 409 Web: 228
Total publications sent in 2016/17
Mail: 10,384 Web: 9,559
1 2
3 4
5 6
Total7
Figure 22: Publication distribution
Compliance Offi cer, Karly Fitzpatrick, reading a
WorkCover WA publication.
57
Opportunities and challenges
Disclosures and legal compliance
Key performance indicators
Financial statements and notes
GGG ChecklistIntroduction Agency in focus Scheme performance
Report on operations

Resolving a dispute
Contact us
Service providers
News
Health providers
Employers
Workers
Resources
General website statisticsWebsiteWorkCover WA’s website provides information on our services and the rights and responsibilities of stakeholders in an accessible, user-friendly format. Stakeholders can subscribe to Latest News updates from WorkCover WA and in 2016/17 our Agency sent 31 Latest News articles to 1,296 website subscribers.
DownloadsThere were 98,945 unique downloads of publications, forms, reports and other information in 2016/17.
Variations to the Prescribed Amount 2016/17
5,638
5,174
3,086
Workers’ Compensation Claim Form
Recommended Premium Rates 2016/17
Variations to the Prescribed Amount 2015/16
10,080
Figure 23: Top downloads 2016/17
Figure 24: Site visits
49.8% New visitor
50.2% Returning visitor
0
50000
100000
150000
200000
250000
275,439 Total visits
142,108 Unique visits
Figure 25: Views by WorkCover WA website channels
231,668
166,641
126,299
42,464
29,784
19,433
18,456
14,871
58
Opportunities and challenges
Disclosures and legal compliance
Key performance indicators
Financial statements and notes
GGG ChecklistIntroduction Agency in focus Scheme performance
Report on operations

gpsupport websiteWorkCover WA continued to promote stakeholder engagement and cooperation via its subsidiary gpsupport website, a key educational tool for general practitioners who have an important role to play in the WA scheme.
Five news articles were published on the gpsupport website in 2016/17. Topics included:
• a general practitioner’s role in establishing return to work programs
• making referrals to workplace rehabilitation providers
• how general practitioners can use case conferences to assist injured workers
• the release of the new edition of the WorkCover WA Guidelines for the Evaluation of Permanent Impairment
• promotion of the WorkCover WA Return to Work Conference which was held in May 2017.
72.2% New visitor
27.8% Returning visitor
Return to Work Conference websiteTo maximise attendance at the Return to Work Conference, WorkCover WA launched a subsidiary website to provide prospective delegates and exhibitors with a one-stop shop for conference updates, program details, exhibition opportunities and venue information.
returntowork.workcover.wa.gov.au was launched in October 2016 and had a total of 5,451 visitors. The website formed an integral part of a successful promotional campaign which enabled the Agency to exceed its attendance goals.
TwitterWorkCover WA uses Twitter to engage and communicate with external stakeholders. Information is ‘tweeted’ with links directing followers to the WorkCover WA website for more comprehensive information.
During 2016/17, WorkCover WA ‘tweeted’ 84 times and accumulated 373 followers including workers, healthcare providers, business managers, human resource officers and advocacy groups.
Advice and Assistance UnitWorkCover WA’s Advice and Assistance Unit is the Agency’s frontline service for workers, employers and others who require immediate guidance related to workers’ compensation and injury management matters.
This year the Unit responded to 20,348 requests for advice and assistance by email, letter, phone and onsite at the WorkCover WA reception desk. The requests came from a broad cross section of stakeholders and covered topics including the claims process, injury management, return to work, weekly compensation rates and entitlements, workplace rehabilitation entitlements, and dispute resolution.
In 2016/17, Advice and Assistance staff received training focused on:
• managing calls to provide timely and practical information
• assisting callers who are experiencing difficult and stressful situations.Figure 26: gpsupport site visits
59
Opportunities and challenges
Disclosures and legal compliance
Key performance indicators
Financial statements and notes
GGG ChecklistIntroduction Agency in focus Scheme performance
Report on operations

Training and seminarsDuring 2016/17, WorkCover WA delivered a range of events in the form of seminars, information sessions and presentations. The events informed stakeholders and the general public about workers’ compensation and injury management rights, obligations and responsibilities. The events also promoted collaboration and mutual respect between stakeholder groups by providing insight into the various elements of the scheme.
Welcome to WorkCover WA seminarsWelcome to WorkCover WA seminars are regular events in the Agency’s calendar. Providing an introductory overview of WorkCover WA and its role within the workers’ compensation and injury management scheme, the seminar offers attendees an opportunity to discuss individual queries and concerns with experienced divisional heads.
WorkCover WA conducted four seminars in 2016/17, informing and educating 205 stakeholders about the scheme.
WorkCover WA continued to monitor feedback from attendees to ensure the content continues to meet the needs of attendees which included workers, employers, and scheme health and service providers. Feedback throughout 2016/17 has been overwhelmingly positive suggesting this remains the case.
Figure 27: 2016/17 Welcome to WorkCover WA seminar attendance*
Insurance Brokers’ Breakfast SeminarThe 2016 Insurance Brokers’ Breakfast Seminar was held on 8 December at Crown Perth. This was the seventh seminar since the commencement of the series in 2006, continuing WorkCover WA’s commitment to engaging with insurance brokers in collaboration with the National Insurance Brokers Association.
Including a keynote presentation that discussed how data from wearable technology in the workplace can inform safety practices, recovery from injury and return to work programs, the seminar enabled insurance brokers to:
• learn more about WorkCover WA and the WA scheme
• better understand WorkCover WA’s regulatory role
• receive feedback about how the services of brokers are perceived by stakeholders and where the interface between insurers, brokers, employers and workers can be improved
• hear about latest scheme trends and developments.
The seminar was fully subscribed with 220 attendees. Feedback from attendees was extremely positive, with 100 percent of respondents indicating they would recommend the seminar to others. The presentation was rated as either ‘good’ or ‘excellent’ by 87 percent of respondents, with the same percentage indicating they had increased their knowledge about the WA scheme.
Employer
Key:
60.8%
Service provider
Worker
Health provider
*Based on feedback from 92 attendees.
Other/no response
17.4%
8.7%8.7%4.4%
60
Opportunities and challenges
Disclosures and legal compliance
Key performance indicators
Financial statements and notes
GGG ChecklistIntroduction Agency in focus Scheme performance
Report on operations

General Manager Regulatory Services Stephe
n Psa
ila-S
avon
a
presenting at the Insurance Brokers’ Bre
akfast
Sem
inar
.
Approved medical specialist trainingApproved medical specialists are medical practitioners approved by WorkCover WA to carry out particular medical assessments.
Approved medical specialists play an integral role in the scheme by assessing an injured worker’s degree of permanent impairment as part of the claims process. In order to become an approved medical specialist, medical practitioners must complete formal training in permanent impairment assessment, including a WA-specific session.
In 2016/17 WorkCover WA held one training session on the WA permanent impairment regime and registered seven new approved medical specialists.
PresentationsBizLinksBizlinks events are hosted by the Small Business Development Corporation and provide WorkCover WA the opportunity to educate small business owners about their workers’ compensation and injury management obligations. In 2016/17, WorkCover WA presented at BizLinks seminars in Gosnells, Bunbury and Perth CBD.
Each free Bizlinks seminar involves 9–10 government agencies presenting to 50–60 attendees. Involvement in the seminars has proved successful with a number of attendees across all sessions indicating their knowledge of workers’ compensation significantly increased after the event.
Presentations on requestWorkCover WA delivers a range of tailored external presentations to stakeholders upon request.
During 2016/17, the Agency delivered 16 external presentations to stakeholders including small business owners, self-insurers, universities and health providers.
These presentations focused on:
• employer obligations and the roles played by different parties (relevant to the audience)
• injury management and return to work information for health providers such as general practitioners, allied health providers and occupational therapy students.
External conferences, seminars and meetingsChamber of Commerce and IndustryIn August 2016, WorkCover WA presented at the Chamber of Commerce and Industry Member Information Session to 70 employers. All attendees received additional informational resources. The presentation covered employer statutory obligations and trends within the scheme, including topics such as stress claims, uninsured claims risks and the Agency’s regulatory activities. Attendees provided exceptional feedback about the presentation.
61
Opportunities and challenges
Disclosures and legal compliance
Key performance indicators
Financial statements and notes
GGG ChecklistIntroduction Agency in focus Scheme performance
Report on operations
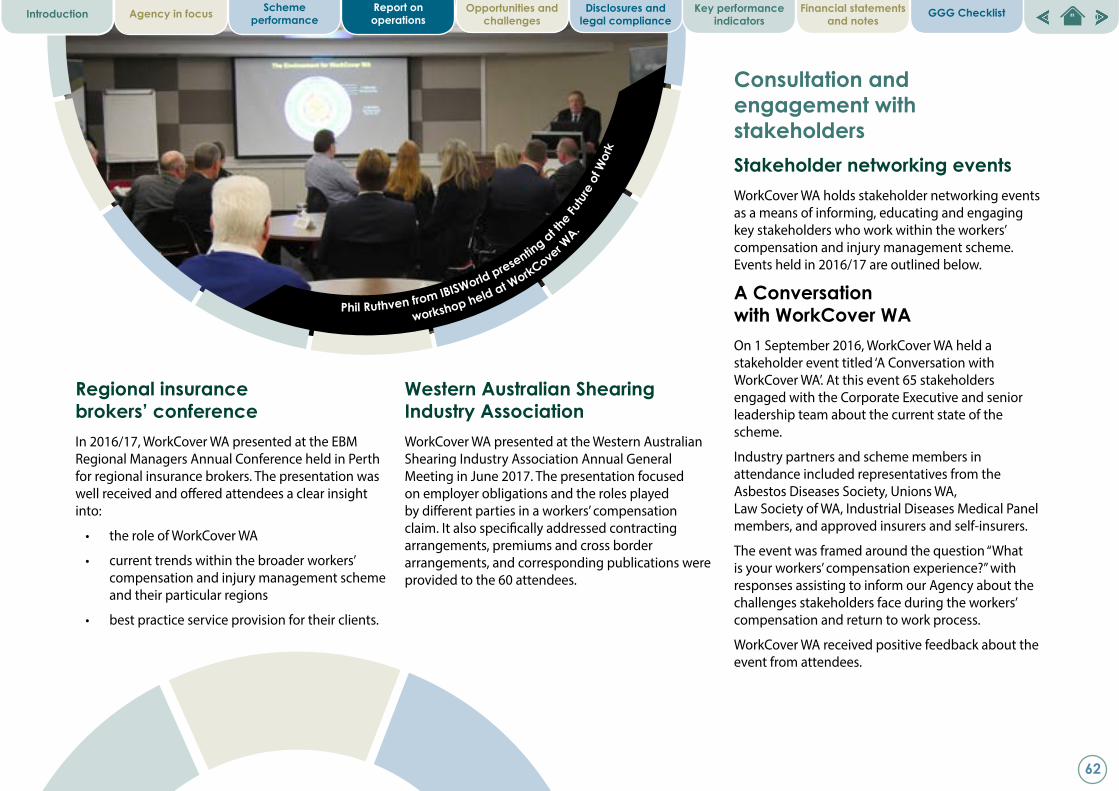
Consultation and engagement with stakeholdersStakeholder networking eventsWorkCover WA holds stakeholder networking events as a means of informing, educating and engaging key stakeholders who work within the workers’ compensation and injury management scheme. Events held in 2016/17 are outlined below.
A Conversation with WorkCover WAOn 1 September 2016, WorkCover WA held a stakeholder event titled ‘A Conversation with WorkCover WA’. At this event 65 stakeholders engaged with the Corporate Executive and senior leadership team about the current state of the scheme.
Industry partners and scheme members in attendance included representatives from the Asbestos Diseases Society, Unions WA, Law Society of WA, Industrial Diseases Medical Panel members, and approved insurers and self-insurers.
The event was framed around the question “What is your workers’ compensation experience?” with responses assisting to inform our Agency about the challenges stakeholders face during the workers’ compensation and return to work process.
WorkCover WA received positive feedback about the event from attendees.
Western Australian Shearing Industry AssociationWorkCover WA presented at the Western Australian Shearing Industry Association Annual General Meeting in June 2017. The presentation focused on employer obligations and the roles played by different parties in a workers’ compensation claim. It also specifically addressed contracting arrangements, premiums and cross border arrangements, and corresponding publications were provided to the 60 attendees.
Phil Ruthven from IBISWorld presenting at the F
utur
e of
Wor
k
workshop held at WorkCover WA.
Regional insurance brokers’ conferenceIn 2016/17, WorkCover WA presented at the EBM Regional Managers Annual Conference held in Perth for regional insurance brokers. The presentation was well received and offered attendees a clear insight into:
• the role of WorkCover WA
• current trends within the broader workers’ compensation and injury management scheme and their particular regions
• best practice service provision for their clients.
62
Opportunities and challenges
Disclosures and legal compliance
Key performance indicators
Financial statements and notes
GGG ChecklistIntroduction Agency in focus Scheme performance
Report on operations

Future of WorkA ‘Future of Work’ workshop was held at WorkCover WA on 12 July 2016. Further information about this event can be found under ‘Initiative 3: Future of work – Implications for workers’ compensation’ located on page 20.
External exhibitionsIn 2016/17, WorkCover WA participated in the following external exhibitions:
NIFNEX Small Business ExpoSmall businesses play a significant role in the WA economy, representing approximately 97 percent of all business in this State. WorkCover WA exhibited at the NIFNEX Small Business Expo on 8 July 2016 to help inform small business owners of their rights and obligations under the Act. The Expo brought our Advice and Assistance staff into contact with over 120 businesses exhibiting at the event, as well as over 900 existing and prospective small business owners who attended.
Perth Franchising ExpoWorkCover WA exhibited at the Perth Franchising Expo at Crown Perth on 7 May 2017. Attending the Expo formed part of the Agency’s ongoing efforts to educate existing and prospective franchisees and franchisors about WA workers’ compensation and injury management obligations. Over 900 people visited the Expo and WorkCover WA staff also made contact with the 57 other exhibitors present. The WorkCover WA booth staff were kept busy handing out publications and responding to over 100 queries, with the majority coming from potential business owners wanting to understand their legal requirements and how to manage injured workers.
Perth Tradies ExpoUnder the WorkCover WA External Communications Strategy 2016–18, the building and construction industry was identified as an industry with a higher risk of employers not holding workers’ compensation insurance. This risk is partly due to contractor and sub-contractor arrangements common to the industry. Targeting employers within this industry, WorkCover WA exhibited at the Perth Tradies Expo at Ascot Racecourse from 16–18 June 2017. This event provided WorkCover WA staff with the opportunity to liaise with tradespeople about their obligations, particularly regarding contracting and sub-contracting arrangements.
Approximately 2,000 people attended the three day event, and WorkCover WA staff spoke to over 150 tradespeople who wanted to better understand their legal requirements in relation to workers’ compensation. Attending staff also answered enquiries from prospective business owners and workers who wanted information about their rights and entitlements.
General Practice Conference and ExhibitionGeneral practitioners play an essential role within the workers’ compensation and injury management scheme and have the opportunity to have an early influence on an injured worker’s recovery. Understanding the need to engage with and support general practitioners, WorkCover WA exhibited at the General Practice Conference and Exhibition at the Perth Convention and Exhibition Centre on 23 and 24 July 2016. WorkCover WA engaged with over 200 primary healthcare professionals at the conference, including approximately 150 general practitioners.
WorkCover WA staff members Hans Fr
ederic and
Mike
Yea
ts
at the General Practice Conference and Ex
hibitio
n.
63
Opportunities and challenges
Disclosures and legal compliance
Key performance indicators
Financial statements and notes
GGG ChecklistIntroduction Agency in focus Scheme performance
Report on operations

WorkCover WA successfully delivered the Return to Work Conference (the Conference) at Pan Pacific Perth on 3 and 4 May 2017. Over two days, nearly 400 delegates attended the Conference to view 21 exhibitions and listen to 23 presentations by Australia’s leading minds and experts.
Highlights included:
• The Minister for Commerce and Industrial Relations, Mines and Petroleum, Electoral Affairs, and Asian Engagement, the Hon. Bill Johnston, officially opening the Conference
• Biomedical engineer, Dr Jordan Nguyen, offering insight into the future of health technology and how these advances may positively impact the health sector
• Social researcher, Ms Claire Madden, analysing the intergenerational transition in the workplace and how best to equip leaders to engage with a multigenerational workforce
• Laureate Professor Sharon Parker, Director of the UWA Centre for Transformative Work Design, discussing factors that drive good work design and their impact on the return to work context
The Conference was an overwhelming success that was delivered to budget with the number of delegates and exhibitors far exceeding projections.
The program was well received, with the majority of evaluated respondents rating the speakers as very good to excellent and nominating the range of presentations as the most beneficial aspect of the Conference.
The survey also found that 94 percent of respondents would attend the next WorkCover WA conference.
• Dr Rory Gallagher, Managing Director of the Asia-Pacific Behavioural Insights Team, sharing his experience on the application of nudge theory to encourage widespread behavioural change in a range of contexts
• Presenter of The Health Report on ABC Radio National and Tonic on ABC News24, Dr Norman Swan, chairing a lively interactive discussion panel on the benefits of early intervention. Panel members included Ms Candy Choo from LGIS, Ms Karin Lee from WorkCover WA, Mr Robert Aurbach from Uncommon Approach, Occupational Physician Dr Roger Lai, and Professor Michael Nicholas from the University of Sydney’s Pain Management Research Institute.
The Hon. Bill Johnston MLA opening the Return to W
ork C
onfe
renc
e.
Case study 2: Return to Work Conference 2017
64
Opportunities and challenges
Disclosures and legal compliance
Key performance indicators
Financial statements and notes
GGG ChecklistIntroduction Agency in focus Scheme performance
Report on operations

CollaborationThe Agency collaborates with external parties who contribute to the effective management of the WA scheme. This collaboration is aimed at ensuring ongoing improvement of both State and National workers’ compensation outcomes.
International collaborationSingapore’s Ministry of ManpowerIn late 2016, WorkCover WA hosted a delegation from the Ministry of Manpower, Singapore Government’s workers’ compensation equivalent. The visit was the final stop in a study trip which saw the delegation also visit workers’ compensation and occupational health and safety regulators in Canberra, Melbourne and Adelaide.
As many of the study group were recently appointed members to Singapore’s Workplace Safety and Health Council, they came to learn about Australian workplace safety standards, workers’ compensation schemes and return to work programs, with an emphasis on the building and construction industry.
The delegation attended presentations from WorkCover WA, WorkSafe WA, the Department of State Development, and the President of the Australasian Faculty of Occupational and Environmental Medicine regarding the WA experience and the health benefits of good work.
The Ministry of Manpower previously visited WorkCover WA in 2015.
National collaborationHeads of Workers’ Compensation AuthoritiesOn 1 January 2016, WorkCover WA assumed the role of chair of the Heads of Workers’ Compensation Authorities (HWCA). HWCA comprises the Chief Executives (or their representatives) of the peak bodies responsible for the regulation of workers’ compensation in Australia and New Zealand. This includes Australia’s 10 workers’ compensation authorities and the New Zealand Accident Compensation Corporation.
HWCA’s vision is to promote and implement best practice in workers’ compensation arrangements in Australia and New Zealand in the areas of policy and legislative matters, regulation, and scheme administration. HWCA also liaises with Safe Work Australia on workers’ compensation matters.
As chair of HWCA, WorkCover WA provides executive and policy level support for meetings and national projects. WorkCover WA also maintains an active role in driving a strategic policy agenda and change.
Strategic Issues Group – Workers’ CompensationWorkCover WA’s Chief Executive Officer (CEO) is WA’s representative on the Safe Work Australia Strategic Issues Group – Workers’ Compensation (SIG-WC). SIG-WC is a forum for workers’ compensation authorities and social partners to discuss national policy issues. SIG-WC has a strategic focus and develops initiatives to improve workers’ compensation arrangements across Australia.
Some of the key activities progressed in 2016/17 by SIG-WC include:
• development of a draft ‘Best practice in psychological claims management in workers’ compensation’ framework
• commencement of a project to develop ways to support general practitioners to achieve better health and return to work outcomes for patients with a compensated injury
• publication of key benchmark reports including the Comparative Performance Monitoring Report and the Comparison of Workers’ Compensation Arrangements in Australia and New Zealand.
Personal Injury Education FoundationWorkCover WA is a member of the Personal Injury Education Foundation (PIEF, www.pief.com.au) and continued to support programs developed by PIEF during 2016/17.
In 2016/17, PIEF provided return to work and case management training for professionals working with people with injuries (such as case managers and employer representatives).
Australian Taxation OfficeTo improve the targeting of employers at risk of non-compliance with their workers’ compensation obligations, WorkCover WA initiated a data sharing collaboration with the Australian Taxation Office in 2016/17.
For more details on this project, refer to the ‘Dataset collaboration with Australian Taxation office’ section on page 42.
65
Opportunities and challenges
Disclosures and legal compliance
Key performance indicators
Financial statements and notes
GGG ChecklistIntroduction Agency in focus Scheme performance
Report on operations

State collaboration Public Sector Safety and Injury Management Steering CommitteeWorkCover WA is a member of the Public Sector Safety and Injury Management Steering Committee, which consists of representatives from WorkSafe, the Department of Commerce, RiskCover, the Public Sector Commission and UnionsWA. The committee is responsible for arranging presentations for public sector staff on a range of injury management and return to work topics.
Industrial Foundation for Accident PreventionWorkCover WA’s cooperative partnership with the not-for-profit Industrial Foundation for Accident Prevention (IFAP) continued in 2016/17 by providing free information sessions to injured workers. IFAP is a registered training organisation providing education and information to injured workers about the workers’ compensation, injury management and return to work process.
In 2016/17, eight free IFAP seminars were delivered to 67 injured workers.
Commission for Occupational Safety and HealthThe WorkCover WA CEO attends meetings of the Commission for Occupational Safety and Health. The Commission consists of representatives from employers, employees, government and people with expertise and knowledge in occupational safety and health (OSH) matters. WorkCover WA provides ongoing support to the Commission’s objectives in the form of statistical data about work-related injury and disease.
Healthier Workplace WAWorkCover WA has continued to work with Healthier Workplace WA (HWWA) to help promote better employee health through decreases in smoking and alcohol intake and increases in physical activity and healthy eating. WorkCover WA is a long standing member of the Advisory Group which provides ideas, feedback and support to HWWA to disseminate information about the program. HWWA had an exhibition booth at WorkCover WA’s 2017 Return to Work Conference.
During 2016/17, WorkCover WA received Bronze accreditation from HWWA acknowledging the Agency’s strong focus on providing a healthy workplace for its employees.
WorkSafe WAIn 2016/17, WorkSafe WA assisted WorkCover WA by distributing copies of the fact sheet Workers’ Compensation Essentials for Employers to 1,800 employers across the State. This is a new initiative and a dedicated 1300 number was included on the fact sheet. Since March 2017, WorkCover WA has received 13 calls directly attributable to the initiative, with the number of callers steadily increasing each month.
Discussions with WorkSafe WA have also confirmed referrals from WorkCover WA regarding potentially high risk employers are extremely useful as they:
• provide insight into types of injuries
• provide context for employers ‘on watch’ by WorkSafe WA
• inform WorkSafe WA whether employers report injuries required under the OSH Act
• inform targeted projects.
Inter Insurer Injury Management ForumThe Inter Insurer Injury Management Forum consists of injury management advisers from approved insurers, the Insurance Commission of WA, LGIS, and representatives of allied health providers.
WorkCover WA participated in three meetings of the forum in 2016/17 to share experiences and discuss potential areas for scheme-wide improvement initiatives in injury management.
Australian Rehabilitation Providers Association WAIn its commitment to influencing best practice within workplace rehabilitation service provision, WorkCover WA supports the Australian Rehabilitation Providers Association (ARPA) WA through the sponsorship of its annual ARPA WA Excellence in Workplace Rehabilitation Awards. WorkCover WA provided gold sponsorship of the 2017 event and presented awards in multiple categories on the night.
66
Opportunities and challenges
Disclosures and legal compliance
Key performance indicators
Financial statements and notes
GGG ChecklistIntroduction Agency in focus Scheme performance
Report on operations

Section 4: Opportunities and challenges68 Opportunity and accessibility70 Equality and inclusion71 Safety, health and wellbeing72 Agency challenges74 Information technology initiatives
67
Disclosures and legal compliance
Key performance indicators
Financial statements and notes
GGG ChecklistIntroduction Agency in focus Scheme performance
Report on operations
Opportunities and challenges

The following initiatives are aligned with, and contribute to, WorkCover WA strategic goal:
3 - Agile and innovative organisation
Opportunity and accessibilityWorkforce development
Employee capabilityWorkCover WA invests in building the capability of staff. Professional development strategies are identified through the Performance Development Agreement (PDA) process. Refer to page 69 for more details on the PDA process.
Blended Learning ProgramWorkCover WA’s ‘blended learning’ approach to staff development aims to build the competency of staff through learning plans that are specific and tailored to the individual. The approach is based on a philosophy that a balance of differing options including on-the-job learning, learning from other staff and structured formal programs is the most effective method to build staff skills and competency.
Following the success of the 2015/16 blended learning trial for Level 1–3 staff, the strategy was continued in 2016/17 through the establishment of individual development plans for these staff as part of their bi-annual PDA. The strategy was also rolled out to all other staff during the August 2016 PDA process.
In 2016/17, the blended learning strategy was enhanced through the Agency’s acquisition of Lynda.com access for all staff. Lynda.com is an online learning platform that allows staff to access a library of learning and development resources at their own workstations during working hours. Lynda.com will replace many of the traditional training accessed by staff and provides a ‘learn-as the need-arises’ approach to staff learning.
During 2017/18 WorkCover WA will undertake an evaluation of the use of this online learning approach.
Staff training In 2016/17, many WorkCover WA staff attended professional development programs. The programs covered areas including:
• performance management
• systems programming
• executive writing and policy development
• skills development in the use of information technology (IT) products.
During the year staff also attended in-house programs on:
• records management
• dealing with difficult clients
• occupational safety and health (OSH) and first aid training
• project management
• customer service.
In 2016/17 there were:
• 1,492 training hours in total
• 10.5 training hours per employee.
Advice and Assistance Offi cer Sh
ane War
d co
mpl
etin
g a
training course
using Ly
nda.
com
.
68
Disclosures and legal compliance
Key performance indicators
Financial statements and notes
GGG ChecklistIntroduction Agency in focus Scheme performance
Report on operations
Opportunities and challenges
Employee development
Performance Development Agreement processWorkCover WA’s employee development process is facilitated through its PDA system. Through the PDA process all staff participate in two formal meetings with their supervisor each year to discuss performance, provide feedback, and develop action plans to improve performance and/or capability.
During 2016/17, particular focus was given to the development and review of individual development plans for staff. This focus included assisting managers and supervisors to progress the implementation of staff development plans.
Attraction and retention Graduate ProgramIn 2016, WorkCover WA adopted an alternative approach to its Graduate Program. Previously, the Program was structured around graduates undertaking a series of rotational placements in each of the Agency’s divisions. In 2016/17, graduates were selected to perform dedicated roles within the Agency.
Two graduates commenced on 11 January 2017 to undertake dedicated roles in their areas of expertise – Human Resources Management, and Communications and Education. In addition to the core responsibilities of their positions, the graduates participated in the Graduate Development Program sponsored by the Public Sector Commission.
Innovative recruitmentThe Innovative Recruitment Strategy reviewed current WorkCover WA attraction, selection and assessment practices to identify improvements and enhance talent attraction and retention.
The strategy also seeks to ensure a contemporary and compliant approach is adopted in recruitment and selection process.
Through the project, WorkCover WA has developed a range of new or revised recruitment, selection and assessment strategies to be used in the filling of vacancies. These include the:
• use of alternate advertising mediums
• adoption of more contemporary assessment techniques
• redesign of the Agency’s careers website page.
The revised recruitment, selection and assessment methods will be implemented in 2017/18. Once revised strategies are adopted to fill WorkCover WA vacancies, the effectiveness of the strategies will be evaluated.
Careers pageIn early 2017, WorkCover WA’s graduates commenced a project to improve the usability and appearance of the careers page on the WorkCover WA website.
The project developed a careers page that is easy to navigate and attractive to applicants seeking employment within the Agency.
The outputs of the project were:
• a dynamic, interactive and informative careers webpage
• an educative source of information for prospective jobseekers about the benefits of working for WorkCover WA
• the use of current staff career profiles to provide applicants with an idea of the work undertaken by WorkCover WA staff.
The enhanced careers page will be launched early in 2017/18. Evaluations of its impact will be conducted thereafter.
WorkCover WA Graduates Ameera Brandis and Ta
yla To
utou
ntzis
.
69
Disclosures and legal compliance
Key performance indicators
Financial statements and notes
GGG ChecklistIntroduction Agency in focus Scheme performance
Report on operations
Opportunities and challenges

The following initiatives all fall under the banner of the Equal Opportunity Management Plan (which forms part of our Strategic Workforce Plan). All initiatives are aligned with, and contribute to, WorkCover WA strategic goal:
3 - Agile and innovative organisation
Equality and inclusion
Disability Access and Inclusion PlanThrough the implementation of its Disability Access and Inclusion Plan (the Plan), WorkCover WA recognises and commits to the inclusion of people with disability (both internal and external to the Agency) by ensuring they have appropriate access to our facilities and services.
WorkCover WA’s Equity and Diversity Committee meets quarterly and is responsible for delivery of the initiatives included in the Plan.
During the year WorkCover WA utilised the website, intranet and internal ‘lunch and learn’ sessions to promote the commitment contained within the Plan to people with disability, internal staff and external contractors.
Specific initiatives arising from the Plan in 2016/17 include:
• a ‘lunch and learn’ session held on International Day for Persons with Disability
• a Mental Health Action Plan which was developed to raise awareness of mental health issues
• the expanded procurement of goods and services from businesses operated by persons with disability
• a review of WorkCover WA’s complaints and customer feedback process (Customer First) to ensure it complies with provisions for vision and hearing impaired clients, and people with disability can adequately access the system.
Following a public comment period, a new Disability Access and Inclusion Plan for the period 2017–2022 was approved by the Disability Services Commission during 2016/17.
Coordinator Workforce Development M
elanie D
eagu
e.
Reconciliation Action PlanWorkCover WA has a Reconciliation Action Plan to raise awareness about the culture and values of Aboriginal and Torres Strait Islander Australians.
All intended Reconciliation Action Plan initiatives were completed in 2016/17, including:
• providing all staff with a copy of the Reconciliation Action Plan
• regular monitoring of the planned actions by the Equity and Diversity Committee
• promoting NAIDOC week through publishing current and historical information
• engaging with Aboriginal and Torres Strait Islander businesses on procurement of goods and services
• increasing employee understanding of protocols involving Acknowledgement of Country and Welcome to Country ceremonies.
70
Disclosures and legal compliance
Key performance indicators
Financial statements and notes
GGG ChecklistIntroduction Agency in focus Scheme performance
Report on operations
Opportunities and challenges

The following initiatives are aligned with, and contribute to, WorkCover WA strategic goal:
3 - Agile and innovative organisation
Safety, health and wellbeing
Occupational Safety and Health Management PlanThe OSH Management Plan 2016–18 (the Plan)ensures a systematic and consistent approach is adopted towards OSH management and allows WorkCover WA greater transparency and accountability in its management of OSH.
The OSH Management Plan ensures our documented OSH requirements, management processes, and other activities contribute to improving and maintaining proactive OSH outcomes. The content of the OSH Management Plan reflects the requirements of the OSH Act 1984, the OSH Regulations 1996, the Public Sector Occupational Safety and Health Code of Practice 2007 and the WorkSafe Plan 2014.
OSH policies and practices are communicated to staff through an online induction program and on the intranet. Online OSH training is a requirement for all employees and managers. WorkCover WA’s current OSH policies and procedures are available to stakeholders through the OSH manual and on the WorkCover WA website.
The next audit of the Plan against the WorkSafe Plan assessment tool is scheduled for 2018.
WorkCover WA Trainee Lauren Gillbanks.
Traineeship programPrimarily targeted at youth under the age of 25, WorkCover WA’s traineeship program also emphasises engagement with young Aboriginal and Torres Strait Islander Australians.
Trainees are supported in completing a Certificate III in Government while undertaking a range of work placements across the Agency. This arrangement provides trainees with skills and experience to enable them to be ‘job ready’ and skilled for future employment opportunities.
During 2016/17, WorkCover WA engaged two trainees. One of these trainees successfully completed the program and the other is expected to complete the program later in 2017.
71
Disclosures and legal compliance
Key performance indicators
Financial statements and notes
GGG ChecklistIntroduction Agency in focus Scheme performance
Report on operations
Opportunities and challenges

Health and wellnessWorkCover WA supports and contributes to the health and wellbeing of its employees by offering a Health and Wellness Program (the Program).
In 2016/17, the Program offered a range of wellness initiatives to staff including:
• Healthy Heart Checks
• skin cancer screening
• flu vaccination
• free on-site gym
• ‘lunch and learn’ sessions on topics such as superannuation, transition to retirement, salary sacrificing, and mental health and wellbeing.
A health and wellness survey was conducted in 2016/17 to seek staff feedback on current initiatives and new ideas WorkCover WA can offer as part of the Health and Wellness Program.
Survey results concluded that:
• 90 percent of staff are motivated to participate in initiatives to improve their overall health
• the majority of respondents cited a lack of time as the reason for not being more physically active
• there was considerable interest in strategies to reduce sedentary work practices, such as sit-stand stations
• there is interest in group fitness programs, including being notified of free fitness activities available in Perth
• 90 percent of respondents believe it would be beneficial for managers to have an understanding of mental health in the workplace.
In response to survey findings, a number of strategies to assist staff in improving their general health and wellbeing are being adopted by the Agency including:
• establishment of health and wellness champions
• promotion of free or low cost health and wellness activities in Perth
• delivery of a range of ‘lunch and learn’ sessions on topics of interest to staff
• provision of mental health first aid training for managers.
Agency challenges Strategic management of the schemeWorkCover WA acknowledges a number of current and future technological, demographical, and economic challenges to the workers’ compensation and injury management scheme (the scheme) that are being managed on a strategic level.
Refer to ‘Strategic planning’ on page 18 in Section 1: Agency in focus for a description of the WorkCover WA 2015–2018 Strategic Plan, and details of the Strategic Initiatives which aim to proactively and strategically address scheme challenges on a short and long term basis.
72
Disclosures and legal compliance
Key performance indicators
Financial statements and notes
GGG ChecklistIntroduction Agency in focus Scheme performance
Report on operations
Opportunities and challenges

Electronic Document and Records Management SystemWorkCover WA implemented an Electronic Document and Records Management Systems (EDRMS) in 2014/15. Since then, WorkCover WA has continued making steady improvements in recordkeeping practices, focusing on increasing staff adoption of the EDRMS system.
In August 2016, the Agency commenced an education program to help staff gain a greater understanding of the various functions within the EDRMS. Staff were taught the importance of saving documents and naming them correctly in order to help other staff find information quickly and easily.
The education program received positive feedback from staff and has resulted in seamless collaboration and information sharing across the Agency.
TRIM upgradeAn upgrade of the EDRMS was completed in 2016/17. The upgrade introduced a fresh, visual style and additional features such as:
• improved and simplified user interface
• easier access to, and new methods of, searching
• advanced workflow module capability which is available for future use.
The new version is expected to improve usability and increase staff adoption of the system.
Review of Risk Management FrameworkIn accordance with the Public Sector Commissioner’s (PSC) Circular 2015-03 and Treasurer’s Instruction 825, all public sector bodies must practise risk management, regularly undertake a structured risk assessment process to identify the risks facing the organisation, be able to demonstrate the management of risks, and where appropriate, have business continuity plans to ensure they can respond to and recover from any business disruption.
In 2016/17, the Agency has continued to build on its risk management advancements by:
• continuing to refine its Enterprise Risk Management Framework by incorporating Risk Strategy and Appetite Statements and setting Key Risk Tolerance levels to guide risk monitoring and reporting. Development of these Risk Strategy and Appetite Statements further prompted a review and refinement of risk descriptions to better define risks
• regular review of strategic and operational risks to ensure full consideration is given to high level strategic risks associated with long-term organisational objectives and operational controls which address Agency threats or opportunities on a day to day business level
• developing a project management system which incorporates the management of project risks
• reviewing and updating our Enterprise Risk Management Framework Guide to capture ongoing improvements and ensure ongoing compliance with the Australian Standard for Risk Management (AS/NZS ISO 31000: 2009) and Western Australian Government requirements
• ensuring relevant ongoing management oversight by the Corporate Executive through regular meetings of the Risk Management Review Group
• bi-annual reporting of strategic and significant operational risks to the Agency’s Audit and Risk Management Committee and the Board.
Review of corporate policies and proceduresThe good governance policies relating to the Code of Conduct, Gifts, Benefits and Hospitality, and all Board governance policies were reviewed to ensure they reflect contemporary practices.
73
Disclosures and legal compliance
Key performance indicators
Financial statements and notes
GGG ChecklistIntroduction Agency in focus Scheme performance
Report on operations
Opportunities and challenges

Information technology initiativesIT Strategic Plan 2016–2021The IT Strategic Plan 2016−2020 was implemented in May 2016. A further review of the IT Plan was undertaken in October 2016 to more closely align the plan to the Agency’s annual planning and budgeting cycle.
The revised IT Plan 2016−2021 incorporates greater planning and design analysis for all IT projects. The revised plan features increased business involvement to ensure innovation and organisational change projects are delivered more effectively and continue to align with the overarching Digital First Program.
For more information on the Digital First Program see ‘Initiative 4: Digital First Program’ on page 21.
IT projectsDatabase server upgrades The purpose of this project was to upgrade WorkCover WA’s database servers.
Whilst the previous database was supported until September 2019 and did not pose any immediate risks to WorkCover WA, upgrading to the latest version enabled WorkCover WA to take advantage of new features and improved functionality, and ensured the Agency did so whilst vendor product support remained.
The upgrade was completed successfully.
Insurer Online Services In 2015/16, WorkCover WA commenced implementation of an online services platform which supports a comprehensive online service delivery model consistent with the Agency’s Digital First Program.
The new Insurer Online Services platform delivers improved services for insurers.
During 2016/17, this project involved:
• a review and redesign of WorkCover WA business processes and online services for insurers and approved audiometric officers (noise induced hearing loss)
• development of new functionality to replace legacy systems
• improvements to WorkCover WA’s core Scheme Information Management System.
These projects were completed successfully.
IT Disaster Recovery reviewWorkCover WA reviewed its existing IT Disaster Recovery plans and supporting systems to ensure their alignment with critical business activities and to recommend improvements. The project also considered the whole of government policy direction related to IT Disaster Recovery from the Office of the Government Chief Information Officer.
The recommendations from the review will guide WorkCover WA in the development of an IT Disaster Recovery strategy that supports efficient and effective business recovery in the event of a disaster. Approved recommendations will be implemented in future financial years.
Dennis Reincastle, Maggie White and Kim
Tiba
from
the
Information Technology branch.
74
Disclosures and legal compliance
Key performance indicators
Financial statements and notes
GGG ChecklistIntroduction Agency in focus Scheme performance
Report on operations
Opportunities and challenges

Section 5: Disclosures and legal compliance76 Report on funds management78 Other financial disclosures83 Ministerial directives83 Governance disclosures88 Legal compliance90 Government policy requirements
75
Key performance indicators
Financial statements and notes
GGG ChecklistIntroduction Agency in focus Scheme performance
Report on operations
Opportunities and challenges
Disclosures and legal compliance

Report on funds managementWorkers’ Compensation and Injury Management Trust AccountThe Workers’ Compensation and Injury Management Trust Account is maintained in accordance with section 110 of the Workers’ Compensation and Injury Management Act 1981 (the Act). WorkCover WA seeks to optimise returns and security of funds invested for the benefit of the dependants of deceased workers.
Section 218 of the Act empowers an Arbitrator to order compensation to be paid in trust to WorkCover WA when it cannot immediately be paid to a person under a legal disability or the dependants of a deceased worker. These funds are invested in accordance with Treasurer’s guidelines.
Investment strategies employed provided an average yield for the 2016/17 year of 2.21 percent for all trust accounts.
Uninsured claims managementWorkCover WA manages specific funds to provide a source of compensation for injured workers of uninsured employers. Funds paid to workers from the General Account are recovered from uninsured employers by WorkCover WA.
Compliance checks establish an employer’s insurance status to ensure monies released from the General Account are in accordance with the provisions of the Act. This year 35 potential claims on the General Account were investigated compared with 31 last year.
There were two new accepted uninsured claims this financial year on which payments were made from the General Account and 25 continuing claims from previous financial years. The net cost of new claims was $181,490 and ongoing claims net costs amounted to $1,683,332.
At 30 June 2017, the total outstanding debt from uninsured employers was approximately $1,864,823. Recovery action against these employers is ongoing.
Employers’ Indemnity Supplementation FundThe Employers’ Indemnity Supplementation Fund was established under the provisions of the Employers’ Indemnity Supplementation Fund Act 1980 and exists to guard against the collapse of an insurer.
The Employers’ Indemnity Supplementation Fund also pays claims under the Waterfront Workers’ (Compensation for Asbestos Related Disease) Act 1986 and the Workers’ Compensation and Injury Management (Acts of Terrorism) Act 2001 (Acts of Terrorism Act).
Payments for claims under the Waterfront Workers’ (Compensation for Asbestos Related Disease) Act 1986 for 2016/17 were nil. Since its inception (February 1987), a total of $2,800,507 has been paid.
Payments for claims under the Acts of Terrorism Act for 2016/17 were nil.
Table 5: Claim payments and receipts for Supplementation Fund for 2016/17
Item HIH Insurance
($)
Non-HIH Insurance
($)
Value of outstanding claims in Western Australia
464,665 68,992
Received from liquidators in 2016/17
119,989 Nil
Claim payments for 2016/17
1,252,100 37,587
76
Key performance indicators
Financial statements and notes
GGG ChecklistIntroduction Agency in focus Scheme performance
Report on operations
Opportunities and challenges
Disclosures and legal compliance

Debts and investmentsAt 30 June 2017, there were 79 outstanding debtors resulting from fines and penalties awarded under the Act, with debts outstanding of $569,643.75. In 2016/17, the weighted average rate of return on General Account investments was 2.73 percent.
Table 6: Actual results vs budget results
Item 2016/17 Target
$000
2016/17 Actual
$000
Variation $000
Total Revenue (sourced from Statement of Comprehensive Income)
24,095 23,247 848a
Total Expenses (sourced from Statement of Comprehensive Income)
24,841 22,291 2,550b
Total Equity (sourced from Statement of Financial Position)
94,873 102,660 (7,787)c
Net decrease in cash held (sourced from Statement of Cash Flows)
592 4,637 (4,045)d
Approved full-time equivalent (FTE) staff level
137 130 7
Further explanations are also contained in Note 35 ‘Explanatory statement’ to the financial statements.
a. Total Revenue variance is primarily due to lower than expected interest rates on the Supplementation Fund monies invested with Treasury.
b. The Expenses variance is mainly due to lower than expected professional services fees and employee benefit expenses.
c. Total Equity variation is largely due to a decrease in the valuation of land and buildings, a reduction in liabilities for the Supplementation Fund and the General Fund and a reduction in the reserves.
d. This variance is due to lower than expected cash recoveries received from the liquidator of HIH Insurance and a lower than expected cash surplus from operational savings.
WorkCover WA Registration Offi cer Kasia Lesiak.
77
Key performance indicators
Financial statements and notes
GGG ChecklistIntroduction Agency in focus Scheme performance
Report on operations
Opportunities and challenges
Disclosures and legal compliance

Other financial disclosuresEmployment and industrial relationsEmployees at WorkCover WA are employed under the provisions of the Public Service Award 1992 and the Public Service and Government Officers General Agreement 2014.
WorkCover WA’s staffing establishment at 30 June 2017 compared with previous years is listed in the table below.
Table 7: WorkCover WA FTE status
Employment type 2014 2015 2016 2017
Full-time permanent 109 112 105 98
Full-time contract 14 10 11 15
Part-time measured on an FTE basis 11.2 11.2 16.84 17.28
Total 134.2 134.2 132.84 130.28
Staff on secondment 5 5 2 4
Staff on traineeship 2 2 1 1
Staff in Graduate Program 0 0 1 2
Internal workers’ compensation claimsThere were no workers’ compensation claims made by WorkCover WA staff in 2016/17.
78
Key performance indicators
Financial statements and notes
GGG ChecklistIntroduction Agency in focus Scheme performance
Report on operations
Opportunities and challenges
Disclosures and legal compliance

Board remunerationIn accordance with the Act, the Chairman and Board members are paid such fees and allowances as may be fixed by the Minister on the recommendation of the Minister for Public Sector Management. In accordance with government policy, Board members who are public service officers are not entitled to payment.
Table 8: WorkCover WA Board remuneration
Position Name Type of remuneration
Period of membership
Gross/actual remuneration
(including superannuation)
Chairman Greg Joyce Board payment 01/07/16 to 30/06/17 $34,091
Member Michelle Reynolds N/A - Public Service Virtue of office Nil
Member Anne Driscoll N/A - Public Service Virtue of office Nil
Member Steven Burns Board payment 01/07/16 to 30/06/17 $17,821
Member Warren Edwardes Board payment 01/07/16 to 30/06/17 $17,821
Member Owen Whittle Board payment 01/07/16 to 30/06/17 $17,821
Member Victoria Wilmot Board payment 01/07/16 to 30/06/17 $17,821
Member Chris White N/A - Public Service Virtue of office Nil
TOTAL $105,375
Directors’ and officers’ liability insuranceDirectors’ and officers’ liability insurance covers the personal liability for damages and defence costs of insured persons in the event action is taken against them for a breach of duty. WorkCover WA holds a directors’ and officers’ liability insurance policy covering the members of the former Workers’ Compensation and Rehabilitation Commission and WorkCover WA Board members. The policy is placed through the State Government’s insurer and is renewed annually. The limit of liability on the policy is $20 million, which is in line with the accepted industry standard.
79
Key performance indicators
Financial statements and notes
GGG ChecklistIntroduction Agency in focus Scheme performance
Report on operations
Opportunities and challenges
Disclosures and legal compliance

Committee remunerationAudit and Risk Management CommitteeAs members of the Audit and Risk Management Committee are either members of the Board or employed in the public sector, no remuneration is paid to members.
Costs CommitteeAs the Costs Committee did not meet in 2016/17, no remuneration was paid to members.
Medical Committee
Table 9: Medical Committee remuneration
Position Name Schedule Period of membership
Gross/actual remuneration
Chair Michelle Reynolds
N/A - Public Service
01/07/16 to 30/06/17
Nil
Member Dr Marcus Adonis
Per attendance at meetings
01/07/16 to 30/06/17
$389
Member Dr Alan Home
Per attendance at meetings
01/07/16 to 30/06/17
$389
Member Dr Neil Ozanne
Per attendance at meetings
01/07/16 to 30/06/17
Nil
Member Mr David Colvin
N/A* 01/07/16 to 30/06/17
Nil
Member Mr Paul Taylor
Per attendance at meetings
01/07/16 to 30/06⁄17
Nil
TOTAL $778
* Some members have requested not to receive remuneration for the Medical Committee.
Capital works projectsWorkCover WA’s expenditure on capital works for 2016/17 is outlined in the table below.
Table 10: 2016/17 Expenditures
Capital works projects Total spent $000’
YTD $000’
Insurer Online Services project 454 454
SQL upgrade project 20 20
Electronic Document and Records Management System (EDRMS) upgrade
69 69
Other equipment 83 83
AdvertisingTable 11: 2016/17 Advertising expenditure
Type Organisation 2016/17 Expenditure ($)
Advertising agencies AdCorp Australia Ltd 1,875
Direct mail organisations
Quickmail Campaign Monitor
4,635 510
Market research organisations
Nil
Media advertising organisations
Careerhub Pty Ltd Carat Australia Media Services Pty Ltd CareerOne Pty Ltd
1805,037
198
Polling organisations Nil
TOTAL 12,435
80
Key performance indicators
Financial statements and notes
GGG ChecklistIntroduction Agency in focus Scheme performance
Report on operations
Opportunities and challenges
Disclosures and legal compliance

Annual estimatesIn accordance with Treasurer’s Instruction 953, statutory authorities not operating as divisions of the Consolidated Account are required to include annual estimates for the current financial year in the annual report of the preceding year. The following estimates have been submitted and approved by the Minister for Commerce and Industrial Relations for 2017/18.
Table 12: Statement of Comprehensive Income
2017 $000
2018 $000
INCOME Revenue
Insurer contributions 19,945 19,883
Interest revenue 2,839 2,411
Other revenue 1,311 2,878
Employers’ Indemnity Supplementation Fund - -
Total Revenue 24,095 25,172
Gains
Decrease in claims liability - -
Total Gains - -
Total Income 24,095 25,172
EXPENSES Expenses
Employee benefits expense 15,634 16,691
Supplies and services 3,799 3,200
Depreciation and amortisation expense 1,093 1,042
Accommodation expenses 430 557
Grants and subsidies - 50
Claims expense 2,364 1,788
Loss on disposal of non-current assets - -
Other expenses 1,521 1,734
Total Expenses 24,841 25,062
Profit/(Loss) before grants and subsidies from State Government (746) 110
Services received free of charge 215 170
Profit/(Loss) for the period (531) 280
81
Key performance indicators
Financial statements and notes
GGG ChecklistIntroduction Agency in focus Scheme performance
Report on operations
Opportunities and challenges
Disclosures and legal compliance

Table 13: Statement of Financial Position
2017 $000
2018 $000
ASSETS Current Assets
Cash and cash equivalents 7,454 3,185
Restricted cash and cash equivalents 84,079 85,615
Receivables 1,120 1,097
Other financial assets 13,358 18,999
Total Current Assets 106,011 108,896
Non-Current Assets
Property, plant, equipment & vehicles 21,392 19,624
Intangible assets 2,181 2,134
Total Non-Current Assets 23,573 21,758
Total Assets 129,584 130,654
LIABILITIES
Current Liabilities
Payables 2,244 2,675
Provisions 5,009 4,533
Total Current Liabilities 7,253 7,208
Non-Current Liabilities
Provisions 27,458 23,965
Total Non-Current Liabilities 27,458 23,965
Total Liabilities 34,711 31,173
NET ASSETS 94,873 99,481
EQUITY Reserves
17,500
16,190
Retained earnings 77,373 83,291
Total Equity 94,873 99,481
Table 14: Statement of Cash Flows
2017 $000
2018 $000
CASH FLOWS FROM OPERATING ACTIVITIES Receipts
Supplementation Fund receipts - -
Insurer contributions 19,946 19,883
Provision of services 38 14
Interest received 2,829 2,411
GST receipts on sales - -
GST receipts from taxation authority - -
Other receipts 936 1,511
Payments Workers’ Compensation claim payments
(2,364)
(1,788)
Employee benefits (15,924) (15,861)
Supplies and services (3,518) (3,200)
Accommodation (430) (617)
Grants and subsidies - (50)
GST payments on purchases - -
Other payments (1,440) (2,156)
Net cash provided by operating activities 73 147
CASH FLOWS FROM INVESTING ACTIVITIES Receipts
Proceeds from sale of non-current physical assets - -
Payments
Purchase of non-current physical assets (665) (676)
Purchase of investments - -
Net cash used in investing activities (665) (676)
Net increase in cash and cash equivalents (592) (529)
Cash and cash equivalents at the beginning of the period 92,125 91,533
Cash and cash equivalent at the end of the period 91,533 91,004
82
Key performance indicators
Financial statements and notes
GGG ChecklistIntroduction Agency in focus Scheme performance
Report on operations
Opportunities and challenges
Disclosures and legal compliance

Ministerial directives No Ministerial directives were received during the financial year.
Governance disclosuresBoard policiesThe Agency has a Board Charter and Evaluation Framework, Code of Conduct, meeting procedures and governance policies to guide the actions of the Board and ensure statutory responsibilities are met.
Board responsibilitiesWorkCover WA’s corporate governance arrangements ensure transparency in decision making and operation, as well as accountability to stakeholders, by promoting strong leadership, sound management, and effective planning and review.
WorkCover WA aims to achieve high standards in corporate governance to assure the State Government, stakeholders and the community, that it is complying with statutory responsibilities and meeting expectations with due diligence and accountability.
The Board’s governance responsibilities include:
• setting the Agency’s strategic direction
• establishing goals for WorkCover WA and monitoring achievement against those goals to optimise the Agency’s performance
• ensuring compliance with statutory requirements
• approving Corporate Executive recommendations
• making recommendations to the Minister (where appropriate)
• giving effect to Ministerial directives
• managing strategic risk.
Following the comprehensive review and successful Internal Audit gap analysis of the Board’s governance policies, procedures and evaluation frameworks in 2015/16, WorkCover WA continued to maintain high standards in 2016/17, including the provision of guidance to other comparable sized Agencies, through peer review, to assist implementation of similar governance arrangements.
Conflicts of interestIn accordance with Treasurer’s Instruction 903 (14)(iii), senior officers and members of the WorkCover WA Board declared any potential conflict of interest held in existing or proposed contracts with WorkCover WA.
Unauthorised use of credit cardsOfficers of WorkCover WA hold corporate credit cards where their functions warrant usage of this facility. Despite each cardholder being reminded of their
obligations annually under the WorkCover WA credit card policy, one employee inadvertently utilised the corporate credit card to purchase a personal item from Night and Day Pharmacy. The matter was not referred for disciplinary action as the Chief Finance Officer noted prompt advice and settlement of the personal use amount and the nature of the expenditure was immaterial and characteristic of an honest mistake.
Table 15: Unauthorised use of credit cards 2017
Personal use expenditure for the reporting period
$9
Personal use expenditure settled by the due date (within 5 working days)
-
Personal use expenditure settled after the period (after 5 working days)
$9
Personal use expenditure outstanding at balance date
-
CEO Performance Agreement The Chief Executive Officer (CEO) and Agency’s performance are monitored by the WorkCover WA Board and the Minister for Commerce and Industrial Relations. In 2016/17, the Public Sector Commissioner varied the CEO performance monitoring process due to the scheduled State Election with formal performance agreements not required. A short report on Agency outcomes for 2016/17 was provided to the Public Sector Commission (PSC).
83
Key performance indicators
Financial statements and notes
GGG ChecklistIntroduction Agency in focus Scheme performance
Report on operations
Opportunities and challenges
Disclosures and legal compliance

Review against the PSC Good Governance GuideTo ensure ongoing good governance performance, WorkCover WA conducted an annual review of its performance against the PSC’s Good Governance Guide (GGG) for public sector agencies and performance of the WorkCover WA Board in accordance with the PSC Board Essentials – Good Governance Guide for Public Sector Boards and Committees.
This ongoing assessment of the Agency’s performance against the operational elements of the nine principles of the GGG and the seven principles of Board governance is aimed at identifying any variances to the required standards and ensures performance is maintained at the previously established exemplary levels.
In March 2017, WorkCover WA was awarded the PSC Award for Good Governance at the Institute of Public Administration’s W.S. Lonnie Awards which recognise excellence in annual reporting.
The Judges commented that the report demonstrated excellence in reporting of governance processes, showing clear links between operations and governance activities as well as highlighting the Agency’s connection to legislation and strong client focus. The report provided relevant information in a straightforward and engaging manner.
Applying Good GovernanceThe following checklist references the sections within this report that highlight how WorkCover WA applies the nine principles of the GGG in practice and complies with relevant requirements.
Good Governance Guide Checklist
Government and public sector relationship
2.1
2.2
2.32.4
2.5
2.6
11.1
1.2
1.3
Management and oversight2
• Enabling legislation (p. 22)• CEO Performance Agreement (p. 83)
• Communications Protocol (p. 28)• Board Governance Policy:
Official Communication (p. 28)
• Ministerial correspondence (p. 28)• Section 5: Disclosures and legal
compliance (p. 75)
• WorkCover WA Board (p. 14)• Senior officers (p. 16)
• Delegation of authority (p. 23)• Workplace consultation (p. 24)• Governance disclosures (p. 83)
• Strategic planning (p. 18)
• Outlook for the future (p. 21)• Performance Management
Framework (p. 30)• Section 3: Report on operations (p. 39)
• Organisational structure (p. 12)• Delegation of authority (p. 23)
• Outlook for the future (p. 21)• Section 6: Key Performance
Indicators (p. 91)
Organisational structure
4.14.2
4.3
4.4
4.5
4.6
33.1
3.2
3.3
Operations4
• Section 5: Disclosures and legal compliance (p. 75)
• Divisions (p. 12)• Workforce development (p. 68)
• Year scorecard (p. 8)• Section 6: Key Performance
Indicators (p. 91)
• Enabling legislation (p. 22)
• Section 3: Report on operations (p. 39)• Agency challenges (p. 72)
• Website (p. 58)• Electronic Document and Records
Management System (p. 73)• Information technology initiatives (p. 74)
• Report against 2016/17 Strategic Initiatives (p. 19)
• Section 3: Report on operations (p. 39)• Section 6: Key Performance Indicators (p. 91)
• Section 2: Scheme performance (p. 33)• Section 6: Key Performance Indicators (p. 91)
• Audit and Risk Management Committee (p. 86)
• Section 6: Key Performance Indicators (p. 91)• Independent audit opinion (p. 109)
84
Key performance indicators
Financial statements and notesIntroduction Agency in focus Scheme
performanceReport on operations
Opportunities and challenges
GGG ChecklistDisclosures and legal compliance

Ethics and integrity55.1
5.2
5.3
• Our values (p. 4)• Legal compliance (p. 88)
• Legal compliance (p. 88)• Notes to the financial statements (p. 113)
• WorkCover WA Code of Conduct (p. 88)
• Public Interest Disclosure (p. 28)• Performance Development
Agreement process (p. 69)
• Workplace consultation (p. 24)• Performance Development
Agreement process (p. 69)
5.4
5.5
People6
6.16.2
6.3
• Attraction and retention (p. 69)
• Equality and inclusion (p. 70)• Legal compliance (p. 88)
• Workforce development (p. 68)• Equality and inclusion (p. 70)
• Performance Development Agreement process (p. 69)
• Workplace consultation (p. 24)• Performance Development
Agreement process (p. 69)
6.4
6.5
Finance77.1
7.2
7.3
• Year in dollars (p. 8)• Report on funds management (p. 76)
• Risk Management Review Group (p. 26)• Risk management policies (p. 29)• Audit and Risk Management
Committee (p. 86)
• Section 7: Financial statements and notes (p. 107)
• Section 7: Financial statements and notes (p. 107)
• Section 6: Key Performance Indicators (p. 91)
• Section 7: Financial statements and notes (p. 107)
7.4
7.5
Communication8
8.1
8.28.3
• Complaints handling (p. 26)• Communications policies (p. 28)
• Communications policies (p. 28)
• Complaints handling (p. 26)• Communications policies (p. 28)
• Communications policies (p. 28)• Recordkeeping Plan (p. 88)
• Complaints handling (p. 26)• Communications policies (p. 28)
8.4
8.5
Risk management99.19.29.3
• Risk management policies (p. 29)
• Risk management policies (p. 29)
• Risk Management Review Group (p. 26)• Risk management policies (p. 29)
• Risk management policies (p. 29)• Audit and Risk Management
Committee (p. 86)
9.4
85
Key performance indicators
Financial statements and notesIntroduction Agency in focus Scheme
performanceReport on operations
Opportunities and challenges
GGG ChecklistDisclosures and legal compliance

CommitteesAudit and Risk Management Committee The Audit and Risk Management Committee provides independent assurance and assistance to the Board on WorkCover WA’s risk, control and compliance framework and its external accountability responsibilities.
The Committee:
• ensures the Agency has in place an enterprise-wide risk management framework, reviews the risk profile and measures in place to manage significant risks and uncertainties, and advises the Board of significant or emerging risks
• reviews strategic and annual internal audit plans, monitors the progress of audit recommendations, and provides stewardship by promoting discussion with internal and external auditors to ensure effective systems and policies are in place.
To enhance its effectiveness and assist with succession planning outcomes from the 2015 Board Governance review, an additional independent non-Board member has been appointed to the Audit and Risk Management Committee.
Consistent with the primary functions of the Committee and the heightened focus on risk management, the name of the Audit Committee has been changed to the Audit and Risk Management Committee. At least one member of the Audit and Risk Management Committee is required to have risk management knowledge and experience.
In 2016/17, WorkCover WA conducted 10 internal audits and two external audits.
The 10 internal audits identified 17 low level findings and nine performance improvement opportunities. All findings have been reported to the Audit and Risk Management Committee and action has either been completed by management or is being progressed within agreed completion timeframes. No findings were identified in the two external audits.
Costs CommitteeThe Costs Committee is empowered under section 271 of the Act to make, amend or revoke a determination fixing maximum costs for legal services and registered agent services provided in WorkCover WA’s Conciliation and Arbitration Services.
The Costs Committee amended the Costs Determination with the Workers’ Compensation (Legal Practitioners and Registered Agents) Costs Determination 2015 which came into effect on 1 July 2015. There was no requirement for the Committee to meet in 2016/17.
Medical CommitteeThe Medical Committee provides guidance on matters of a medical nature within the Western Australian (WA) workers’ compensation and injury management scheme (the scheme) and advises the Board on medical matters, such as the:
• WorkCover WA Guidelines for the Evaluation of Permanent Impairment (WA Guidelines)
• criteria for designating and monitoring of approved medical specialists providing impairment assessments
• role of approved medical specialists within the scheme.
In 2016/17, the Medical Committee recommended seven medical practitioners for designation as an approved medical specialist. The applicants were subsequently added to the approved medical specialists register. The Committee was also active in providing advice on the proposed new WA Guidelines (4th Edition) and associated training programs.
Industrial Diseases Medical PanelsIndustrial Diseases Medical Panels are convened to determine prescribed questions in relation to asbestos related diseases. Claims for industrial diseases compensation in relation to pneumoconiosis, mesothelioma, lung cancer and diffuse pleural fibrosis are referred to the panels to determine:
• whether the worker is or was suffering from the prescribed disease(s)
• the worker’s degree of permanent whole of person impairment.
The Industrial Diseases Medical Panel is comprised of physicians who specialise in diseases of the chest or occupational diseases. The panel operates independently with WorkCover WA providing administrative support and funding.
During the financial year the panel convened on 17 occasions and made 34 determinations.
86
Key performance indicators
Financial statements and notes
GGG ChecklistIntroduction Agency in focus Scheme performance
Report on operations
Opportunities and challenges
Disclosures and legal compliance

Table 16: Audit and Risk Management Committee attendance
Audit Committee Member
No. of meetings eligible to attend
No. of meetings attended
Victoria Wilmot (Chair) 5 5
Greg Joyce 5 5
Steven Burns 5 4
Bronwyn Rose 5 4
Table 17: Medical Committee attendance
Medical Committee Member
No. of meetings eligible to attend
No. of meetings attended
Michelle Reynolds (Chair) 1 1
Dr Marcus Adonis 1 1
Dr Alan Home 1 1
Dr Neil Ozanne 1 0
Mr David Colvin 1 0
Mr Paul Taylor 1 0
Table 20: Number of diseases determinations
Disease 2012/13 2013/14 2014/15 2015/16 2016/17
Pneumoconiosis 12 18 28 14 17
Pneumoconiosis and Diffuse Pleural Fibrosis
3 4 4 8 9
Pneumoconiosis and Lung Cancer
0 0 2 0 0
Pneumoconiosis, Diffuse Pleural Fibrosis and Lung Cancer
0 0 0 2 0
Diffuse Pleural Fibrosis 2 5 0 7 0
Mesothelioma 13 12 6 3 1
Lung Cancer 6 9 1 2 3
Sub total 36 48 41 36 30
Determinations where disease not present or disease present but a 0% level of impairment
4 5 6 9 4
TOTAL 40 53 47 45 34
Table 19: Number of Industrial Diseases Medical Panel applications
Applications 2012/13 2013/14 2014/15 2015/16 2016/17
New 38 42 49 35 29
Reviewed 2 11 10 0 10
TOTAL 40 53 59 35 39
Table 18: Industrial Diseases Medical Panel members
2016/17 Industrial Diseases Medical Panel Chairman (Rotating)
Members
Prof E Gabbay Dr D Bucens
Dr M K Tandon Dr P Psaila-Savona
Dr K C Wan Dr J Wrobel
Dr M Musk Dr M Prichard
Dr J Sim Prof A Musk
87
Key performance indicators
Financial statements and notes
GGG ChecklistIntroduction Agency in focus Scheme performance
Report on operations
Opportunities and challenges
Disclosures and legal compliance

Public Sector standards and ethical codesWorkCover WA has policies, procedures and guidelines in place to ensure the Agency meets all obligations with respect to the Public Sector Standards (Human Resource Management), the WA Public Sector Code of Ethics, and the WorkCover WA Code of Conduct.
These policies and supporting guidelines are available to all staff via the WorkCover WA intranet and the online training system. Training on accountable and ethical decision-making in the WA Public Sector continued to be delivered to new staff via the online induction system in 2016/17.
Public Sector Code of EthicsThere were no breaches of the Public Sector Code of Ethics identified in 2016/17.
WorkCover WA Code of Conduct In 2016/17, a review of the WorkCover WA Code of Conduct was completed that included consultation with the Joint Consultative Committee and key stakeholders. The review resulted in the streamlining of the document to enhance its accessibility and readability.
During 2016/17 there was one reported breach of the WorkCover WA Code of Conduct which was investigated, substantiated and finalised.
Public Sector Commissioner’s Instruction Employment StandardThere were no breaches of standard claims against the Employment Standard in 2016/17.
Grievance Resolution StandardThere were no breaches of standard claims against the Grievance Resolution Standard in 2016/17.
Disability Access and Inclusion PlanThe Agency’s Disability Access and Inclusion Plan is outlined on page 70 under ‘Equality and inclusion’ in Section 4: Opportunities and challenges.
Recordkeeping PlanWorkCover WA is compliant with the State Records Act 2000 requirement to have a Recordkeeping Plan. The plan provides an accurate reflection of the recordkeeping program within the organisation and must be complied with by the organisation and its officers.
Under Part 3, Division 4 of the State Records Act 2000, the organisation must review its Recordkeeping Plan every five years or when there is any significant change to the organisation’s functions. WorkCover WA’s Recordkeeping Plan was reviewed and updated in June 2015 to reflect the Agency’s improved recordkeeping practices resulting from the implementation of an EDRMS. The Recordkeeping Plan was approved by the State Records Commission in August 2015. WorkCover WA has actively used the State Records Commission standards and principles to govern best practice recordkeeping across the Agency. The records management framework provides appropriate service delivery to our customers and stakeholders.
WorkCover WA’s hierarchy of recordkeeping governance instruments is:
1. WorkCover WA – Vision, Goals
2. Governance Framework
3. Recordkeeping Plan
4. Records Management Policy, Freedom of Information Policy, Intellectual Property Policy
5. Records Management Guidelines and Procedures (including awareness, training and induction material).
Legal compliance
88
Key performance indicators
Financial statements and notes
GGG ChecklistIntroduction Agency in focus Scheme performance
Report on operations
Opportunities and challenges
Disclosures and legal compliance

Table 21: WorkCover WA record figures
Record type 2014/15 2015/16 2016/17
Documents created
65,800 184,452 249,319
Files created 16,145 14,048 12,861
Storage boxes created
707 797 2,096*
*During 2016/17 WorkCover WA located approximately 1,000 previously unrecorded archive boxes from failed insurer HIH and the State Archives. Archiving of dispute case management files was also undertaken and this has increased the amount of boxes created for offsite storage.
Report against WorkCover WA Recordkeeping PlanEvaluation of the efficiency and effectiveness of the organisation’s recordkeeping systems
Following the implementation of an EDRMS in 2014/15, WorkCover WA has continued to make steady improvements in recordkeeping practices and has focused on increasing staff adoption of the EDRMS system.
The nature and extent of the recordkeeping training program conducted by or for the organisation
At WorkCover WA recordkeeping training is conducted through the Records Management training module within the Agency’s online induction program and through a stand-alone records management course. Completion of the induction program and stand-alone course are compulsory for all new staff.
Review of the efficiency and effectiveness of the recordkeeping training program
In addition to the Records Management training module within the Agency’s online induction program and the stand-alone records management course, the Agency commenced an ongoing education program to assist all staff in gaining a greater understanding of specific areas of functionality within HP TRIM relevant to their day-to-day work as well as to educate staff about how saving documents and naming them correctly enables other staff to find information quickly and easily. This enables more seamless collaboration and encourages information sharing across the Agency.
Positive feedback has been received as a result of the program.
Assurance that the organisation’s induction program addresses employee roles and responsibilities in regard to their compliance with the organisation’s Recordkeeping Plan
The Records Management induction training module and stand-alone records management course address employee roles and responsibilities to ensure compliance with the Recordkeeping Plan and the State Records Act 2000. The training module and stand-alone course are regularly reviewed to ensure employees are aware of current compliance requirements as relevant to their roles.
89
Key performance indicators
Financial statements and notes
GGG ChecklistIntroduction Agency in focus Scheme performance
Report on operations
Opportunities and challenges
Disclosures and legal compliance

Table 22: 2016/17 OSH performance data
OSH indicator 2012/13 2013/14 2014/15 2015/16 2016/17Target
2016/17 Actual
Number of fatalities 0 0 0 0 0 0
Lost-time injury/disease incidence rate*
0 0.75% 0 0 0 0
Lost-time injury/disease severity rate
0 0 0 0 0 0
% injured workers returned to work within 13 weeks
N/A** 100% N/A** N/A** 100% N/A**
% injured workers returned to work within 26 weeks
N/A** 100% N/A** N/A** 100% N/A**
% managers trained in OSH and injury management responsibilities
92% 92% 99% 100% 100% 100%
Substantive equalityWorkCover WA’s compliance with Public Sector Standards and Ethical Codes is detailed under ‘Equality and inclusion’ in Section 4: Opportunities and challenges from page 70 of this report.
Occupational safety, health and injury managementWorkCover WA’s occupational safety and health (OSH), and injury management policies are detailed under ‘Safety, health and wellbeing’ in Section 4: Opportunities and challenges from page 71 of this report.
OSH and injury management performance WorkCover WA’s OSH and injury management data for this reporting period is disclosed in Table 22. Comparative data has been included where possible.
OSH training for staff
All WorkCover WA staff undertake online OSH training which aims to provide an understanding of OSH responsibilities. The OSH training includes five modules:
• WorkCover WA OSH Management System
• OSH Management and OSH Law
• Hazard Identification and OSH Risk Management
• Managing Hazards in an Office Environment
• OSH Incident and Injury Management.
In 2016/17, all new staff completed the online OSH Training successfully.
Government policy requirements
* The lost-time injury/disease incidence rate is the number of lost-time injuries/diseases where one day/shift or more was lost in the financial year per 100 employees.
** Not applicable – no claims were recorded in 2012/13, 2014/15, 2015/16 and 2016/17.
Government Building Training PolicyWorkCover WA does not issue contracts within the scope of the Government Building Training Policy.
90
Key performance indicators
Financial statements and notes
GGG ChecklistIntroduction Agency in focus Scheme performance
Report on operations
Opportunities and challenges
Disclosures and legal compliance

Section 6: Key Performance Indicators92 Additional Key Performance Indicator information94 Key Performance Indicators
91
Financial statements and notes
GGG ChecklistIntroduction Agency in focus Scheme performance
Report on operations
Opportunities and challenges
Disclosures and legal compliance
Key performance indicators

Additional Key Performance Indicator information
Greg Joyce Chairman WorkCover WA 24 August 2017
Chris White A/Chief Executive Officer WorkCover WA 24 August 2017
Certification of KPIsWe hereby certify the key performance indicators are based on proper records, are relevant and appropriate for assisting users to assess WorkCover WA’s performance, and fairly represent the performance of WorkCover WA for the financial year ended 30 June 2017.
Detailed information in support of Key Performance IndicatorsGovernment Goals provide the high level basis of the Government’s intentions to improve the quality of life for all Western Australians, with the needs of Western Australians living in the regions a major priority.
Government Goals are supported by strategic (whole of Government) outcome statements and, at departmental level, by Agency specific desired outcomes. Agency level desired outcomes clarify the contributions agencies are expected to make towards achieving government policies and priorities, and must be linked to the Government Goals.
Agencies deliver services to achieve these desired outcomes which ultimately contribute to meeting Government Goals. This linkage creates a hierarchy in which the purpose of each service provided by an Agency can be traced to a Government Goal.
WorkCover WA contributes to Government Goal 3, ‘Results-Based Service Delivery’ by delivering services aimed at minimising the social and economic impact of work-related injury and disease on workers, employers and the Western Australian community.
WorkCover WA’s purpose is to lead a contemporary, healthy and integrated workers’ compensation scheme that is fair, accessible and cost effective for all participants, through:
• providing advice and guidance on workers’ compensation, injury management and return to work practices
• active, responsive and transparent management of the scheme
• focused information, education and compliance activities
• fair and timely dispute resolution
• a strong service focus.
92
Financial statements and notes
GGG ChecklistIntroduction Agency in focus Scheme performance
Report on operations
Opportunities and challenges
Disclosures and legal compliance
Key performance indicators

Results-Based Service Delivery
Greater focus on achieving results in key service delivery areas for the benefit
of all Western Australians.
Government Goal
WorkCover WA’s Agency Desired Outcome
WorkCover WA’s Agency Services
To ensure a workers’ compensation and injury management scheme that is financially viable, contemporary and integrated, whilst providing services that are fair, accessible, timely and cost
effective for all participants.
1. Scheme Regulation Regulation of workers’ compensation
scheme participants for compliance with legislative requirements.
2. Scheme Services Provision of effective and equitable
dispute resolution and other services to scheme participants.
Figure 28: WorkCover WA’s links to Government Goals through its Agency Desired Outcome and Services
WorkCover WA strives to achieve its outcome through the effective administration of the Workers’ Compensation and Injury Management Act 1981 (the Act), the provision of quality policy advice to Government, and excellent stakeholder relationships.
Our Agency Desired Outcome relates directly to our vision and purpose: “To ensure a workers’ compensation and injury management scheme that is financially viable, contemporary and integrated whilst providing services that are fair, accessible, timely and cost effective for all participants”.
The Agency Services provided to ensure WorkCover WA achieves its desired outcome are:
• Scheme Regulation - regulation of workers’ compensation scheme participants for compliance with legislative requirements
• Scheme Services - provision of effective and equitable dispute resolution and other services to scheme participants.
Figure 28 shows the WorkCover WA Outcome Based Management (OBM) Structure.
Changes to the Outcomes Based Management Structure WorkCover WA undertakes regular reviews of its OBM Structure and Key Performance Indicator (KPI)framework to ensure it provides the most suitable measures to indicate the Agency’s performance.
The Agency did not make any changes to its OBM in 2016/17. The last changes were made in 2014 and included in our 2014/15 Annual Report.
93
Financial statements and notes
GGG ChecklistIntroduction Agency in focus Scheme performance
Report on operations
Opportunities and challenges
Disclosures and legal compliance
Key performance indicators

Key Performance Indicators
To ensure a workers’ compensation and injury management scheme that is financially viable, contemporary, and integrated whilst providing services that are fair, accessible, timely and cost effective for all participants.
Table 23: WorkCover WA’s KPIs and their relationship with the Agency’s OBM Structure
Agency Desired Outcome
1.1 The number of non-compliance events identified as a result of a claim
on the General Account
1.2 The proportion of conciliations completed within eight weeks
1.3 The proportion of disputes resolved within six months
Effectiveness Indicators
1. Scheme Regulation – regulation of workers’ compensation scheme participants for compliance with legislative requirements
2. Scheme Services – provision of effective and equitable dispute resolution and other services to scheme participants
1.1 Average cost per employer
compliance activity
2.3 Average cost to process a Memorandum of
Agreement
1.2 Average cost per approved and
monitored service provider
1.3 Average cost per client contact
to provide information and advice
2.1 Average cost to complete a
conciliation
2.2 Average cost to complete an
arbitration
Agency Services
Efficiency Indicators
94
Financial statements and notes
GGG ChecklistIntroduction Agency in focus Scheme performance
Report on operations
Opportunities and challenges
Disclosures and legal compliance
Key performance indicators

Summary of Key Performance Indicators
Table 24: Key Performance Indicators of Effectiveness
# Indicator 2012/13 Actual
2013/14 Actual
2014/15 Actual
2015/16 Actual
2016/17Actual
2016/17 Target
1.1 The number of non-compliance events identified as a result of a claim on the General Account
3 4 3 9 2 6
1.2 The proportion of conciliations completed within eight weeks
97.8% 96.8% 96.3% 96.2% 97.1% 97.0%
1.3 The proportion of disputes resolved within six months
92.3% 89.5% 88.8% 86.8% 87.9% 90.0%
Table 25: Key Performance Indicators of Efficiency
# Indicator 2012/13 Actual
2013/14 Actual
2014/15 Actual
2015/16 Actual
2016/17Actual
2016/17 Target
1.1 Average cost per employer compliance activity $265 $198 $255 $281 $251 $288
1.2 Average cost per approved and monitored service provider
$2,871 $3,047 $3,250 $3,472 $3,177 $3,659
1.3 Average cost per client contact to provide information and advice
$120 $120 $120 $106 $110 $107
2.1 Average cost to complete a conciliation $2,579 $2,268 $1,966 $2,095 $2,208 $2,144
2.2 Average cost to complete an arbitration $13,014 $11,153 $10,042 $10,084 $9,587 $10,790
2.3 Average cost to process a Memorandum of Agreement
$373 $389 $342 $339 $341 $331
95
Financial statements and notes
GGG ChecklistIntroduction Agency in focus Scheme performance
Report on operations
Opportunities and challenges
Disclosures and legal compliance
Key performance indicators
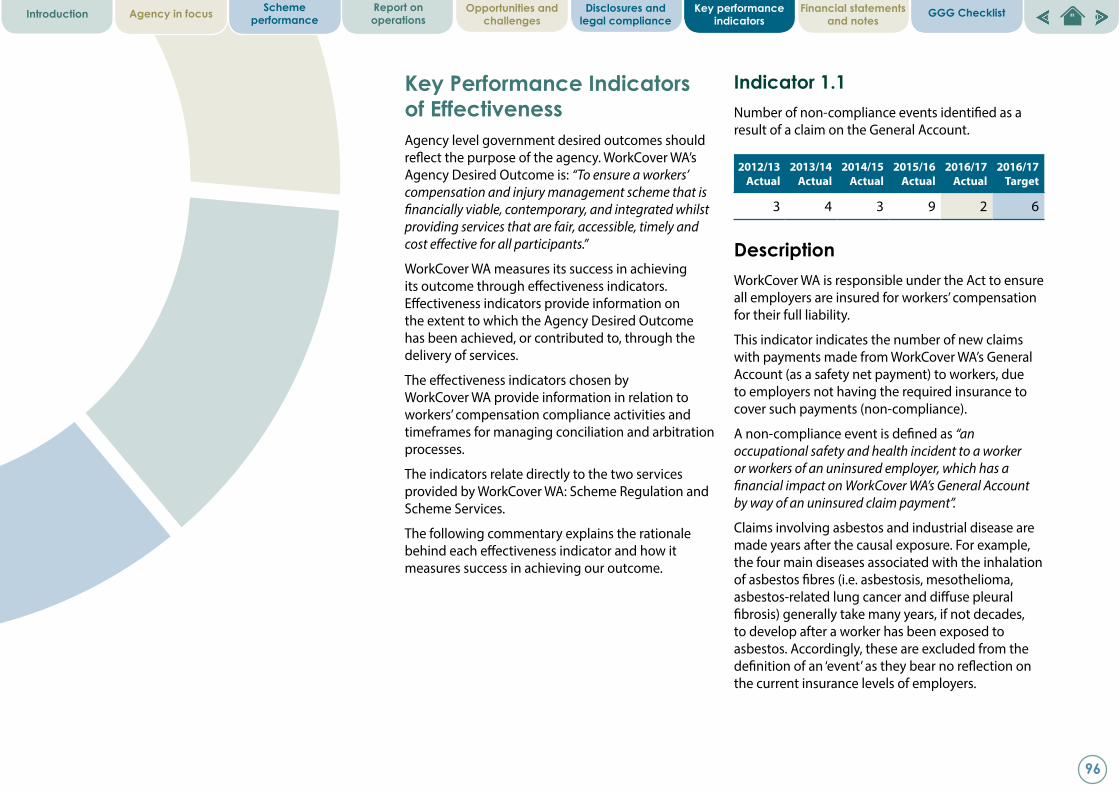
Indicator 1.1 Number of non-compliance events identified as a result of a claim on the General Account.
DescriptionWorkCover WA is responsible under the Act to ensure all employers are insured for workers’ compensation for their full liability.
This indicator indicates the number of new claims with payments made from WorkCover WA’s General Account (as a safety net payment) to workers, due to employers not having the required insurance to cover such payments (non-compliance).
A non-compliance event is defined as “an occupational safety and health incident to a worker or workers of an uninsured employer, which has a financial impact on WorkCover WA’s General Account by way of an uninsured claim payment”.
Claims involving asbestos and industrial disease are made years after the causal exposure. For example, the four main diseases associated with the inhalation of asbestos fibres (i.e. asbestosis, mesothelioma, asbestos-related lung cancer and diffuse pleural fibrosis) generally take many years, if not decades, to develop after a worker has been exposed to asbestos. Accordingly, these are excluded from the definition of an ‘event’ as they bear no reflection on the current insurance levels of employers.
Key Performance Indicators of EffectivenessAgency level government desired outcomes should reflect the purpose of the agency. WorkCover WA’s Agency Desired Outcome is: “To ensure a workers’ compensation and injury management scheme that is financially viable, contemporary, and integrated whilst providing services that are fair, accessible, timely and cost effective for all participants.”
WorkCover WA measures its success in achieving its outcome through effectiveness indicators. Effectiveness indicators provide information on the extent to which the Agency Desired Outcome has been achieved, or contributed to, through the delivery of services.
The effectiveness indicators chosen by WorkCover WA provide information in relation to workers’ compensation compliance activities and timeframes for managing conciliation and arbitration processes.
The indicators relate directly to the two services provided by WorkCover WA: Scheme Regulation and Scheme Services.
The following commentary explains the rationale behind each effectiveness indicator and how it measures success in achieving our outcome.
2012/13 Actual
2013/14 Actual
2014/15 Actual
2015/16 Actual
2016/17Actual
2016/17 Target
3 4 3 9 2 6
96
Financial statements and notes
GGG ChecklistIntroduction Agency in focus Scheme performance
Report on operations
Opportunities and challenges
Disclosures and legal compliance
Key performance indicators

Common law damages claims paid from the General Account due to insurers declining to indemnify the claim are also excluded. This exclusion is limited to claims where a court finds the insured employer breached their insurance policy by recklessly disregarding the risk to the worker.
To determine the target for this KPI, a benchmark of two uninsured claims per 10,000 claims was established and for many years the overall number of insured claims was consistent in the vicinity of 40,000 per annum, giving a target figure of eight. However, in recent years this figure has continued to decline (33,914 in 2014/15, 32,225 in 2015/16 and 28,593 predicted for 2016/17) resulting in the target for 2016/17 being reduced to six.
The information to inform this indicator is derived from two Agency information systems. The total number of claims is reported from the Q2 database which captures details of all claims as reported by approved insurers and self-insurers.
The number of General Account claims is derived from the Agency Financial Management Information System which reports the commencement of any payments to a worker or service provider made from the General Account.
Analysis In 2016/17 there were two non-compliance events that resulted in a claim paid from the General Account (see Figure 29). This is four less than the target of six, and seven less than 2015/16. The number of uninsured claims against the General Account continue to remain low in the context of approximately 30,000 insured claims for the year. The higher than normal figure in 2015/16 included four long term claims for injuries sustained in prior years and appears to be an anomaly.
The continued low number of uninsured claims paid from the General Account can be partially attributed to WorkCover WA’s compliance activities and information and education to stakeholders.
The total cost of the 2016/17 new claims is $160,031. The Agency attempts recovery action against all uninsured employers.
Figure 29: New claims on the General Account
New claims on the General Account
3 4 3 9 2 6
2012/13 32013/14 42014/15 32015/16 92016/17 22016/17 Target 6
0
1
2
3
4
5
6
7
8
9
10
2012/13 2013/14 2014/15 2015/16 2016/17 2016/17 Target
97
Financial statements and notes
GGG ChecklistIntroduction Agency in focus Scheme performance
Report on operations
Opportunities and challenges
Disclosures and legal compliance
Key performance indicators

Analysis In 2016/17, 97.1 percent of conciliations were completed within the eight week statutory timeframe (see Figure 30). This is consistent with the target of 97.0 percent and the outcome for 2015/16.
The eight week timeframe for resolving a dispute through conciliation is a statutory requirement. This is a well-established process and most cases are expected to be completed within the eight week timeframe.
There will always be some cases that cannot reasonably be dealt with within the initial eight week period, in which case the Director may grant an extension for a further eight week period. All 61 matters not completed within the initial eight weeks were completed within the extended timeframe granted by the Director.
Figure 30: Proportion of conciliations completed within eight weeks
Indicator 1.2 The proportion of conciliations completed within eight weeks.
DescriptionThe Workers’ Compensation and Injury Management Conciliation Rules 2011 set the time limit for conciliation at 56 days (eight weeks) from the day on which the Director accepts an application, unless an extension is granted by the Director for a period not exceeding a further eight weeks.
This timeframe is reflected in this KPI which reports the number of conciliation applications completed within the initial eight weeks.
Time taken to complete an application for conciliation is measured from the date an application for conciliation is accepted to the date a Certificate of Outcome is issued by the Conciliation Officer.
This indicator is produced directly from data extracted from the Dispute Case Management System (DCMS) which supports the business needs of the Conciliation and Arbitration Services.
The target for this KPI has been set based on the previous year target and current performance.
2012/13 Actual
2013/14 Actual
2014/15 Actual
2015/16 Actual
2016/17Actual
2016/17 Target
97.8% 96.8% 96.3% 96.2% 97.1% 97.0%
Conciliation at WorkCover WA.
Proportion of conciliations completed within eight weeks
97.8% 96.8% 96.3% 96.2% 97.1% 97.0%
2012/13 97.80%2013/14 96.80%2014/15 96.30%2015/16 96.20%2016/17 97.10%2016/17 Target 97.00%
0.00%
10.00%
20.00%
30.00%
40.00%
50.00%
60.00%
70.00%
80.00%
90.00%
100.00%
2012/13 2013/14 2014/15 2015/16 2016/17 2016/17 Target
98
Financial statements and notes
GGG ChecklistIntroduction Agency in focus Scheme performance
Report on operations
Opportunities and challenges
Disclosures and legal compliance
Key performance indicators

Indicator 1.3The proportion of disputes resolved within six months.
DescriptionThis KPI reports the time taken to resolve a dispute and is consistent with Part XI, Section 177 of the Act, which states:
The main objectives of the conciliation and arbitration functions are to:
Provide a fair and cost effective system for the resolution of disputes under the Act that –
a. is timely
b. is accessible, approachable and professional
c. minimises costs to parties to disputes
d. in the case of conciliation, leads to final and appropriate agreements between parties in relation to disputes
e. in the case of arbitration, enables disputes not resolved by conciliation to be determined according to their substantial merits with as little formality and technicality as practicable.
This KPI measures the proportion of disputes resolved within a six month timeframe from the day an application for conciliation is accepted through to the day they are completed, either via conciliation or arbitration. For those disputes progressing to arbitration, the 28 day statutory gap (or portion of ) in which an application for arbitration can be made, and the time between lodgement and acceptance of an application, is not included in the timeframe. Acceptance of an application (after lodgement) can be delayed due to the provision of inadequate documentation or other factors relating to party behaviour.
Data for this KPI is drawn from the DCMS, and establishes the timeframe by counting disputes from the day a dispute is registered as accepted for conciliation through to the day the dispute is either recorded as completed (for conciliation) or closed and/or final orders issued, where the matter has proceeded to arbitration.
The target for this KPI has been set based on the previous year target and current performance.
Analysis In 2016/17, 87.9 percent of all disputes were resolved within six months (see Figure 31). This is marginally less than the target of 90.0 percent and a slight increase on the 2015/16 result.
These results are published in a long standing comparative performance monitoring report produced by Safe Work Australia and shows dispute resolution within the Western Australian workers’ compensation scheme performs well compared with other jurisdictions. The latest available national data shows the 2014/15 National and New Zealand averages for disputes resolved within six months were 79.0 percent and 76.2 percent respectively.
2012/13 Actual
2013/14 Actual
2014/15 Actual
2015/16 Actual
2016/17YTD
2016/17 Target
92.3% 89.5% 88.8% 86.8% 87.9% 90.0%
Figure 31: Proportion of disputes resolved within six months
Proportion of disputes resolved within six months
2012/13 92.30%2013/14 89.50%2014/15 88.80%2015/16 86.80%2016/17 87.90%2016/17 Target 90.00%
0.00%
10.00%
20.00%
30.00%
40.00%
50.00%
60.00%
70.00%
80.00%
90.00%
100.00%
2012/13 2013/14 2014/15 2015/16 2016/17 2016/17 Target
92.3% 89.5% 88.8% 86.8% 87.9% 90.0%
99
Financial statements and notes
GGG ChecklistIntroduction Agency in focus Scheme performance
Report on operations
Opportunities and challenges
Disclosures and legal compliance
Key performance indicators

Key Indicators of EfficiencyEfficiency indicators relate Agency services to the level of resource inputs required to deliver them. The efficiency indicators for WorkCover WA are focused on financial resources and provide a per-unit cost.
There are three efficiency indicators chosen for each of the two Agency services. These indicators measure the overall unit costs of delivering the core services of dispute resolution and regulation of scheme participants.
Allocation of Agency costsTo ensure accurate allocations of costs to the KPIs across the Agency, a formal Agency cost mapping model is used. The cost allocation model is used to determine overheads and to allocate costs across the Agency’s divisions and six efficiency KPIs and is reviewed for accuracy every two years. Budget figures used in the costing model are consistent with the Agency’s approved budget.
Direct costs for each activity are allocated to individual cost centres within the relevant business units in the first instance. Indirect costs (overheads) easily attributed to Full Time Equivalent (FTE) positions, such as payroll tax, superannuation, workers compensation and employee entitlements, are allocated across all Agency cost centres on an FTE basis. Other overheads, such as rates, water, electricity and depreciation of buildings, are allocated according to the floor space specifically allocated to an area.
In order to account for all Agency costs, expenditure from cost centres that are not attributed directly to a KPI is allocated across all KPIs on an FTE basis. Calculation methodologies referred to below for both target and actual figures include allocated overheads through the cost mapping model.
Certain expenditure and revenue in relation to the payment and subsequent recovery of workers’ compensation claims are not incorporated into the KPI calculation data. This is due to the nature of these transactions and the fact that WorkCover WA has no control over General Account and Supplementation Fund claims, which if included, would unduly skew key KPI data (for 2016/17 this represents 10 percent of the total expenditure consistent with the representation for 2015/16).
Service 1: Scheme Regulation – regulation of workers’ compensation scheme participants for compliance with legislative requirements
As part of its responsibilities in administering the Act, WorkCover WA has responsibility to ensure the efficient and effective operation of the workers’ compensation scheme by monitoring compliance of employers, insurers and others participating in or affected by the scheme.
The following KPIs measure the costs of providing these activities.
Advice and Assistance Offi c
er Carl S
mith
.
100
Financial statements and notes
GGG ChecklistIntroduction Agency in focus Scheme performance
Report on operations
Opportunities and challenges
Disclosures and legal compliance
Key performance indicators

Indicator 1.1Average cost per employer compliance activity.
DescriptionWorkCover WA seeks to ensure every employer maintains a policy of insurance for the full amount of any liability to pay compensation under the Act to any worker employed, and complies with other obligations under the Act.
Authorised inspectors conduct investigations and inspections in order to ensure compliance with the Act and to prosecute non-compliance where identified. Insurers are not able to cancel workers’ compensation insurance policies without the approval of WorkCover WA. This is to ensure employers are not operating a business without insurance.
The Act has 34 penalty provisions relating to employers’ obligations. Following notification of a possible breach, an investigation or prosecution may result.
This indicator reports the average cost per employer compliance activity and is measured by dividing the full costs of the Agency’s Compliance Section for the reference period as determined by the Cost Allocation Model by the total number of employer compliance activities.
Each employer compliance activity is recorded in the Regulatory Services Management System (RSMS) which tracks activity for each case. The total number of employer compliance activities is extracted directly from this system.
The target for this indicator was determined using the full year approved budget figures for the compliance activity, divided by the estimated full year total number of compliance activity units.
Analysis In 2016/17 the average cost per employer compliance activity was $251 (see Figure 32). This is 12.8 percent less than the target of $288 and 10.7 percent less than 2015/16.
The 2016/17 results are predominantly due to a significant increase in the activities involving compliance of expired policies and policy cancellations performed with reduced FTEs for part of the year.
The reduced cost per activity outcome shows increased efficiencies compared to the previous year and the expected target.
2012/13 Actual
2013/14 Actual
2014/15 Actual
2015/16 Actual
2016/17Actual
2016/17 Target
$265 $198 $255 $281 $251 $288
Figure 32: Cost per employer compliance activity
Cost per employer compliance activity
2012/13 $2652013/14 $1982014/15 $2552015/16 $2812016/17 $2512016/17 Target $288
$0
$50
$100
$150
$200
$250
$300
$350
2012/13 2013/14 2014/15 2015/16 2016/17 2016/17 Target
$265 $198 $255 $281 $251 $288
101
Financial statements and notes
GGG ChecklistIntroduction Agency in focus Scheme performance
Report on operations
Opportunities and challenges
Disclosures and legal compliance
Key performance indicators

Indicator 1.2Average cost per approved and monitored service provider.
DescriptionWorkCover WA is responsible for approving, monitoring and reviewing the performance of scheme service providers against established standards which can include performance criteria relating to legislative compliance, codes of conduct, codes of practice and guidelines.
Through its standards and review activities, WorkCover WA approves and/or monitors the performance of the following service providers: insurers, self-insurers, workplace rehabilitation providers, Approved Medical Specialists, audiologists/audiometric officers and registered agents.
This indicator reports the average cost per approved and monitored service provider and is measured by dividing the full costs of the Standards and Review Section by the total number of approved and monitored service providers.
All information relevant to these service providers is captured in RSMS as the single data source and the data for this indicator is extracted directly from the system.The total cost of the monitoring services operational activity for the reference period is provided by the Cost Allocation Model.
The target for this indicator was determined by dividing the approved budget for these activities by the estimated total number of approved and monitored service providers. The number of service providers is measured as of 30 June each year and continues to remain relatively consistent.
Analysis In 2016/17, the average cost per approved and monitored service provider was $3,177 (see Figure 33). This is 13.2 percent less than the target of $3,659 and 8.5 percent less than 2015/16.
The number of service providers is marginally (3.6 percent) less than the target and 5.5 percent less than 2015/16. While the number of service providers has remained relatively stable, the area has operated with reduced FTEs for part of the year thus reducing the average cost.
The outcome for this KPI shows the cost of approving and monitoring service providers decreased in 2016/17 against a previously increasing trend over the past few years.
2012/13 Actual
2013/14 Actual
2014/15 Actual
2015/16 Actual
2016/17Actual
2016/17 Target
$2,871 $3,047 $3,250 $3,472 $3,177 $3,659
Figure 33: Average cost per approved and monitored service provider
Cost per service provider
$2,871 $3,047 $3,250 $3,472 $3,177 $3,659
2012/13 $2,8712013/14 $3,0472014/15 $3,2502015/16 $3,4722016/17 $3,1772016/17 Target $3,659
$0
$500
$1,000
$1,500
$2,000
$2,500
$3,000
$3,500
$4,000
2012/13 2013/14 2014/15 2015/16 2016/17 2016/17 Target
102
Financial statements and notes
GGG ChecklistIntroduction Agency in focus Scheme performance
Report on operations
Opportunities and challenges
Disclosures and legal compliance
Key performance indicators

Indicator 1.3Average cost per client contact to provide information and advice.
DescriptionWorkCover WA has responsibility under the Act to promote awareness and disseminate information about the workers’ compensation scheme.
This indicator reports the average cost of providing information and advice in relation to all aspects of the scheme. It is measured by dividing the full costs of the Advice and Assistance section by the total number of advice and assistance activities (written advice notifications prepared and verbal consultations conducted).
All written advice notifications and verbal consultations, including in-person enquiries, appointments and written enquiries, are captured in the RSMS. Inward telephone calls made to the Agency Advisory Line (1300 794 744) are recorded by the Agency’s phone system. Other enquiries, such as Ministerial correspondence, are recorded in the Ministerial tracking system. The total number of matters conducted is then extracted directly from the respective systems and included in a monthly activity report.
The target for this indicator was determined by dividing the approved budget for this activity by the estimated total number of written advice notifications prepared and verbal consultations conducted for the year. The estimated number of activities was based on a small decrease on the overall expected activity for 2015/16 and is consistent with a slight downward trend in telephone calls in recent years attributed to increased website activity.
Analysis In 2016/17 the average cost per client contact to provide information and advice was $110 (see Figure 34). This is 2.8 percent higher than the target of $107 and 3.8 percent higher than 2015/16.
The increase in the average cost of providing this service is primarily due to a reduced number of enquiries for the year.
The Advice and Assistance Unit responded to 20,348 requests in 2016/17, a reduction of 1,608 (7.3 percent) from 2015/16. This downward trend is attributed to both reduced claim numbers across the scheme and the improved information and search capabilities of the WorkCover WA website. In 2016/17 the website attracted in excess of 275,000 hits compared to approximately 270,000 in 2015/16.
2012/13 Actual
2013/14 Actual
2014/15 Actual
2015/16 Actual
2016/17Actual
2016/17 Target
$120 $120 $120 $106 $110 $107
Figure 34: Average cost per client contact to provide information and advice
Cost per client contact to provide information and advice
$120 $120 $120 $106 $110 $107
2012/13 $1202013/14 $1202014/15 $1202015/16 $1062016/17 $1102016/17 Target $107
$0
$20
$40
$60
$80
$100
$120
$140
2012/13 2013/14 2014/15 2015/16 2016/17 2016/17 Target
103
Financial statements and notes
GGG ChecklistIntroduction Agency in focus Scheme performance
Report on operations
Opportunities and challenges
Disclosures and legal compliance
Key performance indicators

Service 2: Scheme Services - provision of effective and equitable dispute resolution and other services to scheme participants
The Conciliation and Arbitration Services provide a fair and cost effective system for the resolution of disputes that is timely, accessible, approachable and professional, and minimises costs to parties to disputes through either conciliation or arbitration.
The Agency is also responsible for recording the finalisation of workers’ compensation claims through the registration of Memoranda of Agreement (MoAs) and the processing of documents submitted in relation to settlement of common law actions initiated in the District Court.
Indicator 2.1Average cost to complete a conciliation.
DescriptionThis KPI measures the average cost to complete a conciliation. It is measured by dividing the full costs of providing the conciliation process by the total number of conciliations completed.
All conciliations are recorded in the DCMS along with completed dates. ‘Completed’ is measured as the date that a Conciliation Officer records a Certificate of Outcome at the end of a conciliation process. The data for this indicator is extracted directly from DCMS.
The target for this indicator was determined by dividing the approved budget for this activity by the estimated total number of conciliations completed for the year. The estimated number of conciliations for 2016/17 is slightly less than the figure used for 2015/16 based on the stabilising of a previous upward trend.
2012/13 Actual
2013/14 Actual
2014/15 Actual
2015/16 Actual
2016/17Actual
2016/17 Target
$2,579 $2,268 $1,966 $2,095 $2,208 $2,144
Analysis In 2016/17 the average cost to complete a conciliation was $2,208 (see Figure 35). This is 3.0 percent higher than the target of $2,144 and 5.4 percent higher than the outcome of $2,095 in 2015/16.
The number of conciliations completed for the period is 110 (5.0 percent) fewer than expected and 81 (3.7 percent) fewer than in 2015/16.
In the three years from 2012/13 to 2014/15 conciliation numbers increased significantly, however, this trajectory has not continued in the last two years. Therefore the average cost to complete a conciliation has increased in the past two years due to this reduction in the number of applications for conciliation received and completed.
Figure 35: Average cost to complete a conciliation
Cost per completed conciliation
$2,579 $2,268 $1,966 $2,095 $2,208 $2,144
2012/13 $2,5792013/14 $2,2682014/15 $1,9662015/16 $2,0952016/17 $2,2082016/17 Target $2,144
$0
$500
$1,000
$1,500
$2,000
$2,500
$3,000
2012/13 2013/14 2014/15 2015/16 2016/17 2016/17 Target
104
Financial statements and notes
GGG ChecklistIntroduction Agency in focus Scheme performance
Report on operations
Opportunities and challenges
Disclosures and legal compliance
Key performance indicators

Indicator 2.2Average cost to complete an arbitration.
DescriptionThis KPI measures the average cost to complete an arbitration. It is measured by dividing the full costs of providing the arbitration process by the total number of arbitrations completed.
All arbitration applications are recorded in DCMS, including the dates the matters are completed. ‘Completion of an arbitration’ can mean a matter is discontinued or final orders are issued by an Arbitrator.
The target for this indicator is determined by dividing the approved budget for this activity by the estimated total number of arbitrations completed for the year. The estimated number of arbitrations was less than in previous years based on a slight downward trend identified in late 2014/15 which continued in 2015/16.
2012/13 Actual
2013/14 Actual
2014/15 Actual
2015/16 Actual
2016/17Actual
2016/17 Target
$13,014 $11,153 $10,042 $10,084 $9,587 $10,790
Analysis In 2016/17 the average cost to complete an arbitration was $9,587 (see Figure 36). This is 11.1 percent less than the predicted target of $10,790 and 4.9 percent less than the outcome for 2015/16 of $10,084.
The lower than expected cost for this activity is predominantly due to lower utilisation of sessional arbitrators than predicted. This indicator continues to show the efficiencies realised through the active management of case allocations to both in-house and sessional arbitrators.
Figure 36: Average cost to complete an arbitration
Arbitration at WorkCover W
A.
Cost per completed arbitration
$13,014 $11,153 $10,042 $10,084 $9,587 $10,790
2012/13 $13,0142013/14 $11,1532014/15 $10,0422015/16 $10,0842016/17 $9,5872016/17 Target $10,790
$0
$2,000
$4,000
$6,000
$8,000
$10,000
$12,000
$14,000
2012/13 2013/14 2014/15 2015/16 2016/17 2016/17 Target
105
Financial statements and notes
GGG ChecklistIntroduction Agency in focus Scheme performance
Report on operations
Opportunities and challenges
Disclosures and legal compliance
Key performance indicators

Indicator 2.3Average cost to process a Memorandum of Agreement.
DescriptionWorkCover WA is responsible under the Act for registering MoAs where parties agree to settle a claim in the workers’ compensation scheme, either through redemption of weekly entitlements and medical expenses, and/or through an assessment of a worker’s permanent impairment. Registering MoAs involves an assessment of the accuracy of the documentation provided by the parties, as well as compliance with the Act.
This KPI measures the average cost to complete a MoA and is measured by dividing the full costs of providing the MoA process by the total number of MoAs completed.
Each MoA registered is recorded in the MoAs database which forms part of DCMS. The data for this KPI is extracted directly from this system.
The target for this KPI was set based on the previous years estimated actual and the continued increase in the number of MoAs being presented.
2012/13 Actual
2013/14 Actual
2014/15 Actual
2015/16 Actual
2016/17Actual
2016/17 Target
$373 $389 $342 $339 $341 $331
Analysis The average cost to process a MoA for 2016/17 was $341 (see Figure 37). This is 3.0 percent more than the target of $331 and a slight increase (0.6 percent) on the outcome in 2015/16.
The variance to both target and the previous year is primarily due to the higher than expected activity levels in 2015/16 on which the target was based. This increased activity was not sustained.
Figure 37: Average cost to complete a MoA
WorkCover WA Registration Coordinator T
essa
Mar
tens
.
Cost per completed MoA
$373 $389 $342 $339 $341 $331
2012/13 $3732013/14 $3892014/15 $3422015/16 $3392016/17 $3412016/17 Target $331
$0
$50
$100
$150
$200
$250
$300
$350
$400
$450
2012/13 2013/14 2014/15 2015/16 2016/17 2016/17 Target
106
Financial statements and notes
GGG ChecklistIntroduction Agency in focus Scheme performance
Report on operations
Opportunities and challenges
Disclosures and legal compliance
Key performance indicators

Section 7: Financial statements and notes108 Financial statements113 Notes to the financial statements
107
GGG ChecklistIntroduction Agency in focus Scheme performance
Report on operations
Opportunities and challenges
Disclosures and legal compliance
Key performance indicators
Financial statements and notes

Chris WhiteA/Chief Executive Officer
WorkCover Western Australia Authority
24 August 2017
Greg JoyceChairman
WorkCover Western Australia Authority
24 August 2017
John HullChief Finance Officer
WorkCover Western Australia Authority
24 August 2017
The accompanying financial statements of WorkCover Western Australia Authority have been prepared in compliance with the provisions of the Financial Management Act 2006 from proper accounts and records to present fairly the financial transactions for the financial year ended 30 June 2017 and the financial position as at 30 June 2017.
At the date of signing we are not aware of any circumstances which would render the particulars included in the financial statements misleading or inaccurate.
Financial statementsCertication of financial statements
108
GGG ChecklistIntroduction Agency in focus Scheme performance
Report on operations
Opportunities and challenges
Disclosures and legal compliance
Key performance indicators
Financial statements and notes

Independent audit opinion
109
GGG ChecklistIntroduction Agency in focus Scheme performance
Report on operations
Opportunities and challenges
Disclosures and legal compliance
Key performance indicators
Financial statements and notes

110
GGG ChecklistIntroduction Agency in focus Scheme performance
Report on operations
Opportunities and challenges
Disclosures and legal compliance
Key performance indicators
Financial statements and notes

Statement of Comprehensive IncomeFor the year ended 30 June 2017
Statement of Financial PositionFor the year ended 30 June 2017
Note 2017 2016$000 $000
INCOMERevenueInsurer contributions 19,945 21,481 Interest revenue 7 2,320 2,542 Other revenue 8 862 1,317 Employers' Indemnity Supplementation Fund 9 120 2,057 Total Revenue 23,247 27,397
GainsDecrease in claims liability 28,31 3,531 4,029 Total Gains 3,531 4,029
TOTAL INCOME 26,778 31,426
EXPENSESExpenses Employee benefits expense 12 14,494 14,894 Supplies and services 13 2,722 3,186 Depreciation and amortisation expense 14 971 919 Accommodation expenses 15 647 575 Grants and subsidies 16 50 50 Claims expense 10 2,020 2,012 Loss on disposal of non-current assets 11 5 29 Other expenses 17 1,382 1,428 Total Expenses 22,291 23,093
Profit before grants and subsidies from State Government 4,487 8,333 Services received free of charge 18 114 170 Profit for the period 4,601 8,503
OTHER COMPREHENSIVE INCOMEItems not reclassified subsequently to profit or lossRemeasurements of defined benefit liability 28 749 (772)Changes in asset revaluation surplus 29 (1,827) (1,310)Total other comprehensive income (1,078) (2,082)
Total Comprehensive Income For The Period 3,523 6,421 See also note 44 ‘Schedule of Income and Expenses by Service’.
The Statement of Comprehensive Income should be read in conjunction with the accompanying notes.
Note 2017 2016$000 $000
ASSETS
Current Assets
Cash and cash equivalents 19 10,580 15,697
Restricted cash and cash equivalents 20 85,742 85,262
Receivables 21 1,144 1,097
Other financial assets 22 14,529 8,385
Total Current Assets 111,995 110,441
Non-Current Assets
Property, plant, equipment & vehicles 23 17,782 20,093
Intangible assets 25 2,485 2,367
Total Non-Current Assets 20,267 22,460
Total Assets 132,262 132,901
LIABILITIES
Current Liabilities
Payables 27 804 635
Provisions 28 5,756 6,743
Total Current Liabilities 6,560 7,378
Non-Current Liabilities
Provisions 28 23,042 26,386
Total Non-Current Liabilities 23,042 26,386
Total Liabilities 29,602 33,764
Net Assets 102,660 99,137
EQUITY 29
Reserves 14,363 16,190
Retained earnings 88,297 82,947
Total Equity 102,660 99,137
The Statement of Financial Position should be read in conjunction with the accompanying notes.
111
GGG ChecklistIntroduction Agency in focus Scheme performance
Report on operations
Opportunities and challenges
Disclosures and legal compliance
Key performance indicators
Financial statements and notes

Note Reserves Retained earnings
Totalequity
$000 $000 $000
Balance at 1 July 2015 29 17,500 75,216 92,716
Profit - 8,503 8,503
Other comprehensive income (1,310) (772) (2,082)
Total comprehensive income for the period (1,310) 7,731 6,421
Balance at 30 June 2016 16,190 82,947 99,137
Balance at 1 July 2016 16,190 82,947 99,137
Profit - 4,601 4,601
Other comprehensive income (1,827) 749 (1,078)
Total comprehensive income for the period (1,827) 5,350 3,523
Balance at 30 June 2017 14,363 88,297 102,660
The Statement of Changes in Equity should be read in conjunction with the accompanying notes.
Note 2017 2016
$000 $000
CASH FLOWS FROM OPERATING ACTIVITIES
Receipts
Supplementation Fund receipts 120 2,057
Insurer contributions 19,945 21,481
Provision of services 9 9
Interest received 2,446 2,464
GST receipts on sales 27 20
GST receipts from taxation authority 380 467
Other receipts 813 1,300
Payments
Workers' Compensation claim payments (1,760) (1,320)
Employee benefits (14,906) (16,320)
Supplies and services (2,865) (3,266)
Accommodation (661) (582)
Grants and subsidies (50) (50)
GST payments on purchases (404) (483)
Other payments (1,045) (1,116)
Net cash provided by operating activities 30 2,049 4,661
CASH FLOWS FROM INVESTING ACTIVITIES
Receipts
Proceeds from sale of non-current physical assets 11 86 55
Proceeds from the maturity of term deposits - 5,040
Payments
Purchase of non-current physical assets (628) (1,179)
Investments in term deposits (6,144) -
Net cash used in investing activities (6,686) 3,916
Net (decrease)/increase in cash and cash equivalents (4,637) 8,577
Cash and cash equivalents at the beginning of the period 100,959 92,382
Cash and cash equivalent at the end of the period 30 96,322 100,959
The Statement of Cash Flows should be read in conjunction with the accompanying notes.
Statement of Changes in EquityFor the year ended 30 June 2017
Statement of Cash FlowsFor the year ended 30 June 2017
112
GGG ChecklistIntroduction Agency in focus Scheme performance
Report on operations
Opportunities and challenges
Disclosures and legal compliance
Key performance indicators
Financial statements and notes

1. Australian Accounting Standards
GeneralThe Authority’s financial statements for the year ended 30 June 2017 have been prepared in accordance with Australian Accounting Standards. The term ‘Australian Accounting Standards’ includes Standards and Interpretations issued by the Australian Accounting Standards Board (AASB).
The Authority has adopted any applicable new and revised Australian Accounting Standards from their operative dates.
Early adoption of standardsThe Authority cannot early adopt an Australian Accounting Standard unless specifically permitted by TI 1101 Application of Australian Accounting Standards and Other Pronouncements. There has been no early adoption of any Australian Accounting Standards that have been issued or amended (but not operative) by the Authority for the annual reporting period ended 30 June 2017.
2. Summary of significant accounting policies
(a) General statementThe Authority is a not-for-profit reporting entity that prepares general purpose financial statements in accordance with Australian Accounting Standards, the Framework, Statements of Accounting Concepts and other authoritative pronouncements of the AASB as applied by the Treasurer’s instructions. Several of these are modified by the Treasurer’s instructions to vary application, disclosure, format and wording.
The Financial Management Act 2006 and the Treasurer’s instructions impose legislative provisions that govern the preparation of financial statements and take precedence over Australian Accounting Standards, the Framework, Statements of Accounting Concepts and other authoritative pronouncements of the AASB.
Where modification is required and has had a material or significant financial effect upon the reported results, details of that modification and the resulting financial effect are disclosed in the notes to the financial statements.
(b) Basis of preparationThe financial statements have been prepared on the accrual basis of accounting using the historical cost convention, except for land and buildings and infrastructure which have been measured at fair value.
The accounting policies adopted in the preparation of the financial statements have been consistently applied throughout all periods presented unless otherwise stated.
The financial statements are presented in Australian dollars and all values are rounded to the nearest thousand dollars ($’000).
Note 4 ‘Judgements made by management in applying accounting policies’ discloses judgements that have been made in the process of applying the Authority’s accounting policies resulting in the most significant effect on amounts recognised in the financial statements.
Note 5 ‘Key sources of estimation uncertainty’ discloses key assumptions made concerning the future, and other key sources of estimation uncertainty at the end of the reporting period, that have a significant risk of causing a material adjustment to the carrying amounts of assets and liabilities within the next reporting period.
(c) Reporting entityThe reporting entity comprises WorkCover Western Australia Authority.
The financial statements represent transactions of the Workers’ Compensation and Injury Management General Account established under Section 106 of the Workers’ Compensation and Injury Management Act 1981, and the Supplementation Fund established under Section 5 of the Employers’ Indemnity Supplementation Fund Act 1980.
Trust Accounts under Section 110 of the Workers’ Compensation and Injury Management Act 1981 are administered independently of the General Account and Supplementation Fund. See note 39 ‘Workers’ Compensation & Injury Management Trust Account’ for transactions relating to the Trust Account.
(d) IncomeRevenue recognitionRevenue is recognised and measured at the fair value of consideration received or receivable. Revenue is recognised for the major business activities as follows:
Insurer contributions and supplementation fund leviesRevenue is recognised when the amount becomes due and payable.
Provision of servicesRevenue is recognised on delivery of the service to the client or by reference to the stage of completion of the transaction.
Grants, donations, gifts and other non-reciprocal contributionsRevenue is recognised at fair value when the Authority obtains control over the assets comprising the contributions, usually when cash is received.
Other non-reciprocal contributions that are not contributions by owners are recognised at their fair value. Contributions of services are only recognised when a fair value can be reliably determined and the services would be purchased if not donated.
Recoveries from uninsured employersRevenue is recognised on receipt of the recovered monies.
InterestRevenue is recognised as the interest accrues.
GainsRealised and unrealised gains are usually recognised on a net basis. These include gains arising on the disposal of non-current assets and some revaluations of non-current assets.
The effect of an actuarial assessed decrease in the outstanding claims liability is included in the Statement of Comprehensive Income as a Gain. Refer to Provisions – Employers’ Indemnity Supplementation Fund and General Account.
Notes to the financial statements
113
GGG ChecklistIntroduction Agency in focus Scheme performance
Report on operations
Opportunities and challenges
Disclosures and legal compliance
Key performance indicators
Financial statements and notes

(e) Property, plant and equipment and vehicles
Capitalisation/expensing of assetsItems of property, plant and equipment and vehicles costing $5,000 or more are recognised as assets and the cost of utilising assets is expensed (depreciated) over their useful lives. Items of property, plant and equipment and vehicles costing less than $5,000 are immediately expensed direct to the Statement of Comprehensive Income (other than where they form part of a group of similar items which are significant in total).
Initial recognition and measurementProperty, plant and equipment and vehicles are initially recognised at cost.
For items of property, plant and equipment and vehicles acquired at no cost or for nominal cost, the cost is the fair value at the date of acquisition.
Subsequent measurementSubsequent to initial recognition as an asset, the revaluation model is used for the measurement of land and buildings and historical cost for all other property, plant and equipment. Land and buildings are carried at fair value less accumulated depreciation (buildings only) and accumulated impairment losses. All other items of property, plant and equipment are stated at historical cost less accumulated depreciation and accumulated impairment losses.
Where market-based evidence is available, the fair value of land and buildings is determined on the basis of current market values determined by reference to recent market transactions. When buildings are revalued by reference to recent market transactions, the accumulated depreciation is eliminated against the gross carrying amount of the asset and the net amount restated to the revalued amount.
In the absence of market-based evidence, fair value of land and buildings is determined on the basis of existing use. This normally applies where buildings are specialised or where land use is restricted. Fair value for existing use buildings is determined by reference to the cost of replacing the remaining future economic benefits embodied in the asset, i.e. the depreciated replacement cost. Where the fair value of buildings is determined on the depreciated replacement cost basis, the gross carrying amount and the accumulated depreciation are restated proportionately with the change in the gross carrying amount of the asset.
(f) Intangible assetsCapitalisation/expensing of assetsAcquisitions of intangible assets costing $5,000 or more and internally generated intangible assets costing $50,000 or more are capitalised. The cost of utilising the assets is expensed (amortised) over their useful lives. Costs incurred below these thresholds are immediately expensed directly to the Statement of Comprehensive Income.
Intangible assets are initially recognised at cost. For assets acquired at no cost or for nominal cost, the cost is their fair value at the date of acquisition.
The cost model is applied for subsequent measurement requiring the asset to be carried at cost less any accumulated amortisation and accumulated impairment losses.
Amortisation for intangible assets with finite useful lives is calculated for the period of the expected benefit (estimated useful life which is reviewed annually) on the straight line basis. All intangible assets controlled by the Authority have a finite useful life and zero residual value.
The expected useful lives for each class of intangible asset are:
Licences up to 10 years
Software (a) 3 to 10 years
Website costs 3 to 5 years
(a) Software that is not integral to the operation of any related hardware
LicencesLicences have a finite useful life and are carried at cost less accumulated amortisation and accumulated impairment losses.
Computer softwareSoftware that is an integral part of the related hardware is recognised as property, plant and equipment. Software that is not an integral part of the related hardware is recognised as an intangible asset. Software costing less than $5,000 is expensed in the year of acquisition.
Land and buildings are independently valued annually by the Western Australian Land Information Authority (Landgate - Valuation Services) and recognised annually to ensure that the carrying amount does not differ materially from the asset’s fair value at the end of the reporting period.
The most significant assumptions and judgements in estimating fair value are made in assessing whether to apply the existing use basis to assets and in determining estimated economic life. Professional judgment by the valuer is required where the evidence does not provide a clear distinction between market type assets and existing use assets.
DerecognitionUpon disposal or de-recognition of an item of property, plant and equipment, any revaluation surplus relating to that asset is retained in the asset revaluation surplus.
Asset revaluation surplusThe asset revaluation surplus is used to record increments and decrements on the revaluation of non-current assets on a class of assets basis.
DepreciationAll non-current assets having a limited useful life are systematically depreciated over their estimated useful lives in a manner that reflects the consumption of their future economic benefits.
Depreciation is calculated using the straight line method, using rates that are reviewed annually. Estimated useful lives for each class of depreciable asset are:
Buildings 25 years
Plant and equipment 5 to 15 years
Information technology - Hardware 3 to 5 years
Information technology - Software (a) 3 to 10 years
Motor vehicles 6 to 7 years
(a) Software that is integral to the operation of related hardware
Land is not depreciated.
114
GGG ChecklistIntroduction Agency in focus Scheme performance
Report on operations
Opportunities and challenges
Disclosures and legal compliance
Key performance indicators
Financial statements and notes

Development costsResearch costs are expensed as incurred. Development costs incurred for an individual project are carried forward when the future economic benefits can reasonably be regarded as assured and the total project costs are likely to exceed $50,000. Other development costs are expensed as incurred.
Website costsWebsite costs are charged as expenses when they are incurred unless they relate to the acquisition or development of an asset when they may be capitalised and amortised. Costs in relation to feasibility studies during the planning phase of a website, and ongoing costs of maintenance during the operating phase are expensed. Costs incurred in building or enhancing a website that can be reliably measured, are capitalised to the extent that they represent probable future economic benefits.
(g) Impairment of assetsProperty, plant and equipment are tested for any indication of impairment at the end of each reporting period. Where there is an indication of impairment, the recoverable amount is estimated. Where the recoverable amount is less than the carrying amount, the asset is considered impaired and is written down to the recoverable amount and an impairment loss is recognised. Where an asset measured at cost is written down to recoverable amount, an impairment loss is recognised in profit or loss. Where a previously revalued asset is written down to recoverable amount, the loss is recognised as a revaluation decrement in other comprehensive income. As the Authority is a not-for-profit entity, unless a specialised asset has been identified as a surplus asset, the recoverable amount is the higher of an asset’s fair value less costs to sell and depreciated replacement cost.
The risk of impairment is generally limited to circumstances where an asset’s depreciation is materially understated, where the replacement cost is falling or where there is a significant change in useful life. Each relevant class of assets is reviewed annually to verify that the accumulated depreciation/amortisation reflects the level of consumption or expiration of asset’s future economic benefits and to evaluate any impairment risk from falling replacement costs.
Intangible assets with an indefinite useful life and intangible assets not yet available for use are tested for impairment at the end of each reporting period irrespective of whether there is any indication of impairment.
The recoverable amount of assets identified as surplus assets is the higher of fair value less costs to sell and the present value of future cash flows expected to be derived from the asset. Surplus assets carried at fair value have no risk of material impairment where fair value is determined by reference to market-based evidence. Surplus assets at cost are tested for indications of impairment at the end of each reporting period.
(h) LeasesThe Authority has not entered into any finance lease arrangements.
The Authority has not entered into any operating lease arrangements.
(i) Financial instrumentsIn addition to cash, the Authority has three categories of financial instrument:
• Loans and receivables;• Held-to-maturity investments (term deposits); and• Financial liabilities measured at amortised cost.
These financial instruments have been disaggregated in the following classes:
Financial Assets
• Cash and cash equivalents• Restricted cash and cash equivalents• Receivables• Term deposits
Financial Liabilities
• Payables
Initial recognition and measurement of financial instruments is at fair value which normally equates to the transaction cost or the face value. Subsequent measurement is at amortised cost using the effective interest method.
The fair value of short-term receivables and payables is the transaction cost or the face value because there is no interest rate applicable and subsequent measurement is not required as the effect of discounting is not material.
(j) Cash and cash equivalentsFor the purpose of the Statement of Cash Flows, cash and cash equivalent (and restricted cash and cash equivalent) assets comprise cash on hand and short-term deposits with original maturities of three months or less that are readily convertible to a known amount of cash and which are subject to insignificant risk of changes in value.
(k) Accrued salariesAccrued salaries (refer to note 27 ‘Payables’) represent the amount due to staff but unpaid at the end of the financial year. Accrued salaries are settled within a fortnight of the financial year end. The Authority considers the carrying amount of accrued salaries to be equivalent to its fair value.
(l) ReceivablesReceivables are recognised at original invoice amount less an allowance for any uncollectible amounts (i.e. impairment). The collectability of receivables is reviewed on an ongoing basis and any receivables identified as uncollectible are written-off against the allowance account. The allowance for uncollectible amounts (doubtful debts) is raised when there is objective evidence that the Authority will not be able to collect the debts. The carrying amount is equivalent to fair value as it is due for settlement within 30 days.
(m) Investments and other financial assets
Other financial assets (refer to note 22) represents the cash investments by the Authority.
The Authority maintains cash balances to meet general operational costs throughout the year, the future settlement of existing liabilities and asset replacements. The cash balances are invested into term deposits that range from 90 days to 365 days.
The Authority assesses at each balance date whether there is objective evidence that a financial asset or group of financial assets is impaired.
(n) PayablesPayables are recognised at the amounts payable when the Authority becomes obliged to make future payments as a result of a purchase of assets or services. The carrying amount is equivalent to fair value, as settlement is generally within 30 days.
115
GGG ChecklistIntroduction Agency in focus Scheme performance
Report on operations
Opportunities and challenges
Disclosures and legal compliance
Key performance indicators
Financial statements and notes

(o) ProvisionsProvisions are liabilities of uncertain timing or amount and are recognised where there is a present legal or constructive obligation as a result of a past event and when the outflow of resources embodying economic benefits is probable and a reliable estimate can be made of the amount of the obligation. Provisions are reviewed at the end of each reporting period.
Provisions – employee benefitsAll annual leave and long service leave provisions are in respect of employees’ services up to the end of the reporting period.
Annual leaveAnnual leave is not expected to be settled wholly within 12 months after the end of the reporting period and is therefore considered to be ‘other long term employee benefits’. The annual leave liability is recognised and measured at the present value of amounts expected to be paid when the liabilities are settled using the remuneration rate expected to apply at the time of settlement.
When assessing expected future payments consideration is given to expected future wage and salary levels including non-salary components such as employer superannuation contributions, as well as the experience of employee departures and periods of service. The expected future payments are discounted using market yields at the end of the reporting period on national government bonds with terms to maturity that match, as closely as possible, the estimated future cash outflows.
The provision for annual leave is classified as a current liability as the Authority does not have an unconditional right to defer settlement of the liability for at least 12 months after the end of the reporting period.
Long service leaveLong service leave is not expected to be settled wholly within 12 months after the end of the reporting period is recognised and measured at the present value of amounts expected to be paid when the liabilities are settled using the remuneration rate expected to apply at the time of settlement.
When assessing expected future payments consideration is given to expected future wage and salary levels including non-salary components such as employer superannuation contributions, as well as the experience of employee departures and periods of service. The expected future payments are discounted using market yields at the end of the reporting period on national government bonds with terms to maturity that match, as closely as possible, the estimated future cash outflows.
Provisions – otherEmployment on-costsEmployment on-costs, including workers’ compensation insurance and payroll tax, are not employee benefits and are recognised separately as liabilities and expenses when the employment to which they relate has occurred. Employment on-costs are included as part of ‘Other expenses’ and are not included as part of the Authority’s ‘Employee benefits expense’. The related liability is included in ‘Employment on-costs provision’.
Provisions – Employers’ Indemnity Supplementation Fund and General AccountLiability for future claimsThe liability for outstanding claims is measured as the central estimate of the present value of expected future payments against claims incurred at the reporting date, with an additional risk margin to allow for the inherent uncertainty in the central estimate. The expected future payments include those in relation to claims reported but not yet paid, claims incurred but not reported (IBNR), claims incurred but not enough reported (IBNER) and anticipated claims handling costs.
Claims handling costs include costs that can be associated directly with individual claims, such as legal and other professional fees, and costs that can only be indirectly associated with individual claims, such as claims administration costs. The expected future payments are discounted to present value using a risk free rate.
The effect of an actuarial assessed increase in the outstanding claims liability or changes in the discount rate are included in the Statement of Comprehensive Income under Claims expense. The effect of an actuarial assessed decrease in the outstanding claims liability is included in the Statement of Comprehensive Income under Gains.
Unconditional long service leave provisions are classified as current liabilities as the Authority does not have an unconditional right to defer settlement of the liability for at least 12 months after the end of the reporting period. Pre-conditional and conditional long service leave provisions are classified as non-current liabilities because the Authority has an unconditional right to defer the settlement of the liability until the employee has completed the requisite years of service.
SuperannuationThe Government Employees Superannuation Board (GESB) and other funds providers administer public sector superannuation arrangements in Western Australia in accordance with legislative requirements. Eligibility criteria for membership in particular schemes for public sector employees vary according to commencement and implementation dates.
Eligible employees contribute to the Pension Scheme, a defined benefit pension scheme closed to new members since 1987, or to the Gold State Superannuation Scheme (GSS), a defined benefit lump sum scheme closed to new members since 1995.
Employees commencing employment prior to 16 April 2007 who were not members of either the Pension Scheme or the GSS became non-contributory members of the West State Superannuation Scheme (WSS). Employees commencing employment on or after 16 April 2007 became members of the GESB Super Scheme (GESBS). From 30 March 2012, existing members of the WSS or GESBS and new employees became able to choose their preferred superannuation fund provider. The Authority makes contributions to GESB or other funds providers on behalf of employees in compliance with the Commonwealth Government’s Superannuation Guarantee (Administration) Act 1992. Contributions to these accumulation schemes extinguish the Authority’s liability for superannuation charges in respect of employees who are not members of the Pension Scheme or GSS.
The GSS is a defined benefit scheme for the purposes of employees and whole-of-government reporting. However, it is a defined contribution plan for agency purposes because the concurrent contributions (defined contributions) made by the Authority to GESB extinguishes the agency’s obligations to the related superannuation liability.
The Pension Scheme and the pre-transfer benefit for employees who transferred to the GSS Scheme are defined benefit schemes. These benefits are wholly unfunded and the liabilities for future payments are provided at the end of the reporting period. The liabilities under these schemes have been calculated separately for each scheme annually by PricewaterhouseCoopers Actuaries using the projected unit credit method.
The expected future payments are discounted to present value using market yields at the end of the reporting period on national government bonds with terms to maturity that match, as closely as possible, the estimated future cash outflows.
116
GGG ChecklistIntroduction Agency in focus Scheme performance
Report on operations
Opportunities and challenges
Disclosures and legal compliance
Key performance indicators
Financial statements and notes

(p) Superannuation expenseSuperannuation expense is recognised in profit or loss of the Statement of Comprehensive Income for defined contribution plans, including the concurrent payment of employer contributions to the GSS scheme, as and when the contributions fall due.
For defined benefit plans (the Pension Scheme and the pre-transfer component of the GSS), changes in the defined benefit obligation are recognised in the Statement of Comprehensive Income either in profit or loss, or, other comprehensive income as follows:
Profit or loss:
• current service cost;• past service cost; and• interest cost.
Other comprehensive income:
• actuarial gains and losses.
(q) Comparative figuresComparative figures are, where appropriate, reclassified to be comparable with the figures presented in the current reporting period.
(r) Assets and services received free of charge or for nominal cost
Assets or services received free of charge or for nominal cost, that the Authority would otherwise purchase if not donated, are recognised as income at the fair value of the assets or services where they can be reliably measured. A corresponding expense is recognised for services received. Receipts of assets are recognised in the Statement of Financial Position.
Assets or services received from other State Government agencies are separately disclosed under Income from State Government in the Statement of Comprehensive Income.
(s) Provision for uninsured claims pursuant to Section 174
Provision is made to meet payments required under Section 174 of the Workers’ Compensation and Injury Management Act 1981 where Conciliation and Arbitration Services has made an order and the worker has not received the compensation due from the General Account at the end of the reporting period.
(t) Provision for Employers’ Indemnity Supplementation Fund (EISF)
The EISF was established by the Employers’ Indemnity Supplementation Fund Act 1980 (the Act) to provide for payment of workers’ compensation claims in Western Australia. Provision is made to meet the claim costs in the event an approved insurer collapses and to waterfront workers suffering from asbestos related diseases under the Waterfront Workers’ (Compensation for Asbestos Related Diseases) Act 1986.
3. Segment informationIn accordance with AASB 8 and TI 1101, the Authority has provided summary information at note 44 for each of the Authority’s services inclusive of the General and Supplementation Fund.
4. Judgements made by management in applying accounting policies
The preparation of financial statements requires management to make judgements about the application of accounting policies that have a significant effect on the amounts recognised in the financial statements. The Authority evaluates these judgements regularly.
The judgements that have been made in the process of applying accounting policies that have the most significant effect on the amounts recognised in the financial report include:
i. The Authority uses the services of an actuary for the purpose of determining the liability for workers’ compensation claims for asbestos and non-asbestos claims for the General Account and Supplementation Fund.
ii. The Authority has adopted a policy of obtaining actuarial assessment of employee entitlements.
5. Key sources of estimation uncertainty
Key estimates and assumptions concerning the future are based on historical experience and various other factors that have a significant risk of causing a material adjustment to the carrying amount of assets and liabilities within the next reporting period.
Long Service LeaveSeveral estimations and assumptions used in calculating the Authority’s long service leave provision include expected future salary rates, discount rates, employee retention rates and expected future payments. Changes in these estimations and assumptions may impact on the carrying amount of the long service leave provision.
Defined benefit superannuation plansIn determining the Authority’s ultimate cost of its defined superannuation plans, actuarial assumptions are required to be made. The principal actuarial assumptions used are disclosed in note 28 ‘Provisions’.
Assessment of Supplementation Fund and General Account future claims liabilityThe Authority’s risk in relation to outstanding claims liability arising from future claims liability in respect to the Supplementation Fund and General Account has been determined by actuarial assessment. The principal actuarial assumptions used are disclosed in note 28 ‘Provisions’.
117
GGG ChecklistIntroduction Agency in focus Scheme performance
Report on operations
Opportunities and challenges
Disclosures and legal compliance
Key performance indicators
Financial statements and notes

6. Disclosure of changes in accounting policy and estimatesInitial application of an Australian Accounting StandardThe Authority has applied the following Australian Accounting Standards effective, or adopted, for annual reporting periods beginning on or after 1 July 2016 that impacted on the Authority.
AASB 1057 Application of Australian Accounting Standards
This Standard lists the application paragraphs for each other Standard (and Interpretation), grouped where they are the same. There is no financial impact.
AASB 2014-3 Amendments to Australian Accounting Standards Accounting for Acquisitions of Interests in Joint Operations [AASB 1 & 11]
The Authority establishes Joint Operations in pursuit of its objectives and does not routinely acquire interests in Joint Operations. Therefore, there is no financial impact on application of the Standard.
AASB 2014-4 Amendments to Australian Accounting Standards Clarification of Acceptable Methods of Depreciation and Amortisation [AASB 116 & 138]
The adoption of this Standard has no financial impact for the Authority as depreciation and amortisation is not determined by reference to revenue generation, but by reference to consumption of future economic benefits.
AASB 2014-9 Amendments to Australian Accounting Standards Equity Method in Separate Financial Statements [AASB 1, 127 & 128]
This Standard amends AASB 127, and consequentially amends AASB 1 and AASB 128, to allow entities to use the equity method of accounting for investments in subsidiaries, joint ventures and associates in their separate financial statements. As the Authority has no joint ventures and associates, the application of the Standard has no financial impact.
AASB 2015-1 Amendments to Australian Accounting Standards - Annual Improvements to Australian Accounting Standards 2012-2014 Cycle [AASB 1, 2, 3, 5, 7, 11, 110, 119, 121, 133, 134, 137 & 140]
These amendments arise from the issuance of International Financial Reporting Standard Annual Improvements to IFRSs 2012 2014 Cycle in September 2014, and editorial corrections. The Authority has determined that the application of the Standard has no financial impact.
AASB 2015-2 Amendments to Australian Accounting Standards Disclosure Initiative: Amendments to AASB 101 [AASB 7, 101, 134 & 1049]
This Standard amends AASB 101 to provide clarification regarding the disclosure requirements in AASB 101. Specifically, the Standard proposes narrow-focus amendments to address some of the concerns expressed about existing presentation and disclosure requirements and to ensure entities are able to use judgement when applying a Standard in determining what information to disclose in their financial statements. There is no financial impact.
AASB 2015-6 Amendments to Australian Accounting Standards Extending Related Party Disclosures to Not-for-Profit Public Sector Entities [AASB 10, 124 & 1049]
The amendments extend the scope of AASB 124 to include application by not-for-profit public sector entities. Implementation guidance is included to assist application of the Standard by not-for-profit public sector entities. There is no financial impact.
AASB 2015-10 Amendments to Australian Accounting Standards Effective Date of Amendments to AASB 10 & 128
This Standard defers the mandatory effective date (application date) of amendments to AASB 10 & AASB 128 that were originally made in AASB 2014-10 so that the amendments are required to be applied for annual reporting periods beginning on or after 1 January 2018 instead of 1 January 2016. There is no financial impact.
118
GGG ChecklistIntroduction Agency in focus Scheme performance
Report on operations
Opportunities and challenges
Disclosures and legal compliance
Key performance indicators
Financial statements and notes

Future impact of Australian Accounting Standards not yet operativeThe Authority cannot early adopt an Australian Accounting Standard unless specifically permitted by TI 1101 Application of Australian Accounting Standards and Other Pronouncements or by or by an exemption from TI 1101. By virtue of a limited exemption, the Authority has early adopted AASB 2015-7 Amendments to Australian Accounting Standards - Fair Value Disclosures of Not-for-Profit Public Sector Entities. Where applicable, the Authority plans to apply the following Australian Accounting Standards from their application date.
TitleOperative for reporting periods beginning on/after
AASB 9 Financial Instruments
This Standard supersedes AASB 139 Financial Instruments: Recognition and Measurement, introducing a number of changes to accounting treatments.
The mandatory application date of this Standard is currently 1 January 2018 after being amended by AASB 2012-6, AASB 2013-9, and AASB 2014-1 Amendments to Australian Accounting Standards. The Authority has not yet determined the application or the potential impact of the Standard.
1 Jan 2018
AASB 15 Revenue from Contracts with Customers
This Standard establishes the principles that the Authority shall apply to report useful information to users of financial statements about the nature, amount, timing and uncertainty of revenue and cash flows arising from a contract with a customer.
The Authority’s income is principally derived from appropriations which will be measured under AASB 1058 Income of Not-for Profit Entities and will be unaffected by this change. However, the Authority has not yet determined the potential impact of the Standard on ‘User charges and fees’ and ‘Sales’ revenues. In broad terms, it is anticipated that the terms and conditions attached to these revenues will defer revenue recognition until the Authority has discharged its performance obligations.
The Authority has not yet determined the application or the potential impact.
1 Jan 2019
AASB 16 Leases
This Standard introduces a single lessee accounting model and requires a lessee to recognise assets and liabilities for all leases with a term of more than 12 months, unless the underlying asset is of low value.
The authority has not entered into any operating or finance lease arrangements.
1 Jan 2019
AASB 1058 Income of Not-for-Profit Entities
This Standard clarifies and simplifies the income recognition requirements that apply to not for profit (NFP) entities, more closely reflecting the economic reality of NFP entity transactions that are not contracts with customers. Timing of income recognition is dependent on whether such a transaction gives rise to a liability, or a performance obligation (a promise to transfer a good or service), or, an obligation to acquire an asset. The Authority has not yet determined the application or the potential impact of the Standard.
1 Jan 2019
AASB 2010-7 Amendments to Australian Accounting Standards arising from AASB 9 (December 2010) [AASB 1, 3, 4, 5, 7, 101, 102, 108, 112, 118, 120, 121, 127, 128, 131, 132, 136, 137, 139, 1023 & 1038 and Int 2, 5,10, 12, 19 & 127]
This Standard makes consequential amendments to other Australian Accounting Standards and Interpretations as a result of issuing AASB 9 in December 2010.
The mandatory application date of this Standard has been amended by AASB 2012-6 and AASB 2014-1 to 1 January 2018. The Authority has not yet determined the application or the potential impact of the Standard.
1 Jan 2018
119
GGG ChecklistIntroduction Agency in focus Scheme performance
Report on operations
Opportunities and challenges
Disclosures and legal compliance
Key performance indicators
Financial statements and notes

TitleOperative for reporting periods beginning on/after
AASB 2014-1 Amendments to Australian Accounting Standards
Part E of this Standard makes amendments to AASB 9 and consequential amendments to other Standards. It has not yet been assessed by the Authority to determine the application or potential impact of the Standard.
1 Jan 2018
AASB 2014-5 Amendments to Australian Accounting Standards arising from AASB 15
This Standard gives effect to the consequential amendments to Australian Accounting Standards (including Interpretations) arising from the issuance of AASB 15. The Authority has not yet determined the application or the potential impact of the Standard.
1 Jan 2018
AASB 2014-7 Amendments to Australian Accounting Standards arising from AASB 9 (December 2014)
This Standard gives effect to the consequential amendments to Australian Accounting Standards (including Interpretations) arising from the issuance of AASB 9 (December 2014). The Authority has not yet determined the application or the potential impact of the Standard.
1 Jan 2018
AASB 2014-10 Amendments to Australian Accounting Standards – Sale or Contribution of Assets between an Investor and its Associate or Joint Venture [AASB 10 & 128]
This Standard amends AASB 10 and AASB 128 to address an inconsistency between the requirements in AASB 10 and those in AASB 128 (August 2011), in dealing with the sale or contribution of assets between an investor and its associate or joint venture. The mandatory effective date (application date) for the Standard has been deferred to 1 January 2018 by AASB 2015-10. The Authority has determined that the Standard has no financial impact.
1 Jan 2018
AASB 2015-8 Amendments to Australian Accounting Standards – Effective Date of AASB 15
This Standard amends the mandatory effective date (application date) of AASB 15 Revenue from Contracts with Customers so that AASB 15 is required to be applied for annual reporting periods beginning on or after 1 January 2018 instead of 1 January 2017. For Not-For-Profit entities, the mandatory effective date has subsequently been amended to 1 January 2019 by AASB 2016-7. The Authority has not yet determined the application or the potential impact of AASB 15.
1 Jan 2019
AASB 2016-2 Amendments to Australian Accounting Standards – Disclosure Initiative: Amendments to AASB 107
This Standard amends AASB 107 Statement of Cash Flows (August 2015) to require disclosures that enable users of financial statements to evaluate changes in liabilities arising from financing activities, including both changes arising from cash flows and non-cash changes. There is no financial impact.
1 Jan 2017
AASB 2016-3 Amendments to Australian Accounting Standards – Clarifications to AASB 15
This Standard clarifies identifying performance obligations, principal versus agent considerations, timing of recognising revenue from granting a licence, and, provides further transitional provisions to AASB 15. The Authority has not yet determined the application or the potential impact.
1 Jan 2018
AASB 2016-4 Amendments to Australian Accounting Standards – Recoverable Amount of Non-Cash-Generating Specialised Assets of Not-for-Profit Entities
This Standard clarifies that the recoverable amount of primarily non-cash- generating assets of not-for-profit entities, which are typically specialised in nature and held for continuing use of their service capacity, is expected to be materially the same as fair value determined under AASB 13 Fair Value Measurement. The Authority has not yet determined the application or the potential impact.
1 Jan 2017
120
GGG ChecklistIntroduction Agency in focus Scheme performance
Report on operations
Opportunities and challenges
Disclosures and legal compliance
Key performance indicators
Financial statements and notes

TitleOperative for reporting periods beginning on/after
AASB 2016-7 Amendments to Australian Accounting Standards Deferral of AASB 15 for Not-for-Profit Entities
This Standard amends the mandatory effective date (application date) of AASB 15 and defers the consequential amendments that were originally set out in AASB 2014-5 Amendments to Australian Accounting Standards arising from AASB 15 for not-for-profits entities to annual reporting periods beginning on or after 1 January 2019, instead of 1 January 2018. There is no financial impact.
1 Jan 2017
AASB 2016-8 Amendments to Australian Accounting Standards – Australian Implementation Guidance for Not-for-Profit Entities
This Standard inserts Australian requirements and authoritative implementation guidance for not-for-profit entities into AASB 9 and AASB 15. This guidance assists not-for-profit entities in applying those Standards to particular transactions and other events. There is no financial impact.
1 Jan 2019
AASB 2017-2 Amendments to Australian Accounting Standards – Further Annual Improvements 2014-2016 Cycle
This Standard clarifies the scope of AASB 12 by specifying that the disclosure requirements apply to an entity’s interests in other entities that are classified as held for sale, held for distribution to owners in their capacity as owners or discontinued operations in accordance with AASB 5. There is no financial impact.
1 Jan 2017
121
GGG ChecklistIntroduction Agency in focus Scheme performance
Report on operations
Opportunities and challenges
Disclosures and legal compliance
Key performance indicators
Financial statements and notes

7. Interest revenue
2017 2016
$000 $000
General Account 624 614
Employers' Indemnity Supplementation Fund (see note 31) 1,696 1,928
2,320 2,542
8. Other revenue
General Account
Recoveries from uninsured employers 40 363
Other (a) 822 954
862 1,317
(a) Other is mainly comprised of fines, infringements, avoided premiums and contribution from Executive Vehicle Scheme.
9. Employers' Indemnity Supplementation Fund
Surcharge (i) - -
Recovery (ii) 120 2,057
120 2,057
(i) Represents funds collected from the Supplementation Fund Levy.(ii) Dividends received from the liquidation of HIH, CIC and FAI Insurance.
10. Claims expenseWorkers’ compensation claims - Employers’ Indemnity Supplementation Fund (see note 28 & 31)
1,297 1,279
Uninsured claims - General Fund (see note 28) 723 733
2,020 2,012
11. Net gain/(loss) on disposal of non-current assets
2017 2016
$000 $000
Proceeds from Disposal of Non-Current Assets
Vehicles 86 55
86 55
Costs of Disposal of Non-Current Assets
Equipment - (3)
IT hardware - (19)
Vehicles (91) (62)
(91) (84)
Net loss (5) (29)
12. Employee benefits expense
Wages and salaries (a) 13,013 13,386
Superannuation - defined contribution plans (b) 1,355 1,337
Superannuation - defined benefit plans (see note 28 'Provisions') 126 171
14,494 14,894
(a) Includes the value of the fringe benefit to the employee plus the fringe benefits tax component and leave entitlements, including the superannuation contribution component.
(b) Defined contribution plans include West State, Gold State and GESB Super Scheme (contributions paid). Employment on-costs such as workers’ compensation insurance are included at note 17 ‘Other expenses’. The employment on-costs liability is included at note 28 ‘Provisions’.
122
GGG ChecklistIntroduction Agency in focus Scheme performance
Report on operations
Opportunities and challenges
Disclosures and legal compliance
Key performance indicators
Financial statements and notes

13. Supplies and services2017 2016
$000 $000
Communications 153 114
Consultants and contractors 1,532 2,022
Consumables 765 737
Insurance 72 45
Training 113 168
Travel 37 48
Other 50 52
2,722 3,186
14. Depreciation and amortisation expenseDepreciation
Plant, equipment and vehicles 393 219
Buildings 173 234
Total depreciation 566 453
Amortisation
Intangible assets 405 466
Total amortisation 405 466
Total depreciation and amortisation 971 919
17. Other expenses
General Account
Employment on-costs (a) 828 829
Seminars 28 43
Doubtful debts expense 63 61
Sitting fees 97 115
Staff wellness programs 36 73
Audit Fees 204 179
Administration fee paid to Insurance Commission of WA for Uninsured General Fund Claims
53 89
Other 59 32
Employers’ Indemnity Supplementation Fund (see note 31)
Administration fee paid to Insurance Commission of WA 14 7
1,382 1,428
(a) Includes worker’s compensation insurance, payroll tax and other employment on-costs. The on-costs liability associated with the recognition of annual and long service leave liability is included at note 28 ‘Provisions’. Superannuation contributions accrued as part of the provision for leave are employee benefits and are not included in employment on-costs.
15. Accommodation expensesOutgoings 279 247
Repairs and maintenance 214 175
Other 154 153
647 575
16. Grants and subsidies2017 2016
$000 $000
Monash university - GP clinical tools project 50 50
50 50
123
GGG ChecklistIntroduction Agency in focus Scheme performance
Report on operations
Opportunities and challenges
Disclosures and legal compliance
Key performance indicators
Financial statements and notes
18. Services received free of charge2017 2016
$000 $000
Services received free of charge from the State Solicitor’s Office 114 170
114 170
19. Cash and cash equivalentsBank accounts 2,428 2,147
Cash on hand 1 1
Term deposits (a) 8,151 13,549
10,580 15,697
(a) Term deposits are held in order to fund payments as they become due and payable. The term deposits range from 30 days to 3 months.
20. Restricted cash and cash equivalentsCURRENT
Employers' Indemnity Supplementation Fund (See note 31)
Cash balance at Treasury 85,736 85,233
Commonwealth Funding - Indian Ocean Territories (Christmas & Cocos-Keeling Islands)
The Commonwealth Government provides funding in accordance with the Service Delivery Arrangement. Under the arrangement the Authority provides a range of workers’ compensation related services.
Unspent funds for Indian Ocean Territories 5 28
Commonwealth Funding - Paid Parental Leave Scheme
Cash held 1 1
85,742 85,262
21. Receivables2017 2016
$000 $000
CURRENT
General Account
Receivables 158 36
Prepayments 75 -
Fines and penalties 570 551
Allowance for impairment of receivables (311) (274)
Accrued interest 156 196
GST receivable 12 28
660 537
Employers' Indemnity Supplementation Fund (see note 31)
Accrued interest 424 510
GST receivable 60 50
484 560
Total current 1,144 1,097
NON-CURRENT
General Account
Receivables 418 418
Allowance for impairment of receivables (418) (418)
Total non-current - -
Total receivables 1,144 1,097
Reconciliation of changes in allowance for impairment of receivables
Balance at start of period 274 212
Doubtful debts expense 63 62
Amounts written off during the period (26) -
Balance at end of period 311 274
The Authority does not hold any collateral as security or other credit enhancements relating to receivables.
124
GGG ChecklistIntroduction Agency in focus Scheme performance
Report on operations
Opportunities and challenges
Disclosures and legal compliance
Key performance indicators
Financial statements and notes

22. Other financial assets2017 2016
$000 $000
CURRENT
At Cost:
Term deposits (a) 14,529 8,385
14,529 8,385
(a) The term deposits range from 90 days to 365 days.
23. Property, plant, equipment and vehiclesLand
At fair value (a) 13,800 15,000
13,800 15,000
Buildings
At fair value (a) 1,700 2,500
Accumulated depreciation - -
1,700 2,500
Plant, equipment & vehicles
At cost 3,354 3,349
Accumulated depreciation (1,072) (756)
2,282 2,593
Work in progress
At cost - -
- -
17,782 20,093
(a) Land and buildings were revalued as at 30 June 2017 by the Western Australian Land Information Authority. The property was valued on 20 June 2017. The fair value of all land and buildings have been determined by reference to recent market transactions.
RECONCILIATIONS
Reconciliations of carrying amounts of property, plant, equipment and vehicles at the beginning and end of the reporting period are set out in the table below:
Land BuildingsWork in
Progress
Plant, equipment
and vehicles Total
$000 $000 $000 $000 $000
2017
Carrying amount at start of period 15,000 2,500 - 2,593 20,093
Additions - - - 173 173 Transfers - - - -
Disposals - - - (91) (91)
Revaluation increments/(decrements) (1,200) (627) - - (1,827)
Depreciation - (173) - (393) (566)
Carrying amount at end of period 13,800 1,700 - 2,282 17,782
Land BuildingsWork in
Progress
Plant, equipment
and vehicles Total
$000 $000 $000 $000 $000
2016
Carrying amount at start of period 15,400 3,600 22 1,739 20,761
Additions - 22 983 174 1,179 Transfers 22 (1,005) 983 -
Disposals - - - (84) (84)
Revaluation increments/(decrements) (400) (910) - - (1,310)
Depreciation - (234) - (219) (453)
Carrying amount at end of period 15,000 2,500 - 2,593 20,093
125
GGG ChecklistIntroduction Agency in focus Scheme performance
Report on operations
Opportunities and challenges
Disclosures and legal compliance
Key performance indicators
Financial statements and notes

25. Intangible assets 2017 2016
$000 $000
Licences
At cost 170 170
Accumulated amortisation (106) (85)
64 85
Computer software
At cost 4,351 3,828
Transfer (46) -
Accumulated amortisation (1,888) (1,546)
2,417 2,282
Website(a)
At cost - -
Transfer 46
Accumulated amortisation (42) -
4 -
2,485 2,367
(a) The Authority’s Website is reported as a separate intangible asset class in 2016/17. The Website’s cost less accumulated amortisation was previously reported under Computer Software (2016: $19,661).
24. Fair value measurementsAssets measured at fair value:
Level 1 Level 2 Level 3Fair value at
end of period
$000 $000 $000 $000
2017
Land (Note 23) 13,800 13,800
Buildings (Note 23) 1,700 1,700
- 15,500 - 15,500
2016
Land (Note 23) 15,000 15,000
Buildings (Note 23) 2,500 2,500
- 17,500 - 17,500
There were no transfers between Levels 1, 2 or 3 during the current and the previous periods.
Valuation techniques to derive Level 2 fair values
Level 2 fair values of Land and Buildings (office accommodation) are derived using the market approach. Market evidence of sales prices/commercial rents of comparable land and buildings (office accommodation) in close proximity is used to determine price per square metre.
Valuation Processes
There were no changes in valuation techniques during the period.
126
GGG ChecklistIntroduction Agency in focus Scheme performance
Report on operations
Opportunities and challenges
Disclosures and legal compliance
Key performance indicators
Financial statements and notes

27. Payables2017 2016
$000 $000
CURRENT
General Account
Trade payables 177 109
Accrued expenses 354 297
Accrued salaries 143 107
Other payables 26 33
Employers' Indemnity Supplementation Fund (see note 31)
Claim payments 104 89
804 635
26. Impairment of assetsThere were no indications of impairment to property, plant and equipment or intangible assets as at 30 June 2017.
The Authority held no goodwill or intangible assets with an indefinite useful life during the reporting period. At the end of the reporting period there were no intangible assets not yet available for use.
All surplus assets at 30 June 2017 have either been classified as assets held for sale or written-off.
2017 2016
$000 $000
RECONCILIATIONS:
Licences
Carrying amount at start of period 85 106
Additions - -
Amortisation expense (21) (21)
Carrying amount at end of period 64 85
Computer software
Carrying amount at start of period 2,282 2,728
Additions 523 -
Transfer (19)
Amortisation expense (369) (446)
Carrying amount at end of period 2,417 2,282
Website
Carrying amount at start of period - -
Additions - -
Transfer 19
Amortisation expense (15) -
Carrying amount at the end of period 4 -
127
GGG ChecklistIntroduction Agency in focus Scheme performance
Report on operations
Opportunities and challenges
Disclosures and legal compliance
Key performance indicators
Financial statements and notes

28. Provisions2017 2016
$000 $000
CURRENT
GENERAL ACCOUNT
Employee benefits provision
Annual leave (a) 394 396
Long service leave (b) 2,415 2,337
Superannuation (d) 562 629
3,371 3,362
Uninsured Workers (e) 1,128 906
1,128 906
Other provisions
Employment on-costs (c) 167 163
167 163
Employers’ Indemnity Supplementation Fund (see note 31)
Liability for estimated future claim payments 1,090 2,312
1,090 2,312
Total current provisions 5,756 6,743
2017 2016
$000 $000
NON-CURRENT
GENERAL ACCOUNT
Employee benefits provision
Long service leave (b) 547 628
Superannuation (d) 4,884 5,894
5,431 6,522
Uninsured Workers (e) 5,254 5,194
5,254 5,194
Other provisions
Employment on-costs (c) 33 37
33 37
Employers’ Indemnity Supplementation Fund (see note 31)
Liability for estimated future claim payments 12,324 14,633
12,324 14,633
Total non-current provisions 23,042 26,386
(a)
Annual leave liabilities have been classified as current as there is no unconditional right to defer settlement for at least 12 months after the reporting period. Assessments indicate that actual settlement of the liabilities is expected to occur as follows:
Within 12 months of the end of the reporting period 370 382
More than 12 months after the end of the reporting period 24 14
394 396
(b)
Long service leave liabilities have been classified as current where there is no unconditional right to defer settlement for at least 12 months after the end of the reporting period. Assessments indicate that actual settlement of the liabilities is expected to occur as follows:
Within 12 months of the end of the reporting period 975 871
More than 12 months after the end of the reporting period 1,987 2,094
2,962 2,965
128
GGG ChecklistIntroduction Agency in focus Scheme performance
Report on operations
Opportunities and challenges
Disclosures and legal compliance
Key performance indicators
Financial statements and notes

(c)
The settlement of annual and long service leave liabilities gives rise to the payment of employment on-costs including workers’ compensation insurance and payroll tax. The provision is the present value of expected future payments. The associated expense, apart from the unwinding of the discount (finance cost), is disclosed in note 17 ‘Other expenses’.
(d)
Defined benefit superannuation plans
Movements in the present value of the defined benefit obligation in the reporting period were as follows:
Pension Scheme
Pre-transfer benefit - Gold State
Superannuation Scheme
2017 2016 2017 2016
$000 $000 $000 $000
Liability at start of period 6,004 5,400 519 499
INCLUDED IN PROFIT OR LOSS:
Current service cost - - - -
Past service cost - - - -
Interest cost 117 157 9 15
117 157 9 15
INCLUDED IN OTHER COMPREHENSIVE INCOME:
Remeasurements loss (gain) recognised:
Actuarial losses/(gains) arising from:
demographic assumptions (322) - 1 -
financial assumptions (424) 728 (21) 11
experience adjustments (78) 39 95 (6)
(824) 767 75 5
Contributions:
Benefits Paid (330) (320) (124) -
(330) (320) (124) -
Liability at end of period 4,967 6,004 479 519
The Authority holds no plan assets, therefore the present value of the defined benefit obligation equals the net defined benefit liability. Employer contributions, to the Pension Scheme and the pre-transfer benefit for employees who transferred to the GSS, equal the benefits paid.
The principal actuarial assumptions used (expressed as weighted averages) were as follows:
Pension Scheme
Pre-transferbenefit - Gold State
Superannuation Scheme
2017 2016 2017 2016
Discount rate 2.60% 2.00% 2.60% 2.00%
Pension increases 2.50% 2.50%
Future salary increases 2.0% for the first year, 1.5% for the next 3 years and
4.2% thereafter
2.5% for the first 4 years and 4.0%
thereafter
2.0% for the first year, 1.5% for the next 3 years and
4.2% thereafter
2.5% for the first 4 years and 4.0%
thereafter
Average longevity at retirement age (65) for current pensioners (years)
Male 25.20 23.10 N/A N/A
Female 27.40 25.60 N/A N/A
Average longevity at retirement age (65) for current employees (years)
Male 25.20 23.10 N/A N/A
Female 27.40 25.60 N/A N/A
At 30 June 2017, the weighted-average duration of the defined benefit obligation was 12 years for Pension Scheme (2016: 13 years) and 4 years for Gold State Superannuation Scheme (2016: 5 years).
129
GGG ChecklistIntroduction Agency in focus Scheme performance
Report on operations
Opportunities and challenges
Disclosures and legal compliance
Key performance indicators
Financial statements and notes
The Pension Scheme and the pre-transfer benefit for the GSS expose the Authority to actuarial risks, such as salary risk, longevity risk and interest rate risk. The sensitivity analyses below have been determined based on reasonably possible changes of the respective assumptions occurring at the end of the reporting period, holding all other assumptions constant.
Defined Benefit Obligation
Pension Scheme
Pre-transferbenefit - Gold State
Superannuation Scheme
2017 2016 2017 2016
Increase Decrease Increase Decrease
$000 $000 $000 $000
Discount rate (1% movement) (532) 645 (19) 21
Future salary growth (1% movement) N/A N/A 19 (18)
Pension increases (1% movement) 639 (537) N/A N/A
Future longevity (1 year movement) 245 (208) N/A N/A
EMPLOYER FUNDING ARRANGEMENTS FOR THE DEFINED BENEFIT PLANS
The Pension Scheme and the pre-transfer benefit for the GSS in respect of individual plan participants are settled by the Authority on their retirement. Funding requirements are based on invoices provided to the Authority by GESB that represent the cost of benefits paid to members during the reporting period.
Employer contributions of $428K (2016: $297K) are expected to be paid to the Pension Scheme for the subsequent annual reporting period.
Employer contributions of $297K (2016: $317K) are expected to be paid to the Gold State Superannuation Scheme for the subsequent annual reporting period.
MOVEMENTS IN OTHER PROVISIONS
Movements in each class of provisions during the reporting period, other than employee benefits, are set out below.
2017 2016
$000 $000
Employers' Indemnity Supplementation Fund
Liability for estimated future claim payments
Carrying amount at start of period 16,945 18,002
Additional (decrease) in provisions recognised (2,504) (112)
Unwinding of the discount 266 340
Payments/other sacrifices of economic benefits (1,293) (1,285)
Carrying amount at end of period 13,414 16,945
Uninsured claims
Carrying amount at start of period 6,100 9,072
Additional increase/(decrease) in provisions recognised 714 (2,373)
Unwinding of the discount 95 171
Payments/other sacrifices of economic benefits (527) (770)
Carrying amount at end of period 6,382 6,100
Employment on-costs provision
Carrying amount at start of period 200 200
Additional provisions recognised 88 91
Unwinding of the discount 3 4
Payments/other sacrifices of economic benefits (91) (95)
Carrying amount at end of period 200 200
130
GGG ChecklistIntroduction Agency in focus Scheme performance
Report on operations
Opportunities and challenges
Disclosures and legal compliance
Key performance indicators
Financial statements and notes

(e)
Uninsured Workers
Part of the General Account’s obligations are for the provision of workers’ compensation benefits to injured employees whose current or former employer has failed to maintain compulsory workers’ compensation insurance or if the former employer no longer exists and can not be found and therefore the insurer is unknown.
The actuarial assessed valuation includes both asbestos related diseases (ARD) and non-asbestos related diseases (non-ARD). The approach adopted is to analyse the claim and financial data for the General Account and make projections of future claim payments based on actuarial assumptions, knowledge and experience of similar portfolios.
(ARD) ACTUARIAL METHODS AND ASSUMPTIONS
As most of the asbestos-related disease liability is for future lodgement of latent claims, projected future claim notifications are combined with average claim sizes and the assumed payment patterns ‘to produce’:
(a) total projected cost of claims for each future year;(b) claim payments; and(c) gross and net provisions.
The future lodgement patterns are calibrated to closely follow recent claim experience and the future patterns use the research of Professor Berry (University of Sydney) combined with actuarial’s research and examination of the reports of the Institute of Actuaries of Australia Asbestos Taskforce and the independent advice to the James Hardie Special Commission of Inquiry.
Average weighted term to settlement
The average term to settlement is calculated separately by class of business based on historic payment patterns.
Future claim lodgements
Future claim lodgements are calculated from the recent lodgement experience and calibrated according to the relevant research studies on latency claims.
Average claim size
Average claim size is based on current actuarial research taking the WA mining experience into account.
Assumptions
Uninsured workers: Asbestos-Related Claims (ARD)2017 2016
Inflation Rate 2018 2.00% 2017 3.00%
2019 2.75% 2018 3.00%
2020 3.25% 2019 3.00%
2021 3.20% 2020 3.00%
2022 3.14% 2021 3.00%
2023 3.09% 2022 3.00%
2024 3.03% 2023 3.00%
2025 2.98% 2024 3.00%
2026 2.92% 2025 3.00%
2027 2.87% 2026 3.00%
2028 2.82% 2027 3.00%
2029 2.76% 2028 3.00%
2030 2.71% 2029 3.00%
2031 2.65% 2030 3.00%
2032 2.60% 2031 3.00%
2033 Onwards 2.54% 2032 Onwards 3.00%
Discount Rate 2018 1.57% 2017 1.60%
2019 1.92% 2018 1.50%
2020 2.29% 2019 1.50%
2021 2.59% 2020 1.70%
2022 2.84% 2021 2.00%
2023 3.02% 2022 2.20%
2024 3.13% 2023 2.30%
2025 3.18% 2024 2.40%
2026 3.21% 2025 2.50%
2027 3.27% 2026 2.70%
2028 3.37% 2027 2.80%
2029 3.51% 2028 2.90%
2030 3.69% 2029 3.00%
2031 3.91% 2030 3.20%
2032 4.17% 2031 3.30%
2033 Onwards 4.29% 2032 Onwards 3.40%
Claims Managements Expenses 10.5% for claim payments 10.5% for claim payments
Superimposed Inflation 1.5% 2.0%
Risk Margin 20.4% risk margin at the 75% sufficiency level
20.4% risk margin at the 75% sufficiency level
131
GGG ChecklistIntroduction Agency in focus Scheme performance
Report on operations
Opportunities and challenges
Disclosures and legal compliance
Key performance indicators
Financial statements and notes

Expense rate
Claims handling expenses are based on the current arrangements in place with ICWA for claims management of the General Account.
Discount rates
Discount rates are derived as the one-year forward rates implied by the Commonwealth Government yield curve as at the balance date.
Inflation rates
Economic inflation assumptions have been set by reference to current economic indicators.
Superimposed inflation
Superimposed inflation being the real increase after adjusting for normal inflation, usually due to non-economic effects e.g. changes in legislation, court settlement precedents. The superimposed inflation rates assumed considered both the portfolio’s own real cost increases and industry superimposed inflation trends.
In addition to the above assumptions the following allowances have been made for the Act changes promulgated on 1 October 2011.
The following increases in the average claim size for the removal of age limits:
• 0.6% increase for claimants aged under 65 year olds; and
• 3.2% increase for claimants aged over 65. This has decreased from 5% for claimants under 65 and 24% for claimants over 65. It has been adjusted for the portion of the claims experience after the 2011 Amendment Act was implemented which already implicitly allows for the Act change.
• 70% of ARD claims will be lodged as common law claims, with an average claim size 406% greater than the statutory average claim size.
• 0.9% increase in the ARD average claim size to allow for common law claims made by employed contractors. This has reduced from 1.6% last year as the average includes a proportion of experience after the 2011 Amendment Act.
• 6% increase in the number of mesothelioma claims and 0% increase in the number of non-mesothelioma claims lodged due to behavioural change and the availability of common law access for the General Account. This has reduced from 10% last year for mesothelioma claims and 0% for non-mesothelioma as the average includes a proportion of experience after the 2011 Amendment Act.
(NON-ARD) ACTUARIAL METHODS AND ASSUMPTIONS
Claims estimates for the workers’ compensation business are derived from an analysis of several different actuarial models. Ultimate number of claims incurred are projected based on past reporting patterns. Payments experience is analysed based on average paid per claim incurred, average paid per claim finalised, projected case estimates and Bornheutter Ferguson. Historic case estimates development is also used to form a model of future payments. The resulting projected payments from these models are analysed along with benchmarks for average claim size and ratio to case estimates and other statistics, in order to determine the final estimate of outstanding claims.
Claims inflation is built into the resulting projected payments, to allow for both general economic inflation and superimposed inflation detected in the modelling of payment experience. Superimposed inflation arises from non-economic factors such as developments of legal precedent and changes in claimant behaviour.
Projected payments are discounted to allow for the time value of money.
Average weighted term to settlement
The average term to settlement is calculated separately by class of business based on historic payment patterns.
Future claim reports (IBNR)
Future claim reports are analysed using the ratio of late reported claims to reported claims over future development periods.
Average claim size
Average claim size is a benchmark being the outcome of the accident year blend of actuarial methods described above.
132
GGG ChecklistIntroduction Agency in focus Scheme performance
Report on operations
Opportunities and challenges
Disclosures and legal compliance
Key performance indicators
Financial statements and notes

Expense rate
Claims handling expenses were calculated by analysis of General Account actual expenses from the Statement of Comprehensive Income over the last 12 months.
Discount rates
Discount rates are derived as the one-year forward rates implied by the Commonwealth Government yield curve as at the balance date.
Inflation rates
Economic inflation assumptions have been set by reference to current economic indicators.
Superimposed inflation
Superimposed inflation being the real increase after adjusting for normal inflation, usually due to non-economic effects e.g. changes in legislation, court settlement precedents. The superimposed inflation rates assumed considered both the portfolio’s own real cost increases and industry superimposed inflation trends.
Sufficiency Margin
The inherent uncertainty in the estimated claim liability means that there is a range of possible outcomes. An analysis of the variation of the expected results lead to adoption of a 30% co-efficient of variation and the lognormal distribution. This distribution is then used to calculate the risk margin required to increase the level of sufficiency of the central estimate from 50% to 75%.
In addition to the above assumptions we have included the following prospective allowances for claims incurred from 1 October 2011 due to the 2011 Amendment Act:
• 0% increase in the non-ARD average claim size for the removal of age limits. This has decreased from 0.36% last year as the adopted assumptions are usually based on five years of data and five years are after the 2011 Amendment Act so include this allowance implicitly;
• 1.3% of non-ARD claims will be lodged as common law claims, with an average claim size $0.6 million in 30 June 2017 values. The 1.3% is only applied to claims lodged in the past year or future claims reported. A claimant has to elect to pursue common law damages or apply for an extension within 12 months of a claim being lodged. Therefore no claims lodged prior to 30 June 2016 are eligible to pursue common law damages anymore. This is the same method as last year. The average claim size from the December 2011 report is indexed by five year’s superimposed inflation (2.5% per year) and wage inflation (2017: 2.0%, 2016: 2.5%; 2015: 2.8%, 2014: 0.6%; 2013: 6.8%); and
• 0% allowance for common law claims made by employed contractors as it is assumed to be fully allowed for in the experience, as per last year.
Assumptions
Uninsured workers: Non Asbestos-Related Claims (Non-ARD)2017 2016
Inflation Rate 2018 2.00% 2017 3.00%
2019 2.75% 2018 3.00%
2020 3.25% 2019 3.00%
2021 3.20% 2020 3.00%
2022 3.14% 2021 3.00%
2023 3.09% 2022 3.00%
2024 3.03% 2023 3.00%
2025 2.98% 2024 3.00%
2026 2.92% 2025 3.00%
2027 2.87% 2026 3.00%
2028 2.82% 2027 3.00%
2029 2.76% 2028 3.00%
2030 2.71% 2029 3.00%
2031 2.65% 2030 3.00%
2032 2.60% 2031 3.00%
2033 Onwards 2.54% 2032 Onwards 3.00%
Discount Rate 2018 1.57% 2017 1.60%
2019 1.92% 2018 1.50%
2020 2.29% 2019 1.50%
2021 2.59% 2020 1.70%
2022 2.84% 2021 2.00%
2023 3.02% 2022 2.20%
2024 3.13% 2023 2.30%
2025 3.18% 2024 2.40%
2026 3.21% 2025 2.50%
2027 3.27% 2026 2.70%
2028 3.37% 2027 2.80%
2029 3.51% 2028 2.90%
2030 3.69% 2029 3.00%
2031 3.91% 2030 3.20%
2032 4.17% 2031 3.30%
2033 Onwards 4.29% 2032 Onwards 3.40%
Claims Managements Expenses 10.5% for claim payments 10.5% for claim payments
Superimposed Inflation 2.5% for PPCI and PPCF methods 2.5% for PPCI and PPCF methods
Risk Margin 16.76% risk margin at the 75% sufficiency level
16.76% risk margin at the 75% sufficiency level
133
GGG ChecklistIntroduction Agency in focus Scheme performance
Report on operations
Opportunities and challenges
Disclosures and legal compliance
Key performance indicators
Financial statements and notes

29. EquityThe Western Australian Government holds the equity interest in the Authority on behalf of the community.
Equity represents the residual interest in the net assets of the Authority. The asset revaluation surplus represents that portion of equity resulting from the revaluation of non-current assets.
2017 2016
$000 $000
RESERVES
Asset revaluation surplus
Balance at start of period 16,190 17,500
Net revaluation increments/(decrements):
Land (1,200) (400)
Buildings (627) (910)
Balance at end of period 14,363 16,190
RETAINED EARNINGS
Balance at start of period 82,947 75,216
Result for the period 5,350 7,731
Balance at end of period 88,297 82,947
Total equity at end of period 102,660 99,137
30. Notes to the Statement of Cash FlowsRECONCILIATION OF CASH
Cash at the end of the reporting period as shown in the Statement of Cash Flows is reconciled to the related items in the Statement of Financial Position as follows:
2017 2016
$000 $000
Cash and cash equivalents 10,580 15,697
Restricted cash and cash equivalents (note 20 'Restricted cash and cash equivalents') 85,742 85,262
96,322 100,959
RECONCILIATION OF PROFIT AFTER INCOME TAX EQUIVALENT TO NET CASH FLOWS PROVIDED BY/(USED IN) OPERATING ACTIVITIES
Profit after income tax equivalents 4,601 8,503
Non-cash items:
Depreciation and amortisation expense 971 919
Net (gain)/loss on sale of property, plant and equipment 5 29
Remeasurements of defined benefit liability 749 (772)
Decrease/(increase) in assets:
Current receivables (53) (20)
Increase/(decrease) in liabilities:
Current payables (a) 101 (603)
Current provisions (987) (175)
Non-current provisions (3,344) (3,224)
Net GST receipts/(payments) (b) 3 4
Change in GST receivables/(payables) (c) 3 -
Net cash provided by operating activities 2,049 4,661
(a) Note that the Australian Taxation Office (ATO) receivable/payable in respect of GST and the receivable/payable in respect of the sale/purchase of non-current assets are not included in these items as they do not form part of the reconciling items.
(b) This is the net GST paid/received, i.e. cash transactions.
(c) This reverses out the GST in receivables and payables.
134
GGG ChecklistIntroduction Agency in focus Scheme performance
Report on operations
Opportunities and challenges
Disclosures and legal compliance
Key performance indicators
Financial statements and notes

31. Employers’ Indemnity Supplementation Fund (EISF)
The EISF was established by the Employers’ Indemnity Supplementation Fund Act 1980 (the Act) to provide for payment of workers’ compensation claims in Western Australia:
• In the event an approved insurer collapses; and• To waterfront workers suffering from asbestos related diseases under the Waterfront Workers’
(Compensation for Asbestos Related Diseases) Act 1986.
The most recent insurer collapse was HIH Insurance, which was officially placed into provisional liquidation on 15 March 2001. All claims up to and including that date are required to be paid from the EISF.
The Authority’s claim costs for the EISF (including HIH Insurance) are actuarially assessed each financial year and the values disclosed in the financial statements. The actuarial estimates are based on inflated and discounted values including a 75% prudential margin. The liability for outstanding claims is measured as the central estimate of the present value of expected future payments against claims incurred at the reporting date under general insurance contracts issued by the company, with an additional risk margin to allow for the inherent uncertainty in the central estimate.
The expected future payments include those in relation to claims reported but not yet paid, claims incurred but not reported (IBNR), claims incurred but not enough reported (IBNER) and anticipated claims handling costs.
Claims handling costs include costs that can be directly associated with individual claims such as legal and other professional fees, and costs that can only be indirectly associated with individual claims such as claims administration costs.
EISF ACT LIABILITIES
The outstanding liabilities for claims in run-off (including clients of the HIH Insurance Group) are assessed by an independent actuary using models applicable to the nature of the incident by which the liability under the fund has been incurred. Claims under the EISF Act are assessed under the categories of Asbestos-Related Claims (which includes incidents of mesothelioma, lung cancer and other diseases of the respiratory system) and Non Asbestos-Related Claims.
WORKERS’ COMPENSATION – ASBESTOS-RELATED CLAIMS
Asbestos-Related Claims are assessed using actuarial models based on those developed by Professor Geoffrey Berry utilising ICGF data. The models predict the total number of claims likely to emerge over time and also determine likely average cost per claim
(1).
WORKERS’ COMPENSATION – NON ASBESTOS-RELATED CLAIMS
The majority of these claims are long tail in nature and the actuarial models rely heavily on the case estimates placed on each claim to determine the total outstanding liabilities.
ACTUARIAL ASSUMPTIONS
The following tables provide key actuarial assumptions made in determining the outstanding claims liabilities:
EISF Act: Asbestos-Related Claims2017 2016
Inflation Rate 2018 2.00% 2017 3.00%
2019 2.75% 2018 3.00%
2020 3.25% 2019 3.00%
2021 3.20% 2020 3.00%
2022 3.14% 2021 3.00%
2023 3.09% 2022 3.00%
2024 3.03% 2023 3.00%
2025 2.98% 2024 3.00%
2026 2.92% 2025 3.00%
2027 2.87% 2026 3.00%
2028 2.82% 2027 3.00%
2029 2.76% 2028 3.00%
2030 2.71% 2029 3.00%
2031 2.65% 2030 3.00%
2032 2.60% 2031 3.00%
2033 Onwards 2.54% 2032 Onwards 3.00%
Discount Rate 2018 1.57% 2017 1.60%
2019 1.92% 2018 1.50%
2020 2.29% 2019 1.50%
2021 2.59% 2020 1.70%
2022 2.84% 2021 2.00%
2023 3.02% 2022 2.20%
2024 3.13% 2023 2.30%
2025 3.18% 2024 2.40%
2026 3.21% 2025 2.50%
2027 3.27% 2026 2.70%
2028 3.37% 2027 2.80%
2029 3.51% 2028 2.90%
2030 3.69% 2029 3.00%
2031 3.91% 2030 3.20%
2032 4.17% 2031 3.30%
2033 Onwards 4.29% 2032 Onwards 3.40%
Claims Managements Expenses 10.5% for claim payments except for HIH Insurance which is 0%
10.5% for claim payments except for HIH Insurance which is 0%
Superimposed Inflation 1.50% 2.00%
Risk Margin 20.4% risk margin at the 75% sufficiency level
20.4% risk margin at the 75% sufficiency level
135
GGG ChecklistIntroduction Agency in focus Scheme performance
Report on operations
Opportunities and challenges
Disclosures and legal compliance
Key performance indicators
Financial statements and notes

The following increases in the average claim size for the removal of age limits as detailed:
• 0.6% increase for claimants aged under 65 year olds; and• 3.2% increase for claimants aged over 65.
This has decreased from 5% for claimants under 65 and 24% for claimants over 65 as it has been adjusted for the portion of the claims experience that is after the 2011 Amendment Act was implemented so already implicitly allows for the Act change.
The EISF non-ARD valuation no longer includes an explicit allowance for the 2011 Amendment Act. This is because the average claim size uses an average of 2014 to 2017 lodgement years. The removal of age limits is assumed to be fully incorporated into the experience therefore no explicit allowance is required. Last year there was also no explicit allowance to allow for the removal of age limits resulting from the 2011 Amendment Act, as it was incorporated in the experience used for the average.
The actuarial estimates from June 2001 are as follows:
Year $’000
2001 122,312
2002 49,923
2003 31,717
2004 24,090
2005 23,421
2006 17,239
2007 15,883
2008 16,647
2009 29,419
2010 23,866
2011 20,871
2012 18,526
2013 16,724
2014 21,274
2015 18,002
2016 16,945
2017 13,414
The actuarial estimates from 2001 to 2005 provide for current known asbestos related claims.
From 2005 the actuarial assessment makes allowance for current known asbestos related claims and for claims incurred but not reported claims. Prior to 2007 the estimates did not include provision for Non-HIH liabilities.
In accordance with Accounting Standard AASB 1023 General Insurance Contracts the outstanding claims liability at 30 June 2017 was assessed at $13.414 million and a provision for this amount has been included in the financial statements (see note 28).
The actuary’s assessment of outstanding claims liability does not recognise that money may be recovered from HIH’s liquidator.
For the purpose of addressing the outstanding claims liability, a surcharge was imposed on employers’ insurance policies on previous years. From the 25 June 2008 the surcharge was discontinued. The revenue collected previously from the surcharge will be used to pay this liability.
EISF Act: Non Asbestos-Related Claims2017 2016
Inflation Rate 2018 2.00% 2017 3.00%
2019 2.75% 2018 3.00%
2020 3.25% 2019 3.00%
2021 3.20% 2020 3.00%
2022 3.14% 2021 3.00%
2023 3.09% 2022 3.00%
2024 3.03% 2023 3.00%
2025 2.98% 2024 3.00%
2026 2.92% 2025 3.00%
2027 2.87% 2026 3.00%
2028 2.82% 2027 3.00%
2029 2.76% 2028 3.00%
2030 2.71% 2029 3.00%
2031 2.65% 2030 3.00%
2032 2.60% 2031 3.00%
2033 Onwards 2.54% 2032 Onwards 3.00%
Discount Rate 2018 1.57% 2017 1.60%
2019 1.92% 2018 1.50%
2020 2.29% 2019 1.50%
2021 2.59% 2020 1.70%
2022 2.84% 2021 2.00%
2023 3.02% 2022 2.20%
2024 3.13% 2023 2.30%
2025 3.18% 2024 2.40%
2026 3.21% 2025 2.50%
2027 3.27% 2026 2.70%
2028 3.37% 2027 2.80%
2029 3.51% 2028 2.90%
2030 3.69% 2029 3.00%
2031 3.91% 2030 3.20%
2032 4.17% 2031 3.30%
2033 Onwards 4.29% 2032 Onwards 3.40%
Claims Managements Expenses 10.5% for claim payments except for HIH Insurance which is 0%
10.5% for claim payments except for HIH Insurance which is 0%
Superimposed Inflation 0.00% 0.00%
Risk Margin 16.76% risk margin at the 75% sufficiency level
16.76% risk margin at the 75% sufficiency level
(1) Prediction of mesothelioma, lung cancer, and asbestosis in former Wittenoom asbestos workers, British Journal of Industrial Medicine; 48 793-802.
136
GGG ChecklistIntroduction Agency in focus Scheme performance
Report on operations
Opportunities and challenges
Disclosures and legal compliance
Key performance indicators
Financial statements and notes

32. Commitments 2017 2016
$000 $000
OTHER EXPENDITURE COMMITMENTS
Other expenditure commitments including consultants and contracts for service at the end of the reporting period but not recognised as liabilities, are payable as follows:
Within 1 year 398 277
398 277
33. Contingent liabilities and contingent assetsCONTINGENT LIABILITIES
There were no contingent liabilities in existence at 30 June 2017 and up to the date of this report.
- 100
- 100
CONTINGENT ASSETS
There were no contingent assets in existence at 30 June 2017 and up to the date of this report.
- -
- -
34. Events occurring after the end of the reporting period
There were no known events occurring after the end of the reporting period and up to the date of this report.
137
GGG ChecklistIntroduction Agency in focus Scheme performance
Report on operations
Opportunities and challenges
Disclosures and legal compliance
Key performance indicators
Financial statements and notes
35. Explanatory statementAll variances between estimates (original budget) and actual results for 2017, and between the actual results for 2017 and 2016 are shown below.Narratives are provided for selected major variances, which are generally greater than:
• 5% and $0.46 million for the Statements of Comprehensive Income and Cash Flows; and,• 5% and $2.7 million for the Statement of Financial Position.
Statement Of Comprehensive IncomeVariance Note
Estimate 2017
Actual 2017
Actual 2016
Variance between Estimate and
Actual
Variance between actual result for
2017 and 2016
$000 $000 $000 $000 $000
INCOME
Revenue
Insurer contributions A 19,945 19,945 21,481 - (1,536)
Interest revenue 1 2,839 2,320 2,542 519 (222)
Other revenue 1,311 862 1,317 449 (455)
Employers' Indemnity Supplementation Fund B - 120 2,057 (120) (1,937)
Total Revenue 24,095 23,247 27,397 848 (4,150)
Gains
Decrease in claims liability 2, C - 3,531 4,029 (3,531) (498)
Total Gains - 3,531 4,029 (3,531) (498)
Total Income 24,095 26,778 31,426 (2,683) (4,648)
EXPENSES
Expenses
Employee benefits expense 3 15,634 14,494 14,894 1,140 (400)
Supplies and services 4, D 3,799 2,722 3,186 1,077 (464)
Depreciation and amortisation expense 1,093 971 919 122 52
Accommodation expenses 430 647 575 (217) 72
Grants and subsidies - 50 50 (50) -
Claims expense 2,364 2,020 2,012 344 8
Loss on disposal of non-current assets - 5 29 (5) (24)
Other expenses 1,521 1,382 1,428 139 (46)
Total Expenses 24,841 22,291 23,093 2,550 (802)
Profit before grants and subsidies from State Government (746) 4,487 8,333 (5,233) (3,846)
Services received free of charge 215 114 170 101 (56)
Profit for the period (531) 4,601 8,503 (5,132) (3,902)
OTHER COMPREHENSIVE INCOME
Items not reclassified subsequently to profit or loss
Remeasurements of defined benefit liability 5, E - 749 (772) (749) 1,521
Changes in asset revaluation surplus - (1,827) (1,310) 1,827 (517)
Total other comprehensive income - (1,078) (2,082) 1,078 1,004
Total Comprehensive Income For The Period (531) 3,523 6,421 (4,054) (2,898)
Major Estimate and Actual (2017) Variance Narratives
1) Interest Revenue is lower than budget expectations by $519K (18.3%). This is due to lower than expected interest rates on Supplementation Fund monies invested with Treasury.
2) Decrease in claims liability of $3.531 million (100%) is due to movements in actuarially assessed future claim liabilities not specifically provided for in the budget.
3) Employee benefit expense is $1.140 million (7.3%) under budget expectations due to a number of vacancies arising throughout the year, combined with a decrease in WorkCover WA’s defined benefit superannuation liability.
4) Supplies and Services is $1.015 million (26.7%) under budget expectations due to lower than estimated professional service fees such as Sessional Arbitrators, Actuarial services, State Solicitor costs and Other Professional Services.
5) The remeasurements of the defined benefit liability of $749K (100%) reflects the actuarial assessment for future claim liabilities, which is not specifically provided for in the budget.
Major Actual (2017) and Comparative (2016) Variance Narratives
A) Insurer contributions have decreased by $1.536 million (7.2%) which is consistent with the reduction in WorkCover WA’s approved net budget requirement for 2016/17.
B) Employers’ Indemnity Supplementation Fund has decreased by $1.937 million (94.2%) due to a reduction in recoveries received from the liquidation of HIH.
C) Claims Liabilities have decreased by $498K (12.4%) due to lower than expected actuarially assessed future claim liabilities.
D) Supplies and Services has decreased by $464K due to lower than expected expenditure in professional service fees for Sessional Arbitrators, Actuarial services, State Solicitor costs and Other Professional Services.
E) The remeasurement of the defined benefit liability resulting in a variance of $1.521 million (197%) from the prior year, is mainly due to a reduction in the number of pension participants.
138
GGG ChecklistIntroduction Agency in focus Scheme performance
Report on operations
Opportunities and challenges
Disclosures and legal compliance
Key performance indicators
Financial statements and notes

Statement Of Financial PositionVariance Note
Estimate 2017
Actual 2017
Actual 2016
Variance between Estimate and
Actual
Variance between actual result for 2017 and 2016
ASSETS $000 $000 $000 $000 $000
Current Assets
Cash and cash equivalents 7,454 10,580 15,697 (3,126) (5,117)
Restricted cash and cash equivalents 84,079 85,742 85,262 (1,663) 480
Receivables 1,120 1,144 1,097 (24) 47
Other financial assets F 13,358 14,529 8,385 (1,171) 6,144
Total Current Assets 106,011 111,995 110,441 (5,984) 1,554
Non-Current Assets
Property, plant, equipment & vehicles 6 21,392 17,782 20,093 3,610 (2,311)
Intangible assets 2,181 2,485 2,367 (304) 118
Total Non-Current Assets 23,573 20,267 22,460 3,306 (2,193)
Total Assets 129,584 132,262 132,901 (2,678) (639)
LIABILITIES
Current Liabilities
Payables 2,244 804 635 1,440 169
Provisions 5,009 5,756 6,743 (747) (987)
Total Current Liabilities 7,253 6,560 7,378 693 (818)
Non-Current Liabilities
Provisions 7, G 27,458 23,042 26,386 4,416 (3,344)
Total Non-Current Liabilities 27,458 23,042 26,386 4,416 (3,344)
Total Liabilities 34,711 29,602 33,764 5,109 (4,162)
Net Assets 94,873 102,660 99,137 (7,787) 3,523
EQUITY
Reserves 8 17,500 14,363 16,190 3,137 (1,827)
Retained earnings 77,373 88,297 82,947 (10,924) 5,350
Total Equity 94,873 102,660 99,137 (7,787) 3,523
Major Estimate and Actual (2017) Variance Narratives
6) Property, plant, equipment and vehicles are less than budgeted expectations by $3.610 million (16.9%), primarily due to a decrease in the valuation of land and buildings.
7) Provisions are lower than budgeted expectations by $4.416 million (16.1%) due to a decrease in forecast claims liabilities for the Supplementation Fund, combined with a reduction in the General Account’s defined benefit superannuation liabilities.
8) Reserves are lower than budgeted expectations by $3.137 million (17.9%), due to a reduction in land and building valuations and uninsured claims payments from the Uninsured Safety Net Reserve.
Major Actual (2017) and Comparative (2016) Variance Narratives
F) Other financial assets increase of $6.144 million (73.3%) is due to an increase in deposits with a maturity date greater than 3 months, at 30 June 2017.
G) Provisions decrease of $3.344 million (12.7%) is due to a reduction in forecast claims liabilities for the Supplementation Fund, combined with a reduction in the General Account’s defined benefit superannuation liabilities.
139
GGG ChecklistIntroduction Agency in focus Scheme performance
Report on operations
Opportunities and challenges
Disclosures and legal compliance
Key performance indicators
Financial statements and notes

Statement Of Cash FlowsVariance Note
Estimate 2017
Actual 2017
Actual 2016
Variance between Estimate and
Actual
Variance between actual result for
2017 and 2016
CASH FLOWS FROM OPERATING ACTIVITIES $000 $000 $000 $000 $000
Receipts
Supplementation Fund receipts H - 120 2,057 (120) (1,937)
Insurer contributions I 19,946 19,945 21,481 1 (1,536)
Provision of services 38 9 9 29 -
Interest received 2,829 2,446 2,464 383 (18)
GST receipts on sales - 27 20 (27) 7
GST receipts from taxation authority - 380 467 (380) (87)
Other receipts J 936 813 1,300 123 (487)
Payments
Workers' Compensation claim payments 9 (2,364) (1,760) (1,320) (604) (440)
Employee benefits 10, K (15,924) (14,906) (16,320) (1,018) 1,414
Supplies and services 11 (3,518) (2,865) (3,266) (653) 401
Accommodation (430) (661) (582) 231 (79)
Grants and subsidies - (50) (50) 50 -
GST payments on purchases - (404) (483) 404 79
Other payments (1,440) (1,045) (1,116) (395) 71
Net cash provided by operating activities 73 2,049 4,661 (1,976) (2,612)
CASH FLOWS FROM INVESTING ACTIVITIES
Receipts
Proceeds from sale of non-current physical assets - 86 55 (86) 31
Proceeds from the maturity of term deposits - - 5,040 - (5,040)
Payments
Purchase of non-current physical assets L (665) (628) (1,179) (37) 551
Investments in term deposits 12, M - (6,144) - 6,144 (6,144)
Net cash used in investing activities (665) (6,686) 3,916 6,021 (10,602)
Net increase/(decrease) in cash and cash equivalents (592) (4,637) 8,577 4,045 (13,214)
Cash and cash equivalents at the beginning of the period 92,125 100,959 92,382 (8,834) 8,577
Cash and cash equivalent at the end of the period 91,533 96,322 100,959 (4,789) (4,637)
Major Estimate and Actual (2017) Variance Narratives
9) Workers’ Compensation claim payments are $604K (25.5%) under budget estimates due to lower than expected workers compensation claims received for the Supplementation Fund.
10) Employee benefits are $1.018M (6.4%) under budget estimates due to a number of senior vacancies across the agency.
11) Supplies and Services is $653K (18.6%) under budget estimate due to lower than estimated professional service fees such as Sessional Arbitrators, Actuarial services, State Solicitor costs and Other Professional Services.
12) Investments in term deposits of $6.144 million (100%) are not included in the budget.
Major Actual (2017) and Comparative (2016) Variance Narratives
H) Supplementation Fund receipts has decreased by $1.937 million (94.2%) due to a reduction in recoveries received from the administrators of HIH.
I) Insurer contributions has decreased by $1.536 million (7.2%). This is consistent with the reduction in WorkCover WA’s approved net budget requirement for 2016/17.
J) Other receipts has decreased by $487K (37.5%) due to lower than expected uninsured claim recoveries received.
K) Employee benefits have decreased by $1.414 million (8.7%) due to a higher number of vacancies arising throughout the 2016/17 year.
L) Purchase of non-current physical assets have decreased by $551K (46.7%), reflecting the timing of asset purchases associated with the infrastructure program last financial year.
M) Investment in term deposits have increased by $6.144 million (100%) reflecting the timing and maturity of invested monies.
140
GGG ChecklistIntroduction Agency in focus Scheme performance
Report on operations
Opportunities and challenges
Disclosures and legal compliance
Key performance indicators
Financial statements and notes
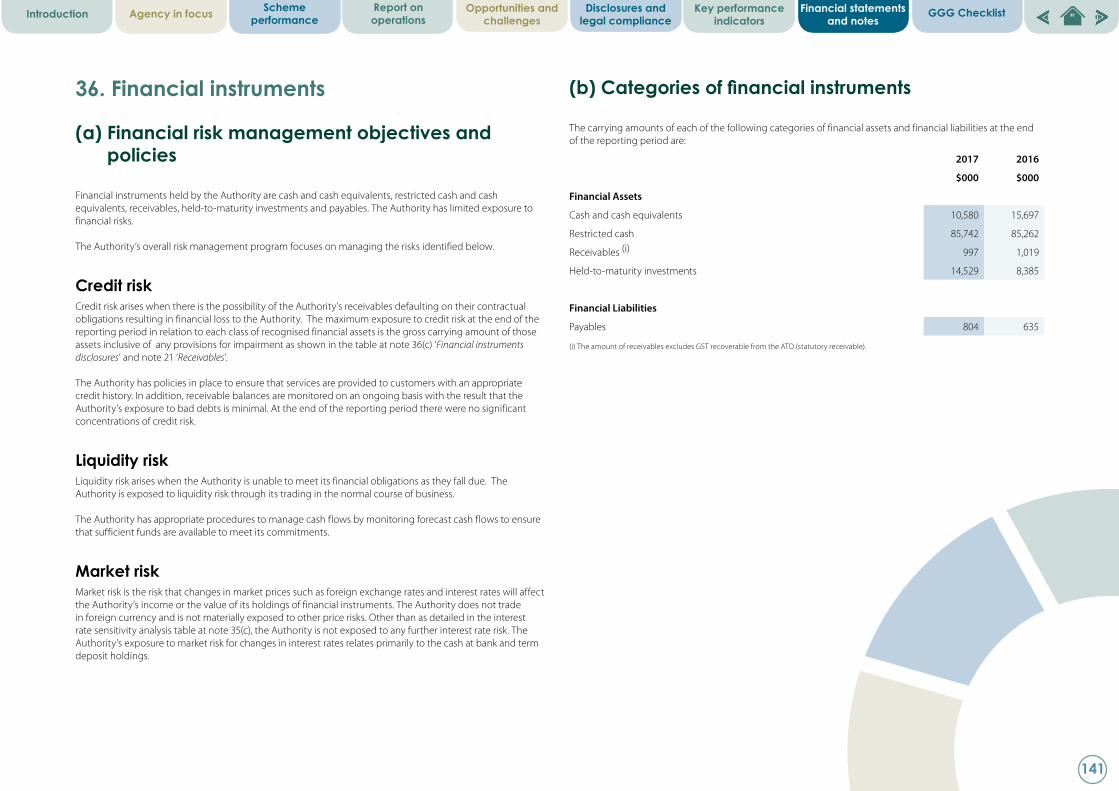
2017 2016
$000 $000
Financial Assets
Cash and cash equivalents 10,580 15,697
Restricted cash 85,742 85,262
Receivables (i) 997 1,019
Held-to-maturity investments 14,529 8,385
Financial Liabilities
Payables 804 635
(i) The amount of receivables excludes GST recoverable from the ATO (statutory receivable).
(b) Categories of financial instruments
The carrying amounts of each of the following categories of financial assets and financial liabilities at the end of the reporting period are:
36. Financial instruments
(a) Financial risk management objectives and policies
Financial instruments held by the Authority are cash and cash equivalents, restricted cash and cash equivalents, receivables, held-to-maturity investments and payables. The Authority has limited exposure to financial risks.
The Authority’s overall risk management program focuses on managing the risks identified below.
Credit riskCredit risk arises when there is the possibility of the Authority’s receivables defaulting on their contractual obligations resulting in financial loss to the Authority. The maximum exposure to credit risk at the end of the reporting period in relation to each class of recognised financial assets is the gross carrying amount of those assets inclusive of any provisions for impairment as shown in the table at note 36(c) ‘Financial instruments disclosures’ and note 21 ‘Receivables’.
The Authority has policies in place to ensure that services are provided to customers with an appropriate credit history. In addition, receivable balances are monitored on an ongoing basis with the result that the Authority’s exposure to bad debts is minimal. At the end of the reporting period there were no significant concentrations of credit risk.
Liquidity riskLiquidity risk arises when the Authority is unable to meet its financial obligations as they fall due. The Authority is exposed to liquidity risk through its trading in the normal course of business.
The Authority has appropriate procedures to manage cash flows by monitoring forecast cash flows to ensure that sufficient funds are available to meet its commitments.
Market riskMarket risk is the risk that changes in market prices such as foreign exchange rates and interest rates will affect the Authority’s income or the value of its holdings of financial instruments. The Authority does not trade in foreign currency and is not materially exposed to other price risks. Other than as detailed in the interest rate sensitivity analysis table at note 35(c), the Authority is not exposed to any further interest rate risk. The Authority’s exposure to market risk for changes in interest rates relates primarily to the cash at bank and term deposit holdings.
141
GGG ChecklistIntroduction Agency in focus Scheme performance
Report on operations
Opportunities and challenges
Disclosures and legal compliance
Key performance indicators
Financial statements and notes

(c) Financial instrument disclosures
Credit riskThe following table discloses the Authority’s maximum exposure to credit risk, interest rate exposures and the ageing analysis of financial assets. The Authority’s maximum exposure to credit risk at the end of the reporting period is the carrying amount of financial assets as shown below. The table discloses the ageing of financial assets that are past due but not impaired and impaired financial assets. The table is based on information provided to senior management of the Authority.
The Authority does not hold any collateral as security or other credit enhancement relating to the financial assets it holds.
Aged analysis of financial assets
2017 Carrying AmountNot past due and
not impaired
Past Due But Not Impaired Impaired Financial AssetsUp to 1 Month 1 to 3 Months 3 to 6 Months 6 to 12 Months More than 1 Year
Financial Assets $000 $000 $000 $000 $000 $000 $000 $000
Cash and cash equivalents 10,580 10,580 - - - - - -
Restricted cash 85,742 85,742 - - - - - -
Receivables (a) 997 775 - 12 39 14 157 -
Other financial assets 14,529 14,529 - - - - - -
111,848 111,626 - 12 39 14 157 -
2016
Financial Assets
Cash and cash equivalents 15,697 15,697 - - - - - -
Restricted Cash 85,262 85,262 - - - - - -
Receivables(a) 1,019 736 - 38 43 100 102 -
Other financial assets 8,385 8,385 - - - - - -
110,363 110,080 - 38 43 100 102 -
(a) The amount of Receivables excludes GST recoverable from the ATO (statutory receivable).
142
GGG ChecklistIntroduction Agency in focus Scheme performance
Report on operations
Opportunities and challenges
Disclosures and legal compliance
Key performance indicators
Financial statements and notes

Liquidity risk and interest rate exposureThe following table details the Authority’s interest rate exposure and the contractual maturity analysis of financial assets and liabilities. The maturity analysis section includes interest and principal cash flows. The interest rate exposure section analyses only the carrying amounts of each item.
Interest rate exposure and maturity analysis for financial assets and financial liabilities
Interest Rate Exposure Maturity Dates
2017
Weighted Average Effective
Interest RateCarrying Amount
Variable Interest Rate
Fixed Interest Rate
Non Interest Bearing
Nominal Amount
Up to 1 Month 1 to 3 Months 3 to 6 Months
6 to 12 Months
More than 1 Year
Financial Assets % $000 $000 $000 $000 $000 $000 $000 $000 $000 $000
Cash and cash equivalents 2.34 10,580 2,387 8,192 1 10,580 5,842 4,738 - - -
Restricted cash 1.98 85,742 85,736 6 - 85,742 85,742 - - - -
Receivables (a) - 997 - - 997 997 997 - - -
Other financial assets 2.60 14,529 - 14,529 - 14,529 - - 10,964 3,565 -
111,848 88,123 22,727 998 111,848 92,581 4,738 10,964 3,565 -
Financial Liabilities
Payables - 804 - - 804 804 804 - - - -
804 - - 804 804 804 - - - -
2016
Financial Assets % $000 $000 $000 $000 $000 $000 $000 $000 $000 $000
Cash and cash equivalents 2.80 15,697 2,031 13,665 1 15,697 6,115 9,582 - - -
Restricted cash 2.27 85,262 85,233 29 - 85,262 85,262 - - - -
Receivables (a) - 1,019 - - 1,019 1,019 1,019 - - -
Other financial assets 2.99 8,385 - 8,385 - 8,385 - - 8,385 - -
110,363 87,264 22,079 1,020 110,363 92,396 9,582 8,385 - -
Financial Liabilities
Payables - 635 - - 635 635 635 - - - -
635 - - 635 635 635 - - - -
(a) The amount of Receivables excludes GST recoverable from the ATO (statutory receivable).
143
GGG ChecklistIntroduction Agency in focus Scheme performance
Report on operations
Opportunities and challenges
Disclosures and legal compliance
Key performance indicators
Financial statements and notes
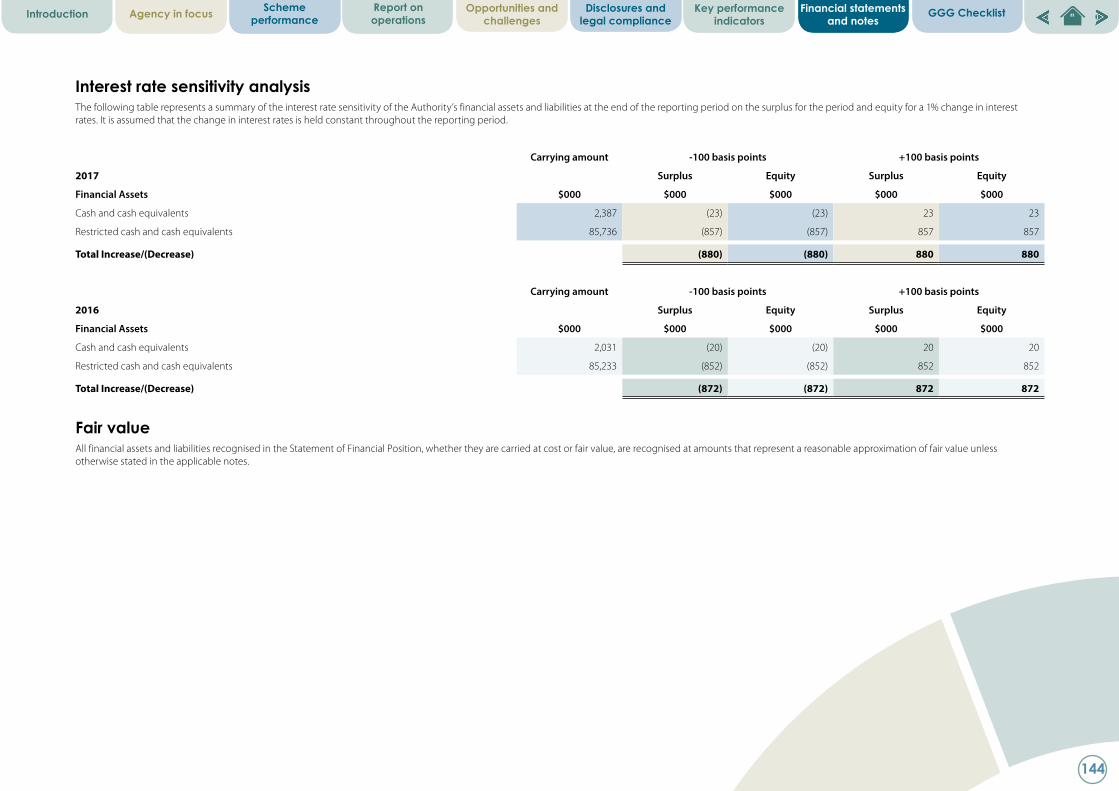
Interest rate sensitivity analysisThe following table represents a summary of the interest rate sensitivity of the Authority’s financial assets and liabilities at the end of the reporting period on the surplus for the period and equity for a 1% change in interest rates. It is assumed that the change in interest rates is held constant throughout the reporting period.
Carrying amount -100 basis points +100 basis points
2017 Surplus Equity Surplus Equity
Financial Assets $000 $000 $000 $000 $000
Cash and cash equivalents 2,387 (23) (23) 23 23
Restricted cash and cash equivalents 85,736 (857) (857) 857 857
Total Increase/(Decrease) (880) (880) 880 880
Carrying amount -100 basis points +100 basis points
2016 Surplus Equity Surplus Equity
Financial Assets $000 $000 $000 $000 $000
Cash and cash equivalents 2,031 (20) (20) 20 20
Restricted cash and cash equivalents 85,233 (852) (852) 852 852
Total Increase/(Decrease) (872) (872) 872 872
Fair valueAll financial assets and liabilities recognised in the Statement of Financial Position, whether they are carried at cost or fair value, are recognised at amounts that represent a reasonable approximation of fair value unless otherwise stated in the applicable notes.
144
GGG ChecklistIntroduction Agency in focus Scheme performance
Report on operations
Opportunities and challenges
Disclosures and legal compliance
Key performance indicators
Financial statements and notes

37. Compensation of Key Management Personnel
The Authority has determined that key management personnel include the responsible Ministers, board members and senior officers of the Authority. However, the Authority is not obligated to compensate the Ministers and therefore disclosures in relation to the Ministers’ compensation may be found in the Annual Report on State Finances.
Total compensation for key management personnel, comprising members and senior officers of the Authority for the reporting period are presented within the following bands:
Compensation of members of the accountable authority
Compensation Band ($) 2017 2016
$
0 - 10,000 1 2
10,001 - 20,000 4 2
30,001 - 40,000 1 1
40,001 - 50,000 - 1
$000 $000
Short-term employee benefits 96 110
Post-employment benefits 9 11
Other long-term benefits - -
Termination benefits - -
Total compensation of members of the accountable authority 105 121
Compensation of senior officers other than the accountable authority
Compensation Band ($) 2017 2016
$
70,001 - 80,000 - 1
110,001 - 120,000 - 1
160,001 - 170,000 - 1
170,001 - 180,000 1 -
190,001 - 200,000 1 1
200,001 - 210,000 - 1
210,001 - 220,000 3 1
230,001 - 240,000 1 -
260,001 - 270,000 1 1
280,001 - 290,000 - 1
$000 $000
Short-term employee benefits 1,209 1,204
Post-employment benefits 157 150
Other long-term benefits 144 159
Termination benefits - -
Total compensation of senior officers 1,510 1,513
145
GGG ChecklistIntroduction Agency in focus Scheme performance
Report on operations
Opportunities and challenges
Disclosures and legal compliance
Key performance indicators
Financial statements and notes

38. Remuneration of auditorRemuneration payable to the Auditor General for the reporting period is as follows:
2017 2016
$000 $000
Auditing the accounts, controls, financial statements and key performance indicators 86 85
86 85
39. Workers’ Compensation & Injury Management Trust Account
The purpose of the Trust Fund is to hold funds paid into the custody of the Authority pursuant to Section 110 of the Workers’ Compensation and Injury Management Act 1981. These funds are not consolidated as they are funds that are administered on behalf of dependants of deceased workers.
Income
Amounts paid to the custody of the Authority 274 453
Interest on investments 21 21
295 474
Expenditure
Payments by the Authority 367 334
Administration fee 10 9
377 343
Surplus/(Deficit) (82) 131
Balance July 1 1,133 1,002
Balance June 30 1,051 1,133
Balance of funds held represents:
Cash and cash equivalents 1,051 1,133
1,051 1,133
40. Supplementary financial information
Potential claims recoveries written offIn relation to the General Account, WorkCover WA may have a statutory obligation to pay a workers’ compensation claim. For uninsured claims where the employer has not maintained a workers’ compensation insurance policy, or the employer is not able to be identified or located or an employer is in breach of the insurance contract, WorkCover seeks to recover the costs of the claims from the employer.
Potential recoveries receivable are assessed with regard to the ability of the debtors to meet their obligation. These recoveries have not been recognised as income because the amount to be recovered could not be reliably measured and consequently the write-off of these debts have not been charged as an expense in the Statement of Comprehensive Income. The General Account Uninsured debt write-offs outlined below are net of recoveries received from employers.
In accordance with Section 48(2) of the Financial Management Act 2006, potential recoveries were written off from the following fund:
2017 2016
$000 $000
Write-offs
General account uninsured claims 235 39
Fines and penalties 20 -
Salaries 6 -
261 39
2017 2016
Number of Individual Recovery Write-offs with Values Between:
$ 0 - 100,000 6 3
$ 100,001 - 200,000 1 -
2017 2016
$000 $000
Losses Through Theft, Defaults And Other Causes
Losses of public money and public and other property through theft, default and other causes
- -
Amount recovered - -
- -
146
GGG ChecklistIntroduction Agency in focus Scheme performance
Report on operations
Opportunities and challenges
Disclosures and legal compliance
Key performance indicators
Financial statements and notes

41. Related bodiesThe Authority does not have related bodies.
42. Affiliated bodiesThe Authority does not have affiliated bodies.
43. Indian Ocean TerritoriesThe Commonwealth Government has a Service Delivery Arrangement with the Authority for the provision of services to Indian Ocean Territories (Christmas Island and Cocos-Keeling Island).
2017 2016
$000 $000
Opening balance 28 15
Funding received from the Commonwealth 16 -
Revenue received from insurers 18 28
62 43
Payment to the Commonwealth 28 -
Payments by Program Area
Regulatory Services 12 8
Conciliation and Arbitration Services 12 5
Legislation and Scheme Information 5 2
Total Payments 57 15
Balance carried forward 5 28
147
GGG ChecklistIntroduction Agency in focus Scheme performance
Report on operations
Opportunities and challenges
Disclosures and legal compliance
Key performance indicators
Financial statements and notes

45. Related party transactionsThe authority is a wholly owned and controlled entity of the State of Western Australia. In conducting its activities, the Authority is required to pay various taxes and levies based on the standard terms and conditions that apply to all tax and levy payers to the State and entities related to the State. The authority is funded through contributions made by insurers approved to underwrite workers’ compensation insurance in Western Australia and by exempt employers (self-insurers).
Related parties of the Authority include:• All Ministers and their close family members, and their controlled or jointly controlled entities;• all senior officers and their close family members, and their controlled or jointly controlled entities;• other departments and statutory authorities, including their related bodies, that are included in the
whole of government consolidated financial statements• associates and joint ventures of an entity that are included in the whole of Government consolidated
financial statements; and• the Government Employees Superannuation Board (GESB).
Significant transactions with Government-related entitiesSignificant transactions include:
• Insurance contributions from Insurance Commission of WA $3.489 million• Interest from Department of Treasury $1.721 million (Note 7)• Insurance and claim payments to Insurance Commission of WA $1.905 million• District Court cost to Department of Treasury $0.143 million (Note 13)• Payroll tax to Department of Finance $0.800 million (Note 17)• Services received free of charge from the State Solicitor’s Office $0.114 million (Note 18)
Material transactions with related partiesMaterial transactions include:
• Superannuation payments to GESB $1.373 million (Note 12)
All other transactions (including general citizen type transactions) between the Authority and Ministers/senior officers or their close family members or their controlled (or jointly controlled) entities are not material for disclosure.
44. Schedule of income and expenses by service
SchemeRegulation
Scheme Services
Grand Total
2017 2016 2017 2016 2017 2016
Income $000 $000 $000 $000 $000 $000
Insurer contributions 9,034 9,858 10,911 11,623 19,945 21,481
Interest revenue 1,051 1,167 1,269 1,375 2,320 2,542
Other revenue 390 604 472 713 862 1,317
Employers' Indemnity Supplementation Fund
54 944 66 1,113 120 2,057
Decrease in claims liability 1,599 1,849 1,932 2,180 3,531 4,029
Total Income 12,128 14,422 14,650 17,004 26,778 31,426
Expenses
Employee benefits expense
6,565 6,835 7,929 8,059 14,494 14,894
Supplies and services 1,233 1,462 1,489 1,724 2,722 3,186
Depreciation and amortisation expense
440 422 531 497 971 919
Accommodation expenses
293 264 354 311 647 575
Grants and subsidies 23 23 27 27 50 50
Claims expense 915 923 1,105 1,089 2,020 2,012
Loss on disposal of non current assets
2 13 3 16 5 29
Other expenses 626 655 756 773 1,382 1,428
Total Expenses 10,097 10,597 12,194 12,496 22,291 23,093
Profit before grants and subsidies from State Government
2,031 3,825 2,456 4,508 4,487 8,333
Services received free of charges
52 78 62 92 114 170
Profit for the period 2,083 3,903 2,518 4,600 4,601 8,503
148
GGG ChecklistIntroduction Agency in focus Scheme performance
Report on operations
Opportunities and challenges
Disclosures and legal compliance
Key performance indicators
Financial statements and notes
GGG ChecklistIntroduction Agency in focus Scheme performance
Report on operations
Opportunities and challenges
Disclosures and legal compliance
Key performance indicators
Financial statements and notes