Embed Size (px)
Citation preview
Vol. 55
Ministry of Finance and Economic Development
July 2011 (Price: Rs 200.00)
2010
REPUBLIC OF MAURITIUS
CENTRAL STATISTICS OFFICE
ANNUAL
DIGEST OF STATISTICS
CENTRAL STATISTICS OFFICE
ANNUAL
DIGEST OF STATISTICS
2010
ANNUAL DIGEST OF STATISTICS 2010
FOREWORD
This is the twenty-sixth issue of the Annual Digest of Statistics. It presents in a concise and readily accessible form, important statistical information available on the demographic, economic and social characteristics of Mauritius. All data in the digest are the latest available as at end of June 2011. Some of them are provisional and are therefore subject to revision in later issues. Figures in each issue of the digest supersede and replace those appearing in previous ones. Where necessary, figures have been rounded off to the nearest digit, and hence in some tables there may be slight discrepancies between the sum of the constituent items and the total given. It is hoped that the data presented will prove useful to a wide range of users, policy makers and planners as well as the general public. Readers interested in more comprehensive data may wish to consult the different publications of this office on each subject. Regular publications, including the Economic and Social Indicators, series as well as ad hoc reports issued by this office are uploaded on our website at the following address: http://statsmauritius.gov.mu. The co-operation and assistance given by public and private organisations in providing information for the preparation of this issue, are gratefully acknowledged. L.F Cheung Kai Suet Director of Statistics Central Statistics Office Ministry of Finance and Economic Development Port Louis MAURITIUS July 2011
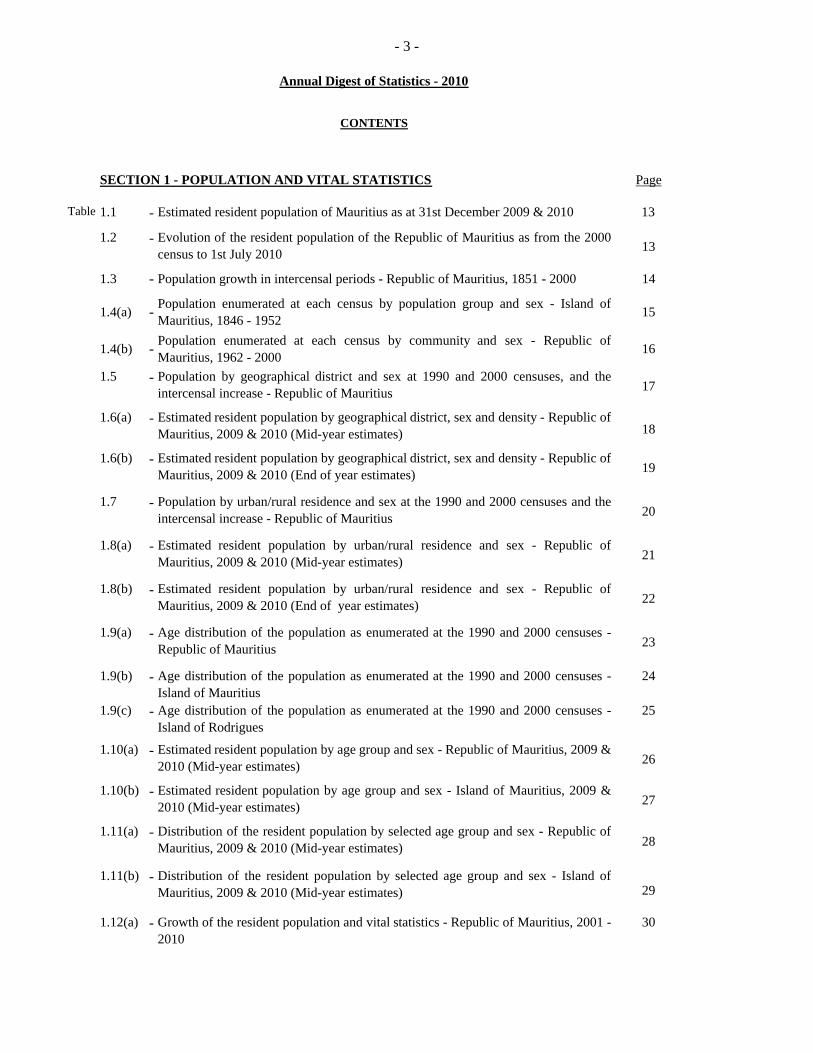
- 3 -
Annual Digest of Statistics - 2010
CONTENTS
SECTION 1 - POPULATION AND VITAL STATISTICS Page
Table 1.1 - Estimated resident population of Mauritius as at 31st December 2009 & 2010 13
1.2 - Evolution of the resident population of the Republic of Mauritius as from the 2000census to 1st July 2010 13
1.3 - Population growth in intercensal periods - Republic of Mauritius, 1851 - 2000 14
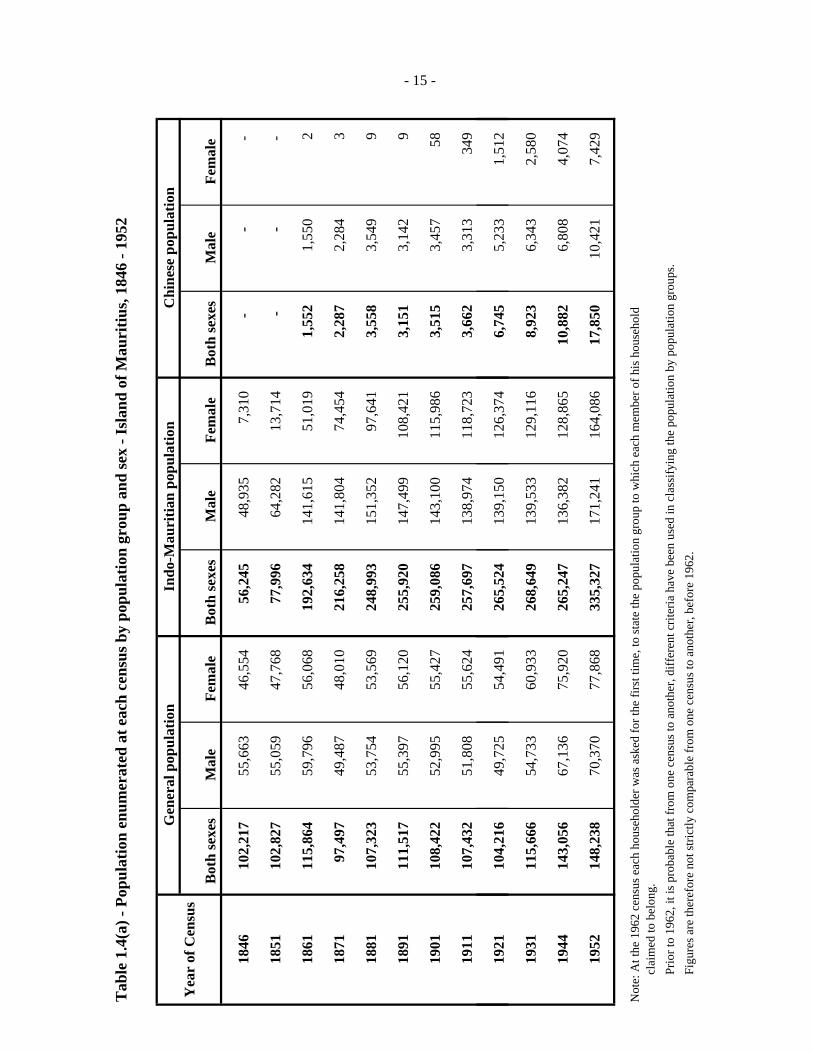
1.4(a) - Population enumerated at each census by population group and sex - Island ofMauritius, 1846 - 1952 15
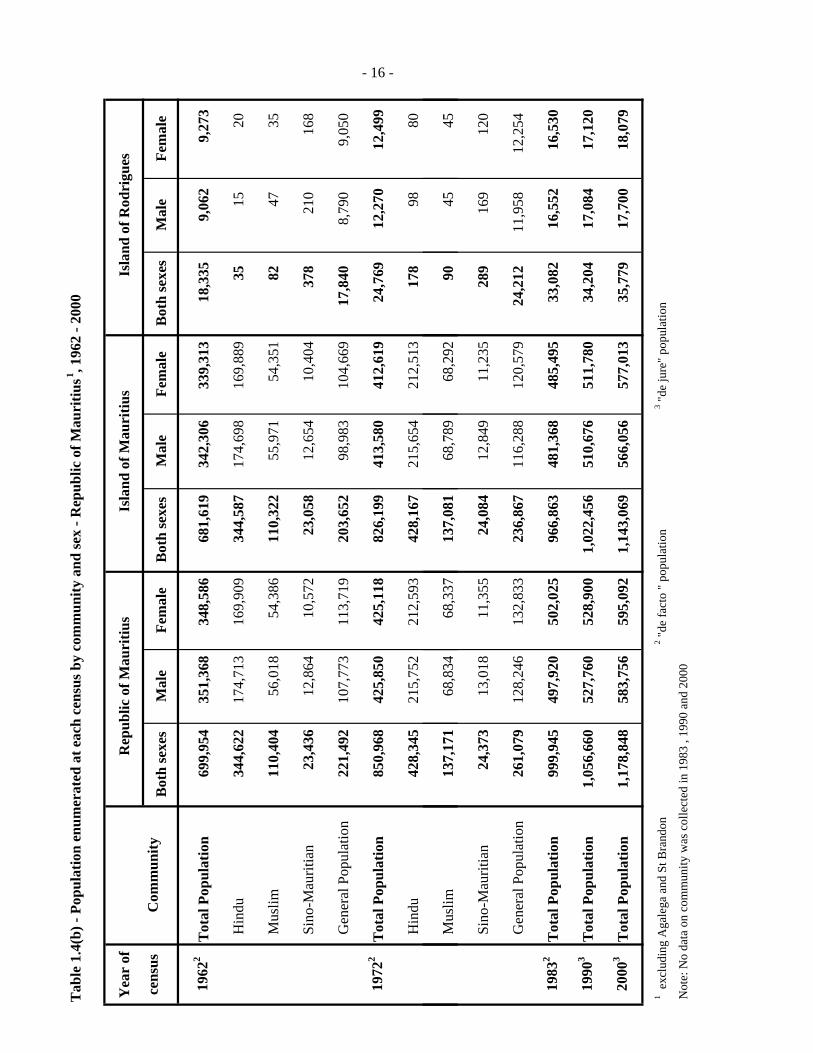
1.4(b) - Population enumerated at each census by community and sex - Republic ofMauritius, 1962 - 2000 16
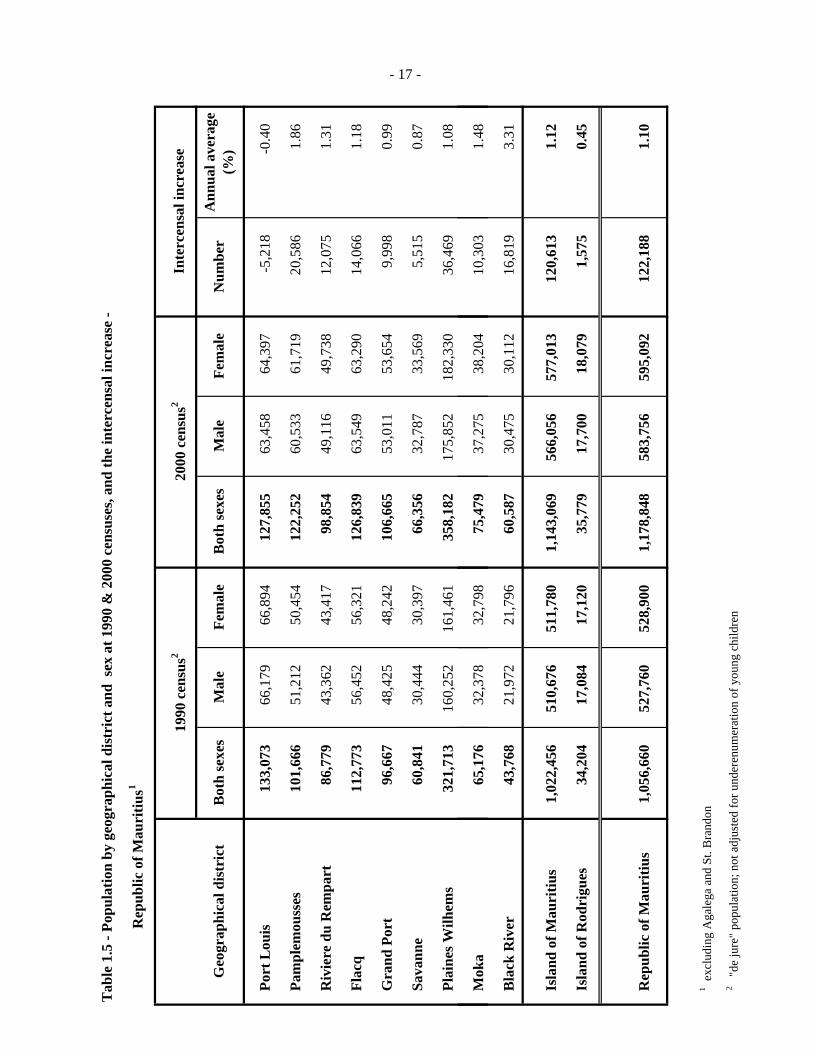
1.5 - Population by geographical district and sex at 1990 and 2000 censuses, and theintercensal increase - Republic of Mauritius 17
1.6(a) - Estimated resident population by geographical district, sex and density - Republic ofMauritius, 2009 & 2010 (Mid-year estimates) 18
1.6(b) - Estimated resident population by geographical district, sex and density - Republic ofMauritius, 2009 & 2010 (End of year estimates) 19
1.7 - Population by urban/rural residence and sex at the 1990 and 2000 censuses and theintercensal increase - Republic of Mauritius 20
1.8(a) - Estimated resident population by urban/rural residence and sex - Republic ofMauritius, 2009 & 2010 (Mid-year estimates) 21
1.8(b) - Estimated resident population by urban/rural residence and sex - Republic ofMauritius, 2009 & 2010 (End of year estimates) 22
1.9(a) - Age distribution of the population as enumerated at the 1990 and 2000 censuses -Republic of Mauritius 23
1.9(b) - Age distribution of the population as enumerated at the 1990 and 2000 censuses -Island of Mauritius
24
1.9(c) - Age distribution of the population as enumerated at the 1990 and 2000 censuses -Island of Rodrigues
25
1.10(a) - Estimated resident population by age group and sex - Republic of Mauritius, 2009 &2010 (Mid-year estimates) 26
1.10(b) - Estimated resident population by age group and sex - Island of Mauritius, 2009 &2010 (Mid-year estimates) 27
1.11(a) - Distribution of the resident population by selected age group and sex - Republic ofMauritius, 2009 & 2010 (Mid-year estimates) 28
1.11(b) - Distribution of the resident population by selected age group and sex - Island ofMauritius, 2009 & 2010 (Mid-year estimates) 29
1.12(a) - Growth of the resident population and vital statistics - Republic of Mauritius, 2001 -2010
30
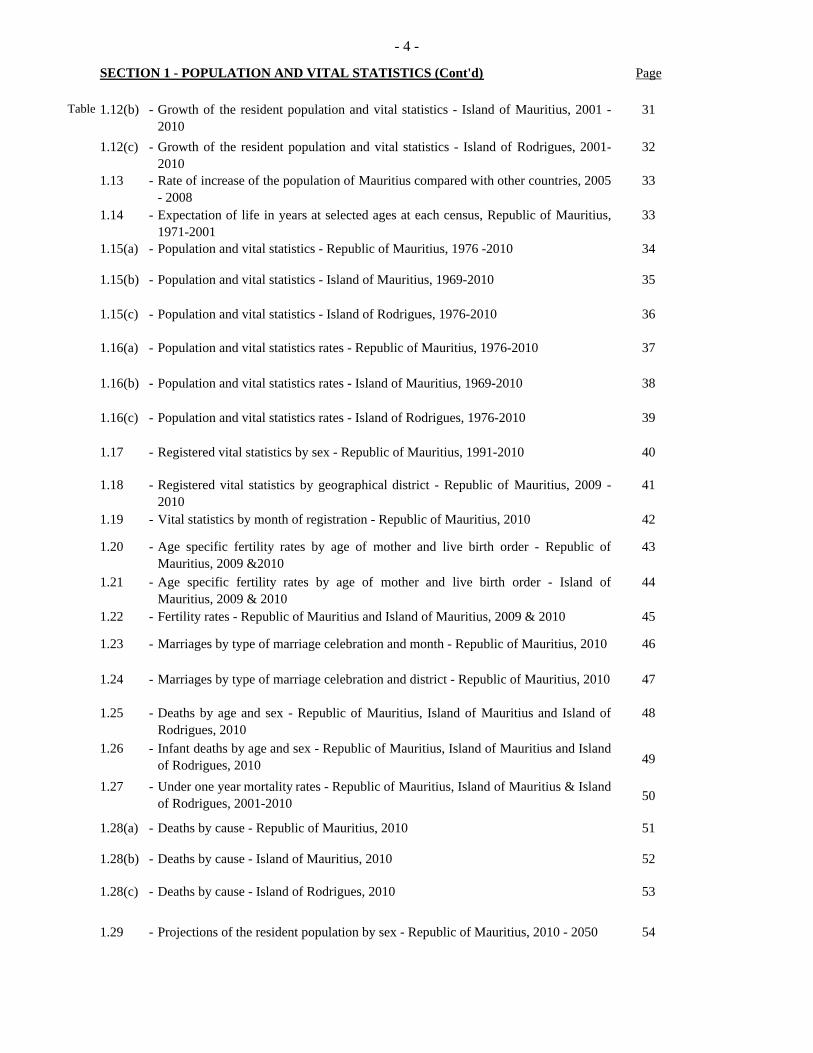
- 4 -
SECTION 1 - POPULATION AND VITAL STATISTICS (Cont'd) Page
Table 1.12(b) - Growth of the resident population and vital statistics - Island of Mauritius, 2001 -2010
31
1.12(c) - Growth of the resident population and vital statistics - Island of Rodrigues, 2001-2010
32
1.13 - Rate of increase of the population of Mauritius compared with other countries, 2005- 2008
33
1.14 - Expectation of life in years at selected ages at each census, Republic of Mauritius,1971-2001
33
1.15(a) - Population and vital statistics - Republic of Mauritius, 1976 -2010 34
1.15(b) - Population and vital statistics - Island of Mauritius, 1969-2010 35
1.15(c) - Population and vital statistics - Island of Rodrigues, 1976-2010 36
1.16(a) - Population and vital statistics rates - Republic of Mauritius, 1976-2010 37
1.16(b) - Population and vital statistics rates - Island of Mauritius, 1969-2010 38
1.16(c) - Population and vital statistics rates - Island of Rodrigues, 1976-2010 39
1.17 - Registered vital statistics by sex - Republic of Mauritius, 1991-2010 40
1.18 - Registered vital statistics by geographical district - Republic of Mauritius, 2009 -2010
41
1.19 - Vital statistics by month of registration - Republic of Mauritius, 2010 42
1.20 - Age specific fertility rates by age of mother and live birth order - Republic ofMauritius, 2009 &2010
43
1.21 - Age specific fertility rates by age of mother and live birth order - Island ofMauritius, 2009 & 2010
44
1.22 - Fertility rates - Republic of Mauritius and Island of Mauritius, 2009 & 2010 45
1.23 - Marriages by type of marriage celebration and month - Republic of Mauritius, 2010 46
1.24 - Marriages by type of marriage celebration and district - Republic of Mauritius, 2010 47
1.25 - Deaths by age and sex - Republic of Mauritius, Island of Mauritius and Island ofRodrigues, 2010
48
1.26 - Infant deaths by age and sex - Republic of Mauritius, Island of Mauritius and Islandof Rodrigues, 2010 49
1.27 - Under one year mortality rates - Republic of Mauritius, Island of Mauritius & Islandof Rodrigues, 2001-2010 50
1.28(a) - Deaths by cause - Republic of Mauritius, 2010 51
1.28(b) - Deaths by cause - Island of Mauritius, 2010 52
1.28(c) - Deaths by cause - Island of Rodrigues, 2010 53
1.29 - Projections of the resident population by sex - Republic of Mauritius, 2010 - 2050 54
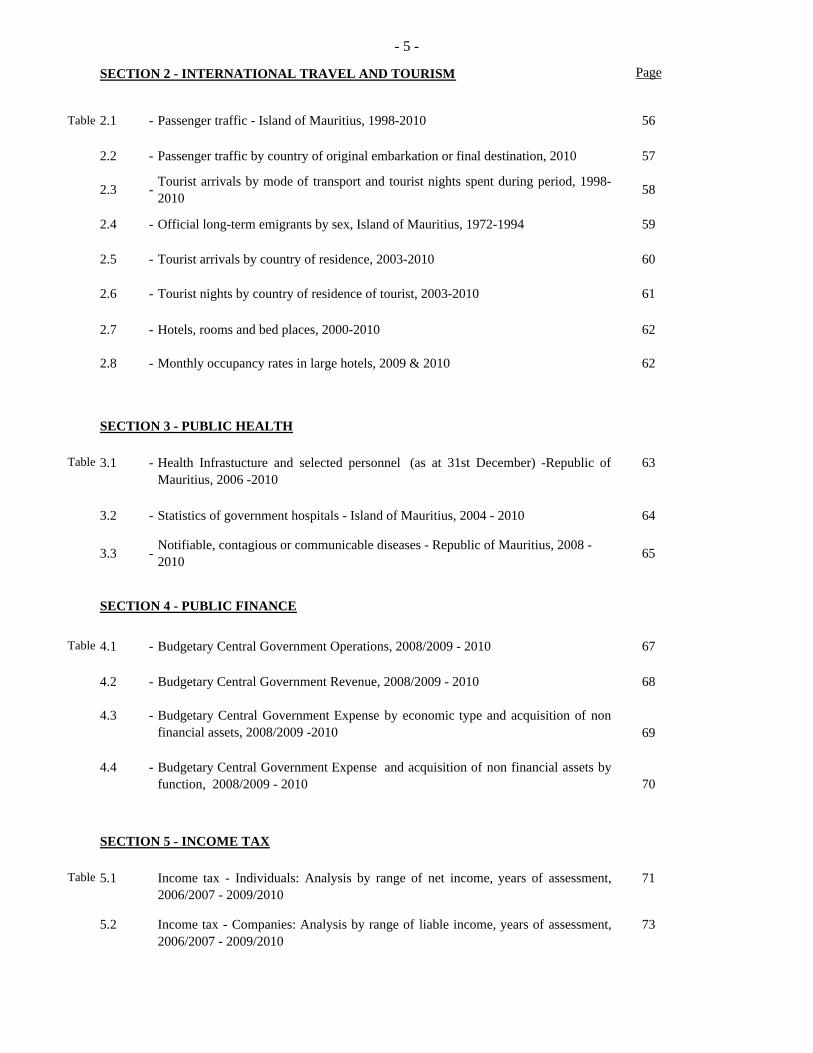
- 5 -
SECTION 2 - INTERNATIONAL TRAVEL AND TOURISM Page
Table 2.1 - Passenger traffic - Island of Mauritius, 1998-2010 56
2.2 - Passenger traffic by country of original embarkation or final destination, 2010 57
2.3 - Tourist arrivals by mode of transport and tourist nights spent during period, 1998-2010 58
2.4 - Official long-term emigrants by sex, Island of Mauritius, 1972-1994 59
2.5 - Tourist arrivals by country of residence, 2003-2010 60
2.6 - Tourist nights by country of residence of tourist, 2003-2010 61
2.7 - Hotels, rooms and bed places, 2000-2010 62
2.8 - Monthly occupancy rates in large hotels, 2009 & 2010 62
SECTION 3 - PUBLIC HEALTH
Table 3.1 - Health Infrastucture and selected personnel (as at 31st December) -Republic ofMauritius, 2006 -2010
63
3.2 - Statistics of government hospitals - Island of Mauritius, 2004 - 2010 64
3.3 - Notifiable, contagious or communicable diseases - Republic of Mauritius, 2008 - 2010 65
SECTION 4 - PUBLIC FINANCE
Table 4.1 - Budgetary Central Government Operations, 2008/2009 - 2010 67
4.2 - Budgetary Central Government Revenue, 2008/2009 - 2010 68
4.3 - Budgetary Central Government Expense by economic type and acquisition of nonfinancial assets, 2008/2009 -2010 69
4.4 - Budgetary Central Government Expense and acquisition of non financial assets byfunction, 2008/2009 - 2010 70
SECTION 5 - INCOME TAX
Table 5.1 Income tax - Individuals: Analysis by range of net income, years of assessment,2006/2007 - 2009/2010
71
5.2 Income tax - Companies: Analysis by range of liable income, years of assessment,2006/2007 - 2009/2010
73
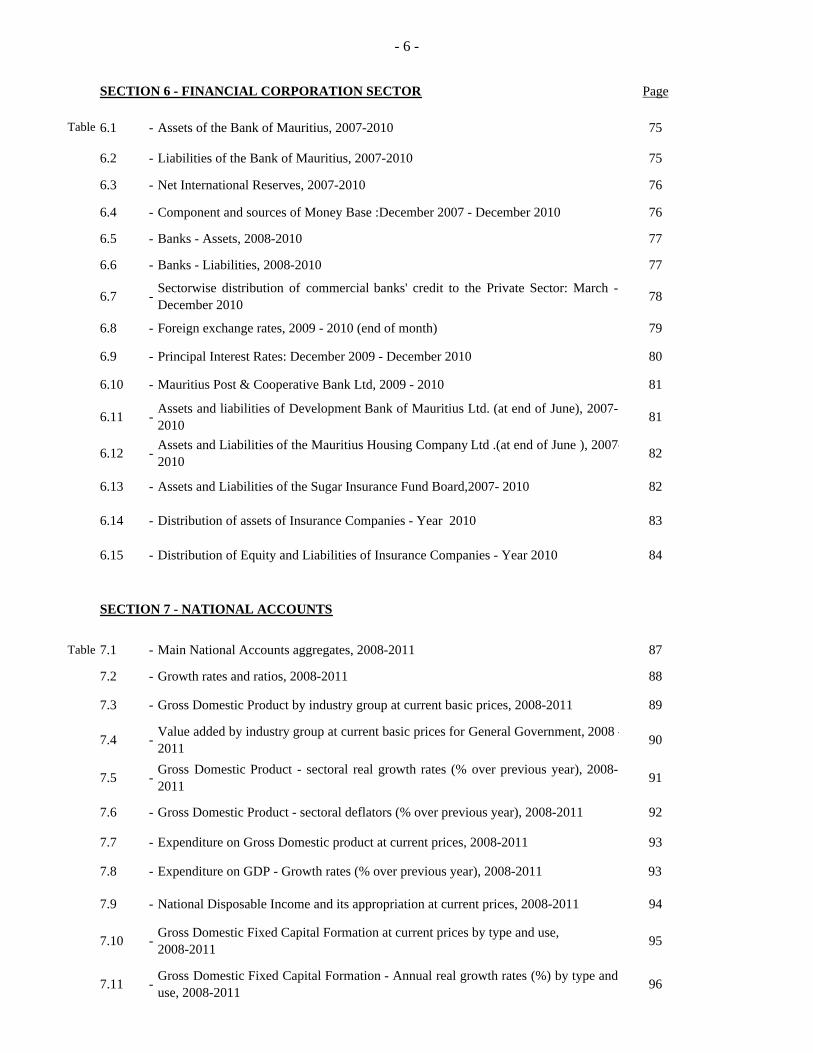
- 6 -
SECTION 6 - FINANCIAL CORPORATION SECTOR Page
Table 6.1 - Assets of the Bank of Mauritius, 2007-2010 75
6.2 - Liabilities of the Bank of Mauritius, 2007-2010 75
6.3 - Net International Reserves, 2007-2010 76
6.4 - Component and sources of Money Base :December 2007 - December 2010 76
6.5 - Banks - Assets, 2008-2010 77
6.6 - Banks - Liabilities, 2008-2010 77
6.7 - Sectorwise distribution of commercial banks' credit to the Private Sector: March -December 2010 78
6.8 - Foreign exchange rates, 2009 - 2010 (end of month) 79
6.9 - Principal Interest Rates: December 2009 - December 2010 80
6.10 - Mauritius Post & Cooperative Bank Ltd, 2009 - 2010 81
6.11 - Assets and liabilities of Development Bank of Mauritius Ltd. (at end of June), 2007-2010 81
6.12 - Assets and Liabilities of the Mauritius Housing Company Ltd .(at end of June ), 2007-2010 82
6.13 - Assets and Liabilities of the Sugar Insurance Fund Board,2007- 2010 82
6.14 - Distribution of assets of Insurance Companies - Year 2010 83
6.15 - Distribution of Equity and Liabilities of Insurance Companies - Year 2010 84
SECTION 7 - NATIONAL ACCOUNTS
Table 7.1 - Main National Accounts aggregates, 2008-2011 87
7.2 - Growth rates and ratios, 2008-2011 88
7.3 - Gross Domestic Product by industry group at current basic prices, 2008-2011 89
7.4 - Value added by industry group at current basic prices for General Government, 2008 -2011 90
7.5 - Gross Domestic Product - sectoral real growth rates (% over previous year), 2008-2011 91
7.6 - Gross Domestic Product - sectoral deflators (% over previous year), 2008-2011 92
7.7 - Expenditure on Gross Domestic product at current prices, 2008-2011 93
7.8 - Expenditure on GDP - Growth rates (% over previous year), 2008-2011 93
7.9 - National Disposable Income and its appropriation at current prices, 2008-2011 94
7.10 - Gross Domestic Fixed Capital Formation at current prices by type and use, 2008-2011 95
7.11 - Gross Domestic Fixed Capital Formation - Annual real growth rates (%) by type anduse, 2008-2011 96
- 7 -
SECTION 7 - NATIONAL ACCOUNTS (Cont'd) Page
Table 7.12 - Gross Domestic Fixed Capital Formation - Deflators (% over previous year),2008-2011 97
7.13 - Gross Domestic Fixed Capital Formation by industrial use and sector,2008-2011 98
7.14 - Summary of Balance of Payments, 2006-2010 99
7.15 - Balance of payments, 2008-2010 100
7.16 -Quarterly Gross Domestic Product by industry group at current basic prices, Q12008 - Q1 2010
102
7.17 - Gross Domestic Product - sectoral growth rates (% over corresponding period of previous year ), Q1 2009 - Q1 2011 103
7.18 - Quarterly expenditure on Gross Domestic Product at current basic prices, Q1 2009 -Q1 2011 104
7.19 - Quarterly Expenditure on GDP - Growth rates ( % over corresponding period ofprevious year) , Q1 2009 - Q1 2011 105
SECTION 8 - CONSUMER PRICE INDEX
Table 8.1 - Consumer Price Index, 1963-1976: Yearly Average 106
8.2 - Consumer Price Index, 1976-1991 106
8.3 - Monthly Consumer Price Index, July 1992-December 2010 107
8.4 - Inflation rate (%), 1975-2010 108
8.5 - Monthly sub-indices by division of consumption expenditure, December 2009-December 2010 109
8.6 - Internal purchasing power of the rupee, (1962-2010) 110
SECTION 9 - EXTERNAL TRADE
Table 9.1 - Summary of External Trade, 2007-2010 111
9.2 - Price indices of exports and imports and terms of trade, 2009-2010 112
9.3 - Annual % change in prices of Imports by Section, 2008-2009 113
9.4 - Exports of goods by section, 2007-2010 114
9.5 - Domestic exports by main product / sector, 2007-2010 115
9.6 - Exports of goods by main countries of destination, 2007-2010 116
9.7 - EOE exports by main section / commodity, 2007-2010 117
9.8 - EOE exports by main countries of destination, 2007-2010 118
- 8 -
SECTION 9 - EXTERNAL TRADE (Cont'd) Page
9.9 - Total imports by section / main commodities, 2007-2010 119
9.10 - Imports of selected commodities, quantity, 2007-2010 121
9.11 - EOE imports by main section / commodity, 2007-2010 121
9.12 - Total imports by main countries of origin, 2007-2010 122
SECTION 10 - LABOUR STATISTICS
Table 10.1 - Labour force, Employment and Unemployment, 16 years and over, 2006-2010 126
10.2 - Employment in large establishments by major industrial group, March 2008-March2010
127
10.3 - Employment in large establishments by sector, March 2008-March 2010 128
10.4 - Average monthly earnings in large establishments by industrial group, March 2008-March 2010 129
10.5 - Average monthly earnings in large establishments by industrial group for employeeson monthly rates of pay, March 2008 -March 2010 129
10.6 - Average daily earnings in large establishments by industrial group for employees ondaily rates of pay, March 2008-March 2010 130
10.7 - Average monthly earnings in EOE by industrial group for employees exclusively onmonthly rates of pay, March 2008-March 2010 130
10.8 - Average daily earnings in EOE by industrial group for employees exclusively ondaily rates of pay, March 2008-March 2010 130
10.9 - Minimum wages per month as prescribed by the National Remuneration Board forspecified occupations in principal industries, 2008-2010 131
10.10 - Earnings per month for typical occupations in selected industries (excludingGovernment), 2009 & 2010 133
10.11 - Minimum and maximum salary rates per month of specified occupations inMinistry/Department, July 2009-July 2010 134
10.12 - Average wages/salaries per month of selected occupations in Ministry/Department,2008-2010 135
SECTION 11 - SOCIAL SECURITY
Table 11.1(a) - Social Benefits, Republic of Mauritius, 2006/2007 - 2009/2010 136
11.1(b) - Social Benefits, Island of Mauritius, 2006/2007 - 2009/2010 137
11.1(c) - Social Benefits, Island of Rodrigues, 2006/2007 - 2009/2010 138
11.2 - National Pensions Scheme - Contribution from employers/employees, Republic ofMauritius, 2005/2006 - 2008/2009 139
11.3 Contribution to the National Savings Fund (NSF), Republic of Mauritius 2005/2006 -2008/2009 139
- 9 -
SECTION 12 - EDUCATION Page
Table 12.1 - Number of pre-primary schools, enrolment and personnel by district and sex, 2010 140
12.2 - Number of pre-primary schools, enrolment and personnel by zone and sex, 2010 140
12.3 - Primary education - Number of schools, pupils, personnel & pupil/teacher ratio,2006-2010
141
12.4 - Enrolment in primary schools by geographical district and grade, 2010 142
12.5 - Enrolment in primary schools by type of administration, grade and sex, 2008-2010 -Republic of Mauritius 143
12.6 - Certificate of Primary Education (CPE) examination results - Republic of Mauritius,1997-2010 144
12.7 - Secondary education - Number of schools, pupils, personnel and pupil/teacher ratio,2006-2010
145
12.8(a) - Enrolment in secondary schools (academic stream) by geographical district andgrade, 2010 146
12.8(b) - Enrolment in secondary schools (academic stream) by zone and grade, 2010 146
12.9 - Enrolment in secondary schools (academic stream) by type of administration, gradeand sex - Republic of Mauritius, 2008-2010
147
12.10 - Cambridge School Certificate (SC) examination results - Republic of Mauritius,1999-2010
148
12.11 - Cambridge Higher School Certificate (HSC) examination results - Republic ofMauritius, 1999-2010
149
12.12 - Pre-vocational Education - Number of schools, pupils, staff and pupil/teacher ratio,2006-2010
150
12.13 - Enrolment in schools offering pre-vocational education by district, sex and year ofstudy, 2010
151
12.14 - Enrolment in schools offering pre-vocational education by zone, sex and year ofstudy, 2010
151
12.15 - Enrolment in schools offering pre-vocational education by type of administration,year of study and sex, 2008-2010 152
12.16 - University of Mauritius - Enrolment, admission and output by course level andfaculty 153
12.17(a) - University of Technology - Mauritius : Enrolment by school, course level year ofstudy and sex, 2010/2011 154
12.17(b) - University of Technology - Mauritius : Enrolment by mode of study and output byschool,course level and sex 154
12.18 - Mauritius Institute of Health - Enrolment by course level and sex 155
12.19 - Mauritius Institute of Education - Enrolment and output by course level and sex 156
12.20 - Mahatma Gandhi Institute - Enrolment and Output by course level and sex 157
12.21 - Mauritius College of the Air - Enrolment for Distance Education by course level andsex, 2010 158
12.22 - Enrolment and Output in Polytechnics by field, year of study and sex 159
12.23 - Enrolment in Post-Secondary Institutions, 2010/2011 160
12.24 - Total number of students enrolled in Tertiary Education, both locally and overseas,by field of study as at December 2009 161
- 10 -
SECTION 13 - TRANSPORT AND COMMUNICATION Page
Table 13.1 - Motor vehicles registered, 2007 - 2010 162
13.2 - Registration of new motor vehicles, 2007 - 2010 163 `
13.3 - Registration of imported second-hand motor vehicles, 2007- 2010 163
13.4 - Motor vehicles off the road, 2007 - 2010 164
13.5 - Bus operational statistics, 2007- 2010 165
13.6 - Road traffic accidents, motor vehicles involved and casualties, 2006 - 2010 165
13.7 - Sea transport, 2007- 2010 166
13.8 - Air transport, 2007 - 2010 166
13.9 - Telephone service (end of period), 2006-2010 167
13.10 - Broadcasting services (end of period), 2006- 2010 167
SECTION 14 - LAND UTILIZATION
Table 14.1 - Total area classified by utilization 168
14.2 - Effective area under cultivation (hectares), 2005-2010 168
SECTION 15 - LOCAL PRODUCTION
Table 15.1 - Agriculture : production of main crops, 2005-2010 169
15.2 - Fisheries statistics, 2005-2010 169
15.3 - Livestock slaughtered, 2006-2010 170
15.4 - Sugar industry - cane cultivation, 2004-2010 171
15.5 - Sugar manufacture, 2005-2010 171
15.6 - Industry: Production of selected commodities, Island of Mauritius, 2005-2010 172
15.7 - Industrial Production: Number of establishments and value added at basic prices,2008-2009 173
15.8(a) - Quarterly Producer Price Index by NSIC Group, 2009-2010 (Manufacturingincluding Food, Beverages and Tobacco) 174
15.8(b) - Quarterly Producer Price Index by NSIC Group, 2009-2010 (Food, Beverages andTobacco) 175
15.9 - Productivity and unit labour cost indices (manufacturing sector), 1990-2010 176
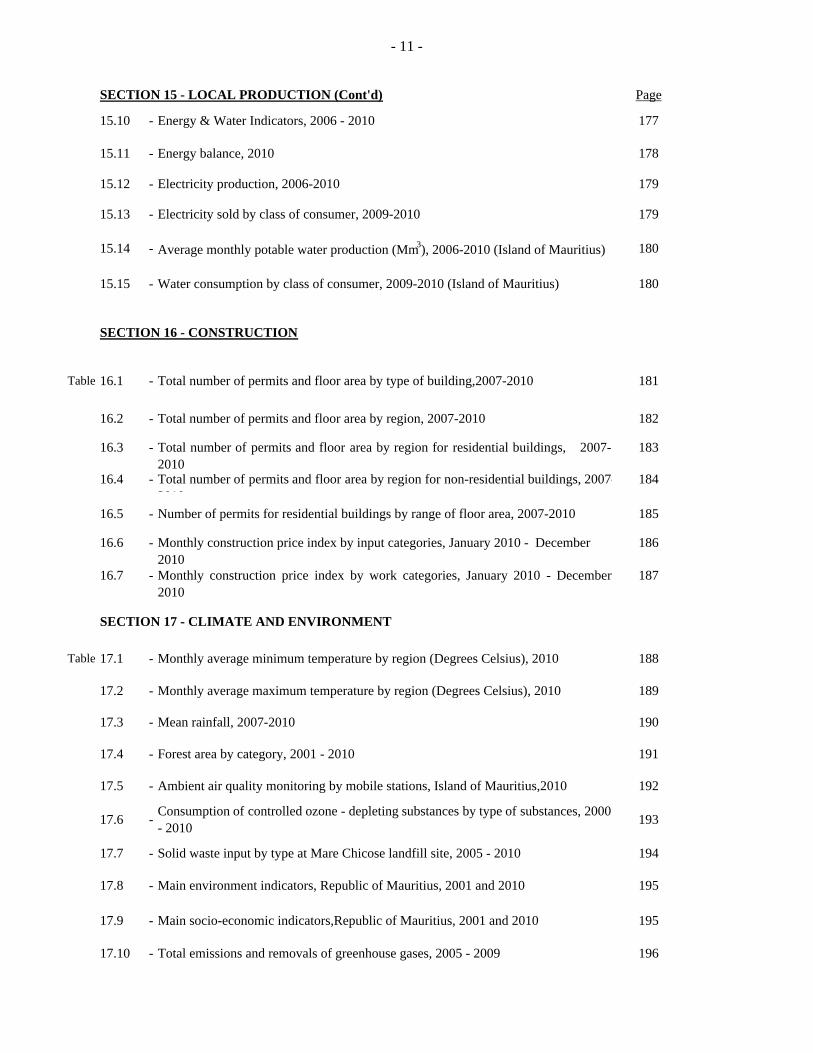
- 11 -
SECTION 15 - LOCAL PRODUCTION (Cont'd) Page
15.10 - Energy & Water Indicators, 2006 - 2010 177
15.11 - Energy balance, 2010 178
15.12 - Electricity production, 2006-2010 179
15.13 - Electricity sold by class of consumer, 2009-2010 179
15.14 - Average monthly potable water production (Mm3), 2006-2010 (Island of Mauritius) 180
15.15 - Water consumption by class of consumer, 2009-2010 (Island of Mauritius) 180
SECTION 16 - CONSTRUCTION
Table 16.1 - Total number of permits and floor area by type of building,2007-2010 181
16.2 - Total number of permits and floor area by region, 2007-2010 182
16.3 - Total number of permits and floor area by region for residential buildings, 2007-2010
183
16.4 - Total number of permits and floor area by region for non-residential buildings, 2007-2010
184
16.5 - Number of permits for residential buildings by range of floor area, 2007-2010 185
16.6 - Monthly construction price index by input categories, January 2010 - December 2010
186
16.7 - Monthly construction price index by work categories, January 2010 - December
2010187
SECTION 17 - CLIMATE AND ENVIRONMENT
Table 17.1 - Monthly average minimum temperature by region (Degrees Celsius), 2010 188
17.2 - Monthly average maximum temperature by region (Degrees Celsius), 2010 189
17.3 - Mean rainfall, 2007-2010 190
17.4 - Forest area by category, 2001 - 2010 191
17.5 - Ambient air quality monitoring by mobile stations, Island of Mauritius,2010 192
17.6 - Consumption of controlled ozone - depleting substances by type of substances, 2000- 2010 193
17.7 - Solid waste input by type at Mare Chicose landfill site, 2005 - 2010 194
17.8 - Main environment indicators, Republic of Mauritius, 2001 and 2010 195
17.9 - Main socio-economic indicators,Republic of Mauritius, 2001 and 2010 195
17.10 - Total emissions and removals of greenhouse gases, 2005 - 2009 196
- 12 -
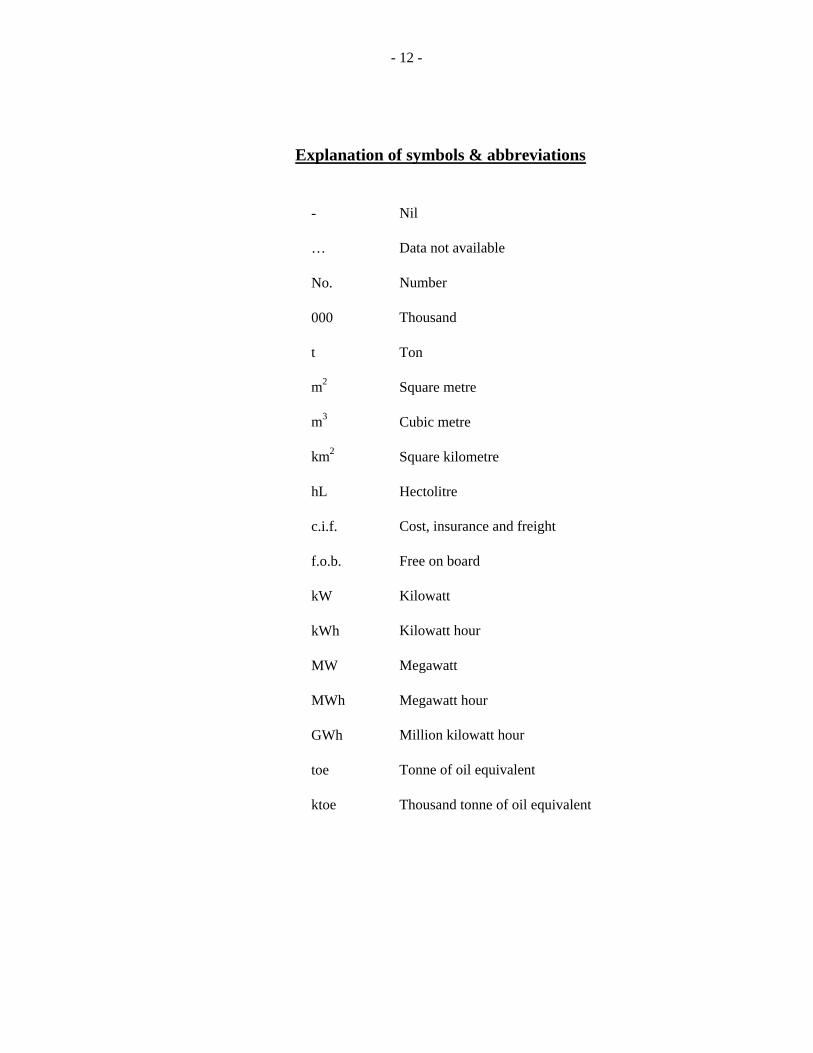
Explanation of symbols & abbreviations
- Nil
… Data not available
No. Number
000 Thousand
t Ton
m2 Square metre
m3 Cubic metre
km2 Square kilometre
hL Hectolitre
c.i.f. Cost, insurance and freight
f.o.b. Free on board
kW Kilowatt
kWh Kilowatt hour
MW Megawatt
MWh Megawatt hour
GWh Million kilowatt hour
toe Tonne of oil equivalent
ktoe Thousand tonne of oil equivalent
- 13 -
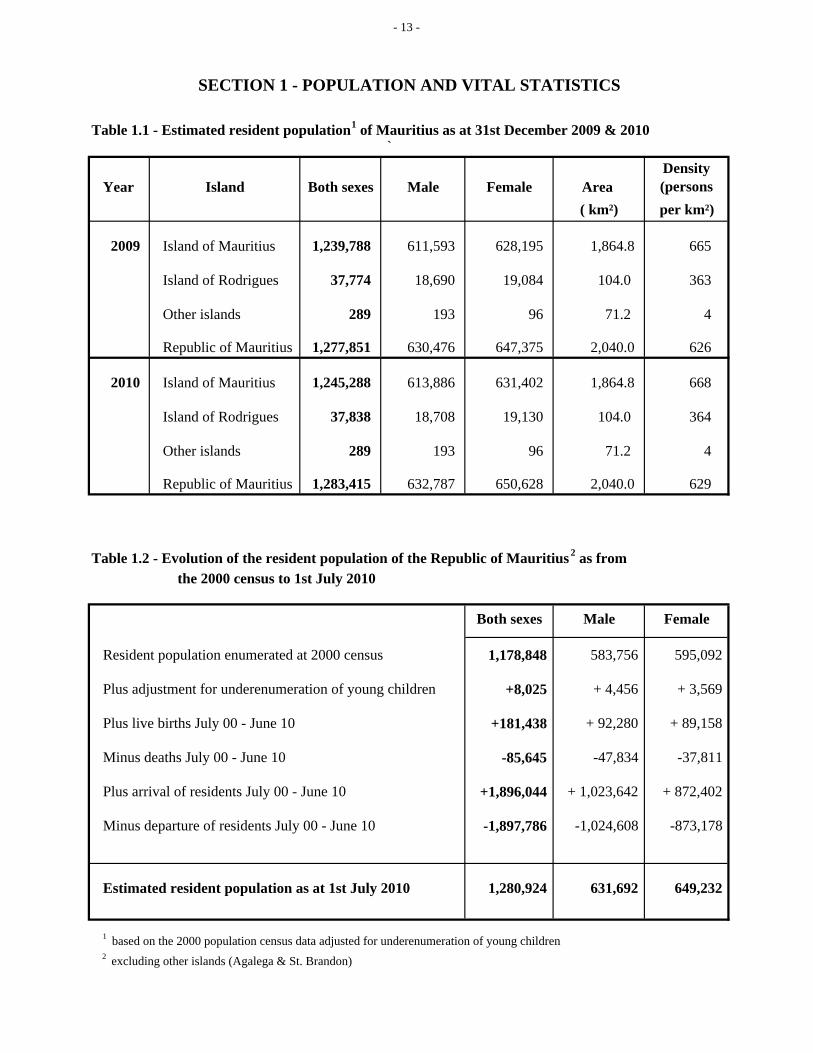
SECTION 1 - POPULATION AND VITAL STATISTICS
Table 1.1 - Estimated resident population1 of Mauritius as at 31st December 2009 & 2010`
Year Island Both sexes Male Female Area Density (persons
( km²) per km²)
2009 Island of Mauritius 1,239,788 611,593 628,195 1,864.8 665
Island of Rodrigues 37,774 18,690 19,084 104.0 363
Other islands 289 193 96 71.2 4
Republic of Mauritius 1,277,851 630,476 647,375 2,040.0 626
2010 Island of Mauritius 1,245,288 613,886 631,402 1,864.8 668
Island of Rodrigues 37,838 18,708 19,130 104.0 364
Other islands 289 193 96 71.2 4
Republic of Mauritius 1,283,415 632,787 650,628 2,040.0 629
Table 1.2 - Evolution of the resident population of the Republic of Mauritius2 as from the 2000 census to 1st July 2010
Both sexes Male Female
Resident population enumerated at 2000 census 1,178,848 583,756 595,092
Plus adjustment for underenumeration of young children +8,025 + 4,456 + 3,569
Plus live births July 00 - June 10 +181,438 + 92,280 + 89,158
Minus deaths July 00 - June 10 -85,645 -47,834 -37,811
Plus arrival of residents July 00 - June 10 +1,896,044 + 1,023,642 + 872,402
Minus departure of residents July 00 - June 10 -1,897,786 -1,024,608 -873,178
Estimated resident population as at 1st July 2010 1,280,924 631,692 649,232
1 based on the 2000 population census data adjusted for underenumeration of young children2 excluding other islands (Agalega & St. Brandon)
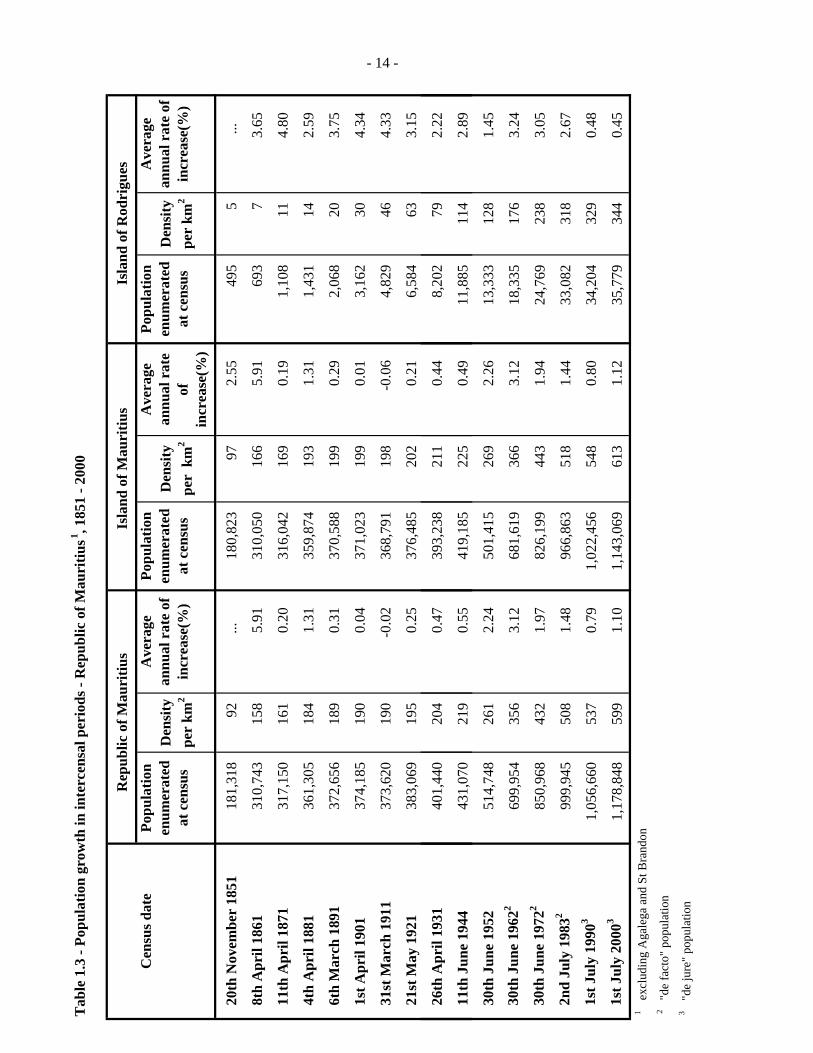
Tab
le 1
.3 -
Popu
latio
n gr
owth
in in
terc
ensa
l per
iods
- R
epub
lic o
f Mau
ritiu
s1 , 185
1 - 2
000
Rep
ublic
of M
auri
tius
Isla
nd o
f Mau
ritiu
sIs
land
of R
odri
gues
Cen
sus d
ate
Popu
latio
n en
umer
ated
at
cen
sus
Den
sity
pe
r km
2
Ave
rage
an
nual
rat
e of
in
crea
se(%
)
Popu
latio
n en
umer
ated
at
cen
sus
Den
sity
pe
r k
m2
Ave
rage
an
nual
rat
e of
in
crea
se(%
)
Popu
latio
n en
umer
ated
at
cen
sus
Den
sity
pe
r km
2
Ave
rage
an
nual
rat
e of
in
crea
se(%
)
20
th N
ovem
ber
1851
181,
318
92
..
.18
0,82
3
97
2.55
495
5
.
..
8t
h A
pril
1861
310,
743
15
8
5.91
310,
050
16
6
5.91
693
7
3.
65
11
th A
pril
1871
317,
150
16
1
0.20
316,
042
16
9
0.19
1,10
8
11
4.80
4t
h A
pril
1881
361,
305
18
4
1.31
359,
874
19
3
1.31
1,43
1
14
2.59
6t
h M
arch
189
137
2,65
6
189
0.
31
37
0,58
8
199
0.
29
2,
068
20
3.
75
1s
t Apr
il 19
0137
4,18
5
190
0.
04
37
1,02
3
199
0.
01
3,
162
30
4.
34
31
st M
arch
191
137
3,62
0
190
-0
.02
36
8,79
1
198
-0
.06
4,
829
46
4.
33
21
st M
ay 1
921
383,
069
19
5
0.25
376,
485
20
2
0.21
6,58
4
63
3.15
26
th A
pril
1931
401,
440
20
4
0.47
393,
238
21
1
0.44
8,20
2
79
2.22
- 14 -
11
th J
une
1944
431,
070
21
9
0.55
419,
185
22
5
0.49
11,8
85
114
2.
89
30
th J
une
1952
514,
748
26
1
2.24
501,
415
26
9
2.26
13,3
33
128
1.
45
30
th J
une
1962
269
9,95
4
356
3.
12
68
1,61
9
366
3.
12
18
,335
17
6
3.24
30
th J
une
1972
285
0,96
8
432
1.
97
82
6,19
9
443
1.
94
24
,769
23
8
3.05
2n
d Ju
ly 1
9832
999,
945
50
8
1.48
966,
863
51
8
1.44
33,0
82
318
2.
67
1s
t Jul
y 19
903
1,05
6,66
0
537
0.
79
1,
022,
456
54
8
0.80
34,2
04
329
0.
48
1s
t Jul
y 20
003
1,17
8,84
8
599
1.
10
1,
143,
069
61
3
1.12
35,7
79
344
0.
45
1
exc
ludi
ng A
gale
ga a
nd S
t Bra
ndon
2 "
de fa
cto"
pop
ulat
ion
3 "
de ju
re"
popu
latio
n
Tab
le 1
.4(a
) - P
opul
atio
n en
umer
ated
at e
ach
cens
us b
y po
pula
tion
grou
p an
d se
x - I
slan
d of
Mau
ritiu
s, 18
46 -
1952
Gen
eral
pop
ulat
ion
Indo
-Mau
ritia
n po
pula
tion
Chi
nese
pop
ulat
ion
Yea
r of
Cen
sus
Bot
h se
xes
Mal
eFe
mal
eB
oth
sexe
sM
ale
Fem
ale
Bot
h se
xes
Mal
eFe
mal
e
1846
102,
217
55
,663
46
,554
56
,245
48
,935
7,
310
-
-
-
1851
102,
827
55
,059
47
,768
77
,996
64
,282
13
,714
-
-
-
1861
115,
864
59
,796
56
,068
19
2,63
4
141,
615
51
,019
1,
552
1,
550
2
1871
97,4
97
49,4
87
48,0
10
216,
258
14
1,80
4
74,4
54
2,28
7
2,28
4
3
1881
107,
323
53
,754
53
,569
24
8,99
3
151,
352
97
,641
3,
558
3,
549
9
1891
111,
517
55
,397
56
,120
25
5,92
0
147,
499
10
8,42
1
3,15
1
3,14
2
9
1901
108,
422
52
,995
55
,427
25
9,08
6
143,
100
11
5,98
6
3,51
5
3,45
7
58
1911
107,
432
51
,808
55
,624
25
7,69
7
138,
974
11
8,72
3
3,66
2
3,31
3
349
- 15 -
1921
104,
216
49
,725
54
,491
26
5,52
4
139,
150
12
6,37
4
6,74
5
5,23
3
1,51
2
1931
115,
666
54
,733
60
,933
26
8,64
9
139,
533
12
9,11
6
8,92
3
6,34
3
2,58
0
1944
143,
056
67
,136
75
,920
26
5,24
7
136,
382
12
8,86
5
10,8
82
6,80
8
4,07
4
1952
148,
238
70
,370
77
,868
33
5,32
7
171,
241
16
4,08
6
17,8
50
10,4
21
7,42
9
Not
e: A
t the
196
2 ce
nsus
eac
h ho
useh
olde
r was
ask
ed fo
r the
firs
t tim
e, to
stat
e th
e po
pula
tion
grou
p to
whi
ch e
ach
mem
ber o
f his
hou
seho
ld
clai
med
to b
elon
g.
Prio
r to
1962
, it i
s pro
babl
e th
at fr
om o
ne c
ensu
s to
anot
her,
diff
eren
t crit
eria
hav
e be
en u
sed
in c
lass
ifyin
g th
e po
pula
tion
by p
opul
atio
n gr
oups
.
Figu
res a
re th
eref
ore
not s
trict
ly c
ompa
rabl
e fr
om o
ne c
ensu
s to
anot
her,
befo
re 1
962.
Tab
le 1
.4(b
) - P
opul
atio
n en
umer
ated
at e
ach
cens
us b
y co
mm
unity
and
sex
- Rep
ublic
of M
auri
tius1 , 1
962
- 200
0
Yea
r of
Rep
ublic
of M
auri
tius
Isla
nd o
f Mau
ritiu
sIs
land
of R
odri
gues
cens
usC
omm
unity
Bot
h se
xes
Mal
eFe
mal
eB
oth
sexe
sM
ale
Fem
ale
Bot
h se
xes
Mal
eFe
mal
e
1962
2T
otal
Pop
ulat
ion
699,
954
351,
368
348,
586
681,
619
342,
306
339,
313
18,3
35
9,06
2
9,27
3
Hin
du34
4,62
2 17
4,71
3 16
9,90
9 34
4,58
7 17
4,69
8 16
9,88
9 35
15
20
Mus
lim11
0,40
4 56
,018
54
,386
11
0,32
2 55
,971
54
,351
82
47
35
Sin
o-M
aurit
ian
23,4
36
12,8
64
10,5
72
23,0
58
12,6
54
10,4
04
378
21
0
168
Gen
eral
Pop
ulat
ion
221,
492
107,
773
113,
719
203,
652
98,9
83
104,
669
17,8
40
8,79
0
9,05
0
1972
2T
otal
Pop
ulat
ion
850,
968
425,
850
425,
118
826,
199
413,
580
412,
619
24,7
69
12,2
70
12,4
99
Hin
du42
8,34
5 21
5,75
2 21
2,59
3 42
8,16
7 21
5,65
4 21
2,51
3 17
8
98
80
Mli
137
171
6883
468
337
137
081
6878
968
292
9045
45
- 16 -
Mus
lim13
7,17
1 68
,834
68
,337
13
7,08
1 68
,789
68
,292
90
45
45
Sin
o-M
aurit
ian
24,3
73
13,0
18
11,3
55
24,0
84
12,8
49
11,2
35
289
16
9
120
Gen
eral
Pop
ulat
ion
261,
079
128,
246
132,
833
236,
867
116,
288
120,
579
24,2
12
11,9
58
12,2
54
1983
2T
otal
Pop
ulat
ion
999,
945
497,
920
502,
025
966,
863
481,
368
485,
495
33,0
82
16,5
52
16,5
30
1990
3T
otal
Pop
ulat
ion
1,05
6,66
0 52
7,76
0 52
8,90
0 1,
022,
456
510,
676
511,
780
34,2
04
17,0
84
17,1
20
2000
3T
otal
Pop
ulat
ion
1,17
8,84
8 58
3,75
6 59
5,09
2 1,
143,
069
566,
056
577,
013
35,7
79
17,7
00
18,0
79
1 exc
ludi
ng A
gale
ga a
nd S
t Bra
ndon
2 "de
fact
o "
popu
latio
n 3 "
de ju
re"
popu
latio
n
Not
e: N
o da
ta o
n co
mm
unity
was
col
lect
ed in
198
3 , 1
990
and
2000
-
Tab
le 1
.5 -
Popu
latio
n by
geo
grap
hica
l dis
tric
t and
sex
at 1
990
& 2
000
cens
uses
, and
the
inte
rcen
sal i
ncre
ase
-
Rep
ublic
of M
auri
tius1
1990
cen
sus2
2000
cen
sus2
Inte
rcen
sal i
ncre
ase
Geo
grap
hica
l dis
tric
tB
oth
sexe
sM
ale
Fem
ale
Bot
h se
xes
Mal
eFe
mal
eN
umbe
rA
nnua
l ave
rage
(%
)
Po
rt L
ouis
133,
073
66
,179
66,8
94
12
7,85
5
63,4
58
64
,397
-5,2
18
-0
.40
Pa
mpl
emou
sses
101,
666
51
,212
50,4
54
12
2,25
2
60,5
33
61
,719
20,5
86
1.
86
R
ivie
re d
u R
empa
rt86
,779
43,3
62
43
,417
98,8
54
49
,116
49,7
38
12
,075
1.31
Fl
acq
112,
773
56
,452
56,3
21
12
6,83
9
63,5
49
63
,290
14,0
66
1.
18
G
rand
Por
t96
,667
48,4
25
48
,242
106,
665
53
,011
53,6
54
9,
998
0.
99
Sa
vann
e60
,841
30,4
44
30
,397
66,3
56
32
,787
33,5
69
5,
515
0.
87
Pl
aine
s Wilh
ems
321,
713
16
0,25
2
161,
461
35
8,18
2
175,
852
18
2,33
0
36,4
69
1.
08
- 17 -
M
oka
65,1
76
32
,378
32,7
98
75
,479
37,2
75
38
,204
10,3
03
1.
48
B
lack
Riv
er43
,768
21,9
72
21
,796
60,5
87
30
,475
30,1
12
16
,819
3.31
Is
land
of M
auri
tius
1,02
2,45
6
510,
676
51
1,78
0
1,14
3,06
9
566,
056
57
7,01
3
120,
613
1.
12
Is
land
of R
odri
gues
34,2
04
17
,084
17,1
20
35
,779
17,7
00
18
,079
1,57
5
0.45
R
epub
lic o
f Mau
ritiu
s1,
056,
660
52
7,76
0
528,
900
1,
178,
848
58
3,75
6
595,
092
12
2,18
8
1.10
1
exc
ludi
ng A
gale
ga a
nd S
t. B
rand
on
2
"de
jure
" po
pula
tion;
not
adj
uste
d fo
r und
eren
umer
atio
n of
you
ng c
hild
ren
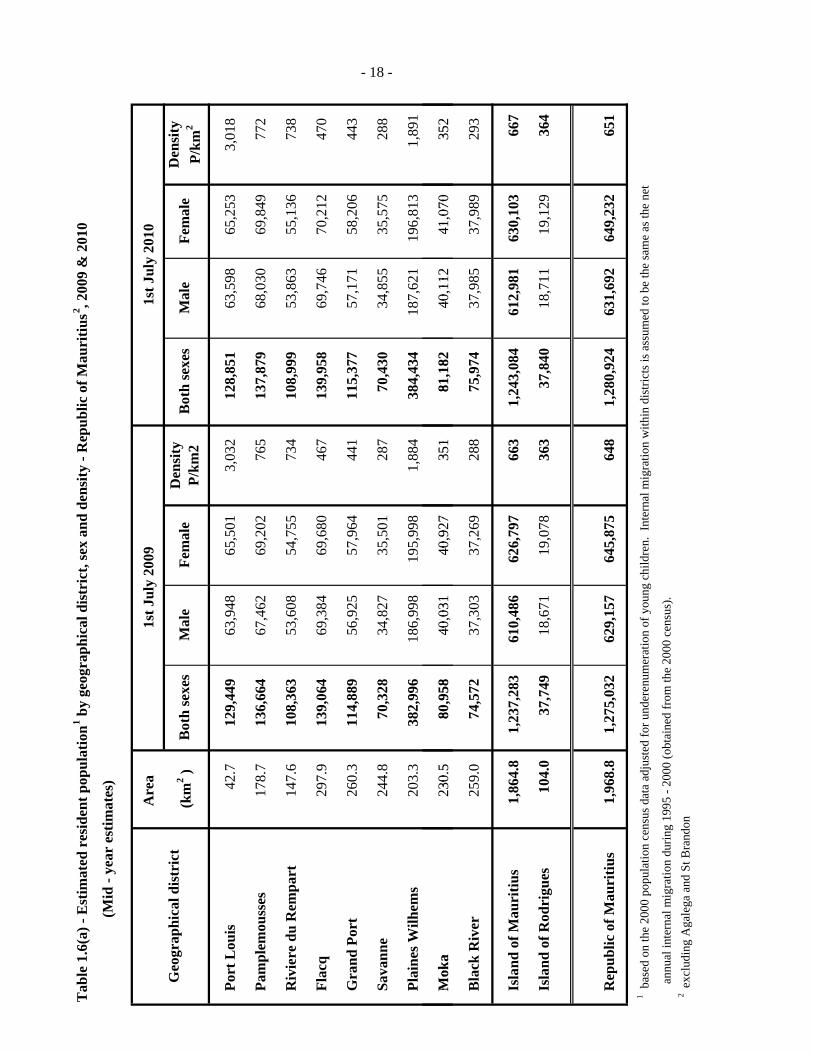
Tab
le 1
.6(a
) - E
stim
ated
res
iden
t pop
ulat
ion1 b
y ge
ogra
phic
al d
istr
ict,
sex
and
dens
ity -
Rep
ublic
of M
auri
tius2 , 2
009
& 2
010
(
Mid
- ye
ar e
stim
ates
)
Are
a 1s
t Jul
y 20
091s
t Jul
y 20
10
Geo
grap
hica
l dis
tric
t(k
m2 )
Bot
h se
xes
Mal
eFe
mal
eD
ensi
ty
P/km
2B
oth
sexe
sM
ale
Fem
ale
Den
sity
P/
km2
Po
rt L
ouis
42.7
12
9,44
9
63,9
48
65,5
01
3,03
2
128,
851
63
,598
65
,253
3,
018
Pa
mpl
emou
sses
178.
7
136,
664
67
,462
69
,202
76
5
137,
879
68
,030
69
,849
77
2
R
ivie
re d
u R
empa
rt14
7.6
10
8,36
3
53,6
08
54,7
55
734
10
8,99
9
53,8
63
55,1
36
738
Fl
acq
297.
9
139,
064
69
,384
69
,680
46
7
139,
958
69
,746
70
,212
47
0
G
rand
Por
t26
0.3
11
4,88
9
56,9
25
57,9
64
441
11
5,37
7
57,1
71
58,2
06
443
Sa
vann
e24
4.8
70
,328
34
,827
35
,501
28
7
70,4
30
34,8
55
35,5
75
288
Pl
aine
s Wilh
ems
203.
3
382,
996
18
6,99
8
195,
998
1,
884
38
4,43
4
187,
621
19
6,81
3
1,89
1
Mok
a23
05
8095
840
031
4092
735
181
182
4011
241
070
352
- 18 -
M
oka
230.
5
80,9
58
40,0
31
40,9
27
351
81
,182
40
,112
41
,070
35
2
B
lack
Riv
er25
9.0
74
,572
37
,303
37
,269
28
8
75,9
74
37,9
85
37,9
89
293
Is
land
of M
auri
tius
1,86
4.8
1,
237,
283
61
0,48
6
626,
797
66
3
1,24
3,08
4
612,
981
63
0,10
3
667
Is
land
of R
odri
gues
104.
0
37,7
49
18,6
71
19,0
78
363
37
,840
18
,711
19
,129
36
4
R
epub
lic o
f Mau
ritiu
s1,
968.
8
1,27
5,03
2
629,
157
64
5,87
5
648
1,
280,
924
63
1,69
2
649,
232
65
1
1 b
ased
on
the
2000
pop
ulat
ion
cens
us d
ata
adju
sted
for u
nder
enum
erat
ion
of y
oung
chi
ldre
n. I
nter
nal m
igra
tion
with
in d
istri
cts i
s ass
umed
to b
e th
e sa
me
as th
e ne
t
annu
al in
tern
al m
igra
tion
durin
g 19
95 -
2000
(obt
aine
d fr
om th
e 20
00 c
ensu
s).
2 e
xclu
ding
Aga
lega
and
St B
rand
on
-
Tab
le 1
.6(b
) - E
stim
ated
res
iden
t pop
ulat
ion1 b
y ge
ogra
phic
al d
istr
ict,
sex
and
dens
ity -
Rep
ublic
of M
auri
tius2 , 2
009
& 2
010
(E
nd o
f yea
r es
timat
es)
Are
a 31
st D
ecem
ber
2009
31st
Dec
embe
r 20
10
Geo
grap
hica
l dis
tric
t(k
m²)
Bot
h se
xes
Mal
eFe
mal
eD
ensi
ty
P/km
2B
oth
sexe
sM
ale
Fem
ale
Den
sity
P/
km2
Po
rt L
ouis
42.7
12
9,12
5
63,7
80
65
,345
3,02
4
128,
483
63
,367
65,1
16
3,
009
Pa
mpl
emou
sses
178.
7
137,
244
67
,731
69,5
13
76
8
138,
339
68
,258
70,0
81
77
4
R
ivie
re d
u R
empa
rt14
7.6
10
8,66
9
53,7
45
54
,924
736
10
9,20
6
53,9
47
55
,259
740
Fl
acq
297.
9
139,
465
69
,531
69,9
34
46
8
140,
294
69
,871
70,4
23
47
1
G
rand
Por
t26
0.3
11
5,09
2
57,0
30
58
,062
442
11
5,54
6
57,2
33
58
,313
444
Sa
vann
e24
4.8
70
,327
34,8
13
35
,514
287
70
,471
34,8
60
35
,611
288
Pl
aine
s Wilh
ems
203.
3
383,
606
18
7,27
9
196,
327
1,
887
38
5,03
4
187,
863
19
7,17
1
1,89
4
- 19 -
Pl
aine
s Wilh
ems
203.
3
383,
606
18
7,27
9
196,
327
1,
887
38
5,03
4
187,
863
19
7,17
1
1,89
4
M
oka
230.
5
81,0
40
40
,060
40,9
80
35
2
81,2
88
40
,162
41,1
26
35
3
B
lack
Riv
er25
9.0
75
,220
37,6
24
37
,596
290
76
,627
38,3
25
38
,302
296
Is
land
of M
auri
tius
1,86
4.8
1,
239,
788
61
1,59
3
628,
195
66
5
1,24
5,28
8
613,
886
63
1,40
2
668
Is
land
of R
odri
gues
104.
0
37,7
74
18
,690
19,0
84
36
3
37,8
38
18
,708
19,1
30
36
4
R
epub
lic o
f Mau
ritiu
s1,
968.
8
1,27
7,56
2
630,
283
64
7,27
9
649
1,
283,
126
63
2,59
4
650,
532
65
2
1
bas
ed o
n th
e 20
00 p
opul
atio
n ce
nsus
dat
a ad
just
ed fo
r und
eren
umer
atio
n of
you
ng c
hild
ren.
Int
erna
l mig
ratio
n w
ithin
dis
trict
s is a
ssum
ed to
be
the
sam
e as
the
net a
nnua
l int
erna
l mig
ratio
n du
ring
1995
- 20
00 (o
btai
ned
from
the
2000
cen
sus)
.
2 e
xclu
ding
Aga
lega
and
St.
Bra
ndon
9 -
Tab
le 1
.7- P
opul
atio
n1 by
urba
n/ru
ral r
esid
ence
and
sex
at 1
990
and
2000
cen
suse
s and
the
inte
rcen
sal i
ncre
ase
- Rep
ublic
of M
auri
tius2
Cou
ntry
/Mun
icip
al19
90 c
ensu
s420
00 c
ensu
s4In
terc
ensa
l inc
reas
e
Cou
ncil
Are
a (M
CA
)3B
oth
sexe
sM
ale
Fem
ale
Bot
h se
xes
Mal
eFe
mal
eN
umbe
rA
nnua
lav
erag
e(%
)
Isla
nd o
f Mau
ritiu
s1,
022,
456
510,
676
511,
780
1,14
3,06
9 56
6,05
6 57
7,01
3 12
0,61
3 1.
12
Urb
an p
opul
atio
n41
4,24
2 20
6,10
4 20
8,13
8 50
3,04
5 24
7,84
4 25
5,20
1 88
,803
1.
96
-
Port
Lou
is(1
32,4
60)
(65,
873)
(6
6,58
7)
(144
,303
) (7
1,72
0)
(72,
583)
(1
1,84
3)
(0.8
6)
-
Beau
Bas
sin/
Rose
Hill
(91,
518)
(4
5,49
7)
(46,
021)
(1
03,8
72)
(50,
730)
(5
3,14
2)
(12,
354)
(1
.27)
-
Qua
tre
Born
es(6
8,39
8)
(33,
875)
(3
4,52
3)
(75,
884)
(3
7,30
6)
(38,
578)
(7
,486
) (1
.04)
-
Vaco
as/P
hoen
ix(5
6,45
2)
(28,
235)
(2
8,21
7)
(100
,066
) (4
9,45
2)
(50,
614)
(4
3,61
4)
(5.8
9)
-
Cur
epip
e(6
5,41
4)
(32,
624)
(3
2,79
0)
(78,
920)
(3
8,63
6)
(40,
284)
(1
3,50
6)
(1.8
9)
Rur
al p
opul
atio
n60
8,21
4 30
4,57
2 30
3,64
2 64
0,02
4 31
8,21
2 32
1,81
2 31
,810
0.
51
- 20 -
Isla
nd o
f Rod
rigu
es34
,204
17
,084
17
,120
35
,779
17
,700
18
,079
1,
575
0.45
U
rban
pop
ulat
ion
-
-
-
-
-
-
-
-
Rur
al p
opul
atio
n34
,204
17
,084
17
,120
35
,779
17
,700
18
,079
1,
575
0.45
Rep
ublic
of M
auri
tius
1,05
6,66
0 52
7,76
0 52
8,90
0 1,
178,
848
583,
756
595,
092
122,
188
1.10
Urb
an p
opul
atio
n41
4,24
2 20
6,10
4 20
8,13
8 50
3,04
5 24
7,84
4 25
5,20
1 88
,803
1.
96
Rur
al p
opul
atio
n64
2,41
8 32
1,65
6 32
0,76
2 67
5,80
3 33
5,91
2 33
9,89
1 33
,385
0.
51
1 n
ot a
djus
ted
for u
nder
enum
erat
ion
of y
oung
chi
ldre
n2
exc
ludi
ng A
gale
ga a
nd S
t Bra
ndon
3 a
ccor
ding
to p
rocl
aim
ed b
ound
arie
s, al
tere
d in
196
3 (P
rocl
amat
ion
No.
12
and
13) a
nd su
bseq
uent
ly e
nlar
ged
in 1
965
- (Pr
ocla
mat
ion
No.
23)
and
in 1
967
(Pro
clam
atio
n N
o. 2
). U
rban
pop
ulat
ion
refe
rs to
the
popu
latio
n in
Mun
icip
al C
ounc
il A
reas
.4
"de
jure
" po
pula
tion
Tab
le 1
.8(a
) - E
stim
ated
re
side
nt p
opul
atio
n1 by
urba
n/ru
ral r
esid
ence
and
sex
- Rep
ublic
of M
auri
tius2 , 2
009
& 2
010
( Mid
- ye
ar e
stim
ates
)
Cou
ntry
/Mun
icip
al1s
t Jul
y 20
091s
t Jul
y 20
10
Cou
ncil
Are
a (M
CA
)3B
oth
sexe
sM
ale
Fem
ale
Bot
h se
xes
Mal
eFe
mal
e
Is
land
of M
auri
tius
1,23
7,28
3
610,
486
62
6,79
7
1,24
3,08
4
612,
981
63
0,10
3
Urb
an p
opul
atio
n53
2,59
1
261,
041
27
1,55
0
533,
771
26
1,48
9
272,
282
-
Por
t Lou
is(1
48,9
28)
(7
3,69
0)
(75,
238)
(1
48,6
38)
(7
3,49
2)
(75,
146)
-
Bea
u Ba
ssin
/Ros
e H
ill(1
10,3
37)
(5
3,67
5)
(56,
662)
(1
10,6
87)
(5
3,83
9)
(56,
848)
-
Qua
tre
Born
es(8
1,40
9)
(39,
856)
(4
1,55
3)
(81,
773)
(4
0,02
8)
(41,
745)
-
Vac
oas/
Phoe
nix
(107
,678
)
(52,
877)
(5
4,80
1)
(108
,186
)
(53,
121)
(5
5,06
5)
-
Cur
epip
e(8
4,23
9)
(40,
943)
(4
3,29
6)
(84,
487)
(4
1,00
9)
(43,
478)
Rur
al p
opul
atio
n70
4,69
2
349,
445
35
5,24
7
709,
313
35
1,49
2
357,
821
Il
dfR
di
3774
918
671
1907
837
840
1871
119
129
- 21 -
Is
land
of R
odri
gues
37,7
49
18
,671
19,0
78
37
,840
18,7
11
19
,129
Urb
an p
opul
atio
n
-
-
-
-
-
-
Rur
al p
opul
atio
n37
,749
18,6
71
19
,078
37,8
40
18
,711
19,1
29
R
epub
lic o
f Mau
ritiu
s1,
275,
032
62
9,15
7
645,
875
1,
280,
924
63
1,69
2
649,
232
Urb
an p
opul
atio
n53
2,59
1
261,
041
27
1,55
0
533,
771
26
1,48
9
272,
282
Rur
al p
opul
atio
n74
2,44
1
368,
116
37
4,32
5
747,
153
37
0,20
3
376,
950
1 ba
sed
on 2
000
popu
latio
n ce
nsus
dat
a ad
just
ed fo
r und
eren
umer
atio
n of
you
ng c
hild
ren.
Inte
rnal
mig
ratio
n w
ithin
tow
ns is
ass
umed
to b
e th
e sa
me
as th
e ne
t ann
ual
mig
ratio
n du
ring
1995
- 20
00 (o
btai
ned
from
the
2000
cen
sus)
. 2
exc
ludi
ng A
gale
ga a
nd S
t Bra
ndon
3
acco
rdin
g to
pro
clai
med
bou
ndar
ies a
ltere
d in
196
3 (P
rocl
. No.
12,
13),1
965
(Pro
cl. N
o. 2
3), 1
967
(Pro
cl. N
o. 2
), 19
90 (P
rocl
. No.
8).
Tab
le 1
.8(b
) - E
stim
ated
res
iden
t pop
ulat
ion¹
by
urba
n/ru
ral r
esid
ence
and
sex
- R
epub
lic o
f Mau
ritiu
s2 , 200
9 &
201
0
(
End
of y
ear
estim
ates
)
Cou
ntry
/Mun
icip
al31
st D
ecem
ber
2009
31st
Dec
embe
r 20
10
Cou
ncil
Are
a (M
CA
)3B
oth
sexe
sM
ale
Fem
ale
Bot
h se
xes
Mal
eFe
mal
e
Is
land
of M
auri
tius
1,23
9,78
8
611,
593
62
8,19
5
1,24
5,28
8
613,
886
63
1,40
2
Urb
an p
opul
atio
n53
3,04
5
261,
239
27
1,80
6
534,
163
26
1,57
4
272,
589
-
Port
Lou
is(1
48,7
56)
(7
3,60
0)
(75,
156)
(1
48,4
16)
(7
3,33
0)
(75,
086)
-
Beau
Bas
sin/
Rose
Hill
(110
,459
)
(53,
740)
(5
6,71
9)
(110
,866
)
(53,
903)
(5
6,96
3)
-
Qua
tre
Born
es(8
1,59
4)
(39,
946)
(4
1,64
8)
(81,
899)
(4
0,08
6)
(41,
813)
-
Vaco
as/P
hoen
ix(1
07,8
99)
(5
2,99
7)
(54,
902)
(1
08,3
47)
(5
3,18
8)
(55,
159)
-
Cur
epip
e(8
4,33
7)
(40,
956)
(4
3,38
1)
(84,
635)
(4
1,06
7)
(43,
568)
Rur
al p
opul
atio
n70
6,74
3
350,
354
35
6,38
9
711,
125
35
2,31
2
358,
813
Isla
ndof
Rod
rigu
es37
774
1869
019
084
3783
818
708
1913
0
- 22 -
Is
land
of R
odri
gues
37,7
74
18
,690
19,0
84
37
,838
18,7
08
19
,130
Urb
an p
opul
atio
n
-
-
-
-
-
-
Rur
al p
opul
atio
n37
,774
18,6
90
19
,084
37,8
38
18
,708
19,1
30
R
epub
lic o
f Mau
ritiu
s1,
277,
562
63
0,28
3
647,
279
1,
283,
126
63
2,59
4
650,
532
Urb
an p
opul
atio
n53
3,04
5
261,
239
27
1,80
6
534,
163
26
1,57
4
272,
589
Rur
al p
opul
atio
n74
4,51
7
369,
044
37
5,47
3
748,
963
37
1,02
0
377,
943
1 b
ased
on
2000
cen
sus d
ata
adju
sted
for u
nder
enum
erat
ion
of y
oung
chi
ldre
n. In
tern
al m
igra
tion
with
in to
wns
is a
ssum
ed to
be
the
sam
e as
the
net a
nnua
l int
erna
l
m
igra
tion
durin
g 19
95 -
2000
(obt
aine
d fr
om th
e 20
00 c
ensu
s).
2 exc
ludi
ng A
gale
ga a
nd S
t. B
rand
on 3
acc
ordi
ng to
pro
clai
med
bou
ndar
ies a
ltere
d in
196
3 (P
rocl
. No.
12,
13),1
965
(Pro
cl. N
o. 2
3), 1
967
(Pro
cl. N
o. 2
), 19
90 (P
rocl
. No.
8).

Tab
le 1
.9(a
) - A
ge d
istr
ibut
ion
of th
e po
pula
tion
as e
num
erat
ed a
t the
199
0 an
d 20
00 c
ensu
ses -
Rep
ublic
of M
auri
tius1
Age
gro
up1
9 9
0 2
2 0
0 0
2
(Yea
rs)
Mal
eFe
mal
eB
oth
sexe
sM
ale
Fem
ale
Bot
h se
xes
Num
ber
%N
umbe
r%
010
,490
10,2
62
20
,752
2.0
9,
574
9,
341
18
,915
1.6
1
- 438
,330
37,6
37
75
,967
7.2
38
,066
37,3
22
75
,388
6.4
5
- 952
,501
50,9
81
10
3,48
2
9.8
53
,037
52,1
52
10
5,18
9
8.9
10
- 14
57,1
71
56
,102
113,
273
10
.7
49,4
28
48
,312
97,7
40
8.
3
15 -
1949
,238
47,9
64
97
,202
9.2
51
,671
50,4
17
10
2,08
8
8.7
20
- 24
52,4
26
50
,238
102,
664
9.
7
55,1
08
55
,784
110,
892
9.
4
25 -
2953
,689
51,8
93
10
5,58
2
10.0
46
,749
47,0
48
93
,797
8.0
30
- 34
47,7
14
45
,875
93,5
89
8.
9
49,9
64
49
,551
99,5
15
8.
4
35 -
3941
,284
39,9
25
81
,209
7.7
51
,621
50,3
25
10
1,94
6
8.6
40
- 44
30,1
26
30
,309
60,4
35
5.
7
45,7
98
44
,608
90,4
06
7.
7
45 -
4921
,908
22,8
02
44
,710
4.2
39
,133
38,7
98
77
,931
6.6
50
-54
1846
219
576
3803
83
627
790
2914
956
939
48
- 23 -
50 -
5418
,462
19,5
76
38
,038
3.6
27
,790
29,1
49
56
,939
4.8
55
- 59
15,6
88
16
,475
32,1
63
3.
0
19,2
28
21
,263
40,4
91
3.
4
60 -
6414
,758
16,0
88
30
,846
2.9
15
,301
17,7
96
33
,097
2.8
65
- 69
11,3
01
12
,952
24,2
53
2.
3
11,7
58
14
,010
25,7
68
2.
2
70 -
746,
480
8,
269
14
,749
1.4
9,
491
12
,203
21,6
94
1.
9
75 -
793,
904
6,
071
9,
975
0.
9
6,04
7
8,86
3
14,9
10
1.
3
80 -
841,
566
3,
210
4,
776
0.
5
2,58
4
4,54
8
7,13
2
0.6
85
+69
4
2,22
9
2,92
3
0.3
1,
363
3,
528
4,
891
0.
4
Age
unk
now
n30
42
72
0.0
45
74
11
9
0.0
All
ages
527,
760
52
8,90
0
1,05
6,66
0
100.
0
583,
756
59
5,09
2
1,17
8,84
8
100.
0
1 ex
clud
ing
Aga
lega
and
St B
rand
on
2 'd
e ju
re' p
opul
atio
n; n
ot a
djus
ted
for u
nder
enum
erat
ion
of y
oung
chi
ldre
n
Tab
le 1
.9(b
) - A
ge d
istr
ibut
ion
of th
e po
pula
tion
as e
num
erat
ed a
t the
199
0 an
d 20
00 c
ensu
ses -
Isla
nd o
f Mau
ritiu
s
Age
gro
up1
9 9
0 1
2 0
0 0
1
(Yea
rs)
Mal
eFe
mal
eB
oth
sexe
sM
ale
Fem
ale
Bot
h se
xes
Num
ber
%N
umbe
r%
010
,088
9,90
8
19
,996
2.0
9,16
3
8,
965
18,1
28
1.
6
1
- 436
,743
36,0
39
72
,782
7.1
36,6
97
35
,910
72,6
07
6.
3
5
- 950
,011
48,4
43
98
,454
9.6
51,2
29
50
,271
101,
500
8.9
10 -
1454
,708
53,6
84
10
8,39
2
10
.6
47
,438
46,4
10
93
,848
8.2
15 -
1947
,231
45,9
82
93
,213
9.1
49,4
47
48
,126
97,5
73
8.
5
20
- 24
50,7
84
48
,694
99,4
78
9.
7
53
,325
53,9
93
10
7,31
8
9.
4
25
- 29
52,4
51
50
,576
103,
027
10.1
45,3
90
45
,656
91,0
46
8.
0
30
- 34
46,6
03
44
,800
91,4
03
8.
9
48
,739
48,3
07
97
,046
8.5
35 -
3940
,437
39,1
42
79
,579
7.8
50,5
03
49
,151
99,6
54
8.
7
40
- 44
29,4
57
29
,689
59,1
46
5.
8
44
,739
43,5
68
88
,307
7.7
45 -
4921
,219
22,1
02
43
,321
4.2
38,3
40
38
,069
76,4
09
6.
7
50
5417
892
1897
436
866
36
2716
828
556
5572
44
9
- 24 -
50 -
5417
,892
18,9
74
36
,866
3.6
27,1
68
28
,556
55,7
24
4.
9
55
- 59
15,2
19
16
,016
31,2
35
3.
1
18
,623
20,6
47
39
,270
3.4
60 -
6414
,426
15,7
47
30
,173
3.0
14,8
08
17
,248
32,0
56
2.
8
65
- 69
11,0
62
12
,698
23,7
60
2.
3
11
,404
13,6
02
25
,006
2.2
70 -
746,
307
8,04
0
14
,347
1.4
9,26
7
11
,954
21,2
21
1.
9
75
- 79
3,81
5
5,
924
9,73
9
1.
0
5,
905
8,68
1
14
,586
1.3
80 -
841,
514
3,11
0
4,
624
0.4
2,50
6
4,
416
6,92
2
0.
6
85
+68
0
2,
172
2,85
2
0.
3
1,
324
3,41
0
4,
734
0.4
Age
unk
now
n29
40
69
0.0
41
73
114
0.0
All
ages
510,
676
511,
780
1,02
2,45
6
10
0.0
566,
056
577,
013
1,14
3,06
9
10
0.0
1
'de
jure
' pop
ulat
ion;
not
adj
uste
d fo
r und
eren
umer
atio
n of
you
ng c
hild
ren
Tab
le 1
.9(c
) - A
ge d
istr
ibut
ion
of th
e po
pula
tion
1/ a
s enu
mer
ated
at t
he 1
990
and
2000
cen
suse
s, Is
land
of R
odri
gues
Bot
h se
xes
Bot
h se
xes
Mal
eFe
mal
eN
umbe
r%
Mal
eFe
mal
eN
umbe
r%
040
2
354
75
6
2.2
411
37
6
787
2.
2
1
- 41,
587
1,
598
3,
185
9.
3
1,
369
1,
412
2,
781
7.
8
5
- 92,
490
2,
538
5,
028
14
.7
1,80
8
1,88
1
3,68
9
10.3
10
- 14
2,46
3
2,41
8
4,88
1
14.3
1,
990
1,
902
3,
892
10
.9
15 -
192,
007
1,
982
3,
989
11
.7
2,22
4
2,29
1
4,51
5
12.6
20
- 24
1,64
2
1,54
4
3,18
6
9.3
1,78
3
1,79
1
3,57
4
10.0
25
- 29
1,23
8
1,31
7
2,55
5
7.5
1,35
9
1,39
2
2,75
1
7.7
30 -
341,
111
1,
075
2,
186
6.
4
1,
225
1,
244
2,
469
6.
9
35
- 39
847
78
3
1,63
0
4.8
1,11
8
1,17
4
2,29
2
6.4
40 -
4466
9
620
1,
289
3.
8
1,
059
1,
040
2,
099
5.
9
45
- 49
689
70
0
1,38
9
4.1
793
72
9
1,52
2
4.3
50 -
5457
0
602
1,
172
3.
4
62
2
593
1,
215
3.
4
55
- 59
469
45
9
928
2.
7
60
5
616
1,
221
3.
4
Age
gro
up(Y
ears
)19
9020
00
- 25 -
,60
- 64
332
34
1
673
2.
0
49
3
548
1,
041
2.
9
65
- 69
239
25
4
493
1.
4
35
4
408
76
2
2.1
70 -
7417
3
229
40
2
1.2
224
24
9
473
1.
3
75
- 79
89
14
7
236
0.
7
14
2
182
32
4
0.9
80 -
8452
100
15
2
0.4
78
13
2
210
0.
6
8
5 +
14
57
71
0.
2
39
118
15
7
0.4
Age
unk
now
n1
2
3
0.
0
4
1
5
0.
0
A
ll ag
es17
,084
17
,120
34
,204
10
0.0
17,7
00
18,0
79
35,7
79
100.
0
1/
'd
e ju
re' p
opul
atio
n
Tab
le 1
.10(
a) -
Est
imat
ed r
esid
ent p
opul
atio
n1 by
age-
grou
p an
d se
x - R
epub
lic o
f Mau
ritiu
s2 , 20
09 &
201
0
(Mid
- ye
ar e
stim
ates
)
1st J
uly
2009
1st J
uly
2010
Age
gro
upB
oth
sexe
sB
oth
sexe
s(Y
ears
)M
ale
Fem
ale
Num
ber
%
Mal
eFe
mal
eN
umbe
r
%
07,
873
7,
824
15
,697
1.2
7,
637
7,
503
15
,140
1.2
1
- 435
,637
34,3
37
69
,974
5.5
34
,052
32,9
35
66
,987
5.2
5
- 949
,593
47,8
49
97
,442
7.6
48
,937
47,4
16
96
,353
7.5
10
- 14
50,3
81
49
,304
99,6
85
7.
8
49,8
41
48
,410
98,2
51
7.
7
15 -
1955
,121
53,6
06
10
8,72
7
8.5
54
,905
53,6
75
10
8,58
0
8.5
20
- 24
47,7
38
46
,751
94,4
89
7.
4
49,0
06
48
,025
97,0
31
7.
6
25 -
2953
,776
52,9
66
10
6,74
2
8.4
50
,952
49,9
69
10
0,92
1
7.9
30
- 34
52,1
92
53
,588
105,
780
8.
3
54,1
26
55
,307
109,
433
8.
5
35 -
3945
,582
46,2
03
91
,785
7.2
45
,657
46,5
73
92
,230
7.2
40
- 44
48,9
39
49
,435
98,3
74
7.
7
48,3
59
48
,834
97,1
93
7.
6
45 -
4948
,409
48,4
51
96
,860
7.6
49
,111
49,3
37
98
,448
7.7
- 26 -
,,
,,
50 -
5440
,967
41,7
39
82
,706
6.5
42
,427
43,1
55
85
,582
6.7
55
- 59
34,4
90
36
,185
70,6
75
5.
5
35,0
16
36
,796
71,8
12
5.
6
60 -
6421
,743
25,0
98
46
,841
3.7
23
,450
26,6
39
50
,089
3.9
65
- 69
14,0
65
17
,271
31,3
36
2.
5
14,8
39
18
,343
33,1
82
2.
6
70 -
7410
,148
13,9
51
24
,099
1.9
10
,497
14,2
81
24
,778
1.9
75
- 79
6,43
2
9,59
3
16,0
25
1.
3
6,61
0
9,99
8
16,6
08
1.
3
80 -
844,
039
7,
073
11
,112
0.9
4,
120
7,
019
11
,139
0.9
85
+2,
032
4,
651
6,
683
0.
5
2,15
0
5,01
7
7,16
7
0.5
All
ages
629,
157
64
5,87
5
1,27
5,03
2
100.
0
631,
692
64
9,23
2
1,28
0,92
4
100.
0
1 b
ased
on
2000
pop
ulat
ion
cens
us d
ata
adju
sted
for u
nder
enum
erat
ion
of y
oung
chi
ldre
n (4
,456
mal
es a
nd 3
,569
fem
ales
at a
ges 0
- 9
year
s)
2 e
xclu
ding
Aga
lega
and
St B
rand
on
Tab
le 1
.10(
b) -
Est
imat
ed r
esid
ent p
opul
atio
n1 by
age
grou
p an
d se
x - I
slan
d of
Mau
ritiu
s, 2
009
& 2
010
(Mid
- ye
ar e
stim
ates
)
Age
gro
up1s
t Jul
y 20
091s
t Jul
y 20
10
(Yea
rs)
Mal
eFe
mal
eB
oth
sexe
sM
ale
Fem
ale
Bot
h se
xes
Num
ber
%N
umbe
r%
07,
469
7,47
7
14
,946
1.2
7,26
5
7,
137
14,4
02
1.
2
1
- 433
,911
32,6
86
66
,597
5.4
32,4
02
31
,349
63,7
51
5.
1
5
- 947
,516
45,8
90
93
,406
7.5
46,7
85
45
,420
92,2
05
7.
4
10
- 14
48,6
62
47
,519
96,1
81
7.
8
48
,077
46,6
31
94
,708
7.6
15 -
1953
,273
51,7
72
10
5,04
5
8.
5
53
,114
51,8
17
10
4,93
1
8.
4
20
- 24
45,8
85
44
,923
90,8
08
7.
3
47
,168
46,2
71
93
,439
7.5
25 -
2951
,923
51,0
25
10
2,94
8
8.
3
49
,137
48,0
44
97
,181
7.8
30 -
3451
,112
52,3
82
10
3,49
4
8.
4
52
,944
54,0
34
10
6,97
8
8.
6
35
- 39
44,7
29
45
,232
89,9
61
7.
3
44
,850
45,6
21
90
,471
7.3
40 -
4448
,072
48,5
10
96
,582
7.8
47,4
64
47
,903
95,3
67
7.
7
- 27 -
45 -
4947
,419
47,4
33
94
,852
7.7
48,1
34
48
,348
96,4
82
7.
8
50
- 54
39,9
62
40
,850
80,8
12
6.
5
41
,433
42,2
11
83
,644
6.7
55 -
5933
,803
35,5
18
69
,321
5.6
34,2
99
36
,113
70,4
12
5.
7
60
- 64
21,2
02
24
,555
45,7
57
3.
7
22
,906
26,1
01
49
,007
3.9
65 -
6913
,600
16,7
34
30
,334
2.4
14,3
57
17
,808
32,1
65
2.
6
70
- 74
9,80
2
13
,511
23,3
13
1.
9
10
,138
13,8
26
23
,964
1.9
75 -
796,
218
9,33
4
15
,552
1.3
6,39
7
9,
703
16,1
00
1.
3
80
- 84
3,96
4
6,
926
10,8
90
0.
9
4,
023
6,88
6
10
,909
0.9
85 +
1,96
4
4,
520
6,48
4
0.
5
2,
088
4,88
0
6,
968
0.6
All
ages
610,
486
62
6,79
7
1,23
7,28
3
100.
0
61
2,98
1
630,
103
1,
243,
084
10
0.0
1 b
ased
on
2000
pop
ulat
ion
cens
us d
ata
adju
sted
for u
nder
enum
erat
ion
of y
oung
chi
ldre
n ( 4
,456
mal
es a
nd 3
,569
fem
ales
at a
ges 0
-9 y
ears
)
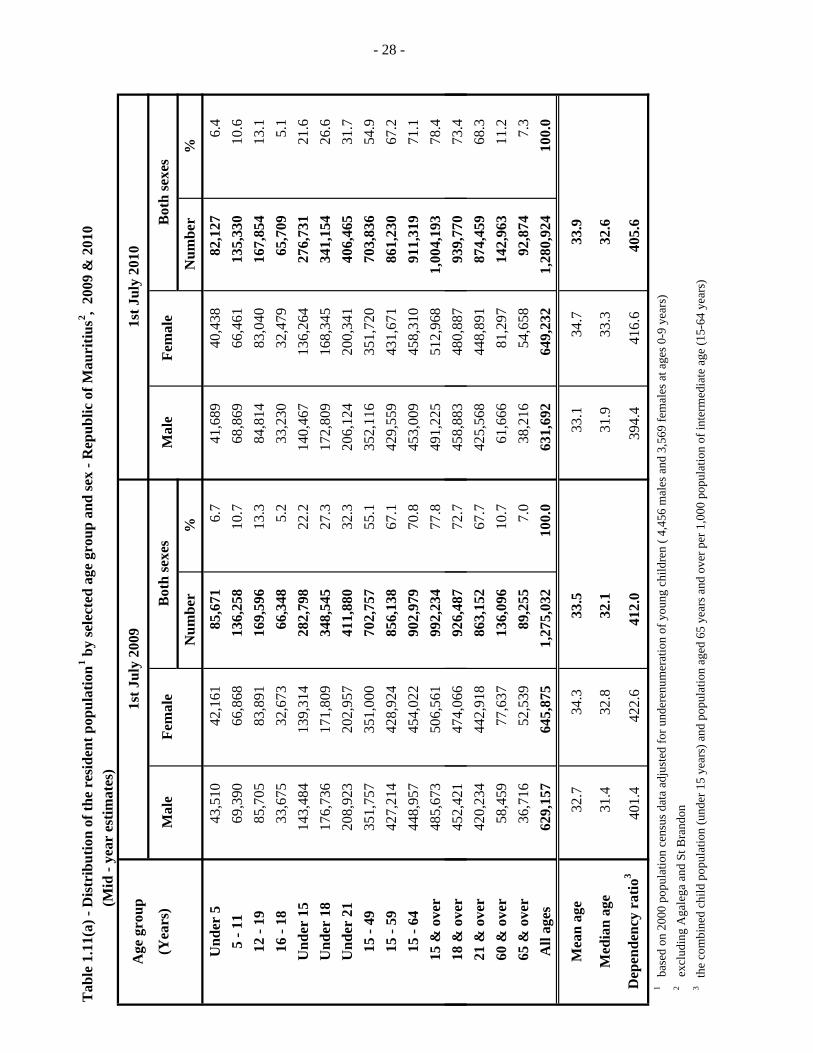
Tab
le 1
.11(
a) -
Dis
trib
utio
n of
the
resi
dent
pop
ulat
ion1 b
y se
lect
ed a
ge g
roup
and
sex
- Rep
ublic
of M
auri
tius2 ,
2009
& 2
010
(M
id -
year
est
imat
es)
Age
gro
up1s
t Jul
y 20
091s
t Jul
y 20
10
(Yea
rs)
Mal
eFe
mal
eB
oth
sexe
sM
ale
Fem
ale
Bot
h se
xes
Num
ber
%N
umbe
r%
Und
er 5
43,5
10
42
,161
85,6
71
6.
7
41
,689
40,4
38
82
,127
6.4
5 - 1
169
,390
66,8
68
13
6,25
8
10.7
68,8
69
66
,461
135,
330
10
.6
12
- 19
85,7
05
83
,891
169,
596
13
.3
84
,814
83,0
40
16
7,85
4
13.1
16 -
1833
,675
32,6
73
66
,348
5.2
33,2
30
32
,479
65,7
09
5.
1
U
nder
15
143,
484
13
9,31
4
282,
798
22
.2
14
0,46
7
136,
264
27
6,73
1
21.6
Und
er 1
817
6,73
6
171,
809
34
8,54
5
27.3
172,
809
16
8,34
5
341,
154
26
.6
U
nder
21
208,
923
20
2,95
7
411,
880
32
.3
20
6,12
4
200,
341
40
6,46
5
31.7
15 -
4935
1,75
7
351,
000
70
2,75
7
55.1
352,
116
35
1,72
0
703,
836
54
.9
15
- 59
427,
214
42
8,92
4
856,
138
67
.1
42
9,55
9
431,
671
86
1,23
0
67.2
15 -
6444
8,95
7
454,
022
90
2,97
9
70.8
453,
009
45
8,31
0
911,
319
71
.1
1
5 &
ove
r48
5,67
3
506,
561
99
2,23
4
77.8
491,
225
51
2,96
8
1,00
4,19
3
78.4
- 28 -
18
& o
ver
452,
421
47
4,06
6
926,
487
72
.7
45
8,88
3
480,
887
93
9,77
0
73.4
21
& o
ver
420,
234
44
2,91
8
863,
152
67
.7
42
5,56
8
448,
891
87
4,45
9
68.3
60
& o
ver
58,4
59
77
,637
136,
096
10
.7
61
,666
81,2
97
14
2,96
3
11.2
65
& o
ver
36,7
16
52
,539
89,2
55
7.
0
38
,216
54,6
58
92
,874
7.3
All
ages
629,
157
64
5,87
5
1,27
5,03
2
100.
0
63
1,69
2
649,
232
1,
280,
924
10
0.0
Mea
n ag
e32
.7
34
.3
33
.5
33
.1
34
.7
33
.9
Med
ian
age
31.4
32.8
32.1
31.9
33.3
32.6
Dep
ende
ncy
ratio
340
1.4
422.
6
41
2.0
394.
4
41
6.6
405.
6
1
base
d on
200
0 po
pula
tion
cens
us d
ata
adju
sted
for u
nder
enum
erat
ion
of y
oung
chi
ldre
n ( 4
,456
mal
es a
nd 3
,569
fem
ales
at a
ges 0
-9 y
ears
)
2 ex
clud
ing
Aga
lega
and
St B
rand
on
3 t
he c
ombi
ned
child
pop
ulat
ion
(und
er 1
5 ye
ars)
and
pop
ulat
ion
aged
65
year
s and
ove
r per
1,0
00 p
opul
atio
n of
inte
rmed
iate
age
(15-
64 y
ears
)
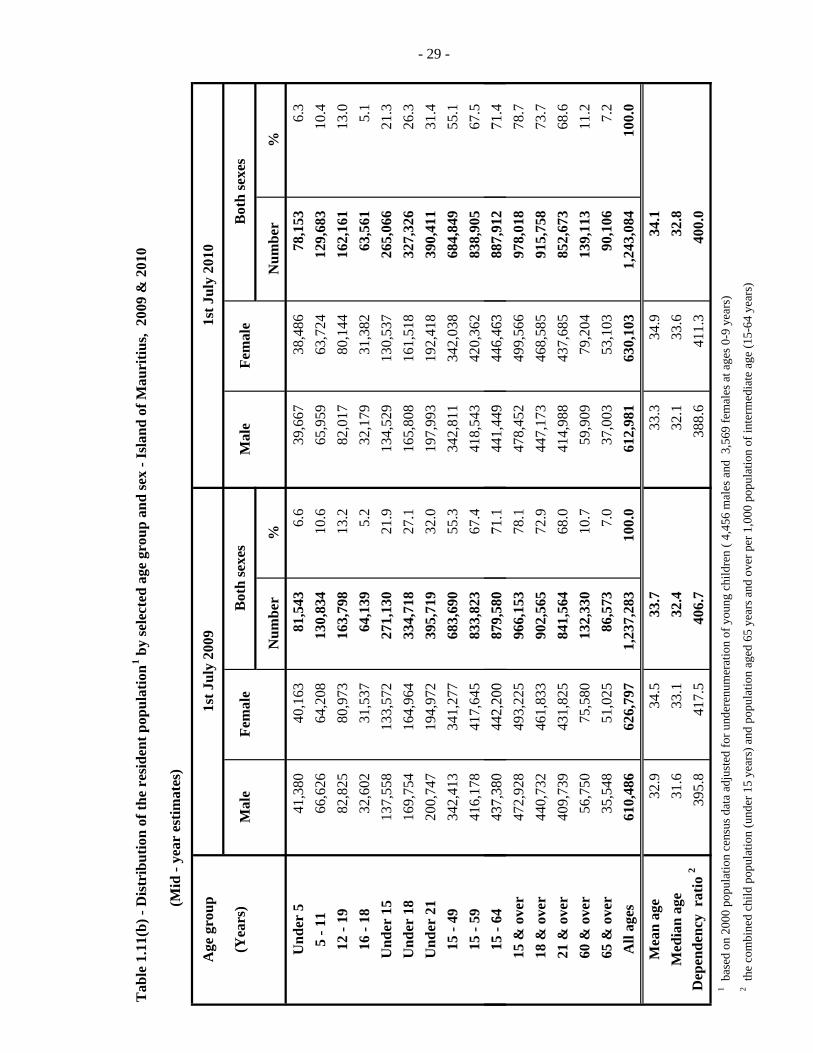
Tab
le 1
.11(
b) -
Dis
trib
utio
n of
the
resi
dent
pop
ulat
ion1 b
y se
lect
ed a
ge g
roup
and
sex
- Isl
and
of M
auri
tius,
200
9 &
201
0
(M
id -
year
est
imat
es)
Age
gro
up1s
t Jul
y 20
091s
t Jul
y 20
10
(Yea
rs)
Mal
eFe
mal
eB
oth
sexe
sM
ale
Fem
ale
Bot
h se
xes
Num
ber
%N
umbe
r%
Und
er 5
41,3
80
40,1
63
81,5
43
6.6
39,6
67
38,4
86
78,1
53
6.3
5 - 1
166
,626
64
,208
13
0,83
4
10.6
65,9
59
63,7
24
129,
683
10
.4
12
- 19
82,8
25
80,9
73
163,
798
13
.2
82
,017
80
,144
16
2,16
1
13.0
16 -
1832
,602
31
,537
64
,139
5.
2
32
,179
31
,382
63
,561
5.
1
U
nder
15
137,
558
13
3,57
2
271,
130
21
.9
13
4,52
9
130,
537
26
5,06
6
21.3
Und
er 1
816
9,75
4
164,
964
33
4,71
8
27.1
165,
808
16
1,51
8
327,
326
26
.3
U
nder
21
200,
747
19
4,97
2
395,
719
32
.0
19
7,99
3
192,
418
39
0,41
1
31.4
15 -
4934
2,41
3
341,
277
68
3,69
0
55.3
342,
811
34
2,03
8
684,
849
55
.1
15
- 59
416,
178
41
7,64
5
833,
823
67
.4
41
8,54
3
420,
362
83
8,90
5
67.5
1564
437
380
442
200
879
580
711
441
449
446
463
887
912
714
- 29 -
15 -
6443
7,38
0
442,
200
87
9,58
0
71.1
441,
449
44
6,46
3
887,
912
71
.4
1
5 &
ove
r47
2,92
8
493,
225
96
6,15
3
78.1
478,
452
49
9,56
6
978,
018
78
.7
1
8 &
ove
r44
0,73
2
461,
833
90
2,56
5
72.9
447,
173
46
8,58
5
915,
758
73
.7
2
1 &
ove
r40
9,73
9
431,
825
84
1,56
4
68.0
414,
988
43
7,68
5
852,
673
68
.6
6
0 &
ove
r56
,750
75
,580
13
2,33
0
10.7
59,9
09
79,2
04
139,
113
11
.2
6
5 &
ove
r35
,548
51
,025
86
,573
7.
0
37
,003
53
,103
90
,106
7.
2
A
ll ag
es61
0,48
6
626,
797
1,
237,
283
10
0.0
612,
981
63
0,10
3
1,24
3,08
4
100.
0
Mea
n ag
e32
.9
34.5
33
.7
33.3
34
.9
34.1
M
edia
n ag
e31
.6
33.1
32
.4
32.1
33
.6
32.8
D
epen
denc
y r
atio
239
5.8
41
7.5
40
6.7
38
8.6
41
1.3
40
0.0
1
bas
ed o
n 20
00 p
opul
atio
n ce
nsus
dat
a ad
just
ed fo
r und
eren
umer
atio
n of
you
ng c
hild
ren
( 4,4
56 m
ales
and
3,5
69 fe
mal
es a
t age
s 0-9
yea
rs)
2
the
com
bine
d ch
ild p
opul
atio
n (u
nder
15
year
s) a
nd p
opul
atio
n ag
ed 6
5 ye
ars a
nd o
ver p
er 1
,000
pop
ulat
ion
of in
term
edia
te a
ge (1
5-64
yea
rs)
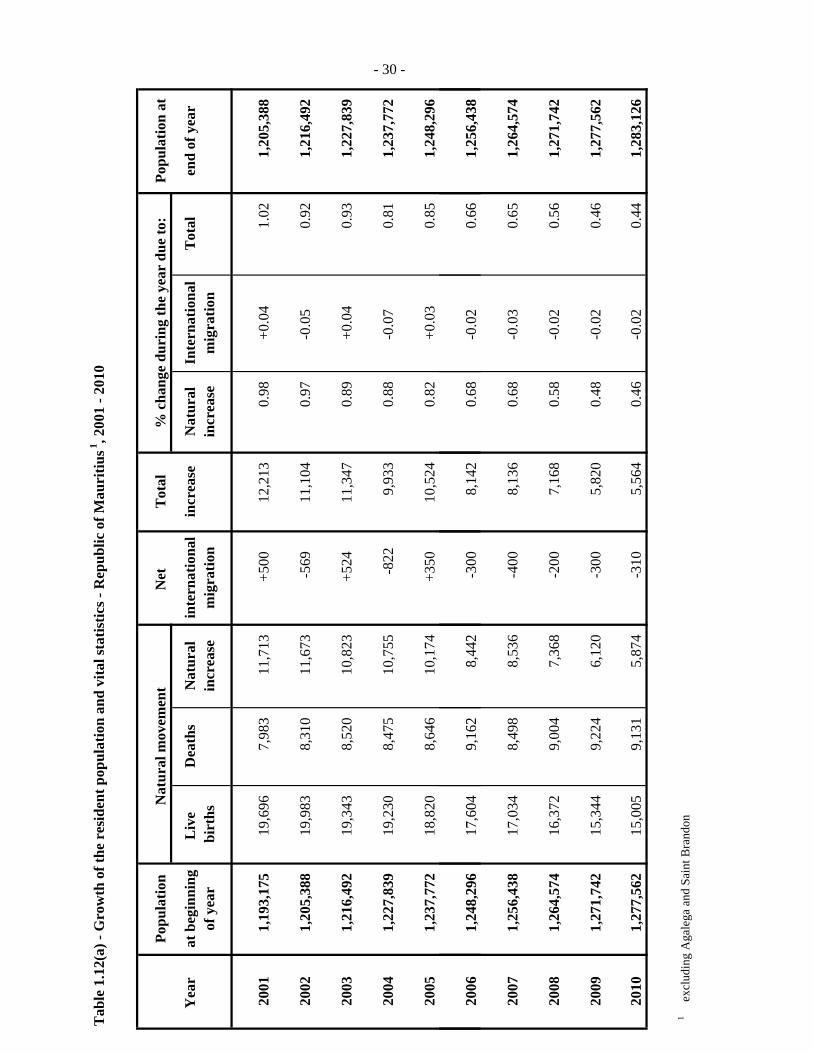
Tab
le 1
.12(
a) -
Gro
wth
of t
he r
esid
ent p
opul
atio
n an
d vi
tal s
tatis
tics -
Rep
ublic
of M
auri
tius1 , 2
001
- 201
0
Popu
latio
nN
atur
al m
ovem
ent
Net
T
otal
% c
hang
e du
ring
the
year
due
to:
Popu
latio
n at
Yea
r at
beg
inni
ngL
ive
Dea
ths
Nat
ural
inte
rnat
iona
lin
crea
seN
atur
alIn
tern
atio
nal
Tot
alen
d of
yea
rof
yea
rbi
rths
incr
ease
mig
ratio
nin
crea
sem
igra
tion
2001
1,19
3,17
5
19,6
96
7,98
3
11,7
13
+500
12,2
13
0.98
+
0.04
1.02
1,
205,
388
2002
1,20
5,38
8
19,9
83
8,31
0
11,6
73
-569
11,1
04
0.97
-
0.05
0.92
1,
216,
492
2003
1,21
6,49
2
19,3
43
8,52
0
10,8
23
+524
11,3
47
0.89
+
0.04
0.93
1,
227,
839
2004
1,22
7,83
9
19,2
30
8,47
5
10,7
55
-822
9,93
3
0.88
-
0.07
0.81
1,
237,
772
2005
1,23
7,77
2
18,8
20
8,64
6
10,1
74
+350
10,5
24
0.82
+
0.03
0.85
1,
248,
296
2006
124
829
617
604
916
28
442
300
814
20
680
020
661
256
438
- 30 -
2006
1,24
8,29
6
17,6
04
9,16
2
8,44
2
-
300
8,14
2
0.68
-0
.02
0.66
1,
256,
438
2007
1,25
6,43
8
17,0
34
8,49
8
8,53
6
-
400
8,13
6
0.68
-
0.03
0.65
1,
264,
574
2008
1,26
4,57
4
16,3
72
9,00
4
7,36
8
-
200
7,16
8
0.58
-
0.02
0.56
1,
271,
742
2009
1,27
1,74
2
15,3
44
9,22
4
6,12
0
-
300
5,82
0
0.48
-
0.02
0.46
1,
277,
562
2010
1,27
7,56
2
15,0
05
9,13
1
5,87
4
-
310
5,56
4
0.46
-
0.02
0.44
1,
283,
126
1
exc
ludi
ng A
gale
ga a
nd S
aint
Bra
ndon
0 -
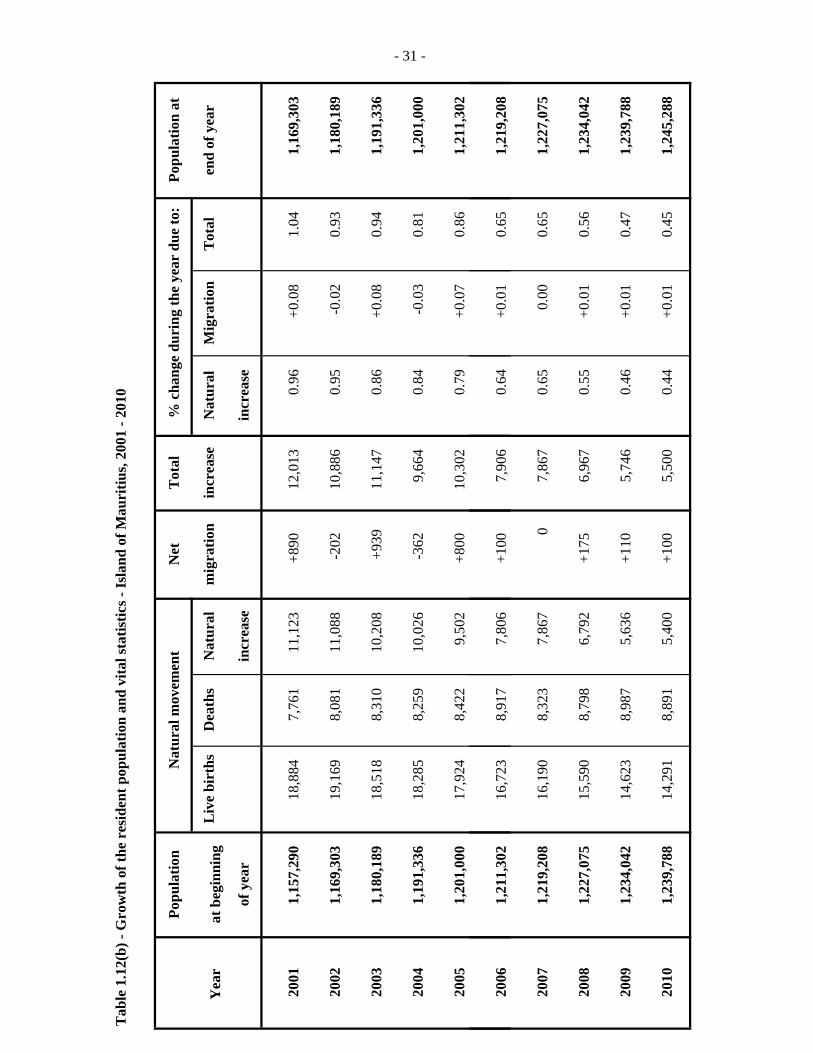
Tab
le 1
.12(
b) -
Gro
wth
of t
he r
esid
ent p
opul
atio
n an
d vi
tal s
tatis
tics -
Isla
nd o
f Mau
ritiu
s, 20
01 -
2010
Popu
latio
nN
atur
al m
ovem
ent
Net
Tot
al%
cha
nge
duri
ng th
e ye
ar d
ue to
:Po
pula
tion
at
Yea
r at
beg
inni
ngL
ive
birt
hsD
eath
sN
atur
alm
igra
tion
incr
ease
Nat
ural
Mig
ratio
nT
otal
end
of y
ear
of y
ear
incr
ease
incr
ease
2001
1,15
7,29
0
18,8
84
7,76
1
11,1
23
+8
9012
,013
0.
96
+0.0
8
1.04
1,
169,
303
2002
1,16
9,30
3
19,1
69
8,08
1
11,0
88
-2
0210
,886
0.
95
-0.0
2
0.93
1,
180,
189
2003
1,18
0,18
9
18,5
18
8,31
0
10,2
08
+
939
11,1
47
0.86
+0
.08
0.
94
1,19
1,33
6
2004
1,19
1,33
6
18,2
85
8,25
9
10,0
26
-3
629,
664
0.
84
-0.0
3
0.81
1,
201,
000
2005
1,20
1,00
0
17,9
24
8,42
2
9,50
2
+8
0010
,302
0.
79
+0.0
7
0.86
1,
211,
302
- 31 -
2006
1,21
1,30
2
16,7
23
8,91
7
7,80
6
+1
007,
906
0.
64
+0.0
1
0.65
1,
219,
208
2007
1,21
9,20
8
16,1
90
8,32
3
7,86
7
0
7,86
7
0.65
0.
00
0.65
1,
227,
075
2008
1,22
7,07
5
15,5
90
8,79
8
6,79
2
+1
756,
967
0.
55
+0.0
1
0.56
1,
234,
042
2009
1,23
4,04
2
14,6
23
8,98
7
5,63
6
+1
105,
746
0.
46
+0.0
1
0.47
1,
239,
788
2010
1,23
9,78
8
14,2
91
8,89
1
5,40
0
+1
005,
500
0.
44
+0.0
1
0.45
1,
245,
288
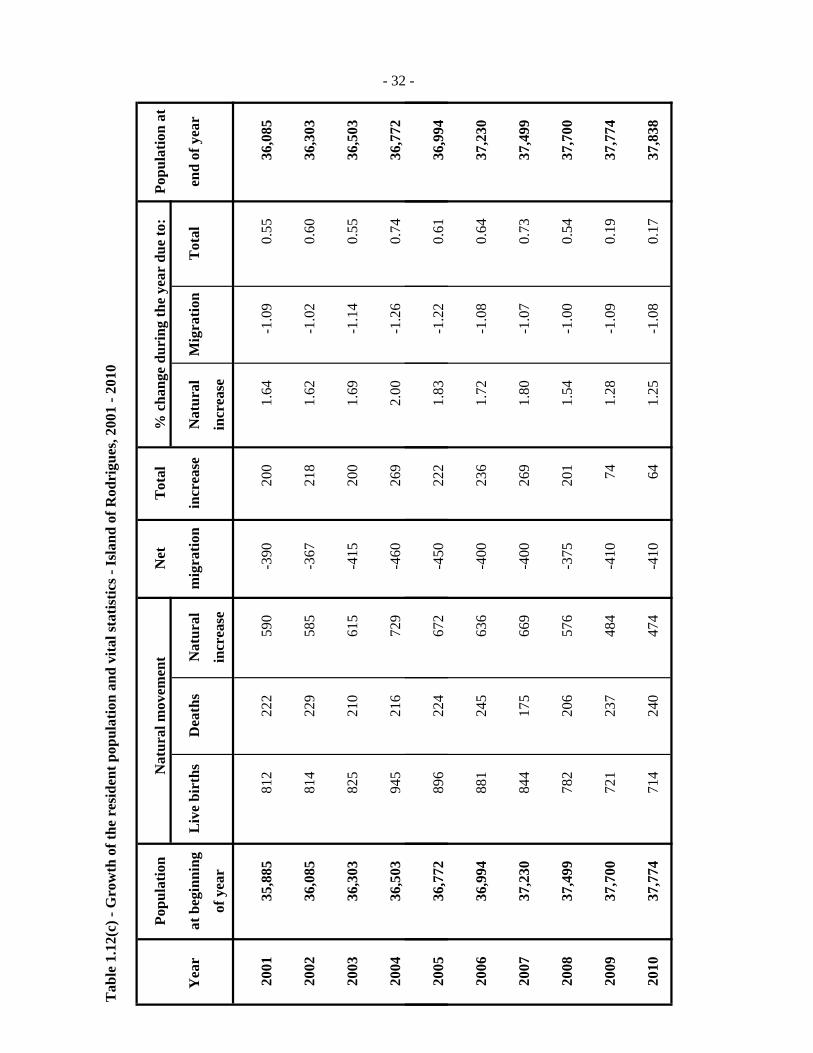
Tab
le 1
.12(
c) -
Gro
wth
of t
he r
esid
ent p
opul
atio
n an
d vi
tal s
tatis
tics -
Isla
nd o
f Rod
rigu
es, 2
001
- 201
0
Popu
latio
nN
atur
al m
ovem
ent
Net
Tot
al%
cha
nge
duri
ng th
e ye
ar d
ue to
:Po
pula
tion
at
Yea
r at
beg
inni
ngL
ive
birt
hsD
eath
sN
atur
alm
igra
tion
incr
ease
Nat
ural
Mig
ratio
nT
otal
end
of y
ear
of y
ear
incr
ease
incr
ease
2001
35,8
85
81
2
222
59
0
-390
200
1.
64
-1
.09
0.
55
36
,085
2002
36,0
85
81
4
229
58
5
-367
218
1.
62
-1
.02
0.
60
36
,303
2003
36,3
03
82
5
210
61
5
-415
200
1.
69
-1
.14
0.
55
36
,503
2004
36,5
03
94
5
216
72
9
-460
269
2.
00
-1
.26
0.
74
36
,772
2005
36,7
72
89
6
224
67
2
-450
222
1.
83
-1
.22
0.
61
36
,994
- 32 -
2005
36,7
72
89
6
224
67
2
450
222
1.
83
1.
22
0.
61
36
,994
2006
36,9
94
88
1
245
63
6
-400
236
1.
72
-1
.08
0.
64
37
,230
2007
37,2
30
84
4
175
66
9
-400
269
1.
80
-1
.07
0.
73
37
,499
2008
37,4
99
78
2
206
57
6
-375
201
1.
54
-1
.00
0.
54
37
,700
2009
37,7
00
72
1
237
48
4
-410
74
1.
28
-1
.09
0.
19
37
,774
2010
37,7
74
71
4
240
47
4
-410
64
1.
25
-1
.08
0.
17
37
,838
- 32 -

- 33 -Table 1.13 - Rate of increase of the population of Mauritius compared with other
countries, 2005 - 2008
Continent & Country &2005 - 2008 (%)
AFRICA ASIARepublic of Mauritius: 0.7 Hong kong 0.8 ( Island of Mauritius) (0.7) India 1.4 (Island of Rodrigues) (0.6) Sri Lanka 1.0Reunion 1.2Senegal 1.5
AMERICA EUROPECanada 1.1 Belgium 0.6Jamaica 0.5 France 0.6U.S.A. 0.9 Hungary
Italy 0.7
OCEANIAAustralia 1.8New Zealand 1.1
Source: United Nations Demographic Yearbook 2008(except for the Republic of Mauritius and its constituent islands).
Table 1.14 - Expectation of life in years at selected ages at each census,Republic of Mauritius, 1971 - 2001
Exact age Male Female
(Years) 1971 - 1982 - July 89- July 99 - 1971 - 1982 - July 89 - July 99 -19731 1984 June 91 June 01 19731 1984 June 91 June 01
0 61.0 64.4 65.6 68.2 65.9 71.7 73.4 75.3
10 56.7 56.8 57.5 59.7 61.5 63.9 65.0 66.5
20 47.3 47.2 47.8 50.0 52.0 54.3 55.3 56.7
30 37.9 37.8 38.3 40.6 42.9 44.9 45.8 47.1
40 28.8 28.8 29.4 31.5 34.0 35.5 36.3 37.5
50 20.5 20.7 21.4 23.3 25.3 26.5 27.3 28.4
60 13.5 13.8 14.8 16.1 17.5 18.4 19.1 20.3
70 8.5 8.5 9.6 10.6 10.9 11.6 12.3 13.3
80 5.7 4.8 5.8 6.5 6.6 6.9 7.4 8.1 1 revised
-0.2
Annual rate of increase
2005 - 2008 (%)
Annual rate of increase
Continent
Country
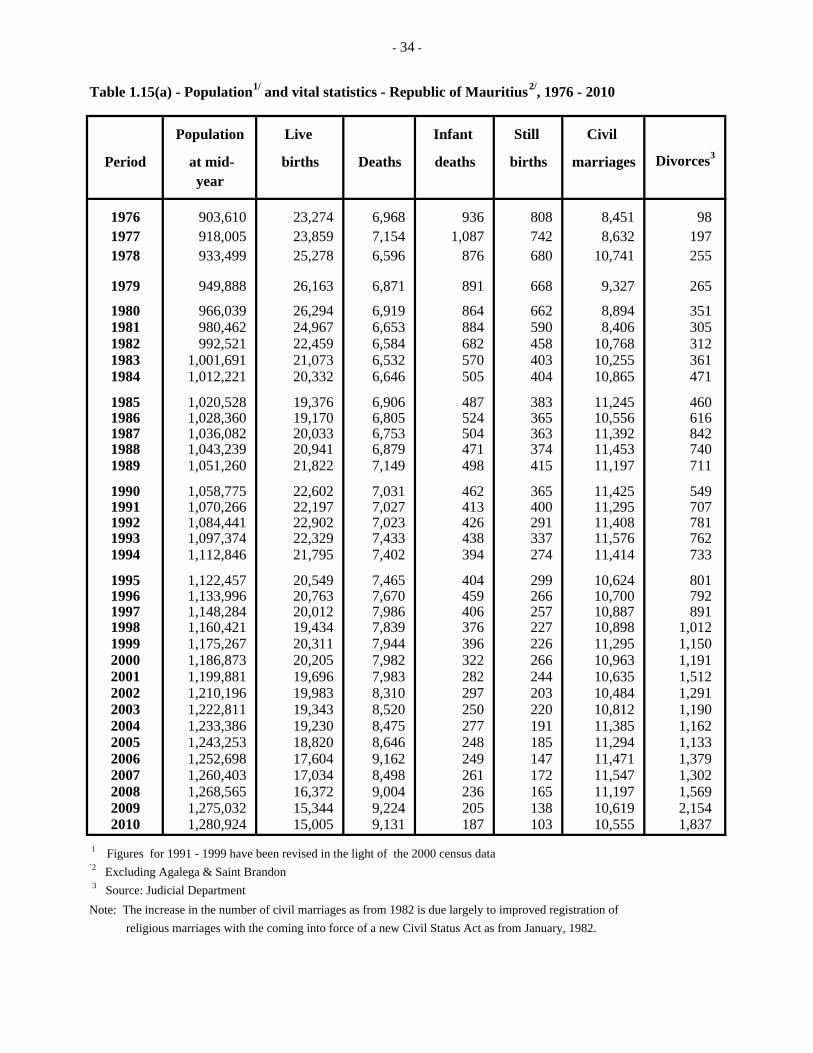
- 34 -
Table 1.15(a) - Population1/ and vital statistics - Republic of Mauritius2/, 1976 - 2010
Population Live Infant Still Civil
Period at mid- births Deaths deaths births marriages Divorces3
year
1976 903,610 23,274 6,968 936 808 8,451 98 1977 918,005 23,859 7,154 1,087 742 8,632 197 1978 933,499 25,278 6,596 876 680 10,741 255
1979 949,888 26,163 6,871 891 668 9,327 265
1980 966,039 26,294 6,919 864 662 8,894 351 1981 980,462 24,967 6,653 884 590 8,406 305 1982 992,521 22,459 6,584 682 458 10,768 312 1983 1,001,691 21,073 6,532 570 403 10,255 361 1984 1,012,221 20,332 6,646 505 404 10,865 471
1985 1,020,528 19,376 6,906 487 383 11,245 460 1986 1,028,360 19,170 6,805 524 365 10,556 616 1987 1,036,082 20,033 6,753 504 363 11,392 842 1988 1,043,239 20,941 6,879 471 374 11,453 740 1989 1,051,260 21,822 7,149 498 415 11,197 711
1990 1,058,775 22,602 7,031 462 365 11,425 549 1991 1,070,266 22,197 7,027 413 400 11,295 707 1992 1,084,441 22,902 7,023 426 291 11,408 781 1993 1,097,374 22,329 7,433 438 337 11,576 762 1994 1,112,846 21,795 7,402 394 274 11,414 733
1995 1,122,457 20,549 7,465 404 299 10,624 801 1996 1,133,996 20,763 7,670 459 266 10,700 792 1997 1,148,284 20,012 7,986 406 257 10,887 891 1998 1,160,421 19,434 7,839 376 227 10,898 1,012 1999 1,175,267 20,311 7,944 396 226 11,295 1,150 2000 1,186,873 20,205 7,982 322 266 10,963 1,191 2001 1,199,881 19,696 7,983 282 244 10,635 1,512 2002 1,210,196 19,983 8,310 297 203 10,484 1,291 2003 1,222,811 19,343 8,520 250 220 10,812 1,190 2004 1,233,386 19,230 8,475 277 191 11,385 1,162 2005 1,243,253 18,820 8,646 248 185 11,294 1,133 2006 1,252,698 17,604 9,162 249 147 11,471 1,379 2007 1,260,403 17,034 8,498 261 172 11,547 1,302 2008 1,268,565 16,372 9,004 236 165 11,197 1,569 2009 1,275,032 15,344 9,224 205 138 10,619 2,154 2010 1,280,924 15,005 9,131 187 103 10,555 1,837
1 Figures for 1991 - 1999 have been revised in the light of the 2000 census data`2 Excluding Agalega & Saint Brandon 3 Source: Judicial DepartmentNote: The increase in the number of civil marriages as from 1982 is due largely to improved registration of religious marriages with the coming into force of a new Civil Status Act as from January, 1982.
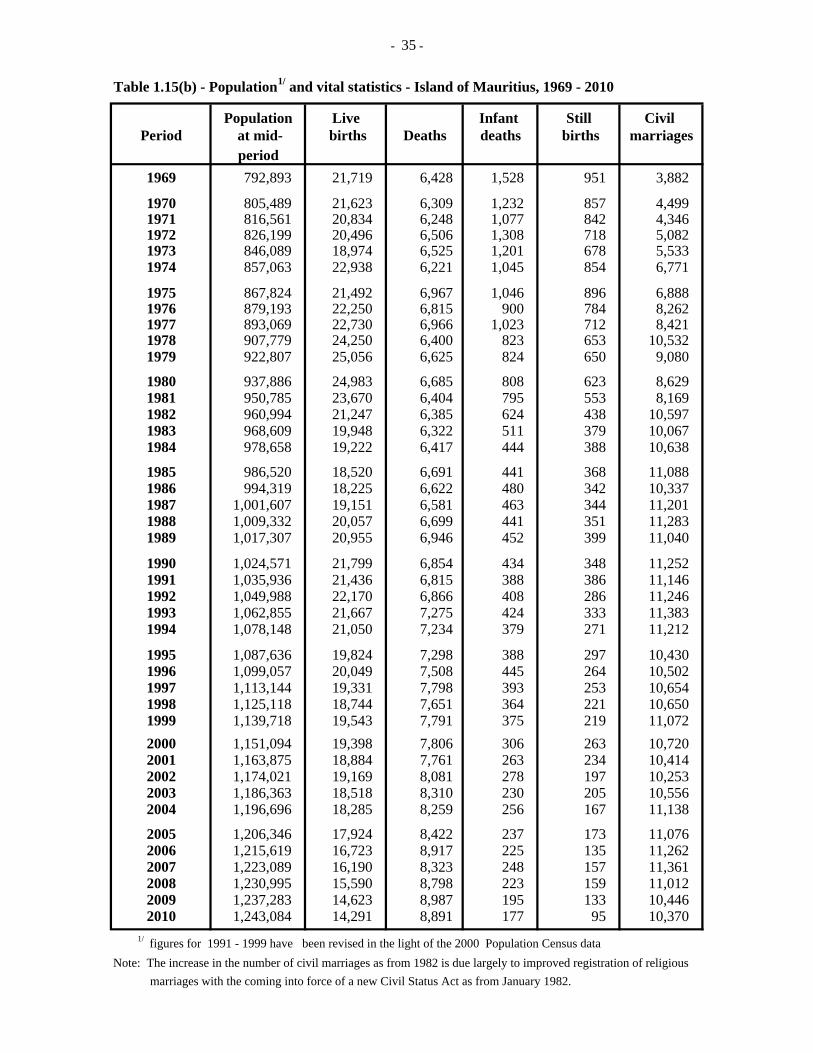
- 35 -
Table 1.15(b) - Population1/ and vital statistics - Island of Mauritius, 1969 - 2010
Population Live Infant Still Civil Period at mid- births Deaths deaths births marriages
period1969 792,893 21,719 6,428 1,528 951 3,882
1970 805,489 21,623 6,309 1,232 857 4,499 1971 816,561 20,834 6,248 1,077 842 4,346 1972 826,199 20,496 6,506 1,308 718 5,082 1973 846,089 18,974 6,525 1,201 678 5,533 1974 857,063 22,938 6,221 1,045 854 6,771
1975 867,824 21,492 6,967 1,046 896 6,888 1976 879,193 22,250 6,815 900 784 8,262 1977 893,069 22,730 6,966 1,023 712 8,421 1978 907,779 24,250 6,400 823 653 10,532 1979 922,807 25,056 6,625 824 650 9,080
1980 937,886 24,983 6,685 808 623 8,629 1981 950,785 23,670 6,404 795 553 8,169 1982 960,994 21,247 6,385 624 438 10,597 1983 968,609 19,948 6,322 511 379 10,067 1984 978,658 19,222 6,417 444 388 10,638
1985 986,520 18,520 6,691 441 368 11,088 1986 994,319 18,225 6,622 480 342 10,337 1987 1,001,607 19,151 6,581 463 344 11,201 1988 1,009,332 20,057 6,699 441 351 11,283 1989 1,017,307 20,955 6,946 452 399 11,040
1990 1,024,571 21,799 6,854 434 348 11,252 1991 1,035,936 21,436 6,815 388 386 11,146 1992 1,049,988 22,170 6,866 408 286 11,246 1993 1,062,855 21,667 7,275 424 333 11,383 1994 1,078,148 21,050 7,234 379 271 11,212
1995 1,087,636 19,824 7,298 388 297 10,430 1996 1,099,057 20,049 7,508 445 264 10,502 1997 1,113,144 19,331 7,798 393 253 10,654 1998 1,125,118 18,744 7,651 364 221 10,650 1999 1,139,718 19,543 7,791 375 219 11,072 2000 1,151,094 19,398 7,806 306 263 10,720 2001 1,163,875 18,884 7,761 263 234 10,414 2002 1,174,021 19,169 8,081 278 197 10,253 2003 1,186,363 18,518 8,310 230 205 10,556 2004 1,196,696 18,285 8,259 256 167 11,138
2005 1,206,346 17,924 8,422 237 173 11,076 2006 1,215,619 16,723 8,917 225 135 11,262 2007 1,223,089 16,190 8,323 248 157 11,361 2008 1,230,995 15,590 8,798 223 159 11,012 2009 1,237,283 14,623 8,987 195 133 10,446 2010 1,243,084 14,291 8,891 177 95 10,370
1/ figures for 1991 - 1999 have been revised in the light of the 2000 Population Census dataNote: The increase in the number of civil marriages as from 1982 is due largely to improved registration of religious marriages with the coming into force of a new Civil Status Act as from January 1982.
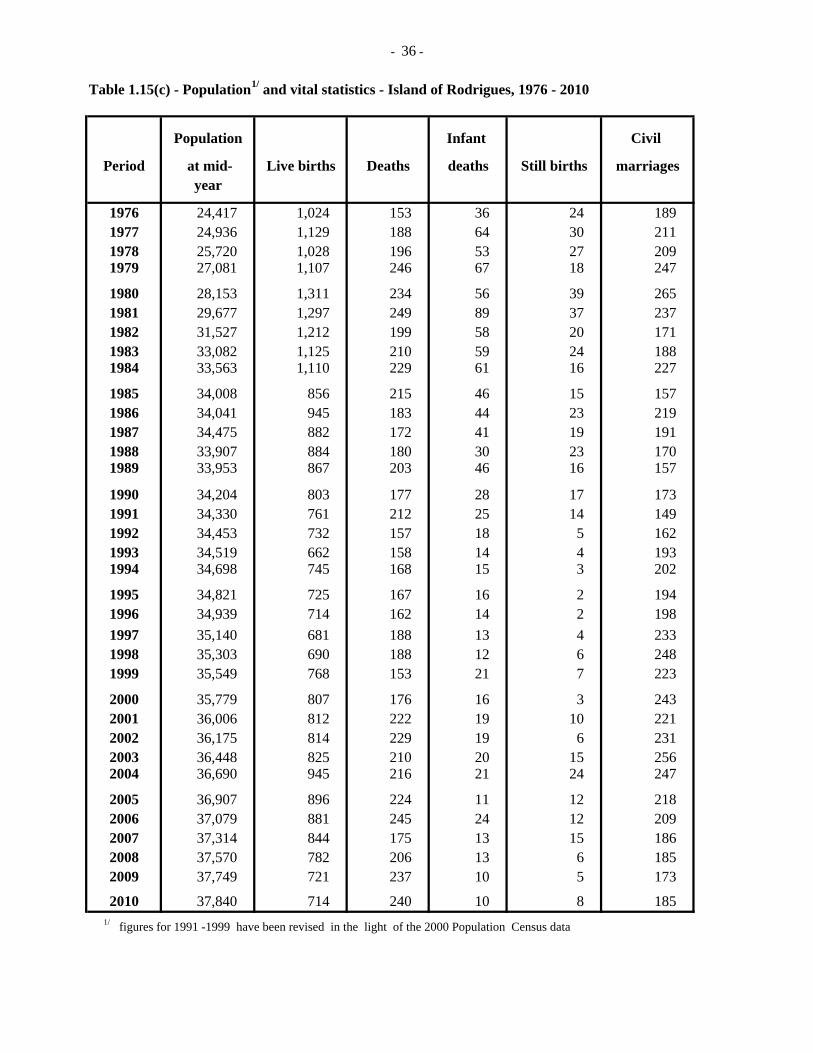
- 36 -
Table 1.15(c) - Population1/ and vital statistics - Island of Rodrigues, 1976 - 2010
Population Infant Civil
Period at mid- Live births Deaths deaths Still births marriagesyear
1976 24,417 1,024 153 36 24 189 1977 24,936 1,129 188 64 30 211 1978 25,720 1,028 196 53 27 209 1979 27,081 1,107 246 67 18 247
1980 28,153 1,311 234 56 39 265 1981 29,677 1,297 249 89 37 237 1982 31,527 1,212 199 58 20 171 1983 33,082 1,125 210 59 24 188 1984 33,563 1,110 229 61 16 227
1985 34,008 856 215 46 15 157 1986 34,041 945 183 44 23 219 1987 34,475 882 172 41 19 191 1988 33,907 884 180 30 23 170 1989 33,953 867 203 46 16 157
1990 34,204 803 177 28 17 173 1991 34,330 761 212 25 14 149 1992 34,453 732 157 18 5 162 1993 34,519 662 158 14 4 193 1994 34,698 745 168 15 3 202
1995 34,821 725 167 16 2 194 1996 34,939 714 162 14 2 198 1997 35,140 681 188 13 4 233 1998 35,303 690 188 12 6 248 1999 35,549 768 153 21 7 223
2000 35,779 807 176 16 3 243 2001 36,006 812 222 19 10 221 2002 36,175 814 229 19 6 231 2003 36,448 825 210 20 15 256 2004 36,690 945 216 21 24 247
2005 36,907 896 224 11 12 218 2006 37,079 881 245 24 12 209 2007 37,314 844 175 13 15 186 2008 37,570 782 206 13 6 185 2009 37,749 721 237 10 5 173
2010 37,840 714 240 10 8 185
1/ figures for 1991 -1999 have been revised in the light of the 2000 Population Census data
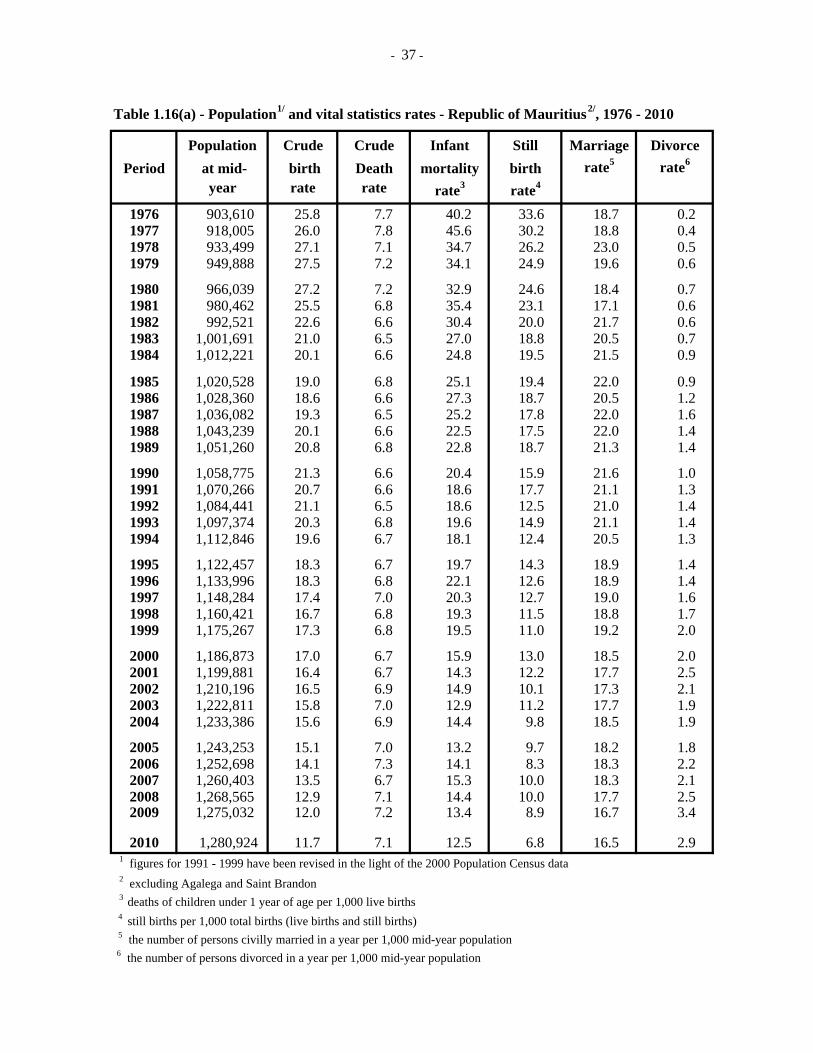
- 37 -
Table 1.16(a) - Population1/ and vital statistics rates - Republic of Mauritius2/, 1976 - 2010
Population Crude Crude Infant Still Marriage DivorcePeriod at mid- birth Death mortality birth rate5 rate6
year rate rate rate3 rate4
1976 903,610 25.8 7.7 40.2 33.6 18.7 0.2 1977 918,005 26.0 7.8 45.6 30.2 18.8 0.4 1978 933,499 27.1 7.1 34.7 26.2 23.0 0.5 1979 949,888 27.5 7.2 34.1 24.9 19.6 0.6
1980 966,039 27.2 7.2 32.9 24.6 18.4 0.7 1981 980,462 25.5 6.8 35.4 23.1 17.1 0.6 1982 992,521 22.6 6.6 30.4 20.0 21.7 0.6 1983 1,001,691 21.0 6.5 27.0 18.8 20.5 0.7 1984 1,012,221 20.1 6.6 24.8 19.5 21.5 0.9
1985 1,020,528 19.0 6.8 25.1 19.4 22.0 0.9 1986 1,028,360 18.6 6.6 27.3 18.7 20.5 1.2 1987 1,036,082 19.3 6.5 25.2 17.8 22.0 1.6 1988 1,043,239 20.1 6.6 22.5 17.5 22.0 1.4 1989 1,051,260 20.8 6.8 22.8 18.7 21.3 1.4
1990 1,058,775 21.3 6.6 20.4 15.9 21.6 1.0 1991 1,070,266 20.7 6.6 18.6 17.7 21.1 1.3 1992 1,084,441 21.1 6.5 18.6 12.5 21.0 1.4 1993 1,097,374 20.3 6.8 19.6 14.9 21.1 1.4 1994 1,112,846 19.6 6.7 18.1 12.4 20.5 1.3
1995 1,122,457 18.3 6.7 19.7 14.3 18.9 1.4 1996 1,133,996 18.3 6.8 22.1 12.6 18.9 1.4 1997 1,148,284 17.4 7.0 20.3 12.7 19.0 1.6 1998 1,160,421 16.7 6.8 19.3 11.5 18.8 1.7 1999 1,175,267 17.3 6.8 19.5 11.0 19.2 2.0
2000 1,186,873 17.0 6.7 15.9 13.0 18.5 2.0 2001 1,199,881 16.4 6.7 14.3 12.2 17.7 2.5 2002 1,210,196 16.5 6.9 14.9 10.1 17.3 2.1 2003 1,222,811 15.8 7.0 12.9 11.2 17.7 1.9 2004 1,233,386 15.6 6.9 14.4 9.8 18.5 1.9
2005 1,243,253 15.1 7.0 13.2 9.7 18.2 1.8 2006 1,252,698 14.1 7.3 14.1 8.3 18.3 2.2 2007 1,260,403 13.5 6.7 15.3 10.0 18.3 2.1 2008 1,268,565 12.9 7.1 14.4 10.0 17.7 2.5 2009 1,275,032 12.0 7.2 13.4 8.9 16.7 3.4
2010 1,280,924 11.7 7.1 12.5 6.8 16.5 2.9 1 figures for 1991 - 1999 have been revised in the light of the 2000 Population Census data 2 excluding Agalega and Saint Brandon 3 deaths of children under 1 year of age per 1,000 live births 4 still births per 1,000 total births (live births and still births) 5 the number of persons civilly married in a year per 1,000 mid-year population 6 the number of persons divorced in a year per 1,000 mid-year population
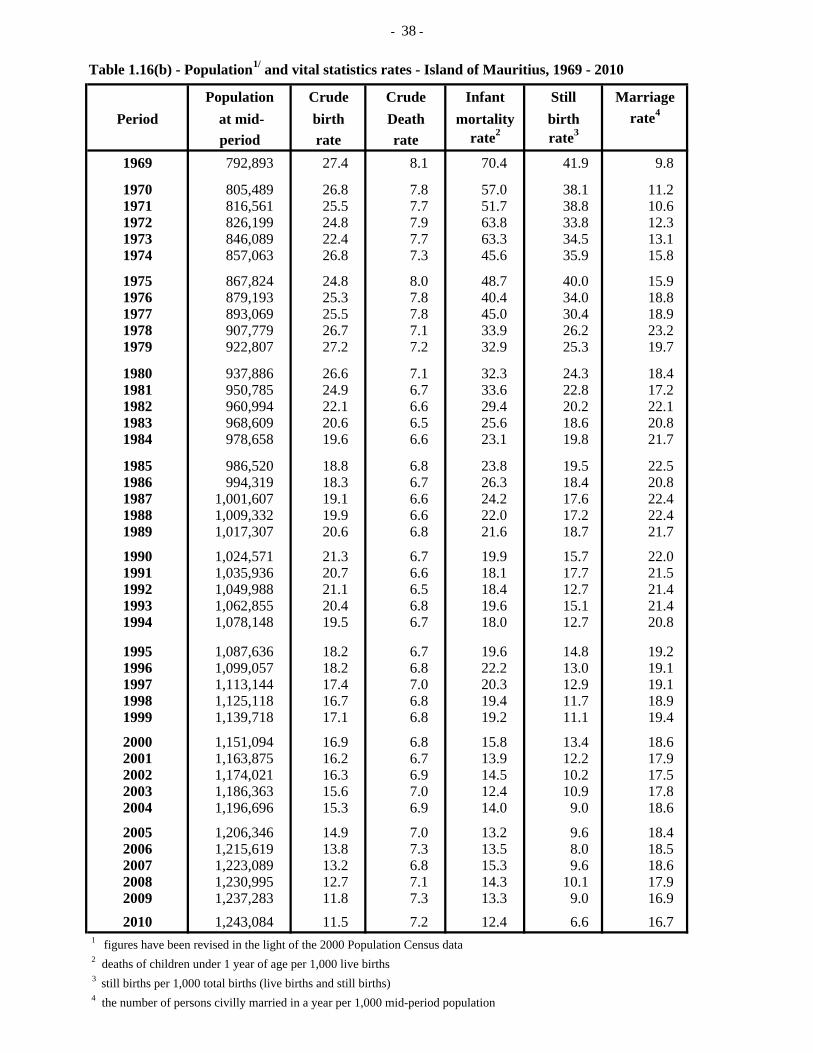
- 38 -
Table 1.16(b) - Population1/ and vital statistics rates - Island of Mauritius, 1969 - 2010
Population Crude Crude Infant Still MarriagePeriod at mid- birth Death mortality birth rate4
period rate rate rate2 rate3
1969 792,893 27.4 8.1 70.4 41.9 9.8
1970 805,489 26.8 7.8 57.0 38.1 11.2 1971 816,561 25.5 7.7 51.7 38.8 10.6 1972 826,199 24.8 7.9 63.8 33.8 12.3 1973 846,089 22.4 7.7 63.3 34.5 13.1 1974 857,063 26.8 7.3 45.6 35.9 15.8
1975 867,824 24.8 8.0 48.7 40.0 15.9 1976 879,193 25.3 7.8 40.4 34.0 18.8 1977 893,069 25.5 7.8 45.0 30.4 18.9 1978 907,779 26.7 7.1 33.9 26.2 23.2 1979 922,807 27.2 7.2 32.9 25.3 19.7
1980 937,886 26.6 7.1 32.3 24.3 18.4 1981 950,785 24.9 6.7 33.6 22.8 17.2 1982 960,994 22.1 6.6 29.4 20.2 22.1 1983 968,609 20.6 6.5 25.6 18.6 20.8 1984 978,658 19.6 6.6 23.1 19.8 21.7
1985 986,520 18.8 6.8 23.8 19.5 22.5 1986 994,319 18.3 6.7 26.3 18.4 20.8 1987 1,001,607 19.1 6.6 24.2 17.6 22.4 1988 1,009,332 19.9 6.6 22.0 17.2 22.4 1989 1,017,307 20.6 6.8 21.6 18.7 21.7
1990 1,024,571 21.3 6.7 19.9 15.7 22.0 1991 1,035,936 20.7 6.6 18.1 17.7 21.5 1992 1,049,988 21.1 6.5 18.4 12.7 21.4 1993 1,062,855 20.4 6.8 19.6 15.1 21.4 1994 1,078,148 19.5 6.7 18.0 12.7 20.8
1995 1,087,636 18.2 6.7 19.6 14.8 19.2 1996 1,099,057 18.2 6.8 22.2 13.0 19.1 1997 1,113,144 17.4 7.0 20.3 12.9 19.1 1998 1,125,118 16.7 6.8 19.4 11.7 18.9 1999 1,139,718 17.1 6.8 19.2 11.1 19.4
2000 1,151,094 16.9 6.8 15.8 13.4 18.6 2001 1,163,875 16.2 6.7 13.9 12.2 17.9 2002 1,174,021 16.3 6.9 14.5 10.2 17.5 2003 1,186,363 15.6 7.0 12.4 10.9 17.8 2004 1,196,696 15.3 6.9 14.0 9.0 18.6
2005 1,206,346 14.9 7.0 13.2 9.6 18.4 2006 1,215,619 13.8 7.3 13.5 8.0 18.5 2007 1,223,089 13.2 6.8 15.3 9.6 18.6 2008 1,230,995 12.7 7.1 14.3 10.1 17.9 2009 1,237,283 11.8 7.3 13.3 9.0 16.9 2010 1,243,084 11.5 7.2 12.4 6.6 16.7
1 figures have been revised in the light of the 2000 Population Census data 2 deaths of children under 1 year of age per 1,000 live births 3 still births per 1,000 total births (live births and still births) 4 the number of persons civilly married in a year per 1,000 mid-period population
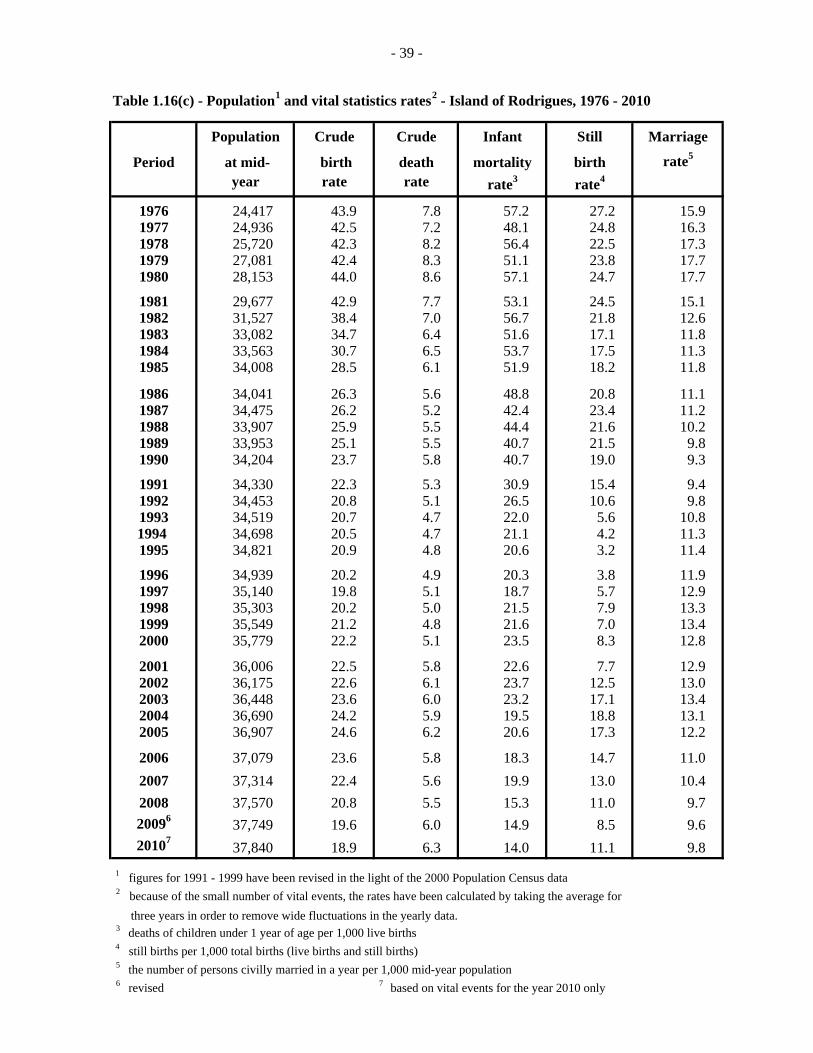
- 39 -
Table 1.16(c) - Population1 and vital statistics rates2 - Island of Rodrigues, 1976 - 2010
Population Crude Crude Infant Still Marriage
Period at mid- birth death mortality birth rate5
year rate rate rate3 rate4
1976 24,417 43.9 7.8 57.2 27.2 15.9 1977 24,936 42.5 7.2 48.1 24.8 16.3 1978 25,720 42.3 8.2 56.4 22.5 17.3 1979 27,081 42.4 8.3 51.1 23.8 17.7 1980 28,153 44.0 8.6 57.1 24.7 17.7
1981 29,677 42.9 7.7 53.1 24.5 15.1 1982 31,527 38.4 7.0 56.7 21.8 12.6 1983 33,082 34.7 6.4 51.6 17.1 11.8 1984 33,563 30.7 6.5 53.7 17.5 11.3 1985 34,008 28.5 6.1 51.9 18.2 11.8
1986 34,041 26.3 5.6 48.8 20.8 11.1 1987 34,475 26.2 5.2 42.4 23.4 11.2 1988 33,907 25.9 5.5 44.4 21.6 10.2 1989 33,953 25.1 5.5 40.7 21.5 9.8 1990 34,204 23.7 5.8 40.7 19.0 9.3
1991 34,330 22.3 5.3 30.9 15.4 9.4 1992 34,453 20.8 5.1 26.5 10.6 9.8 1993 34,519 20.7 4.7 22.0 5.6 10.8
1994 34,698 20.5 4.7 21.1 4.2 11.3 1995 34,821 20.9 4.8 20.6 3.2 11.4
1996 34,939 20.2 4.9 20.3 3.8 11.9 1997 35,140 19.8 5.1 18.7 5.7 12.9 1998 35,303 20.2 5.0 21.5 7.9 13.3 1999 35,549 21.2 4.8 21.6 7.0 13.4 2000 35,779 22.2 5.1 23.5 8.3 12.8
2001 36,006 22.5 5.8 22.6 7.7 12.9 2002 36,175 22.6 6.1 23.7 12.5 13.0 2003 36,448 23.6 6.0 23.2 17.1 13.4 2004 36,690 24.2 5.9 19.5 18.8 13.1 2005 36,907 24.6 6.2 20.6 17.3 12.2
2006 37,079 23.6 5.8 18.3 14.7 11.0 2007 37,314 22.4 5.6 19.9 13.0 10.4 2008 37,570 20.8 5.5 15.3 11.0 9.7 20096 37,749 19.6 6.0 14.9 8.5 9.6 20107 37,840 18.9 6.3 14.0 11.1 9.8
1 figures for 1991 - 1999 have been revised in the light of the 2000 Population Census data 2 because of the small number of vital events, the rates have been calculated by taking the average for three years in order to remove wide fluctuations in the yearly data. 3 deaths of children under 1 year of age per 1,000 live births 4 still births per 1,000 total births (live births and still births) 5 the number of persons civilly married in a year per 1,000 mid-year population 6 revised 7 based on vital events for the year 2010 only
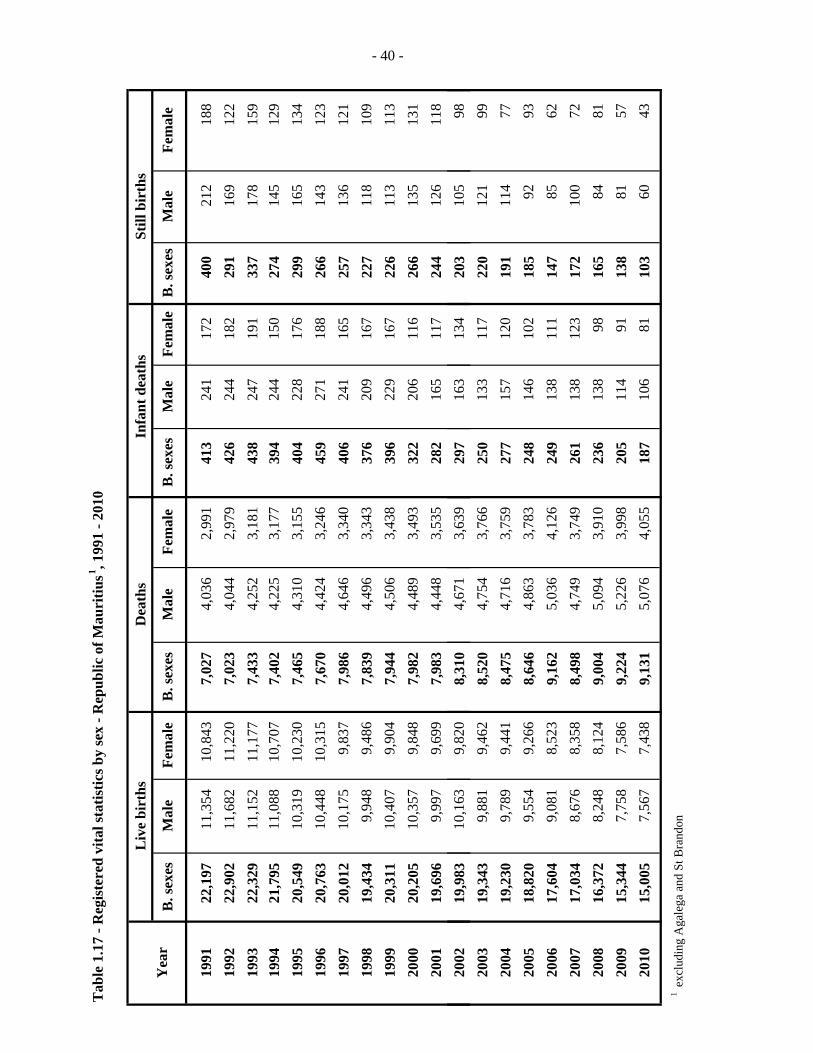
Tab
le 1
.17
- Reg
iste
red
vita
l sta
tistic
s by
sex
- Rep
ublic
of M
auri
tius1 , 1
991
- 201
0
Liv
e bi
rths
Dea
ths
Infa
nt d
eath
sSt
ill b
irth
sY
ear
B. s
exes
Mal
eFe
mal
eB
. sex
esM
ale
Fem
ale
B. s
exes
Mal
eFe
mal
eB
. sex
esM
ale
Fem
ale
1991
22,1
97
11,3
54
10,8
43
7,02
7
4,03
6
2,99
1
413
24
1
172
40
0
212
18
8
1992
22,9
02
11,6
82
11,2
20
7,02
3
4,04
4
2,97
9
426
24
4
182
29
1
169
12
2
1993
22,3
29
11,1
52
11,1
77
7,43
3
4,25
2
3,18
1
438
24
7
191
33
7
178
15
9
1994
21,7
95
11,0
88
10,7
07
7,40
2
4,22
5
3,17
7
394
24
4
150
27
4
145
12
9
1995
20,5
49
10,3
19
10,2
30
7,46
5
4,31
0
3,15
5
404
22
8
176
29
9
165
13
4
1996
20,7
63
10,4
48
10,3
15
7,67
0
4,42
4
3,24
6
459
27
1
188
26
6
143
12
3
1997
20,0
12
10,1
75
9,83
7
7,98
6
4,64
6
3,34
0
406
24
1
165
25
7
136
12
1
1998
19,4
34
9,94
8
9,48
6
7,83
9
4,49
6
3,34
3
376
20
9
167
22
7
118
10
9
1999
20,3
11
10,4
07
9,90
4
7,94
4
4,50
6
3,43
8
396
22
9
167
22
6
113
11
3
2000
20,2
05
10,3
57
9,84
8
7,98
2
4,48
9
3,49
3
322
20
6
116
26
6
135
13
1
2001
19,6
96
9,99
7
9,69
9
7,98
3
4,44
8
3,53
5
282
16
5
117
24
4
126
11
8
2002
19,9
83
10,1
63
9,82
0
8,31
0
4,67
1
3,63
9
297
16
3
134
20
3
105
98
- 40 -
,,
,,
,,
2003
19,3
43
9,88
1
9,46
2
8,52
0
4,75
4
3,76
6
250
13
3
117
22
0
121
99
20
0419
,230
9,
789
9,
441
8,
475
4,
716
3,
759
27
7
157
12
0
191
11
4
77
2005
18,8
20
9,55
4
9,26
6
8,64
6
4,86
3
3,78
3
248
14
6
102
18
5
92
93
2006
17,6
04
9,08
1
8,52
3
9,16
2
5,03
6
4,12
6
249
13
8
111
14
7
85
62
2007
17,0
34
8,67
6
8,35
8
8,49
8
4,74
9
3,74
9
261
13
8
123
17
2
100
72
20
0816
,372
8,
248
8,
124
9,
004
5,
094
3,
910
23
6
138
98
16
5
84
81
2009
15,3
44
7,75
8
7,58
6
9,22
4
5,22
6
3,99
8
205
11
4
91
138
81
57
20
1015
,005
7,
567
7,
438
9,
131
5,
076
4,
055
18
7
106
81
10
3
60
43
1 e
xclu
ding
Aga
lega
and
St B
rand
on
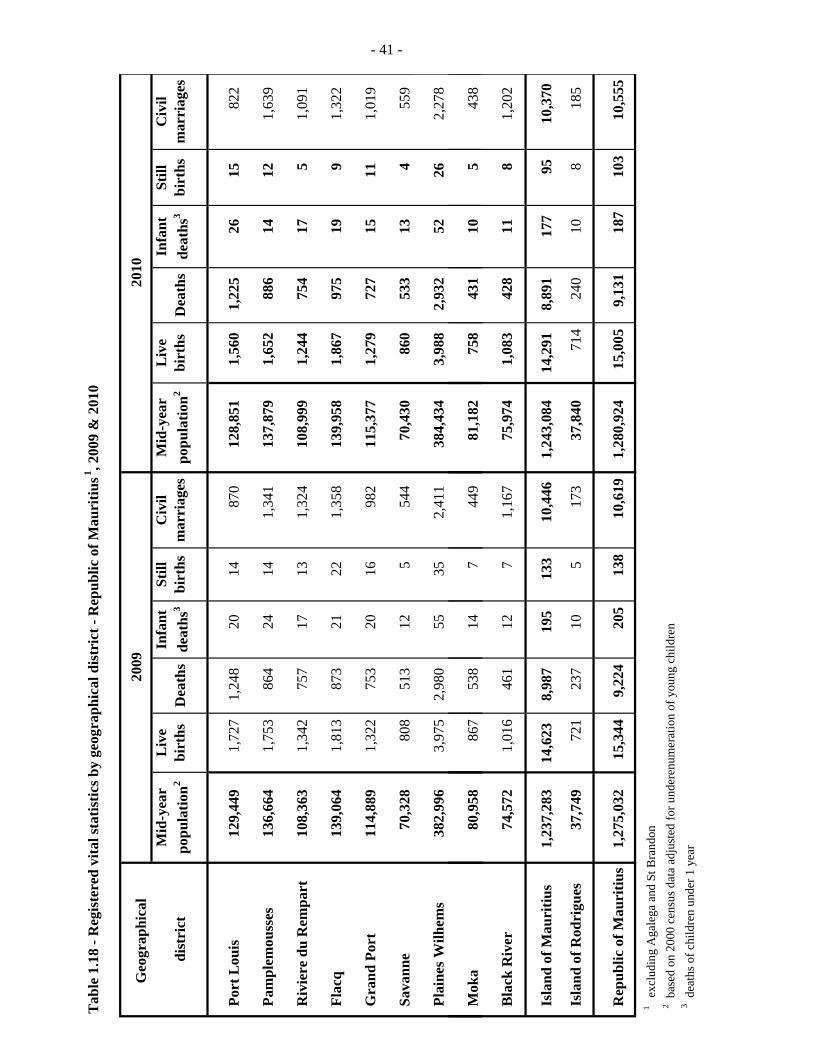
Tab
le 1
.18
- Reg
iste
red
vita
l sta
tistic
s by
geog
raph
ical
dis
tric
t - R
epub
lic o
f Mau
ritiu
s1 , 200
9 &
201
0
Geo
grap
hica
l 20
0920
10
dist
rict
Mid
-yea
r po
pula
tion2
Liv
e bi
rths
Dea
ths
Infa
nt
deat
hs3
Still
bi
rths
Civ
il m
arri
ages
Mid
-yea
r po
pula
tion2
Liv
e bi
rths
Dea
ths
Infa
nt
deat
hs3
Still
bi
rths
Civ
il m
arri
ages
Por
t Lou
is12
9,44
9
1,72
7 1,
248
20
14
87
0
128,
851
1,
560
1,
225
26
15
82
2
Pam
plem
ouss
es13
6,66
4
1,75
3 86
4
24
14
1,34
1
137,
879
1,
652
88
6
14
12
1,63
9
Riv
iere
du
Rem
part
108,
363
1,
342
757
17
13
1,
324
10
8,99
9
1,24
4
754
17
5
1,
091
Fla
cq13
9,06
4
1,81
3 87
3
21
22
1,35
8
139,
958
1,
867
97
5
19
9
1,32
2
Gra
nd P
ort
114,
889
1,
322
753
20
16
98
2
115,
377
1,
279
72
7
15
11
1,01
9
Sav
anne
70,3
28
80
8 51
3
12
5
544
70
,430
860
53
3
13
4
559
Pla
ines
Wilh
ems
382,
996
3,
975
2,98
0
55
35
2,41
1
384,
434
3,
988
2,
932
52
26
2,
278
- 41 -
Mok
a80
,958
867
538
14
7
44
9
81,1
82
75
8
431
10
5
43
8
Bla
ck R
iver
74,5
72
1,
016
461
12
7
1,
167
75
,974
1,08
3
428
11
8
1,
202
Isl
and
of M
auri
tius
1,23
7,28
3
14,6
23
8,98
7
195
13
3
10,4
46
1,24
3,08
4
14,2
91
8,89
1
177
95
10
,370
Isl
and
of R
odri
gues
37,7
49
72
1 23
7
10
5
173
37
,840
714
240
10
8
18
5
Rep
ublic
of M
auri
tius
1,27
5,03
2
15,3
44
9,22
4 20
5 13
8 10
,619
1,
280,
924
15
,005
9,
131
187
103
10,5
55
1 e
xclu
ding
Aga
lega
and
St B
rand
on
2 bas
ed o
n 20
00 c
ensu
s dat
a ad
just
ed fo
r und
eren
umer
atio
n of
you
ng c
hild
ren
3 d
eath
s of c
hild
ren
unde
r 1 y
ear

Tab
le 1
.19
- Vita
l sta
tistic
s by
mon
th o
f reg
istr
atio
n - R
epub
lic o
f Mau
ritiu
s1 , 201
0
Mon
th o
fL
ive
birt
hsD
eath
sIn
fant
dea
ths
Still
bir
ths
Civ
il
regi
stra
tion
Bot
h se
xes
Mal
eFe
mal
eB
oth
sexe
sM
ale
Fem
ale
Bot
h se
xes
Mal
eFe
mal
eB
oth
sexe
sM
ale
Fem
ale
Mar
riag
es
Jan
uary
1,31
5
704
61
1
733
41
4
319
17
9
8
7
2
5
53
4
Feb
ruar
y1,
177
60
0
577
73
5
399
33
6
20
13
7
9
5
4
631
Mar
ch1,
413
68
3
730
68
3
369
31
4
13
10
3
8
4
4
671
Apr
il1,
277
63
4
643
69
4
396
29
8
14
6
8
12
6
6
826
May
1,33
5
669
66
6
714
39
5
319
20
9
11
8
4
4
93
0
Jun
e1,
318
60
9
709
73
4
412
32
2
21
13
8
10
4
6
956
Jul
y1,
363
68
5
678
92
4
531
39
3
19
13
6
10
7
3
1,07
4
- 42 -- 42 -
Aug
ust
1,31
4
650
66
4
892
49
4
398
13
7
6
10
7
3
1,
006
Sep
tem
ber
1,26
9
650
61
9
769
42
8
341
7
3
4
6
3
3
89
1
Oct
ober
1,09
8
577
52
1
728
39
9
329
14
7
7
8
5
3
1,
116
Nov
embe
r1,
131
58
3
548
74
4
414
33
0
14
8
6
5
5
0
1,01
5
Dec
embe
r99
5
523
47
2
781
42
5
356
15
8
7
10
8
2
90
5
Yea
r 20
1015
,005
7,
567
7,
438
9,
131
5,
076
4,
055
18
7
106
81
10
3
60
43
10,5
55
1 exc
ludi
ng A
gale
ga a
nd S
t Bra
ndon
-42 -

Tab
le 1
.20
- Age
spec
ific
fert
ility
rat
es1 b
y ag
e of
mot
her
and
live
birt
h or
der
- Rep
ublic
of M
auri
tius2 , 2
009
& 2
010
Liv
e bi
rth
orde
r
Yea
rA
ge o
f mot
her
Firs
tSe
cond
Thi
rdFo
urth
Fift
hSi
xth
& o
ver
Tot
al
15 -
1928
.3
3.
9
0.4*
0
.0*
0
.0*
0.
0*32
.6
2
20 -
2454
.9
22
.0
4.
4
0.
8
0.1
*
0.0*
82.2
025
- 29
45.4
33.0
9.5
2.5
0.6
0.
2*91
.2
0
30 -
3421
.4
23
.6
11
.3
3.
0
0.
9
0.5*
60.7
935
- 39
8.0
8.1
5.7
2.5
1.0
0.8
26.1
40 -
442.
5
1.
4
1.
5
0.
8
0.4
*0.
6
7.
2
45
- 49
0.2*
0
.1*
0.
1*
0.1
*
0.0
*
0.0
*
0.5
*
G.F
.R3
15 -
4923
.2
13
.4
4.
8
1.
4
0.
4
0.
3
43
.5
15 -
1926
.3
3.
9
0.4*
0
.0*
0
.0*
0
.0*
30.6
220
- 24
50.2
21.8
5.4
1.0
0
.3*
0
.0*
78.7
025
- 29
45.0
33.0
10.1
2.5
0.4
0
.1*
91.1
130
3420
223
911
22
81
00
5*59
6
- 43 -
130
- 34
20.2
23.9
11.2
2.8
1.0
0.
5*59
.6
0
35 -
397.
4
8.
5
6.
6
2.
6
0.
8
0.5
*26
.4
40
- 44
1.7
1.6
1.7
0.6
0
.4*
0
.5*
6.5
45 -
49
0.
1*
0.0
*
0.1*
0
.1*
0
.0*
0
.0*
0
.3*
G.F
.R3
15 -
4921
.7
13
.4
5.
1
1.
4
0.
4
0.
2
42
.2
1
liv
e bi
rths o
ccur
red
per 1
,000
fem
ales
in e
ach
age
grou
p. In
cal
cula
ting
the
abo
ve ra
tes,
live
birth
s occ
urrin
g to
mot
hers
age
d le
ss th
an 1
5 ye
ars h
ave
been
incl
uded
in
the
age
grou
p (1
5-19
) whi
lst t
hose
occ
urrin
g to
mot
hers
age
d 50
yea
rs a
nd a
bove
in th
e ag
e gr
oup
(45-
49)
. B
irths
occ
urrin
g to
mot
hers
of u
nkno
wn
age
and
un
know
n bi
rth o
rder
hav
e be
en p
rora
ted.
2 exc
ludi
ng A
gale
ga a
nd S
t Bra
ndon
3 G
ener
al F
ertil
ity R
ate
- Liv
e bi
rths o
ccur
red
per 1
,000
wom
en a
ged
(15-
49) y
ears
* r
ates
bas
ed o
n a
smal
l num
ber o
f eve
nts (
<30)
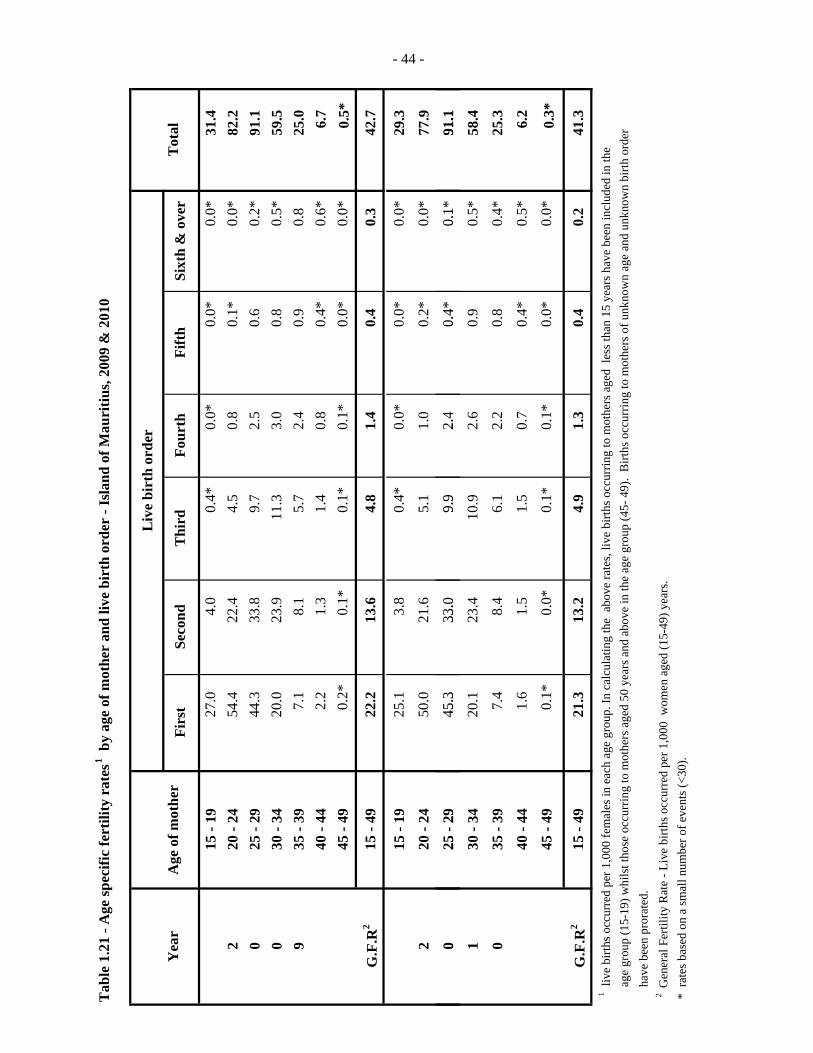
Tab
le 1
.21
- Age
spec
ific
fert
ility
rat
es1 b
y ag
e of
mot
her
and
live
birt
h or
der
- Isl
and
of M
auri
tius,
2009
& 2
010
Liv
e bi
rth
orde
r
Yea
rA
ge o
f mot
her
Firs
tSe
cond
Thi
rdFo
urth
Fift
hSi
xth
& o
ver
Tot
al
15 -
1927
.0
4.
0
0.4*
0.
0*
0.0*
0.
0*
31.4
220
- 24
54.4
22.4
4.5
0.
8
0.1*
0.
0*
82.2
025
- 29
44.3
33.8
9.7
2.
5
0.6
0.
2*
91.1
030
- 34
20.0
23.9
11.3
3.0
0.
8
0.5*
59
.5
9
35 -
397.
1
8.1
5.
7
2.4
0.
9
0.8
25
.0
40
- 44
2.2
1.
3
1.4
0.
8
0.4*
0.
6*
6.7
45 -
490.
2*
0.1*
0.
1*
0.1*
0.
0*
0.0*
0
.5*
G.F
.R2
15 -
4922
.2
13
.6
4.
8
1.4
0.
4
0.3
42
.7
15 -
1925
.1
3.
8
0.4*
0.
0*
0.0*
0.
0*
29.3
220
- 24
50.0
21.6
5.1
1.
0
0.2*
0.
0*
77.9
025
- 29
45.3
33.0
9.9
2.
4
0.4*
0.
1*
91.1
- 44 -- 44 - - 44 -
025
29
45.3
33.0
9.9
2.
4
0.4
0.
1
91.1
130
- 34
20.1
23.4
10.9
2.6
0.
9
0.5*
58
.4
035
- 39
7.4
8.
4
6.1
2.
2
0.8
0.
4*
25.3
40 -
441.
6
1.5
1.
5
0.7
0.
4*
0.5*
6.
2
45 -
490.
1*
0.0*
0.
1*
0.1*
0.
0*
0.0*
0
.3*
G.F
.R2
15 -
4921
.3
13
.2
4.
9
1.3
0.
4
0.2
41
.3
1 liv
e bi
rths o
ccur
red
per 1
,000
fem
ales
in e
ach
age
grou
p. In
cal
cula
ting
the
abo
ve ra
tes,
live
birth
s occ
urrin
g to
mot
hers
age
d le
ss th
an 1
5 ye
ars h
ave
been
incl
uded
in th
e
age
gro
up (1
5-19
) whi
lst t
hose
occ
urrin
g to
mot
hers
age
d 50
yea
rs a
nd a
bove
in th
e ag
e gr
oup
(45-
49)
. B
irths
occ
urrin
g to
mot
hers
of u
nkno
wn
age
and
unkn
own
birth
ord
er
h
ave
been
pro
rate
d. 2
Gen
eral
Fer
tility
Rat
e - L
ive
birth
s occ
urre
d pe
r 1,0
00 w
omen
age
d (1
5-49
) yea
rs.
* r
ates
bas
ed o
n a
smal
l num
ber o
f eve
nts (
<30)
.
4 -
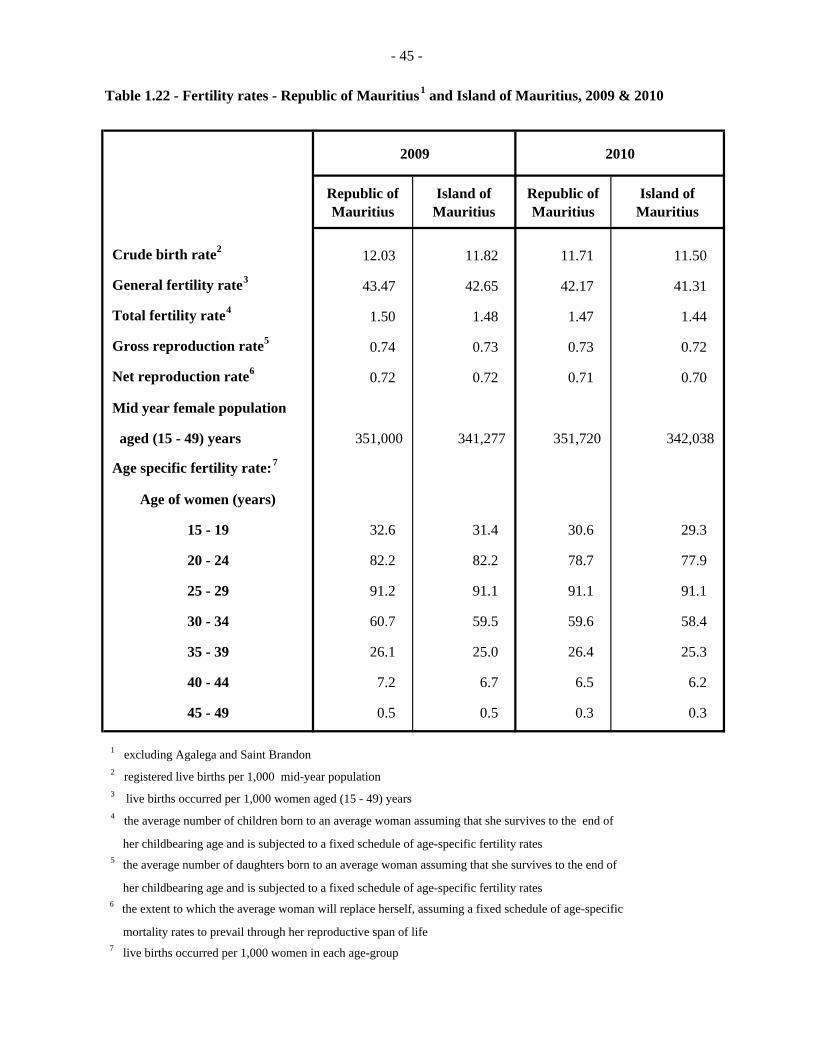
- 45 -
Table 1.22 - Fertility rates - Republic of Mauritius1 and Island of Mauritius, 2009 & 2010
2009 2010
Republic of Mauritius
Island of Mauritius
Republic of Mauritius
Island of Mauritius
Crude birth rate2 12.03 11.82 11.71 11.50
General fertility rate3 43.47 42.65 42.17 41.31
Total fertility rate4 1.50 1.48 1.47 1.44
Gross reproduction rate5 0.74 0.73 0.73 0.72
Net reproduction rate6 0.72 0.72 0.71 0.70
Mid year female population
aged (15 - 49) years 351,000 341,277 351,720 342,038
Age specific fertility rate:7
Age of women (years)
15 - 19 32.6 31.4 30.6 29.3
20 - 24 82.2 82.2 78.7 77.9
25 - 29 91.2 91.1 91.1 91.1
30 - 34 60.7 59.5 59.6 58.4
35 - 39 26.1 25.0 26.4 25.3
40 - 44 7.2 6.7 6.5 6.2
45 - 49 0.5 0.5 0.3 0.3
1 excluding Agalega and Saint Brandon
2 registered live births per 1,000 mid-year population
3 live births occurred per 1,000 women aged (15 - 49) years
4 the average number of children born to an average woman assuming that she survives to the end of
her childbearing age and is subjected to a fixed schedule of age-specific fertility rates
5 the average number of daughters born to an average woman assuming that she survives to the end of
her childbearing age and is subjected to a fixed schedule of age-specific fertility rates
6 the extent to which the average woman will replace herself, assuming a fixed schedule of age-specific
mortality rates to prevail through her reproductive span of life
7 live births occurred per 1,000 women in each age-group
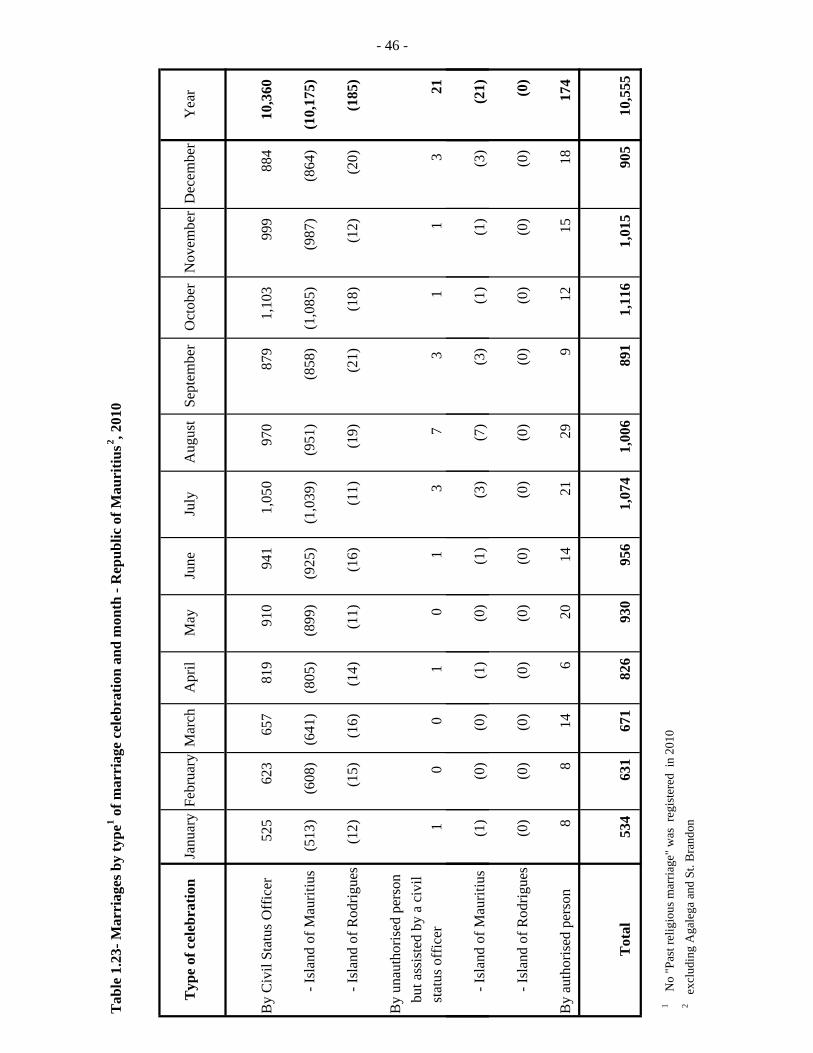
Tab
le 1
.23-
Mar
riag
es b
y ty
pe1 o
f mar
riag
e ce
lebr
atio
n an
d m
onth
- R
epub
lic o
f Mau
ritiu
s2 , 201
0
Typ
e of
cel
ebra
tion
Janu
ary
Febr
uary
Mar
chA
pril
May
June
July
Aug
ust
Sept
embe
rO
ctob
erN
ovem
ber
Dec
embe
rY
ear
By
Civ
il St
atus
Off
icer
525
62
3
657
81
9
910
94
1
1,05
0
970
87
9
1,10
3
999
88
4
10,3
60
- Isl
and
of M
aurit
ius
(513
) (6
08)
(641
) (8
05)
(899
) (9
25)
(1,0
39)
(951
) (8
58)
(1,0
85)
(987
) (8
64)
(10,
175)
- Isl
and
of R
odrig
ues
(12)
(1
5)
(16)
(1
4)
(11)
(1
6)
(11)
(1
9)
(21)
(1
8)
(12)
(2
0)
(185
)
By
unau
thor
ised
per
son
bu
t ass
iste
d by
a c
ivil
st
atus
off
icer
1
0
0
1
0
1
3
7
3
1
1
3
21
- 46 -
- Isl
and
of M
aurit
ius
(1)
(0)
(0)
(1)
(0)
(1)
(3)
(7)
(3)
(1)
(1)
(3)
(21)
- Isl
and
of R
odrig
ues
(0)
(0)
(0)
(0)
(0)
(0)
(0)
(0)
(0)
(0)
(0)
(0)
(0)
By
auth
oris
ed p
erso
n8
8
14
6
20
14
21
29
9
12
15
18
17
4
Tot
al53
4 63
1 67
1 82
6 93
0 95
6 1,
074
1,00
6 89
1 1,
116
1,01
5 90
5 10
,555
1 N
o "P
ast r
elig
ious
mar
riage
" w
as r
egis
tere
d in
201
0 2
exc
ludi
ng A
gale
ga a
nd S
t. B
rand
on
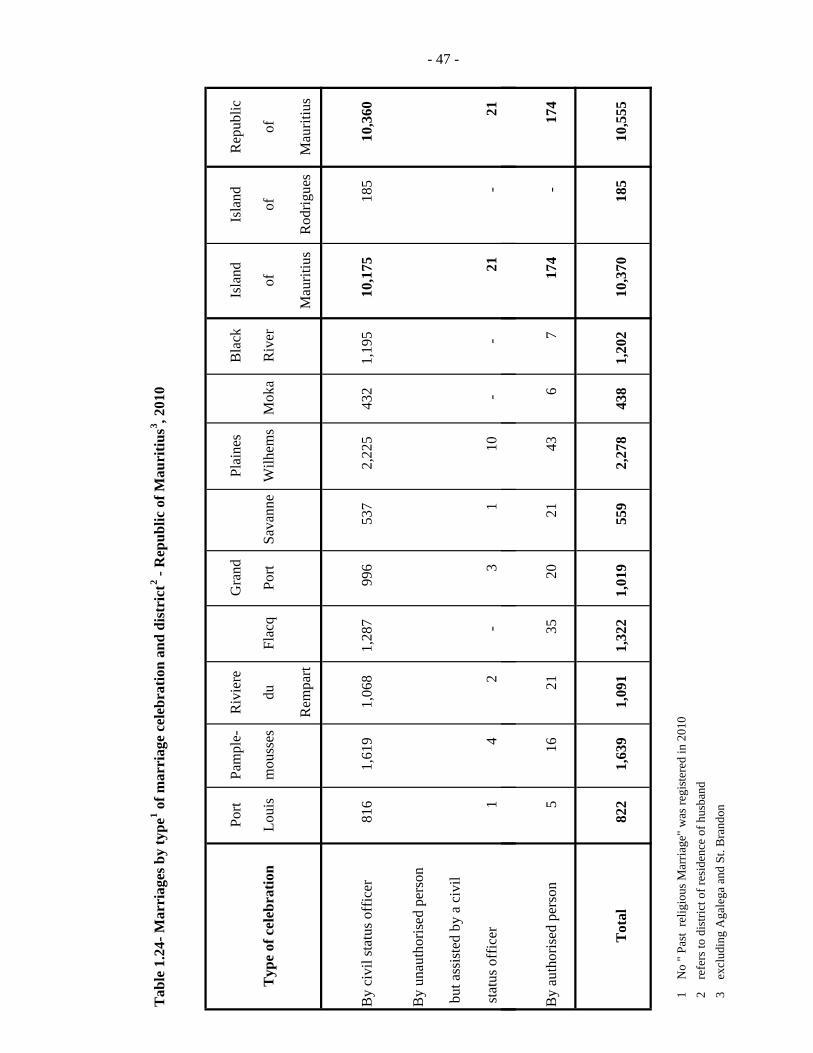
Tab
le 1
.24-
Mar
riag
es b
y ty
pe1 o
f mar
riag
e ce
lebr
atio
n an
d di
stri
ct2 -
Rep
ublic
of M
auri
tius3 , 2
010
Port
Pam
ple-
Riv
iere
Gra
ndPl
aine
sB
lack
Isla
ndIs
land
Rep
ublic
Typ
e of
cel
ebra
tion
Loui
sm
ouss
esdu
Flac
qPo
rtSa
vann
eW
ilhem
sM
oka
Riv
erof
ofof
Rem
part
Mau
ritiu
sR
odrig
ues
Mau
ritiu
s
By
civi
l sta
tus o
ffic
er81
6
1,61
9
1,06
8
1,28
7
996
53
7
2,22
5
432
1,
195
10
,175
18
5
10,3
60
By
unau
thor
ised
per
son
but
ass
iste
d by
a c
ivil
stat
us o
ffic
er1
4
2
-
3
1
10
-
-
21
-
21
- 47 -- 47 -
By
auth
oris
ed p
erso
n5
16
21
35
20
21
43
6
7
17
4
-
174
Tot
al82
2
1,63
9
1,09
1
1,32
2
1,01
9
559
2,
278
43
8
1,20
2
10,3
70
185
10
,555
1
N
o "
Past
rel
igio
us M
arria
ge"
was
regi
ster
ed in
201
0
2
refe
rs to
dis
trict
of r
esid
ence
of h
usba
nd
3
excl
udin
g A
gale
ga a
nd S
t. B
rand
on
-
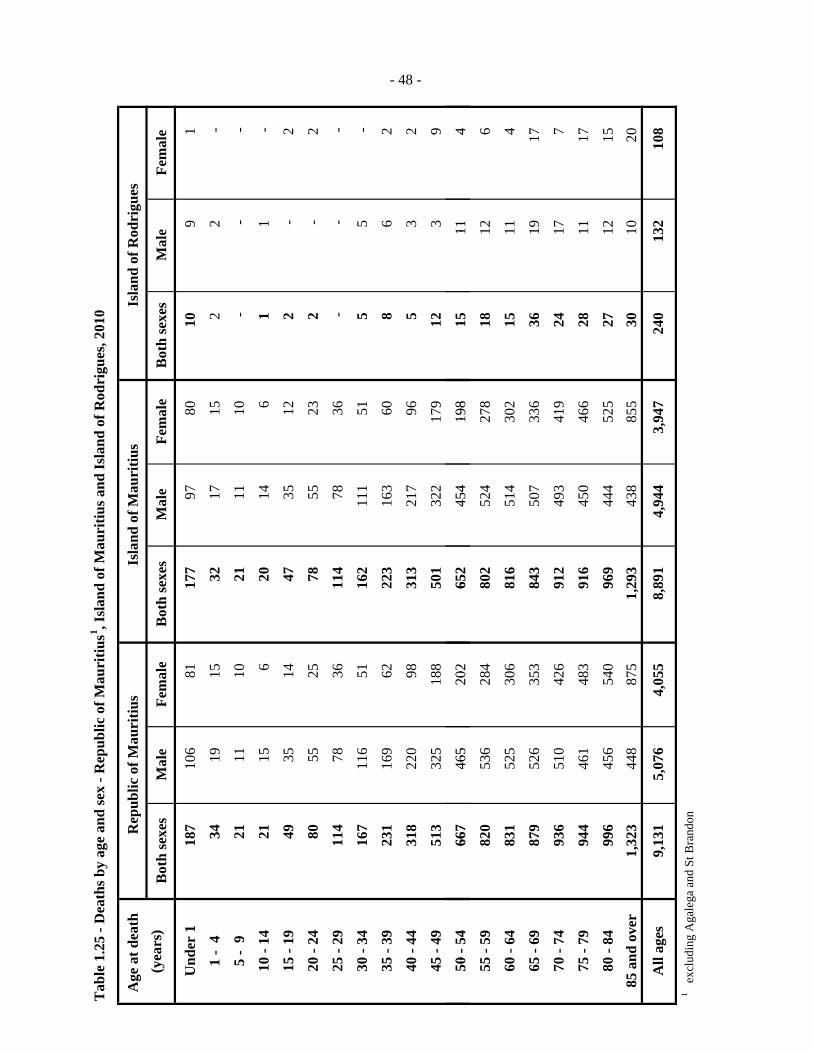
Tab
le 1
.25
- Dea
ths b
y ag
e an
d se
x - R
epub
lic o
f Mau
ritiu
s1 , Isl
and
of M
auri
tius a
nd Is
land
of R
odri
gues
, 201
0
Age
at d
eath
R
epub
lic o
f Mau
ritiu
sIs
land
of M
auri
tius
Isla
nd o
f Rod
rigu
es(y
ears
)B
oth
sexe
sM
ale
Fem
ale
Bot
h se
xes
Mal
eFe
mal
eB
oth
sexe
sM
ale
Fem
ale
Und
er 1
187
106
81
17
7
97
80
10
9
1
1 -
434
19
15
32
17
15
2
2
-
5 -
921
11
10
21
11
10
-
-
-
10 -
1421
15
6
20
14
6
1
1
-
15 -
1949
35
14
47
35
12
2
-
2
20 -
2480
55
25
78
55
23
2
-
2
25 -
2911
4
78
36
11
4
78
36
-
-
-
30 -
3416
7
11
6
51
162
111
51
5
5
-
35 -
3923
1
16
9
62
223
163
60
8
6
2
40 -
4431
8
22
0
98
313
217
96
5
3
2
45 -
4951
3
32
5
18
8
50
1
32
2
17
9
12
3
9
50-5
466
746
520
265
245
419
815
114
- 48 -
50 -
5466
7
46
5
20
2
65
2
45
4
19
8
15
11
4
55 -
5982
0
53
6
28
4
80
2
52
4
27
8
18
12
6
60 -
6483
1
52
5
30
6
81
6
51
4
30
2
15
11
4
65 -
6987
9
52
6
35
3
84
3
50
7
33
6
36
19
17
70 -
7493
6
51
0
42
6
91
2
49
3
41
9
24
17
7
75 -
7994
4
46
1
48
3
91
6
45
0
46
6
28
11
17
80 -
8499
6
45
6
54
0
96
9
44
4
52
5
27
12
15
85 a
nd o
ver
1,32
3
44
8
87
5
1,
293
438
855
30
10
20
All
ages
9,13
1
5,
076
4,05
5
8,
891
4,94
4
3,
947
240
132
108
1
excl
udin
g A
gale
ga a
nd S
t Bra
ndon
-
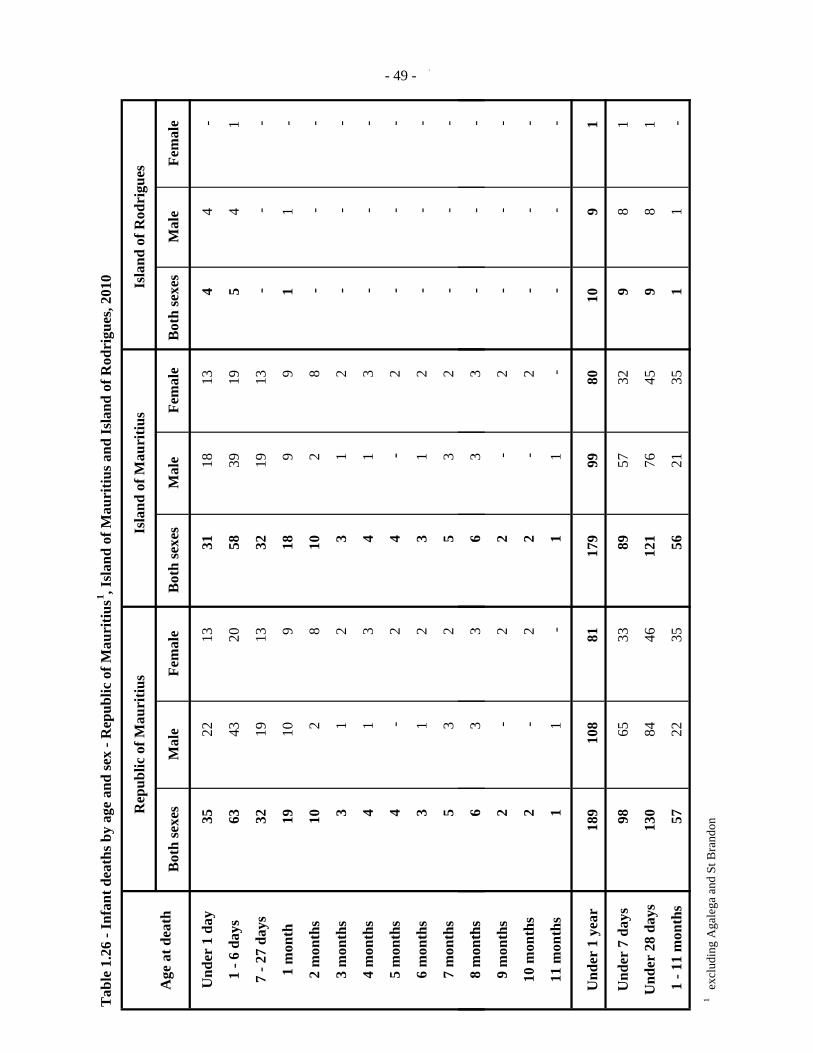
Tab
le 1
.26
- Inf
ant d
eath
s by
age
and
sex
- Rep
ublic
of M
auri
tius1 , I
slan
d of
Mau
ritiu
s and
Isla
nd o
f Rod
rigu
es, 2
010
Rep
ublic
of M
auri
tius
Isla
nd o
f Mau
ritiu
sIs
land
of R
odri
gues
Age
at d
eath
B
oth
sexe
sM
ale
Fem
ale
Bot
h se
xes
Mal
eFe
mal
eB
oth
sexe
sM
ale
Fem
ale
Und
er 1
day
35
22
13
31
18
13
4
4
-
1 - 6
day
s63
43
20
58
39
19
5
4
1
7 - 2
7 da
ys32
19
13
32
19
13
-
-
-
1 m
onth
19
10
9
18
9
9
1
1
-
2 m
onth
s10
2
8
10
2
8
-
-
-
3 m
onth
s3
1
2
3
1
2
-
-
-
4 m
onth
s4
1
3
4
1
3
-
-
-
5 m
onth
s4
-
2
4
-
2
-
-
-
6 m
onth
s3
1
2
3
1
2
-
-
-
7 m
onth
s5
3
2
5
3
2
-
-
-
8m
onth
s6
33
63
3
- 49 -- 49 -
8 m
onth
s6
3
3
6
3
3
-
-
-
9 m
onth
s2
-
2
2
-
2
-
-
-
10 m
onth
s2
-
2
2
-
2
-
-
-
11 m
onth
s1
1
-
1
1
-
-
-
-
Und
er 1
yea
r18
9
10
8
81
179
99
80
10
9
1
Und
er 7
day
s98
65
33
89
57
32
9
8
1
Und
er 2
8 da
ys13
0
84
46
12
1
76
45
9
8
1
1 -
11 m
onth
s57
22
35
56
21
35
1
1
-
1 e
xclu
ding
Aga
lega
and
St B
rand
on
-
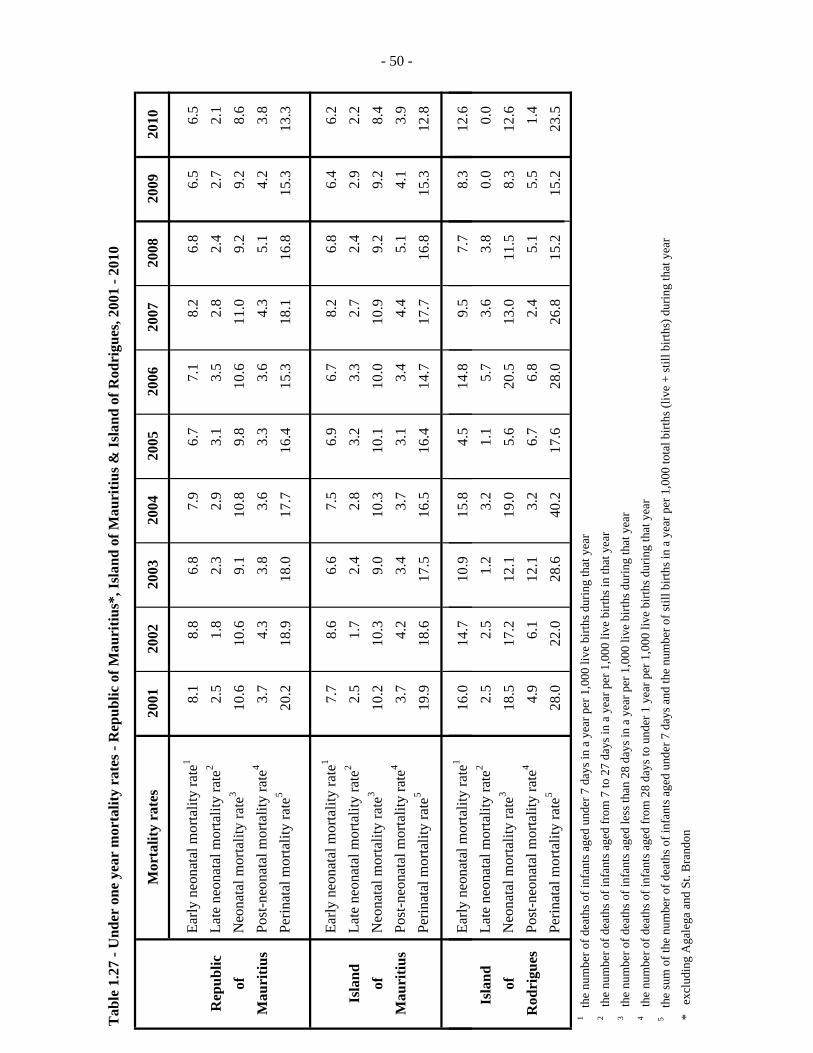
Tab
le 1
.27
- Und
er o
ne y
ear
mor
talit
y ra
tes -
Rep
ublic
of M
auri
tius*
, Isl
and
of M
auri
tius &
Isla
nd o
f Rod
rigu
es, 2
001
- 201
0
Mor
talit
y ra
tes
2001
2002
2003
2004
2005
2006
2007
2008
2009
2010
Ear
ly n
eona
tal m
orta
lity
rate
18.
1
8.8
6.
8
7.9
6.
7
7.1
8.
2
6.8
6.
5
6.5
R
epub
lic L
ate
neon
atal
mor
talit
y ra
te2
2.5
1.
8
2.3
2.
9
3.1
3.
5
2.8
2.
4
2.7
2.
1
of N
eona
tal m
orta
lity
rate
310
.6
10.6
9.
1
10.8
9.
8
10.6
11
.0
9.2
9.
2
8.6
M
auri
tius
Pos
t-neo
nata
l mor
talit
y ra
te4
3.7
4.
3
3.8
3.
6
3.3
3.
6
4.3
5.
1
4.2
3.
8
Per
inat
al m
orta
lity
rate
520
.2
18.9
18
.0
17.7
16
.4
15.3
18
.1
16.8
15
.3
13.3
Ear
ly n
eona
tal m
orta
lity
rate
17.
7
8.6
6.
6
7.5
6.
9
6.7
8.
2
6.8
6.
4
6.2
Is
land
Lat
e ne
onat
al m
orta
lity
rate
22.
5
1.7
2.
4
2.8
3.
2
3.3
2.
7
2.4
2.
9
2.2
of
Neo
nata
l mor
talit
y ra
te3
10.2
10
.3
9.0
10
.3
10.1
10
.0
10.9
9.
2
9.2
8.
4
Mau
ritiu
s P
ost-n
eona
tal m
orta
lity
rate
43.
7
4.2
3.
4
3.7
3.
1
3.4
4.
4
5.1
4.
1
3.9
P
erin
atal
mor
talit
y ra
te5
19.9
18
.6
17.5
16
.5
16.4
14
.7
17.7
16
.8
15.3
12
.8
- 50 -
Ear
ly n
eona
tal m
orta
lity
rate
116
.0
14.7
10
.9
15.8
4.
5
14.8
9.
5
7.7
8.
3
12.6
Is
land
L
ate
neon
atal
mor
talit
y ra
te2
2.5
2.
5
1.2
3.
2
1.1
5.
7
3.6
3.
8
0.0
0.
0
of N
eona
tal m
orta
lity
rate
318
.5
17.2
12
.1
19.0
5.
6
20.5
13
.0
11.5
8.
3
12.6
R
odri
gues
Pos
t-neo
nata
l mor
talit
y ra
te4
4.9
6.
1
12.1
3.
2
6.7
6.
8
2.4
5.
1
5.5
1.
4
Per
inat
al m
orta
lity
rate
528
.0
22.0
28
.6
40.2
17
.6
28.0
26
.8
15.2
15
.2
23.5
1 t
he n
umbe
r of d
eath
s of i
nfan
ts a
ged
unde
r 7 d
ays i
n a
year
per
1,0
00 li
ve b
irths
dur
ing
that
yea
r 2
the
num
ber o
f dea
ths o
f inf
ants
age
d fr
om 7
to 2
7 da
ys in
a y
ear p
er 1
,000
live
birt
hs in
that
yea
r 3
the
num
ber o
f dea
ths o
f inf
ants
age
d le
ss th
an 2
8 da
ys in
a y
ear p
er 1
,000
live
birt
hs d
urin
g th
at y
ear
4 th
e nu
mbe
r of d
eath
s of i
nfan
ts a
ged
from
28
days
to u
nder
1 y
ear p
er 1
,000
live
birt
hs d
urin
g th
at y
ear
5
the
sum
of t
he n
umbe
r of d
eath
s of i
nfan
ts a
ged
unde
r 7 d
ays a
nd th
e nu
mbe
r of s
till b
irths
in a
yea
r per
1,0
00 to
tal b
irths
(liv
e +
still
birt
hs) d
urin
g th
at y
ear
*
excl
udin
g A
gale
ga a
nd S
t. B
rand
on
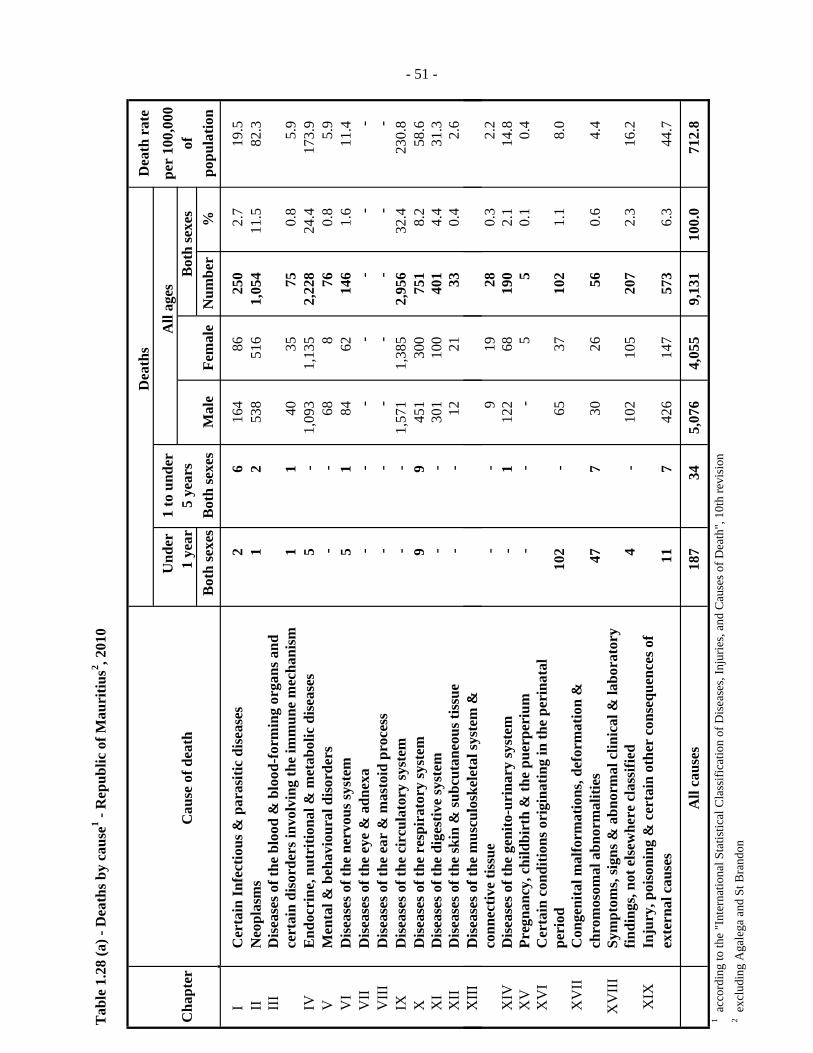
Tab
le 1
.28
(a) -
Dea
ths b
y ca
use1 -
Rep
ublic
of M
auri
tius2 , 2
010
Dea
ths
Dea
th r
ate
Und
er
1 to
und
er
A
ll ag
espe
r 10
0,00
0C
hapt
erC
ause
of d
eath
1 ye
ar5
year
s
Bot
h se
xes
ofB
oth
sexe
sB
oth
sexe
sM
ale
Fem
ale
Num
ber
%po
pula
tion
I
Cer
tain
Infe
ctio
us &
par
asiti
c di
seas
es2
6
16
4
86
250
2.7
19.5
II
Neo
plas
ms
1
2
538
516
1,05
4
11
.5
82
.3
III
Dis
ease
s of t
he b
lood
& b
lood
-for
min
g or
gans
and
cert
ain
diso
rder
s inv
olvi
ng th
e im
mun
e m
echa
nism
1
1
40
35
75
0.
8
5.
9
IVE
ndoc
rine
, nut
ritio
nal &
met
abol
ic d
isea
ses
5
-
1,09
3
1,
135
2,22
8
24
.4
17
3.9
V
Men
tal &
beh
avio
ural
dis
orde
rs
-
-
68
8
76
0.8
5.9
V
ID
isea
ses o
f the
ner
vous
syst
em
5
1
84
62
146
1.6
11.4
V
IID
isea
ses o
f the
eye
& a
dnex
a
-
-
-
-
-
-
-
VII
ID
isea
ses o
f the
ear
& m
asto
id p
roce
ss
-
-
-
-
-
-
-
IXD
isea
ses o
f the
cir
cula
tory
syst
em
-
-
1,
571
1,38
5
2,
956
32.4
230.
8
XD
isea
ses o
f the
res
pira
tory
syst
em9
9
45
1
30
0
75
1
8.
2
58
.6
XI
Dis
ease
s of t
he d
iges
tive
syst
em
-
-
30
1
10
0
40
1
4.
4
31
.3
XII
Dis
ease
s of t
he sk
in &
subc
utan
eous
tiss
ue
-
-
12
21
33
0.4
2.6
XII
ID
ift
hl
kl
tl
t&
- 51 -- 51 -
X
III
Dis
ease
s of t
he m
uscu
losk
elet
al sy
stem
&co
nnec
tive
tissu
e
-
-
9
19
28
0.3
2.2
X
IVD
isea
ses o
f the
gen
ito-u
rina
ry sy
stem
-
1
122
68
19
0
2.
1
14
.8
XV
Preg
nanc
y, c
hild
birt
h &
the
puer
peri
um
-
-
-
5
5
0.
1
0.
4
XV
IC
erta
in c
ondi
tions
ori
gina
ting
in th
e pe
rina
tal
peri
od10
2
-
65
37
102
1.1
8.0
X
VII
Con
geni
tal m
alfo
rmat
ions
, def
orm
atio
n &
chro
mos
omal
abn
orm
aliti
es47
7
30
26
56
0.6
4.4
XV
III
Sym
ptom
s, si
gns &
abn
orm
al c
linic
al &
labo
rato
ryfin
ding
s, no
t els
ewhe
re c
lass
ified
4
-
102
105
207
2.3
16.2
XIX
Inju
ry, p
oiso
ning
& c
erta
in o
ther
con
sequ
ence
s of
exte
rnal
cau
ses
11
7
426
147
573
6.3
44.7
All
caus
es18
7
34
5,07
6
4,
055
9,13
1
10
0.0
712.
8
1 acc
ordi
ng to
the
"Int
erna
tiona
l Sta
tistic
al C
lass
ifica
tion
of D
isea
ses,
Inju
ries,
and
Cau
ses o
f Dea
th",
10t
h re
visi
on 2 e
xclu
ding
Aga
lega
and
St B
rand
on
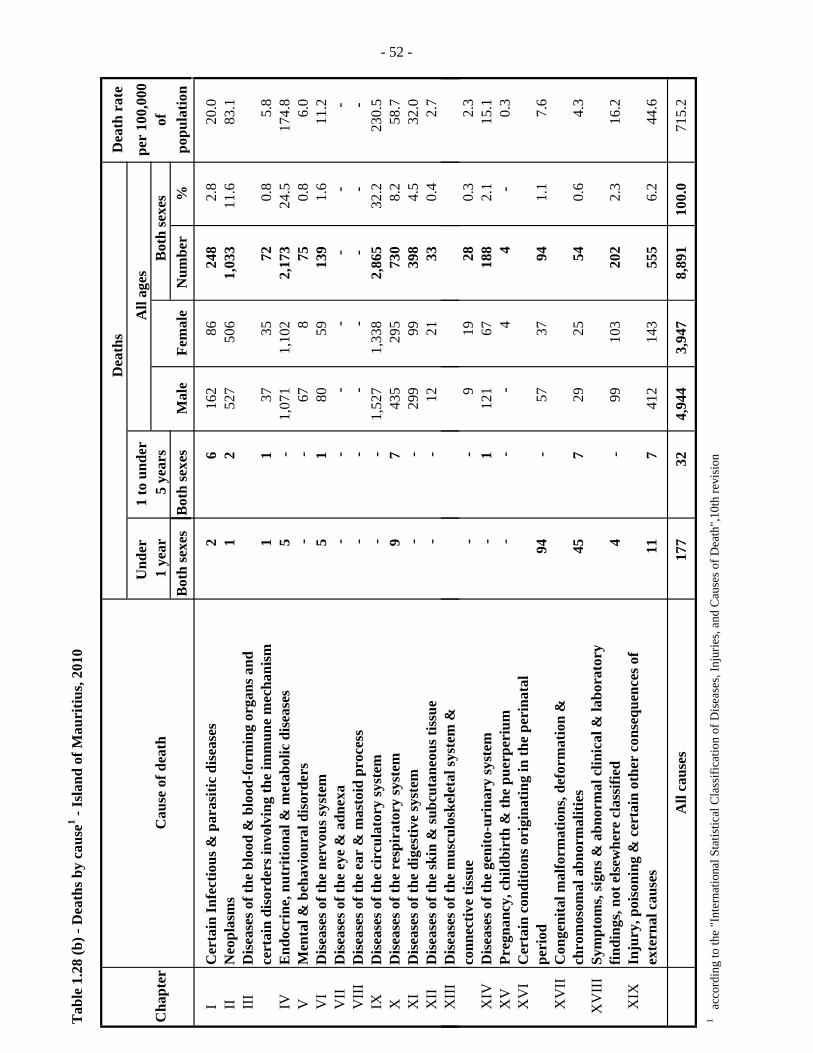
Tab
le 1
.28
(b) -
Dea
ths b
y ca
use1 -
Isla
nd o
f Mau
ritiu
s, 20
10
Dea
ths
Dea
th r
ate
Und
er
1 to
und
er
A
ll ag
espe
r 10
0,00
0C
hapt
erC
ause
of d
eath
1 ye
ar 5
yea
rs
Bot
h se
xes
ofB
oth
sexe
sB
oth
sexe
sM
ale
Fem
ale
Num
ber
%po
pula
tion
I
Cer
tain
Infe
ctio
us &
par
asiti
c di
seas
es2
6
16
2
86
248
2.8
20.0
II
Neo
plas
ms
1
2
527
506
1,03
3
11
.6
83
.1
III
Dis
ease
s of t
he b
lood
& b
lood
-for
min
g or
gans
and
cert
ain
diso
rder
s inv
olvi
ng th
e im
mun
e m
echa
nism
1
1
37
35
72
0.
8
5.
8
IVE
ndoc
rine
, nut
ritio
nal &
met
abol
ic d
isea
ses
5
-
1,
071
1,10
2
2,
173
24.5
174.
8
VM
enta
l & b
ehav
iour
al d
isor
ders
-
-
67
8
75
0.
8
6.
0
VI
Dis
ease
s of t
he n
ervo
us sy
stem
5
1
80
59
13
9
1.
6
11
.2
VII
Dis
ease
s of t
he e
ye &
adn
exa
-
-
-
-
-
-
-
V
III
Dis
ease
s of t
he e
ar &
mas
toid
pro
cess
-
-
-
-
-
-
-
IX
Dis
ease
s of t
he c
ircu
lato
ry sy
stem
-
-
1,52
7
1,
338
2,86
5
32
.2
23
0.5
X
Dis
ease
s of t
he r
espi
rato
ry sy
stem
9
7
435
295
730
8.2
58.7
X
ID
isea
ses o
f the
dig
estiv
e sy
stem
-
-
299
99
39
8
4.
5
32
.0
XII
Dis
ease
s of t
he sk
in &
subc
utan
eous
tiss
ue-
-
12
21
33
0.4
2.7
XII
ID
ift
hl
kl
tl
t&
- 52 -- 52 -
X
III
Dis
ease
s of t
he m
uscu
losk
elet
al sy
stem
&co
nnec
tive
tissu
e-
-
9
19
28
0.3
2.3
X
IVD
isea
ses o
f the
gen
ito-u
rina
ry sy
stem
-
1
12
1
67
188
2.1
15.1
X
VPr
egna
ncy,
chi
ldbi
rth
& th
e pu
erpe
rium
-
-
-
4
4
-
0.
3
XV
IC
erta
in c
ondi
tions
ori
gina
ting
in th
e pe
rina
tal
peri
od94
-
57
37
94
1.
1
7.
6
XV
IIC
onge
nita
l mal
form
atio
ns, d
efor
mat
ion
&ch
rom
osom
al a
bnor
mal
ities
45
7
29
25
54
0.
6
4.
3
X
VII
ISy
mpt
oms,
sign
s & a
bnor
mal
clin
ical
& la
bora
tory
findi
ngs,
not e
lsew
here
cla
ssifi
ed4
-
99
10
3
20
2
2.
3
16
.2
X
IXIn
jury
, poi
soni
ng &
cer
tain
oth
er c
onse
quen
ces o
fex
tern
al c
ause
s11
7
41
2
14
3
55
5
6.
2
44
.6
All
caus
es17
7
32
4,94
4
3,
947
8,89
1
10
0.0
715.
2
1
acco
rdin
g to
the
"Int
erna
tiona
l Sta
tistic
al C
lass
ifica
tion
of D
isea
ses,
Inju
ries,
and
Cau
ses o
f Dea
th",
10th
revi
sion
-
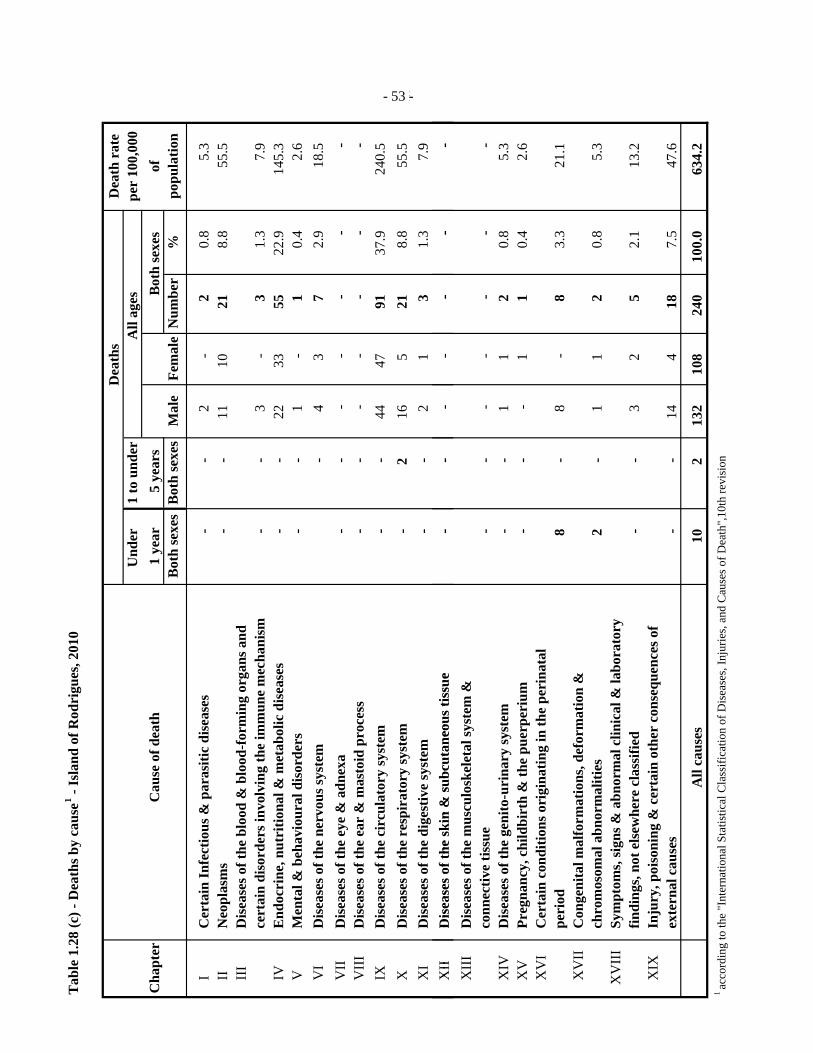
Tab
le 1
.28
(c) -
Dea
ths b
y ca
use1 -
Isla
nd o
f Rod
rigu
es, 2
010
Dea
ths
Dea
th r
ate
Und
er
1 to
und
er
A
ll ag
espe
r 10
0,00
0C
hapt
erC
ause
of d
eath
1 ye
ar 5
yea
rs
Bot
h se
xes
ofB
oth
sexe
sB
oth
sexe
sM
ale
Fem
ale
Num
ber
%po
pula
tion
I
Cer
tain
Infe
ctio
us &
par
asiti
c di
seas
es-
-
2
-
2
0.
8
5.
3
IIN
eopl
asm
s-
-
11
10
21
8.8
55.5
II
ID
isea
ses o
f the
blo
od &
blo
od-f
orm
ing
orga
ns a
ndce
rtai
n di
sord
ers i
nvol
ving
the
imm
une
mec
hani
sm-
-
3
-
3
1.
3
7.
9
IVE
ndoc
rine
, nut
ritio
nal &
met
abol
ic d
isea
ses
-
-
22
33
55
22
.9
14
5.3
V
Men
tal &
beh
avio
ural
dis
orde
rs-
-
1
-
1
0.
4
2.
6
VI
Dis
ease
s of t
he n
ervo
us sy
stem
-
4
3
7
2.9
18.5
V
IID
isea
ses o
f the
eye
& a
dnex
a-
-
-
-
-
-
-
VII
ID
isea
ses o
f the
ear
& m
asto
id p
roce
ss-
-
-
-
-
-
-
IXD
isea
ses o
f the
cir
cula
tory
syst
em-
-
44
47
91
37.9
240.
5
XD
isea
ses o
f the
res
pira
tory
syst
em-
2
16
5
21
8.
8
55
.5
XI
Dis
ease
s of t
he d
iges
tive
syst
em-
-
2
1
3
1.3
7.9
XII
Dis
ease
soft
hesk
in&
subc
utan
eous
tissu
e-
--
--
--
- 53 -- 53 -
X
IID
isea
ses o
f the
skin
& su
bcut
aneo
us ti
ssue
-
-
-
-
-
-
-
X
III
Dis
ease
s of t
he m
uscu
losk
elet
al sy
stem
&co
nnec
tive
tissu
e-
-
-
-
-
-
-
XIV
Dis
ease
s of t
he g
enito
-uri
nary
syst
em-
-
1
1
2
0.8
5.3
X
VPr
egna
ncy,
chi
ldbi
rth
& th
e pu
erpe
rium
-
-
-
1
1
0.4
2.6
X
VI
Cer
tain
con
ditio
ns o
rigi
natin
g in
the
peri
nata
l pe
riod
8
-
8
-
8
3.
3
21
.1
XV
IIC
onge
nita
l mal
form
atio
ns, d
efor
mat
ion
&ch
rom
osom
al a
bnor
mal
ities
2
-
1
1
2
0.8
5.3
XV
III
Sym
ptom
s, si
gns &
abn
orm
al c
linic
al &
labo
rato
ryfin
ding
s, no
t els
ewhe
re c
lass
ified
-
-
3
2
5
2.
1
13
.2
X
IXIn
jury
, poi
soni
ng &
cer
tain
oth
er c
onse
quen
ces o
fex
tern
al c
ause
s-
-
14
4
18
7.5
47.6
All
caus
es10
2
13
2
10
8
24
0
10
0.0
634.
2
1 ac
cord
ing
to th
e "I
nter
natio
nal S
tatis
tical
Cla
ssifi
catio
n of
Dis
ease
s, In
jurie
s, an
d C
ause
s of D
eath
",10
th re
visi
on
3 --
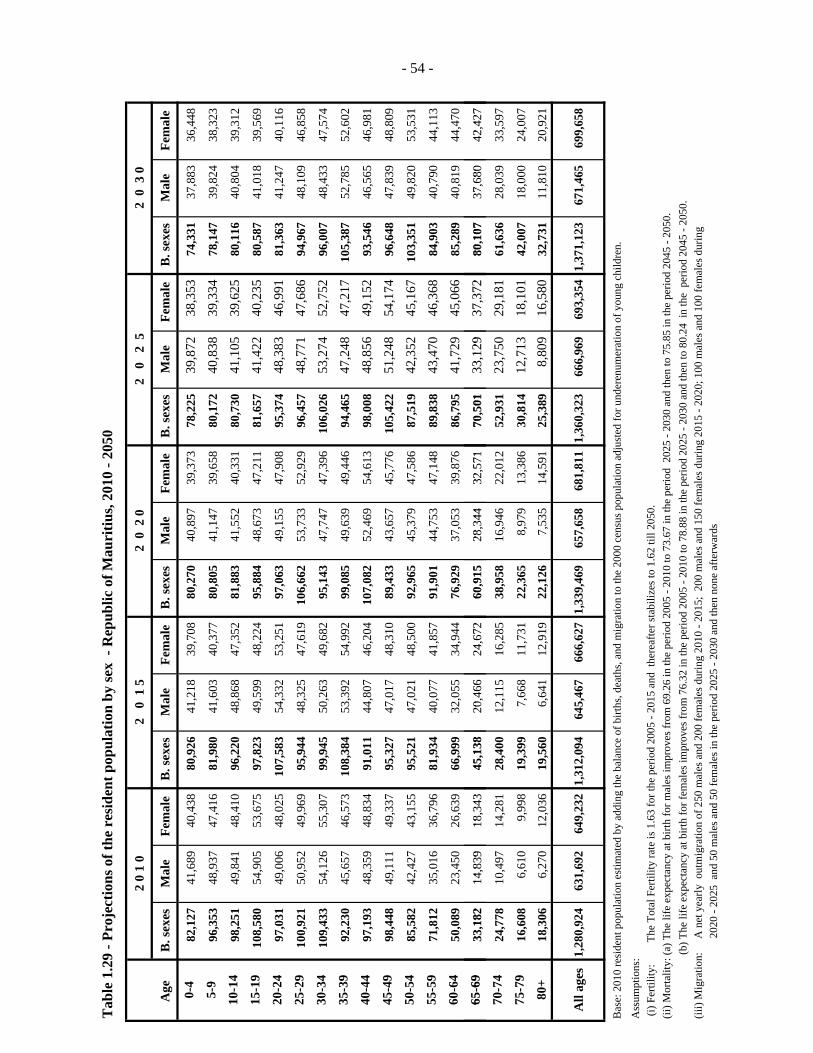
Tab
le 1
.29
- Pro
ject
ions
of t
he r
esid
ent p
opul
atio
n by
sex
- R
epub
lic o
f Mau
ritiu
s, 20
10 -
2050
2 0
1 0
2 0
1 5
2 0
2 0
2 0
2
52
0 3
0
Age
B
. sex
esM
ale
Fem
ale
B. s
exes
Mal
eFe
mal
eB
. sex
esM
ale
Fem
ale
B. s
exes
Mal
eFe
mal
eB
. sex
esM
ale
Fem
ale
0-4
82
,127
41
,689
40
,438
80
,926
41
,218
39
,708
80
,270
40
,897
39
,373
78
,225
39
,872
38
,353
74
,331
37
,883
36
,448
5-9
96
,353
48
,937
47
,416
81
,980
41
,603
40
,377
80
,805
41
,147
39
,658
80
,172
40
,838
39
,334
78
,147
39
,824
38
,323
10-1
498
,251
49
,841
48
,410
96
,220
48
,868
47
,352
81
,883
41
,552
40
,331
80
,730
41
,105
39
,625
80
,116
40
,804
39
,312
15-1
910
8,58
0 54
,905
53
,675
97
,823
49
,599
48
,224
95
,884
48
,673
47
,211
81
,657
41
,422
40
,235
80
,587
41
,018
39
,569
20-2
497
,031
49
,006
48
,025
10
7,58
3 54
,332
53
,251
97
,063
49
,155
47
,908
95
,374
48
,383
46
,991
81
,363
41
,247
40
,116
25-2
910
0,92
1 50
,952
49
,969
95
,944
48
,325
47
,619
10
6,66
2 53
,733
52
,929
96
,457
48
,771
47
,686
94
,967
48
,109
46
,858
30-3
410
9,43
3 54
,126
55
,307
99
,945
50
,263
49
,682
95
,143
47
,747
47
,396
10
6,02
6 53
,274
52
,752
96
,007
48
,433
47
,574
35-3
992
,230
45
,657
46
,573
10
8,38
4 53
,392
54
,992
99
,085
49
,639
49
,446
94
,465
47
,248
47
,217
10
5,38
7 52
,785
52
,602
40-4
497
,193
48
,359
48
,834
91
,011
44
,807
46
,204
10
7,08
2 52
,469
54
,613
98
,008
48
,856
49
,152
93
,546
46
,565
46
,981
45-4
998
,448
49
,111
49
,337
95
,327
47
,017
48
,310
89
,433
43
,657
45
,776
10
5,42
2 51
,248
54
,174
96
,648
47
,839
48
,809
50-5
485
,582
42
,427
43
,155
95
,521
47
,021
48
,500
92
,965
45
,379
47
,586
87
,519
42
,352
45
,167
10
3,35
1 49
,820
53
,531
55-5
971
,812
35
,016
36
,796
81
,934
40
,077
41
,857
91
,901
44
,753
47
,148
89
,838
43
,470
46
,368
84
,903
40
,790
44
,113
60-6
450
,089
23
,450
26
,639
66
,999
32
,055
34
,944
76
,929
37
,053
39
,876
86
,795
41
,729
45
,066
85
,289
40
,819
44
,470
65-6
933
182
1483
918
343
4513
820
466
2467
260
915
2834
432
571
7050
133
129
3737
280
107
3768
042
427
- 54 - - 54 -
65-6
933
,182
14
,839
18
,343
45
,138
20
,466
24
,672
60
,915
28
,344
32
,571
70
,501
33
,129
37
,372
80
,107
37
,680
42
,427
70-7
424
,778
10
,497
14
,281
28
,400
12
,115
16
,285
38
,958
16
,946
22
,012
52
,931
23
,750
29
,181
61
,636
28
,039
33
,597
75-7
916
,608
6,
610
9,99
8 19
,399
7,
668
11,7
31
22,3
65
8,97
9 13
,386
30
,814
12
,713
18
,101
42
,007
18
,000
24
,007
80+
18
,306
6,
270
12,0
36
19,5
60
6,64
1 12
,919
22
,126
7,
535
14,5
91
25,3
89
8,80
9 16
,580
32
,731
11
,810
20
,921
All
ages
1,28
0,92
4 63
1,69
2 64
9,23
2 1,
312,
094
645,
467
666,
627
1,33
9,46
9 65
7,65
8 68
1,81
1 1,
360,
323
666,
969
693,
354
1,37
1,12
3 67
1,46
5 69
9,65
8
Bas
e: 2
010
resi
dent
pop
ulat
ion
estim
ated
by
addi
ng th
e ba
lanc
e of
birt
hs, d
eath
s, an
d m
igra
tion
to th
e 20
00 c
ensu
s pop
ulat
ion
adju
sted
for u
nder
enum
erat
ion
of y
oung
chi
ldre
n.
Ass
umpt
ions
: (i
) Fer
tility
:
Th
e To
tal F
ertil
ity ra
te is
1.6
3 fo
r the
per
iod
2005
- 20
15 a
nd t
here
afte
r sta
biliz
es to
1.6
2 til
l 205
0.(ii
) Mor
talit
y: (a
) The
life
exp
ecta
ncy
at b
irth
for m
ales
impr
oves
from
69.
26 in
the
perio
d 20
05 -
2010
to 7
3.67
in th
e pe
riod
202
5 - 2
030
and
then
to 7
5.85
in th
e pe
riod
2045
- 20
50.
(b) T
he li
fe e
xpec
tanc
y at
birt
h fo
r fem
ales
impr
oves
from
76.
32 in
the
perio
d 20
05 -
2010
to 7
8.88
in th
e pe
riod
2025
- 20
30 a
nd th
en to
80.
24 i
n th
e p
erio
d 20
45 -
2050
.(ii
i) M
igra
tion:
A
net
yea
rly o
utm
igra
tion
of 2
50 m
ales
and
200
fem
ales
dur
ing
2010
- 20
15;
200
mal
es a
nd 1
50 fe
mal
es d
urin
g 20
15 -
2020
; 100
mal
es a
nd 1
00 fe
mal
es d
urin
g
2
020
- 202
5 a
nd 5
0 m
ales
and
50
fem
ales
in th
e pe
riod
2025
- 20
30 a
nd th
en n
one
afte
rwar
ds
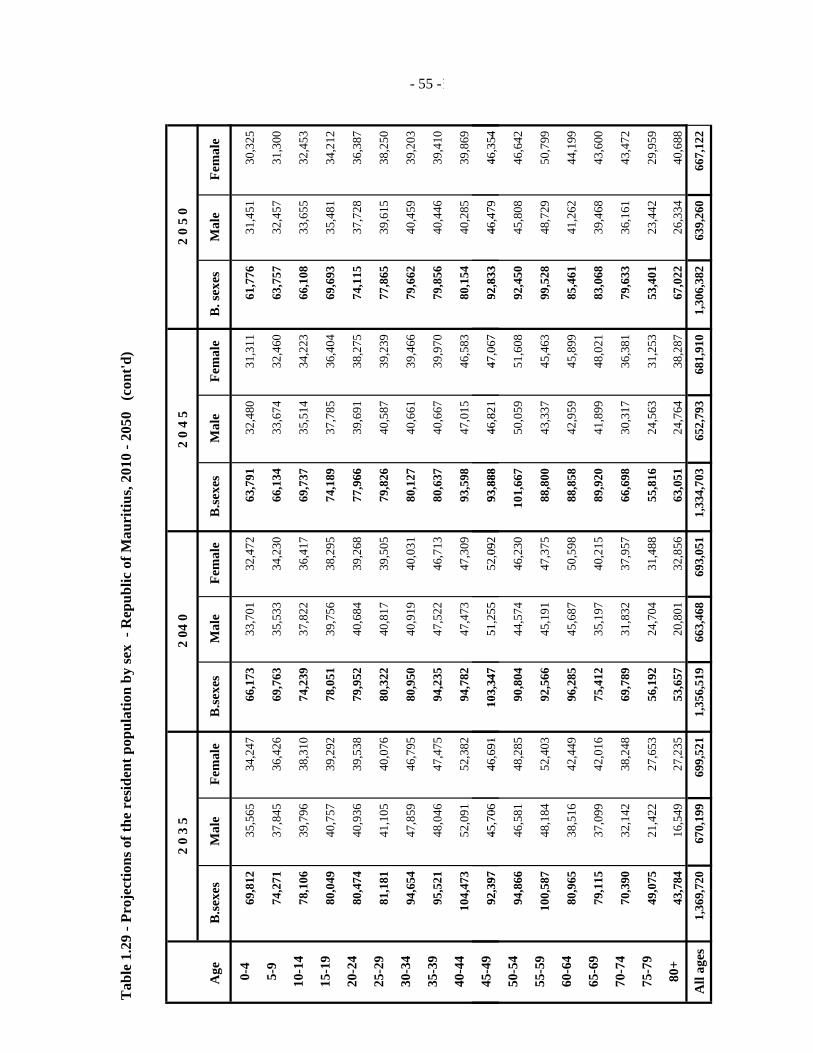
Tab
le 1
.29
- Pro
ject
ions
of t
he r
esid
ent p
opul
atio
n by
sex
- R
epub
lic o
f Mau
ritiu
s, 20
10 -
2050
(c
ont'd
)
2 0
3 5
2 04
02
0 4
52
0 5
0
Age
B
.sexe
sM
ale
Fem
ale
B.se
xes
Mal
eFe
mal
eB
.sexe
sM
ale
Fem
ale
B. s
exes
Mal
eFe
mal
e
0-4
69
,812
35
,565
34
,247
66
,173
33
,701
32
,472
63
,791
32
,480
31
,311
61
,776
31
,451
30
,325
5-9
74
,271
37
,845
36
,426
69
,763
35
,533
34
,230
66
,134
33
,674
32
,460
63
,757
32
,457
31
,300
10-1
478
,106
39
,796
38
,310
74
,239
37
,822
36
,417
69
,737
35
,514
34
,223
66
,108
33
,655
32
,453
15-1
980
,049
40
,757
39
,292
78
,051
39
,756
38
,295
74
,189
37
,785
36
,404
69
,693
35
,481
34
,212
20-2
480
,474
40
,936
39
,538
79
,952
40
,684
39
,268
77
,966
39
,691
38
,275
74
,115
37
,728
36
,387
25-2
981
,181
41
,105
40
,076
80
,322
40
,817
39
,505
79
,826
40
,587
39
,239
77
,865
39
,615
38
,250
30-3
494
,654
47
,859
46
,795
80
,950
40
,919
40
,031
80
,127
40
,661
39
,466
79
,662
40
,459
39
,203
35-3
995
,521
48
,046
47
,475
94
,235
47
,522
46
,713
80
,637
40
,667
39
,970
79
,856
40
,446
39
,410
40-4
410
4,47
3 52
,091
52
,382
94
,782
47
,473
47
,309
93
,598
47
,015
46
,583
80
,154
40
,285
39
,869
45-4
992
397
4570
646
691
103
347
5125
552
092
9388
846
821
4706
792
833
4647
946
354
- 55 -- 55 -
92,3
97
45,7
06
46,6
91
103,
347
51,2
55
52,0
92
93,8
88
46,8
21
47,0
67
92,8
33
46,4
79
46,3
54
50-5
494
,866
46
,581
48
,285
90
,804
44
,574
46
,230
10
1,66
7 50
,059
51
,608
92
,450
45
,808
46
,642
55-5
910
0,58
7 48
,184
52
,403
92
,566
45
,191
47
,375
88
,800
43
,337
45
,463
99
,528
48
,729
50
,799
60-6
480
,965
38
,516
42
,449
96
,285
45
,687
50
,598
88
,858
42
,959
45
,899
85
,461
41
,262
44
,199
65-6
979
,115
37
,099
42
,016
75
,412
35
,197
40
,215
89
,920
41
,899
48
,021
83
,068
39
,468
43
,600
70-7
470
,390
32
,142
38
,248
69
,789
31
,832
37
,957
66
,698
30
,317
36
,381
79
,633
36
,161
43
,472
75-7
949
,075
21
,422
27
,653
56
,192
24
,704
31
,488
55
,816
24
,563
31
,253
53
,401
23
,442
29
,959
80+
43
,784
16
,549
27
,235
53
,657
20
,801
32
,856
63
,051
24
,764
38
,287
67
,022
26
,334
40
,688
All
ages
1,36
9,72
0 67
0,19
9 69
9,52
1 1,
356,
519
663,
468
693,
051
1,33
4,70
3 65
2,79
3 68
1,91
0 1,
306,
382
639,
260
667,
122
55 -
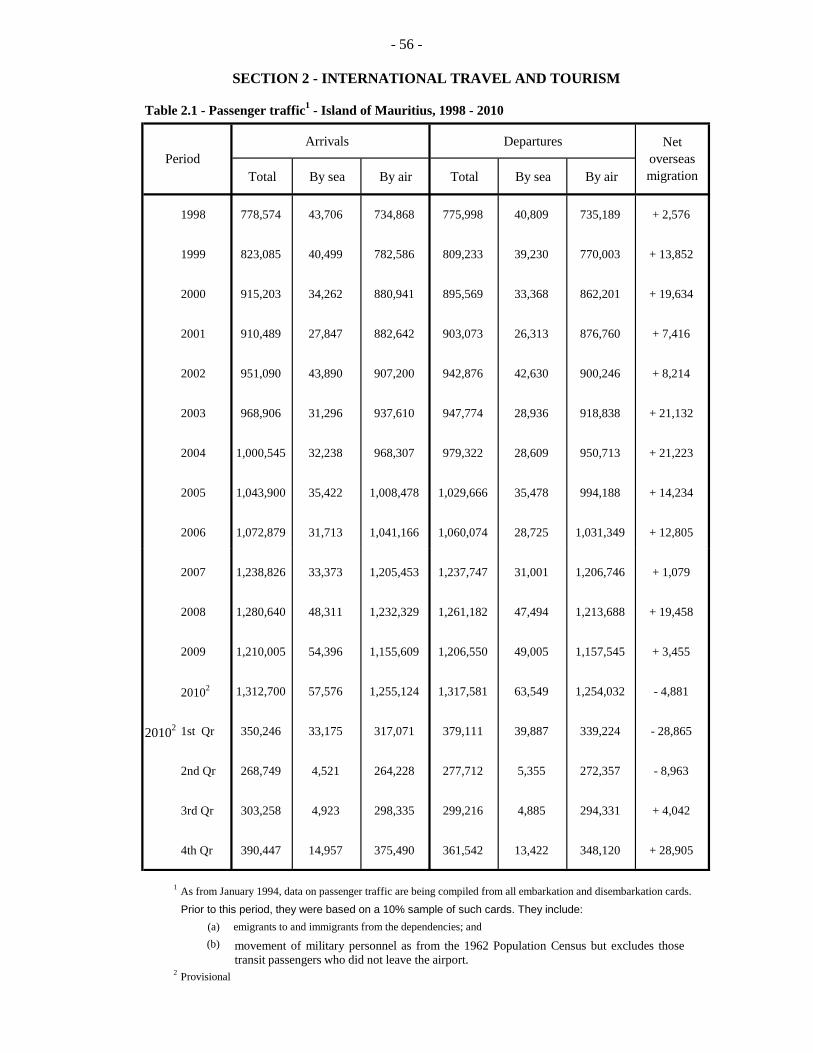
- 56 -
SECTION 2 - INTERNATIONAL TRAVEL AND TOURISM
Table 2.1 - Passenger traffic1 - Island of Mauritius, 1998 - 2010
Arrivals Departures
Total By sea By air Total By sea By air
1998 778,574 43,706 734,868 775,998 40,809 735,189 + 2,576
1999 823,085 40,499 782,586 809,233 39,230 770,003 + 13,852
2000 915,203 34,262 880,941 895,569 33,368 862,201 + 19,634
2001 910,489 27,847 882,642 903,073 26,313 876,760 + 7,416
2002 951,090 43,890 907,200 942,876 42,630 900,246 + 8,214
2003 968,906 31,296 937,610 947,774 28,936 918,838 + 21,132
2004 1,000,545 32,238 968,307 979,322 28,609 950,713 + 21,223
2005 1,043,900 35,422 1,008,478 1,029,666 35,478 994,188 + 14,234
2006 1,072,879 31,713 1,041,166 1,060,074 28,725 1,031,349 + 12,805
Netoverseas migration
Period
2007 1,238,826 33,373 1,205,453 1,237,747 31,001 1,206,746 + 1,079
2008 1,280,640 48,311 1,232,329 1,261,182 47,494 1,213,688 + 19,458
2009 1,210,005 54,396 1,155,609 1,206,550 49,005 1,157,545 + 3,455
20102 1,312,700 57,576 1,255,124 1,317,581 63,549 1,254,032 - 4,881
20102 1st Qr 350,246 33,175 317,071 379,111 39,887 339,224 - 28,865
2nd Qr 268,749 4,521 264,228 277,712 5,355 272,357 - 8,963
3rd Qr 303,258 4,923 298,335 299,216 4,885 294,331 + 4,042
4th Qr 390,447 14,957 375,490 361,542 13,422 348,120 + 28,905
1 As from January 1994, data on passenger traffic are being compiled from all embarkation and disembarkation cards.
Prior to this period, they were based on a 10% sample of such cards. They include:(a) emigrants to and immigrants from the dependencies; and
(b)
2 Provisional
movement of military personnel as from the 1962 Population Census but excludes thosetransit passengers who did not leave the airport.
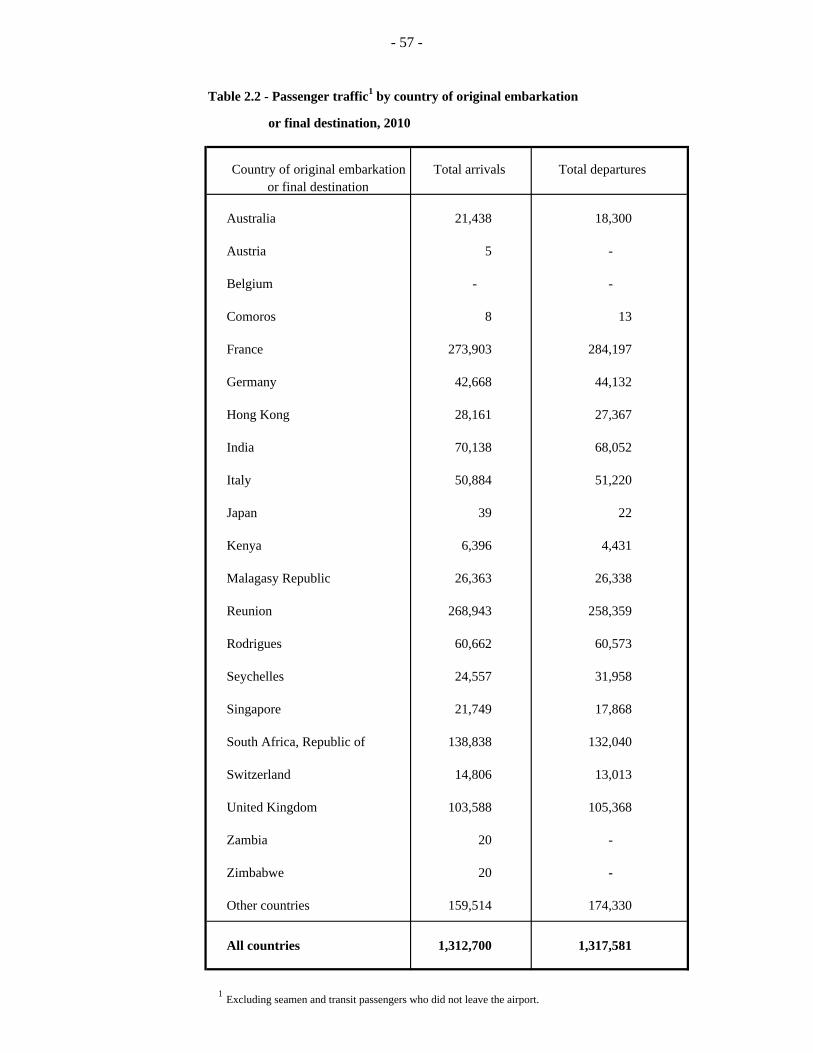
- 57 -
Table 2.2 - Passenger traffic1 by country of original embarkation
or final destination, 2010
Country of original embarkation Total arrivals Total departures or final destination
Australia 21,438 18,300
Austria 5 -
Belgium - -
Comoros 8 13
France 273,903 284,197
Germany 42,668 44,132
Hong Kong 28,161 27,367
India 70,138 68,052
Italy 50,884 51,220
Japan 39 22
Kenya 6,396 4,431
Malagasy Republic 26,363 26,338
Reunion 268,943 258,359
Rodrigues 60,662 60,573
Seychelles 24,557 31,958
Singapore 21,749 17,868
South Africa, Republic of 138,838 132,040
Switzerland 14,806 13,013
United Kingdom 103,588 105,368
Zambia 20 -
Zimbabwe 20 -
Other countries 159,514 174,330
All countries 1,312,700 1,317,581
1 Excluding seamen and transit passengers who did not leave the airport.
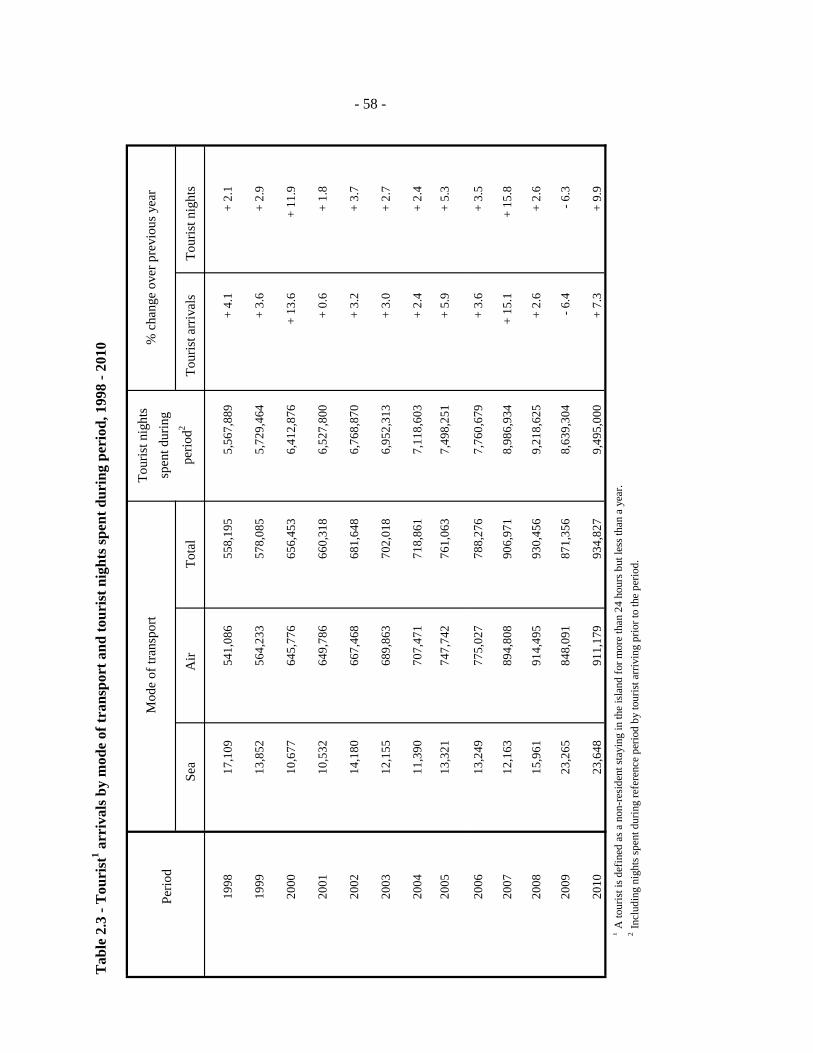
Tab
le 2
.3 -
Tou
rist
1 arr
ival
s by
mod
e of
tran
spor
t and
tour
ist n
ight
s spe
nt d
urin
g pe
riod
, 199
8 - 2
010
Tour
ist n
ight
s
Perio
dsp
ent d
urin
g
Se
a A
irTo
tal
perio
d2To
uris
t arr
ival
sTo
uris
t nig
hts
1998
17,1
09
54
1,08
6
55
8,19
5
5,
567,
889
+
4.1
+
2.1
1999
13,8
52
56
4,23
3
57
8,08
5
5,
729,
464
+
3.6
+
2.9
2000
10,6
77
64
5,77
6
65
6,45
3
6,
412,
876
+
13.6
+
11.9
2001
10,5
32
64
9,78
6
66
0,31
8
6,
527,
800
+
0.6
+
1.8
2002
14,1
80
66
7,46
8
68
1,64
8
6,
768,
870
+
3.2
+
3.7
2003
12,1
55
68
9,86
3
70
2,01
8
6,
952,
313
+
3.0
+
2.7
2004
11,3
90
70
7,47
1
71
8,86
1
7,
118,
603
+
2.4
+
2.4
2005
13,3
21
74
7,74
2
76
1,06
3
7,
498,
251
+
5.9
+
5.3
Mod
e of
tran
spor
t%
cha
nge
over
pre
viou
s yea
r
- 58 -
2006
13,2
49
77
5,02
7
78
8,27
6
7,
760,
679
+
3.6
+
3.5
2007
12,1
63
89
4,80
8
90
6,97
1
8,
986,
934
+
15.1
+
15.8
2008
15,9
61
91
4,49
5
93
0,45
6
9,
218,
625
+
2.6
+
2.6
2009
23,2
65
84
8,09
1
87
1,35
6
8,
639,
304
- 6
.4
- 6.3
2010
23,6
48
91
1,17
9
93
4,82
7
9,
495,
000
+
7.3
+
9.9
1
A to
uris
t is d
efin
ed a
s a n
on-r
esid
ent s
tayi
ng in
the
isla
nd fo
r mor
e th
an 2
4 ho
urs b
ut le
ss th
an a
yea
r.2
Incl
udin
g ni
ghts
spen
t dur
ing
refe
renc
e pe
riod
by to
uris
t arr
ivin
g pr
ior t
o th
e pe
riod.
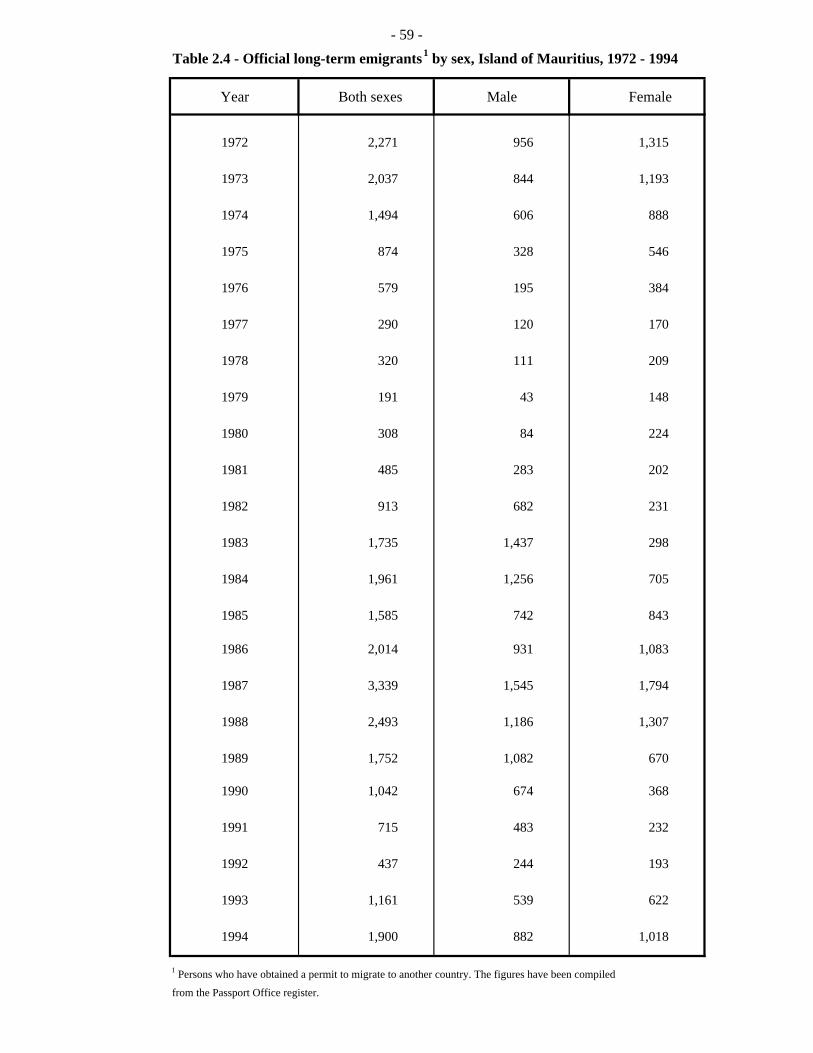
- 59 -Table 2.4 - Official long-term emigrants1 by sex, Island of Mauritius, 1972 - 1994
Year Both sexes Male Female
1972 2,271 956 1,315
1973 2,037 844 1,193
1974 1,494 606 888
1975 874 328 546
1976 579 195 384
1977 290 120 170
1978 320 111 209
1979 191 43 148
1980 308 84 224
1981 485 283 202
1982 913 682 231
1983 1,735 1,437 298
1984 1,961 1,256 705
1985 1,585 742 843
1986 2,014 931 1,083
1987 3,339 1,545 1,794
1988 2,493 1,186 1,307
1989 1,752 1,082 670
1990 1,042 674 368
1991 715 483 232
1992 437 244 193
1993 1,161 539 622
1994 1,900 882 1,018
1 Persons who have obtained a permit to migrate to another country. The figures have been compiled
from the Passport Office register.
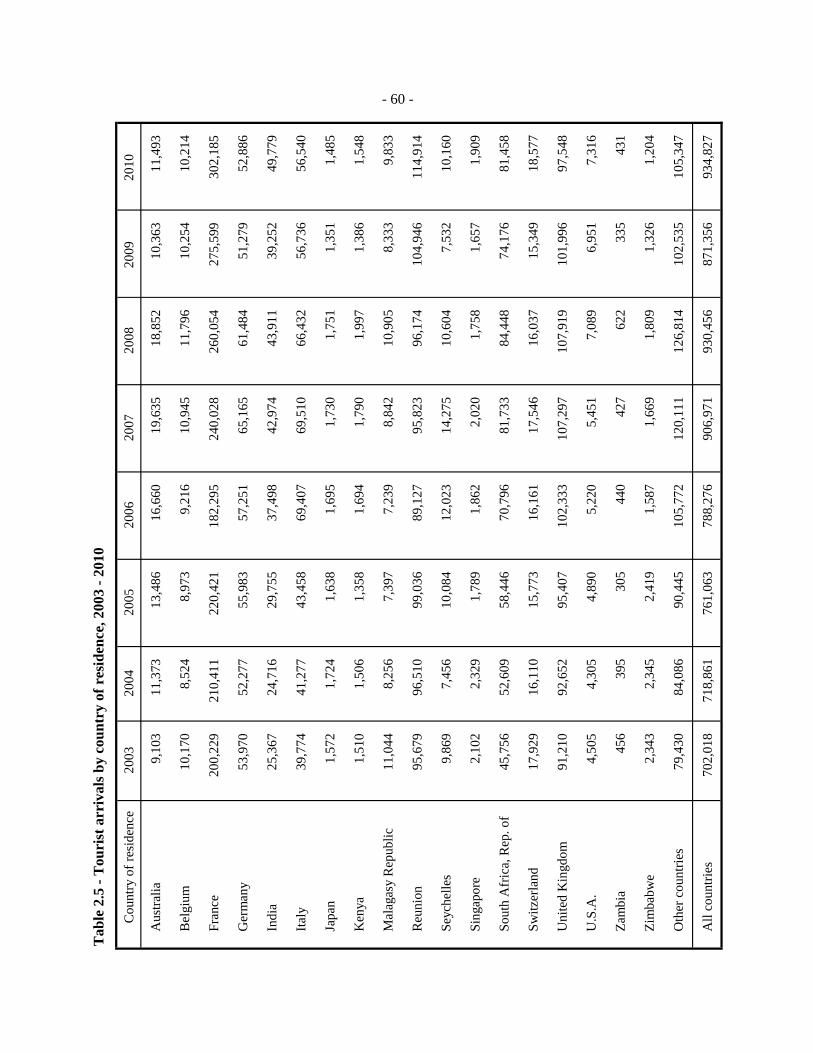
Tab
le 2
.5 -
Tou
rist
arr
ival
s by
coun
try
of r
esid
ence
, 200
3 - 2
010
Cou
ntry
of r
esid
ence
2003
2004
2005
2006
2007
2008
2009
20
10
Aus
tralia
9,10
3
11,3
73
13,4
86
16,6
60
19,6
35
18,8
52
10,3
63
11,4
93
Bel
gium
10,1
70
8,52
4
8,97
3
9,21
6
10,9
45
11,7
96
10,2
54
10,2
14
Fran
ce20
0,22
9
210,
411
22
0,42
1
182,
295
24
0,02
8
260,
054
27
5,59
9
302,
185
Ger
man
y53
,970
52
,277
55
,983
57
,251
65
,165
61
,484
51
,279
52
,886
Indi
a25
,367
24
,716
29
,755
37
,498
42
,974
43
,911
39
,252
49
,779
Italy
39,7
74
41,2
77
43,4
58
69,4
07
69,5
10
66,4
32
56,7
36
56,5
40
Japa
n1,
572
1,
724
1,
638
1,
695
1,
730
1,
751
1,
351
1,
485
Ken
ya1,
510
1,
506
1,
358
1,
694
1,
790
1,
997
1,
386
1,
548
Mal
agas
y R
epub
lic11
,044
8,
256
7,
397
7,
239
8,
842
10
,905
8,
333
9,
833
Reu
nion
95,6
79
96,5
10
99,0
36
89,1
27
95,8
23
96,1
74
104,
946
11
4,91
4
Sh
ll9
869
745
610
084
1202
314
275
1060
47
532
1016
0
- 60 -
Seyc
helle
s9,
869
7,
456
10
,084
12
,023
14
,275
10
,604
7,
532
10
,160
Sing
apor
e2,
102
2,
329
1,
789
1,
862
2,
020
1,
758
1,
657
1,
909
Sout
h A
fric
a, R
ep. o
f45
,756
52
,609
58
,446
70
,796
81
,733
84
,448
74
,176
81
,458
Switz
erla
nd17
,929
16
,110
15
,773
16
,161
17
,546
16
,037
15
,349
18
,577
Uni
ted
Kin
gdom
91,2
10
92,6
52
95,4
07
102,
333
10
7,29
7
107,
919
10
1,99
6
97,5
48
U.S
.A.
4,50
5
4,30
5
4,89
0
5,22
0
5,45
1
7,08
9
6,95
1
7,31
6
Zam
bia
456
39
5
305
44
0
427
62
2
335
43
1
Zim
babw
e2,
343
2,
345
2,
419
1,
587
1,
669
1,
809
1,
326
1,
204
Oth
er c
ount
ries
79,4
30
84,0
86
90,4
45
105,
772
12
0,11
1
126,
814
10
2,53
5
105,
347
All
coun
tries
702,
018
71
8,86
1
761,
063
78
8,27
6
906,
971
93
0,45
6
871,
356
93
4,82
7
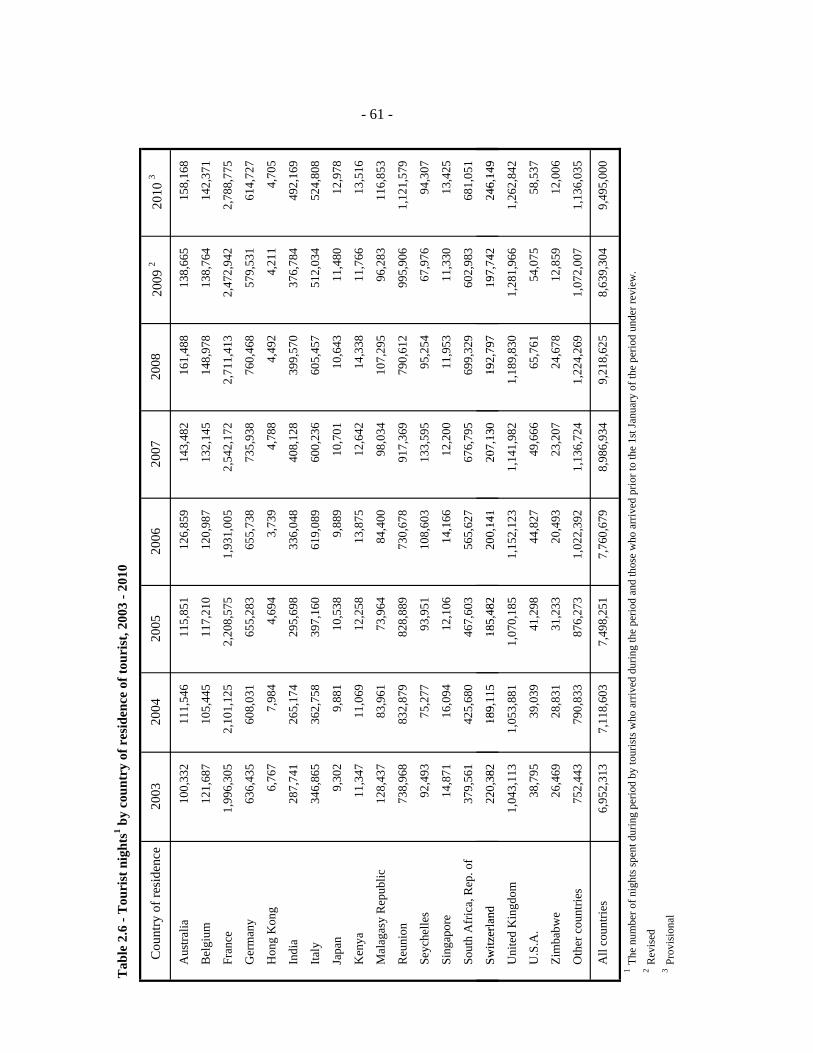
Tab
le 2
.6 -
Tou
rist
nig
hts1 b
y co
untr
y of
res
iden
ce o
f tou
rist
, 200
3 - 2
010
Cou
ntry
of r
esid
ence
2003
2004
2005
2006
2007
2008
2009
220
10 3
Aus
tralia
100,
332
11
1,54
6
115,
851
12
6,85
9
143,
482
16
1,48
8
138,
665
15
8,16
8
Bel
gium
121,
687
10
5,44
5
117,
210
12
0,98
7
132,
145
14
8,97
8
138,
764
14
2,37
1
Fran
ce1,
996,
305
2,
101,
125
2,
208,
575
1,
931,
005
2,
542,
172
2,
711,
413
2,
472,
942
2,
788,
775
Ger
man
y63
6,43
5
608,
031
65
5,28
3
655,
738
73
5,93
8
760,
468
57
9,53
1
614,
727
Hon
g K
ong
6,76
7
7,98
4
4,69
4
3,73
9
4,78
8
4,49
2
4,21
1
4,70
5
Indi
a28
7,74
1
265,
174
29
5,69
8
336,
048
40
8,12
8
399,
570
37
6,78
4
492,
169
Italy
346,
865
36
2,75
8
397,
160
61
9,08
9
600,
236
60
5,45
7
512,
034
52
4,80
8
Japa
n9,
302
9,
881
10
,538
9,
889
10
,701
10
,643
11
,480
12
,978
Ken
ya11
,347
11
,069
12
,258
13
,875
12
,642
14
,338
11
,766
13
,516
Mal
agas
y R
epub
lic12
8,43
7
83,9
61
73,9
64
84,4
00
98,0
34
107,
295
96
,283
11
6,85
3
Reu
nion
738,
968
83
2,87
9
828,
889
73
0,67
8
917,
369
79
0,61
2
995,
906
1,
121,
579
Seyc
helle
s92
,493
75
,277
93
,951
10
8,60
3
133,
595
95
,254
67
,976
94
,307
Sing
apor
e14
,871
16
,094
12
,106
14
,166
12
,200
11
,953
11
,330
13
,425
Sout
h A
fric
a, R
ep. o
f37
9,56
1
425,
680
46
7,60
3
565,
627
67
6,79
5
699,
329
60
2,98
3
681,
051
Switz
erla
nd22
038
218
911
518
548
220
014
120
713
019
279
719
774
224
614
9
- 61 -
Switz
erla
nd22
0,38
2
189,
115
18
5,48
2
200,
141
20
7,13
0
192,
797
19
7,74
2
246,
149
Uni
ted
Kin
gdom
1,04
3,11
3
1,05
3,88
1
1,07
0,18
5
1,15
2,12
3
1,14
1,98
2
1,18
9,83
0
1,28
1,96
6
1,26
2,84
2
U.S
.A.
38,7
95
39,0
39
41,2
98
44,8
27
49,6
66
65,7
61
54,0
75
58,5
37
Zim
babw
e26
,469
28
,831
31
,233
20
,493
23
,207
24
,678
12
,859
12
,006
Oth
er c
ount
ries
752,
443
79
0,83
3
876,
273
1,
022,
392
1,
136,
724
1,
224,
269
1,
072,
007
1,
136,
035
All
coun
tries
6,95
2,31
3
7,11
8,60
3
7,49
8,25
1
7,76
0,67
9
8,98
6,93
4
9,21
8,62
5
8,63
9,30
4
9,49
5,00
0
1Th
e nu
mbe
r of n
ight
s spe
nt d
urin
g pe
riod
by to
uris
ts w
ho a
rriv
ed d
urin
g th
e pe
riod
and
thos
e w
ho a
rriv
ed p
rior t
o th
e 1s
t Jan
uary
of t
he p
erio
d un
der r
evie
w.
2R
evis
ed3
Prov
isio
nal
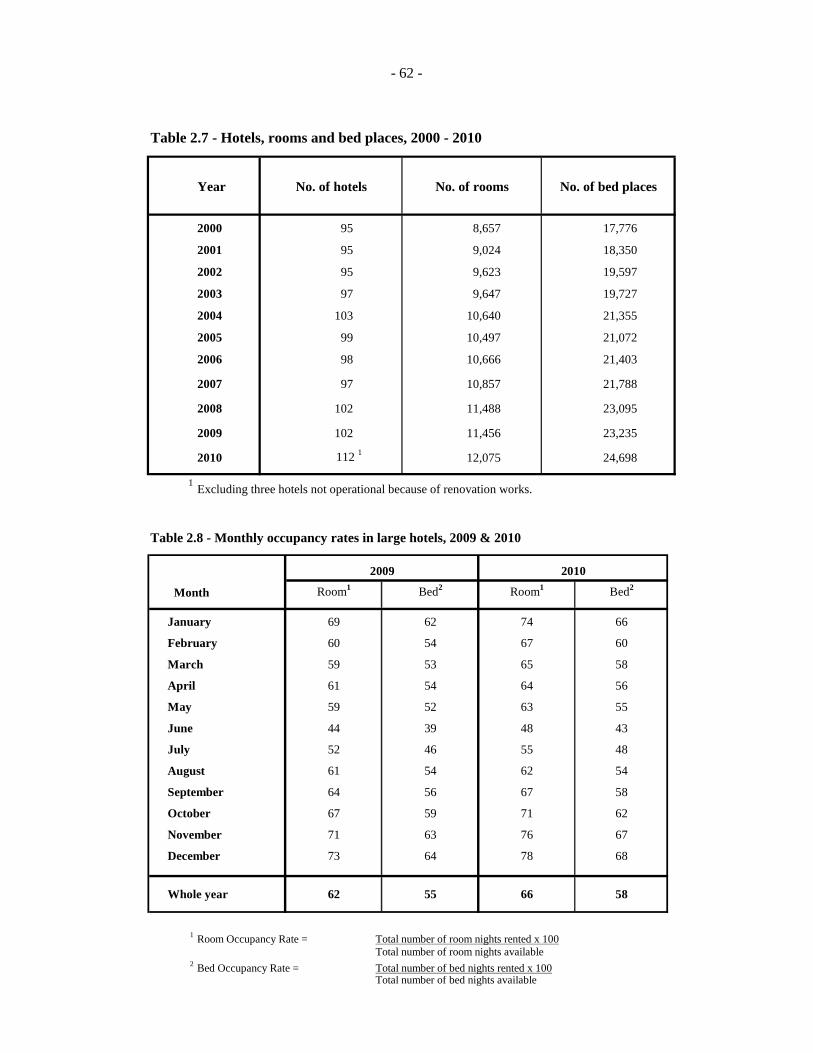
- 62 -
Table 2.7 - Hotels, rooms and bed places, 2000 - 2010
Year No. of hotels No. of rooms
2000 95 8,657 17,776
2001 95 9,024 18,350
2002 95 9,623 19,597
2003 97 9,647 19,727
2004 103
10,640 21,355
2005 99 10,497 21,072
2006 98 10,666 21,403
2007 97 10,857 21,788
2008 102 11,488 23,095
2009 102 11,456 23,235
2010 112 1 12,075 24,698
1 Excluding three hotels not operational because of renovation works.
Table 2.8 - Monthly occupancy rates in large hotels, 2009 & 2010
No. of bed places
2009 2010
1 Room Occupancy Rate = Total number of room nights rented x 100Total number of room nights available
2 Bed Occupancy Rate = Total number of bed nights rented x 100Total number of bed nights available
Month Room1 Bed2 Room1 Bed2
January 69 62 74 66
February 60 54 67 60
March 59 53 65 58
April 61 54 64 56
May 59 52 63 55
June 44 39 48 43
July 52 46 55 48
August 61 54 62 54
September 64 56 67 58
October 67 59 71 62
November 71 63 76 67
December 73 64 78 68
Whole year 62 55 66 58
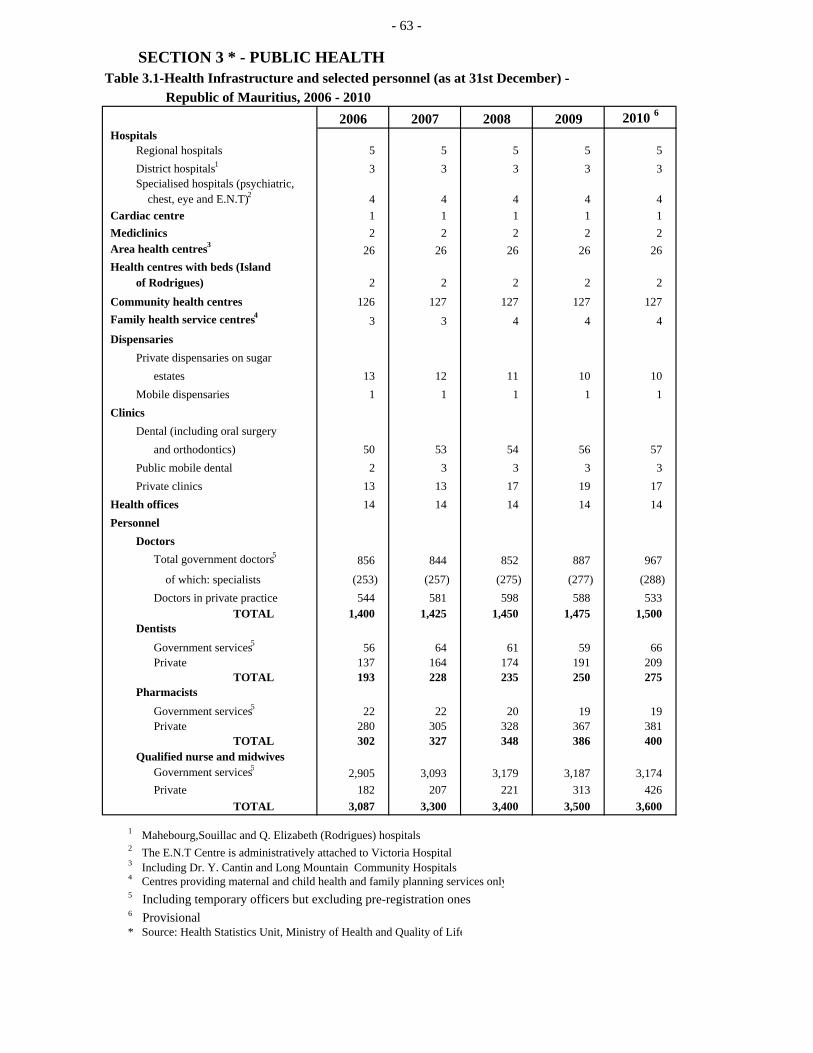
- 63 -
SECTION 3 * - PUBLIC HEALTHTable 3.1-Health Infrastructure and selected personnel (as at 31st December) -
Republic of Mauritius, 2006 - 20102006 2007 2008 2009 2010 6
HospitalsRegional hospitals 5 5 5 5 5 District hospitals1 3 3 3 3 3 Specialised hospitals (psychiatric, chest, eye and E.N.T)2 4 4 4 4 4
Cardiac centre 1 1 1 1 1 Mediclinics 2 2 2 2 2 Area health centres3 26 26 26 26 26 Health centres with beds (Island
of Rodrigues) 2 2 2 2 2
Community health centres 126 127 127 127 127 Family health service centres4 3 3 4 4 4 Dispensaries
Private dispensaries on sugarestates 13 12 11 10 10
Mobile dispensaries 1 1 1 1 1 Clinics
Dental (including oral surgeryand orthodontics) 50 53 54 56 57
Public mobile dental 2 3 3 3 3 Private clinics 13 13 17 19 17
Health offices 14 14 14 14 14 Personnel
DoctorsTotal government doctors5 856 844 852 887 967
of which: specialists (253) (257) (275) (277) (288) Doctors in private practice 544 581 598 588 533
TOTAL 1,400 1,425 1,450 1,475 1,500 Dentists
Government services5 56 64 61 59 66 Private 137 164 174 191 209
TOTAL 193 228 235 250 275 Pharmacists
Government services5 22 22 20 19 19 Private 280 305 328 367 381
TOTAL 302 327 348 386 400 Qualified nurse and midwives
Government services5 2,905 3,093 3,179 3,187 3,174 Private 182 207 221 313 426
TOTAL 3,087 3,300 3,400 3,500 3,600
1 Mahebourg,Souillac and Q. Elizabeth (Rodrigues) hospitals2 The E.N.T Centre is administratively attached to Victoria Hospital3 Including Dr. Y. Cantin and Long Mountain Community Hospitals4 Centres providing maternal and child health and family planning services only5 Including temporary officers but excluding pre-registration ones6 Provisional
* Source: Health Statistics Unit, Ministry of Health and Quality of Life
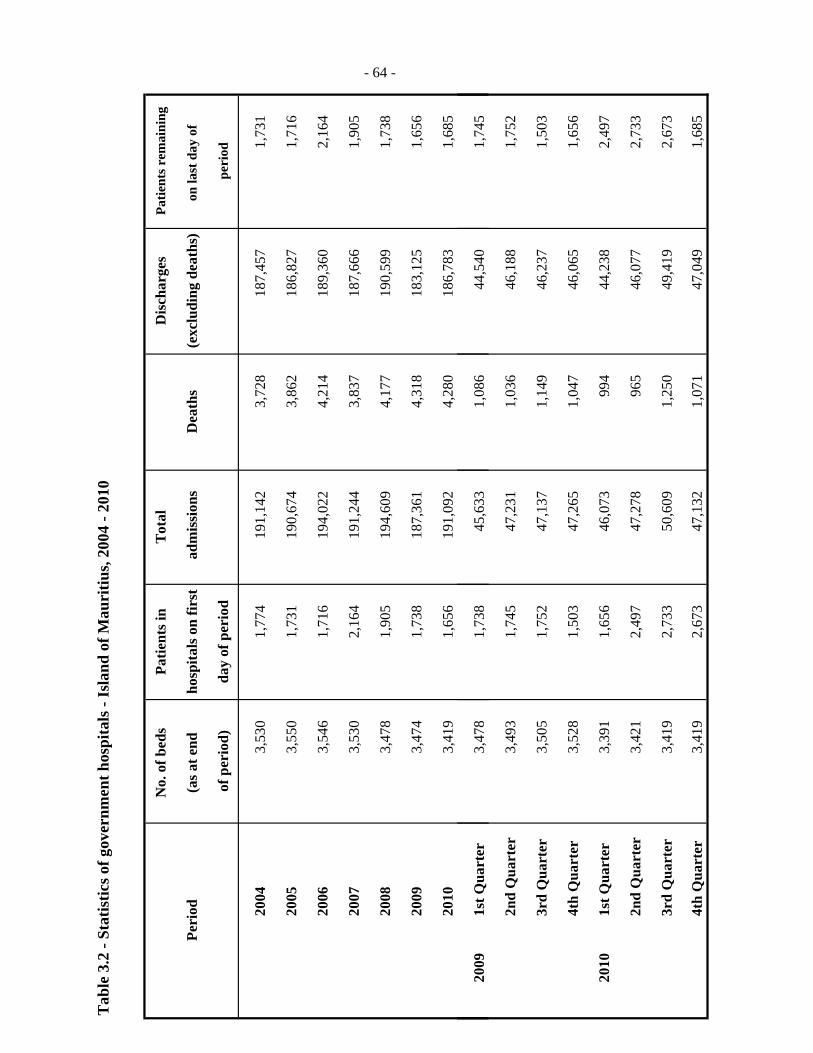
Tab
le 3
.2 -
Stat
istic
s of g
over
nmen
t hos
pita
ls -
Isla
nd o
f Mau
ritiu
s, 20
04 -
2010
No.
of b
eds
Patie
nts i
nT
otal
Dis
char
ges
Patie
nts r
emai
ning
Peri
od(a
s at e
nd
hosp
itals
on
first
adm
issi
ons
Dea
ths
(exc
ludi
ng d
eath
s)on
last
day
of
of
per
iod)
day
of p
erio
d
peri
od
2004
3,53
0
1,
774
191,
142
3,72
8
18
7,45
7
1,
731
2005
3,55
0
1,
731
190,
674
3,86
2
18
6,82
7
1,
716
2006
3,54
6
1,
716
194,
022
4,21
4
18
9,36
0
2,
164
2007
3,53
0
2,
164
191,
244
3,83
7
18
7,66
6
1,
905
2008
3,47
8
1,
905
194,
609
4,17
7
19
0,59
9
1,
738
2009
3,47
4
1,
738
187,
361
4,31
8
18
3,12
5
1,
656
2010
3,41
9
1,
656
191,
092
4,28
0
18
6,78
3
1,
685
- 65 -- 65 - - 65 -- 64 -
2009
1st Q
uart
er3,
478
1,73
8
45
,633
1,08
6
44
,540
1,74
5
2nd
Qua
rter
3,49
3
1,
745
47,2
31
1,
036
46,1
88
1,
752
3rd
Qua
rter
3,50
5
1,
752
47,1
37
1,
149
46,2
37
1,
503
4th
Qua
rter
3,52
8
1,
503
47,2
65
1,
047
46,0
65
1,
656
2010
1st Q
uart
er3,
391
1,65
6
46
,073
994
44,2
38
2,
497
2nd
Qua
rter
3,42
1
2,
497
47,2
78
96
5
46
,077
2,73
3
3rd
Qua
rter
3,41
9
2,
733
50,6
09
1,
250
49,4
19
2,
673
4th
Qua
rter
3,41
9
2,
673
47,1
32
1,
071
47,0
49
1,
685
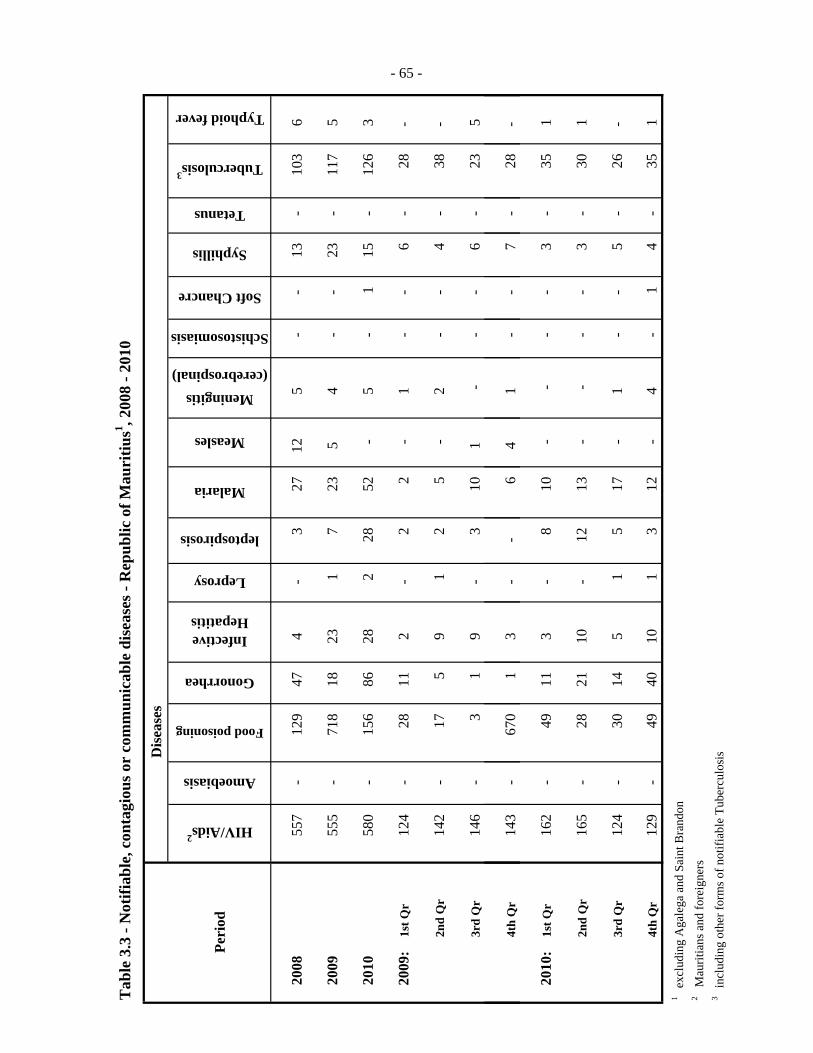
Tab
le 3
.3 -
Not
ifiab
le, c
onta
giou
s or
com
mun
icab
le d
isea
ses -
Rep
ublic
of M
auri
tius1 , 2
008
- 201
0
Dis
ease
s
Peri
odHIV/Aids
2
Amoebiasis
Food poisoning
Gonorrhea
Infective Hepatitis
Leprosy
leptospirosis
Malaria
Measles
Meningitis(cerebrospinal)
Schistosomiasis
Soft Chancre
Syphillis
Tetanus
Tuberculosis3
Typhoid fever
2008
557
-
129
47
4
-3
27
12
-
-
13
-
10
3
6
2009
555
-
718
18
23
1
7
23
5
-
-
23
-
117
5
2010
580
-
156
86
28
2
28
52
--
1
15
-
12
6
3
2
009:
1st Q
r12
4
-28
11
2
-2
2
-
-
-
6
-
28
-
2nd
Qr
142
-
17
5
91
2
5
-
-
-
4
-
38
-
3rd
Qr
146
-
3
1
9-
3
10
1
-
-
6
-
23
5
-5
4
5
1
2
- 65 -- 65 -- 65 -- 65 -
4th
Qr
143
-
670
1
3
--
6
4
-
-
7
-
28
-
2
010:
1st Q
r16
2
-49
11
3
-8
10
-
-
-
3
-
35
1
2nd
Qr
165
-
28
21
10-
12
13
--
-
3
-
30
1
3rd
Qr
124
-
30
14
51
5
17
-
-
-
5
-
26
-
4th
Qr
129
-
49
40
101
3
12
-
-
1
4
-
35
1
1 e
xclu
ding
Aga
lega
and
Sai
nt B
rand
on2
Mau
ritia
ns a
nd fo
reig
ners
3
incl
udin
g ot
her f
orm
s of n
otifi
able
Tub
ercu
losi
s
1
4 - -1

‐66‐
SECTION 4 - PUBLIC FINANCE
Tables on Government Finance Statistics published in this report have been compiled according to the Government Finance Statistics Manual 2001(GFSM 2001) of the International Monetary Fund (IMF). The tables relate to Budgetary Central Government comprising all ministries and their departments. Additional tables on General Government comprising of Consolidated Central Government (Budgetary Central Government, Extra Budgetary Units and the National Pensions Fund), Local Government and Rodrigues Regional Assembly are available in The Digest of Public Finance Statistics. Data sets up to 2007/08, compiled according to the concepts and definitions as set down in the previous manual of the IMF, GFSM1986, are available in past issues of the Annual Digest of Statistics and The Digest of Public Finance Statistics as well as on the web site of the CSO at http://statsmauritius.gov.mu. Budgetary Central Government Expense and Acquisition of Non Financial Assets includes all
expenditure incurred (recurrent and capital) by ministries and their departments to provide
goods and services to the community.
The economic classification (Table 4.3) identifies the different types of expenditure incurred, that
is, wages and salaries, use of goods and services, social benefits, grants, etc., to provide the
goods and services to the community. The classification by function (Table 4.4) shows total
outlay (recurrent and capital expenditure) incurred in different areas: health, education, social
protection, etc.
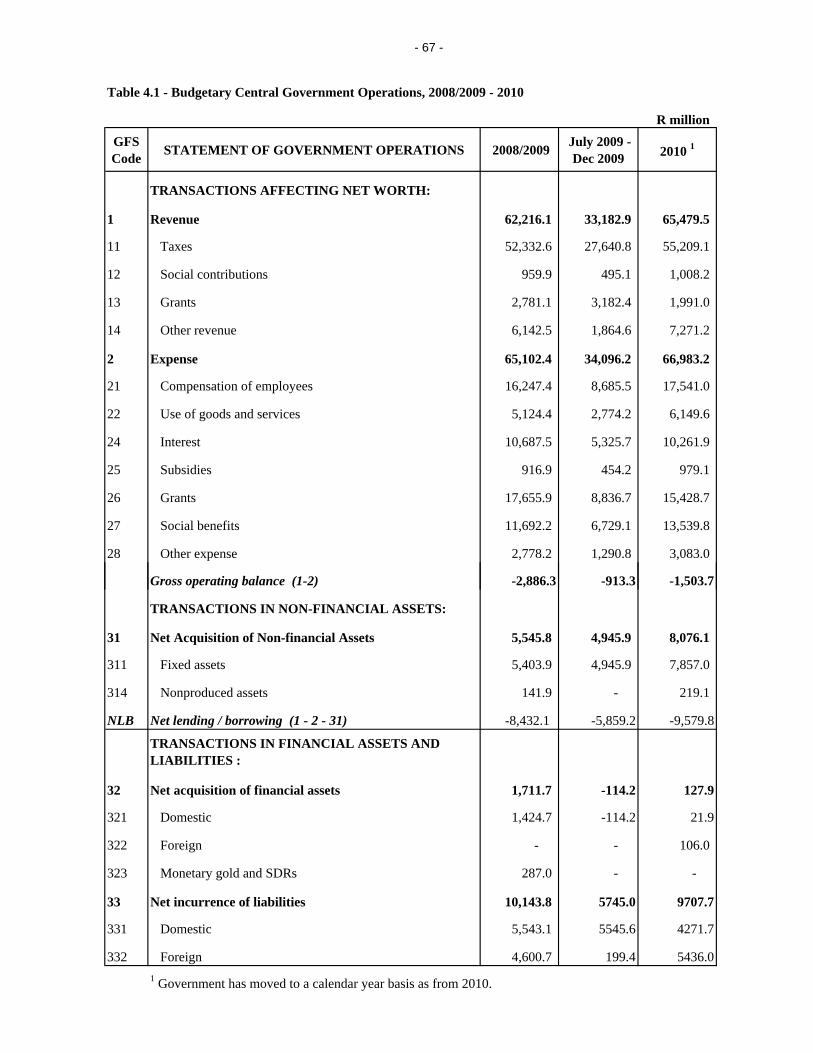
- 67 -
R millionGFS Code STATEMENT OF GOVERNMENT OPERATIONS 2008/2009 July 2009 -
Dec 2009 2010 1
TRANSACTIONS AFFECTING NET WORTH:
1 Revenue 62,216.1 33,182.9 65,479.5
11 Taxes 52,332.6 27,640.8 55,209.1
12 Social contributions 959.9 495.1 1,008.2
13 Grants 2,781.1 3,182.4 1,991.0
14 Other revenue 6,142.5 1,864.6 7,271.2
2 Expense 65,102.4 34,096.2 66,983.2
21 Compensation of employees 16,247.4 8,685.5 17,541.0
22 Use of goods and services 5,124.4 2,774.2 6,149.6
24 Interest 10,687.5 5,325.7 10,261.9
25 Subsidies 916.9 454.2 979.1
26 Grants 17,655.9 8,836.7 15,428.7
27 Social benefits 11,692.2 6,729.1 13,539.8
28 Other expense 2,778.2 1,290.8 3,083.0
Table 4.1 - Budgetary Central Government Operations, 2008/2009 - 2010
Gross operating balance (1-2) -2,886.3 -913.3 -1,503.7
TRANSACTIONS IN NON-FINANCIAL ASSETS:
31 Net Acquisition of Non-financial Assets 5,545.8 4,945.9 8,076.1
311 Fixed assets 5,403.9 4,945.9 7,857.0
314 Nonproduced assets 141.9 - 219.1
NLB Net lending / borrowing (1 - 2 - 31) -8,432.1 -5,859.2 -9,579.8
TRANSACTIONS IN FINANCIAL ASSETS AND LIABILITIES :
32 Net acquisition of financial assets 1,711.7 -114.2 127.9
321 Domestic 1,424.7 -114.2 21.9
322 Foreign - - 106.0
323 Monetary gold and SDRs 287.0 - -
33 Net incurrence of liabilities 10,143.8 5745.0 9707.7
331 Domestic 5,543.1 5545.6 4271.7
332 Foreign 4,600.7 199.4 5436.01 Government has moved to a calendar year basis as from 2010.
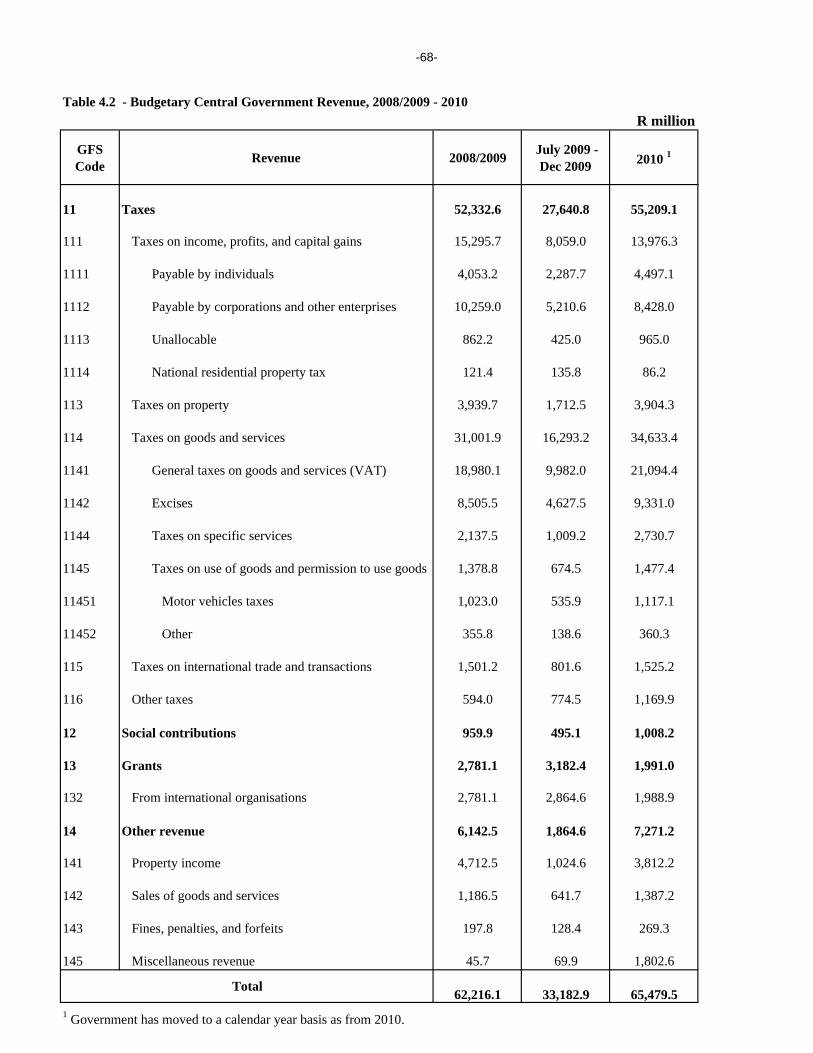
-68-
Table 4.2 - Budgetary Central Government Revenue, 2008/2009 - 2010R million
GFS Code Revenue 2008/2009 July 2009 -
Dec 2009 2010 1
11 Taxes 52,332.6 27,640.8 55,209.1
111 Taxes on income, profits, and capital gains 15,295.7 8,059.0 13,976.3
1111 Payable by individuals 4,053.2 2,287.7 4,497.1
1112 Payable by corporations and other enterprises 10,259.0 5,210.6 8,428.0
1113 Unallocable 862.2 425.0 965.0
1114 National residential property tax 121.4 135.8 86.2
113 Taxes on property 3,939.7 1,712.5 3,904.3
114 Taxes on goods and services 31,001.9 16,293.2 34,633.4
1141 General taxes on goods and services (VAT) 18,980.1 9,982.0 21,094.4
1142 Excises 8,505.5 4,627.5 9,331.0
1144 Taxes on specific services 2,137.5 1,009.2 2,730.7
1145 Taxes on use of goods and permission to use goods 1,378.8 674.5 1,477.4
11451 Motor vehicles taxes 1,023.0 535.9 1,117.1
11452 Other 355.8 138.6 360.3
115 Taxes on international trade and transactions 1,501.2 801.6 1,525.2
116 Other taxes 594.0 774.5 1,169.9
12 Social contributions 959.9 495.1 1,008.2
13 Grants 2,781.1 3,182.4 1,991.0
132 From international organisations 2,781.1 2,864.6 1,988.9
14 Other revenue 6,142.5 1,864.6 7,271.2
141 Property income 4,712.5 1,024.6 3,812.2
142 Sales of goods and services 1,186.5 641.7 1,387.2
143 Fines, penalties, and forfeits 197.8 128.4 269.3
145 Miscellaneous revenue 45.7 69.9 1,802.6
62,216.1 33,182.9 65,479.51 Government has moved to a calendar year basis as from 2010.
Total
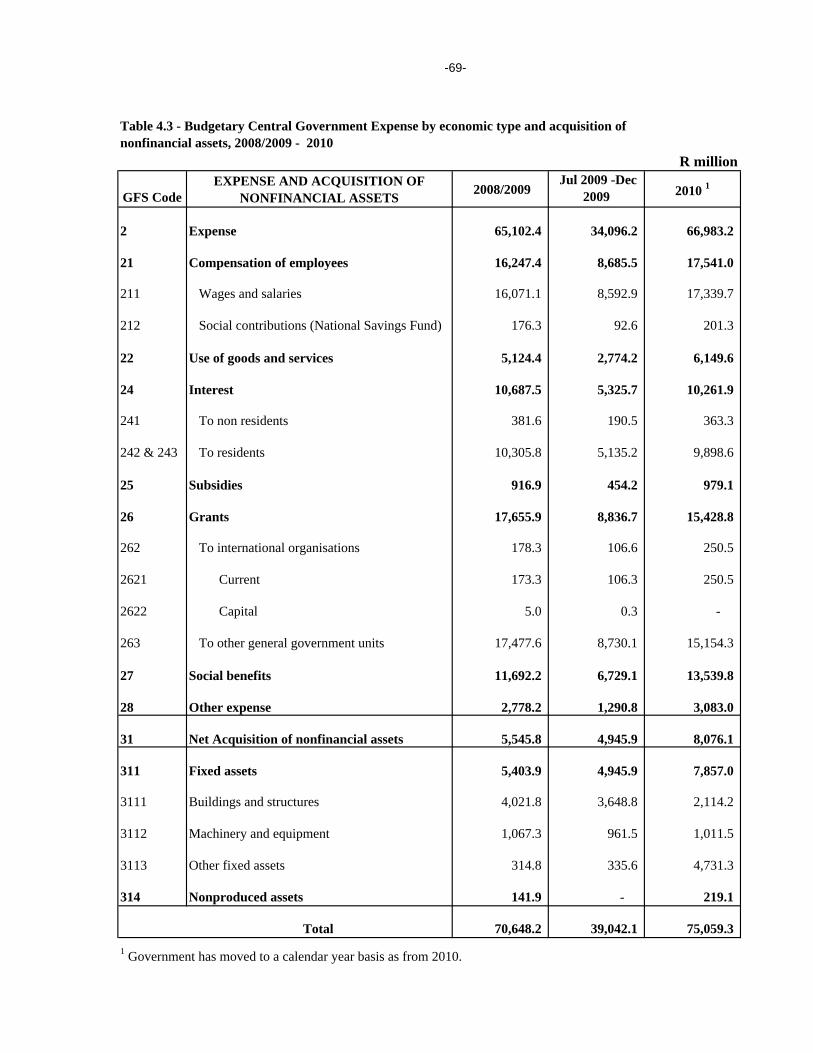
-69-
R million
GFS CodeEXPENSE AND ACQUISITION OF
NONFINANCIAL ASSETS 2008/2009 Jul 2009 -Dec
2009 2010 1
2 Expense 65,102.4 34,096.2 66,983.2
21 Compensation of employees 16,247.4 8,685.5 17,541.0
211 Wages and salaries 16,071.1 8,592.9 17,339.7
212 Social contributions (National Savings Fund) 176.3 92.6 201.3
22 Use of goods and services 5,124.4 2,774.2 6,149.6
24 Interest 10,687.5 5,325.7 10,261.9
241 To non residents 381.6 190.5 363.3
242 & 243 To residents 10,305.8 5,135.2 9,898.6
25 Subsidies 916.9 454.2 979.1
26 Grants 17,655.9 8,836.7 15,428.8
262 To international organisations 178.3 106.6 250.5
2621 Current 173.3 106.3 250.5
2622 Capital 5.0 0.3 -
263 To other general government units 17,477.6 8,730.1 15,154.3
27 Social benefits 11,692.2 6,729.1 13,539.8
28 Other expense 2,778.2 1,290.8 3,083.0
31 Net Acquisition of nonfinancial assets 5,545.8 4,945.9 8,076.1
311 Fixed assets 5,403.9 4,945.9 7,857.0
3111 Buildings and structures 4,021.8 3,648.8 2,114.2
3112 Machinery and equipment 1,067.3 961.5 1,011.5
3113 Other fixed assets 314.8 335.6 4,731.3
314 Nonproduced assets 141.9 - 219.1
Total 70,648.2 39,042.1 75,059.3 1 Government has moved to a calendar year basis as from 2010.
Table 4.3 - Budgetary Central Government Expense by economic type and acquisition of nonfinancial assets, 2008/2009 - 2010
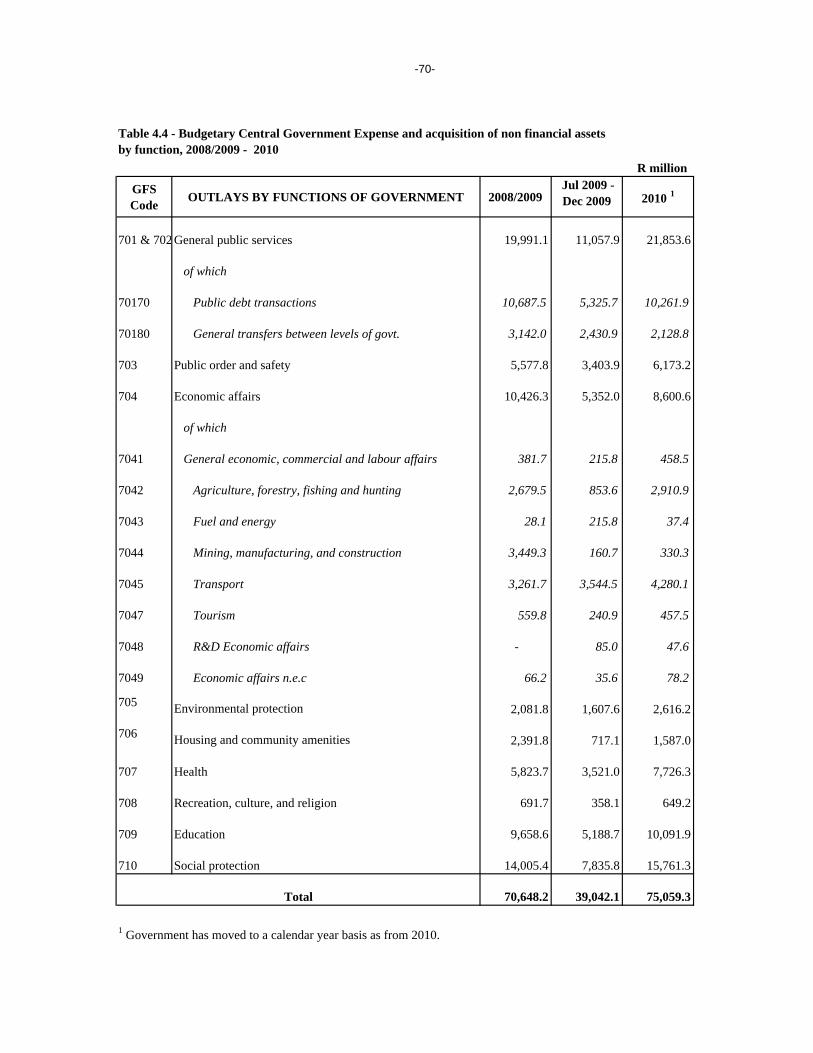
-70-
R million
GFS Code OUTLAYS BY FUNCTIONS OF GOVERNMENT 2008/2009
Jul 2009 -Dec 2009 2010 1
701 & 702 General public services 19,991.1 11,057.9 21,853.6
of which
70170 Public debt transactions 10,687.5 5,325.7 10,261.9
70180 General transfers between levels of govt. 3,142.0 2,430.9 2,128.8
703 Public order and safety 5,577.8 3,403.9 6,173.2
704 Economic affairs 10,426.3 5,352.0 8,600.6
of which
7041 General economic, commercial and labour affairs 381.7 215.8 458.5
7042 Agriculture, forestry, fishing and hunting 2,679.5 853.6 2,910.9
7043 Fuel and energy 28.1 215.8 37.4
7044 Mining, manufacturing, and construction 3,449.3 160.7 330.3
7045 Transport 3,261.7 3,544.5 4,280.1
7047 Tourism 559.8 240.9 457.5
7048 R&D Economic affairs - 85.0 47.6
7049 Economic affairs n.e.c 66.2 35.6 78.2
705 Environmental protection 2,081.8 1,607.6 2,616.2
706 Housing and community amenities 2,391.8 717.1 1,587.0
707 Health 5,823.7 3,521.0 7,726.3
708 Recreation, culture, and religion 691.7 358.1 649.2
709 Education 9,658.6 5,188.7 10,091.9
710 Social protection 14,005.4 7,835.8 15,761.3
70,648.2 39,042.1 75,059.3
1 Government has moved to a calendar year basis as from 2010.
Total
Table 4.4 - Budgetary Central Government Expense and acquisition of non financial assets by function, 2008/2009 - 2010
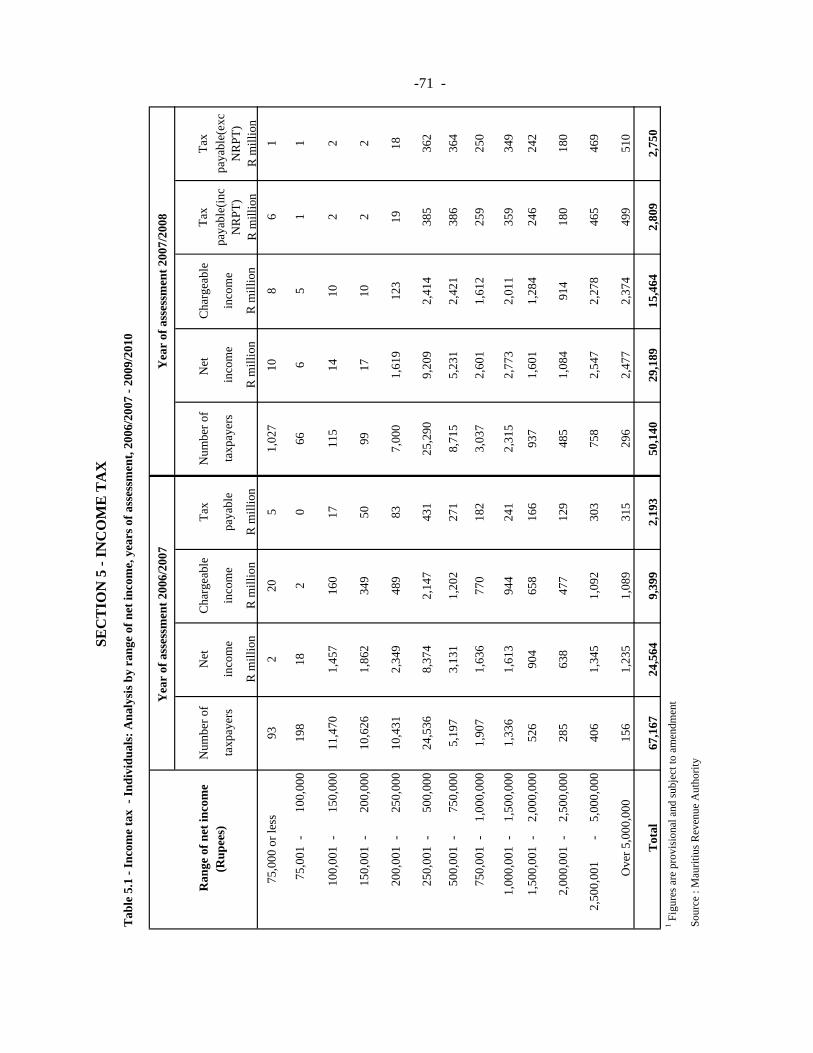
Tab
le 5
.1 -
Inco
me
tax
- In
divi
dual
s: A
naly
sis b
y ra
nge
of n
et in
com
e, y
ears
of a
sses
smen
t, 20
06/2
007
- 200
9/20
10
Yea
r of
ass
essm
ent 2
006/
2007
Y
ear
of a
sses
smen
t 200
7/20
08
Ran
ge o
f net
inco
me
Num
ber o
fN
etC
harg
eabl
eTa
xN
umbe
r of
Net
C
harg
eabl
eTa
xTa
x
taxp
ayer
sin
com
ein
com
epa
yabl
eta
xpay
ers
inco
me
inco
me
paya
ble(
inc
NR
PT)
paya
ble(
exc
NR
PT)
R m
illio
nR
mill
ion
R m
illio
nR
mill
ion
R m
illio
nR
mill
ion
R m
illio
n93
220
51,
027
108
61
75,0
01-
100,
000
198
182
066
65
11
100,
001
-15
0,00
011
,470
1,45
716
017
115
1410
22
150,
001
-20
0,00
010
,626
1,86
234
950
9917
102
2
200,
001
-25
0,00
010
,431
2,34
948
983
7,00
01,
619
123
1918
250,
001
-50
0,00
024
,536
8,37
42,
147
431
25,2
909,
209
2,41
438
536
2
500,
001
-75
0,00
05,
197
3,13
11,
202
271
8,71
55,
231
2,42
138
636
4
750,
001
-1,
000,
000
1,90
71,
636
770
182
3,03
72,
601
1,61
225
925
0
1,00
0,00
1-
1,50
0,00
01,
336
1,61
394
424
12,
315
2,77
32,
011
359
349
1,50
0,00
1-
2,00
0,00
052
690
465
816
693
71,
601
1,28
424
624
2
2,00
0,00
1-
2,50
0,00
028
563
847
712
948
51,
084
914
180
180
2,50
0,00
1-
5,00
0,00
040
61,
345
1,09
230
375
82,
547
2,27
846
546
9
Ove
r 5,0
00,0
0015
61,
235
1,08
931
529
62,
477
2,37
449
951
0
Tot
al67
,167
24,5
649,
399
2,19
350
,140
29,1
8915
,464
2,80
92,
750
1 Fig
ures
are
pro
visi
onal
and
subj
ect t
o am
endm
ent
Sour
ce :
Mau
ritiu
s Rev
enue
Aut
horit
y
SEC
TIO
N 5
- IN
CO
ME
TA
X-71 -
(Rup
ees)
75,0
00 o
r les
s
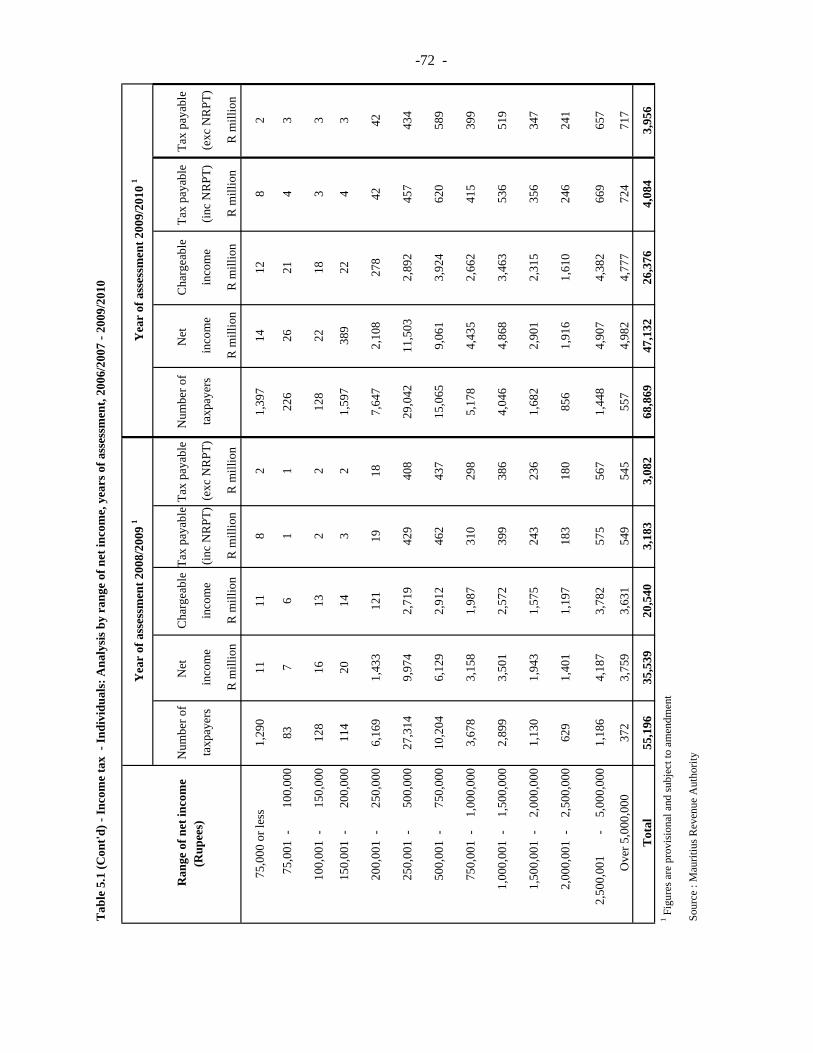
Tab
le 5
.1 (C
ont'd
) - In
com
e ta
x -
Indi
vidu
als:
Ana
lysi
s by
rang
e of
net
inco
me,
yea
rs o
f ass
essm
ent,
2006
/200
7 - 2
009/
2010
Yea
r of
ass
essm
ent 2
008/
2009
1Y
ear
of a
sses
smen
t 200
9/20
10 1
Ran
ge o
f net
inco
me
Num
ber o
fN
et
Cha
rgea
ble
Tax
paya
ble
Tax
paya
ble
Num
ber o
fN
et
Cha
rgea
ble
Tax
paya
ble
Tax
paya
ble
taxp
ayer
sin
com
ein
com
e(in
c N
RPT
)(e
xc N
RPT
)ta
xpay
ers
inco
me
inco
me
(inc
NR
PT)
(exc
NR
PT)
R m
illio
nR
mill
ion
R m
illio
nR
mill
ion
R m
illio
nR
mill
ion
R m
illio
nR
mill
ion
1,29
011
118
21,
397
1412
82
75,0
01-
100,
000
837
61
122
626
214
3
100,
001
-15
0,00
012
816
132
212
822
183
3
150,
001
-20
0,00
011
420
143
21,
597
389
224
3
200,
001
-25
0,00
06,
169
1,43
312
119
187,
647
2,10
827
842
42
250,
001
-50
0,00
027
,314
9,97
42,
719
429
408
29,0
4211
,503
2,89
245
743
4
500,
001
-75
0,00
010
,204
6,12
92,
912
462
437
15,0
659,
061
3,92
462
058
9
750,
001
-1,
000,
000
3,67
83,
158
1,98
731
029
85,
178
4,43
52,
662
415
399
1,00
0,00
1-
1,50
0,00
02,
899
3,50
12,
572
399
386
4,04
64,
868
3,46
353
651
9
1,50
0,00
1-
2,00
0,00
01,
130
1,94
31,
575
243
236
1,68
22,
901
2,31
535
634
7
2,00
0,00
1-
2,50
0,00
062
91,
401
1,19
718
318
085
61,
916
1,61
024
624
1
2,50
0,00
1-
5,00
0,00
01,
186
4,18
73,
782
575
567
1,44
84,
907
4,38
266
965
7
Ove
r 5,0
00,0
0037
23,
759
3,63
154
954
555
74,
982
4,77
772
471
7
Tot
al55
,196
35,5
3920
,540
3,18
33,
082
68,8
6947
,132
26,3
764,
084
3,95
61 F
igur
es a
re p
rovi
sion
al a
nd su
bjec
t to
amen
dmen
t
Sour
ce :
Mau
ritiu
s Rev
enue
Aut
horit
y
-72 -
(Rup
ees)
75,0
00 o
r les
s
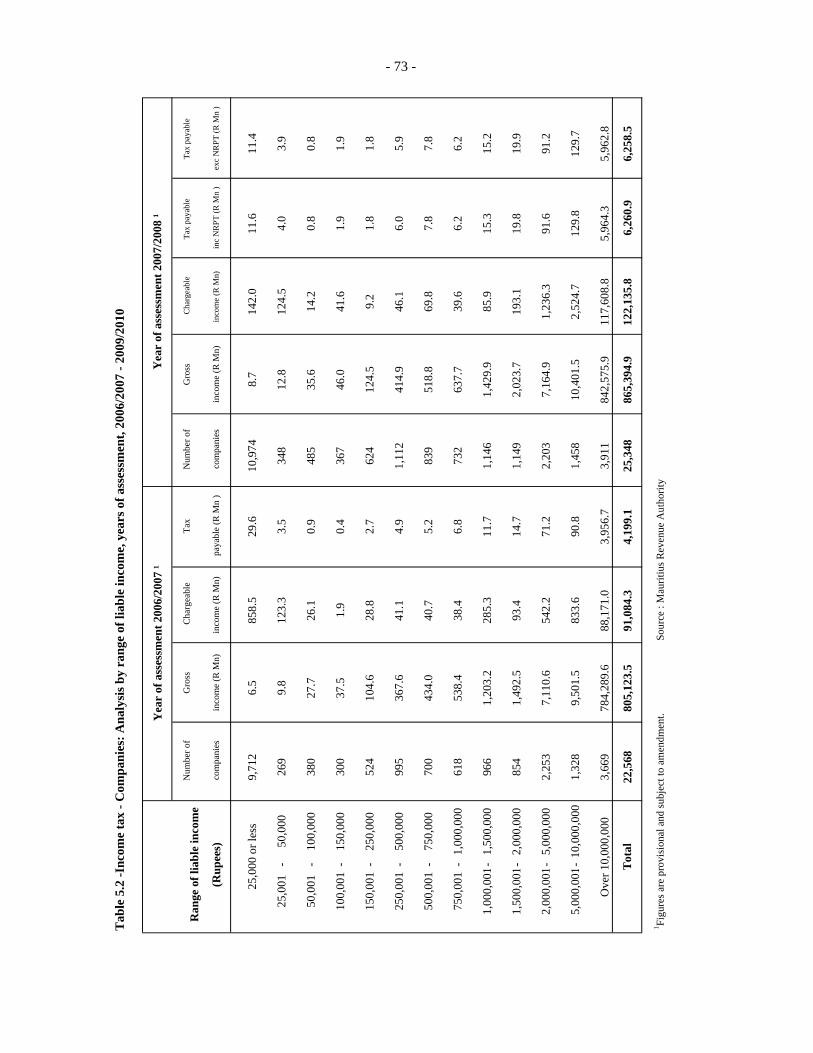
Tab
le 5
.2 -I
ncom
e ta
x - C
ompa
nies
: Ana
lysi
s by
rang
e of
liab
le in
com
e, y
ears
of a
sses
smen
t, 20
06/2
007
- 200
9/20
10
Yea
r of
ass
essm
ent 2
006/
2007
¹
Ran
ge o
f lia
ble
inco
me
Num
ber o
fG
ross
C
harg
eabl
eTa
xN
umbe
r of
Gro
ss
Cha
rgea
ble
Tax
paya
ble
Tax
paya
ble
(Rup
ees)
com
pani
esin
com
e (R
Mn)
in
com
e (R
Mn)
pa
yabl
e (R
Mn
)co
mpa
nies
inco
me
(R M
n)
inco
me
(R M
n)
inc
NR
PT (R
Mn
)ex
c N
RPT
(R M
n )
9,71
2
6.5
85
8.5
29
.610
,974
8.7
14
2.0
11
.6
11
.4
25,0
01-
50,0
0026
9
9.8
12
3.3
3.
534
8
12.8
124.
5
4.0
3.
9
50,0
01-
100,
000
380
27
.7
26
.1
0.
948
5
35.6
14.2
0.8
0.
8
100,
001
-15
0,00
030
0
37.5
1.9
0.
436
7
46.0
41.6
1.9
1.
9
150,
001
-25
0,00
052
4
104.
6
28.8
2.7
624
12
4.5
9.
2
1.8
1.
8
250,
001
-50
0,00
099
5
367.
6
41.1
4.9
1,11
2
414.
9
46.1
6.0
5.
9
500,
001
-75
0,00
070
0
434.
0
40.7
5.2
839
51
8.8
69
.8
7.
8
7.8
750,
001
-1,
000,
000
618
53
8.4
38
.4
6.
873
2
637.
7
39.6
6.2
6.
2
1,00
0,00
1-1,
500,
000
966
1,
203.
2
285.
3
11.7
1,14
6
1,42
9.9
85
.9
15
.3
15
.2
1,50
0,00
1-2,
000,
000
854
1,
492.
5
93.4
14.7
1,14
9
2,02
3.7
19
3.1
19
.8
19
.9
2,00
0,00
1-5,
000,
000
2,25
3
7,11
0.6
54
2.2
71
.22,
203
7,
164.
9
1,23
6.3
91
.6
91
.2
5,00
0,00
1-10
,000
,000
1,32
8
9,50
1.5
83
3.6
90
.81,
458
10
,401
.5
2,
524.
7
129.
8
129.
7
3,66
9
784,
289.
6
88,1
71.0
3,95
6.7
3,91
1
842,
575.
9
117,
608.
8
5,96
4.3
5,
962.
8
22,5
68
80
5,12
3.5
91
,084
.3
4,
199.
125
,348
865,
394.
9
122,
135.
8
6,26
0.9
6,25
8.5
1 Figu
res a
re p
rovi
sion
al a
nd su
bjec
t to
amen
dmen
t.So
urce
: M
aurit
ius R
even
ue A
utho
rity
Yea
r of
ass
essm
ent 2
007/
2008
¹
Tot
al
- 73 -
Ove
r 10,
000,
000
25,0
00 o
r les
s
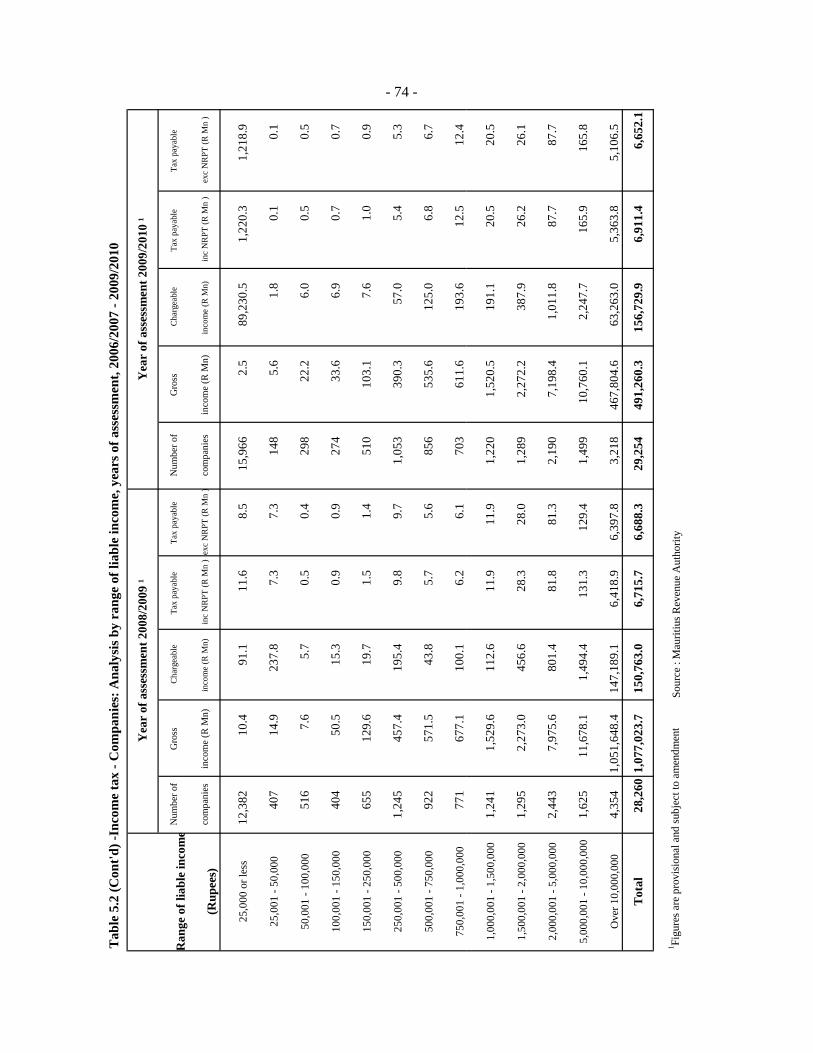
Tab
le 5
.2 (C
ont'd
) -In
com
e ta
x - C
ompa
nies
: Ana
lysi
s by
rang
e of
liab
le in
com
e, y
ears
of a
sses
smen
t, 20
06/2
007
- 200
9/20
10
Ran
ge o
f lia
ble
inco
me
Num
ber o
fG
ross
C
harg
eabl
eTa
x pa
yabl
e Ta
x pa
yabl
e N
umbe
r of
Gro
ss
Cha
rgea
ble
Tax
paya
ble
Tax
paya
ble
(Rup
ees)
com
pani
esin
com
e (R
Mn)
in
com
e (R
Mn)
in
c N
RPT
(R M
n )
exc
NR
PT (R
Mn
)co
mpa
nies
inco
me
(R M
n)
inco
me
(R M
n)
inc
NR
PT (R
Mn
)ex
c N
RPT
(R M
n )
25,0
00 o
r les
s12
,382
10.4
91.1
11.6
8.5
15
,966
2.5
89
,230
.5
1,
220.
3
1,21
8.9
25,0
01 -
50,0
0040
7
14.9
237.
8
7.3
7.
3
148
5.
6
1.8
0.
1
0.1
50,0
01 -
100,
000
516
7.
6
5.7
0.
5
0.4
29
8
22.2
6.0
0.
5
0.5
100,
001
- 150
,000
404
50
.5
15
.3
0.
9
0.9
27
4
33.6
6.9
0.
7
0.7
150,
001
- 250
,000
655
12
9.6
19
.7
1.
5
1.4
51
0
103.
1
7.6
1.
0
0.9
250,
001
- 500
,000
1,24
5
457.
4
195.
4
9.8
9.
7
1,05
3
390.
3
57.0
5.4
5.
3
500,
001
- 750
,000
922
57
1.5
43
.8
5.
7
5.6
85
6
535.
6
125.
0
6.8
6.
7
750,
001
- 1,0
00,0
0077
1
677.
1
100.
1
6.2
6.
1
703
61
1.6
19
3.6
12
.5
12
.4
- 74 -
Yea
r of
ass
essm
ent 2
008/
2009
¹Y
ear
of a
sses
smen
t 200
9/20
10 ¹
1,00
0,00
1 - 1
,500
,000
1,24
1
1,52
9.6
11
2.6
11
.9
11
.9
1,
220
1,
520.
5
191.
1
20.5
20.5
1,50
0,00
1 - 2
,000
,000
1,29
5
2,27
3.0
45
6.6
28
.3
28
.0
1,
289
2,
272.
2
387.
9
26.2
26.1
2,00
0,00
1 - 5
,000
,000
2,44
3
7,97
5.6
80
1.4
81
.8
81
.3
2,
190
7,
198.
4
1,01
1.8
87
.7
87
.7
5,00
0,00
1 - 1
0,00
0,00
01,
625
11
,678
.1
1,
494.
4
131.
3
129.
4
1,49
9
10,7
60.1
2,24
7.7
16
5.9
16
5.8
Ove
r 10,
000,
000
4,35
4
1,05
1,64
8.4
14
7,18
9.1
6,
418.
9
6,39
7.8
3,
218
46
7,80
4.6
63
,263
.0
5,
363.
8
5,10
6.5
Tot
al28
,260
1,07
7,02
3.7
15
0,76
3.0
6,
715.
7
6,68
8.3
29
,254
491,
260.
3
156,
729.
9
6,91
1.4
6,
652.
1
1 Figu
res a
re p
rovi
sion
al a
nd su
bjec
t to
amen
dmen
tSo
urce
: M
aurit
ius R
even
ue A
utho
rity
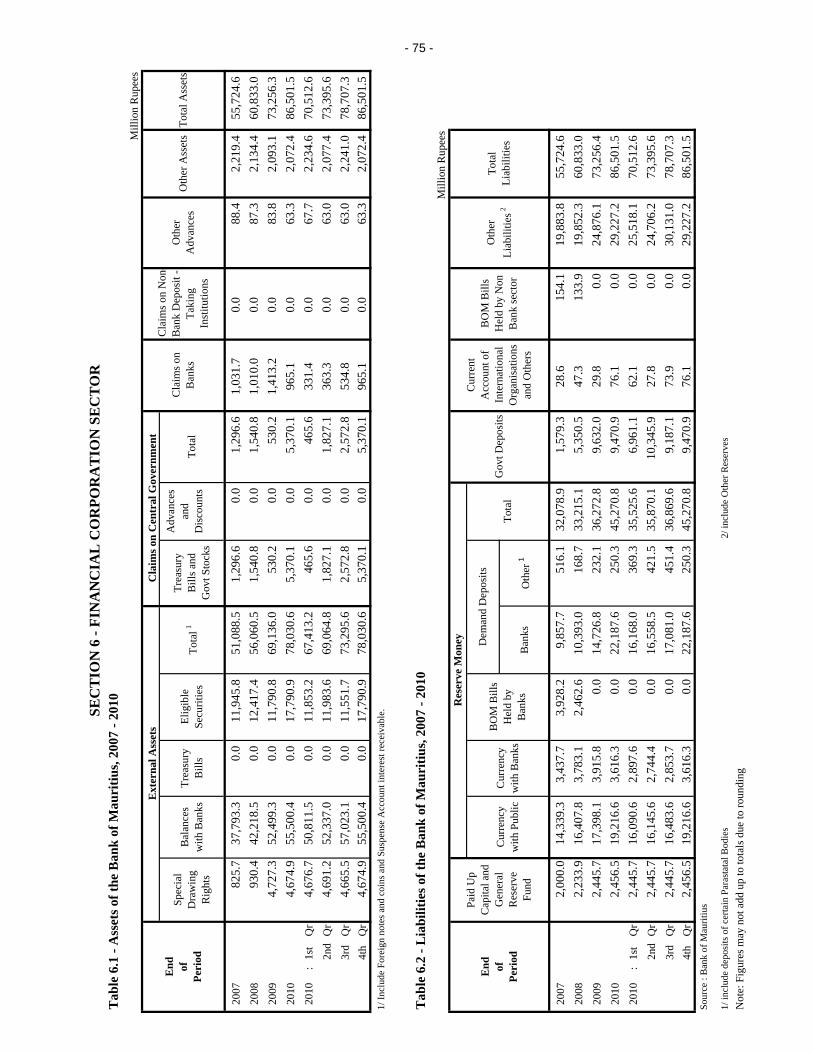
Tab
le 6
.1 -
Ass
ets o
f the
Ban
k of
Mau
ritiu
s, 20
07 -
2010
2007
825.
737
,793
.3
0.0
11,9
45.8
51
,088
.5
1,29
6.6
0.0
1,29
6.6
1,03
1.7
0.0
88.4
2,
219.
4 55
,724
.6
2008
930.
442
,218
.5
0.0
12,4
17.4
56
,060
.5
1,54
0.8
0.0
1,54
0.8
1,01
0.0
0.0
87.3
2,
134.
4 60
,833
.0
2009
4,72
7.3
52,4
99.3
0.
0 11
,790
.8
69,1
36.0
53
0.2
0.0
530.
2 1,
413.
2 0.
0 83
.8
2,09
3.1
73,2
56.3
20
104,
674.
955
,500
.4
0.0
17,7
90.9
78
,030
.6
5,37
0.1
0.0
5,37
0.1
965.
1 0.
0 63
.3
2,07
2.4
86,5
01.5
20
10:
1st
Qr
4,67
6.7
50,8
11.5
0.
0 11
,853
.2
67,4
13.2
46
5.6
0.0
465.
6 33
1.4
0.0
67.7
2,
234.
6 70
,512
.6
2nd
Qr
4,69
1.2
52,3
37.0
0.
0 11
,983
.6
69,0
64.8
1,
827.
1 0.
0 1,
827.
1 36
3.3
0.0
63.0
2,
077.
4 73
,395
.6
3rd
Qr
4,66
5.5
57,0
23.1
0.
0 11
,551
.7
73,2
95.6
2,
572.
8 0.
0 2,
572.
8 53
4.8
0.0
63.0
2,
241.
0 78
,707
.3
4t
hQ
r4,
674.
955
,500
.4
0.0
17,7
90.9
78
,030
.6
5,37
0.1
0.0
5,37
0.1
965.
1 0.
0 63
.3
2,07
2.4
86,5
01.5
1/
Incl
ude
Fore
ign
note
s and
coi
ns a
nd S
uspe
nse
Acc
ount
inte
rest
rece
ivab
le.
Tab
le 6
.2 -
Lia
bilit
ies o
f the
Ban
k of
Mau
ritiu
s, 20
07 -
2010
Ban
ks
Oth
er 1
2007
2,00
0.0
14,3
39.3
3,
437.
7 3,
928.
2 9,
857.
7 51
6.1
32,0
78.9
1,
579.
3 28
.6
154.
1 19
,883
.8
55,7
24.6
20
082,
233.
916
,407
.8
3,78
3.1
2,46
2.6
10,3
93.0
16
8.7
33,2
15.1
5,
350.
5 47
.3
133.
9 19
,852
.3
60,8
33.0
20
092,
445.
717
,398
.1
3,91
5.8
0.0
14,7
26.8
23
2.1
36,2
72.8
9,
632.
0 29
.8
0.0
24,8
76.1
73
,256
.4
2010
2,45
6.5
19,2
16.6
3,
616.
3 0.
0 22
,187
.6
250.
3 45
,270
.8
9,47
0.9
76.1
0.
0 29
,227
.2
86,5
01.5
20
10:
1st
Qr
2,44
5.7
16,0
90.6
2,
897.
6 0.
0 16
,168
.0
369.
3 35
,525
.6
6,96
1.1
62.1
0.
0 25
,518
.1
70,5
12.6
2n
dQ
r2,
445.
716
,145
.6
2,74
4.4
0.0
16,5
58.5
42
1.5
35,8
70.1
10
,345
.9
27.8
0.
0 24
,706
.2
73,3
95.6
3r
dQ
r2,
445.
716
,483
.6
2,85
3.7
0.0
17,0
81.0
45
1.4
36,8
69.6
9,
187.
1 73
.9
0.0
30,1
31.0
78
,707
.3
4t
hQ
r2,
456.
519
,216
.6
3,61
6.3
0.0
22,1
87.6
25
0.3
45,2
70.8
9,
470.
9 76
.1
0.0
29,2
27.2
86
,501
.5
Sour
ce :
Ban
k of
Mau
ritiu
s
1/ in
clud
e de
posi
ts o
f cer
tain
Par
asta
tal B
odie
s2/
incl
ude
Oth
er R
eser
ves
Not
e: F
igur
es m
ay n
ot a
dd u
p to
tota
ls d
ue to
roun
ding
End
of
Pe
riod
Ext
erna
l Ass
ets
Cla
ims o
n C
entr
al G
over
nmen
t
Tota
l Ass
ets
Spec
ial
Dra
win
g R
ight
s
Cla
ims o
n N
on-
Ban
k D
epos
it -
Taki
ng
Inst
itutio
ns
Oth
er
Adv
ance
sO
ther
Ass
etsM
illio
n R
upee
s
Bal
ance
s w
ith B
anks
Trea
sury
B
ills
Elig
ible
Se
curit
ies
Tota
l 1Tr
easu
ry
Bill
s and
G
ovt S
tock
s
Adv
ance
s an
d D
isco
unts
Tota
lC
laim
s on
Ban
ks
Tota
l Li
abili
ties
End
of
Pe
riod
Cur
rent
A
ccou
nt o
f In
tern
atio
nal
Org
anis
atio
ns
and
Oth
ers
BO
M B
ills
Hel
d by
Non
B
ank
sect
or
Oth
er
Liab
ilitie
s 2
Paid
Up
Cap
ital a
nd
Gen
eral
R
eser
ve
Fund
- 75 -
SEC
TIO
N 6
- FI
NA
NC
IAL
CO
RPO
RA
TIO
N S
EC
TO
R
Mill
ion
Rup
ees
Res
erve
Mon
ey
Cur
renc
y w
ith P
ublic
Cur
renc
y w
ith B
anks
BO
M B
ills
Hel
d by
B
anks
Dem
and
Dep
osits
Tota
lG
ovt D
epos
its

- 76 -
Table 6.3 - Net International Reserves, 2007 - 2010
2007
2008
2009
2010
2010 : 1st Qr
2nd Qr
3rd Qr
4th Qr
1
2
3 Based on the value of the import bill
Table 6.4 - Components and sources of Monetary Base : December 2007 - December 2010
(as at end of period)
Dec 2007 Dec 2008 Dec 2009 Mar 2010 Jun 2010 Sep 2010 Dec 2010
1 Currency with Public 14,260 16,156 17,153 15,845 15,905 16,242 18,975
23,438 3,787 3,916 2,898 2,745 2,854 3,617
3 Deposits with BOM 10,313 10,551 14,865 16,368 17,102 17,459 22,345
of which
Other Depository Corporations 9,858 10,393 14,729 16,169 16,559 17,082 22,188
Other 455 158 136 199 543 378 157
28,011 30,495 35,934 35,111 35,752 36,556 44,937
1 Net Foreign Assets 50,880 56,025 65,073 63,322 65,004 69,200 73,899
2 -270 -3,797 -10,289 -6,484 -8,507 -6,602 -4,188
3 1,083 1,014 1,427 465 447 729 992
4 Claims on Private Sector 251 135 144 131 133 138 145
5 Net Non-Monetary Liabilities 23,932 22,881 20,422 22,323 21,326 26,910 25,912
Monetary Base ( 1+2+3+4-5 ) 28,011 30,495 35,934 35,111 35,752 36,556 44,937
Source: Monthly Statistical Bulletin of Bank of MauritiusNote: Figures may not add up to totals due to rounding
73,899.0
Net claims on Budgetary Central Govt.
Claims on other Depository Corporations
Components of Monetary Base
Monetary Base ( 1+2+3 )
The Net foreign Assets of Other Depository Corporations are adjusted for transactions of Global Business Licence Holders.
Comprises foreign assets of the Government and the country's Reserve Position in the IMF
65,004.0
Million Rupees
Currency with other Depository Corporations
Sources of Monetary Base
69,200.0 27,309.0 1,033.0 97,542.0 37.5
73,899.0
33,052.0 1,033.0 107,984.0 41.5
63,322.0 40,217.0 807.0 104,346.0 40.1
34.8
36,729.0 1,040.0 102,773.0 39.5
65,073.0 40,050.0 625.0 105,748.0 44.1
38.2
Net
50,880.0 34,640.0 314.0
33,052.0 1,033.0 107,984.0 41.5
85,834.0
56,025.0 33,496.0 643.0 90,164.0
Period Foreign Assets1
Million RupeesOther Depository
Others 2Net International
ReservesImport Coverage (No. of weeks) 3
End Bank of Mauritius Corporationsof Net Foreign Assets

Tab
le 6
.5 -
Ban
ks -
Ass
ets,
2008
- 20
10
End
of
Perio
dC
ash
in
Han
d
Bal
ance
s w
ith
BO
M
BO
M
Bill
sTo
tal
Bal
ance
s w
ith
Ban
ks
Abr
oad
Fore
ign
Bill
s D
isco
unte
d
Fore
ign
Secu
ritie
s
Fore
ign
Not
es a
nd
Coi
ns
Loan
s O
utsi
de
Mau
ritiu
sTo
tal
Trea
sury
B
ills
Gov
t. Se
curit
ies
Adv
ance
sTo
tal
Loca
l Bill
s Pu
rcha
sed
and
Dis
coun
ted
Bill
s R
ecei
vabl
eLo
ans a
nd
Adv
ance
s
Inve
stm
ent
in S
hare
s an
d D
eben
ture
s
Tota
l
2008
3,78
3.1
10,3
95.0
2,54
1.0
16,7
19.1
203,
182.
25,
310.
722
,688
.81,
132.
622
8,45
2.6
460,
766.
823
,280
.325
,751
.10.
049
,031
.41,
090.
23,
656.
816
6,18
2.0
7,99
5.6
178,
924.
616
,653
.72,
117.
130
,251
.475
4,46
3.9
2009
3,91
5.8
14,7
07.7
0.0
18,6
23.5
212,
882.
89,
093.
47,
498.
562
4.6
207,
189.
043
7,28
8.4
31,6
94.2
26,9
19.1
0.0
58,6
13.2
1,17
7.9
2,59
7.1
172,
902.
27,
972.
518
4,64
9.7
16,9
84.1
3,28
7.5
31,8
11.1
751,
257.
6
2010
3,61
6.3
22,1
58.0
3,64
4.6
29,4
18.9
213,
380.
06,
338.
97,
607.
058
9.7
270,
842.
049
8,75
7.5
24,2
09.6
31,1
53.4
0.0
55,3
63.0
1,87
6.4
3,24
1.8
195,
702.
58,
748.
820
9,56
9.5
20,4
27.7
4,53
6.2
45,3
94.6
863,
467.
4
1 In
clud
e cl
aim
s on
Publ
ic C
orpo
ratio
ns, S
tate
and
Loc
al G
over
nmen
t2
Incl
ude
Inte
rban
k Lo
an a
nd fi
xed
Ass
ets
Res
erve
sFo
reig
n A
sset
sC
laim
s on
Bud
geta
ry C
entra
l Gov
tC
laim
s on
Priv
ate
Sect
or 1
Cla
ims o
n G
loba
l B
usin
ess
Lice
nce
Hol
ders
Cla
ims o
n B
anks
in
Mau
ritiu
s
Oth
er
Ass
ets 2
Tota
l A
sset
s
- 77 -
Mill
ion
Rup
ees
Tab
le 6
.6 -
Ban
ks -
Lia
bilit
ies,
2008
- 20
10
Dem
and
Savi
ngs 1
Tim
e 2
Fore
ign
Cur
renc
y D
epos
its
Ban
ks in
M
aurit
ius
Ban
ks
Abr
oad
2008
54,7
00.3
22,8
44.7
92,6
69.7
69,8
07.8
362,
019.
354
7,34
1.6
802.
42,
052.
51,
046.
51,
894.
795
,617
.922
1.8
50,7
86.3
754,
463.
9
2009
59,6
48.2
27,9
01.6
105,
915.
873
,072
.335
2,09
5.9
558,
985.
684
5.9
1,83
0.5
1,43
0.0
2,89
6.8
81,7
32.6
195.
343
,692
.775
1,25
7.6
2010
71,9
58.2
32,6
73.6
121,
023.
473
,718
.540
5,38
1.7
632,
797.
284
3.4
5,23
2.7
975.
04,
269.
585
,682
.019
8.7
61,5
10.7
863,
467.
4
Sour
ce :
Mon
thly
Sta
tistic
al B
ulle
tin o
f Ban
k of
Mau
ritiu
s1
Incl
ude
mar
gin
depo
sits
2 Fr
om S
epte
mbe
r 200
5 to
Sep
tem
ber 2
009,
incl
ude
bond
s iss
ued
by o
ne b
ank
3 In
clud
es b
orro
win
gs fr
om o
ther
inst
itutio
ns (l
ocal
and
fore
ign)
Not
e: F
igur
es m
ay n
ot a
dd u
p to
tota
ls d
ue to
roun
ding
Bor
row
ings
fr
om B
OM
End
of
perio
d
Cap
ital
and
rese
rves
Dep
osits
Tota
l
Bud
geta
ry
Cen
tral
Gov
t D
epos
its
Inte
r-B
ank
Bor
row
ings
Bor
row
ing
from
Bill
s Pa
yabl
eO
ther
Li
abili
ties3
Tota
l Li
abili
ties
Mill
ion
Rup
ees
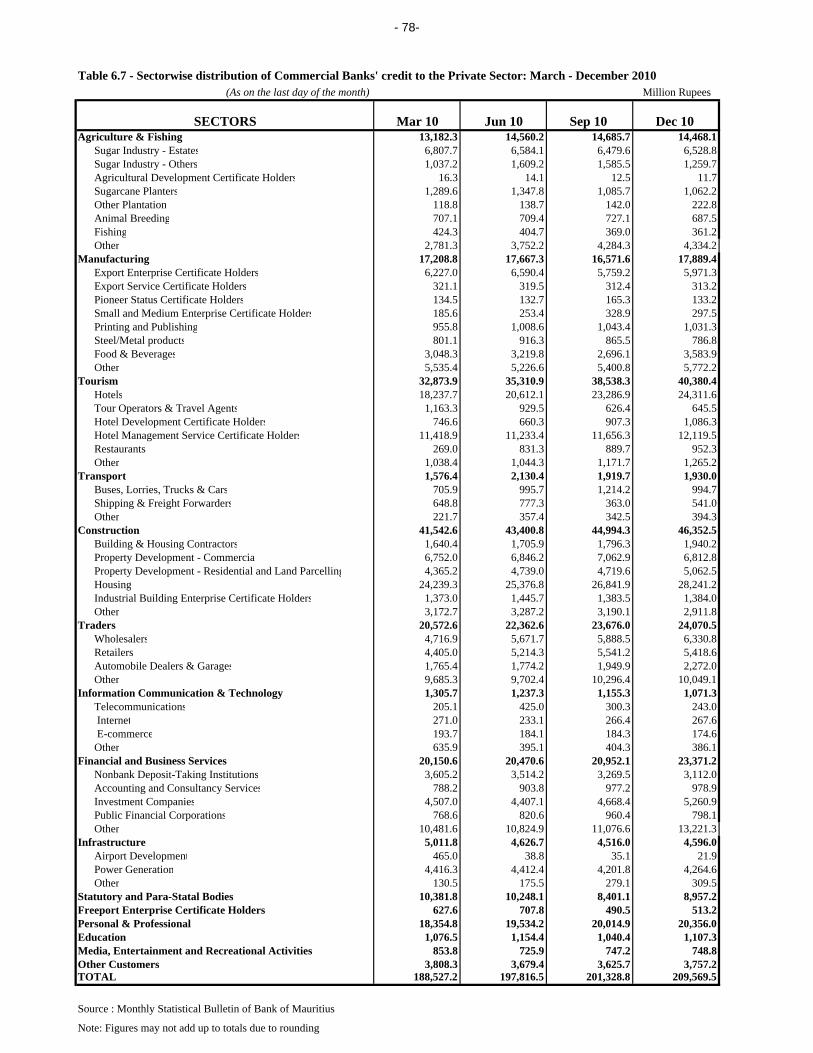
- 78-
Table 6.7 - Sectorwise distribution of Commercial Banks' credit to the Private Sector: March - December 2010(As on the last day of the month) Million Rupees
SECTORS Mar 10 Jun 10 Sep 10 Dec 10 Agriculture & Fishing 13,182.3 14,560.2 14,685.7 14,468.1 Sugar Industry - Estates 6,807.7 6,584.1 6,479.6 6,528.8 Sugar Industry - Others 1,037.2 1,609.2 1,585.5 1,259.7 Agricultural Development Certificate Holders 16.3 14.1 12.5 11.7 Sugarcane Planters 1,289.6 1,347.8 1,085.7 1,062.2 Other Plantation 118.8 138.7 142.0 222.8 Animal Breeding 707.1 709.4 727.1 687.5 Fishing 424.3 404.7 369.0 361.2 Other 2,781.3 3,752.2 4,284.3 4,334.2Manufacturing 17,208.8 17,667.3 16,571.6 17,889.4 Export Enterprise Certificate Holders 6,227.0 6,590.4 5,759.2 5,971.3 Export Service Certificate Holders 321.1 319.5 312.4 313.2 Pioneer Status Certificate Holders 134.5 132.7 165.3 133.2 Small and Medium Enterprise Certificate Holders 185.6 253.4 328.9 297.5 Printing and Publishing 955.8 1,008.6 1,043.4 1,031.3 Steel/Metal products 801.1 916.3 865.5 786.8 Food & Beverages 3,048.3 3,219.8 2,696.1 3,583.9 Other 5,535.4 5,226.6 5,400.8 5,772.2Tourism 32,873.9 35,310.9 38,538.3 40,380.4 Hotels 18,237.7 20,612.1 23,286.9 24,311.6 Tour Operators & Travel Agents 1,163.3 929.5 626.4 645.5 Hotel Development Certificate Holders 746.6 660.3 907.3 1,086.3 Hotel Management Service Certificate Holders 11,418.9 11,233.4 11,656.3 12,119.5 Restaurants 269.0 831.3 889.7 952.3 Other 1,038.4 1,044.3 1,171.7 1,265.2Transport 1,576.4 2,130.4 1,919.7 1,930.0 Buses, Lorries, Trucks & Cars 705.9 995.7 1,214.2 994.7 Shipping & Freight Forwarders 648.8 777.3 363.0 541.0 Other 221.7 357.4 342.5 394.3Construction 41,542.6 43,400.8 44,994.3 46,352.5 Building & Housing Contractors 1,640.4 1,705.9 1,796.3 1,940.2 Property Development - Commercial 6,752.0 6,846.2 7,062.9 6,812.8 Property Development - Residential and Land Parcelling 4,365.2 4,739.0 4,719.6 5,062.5 Housing 24,239.3 25,376.8 26,841.9 28,241.2 Industrial Building Enterprise Certificate Holders 1,373.0 1,445.7 1,383.5 1,384.0 Other 3,172.7 3,287.2 3,190.1 2,911.8Traders 20,572.6 22,362.6 23,676.0 24,070.5 Wholesalers 4,716.9 5,671.7 5,888.5 6,330.8 Retailers 4,405.0 5,214.3 5,541.2 5,418.6 Automobile Dealers & Garages 1,765.4 1,774.2 1,949.9 2,272.0 Other 9,685.3 9,702.4 10,296.4 10,049.1Information Communication & Technology 1,305.7 1,237.3 1,155.3 1,071.3 Telecommunications 205.1 425.0 300.3 243.0 Internet 271.0 233.1 266.4 267.6 E-commerce 193.7 184.1 184.3 174.6 Other 635.9 395.1 404.3 386.1Financial and Business Services 20,150.6 20,470.6 20,952.1 23,371.2 Nonbank Deposit-Taking Institutions 3,605.2 3,514.2 3,269.5 3,112.0 Accounting and Consultancy Services 788.2 903.8 977.2 978.9 Investment Companies 4,507.0 4,407.1 4,668.4 5,260.9 Public Financial Corporations 768.6 820.6 960.4 798.1 Other 10,481.6 10,824.9 11,076.6 13,221.3Infrastructure 5,011.8 4,626.7 4,516.0 4,596.0 Airport Development 465.0 38.8 35.1 21.9 Power Generation 4,416.3 4,412.4 4,201.8 4,264.6 Other 130.5 175.5 279.1 309.5Statutory and Para-Statal Bodies 10,381.8 10,248.1 8,401.1 8,957.2Freeport Enterprise Certificate Holders 627.6 707.8 490.5 513.2Personal & Professional 18,354.8 19,534.2 20,014.9 20,356.0Education 1,076.5 1,154.4 1,040.4 1,107.3Media, Entertainment and Recreational Activities 853.8 725.9 747.2 748.8Other Customers 3,808.3 3,679.4 3,625.7 3,757.2TOTAL 188,527.2 197,816.5 201,328.8 209,569.5
Source : Monthly Statistical Bulletin of Bank of Mauritius
Note: Figures may not add up to totals due to rounding
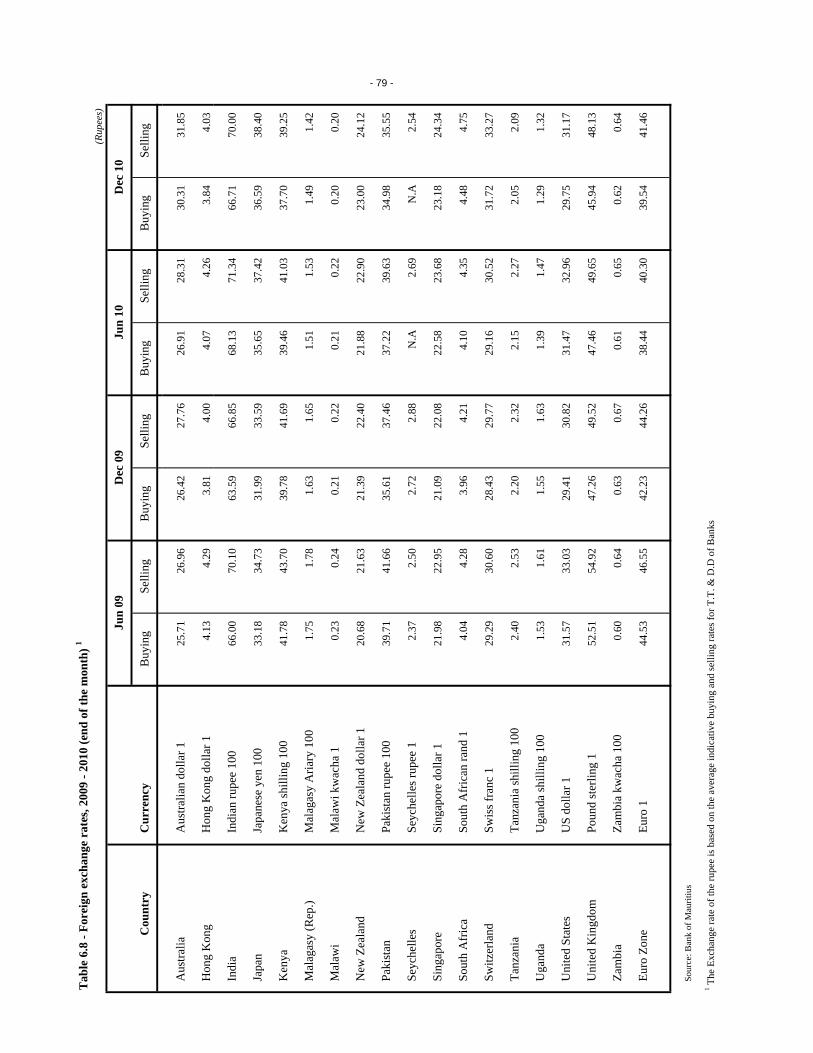
Tab
le 6
.8 -
Fore
ign
exch
ange
rat
es, 2
009
- 201
0 (e
nd o
f the
mon
th) 1
(Rup
ees)
Cou
ntry
Cur
renc
yB
uyin
gSe
lling
Buy
ing
Selli
ngB
uyin
gSe
lling
Buy
ing
Selli
ng
Aus
tralia
Aus
tralia
n do
llar 1
25.7
1
26.9
6
26.4
2
27.7
6
26.9
1
28.3
1
30.3
1
31.8
5
Hon
g K
ong
Hon
g K
ong
dolla
r 14.
13
4.29
3.
81
4.00
4.
07
4.26
3.
84
4.03
Indi
aIn
dian
rupe
e 10
066
.00
70
.10
63
.59
66
.85
68
.13
71
.34
66
.71
70
.00
Japa
nJa
pane
se y
en 1
0033
.18
34
.73
31
.99
33
.59
35
.65
37
.42
36
.59
38
.40
Ken
yaK
enya
shill
ing
100
41.7
8
43.7
0
39.7
8
41.6
9
39.4
6
41.0
3
37.7
0
39.2
5
Mal
agas
y (R
ep.)
Mal
agas
y A
riary
100
1.
75
1.78
1.
63
1.65
1.
51
1.53
1.
49
1.42
Mal
awi
Mal
awi k
wac
ha 1
0.23
0.
24
0.21
0.
22
0.21
0.
22
0.20
0.
20
New
Zea
land
New
Zea
land
dol
lar 1
20.6
8
21.6
3
21.3
9
22.4
0
21.8
8
22.9
0
23.0
0
24.1
2
Paki
stan
Paki
stan
rupe
e 10
039
.71
41
.66
35
.61
37
.46
37
.22
39
.63
34
.98
35
.55
Seyc
helle
sSe
yche
lles r
upee
12.
37
2.50
2.
72
2.88
N.A
2.69
N.A
2.54
Sing
apor
eSi
ngap
ore
dolla
r 121
.98
22
.95
21
.09
22
.08
22
.58
23
.68
23
.18
24
.34
Sout
h A
fric
aSo
uth
Afr
ican
rand
14.
04
4.28
3.
96
4.21
4.
10
4.35
4.
48
4.75
Switz
erla
ndSw
iss f
ranc
129
.29
30
.60
28
.43
29
.77
29
.16
30
.52
31
.72
33
.27
Tanz
ania
Tanz
ania
shill
ing
100
2.40
2.
53
2.20
2.
32
2.15
2.
27
2.05
2.
09
Uga
nda
Uga
nda
shill
ing
100
1.53
1.
61
1.55
1.
63
1.39
1.
47
1.29
1.
32
Uni
ted
Stat
esU
S do
llar 1
31.5
7
33.0
3
29.4
1
30.8
2
31.4
7
32.9
6
29.7
5
31.1
7
Uni
ted
Kin
gdom
Poun
d st
erlin
g 1
52.5
1
54.9
2
47.2
6
49.5
2
47.4
6
49.6
5
45.9
4
48.1
3
Zam
bia
Zam
bia
kwac
ha 1
000.
60
0.64
0.
63
0.67
0.
61
0.65
0.
62
0.64
Euro
Zon
eEu
ro 1
44.5
3
46.5
5
42.2
3
44.2
6
38.4
4
40.3
0
39.5
4
41.4
6
Sour
ce: B
ank
of M
aurit
ius
1 The
Exc
hang
e ra
te o
f the
rupe
e is
bas
ed o
n th
e av
erag
e in
dica
tive
buyi
ng a
nd se
lling
rate
s for
T.T
. & D
.D o
f Ban
ks
- 79 -
Jun
09D
ec 0
9Ju
n 10
Dec
10
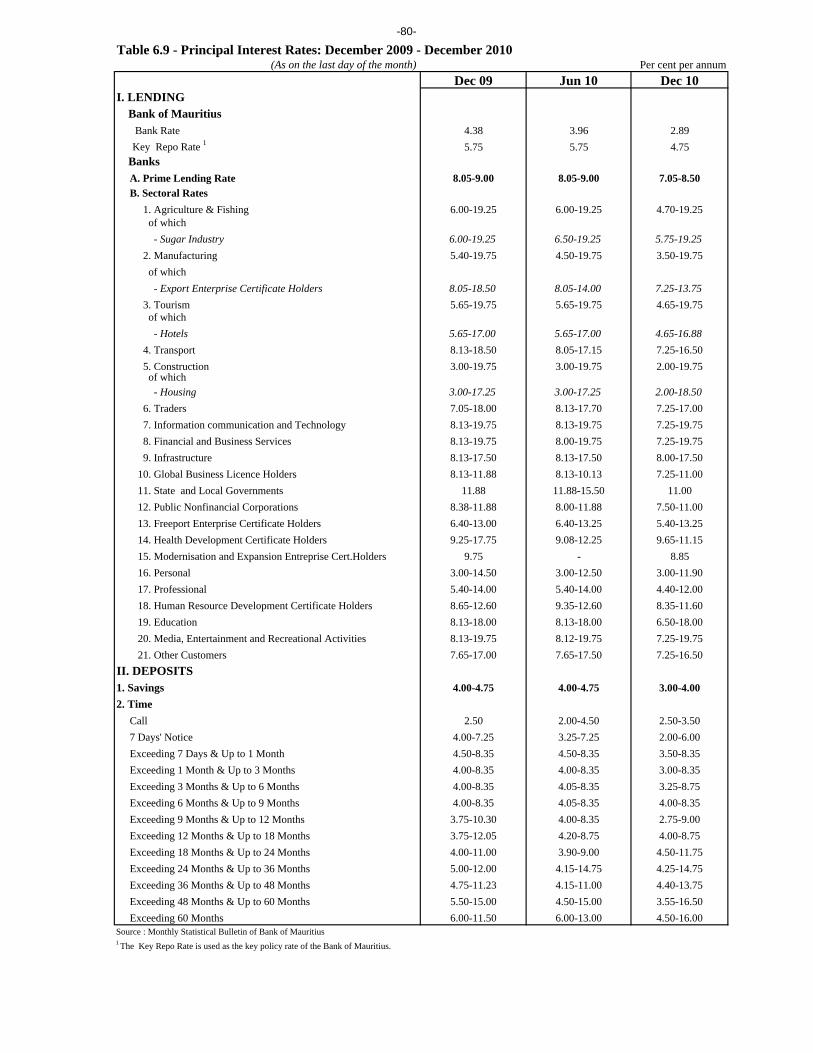
-80-
Table 6.9 - Principal Interest Rates: December 2009 - December 2010(As on the last day of the month) Per cent per annum
Dec 09 Jun 10 Dec 10I. LENDING Bank of Mauritius Bank Rate 4.38 3.96 2.89 Key Repo Rate 1 5.75 5.75 4.75 Banks A. Prime Lending Rate 8.05-9.00 8.05-9.00 7.05-8.50 B. Sectoral Rates 1. Agriculture & Fishing 6.00-19.25 6.00-19.25 4.70-19.25 of which - Sugar Industry 6.00-19.25 6.50-19.25 5.75-19.25 2. Manufacturing 5.40-19.75 4.50-19.75 3.50-19.75 of which - Export Enterprise Certificate Holders 8.05-18.50 8.05-14.00 7.25-13.75 3. Tourism 5.65-19.75 5.65-19.75 4.65-19.75 of which - Hotels 5.65-17.00 5.65-17.00 4.65-16.88 4. Transport 8.13-18.50 8.05-17.15 7.25-16.50 5. Construction 3.00-19.75 3.00-19.75 2.00-19.75 of which - Housing 3.00-17.25 3.00-17.25 2.00-18.50 6. Traders 7.05-18.00 8.13-17.70 7.25-17.00 7. Information communication and Technology 8.13-19.75 8.13-19.75 7.25-19.75 8. Financial and Business Services 8.13-19.75 8.00-19.75 7.25-19.75 9. Infrastructure 8.13-17.50 8.13-17.50 8.00-17.50 10. Global Business Licence Holders 8.13-11.88 8.13-10.13 7.25-11.00 11. State and Local Governments 11.88 11.88-15.50 11.00 12. Public Nonfinancial Corporations 8.38-11.88 8.00-11.88 7.50-11.00 13. Freeport Enterprise Certificate Holders 6.40-13.00 6.40-13.25 5.40-13.25 14. Health Development Certificate Holders 9.25-17.75 9.08-12.25 9.65-11.15 15. Modernisation and Expansion Entreprise Cert.Holders 9.75 - 8.85 16. Personal 3.00-14.50 3.00-12.50 3.00-11.90 17. Professional 5.40-14.00 5.40-14.00 4.40-12.00 18. Human Resource Development Certificate Holders 8.65-12.60 9.35-12.60 8.35-11.60 19. Education 8.13-18.00 8.13-18.00 6.50-18.00 20. Media, Entertainment and Recreational Activities 8.13-19.75 8.12-19.75 7.25-19.75 21. Other Customers 7.65-17.00 7.65-17.50 7.25-16.50II. DEPOSITS1. Savings 4.00-4.75 4.00-4.75 3.00-4.002. Time Call 2.50 2.00-4.50 2.50-3.50 7 Days' Notice 4.00-7.25 3.25-7.25 2.00-6.00 Exceeding 7 Days & Up to 1 Month 4.50-8.35 4.50-8.35 3.50-8.35 Exceeding 1 Month & Up to 3 Months 4.00-8.35 4.00-8.35 3.00-8.35 Exceeding 3 Months & Up to 6 Months 4.00-8.35 4.05-8.35 3.25-8.75 Exceeding 6 Months & Up to 9 Months 4.00-8.35 4.05-8.35 4.00-8.35 Exceeding 9 Months & Up to 12 Months 3.75-10.30 4.00-8.35 2.75-9.00 Exceeding 12 Months & Up to 18 Months 3.75-12.05 4.20-8.75 4.00-8.75 Exceeding 18 Months & Up to 24 Months 4.00-11.00 3.90-9.00 4.50-11.75 Exceeding 24 Months & Up to 36 Months 5.00-12.00 4.15-14.75 4.25-14.75 Exceeding 36 Months & Up to 48 Months 4.75-11.23 4.15-11.00 4.40-13.75 Exceeding 48 Months & Up to 60 Months 5.50-15.00 4.50-15.00 3.55-16.50 Exceeding 60 Months 6.00-11.50 6.00-13.00 4.50-16.00Source : Monthly Statistical Bulletin of Bank of Mauritius1 The Key Repo Rate is used as the key policy rate of the Bank of Mauritius.
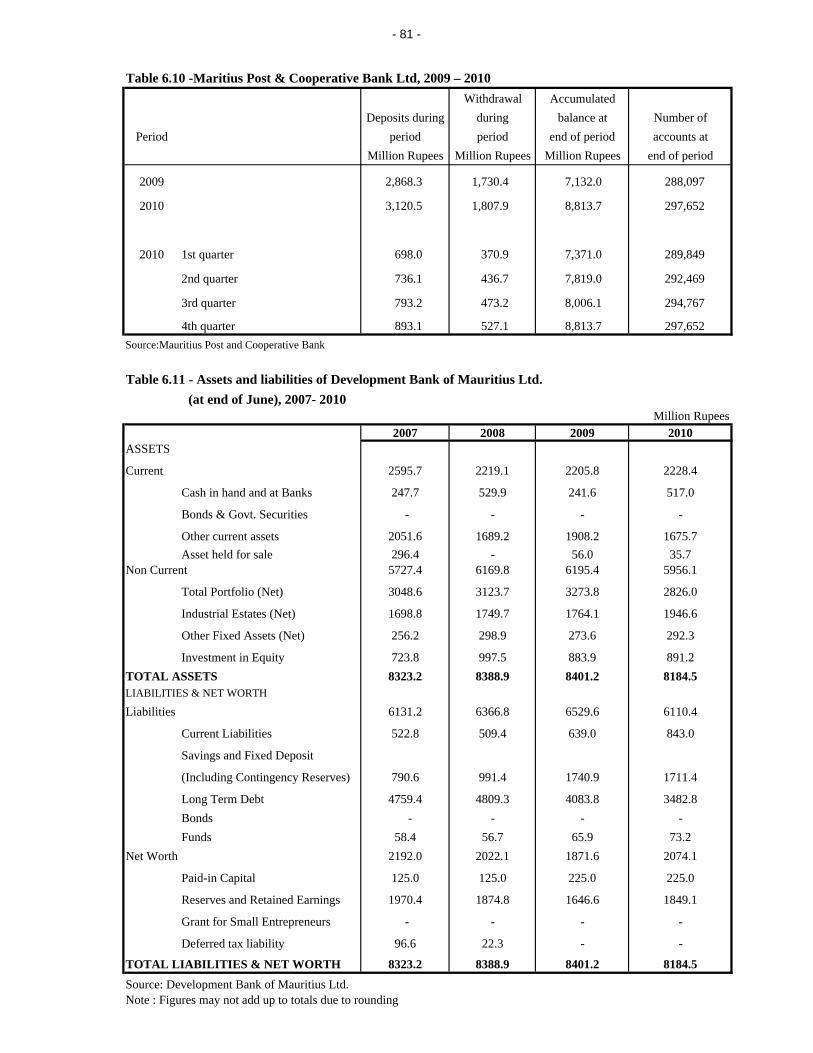
- 81 -
Table 6.10 -Maritius Post & Cooperative Bank Ltd, 2009 – 2010Withdrawal Accumulated
Deposits during during balance at Number ofPeriod period period end of period accounts at
Million Rupees Million Rupees Million Rupees end of period
2009 2,868.3 1,730.4 7,132.0 288,097
2010 3,120.5 1,807.9 8,813.7 297,652
2010 1st quarter 698.0 370.9 7,371.0 289,849
2nd quarter 736.1 436.7 7,819.0 292,469
3rd quarter 793.2 473.2 8,006.1 294,767
4th quarter 893.1 527.1 8,813.7 297,652 Source:Mauritius Post and Cooperative Bank
Table 6.11 - Assets and liabilities of Development Bank of Mauritius Ltd. (at end of June), 2007- 2010
Million Rupees2007 2008 2009 2010
ASSETS
Current 2595.7 2219.1 2205.8 2228.4
Cash in hand and at Banks 247.7 529.9 241.6 517.0
Bonds & Govt. Securities - - - -
Other current assets 2051.6 1689.2 1908.2 1675.7Asset held for sale 296.4 - 56.0 35.7
Non Current 5727.4 6169.8 6195.4 5956.1
Total Portfolio (Net) 3048.6 3123.7 3273.8 2826.0
Industrial Estates (Net) 1698.8 1749.7 1764.1 1946.6
Other Fixed Assets (Net) 256.2 298.9 273.6 292.3
Investment in Equity 723.8 997.5 883.9 891.2TOTAL ASSETS 8323.2 8388.9 8401.2 8184.5LIABILITIES & NET WORTH
Liabilities 6131.2 6366.8 6529.6 6110.4
Current Liabilities 522.8 509.4 639.0 843.0
Savings and Fixed Deposit
(Including Contingency Reserves) 790.6 991.4 1740.9 1711.4
Long Term Debt 4759.4 4809.3 4083.8 3482.8Bonds - - - -Funds 58.4 56.7 65.9 73.2
Net Worth 2192.0 2022.1 1871.6 2074.1
Paid-in Capital 125.0 125.0 225.0 225.0
Reserves and Retained Earnings 1970.4 1874.8 1646.6 1849.1
Grant for Small Entrepreneurs - - - -
Deferred tax liability 96.6 22.3 - -
TOTAL LIABILITIES & NET WORTH 8323.2 8388.9 8401.2 8184.5Source: Development Bank of Mauritius Ltd.Note : Figures may not add up to totals due to rounding
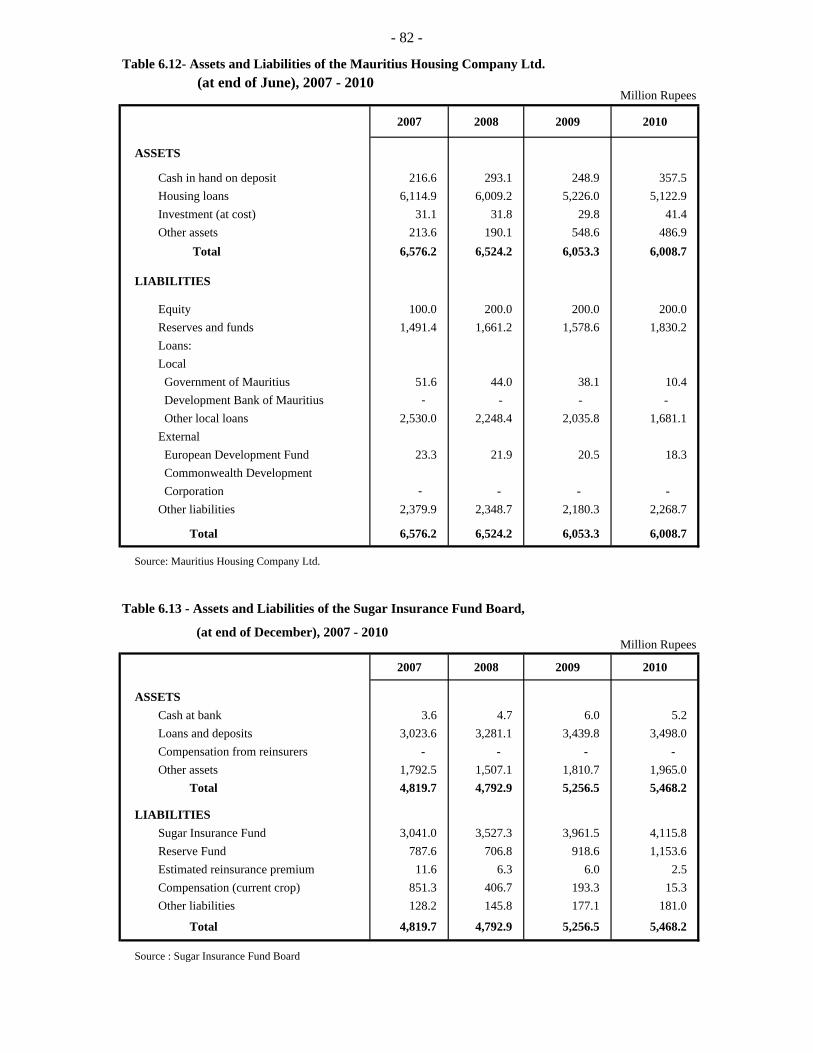
- 82 -
Table 6.12- Assets and Liabilities of the Mauritius Housing Company Ltd. (at end of June), 2007 - 2010
2007 2008 2009 2010
ASSETS
Cash in hand on deposit 216.6 293.1 248.9 357.5 Housing loans 6,114.9 6,009.2 5,226.0 5,122.9 Investment (at cost) 31.1 31.8 29.8 41.4 Other assets 213.6 190.1 548.6 486.9
Total 6,576.2 6,524.2 6,053.3 6,008.7
LIABILITIES
Equity 100.0 200.0 200.0 200.0 Reserves and funds 1,491.4 1,661.2 1,578.6 1,830.2 Loans:
Local Government of Mauritius 51.6 44.0 38.1 10.4 Development Bank of Mauritius - - - - Other local loans 2,530.0 2,248.4 2,035.8 1,681.1
External European Development Fund 23.3 21.9 20.5 18.3 Commonwealth Development Corporation - - - -Other liabilities 2,379.9 2,348.7 2,180.3 2,268.7
Total 6,576.2 6,524.2 6,053.3 6,008.7
Source: Mauritius Housing Company Ltd.
Table 6.13 - Assets and Liabilities of the Sugar Insurance Fund Board,
(at end of December), 2007 - 2010
2007 2008 2009 2010
ASSETSCash at bank 3.6 4.7 6.0 5.2 Loans and deposits 3,023.6 3,281.1 3,439.8 3,498.0 Compensation from reinsurers - - - - Other assets 1,792.5 1,507.1 1,810.7 1,965.0
Total 4,819.7 4,792.9 5,256.5 5,468.2
LIABILITIESSugar Insurance Fund 3,041.0 3,527.3 3,961.5 4,115.8 Reserve Fund 787.6 706.8 918.6 1,153.6 Estimated reinsurance premium 11.6 6.3 6.0 2.5 Compensation (current crop) 851.3 406.7 193.3 15.3 Other liabilities 128.2 145.8 177.1 181.0
Total 4,819.7 4,792.9 5,256.5 5,468.2
Source : Sugar Insurance Fund Board
Million Rupees
Million Rupees
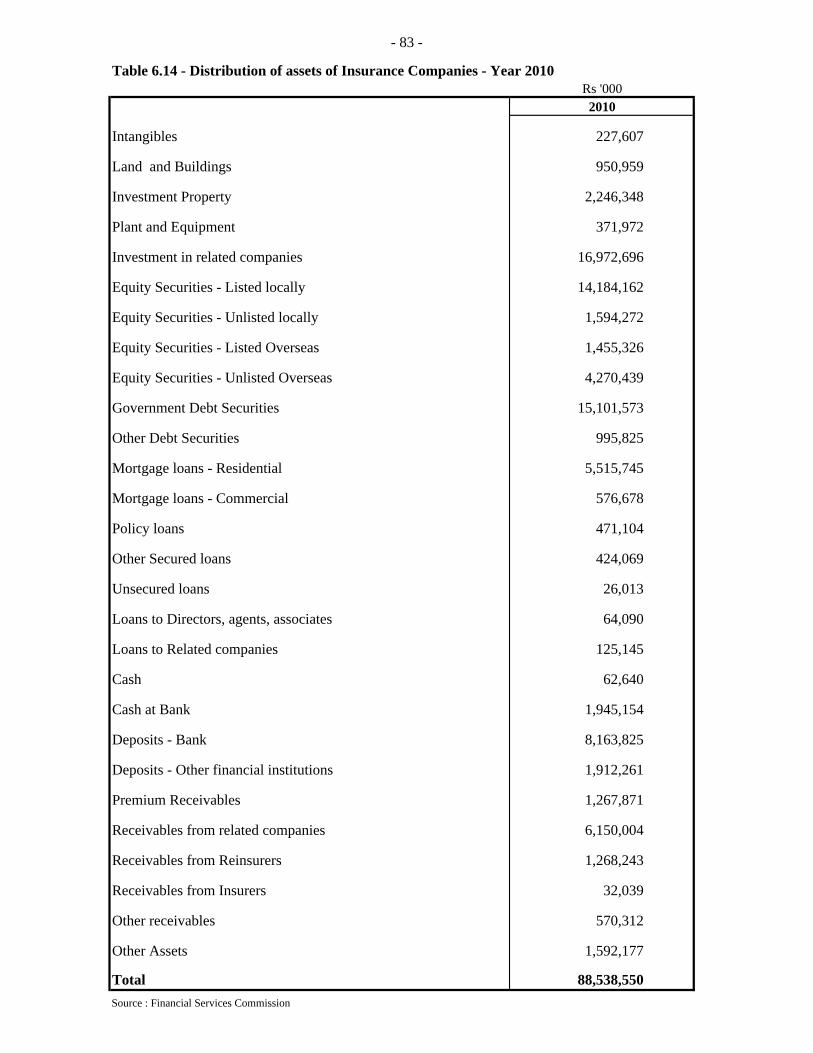
- 83 -
Table 6.14 - Distribution of assets of Insurance Companies - Year 2010Rs '0002010
Intangibles 227,607
Land and Buildings 950,959
Investment Property 2,246,348
Plant and Equipment 371,972
Investment in related companies 16,972,696
Equity Securities - Listed locally 14,184,162
Equity Securities - Unlisted locally 1,594,272
Equity Securities - Listed Overseas 1,455,326
Equity Securities - Unlisted Overseas 4,270,439
Government Debt Securities 15,101,573
Other Debt Securities 995,825
Mortgage loans - Residential 5,515,745
Mortgage loans - Commercial 576,678
Policy loans 471,104
Other Secured loans 424,069
Unsecured loans 26,013
Loans to Directors, agents, associates 64,090
Loans to Related companies 125,145
Cash 62,640
Cash at Bank 1,945,154
Deposits - Bank 8,163,825
Deposits - Other financial institutions 1,912,261
Premium Receivables 1,267,871
Receivables from related companies 6,150,004
Receivables from Reinsurers 1,268,243
Receivables from Insurers 32,039
Other receivables 570,312
Other Assets 1,592,177
Total 88,538,550 Source : Financial Services Commission
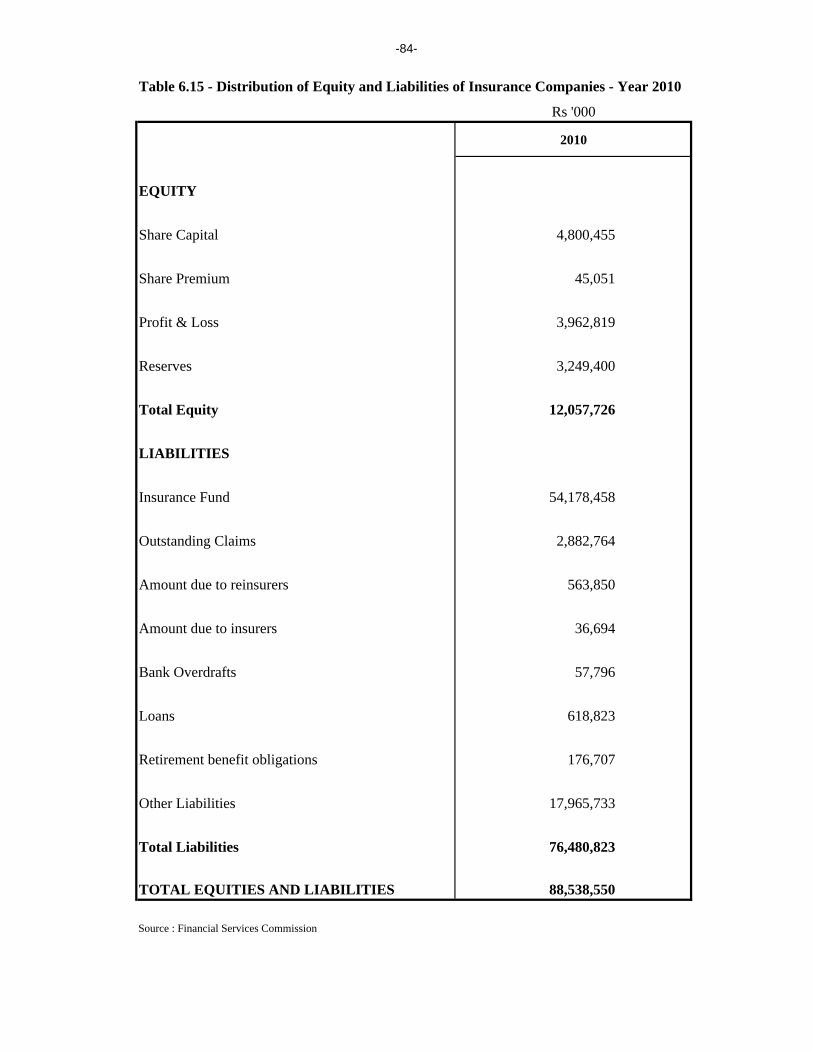
-84-
Table 6.15 - Distribution of Equity and Liabilities of Insurance Companies - Year 2010
Rs '000
2010
EQUITY
Share Capital 4,800,455
Share Premium 45,051
Profit & Loss 3,962,819
Reserves 3,249,400
Total Equity 12,057,726
LIABILITIES
Insurance Fund 54,178,458
Outstanding Claims 2,882,764
Amount due to reinsurers 563,850
Amount due to insurers 36,694
Bank Overdrafts 57,796
Loans 618,823
Retirement benefit obligations 176,707
Other Liabilities 17,965,733
Total Liabilities 76,480,823
TOTAL EQUITIES AND LIABILITIES 88,538,550
Source : Financial Services Commission
SECTION 7 – NATIONAL ACCOUNTS AND QUARTERLY NATIONAL ACCOUNTS 1. Introduction. National Accounts data are compiled according to the recommendations of the 1993 System of National Accounts (SNA93). Concepts and terminologies used are defined below.
Quarterly National Accounts (QNA) estimates starting from the first quarter of 1999 are published by the Central Statistics Office. These quarterly estimates are compiled according to guidelines provided in the IMF manual entitled “Quarterly National Accounts Manual – Concepts, Data sources and Compilation”, which is itself based on the SNA 93. Gross Domestic Product (GDP)
GDP is the aggregate money value of all goods and services produced within a country out of economic activity during a specified period usually a year, before provision for the consumption of fixed capital. GDP at basic prices GDP at basic prices is obtained as the difference between output and intermediate consumption whereby output is valued at basic prices and intermediate consumption at purchasers' prices.
The basic price is the amount receivable by the producer exclusive of taxes on products and inclusive of subsidies on products. The equivalent for imported products is the c.i.f. value, i.e. the value at the border of the importing country.
The purchasers' price is the amount payable by the purchaser exclusive of deductible taxes on products (e.g. deductible value added tax). GDP at market prices GDP at market prices is equal to the GDP at basic prices plus taxes (net of subsidies) on products. Gross National Income (GNI) GDP added to net primary income from abroad gives Gross National Income (GNI). Gross National Disposable Income (GNDI) Gross National Income (GNI) net of transfers from the rest of the world gives Gross National Disposable Income (GNDI). Financial intermediation services indirectly measured (FISIM) FISIM is obtained as the difference between interest received and interest paid by banks excluding those received on own funds. The total amount of FISIM was previously recorded as the intermediate consumption of a nominal industry. As recommended by the 1993 SNA, it is now allocated to users as follows: intermediate consumption of businesses, final consumption of households and government, and a component of exports of services. Gross Domestic Fixed Capital Formation (GDFCF) GDFCF is the net additions to the physical assets of the country in a year. These consist mainly of investment in buildings, plants, machinery and transport equipment, all valued at market prices. Change in inventories
Change in inventories includes the value of the physical change in inventories of raw materials, work in progress, and finished goods held by producers
-85-

Consumption expenditure Consumption expenditure is made up of final consumption expenditure of households and of government. Government final consumption expenditure is further disaggregated into collective and individual consumption expenditure. Collective expenditure consists of the services which government provides to the community as a whole, for example, security and defence whereas individual expenditure is made up of expenses incurred in providing services which are mostly beneficial to individuals, mainly in respect of health and education. Actual Government final consumption expenditure refers to expenditure incurred for the provision of collective services. Actual final consumption expenditure covers goods and services supplied to households, irrespective of whether these goods and services are actually paid by government or households themselves. Consequently, it consists of expenditure incurred by households and government on the provision of individual services. Gross National Saving Gross National Disposable Income (GNDI) less total consumption gives Gross National Saving. Exports and Imports of goods and services Both exports and imports of goods are measured f.o.b. Insurance and freight, which represent the difference between the c.i.f and f.o.b values of imports of goods are recorded as imports of services. Exports and imports of goods are compiled according to the General Trade System, using the national boundary as the statistical frontier. All goods entering the country are recorded in imports and goods leaving the country in exports. 2. Status of figures 2.1 National Accounts National Accounts estimates are as at June 2011. Data for years 2009 to 2010 are “Revised” whilst those of year 2011 are “Forecast”.
The Main assumptions used in estimating 2011 figures are: Sector Main assumption Growth rate
Sugarcane Sugar production of 420,000 tonnes -5.1%
EOE +5.0%
Hotels and restaurants
Tourist arrivals: 980,000 Tourist earnings: R 42.5 billion
+4.0%
Construction +1.0%
Transport, storage and communications
+5.5%
Financial intermediation Higher growth expected in offshore activities +5.7%
2.2 Quarterly National Accounts
Quarterly data for 2009 and up to the fourth quarter of 2010 are “Revised estimates” and those for the first quarter of 2011 are “First estimates”.
-86-
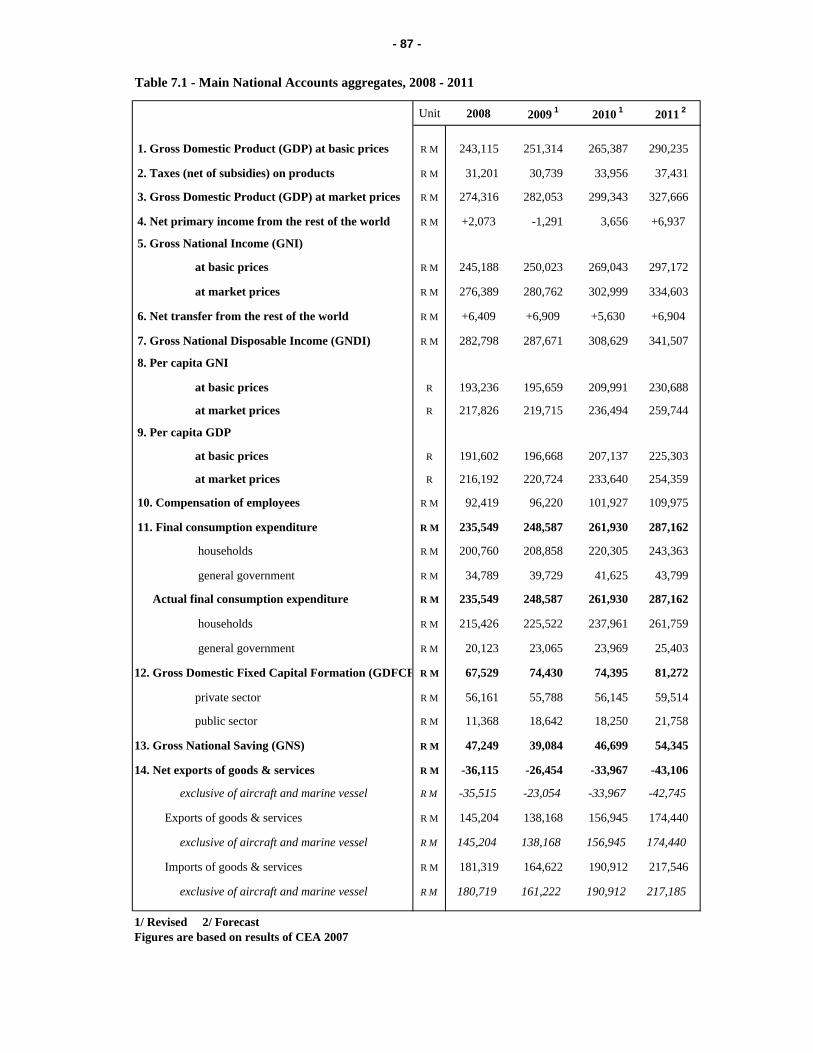
- 87 -
Table 7.1 - Main National Accounts aggregates, 2008 - 2011
Unit 2008 2009 1 2010 1 2011 2
1. Gross Domestic Product (GDP) at basic prices R M 243,115 251,314 265,387 290,235
2. Taxes (net of subsidies) on products R M 31,201 30,739 33,956 37,431
3. Gross Domestic Product (GDP) at market prices R M 274,316 282,053 299,343 327,666
4. Net primary income from the rest of the world R M +2,073 -1,291 3,656 +6,937
5. Gross National Income (GNI)
at basic prices R M 245,188 250,023 269,043 297,172
at market prices R M 276,389 280,762 302,999 334,603
6. Net transfer from the rest of the world R M +6,409 +6,909 +5,630 +6,904
7. Gross National Disposable Income (GNDI) R M 282,798 287,671 308,629 341,507
8. Per capita GNI
at basic prices R 193,236 195,659 209,991 230,688
at market prices R 217,826 219,715 236,494 259,744
9. Per capita GDP
at basic prices R 191,602 196,668 207,137 225,303
at market prices R 216,192 220,724 233,640 254,359
10. Compensation of employees R M 92,419 96,220 101,927 109,975
11. Final consumption expenditure R M 235,549 248,587 261,930 287,162
households R M 200,760 208,858 220,305 243,363
general government R M 34,789 39,729 41,625 43,799
Actual final consumption expenditure R M 235,549 248,587 261,930 287,162
households R M 215,426 225,522 237,961 261,759
general government R M 20,123 23,065 23,969 25,403
12. Gross Domestic Fixed Capital Formation (GDFCF R M 67,529 74,430 74,395 81,272
private sector R M 56,161 55,788 56,145 59,514
public sector R M 11,368 18,642 18,250 21,758
13. Gross National Saving (GNS) R M 47,249 39,084 46,699 54,345
14. Net exports of goods & services R M -36,115 -26,454 -33,967 -43,106
exclusive of aircraft and marine vessel R M -35,515 -23,054 -33,967 -42,745
Exports of goods & services R M 145,204 138,168 156,945 174,440
exclusive of aircraft and marine vessel R M 145,204 138,168 156,945 174,440
Imports of goods & services R M 181,319 164,622 190,912 217,546
exclusive of aircraft and marine vessel R M 180,719 161,222 190,912 217,185
1/ Revised 2/ ForecastFigures are based on results of CEA 2007
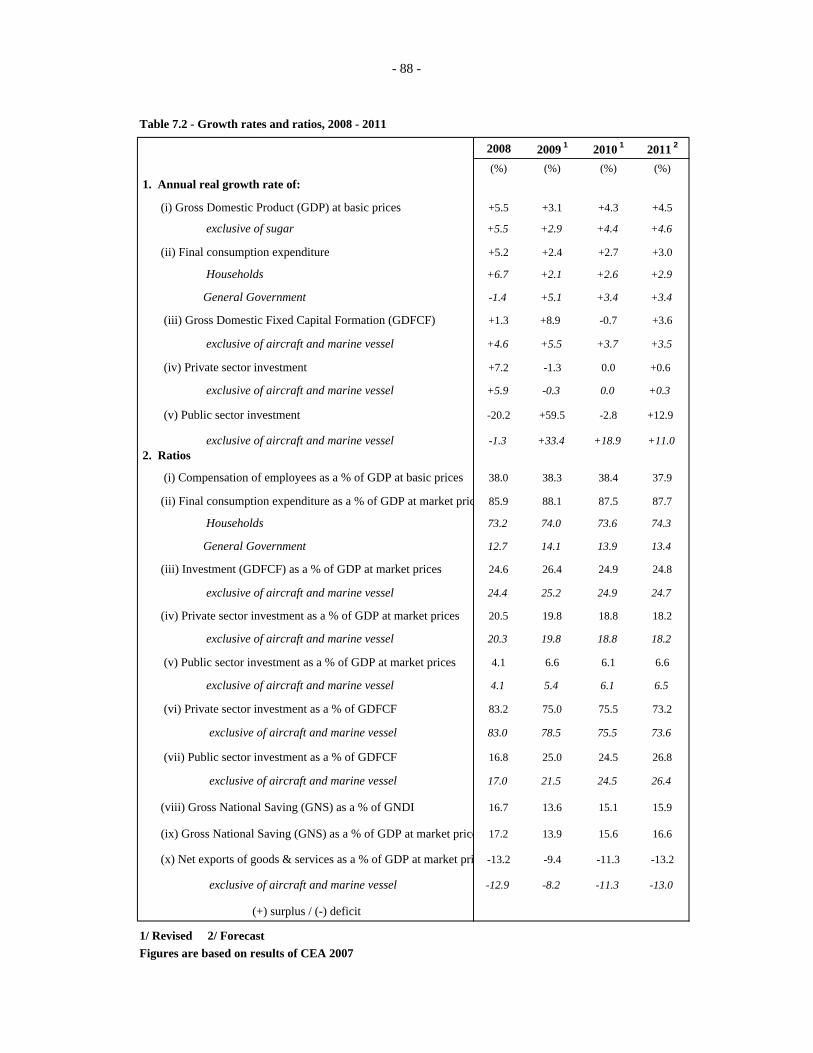
- 88 -
Table 7.2 - Growth rates and ratios, 2008 - 2011
2008 2009 1 2010 1 2011 2
(%) (%) (%) (%) 1. Annual real growth rate of:
(i) Gross Domestic Product (GDP) at basic prices +5.5 +3.1 +4.3 +4.5
exclusive of sugar +5.5 +2.9 +4.4 +4.6
(ii) Final consumption expenditure +5.2 +2.4 +2.7 +3.0
Households +6.7 +2.1 +2.6 +2.9
General Government -1.4 +5.1 +3.4 +3.4
(iii) Gross Domestic Fixed Capital Formation (GDFCF) +1.3 +8.9 -0.7 +3.6
exclusive of aircraft and marine vessel +4.6 +5.5 +3.7 +3.5
(iv) Private sector investment +7.2 -1.3 0.0 +0.6
exclusive of aircraft and marine vessel +5.9 -0.3 0.0 +0.3
(v) Public sector investment -20.2 +59.5 -2.8 +12.9
exclusive of aircraft and marine vessel -1.3 +33.4 +18.9 +11.0 2. Ratios
(i) Compensation of employees as a % of GDP at basic prices 38.0 38.3 38.4 37.9
(ii) Final consumption expenditure as a % of GDP at market pric 85.9 88.1 87.5 87.7
Households 73.2 74.0 73.6 74.3
General Government 12.7 14.1 13.9 13.4
(iii) Investment (GDFCF) as a % of GDP at market prices 24.6 26.4 24.9 24.8
exclusive of aircraft and marine vessel 24.4 25.2 24.9 24.7
(iv) Private sector investment as a % of GDP at market prices 20.5 19.8 18.8 18.2
exclusive of aircraft and marine vessel 20.3 19.8 18.8 18.2
(v) Public sector investment as a % of GDP at market prices 4.1 6.6 6.1 6.6
exclusive of aircraft and marine vessel 4.1 5.4 6.1 6.5
(vi) Private sector investment as a % of GDFCF 83.2 75.0 75.5 73.2
exclusive of aircraft and marine vessel 83.0 78.5 75.5 73.6
(vii) Public sector investment as a % of GDFCF 16.8 25.0 24.5 26.8
exclusive of aircraft and marine vessel 17.0 21.5 24.5 26.4
(viii) Gross National Saving (GNS) as a % of GNDI 16.7 13.6 15.1 15.9
(ix) Gross National Saving (GNS) as a % of GDP at market price 17.2 13.9 15.6 16.6
(x) Net exports of goods & services as a % of GDP at market pri -13.2 -9.4 -11.3 -13.2
exclusive of aircraft and marine vessel -12.9 -8.2 -11.3 -13.0
(+) surplus / (-) deficit
1/ Revised 2/ ForecastFigures are based on results of CEA 2007
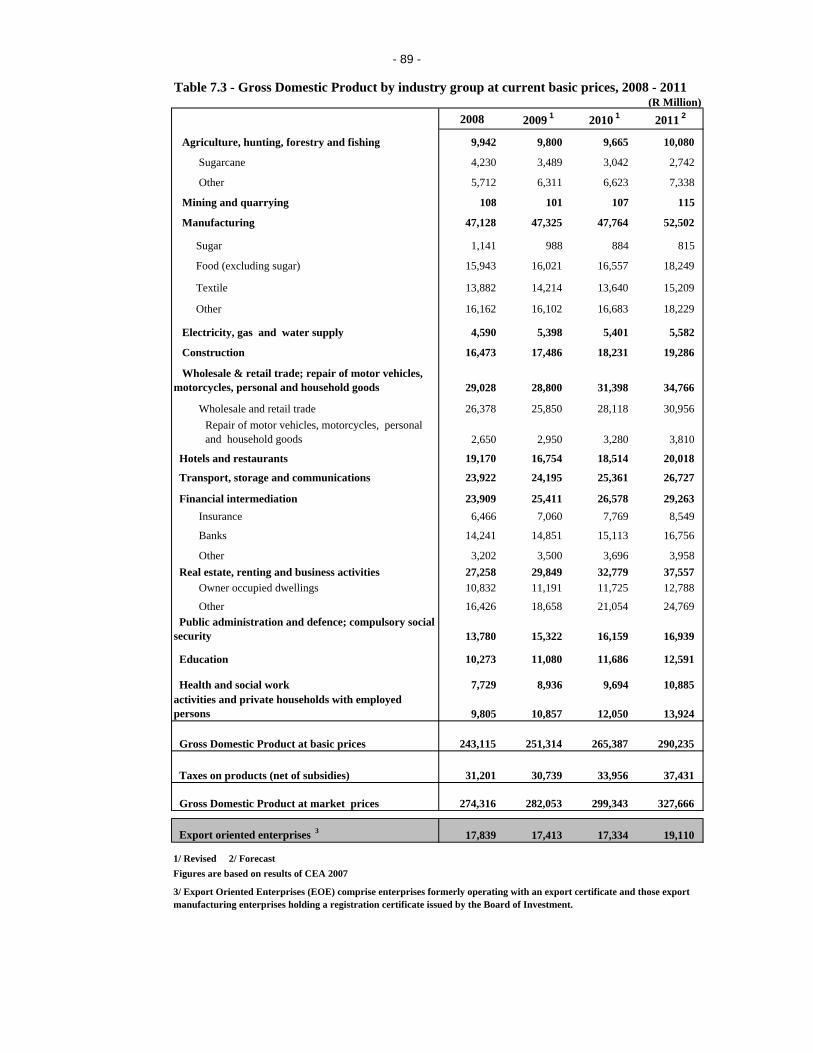
- 89 -
Table 7.3 - Gross Domestic Product by industry group at current basic prices, 2008 - 2011(R Million)
2008 2009 1 2010 1 2011 2
Agriculture, hunting, forestry and fishing 9,942 9,800 9,665 10,080
Sugarcane 4,230 3,489 3,042 2,742
Other 5,712 6,311 6,623 7,338
Mining and quarrying 108 101 107 115
Manufacturing 47,128 47,325 47,764 52,502
Sugar 1,141 988 884 815
Food (excluding sugar) 15,943 16,021 16,557 18,249
Textile 13,882 14,214 13,640 15,209
Other 16,162 16,102 16,683 18,229
Electricity, gas and water supply 4,590 5,398 5,401 5,582
Construction 16,473 17,486 18,231 19,286
Wholesale & retail trade; repair of motor vehicles, motorcycles, personal and household goods 29,028 28,800 31,398 34,766
Wholesale and retail trade 26,378 25,850 28,118 30,956 Repair of motor vehicles, motorcycles, personal and household goods 2,650 2,950 3,280 3,810
Hotels and restaurants 19,170 16,754 18,514 20,018
Transport, storage and communications 23,922 24,195 25,361 26,727
Financial intermediation 23,909 25,411 26,578 29,263 Insurance 6,466 7,060 7,769 8,549
Banks 14,241 14,851 15,113 16,756
Other 3,202 3,500 3,696 3,958 Real estate, renting and business activities 27,258 29,849 32,779 37,557 Owner occupied dwellings 10,832 11,191 11,725 12,788
Other 16,426 18,658 21,054 24,769 Public administration and defence; compulsory social security 13,780 15,322 16,159 16,939
Education 10,273 11,080 11,686 12,591
Health and social work 7,729 8,936 9,694 10,885 activities and private households with employed persons 9,805 10,857 12,050 13,924
Gross Domestic Product at basic prices 243,115 251,314 265,387 290,235
Taxes on products (net of subsidies) 31,201 30,739 33,956 37,431
Gross Domestic Product at market prices 274,316 282,053 299,343 327,666
Export oriented enterprises 3 17,839 17,413 17,334 19,110
1/ Revised 2/ ForecastFigures are based on results of CEA 2007
3/ Export Oriented Enterprises (EOE) comprise enterprises formerly operating with an export certificate and those export manufacturing enterprises holding a registration certificate issued by the Board of Investment.
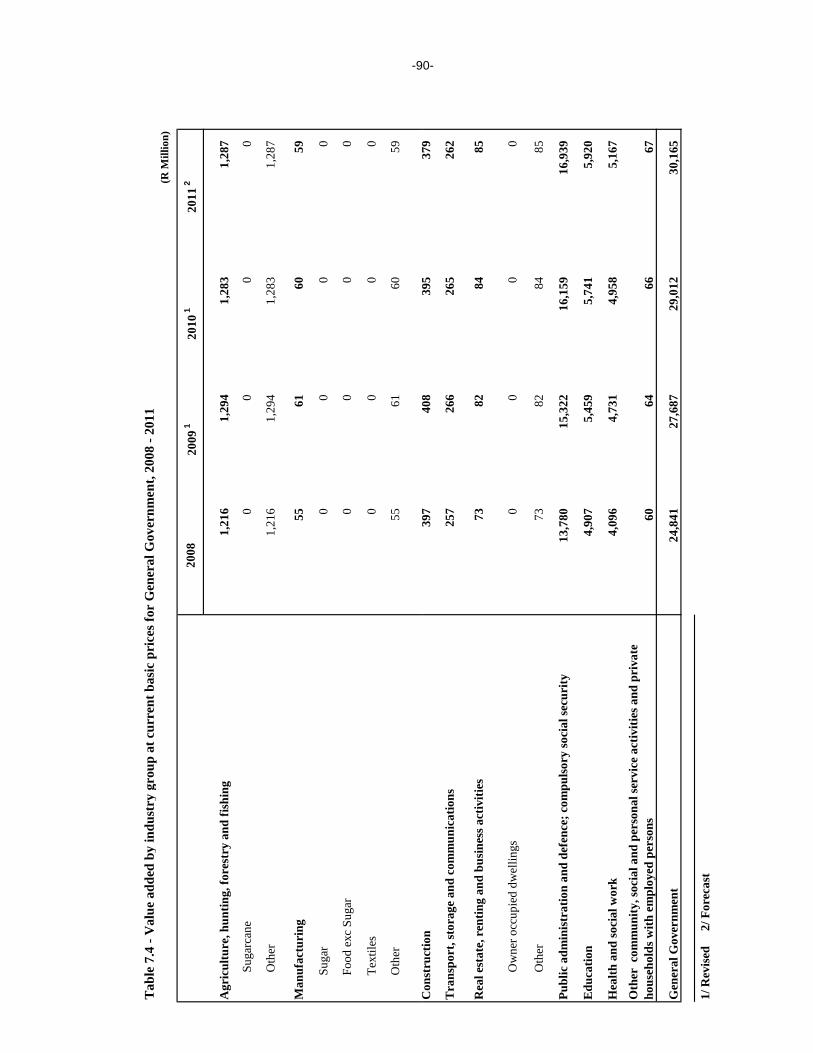
Tab
le 7
.4 -
Val
ue a
dded
by
indu
stry
gro
up a
t cur
rent
bas
ic p
rice
s for
Gen
eral
Gov
ernm
ent,
2008
- 20
11(R
Mill
ion)
2008
2009
120
10 1
2011
2
Agr
icul
ture
, hun
ting,
fore
stry
and
fish
ing
1,21
6
1,29
4
1,28
3
1,28
7
Su
garc
ane
0
0
0
0
O
ther
1,21
6
1,29
4
1,28
3
1,28
7
Man
ufac
turi
ng55
61
60
59
Sug
ar
0
0
0
0
Foo
d ex
c Su
gar
0
0
0
0
Tex
tiles
0
0
0
0
Oth
er55
61
60
59
Ct
ti39
740
839
537
9
-9
Con
stru
ctio
n39
7
408
39
5
379
Tra
nspo
rt, s
tora
ge a
nd c
omm
unic
atio
ns
257
26
6
265
26
2
Rea
l est
ate,
ren
ting
and
busi
ness
act
iviti
es73
82
84
85
O
wne
r occ
upie
d dw
ellin
gs0
0
0
0
O
ther
73
82
84
85
Publ
ic a
dmin
istr
atio
n an
d de
fenc
e; c
ompu
lsor
y so
cial
secu
rity
13
,780
15
,322
16
,159
16
,939
Edu
catio
n4,
907
5,
459
5,
741
5,
920
Hea
lth a
nd so
cial
wor
k4,
096
4,
731
4,
958
5,
167
Oth
er c
omm
unity
, soc
ial a
nd p
erso
nal s
ervi
ce a
ctiv
ities
and
pri
vate
ho
useh
olds
with
em
ploy
ed p
erso
ns
60
64
66
67
Gen
eral
Gov
ernm
ent
24,8
41
27,6
87
29,0
12
30,1
65
1/ R
evis
ed
2/ F
orec
ast
0-
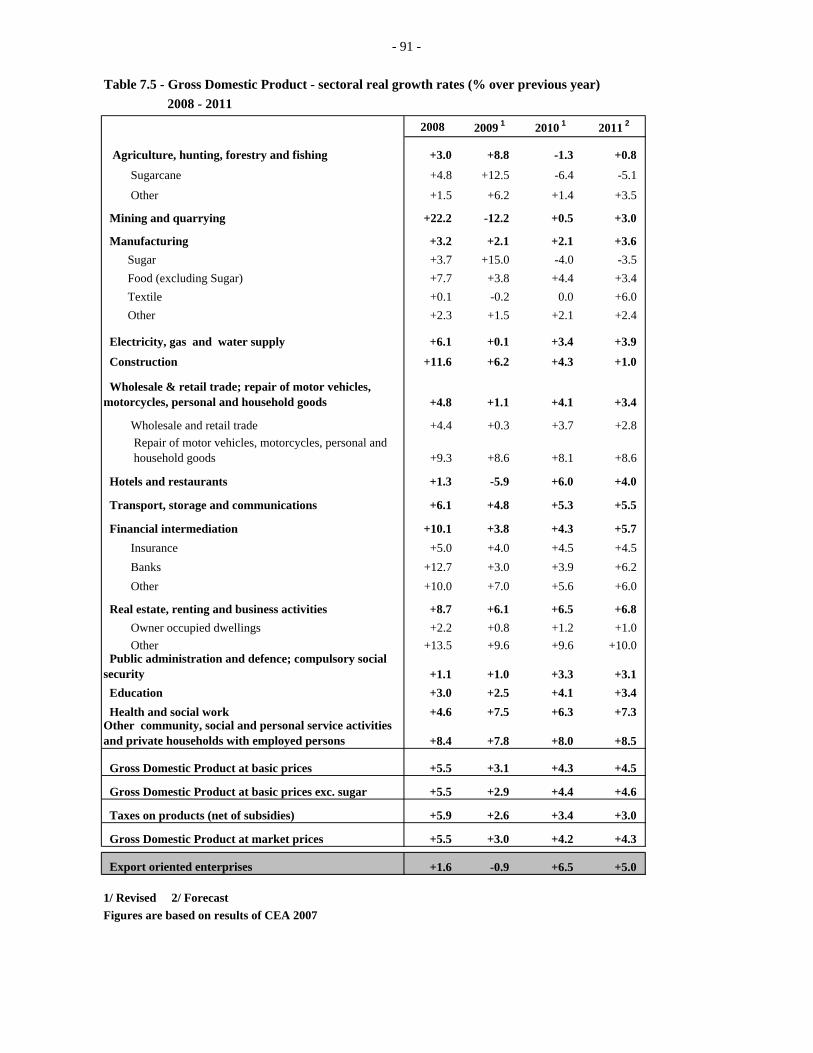
- 91 -
2008 - 2011
2008 2009 1 2010 1 2011 2
Agriculture, hunting, forestry and fishing +3.0 +8.8 -1.3 +0.8
Sugarcane +4.8 +12.5 -6.4 -5.1
Other +1.5 +6.2 +1.4 +3.5
Mining and quarrying +22.2 -12.2 +0.5 +3.0
Manufacturing +3.2 +2.1 +2.1 +3.6 Sugar +3.7 +15.0 -4.0 -3.5 Food (excluding Sugar) +7.7 +3.8 +4.4 +3.4 Textile +0.1 -0.2 0.0 +6.0 Other +2.3 +1.5 +2.1 +2.4
Electricity, gas and water supply +6.1 +0.1 +3.4 +3.9
Construction +11.6 +6.2 +4.3 +1.0
Wholesale & retail trade; repair of motor vehicles, motorcycles, personal and household goods +4.8 +1.1 +4.1 +3.4
Wholesale and retail trade +4.4 +0.3 +3.7 +2.8 Repair of motor vehicles, motorcycles, personal and household goods +9.3 +8.6 +8.1 +8.6
Hotels and restaurants +1.3 -5.9 +6.0 +4.0
Transport, storage and communications +6.1 +4.8 +5.3 +5.5
Financial intermediation +10.1 +3.8 +4.3 +5.7 Insurance +5.0 +4.0 +4.5 +4.5 Banks +12.7 +3.0 +3.9 +6.2 Other +10.0 +7.0 +5.6 +6.0
Real estate, renting and business activities +8.7 +6.1 +6.5 +6.8 Owner occupied dwellings +2.2 +0.8 +1.2 +1.0 Other +13.5 +9.6 +9.6 +10.0 Public administration and defence; compulsory social security +1.1 +1.0 +3.3 +3.1 Education +3.0 +2.5 +4.1 +3.4 Health and social work +4.6 +7.5 +6.3 +7.3 Other community, social and personal service activities and private households with employed persons +8.4 +7.8 +8.0 +8.5
Gross Domestic Product at basic prices +5.5 +3.1 +4.3 +4.5
Gross Domestic Product at basic prices exc. sugar +5.5 +2.9 +4.4 +4.6
Taxes on products (net of subsidies) +5.9 +2.6 +3.4 +3.0
Gross Domestic Product at market prices +5.5 +3.0 +4.2 +4.3
Export oriented enterprises +1.6 -0.9 +6.5 +5.0
1/ Revised 2/ ForecastFigures are based on results of CEA 2007
Table 7.5 - Gross Domestic Product - sectoral real growth rates (% over previous year)
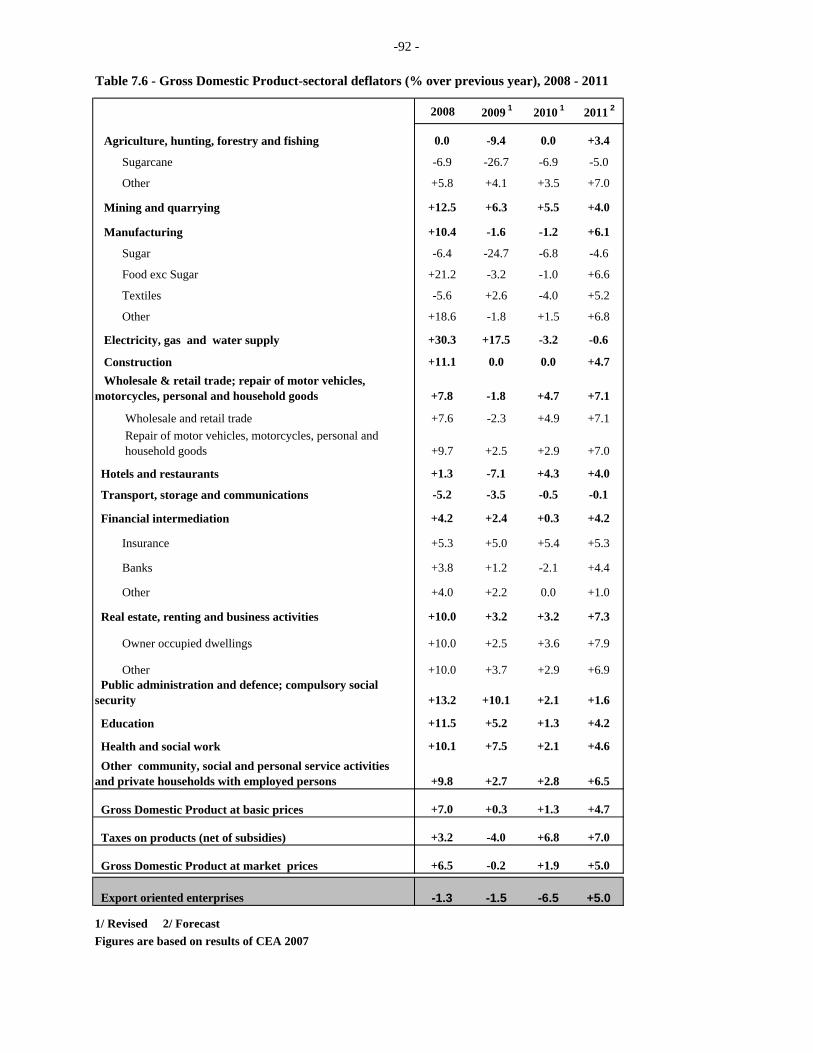
-92 -
Table 7.6 - Gross Domestic Product-sectoral deflators (% over previous year), 2008 - 2011
2008 2009 1 2010 1 2011 2
Agriculture, hunting, forestry and fishing 0.0 -9.4 0.0 +3.4
Sugarcane -6.9 -26.7 -6.9 -5.0
Other +5.8 +4.1 +3.5 +7.0
Mining and quarrying +12.5 +6.3 +5.5 +4.0
Manufacturing +10.4 -1.6 -1.2 +6.1
Sugar -6.4 -24.7 -6.8 -4.6
Food exc Sugar +21.2 -3.2 -1.0 +6.6
Textiles -5.6 +2.6 -4.0 +5.2
Other +18.6 -1.8 +1.5 +6.8
Electricity, gas and water supply +30.3 +17.5 -3.2 -0.6
Construction +11.1 0.0 0.0 +4.7 Wholesale & retail trade; repair of motor vehicles, motorcycles, personal and household goods +7.8 -1.8 +4.7 +7.1
Wholesale and retail trade +7.6 -2.3 +4.9 +7.1 Repair of motor vehicles, motorcycles, personal and household goods +9.7 +2.5 +2.9 +7.0
Hotels and restaurants +1.3 -7.1 +4.3 +4.0
Transport, storage and communications -5.2 -3.5 -0.5 -0.1
Financial intermediation +4.2 +2.4 +0.3 +4.2
Insurance +5.3 +5.0 +5.4 +5.3
Banks +3.8 +1.2 -2.1 +4.4
Other +4.0 +2.2 0.0 +1.0
Real estate, renting and business activities +10.0 +3.2 +3.2 +7.3
Owner occupied dwellings +10.0 +2.5 +3.6 +7.9
Other +10.0 +3.7 +2.9 +6.9 Public administration and defence; compulsory social security +13.2 +10.1 +2.1 +1.6
Education +11.5 +5.2 +1.3 +4.2
Health and social work +10.1 +7.5 +2.1 +4.6 Other community, social and personal service activities and private households with employed persons +9.8 +2.7 +2.8 +6.5
Gross Domestic Product at basic prices +7.0 +0.3 +1.3 +4.7
Taxes on products (net of subsidies) +3.2 -4.0 +6.8 +7.0
Gross Domestic Product at market prices +6.5 -0.2 +1.9 +5.0
Export oriented enterprises -1.3 -1.5 -6.5 +5.0
1/ Revised 2/ ForecastFigures are based on results of CEA 2007

- 93 -
Table 7.7 - Expenditure on Gross Domestic Product at current prices, 2008 - 2011(R Million)
2008 2009 1 2010 1 2011 2
Final consumption expenditure 235,549 248,587 261,930 287,162 Households 200,760 208,858 220,305 243,363
General government 34,789 39,729 41,625 43,799
Individual (14,666) (16,664) (17,656) (18,396) Collective (20,123) (23,065) (23,969) (25,403)
Gross domestic fixed capital formation 67,529 74,430 74,395 81,272
Private sector 56,161 55,788 56,145 59,514
Public sector 11,368 18,642 18,250 21,758
Increase in inventories 3 7,352 -14,510 -3,015 2,337
Exports of goods & services 145,204 138,168 156,945 174,440
Goods ( f.o.b ) 67,970 61,681 69,556 78,000
Services 77,234 76,487 87,389 96,440
Less Imports of goods & services 181,319 164,622 190,912 217,546
Goods ( f.o.b ) 124,567 111,154 127,869 149,730
Services 56,752 53,468 63,043 67,816
Gross Domestic Product at market pric 274,316 282,053 299,343 327,666
Table 7.8 - Expenditure on GDP-Growth rates (% over previous year), 2008 - 2011
2008 2009 1 2010 1 2011 2
Final consumption expenditure +5.2 +2.4 +2.7 +3.0 Households +6.7 +2.1 +2.6 +2.9
General government -1.4 +5.1 +3.4 +3.4
Individual -0.8 +3.5 +4.0 +3.2
Collective -1.8 +6.3 +3.0 +3.5
Gross domestic fixed capital formation +1.3 +8.9 -0.7 +3.6
Private sector +7.2 -1.3 0.0 +0.6
Public sector -20.2 +59.5 -2.8 +12.9
Exports of goods & services +4.0 -3.5 +16.3 +4.0
Goods ( f.o.b ) -0.6 -9.3 +16.6 +4.5
Services +8.5 +1.6 +16.1 +3.6
Less Imports of goods & services +1.8 -9.1 +7.1 +7.2
Goods ( f.o.b ) -0.4 -8.9 +7.1 +9.4
Services +6.6 -9.3 +7.0 +2.7
1/ Revised 2/ Forecast
3/ includes all statistical discrepancies4/ Figures for exports and imports of services are not equal to those compiled by the BOM, due to the difference in the treatmeof FISIM by CSO and BOM
Figures are based on results of CEA 2007
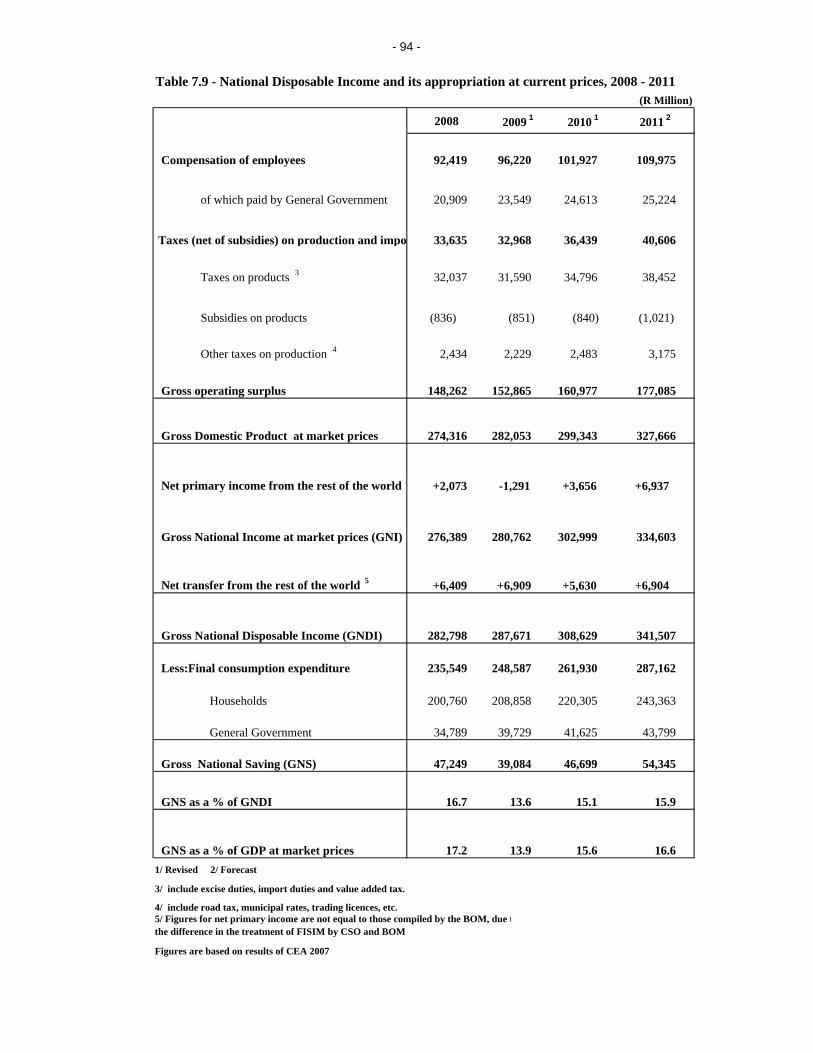
- 94 -
Table 7.9 - National Disposable Income and its appropriation at current prices, 2008 - 2011(R Million)
2008 2009 1 2010 1 2011 2
Compensation of employees 92,419 96,220 101,927 109,975
of which paid by General Government 20,909 23,549 24,613 25,224
Taxes (net of subsidies) on production and impo 33,635 32,968 36,439 40,606
Taxes on products 3 32,037 31,590 34,796 38,452
Subsidies on products (836) (851) (840) (1,021)
Other taxes on production 4 2,434 2,229 2,483 3,175
Gross operating surplus 148,262 152,865 160,977 177,085
Gross Domestic Product at market prices 274,316 282,053 299,343 327,666
Net primary income from the rest of the world 5 +2,073 -1,291 +3,656 +6,937
Gross National Income at market prices (GNI) 276,389 280,762 302,999 334,603
Net transfer from the rest of the world 5 +6,409 +6,909 +5,630 +6,904
Gross National Disposable Income (GNDI) 282,798 287,671 308,629 341,507
Less:Final consumption expenditure 235,549 248,587 261,930 287,162
Households 200,760 208,858 220,305 243,363
General Government 34,789 39,729 41,625 43,799
Gross National Saving (GNS) 47,249 39,084 46,699 54,345
GNS as a % of GNDI 16.7 13.6 15.1 15.9
GNS as a % of GDP at market prices 17.2 13.9 15.6 16.6 1/ Revised 2/ Forecast
3/ include excise duties, import duties and value added tax.
4/ include road tax, municipal rates, trading licences, etc.5/ Figures for net primary income are not equal to those compiled by the BOM, due tthe difference in the treatment of FISIM by CSO and BOM
Figures are based on results of CEA 2007
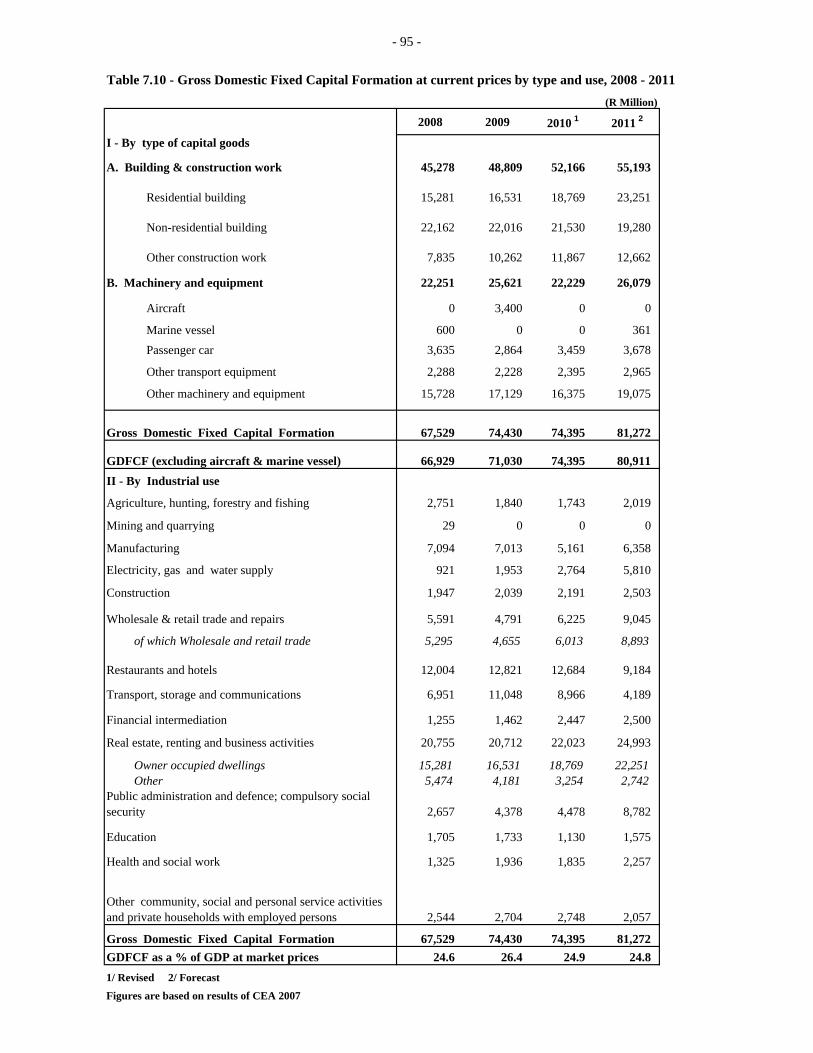
- 95 -
Table 7.10 - Gross Domestic Fixed Capital Formation at current prices by type and use, 2008 - 2011(R Million)
2008 2009 2010 1 2011 2
I - By type of capital goods
A. Building & construction work 45,278 48,809 52,166 55,193
Residential building 15,281 16,531 18,769 23,251
Non-residential building 22,162 22,016 21,530 19,280
Other construction work 7,835 10,262 11,867 12,662
B. Machinery and equipment 22,251 25,621 22,229 26,079
Aircraft 0 3,400 0 0
Marine vessel 600 0 0 361 Passenger car 3,635 2,864 3,459 3,678
Other transport equipment 2,288 2,228 2,395 2,965
Other machinery and equipment 15,728 17,129 16,375 19,075
Gross Domestic Fixed Capital Formation 67,529 74,430 74,395 81,272
GDFCF (excluding aircraft & marine vessel) 66,929 71,030 74,395 80,911 II - By Industrial use
Agriculture, hunting, forestry and fishing 2,751 1,840 1,743 2,019
Mining and quarrying 29 0 0 0
Manufacturing 7,094 7,013 5,161 6,358
Electricity, gas and water supply 921 1,953 2,764 5,810
Construction 1,947 2,039 2,191 2,503
Wholesale & retail trade and repairs 5,591 4,791 6,225 9,045
of which Wholesale and retail trade 5,295 4,655 6,013 8,893
Restaurants and hotels 12,004 12,821 12,684 9,184
Transport, storage and communications 6,951 11,048 8,966 4,189
Financial intermediation 1,255 1,462 2,447 2,500
Real estate, renting and business activities 20,755 20,712 22,023 24,993
Owner occupied dwellings 15,281 16,531 18,769 22,251 Other 5,474 4,181 3,254 2,742 Public administration and defence; compulsory social security 2,657 4,378 4,478 8,782
Education 1,705 1,733 1,130 1,575
Health and social work 1,325 1,936 1,835 2,257
Other community, social and personal service activities and private households with employed persons 2,544 2,704 2,748 2,057
Gross Domestic Fixed Capital Formation 67,529 74,430 74,395 81,272 GDFCF as a % of GDP at market prices 24.6 26.4 24.9 24.8 1/ Revised 2/ Forecast
Figures are based on results of CEA 2007

- 96 -
Table 7.11 - Gross Domestic Fixed Capital Formation - Annual real growth rates (%) by type and use, 2008 - 2011
2008 2009 2010 1 2011 2
I - By type of capital goods
A. Building & construction work +13.3 +7.7 +7.0 +1.2
Residential building +18.0 +8.1 +13.7 +18.5
Non-residential building +12.2 -0.8 -2.1 -14.3
Other construction work +8.1 +30.8 +15.8 +2.1
B. Machinery and equipment -15.8 +11.4 -15.4 +9.3
Machinery and equipment (excluding aircraft & marine vessel) -9.1 +0.8 -2.4 +21.2
Passenger car +5.6 -25.8 +17.8 +0.6
Other transport equipment -41.1 +70.3 -58.7 +32.3
Other transport equipment (excluding aircraft & marine -5.1 -14.9 +4.4 +17.9
Other machinery and equipment -12.7 +9.2 -6.7 +7.9
Gross Domestic Fixed Capital Formation +1.3 +8.9 -0.7 +3.6
GDFCF (excluding aircraft & marine vessel) +4.6 +5.5 +3.7 +3.5 II - By Industrial use
Agriculture, hunting, forestry and fishing +0.3 -33.9 -6.6 +8.8
Mining and quarrying +183.5 -100.0 0.0 0.0
Manufacturing -23.7 -1.4 -28.0 +15.3
Electricity , gas and water supply -61.0 +112.2 +39.6 +96.3
Construction +9.1 +3.1 +6.1 +8.2
Wholesale & retail trade and repairs +5.9 -15.7 +26.9 +38.4 of which Wholesale and retail trade +6.4 -13.5 +29.6 +40.9
Restaurants and hotels +6.6 +6.7 -1.2 -31.1
Transport , storage and communications -26.6 +51.3 -19.7 -55.7
Financial intermediation -18.7 +15.3 +65.7 -4.1
Real estate, renting and business activities +27.9 -0.5 +6.2 +8.4
Owner occupied dwellings +18.0 +8.1 +13.7 +13.4
Other +65.3 -24.4 -23.4 -20.6
Public administration and defence;compulsory social security +37.5 +61.8 +1.7 +86.6
Education +37.6 +1.5 -35.4 +32.0
Health and social work +56.1 +45.7 -6.2 +15.8
Other community, social and personal service activities and private households with employed persons +2.9 +5.5 +0.6 -29.2
Gross Domestic Fixed Capital Formation +1.3 +8.9 -0.7 +3.6
1/ Revised 2/ ForecastFigures are based on results of CEA 2007
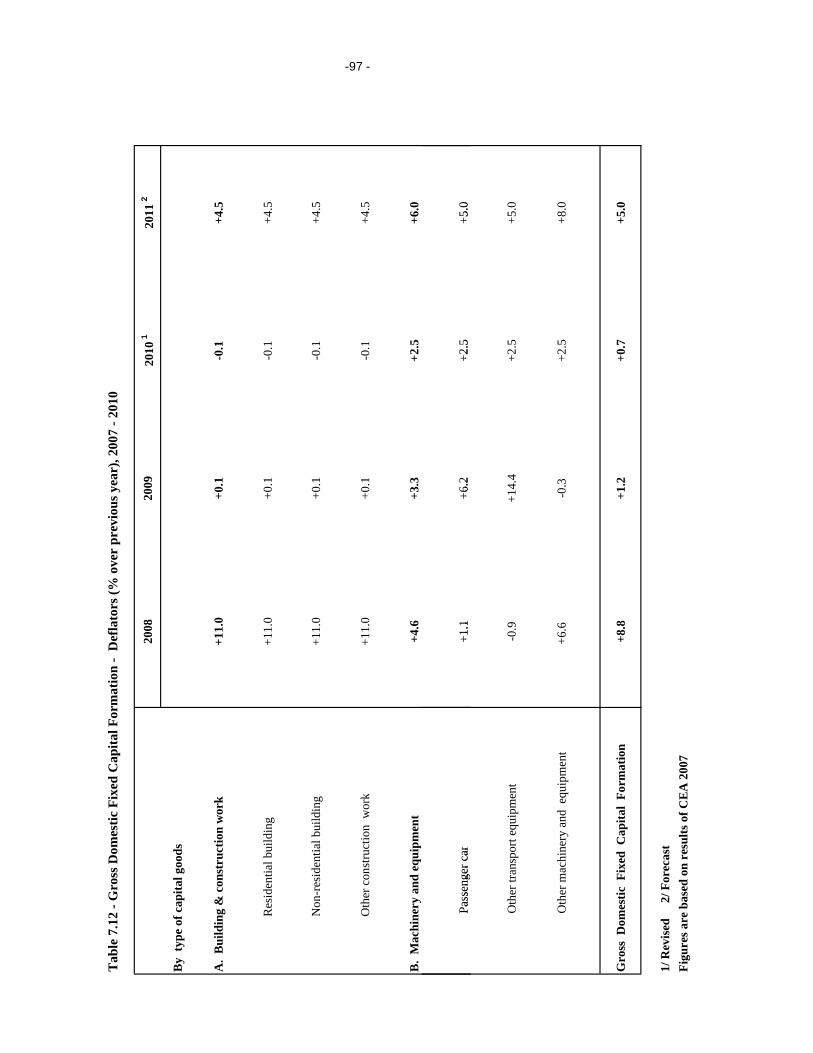
Tab
le 7
.12
- Gro
ss D
omes
tic F
ixed
Cap
ital F
orm
atio
n -
Def
lato
rs (%
ove
r pr
evio
us y
ear)
, 200
7 - 2
010
2008
2009
2010
120
11 2
By
type
of c
apita
l goo
ds
A.
Bui
ldin
g &
con
stru
ctio
n w
ork
+11.
0+0
.1-0
.1+4
.5
Res
iden
tial b
uild
ing
+11.
0+0
.1-0
.1+4
.5
Non
-res
iden
tial b
uild
ing
+11.
0+0
.1-0
.1+4
.5
Oth
er c
onst
ruct
ion
wor
k+1
1.0
+0.1
-0.1
+4.5
B.
Mac
hine
ry a
nd e
quip
men
t+4
.6+3
.3+2
.5+6
.0
Pas
seng
er c
ar+1
.1+6
.2+2
.5+5
.0
-97 -
Pas
seng
er c
ar+1
.1+6
.2+2
.5+5
.0
Oth
er tr
ansp
ort e
quip
men
t-0
.9+1
4.4
+2.5
+5.0
Oth
er m
achi
nery
and
equ
ipm
ent
+6.6
-0.3
+2.5
+8.0
Gro
ss D
omes
tic F
ixed
Cap
ital
Form
atio
n+8
.8+1
.2+0
.7+5
.0
1/ R
evis
ed
2/ F
orec
ast
Figu
res a
re b
ased
on
resu
lts o
f CE
A 2
007
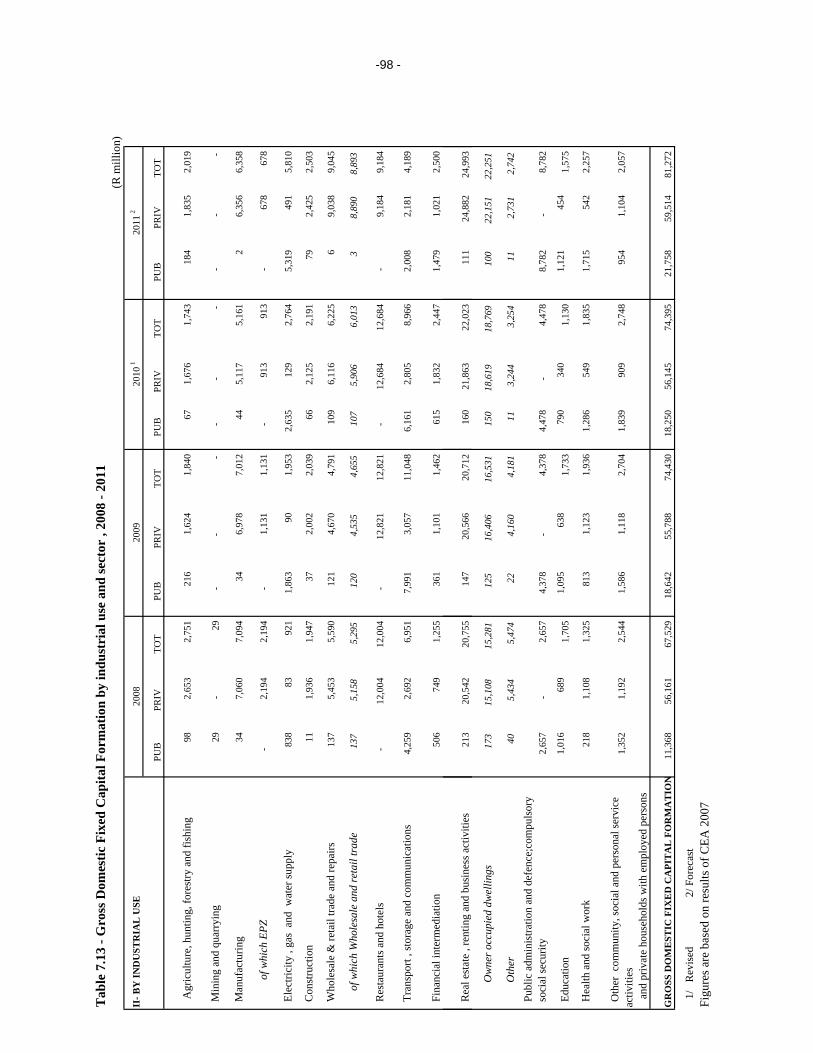
Tab
le 7
.13
- Gro
ss D
omes
tic F
ixed
Cap
ital F
orm
atio
n by
indu
stri
al u
se a
nd se
ctor
, 20
08 -
2011
(R m
illio
n)
II- B
Y IN
DU
STR
IAL
USE
PUB
PRIV
TOT
PUB
PRIV
TOT
PUB
PRIV
TOT
PUB
PRIV
TOT
A
gric
ultu
re, h
untin
g, fo
rest
ry a
nd fi
shin
g98
2,
653
2,75
1 21
6 1,
624
1,84
0 67
1,
676
1,74
3 18
4 1,
835
2,01
9
Min
ing
and
quar
ryin
g29
-
29
- -
- -
--
- -
-
Man
ufac
turin
g34
7,
060
7,09
4 34
6,
978
7,01
2 44
5,
117
5,16
1 2
6,35
6 6,
358
o
f whi
ch E
PZ -
2,19
4 2,
194
-1,
131
1,13
1 -
913
913
-67
8 67
8
Ele
ctric
ity ,
gas
and
wat
er su
pply
838
83
921
1,86
3 90
1,
953
2,63
5 12
9 2,
764
5,31
9 49
1 5,
810
Con
stru
ctio
n11
1,
936
1,94
7 37
2,
002
2,03
9 66
2,
125
2,19
1 79
2,
425
2,50
3
Who
lesa
le &
reta
il tra
de a
nd re
pairs
137
5,45
3 5,
590
121
4,67
0 4,
791
109
6,11
6 6,
225
6 9,
038
9,04
5
of w
hich
Who
lesa
le a
nd re
tail
trad
e13
7 5,
158
5,29
5 12
0 4,
535
4,65
5 10
7 5,
906
6,01
3 3
8,89
0 8,
893
Res
taur
ants
and
hot
els
-12
,004
12
,004
-
12,8
21
12,8
21
-12
,684
12
,684
-
9,18
4 9,
184
Tra
nspo
rt , s
tora
ge a
nd c
omm
unic
atio
ns
4,25
9 2,
692
6,95
1 7,
991
3,05
7 11
,048
6,
161
2,80
5 8,
966
2,00
8 2,
181
4,18
9
Fin
anci
al in
term
edia
tion
506
749
1,25
5 36
1 1,
101
1,46
2 61
5 1,
832
2,44
7 1,
479
1,02
1 2,
500
2008
2009
20
10 1
2011
2
-98 -
Rea
l est
ate
, ren
ting
and
busi
ness
act
iviti
es
213
20,5
42
20,7
55
147
20,5
66
20,7
12
160
21,8
63
22,0
23
111
24,8
82
24,9
93
O
wne
r occ
upie
d dw
ellin
gs17
3 15
,108
15
,281
12
5 16
,406
16
,531
15
0 18
,619
18
,769
10
0 22
,151
22
,251
O
ther
40
5,43
4 5,
474
22
4,16
0 4,
181
11
3,24
4 3,
254
11
2,73
1 2,
742
Pub
lic a
dmin
istra
tion
and
defe
nce;
com
puls
ory
soc
ial s
ecur
ity2,
657
-2,
657
4,37
8 -
4,37
8 4,
478
-4,
478
8,78
2 -
8,78
2
Edu
catio
n1,
016
689
1,70
5 1,
095
638
1,73
3 79
0 34
0 1,
130
1,12
1 45
4 1,
575
Hea
lth a
nd so
cial
wor
k21
8 1,
108
1,32
5 81
3 1,
123
1,93
6 1,
286
549
1,83
5 1,
715
542
2,25
7
Oth
er c
omm
unity
, soc
ial a
nd p
erso
nal s
ervi
ce
activ
ities
an
d pr
ivat
e ho
useh
olds
with
em
ploy
ed p
erso
ns
1,35
2 1,
192
2,54
4 1,
586
1,11
8 2,
704
1,83
9 90
9 2,
748
954
1,10
4 2,
057
GR
OSS
DO
ME
STIC
FIX
ED
CA
PIT
AL
FO
RM
AT
ION
11,3
68
56,1
61
67,5
29
18,6
42
55,7
88
74,4
30
18,2
50
56,1
45
74,3
95
21,7
58
59,5
14
81,2
72
1/
R
evis
ed
2/
For
ecas
tFi
gure
s are
bas
ed o
n re
sults
of C
EA 2
007
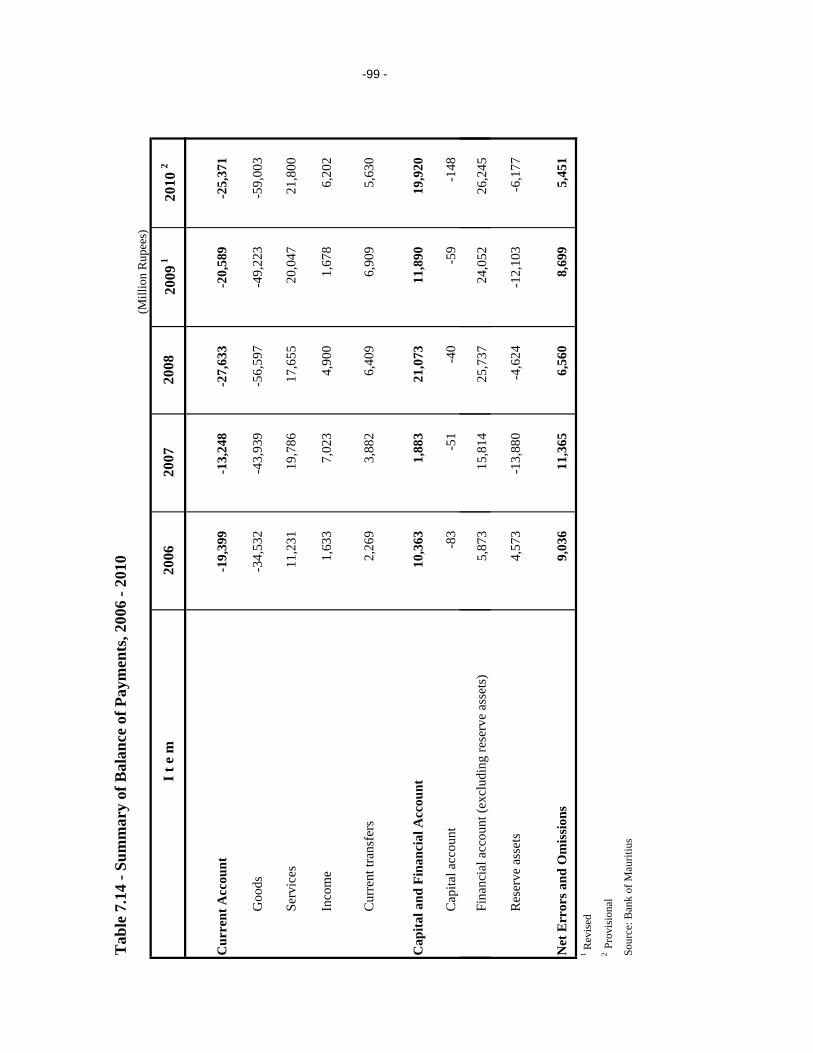
Tab
le 7
.14
- Sum
mar
y of
Bal
ance
of P
aym
ents
, 200
6 - 2
010
(Mill
ion
Rup
ees)
I t e
m20
0620
0720
0820
09 1
2010
2
Cur
rent
Acc
ount
-19,
399
-13,
248
-27,
633
-20,
589
-25,
371
Goo
ds
-34,
532
-43,
939
-56,
597
-49,
223
-59,
003
Serv
ices
11,2
31
19
,786
17,6
55
20
,047
21,8
00
Inco
me
1,63
3
7,
023
4,90
0
1,
678
6,20
2
Cur
rent
tran
sfer
s2,
269
3,88
2
6,
409
6,90
9
5,
630
Cap
ital a
nd F
inan
cial
Acc
ount
10,3
63
1,
883
21,0
73
11
,890
19,9
20
Cap
ital a
ccou
nt-8
3
-5
1
-4
0
-5
9
-1
48
Fina
ncia
l acc
ount
(exc
ludi
ng re
serv
e as
sets
)5,
873
15,8
14
25
,737
24,0
52
26
,245
-99 -
Res
erve
ass
ets
4,57
3
-1
3,88
0
-4
,624
-12,
103
-6,1
77
Net
Err
ors a
nd O
mis
sion
s9,
036
11,3
65
6,
560
8,69
9
5,
451
1 Rev
ised
2
Prov
isio
nal
Sour
ce: B
ank
of M
aurit
ius
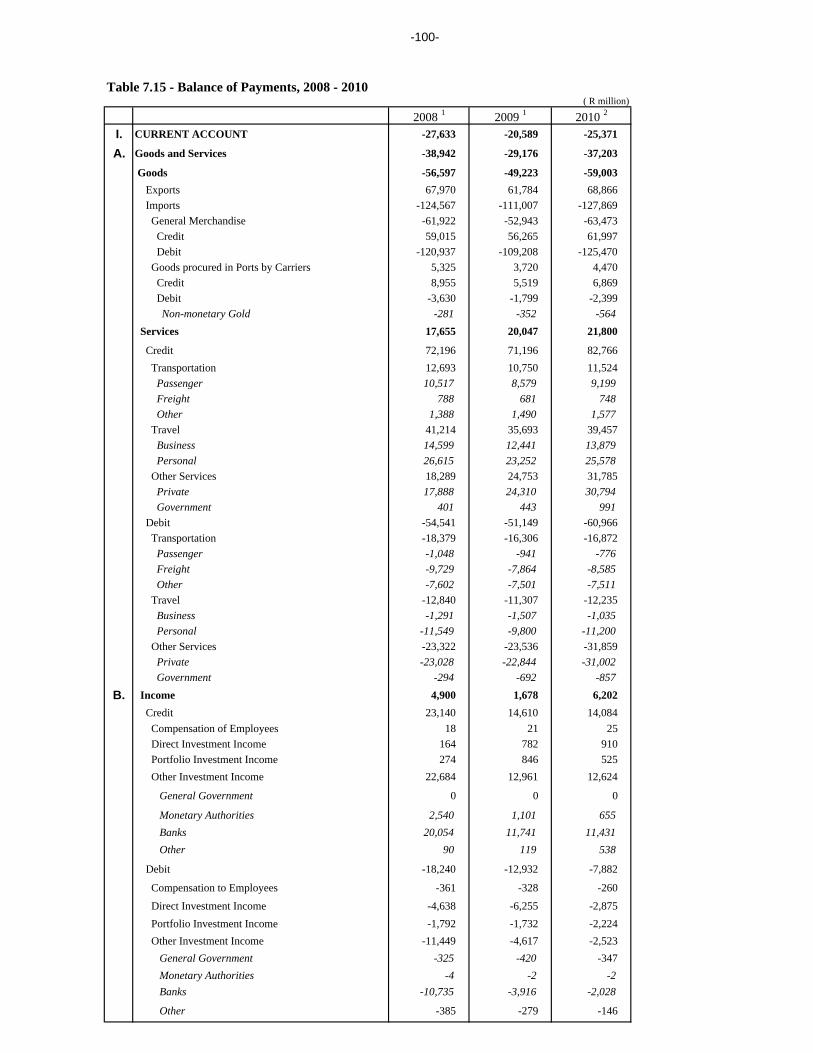
-100-
Table 7.15 - Balance of Payments, 2008 - 2010 ( R million)
2008 1 2009 1 2010 2
I. CURRENT ACCOUNT -27,633 -20,589 -25,371
A. Goods and Services -38,942 -29,176 -37,203
Goods -56,597 -49,223 -59,003 Exports 67,970 61,784 68,866 Imports -124,567 -111,007 -127,869 General Merchandise -61,922 -52,943 -63,473 Credit 59,015 56,265 61,997 Debit -120,937 -109,208 -125,470 Goods procured in Ports by Carriers 5,325 3,720 4,470 Credit 8,955 5,519 6,869 Debit -3,630 -1,799 -2,399 Non-monetary Gold -281 -352 -564 Services 17,655 20,047 21,800
Credit 72,196 71,196 82,766 Transportation 12,693 10,750 11,524 Passenger 10,517 8,579 9,199 Freight 788 681 748 Other 1,388 1,490 1,577 Travel 41,214 35,693 39,457 Business 14,599 12,441 13,879 Personal 26,615 23,252 25,578 Other Services 18,289 24,753 31,785 Private 17,888 24,310 30,794 Government 401 443 991 Debit -54,541 -51,149 -60,966 Transportation -18,379 -16,306 -16,872 Passenger -1,048 -941 -776 Freight -9,729 -7,864 -8,585 Other -7,602 -7,501 -7,511 Travel -12,840 -11,307 -12,235 Business -1,291 -1,507 -1,035 Personal -11,549 -9,800 -11,200 Other Services -23,322 -23,536 -31,859 Private -23,028 -22,844 -31,002 Government -294 -692 -857
B. Income 4,900 1,678 6,202 Credit 23,140 14,610 14,084 Compensation of Employees 18 21 25 Direct Investment Income 164 782 910 Portfolio Investment Income 274 846 525 Other Investment Income 22,684 12,961 12,624
General Government 0 0 0
Monetary Authorities 2,540 1,101 655 Banks 20,054 11,741 11,431 Other 90 119 538
Debit -18,240 -12,932 -7,882
Compensation to Employees -361 -328 -260
Direct Investment Income -4,638 -6,255 -2,875 Portfolio Investment Income -1,792 -1,732 -2,224 Other Investment Income -11,449 -4,617 -2,523 General Government -325 -420 -347 Monetary Authorities -4 -2 -2 Banks -10,735 -3,916 -2,028
Other -385 -279 -146
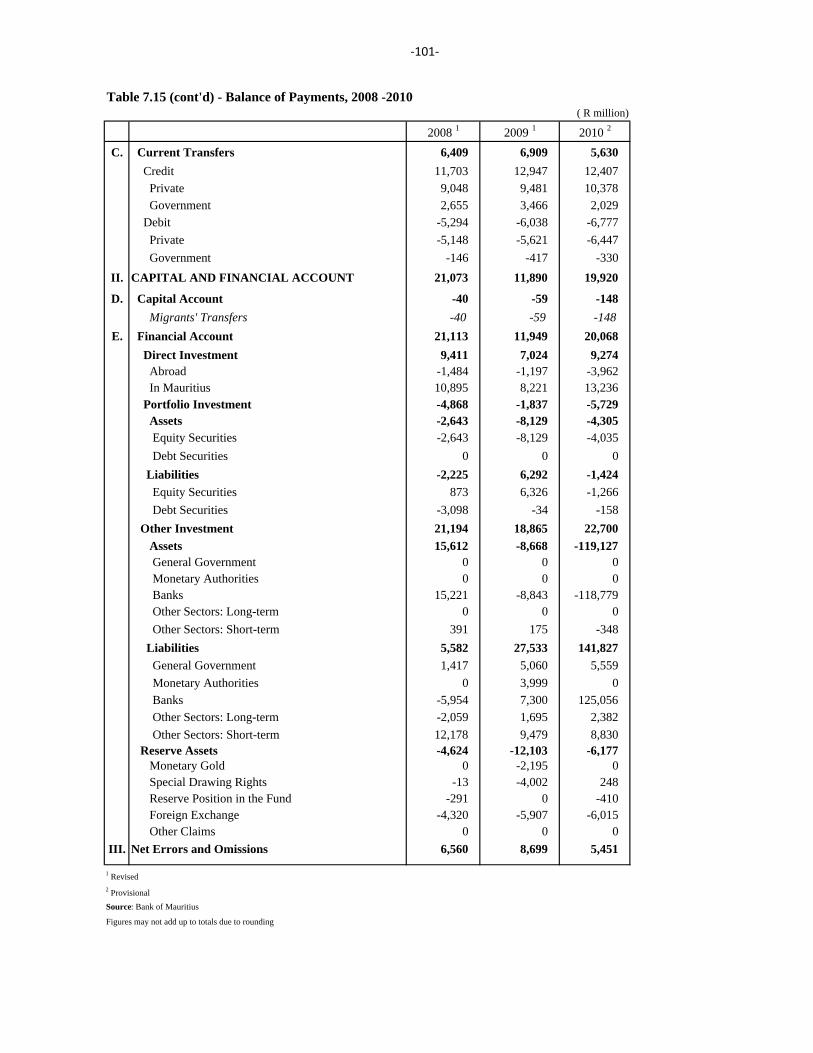
‐101‐
Table 7.15 (cont'd) - Balance of Payments, 2008 -2010 ( R million)
2008 1 2009 1 2010 2
C. Current Transfers 6,409 6,909 5,630 Credit 11,703 12,947 12,407 Private 9,048 9,481 10,378 Government 2,655 3,466 2,029 Debit -5,294 -6,038 -6,777 Private -5,148 -5,621 -6,447 Government -146 -417 -330
II. CAPITAL AND FINANCIAL ACCOUNT 21,073 11,890 19,920
D. Capital Account -40 -59 -148 Migrants' Transfers -40 -59 -148
E. Financial Account 21,113 11,949 20,068 Direct Investment 9,411 7,024 9,274 Abroad -1,484 -1,197 -3,962 In Mauritius 10,895 8,221 13,236 Portfolio Investment -4,868 -1,837 -5,729 Assets -2,643 -8,129 -4,305 Equity Securities -2,643 -8,129 -4,035 Debt Securities 0 0 0 Liabilities -2,225 6,292 -1,424 Equity Securities 873 6,326 -1,266 Debt Securities -3,098 -34 -158 Other Investment 21,194 18,865 22,700 Assets 15,612 -8,668 -119,127 General Government 0 0 0 Monetary Authorities 0 0 0 Banks 15,221 -8,843 -118,779 Other Sectors: Long-term 0 0 0 Other Sectors: Short-term 391 175 -348 Liabilities 5,582 27,533 141,827 General Government 1,417 5,060 5,559 Monetary Authorities 0 3,999 0 Banks -5,954 7,300 125,056 Other Sectors: Long-term -2,059 1,695 2,382 Other Sectors: Short-term 12,178 9,479 8,830 Reserve Assets -4,624 -12,103 -6,177 Monetary Gold 0 -2,195 0 Special Drawing Rights -13 -4,002 248 Reserve Position in the Fund -291 0 -410 Foreign Exchange -4,320 -5,907 -6,015 Other Claims 0 0 0
III. Net Errors and Omissions 6,560 8,699 5,451
1 Revised 2 Provisional Source: Bank of Mauritius
Figures may not add up to totals due to rounding
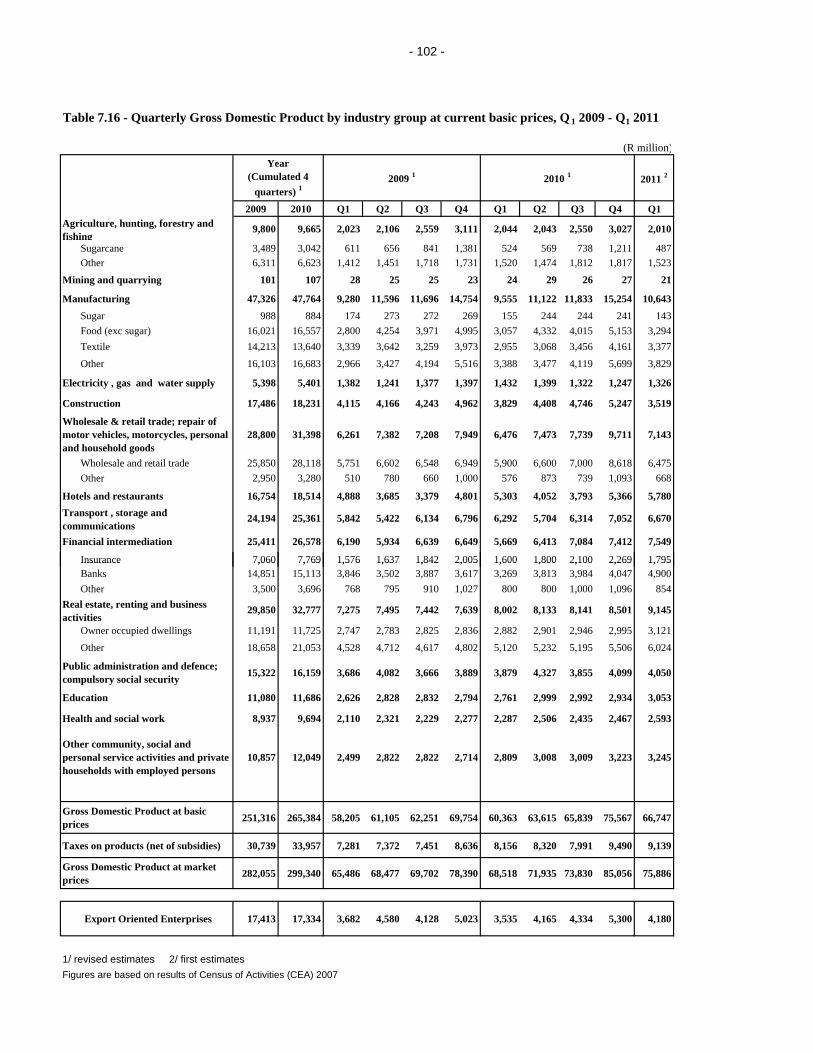
- 102 -
(R million)
2011 2
2009 2010 Q1 Q2 Q3 Q4 Q1 Q2 Q3 Q4 Q1Agriculture, hunting, forestry and fishing
9,800 9,665 2,023 2,106 2,559 3,111 2,044 2,043 2,550 3,027 2,010
Sugarcane 3,489 3,042 611 656 841 1,381 524 569 738 1,211 487 Other 6,311 6,623 1,412 1,451 1,718 1,731 1,520 1,474 1,812 1,817 1,523
Mining and quarrying 101 107 28 25 25 23 24 29 26 27 21
Manufacturing 47,326 47,764 9,280 11,596 11,696 14,754 9,555 11,122 11,833 15,254 10,643 Sugar 988 884 174 273 272 269 155 244 244 241 143 Food (exc sugar) 16,021 16,557 2,800 4,254 3,971 4,995 3,057 4,332 4,015 5,153 3,294 Textile 14,213 13,640 3,339 3,642 3,259 3,973 2,955 3,068 3,456 4,161 3,377
Other 16,103 16,683 2,966 3,427 4,194 5,516 3,388 3,477 4,119 5,699 3,829
Electricity , gas and water supply 5,398 5,401 1,382 1,241 1,377 1,397 1,432 1,399 1,322 1,247 1,326
Construction 17,486 18,231 4,115 4,166 4,243 4,962 3,829 4,408 4,746 5,247 3,519
Wholesale & retail trade; repair of motor vehicles, motorcycles, personal and household goods
28,800 31,398 6,261 7,382 7,208 7,949 6,476 7,473 7,739 9,711 7,143
Wholesale and retail trade 25,850 28,118 5,751 6,602 6,548 6,949 5,900 6,600 7,000 8,618 6,475 Other 2,950 3,280 510 780 660 1,000 576 873 739 1,093 668
Hotels and restaurants 16,754 18,514 4,888 3,685 3,379 4,801 5,303 4,052 3,793 5,366 5,780Transport , storage and communications
24,194 25,361 5,842 5,422 6,134 6,796 6,292 5,704 6,314 7,052 6,670
Financial intermediation 25,411 26,578 6,190 5,934 6,639 6,649 5,669 6,413 7,084 7,412 7,549
Insurance 7,060 7,769 1,576 1,637 1,842 2,005 1,600 1,800 2,100 2,269 1,795
Table 7.16 - Quarterly Gross Domestic Product by industry group at current basic prices, Q 1 2009 - Q1 2011
Year (Cumulated 4
quarters) 12009 1 2010 1
Insurance 7,060 7,769 1,576 1,637 1,842 2,005 1,600 1,800 2,100 2,269 1,795 Banks 14,851 15,113 3,846 3,502 3,887 3,617 3,269 3,813 3,984 4,047 4,900 Other 3,500 3,696 768 795 910 1,027 800 800 1,000 1,096 854Real estate, renting and business activities
29,850 32,777 7,275 7,495 7,442 7,639 8,002 8,133 8,141 8,501 9,145
Owner occupied dwellings 11,191 11,725 2,747 2,783 2,825 2,836 2,882 2,901 2,946 2,995 3,121
Other 18,658 21,053 4,528 4,712 4,617 4,802 5,120 5,232 5,195 5,506 6,024
Public administration and defence; compulsory social security 15,322 16,159 3,686 4,082 3,666 3,889 3,879 4,327 3,855 4,099 4,050
Education 11,080 11,686 2,626 2,828 2,832 2,794 2,761 2,999 2,992 2,934 3,053
Health and social work 8,937 9,694 2,110 2,321 2,229 2,277 2,287 2,506 2,435 2,467 2,593
Other community, social and personal service activities and private households with employed persons
10,857 12,049 2,499 2,822 2,822 2,714 2,809 3,008 3,009 3,223 3,245
Gross Domestic Product at basic prices 251,316 265,384 58,205 61,105 62,251 69,754 60,363 63,615 65,839 75,567 66,747
Taxes on products (net of subsidies) 30,739 33,957 7,281 7,372 7,451 8,636 8,156 8,320 7,991 9,490 9,139
Gross Domestic Product at market prices 282,055 299,340 65,486 68,477 69,702 78,390 68,518 71,935 73,830 85,056 75,886
Export Oriented Enterprises 17,413 17,334 3,682 4,580 4,128 5,023 3,535 4,165 4,334 5,300 4,180
1/ revised estimates 2/ first estimatesFigures are based on results of Census of Activities (CEA) 2007
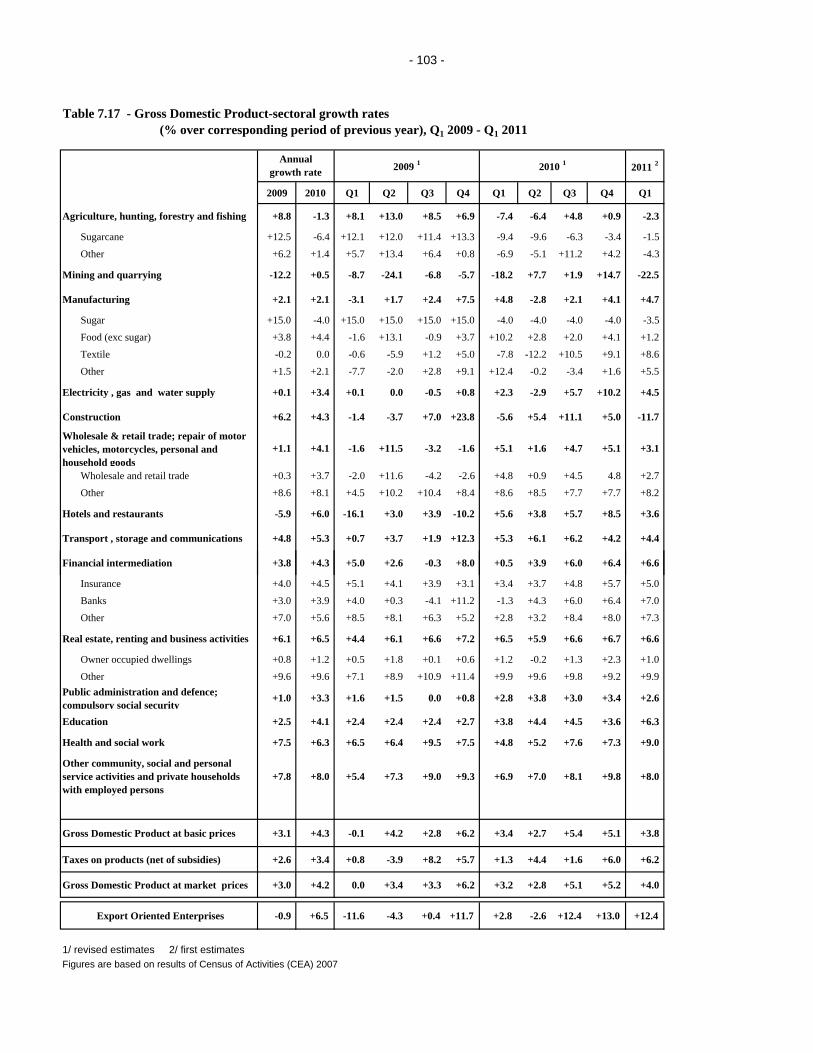
- 103 -
2011 2
2009 2010 Q1 Q2 Q3 Q4 Q1 Q2 Q3 Q4 Q1
Agriculture, hunting, forestry and fishing +8.8 -1.3 +8.1 +13.0 +8.5 +6.9 -7.4 -6.4 +4.8 +0.9 -2.3
Sugarcane +12.5 -6.4 +12.1 +12.0 +11.4 +13.3 -9.4 -9.6 -6.3 -3.4 -1.5
Other +6.2 +1.4 +5.7 +13.4 +6.4 +0.8 -6.9 -5.1 +11.2 +4.2 -4.3
Mining and quarrying -12.2 +0.5 -8.7 -24.1 -6.8 -5.7 -18.2 +7.7 +1.9 +14.7 -22.5
Manufacturing +2.1 +2.1 -3.1 +1.7 +2.4 +7.5 +4.8 -2.8 +2.1 +4.1 +4.7
Sugar +15.0 -4.0 +15.0 +15.0 +15.0 +15.0 -4.0 -4.0 -4.0 -4.0 -3.5
Food (exc sugar) +3.8 +4.4 -1.6 +13.1 -0.9 +3.7 +10.2 +2.8 +2.0 +4.1 +1.2
Textile -0.2 0.0 -0.6 -5.9 +1.2 +5.0 -7.8 -12.2 +10.5 +9.1 +8.6
Other +1.5 +2.1 -7.7 -2.0 +2.8 +9.1 +12.4 -0.2 -3.4 +1.6 +5.5
Electricity , gas and water supply +0.1 +3.4 +0.1 0.0 -0.5 +0.8 +2.3 -2.9 +5.7 +10.2 +4.5
Construction +6.2 +4.3 -1.4 -3.7 +7.0 +23.8 -5.6 +5.4 +11.1 +5.0 -11.7
Wholesale & retail trade; repair of motor vehicles, motorcycles, personal and household goods
+1.1 +4.1 -1.6 +11.5 -3.2 -1.6 +5.1 +1.6 +4.7 +5.1 +3.1
Wholesale and retail trade +0.3 +3.7 -2.0 +11.6 -4.2 -2.6 +4.8 +0.9 +4.5 4.8 +2.7
Other +8.6 +8.1 +4.5 +10.2 +10.4 +8.4 +8.6 +8.5 +7.7 +7.7 +8.2
Hotels and restaurants -5.9 +6.0 -16.1 +3.0 +3.9 -10.2 +5.6 +3.8 +5.7 +8.5 +3.6
Transport , storage and communications +4.8 +5.3 +0.7 +3.7 +1.9 +12.3 +5.3 +6.1 +6.2 +4.2 +4.4
Table 7.17 - Gross Domestic Product-sectoral growth rates (% over corresponding period of previous year), Q1 2009 - Q1 2011
Annual growth rate 2009 1 2010 1
Financial intermediation +3.8 +4.3 +5.0 +2.6 -0.3 +8.0 +0.5 +3.9 +6.0 +6.4 +6.6
Insurance +4.0 +4.5 +5.1 +4.1 +3.9 +3.1 +3.4 +3.7 +4.8 +5.7 +5.0
Banks +3.0 +3.9 +4.0 +0.3 -4.1 +11.2 -1.3 +4.3 +6.0 +6.4 +7.0
Other +7.0 +5.6 +8.5 +8.1 +6.3 +5.2 +2.8 +3.2 +8.4 +8.0 +7.3
Real estate, renting and business activities +6.1 +6.5 +4.4 +6.1 +6.6 +7.2 +6.5 +5.9 +6.6 +6.7 +6.6
Owner occupied dwellings +0.8 +1.2 +0.5 +1.8 +0.1 +0.6 +1.2 -0.2 +1.3 +2.3 +1.0
Other +9.6 +9.6 +7.1 +8.9 +10.9 +11.4 +9.9 +9.6 +9.8 +9.2 +9.9 Public administration and defence; compulsory social security
+1.0 +3.3 +1.6 +1.5 0.0 +0.8 +2.8 +3.8 +3.0 +3.4 +2.6
Education +2.5 +4.1 +2.4 +2.4 +2.4 +2.7 +3.8 +4.4 +4.5 +3.6 +6.3
Health and social work +7.5 +6.3 +6.5 +6.4 +9.5 +7.5 +4.8 +5.2 +7.6 +7.3 +9.0
Other community, social and personal service activities and private households with employed persons
+7.8 +8.0 +5.4 +7.3 +9.0 +9.3 +6.9 +7.0 +8.1 +9.8 +8.0
Gross Domestic Product at basic prices +3.1 +4.3 -0.1 +4.2 +2.8 +6.2 +3.4 +2.7 +5.4 +5.1 +3.8
Taxes on products (net of subsidies) +2.6 +3.4 +0.8 -3.9 +8.2 +5.7 +1.3 +4.4 +1.6 +6.0 +6.2
Gross Domestic Product at market prices +3.0 +4.2 0.0 +3.4 +3.3 +6.2 +3.2 +2.8 +5.1 +5.2 +4.0
Export Oriented Enterprises -0.9 +6.5 -11.6 -4.3 +0.4 +11.7 +2.8 -2.6 +12.4 +13.0 +12.4
1/ revised estimates 2/ first estimatesFigures are based on results of Census of Activities (CEA) 2007
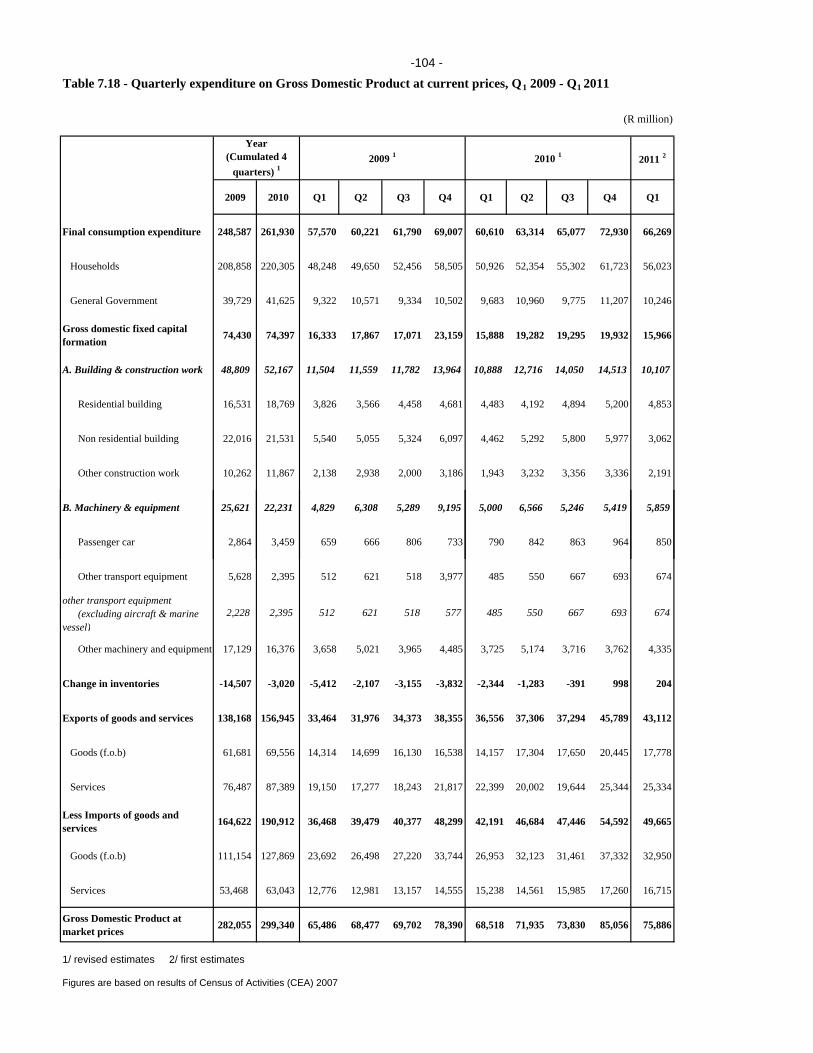
-104 -
(R million)
2011 2
2009 2010 Q1 Q2 Q3 Q4 Q1 Q2 Q3 Q4 Q1
Final consumption expenditure 248,587 261,930 57,570 60,221 61,790 69,007 60,610 63,314 65,077 72,930 66,269
Households 208,858 220,305 48,248 49,650 52,456 58,505 50,926 52,354 55,302 61,723 56,023
General Government 39,729 41,625 9,322 10,571 9,334 10,502 9,683 10,960 9,775 11,207 10,246
Gross domestic fixed capital formation 74,430 74,397 16,333 17,867 17,071 23,159 15,888 19,282 19,295 19,932 15,966
A. Building & construction work 48,809 52,167 11,504 11,559 11,782 13,964 10,888 12,716 14,050 14,513 10,107
Residential building 16,531 18,769 3,826 3,566 4,458 4,681 4,483 4,192 4,894 5,200 4,853
Non residential building 22,016 21,531 5,540 5,055 5,324 6,097 4,462 5,292 5,800 5,977 3,062
Other construction work 10,262 11,867 2,138 2,938 2,000 3,186 1,943 3,232 3,356 3,336 2,191
B. Machinery & equipment 25,621 22,231 4,829 6,308 5,289 9,195 5,000 6,566 5,246 5,419 5,859
Table 7.18 - Quarterly expenditure on Gross Domestic Product at current prices, Q1 2009 - Q1 2011
Year (Cumulated 4
quarters) 12009 1 2010 1
Passenger car 2,864 3,459 659 666 806 733 790 842 863 964 850
Other transport equipment 5,628 2,395 512 621 518 3,977 485 550 667 693 674
other transport equipment (excluding aircraft & marine vessel)
2,228 2,395 512 621 518 577 485 550 667 693 674
Other machinery and equipment 17,129 16,376 3,658 5,021 3,965 4,485 3,725 5,174 3,716 3,762 4,335
Change in inventories -14,507 -3,020 -5,412 -2,107 -3,155 -3,832 -2,344 -1,283 -391 998 204
Exports of goods and services 138,168 156,945 33,464 31,976 34,373 38,355 36,556 37,306 37,294 45,789 43,112
Goods (f.o.b) 61,681 69,556 14,314 14,699 16,130 16,538 14,157 17,304 17,650 20,445 17,778
Services 76,487 87,389 19,150 17,277 18,243 21,817 22,399 20,002 19,644 25,344 25,334
Less Imports of goods and services 164,622 190,912 36,468 39,479 40,377 48,299 42,191 46,684 47,446 54,592 49,665
Goods (f.o.b) 111,154 127,869 23,692 26,498 27,220 33,744 26,953 32,123 31,461 37,332 32,950
Services 53,468 63,043 12,776 12,981 13,157 14,555 15,238 14,561 15,985 17,260 16,715
Gross Domestic Product at market prices 282,055 299,340 65,486 68,477 69,702 78,390 68,518 71,935 73,830 85,056 75,886
1/ revised estimates 2/ first estimates
Figures are based on results of Census of Activities (CEA) 2007
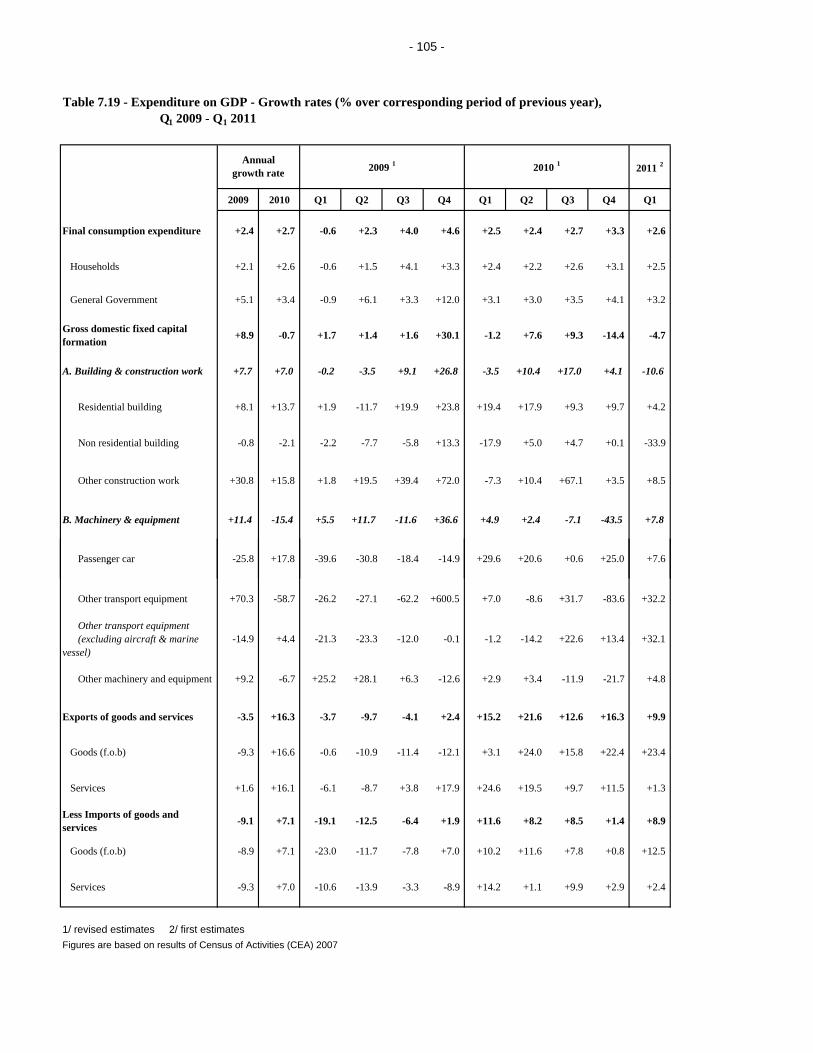
- 105 -
2011 2
2009 2010 Q1 Q2 Q3 Q4 Q1 Q2 Q3 Q4 Q1
Final consumption expenditure +2.4 +2.7 -0.6 +2.3 +4.0 +4.6 +2.5 +2.4 +2.7 +3.3 +2.6
Households +2.1 +2.6 -0.6 +1.5 +4.1 +3.3 +2.4 +2.2 +2.6 +3.1 +2.5
General Government +5.1 +3.4 -0.9 +6.1 +3.3 +12.0 +3.1 +3.0 +3.5 +4.1 +3.2
Gross domestic fixed capital formation +8.9 -0.7 +1.7 +1.4 +1.6 +30.1 -1.2 +7.6 +9.3 -14.4 -4.7
A. Building & construction work +7.7 +7.0 -0.2 -3.5 +9.1 +26.8 -3.5 +10.4 +17.0 +4.1 -10.6
Residential building +8.1 +13.7 +1.9 -11.7 +19.9 +23.8 +19.4 +17.9 +9.3 +9.7 +4.2
Non residential building -0.8 -2.1 -2.2 -7.7 -5.8 +13.3 -17.9 +5.0 +4.7 +0.1 -33.9
Other construction work +30.8 +15.8 +1.8 +19.5 +39.4 +72.0 -7.3 +10.4 +67.1 +3.5 +8.5
B. Machinery & equipment +11.4 -15.4 +5.5 +11.7 -11.6 +36.6 +4.9 +2.4 -7.1 -43.5 +7.8
Passenger car -25.8 +17.8 -39.6 -30.8 -18.4 -14.9 +29.6 +20.6 +0.6 +25.0 +7.6
Table 7.19 - Expenditure on GDP - Growth rates (% over corresponding period of previous year), Q1 2009 - Q1 2011
Annual growth rate 2009 1 2010 1
g
Other transport equipment +70.3 -58.7 -26.2 -27.1 -62.2 +600.5 +7.0 -8.6 +31.7 -83.6 +32.2
Other transport equipment (excluding aircraft & marine vessel)
-14.9 +4.4 -21.3 -23.3 -12.0 -0.1 -1.2 -14.2 +22.6 +13.4 +32.1
Other machinery and equipment +9.2 -6.7 +25.2 +28.1 +6.3 -12.6 +2.9 +3.4 -11.9 -21.7 +4.8
Exports of goods and services -3.5 +16.3 -3.7 -9.7 -4.1 +2.4 +15.2 +21.6 +12.6 +16.3 +9.9
Goods (f.o.b) -9.3 +16.6 -0.6 -10.9 -11.4 -12.1 +3.1 +24.0 +15.8 +22.4 +23.4
Services +1.6 +16.1 -6.1 -8.7 +3.8 +17.9 +24.6 +19.5 +9.7 +11.5 +1.3
Less Imports of goods and services -9.1 +7.1 -19.1 -12.5 -6.4 +1.9 +11.6 +8.2 +8.5 +1.4 +8.9
Goods (f.o.b) -8.9 +7.1 -23.0 -11.7 -7.8 +7.0 +10.2 +11.6 +7.8 +0.8 +12.5
Services -9.3 +7.0 -10.6 -13.9 -3.3 -8.9 +14.2 +1.1 +9.9 +2.9 +2.4
1/ revised estimates 2/ first estimatesFigures are based on results of Census of Activities (CEA) 2007
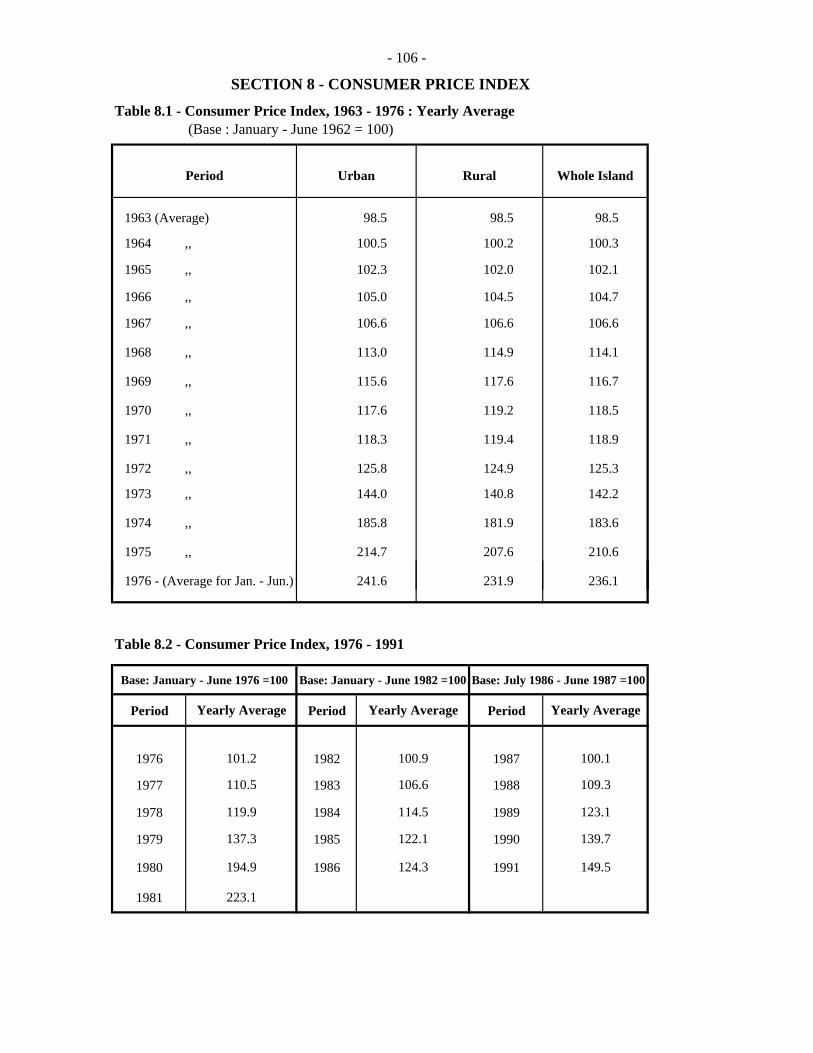
- 106 -
Table 8.1 - Consumer Price Index, 1963 - 1976 : Yearly Average(Base : January - June 1962 = 100)
1963 (Average)
1964 ,,
1965 ,,
1966 ,,
1967 ,,
1968 ,,
1969 ,,
1970 ,,
1971 ,,
1972 ,,
1973 ,,
1974 ,,
1975 ,,
SECTION 8 - CONSUMER PRICE INDEX
104.7
106.6
Period
102.0
100.2
98.5 98.5
100.3
102.1
214.7
106.6
104.5
119.2
117.6
114.9
118.3
125.8
144.0
183.6
210.6 207.6
114.1
116.7
118.5
181.9
140.8
115.6
117.6
124.9
119.4 118.9
125.3
142.2
185.8
Urban Rural Whole Island
98.5
100.5
102.3
105.0
106.6
113.0
1976 - (Average for Jan. - Jun.)
Table 8.2 - Consumer Price Index, 1976 - 1991
Base: January - June 1976 =100 Base: January - June 1982 =100 Base: July 1986 - June 1987 =100
Period Period Period
1976 1982 1987
1977 1983 1988
1978 1984 1989
1979 1985 1990
1980 1986 1991
1981
139.7
149.5
137.3
194.9
223.1
100.9
106.6
114.5
122.1
124.3
101.2
110.5
119.9
100.1
109.3
123.1
241.6 236.1 231.9
Yearly Average Yearly AverageYearly Average
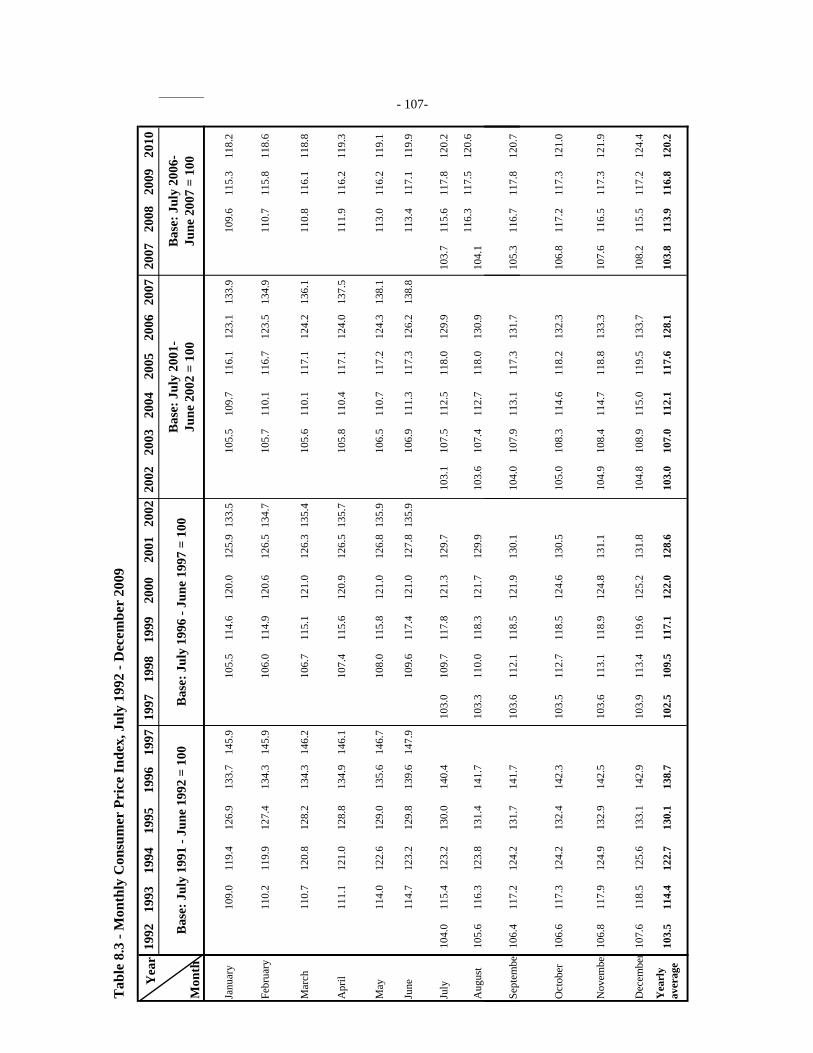
Tab
le 8
.3 -
Mon
thly
Con
sum
er P
rice
Inde
x, J
uly
1992
- D
ecem
ber
2009
Yea
r19
9219
9319
9419
9519
9619
9719
9719
9819
9920
0020
0120
0220
0220
0320
0420
0520
0620
0720
0720
0820
0920
10
Mon
th
Janu
ary
109.
0 11
9.4
126.
9 13
3.7
145.
9 10
5.5
114.
6 12
0.0
125.
9 13
3.5
105.
5 10
9.7
116.
1 12
3.1
133.
9 10
9.6
115.
3 11
8.2
Febr
uary
110.
2 11
9.9
127.
4 13
4.3
145.
9 10
6.0
114.
9 12
0.6
126.
5 13
4.7
105.
7 11
0.1
116.
7 12
3.5
134.
9 11
0.7
115.
8 11
8.6
Mar
ch11
0.7
120.
8 12
8.2
134.
3 14
6.2
106.
7 11
5.1
121.
0 12
6.3
135.
4 10
5.6
110.
1 11
7.1
124.
2 13
6.1
110.
8 11
6.1
118.
8
Apr
il11
1.1
121.
0 12
8.8
134.
9 14
6.1
107.
4 11
5.6
120.
9 12
6.5
135.
7 10
5.8
110.
4 11
7.1
124.
0 13
7.5
111.
9 11
6.2
119.
3
May
114.
0 12
2.6
129.
0 13
5.6
146.
7 10
8.0
115.
8 12
1.0
126.
8 13
5.9
106.
5 11
0.7
117.
2 12
4.3
138.
1 11
3.0
116.
2 11
9.1
June
114.
7 12
3.2
129.
8 13
9.6
147.
9 10
9.6
117.
4 12
1.0
127.
8 13
5.9
106.
9 11
1.3
117.
3 12
6.2
138.
8 11
3.4
117.
1 11
9.9
July
104.
0 11
5.4
123.
2 13
0.0
140.
4 10
3.0
109.
7 11
7.8
121.
3 12
9.7
103.
1 10
7.5
112.
5 11
8.0
129.
9 10
3.7
115.
6 11
7.8
120.
2
Aug
ust
105.
6 11
6.3
123.
8 13
1.4
141.
7 10
3.3
110.
0 11
8.3
121.
7 12
9.9
103.
6 10
7.4
112.
7 11
8.0
130.
9 10
4.1
116.
3 11
7.5
120.
6
Bas
e: J
uly
1991
- Ju
ne 1
992
= 10
0B
ase:
Jul
y 19
96 -
June
199
7 =
100
Bas
e: J
uly
2001
-Ju
ne 2
002
= 10
0B
ase:
Jul
y 20
06-
June
200
7 =
100
- 107-
Sept
embe
r10
6.4
117.
2 12
4.2
131.
7 14
1.7
103.
6 11
2.1
118.
5 12
1.9
130.
1 10
4.0
107.
9 11
3.1
117.
3 13
1.7
105.
3 11
6.7
117.
8 12
0.7
Oct
ober
106.
6 11
7.3
124.
2 13
2.4
142.
3 10
3.5
112.
7 11
8.5
124.
6 13
0.5
105.
0 10
8.3
114.
6 11
8.2
132.
3 10
6.8
117.
2 11
7.3
121.
0
Nov
embe
r10
6.8
117.
9 12
4.9
132.
9 14
2.5
103.
6 11
3.1
118.
9 12
4.8
131.
1 10
4.9
108.
4 11
4.7
118.
8 13
3.3
107.
6 11
6.5
117.
3 12
1.9
Dec
embe
r10
7.6
118.
5 12
5.6
133.
1 14
2.9
103.
9 11
3.4
119.
6 12
5.2
131.
8 10
4.8
108.
9 11
5.0
119.
5 13
3.7
108.
2 11
5.5
117.
2 12
4.4
Yea
rly
aver
age
103.
5 11
4.4
122.
7 13
0.1
138.
7 10
2.5
109.
5 11
7.1
122.
0 12
8.6
103.
0 10
7.0
112.
1 11
7.6
128.
1 10
3.8
113.
9 11
6.8
120.
2
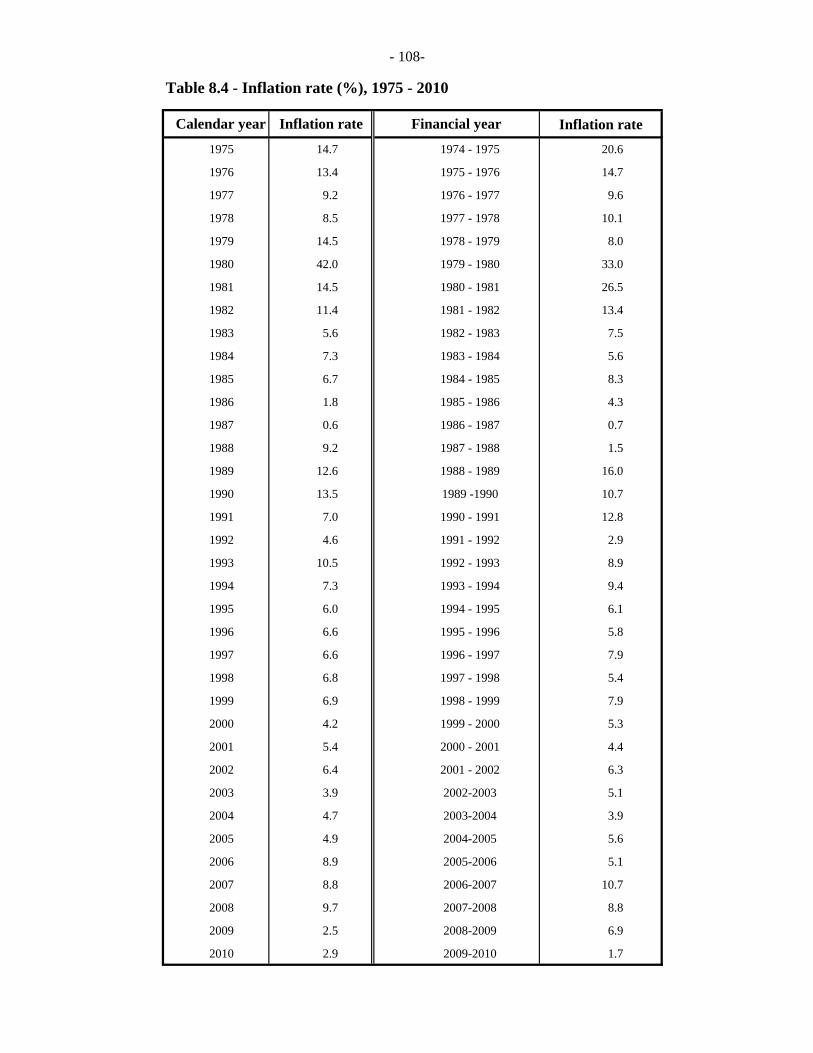
- 108-
Table 8.4 - Inflation rate (%), 1975 - 2010
Inflation rate1975 14.7 1974 - 1975 20.6
1976 13.4 1975 - 1976 14.7
1977 9.2 1976 - 1977 9.6
1978 8.5 1977 - 1978 10.1
1979 14.5 1978 - 1979 8.0
1980 42.0 1979 - 1980 33.0
1981 14.5 1980 - 1981 26.5
1982 11.4 1981 - 1982 13.4
1983 5.6 1982 - 1983 7.5
1984 7.3 1983 - 1984 5.6
1985 6.7 1984 - 1985 8.3
1986 1.8 1985 - 1986 4.3
1987 0.6 1986 - 1987 0.7
1988 9.2 1987 - 1988 1.5
1989 12.6 1988 - 1989 16.0
1990 13.5 1989 -1990 10.7
1991 7.0 1990 - 1991 12.8
1992 4.6 1991 - 1992 2.9
1993 10.5 1992 - 1993 8.9
1994 7.3 1993 - 1994 9.4
1995 6.0 1994 - 1995 6.1
1996 6.6 1995 - 1996 5.8
1997 6.6 1996 - 1997 7.9
1998 6.8 1997 - 1998 5.4
1999 6.9 1998 - 1999 7.9
2000 4.2 1999 - 2000 5.3
2001 5.4 2000 - 2001 4.4
2002 6.4 2001 - 2002 6.3
2003 3.9 2002-2003 5.1
2004 4.7 2003-2004 3.9
2005 4.9 2004-2005 5.6
2006 8.9 2005-2006 5.1
2007 8.8 2006-2007 10.7
2008 9.7 2007-2008 8.8
2009 2.5 2008-2009 6.9
2010 2.9 2009-2010 1.7
Calendar year Inflation rate Financial year
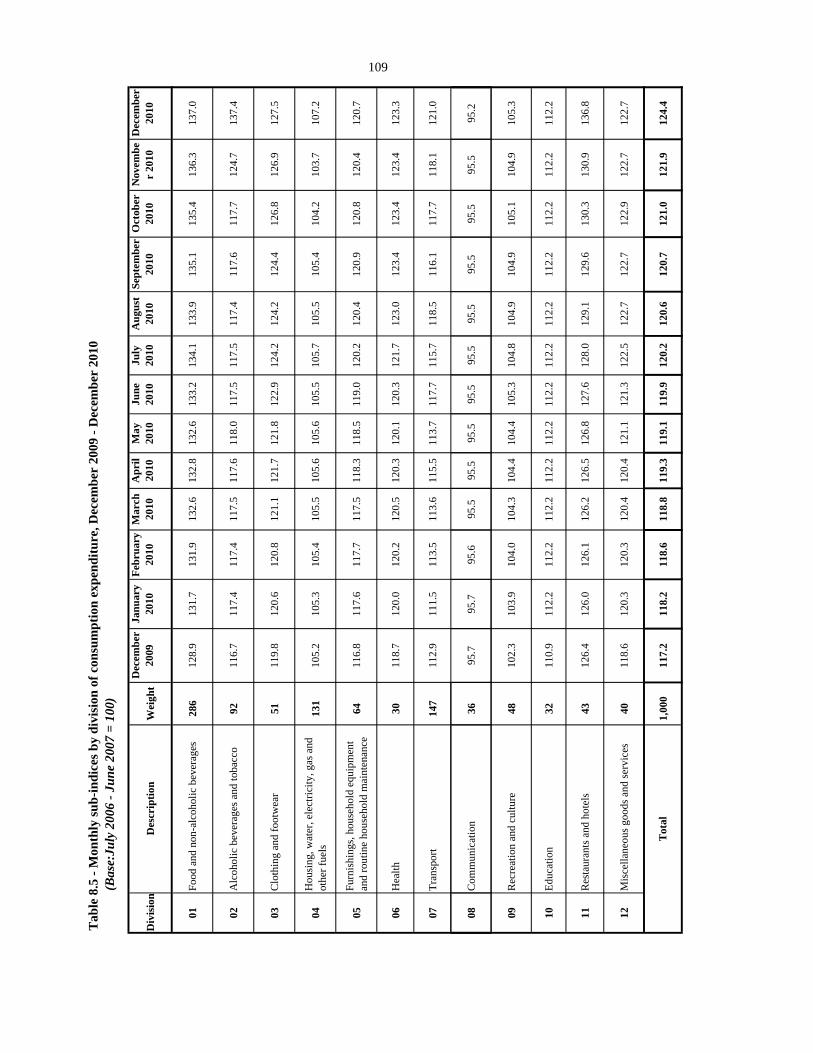
Tab
le 8
.5 -
Mon
thly
sub-
indi
ces b
y di
visi
on o
f con
sum
ptio
n ex
pend
iture
, Dec
embe
r 20
09 -
Dec
embe
r 20
10(B
ase:
July
200
6 - J
une
2007
= 1
00)
Div
isio
nD
escr
iptio
nW
eigh
tD
ecem
ber
2009
Janu
ary
20
10Fe
brua
ry
2010
Mar
ch
2010
Apr
il 20
10M
ay
2010
June
20
10Ju
ly
2010
Aug
ust
2010
Sept
embe
r 20
10O
ctob
er
2010
Nov
embe
r 20
10D
ecem
ber
2010
01Fo
od a
nd n
on-a
lcoh
olic
bev
erag
es28
6
128.
913
1.7
131.
913
2.6
132.
813
2.6
133.
213
4.1
133.
913
5.1
135.
413
6.3
137.
0
02A
lcoh
olic
bev
erag
es a
nd to
bacc
o92
116.
711
7.4
117.
411
7.5
117.
611
8.0
117.
511
7.5
117.
411
7.6
117.
712
4.7
137.
4
03C
loth
ing
and
foot
wea
r51
119.
812
0.6
120.
812
1.1
121.
712
1.8
122.
912
4.2
124.
212
4.4
126.
812
6.9
127.
5
04H
ousi
ng, w
ater
, ele
ctric
ity, g
as a
nd
othe
r fue
ls13
1
105.
210
5.3
105.
410
5.5
105.
610
5.6
105.
510
5.7
105.
510
5.4
104.
210
3.7
107.
2
05Fu
rnis
hing
s, ho
useh
old
equi
pmen
t an
d ro
utin
e ho
useh
old
mai
nten
ance
64
11
6.8
117.
611
7.7
117.
511
8.3
118.
511
9.0
120.
212
0.4
120.
912
0.8
120.
412
0.7
06H
ealth
30
11
8.7
120.
012
0.2
120.
512
0.3
120.
112
0.3
121.
712
3.0
123.
412
3.4
123.
412
3.3
07Tr
ansp
ort
147
11
2.9
111.
511
3.5
113.
611
5.5
113.
711
7.7
115.
711
8.5
116.
111
7.7
118.
112
1.0
109
08C
omm
unic
atio
n36
95.7
95.7
95.6
95.5
95.5
95.5
95.5
95.5
95.5
95.5
95.5
95.5
95.2
09R
ecre
atio
n an
d cu
lture
48
10
2.3
103.
910
4.0
104.
310
4.4
104.
410
5.3
104.
810
4.9
104.
910
5.1
104.
910
5.3
10Ed
ucat
ion
32
11
0.9
112.
211
2.2
112.
211
2.2
112.
211
2.2
112.
211
2.2
112.
211
2.2
112.
211
2.2
11R
esta
uran
ts a
nd h
otel
s43
126.
412
6.0
126.
112
6.2
126.
512
6.8
127.
612
8.0
129.
112
9.6
130.
313
0.9
136.
8
12M
isce
llane
ous g
oods
and
serv
ices
40
11
8.6
120.
312
0.3
120.
412
0.4
121.
112
1.3
122.
512
2.7
122.
712
2.9
122.
712
2.7
1,00
0
117.
211
8.2
118.
611
8.8
119.
311
9.1
119.
912
0.2
120.
612
0.7
121.
012
1.9
124.
4T
otal
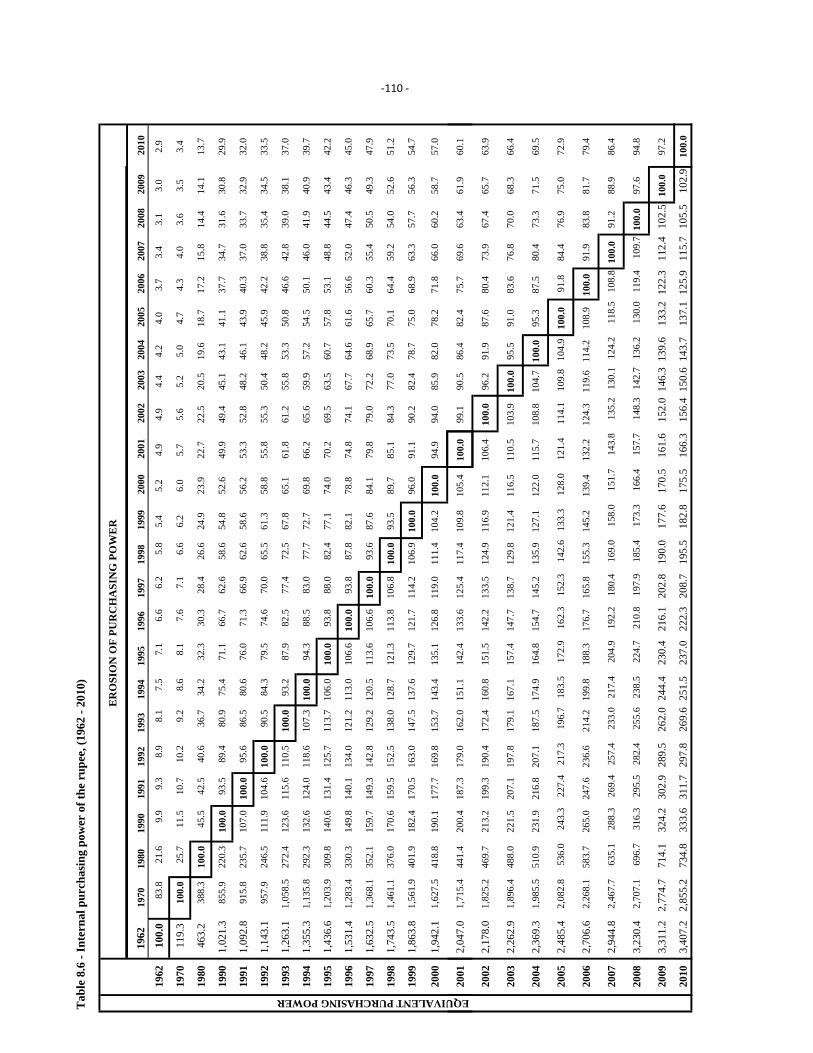
Tab
le 8
.6 -
Inte
rnal
pur
chas
ing
pow
er o
f the
rup
ee, (
1962
- 20
10)
1962
1970
1980
1990
1991
1992
1993
1994
1995
1996
1997
1998
1999
2000
2001
2002
2003
2004
2005
2006
2007
2008
2009
2010
1962
100.
0 83
.8
21.6
9.
9 9.
3 8.
9 8.
1 7.
5 7.
1 6.
6 6.
2 5.
8 5.
4 5.
2 4.
9 4.
9 4.
4 4.
2 4.
0 3.
7 3.
4 3.
1 3.
0 2.
9
1970
119.
3 10
0.0
25.7
11
.5
10.7
10
.2
9.2
8.6
8.1
7.6
7.1
6.6
6.2
6.0
5.7
5.6
5.2
5.0
4.7
4.3
4.0
3.6
3.5
3.4
1980
463.
2 38
8.3
100.
0 45
.5
42.5
40
.6
36.7
34
.2
32.3
30
.3
28.4
26
.6
24.9
23
.9
22.7
22
.5
20.5
19
.6
18.7
17
.2
15.8
14
.4
14.1
13
.7
1990
1,02
1.3
855.
9 22
0.3
100.
0 93
.5
89.4
80
.9
75.4
71
.1
66.7
62
.6
58.6
54
.8
52.6
49
.9
49.4
45
.1
43.1
41
.1
37.7
34
.7
31.6
30
.8
29.9
1991
1,09
2.8
915.
8 23
5.7
107.
0 10
0.0
95.6
86
.5
80.6
76
.0
71.3
66
.9
62.6
58
.6
56.2
53
.3
52.8
48
.2
46.1
43
.9
40.3
37
.0
33.7
32
.9
32.0
1992
1,14
3.1
957.
9 24
6.5
111.
9 10
4.6
100.
0 90
.5
84.3
79
.5
74.6
70
.0
65.5
61
.3
58.8
55
.8
55.3
50
.4
48.2
45
.9
42.2
38
.8
35.4
34
.5
33.5
1993
1,26
3.1
1,05
8.5
272.
4 12
3.6
115.
6 11
0.5
100.
0 93
.2
87.9
82
.5
77.4
72
.5
67.8
65
.1
61.8
61
.2
55.8
53
.3
50.8
46
.6
42.8
39
.0
38.1
37
.0
1994
1,35
5.3
1,13
5.8
292.
3 13
2.6
124.
0 11
8.6
107.
3 10
0.0
94.3
88
.5
83.0
77
.7
72.7
69
.8
66.2
65
.6
59.9
57
.2
54.5
50
.1
46.0
41
.9
40.9
39
.7
1995
1,43
6.6
1,20
3.9
309.
8 14
0.6
131.
4 12
5.7
113.
7 10
6.0
100.
0 93
.8
88.0
82
.4
77.1
74
.0
70.2
69
.5
63.5
60
.7
57.8
53
.1
48.8
44
.5
43.4
42
.2
1996
1,53
1.4
1,28
3.4
330.
3 14
9.8
140.
1 13
4.0
121.
2 11
3.0
106.
6 10
0.0
93.8
87
.8
82.1
78
.8
74.8
74
.1
67.7
64
.6
61.6
56
.6
52.0
47
.4
46.3
45
.0
1997
1,63
2.5
1,36
8.1
352.
1 15
9.7
149.
3 14
2.8
129.
2 12
0.5
113.
6 10
6.6
100.
0 93
.6
87.6
84
.1
79.8
79
.0
72.2
68
.9
65.7
60
.3
55.4
50
.5
49.3
47
.9
1998
1,74
3.5
1,46
1.1
376.
0 17
0.6
159.
5 15
2.5
138.
0 12
8.7
121.
3 11
3.8
106.
8 10
0.0
93.5
89
.7
85.1
84
.3
77.0
73
.5
70.1
64
.4
59.2
54
.0
52.6
51
.2
1999
1,86
3.8
1,56
1.9
401.
9 18
2.4
170.
5 16
3.0
147.
5 13
7.6
129.
7 12
1.7
114.
2 10
6.9
100.
0 96
.0
91.1
90
.2
82.4
78
.7
75.0
68
.9
63.3
57
.7
56.3
54
.7
2000
1,94
2.1
1,62
7.5
418.
8 19
0.1
177.
7 16
9.8
153.
7 14
3.4
135.
1 12
6.8
119.
0 11
1.4
104.
2 10
0.0
94.9
94
.0
85.9
82
.0
78.2
71
.8
66.0
60
.2
58.7
57
.0
UIVALENT PURCHASING POWER
ER
OSI
ON
OF
PUR
CH
ASI
NG
PO
WE
R
‐110 ‐
2001
2,04
7.0
1,71
5.4
441.
4 20
0.4
187.
3 17
9.0
162.
0 15
1.1
142.
4 13
3.6
125.
4 11
7.4
109.
8 10
5.4
100.
0 99
.1
90.5
86
.4
82.4
75
.7
69.6
63
.4
61.9
60
.1
2002
2,17
8.0
1,82
5.2
469.
7 21
3.2
199.
3 19
0.4
172.
4 16
0.8
151.
5 14
2.2
133.
5 12
4.9
116.
9 11
2.1
106.
4 10
0.0
96.2
91
.9
87.6
80
.4
73.9
67
.4
65.7
63
.9
2003
2,26
2.9
1,89
6.4
488.
0 22
1.5
207.
1 19
7.8
179.
1 16
7.1
157.
4 14
7.7
138.
7 12
9.8
121.
4 11
6.5
110.
5 10
3.9
100.
0 95
.5
91.0
83
.6
76.8
70
.0
68.3
66
.4
2004
2,36
9.3
1,98
5.5
510.
9 23
1.9
216.
8 20
7.1
187.
5 17
4.9
164.
8 15
4.7
145.
2 13
5.9
127.
1 12
2.0
115.
7 10
8.8
104.
7 10
0.0
95.3
87
.5
80.4
73
.3
71.5
69
.5
2005
2,48
5.4
2,08
2.8
536.
024
3.3
227.
421
7.3
196.
718
3.5
172.
916
2.3
152.
314
2.6
133.
312
8.0
121.
411
4.1
109.
810
4.9
100.
0 91
.884
.4
76.9
75
.0
72.9
2006
2,70
6.6
2,26
8.1
583.
7 26
5.0
247.
6 23
6.6
214.
2 19
9.8
188.
3 17
6.7
165.
8 15
5.3
145.
2 13
9.4
132.
2 12
4.3
119.
6 11
4.2
108.
9 10
0.0
91.9
83
.8
81.7
79
.4
2007
2,94
4.8
2,46
7.7
635.
128
8.3
269.
425
7.4
233.
021
7.4
204.
919
2.2
180.
416
9.0
158.
015
1.7
143.
813
5.2
130.
112
4.2
118.
510
8.8
100.
0 91
.2
88.9
86
.4
2008
3,23
0.4
2,70
7.1
696.
731
6.3
295.
528
2.4
255.
623
8.5
224.
721
0.8
197.
918
5.4
173.
316
6.4
157.
714
8.3
142.
713
6.2
130.
011
9.4
109.
710
0.0
97.6
94
.8
2009
3,31
1.2
2,77
4.7
714.
132
4.2
302.
928
9.5
262.
024
4.4
230.
421
6.1
202.
819
0.0
177.
617
0.5
161.
615
2.0
146.
313
9.6
133.
212
2.3
112.
410
2.5
100.
0 97
.2
2010
3,40
7.2
2,85
5.2
734.
833
3.6
311.
729
7.8
269.
625
1.5
237.
022
2.3
208.
719
5.5
182.
817
5.5
166.
315
6.4
150.
614
3.7
137.
112
5.9
115.
710
5.5
102.
910
0.0
EQU
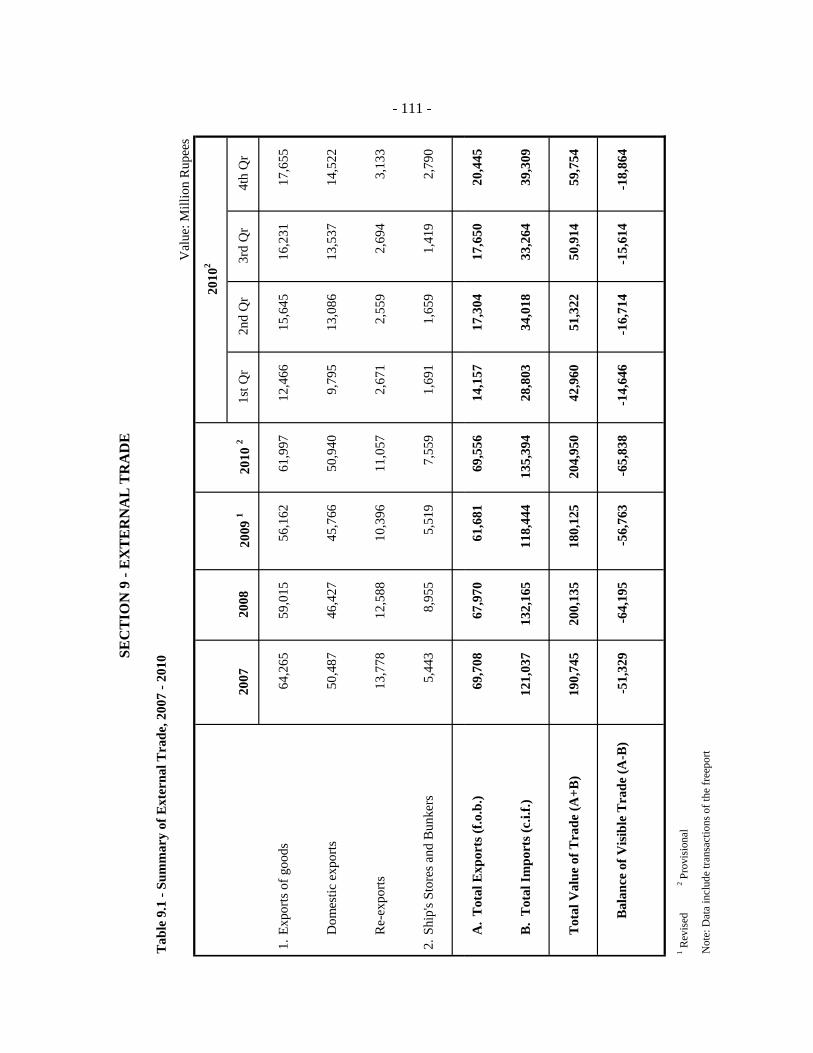
SEC
TIO
N 9
- E
XT
ER
NA
L T
RA
DE
Tab
le 9
.1 -
Sum
mar
y of
Ext
erna
l Tra
de, 2
007
- 201
0
Val
ue: M
illio
n R
upee
s
2010
2
2007
2008
2009
120
10 2
1st Q
r2n
d Q
r3r
d Q
r4t
h Q
r
1.Ex
ports
of g
oods
64,2
65
59,0
15
56,1
62
61,9
97
12,4
66
15,6
45
16,2
31
17,6
55
Dom
estic
exp
orts
50,4
87
46,4
27
45,7
66
50,9
40
9,79
5
13,0
86
13,5
37
14,5
22
Re-
expo
rts13
,778
12
,588
10
,396
11
,057
2,
671
2,
559
2,
694
3,
133
2.Sh
ip's
Stor
es a
nd B
unke
rs5,
443
8,
955
5,
519
7,
559
1,
691
1,
659
1,
419
2,
790
- 111 -
A.
Tot
al E
xpor
ts (f
.o.b
.)69
,708
67
,970
61
,681
69
,556
14
,157
17
,304
17
,650
20
,445
B.
Tot
al Im
port
s (c.
i.f.)
121,
037
13
2,16
5
118,
444
13
5,39
4
28,8
03
34,0
18
33,2
64
39,3
09
Tot
al V
alue
of T
rade
(A+B
)19
0,74
5
200,
135
18
0,12
5
204,
950
42
,960
51
,322
50
,914
59
,754
-51,
329
-6
4,19
5
-56,
763
-6
5,83
8
-14,
646
-1
6,71
4
-15,
614
-1
8,86
4
1 Rev
ised
2 P
rovi
sion
al
Not
e: D
ata
incl
ude
trans
actio
ns o
f the
free
port
Bal
ance
of V
isib
le T
rade
(A-B
)
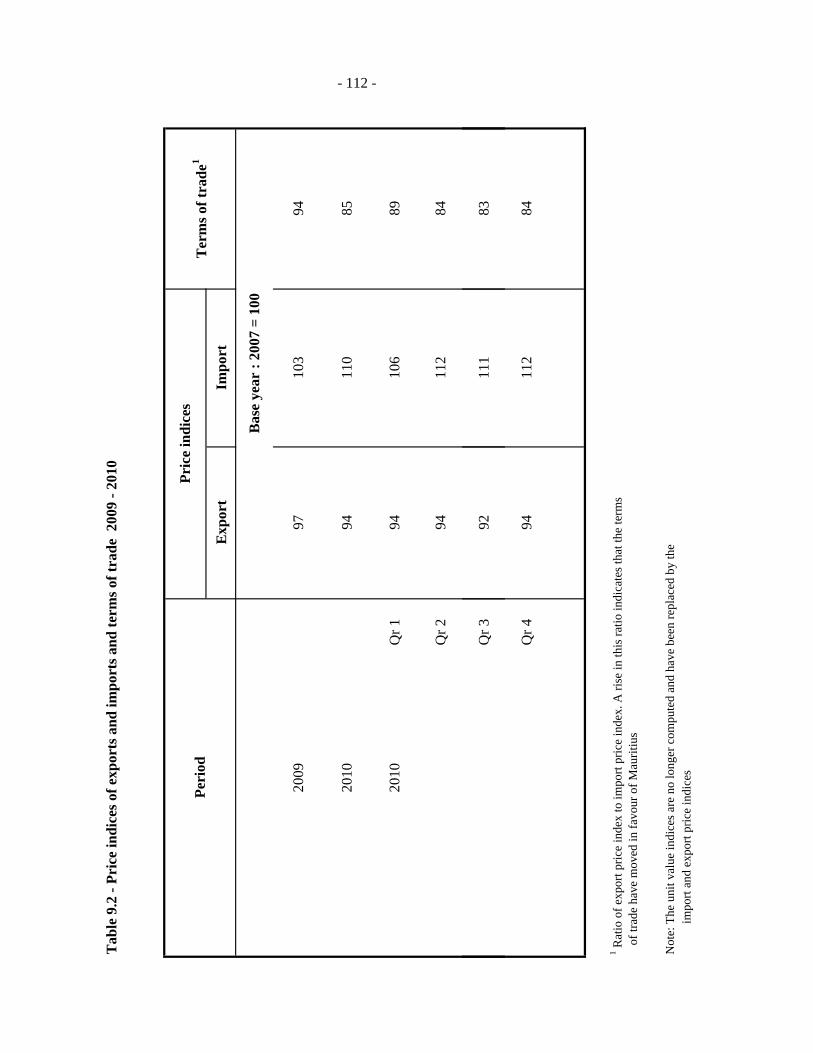
Tab
le 9
.2 -
Pric
e in
dice
s of e
xpor
ts a
nd im
port
s and
term
s of t
rade
200
9 - 2
010
Exp
ort
Impo
rt
2009
9710
394
2010
9411
085
2010
Qr 1
9410
689
Qr 2
9411
284
Bas
e ye
ar :
2007
= 1
00
Peri
odPr
ice
indi
ces
Ter
ms o
f tra
de1
- 112 -
Qr 3
9211
183
Qr 4
9411
284
1 Rat
io o
f exp
ort p
rice
inde
x to
impo
rt pr
ice
inde
x. A
rise
in th
is ra
tio in
dica
tes t
hat t
he te
rms
of
trad
e ha
ve m
oved
in fa
vour
of M
aurit
ius
Not
e: T
he u
nit v
alue
indi
ces a
re n
o lo
nger
com
pute
d an
d ha
ve b
een
repl
aced
by
the
im
port
and
expo
rt pr
ice
indi
ces
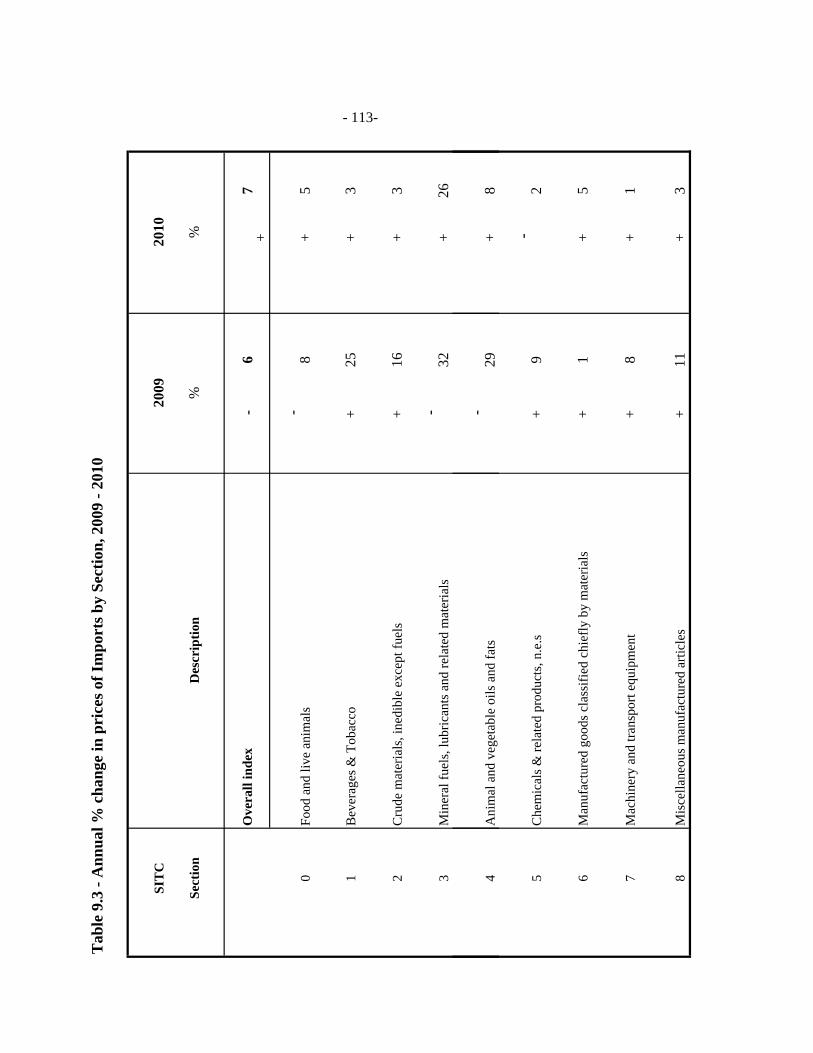
Tab
le 9
.3 -
Ann
ual %
cha
nge
in p
rice
s of I
mpo
rts b
y Se
ctio
n, 2
009
- 201
0
SIT
C
Sect
ion
Des
crip
tion
Ove
rall
inde
x-
6+
7
0Fo
od a
nd li
ve a
nim
als
-8
+5
1B
ever
ages
& T
obac
co+
25+
3
2C
rude
mat
eria
ls, i
nedi
ble
exce
pt fu
els
+16
+3
3M
iner
al fu
els,
lubr
ican
ts a
nd re
late
d m
ater
ials
-32
+26
%%
2009
2010
- 113-
4A
nim
al a
nd v
eget
able
oils
and
fats
-29
+8
5C
hem
ical
s & re
late
d pr
oduc
ts, n
.e.s
+9
-2
6M
anuf
actu
red
good
s cla
ssifi
ed c
hief
ly b
y m
ater
ials
+1
+5
7M
achi
nery
and
tran
spor
t equ
ipm
ent
+8
+1
8M
isce
llane
ous m
anuf
actu
red
artic
les
+11
+3
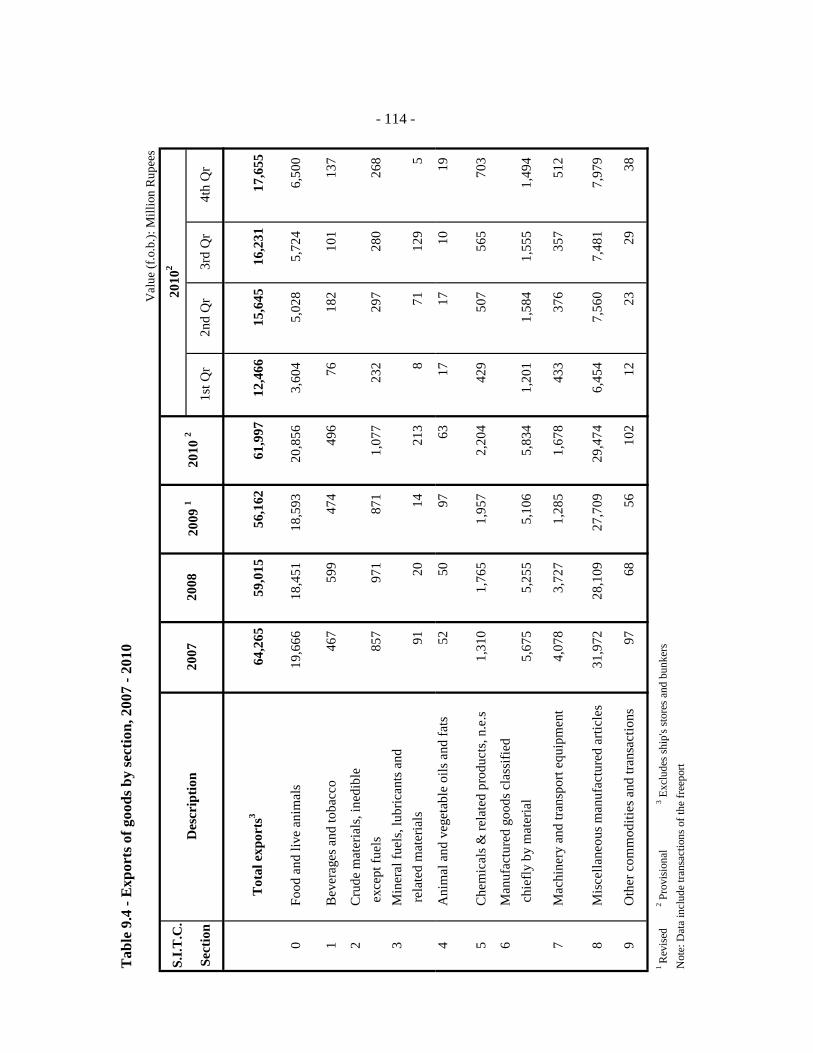
Tab
le 9
.4 -
Exp
orts
of g
oods
by
sect
ion,
200
7 - 2
010
Val
ue (f
.o.b
.): M
illio
n R
upee
s
S.I.T
.C.
Sect
ion
1st Q
r2n
d Q
r3r
d Q
r4t
h Q
r
T
otal
exp
orts
364
,265
59
,015
56
,162
61
,997
12
,466
15
,645
16
,231
17
,655
0Fo
od a
nd li
ve a
nim
als
19,6
66
18,4
51
18,5
93
20,8
56
3,60
4
5,02
8
5,72
4
6,50
0
1B
ever
ages
and
toba
cco
467
59
9
474
49
6
76
182
10
1
137
2C
rude
mat
eria
ls, i
nedi
ble
exc
ept f
uels
857
97
1
871
1,
077
23
2
297
28
0
268
3
Min
eral
fuel
s, lu
bric
ants
and
rela
ted
mat
eria
ls91
20
14
21
3
8
71
129
5
2010
2
Des
crip
tion
2007
2009
120
0820
10 2
- 114 -
4A
nim
al a
nd v
eget
able
oils
and
fats
52
50
97
63
17
17
10
19
5C
hem
ical
s & re
late
d pr
oduc
ts, n
.e.s
1,31
0
1,76
5
1,95
7
2,20
4
429
50
7
565
70
3
6M
anuf
actu
red
good
s cla
ssifi
ed c
hief
ly b
y m
ater
ial
5,67
5
5,25
5
5,10
6
5,83
4
1,20
1
1,58
4
1,55
5
1,49
4
7M
achi
nery
and
tran
spor
t equ
ipm
ent
4,07
8
3,72
7
1,28
5
1,67
8
433
37
6
357
51
2
8M
isce
llane
ous m
anuf
actu
red
artic
les
31,9
72
28,1
09
27,7
09
29,4
74
6,45
4
7,56
0
7,48
1
7,97
9
9O
ther
com
mod
ities
and
tran
sact
ions
97
68
56
102
12
23
29
38
1 R
evis
ed2 P
rovi
sion
al
3 Exc
lude
s shi
p's s
tore
s and
bun
kers
Not
e: D
ata
incl
ude
trans
actio
ns o
f the
free
port

Tab
le 9
.5 -
Dom
estic
exp
orts
by
mai
n pr
oduc
t/sec
tor,
200
7 - 2
010
Val
ue (f
.o.b
.): M
illio
n R
upee
s
1st Q
r2n
d Q
r3r
d Q
r4t
h Q
r
Tot
al D
omes
tic E
xpor
ts50
,487
46
,427
45
,766
50
,940
9,
795
13
,086
13
,537
14
,522
EO
E pr
oduc
ts (d
omes
tic) :
val
ue37
,483
34
,433
35
,279
39
,774
8,
478
10
,205
10
,520
10
,571
N
on-E
OE
prod
ucts
: va
lue
13,0
04
11,9
94
10,4
87
11,1
66
1,31
7
2,88
1
3,01
7
3,95
1
Live
ani
mal
sQ
uant
ity (
000
unit
)40
8
1,14
7
864
1,
561
27
6
337
40
5
543
V
alue
550
63
8
557
58
8
113
15
7
168
15
0
Whe
aten
flou
r Q
uant
ity (
tonn
e )
11,4
33
6,22
3
22,4
81
20,6
37
6,95
5
5,70
3
4,72
5
3,25
4
Val
ue16
1
126
33
3
291
86
76
64
65
C
ane
Suga
rQ
uant
ity (
000
tonn
e )
442
42
7
344
43
2
41
117
12
2
152
V
alue
9,57
8
8,26
8
6,82
8
7,74
0
824
1,
968
2,
288
2,
660
Cut
flow
ers &
folia
geQ
uant
ity (
tonn
e )
250
21
7
137
16
8
56
20
37
55
Val
ue90
81
49
64
22
7
15
20
2007
2009
120
0820
10 2
2010
2
- 115 -
Va
ue90
89
67
50
Che
mic
als &
rela
ted
prod
ucts
Qua
ntity
( to
nne
)6,
129
4,
101
5,
080
7,
305
2,
344
1,
243
1,
826
1,
892
Val
ue20
7
156
18
9
249
11
0
44
46
49
Arti
cles
of a
ppar
el &
clo
thin
g
Qua
ntity
( no
t app
licab
le )
-.--.-
-.--.-
-.--.-
-.--.-
Val
ue26
923
8
264
27
3
51
6666
90O
ther
com
mod
ities
Val
ue2,
149
2,
487
2,
267
1,
961
11
1
563
37
0
917
'
1 R
evis
ed2 P
rovi
sion
al
3 Exc
lude
s shi
p's s
tore
s and
bun
kers
Not
e: E
OE
ente
rpris
es c
ompr
ise
ente
rpris
es fo
rmer
ly o
pera
ting
with
an
EPZ
certi
ficat
e an
d th
ose
esta
blis
hmen
ts m
anuf
actu
ring
good
s for
exp
orts
and
hol
ding
a re
gist
ratio
n ce
rtific
ate
issu
ed b
y th
e
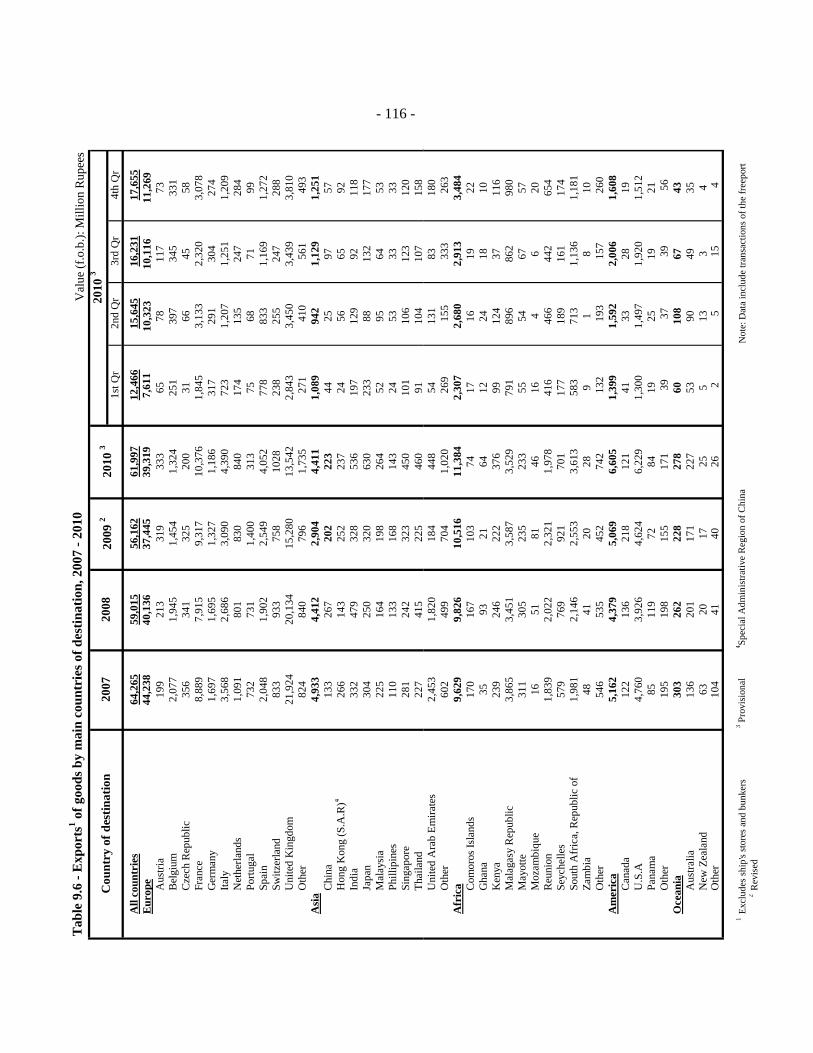
Tab
le 9
.6 -
Exp
orts
1 of g
oods
by
mai
n co
untr
ies o
f des
tinat
ion,
200
7 - 2
010
Val
ue (f
.o.b
.): M
illio
n R
upee
s20
10 3
1st Q
r2n
d Q
r3r
d Q
r4t
h Q
r
All
coun
trie
s64
,265
59,0
1556
,162
61,9
9712
,466
15,6
4516
,231
17,6
55E
urop
e44
,238
40,1
3637
,445
39,3
197,
611
10,3
23
10,1
16
11,2
69
Aus
tria
199
213
319
333
65
78
117
73
B
elgi
u m2,
077
1,94
51,
454
1,32
425
1
397
34
5
331
C
zech
Rep
ublic
356
341
325
200
31
66
45
58
Fran
ce8,
889
7,91
59,
317
10,3
761,
845
3,
133
2,
320
3,
078
G
erm
any
1,69
71,
695
1,32
71,
186
317
29
1
304
27
4
Ital y
3,56
82,
686
3,09
04,
390
723
1,
207
1,
251
1,
209
N
ethe
rland
s1,
091
801
830
840
174
13
5
247
28
4
Portu
gal
732
731
1,40
031
375
68
71
99
Sp
ain
2,04
81,
902
2,54
94,
052
778
83
3
1,16
9
1,27
2
Switz
erla
nd83
393
375
810
2823
8
255
24
7
288
U
nite
d K
ingd
o m21
,924
20,1
3415
,280
13,5
422,
843
3,
450
3,
439
3,
810
O
the r
824
840
796
1,73
527
141
056
149
3A
sia
4,93
34,
412
2,90
44,
411
1,08
9
942
1,
129
1,
251
C
hina
133
267
202
223
44
25
97
57
Hon
g K
ong
(S.A
.R)4
266
143
252
237
24
56
65
92
Indi
a33
247
932
853
619
7
129
92
11
8
Japa
n30
425
032
063
023
3
88
132
17
7
Mal
aysi
a22
516
419
826
452
95
64
53
Ph
illip
ines
110
133
168
143
24
53
33
33
Sing
apor
e28
124
232
345
010
1
106
12
3
120
Th
aila
nd22
741
522
546
091
10
4
107
15
8
2009
2C
ount
ry o
f des
tinat
ion
2007
2008
2010
3
- 116 -
Uni
ted
Ara
b Em
irate
s2,
453
1,82
018
444
854
13
1
83
180
#
Oth
er60
249
970
41,
020
269
155
333
263
Afr
ica
9,62
99,
826
10,5
1611
,384
2,30
7
2,68
0
2,91
3
3,48
4
Com
oros
Isla
nds
170
167
103
7417
16
19
22
G
hana
3593
2164
12
24
18
10
Ken
ya23
924
622
237
699
12
4
37
116
M
alag
asy
Rep
ublic
3,86
53,
451
3,58
73,
529
791
89
6
862
98
0
May
otte
311
305
235
233
55
54
67
57
Moz
ambi
que
1651
8146
16
4
6
20
Reu
nio n
1,83
92,
022
2,32
11,
978
416
46
6
442
65
4
Seyc
helle
s57
976
992
170
117
7
189
16
1
174
So
uth
Afr
ica,
Rep
ublic
of
1,98
12,
146
2,55
33,
613
583
71
3
1,13
6
1,18
1
Zam
bia
4841
2028
9
1
8
10
Oth
e r54
653
545
274
213
219
315
726
0A
mer
ica
5,16
24,
379
5,06
96,
605
1,39
9
1,59
2
2,00
6
1,60
8
Can
ada
122
136
218
121
41
33
28
19
U.S
.A4,
760
3,92
64,
624
6,22
91,
300
1,
497
1,
920
1,
512
Pa
nam
a85
119
7284
19
25
19
21
Oth
e r19
519
815
517
139
3739
56O
cean
ia30
326
222
827
860
10
8
67
43
Aus
tralia
136
201
171
227
53
90
49
35
New
Zea
land
6320
1725
5
13
3
4
Oth
er10
441
4026
25
154
1Ex
clud
es sh
ip's
stor
es a
nd b
unke
rs3
Prov
isio
nal
4 Spec
ial A
dmin
istra
tive
Reg
ion
of C
hina
Not
e: D
ata
incl
ude
trans
actio
ns o
f the
free
port
2R
evis
ed
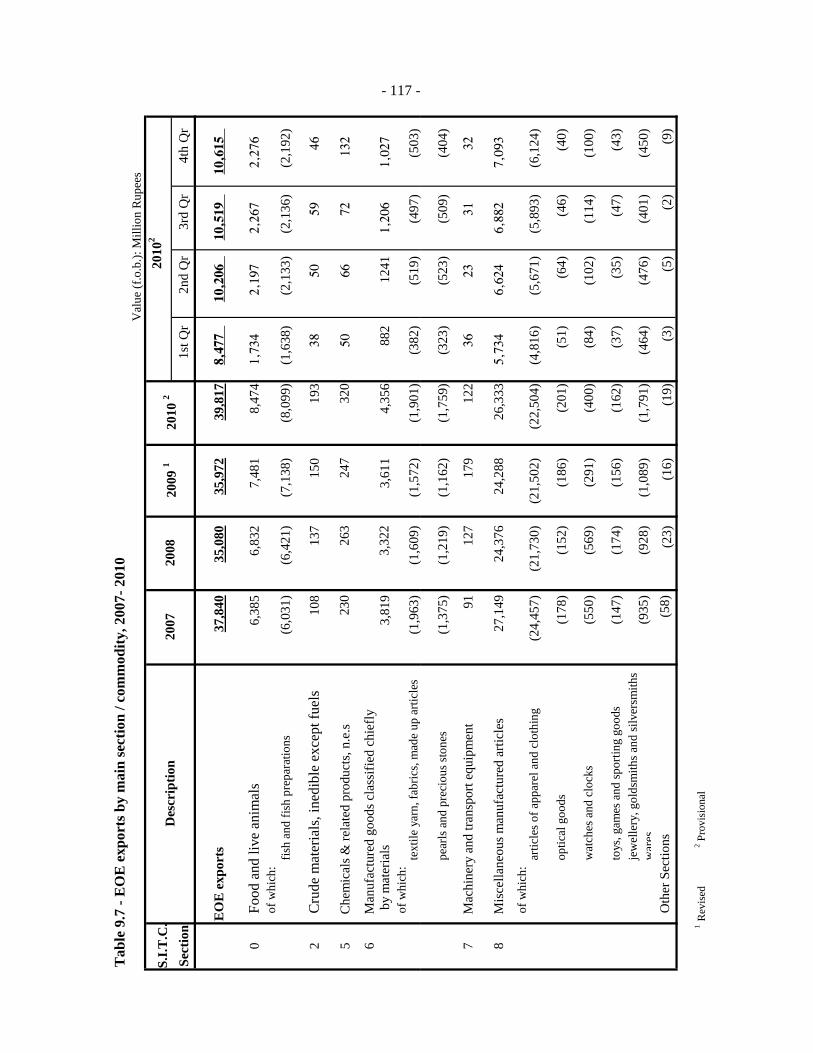
Tab
le 9
.7 -
EO
E e
xpor
ts b
y m
ain
sect
ion
/ com
mod
ity, 2
007-
201
0V
alue
(f.o
.b.):
Mill
ion
Rup
ees
S.I.T
.C.
Sect
ion
1st Q
r2n
d Q
r3r
d Q
r4t
h Q
r
EO
E e
xpor
ts37
,840
35,0
8035
,972
39,8
178,
477
10
,206
10
,519
10
,615
0 F
ood
and
live
anim
als
6,38
56,
832
7,48
18,
474
1,73
4
2,19
7
2,26
7
2,27
6
of w
hich
:fis
h an
d fis
h pr
epar
atio
ns(6
,031
)(6
,421
)(7
,138
)(8
,099
)(1
,638
)(2
,133
)(2
,136
)(2
,192
)
2 C
rude
mat
eria
ls, i
nedi
ble
exce
pt fu
els
108
137
150
193
38
50
59
46
5 C
hem
ical
s & re
late
d pr
oduc
ts, n
.e.s
230
263
247
320
50
66
72
132
6 M
anuf
actu
red
good
s cla
ssifi
ed c
hief
ly
by
mat
eria
ls3,
819
3,32
23,
611
4,35
688
212
411,
206
1,
027
of
whi
ch:
text
ile y
arn,
fabr
ics,
mad
e up
arti
cles
(1,9
63)
(1,6
09)
(1,5
72)
(1,9
01)
(382
)(5
19)
(497
)(5
03)
2010
2
Des
crip
tion
2007
2008
2009
120
10 2
- 117 -
pear
ls a
nd p
reci
ous s
tone
s(1
,375
)(1
,219
)(1
,162
)(1
,759
)(3
23)
(523
)(5
09)
(404
)
7 M
achi
nery
and
tran
spor
t equ
ipm
ent
9112
717
912
236
23
31
32
8 M
isce
llane
ous m
anuf
actu
red
artic
les
27,1
4924
,376
24,2
8826
,333
5,73
4
6,62
4
6,88
2
7,09
3
of w
hich
:ar
ticle
s of a
ppar
el a
nd c
loth
ing
(24,
457)
(21,
730)
(21,
502)
(22,
504)
(4,8
16)
(5,6
71)
(5,8
93)
(6,1
24)
optic
al g
oods
(178
)(1
52)
(186
)(2
01)
(51)
(64)
(46)
(40)
wat
ches
and
clo
cks
(550
)(5
69)
(291
)(4
00)
(84)
(102
)(1
14)
(100
)
toys
, gam
es a
nd sp
ortin
g go
ods
(147
)(1
74)
(156
)(1
62)
(37)
(35)
(47)
(43)
jew
elle
ry, g
olds
mith
s and
silv
ersm
iths
war
es(9
35)
(928
)(1
,089
)(1
,791
)(4
64)
(476
)(4
01)
(450
)O
ther
Sec
tions
(58)
(23)
(16)
(19)
(3)
(5)
(2)
(9)
1R
evis
ed
2
Pro
visi
onal
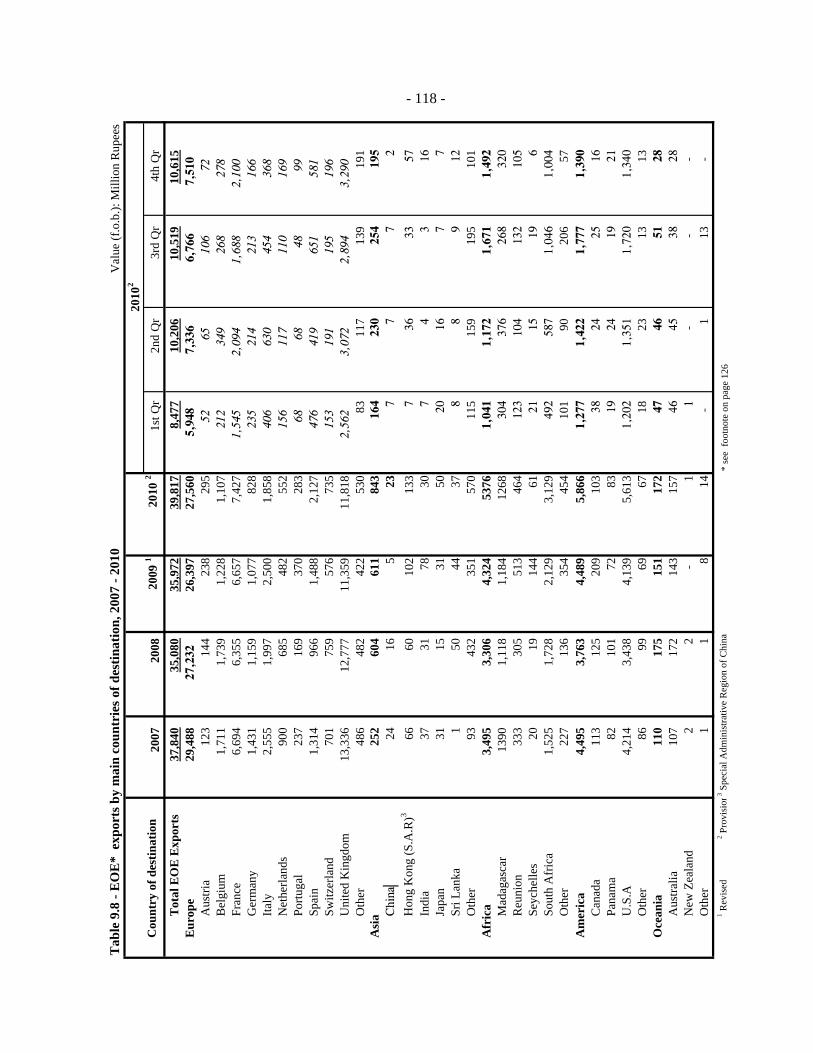
Tab
le 9
.8 -
EO
E*
exp
orts
by
mai
n co
untr
ies o
f des
tinat
ion,
200
7 - 2
010
Val
ue (f
.o.b
.): M
illio
n R
upee
s
Cou
ntry
of d
estin
atio
n20
0720
0820
09 1
2010
21s
t Qr
2nd
Qr
3rd
Qr
4th
Qr
Tot
al E
OE
Exp
orts
37,8
4035
,080
35,9
7239
,817
8,47
710
,206
10,5
1910
,615
Eur
ope
29,4
8827
,232
26
,397
27,5
605,
948
7,
336
6,
766
7,
510
A
ustri
a12
314
423
829
552
65
10
6
72
Bel
giu m
1,71
11,
739
1,22
81,
107
212
34
9
268
27
8
Fran
ce6,
694
6,35
56,
657
7,42
71,
545
2,
094
1,
688
2,
100
G
erm
any
1,43
11,
159
1,07
782
823
5
214
21
3
166
Ita
l y2,
555
1,99
72,
500
1,85
840
6
630
45
4
368
N
ethe
rland
s90
068
548
255
215
6
117
11
0
169
Po
rtuga
l23
716
937
028
368
68
48
99
Sp
ain
1,31
496
61,
488
2,12
747
6
419
65
1
581
Sw
itzer
lan d
701
759
576
735
153
19
1
195
19
6
Uni
ted
Kin
gdo m
13,3
3612
,777
11,3
5911
,818
2,56
2
3,07
2
2,89
4
3,29
0
Oth
er48
648
242
253
083
117
139
191
Asi
a25
260
461
184
316
423
025
419
5C
hina
2416
523
77
72
Hon
g K
ong
(S.A
.R)3
6660
102
133
736
3357
Indi
a37
3178
307
43
16Ja
pan
3115
3150
2016
77
Sri L
ank a
150
4437
88
912
Oth
er93
432
351
570
115
159
195
101
Afr
ica
3,49
53,
306
4,32
453
761,
041
1,17
21,
671
1,49
2M
adag
asca
r13
901,
118
1,18
412
6830
437
626
832
0R
euni
on33
330
551
346
412
310
413
210
5Se
yche
lles
2019
144
6121
1519
6So
uth
Afr
ica
1,52
51,
728
2,12
93,
129
492
587
1,04
61,
004
Oth
er22
713
635
445
410
190
206
57A
mer
ica
4,49
53,
763
4,48
95,
866
1,27
71,
422
1,77
71,
390
Can
ada
113
125
209
103
3824
2516
Pana
ma
8210
172
8319
2419
21U
.S.A
4,21
43,
438
4,13
95,
613
1,20
21,
351
1,72
01,
340
Oth
er86
9969
6718
2313
13O
cean
ia11
017
515
117
247
4651
28A
ustra
lia10
717
214
315
746
4538
28N
ew Z
eala
nd2
2 -
1
1 -
-
-
O
ther
11
814
-
1
13 -
1 R
evis
ed
2 Pro
visi
on3 S
peci
al A
dmin
istra
tive
Reg
ion
of C
hina
* se
e fo
otno
te o
n pa
ge 1
26
2010
2
- 118 -
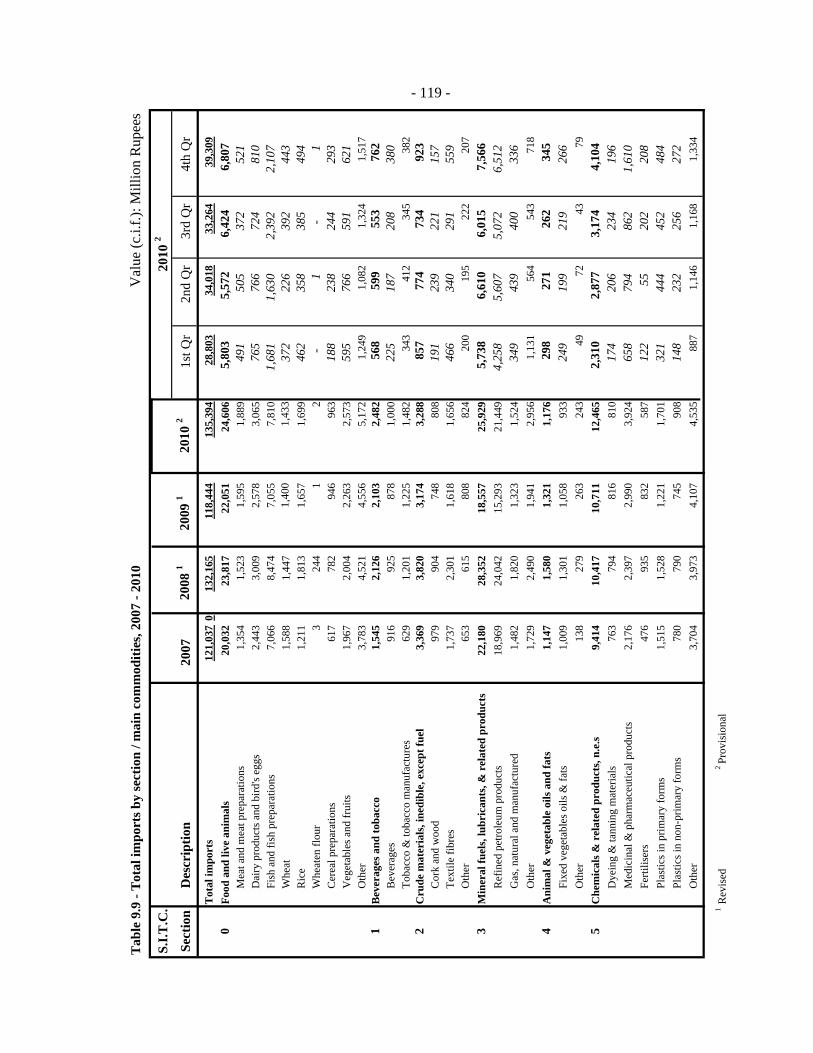
Tab
le 9
.9 -
Tot
al im
port
s by
sect
ion
/ mai
n co
mm
oditi
es, 2
007
- 201
0V
alue
(c.i.
f.): M
illio
n R
upee
s
S.I.T
.C.
Sect
ion
Des
crip
tion
2007
2008
120
09 1
2010
21s
t Qr
2nd
Qr
3rd
Qr
4th
Qr
Tot
al im
port
s12
1,03
70
132,
165
118,
444
135,
394
28,8
0334
,018
33,2
6439
,309
0Fo
od a
nd li
ve a
nim
als
20,0
3223
,817
22,0
5124
,606
5,80
3
5,57
2
6,42
4
6,80
7
Mea
t and
mea
t pre
para
tions
1,35
41,
523
1,59
51,
889
491
50
5
372
52
1
Dai
ry p
rodu
cts a
nd b
ird's
eggs
2,44
33,
009
2,57
83,
065
765
76
6
724
81
0
Fish
and
fish
pre
para
tions
7,06
68,
474
7,05
57,
810
1,68
1
1,63
0
2,39
2
2,10
7
Whe
at1,
588
1,44
71,
400
1,43
337
2
226
39
2
443
R
ice
1,21
11,
813
1,65
71,
699
462
35
8
385
49
4
Whe
aten
flou
r3
244
12
-
1
-
1
Cer
eal p
repa
ratio
ns61
778
294
696
318
8
238
24
4
293
V
eget
able
s and
frui
ts1,
967
2,00
42,
263
2,57
359
5
766
59
1
621
O
ther
3,78
34,
521
4,55
65,
172
1,24
91,
082
1,32
41,
517
1B
ever
ages
and
toba
cco
1,54
52,
126
2,10
32,
482
568
59
9
553
76
2
Bev
erag
es91
692
587
81,
000
225
18
7
208
38
0
Toba
cco
& to
bacc
o m
anuf
actu
res
629
1,20
11,
225
1,48
234
341
234
538
22
Cru
de m
ater
ials
, ine
dibl
e, e
xcep
t fue
l3,
369
3,82
03,
174
3,28
885
7
774
73
4
923
C
ork
and
woo
d97
990
474
880
819
1
239
22
1
157
Te
xtile
fibr
es1,
737
2,30
11,
618
1,65
646
6
340
29
1
559
O
ther
653
615
808
824
200
195
222
207
3M
iner
al fu
els,
lubr
ican
ts, &
rel
ated
pro
duct
s22
,180
28,3
5218
,557
25,9
295,
738
6,
610
6,
015
7,
566
R
efin
ed p
etro
leum
pro
duct
s18
,969
24,0
4215
,293
21,4
494,
258
5,
607
5,
072
6,
512
G
as, n
atur
al a
nd m
anuf
actu
red
1,48
21,
820
1,32
31,
524
349
43
9
400
33
6
Oth
er1,
729
2,49
01,
941
2,95
61,
131
564
543
718
4A
nim
al &
veg
etab
le o
ils a
nd fa
ts1,
147
1,58
01,
321
1,17
629
8
271
26
2
345
Fi
xed
vege
tabl
es o
ils &
fats
1,00
91,
301
1,05
893
324
9
199
21
9
266
O
ther
138
279
263
243
4972
4379
5C
hem
ical
s & r
elat
ed p
rodu
cts,
n.e.
s9,
414
10,4
1710
,711
12,4
652,
310
2,
877
3,
174
4,
104
D
yein
g &
tann
ing
mat
eria
ls76
379
481
681
017
4
206
23
4
196
M
edic
inal
& p
harm
aceu
tical
pro
duct
s2,
176
2,39
72,
990
3,92
465
8
794
86
2
1,61
0
Ferti
liser
s47
693
583
258
712
2
55
202
20
8
Plas
tics i
n pr
imar
y fo
rms
1,51
51,
528
1,22
11,
701
321
44
4
452
48
4
Plas
tics i
n no
n-pr
imar
y fo
rms
780
790
745
908
148
23
2
256
27
2
Oth
er3,
704
3,97
34,
107
4,53
588
71,
146
1,16
81,
334
1R
evis
ed
2
Prov
isio
nal
- 119 -
2010
2
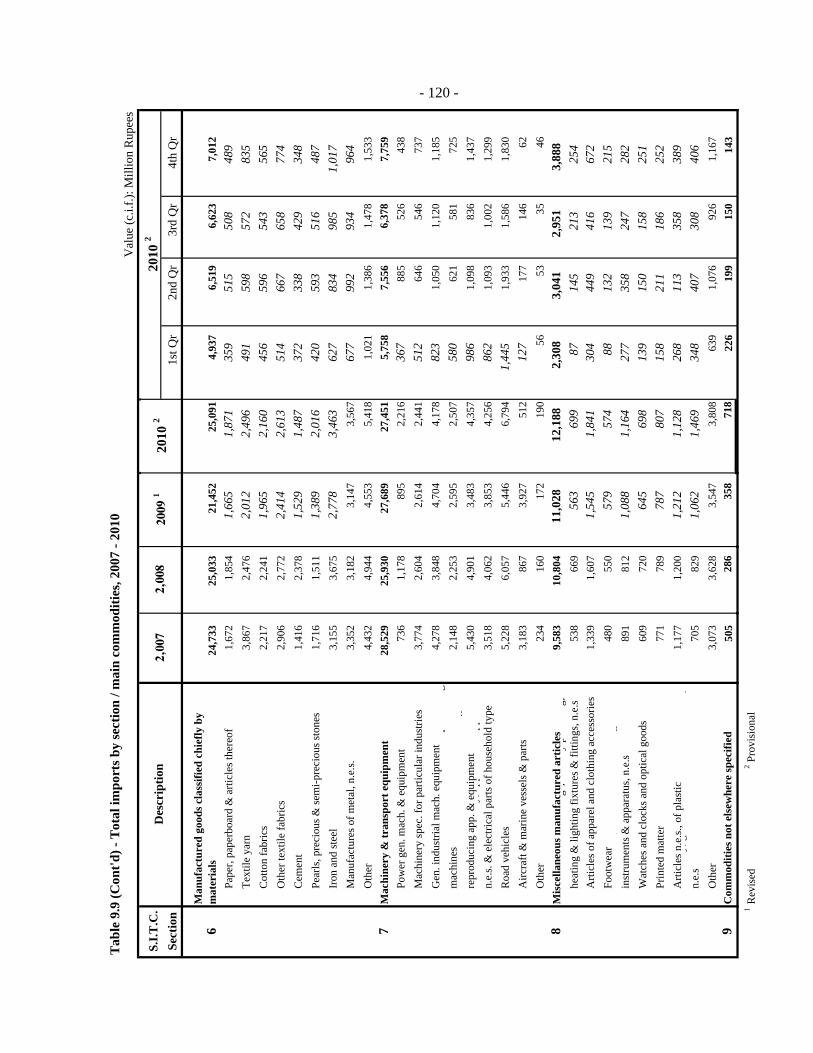
Tab
le 9
.9 (C
ont'd
) - T
otal
impo
rts b
y se
ctio
n / m
ain
com
mod
ities
, 200
7 - 2
010
Val
ue (c
.i.f.)
: Mill
ion
Rup
ees
S.I.T
.C.
Sect
ion
1st Q
r2n
d Q
r3r
d Q
r4t
h Q
r
624
,733
25,0
3321
,452
25,0
914,
937
6,51
96,
623
7,01
2Pa
per,
pape
rboa
rd &
arti
cles
ther
eof
1,67
21,
854
1,66
5
1,87
1
359
51
5
508
48
9
Text
ile y
arn
3,86
72,
476
2,01
2
2,49
6
491
59
8
572
83
5
Cot
ton
fabr
ics
2,21
72,
241
1,96
5
2,16
0
456
59
6
543
56
5
Oth
er te
xtile
fabr
ics
2,90
62,
772
2,41
4
2,61
3
514
66
7
658
77
4
Cem
ent
1,41
62,
378
1,52
9
1,48
7
372
33
8
429
34
8
Pear
ls, p
reci
ous &
sem
i-pre
ciou
s sto
nes
1,71
61,
511
1,38
9
2,01
6
420
59
3
516
48
7
Iron
and
stee
l3,
155
3,67
52,
778
3,
463
62
7
834
98
5
1,01
7
Man
ufac
ture
s of m
etal
, n.e
.s.3,
352
3,18
23,
147
3,56
767
7
992
93
4
964
O
ther
4,43
24,
944
4,55
35,
418
1,02
11,
386
1,47
81,
533
7M
achi
nery
& tr
ansp
ort e
quip
men
t28
,529
25,9
3027
,689
27,4
515,
758
7,55
66,
378
7,75
9Po
wer
gen
. mac
h. &
equ
ipm
ent
736
1,17
889
52,
216
367
88
552
643
8M
achi
nery
spec
. for
par
ticul
ar in
dust
ries
3,77
42,
604
2,61
42,
441
512
64
654
673
7G
en. i
ndus
trial
mac
h. e
quip
men
t4,
278
3,84
84,
704
4,17
882
3
1,05
01,
120
1,18
52,
148
2,25
32,
595
2,50
758
0
621
581
725
5,43
04,
901
3,48
34,
357
986
1,
098
836
1,43
73,
518
4,06
23,
853
4,25
686
2
1,09
31,
002
1,29
9R
oad
vehi
cles
5,22
86,
057
5,44
66,
794
1,44
5
1,93
31,
586
1,83
0A
ircra
ft &
mar
ine
vess
els &
par
ts3,
183
867
3,92
751
212
7
177
146
62O
ther
234
160
172
190
5653
3546
8M
isce
llane
ous m
anuf
actu
red
artic
les
9,58
310
,804
11,0
28
12,1
88
2,30
8
3,04
1
2,95
1
3,88
8
538
669
563
69
9
87
145
21
3
254
A
rticl
es o
f app
arel
and
clo
thin
g ac
cess
orie
s1,
339
1,60
71,
545
1,
841
30
4
449
41
6
672
Fo
otw
ear
480
550
579
57
4
88
132
13
9
215
89
181
21,
088
1,
164
27
7
358
24
7
282
W
atch
es a
nd c
lock
s and
opt
ical
goo
ds60
972
064
5
698
13
9
150
15
8
251
Pr
inte
d m
atte
r 77
178
978
7
807
15
8
211
18
6
252
A
rticl
es n
.e.s.
, of p
last
ic
1,17
71,
200
1,21
2
1,12
8
268
11
3
358
38
9
705
829
1,06
2
1,46
9
348
40
7
308
40
6
Oth
er3,
073
3,62
83,
547
3,80
863
91,
076
926
1,16
79
Com
mod
ities
not
els
ewhe
re sp
ecifi
ed50
528
635
871
822
619
915
014
31
Rev
ised
2 P
rovi
sion
al
2009
1
- 120 -
g;
yp
g,he
atin
g &
ligh
ting
fixtu
res &
fitti
ngs,
n.e.
s
,g
inst
rum
ents
& a
ppar
atus
, n.e
.s
y,g
,n.
e.s
2010
2
y,pp
ppn.
e.s.
& e
lect
rical
par
ts o
f hou
seho
ld ty
pegre
prod
ucin
g ap
p. &
equ
ipm
ent
pg
mac
hine
s
2010
2
Man
ufac
ture
d go
ods c
lass
ified
chi
efly
by
mat
eria
ls
Des
crip
tion
2,00
82,
007
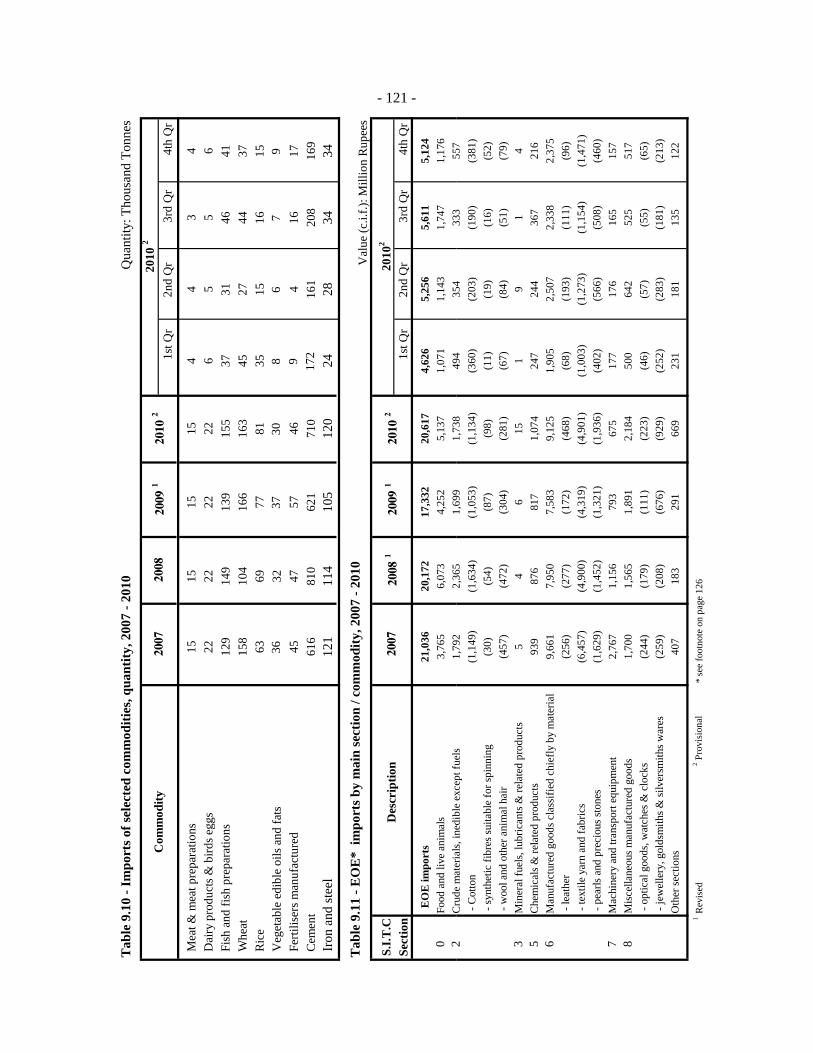
Tab
le 9
.10
- Im
port
s of s
elec
ted
com
mod
ities
, qua
ntity
, 200
7 - 2
010
Qua
ntity
: Tho
usan
d To
nnes
1st Q
r2n
d Q
r3r
d Q
r4t
h Q
r
Mea
t & m
eat p
repa
ratio
ns15
1515
154
43
4D
airy
pro
duct
s & b
irds e
ggs
2222
2222
65
56
Fish
and
fish
pre
para
tions
129
149
139
155
3731
4641
Whe
at15
810
416
616
345
2744
37R
ice
6369
7781
3515
1615
Veg
etab
le e
dibl
e oi
ls a
nd fa
ts36
3237
308
67
9Fe
rtilis
ers m
anuf
actu
red
4547
5746
94
1617
Cem
ent
616
810
621
710
172
161
208
169
Iron
and
stee
l12
111
410
512
024
2834
34
Tab
le 9
.11
- EO
E*
impo
rts b
y m
ain
sect
ion
/ com
mod
ity, 2
007
- 201
0
1st Q
r2n
d Q
r3r
d Q
r4t
h Q
r
EO
E im
port
s21
,036
20,1
7217
,332
20,6
174,
626
5,25
65,
611
5,12
40
Food
and
live
ani
mal
s3,
765
6,07
34,
252
5,13
71,
071
1,14
31,
747
1,17
62
Cru
dem
ater
ials
ined
ible
exce
ptfu
els
179
22
365
169
91
738
494
354
333
557
2010
2
2010
2
2010
2
2010
2
2007
2008
2008
1
Val
ue (c
.i.f.)
: Mill
ion
Rup
ees
2007
2009
1
2009
1C
omm
odity
D
escr
iptio
nS.
I.T.C
Sect
ion
- 121 -
2C
rude
mat
eria
ls, in
edib
le e
xcep
t fue
ls1,
792
2,36
51,
699
1,73
849
435
433
355
7 -
Cot
ton
(1,1
49)
(1,6
34)
(1,0
53)
(1,1
34)
(360
)(2
03)
(190
)(3
81)
- sy
nthe
tic fi
bres
suita
ble
for s
pinn
ing
(30)
(54)
(87)
(98)
(11)
(19)
(16)
(52)
- w
ool a
nd o
ther
ani
mal
hai
r(4
57)
(472
)(3
04)
(281
)(6
7)(8
4)(5
1)(7
9)3
Min
eral
fuel
s, lu
bric
ants
& re
late
d pr
oduc
ts5
46
151
91
45
Che
mic
als &
rela
ted
prod
ucts
939
876
817
1,07
424
724
436
721
66
9,66
17,
950
7,58
39,
125
1,90
52,
507
2,33
82,
375
- le
athe
r(2
56)
(277
)(1
72)
(468
)(6
8)(1
93)
(111
)(9
6) -
text
ile y
arn
and
fabr
ics
(6,4
57)
(4,9
00)
(4,3
19)
(4,9
01)
(1,0
03)
(1,2
73)
(1,1
54)
(1,4
71)
- pe
arls
and
prec
ious
ston
es(1
,629
)(1
,452
)(1
,321
)(1
,936
)(4
02)
(566
)(5
08)
(460
)7
Mac
hine
ry a
nd tr
ansp
ort e
quip
men
t2,
767
1,15
679
367
517
717
616
515
78
Mis
cella
neou
s man
ufac
ture
d go
ods
1,70
01,
565
1,89
12,
184
500
642
525
517
- op
tical
goo
ds, w
atch
es &
clo
cks
(244
)(1
79)
(111
)(2
23)
(46)
(57)
(55)
(65)
(259
)(2
08)
(676
)(9
29)
(252
)(2
83)
(181
)(2
13)
Oth
er se
ctio
ns40
718
329
166
923
118
113
512
2
1R
evis
ed2 P
rovi
sion
al*
see
foot
note
on
page
126
- je
wel
lery
, gol
dsm
iths &
silv
ersm
iths w
ares
Man
ufac
ture
d go
ods c
lass
ified
chi
efly
by
mat
eria
l
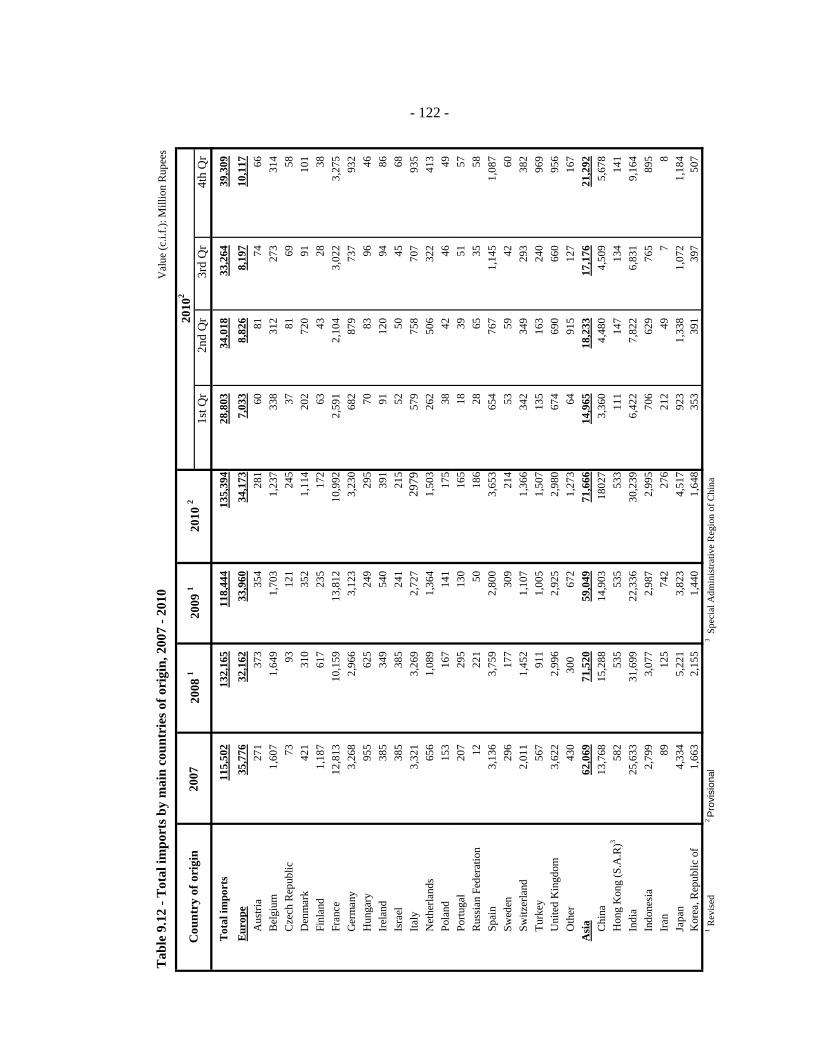
Tab
le 9
.12
- Tot
al im
port
s by
mai
n co
untr
ies o
f ori
gin,
200
7 - 2
010
Val
ue (c
.i.f.)
: Mill
ion
Rup
ees
1st Q
r2n
d Q
r3r
d Q
r4t
h Q
r
Tot
al im
port
s11
5,50
213
2,16
511
8,44
413
5,39
428
,803
34,0
1833
,264
39,3
09
Eur
ope
35,7
7632
,162
33,9
6034
,173
7,03
38,
826
8,19
710
,117
Aus
tria
271
373
354
281
6081
7466
Bel
gium
1,60
71,
649
1,70
31,
237
338
312
273
314
Cze
ch R
epub
lic73
9312
124
537
8169
58D
enm
ark
421
310
352
1,11
420
272
091
101
Finl
and
1,18
761
723
517
263
4328
38Fr
ance
12,8
1310
,159
13,8
1210
,992
2,59
12,
104
3,02
23,
275
Ger
man
y3,
268
2,96
63,
123
3,23
068
287
973
793
2H
unga
ry95
562
524
929
570
8396
46Ire
land
385
349
540
391
9112
094
86Is
rael
385
385
241
215
5250
4568
Italy
3,32
13,
269
2,72
729
7957
975
870
793
5N
ethe
rland
s65
61,
089
1,36
41,
503
262
506
322
413
Pola
nd15
316
714
117
538
4246
49
2008
120
07
Cou
ntry
of o
rigi
n20
09 1
2010
2
2010
2
- 122 -
Portu
gal
207
295
130
165
1839
5157
Rus
sian
Fed
erat
ion
1222
150
186
2865
3558
Spai
n3,
136
3,75
92,
800
3,65
365
476
71,
145
1,08
7Sw
eden
296
177
309
214
5359
4260
Switz
erla
nd2,
011
1,45
21,
107
1,36
634
234
929
338
2Tu
rkey
567
911
1,00
51,
507
135
163
240
969
Uni
ted
Kin
gdom
3,62
22,
996
2,92
52,
980
674
690
660
956
Oth
er43
030
0
672
1,27
364
915
127
167
Asi
a62
,069
71,5
2059
,049
71,6
6614
,965
18,2
3317
,176
21,2
92C
hina
13,7
6815
,288
14,9
0318
027
3,36
04,
480
4,50
95,
678
Hon
g K
ong
(S.A
.R)3
582
535
535
533
111
147
134
141
Indi
a25
,633
31,6
9922
,336
30,2
396,
422
7,82
26,
831
9,16
4In
done
sia
2,79
93,
077
2,98
72,
995
706
629
765
895
Iran
8912
574
227
621
249
78
Japa
n4,
334
5,22
13,
823
4,51
792
31,
338
1,07
21,
184
Kor
ea, R
epub
lic o
f1,
663
2,15
51,
440
1,64
835
339
139
750
71 R
evis
ed2 P
rovi
sion
al3 S
peci
al A
dmin
istra
tive
Reg
ion
of C
hina
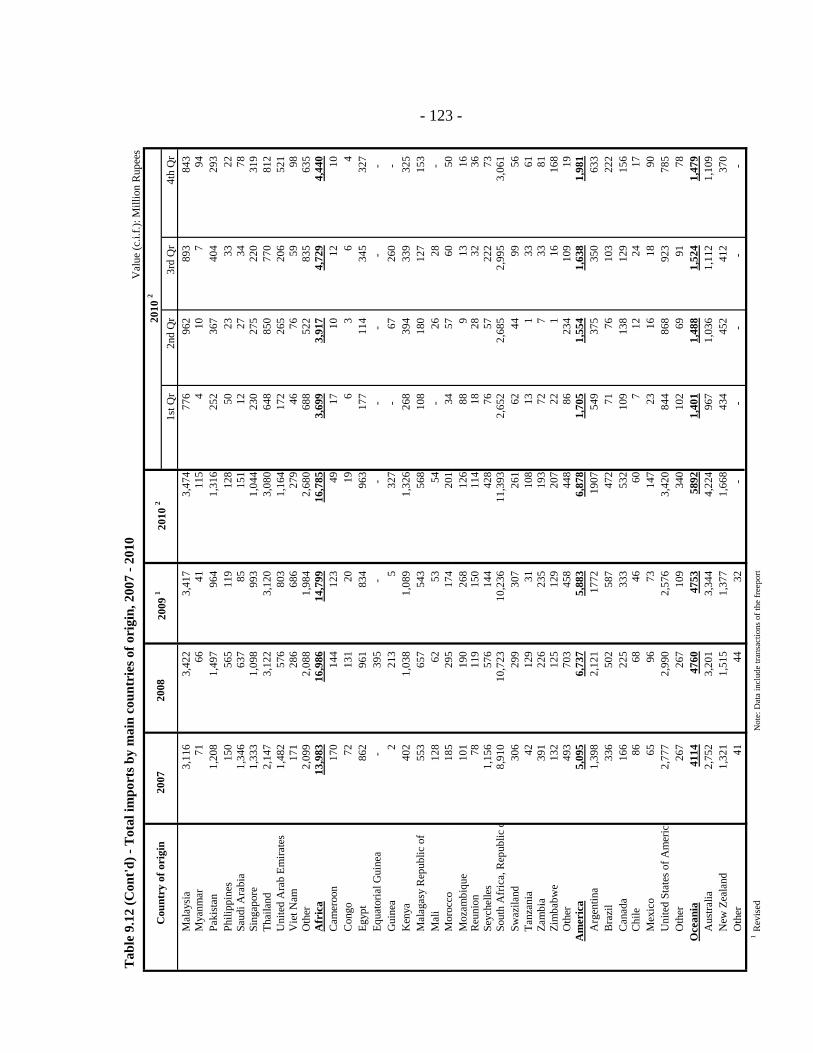
Tab
le 9
.12
(Con
t'd) -
Tot
al im
port
s by
mai
n co
untr
ies o
f ori
gin,
200
7 - 2
010
1st Q
r2n
d Q
r3r
d Q
r4t
h Q
rM
alay
sia
3,11
63,
422
3,41
73,
474
776
962
893
843
Mya
nma r
7166
4111
54
107
94Pa
kist
an1,
208
1,49
796
41,
316
252
367
404
293
Phili
ppin
es15
056
511
912
850
2333
22Sa
udi A
rabi
a1,
346
637
8515
112
2734
78Si
ngap
ore
1,33
31,
098
993
1,04
423
027
522
031
9Th
aila
nd2,
147
3,12
23,
120
3,08
064
885
077
081
2U
nite
d A
rab
Emira
tes
1,48
257
680
31,
164
172
265
206
521
Vie
t Na m
171
286
686
279
4676
5998
Oth
e r2,
099
2,08
81,
984
2,68
068
852
283
563
5A
fric
a13
,983
16,9
8614
,799
16,7
853,
699
3,91
74,
729
4,44
0C
amer
oon
170
144
123
4917
1012
10C
ongo
7213
120
196
36
4Eg
ypt
862
961
834
963
177
114
345
327
Equa
toria
l Gui
nea
-
395
-
-
-
-
-
-
Gui
nea
221
35
327
-
6726
0
-
K
enya
402
1,03
81,
089
1,32
626
839
433
932
5M
alag
asy
Rep
ublic
of
553
657
543
568
108
180
127
153
Mal
i12
862
5354
-
2628
-
Mor
occo
185
295
174
201
3457
6050
Cou
ntry
of o
rigi
n20
0720
08
Val
ue (c
.i.f.)
: Mill
ion
Rup
ees
- 123
2010
2
2009
120
10 2
Mor
occo
185
295
174
201
3457
6050
Moz
ambi
que
101
190
268
126
889
1316
Reu
nion
7811
915
011
418
2832
36Se
yche
lles
1,15
657
614
442
876
5722
273
Sout
h A
fric
a, R
epub
lic o
8,91
010
,723
10,2
3611
,393
2,65
22,
685
2,99
53,
061
Swaz
iland
306
299
307
261
6244
9956
Tanz
ania
4212
931
108
131
3361
Zam
bia
391
226
235
193
727
3381
Zim
babw
e13
212
512
920
722
116
168
Oth
e r49
370
345
844
886
234
109
19A
mer
ica
5,09
56,
737
5,88
36,
878
1,70
51,
554
1,63
81,
981
Arg
entin
a1,
398
2,12
117
7219
0754
937
535
063
3B
razi
l33
650
258
747
271
7610
322
2C
anad
a16
622
533
353
210
913
812
915
6C
hile
86
6846
607
1224
17M
exic
o65
9673
147
2316
1890
Uni
ted
Stat
es o
f Am
eric
a2,
777
2,99
02,
576
3,42
084
486
892
378
5O
ther
267
267
109
340
102
6991
78O
cean
ia41
1447
6047
5358
921,
401
1,48
81,
524
1,47
9A
ustra
lia2,
752
3,20
13,
344
4,22
496
71,
036
1,11
21,
109
New
Zea
land
1,32
11,
515
1,37
71,
668
434
452
412
370
Oth
er41
4432
-
-
-
-
-
1R
evis
edN
ote:
Dat
a in
clud
e tra
nsac
tions
of t
he fr
eepo
rt
3 -
- 124 -
SECTION 10 - LABOUR STATISTICS
(a) Prior to 2004, estimates of labour force, employment and unemployment that were published, were based on the latest Population Census or Labour Force Sample Survey, updated with data from surveys of establishments and information from various administrative sources. The estimates refer to population aged 12 years and over.
(b) As from 2004, the Continuous Multi Purpose Household Survey (CMPHS) is being used to
measure labour force, employment and unemployment. This follows the recommendations of a Technical Committee set up to analyse the findings of a World Bank study on unemployment in Mauritius. With the amendment to the Labour Act in December 2007, whereby the minimum legal working age has been raised from 15 to 16 years, and the subsequent recommendation of ILO to be in line with the Act, the lower age cut-off point for the labour force is 16 years as from 2007.
2. Tables 10.2 to 10.8 show figures of employment and earnings derived from the March
Survey of Employment and Earnings. The figures relate to large establishments only, defined as:
(a) Agricultural establishments comprising:
(i) Sugar plantations of 10 hectares or more, (ii) Tea plantations of 2 hectares or more, (iii) All 'flue-cured' tobacco establishments, irrespective of acreage, (iv) Other agricultural establishments employing at least 10 persons during the
reference period (March 2010). (b) Non-agricultural establishments employing at least 10 persons during the reference
month. It is to be noted that 'outworkers', i.e. piece-rate workers who, although employed by an establishment, are working in their homes on materials provided by the establishment are excluded.
3. (a) Classification used is according to the National Standard Industrial Classification,
which is an adaptation of the International Standard Industrial Classification Rev. 3 (ISIC Rev. 3) of 1990.
(b) Establishments previously lumped under ‘Central Government’ are now allocated to
their relevant industry groups according to their activities.
- 125 -
4. It is to be noted that apart from increases in salaries and wages, fluctuations in earnings
(tables 10.4 to 10.8 ) may be due to:
(a) changes of different magnitude in the various categories of employees e.g. a large intake of employees at the lower end of the wage scale (as occurs when a new factory starts operation) has the effect of lowering the average earnings. On the other hand, a large intake of professionals by, say, an architectural firm can cause a sudden increase in the average monthly earnings.
(b) changes in overtime, regular allowances, bonuses and commissions.
5. Tables 10.9 - 10.12 show figures of wages/salaries and earnings by occupation. The figures
shown in table 10.10 have been derived from the Quarterly Survey of Employment, Earnings and Hours of work carried out among a sample of large establishments. Large fluctuations noted in certain occupations are mainly due to changes in allowances and overtime.
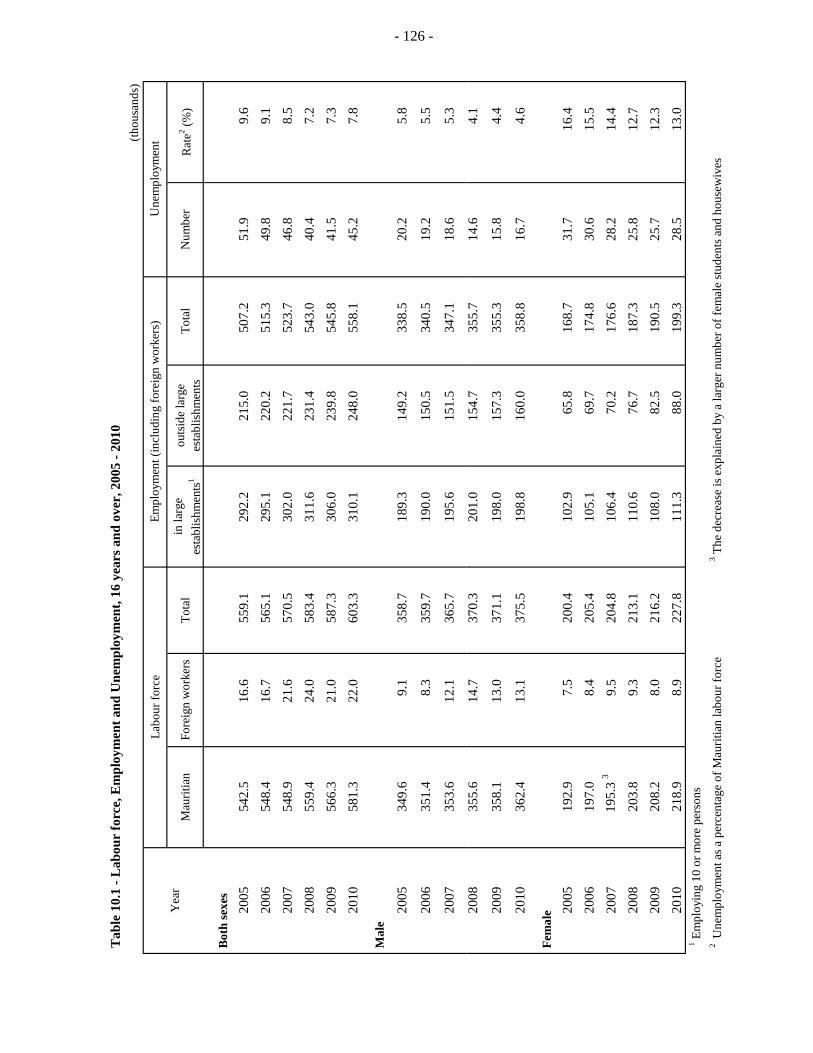
Tab
le 1
0.1
- Lab
our
forc
e, E
mpl
oym
ent a
nd U
nem
ploy
men
t, 16
yea
rs a
nd o
ver,
200
5 - 2
010
(thou
sand
s)
Labo
ur fo
rce
Yea
rM
aurit
ian
Fore
ign
wor
kers
Tota
lin
larg
e es
tabl
ishm
ents
1ou
tsid
e la
rge
esta
blis
hmen
tsTo
tal
Num
ber
Rat
e2 (%)
Bot
h se
xes
2005
542.
516
.6
559.
1
29
2.2
215.
0
50
7.2
51.9
9.6
2006
548.
416
.7
565.
1
29
5.1
220.
2
51
5.3
49.8
9.1
2007
548.
921
.6
570.
5
30
2.0
221.
7
52
3.7
46.8
8.5
2008
559.
424
.0
583.
4
31
1.6
231.
4
54
3.0
40.4
7.2
2009
566.
321
.0
587.
3
30
6.0
239.
8
54
5.8
41.5
7.3
2010
581.
322
.0
603.
3
31
0.1
248.
0
55
8.1
45.2
7.8
Mal
e
2005
349.
69.
1
35
8.7
189.
3
14
9.2
338.
5
20
.25.
8
2006
351.
48.
3
35
9.7
190.
0
15
0.5
340.
5
19
.25.
5
2007
353.
612
.1
365.
7
19
5.6
151.
5
34
7.1
18.6
5.3
Empl
oym
ent (
incl
udin
g fo
reig
n w
orke
rs)
Une
mpl
oym
ent
- 126 -
2008
355.
614
.7
370.
3
20
1.0
154.
7
35
5.7
14.6
4.1
2009
358.
113
.0
371.
1
19
8.0
157.
3
35
5.3
15.8
4.4
2010
362.
413
.1
375.
5
19
8.8
160.
0
35
8.8
16.7
4.6
Fem
ale 20
0519
2.9
7.5
200.
4
10
2.9
65.8
16
8.7
31.7
16.4
20
0619
7.0
8.4
205.
4
10
5.1
69.7
17
4.8
30.6
15.5
20
07 1
95.3
39.
5
20
4.8
106.
4
70
.2
176.
6
28
.214
.4
2008
203.
89.
3
21
3.1
110.
6
76
.7
187.
3
25
.812
.7
2009
208.
28.
0
21
6.2
108.
0
82
.5
190.
5
25
.712
.3
2010
218.
98.
9
22
7.8
111.
3
88
.0
199.
3
28
.513
.0
1 E
mpl
oyin
g 10
or m
ore
pers
ons
2 U
nem
ploy
men
t as a
per
cent
age
of M
aurit
ian
labo
ur fo
rce
3Th
e de
crea
se is
exp
lain
ed b
y a
larg
er n
umbe
r of f
emal
e st
uden
ts a
nd h
ouse
wiv
es
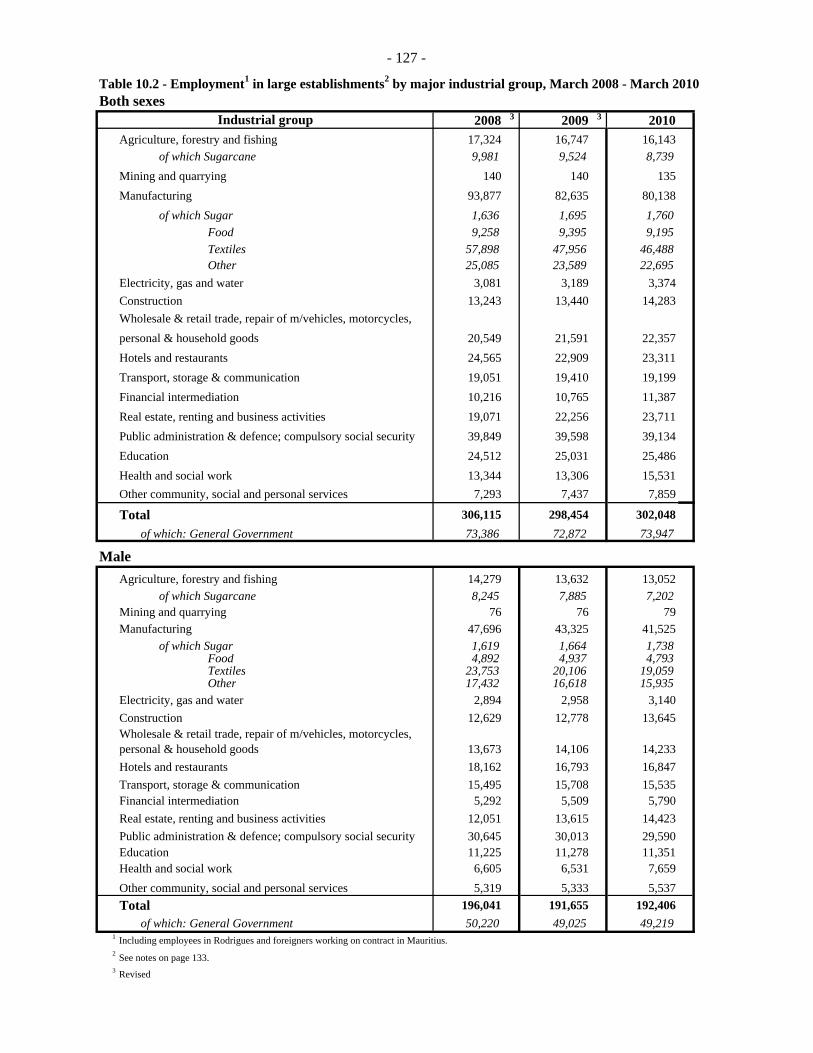
- 127 -
Table 10.2 - Employment1 in large establishments2 by major industrial group, March 2008 - March 2010Both sexes
2008 3 2009 3 2010Agriculture, forestry and fishing 17,324 16,747 16,143 of which Sugarcane 9,981 9,524 8,739Mining and quarrying 140 140 135Manufacturing 93,877 82,635 80,138 of which Sugar 1,636 1,695 1,760 Food 9,258 9,395 9,195 Textiles 57,898 47,956 46,488 Other 25,085 23,589 22,695Electricity, gas and water 3,081 3,189 3,374Construction 13,243 13,440 14,283Wholesale & retail trade, repair of m/vehicles, motorcycles, personal & household goods 20,549 21,591 22,357Hotels and restaurants 24,565 22,909 23,311Transport, storage & communication 19,051 19,410 19,199Financial intermediation 10,216 10,765 11,387Real estate, renting and business activities 19,071 22,256 23,711Public administration & defence; compulsory social security 39,849 39,598 39,134Education 24,512 25,031 25,486Health and social work 13,344 13,306 15,531Other community, social and personal services 7,293 7,437 7,859
Total 306,115 298,454 302,048 of which: General Government 73,386 72,872 73,947
MaleAgriculture, forestry and fishing 14,279 13,632 13,052 of which Sugarcane 8,245 7,885 7,202Mining and quarrying 76 76 79Manufacturing 47,696 43,325 41,525 of which Sugar 1,619 1,664 1,738 Food 4,892 4,937 4,793 Textiles 23,753 20,106 19,059 Other 17,432 16,618 15,935Electricity, gas and water 2,894 2,958 3,140Construction 12,629 12,778 13,645Wholesale & retail trade, repair of m/vehicles, motorcycles, personal & household goods 13,673 14,106 14,233Hotels and restaurants 18,162 16,793 16,847Transport, storage & communication 15,495 15,708 15,535Financial intermediation 5,292 5,509 5,790Real estate, renting and business activities 12,051 13,615 14,423Public administration & defence; compulsory social security 30,645 30,013 29,590Education 11,225 11,278 11,351Health and social work 6,605 6,531 7,659Other community, social and personal services 5,319 5,333 5,537Total 196,041 191,655 192,406 of which: General Government 50,220 49,025 49,219
1 Including employees in Rodrigues and foreigners working on contract in Mauritius.2 See notes on page 133. 3 Revised
Industrial group
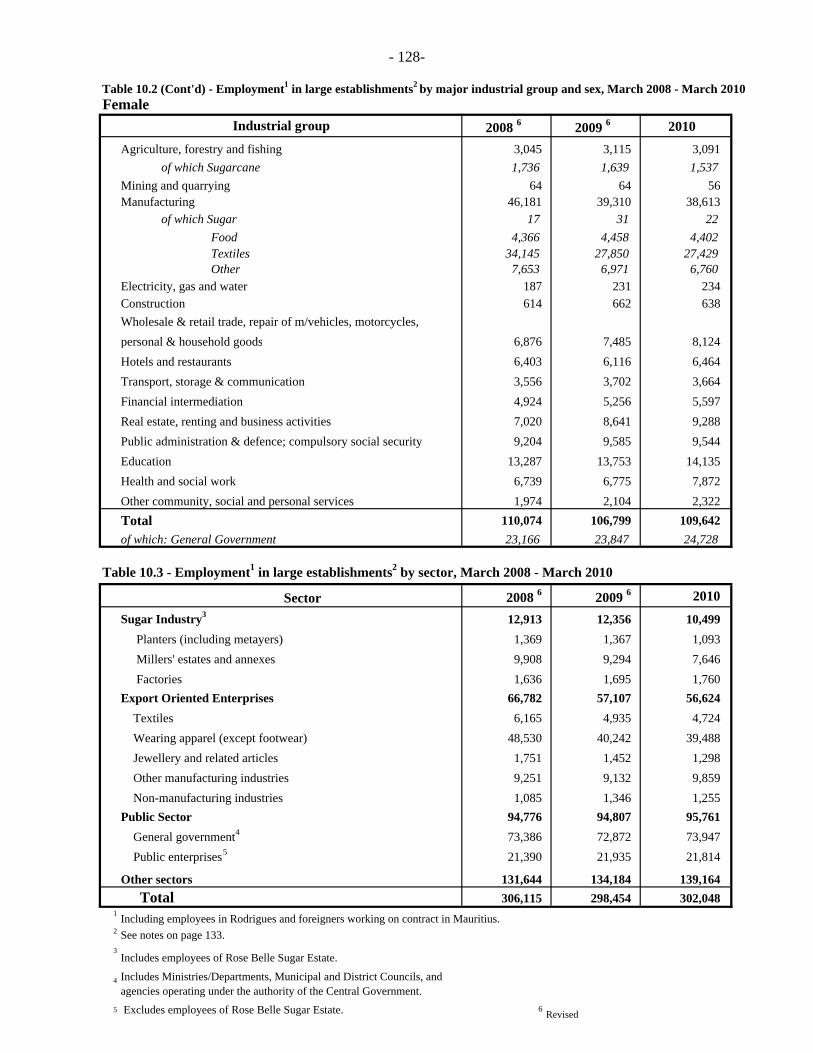
- 128-
Table 10.2 (Cont'd) - Employment1 in large establishments2 by major industrial group and sex, March 2008 - March 2010Female
2008 6 2009 6 2010Agriculture, forestry and fishing 3,045 3,115 3,091 of which Sugarcane 1,736 1,639 1,537Mining and quarrying 64 64 56Manufacturing 46,181 39,310 38,613 of which Sugar 17 31 22 Food 4,366 4,458 4,402 Textiles 34,145 27,850 27,429 Other 7,653 6,971 6,760Electricity, gas and water 187 231 234Construction 614 662 638Wholesale & retail trade, repair of m/vehicles, motorcycles, personal & household goods 6,876 7,485 8,124Hotels and restaurants 6,403 6,116 6,464Transport, storage & communication 3,556 3,702 3,664Financial intermediation 4,924 5,256 5,597Real estate, renting and business activities 7,020 8,641 9,288Public administration & defence; compulsory social security 9,204 9,585 9,544Education 13,287 13,753 14,135Health and social work 6,739 6,775 7,872Other community, social and personal services 1,974 2,104 2,322Total 110,074 106,799 109,642of which: General Government 23,166 23,847 24,728
Table 10.3 - Employment1 in large establishments2 by sector, March 2008 - March 2010
Sector 2008 6 2009 6 2010
Sugar Industry3 12,913 12,356 10,499 Planters (including metayers) 1,369 1,367 1,093 Millers' estates and annexes 9,908 9,294 7,646 Factories 1,636 1,695 1,760Export Oriented Enterprises 66,782 57,107 56,624 Textiles 6,165 4,935 4,724 Wearing apparel (except footwear) 48,530 40,242 39,488 Jewellery and related articles 1,751 1,452 1,298 Other manufacturing industries 9,251 9,132 9,859 Non-manufacturing industries 1,085 1,346 1,255Public Sector 94,776 94,807 95,761 General government4 73,386 72,872 73,947 Public enterprises5 21,390 21,935 21,814
Other sectors 131,644 134,184 139,164 Total 306,115 298,454 302,048
1 Including employees in Rodrigues and foreigners working on contract in Mauritius.2 See notes on page 133.3
Includes employees of Rose Belle Sugar Estate.
4 Includes Ministries/Departments, Municipal and District Councils, and agencies operating under the authority of the Central Government.
5 Excludes employees of Rose Belle Sugar Estate. 6 Revised
Industrial group
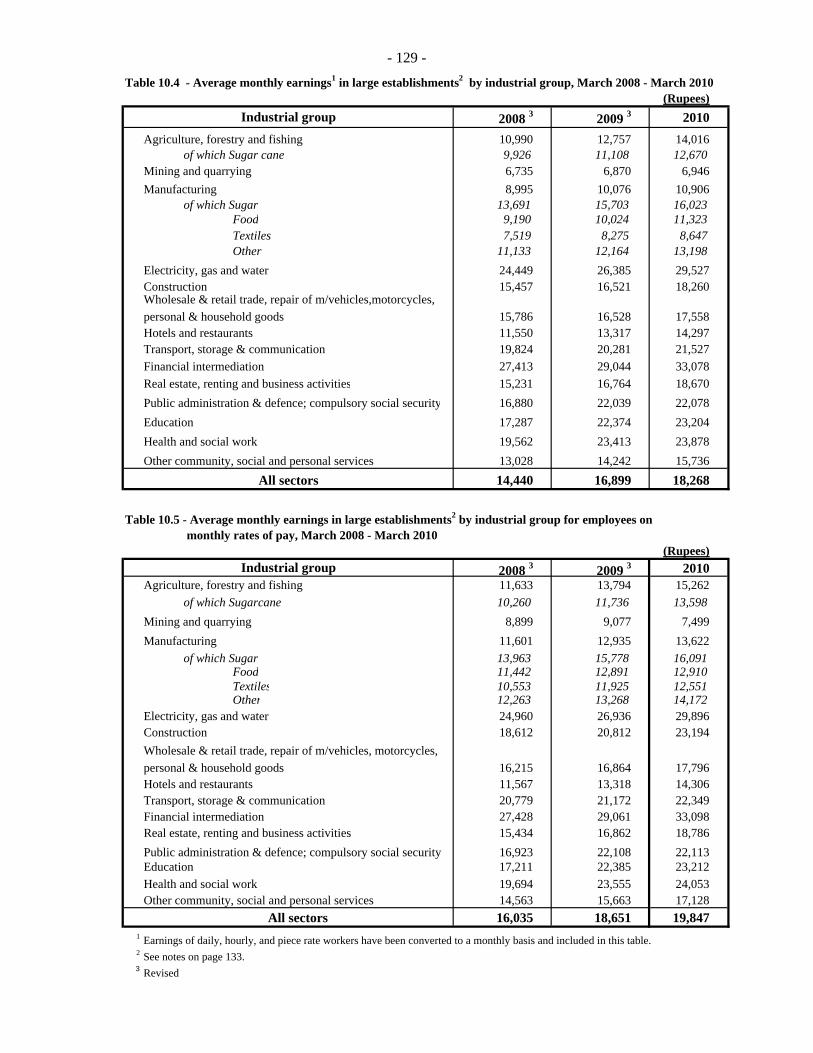
- 129 -
Table 10.4 - Average monthly earnings1 in large establishments2 by industrial group, March 2008 - March 2010(Rupees)
2008 3 2009 3 2010Agriculture, forestry and fishing 10,990 12,757 14,016 of which Sugar cane 9,926 11,108 12,670Mining and quarrying 6,735 6,870 6,946Manufacturing 8,995 10,076 10,906 of which Sugar 13,691 15,703 16,023 Food 9,190 10,024 11,323 Textiles 7,519 8,275 8,647 Other 11,133 12,164 13,198Electricity, gas and water 24,449 26,385 29,527Construction 15,457 16,521 18,260Wholesale & retail trade, repair of m/vehicles,motorcycles, personal & household goods 15,786 16,528 17,558Hotels and restaurants 11,550 13,317 14,297Transport, storage & communication 19,824 20,281 21,527Financial intermediation 27,413 29,044 33,078Real estate, renting and business activities 15,231 16,764 18,670Public administration & defence; compulsory social security 16,880 22,039 22,078Education 17,287 22,374 23,204Health and social work 19,562 23,413 23,878Other community, social and personal services 13,028 14,242 15,736
14,440 16,899 18,268
Table 10.5 - Average monthly earnings in large establishments2 by industrial group for employees on monthly rates of pay, March 2008 - March 2010
(Rupees)2008 3 2009 3 2010
Agriculture, forestry and fishing 11,633 13,794 15,262 of which Sugarcane 10,260 11,736 13,598Mining and quarrying 8,899 9,077 7,499Manufacturing 11,601 12,935 13,622 of which Sugar 13,963 15,778 16,091 Food 11,442 12,891 12,910 Textiles 10,553 11,925 12,551 Other 12,263 13,268 14,172Electricity, gas and water 24,960 26,936 29,896Construction 18,612 20,812 23,194Wholesale & retail trade, repair of m/vehicles, motorcycles,personal & household goods 16,215 16,864 17,796Hotels and restaurants 11,567 13,318 14,306Transport, storage & communication 20,779 21,172 22,349Financial intermediation 27,428 29,061 33,098Real estate, renting and business activities 15,434 16,862 18,786Public administration & defence; compulsory social security 16,923 22,108 22,113Education 17,211 22,385 23,212Health and social work 19,694 23,555 24,053Other community, social and personal services 14,563 15,663 17,128
All sectors 16,035 18,651 19,8471 Earnings of daily, hourly, and piece rate workers have been converted to a monthly basis and included in this table. 2 See notes on page 133.3 Revised
Industrial group
All sectors
Industrial group

- 130 -Table 10.6 - Average daily earnings in large establishments1 by industrial group for employees on daily
rates of pay, March 2008 - March 2010
Industrial group 2008 2009 3 2010 Agriculture, forestry and fishing 320 314 332 of which Sugarcane 337 329 355 Mining and quarrying 215 219 240 Manufacturing 263 291 322 of which Sugar 443 520 517 Food 261 239 268 Textiles 231 271 302 Other 332 351 377 Electricity, gas and water 309 309 211 Construction 477 485 523 Wholesale & retail trade, repair of motor vehicles,motorcycles, personal & household goods 306 306 353 Hotels and restaurants 304 - -Transport, storage & communication 346 386 459 Financial intermediation 331 495 536 Real estate, renting and business activities 254 290 343 Public administration & defence; compulsory social security 275 384 628 Education 296 260 302 Health and social work 302 214 135 Other community, social and personal services 260 260 313 All sectors 310 333 376
Table 10.7 - Average monthly earnings in EOE2 by industrial group for employees exclusively on monthly rates of pay, March 2008 - March 2010
Industrial group 2008 3 2009 3 2010 Manufacturing 10,513 11,674 12,184 Food 10,193 10,980 9,834 Textiles 11,421 12,042 12,488 Wearing apparel (except footwear) 10,538 12,659 13,609 Footwear and leather products 17,000 19,000 21,092 Wood and furniture 8,470 8,236 9,766 Medical, optical and photographic equipment 9,074 10,135 11,726 Watches and clocks 8,400 9,100 10,551 Jewellery & related articles 9,247 10,191 10,963 Paper products and printing and publishing 10,885 11,120 11,396 Chemical and plastic products 11,875 11,475 13,523 Other 10,238 9,105 10,414 Non-manufacturing 20,357 20,000 20,431 All sectors 10,938 12,280 12,700
Table 10.8 - Average daily earnings in EOE2 by industrial group for employees exclusively on daily rates of pay, March 2008 - March 2010
Industrial group 2008 3 2009 3 2010 Manufacturing 241 274 303 Food 235 250 243 Textiles 281 286 419 Wearing apparel (except footwear) 236 276 299 Footwear and leather products 265 300 348 Wood and furniture 279 309 300 Medical, optical and photographic equipment 304 352 351 Watches and clocks - - - Jewellery & related articles 211 226 - Paper products and printing and publishing - - - Chemical and plastic products 219 284 258 Other 205 249 266 Non-manufacturing 254 265 366 All sectors 241 274 305
1 See notes on page 133. 2 Export Oriented EntreprisesPlease note that EOE consists of those entreprises previously operating with an EPZ certificate, and those entreprises manufacturing goods for export and holding a registration certificate issued by the Board of Investment
3 Revised
(Rupees)
(Rupees)
(Rupees)
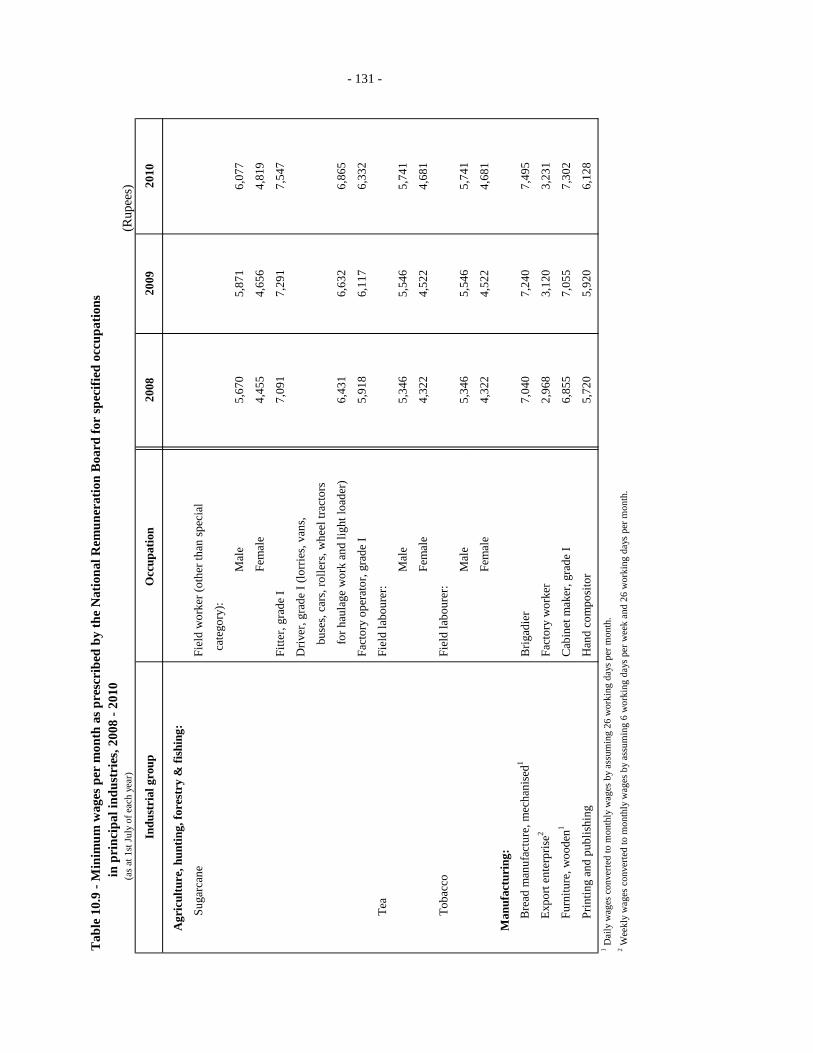
Tab
le 1
0.9
- Min
imum
wag
es p
er m
onth
as p
resc
ribe
d by
the
Nat
iona
l Rem
uner
atio
n B
oard
for
spec
ified
occ
upat
ions
in
pri
ncip
al in
dust
ries
, 200
8 - 2
010
(as
at 1
st J
uly
of e
ach
year
)(R
upee
s)
Indu
stri
al g
roup
Occ
upat
ion
2008
2009
2010
A
gric
ultu
re, h
untin
g, fo
rest
ry &
fish
ing:
S
ugar
cane
Fie
ld w
orke
r (ot
her t
han
spec
ial
ca
tego
ry):
M
ale
5,67
05,
871
6,07
7
F
emal
e4,
455
4,65
64,
819
Fitt
er, g
rade
I7,
091
7,29
17,
547
Driv
er, g
rade
I (lo
rrie
s, va
ns,
b
uses
, car
s, ro
llers
, whe
el tr
acto
rs
f
or h
aula
ge w
ork
and
light
load
er)
6,43
16,
632
6,86
5
Fac
tory
ope
rato
r, gr
ade
I5,
918
6,11
76,
332
T
ea F
ield
labo
urer
:
M
ale
5,34
65,
546
5,74
1
F
emal
e4,
322
4,52
24,
681
T
obac
co F
ield
labo
urer
:
Mal
e5,
346
5,54
65,
741
- 131 -
M
ale
5,34
65,
546
5,74
1
F
emal
e4,
322
4,52
24,
681
M
anuf
actu
ring
:
B
read
man
ufac
ture
, mec
hani
sed1
Brig
adie
r7,
040
7,24
07,
495
E
xpor
t ent
erpr
ise2
Fac
tory
wor
ker
2,96
83,
120
3,23
1
F
urni
ture
, woo
den1
Cab
inet
mak
er, g
rade
I6,
855
7,05
57,
302
P
rintin
g an
d pu
blis
hing
Han
d co
mpo
sito
r5,
720
5,92
06,
128
1 Dai
ly w
ages
con
verte
d to
mon
thly
wag
es b
y as
sum
ing
26 w
orki
ng d
ays p
er m
onth
. 2 W
eekl
y w
ages
con
verte
d to
mon
thly
wag
es b
y as
sum
ing
6 w
orki
ng d
ays p
er w
eek
and
26 w
orki
ng d
ays p
er m
onth
.
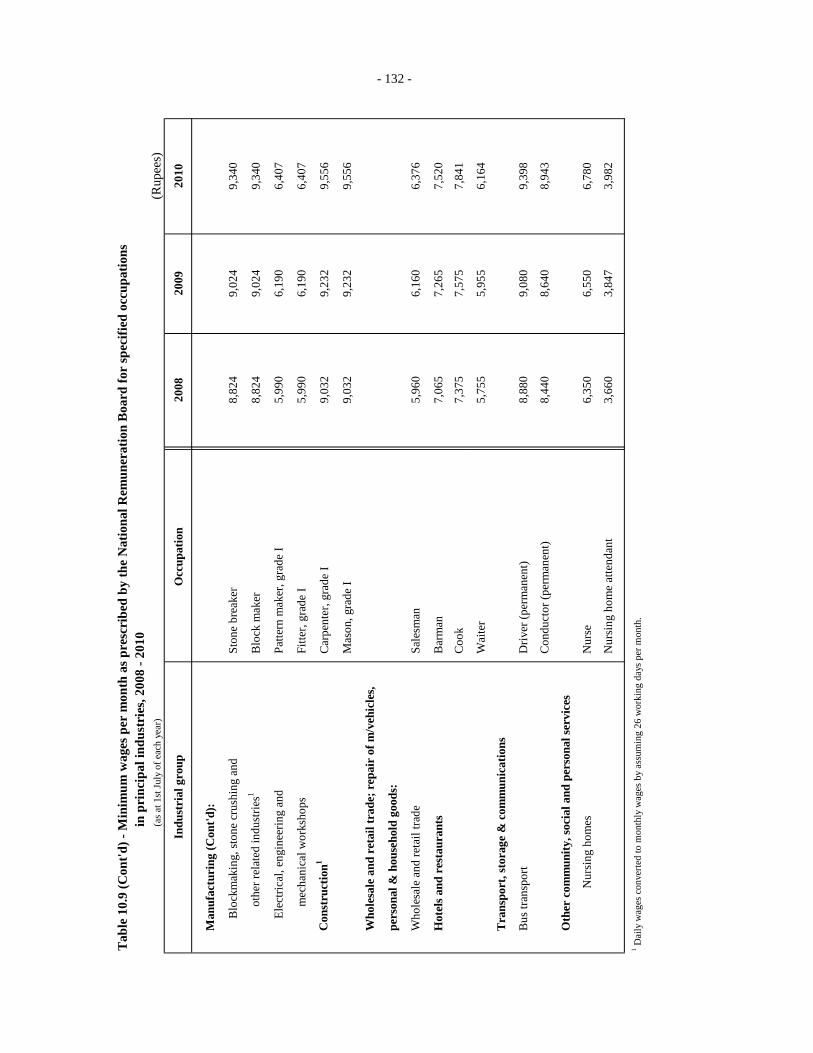
Tab
le 1
0.9
(Con
t'd) -
Min
imum
wag
es p
er m
onth
as p
resc
ribe
d by
the
Nat
iona
l Rem
uner
atio
n B
oard
for
spec
ified
occ
upat
ions
in p
rinc
ipal
indu
stri
es, 2
008
- 201
0
(as
at 1
st J
uly
of e
ach
year
)(R
upee
s)
Indu
stri
al g
roup
Occ
upat
ion
2008
2009
2010
Man
ufac
turi
ng (C
ont'd
):
B
lock
mak
ing,
ston
e cr
ushi
ng a
nd S
tone
bre
aker
8,82
49,
024
9,34
0
oth
er re
late
d in
dust
ries1
Blo
ck m
aker
8,82
49,
024
9,34
0
E
lect
rical
, eng
inee
ring
and
Pat
tern
mak
er, g
rade
I5,
990
6,19
06,
407
mec
hani
cal w
orks
hops
Fitt
er, g
rade
I5,
990
6,19
06,
407
C
onst
ruct
ion1
Car
pent
er, g
rade
I9,
032
9,23
29,
556
Mas
on, g
rade
I9,
032
9,23
29,
556
W
hole
sale
and
ret
ail t
rade
; rep
air
of m
/veh
icle
s,
pers
onal
& h
ouse
hold
goo
ds:
Who
lesa
le a
nd re
tail
trade
Sal
esm
an5,
960
6,16
06,
376
Hot
els a
nd r
esta
uran
ts B
arm
an7,
065
7,26
57,
520
Coo
k7,
375
7,57
57,
841
- 132 -
Wai
ter
5,75
55,
955
6,16
4
T
rans
port
, sto
rage
& c
omm
unic
atio
ns
Bus
tran
spor
t D
river
(per
man
ent)
8,88
09,
080
9,39
8
Con
duct
or (p
erm
anen
t)8,
440
8,64
08,
943
O
ther
com
mun
ity, s
ocia
l and
per
sona
l ser
vice
s
Nur
sing
hom
es N
urse
6,35
06,
550
6,78
0
Nur
sing
hom
e at
tend
ant
3,66
03,
847
3,98
2
1 Dai
ly w
ages
con
verte
d to
mon
thly
wag
es b
y as
sum
ing
26 w
orki
ng d
ays p
er m
onth
.
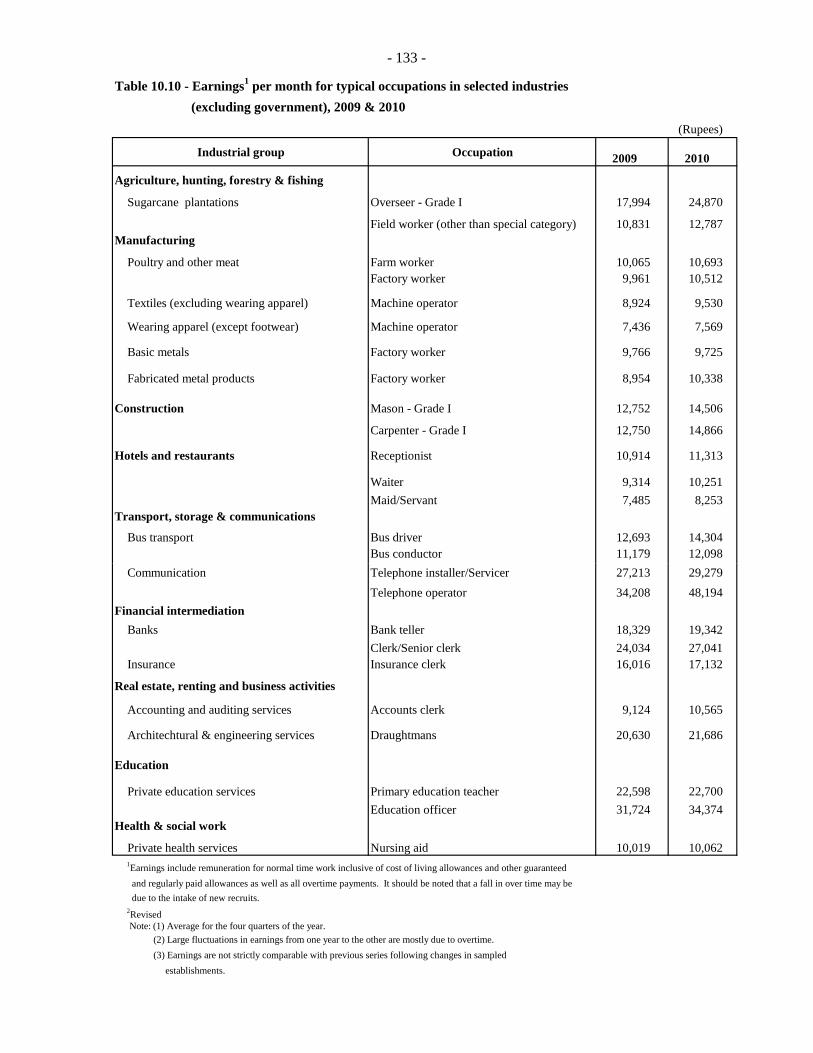
- 133 -
Table 10.10 - Earnings1 per month for typical occupations in selected industries (excluding government), 2009 & 2010
(Rupees)
Industrial group Occupation 2009 2010
Agriculture, hunting, forestry & fishing
Sugarcane plantations Overseer - Grade I 17,994 24,870
Field worker (other than special category) 10,831 12,787Manufacturing
Poultry and other meat Farm worker 10,065 10,693Factory worker 9,961 10,512
Textiles (excluding wearing apparel) Machine operator 8,924 9,530
Wearing apparel (except footwear) Machine operator 7,436 7,569
Basic metals Factory worker 9,766 9,725
Fabricated metal products Factory worker 8,954 10,338
Construction Mason - Grade I 12,752 14,506
Carpenter - Grade I 12,750 14,866
Hotels and restaurants Receptionist 10,914 11,313
Waiter 9,314 10,251Maid/Servant 7,485 8,253
Transport, storage & communications
Bus transport Bus driver 12,693 14,304Bus conductor 11,179 12,098
Communication Telephone installer/Servicer 27,213 29,279Telephone operator 34,208 48,194
Banks Bank teller 18,329 19,342Clerk/Senior clerk 24,034 27,041
Insurance Insurance clerk 16,016 17,132
Real estate, renting and business activities
Accounting and auditing services Accounts clerk 9,124 10,565
Architechtural & engineering services Draughtmans 20,630 21,686
Education
Private education services Primary education teacher 22,598 22,700Education officer 31,724 34,374
Health & social work
Private health services Nursing aid 10,019 10,0621Earnings include remuneration for normal time work inclusive of cost of living allowances and other guaranteed and regularly paid allowances as well as all overtime payments. It should be noted that a fall in over time may be due to the intake of new recruits.2Revised Note: (1) Average for the four quarters of the year. (2) Large fluctuations in earnings from one year to the other are mostly due to overtime. (3) Earnings are not strictly comparable with previous series following changes in sampled establishments.
Financial intermediation
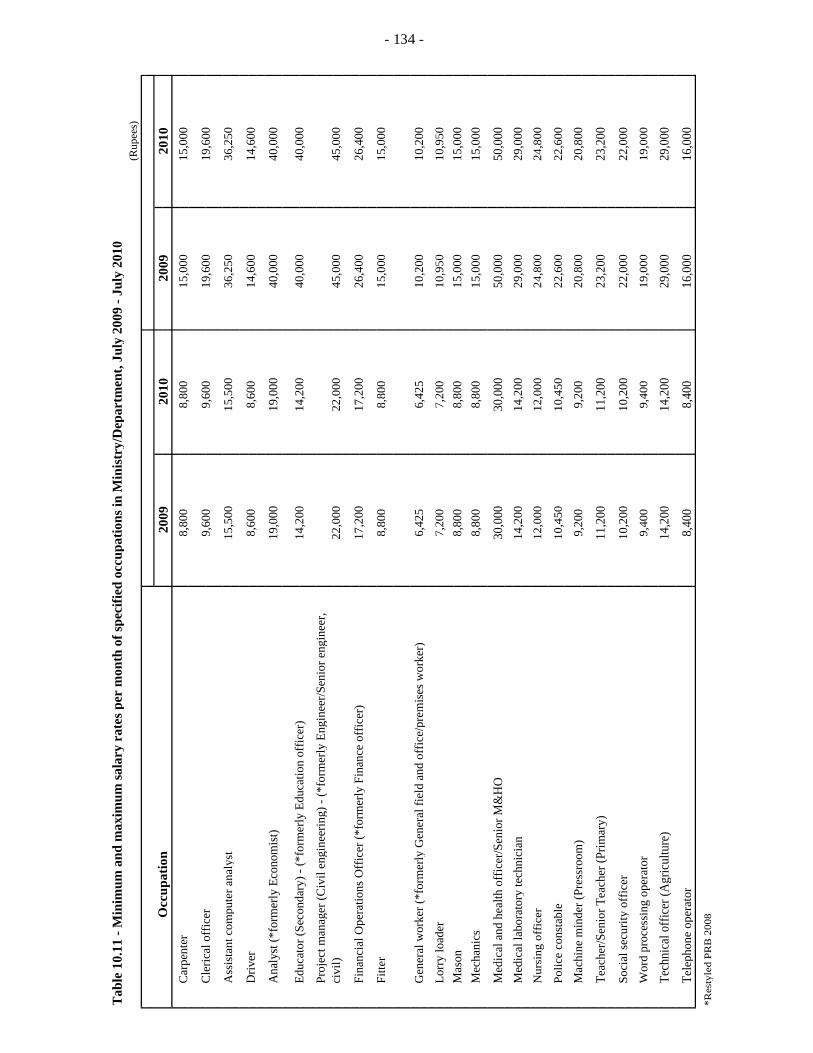
Tab
le10
.11
-Min
imum
and
max
imum
sala
ryra
tesp
erm
onth
ofsp
ecifi
edoc
cupa
tions
inM
inis
try/
Dep
artm
ent,
July
2009
-Jul
y20
10T
able
10.
11
Min
imum
and
max
imum
sala
ry r
ates
per
mon
th o
f spe
cifie
d oc
cupa
tions
in M
inis
try/
Dep
artm
ent,
July
200
9 J
uly
2010
(Rup
ees)
(p
)
Occ
upat
ion
2009
2010
2009
2010
Occ
upat
ion
2009
2010
2009
2010
C8
800
880
015
000
1500
0C
arpe
nter
8,80
0
8,80
0
15,0
00
15,0
00
p,
,,
,
Cle
rical
offic
er9
600
960
019
600
1960
0C
leric
al o
ffic
er9,
600
9,
600
19
,600
19
,600
Ass
ista
ntco
mpu
tera
naly
st15
,500
15,5
0036
,250
36,2
50A
ssis
tant
com
pute
r ana
lyst
15,5
00
15,5
00
36,2
50
36,2
50
Di
860
08
600
1460
014
600
Driv
er8,
600
8,
600
14
,600
14
,600
Ana
lyst
(*fo
rmer
lyEc
onom
ist)
1900
019
000
4000
040
000
Ana
lyst
(fo
rmer
ly E
cono
mis
t)19
,000
19
,000
40
,000
40
,000
1420
014
200
4000
040
000
Educ
ator
(Sec
onda
ry)
(*fo
rmer
lyEd
ucat
ion
offic
er)
14,2
00
14,2
00
40,0
00
40,0
00
Educ
ator
(Sec
onda
ry) -
(*fo
rmer
ly E
duca
tion
offic
er)
j(
iil
ii
)(*
fl
i/
ii
Proj
ect m
anag
er (C
ivil
engi
neer
ing)
- (*
form
erly
Eng
inee
r/Sen
ior e
ngin
eer,
2200
022
000
4500
045
000
jg
(g
g)(
yg
g,
iil)
22,0
00
22,0
00
45,0
00
45,0
00
civi
l) )
1720
017
200
2640
026
400
Fina
ncia
lOpe
ratio
nsO
ffic
er(*
form
erly
Fina
nce
offic
er)
17,2
00
17,2
00
26,4
00
26,4
00
Fina
ncia
l Ope
ratio
ns O
ffic
er (
form
erly
Fin
ance
off
icer
)
Fitte
r8,
800
8,80
015
,000
15,0
00e
,,
,,
- 1334
642
56
425
1020
010
200
Gen
eral
wor
ker(
*for
mer
lyG
ener
alfie
ldan
dof
fice/
prem
ises
wor
ker)
4
6,42
5
6,42
5
10,2
00
10,2
00
Gen
eral
wor
ker (
*for
mer
ly G
ener
al fi
eld
and
offic
e/pr
emis
es w
orke
r)
-
Ll
d7
200
720
010
950
1095
0Lo
rry
load
er7,
200
7,
200
10
,950
10
,950
y
,,
,,
880
08
800
100
01
000
Mas
on8,
800
8,
800
15
,000
15
,000
,
,,
,M
echa
nics
8,80
08,
800
15,0
0015
,000
Mec
hani
cs8,
800
8,
800
15
,000
15
,000
Med
ical
and
heal
thof
ficer
/Sen
iorM
&H
O30
000
3000
050
000
5000
0M
edic
al a
nd h
ealth
off
icer
/Sen
ior M
&H
O30
,000
30
,000
50
,000
50
,000
di
llb
hi
iM
edic
alla
bora
tory
tech
nici
an14
,200
14,2
0029
,000
29,0
00M
edic
al la
bora
tory
tech
nici
an14
,200
14
,200
29
,000
29
,000
N
ursi
ngof
ficer
1200
012
000
2480
024
800
Nur
sing
off
icer
12,0
00
12,0
00
24,8
00
24,8
00
Pli
tbl
1045
010
450
2260
022
600
Polic
e co
nsta
ble
10,4
50
10,4
50
22,6
00
22,6
00
Mac
hine
min
der(
Pres
sroo
m)
9,20
09,
200
20,8
0020
,800
Mac
hine
min
der (
Pres
sroo
m)
9,20
0
9,20
0
20,8
00
20,8
00
Teac
her/S
enio
rTea
cher
(Prim
ar)
1120
011
200
2320
023
200
Teac
her/S
enio
r Tea
cher
(Prim
ary)
11,2
00
11,2
00
23,2
00
23,2
00
Soci
alse
curit
yof
ficer
1020
010
200
2200
022
000
Soci
al se
curit
y of
ficer
10,2
00
10,2
00
22,0
00
22,0
00
Wd
it
940
09
400
1900
019
000
Wor
d pr
oces
sing
ope
rato
r9,
400
9,
400
19
,000
19
,000
p
gp
Tech
nica
loff
icer
(Agr
icul
ture
)14
,200
14,2
0029
,000
29,0
00Te
chni
cal o
ffic
er (A
gric
ultu
re)
14,2
00
14,2
00
29,0
00
29,0
00
Tl
ht
840
08
400
1600
016
000
Tele
phon
e op
erat
or8,
400
8,
400
16
,000
16
,000
p
p,
,,
,
*Res
tyle
dPR
B20
08R
esty
led
PRB
200
8
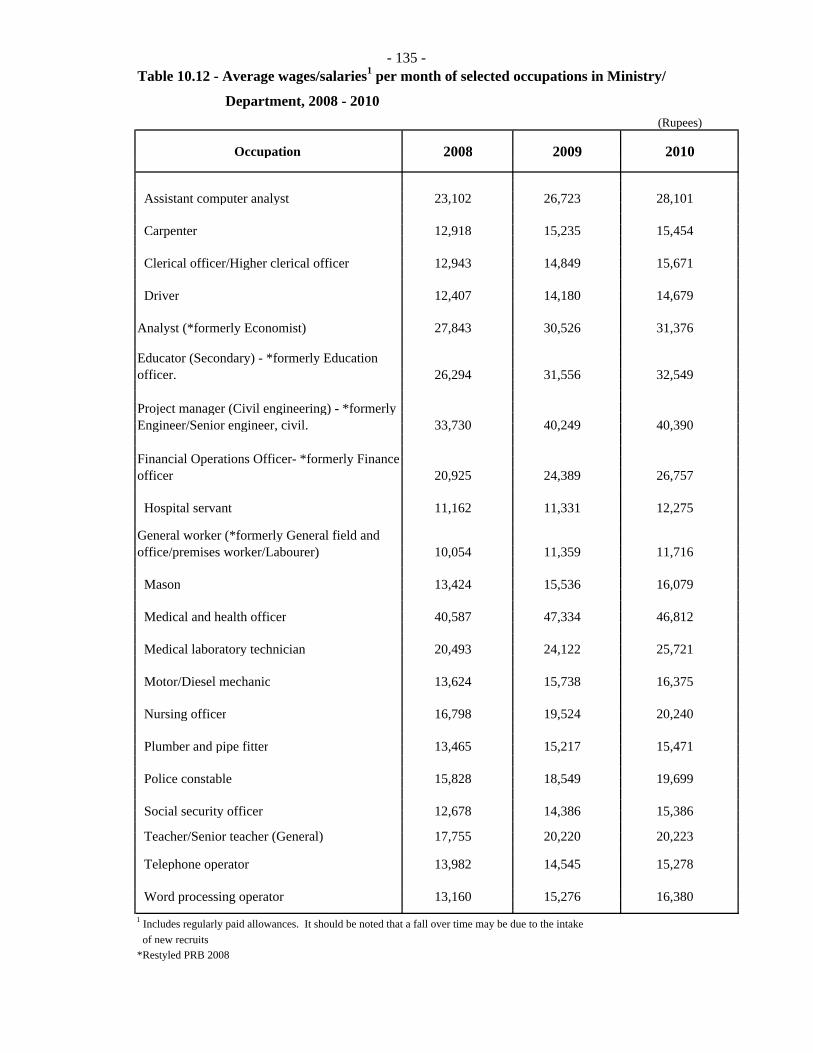
135- 135 -1Table 10.12 - Average wages/salaries1 per month of selected occupations in Ministry/Table 10.12 Average wages/salaries per month of selected occupations in Ministry/
Department 2008 - 2010 Department, 2008 - 2010(Rupees)(Rupees)
O i 2008 2009 2010Occupation 2008 2009 2010p
Assistant computer analyst 23,102 26,723 28,101 Assistant computer analyst 23,102 26,723 28,101
Carpenter 12,918 15,235 15,454 p , , ,
Clerical officer/Higher clerical officer 12,943 14,849 15,671 g , , ,
i 12 40 14 180 14 6 9 Driver 12,407 14,180 14,679 , , ,
A l (*f l E i ) 27 843 30 526 31 376Analyst (*formerly Economist) 27,843 30,526 31,376 y ( y )
Educator (Secondary) *formerly EducationEducator (Secondary) - *formerly Education 26,294 31,556 32,549 officer. , , ,
Project manager (Civil engineering) - *formerly33 730 40 249 40 390
Project manager (Civil engineering) formerly Engineer/Senior engineer civil 33,730 40,249 40,390 Engineer/Senior engineer, civil.
Fi i l O ti Offi *f l FiFinancial Operations Officer- *formerly Finance 20,925 24,389 26,757officer 20,925 24,389 26,757 officer
Hospital servant 11,162 11,331 12,275 Hospital servant 11,162 11,331 12,275
General worker (*formerly General field andGeneral worker (*formerly General field and 10,054 11,359 11,716office/premises worker/Labourer) 10,054 11,359 11,716 office/premises worker/Labourer)
Mason 13,424 15,536 16,079 , , ,
Medical and health officer 40,587 47,334 46,812 , , ,
M di l l b h i i 20 493 24 122 25 721 Medical laboratory technician 20,493 24,122 25,721 y
M t /Di l h i 13 624 15 738 16 375 Motor/Diesel mechanic 13,624 15,738 16,375
N i ffi 16 798 19 524 20 240 Nursing officer 16,798 19,524 20,240
Pl b d i fitt 13 465 15 217 15 471 Plumber and pipe fitter 13,465 15,217 15,471
Police constable 15 828 18 549 19 699 Police constable 15,828 18,549 19,699
Social security officer 12 678 14 386 15 386 Social security officer 12,678 14,386 15,386
T h /S i t h (G l) 17 755 20 220 20 223 Teacher/Senior teacher (General) 17,755 20,220 20,223
Telephone operator 13 982 14 545 15 278 Telephone operator 13,982 14,545 15,278
Word processing operator 13 160 15 276 16 380 Word processing operator 13,160 15,276 16,380 1 I l d l l id ll It h ld b t d th t f ll ti b d t th i t k1 Includes regularly paid allowances. It should be noted that a fall over time may be due to the intake of new recruitso ew ec u s*Restyled PRB 2008*Restyled PRB 2008
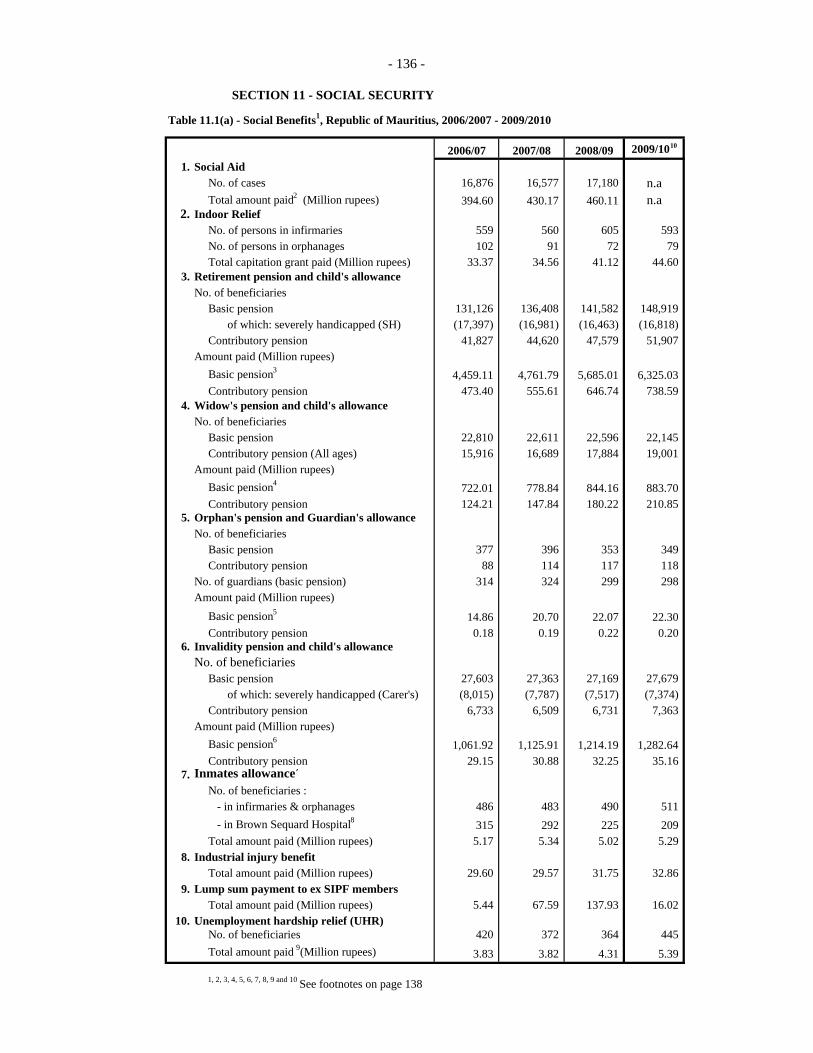
- 136 -
SECTION 11 - SOCIAL SECURITY
Table 11.1(a) - Social Benefits1, Republic of Mauritius, 2006/2007 - 2009/2010
2006/07 2007/08 2008/09 2009/1010
1. Social AidNo. of cases 16,876 16,577 17,180 n.aTotal amount paid2 (Million rupees) 394.60 430.17 460.11 n.a
2. Indoor ReliefNo. of persons in infirmaries 559 560 605 593 No. of persons in orphanages 102 91 72 79 Total capitation grant paid (Million rupees) 33.37 34.56 41.12 44.60
3. Retirement pension and child's allowanceNo. of beneficiaries
Basic pension 131,126 136,408 141,582 148,919 of which: severely handicapped (SH) (17,397) (16,981) (16,463) (16,818)
Contributory pension 41,827 44,620 47,579 51,907 Amount paid (Million rupees)
Basic pension3 4,459.11 4,761.79 5,685.01 6,325.03 Contributory pension 473.40 555.61 646.74 738.59
4. Widow's pension and child's allowanceNo. of beneficiaries
Basic pension 22,810 22,611 22,596 22,145 Contributory pension (All ages) 15,916 16,689 17,884 19,001
Amount paid (Million rupees)Basic pension4 722.01 778.84 844.16 883.70 Contributory pension 124.21 147.84 180.22 210.85
5. Orphan's pension and Guardian's allowanceNo. of beneficiaries
Basic pension 377 396 353 349 Contributory pension 88 114 117 118
No. of guardians (basic pension) 314 324 299 298 Amount paid (Million rupees)
Basic pension5 14.86 20.70 22.07 22.30 Contributory pension 0.18 0.19 0.22 0.20
6. Invalidity pension and child's allowanceNo. of beneficiaries
Basic pension 27,603 27,363 27,169 27,679 of which: severely handicapped (Carer's) (8,015) (7,787) (7,517) (7,374)
Contributory pension 6,733 6,509 6,731 7,363 Amount paid (Million rupees)
Basic pension6 1,061.92 1,125.91 1,214.19 1,282.64 Contributory pension 29.15 30.88 32.25 35.16
7. Inmates allowance7
No. of beneficiaries : - in infirmaries & orphanages 486 483 490 511 - in Brown Sequard Hospital8 315 292 225 209 Total amount paid (Million rupees) 5.17 5.34 5.02 5.29
8. Industrial injury benefitTotal amount paid (Million rupees) 29.60 29.57 31.75 32.86
9. Lump sum payment to ex SIPF membersTotal amount paid (Million rupees) 5.44 67.59 137.93 16.02
10. Unemployment hardship relief (UHR)No. of beneficiaries 420 372 364 445 Total amount paid 9(Million rupees) 3.83 3.82 4.31 5.39
1, 2, 3, 4, 5, 6, 7, 8, 9 and 10 See footnotes on page 138
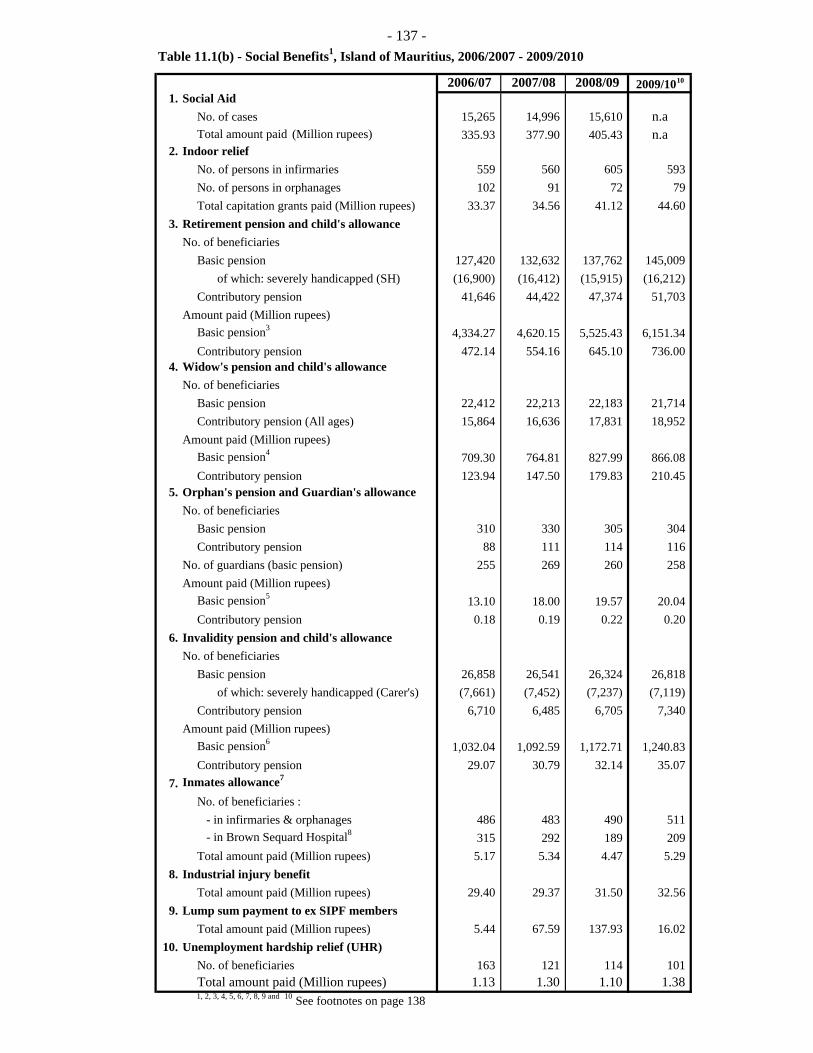
- 137 -Table 11.1(b) - Social Benefits1, Island of Mauritius, 2006/2007 - 2009/2010
2006/07 2007/08 2008/09 2009/1010
1. Social AidNo. of cases 15,265 14,996 15,610 n.aTotal amount paid (Million rupees) 335.93 377.90 405.43 n.a
2. Indoor reliefNo. of persons in infirmaries 559 560 605 593 No. of persons in orphanages 102 91 72 79 Total capitation grants paid (Million rupees) 33.37 34.56 41.12 44.60
3. Retirement pension and child's allowanceNo. of beneficiaries
Basic pension 127,420 132,632 137,762 145,009 of which: severely handicapped (SH) (16,900) (16,412) (15,915) (16,212)
Contributory pension 41,646 44,422 47,374 51,703 Amount paid (Million rupees)
Basic pension3 4,334.27 4,620.15 5,525.43 6,151.34 Contributory pension 472.14 554.16 645.10 736.00
4. Widow's pension and child's allowanceNo. of beneficiaries
Basic pension 22,412 22,213 22,183 21,714 Contributory pension (All ages) 15,864 16,636 17,831 18,952
Amount paid (Million rupees)Basic pension4 709.30 764.81 827.99 866.08 Contributory pension 123.94 147.50 179.83 210.45
5. Orphan's pension and Guardian's allowanceNo. of beneficiaries
Basic pension 310 330 305 304 Contributory pension 88 111 114 116
No. of guardians (basic pension) 255 269 260 258 Amount paid (Million rupees)
Basic pension5 13.10 18.00 19.57 20.04 Contributory pension 0.18 0.19 0.22 0.20
6. Invalidity pension and child's allowanceNo. of beneficiaries
Basic pension 26,858 26,541 26,324 26,818 of which: severely handicapped (Carer's) (7,661) (7,452) (7,237) (7,119)
Contributory pension 6,710 6,485 6,705 7,340 Amount paid (Million rupees)
Basic pension6 1,032.04 1,092.59 1,172.71 1,240.83 Contributory pension 29.07 30.79 32.14 35.07
7. Inmates allowance7
No. of beneficiaries : - in infirmaries & orphanages 486 483 490 511 - in Brown Sequard Hospital8 315 292 189 209 Total amount paid (Million rupees) 5.17 5.34 4.47 5.29
8. Industrial injury benefitTotal amount paid (Million rupees) 29.40 29.37 31.50 32.56
9. Lump sum payment to ex SIPF membersTotal amount paid (Million rupees) 5.44 67.59 137.93 16.02
10. Unemployment hardship relief (UHR)No. of beneficiaries 163 121 114 101 Total amount paid (Million rupees) 1.13 1.30 1.10 1.38 1, 2, 3, 4, 5, 6, 7, 8, 9 and 10 See footnotes on page 138
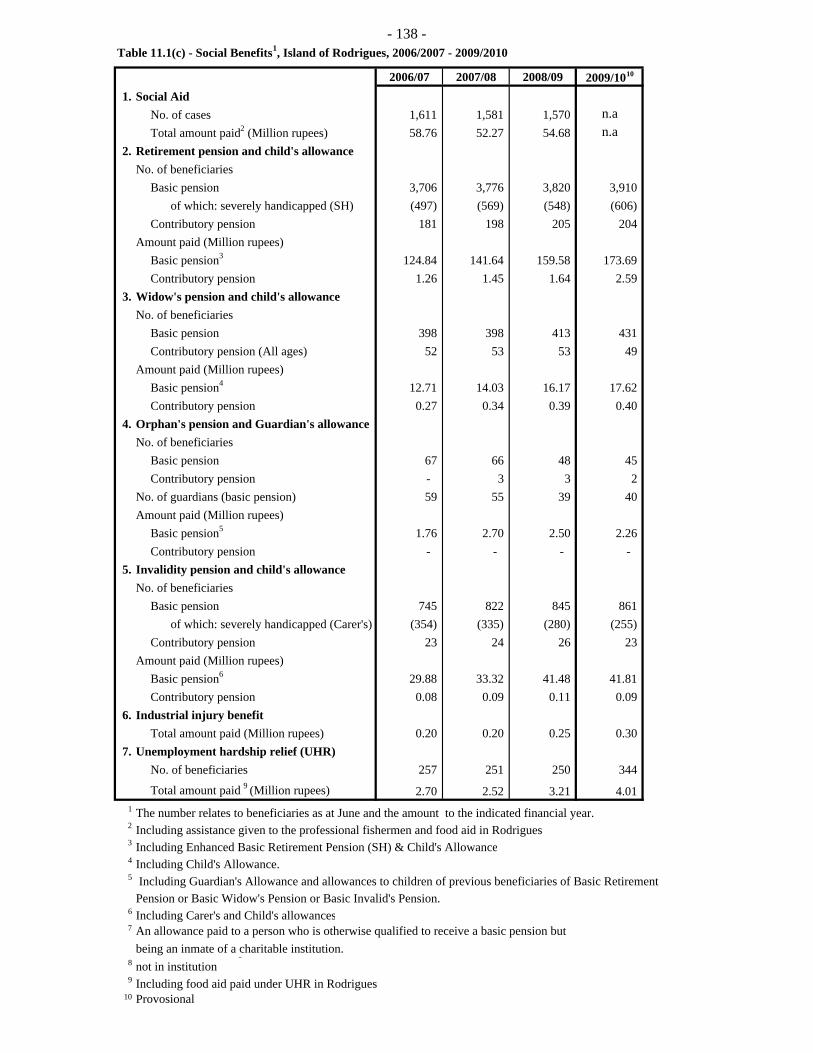
- 138 -Table 11.1(c) - Social Benefits1, Island of Rodrigues, 2006/2007 - 2009/2010
2006/07 2007/08 2008/09 2009/1010
1. Social AidNo. of cases 1,611 1,581 1,570 n.aTotal amount paid2 (Million rupees) 58.76 52.27 54.68 n.a
2. Retirement pension and child's allowanceNo. of beneficiaries
Basic pension 3,706 3,776 3,820 3,910 of which: severely handicapped (SH) (497) (569) (548) (606)
Contributory pension 181 198 205 204 Amount paid (Million rupees)
Basic pension3 124.84 141.64 159.58 173.69 Contributory pension 1.26 1.45 1.64 2.59
3. Widow's pension and child's allowanceNo. of beneficiaries
Basic pension 398 398 413 431 Contributory pension (All ages) 52 53 53 49
Amount paid (Million rupees)Basic pension4 12.71 14.03 16.17 17.62 Contributory pension 0.27 0.34 0.39 0.40
4. Orphan's pension and Guardian's allowanceNo. of beneficiaries
Basic pension 67 66 48 45 Contributory pension - 3 3 2
No. of guardians (basic pension) 59 55 39 40 Amount paid (Million rupees)
Basic pension5 1.76 2.70 2.50 2.26 Contributory pension - - - -
5. Invalidity pension and child's allowanceNo. of beneficiaries
Basic pension 745 822 845 861 of which: severely handicapped (Carer's) (354) (335) (280) (255)
Contributory pension 23 24 26 23 Amount paid (Million rupees)
Basic pension6 29.88 33.32 41.48 41.81 Contributory pension 0.08 0.09 0.11 0.09
6. Industrial injury benefitTotal amount paid (Million rupees) 0.20 0.20 0.25 0.30
7. Unemployment hardship relief (UHR)No. of beneficiaries 257 251 250 344
Total amount paid 9 (Million rupees) 2.70 2.52 3.21 4.01 1 The number relates to beneficiaries as at June and the amount to the indicated financial year. 2 Including assistance given to the professional fishermen and food aid in Rodrigues3 Including Enhanced Basic Retirement Pension (SH) & Child's Allowance4 Including Child's Allowance. 5 Including Guardian's Allowance and allowances to children of previous beneficiaries of Basic Retirement
Pension or Basic Widow's Pension or Basic Invalid's Pension.6 Including Carer's and Child's allowances7
being an inmate of a charitable institution.8
9 Including food aid paid under UHR in Rodrigues10 Provosional
An allowance paid to a person who is otherwise qualified to receive a basic pension but p
not in institution
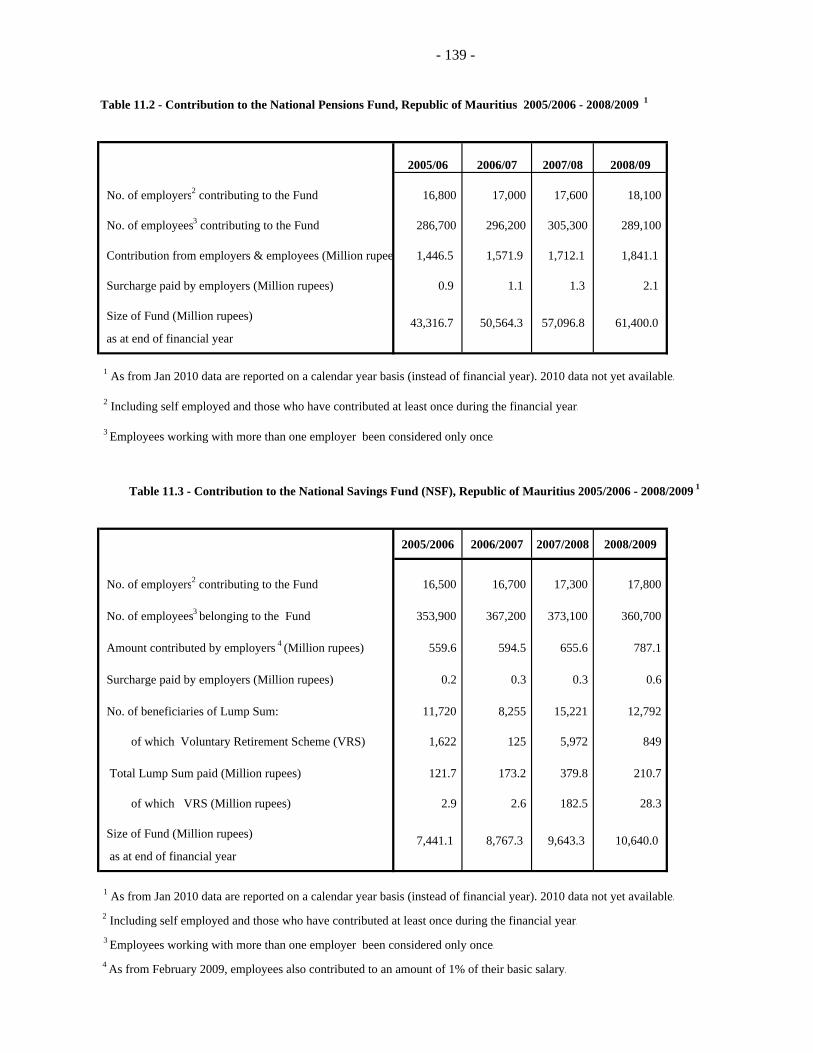
- 139 -
2005/06 2006/07 2007/08 2008/09
No. of employers2 contributing to the Fund 16,800 17,000 17,600 18,100
No. of employees3 contributing to the Fund 286,700 296,200 305,300 289,100
Contribution from employers & employees (Million rupee 1,446.5 1,571.9 1,712.1 1,841.1
Surcharge paid by employers (Million rupees) 0.9 1.1 1.3 2.1
Size of Fund (Million rupees)
as at end of financial year
1 As from Jan 2010 data are reported on a calendar year basis (instead of financial year). 2010 data not yet available.
2 Including self employed and those who have contributed at least once during the financial year.
3 Employees working with more than one employer been considered only once.
2005/2006 2006/2007 2007/2008 2008/2009
No. of employers2 contributing to the Fund 16,500 16,700 17,300 17,800
No. of employees3 belonging to the Fund 353,900 367,200 373,100 360,700
Amount contributed by employers 4 (Million rupees) 559.6 594.5 655.6 787.1
Surcharge paid by employers (Million rupees) 0.2 0.3 0.3 0.6
No. of beneficiaries of Lump Sum: 11,720 8,255 15,221 12,792
of which Voluntary Retirement Scheme (VRS) 1,622 125 5,972 849
Total Lump Sum paid (Million rupees) 121.7 173.2 379.8 210.7
of which VRS (Million rupees) 2.9 2.6 182.5 28.3
Size of Fund (Million rupees)
as at end of financial year
1 As from Jan 2010 data are reported on a calendar year basis (instead of financial year). 2010 data not yet available. 2 Including self employed and those who have contributed at least once during the financial year.
3 Employees working with more than one employer been considered only once. 4 As from February 2009, employees also contributed to an amount of 1% of their basic salary.
7,441.1 8,767.3 9,643.3 10,640.0
Table 11.2 - Contribution to the National Pensions Fund, Republic of Mauritius 2005/2006 - 2008/2009 1
43,316.7 50,564.3 57,096.8 61,400.0
Table 11.3 - Contribution to the National Savings Fund (NSF), Republic of Mauritius 2005/2006 - 2008/2009 1
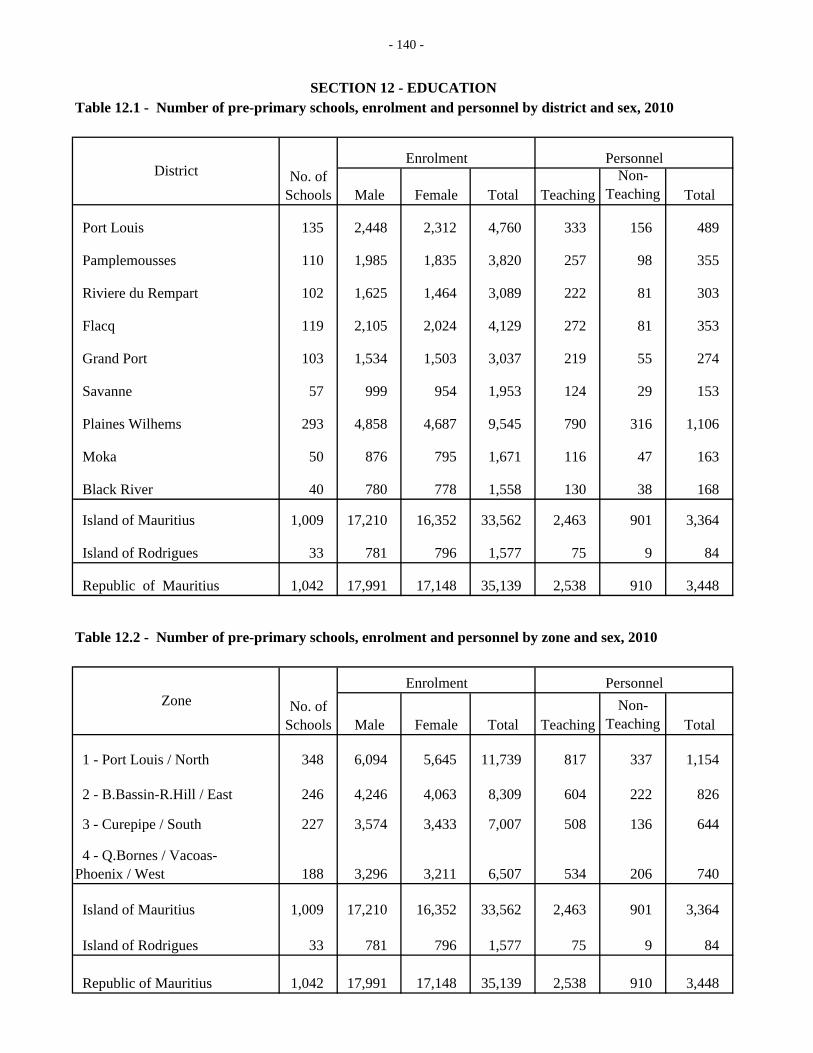
- 140 -
Table 12.1 - Number of pre-primary schools, enrolment and personnel by district and sex, 2010
Male Female Total TeachingNon-
Teaching Total
Port Louis 135 2,448 2,312 4,760 333 156 489
Pamplemousses 110 1,985 1,835 3,820 257 98 355
Riviere du Rempart 102 1,625 1,464 3,089 222 81 303
Flacq 119 2,105 2,024 4,129 272 81 353
Grand Port 103 1,534 1,503 3,037 219 55 274
Savanne 57 999 954 1,953 124 29 153
Plaines Wilhems 293 4,858 4,687 9,545 790 316 1,106
Moka 50 876 795 1,671 116 47 163
Black River 40 780 778 1,558 130 38 168
Island of Mauritius 1,009 17,210 16,352 33,562 2,463 901 3,364
Island of Rodrigues 33 781 796 1,577 75 9 84
Republic of Mauritius 1,042 17,991 17,148 35,139 2,538 910 3,448
Table 12.2 - Number of pre-primary schools, enrolment and personnel by zone and sex, 2010
Male Female Total TeachingNon-
Teaching Total
1 - Port Louis / North 348 6,094 5,645 11,739 817 337 1,154
246 4,246 4,063 8,309 604 222 826
3 - Curepipe / South 227 3,574 3,433 7,007 508 136 644
188 3,296 3,211 6,507 534 206 740
1,009 17,210 16,352 33,562 2,463 901 3,364
Island of Rodrigues 33 781 796 1,577 75 9 84
Republic of Mauritius 1,042 17,991 17,148 35,139 2,538 910 3,448
Island of Mauritius
No. of Schools
2 - B.Bassin-R.Hill / East
District
Zone
4 - Q.Bornes / Vacoas- Phoenix / West
SECTION 12 - EDUCATION
No. of Schools
Enrolment Personnel
Enrolment Personnel
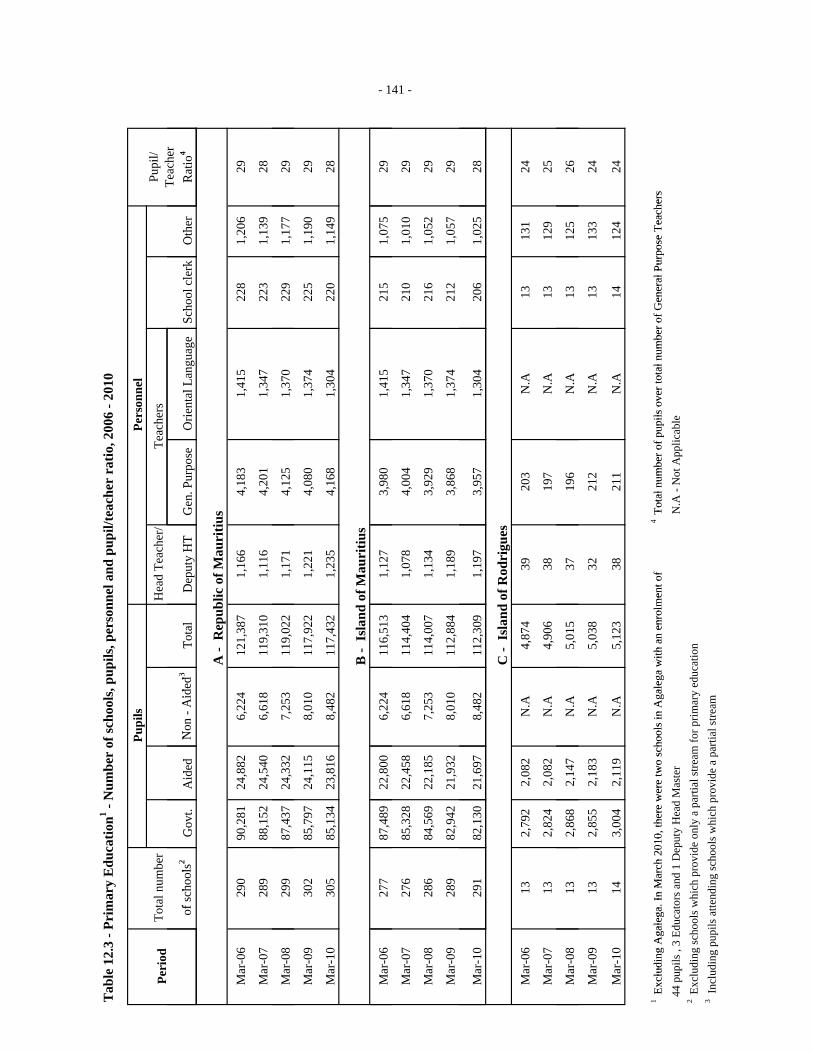
Tab
le 1
2.3
- Pri
mar
y E
duca
tion1 -
Num
ber
of sc
hool
s, pu
pils
, per
sonn
el a
nd p
upil/
teac
her
ratio
, 200
6 - 2
010
Pupi
lsPe
rson
nel
Tota
l num
ber
Hea
d Te
ache
r/Te
ache
rs
fh
l2
GA
idd
NA
idd3
Tl
DH
TG
PO
ilL
Sh
ll
kO
h
Peri
odPu
pil/
Teac
her
Ri
4of
scho
ols2
Gov
t.A
ided
N
on -
Aid
ed3
Tota
lD
eput
y H
TG
en. P
urpo
seO
rient
al L
angu
age
Scho
ol c
lerk
Oth
er
A -
Rep
ublic
of M
auri
tius
Mar
-06
290
90,2
8124
,882
6,22
412
1,38
71,
166
4,18
31,
415
228
1,20
629
Mar
-07
289
88,1
5224
,540
6,61
811
9,31
01,
116
4,20
11,
347
223
1,13
928
Rat
io4
Mar
-08
299
87,4
3724
,332
7,25
311
9,02
21,
171
4,12
51,
370
229
1,17
729
Mar
-09
302
85,7
9724
,115
8,01
011
7,92
21,
221
4,08
01,
374
225
1,19
029
Mar
-10
305
85,1
3423
,816
8,48
211
7,43
21,
235
4,16
81,
304
220
1,14
928
B -
Isla
nd o
f Mau
ritiu
s
- 1
Mar
-06
277
87,4
8922
,800
6,22
411
6,51
31,
127
3,98
01,
415
215
1,07
529
Mar
-07
276
85,3
2822
,458
6,61
811
4,40
41,
078
4,00
41,
347
210
1,01
029
Mar
-08
286
84,5
6922
,185
7,25
311
4,00
71,
134
3,92
91,
370
216
1,05
229
Mar
-09
289
82,9
4221
,932
8,01
011
2,88
41,
189
3,86
81,
374
212
1,05
729
- 141 -
Mar
-10
291
82,1
3021
,697
8,48
211
2,30
91,
197
3,95
71,
304
206
1,02
528
C -
Isla
nd o
f Rod
rigu
esM
ar-0
613
2,79
22,
082
N.A
4,87
439
203
N.A
1313
124
Mar
-07
132,
824
2,08
2N
.A4,
906
3819
7N
.A13
129
25
Mar
-08
132,
868
2,14
7N
.A5,
015
3719
6N
.A13
125
26
Mar
-09
132,
855
2,18
3N
.A5,
038
3221
2N
.A13
133
24
Mar
-10
143,
004
2,11
9N
.A5,
123
3821
1N
.A14
124
24
1 Ex
clud
ing
Aga
lega
InM
arch
2010
ther
ew
ere
two
scho
olsi
nA
gale
gaw
ithan
enro
lmen
tof
4 To
taln
umbe
rofp
upils
over
tota
lnum
bero
fGen
eral
Purp
ose
Teac
hers
Exc
ludi
ng A
gale
ga. I
n M
arch
201
0, th
ere
wer
e tw
o sc
hool
s in
Aga
lega
with
an
enro
lmen
t of
To
tal n
umbe
r of p
upils
ove
r tot
al n
umbe
r of G
ener
al P
urpo
se T
each
ers
44
pupi
ls ,
3 Ed
ucat
ors a
nd 1
Dep
uty
Hea
d M
aste
r
N.A
- N
ot A
pplic
able
2 E
xclu
ding
scho
ols w
hich
pro
vide
onl
y a
parti
al st
ream
for p
rimar
y ed
ucat
ion
3 Inc
ludi
ng p
upils
atte
ndin
g sc
hool
s whi
ch p
rovi
de a
par
tial s
tream
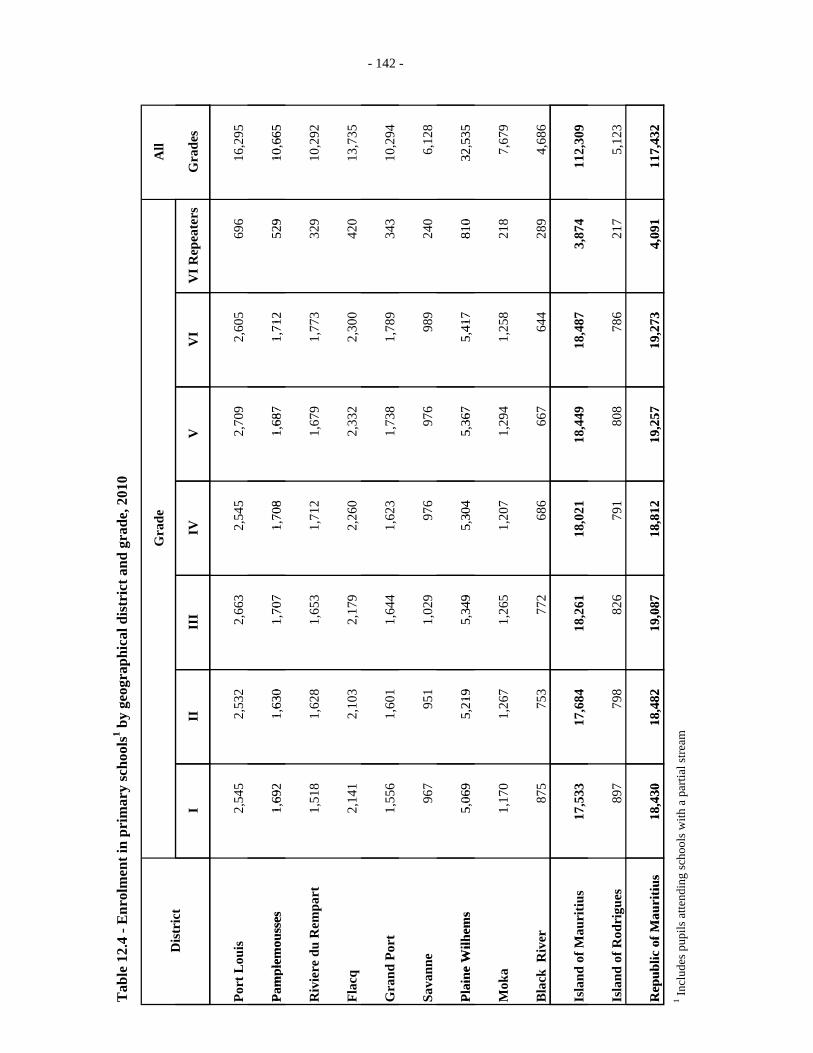
Tab
le 1
2.4
- Enr
olm
ent i
n pr
imar
y sc
hool
s1 by
geog
raph
ical
dis
tric
t and
gra
de, 2
010
Gra
deA
llD
istr
ict
III
III
IVV
VI
VI R
epea
ters
Gra
des
Port
Lou
is2,
545
2,53
2
2,
663
2,54
5
2,
709
2,60
5
69
6
16
,295
Pam
plem
ouss
es1
692
163
01
707
170
81
687
171
252
910
665
Pam
plem
ouss
es1,
692
1,63
0
1,
707
1,70
8
1,
687
1,71
2
52
9
10
,665
Riv
iere
du
Rem
part
1,51
8
1,
628
1,65
3
1,
712
1,67
9
1,
773
329
10,2
92
Flac
q2,
141
2,10
3
2,
179
2,26
0
2,
332
2,30
0
42
0
13
,735
- 142
Gra
nd P
ort
1,55
6
1,
601
1,64
4
1,
623
1,73
8
1,
789
343
10,2
94
Sava
nne
967
951
1,02
9
97
6
97
6
98
9
24
0
6,
128
Plai
neW
ilhem
s5
069
521
95
349
530
45
367
541
781
032
535
- 142 -
Plai
ne W
ilhem
s5,
069
5,21
9
5,
349
5,30
4
5,
367
5,41
7
81
0
32
,535
Mok
a1,
170
1,26
7
1,
265
1,20
7
1,
294
1,25
8
21
8
7,
679
Bla
ck R
iver
875
753
772
686
667
644
289
4,68
6
-
Isla
nd o
f Mau
ritiu
s17
,533
17,6
84
18
,261
18,0
21
18
,449
18,4
87
3,
874
112,
309
Isla
nd o
f Rod
rigu
es89
7
79
8
82
6
79
1
80
8
78
6
21
7
5,
123
Rep
ublic
ofM
auri
tius
18,4
3018
,482
19,0
8718
,812
19,2
5719
,273
4,09
111
7,43
2R
epub
lic o
f Mau
ritiu
s18
,430
18,4
82
19
,087
18,8
12
19
,257
19,2
73
4,
091
117,
432
1 Incl
udes
pup
ils a
ttend
ing
scho
ols w
ith a
par
tial s
tream
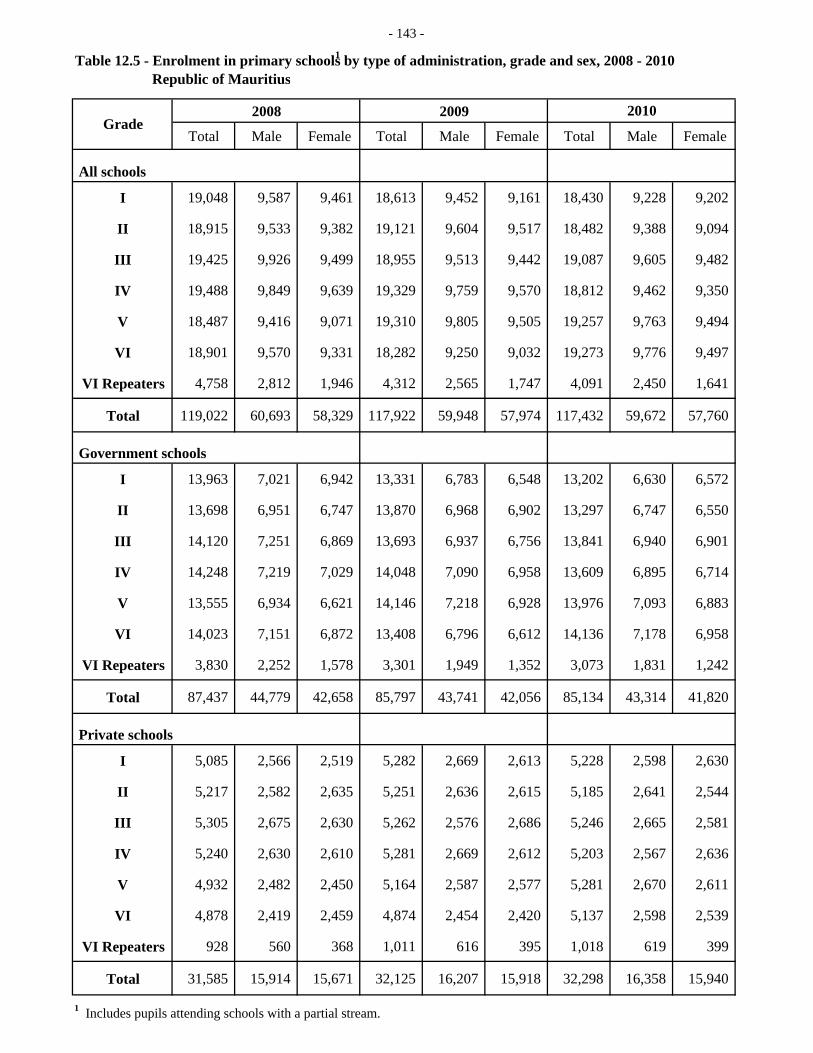
- 143 -
Table 12.5 - Enrolment in primary schools1 by type of administration, grade and sex, 2008 - 2010 Republic of Mauritius
2008 2009
Total Male Female Total Male Female Total Male Female
All schools
I 19,048 9,587 9,461 18,613 9,452 9,161 18,430 9,228 9,202
II 18,915 9,533 9,382 19,121 9,604 9,517 18,482 9,388 9,094
III 19,425 9,926 9,499 18,955 9,513 9,442 19,087 9,605 9,482
IV 19,488 9,849 9,639 19,329 9,759 9,570 18,812 9,462 9,350
V 18,487 9,416 9,071 19,310 9,805 9,505 19,257 9,763 9,494
VI 18,901 9,570 9,331 18,282 9,250 9,032 19,273 9,776 9,497
VI Repeaters 4,758 2,812 1,946 4,312 2,565 1,747 4,091 2,450 1,641
Total 119,022 60,693 58,329 117,922 59,948 57,974 117,432 59,672 57,760
Government schools
I 13,963 7,021 6,942 13,331 6,783 6,548 13,202 6,630 6,572
II 13,698 6,951 6,747 13,870 6,968 6,902 13,297 6,747 6,550
III 14,120 7,251 6,869 13,693 6,937 6,756 13,841 6,940 6,901
IV 14,248 7,219 7,029 14,048 7,090 6,958 13,609 6,895 6,714
V 13,555 6,934 6,621 14,146 7,218 6,928 13,976 7,093 6,883
VI 14,023 7,151 6,872 13,408 6,796 6,612 14,136 7,178 6,958
VI Repeaters 3,830 2,252 1,578 3,301 1,949 1,352 3,073 1,831 1,242
Total 87,437 44,779 42,658 85,797 43,741 42,056 85,134 43,314 41,820
Private schools
I 5,085 2,566 2,519 5,282 2,669 2,613 5,228 2,598 2,630
II 5,217 2,582 2,635 5,251 2,636 2,615 5,185 2,641 2,544
III 5,305 2,675 2,630 5,262 2,576 2,686 5,246 2,665 2,581
IV 5,240 2,630 2,610 5,281 2,669 2,612 5,203 2,567 2,636
V 4,932 2,482 2,450 5,164 2,587 2,577 5,281 2,670 2,611
VI 4,878 2,419 2,459 4,874 2,454 2,420 5,137 2,598 2,539
VI Repeaters 928 560 368 1,011 616 395 1,018 619 399
Total 31,585 15,914 15,671 32,125 16,207 15,918 32,298 16,358 15,940
1 Includes pupils attending schools with a partial stream.
Grade2010
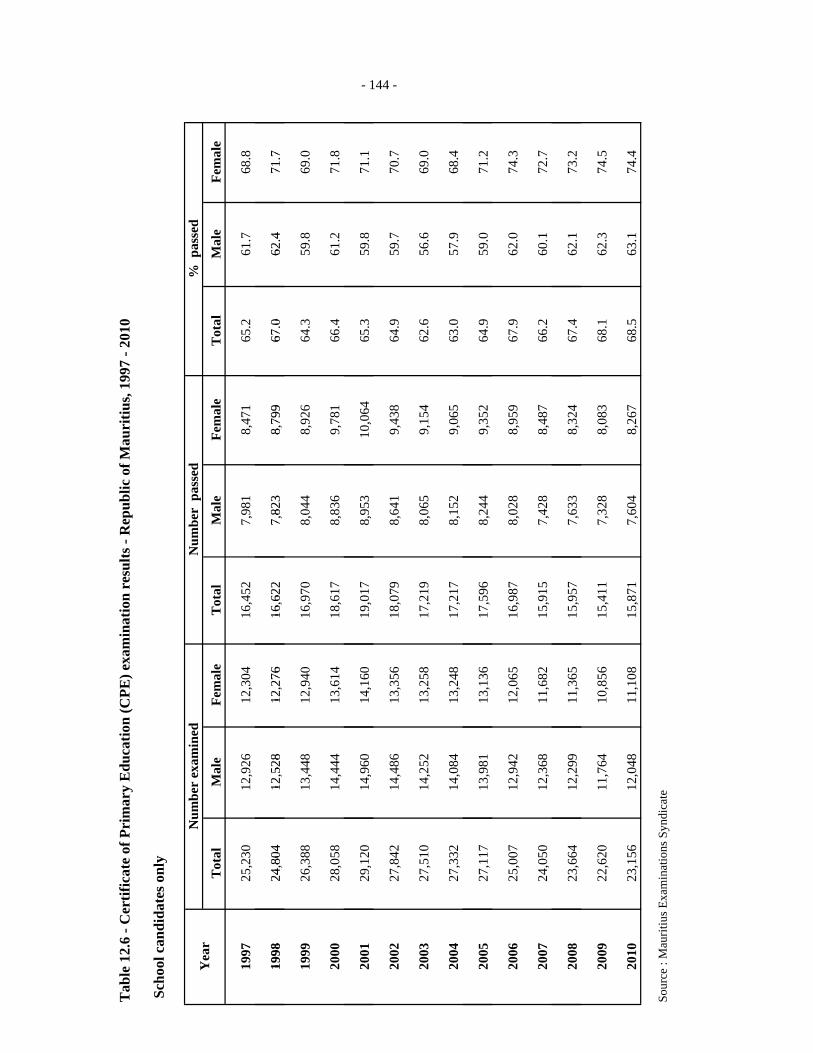
Tab
le 1
2.6
- Cer
tific
ate
of P
rim
ary
Edu
catio
n (C
PE) e
xam
inat
ion
resu
lts -
Rep
ublic
of M
auri
tius,
1997
- 20
10
Sch
ool c
andi
date
s onl
y
Num
ber
pas
sed
% p
asse
d
Tot
alM
ale
Fem
ale
Tot
alM
ale
Fem
ale
Tot
alM
ale
Fem
ale
1997
25,2
3012
,926
12,3
0416
,452
7,98
18,
471
65.2
61.7
68.8
1998
2480
412
528
1227
616
622
782
38
799
670
624
717
Num
ber
exam
ined
Yea
r
1998
24,8
0412
,528
12,2
7616
,622
7,82
38,
799
67.0
62.4
71.7
1999
26,3
8813
,448
12,9
4016
,970
8,04
48,
926
64.3
59.8
69.0
2000
28,0
5814
,444
13,6
1418
,617
8,83
69,
781
66.4
61.2
71.8
2001
29,1
2014
,960
14,1
6019
,017
8,95
310
,064
65.3
59.8
71.1
- 144 -
,,
,,
,,
2002
27,8
4214
,486
13,3
5618
,079
8,64
19,
438
64.9
59.7
70.7
2003
27,5
1014
,252
13,2
5817
,219
8,06
59,
154
62.6
56.6
69.0
2004
27,3
3214
,084
13,2
4817
,217
8,15
29,
065
63.0
57.9
68.4
- 144 -
2005
27,1
1713
,981
13,1
3617
,596
8,24
49,
352
64.9
59.0
71.2
2006
25,0
0712
,942
12,0
6516
,987
8,02
88,
959
67.9
62.0
74.3
2007
24,0
5012
,368
11,6
8215
,915
7,42
88,
487
66.2
60.1
72.7
2008
23,6
6412
,299
11,3
6515
,957
7,63
38,
324
67.4
62.1
73.2
2009
22,6
2011
,764
10,8
5615
,411
7,32
88,
083
68.1
62.3
74.5
2010
23,1
5612
,048
11,1
0815
,871
7,60
48,
267
68.5
63.1
74.4
Sour
ce :
Mau
ritiu
s Exa
min
atio
ns S
yndi
cate
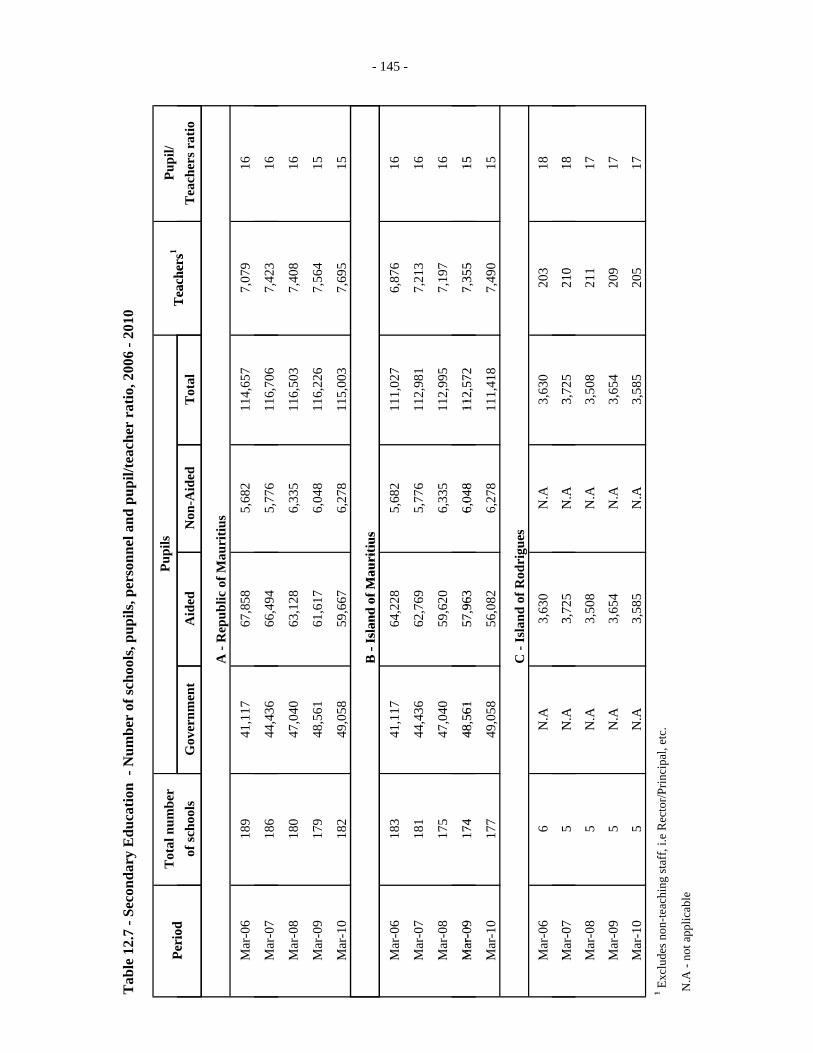
Tab
le 1
2.7
- Sec
onda
ry E
duca
tion
- N
umbe
r of
scho
ols,
pupi
ls, p
erso
nnel
and
pup
il/te
ache
r ra
tio, 2
006
- 201
0
Tot
al n
umbe
rPu
pil/
Peri
odT
each
ers1
Pupi
ls
of sc
hool
sG
over
nmen
tA
ided
Non
-Aid
edT
otal
Tea
cher
s rat
io
A -
Rep
ublic
of M
auri
tius
Mar
-06
189
41,1
1767
,858
5,68
211
4,65
77,
079
16
Mar
-07
186
44,4
3666
,494
5,77
611
6,70
67,
423
16
Peri
odT
each
ers
,,
,,
,
Mar
-08
180
47,0
4063
,128
6,33
511
6,50
37,
408
16
Mar
-09
179
48,5
6161
,617
6,04
811
6,22
67,
564
15
Mar
-10
182
49,0
5859
,667
6,27
811
5,00
37,
695
15
B-I
slan
dof
Mau
ritiu
s
-
B -
Isla
nd o
f Mau
ritiu
s
Mar
-06
183
41,1
1764
,228
5,68
211
1,02
76,
876
16
Mar
-07
181
44,4
3662
,769
5,77
611
2,98
17,
213
16
Mar
-08
175
47,0
4059
,620
6,33
511
2,99
57,
197
16
Mar
-09
174
4856
157
963
604
811
257
27
355
15
- 145 -
Mar
-09
174
48,5
6157
,963
6,04
811
2,57
27,
355
15
Mar
-10
177
49,0
5856
,082
6,27
811
1,41
87,
490
15
C -
Isla
nd o
f Rod
rigu
es
Mar
-06
6N
.A3,
630
N.A
3,63
020
318
M07
5N
A3
725
NA
372
521
018
Mar
-07
5N
.A3,
725
N.A
3,72
521
018
Mar
-08
5N
.A3,
508
N.A
3,50
821
117
Mar
-09
5N
.A3,
654
N.A
3,65
420
917
Mar
-10
5N
.A3,
585
N.A
3,58
520
517
1E
ld
hiff
iR
/Pi
il
1 Exc
lude
s non
-teac
hing
staf
f, i.e
Rec
tor/P
rinci
pal,
etc.
N.A
- no
t app
licab
le
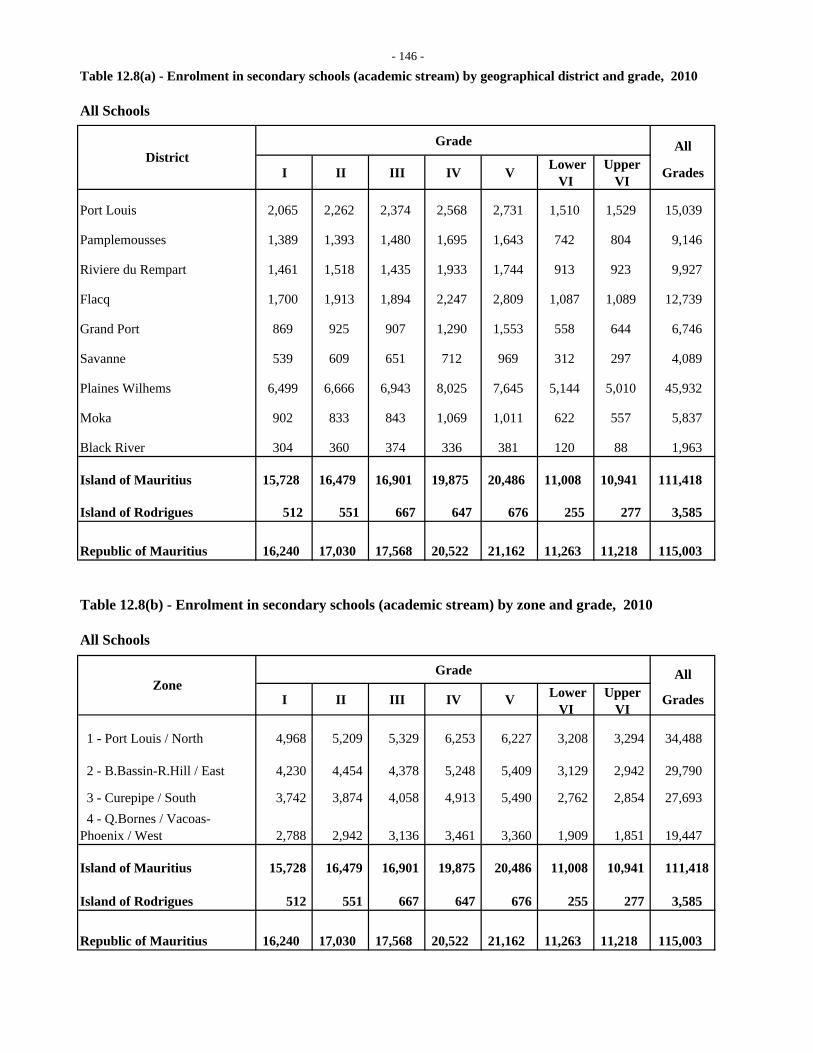
- 146 -
Table 12.8(a) - Enrolment in secondary schools (academic stream) by geographical district and grade, 2010
All Schools
Grade All
I II III IV V Lower VI
Upper VI Grades
Port Louis 2,065 2,262 2,374 2,568 2,731 1,510 1,529 15,039
Pamplemousses 1,389 1,393 1,480 1,695 1,643 742 804 9,146
Riviere du Rempart 1,461 1,518 1,435 1,933 1,744 913 923 9,927
Flacq 1,700 1,913 1,894 2,247 2,809 1,087 1,089 12,739
Grand Port 869 925 907 1,290 1,553 558 644 6,746
Savanne 539 609 651 712 969 312 297 4,089
Plaines Wilhems 6,499 6,666 6,943 8,025 7,645 5,144 5,010 45,932
Moka 902 833 843 1,069 1,011 622 557 5,837
Black River 304 360 374 336 381 120 88 1,963
Island of Mauritius 15,728 16,479 16,901 19,875 20,486 11,008 10,941 111,418
Island of Rodrigues 512 551 667 647 676 255 277 3,585
Republic of Mauritius 16,240 17,030 17,568 20,522 21,162 11,263 11,218 115,003
Table 12.8(b) - Enrolment in secondary schools (academic stream) by zone and grade, 2010
All Schools
Grade All
I II III IV V Lower VI
Upper VI
Grades
1 - Port Louis / North 4,968 5,209 5,329 6,253 6,227 3,208 3,294 34,488
4,230 4,454 4,378 5,248 5,409 3,129 2,942 29,790
3 - Curepipe / South 3,742 3,874 4,058 4,913 5,490 2,762 2,854 27,693
2,788 2,942 3,136 3,461 3,360 1,909 1,851 19,447
Island of Mauritius 15,728 16,479 16,901 19,875 20,486 11,008 10,941 111,418
Island of Rodrigues 512 551 667 647 676 255 277 3,585
16,240 17,030 17,568 20,522 21,162 11,263 11,218 115,003
4 - Q.Bornes / Vacoas-Phoenix / West
Republic of Mauritius
District
Zone
2 - B.Bassin-R.Hill / East
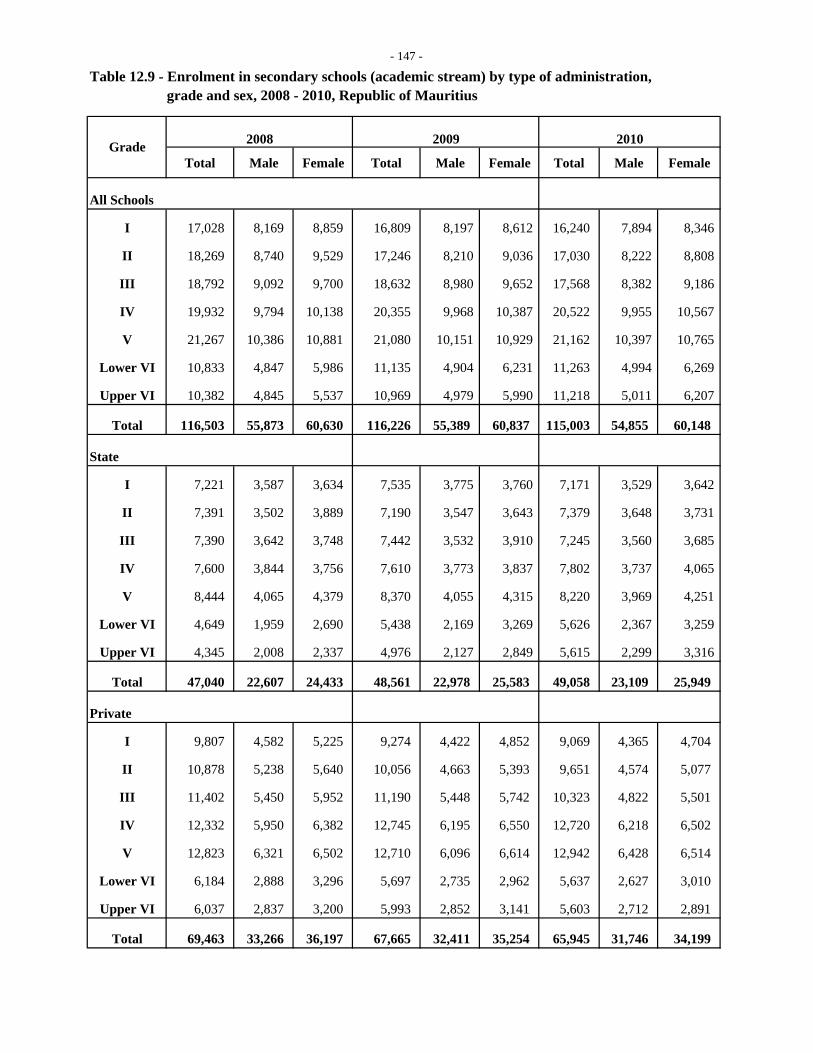
- 147 -
Table 12.9 - Enrolment in secondary schools (academic stream) by type of administration, grade and sex, 2008 - 2010, Republic of Mauritius
2008 2009 2010
Total Male Female Total Male Female Total Male Female
All Schools
I 17,028 8,169 8,859 16,809 8,197 8,612 16,240 7,894 8,346
II 18,269 8,740 9,529 17,246 8,210 9,036 17,030 8,222 8,808
III 18,792 9,092 9,700 18,632 8,980 9,652 17,568 8,382 9,186
IV 19,932 9,794 10,138 20,355 9,968 10,387 20,522 9,955 10,567
V 21,267 10,386 10,881 21,080 10,151 10,929 21,162 10,397 10,765
Lower VI 10,833 4,847 5,986 11,135 4,904 6,231 11,263 4,994 6,269
Upper VI 10,382 4,845 5,537 10,969 4,979 5,990 11,218 5,011 6,207
Total 116,503 55,873 60,630 116,226 55,389 60,837 115,003 54,855 60,148
State
I 7,221 3,587 3,634 7,535 3,775 3,760 7,171 3,529 3,642
II 7,391 3,502 3,889 7,190 3,547 3,643 7,379 3,648 3,731
III 7,390 3,642 3,748 7,442 3,532 3,910 7,245 3,560 3,685
IV 7,600 3,844 3,756 7,610 3,773 3,837 7,802 3,737 4,065
V 8,444 4,065 4,379 8,370 4,055 4,315 8,220 3,969 4,251
Lower VI 4,649 1,959 2,690 5,438 2,169 3,269 5,626 2,367 3,259
Upper VI 4,345 2,008 2,337 4,976 2,127 2,849 5,615 2,299 3,316
Total 47,040 22,607 24,433 48,561 22,978 25,583 49,058 23,109 25,949
Private
I 9,807 4,582 5,225 9,274 4,422 4,852 9,069 4,365 4,704
II 10,878 5,238 5,640 10,056 4,663 5,393 9,651 4,574 5,077
III 11,402 5,450 5,952 11,190 5,448 5,742 10,323 4,822 5,501
IV 12,332 5,950 6,382 12,745 6,195 6,550 12,720 6,218 6,502
V 12,823 6,321 6,502 12,710 6,096 6,614 12,942 6,428 6,514
Lower VI 6,184 2,888 3,296 5,697 2,735 2,962 5,637 2,627 3,010
Upper VI 6,037 2,837 3,200 5,993 2,852 3,141 5,603 2,712 2,891
Total 69,463 33,266 36,197 67,665 32,411 35,254 65,945 31,746 34,199
Grade
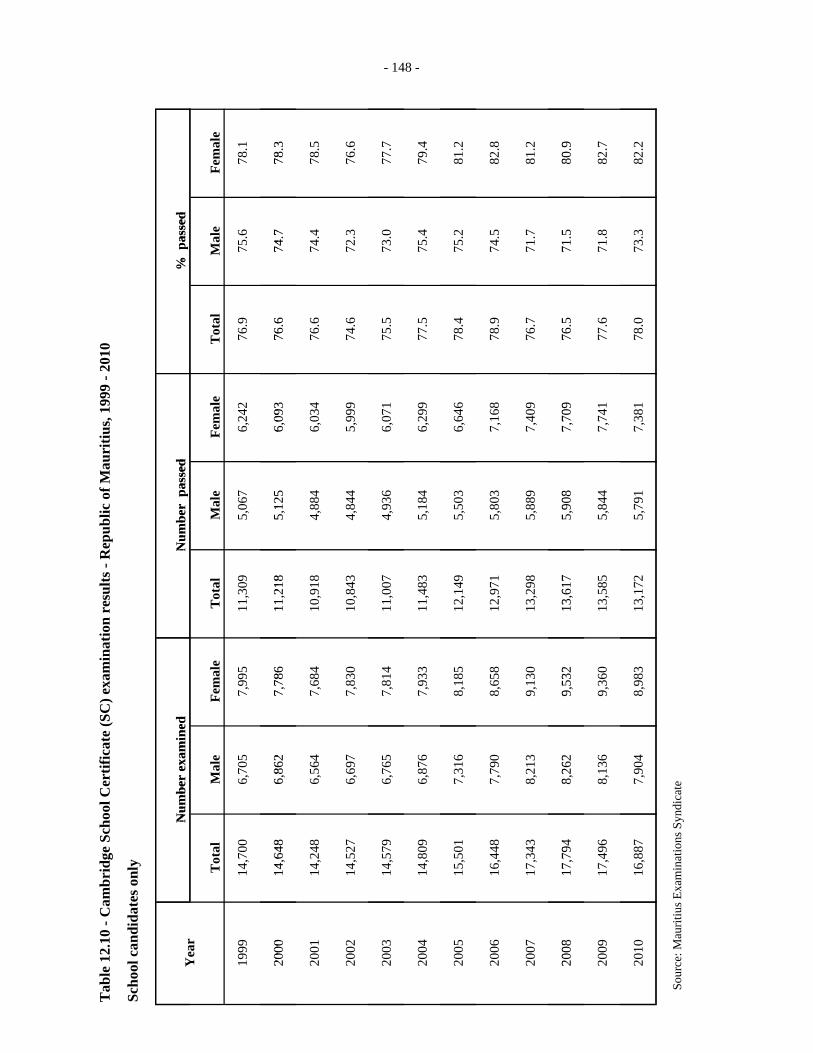
Tab
le 1
2.10
- C
ambr
idge
Sch
ool C
ertif
icat
e (S
C) e
xam
inat
ion
resu
lts -
Rep
ublic
of M
auri
tius,
1999
- 20
10
Scho
ol c
andi
date
s onl
y
Num
ber
pass
ed%
pass
edN
umbe
rex
amin
edN
umbe
r p
asse
d%
pas
sed
Tot
alM
ale
Fem
ale
Tot
alM
ale
Fem
ale
Tot
alM
ale
Fem
ale
1999
14,7
006,
705
7,99
511
,309
5,06
76,
242
76.9
75.6
78.1
2000
1464
86
862
778
611
218
512
56
093
766
747
783
Yea
rN
umbe
r ex
amin
ed
2000
14,6
486,
862
7,78
611
,218
5,12
56,
093
76.6
74.7
78.3
2001
14,2
486,
564
7,68
410
,918
4,88
46,
034
76.6
74.4
78.5
2002
14,5
276,
697
7,83
010
,843
4,84
45,
999
74.6
72.3
76.6
- 14
2003
14,5
796,
765
7,81
411
,007
4,93
66,
071
75.5
73.0
77.7
2004
14,8
096,
876
7,93
311
,483
5,18
46,
299
77.5
75.4
79.4
2005
15,5
017,
316
8,18
512
,149
5,50
36,
646
78.4
75.2
81.2
- 148 -
2006
16,4
487,
790
8,65
812
,971
5,80
37,
168
78.9
74.5
82.8
2007
17,3
438,
213
9,13
013
,298
5,88
97,
409
76.7
71.7
81.2
2008
1779
48
262
953
213
617
590
87
709
765
715
809
48 -
2008
17,7
948,
262
9,53
213
,617
5,90
87,
709
76.5
71.5
80.9
2009
17,4
968,
136
9,36
013
,585
5,84
47,
741
77.6
71.8
82.7
2010
16,8
877,
904
8,98
313
,172
5,79
17,
381
78.0
73.3
82.2
S
ourc
e: M
aurit
ius E
xam
inat
ions
Syn
dica
te
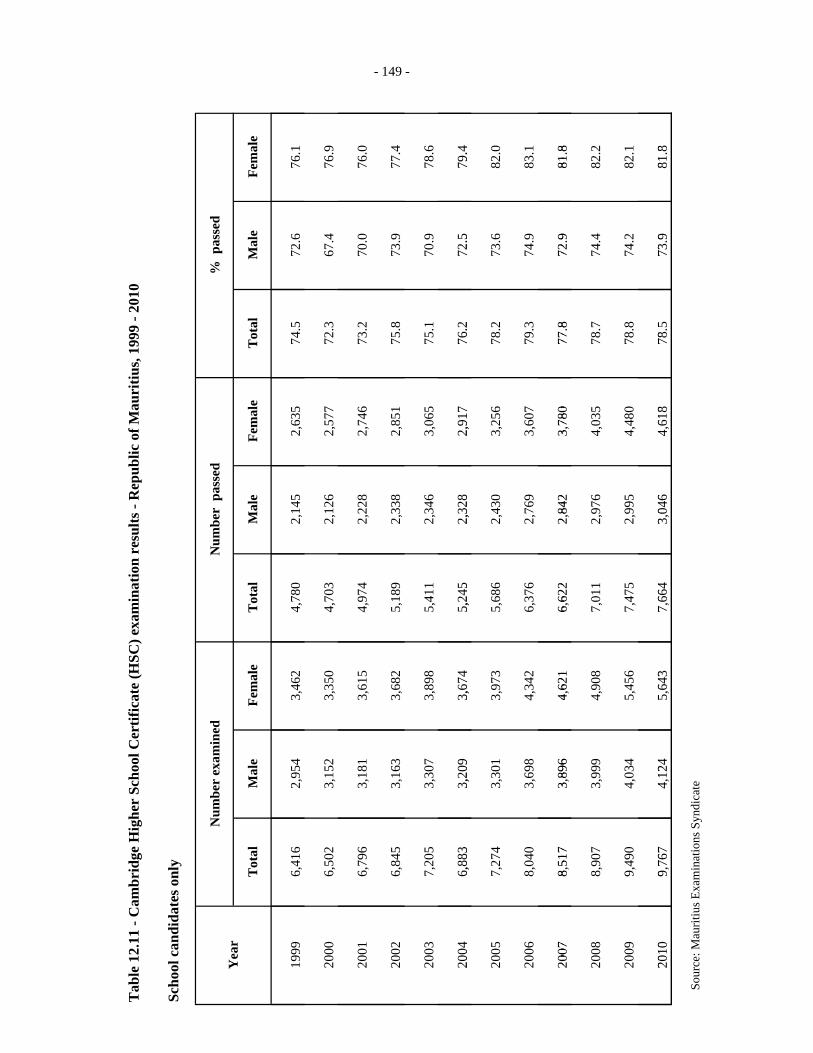
Tab
le 1
2.11
- C
ambr
idge
Hig
her
Scho
ol C
ertif
icat
e (H
SC) e
xam
inat
ion
resu
lts -
Rep
ublic
of M
auri
tius,
1999
- 20
10
Scho
ol c
andi
date
s onl
y
Num
ber
exam
ined
Num
ber
pas
sed
% p
asse
d
Tot
alM
ale
Fem
ale
Tot
alM
ale
Fem
ale
Tot
alM
ale
Fem
ale
Yea
r
1999
6,41
62,
954
3,46
24,
780
2,14
52,
635
74.5
72.6
76.1
2000
6,50
23,
152
3,35
04,
703
2,12
62,
577
72.3
67.4
76.9
2001
6,79
63,
181
3,61
54,
974
2,22
82,
746
73.2
70.0
76.0
- 149
2002
6,84
53,
163
3,68
25,
189
2,33
82,
851
75.8
73.9
77.4
2003
7,20
53,
307
3,89
85,
411
2,34
63,
065
75.1
70.9
78.6
2004
6,88
33,
209
3,67
45,
245
2,32
82,
917
76.2
72.5
79.4
- 149 -
2004
6,88
33,
209
3,67
45,
245
2,32
82,
917
76.2
72.5
79.4
2005
7,27
43,
301
3,97
35,
686
2,43
03,
256
78.2
73.6
82.0
2006
8,04
03,
698
4,34
26,
376
2,76
93,
607
79.3
74.9
83.1
2007
851
73
896
462
16
622
284
23
780
778
729
818
-
2007
8,51
73,
896
4,62
16,
622
2,84
23,
780
77.8
72.9
81.8
2008
8,90
73,
999
4,90
87,
011
2,97
64,
035
78.7
74.4
82.2
2009
9,49
04,
034
5,45
67,
475
2,99
54,
480
78.8
74.2
82.1
2010
976
74
124
564
37
664
304
64
618
785
739
818
2010
9,76
74,
124
5,64
37,
664
3,04
64,
618
78.5
73.9
81.8
S
ourc
e: M
aurit
ius E
xam
inat
ions
Syn
dica
te
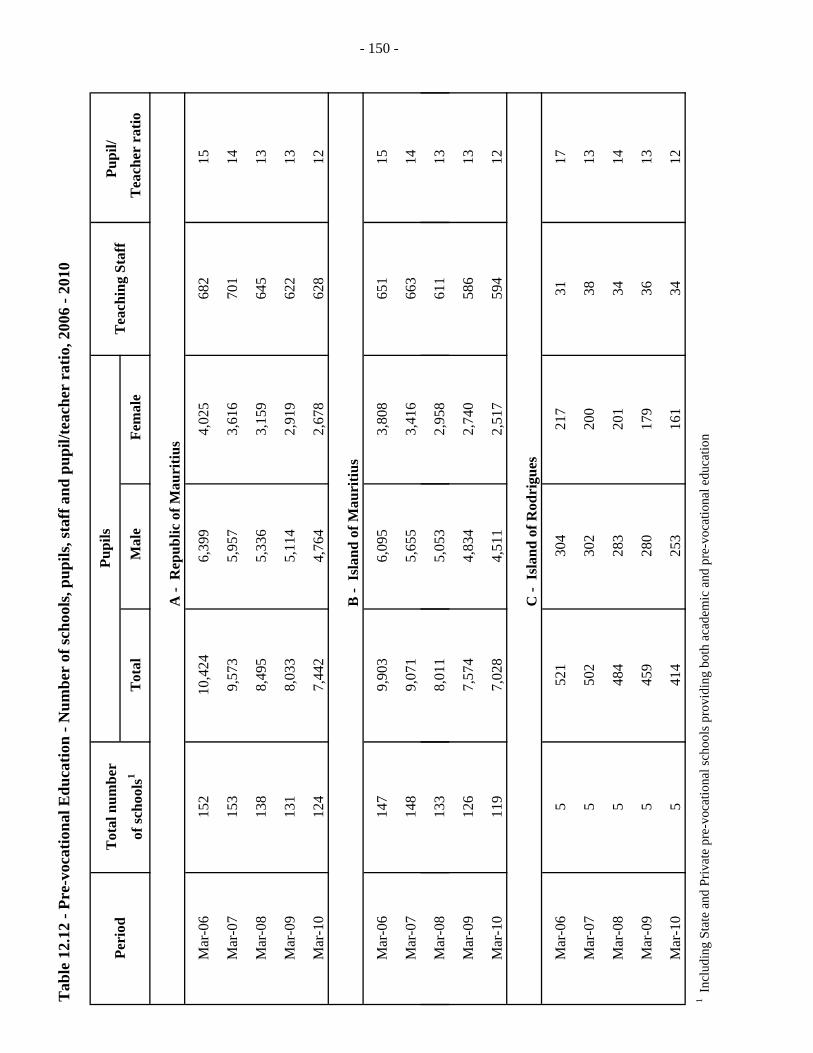
Tab
le 1
2.12
- Pr
e-vo
catio
nal E
duca
tion
- Num
ber
of sc
hool
s, pu
pils
, sta
ff a
nd p
upil/
teac
her
ratio
, 200
6 - 2
010
Tot
al n
umbe
rPu
pil/
of sc
hool
s1T
otal
Mal
e F
emal
e T
each
er r
atio
A
- R
epub
lic o
f Mau
ritiu
s
Mar
-06
152
10,4
246,
399
4,02
568
215
Mar
-07
153
9,57
35,
957
3,61
670
114
Mar
-08
138
8,49
55,
336
3,15
964
513
Mar
-09
131
8,03
35,
114
2,91
962
213
Mar
-10
124
7,44
24,
764
2,67
862
812
B -
Isla
nd o
f Mau
ritiu
s
Mar
-06
147
9,90
36,
095
3,80
865
115
Mar
-07
148
9,07
15,
655
3,41
666
314
Pupi
lsPe
riod
Tea
chin
g St
aff
- 150 -
Mar
-08
133
8,01
15,
053
2,95
861
113
Mar
-09
126
7,57
44,
834
2,74
058
613
Mar
-10
119
7,02
84,
511
2,51
759
412
C -
Isla
nd o
f Rod
rigu
es
Mar
-06
552
130
421
731
17
Mar
-07
550
230
220
038
13
Mar
-08
548
428
320
134
14
Mar
-09
545
928
017
936
13
Mar
-10
541
425
316
134
121
Incl
udin
g St
ate
and
Priv
ate
pre-
voca
tiona
l sch
ools
pro
vidi
ng b
oth
acad
emic
and
pre
-voc
atio
nal e
duca
tion
-

- 151 -
Table 12.13 - Enrolment in schools offering pre-vocational education by district, sex and year of study, 2010All Schools
Year of studyDistrict Total Male Female
I II III Total I II III Total I II III
Port Louis 425 371 297 1,093 281 203 160 644 144 168 137
Pamplemousses 293 230 219 742 189 145 143 477 104 85 76
Riviere du Rempart 219 262 218 699 148 184 158 490 71 78 60
Flacq 285 321 229 835 174 225 166 565 111 96 63
Grand Port 232 190 204 626 158 127 136 421 74 63 68
Savanne 177 188 114 479 111 120 85 316 66 68 29
Plaine Wilhems 653 648 555 1,856 420 443 346 1,209 233 205 209
Moka 109 147 104 360 65 74 59 198 44 73 45
Black River 156 106 76 338 101 55 35 191 55 51 41
Isl.of Mauritius 2,549 2,463 2,016 7,028 1,647 1,576 1,288 4,511 902 887 728
Isl.of Rodrigues 142 126 146 414 89 78 86 253 53 48 60
Rep. of Mauritius 2,691 2,589 2,162 7,442 1,736 1,654 1,374 4,764 955 935 788
Table 12.14 - Enrolment in schools offering pre-vocational education by zone, sex and year of study, 2010
All Schools
Year of studyTotal Male Female
I II III Total I II III Total I II III
1 - Port Louis / North 961 882 734 2577 618 532 461 1611 343 350 273
633 711 549 1893 414 489 362 1265 219 222 187
3 - Curepipe / South 573 507 463 1543 364 323 308 995 209 184 155
382 363 270 1015 251 232 157 640 131 131 113
Island of Mauritius 2549 2463 2016 7028 1647 1576 1288 4511 902 887 728
Island of Rodrigues 142 126 146 414 89 78 86 253 53 48 60
2,691 2,589 2,162 7,442 1,736 1,654 1,374 4,764 955 935 788
Zone
2 - B.Bassin-R.Hill / East
Republic of Mauritius
4 - Q Bornes / Vacoas-Phoenix / West
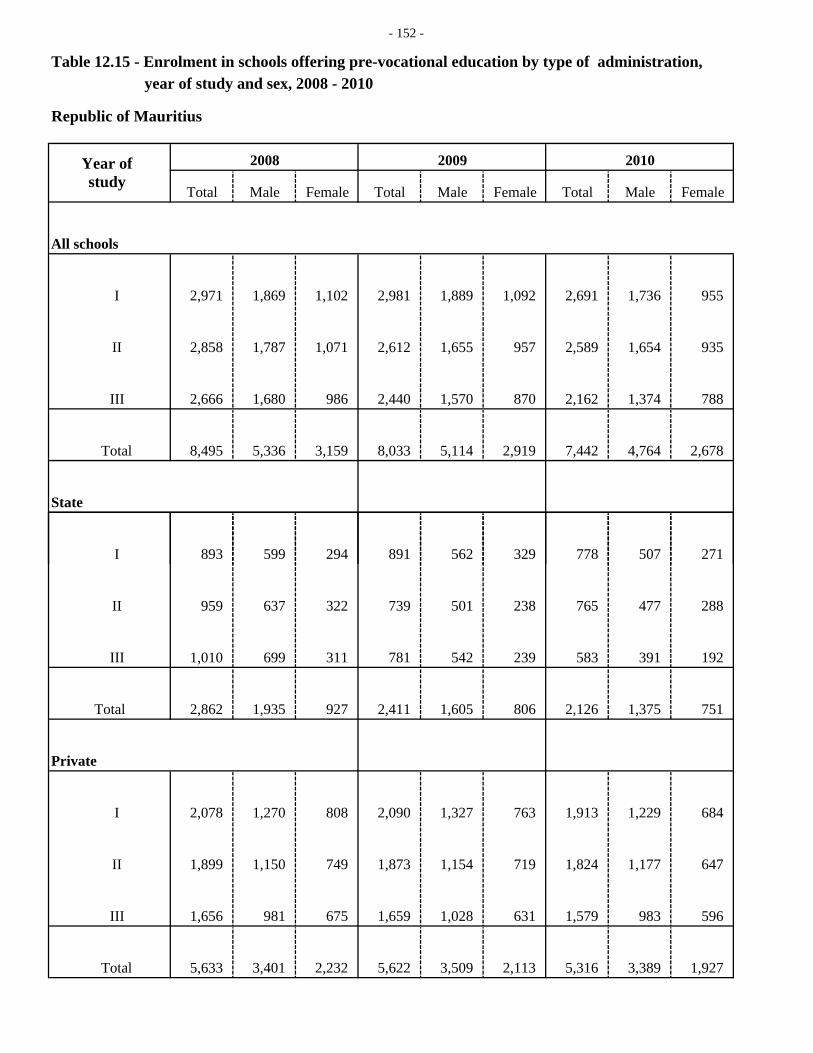
- 152 -
Table 12.15 - Enrolment in schools offering pre-vocational education by type of administration, year of study and sex, 2008 - 2010
Republic of Mauritius
2008 2009 2010
Total Male Female Total Male Female Total Male Female
All schools
I 2,971 1,869 1,102 2,981 1,889 1,092 2,691 1,736 955
II 2,858 1,787 1,071 2,612 1,655 957 2,589 1,654 935
III 2,666 1,680 986 2,440 1,570 870 2,162 1,374 788
Total 8,495 5,336 3,159 8,033 5,114 2,919 7,442 4,764 2,678
State
Year of study
Year of study
I 893 599 294 891 562 329 778 507 271
II 959 637 322 739 501 238 765 477 288
III 1,010 699 311 781 542 239 583 391 192
Total 2,862 1,935 927 2,411 1,605 806 2,126 1,375 751
Private
I 2,078 1,270 808 2,090 1,327 763 1,913 1,229 684
II 1,899 1,150 749 1,873 1,154 719 1,824 1,177 647
III 1,656 981 675 1,659 1,028 631 1,579 983 596
Total 5,633 3,401 2,232 5,622 3,509 2,113 5,316 3,389 1,927
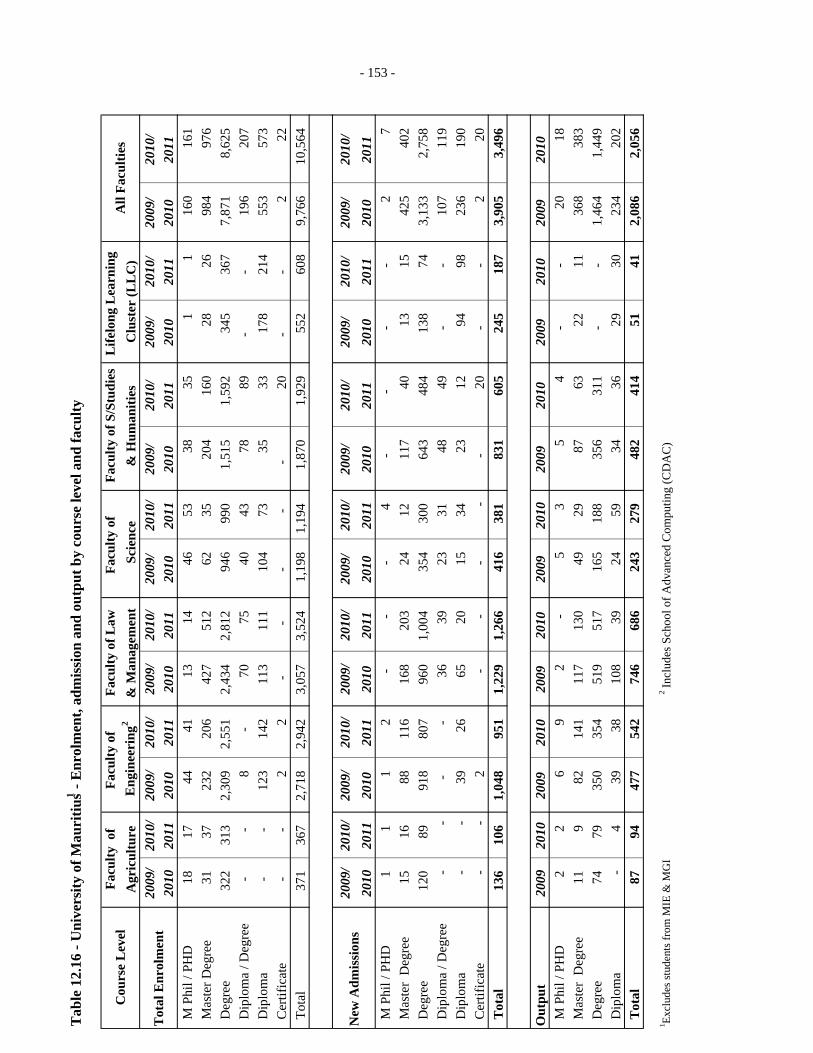
Tab
le 1
2.16
- U
nive
rsity
of M
auri
tius1 -
Enr
olm
ent,
adm
issi
on a
nd o
utpu
t by
cour
se le
vel a
nd fa
culty
Facu
lty o
fFa
culty
of
Facu
lty o
f Law
Fa
culty
of
Agr
icul
ture
Eng
inee
ring
2&
Man
agem
ent
2009
/20
10/
2009
/20
10/
2009
/20
10/
2009
/20
10/
2009
/20
10/
2009
/20
10/
2009
/20
10/
2010
2011
2010
2011
2010
2011
2010
2011
2010
2011
2010
2011
2010
2011
M P
hil /
PH
D18
17
44
41
13
14
46
53
38
35
1
1
16
0
161
M
aste
r Deg
ree
31
37
232
20
6
427
51
2
62
35
204
16
0
28
26
984
97
6
Deg
ree
322
31
3
2,30
9
2,55
1
2,43
4
2,81
2
946
99
0
1,51
5
1,59
2
345
36
7
7,87
1
8,62
5
Dip
lom
a / D
egre
e
-
-8
-
70
75
40
43
78
89
-
-
196
20
7
Dip
lom
a
-
-12
3
142
11
3
111
10
4
73
35
33
178
21
4
553
57
3
Cer
tific
ate
-
-
2
2
-
-
-
-
-20
-
-2
22
T
otal
371
36
7
2,71
8
2,94
2
3,05
7
3,52
4
1,19
8
1,19
4
1,87
0
1,92
9
552
60
8
9,76
6
10,5
64
2009
/20
10/
2009
/20
10/
2009
/20
10/
2009
/20
10/
2009
/20
10/
2009
/20
10/
2009
/20
10/
2010
2011
2010
2011
2010
2011
2010
2011
2010
2011
2010
2011
2010
2011
M P
hil /
PH
D1
1
1
2
-
-
-4
-
-
-
-2
7
M
aste
r D
egre
e15
16
88
11
6
168
20
3
24
12
117
40
13
15
42
5
402
D
egre
e12
0
89
918
80
7
960
1,
004
35
4
300
64
3
484
13
8
74
3,13
3
2,75
8
Dip
lom
a / D
egre
e
-
-
-
-36
39
23
31
48
49
-
-10
7
119
D
iplo
ma
-
-
39
26
65
20
15
34
23
12
94
98
236
19
0
Cer
tific
ate
-
-
2
-
-
-
-
-
20
-
-
2
20
Tot
al13
6
106
1,
048
95
1
1,22
9
1,26
6
416
38
1
831
60
5
245
18
7
3,90
5
3,49
6
Out
put
2009
2010
2009
2010
2009
2010
2009
2010
2009
2010
2009
2010
2009
2010
M P
hil /
PH
D2
2
6
9
2
-5
3
5
4
-
-20
18
M
aste
r D
egre
e11
9
82
14
1
117
13
0
49
29
87
63
22
11
368
38
3
Deg
ree
74
79
350
35
4
519
51
7
165
18
8
356
31
1
-
-
1,46
4
1,44
9
Dip
lom
a
-4
39
38
10
8
39
24
59
34
36
29
30
234
20
2
Tot
al87
94
47
7
542
74
6
686
24
3
279
48
2
414
51
41
2,
086
2,
056
1 Excl
udes
stud
ents
from
MIE
& M
GI
2 In
clud
es S
choo
l of A
dvan
ced
Com
putin
g (C
DA
C)
Tot
al E
nrol
men
t
New
Adm
issi
ons
Facu
lty o
f S/S
tudi
esC
ours
e L
evel
Life
long
Lea
rnin
g A
ll Fa
culti
es S
cien
ce&
Hum
aniti
esC
lust
er (L
LC
)
- 161 -- 178 -- 178 -- 178 -- 153 -
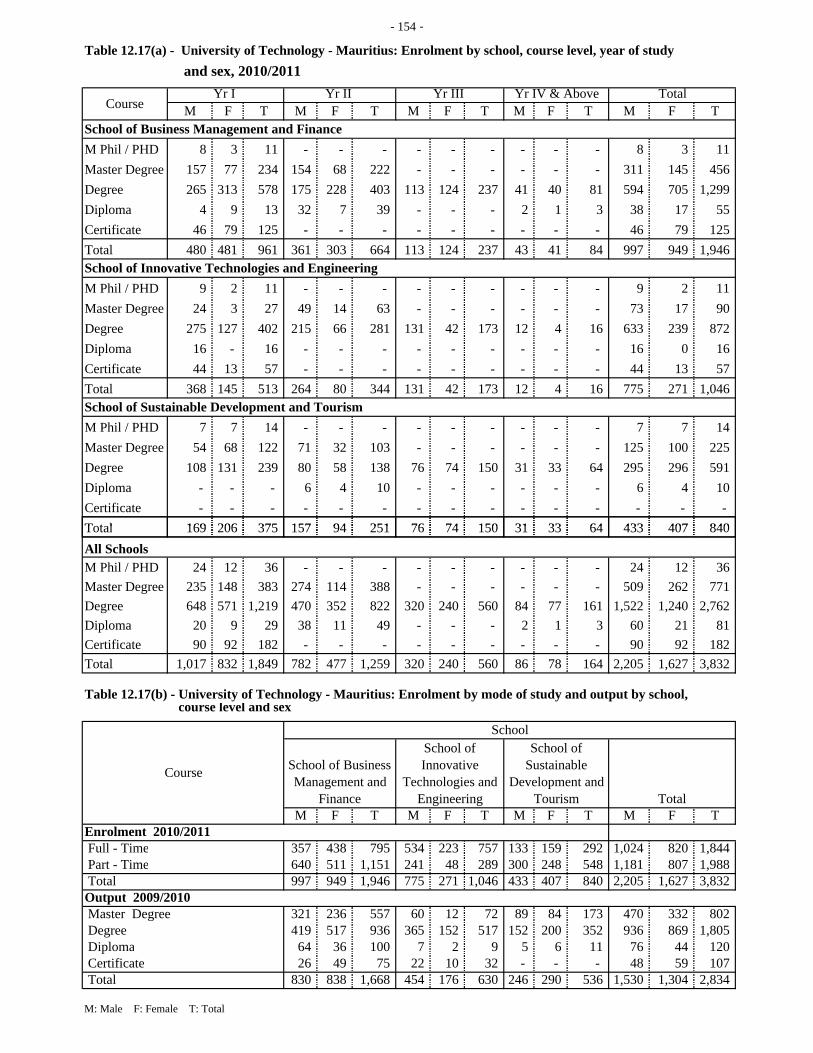
- 154 -
Table 12.17(a) - University of Technology - Mauritius: Enrolment by school, course level, year of study and sex, 2010/2011
M F T M F T M F T M F T M F T
M Phil / PHD 8 3 11 - - - - - - - - - 8 3 11 Master Degree 157 77 234 154 68 222 - - - - - - 311 145 456 Degree 265 313 578 175 228 403 113 124 237 41 40 81 594 705 1,299 Diploma 4 9 13 32 7 39 - - - 2 1 3 38 17 55 Certificate 46 79 125 - - - - - - - - - 46 79 125 Total 480 481 961 361 303 664 113 124 237 43 41 84 997 949 1,946
M Phil / PHD 9 2 11 - - - - - - - - - 9 2 11 Master Degree 24 3 27 49 14 63 - - - - - - 73 17 90 Degree 275 127 402 215 66 281 131 42 173 12 4 16 633 239 872 Diploma 16 - 16 - - - - - - - - - 16 0 16 Certificate 44 13 57 - - - - - - - - - 44 13 57 Total 368 145 513 264 80 344 131 42 173 12 4 16 775 271 1,046
M Phil / PHD 7 7 14 - - - - - - - - - 7 7 14 Master Degree 54 68 122 71 32 103 - - - - - - 125 100 225 Degree 108 131 239 80 58 138 76 74 150 31 33 64 295 296 591 Diploma - - - 6 4 10 - - - - - - 6 4 10 Certificate - - - - - - - - - - - - - - - Total 169 206 375 157 94 251 76 74 150 31 33 64 433 407 840
School of Sustainable Development and Tourism
Yr IV & Above Total
School of Business Management and Finance
School of Innovative Technologies and Engineering
Course Yr I Yr II Yr III
Total 169 206 375 157 94 251 76 74 150 31 33 64 433 407 840
M Phil / PHD 24 12 36 - - - - - - - - - 24 12 36 Master Degree 235 148 383 274 114 388 - - - - - - 509 262 771 Degree 648 571 1,219 470 352 822 320 240 560 84 77 161 1,522 1,240 2,762 Diploma 20 9 29 38 11 49 - - - 2 1 3 60 21 81 Certificate 90 92 182 - - - - - - - - - 90 92 182 Total 1,017 832 1,849 782 477 1,259 320 240 560 86 78 164 2,205 1,627 3,832
Table 12.17(b) - University of Technology - Mauritius: Enrolment by mode of study and output by school, course level and sex
M F T M F T M F T M F TEnrolment 2010/2011
357 438 795 534 223 757 133 159 292 1,024 820 1,844 640 511 1,151 241 48 289 300 248 548 1,181 807 1,988 997 949 1,946 775 271 1,046 433 407 840 2,205 1,627 3,832
Output 2009/2010321 236 557 60 12 72 89 84 173 470 332 802 419 517 936 365 152 517 152 200 352 936 869 1,805 64 36 100 7 2 9 5 6 11 76 44 120
Certificate 26 49 75 22 10 32 - - - 48 59 107 830 838 1,668 454 176 630 246 290 536 1,530 1,304 2,834
M: Male F: Female T: Total
Total
School
Course
Degree Diploma
Total
Full - Time Part - Time Total
Master Degree
All Schools
School of Business Management and
Finance
School of Innovative
Technologies and Engineering
School of Sustainable
Development and Tourism
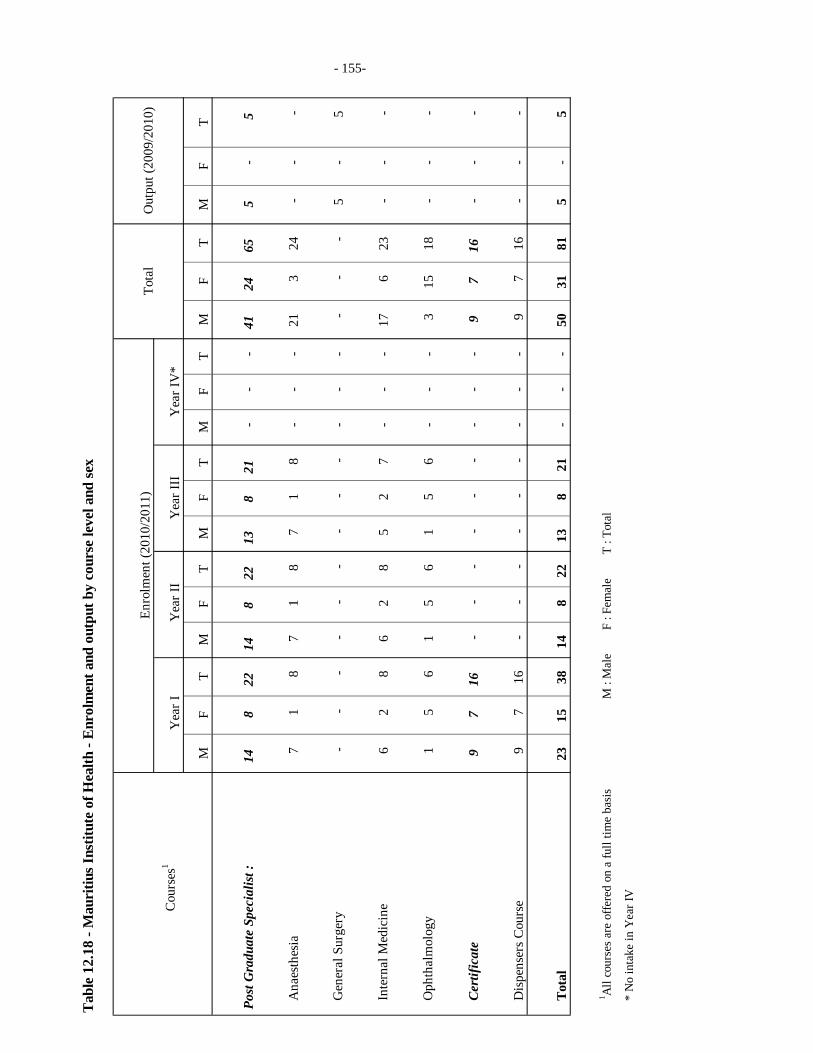
Tab
le 1
2.18
- M
auri
tius I
nstit
ute
of H
ealth
- E
nrol
men
t and
out
put b
y co
urse
leve
l and
sex
Enro
lmen
t (20
10/2
011)
Cou
rses
1 Y
ear I
MF
TM
FT
MF
TM
FT
MF
TM
FT
Pos
t Gra
duat
e Sp
ecia
list :
14
8
22
14
8
22
13
8
21
-
-
-
41
24
65
5
-
5
Ana
esth
esia
7
1
8
7
1
8
7
1
8
-
-
-
21
3
24
-
-
-
Gen
eral
Sur
gery
-
-
-
-
-
-
-
-
-
-
-
-
-
-
-
5
-
5
Inte
rnal
Med
icin
e6
2
8
6
2
8
5
2
7
-
-
-
17
6
23
-
-
-
Oph
thal
mol
ogy
1
5
6
1
5
6
1
5
6
-
-
-
3
15
18
-
-
-
Cer
tific
ate
9
7
16
-
-
-
-
-
-
-
-
-
9
7
16
-
-
-
Dis
pens
ers C
ours
e9
7
16
-
-
-
-
-
-
-
-
-
9
7
16
-
-
-
Tot
al23
15
38
14
8
22
13
8
21
-
-
-
50
31
81
5
-
5
1A
ll co
urse
s are
offe
red
on a
full
time
basi
sM
: M
ale
F : F
emal
eT
: Tot
al
* N
o in
take
in Y
ear I
V
Tota
l
Yea
r II
Yea
r III
Out
put (
2009
/201
0)
Yea
r IV
*
- 155-
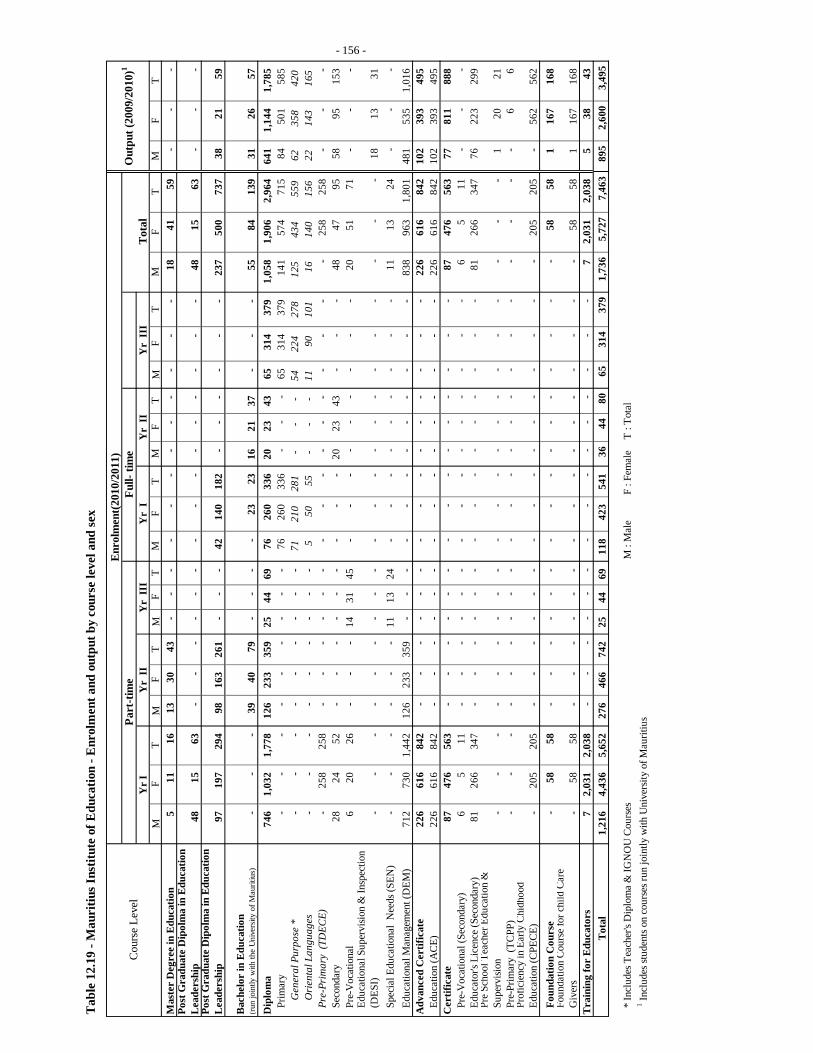
Tab
le 1
2.19
- M
auri
tius I
nstit
ute
of E
duca
tion
- Enr
olm
ent a
nd o
utpu
t by
cour
se le
vel a
nd se
x
MF
TM
FT
MF
TM
FT
MF
TM
FT
MF
TM
FT
5
11
16
13
30
43
- -
- -
- -
- -
- -
- -
18
41
59
- -
-
48
15
63
- -
- -
- -
- -
- -
- -
- -
- 48
15
63
-
- -
97
197
29
4
98
163
26
1
- -
- 42
14
0
182
-
- -
- -
- 23
7
500
73
7
38
21
59
- -
- 39
40
79
-
- -
- 23
23
16
21
37
-
- -
55
84
139
31
26
57
D
iplo
ma
746
1,
032
1,
778
12
6
233
35
9
25
44
69
76
260
33
6
20
23
43
65
314
37
9
1,05
8
1,90
6
2,96
4
641
1,
144
1,
785
Pr
imar
y -
- -
- -
- -
- -
76
260
33
6
- -
- 65
31
4
379
14
1
574
71
5
84
501
58
5
G
ener
al P
urpo
se *
- -
- -
- -
- -
- 71
21
0
281
-
- -
54
224
27
8
125
43
4
559
62
35
8
420
Ori
enta
l Lan
guag
es-
- -
- -
- -
- -
5
50
55
- -
- 11
90
10
1
16
140
15
6
22
143
16
5
Pre-
Prim
ary
(TD
ECE)
- 25
8
258
-
- -
- -
- -
- -
- -
- -
- -
- 25
8
258
-
- -
Seco
ndar
y28
24
52
-
- -
- -
- -
- -
20
23
43
- -
- 48
47
95
58
95
15
3
Pre-
Voc
atio
nal
6
20
26
- -
- 14
31
45
-
- -
- -
- -
- -
20
51
71
- -
- Ed
ucat
iona
l Sup
ervi
sion
& In
spec
tion
(DES
I)-
- -
- -
- -
- -
- -
- -
- -
- -
- -
- -
18
13
31
Spec
ial E
duca
tiona
l N
eeds
(SEN
)-
- -
- -
- 11
13
24
-
- -
- -
- -
- -
11
13
24
- -
- Ed
ucat
iona
l Man
agem
ent (
DEM
)71
2
730
1,
442
12
6
233
35
9
- -
- -
- -
- -
- -
- -
838
96
3
1,80
1
481
53
5
1,01
6
Adv
ance
d C
ertif
icat
e22
6
616
84
2
- -
- -
- -
- -
- -
- -
- -
- 22
6
616
84
2
102
39
3
495
Ed
ucat
ion
(AC
E)22
6
616
84
2
- -
- -
- -
- -
- -
- -
- -
- 22
6
616
84
2
102
39
3
495
C
ertif
icat
e 87
47
6
563
-
- -
- -
- -
- -
- -
- -
- -
87
476
56
3
77
811
88
8
Pre-
Voc
atio
nal (
Seco
ndar
y)6
5
11
-
- -
- -
- -
- -
- -
- -
- -
6
5
11
- -
- Ed
ucat
or's
Lice
nce
(Sec
onda
ry)
81
266
34
7
- -
- -
- -
- -
- -
- -
- -
- 81
26
6
347
76
22
3
299
Pr
e Sc
hool
Tea
cher
Edu
catio
n &
Su
perv
ision
- -
- -
- -
- -
- -
- -
- -
- -
- -
- -
- 1
20
21
Pr
e-Pr
imar
y (T
CPP
)-
- -
- -
- -
- -
- -
- -
- -
- -
- -
- -
- 6
6
Pr
ofic
ienc
y in
Ear
ly C
hidh
ood
Educ
atio
n (C
PEC
E)-
205
20
5
- -
- -
- -
- -
- -
- -
- -
- -
205
20
5
- 56
2
562
Fo
unda
tion
Cou
rse
- 58
58
-
- -
- -
- -
- -
- -
- -
- -
- 58
58
1
16
7
168
Fo
unda
tion
Cou
rse
for c
hild
Car
e G
iver
s-
58
58
- -
- -
- -
- -
- -
- -
- -
- -
58
58
1
167
16
8
7
2,03
1
2,03
8
- -
- -
- -
- -
- -
- -
- -
- 7
2,
031
2,
038
5
38
43
1,
216
4,
436
5,
652
27
6
466
74
2
25
44
69
118
42
3
541
36
44
80
65
31
4 37
9 1,
736
5,72
7 7,
463
895
2,60
0 3,
495
M :
Mal
eF
: Fem
ale
T : T
otal
1 In
clud
es st
uden
ts on
cou
rses
run
join
tly w
ith U
nive
rsity
of M
aurit
ius
Yr
IY
r I
Part
-tim
e
Tot
al
Mas
ter
Deg
ree
in E
duca
tion
Post
Gra
duat
e D
i pol
ma
in E
duca
tion
Lea
ders
hip
Bac
helo
r in
Edu
catio
n
(run
join
tly w
ith th
e Un
ivers
ity o
f Mau
ritiu
s)
Tra
inin
g fo
r E
duca
tors
Post
Gra
duat
e D
ipol
ma
in E
duca
tion
Lea
ders
hip
Yr
III
* In
clud
es T
each
er's
Dip
lom
a &
IGN
OU
Cou
rses
Full-
tim
eO
utpu
t (20
09/2
010)
1C
ours
e Le
vel
Tot
al
Enr
olm
ent(
2010
/201
1)
Yr
IIY
r II
IY
r II
- 156 -

Tab
le 1
2.20
- M
ahat
ma
Gan
dhi I
nstit
ute
- Enr
olm
ent a
nd o
utpu
t by
cour
se le
vel a
nd se
x
Cou
rses
Yea
r I
Yea
r II
MF
TM
FT
MF
TM
FT
MF
TM
FT
Post
Gra
duat
e10
34
44
2
4
6
-
-
-
-
-
-
12
38
50
-
-
-
M
.A H
ons.
Hin
diPT
1
18
19
2
4
6
-
-
-
-
-
-
3
22
25
-
-
-
M.A
Hon
s. U
rdu
PT1
10
11
-
-
-
-
-
-
-
-
-
1
10
11
-
-
-
Pe
rfor
min
g A
rts (S
itar &
Voc
al H
indu
stan
i M
usic
)PT
8
6
14
-
-
-
-
-
-
-
-
-
8
6
14
-
-
-
Deg
ree
(B.A
Hon
ours
)11
86
97
8
99
10
7
1
24
25
-
-
-
20
209
22
9
41
158
19
9
Hin
di
FT2
28
30
2
23
25
1
24
25
-
-
-
5
75
80
3
23
26
U
rdu
FT2
18
20
2
22
24
-
-
-
-
-
-
4
40
44
1
18
19
Ta
mil
FT-
5
5
-
3
3
-
-
-
-
-
-
-
8
8
1
1
2
Te
lugu
FT
-
2
2
-
-
-
-
-
-
-
-
-
-
2
2
1
1
2
Mar
athi
FT
-
2
2
-
-
-
-
-
-
-
-
-
-
2
2
1
5
6
Indo
logi
cal S
tudi
es (I
ndia
n Ph
iloso
phy
)FT
4
26
30
1
29
30
-
-
-
-
-
-
5
55
60
5
21
26
Indo
logi
cal S
tudi
es (S
ansk
rit)
PT1
2
3
-
-
-
-
-
-
-
-
-
1
2
3
-
-
-
H
indi
,Tam
il,Te
lugu
,Mar
athi
, Ind
ian
Philo
soph
y,Sa
nskr
it &
Mod
ern
Chi
nese
PT
-
2
2
3
22
25
-
-
-
-
-
-
3
24
27
13
69
82
Perf
orm
ing
Arts
: (K
hata
k &
Sita
r)
PT2
1
3
-
-
-
-
-
-
-
-
-
2
1
3
16
20
36
D
iplo
ma/
Deg
ree
4
11
15
5
20
25
-
-
-
13
21
34
22
52
74
2
-
2
Fine
Arts
FT-
-
-
5
20
25
-
-
-
6
16
22
11
36
47
-
-
-
D
igita
l Arts
FT4
11
15
-
-
-
-
-
-
7
5
12
11
16
27
2
-
2
D
iplo
ma
20
58
78
17
62
79
6
31
37
-
-
-
43
151
19
4
7
18
25
Perf
orm
ing
Arts
: Bha
rata
N
atya
m,K
hata
k,K
uchi
pudi
, Voc
al H
indu
stan
i M
usic
, Voc
al C
arna
tic M
usic
, Vio
lin
Hin
dust
ani,
Mri
dang
am, T
abla
& S
itar)
PT
6
19
25
10
15
25
5
13
18
-
-
-
21
47
68
2
2
4
Indo
logi
cal S
tudi
es (S
ansk
rit &
Indi
an
Philo
soph
y)
PT3
8
11
-
4
4
-
-
-
3
12
15
-
-
-
Fi
ne A
rts
PT6
9
15
4
5
9
-
-
-
-
-
-
10
14
24
3
6
9
La
ngua
ges :
H
indi
,Urd
u,Ta
mil,
Telu
gu,M
arat
hi,C
hine
se,S
ansk
rit &
Indi
an P
hilo
soph
yPT
5
22
27
3
38
41
1
18
19
-
-
-
9
78
87
2
10
12
Adv
ance
d C
ertif
icat
e14
39
53
23
30
53
-
-
-
-
-
-
37
69
10
6
-
-
-
Indi
an M
usic
& D
ance
(MG
I & D
ista
nce
Educ
atio
n)PT
14
39
53
23
30
53
-
-
-
-
-
-
37
69
106
-
-
-
Cer
tific
ate
374
61
4
988
20
0
314
51
4
63
106
16
9
-
-
-
637
1,
034
1,
671
62
82
14
4
Prof
icie
ncy
in P
erfo
rman
ce in
Indi
an D
ance
PT
-
-
-
-
9
9
-
-
-
-
9
9
-
-
-
Cer
tific
ate
Cou
rse
in In
dian
Mus
ic &
Dan
cePT
240
37
3
613
14
5
183
32
8
57
104
16
1
442
66
0
1,10
2
62
82
144
C
hild
ren'
s Cou
rse
in In
dian
Mus
ic &
Dan
cePT
134
24
1
375
55
12
2
177
6
2
8
-
-
-
19
5
365
56
0
-
-
-
433
84
2
1,27
5
255
52
9
784
70
16
1
231
13
21
34
77
1
1,55
3
2,32
4
112
25
8
370
M :
Mal
e
F :
Fem
ale
T : T
otal
Tot
al
Mod
e of
St
udy
Enr
olm
ent(
2010
/201
1)O
utpu
t(20
09/2
010)
Yea
r II
I Y
ear
IV
Tot
a l
- 178 -- 165 -- 178 -- 157 -
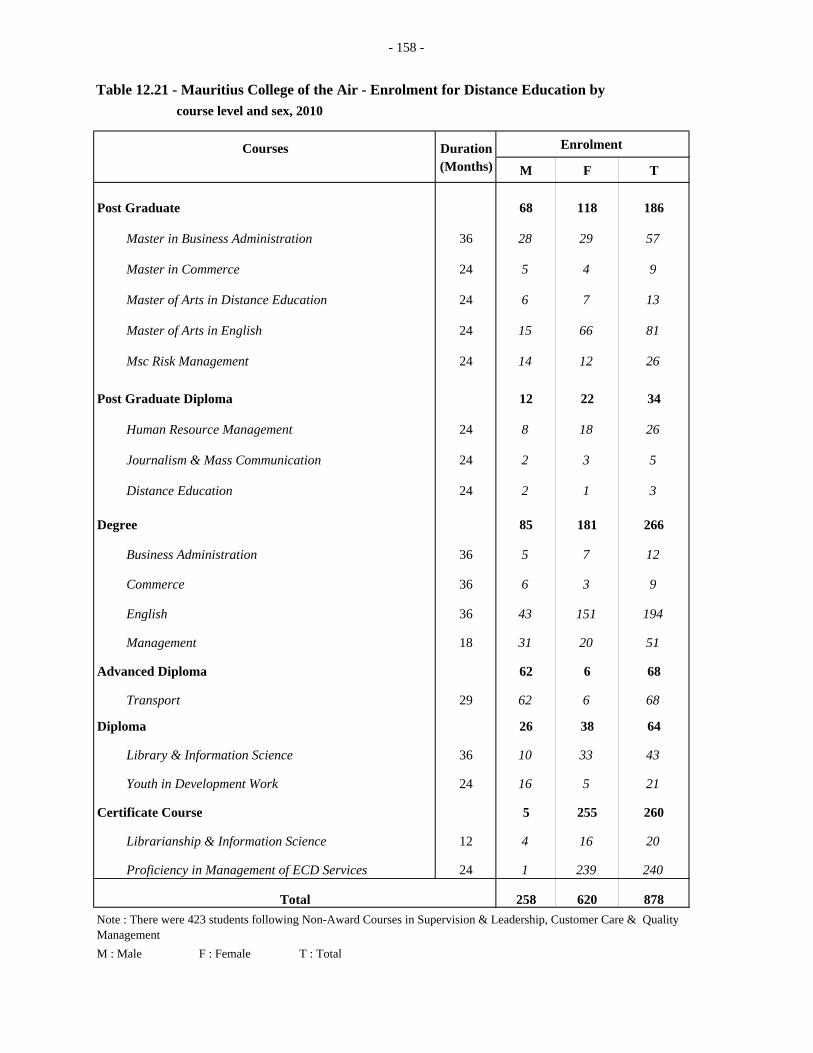
- 158 -
Table 12.21 - Mauritius College of the Air - Enrolment for Distance Education by course level and sex, 2010
Courses Duration(Months) M F T
Post Graduate 68 118 186
Master in Business Administration 36 28 29 57
Master in Commerce 24 5 4 9
Master of Arts in Distance Education 24 6 7 13
Master of Arts in English 24 15 66 81
Msc Risk Management 24 14 12 26
Post Graduate Diploma 12 22 34
Human Resource Management 24 8 18 26
Journalism & Mass Communication 24 2 3 5
Distance Education 24 2 1 3
85 181 266
Business Administration 36 5 7 12
36 6 3 9
English 36 43 151 194
Management 18 31 20 51
Advanced Diploma 62 6 68
Transport 29 62 6 68
Diploma 26 38 64
Library & Information Science 36 10 33 43
Youth in Development Work 24 16 5 21
Certificate Course 5 255 260
Librarianship & Information Science 12 4 16 20
Proficiency in Management of ECD Services 24 1 239 240
258 620 878
F : Female T : Total
Note : There were 423 students following Non-Award Courses in Supervision & Leadership, Customer Care & Quality Management
Enrolment
Total
Degree
Commerce
M : Male
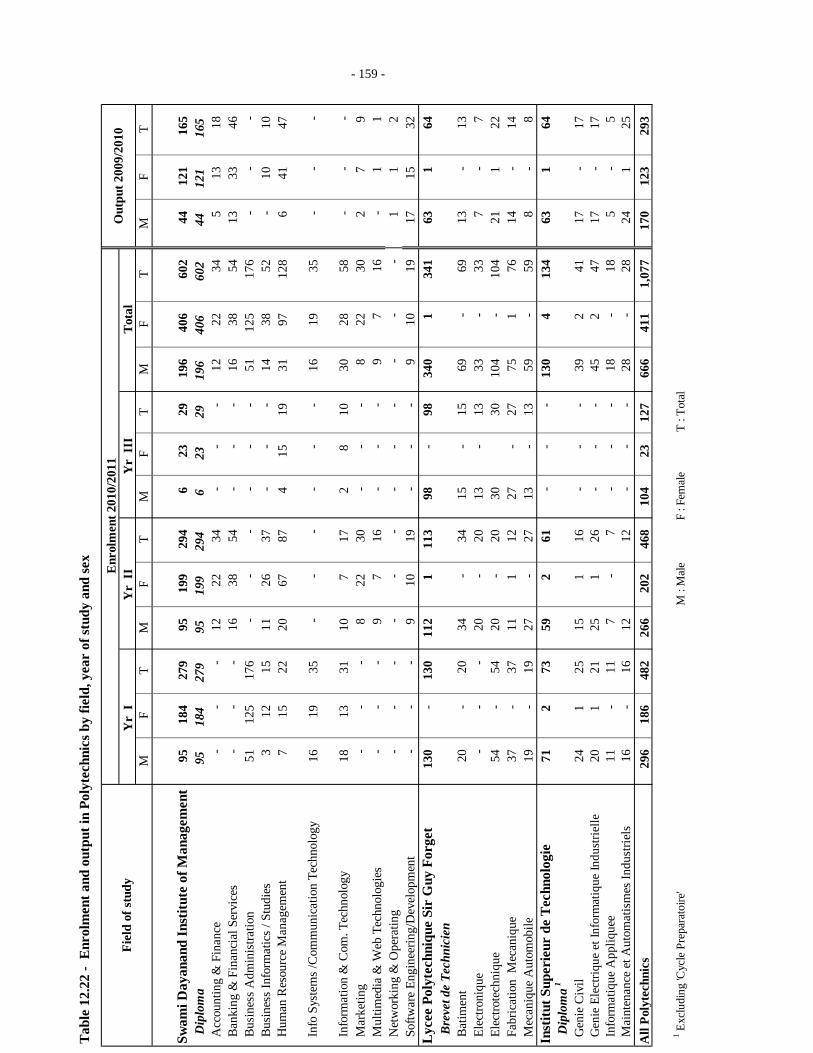
Tab
le 1
2.22
- E
nrol
men
t and
out
put i
n Po
lyte
chni
cs b
y fie
ld, y
ear
of st
udy
and
sex
Enr
olm
ent 2
010/
2011
Yr
I Y
r II
Y
r II
I M
FT
MF
TM
FT
MF
TM
FT
95
184
27
9
95
199
29
4
6
23
29
196
40
6
602
44
12
1
165
A
ccou
ntin
g &
Fin
ance
-
-
-
12
22
34
-
-
-
12
22
34
5
13
18
Bank
ing
& F
inan
cial
Ser
vice
s-
-
-
16
38
54
-
-
-
16
38
54
13
33
46
Bu
sine
ss A
dmin
istra
tion
51
125
17
6
-
-
-
-
-
-
51
125
17
6
-
-
-
Busi
ness
Info
rmat
ics /
Stu
dies
3
12
15
11
26
37
-
-
-
14
38
52
-
10
10
Hum
an R
esou
rce
Man
agem
ent
7
15
22
20
67
87
4
15
19
31
97
128
6
41
47
Info
Sys
tem
s /C
omm
unic
atio
n Te
chno
logy
16
19
35
-
-
-
-
-
-
16
19
35
-
-
-
Info
rmat
ion
& C
om. T
echn
olog
y18
13
31
10
7
17
2
8
10
30
28
58
-
-
-
M
arke
ting
-
-
-
8
22
30
-
-
-
8
22
30
2
7
9
Mul
timed
ia &
Web
Tec
hnol
ogie
s-
-
-
9
7
16
-
-
-
9
7
16
-
1
1
N
etw
orki
ng &
Ope
ratin
g-
-
-
-
-
-
-
-
-
-
-
-
1
1
2
So
ftwar
e En
gine
erin
g/D
evel
opm
ent
-
-
-
9
10
19
-
-
-
9
10
19
17
15
32
Lyc
ee P
olyt
echn
ique
Sir
Guy
For
get
130
-
13
0
112
1
11
3
98
-
98
340
1
34
1
63
1
64
B
reve
t de
Tech
nici
enBa
timen
t20
-
20
34
-
34
15
-
15
69
-
69
13
-
13
El
ectro
niqu
e-
-
-
20
-
20
13
-
13
33
-
33
7
-
7
El
ectro
tech
niqu
e54
-
54
20
-
20
30
30
10
4
-
104
21
1
22
Fa
bric
atio
n M
ecan
ique
37
-
37
11
1
12
27
-
27
75
1
76
14
-
14
Mec
aniq
ue A
utom
obile
19
-
19
27
-
27
13
-
13
59
-
59
8
-
8
Inst
itut S
uper
ieur
de
Tec
hnol
ogie
71
2
73
59
2
61
-
-
-
130
4
13
4
63
1
64
D
iplo
ma
1
Gen
ie C
ivil
24
1
25
15
1
16
-
-
-
39
2
41
17
-
17
Gen
ie E
lect
rique
et I
nfor
mat
ique
Indu
strie
lle20
1
21
25
1
26
-
-
-
45
2
47
17
-
17
In
form
atiq
ue A
ppliq
uee
11
-
11
7
-
7
-
-
-
18
-
18
5
-
5
Mai
nten
ance
et A
utom
atis
mes
Indu
strie
ls16
-
16
12
12
-
-
-
28
-
28
24
1
25
A
ll Po
lyte
chni
cs29
6
186
48
2
266
20
2
468
10
4
23
127
66
6
411
1,
077
17
0
123
29
3
1 Exc
ludi
ng 'C
ycle
Pre
para
toire
'M
: M
ale
F : F
emal
eT
: Tot
al
406
60
2
44
121
16
5
199
29
4
6
23
29
196
Out
put 2
009/
2010
Fiel
d of
stud
y
D
iplo
ma
Tot
al
Swam
i Day
anan
d In
stitu
te o
f Man
agem
ent
95
184
27
9
95
- 159 -
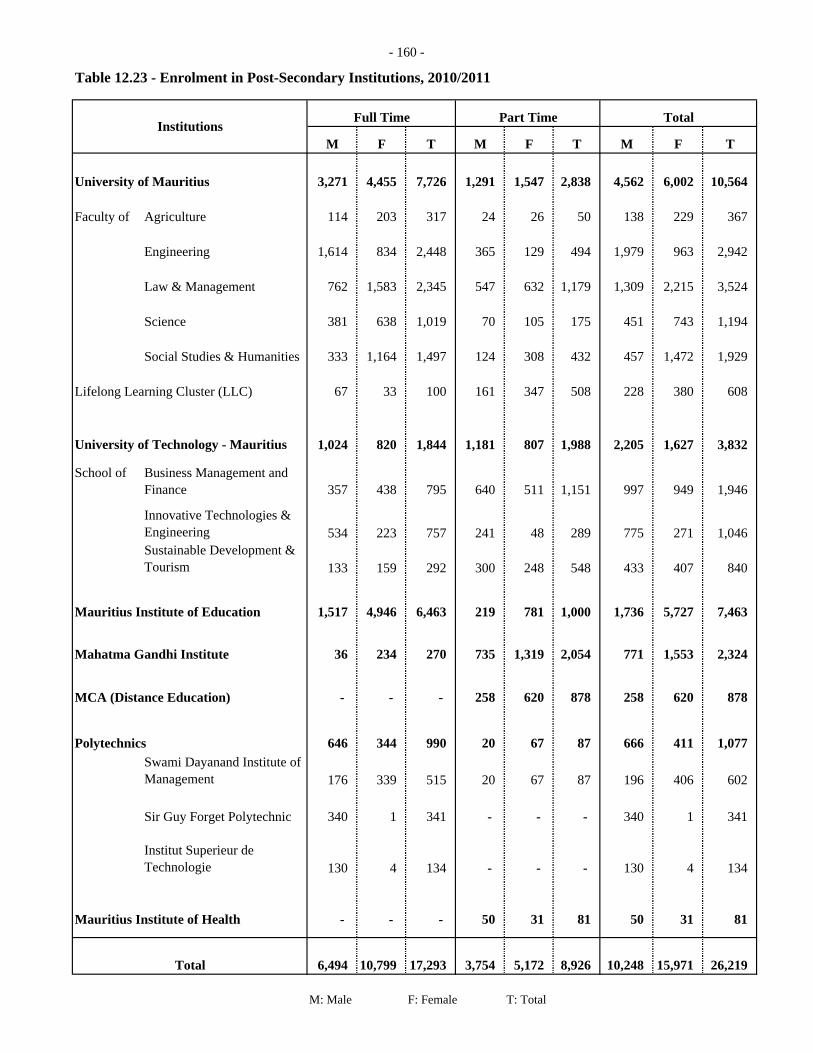
- 160 -
Table 12.23 - Enrolment in Post-Secondary Institutions, 2010/2011
M F T M F T M F T
University of Mauritius 3,271 4,455 7,726 1,291 1,547 2,838 4,562 6,002 10,564
Faculty of Agriculture 114 203 317 24 26 50 138 229 367
Engineering 1,614 834 2,448 365 129 494 1,979 963 2,942
Law & Management 762 1,583 2,345 547 632 1,179 1,309 2,215 3,524
Science 381 638 1,019 70 105 175 451 743 1,194
Social Studies & Humanities 333 1,164 1,497 124 308 432 457 1,472 1,929
Lifelong Learning Cluster (LLC) 67 33 100 161 347 508 228 380 608
1,024 820 1,844 1,181 807 1,988 2,205 1,627 3,832
School of Business Management and Finance 357 438 795 640 511 1,151 997 949 1,946
Innovative Technologies & Engineering 534 223 757 241 48 289 775 271 1,046 Sustainable Development & Tourism 133 159 292 300 248 548 433 407 840
Mauritius Institute of Education 1,517 4,946 6,463 219 781 1,000 1,736 5,727 7,463
Mahatma Gandhi Institute 36 234 270 735 1,319 2,054 771 1,553 2,324
MCA (Distance Education) - - - 258 620 878 258 620 878
Polytechnics 646 344 990 20 67 87 666 411 1,077 Swami Dayanand Institute of Management 176 339 515 20 67 87 196 406 602
Sir Guy Forget Polytechnic 340 1 341 - - - 340 1 341
Institut Superieur de Technologie 130 4 134 - - - 130 4 134
Mauritius Institute of Health - - - 50 31 81 50 31 81
6,494 10,799 17,293 3,754 5,172 8,926 10,248 15,971 26,219
M: Male F: Female T: Total
Total
TotalPart TimeInstitutions
Full Time
University of Technology - Mauritius
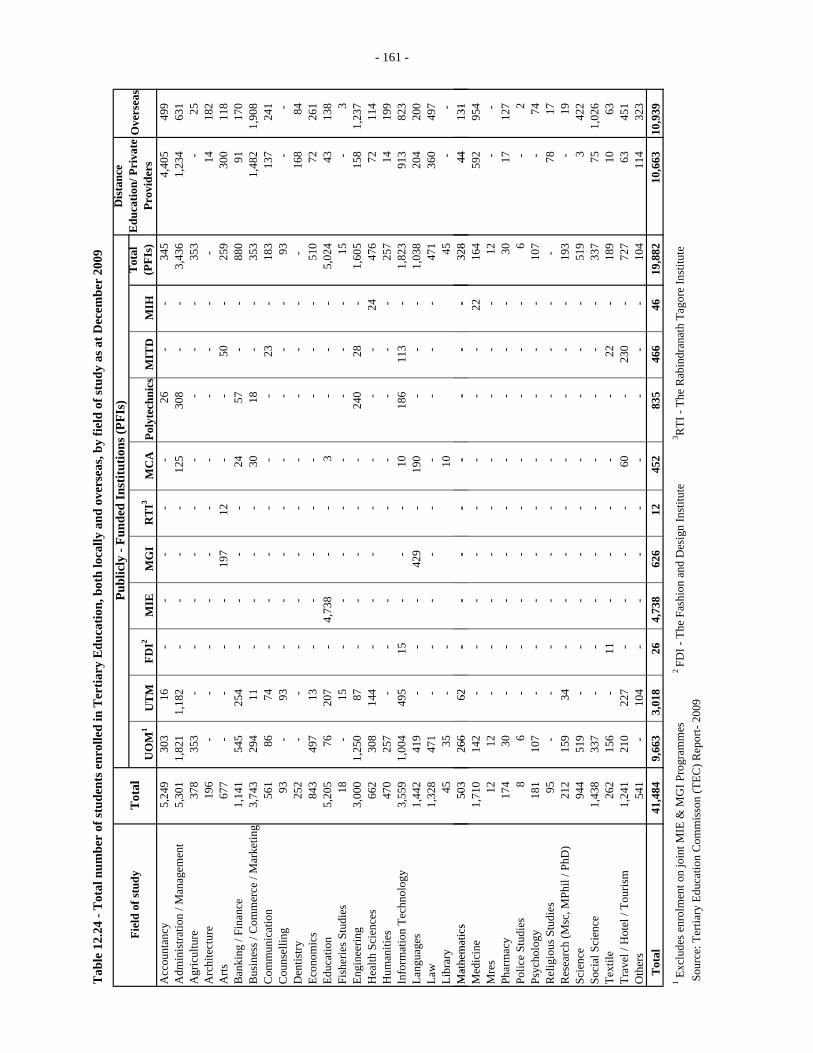
Tab
le 1
2.24
- T
otal
num
ber
of st
uden
ts e
nrol
led
in T
ertia
ry E
duca
tion,
bot
h lo
cally
and
ove
rsea
s, by
fiel
d of
stud
y as
at D
ecem
ber
2009
UO
M1
UT
MFD
I2M
IEM
GI
RT
I3M
CA
Poly
tech
nics
MIT
DM
IHA
ccou
ntan
cy5,
249
30
3
16
-
-
-
-
-
26
-
-
34
5
4,40
5
499
A
dmin
istra
tion
/ Man
agem
ent
5,30
1
1,82
1
1,18
2
-
-
-
-
125
30
8
-
-
3,43
6
1,23
4
631
A
gric
ultu
re37
8
353
-
-
-
-
-
-
-
-
-
353
-
25
A
rchi
tect
ure
196
-
-
-
-
-
-
-
-
-
-
-
14
18
2
Arts
677
-
-
-
-
19
7
12
-
-
50
-
25
9
300
11
8
Ban
king
/ Fi
nanc
e1,
141
54
5
254
-
-
-
-
24
57
-
-
88
0
91
17
0
Bus
ines
s / C
omm
erce
/ M
arke
ting
3,74
3
294
11
-
-
-
-
30
18
-
-
353
1,
482
1,
908
C
omm
unic
atio
n56
1
86
74
-
-
-
-
-
-
23
-
183
13
7
241
C
ouns
ellin
g93
-
93
-
-
-
-
-
-
-
-
93
-
-
Den
tistry
252
-
-
-
-
-
-
-
-
-
-
-
16
8
84
Ec
onom
ics
843
49
7
13
-
-
-
-
-
-
-
-
51
0
72
26
1
Educ
atio
n5,
205
76
207
-
4,73
8
-
-
3
-
-
-
5,
024
43
138
Fi
sher
ies S
tudi
es18
-
15
-
-
-
-
-
-
-
-
15
-
3
En
gine
erin
g3,
000
1,
250
87
-
-
-
-
-
24
0
28
-
1,60
5
158
1,
237
H
ealth
Sci
ence
s66
2
308
14
4
-
-
-
-
-
-
-
24
476
72
114
H
uman
ities
470
25
7
-
-
-
-
-
-
-
-
257
14
199
In
form
atio
n Te
chno
logy
3,55
9
1,00
4
495
15
-
-
-
10
186
11
3
-
1,
823
91
3
823
La
ngua
ges
1,44
2
419
-
-
-
429
-
190
-
-
-
1,03
8
204
20
0
Law
1,32
8
471
-
-
-
-
-
-
-
-
-
471
36
0
497
Li
brar
y45
35
-
-
10
45
-
-
Mat
hem
atic
s50
326
662
--
--
--
--
328
4413
1
Fiel
d of
stud
yD
ista
nce
Edu
catio
n/ P
riva
te
Prov
ider
sO
vers
eas
Tot
alT
otal
(PFI
s)
Publ
icly
- Fu
nded
Inst
itutio
ns (P
FIs)
- 161 -
Mat
hem
atic
s 50
3
266
62
-
-
-
-
-
-
-
-
328
44
131
M
edic
ine
1,71
0
142
-
-
-
-
-
-
-
-
22
164
59
2
954
M
res
12
12
-
-
-
-
-
-
-
-
-
12
-
-
Ph
arm
acy
174
30
-
-
-
-
-
-
-
-
-
30
17
127
Po
lice
Stud
ies
8
6
-
-
-
-
-
-
-
-
-
6
-
2
Psyc
holo
gy18
1
107
-
-
-
-
-
-
-
-
-
107
-
74
R
elig
ious
Stu
dies
95
-
-
-
-
-
-
-
-
-
-
-
78
17
R
esea
rch
(Msc
, MPh
il / P
hD)
212
15
9
34
-
-
-
-
-
-
-
-
19
3
-
19
Scie
nce
944
51
9
-
-
-
-
-
-
-
-
-
51
9
3
422
So
cial
Sci
ence
1,43
8
337
-
-
-
-
-
-
-
-
-
337
75
1,02
6
Text
ile26
2
156
-
11
-
-
-
-
-
22
-
189
10
63
Tr
avel
/ H
otel
/ To
uris
m1,
241
21
0
227
-
-
-
-
60
-
23
0
-
72
7
63
45
1
Oth
ers
541
-
104
-
-
-
-
-
-
-
-
10
4
114
32
3
Tot
al41
,484
9,66
3
3,01
8
26
4,
738
62
6
12
45
2
835
46
6
46
19
,882
10
,663
1
0,93
9
1 Exc
lude
s enr
olm
ent o
n jo
int M
IE &
MG
I Pro
gram
mes
2 FD
I - T
he F
ashi
on a
nd D
esig
n In
stitu
te3 R
TI -
The
Rab
indr
anat
h Ta
gore
Inst
itute
Sou
rce:
Ter
tiary
Edu
catio
n C
omm
isso
n (T
EC) R
epor
t- 20
09
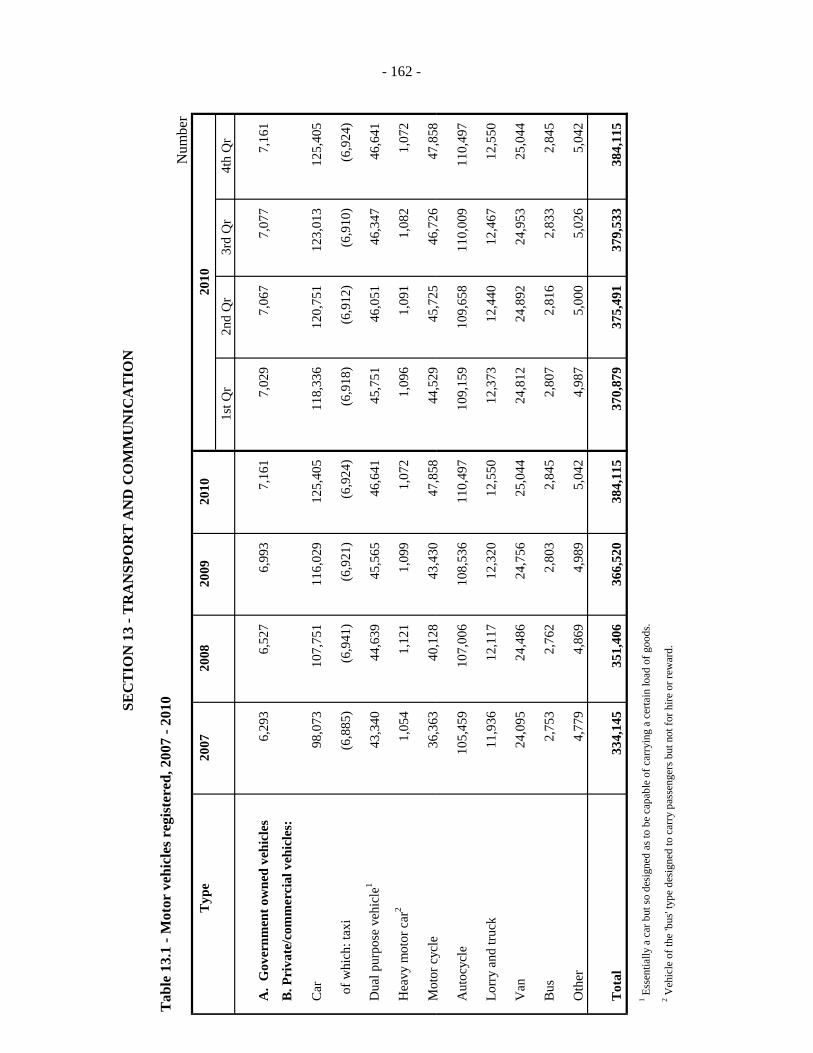
SEC
TIO
N 1
3 - T
RA
NSP
OR
T A
ND
CO
MM
UN
ICA
TIO
N
Tab
le 1
3.1
- Mot
or v
ehic
les r
egis
tere
d, 2
007
- 201
0N
umbe
rT
ype
2007
2008
2009
2010
2010
1st Q
r2n
d Q
r3r
d Q
r4t
h Q
r
A.
Gov
ernm
ent o
wne
d ve
hicl
es6,
293
6,
527
6,
993
7,
161
7,
029
7,
067
7,
077
7,
161
B. P
riva
te/c
omm
erci
al v
ehic
les:
Car
98
,073
10
7,75
1
116,
029
12
5,40
5
118,
336
12
0,75
1
123,
013
12
5,40
5
of w
hich
: tax
i(6
,885
) (6
,941
) (6
,921
) (6
,924
) (6
,918
) (6
,912
) (6
,910
) (6
,924
)
Dua
l pur
pose
veh
icle
143
,340
44
,639
45
,565
46
,641
45
,751
46
,051
46
,347
46
,641
Hea
vy m
otor
car
21,
054
1,
121
1,
099
1,
072
1,
096
1,
091
1,
082
1,
072
Mot
orcy
cle
36,3
6340
,128
43,4
3047
,858
44,5
2945
,725
46,7
2647
,858
- 162 -
Mot
or c
ycle
36,3
63
40,1
28
43,4
30
47,8
58
44,5
29
45,7
25
46,7
26
47,8
58
Aut
ocyc
le10
5,45
9
107,
006
10
8,53
6
110,
497
10
9,15
9
109,
658
11
0,00
9
110,
497
Lorr
y an
d tru
ck11
,936
12
,117
12
,320
12
,550
12
,373
12
,440
12
,467
12
,550
Van
24,0
95
24,4
86
24,7
56
25,0
44
24,8
12
24,8
92
24,9
53
25,0
44
Bus
2,75
3
2,76
2
2,80
3
2,84
5
2,80
7
2,81
6
2,83
3
2,84
5
Oth
er4,
779
4,
869
4,
989
5,
042
4,
987
5,
000
5,
026
5,
042
Tot
al33
4,14
5
351,
406
36
6,52
0
384,
115
37
0,87
9
375,
491
37
9,53
3
384,
115
1 Ess
entia
lly a
car
but
so d
esig
ned
as to
be
capa
ble
of c
arry
ing
a ce
rtain
load
of g
oods
.2 V
ehic
le o
f the
'bus
' typ
e de
sign
ed to
car
ry p
asse
nger
s but
not
for h
ire o
r rew
ard.
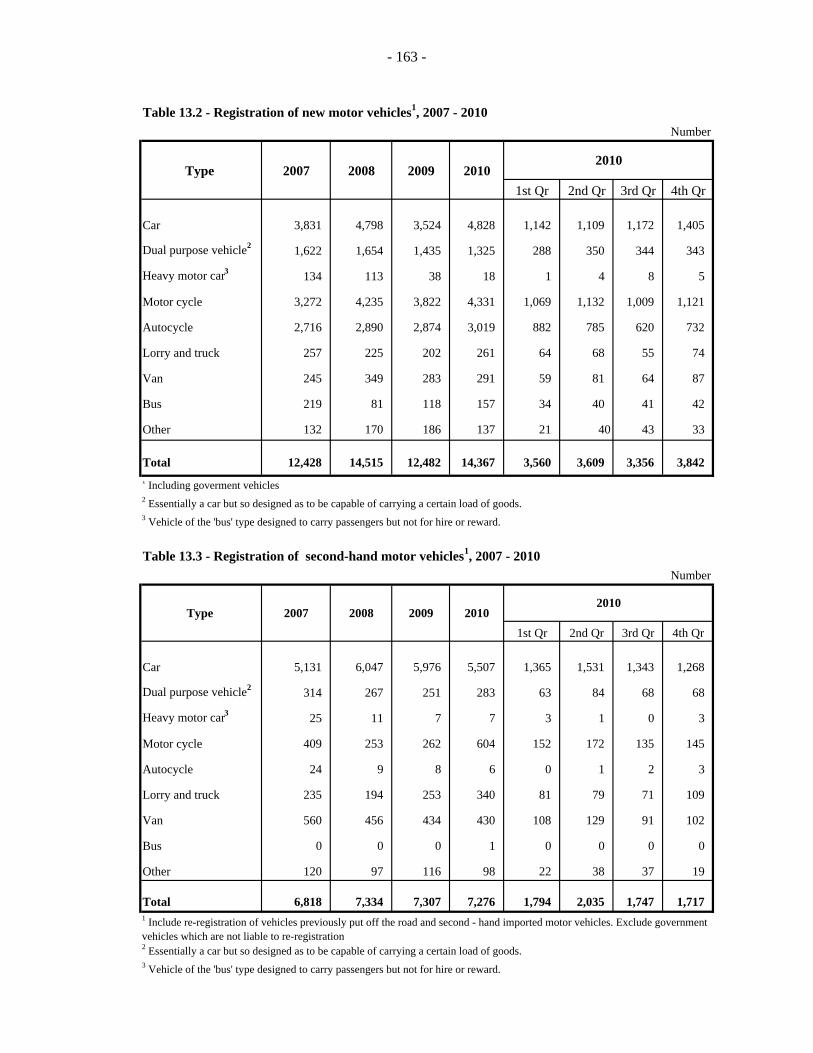
- 163 -
Table 13.2 - Registration of new motor vehicles1, 2007 - 2010Number
Type 2007 2008 2009 20101st Qr 2nd Qr 3rd Qr 4th Qr
Car 3,831 4,798 3,524 4,828 1,142 1,109 1,172 1,405
Dual purpose vehicle2 1,622 1,654 1,435 1,325 288 350 344 343
Heavy motor car3 134 113 38 18 1 4 8 5
Motor cycle 3,272 4,235 3,822 4,331 1,069 1,132 1,009 1,121
Autocycle 2,716 2,890 2,874 3,019 882 785 620 732
Lorry and truck 257 225 202 261 64 68 55 74
Van 245 349 283 291 59 81 64 87
Bus 219 81 118 157 34 40 41 42
Other 132 170 186 137 21 40 43 33
Total 12,428 14,515 12,482 14,367 3,560 3,609 3,356 3,842 1 Including goverment vehicles2 Essentially a car but so designed as to be capable of carrying a certain load of goods.3 Vehicle of the 'bus' type designed to carry passengers but not for hire or reward.
Table 13.3 - Registration of second-hand motor vehicles1, 2007 - 2010Number
Type 2007 2008 2009 20101st Qr 2nd Qr 3rd Qr 4th Qr
Car 5,131 6,047 5,976 5,507 1,365 1,531 1,343 1,268
Dual purpose vehicle2 314 267 251 283 63 84 68 68
Heavy motor car3 25 11 7 7 3 1 0 3
Motor cycle 409 253 262 604 152 172 135 145
Autocycle 24 9 8 6 0 1 2 3
Lorry and truck 235 194 253 340 81 79 71 109
Van 560 456 434 430 108 129 91 102
Bus 0 0 0 1 0 0 0 0
Other 120 97 116 98 22 38 37 19
Total 6,818 7,334 7,307 7,276 1,794 2,035 1,747 1,717
2 Essentially a car but so designed as to be capable of carrying a certain load of goods.3 Vehicle of the 'bus' type designed to carry passengers but not for hire or reward.
2010
2010
1 Include re-registration of vehicles previously put off the road and second - hand imported motor vehicles. Exclude government vehicles which are not liable to re-registration
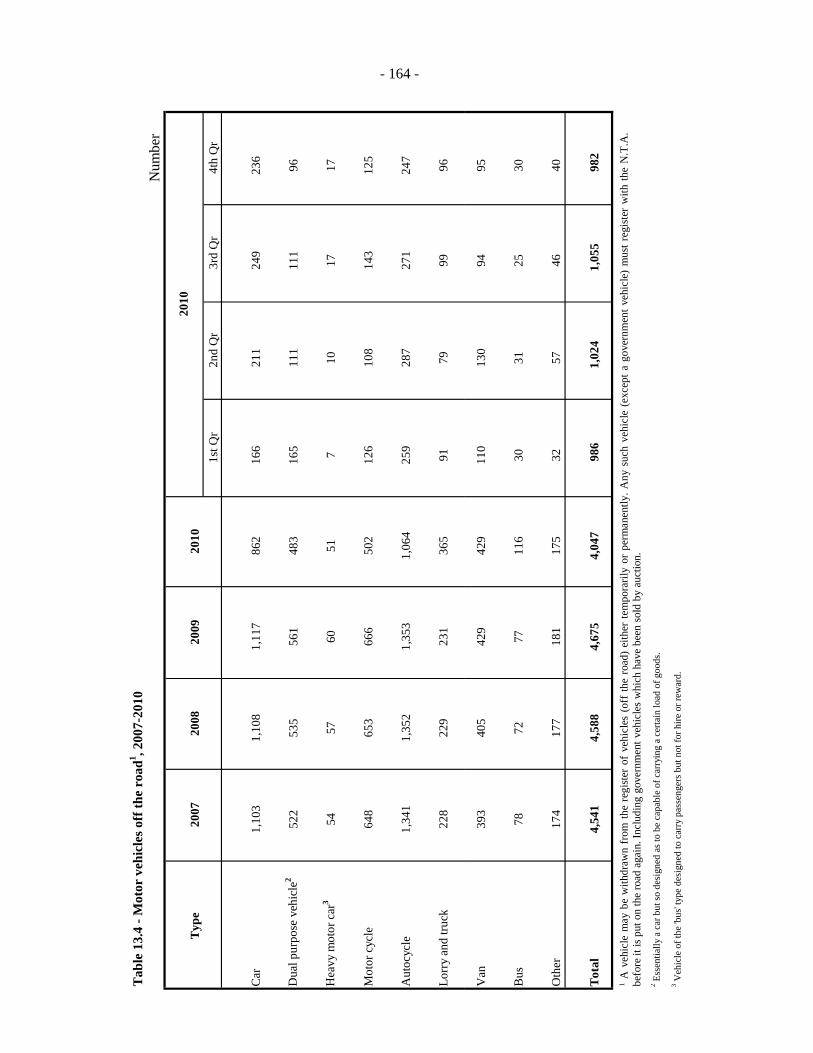
Tab
le 1
3.4
- Mot
or v
ehic
les o
ff th
e ro
ad1 , 2
007-
2010
Num
ber
Typ
e 20
0720
0820
0920
101s
t Qr
2nd
Qr
3rd
Qr
4th
Qr
Car
1,
103
1,
108
1,
117
86
2
166
211
249
236
Dua
l pur
pose
veh
icle
252
2
535
56
1
483
16
5
11
1
11
1
96
Hea
vy m
otor
car
354
57
60
51
7
10
17
17
Mot
or c
ycle
648
65
3
666
50
2
126
108
143
125
Aut
ocyc
le1,
341
1,
352
1,
353
1,
064
25
9
28
7
27
1
24
7
Lorr
y an
d tru
ck22
8
229
23
1
365
91
79
99
96
2010
- 164 -
Van
393
40
5
429
42
9
110
130
94
95
Bus
78
72
77
116
30
31
25
30
Oth
er17
4
177
18
1
175
32
57
46
40
Tot
al4,
541
4,
588
4,
675
4,
047
98
6
1,02
4
1,05
5
982
2 Ess
entia
lly a
car
but
so d
esig
ned
as to
be
capa
ble
of c
arry
ing
a ce
rtain
load
of g
oods
.
3 Veh
icle
of t
he 'b
us' t
ype
desi
gned
to c
arry
pas
seng
ers b
ut n
ot fo
r hire
or r
ewar
d.
1A
vehi
cle
may
bew
ithdr
awn
from
the
regi
ster
ofve
hicl
es(o
ffth
ero
ad)
eith
erte
mpo
raril
yor
perm
anen
tly.A
nysu
chve
hicl
e(e
xcep
tago
vern
men
tveh
icle
)m
ustr
egis
ter
with
the
N.T
.A.
befo
reit
ispu
ton
the
road
agai
n.In
clud
ing
gove
rnm
entv
ehic
les
whi
chha
vebe
enso
ldby
auct
ion.
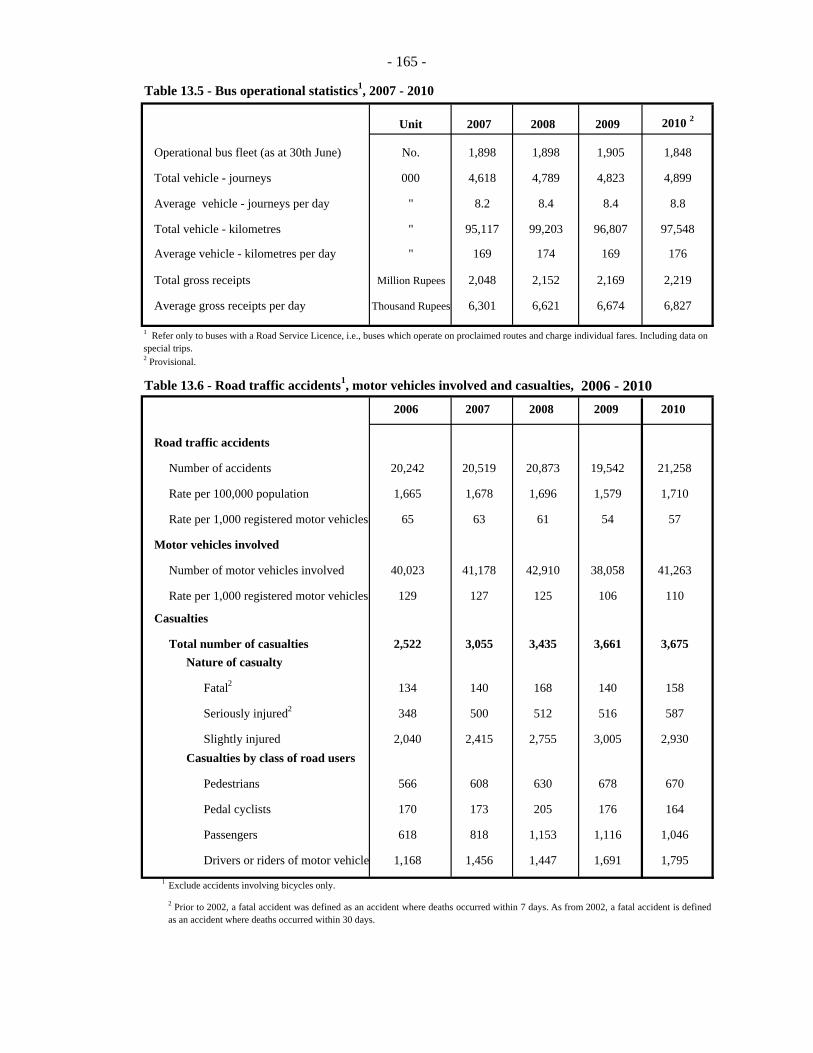
- 165 -
Table 13.5 - Bus operational statistics1, 2007 - 2010
Unit 2007 2008 2009 2010 2
Operational bus fleet (as at 30th June) No. 1,898 1,898 1,905 1,848
Total vehicle - journeys 000 4,618 4,789 4,823 4,899
Average vehicle - journeys per day " 8.2 8.4 8.4 8.8
Total vehicle - kilometres " 95,117 99,203 96,807 97,548
Average vehicle - kilometres per day " 169 174 169 176
Total gross receipts Million Rupees 2,048 2,152 2,169 2,219
Average gross receipts per day Thousand Rupees 6,301 6,621 6,674 6,827
2 Provisional.
Table 13.6 - Road traffic accidents1, motor vehicles involved and casualties, 2006 - 20102006 2007 2008 2009 2010
Road traffic accidents
Number of accidents 20,242 20,519 20,873 19,542 21,258
Rate per 100,000 population 1,665 1,678 1,696 1,579 1,710
Rate per 1,000 registered motor vehicles 65 63 61 54 57
Motor vehicles involved
Number of motor vehicles involved 40,023 41,178 42,910 38,058 41,263
Rate per 1,000 registered motor vehicles 129 127 125 106 110
Casualties
Total number of casualties 2,522 3,055 3,435 3,661 3,675 Nature of casualty
Fatal2 134 140 168 140 158
Seriously injured2 348 500 512 516 587
Slightly injured 2,040 2,415 2,755 3,005 2,930 Casualties by class of road users
Pedestrians 566 608 630 678 670
Pedal cyclists 170 173 205 176 164
Passengers 618 818 1,153 1,116 1,046
Drivers or riders of motor vehicle 1,168 1,456 1,447 1,691 1,795 1 Exclude accidents involving bicycles only.
1 Refer only to buses with a Road Service Licence, i.e., buses which operate on proclaimed routes and charge individual fares. Including data on special trips.
2 Prior to 2002, a fatal accident was defined as an accident where deaths occurred within 7 days. As from 2002, a fatal accident is definedas an accident where deaths occurred within 30 days.
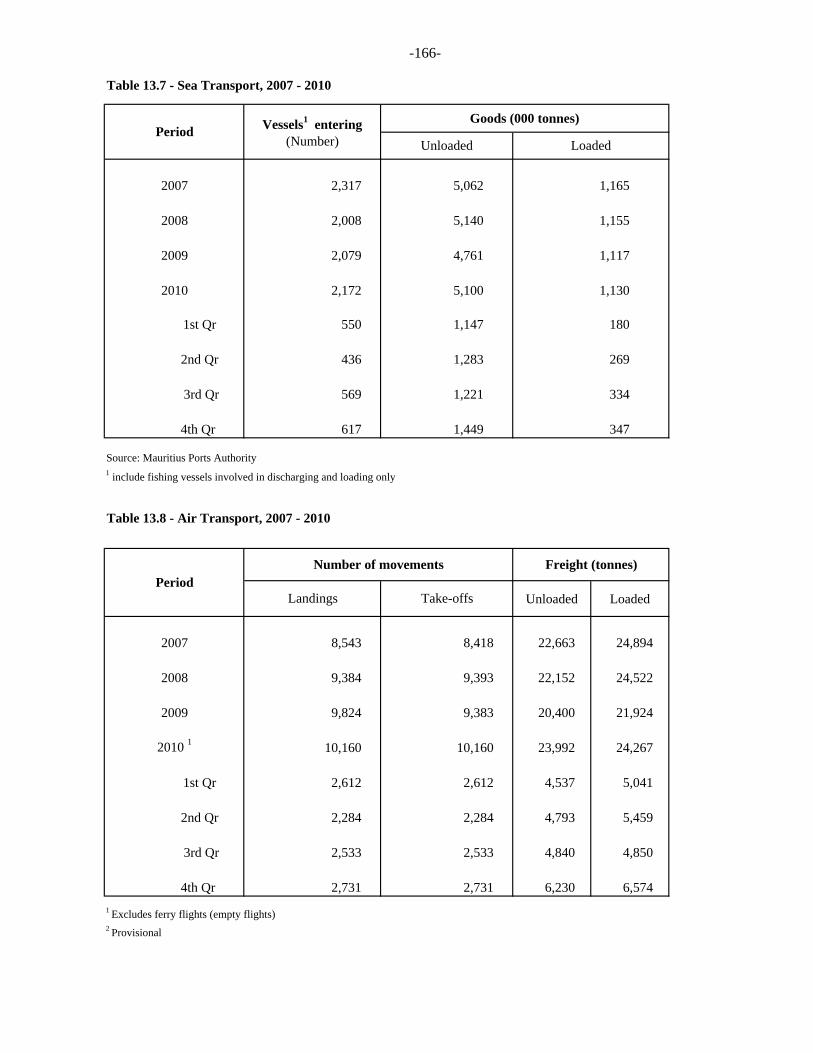
-166-
Table 13.7 - Sea Transport, 2007 - 2010
2007
2008
2009
2010
1st Qr
2nd Qr
3rd Qr
4th Qr
1 include fishing vessels involved in discharging and loading only
Table 13.8 - Air Transport, 2007 - 2010
Unloaded Loaded
2007 22,663 24,894
2008 22,152 24,522
2009 20,400 21,924
2010 1 23,992 24,267
1st Qr 4,537 5,041
2nd Qr 4,793 5,459
3rd Qr 4,840 4,850
4th Qr 6,230 6,574
Period Vessels1 entering (Number)
Goods (000 tonnes)
Unloaded Loaded
2,317 5,062 1,165
2,008 5,140 1,155
2,079 4,761 1,117
2,172 5,100 1,130
550 1,147 180
436 1,283 269
569 1,221 334
617 1,449 347
Source: Mauritius Ports Authority
PeriodNumber of movements Freight (tonnes)
Landings Take-offs
8,543 8,418
9,384 9,393
9,824 9,383
10,160 10,160
2,612 2,612
2,284 2,284
2,533 2,533
2,731 2,731 1 Excludes ferry flights (empty flights)2 Provisional
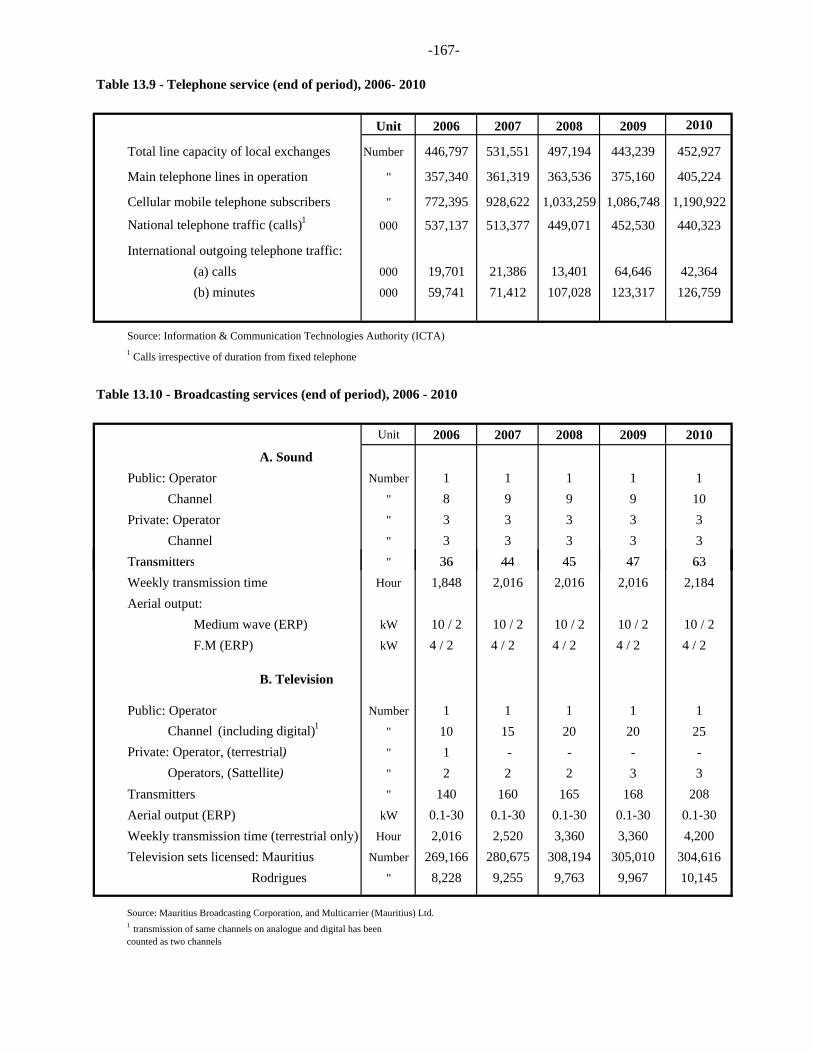
-167-
Table 13.9 - Telephone service (end of period), 2006- 2010
Unit 2006 2007 2008 2009 2010
Total line capacity of local exchanges Number 446,797 531,551 497,194 443,239 452,927
Main telephone lines in operation " 357,340 361,319 363,536 375,160 405,224
Cellular mobile telephone subscribers " 772,395 928,622 1,033,259 1,086,748 1,190,922
National telephone traffic (calls)1 000 537,137 513,377 449,071 452,530 440,323
International outgoing telephone traffic:(a) calls 000 19,701 21,386 13,401 64,646 42,364(b) minutes 000 59,741 71,412 107,028 123,317 126,759
Source: Information & Communication Technologies Authority (ICTA) 1 Calls irrespective of duration from fixed telephone
Table 13.10 - Broadcasting services (end of period), 2006 - 2010
Unit 2006 2007 2008 2009 2010
A. SoundPublic: Operator Number 1 1 1 1 1 Channel " 8 9 9 9 10Private: Operator " 3 3 3 3 3 Channel " 3 3 3 3 3Transmitters " 36 44 45 47 63Transmitters 36 44 45 47 63Weekly transmission time Hour 1,848 2,016 2,016 2,016 2,184Aerial output:
Medium wave (ERP) kW 10 / 2 10 / 2 10 / 2 10 / 2 10 / 2F.M (ERP) kW 4 / 2 4 / 2 4 / 2 4 / 2 4 / 2
B. Television
Public: Operator Number 1 1 1 1 1 Channel (including digital)1 " 10 15 20 20 25Private: Operator, (terrestrial) " 1 - - - - Operators, (Sattellite) " 2 2 2 3 3Transmitters " 140 160 165 168 208Aerial output (ERP) kW 0.1-30 0.1-30 0.1-30 0.1-30 0.1-30Weekly transmission time (terrestrial only) Hour 2,016 2,520 3,360 3,360 4,200Television sets licensed: Mauritius Number 269,166 280,675 308,194 305,010 304,616 Rodrigues " 8,228 9,255 9,763 9,967 10,145
Source: Mauritius Broadcasting Corporation, and Multicarrier (Mauritius) Ltd.1 transmission of same channels on analogue and digital has been counted as two channels
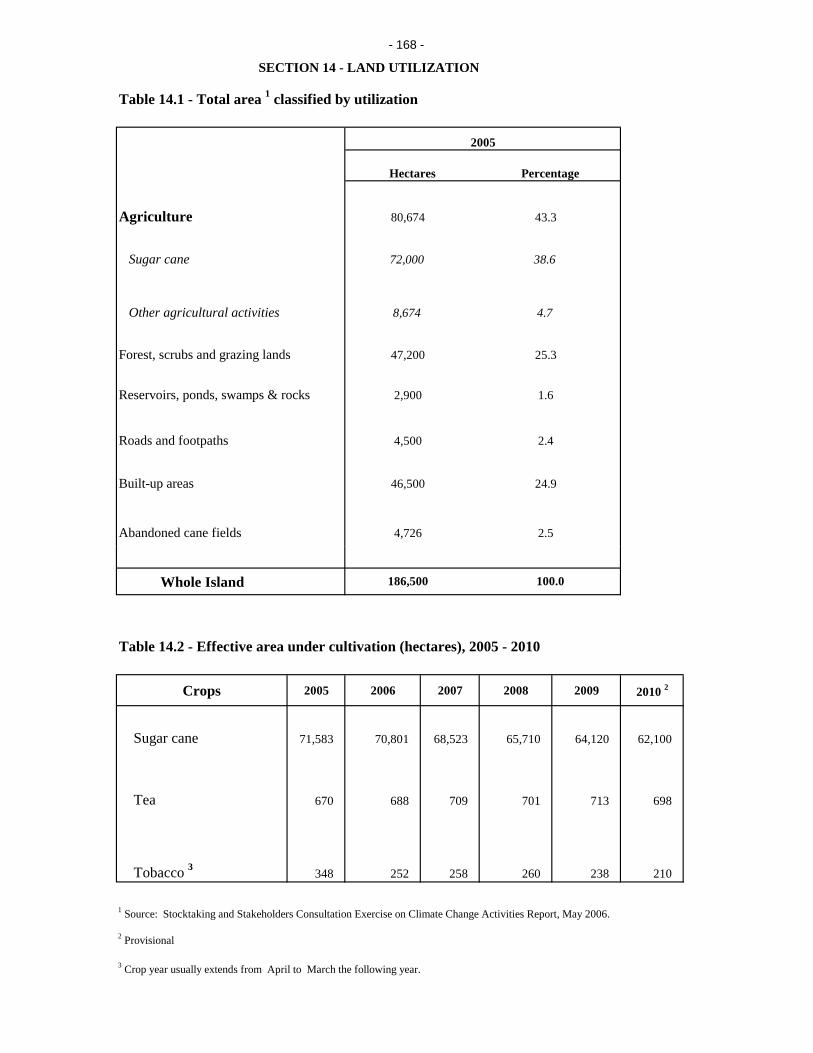
- 168 -
Table 14.1 - Total area 1 classified by utilization
Agriculture
Sugar cane
Other agricultural activities
Forest, scrubs and grazing lands
Reservoirs, ponds, swamps & rocks
Roads and footpaths
Built-up areas
Abandoned cane fields
SECTION 14 - LAND UTILIZATION
8,674
47,200
2,900
80,674
4,500
46,500 24.9
2.4
4.7
25.3
4,726 2.5
72,000
2005
43.3
38.6
Hectares Percentage
1.6
Whole Island
Table 14.2 - Effective area under cultivation (hectares), 2005 - 2010
Crops 2005 2006 2007 2008 2009 2010 2
Sugar cane 71,583 70,801 68,523 65,710 64,120 62,100
Tea 670 688 709 701 713 698
Tobacco 3 348 252 258 260 238 210
1 Source: Stocktaking and Stakeholders Consultation Exercise on Climate Change Activities Report, May 2006.
2 Provisional
3 Crop year usually extends from April to March the following year.
100.0186,500
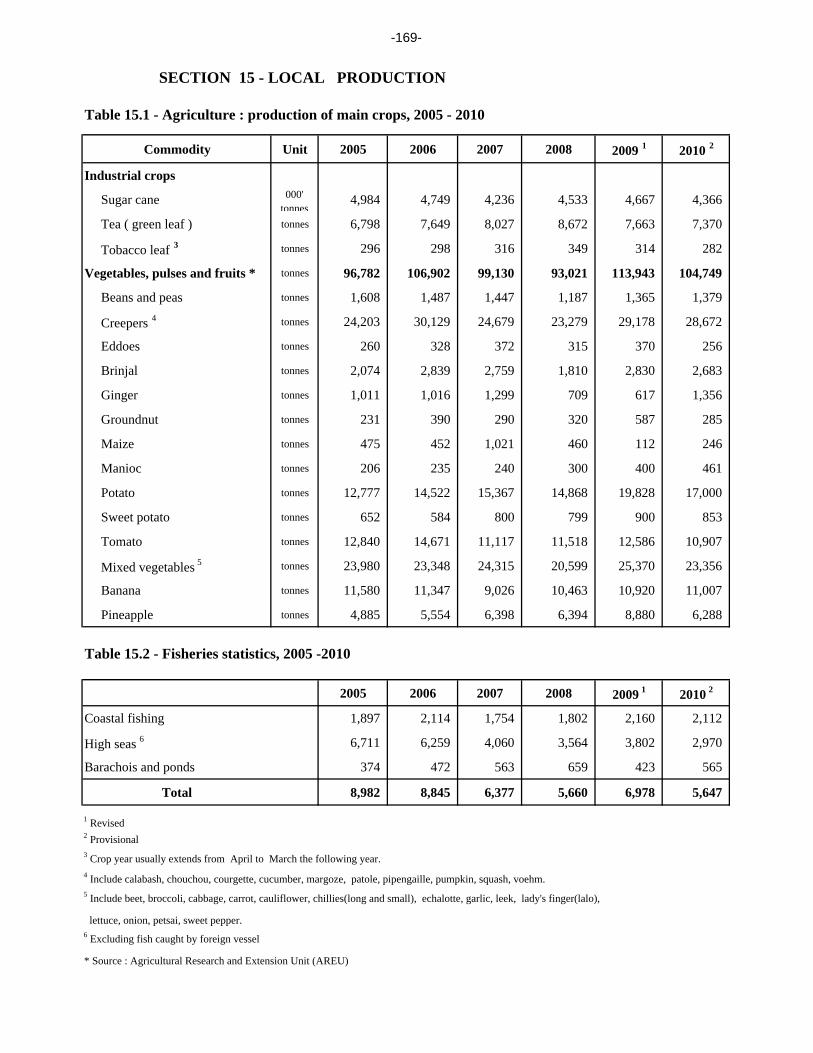
-169-
Table 15.1 - Agriculture : production of main crops, 2005 - 2010
Commodity Unit 2005 2006 2007 2008 2009 1 2010 2
Industrial crops
Sugar cane 000' tonnes
4,984 4,749 4,236 4,533 4,667 4,366
Tea ( green leaf ) tonnes 6,798 7,649 8,027 8,672 7,663 7,370
Tobacco leaf 3 tonnes 296 298 316 349 314 282
Vegetables, pulses and fruits * tonnes 96,782 106,902 99,130 93,021 113,943 104,749
Beans and peas tonnes 1,608 1,487 1,447 1,187 1,365 1,379
Creepers 4 tonnes 24,203 30,129 24,679 23,279 29,178 28,672
Eddoes tonnes 260 328 372 315 370 256
Brinjal tonnes 2,074 2,839 2,759 1,810 2,830 2,683
Ginger tonnes 1,011 1,016 1,299 709 617 1,356
Groundnut tonnes 231 390 290 320 587 285
Maize tonnes 475 452 1,021 460 112 246
Manioc tonnes 206 235 240 300 400 461
Potato tonnes 12,777 14,522 15,367 14,868 19,828 17,000
Sweet potato tonnes 652 584 800 799 900 853
Tomato tonnes 12,840 14,671 11,117 11,518 12,586 10,907
Mixed vegetables 5 tonnes 23,980 23,348 24,315 20,599 25,370 23,356
Banana tonnes 11,580 11,347 9,026 10,463 10,920 11,007
Pineapple tonnes 4,885 5,554 6,398 6,394 8,880 6,288
Table 15.2 - Fisheries statistics, 2005 -2010
2005 2006 2007 2008 2009 1 2010 2
Coastal fishing 1,897 2,114 1,754 1,802 2,160 2,112
High seas 6 6,711 6,259 4,060 3,564 3,802 2,970
Barachois and ponds 374 472 563 659 423 565
Total 8,982 8,845 6,377 5,660 6,978 5,647
1 Revised2 Provisional3 Crop year usually extends from April to March the following year.4 Include calabash, chouchou, courgette, cucumber, margoze, patole, pipengaille, pumpkin, squash, voehm.5 Include beet, broccoli, cabbage, carrot, cauliflower, chillies(long and small), echalotte, garlic, leek, lady's finger(lalo),
lettuce, onion, petsai, sweet pepper.6 Excluding fish caught by foreign vessel
* Source : Agricultural Research and Extension Unit (AREU)
SECTION 15 - LOCAL PRODUCTION
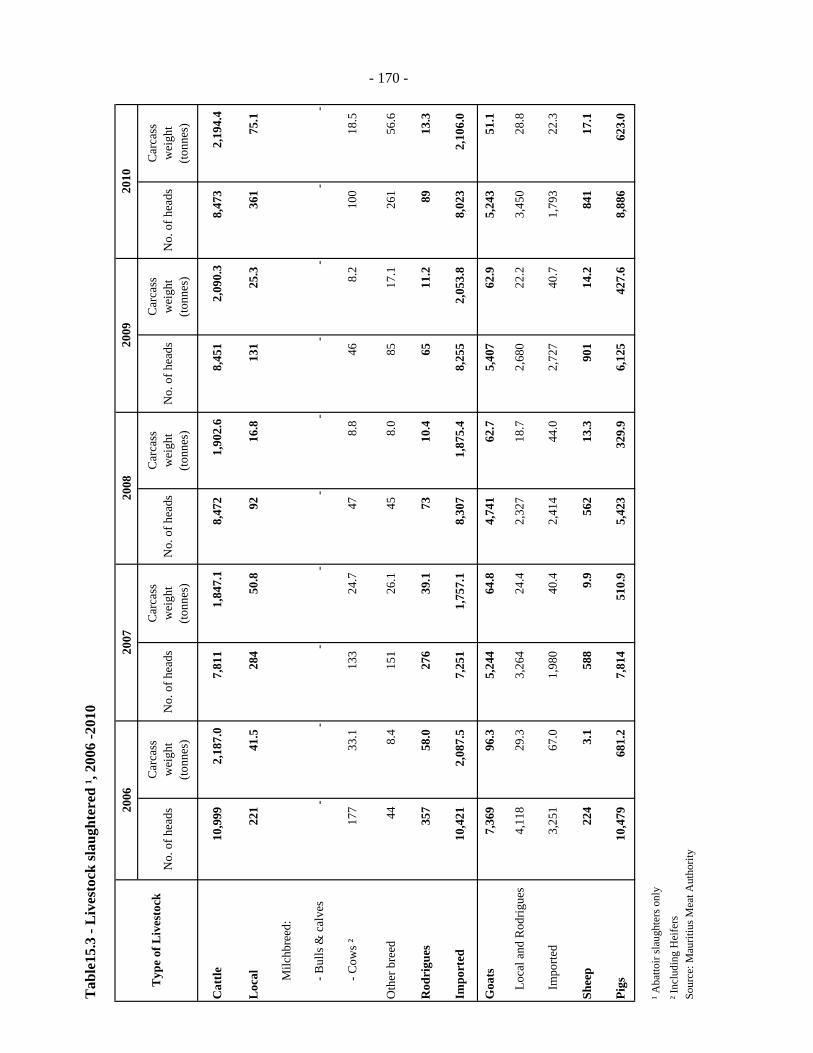
Tab
le15
.3 -
Liv
esto
ck sl
augh
tere
d ¹,
2006
-201
0
2006
2007
2008
No.
of h
eads
Car
cass
w
eigh
t (to
nnes
)N
o. o
f hea
dsC
arca
ss
wei
ght
(tonn
es)
No.
of h
eads
Car
cass
w
eigh
t (to
nnes
)N
o. o
f hea
dsC
arca
ss
wei
ght
(tonn
es)
No.
of h
eads
Car
cass
w
eigh
t (to
nnes
)
Cat
tle10
,999
2,
187.
07,
811
1,
847.
18,
472
1,
902.
68,
451
2,
090.
38,
473
2,
194.
4
Loc
al22
1
41.5
28
4
50.8
92
16
.8
131
25
.3
361
75
.1
Milc
hbre
ed:
- Bul
ls &
cal
ves
--
--
--
--
--
- Cow
s ²17
7
33.1
13
3
24.7
47
8.
8
46
8.2
10
0
18.5
Oth
er b
reed
44
8.4
15
1
26.1
45
8.
0
85
17.1
26
1
56.6
Rod
rigu
es35
7
58.0
27
6
39.1
73
10
.4
65
11.2
89
13
.3
Impo
rted
10,4
21
2,08
7.5
7,
251
1,
757.
1
8,30
7
1,87
5.4
8,
255
2,
053.
8
8,02
3
2,10
6.0
Goa
ts7,
369
96
.3
5,24
4
64.8
4,
741
62
.7
5,40
7
62.9
5,
243
51
.1
Lo
cal a
nd R
odrig
ues
4,11
8
29.3
3,
264
24
.4
2,32
7
18.7
2,
680
22
.2
3,45
0
28.8
Im
porte
d3,
251
67
.0
1,98
0
40.4
2,
414
44
.0
2,72
7
40.7
1,
793
22
.3
Shee
p22
4
3.1
58
8
9.9
56
2
13.3
90
1
14.2
84
1
17.1
Pigs
10,4
79
681.
2
7,81
4
510.
9
5,42
3
329.
9
6,12
5
427.
6
8,88
6
623.
0
¹ Aba
ttoir
slau
ghte
rs o
nly
² Inc
ludi
ng H
eife
rsSo
urce
: Mau
ritiu
s Mea
t Aut
horit
y
Typ
e of
Liv
esto
ck
- 170 -
2009
2010
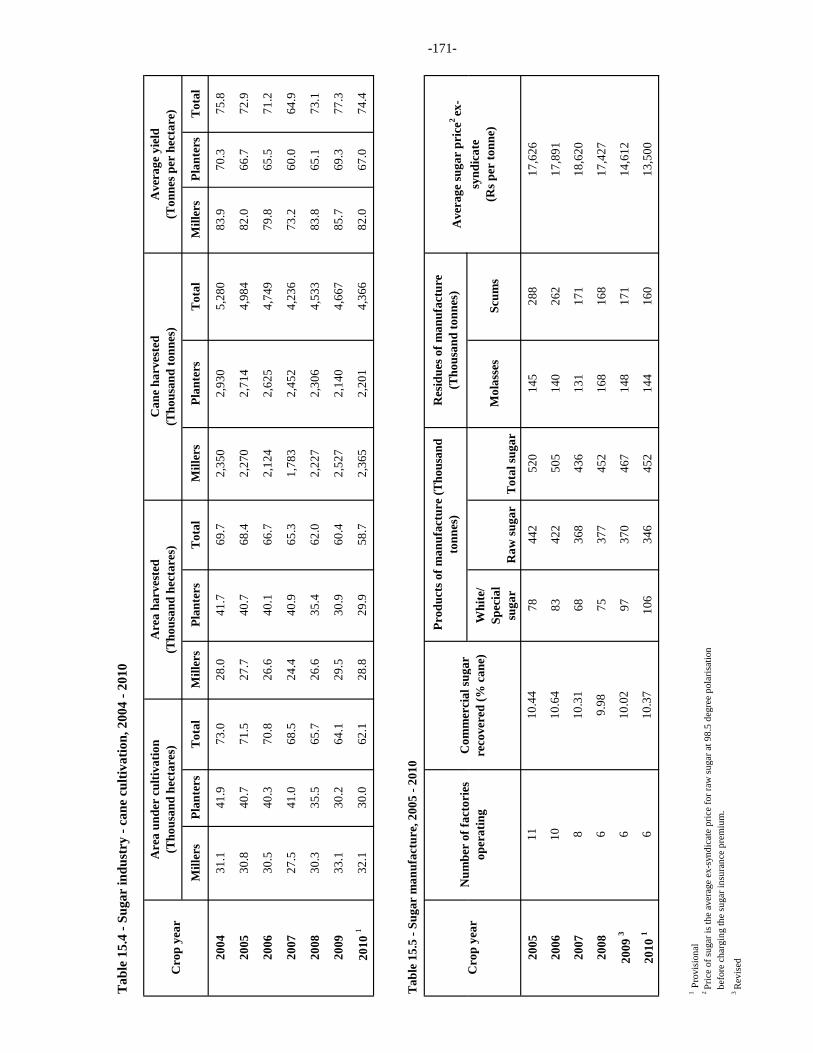
Tab
le 1
5.4
- Sug
ar in
dust
ry -
cane
cul
tivat
ion,
200
4 - 2
010
Mill
ers
Plan
ters
Tot
alM
iller
sPl
ante
rsT
otal
Mill
ers
Plan
ters
Tot
alM
iller
sPl
ante
rsT
otal
2004
31.1
41.9
73.0
28.0
41.7
69.7
2,35
02,
930
5,28
083
.970
.375
.8
2005
30.8
40.7
71.5
27.7
40.7
68.4
2,27
02,
714
4,98
482
.066
.772
.9
2006
30.5
40.3
70.8
26.6
40.1
66.7
2,12
42,
625
4,74
979
.865
.571
.2
2007
27.5
41.0
68.5
24.4
40.9
65.3
1,78
32,
452
4,23
673
.260
.064
.9
2008
30.3
35.5
65.7
26.6
35.4
62.0
2,22
72,
306
4,53
383
.865
.173
.1
2009
33.1
30.2
64.1
29.5
30.9
60.4
2,52
72,
140
4,66
785
.769
.377
.3
201
0 1
32.1
30.0
62.1
28.8
29.9
58.7
2,36
52,
201
4,36
682
.067
.074
.4
Tab
le 1
5.5
- Sug
ar m
anuf
actu
re, 2
005
- 201
0
Ave
rage
yie
ld
(T
onne
s per
hec
tare
)
Res
idue
s of m
anuf
actu
re
(Tho
usan
d to
nnes
)Pr
oduc
ts o
f man
ufac
ture
(Tho
usan
d to
nnes
)
Are
a ha
rves
ted
(T
hous
and
hect
ares
)
Ave
rage
suga
r pr
ice2
ex-
Can
e ha
rves
ted
(T
hous
and
tonn
es)
Cro
p ye
ar
Are
a un
der
culti
vatio
n
(Tho
usan
d he
ctar
es)
CN
umbe
r of
fact
orie
s C
omm
erci
al su
gar
-171-
Whi
te/
Spec
ial
suga
rR
aw su
gar
Tot
al su
gar
Mol
asse
sSc
ums
2005
7844
252
014
528
817
,626
2006
8342
250
514
026
217
,891
2007
6836
843
613
117
118
,620
2008
7537
745
216
816
817
,427
2009
397
370
467
148
171
14,6
12
2010
110
634
645
214
416
013
,500
1 Pr
ovis
iona
l2
Pric
e of
suga
r is t
he a
vera
ge e
x-sy
ndic
ate
pric
e fo
r raw
suga
r at 9
8.5
degr
ee p
olar
isat
ion
bef
ore
char
ging
the
suga
r ins
uran
ce p
rem
ium
.3
Rev
ised
synd
icat
e
(Rs p
er to
nne)
Cro
p ye
arN
ube
oac
toes
oper
atin
gC
oe
ca
suga
reco
vere
d (%
can
e)
8
10.4
411
10.3
76
10.3
1
9.98
6
10.6
410 6
10.0
2
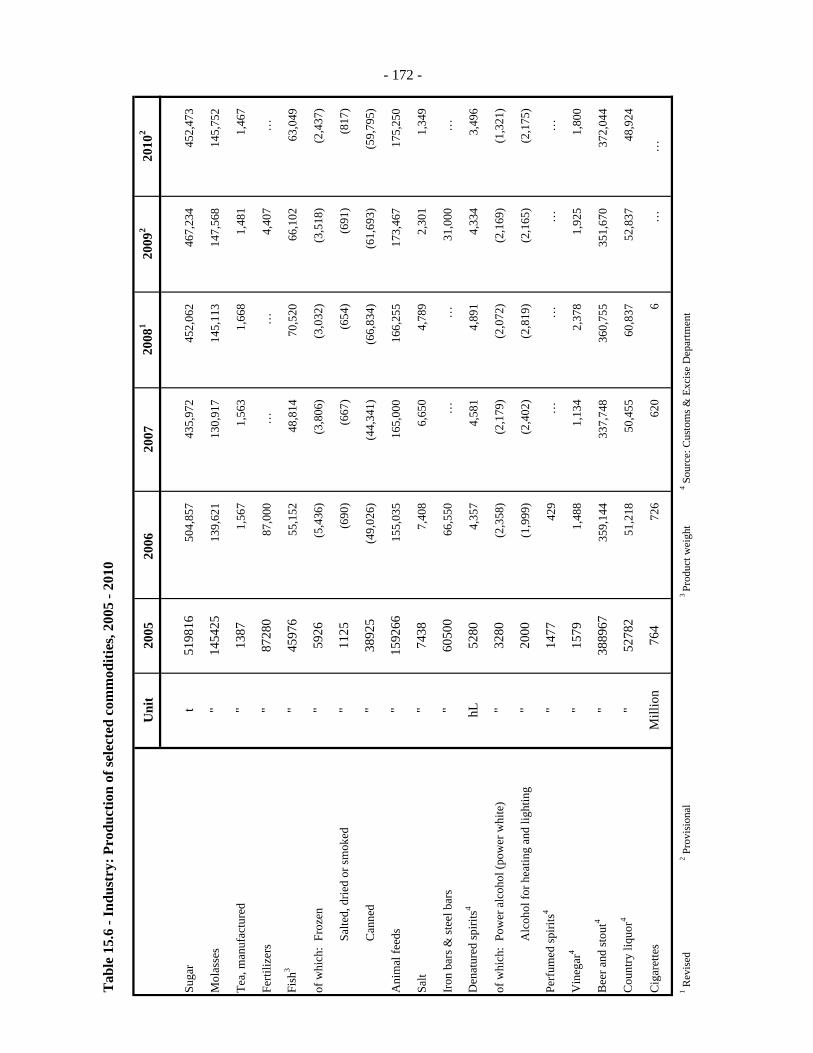
Tab
le 1
5.6
- Ind
ustr
y: P
rodu
ctio
n of
sele
cted
com
mod
ities
, 200
5 - 2
010
Uni
t20
0520
06
2007
2008
120
092
2010
2
Suga
rt
5198
1650
4,85
7
435,
972
45
2,06
2
467,
234
45
2,47
3
Mol
asse
s"
1454
2513
9,62
1
130,
917
14
5,11
3
147,
568
14
5,75
2
Tea,
man
ufac
ture
d"
1387
1,56
7
1,56
3
1,66
8
1,48
1
1,46
7
Ferti
lizer
s"
8728
087
,000
…
…4,
407
…
Fish
3"
4597
655
,152
48
,814
70
,520
66
,102
63
,049
of w
hich
:Fr
ozen
"59
26(5
,436
)
(3,8
06)
(3
,032
)
(3,5
18)
(2
,437
)
Salte
d, d
ried
or sm
oked
"11
25(6
90)
(6
67)
(6
54)
(6
91)
(8
17)
Can
ned
"38
925
(49,
026)
(4
4,34
1)
(66,
834)
(6
1,69
3)
(59,
795)
Ani
mal
feed
s"
1592
6615
5,03
5
165,
000
16
6,25
5
173,
467
17
5,25
0
Salt
"74
387,
408
6,
650
4,
789
2,
301
1,
349
Iron
bar
s & st
eel b
ars
"60
500
66,5
50
…
…
31,0
00
…
Den
atur
ed sp
irits
4hL
5280
4,35
7
4,58
1
4,89
1
4,33
4
3,49
6
of w
hich
:Po
wer
alc
ohol
(pow
er w
hite
)"
3280
(2,3
58)
(2
,179
)
(2,0
72)
(2
,169
)
(1,3
21)
Alc
ohol
for h
eatin
g an
d lig
htin
g"
2000
(1,9
99)
(2
,402
)
(2,8
19)
(2
,165
)
(2,1
75)
Perf
umed
spiri
ts4
"14
7742
9
…
…
…
…
Vin
egar
4"
1579
1,48
8
1,13
4
2,37
8
1,92
5
1,80
0
Bee
r and
stou
t4"
3889
6735
9,14
4
337,
748
36
0,75
5
351,
670
37
2,04
4
Cou
ntry
liqu
or4
"52
782
51,2
18
50,4
55
60,8
37
52,8
37
48,9
24
Cig
aret
tes
Mill
ion
764
726
62
0
6
…
…
1 Rev
ised
2 P
rovi
sion
al3
Prod
uct w
eigh
t4 S
ourc
e: C
usto
ms &
Exc
ise
Dep
artm
ent
- 172 -
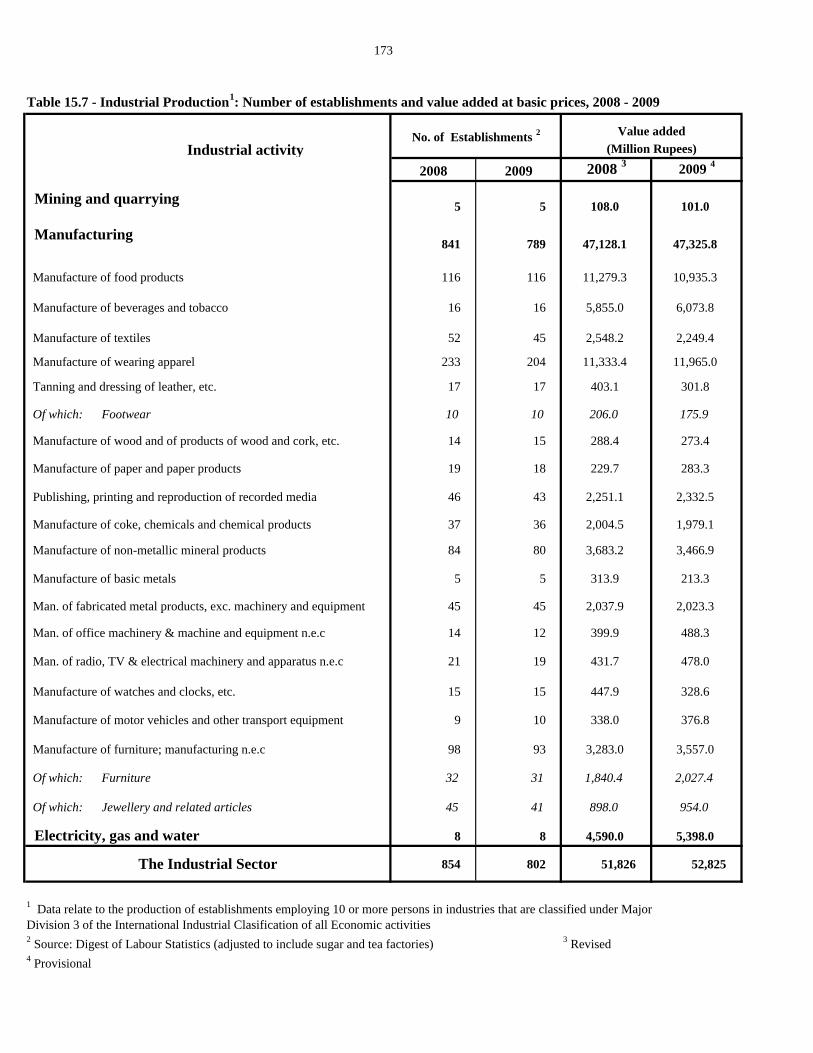
Table 15.7 - Industrial Production1: Number of establishments and value added at basic prices, 2008 - 2009
Industrial activity2008 2009 2008 3 2009 4
Mining and quarrying 5 5 108.0 101.0
Manufacturing841 789 47,128.1 47,325.8
Manufacture of food products 116 116 11,279.3 10,935.3
Manufacture of beverages and tobacco 16 16 5,855.0 6,073.8
Manufacture of textiles 52 45 2,548.2 2,249.4
Manufacture of wearing apparel 233 204 11,333.4 11,965.0
Tanning and dressing of leather, etc. 17 17 403.1 301.8
Of which: Footwear 10 10 206.0 175.9
Manufacture of wood and of products of wood and cork, etc. 14 15 288.4 273.4
Manufacture of paper and paper products 19 18 229.7 283.3
Publishing, printing and reproduction of recorded media 46 43 2,251.1 2,332.5
Manufacture of coke, chemicals and chemical products 37 36 2,004.5 1,979.1
Manufacture of non-metallic mineral products 84 80 3,683.2 3,466.9
Manufacture of basic metals 5 5 313.9 213.3
Man. of fabricated metal products, exc. machinery and equipment 45 45 2,037.9 2,023.3
Man. of office machinery & machine and equipment n.e.c 14 12 399.9 488.3
Man. of radio, TV & electrical machinery and apparatus n.e.c 21 19 431.7 478.0
Manufacture of watches and clocks, etc. 15 15 447.9 328.6
Manufacture of motor vehicles and other transport equipment 9 10 338.0 376.8
Manufacture of furniture; manufacturing n.e.c 98 93 3,283.0 3,557.0
Of which: Furniture 32 31 1,840.4 2,027.4
Of which: Jewellery and related articles 45 41 898.0 954.0
Electricity, gas and water 8 8 4,590.0 5,398.0
854 802 51,826 52,825
1 Data relate to the production of establishments employing 10 or more persons in industries that are classified under Major Division 3 of the International Industrial Clasification of all Economic activities2 Source: Digest of Labour Statistics (adjusted to include sugar and tea factories) 3 Revised4 Provisional
No. of Establishments 2 Value added(Million Rupees)
The Industrial Sector
173
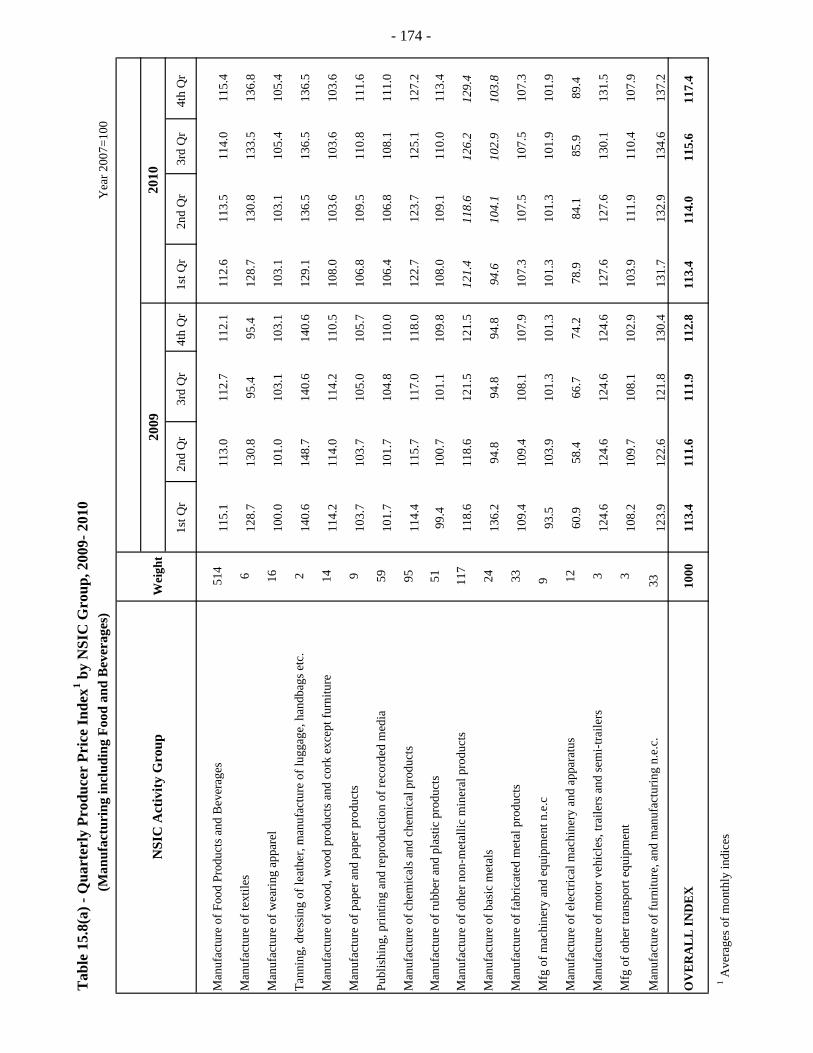
Tab
le 1
5.8(
a) -
Qua
rter
ly P
rodu
cer
Pric
e In
dex1 b
y N
SIC
Gro
up, 2
009-
201
0
(M
anuf
actu
ring
incl
udin
g Fo
od a
nd B
ever
ages
)Y
ear 2
007=
100
NSI
C A
ctiv
ity G
roup
Wei
ght
2009
1st Q
r 2n
d Q
r 3r
d Q
r 4t
h Q
r 1s
t Qr
2nd
Qr
3rd
Qr
4th
Qr
Man
ufac
ture
of F
ood
Prod
ucts
and
Bev
erag
es51
411
5.1
113.
0 11
2.7
112.
1 11
2.6
113.
511
4.0
115.
4
Man
ufac
ture
of t
extil
es6
128.
7 13
0.8
95.4
95
.4
128.
713
0.8
133.
513
6.8
Man
ufac
ture
of w
earin
g ap
pare
l16
100.
0 10
1.0
103.
1 10
3.1
103.
110
3.1
105.
410
5.4
Tann
ing,
dre
ssin
g of
leat
her,
man
ufac
ture
of l
ugga
ge, h
andb
ags e
tc.
214
0.6
148.
7 14
0.6
140.
6 12
9.1
136.
513
6.5
136.
5
Man
ufac
ture
of w
ood,
woo
d pr
oduc
ts a
nd c
ork
exce
pt fu
rnitu
re14
114.
2 11
4.0
114.
2 11
0.5
108.
010
3.6
103.
610
3.6
Man
ufac
ture
of p
aper
and
pap
er p
rodu
cts
910
3.7
103.
7 10
5.0
105.
7 10
6.8
109.
511
0.8
111.
6
Publ
ishi
ng, p
rintin
g an
d re
prod
uctio
n of
reco
rded
med
ia59
101.
7 10
1.7
104.
8 11
0.0
106.
410
6.8
108.
111
1.0
Man
ufac
ture
of c
hem
ical
s and
che
mic
al p
rodu
cts
9511
4.4
115.
7 11
7.0
118.
0 12
2.7
123.
712
5.1
127.
2
Man
ufac
ture
of r
ubbe
r and
pla
stic
pro
duct
s51
99.4
10
0.7
101.
1 10
9.8
108.
010
9.1
110.
011
3.4
Man
ufac
ture
of o
ther
non
-met
allic
min
eral
pro
duct
s11
711
8.6
118.
6 12
1.5
121.
5 12
1.4
118.
612
6.2
129.
4
Man
ufac
ture
of b
asic
met
als
2413
6.2
94.8
94
.8
94.8
94
.610
4.1
102.
910
3.8
Man
ufac
ture
of f
abric
ated
met
al p
rodu
cts
3310
9.4
109.
4 10
8.1
107.
9 10
7.3
107.
510
7.5
107.
3
Mfg
of m
achi
nery
and
equ
ipm
ent n
.e.c
9
93.5
10
3.9
101.
3 10
1.3
101.
310
1.3
101.
910
1.9
Man
ufac
ture
of e
lect
rical
mac
hine
ry a
nd a
ppar
atus
1260
.9
58.4
66
.7
74.2
78
.984
.185
.989
.4
Man
ufac
ture
of m
otor
veh
icle
s, tra
ilers
and
sem
i-tra
ilers
312
4.6
124.
6 12
4.6
124.
6 12
7.6
127.
613
0.1
131.
5
Mfg
of o
ther
tran
spor
t equ
ipm
ent
310
8.2
109.
7 10
8.1
102.
9 10
3.9
111.
911
0.4
107.
9
Man
ufac
ture
of f
urni
ture
, and
man
ufac
turin
g n.
e.c.
33
123.
9 12
2.6
121.
8 13
0.4
131.
713
2.9
134.
613
7.2
OV
ER
AL
L IN
DE
X10
0011
3.4
111.
6 11
1.9
112.
8 11
3.4
114.
0 11
5.6
117.
4
1 Ave
rage
s of m
onth
ly in
dice
s
- 174 -
2010

Tab
le 1
5.8(
b) -
Qua
rter
ly P
rodu
cer
Pric
e In
dex1 b
y N
SIC
Gro
up, 2
009-
201
0
(Fo
od a
nd B
ever
ages
)Y
ear 2
007=
100
NSI
C A
ctiv
ity G
roup
Wei
ght
2009
1st Q
r 2n
d Q
r 3r
d Q
r 4t
h Q
r 1s
t Qr
2nd
Qr
3rd
Qr
4th
Qr
Man
ufac
ture
of f
ood
prod
ucts
360
116.
1 11
2.4
112.
1 11
1.1
111.
011
2.2
112.
911
3.2
Pro
duct
ion,
pro
cess
ing
and
pres
erva
tion
of m
eat a
nd m
eat
prod
ucts
122
107.
0 10
3.0
104.
6 10
4.7
105.
010
5.6
107.
910
7.9
Pro
cess
ing
and
pres
erva
tion
of fi
sh a
nd fi
sh p
rodu
cts
712
6.3
126.
3 12
6.8
130.
3 13
0.3
137.
015
0.2
145.
5P
roce
ssin
g an
d pr
eser
ving
of f
ruits
and
veg
etab
les
710
8.9
115.
1 11
5.1
115.
6 11
6.1
118.
411
8.9
118.
9M
anuf
actu
re o
f veg
etab
le a
nd a
nim
al o
ils a
nd fa
ts36
126.
9 12
1.6
116.
9 11
5.7
112.
811
2.0
111.
811
7.3
Man
ufac
ture
of d
airy
pro
duct
s20
109.
4 10
9.4
109.
4 10
9.4
108.
811
2.5
113.
111
3.1
Man
ufac
ture
of g
rain
mill
pro
duct
s61
119.
4 10
7.9
104.
4 98
.7
99.1
103.
198
.997
.3M
anuf
actu
re o
f pre
pare
d an
imal
feed
s59
130.
0 13
0.0
130.
0 13
0.0
130.
013
0.0
130.
013
0.0
Man
ufac
ture
of b
aker
y pr
oduc
ts27
110.
4
110.
4 11
2.3
112.
2 11
1.1
111.
511
1.8
111.
8B
read
man
ufac
turin
g (w
ith o
r with
out p
astry
)21
110.
5 11
0.5
112.
7 11
2.7
112.
711
2.7
112.
711
2.5
Bis
cuits
man
ufac
turin
g6
110.
0 11
0.0
110.
7 11
0.6
105.
310
7.1
108.
810
9.1
Man
ufac
ture
of m
acar
oni,
nood
les
and
sim
ilar f
arin
aceo
us
prod
ucts
1011
7.6
117.
6 11
7.6
117.
6 11
7.6
117.
612
7.5
132.
4M
anuf
actu
re o
f oth
er fo
od p
rodu
cts
1111
3.7
113.
5 11
3.3
113.
7 11
7.3
116.
911
8.8
119.
4Te
a7
115.
6 11
5.2
115.
0 11
5.7
119.
611
9.4
119.
011
9.9
Spi
ces
and
Pea
nut b
utte
r2
120.
7 12
0.7
120.
7 12
0.7
126.
412
9.4
141.
214
1.2
Man
ufac
ture
of b
ever
ages
154
112.
5 11
4.3
114.
4 11
4.5
116.
2 11
6.5
116.
6 12
0.5
Dis
tillin
g, b
lend
ing
& b
ottli
ng o
f spi
rit53
107.
7 11
2.5
112.
5 11
2.5
112.
511
2.5
112.
511
8.4
Win
e9
118.
9 12
1.3
121.
8 12
2.1
124.
112
8.2
128.
413
4.0
Bee
r71
113.
7 11
3.7
113.
7 11
3.7
115.
211
5.2
115.
411
8.7
Sof
t drin
ks21
117.
8 11
8.1
118.
2 11
9.2
125.
812
5.8
125.
812
6.0
Man
ufac
ture
of F
ood
and
Bev
erag
es51
4
115.
1 11
3.0
112.
7 11
2.1
112.
6 11
3.5
114.
0 11
5.4
1 Ave
rage
s of m
onth
ly in
dice
s
- 175 -
2010
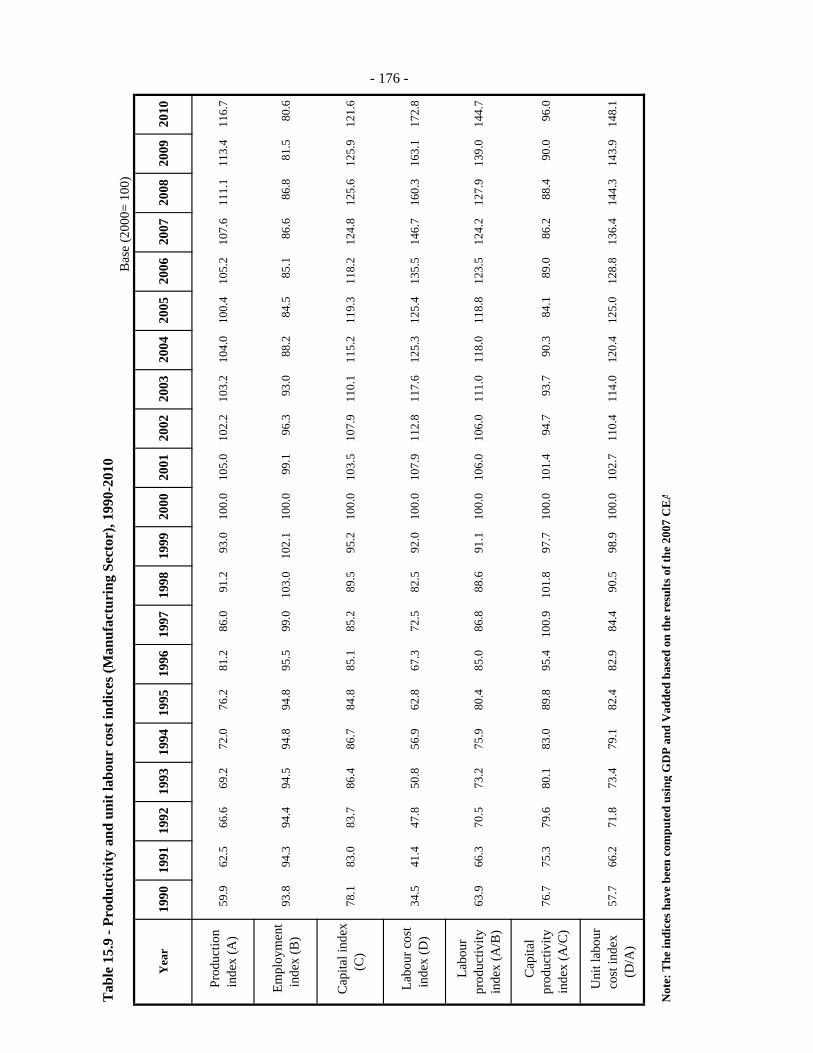
Tab
le 1
5.9
- Pro
duct
ivity
and
uni
t lab
our
cost
indi
ces (
Man
ufac
turi
ng S
ecto
r), 1
990-
2010
Bas
e (2
000=
100
)
Yea
r19
9019
9119
9219
9319
9419
9519
9619
9719
9819
9920
0020
0120
0220
0320
0420
0520
0620
0720
0820
0920
10
Pro
duct
ion
inde
x (A
)59
.9
62.5
66
.6
69.2
72
.0
76.2
81
.2
86.0
91
.2
93.0
10
0.0
105.
0 10
2.2
103.
2 10
4.0
100.
4 10
5.2
107.
6 11
1.1
113.
4 11
6.7
Em
ploy
men
t in
dex
(B)
93.8
94
.3
94.4
94
.5
94.8
94
.8
95.5
99
.0
103.
0 10
2.1
100.
0 99
.1
96.3
93
.0
88.2
84
.5
85.1
86
.6
86.8
81
.5
80.6
Cap
ital i
ndex
(C
)78
.1
83.0
83
.7
86.4
86
.7
84.8
85
.1
85.2
89
.5
95.2
10
0.0
103.
5 10
7.9
110.
1 11
5.2
119.
3 11
8.2
124.
8 12
5.6
125.
9 12
1.6
Lab
our c
ost
inde
x (D
)34
.5
41.4
47
.8
50.8
56
.9
62.8
67
.3
72.5
82
.5
92.0
10
0.0
107.
9 11
2.8
117.
6 12
5.3
125.
4 13
5.5
146.
7 16
0.3
163.
1 17
2.8
Lab
our
prod
uctiv
ity
inde
x (A
/B)
63.9
66
.3
70.5
73
.2
75.9
80
.4
85.0
86
.8
88.6
91
.1
100.
0 10
6.0
106.
0 11
1.0
118.
0 11
8.8
123.
5 12
4.2
127.
9 13
9.0
144.
7
Cap
ital
prod
uctiv
ity
inde
x (A
/C)
76.7
75
.3
79.6
80
.1
83.0
89
.8
95.4
10
0.9
101.
8 97
.7
100.
0 10
1.4
94.7
93
.7
90.3
84
.1
89.0
86
.2
88.4
90
.0
96.0
Uni
t lab
our
cost
inde
x (D
/A)
57.7
66
.2
71.8
73
.4
79.1
82
.4
82.9
84
.4
90.5
98
.9
100.
0 10
2.7
110.
4 11
4.0
120.
4 12
5.0
128.
8 13
6.4
144.
3 14
3.9
148.
1
Not
e: T
he in
dice
s hav
e be
en c
ompu
ted
usin
g G
DP
and
Vad
ded
base
d on
the
resu
lts o
f the
200
7 C
EA
- 176 -
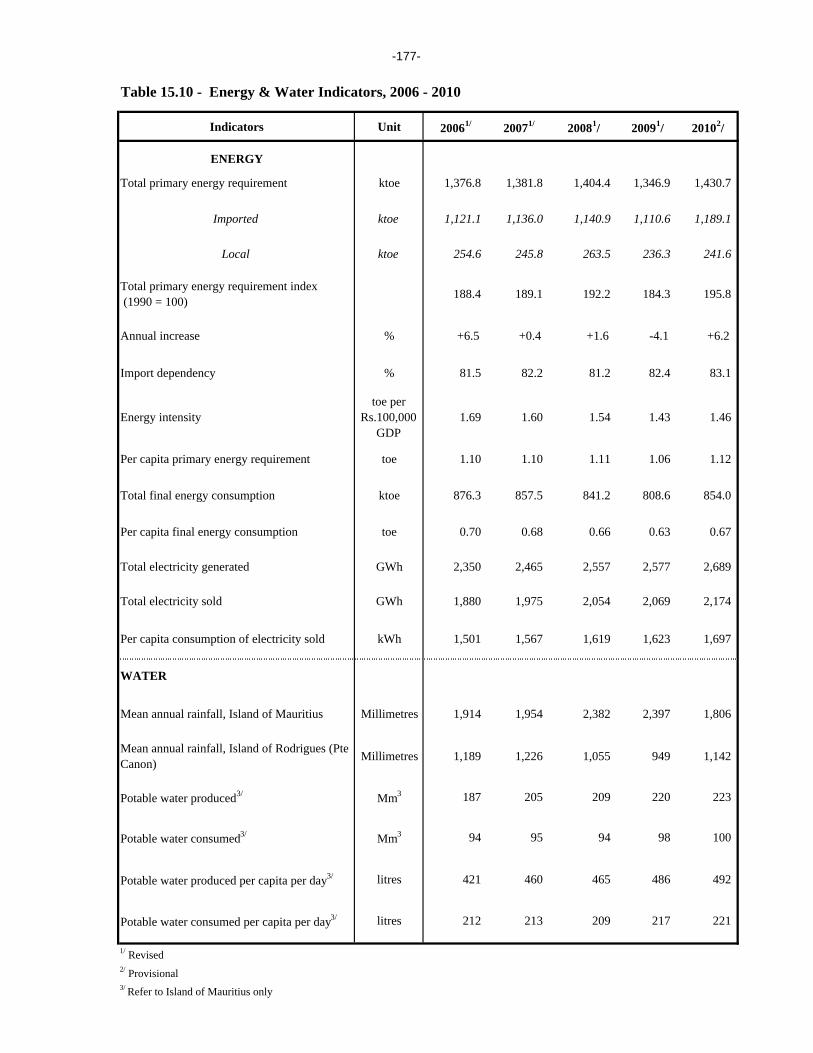
-177-
Table 15.10 - Energy & Water Indicators, 2006 - 2010
Indicators Unit 20061/ 20071/ 20081/ 20091/ 20102/
ENERGY
Total primary energy requirement ktoe 1,376.8 1,381.8 1,404.4 1,346.9 1,430.7
Imported ktoe 1,121.1 1,136.0 1,140.9 1,110.6 1,189.1
Local ktoe 254.6 245.8 263.5 236.3 241.6
Total primary energy requirement index (1990 = 100) 188.4 189.1 192.2 184.3 195.8
Annual increase % +6.5 +0.4 +1.6 -4.1 +6.2
Import dependency % 81.5 82.2 81.2 82.4 83.1
Energy intensitytoe per
Rs.100,000 GDP
1.69 1.60 1.54 1.43 1.46
Per capita primary energy requirement toe 1.10 1.10 1.11 1.06 1.12
Total final energy consumption ktoe 876.3 857.5 841.2 808.6 854.0
Per capita final energy consumption toe 0.70 0.68 0.66 0.63 0.67
Total electricity generated GWh 2,350 2,465 2,557 2,577 2,689
Total electricity sold GWh 1,880 1,975 2,054 2,069 2,174
Per capita consumption of electricity sold kWh 1,501 1,567 1,619 1,623 1,697
WATER
Mean annual rainfall, Island of Mauritius Millimetres 1,914 1,954 2,382 2,397 1,806
Mean annual rainfall, Island of Rodrigues (Pte Canon) Millimetres 1,189 1,226 1,055 949 1,142
Potable water produced3/ Mm3 187 205 209 220 223
Potable water consumed3/ Mm3 94 95 94 98 100
Potable water produced per capita per day3/ litres 421 460 465 486 492
Potable water consumed per capita per day3/ litres 212 213 209 217 221
1/ Revised2/ Provisional3/ Refer to Island of Mauritius only
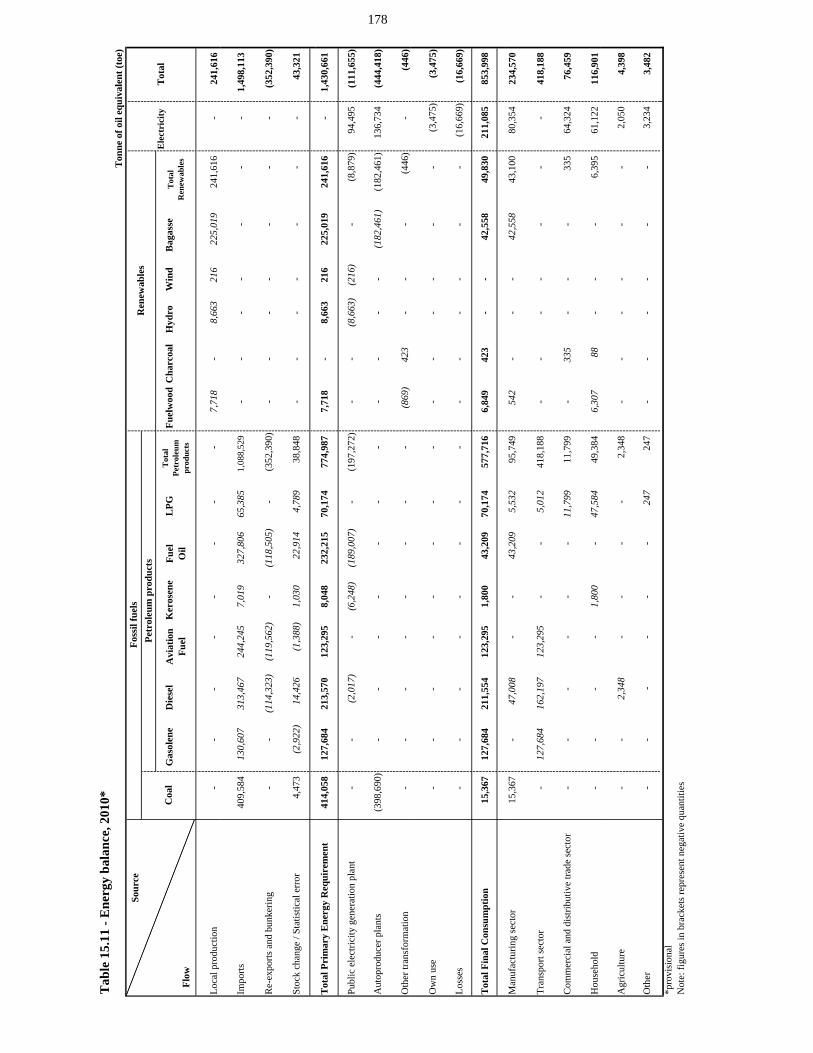
Tab
le 1
5.11
- E
nerg
y ba
lanc
e, 2
010*
Ton
ne o
f oil
equi
vale
nt (t
oe)
Sour
ce
Gas
olen
eD
iese
lK
eros
ene
LPG
Fuel
woo
dC
harc
oal
Hyd
roW
ind
Bag
asse
Flow
Loca
l pro
duct
ion
-
-
-
-
-
-
-
-
7,71
8
-
8,
663
216
225,
019
241,
616
-
241,
616
Foss
il fu
els
Ren
ewab
les
Ele
ctri
city
Tot
alC
oal
Petr
oleu
m p
rodu
cts
Avi
atio
nFu
elFu
elO
il
Tot
al
Petr
oleu
m
prod
ucts
Tot
al
Ren
ewab
les
Impo
rts40
9,58
4
130,
607
31
3,46
7
244,
245
7,01
9
327,
806
65,3
85
1,08
8,52
9
-
-
-
-
-
-
-
1,
498,
113
Re-
expo
rts a
nd b
unke
ring
-
-
(114
,323
)
(119
,562
)
-
(118
,505
)
-
(352
,390
)
-
-
-
-
-
-
-
(3
52,3
90)
Stoc
k ch
ange
/ St
atis
tical
err
or4,
473
(2
,922
)
14
,426
(1,3
88)
1,
030
22
,914
4,78
9
38
,848
-
-
-
-
-
-
-
43
,321
Tot
al P
rim
ary
Ene
rgy
Req
uire
men
t41
4,05
8
127,
684
21
3,57
0
12
3,29
5
8,
048
232,
215
70,1
74
774,
987
7,71
8
-
8,
663
216
225,
019
241,
616
-
1,43
0,66
1
Publ
ic e
lect
ricity
gen
erat
ion
plan
t-
-
(2
,017
)
-
(6,2
48)
(1
89,0
07)
-
(1
97,2
72)
-
-
(8,6
63)
(216
)
-
(8,8
79)
94
,495
(111
,655
)
Aut
opro
duce
r pla
nts
(398
,690
)
-
-
-
-
-
-
-
-
-
-
-
(182
,461
)
(1
82,4
61)
136,
734
(444
,418
)
Oth
er tr
ansf
orm
atio
n-
-
-
-
-
-
-
-
(8
69)
42
3
-
-
-
(4
46)
-
(4
46)
178
Ow
n us
e-
-
-
-
-
-
-
-
-
-
-
-
-
-
(3,4
75)
(3,4
75)
Loss
es-
-
-
-
-
-
-
-
-
-
-
-
-
-
(16,
669)
(16,
669)
Tot
al F
inal
Con
sum
ptio
n15
,367
127,
684
21
1,55
4
12
3,29
5
1,
800
43,2
09
70,1
74
577,
716
6,84
9
42
3
-
-
42,5
58
49,8
30
211,
085
853,
998
Man
ufac
turin
g se
ctor
15,3
67
-
47,0
08
-
-
43,2
09
5,
532
95,7
49
542
-
-
-
42,5
58
43,1
00
80,3
54
23
4,57
0
Tran
spor
t sec
tor
-
12
7,68
4
162,
197
12
3,29
5
-
-
5,01
2
41
8,18
8
-
-
-
-
-
-
-
41
8,18
8
Com
mer
cial
and
dis
tribu
tive
trade
sect
or-
-
-
-
-
-
11,7
99
11,7
99
-
335
-
-
-
335
64
,324
76,4
59
Hou
seho
ld-
-
-
-
1,
800
-
47,5
84
49,3
84
6,30
7
88
-
-
-
6,39
5
61
,122
116,
901
Agr
icul
ture
-
-
2,34
8
-
-
-
-
2,34
8
-
-
-
-
-
-
2,05
0
4,39
8
Oth
er-
-
-
-
-
-
24
7
247
-
-
-
-
-
-
3,23
4
3,48
2
*pro
visi
onal
Not
e: fi
gure
s in
brac
kets
repr
esen
t neg
ativ
e qu
antit
ies
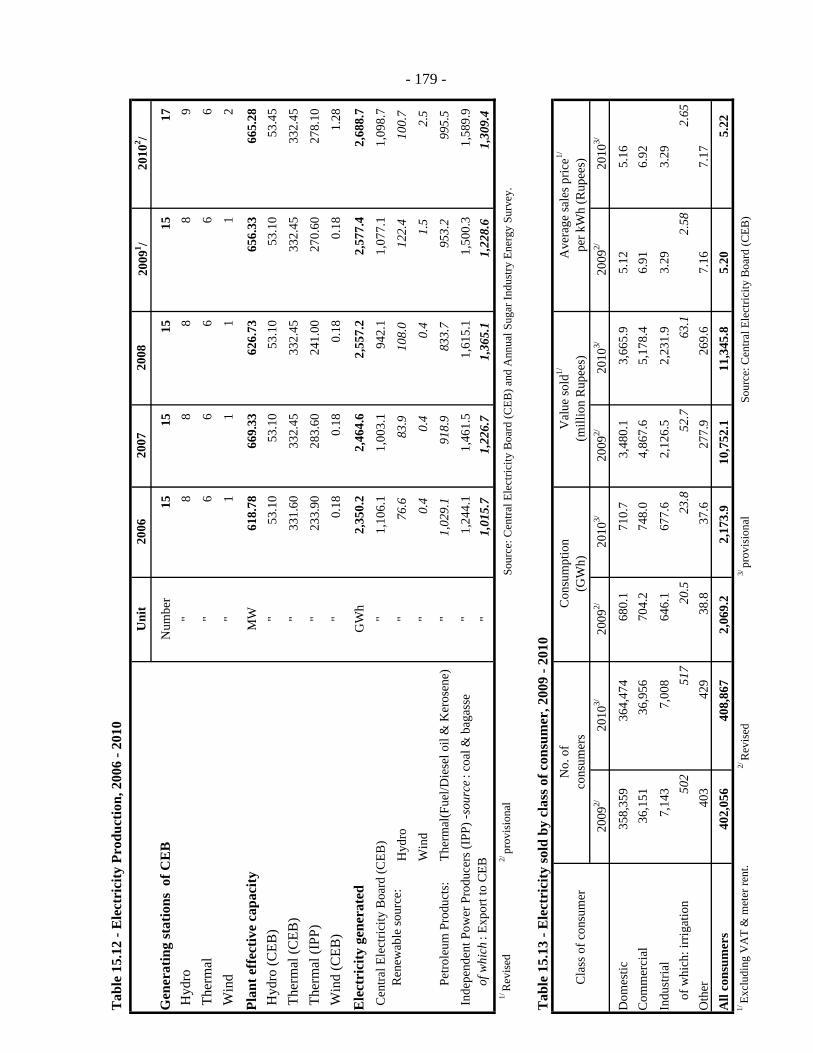
Tab
le 1
5.12
- E
lect
rici
ty P
rodu
ctio
n, 2
006
- 201
0
Uni
t20
0620
0720
0820
091 /
2010
2 /
Gen
erat
ing
stat
ions
of C
EB
Num
ber
15
15
15
15
17
Hyd
ro"
8
8
8
8
9
Ther
mal
"6
6
6
6
6
Win
d"
1
1
1
1
2
Plan
t eff
ectiv
e ca
paci
tyM
W61
8.78
66
9.33
62
6.73
65
6.33
66
5.28
H
ydro
(CEB
)"
53.1
0
53.1
0
53.1
0
53.1
0
53.4
5
Ther
mal
(CEB
)"
331.
60
332.
45
332.
45
332.
45
332.
45
Ther
mal
(IPP
)"
233.
90
283.
60
241.
00
270.
60
278.
10
Win
d (C
EB)
"0.
18
0.18
0.
18
0.18
1.
28
Ele
ctri
city
gen
erat
ed
GW
h2,
350.
2
2,46
4.6
2,
557.
2
2,57
7.4
2,
688.
7
Cen
tral E
lect
ricity
Boa
rd (C
EB)
"1,
106.
1
1,00
3.1
94
2.1
1,
077.
1
1,09
8.7
Hyd
ro"
76.6
83
.9
108.
0
122.
4
100.
7
Win
d "
0.4
0.
4
0.4
1.
5
2.5
P
etro
leum
Pro
duct
s:Th
erm
al(F
uel/D
iese
l oil
& K
eros
ene)
"1,
029.
1
918.
9
833.
7
953.
2
995.
5
Inde
pend
ent P
ower
Pro
duce
rs (I
PP) -
sour
ce: c
oal &
bag
asse
"1,
244.
1
1,46
1.5
1,
615.
1
1,50
0.3
1,
589.
9
o
f whi
ch: E
xpor
t to
CEB
"1,
015.
7
1,22
6.7
1,
365.
1
1,22
8.6
1,
309.
4
1/ R
evis
ed2/
prov
isio
nal
Sour
ce: C
entra
l Ele
ctric
ity B
oard
(CEB
) and
Ann
ual S
ugar
Indu
stry
Ene
rgy
Surv
ey.
Tab
le 1
5.13
- E
lect
rici
ty so
ld b
y cl
ass o
f con
sum
er, 2
009
- 201
0N
o. o
fC
onsu
mpt
ion
Ave
rage
sale
s pric
e1/
cons
umer
s(G
Wh)
per k
Wh
(Rup
ees)
2009
2/20
103/
2009
2/20
103/
2009
2/20
103/
2009
2/20
103/
Dom
estic
358,
359
364,
474
680.
1
710.
7
3,48
0.1
3,
665.
9
5.12
5.
16
Com
mer
cial
36,1
51
36
,956
704.
2
748.
0
4,86
7.6
5,
178.
4
6.91
6.
92
Indu
stria
l7,
143
7,00
8
64
6.1
67
7.6
2,
126.
5
2,23
1.9
3.
29
3.29
of
whi
ch: i
rrig
atio
n50
251
720
.523
.852
.763
.12.
582.
65O
ther
403
429
38.8
37.6
277.
9
269.
6
7.16
7.
17
All
cons
umer
s40
2,05
6
40
8,86
7
2,
069.
2
2,
173.
9
10
,752
.1
11
,345
.8
5.
20
5.22
1/ Ex
clud
ing
VA
T &
met
er re
nt.
2/ R
evis
ed3/
prov
isio
nal
Sour
ce: C
entra
l Ele
ctric
ity B
oard
(CEB
)
- 179 -
R
enew
able
sour
ce:
Cla
ss o
f con
sum
erV
alue
sold
1/
(mill
ion
Rup
ees)
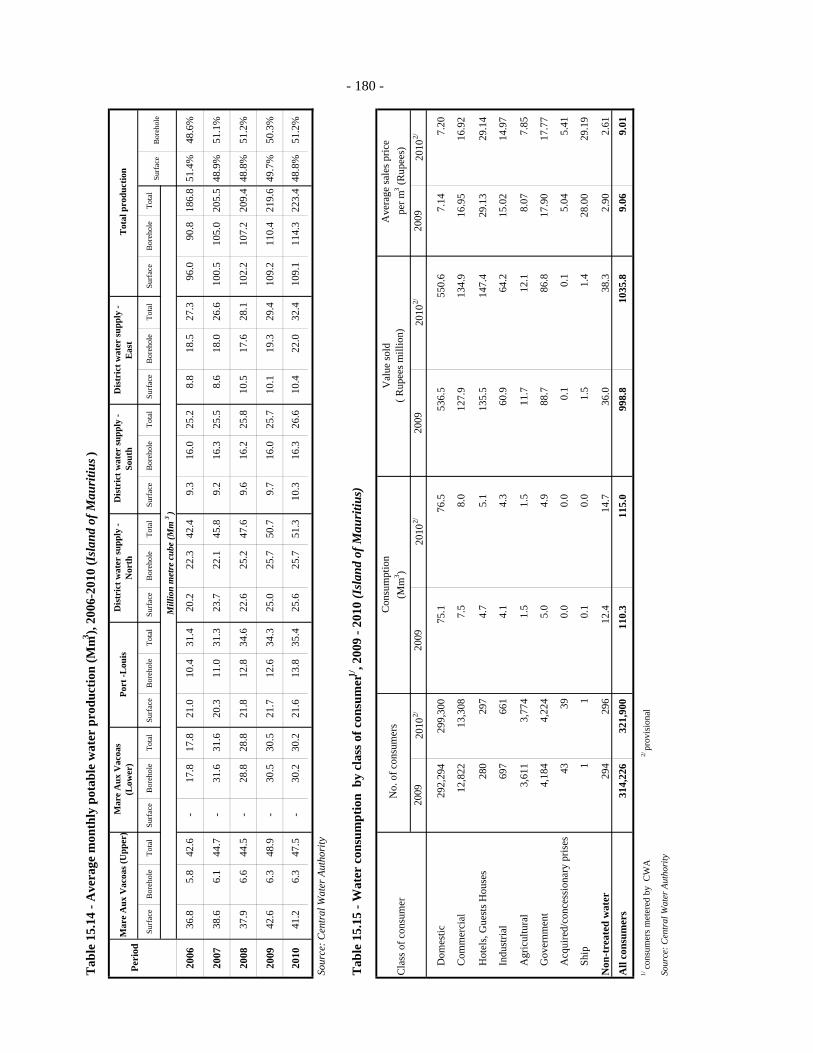
Tab
le 1
5.14
- A
vera
ge m
onth
ly p
otab
le w
ater
pro
duct
ion
(Mm3 ),
2006
-201
0 (I
slan
d of
Mau
ritiu
s)
Surf
ace
Bor
ehol
eTo
tal
Surf
ace
Bor
ehol
eTo
tal
Surf
ace
Bor
ehol
eTo
tal
Surf
ace
Bor
ehol
eTo
tal
Surf
ace
Bor
ehol
eTo
tal
Surf
ace
Bor
ehol
eTo
tal
Surf
ace
Bor
ehol
eTo
tal
2006
36.8
5.
8
42.6
-
17.8
17.8
21
.0
10.4
31.4
20
.2
22.3
42.4
9.
3
16
.0
25
.2
8.8
18.5
27.3
96
.0
90
.8
18
6.8
51.4
%48
.6%
2007
38.6
6.
1
44.7
-
31.6
31.6
20
.3
11.0
31.3
23
.7
22.1
45.8
9.
2
16
.3
25
.5
8.6
18.0
26.6
10
0.5
10
5.0
20
5.5
48.9
%51
.1%
2008
37.9
6.
6
44.5
-
28.8
28.8
21
.8
12.8
34.6
22
.6
25.2
47.6
9.
6
16
.2
25
.8
10.5
17
.6
28
.1
102.
2
107.
2
209.
448
.8%
51.2
%
2009
42.6
6.
3
48.9
-
30.5
30.5
21
.7
12.6
34.3
25
.0
25.7
50.7
9.
7
16
.0
25
.7
10.1
19
.3
29
.4
109.
2
110.
4
219.
649
.7%
50.3
%
2010
41.2
6.
3
47.5
-
30.2
30.2
21
.6
13.8
35.4
25
.6
25.7
51.3
10
.3
16.3
26.6
10
.4
22.0
32.4
10
9.1
11
4.3
22
3.4
48.8
%51
.2%
Sour
ce: C
entr
al W
ater
Aut
hori
ty
Tab
le 1
5.15
- W
ater
con
sum
ptio
n b
y cl
ass o
f con
sum
er1/
, 200
9 - 2
010
(Isl
and
of M
auri
tius)
Dom
estic
Com
mer
cial
Hot
els,
Gue
sts H
ouse
s
Indu
stria
l
Agr
icul
tura
l
Gov
ernm
ent
Acq
uire
d/co
nces
sion
ary
pris
es
Ship
Non
-tre
ated
wat
er
All
cons
umer
s
1/ c
onsu
mer
s met
ered
by
CW
A2/
prov
isio
nal
Sour
ce: C
entr
al W
ater
Aut
hori
ty
9.06
9.
01
314,
226
321,
900
110.
3
11
5.0
998.
8
10
35.8
28.0
0
29.1
9
294
296
12.4
14.7
36.0
38.3
2.90
2.
61
1 1
0.1
0.0
1.5
1.4
17.9
0
17.7
7
43
39
0.0
0.0
0.1
0.1
5.04
5.
41
4,18
4 4,
224
5.0
4.9
88.7
86.8
15.0
2
14.9
7
3,61
1 3,
774
1.5
1.5
11.7
12.1
8.07
7.
85
697
661
4.1
4.3
60.9
64.2
16.9
2
280
297
4.7
5.1
135.
5
14
7.4
29.1
3
29.1
4
550.
6
7.
14
7.20
12,8
22
13,3
08
7.5
8.0
127.
9
13
4.9
16.9
5
2010
2/20
0920
102/
2009
2010
2/
292,
294
299,
300
75.1
76.5
536.
5
Bor
ehol
e
Mill
ion
met
re c
ube
(Mm
3)
Cla
ss o
f con
sum
erN
o. o
f con
sum
ers
Con
sum
ptio
n(M
m3 )
Val
ue so
ld( R
upee
s mill
ion)
Ave
rage
sale
s pric
e p
er m
3 (Rup
ees)
2009
2010
2/20
09
- 180 -
Peri
odM
are
Aux
Vac
oas (
Upp
er)
Mar
e A
ux V
acoa
s (L
ower
)Po
rt -L
ouis
Dis
tric
t wat
er su
pply
- N
orth
Dis
tric
t wat
er su
pply
- So
uth
Dis
tric
t wat
er su
pply
- E
ast
Tot
al p
rodu
ctio
n
Surf
ace
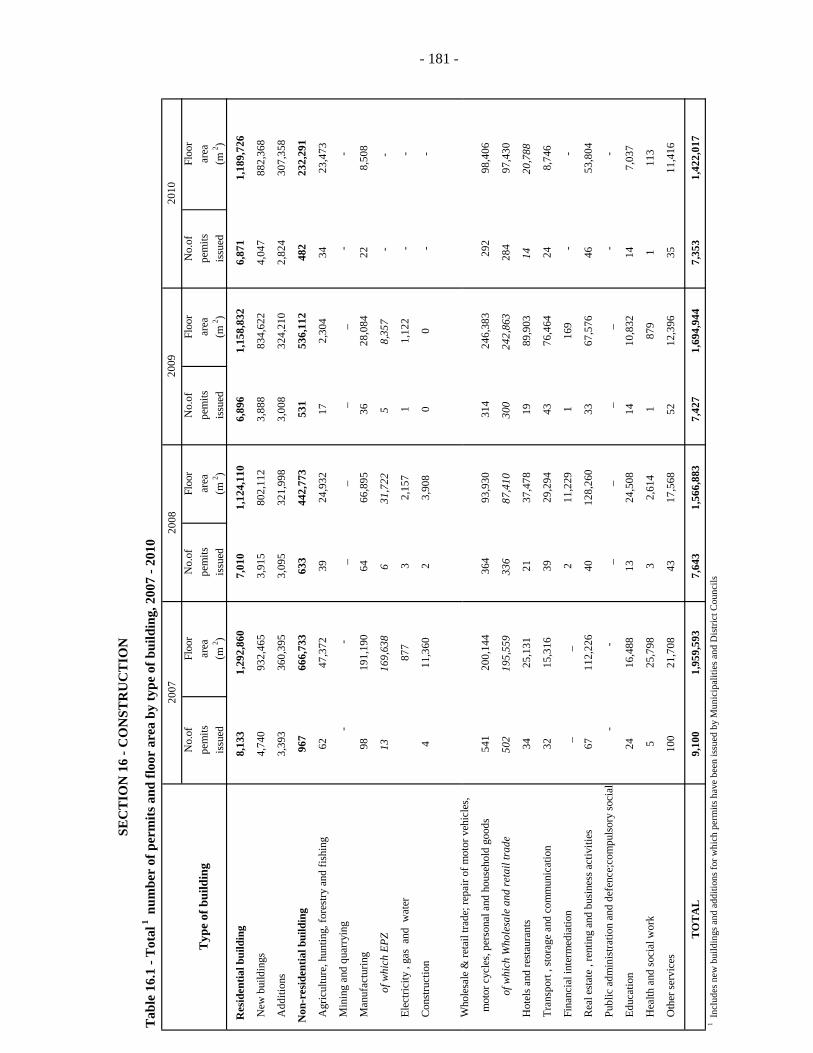
Tab
le 1
6.1
- Tot
al 1
num
ber
of p
erm
its a
nd fl
oor
area
by
type
of b
uild
ing,
200
7 - 2
010
2007
2008
No.
ofFl
oor
No.
ofFl
oor
No.
ofFl
oor
No.
ofFl
oor
Typ
e of
bui
ldin
gpe
mits
area
pem
itsar
eape
mits
area
pem
itsar
eais
sued
(m 2 )
issu
ed(m
2 )is
sued
(m 2 )
issu
ed(m
2 )
R
esid
entia
l bui
ldin
g8,
133
1,
292,
860
7,
010
1,
124,
110
6,
896
1,
158,
832
6,
871
1,
189,
726
N
ew b
uild
ings
4,74
0
932,
465
3,
915
80
2,11
2
3,88
8
834,
622
4,
047
88
2,36
8
A
dditi
ons
3,39
3
360,
395
3,
095
32
1,99
8
3,00
8
324,
210
2,
824
30
7,35
8
Non
-res
iden
tial b
uild
ing
967
66
6,73
3
633
44
2,77
3
531
53
6,11
2
482
23
2,29
1
A
gric
ultu
re, h
untin
g, fo
rest
ry a
nd fi
shin
g62
47
,372
39
24
,932
17
2,
304
34
23
,473
M
inin
g an
d qu
arry
ing
-
-_
__
_-
-
M
anuf
actu
ring
98
191,
190
64
66
,895
36
28
,084
22
8,
508
of w
hich
EPZ
13
169,
638
6
31
,722
5
8,
357
-
-
E
lect
ricity
, ga
s an
d w
ater
877
3
2,
157
1
1,
122
-
-
C
onst
ruct
ion
4
11,3
60
2
3,90
8
0
0
--
Wh
ll
&t
ilt
di
ft
hil
SEC
TIO
N 1
6 - C
ON
STR
UC
TIO
N
2009
2010
- 181 -
W
hole
sale
& re
tail
trade
; rep
air o
f mot
or v
ehic
les,
mot
or c
ycle
s, pe
rson
al a
nd h
ouse
hold
goo
ds54
1
200,
144
36
4
93,9
30
314
24
6,38
3
292
98,4
06
of w
hich
Who
lesa
le a
nd re
tail
trad
e50
2
195,
559
33
6
87,4
10
300
24
2,86
3
284
97
,430
H
otel
s and
rest
aura
nts
34
25,1
31
21
37,4
78
19
89,9
03
14
20,7
88
T
rans
port
, sto
rage
and
com
mun
icat
ion
32
15,3
16
39
29,2
94
43
76,4
64
24
8,74
6
F
inan
cial
inte
rmed
iatio
n_
_2
11
,229
1
16
9
--
R
eal e
stat
e , r
entin
g an
d bu
sine
ss a
ctiv
ities
67
11
2,22
6
40
128,
260
33
67
,576
46
53
,804
P
ublic
adm
inis
tratio
n an
d de
fenc
e;co
mpu
lsory
soci
al
-
-_
__
_-
-
E
duca
tion
24
16,4
88
13
24,5
08
14
10,8
32
14
7,03
7
H
ealth
and
soci
al w
ork
5
25,7
98
3
2,61
4
1
879
1
11
3
O
ther
serv
ices
100
21
,708
43
17
,568
52
12
,396
35
11
,416
T
OT
AL
9,10
0
1,95
9,59
3
7,64
3
1,56
6,88
3
7,42
7
1,69
4,94
4
7,35
3
1,42
2,01
7
1 Inc
lude
s new
bui
ldin
gs a
nd a
dditi
ons f
or w
hich
per
mits
hav
e be
en is
sued
by
Mun
icip
aliti
es a
nd D
istri
ct C
ounc
ils
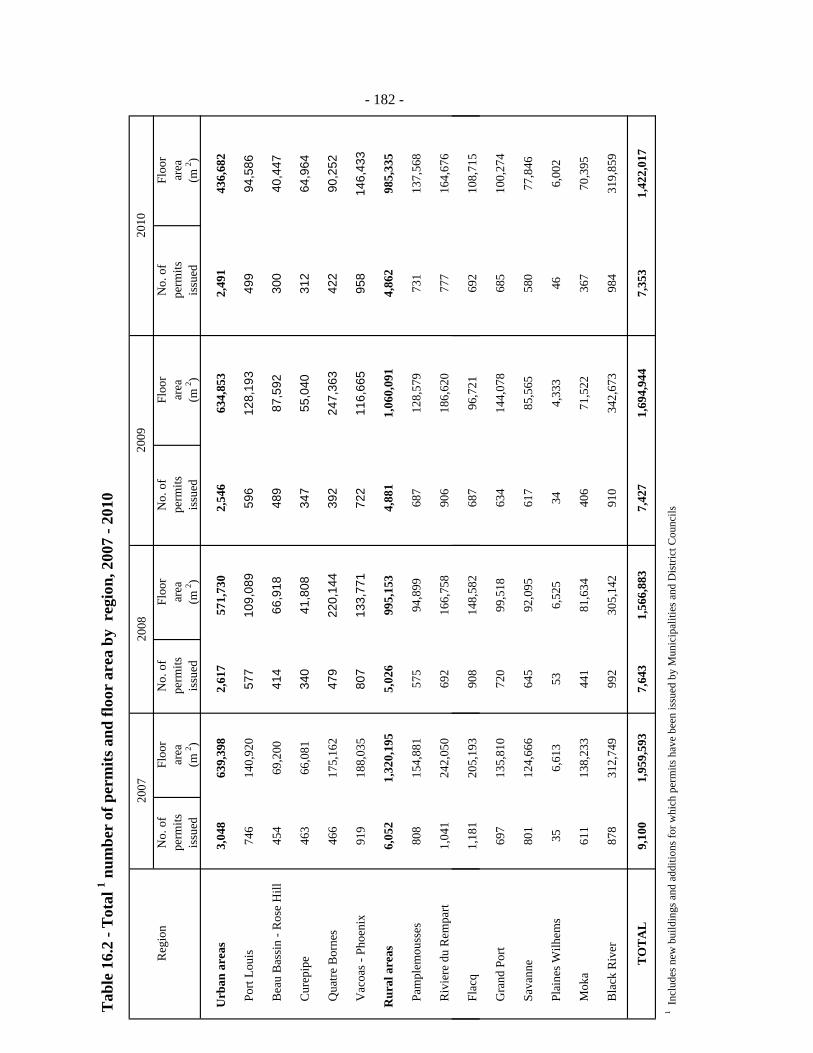
Tab
le 1
6.2
- Tot
al 1 n
umbe
r of
per
mits
and
floo
r ar
ea b
y r
egio
n, 2
007
- 201
0
2007
2008
Reg
ion
No.
of
Floo
rN
o. o
fFl
oor
No.
of
Floo
rN
o. o
fFl
oor
perm
itsar
eape
rmits
area
perm
itsar
eape
rmits
area
issu
ed(m
2 )is
sued
(m 2 )
issu
ed(m
2 )is
sued
(m 2 )
U
rban
are
as3,
048
63
9,39
8
2,61
7
571,
730
2,
546
63
4,85
3
2,49
1
436,
682
P
ort L
ouis
746
14
0,92
0
577
10
9,08
9
596
12
8,19
3
499
94
,586
B
eau
Bas
sin
- Ros
e H
ill45
4
69,2
00
414
66
,918
48
9
87,5
92
300
40
,447
C
urep
ipe
463
66
,081
34
0
41,8
08
347
55
,040
31
2
64,9
64
Q
uatre
Bor
nes
466
17
5,16
2
479
22
0,14
4
392
24
7,36
3
422
90
,252
V
acoa
s - P
hoen
ix91
9
188,
035
80
7
133,
771
72
2
116,
665
95
8
146,
433
R
ural
are
as6,
052
1,
320,
195
5,
026
99
5,15
3
4,88
1
1,06
0,09
1
4,86
2
985,
335
P
ampl
emou
sses
808
15
4,88
1
575
94
,899
68
7
128,
579
73
1
137,
568
R
ivie
re d
u R
empa
rt1,
041
24
2,05
0
692
16
6,75
8
906
18
6,62
0
777
16
4,67
6
2009
2010
- 182 -
F
lacq
1,18
1
205,
193
90
8
148,
582
68
7
96,7
21
692
10
8,71
5
G
rand
Por
t69
7
135,
810
72
0
99,5
18
634
14
4,07
8
685
10
0,27
4
S
avan
ne80
1
124,
666
64
5
92,0
95
617
85
,565
58
0
77,8
46
P
lain
es W
ilhem
s35
6,
613
53
6,
525
34
4,
333
46
6,
002
M
oka
611
13
8,23
3
441
81
,634
40
6
71,5
22
367
70
,395
B
lack
Riv
er87
8
312,
749
99
2
305,
142
91
0
342,
673
98
4
319,
859
TO
TA
L9,
100
1,
959,
593
7,
643
1,
566,
883
7,
427
1,
694,
944
7,
353
1,
422,
017
1 Inc
lude
s new
bui
ldin
gs a
nd a
dditi
ons f
or w
hich
per
mits
hav
e be
en is
sued
by
Mun
icip
aliti
es a
nd D
istri
ct C
ounc
ils
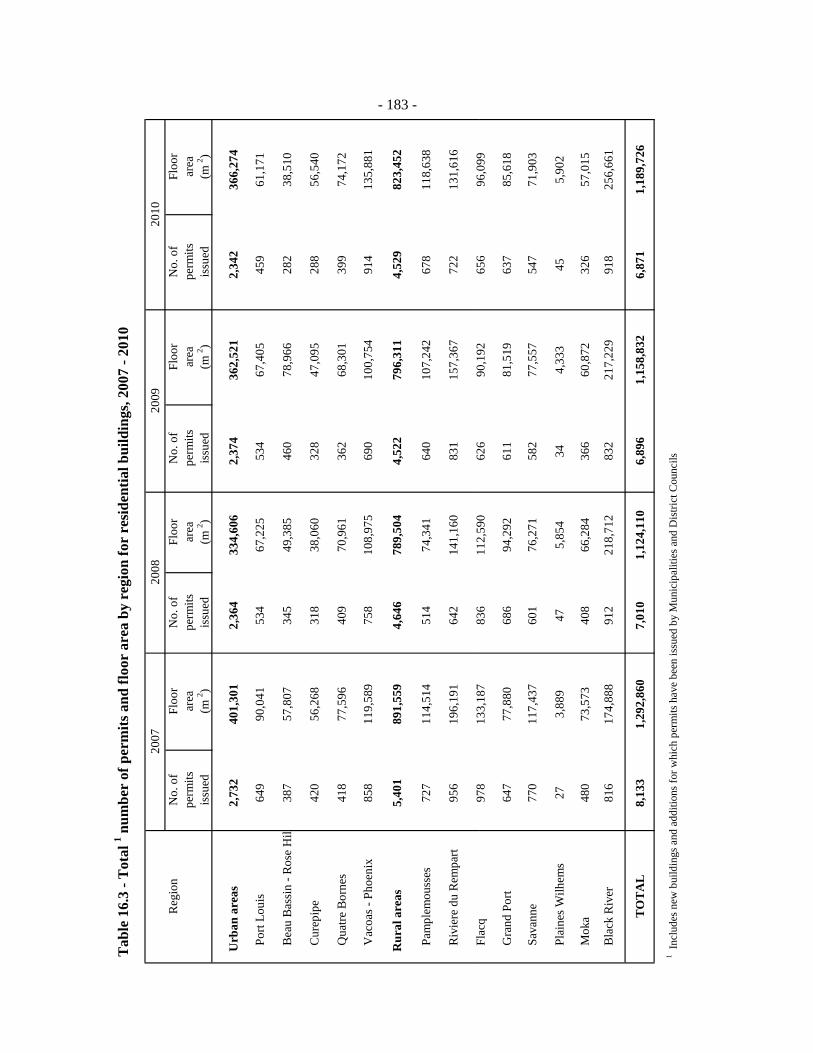
Tab
le 1
6.3
- Tot
al 1 n
umbe
r of
per
mits
and
floo
r ar
ea b
y re
gion
for
resi
dent
ial b
uild
ings
, 200
7 - 2
010
2007
2008
2009
2010
Reg
ion
No.
of
Floo
rN
o. o
fFl
oor
No.
of
Floo
rN
o. o
fFl
oor
perm
itsar
eape
rmits
area
perm
itsar
eape
rmits
area
issu
ed(m
2 )is
sued
(m 2 )
issu
ed(m
2 )is
sued
(m 2 )
U
rban
are
as2,
732
40
1,30
1
2,36
4
334,
606
2,
374
36
2,52
1
2,34
2
366,
274
P
ort L
ouis
649
90
,041
53
4
67,2
25
534
67
,405
45
9
61,1
71
B
eau
Bas
sin
- Ros
e H
il38
7
57,8
07
345
49
,385
46
0
78,9
66
282
38
,510
C
urep
ipe
420
56
,268
31
8
38,0
60
328
47
,095
28
8
56,5
40
Q
uatre
Bor
nes
418
77
,596
40
9
70,9
61
362
68
,301
39
9
74,1
72
V
acoa
s - P
hoen
ix85
8
119,
589
75
8
108,
975
69
0
100,
754
91
4
135,
881
R
ural
are
as5,
401
89
1,55
9
4,64
6
789,
504
4,
522
79
6,31
1
4,52
9
823,
452
P
ampl
emou
sses
727
11
4,51
4
514
74
,341
64
0
107,
242
67
8
118,
638
R
ivie
re d
u R
empa
rt95
6
196,
191
64
2
141,
160
83
1
157,
367
72
2
131,
616
Flac
q97
813
318
783
611
259
062
690
192
656
9609
9
- 183 -
F
lacq
978
13
3,18
7
836
11
2,59
0
626
90
,192
65
6
96,0
99
G
rand
Por
t64
7
77,8
80
686
94
,292
61
1
81,5
19
637
85
,618
S
avan
ne77
0
117,
437
60
1
76,2
71
582
77
,557
54
7
71,9
03
P
lain
es W
ilhem
s27
3,
889
47
5,
854
34
4,
333
45
5,
902
M
oka
480
73
,573
40
8
66,2
84
366
60
,872
32
6
57,0
15
B
lack
Riv
er81
6
174,
888
91
2
218,
712
83
2
217,
229
91
8
256,
661
TO
TA
L8,
133
1,
292,
860
7,
010
1,
124,
110
6,
896
1,
158,
832
6,
871
1,
189,
726
1 Inc
lude
s new
bui
ldin
gs a
nd a
dditi
ons f
or w
hich
per
mits
hav
e be
en is
sued
by
Mun
icip
aliti
es a
nd D
istri
ct C
ounc
ils
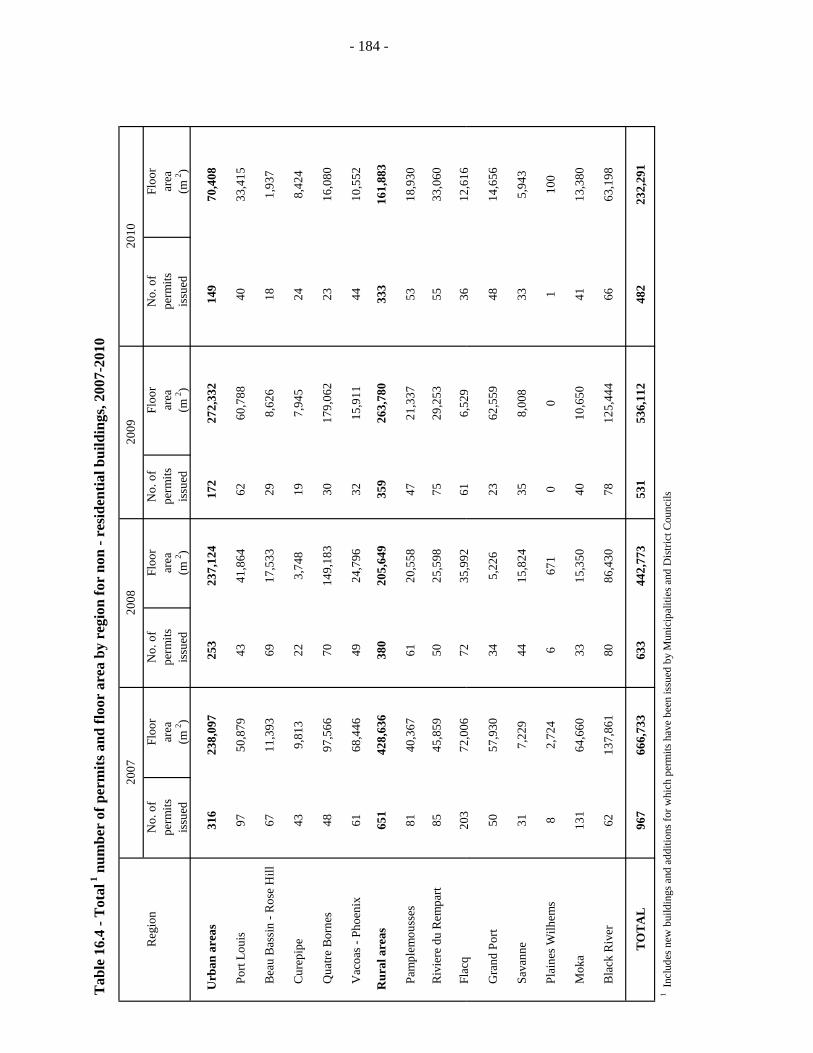
Tab
le 1
6.4
- Tot
al 1 n
umbe
r of
per
mits
and
floo
r ar
ea b
y re
gion
for
non
- res
iden
tial b
uild
ings
, 200
7-20
10
Reg
ion
No.
of
Floo
rN
o. o
fFl
oor
No.
of
Floo
rN
o. o
fFl
oor
perm
itsar
eape
rmits
area
perm
itsar
eape
rmits
area
issu
ed(m
2 )is
sued
(m 2 )
issu
ed(m
2 )is
sued
(m 2 )
U
rban
are
as31
6
238,
097
25
3
237,
124
17
2
272,
332
14
9
70,4
08
P
ort L
ouis
97
50,8
79
43
41,8
64
62
60,7
88
40
33,4
15
B
eau
Bas
sin
- Ros
e H
ill67
11
,393
69
17
,533
29
8,
626
18
1,
937
C
urep
ipe
43
9,81
3
22
3,74
8
19
7,94
5
24
8,42
4
Q
uatre
Bor
nes
48
97,5
66
70
149,
183
30
17
9,06
2
23
16,0
80
V
acoa
s - P
hoen
ix61
68
,446
49
24
,796
32
15
,911
44
10
,552
R
ural
are
as65
1
428,
636
38
0
205,
649
35
9
263,
780
33
3
161,
883
P
ampl
emou
sses
81
40,3
67
61
20,5
58
47
21,3
37
53
18,9
30
R
ivie
re d
u R
empa
rt85
45
,859
50
25
,598
75
29
,253
55
33
,060
Flac
q20
372
006
7235
992
616
529
3612
616
2007
2008
2009
2010
- 184 -
F
lacq
203
72
,006
72
35
,992
61
6,
529
36
12
,616
G
rand
Por
t50
57
,930
34
5,
226
23
62
,559
48
14
,656
S
avan
ne31
7,
229
44
15
,824
35
8,
008
33
5,
943
P
lain
es W
ilhem
s8
2,
724
6
67
1
0
0
1
100
M
oka
131
64
,660
33
15
,350
40
10
,650
41
13
,380
B
lack
Riv
er62
13
7,86
1
80
86,4
30
78
125,
444
66
63
,198
TO
TA
L96
7
666,
733
63
3
442,
773
53
1
536,
112
48
2
232,
291
1 Inc
lude
s new
bui
ldin
gs a
nd a
dditi
ons f
or w
hich
per
mits
hav
e be
en is
sued
by
Mun
icip
aliti
es a
nd D
istri
ct C
ounc
ils

Tab
le 1
6.5
- Num
ber
of p
erm
its fo
r re
side
ntia
l bui
ldin
gs1 b
y ra
nge
of fl
oor
area
, 200
7 - 2
010
Ran
ge o
f flo
or a
rea
Urb
anR
ural
Tota
lU
rban
Rur
alTo
tal
Urb
anR
ural
Tota
lU
rban
Rur
alTo
tal
(sq
mts
)N
umbe
rN
umbe
rN
umbe
r%
Num
ber
Num
ber
Num
ber
%N
umbe
rN
umbe
rN
umbe
r%
Num
ber
Num
ber
Num
ber
%
Les
s tha
n 65
483
543
1,02
613
40
339
179
411
377
318
695
1034
632
066
610
65-
139
1,27
82,
694
3,97
249
1,
126
2,39
53,
521
501,
158
2,22
63,
384
491,
110
2,30
33,
413
50
2008
2007
2009
2010
- 185 -
140
-299
832
1,82
52,
657
33
700
1,43
02,
130
3069
11,
681
2,37
234
726
1,55
32,
279
33
300
-499
108
237
345
3 11
836
548
37
128
220
348
512
824
437
25
500
& o
ver
3110
213
32
1765
822
2077
972
3210
914
12
TO
TA
L2,
732
5,40
18,
133
100
2,36
44,
646
7,01
010
02,
374
4,52
26,
896
100
2,34
24,
529
6,87
110
0
1 I
nclu
des n
ew b
uild
ings
and
add
ition
s
-
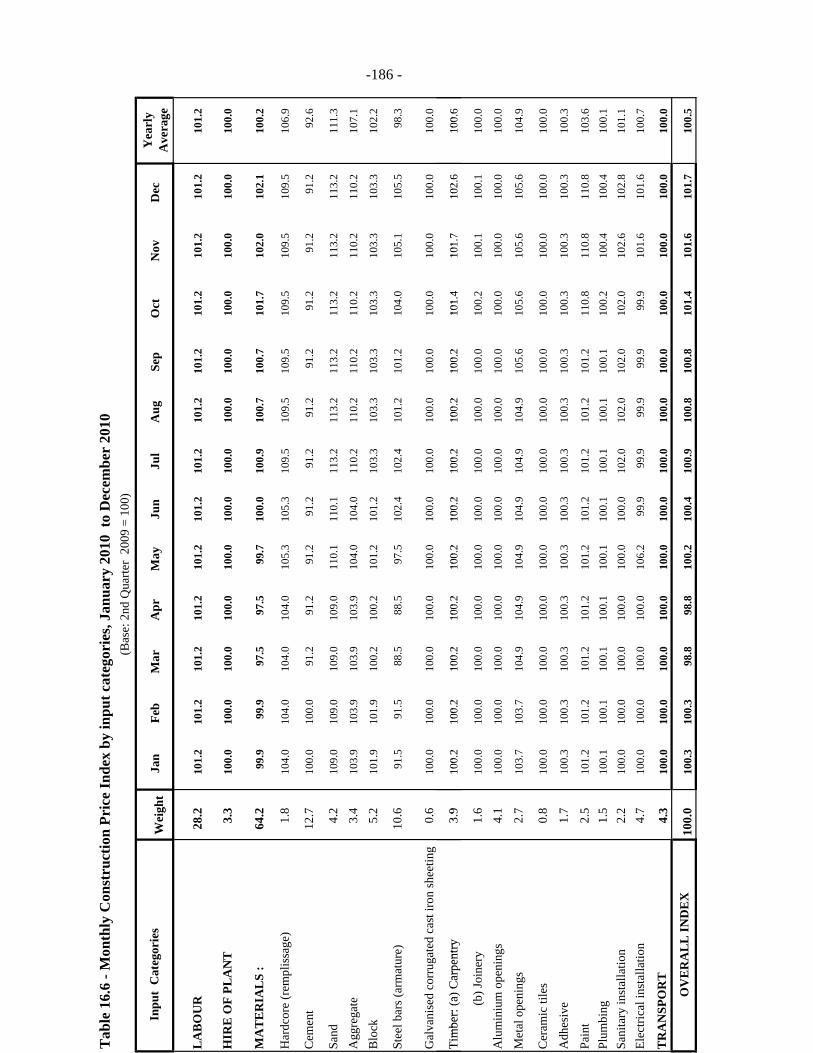
Jan
Feb
Mar
Apr
May
Jun
Jul
Aug
Sep
Oct
Nov
Dec
Yea
rly
Ave
rage
LA
BO
UR
28.2
101.
2
101.
2
101.
2
101.
2
101.
2
101.
2
101.
2
101.
2
101.
2
101.
2
101.
2
101.
2
101.
2
HIR
E O
F PL
AN
T3.
3
10
0.0
10
0.0
10
0.0
10
0.0
10
0.0
10
0.0
10
0.0
10
0.0
10
0.0
10
0.0
10
0.0
10
0.0
10
0.0
MA
TE
RIA
LS
:64
.2
99
.9
99.9
97
.5
97.5
99
.7
100.
0
100.
9
100.
7
100.
7
101.
7
102.
0
102.
1
100.
2
Har
dcor
e (r
empl
issa
ge)
1.8
104.
0
104.
0
104.
0
104.
0
105.
3
105.
3
109.
5
109.
5
109.
5
109.
5
109.
5
109.
5
106.
9
Cem
ent
12.7
100.
0
100.
0
91.2
91
.2
91.2
91
.2
91.2
91
.2
91.2
91
.2
91.2
91
.2
92.6
Sand
4.2
109.
0
109.
0
109.
0
109.
0
110.
1
110.
1
113.
2
113.
2
113.
2
113.
2
113.
2
113.
2
111.
3
Agg
rega
te3.
4
10
3.9
10
3.9
10
3.9
10
3.9
10
4.0
10
4.0
11
0.2
11
0.2
11
0.2
11
0.2
11
0.2
11
0.2
10
7.1
Blo
ck5.
2
10
1.9
10
1.9
10
0.2
10
0.2
10
1.2
10
1.2
10
3.3
10
3.3
10
3.3
10
3.3
10
3.3
10
3.3
10
2.2
Stee
l bar
s (ar
mat
ure)
10.6
91.5
91
.5
88.5
88
.5
97.5
10
2.4
10
2.4
10
1.2
10
1.2
10
4.0
10
5.1
10
5.5
98
.3
Gal
vani
sed
corr
ugat
ed c
ast i
ron
shee
ting
0.6
100.
0
100.
0
100.
0
100.
0
100.
0
100.
0
100.
0
100.
0
100.
0
100.
0
100.
0
100.
0
100.
0
Tim
ber:
(a)C
arpe
ntry
39
100
210
02
100
210
02
100
210
02
100
210
02
100
210
14
101
710
26
100
6
Tab
le 1
6.6
- Mon
thly
Con
stru
ctio
n Pr
ice
Inde
x by
inpu
t cat
egor
ies,
Janu
ary
2010
to
Dec
embe
r 20
10
-186 -
(Bas
e: 2
nd Q
uarte
r 20
09 =
100
)
Inpu
t C
ateg
orie
sW
eigh
t
Tim
ber:
(a) C
arpe
ntry
3.9
100.
2
100.
2
100.
2
100.
2
100.
2
100.
2
100.
2
100.
2
100.
2
101.
4
101.
7
102.
6
100.
6
(b)
Join
ery
1.6
100.
0
100.
0
100.
0
100.
0
100.
0
100.
0
100.
0
100.
0
100.
0
100.
2
100.
1
100.
1
100.
0
Alu
min
ium
ope
ning
s4.
1
10
0.0
10
0.0
10
0.0
10
0.0
10
0.0
10
0.0
10
0.0
10
0.0
10
0.0
10
0.0
10
0.0
10
0.0
10
0.0
Met
al o
peni
ngs
2.7
103.
7
103.
7
104.
9
104.
9
104.
9
104.
9
104.
9
104.
9
105.
6
105.
6
105.
6
105.
6
104.
9
Cer
amic
tile
s0.
8
10
0.0
10
0.0
10
0.0
10
0.0
10
0.0
10
0.0
10
0.0
10
0.0
10
0.0
10
0.0
10
0.0
10
0.0
10
0.0
Adh
esiv
e1.
7
10
0.3
10
0.3
10
0.3
10
0.3
10
0.3
10
0.3
10
0.3
10
0.3
10
0.3
10
0.3
10
0.3
10
0.3
10
0.3
Pain
t2.
5
10
1.2
10
1.2
10
1.2
10
1.2
10
1.2
10
1.2
10
1.2
10
1.2
10
1.2
11
0.8
11
0.8
11
0.8
10
3.6
Pl
umbi
ng1.
5
10
0.1
10
0.1
10
0.1
10
0.1
10
0.1
10
0.1
10
0.1
10
0.1
10
0.1
10
0.2
10
0.4
10
0.4
10
0.1
Sa
nita
ry in
stal
latio
n2.
2
10
0.0
10
0.0
10
0.0
10
0.0
10
0.0
10
0.0
10
2.0
10
2.0
10
2.0
10
2.0
10
2.6
10
2.8
10
1.1
Elec
trica
l ins
talla
tion
4.7
100.
0
100.
0
100.
0
100.
0
106.
2
99.9
99
.9
99.9
99
.9
99.9
10
1.6
10
1.6
10
0.7
TR
AN
SPO
RT
4.3
100.
0
100.
0
100.
0
100.
0
100.
0
100.
0
100.
0
100.
0
100.
0
100.
0
100.
0
100.
0
100.
0
OV
ER
AL
L IN
DE
X10
0.0
100.
3
100.
3
98.8
98
.8
100.
2
100.
4
100.
9
100.
8
100.
8
101.
4
101.
6
101.
7
100.
5
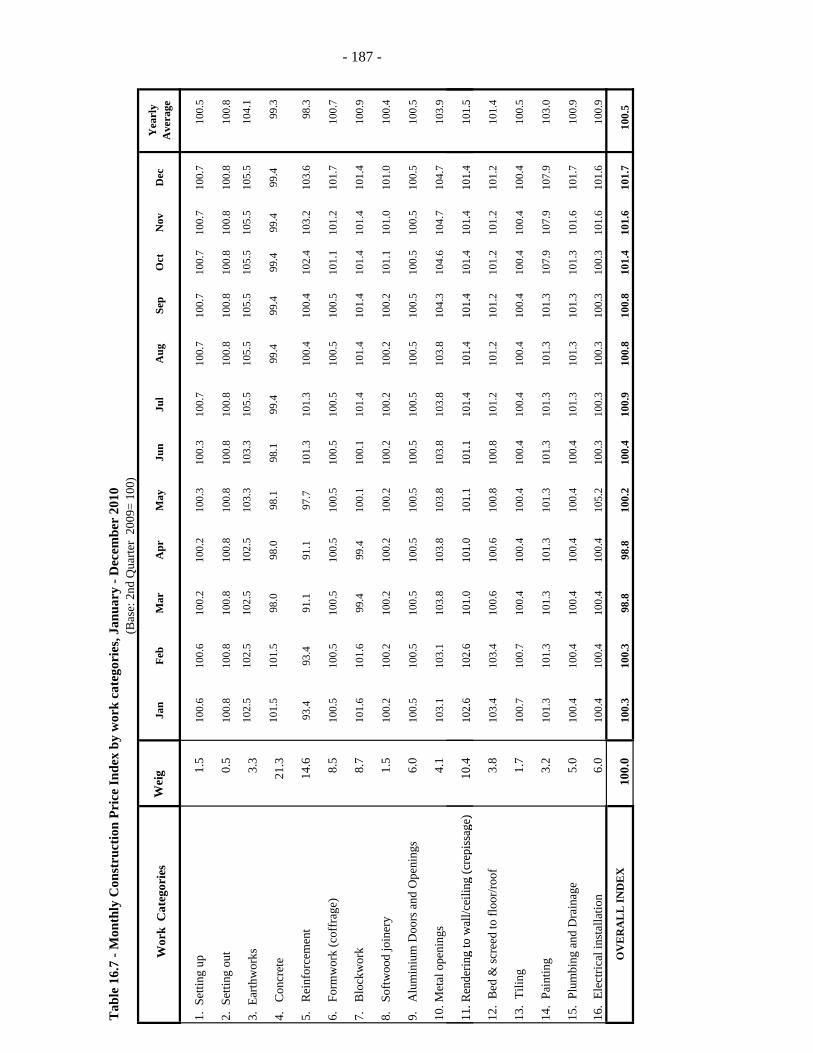
Jan
Feb
Mar
Apr
May
Jun
Jul
Aug
Sep
Oct
Nov
Dec
Yea
rly
Ave
rage
1. S
ettin
g up
1.5
100.
610
0.6
100.
210
0.2
100.
310
0.3
100.
710
0.7
100.
710
0.7
100.
710
0.7
100.
5
2. S
ettin
g ou
t0.
5
10
0.8
100.
810
0.8
100.
810
0.8
100.
810
0.8
100.
810
0.8
100.
810
0.8
100.
810
0.8
3. E
arth
wor
ks3.
3
10
2.5
102.
510
2.5
102.
510
3.3
103.
310
5.5
105.
510
5.5
105.
510
5.5
105.
510
4.1
4.
Con
cret
e21
.3
10
1.5
101.
598
.098
.098
.198
.199
.499
.499
.499
.499
.499
.499
.3
5.
Rei
nfor
cem
ent
14.6
93.4
93.4
91.1
91.1
97.7
101.
310
1.3
100.
410
0.4
102.
410
3.2
103.
698
.3
6.
Form
wor
k (c
offr
age)
8.5
100.
510
0.5
100.
510
0.5
100.
510
0.5
100.
510
0.5
100.
510
1.1
101.
210
1.7
100.
7
7.
Blo
ckw
ork
8.7
101.
610
1.6
99.4
99.4
100.
110
0.1
101.
410
1.4
101.
410
1.4
101.
410
1.4
100.
9
8.
Softw
ood
join
ery
1.5
100.
210
0.2
100.
210
0.2
100.
210
0.2
100.
210
0.2
100.
210
1.1
101.
010
1.0
100.
4
9.
Alu
min
ium
Doo
rs a
nd O
peni
ngs
6.0
100.
510
0.5
100.
510
0.5
100.
510
0.5
100.
510
0.5
100.
510
0.5
100.
510
0.5
100.
5
10. M
etal
ope
ning
s4.
1
10
3.1
103.
110
3.8
103.
810
3.8
103.
810
3.8
103.
810
4.3
104.
610
4.7
104.
710
3.9
11. R
ende
ring
to w
all/c
eilin
g (c
repi
ssag
e)10
.4
10
2.6
102.
610
1.0
101.
010
1.1
101.
110
1.4
101.
410
1.4
101.
410
1.4
101.
410
1.5
Tab
le 1
6.7
- Mon
thly
Con
stru
ctio
n Pr
ice
Inde
x by
wor
k ca
tego
ries
, Jan
uary
- D
ecem
ber
2010
- 187 -
(Bas
e: 2
nd Q
uarte
r 20
09=
100)
Wor
k C
ateg
orie
sW
eig
11. R
ende
ring
to w
all/c
eilin
g (c
repi
ssag
e)10
.4
10
2.6
102.
610
1.0
101.
010
1.1
101.
110
1.4
101.
410
1.4
101.
410
1.4
101.
410
1.5
12.
Bed
& sc
reed
to fl
oor/r
oof
3.8
103.
410
3.4
100.
610
0.6
100.
810
0.8
101.
210
1.2
101.
210
1.2
101.
210
1.2
101.
4
13.
Tilin
g1.
7
10
0.7
100.
710
0.4
100.
410
0.4
100.
410
0.4
100.
410
0.4
100.
410
0.4
100.
410
0.5
14.
Pain
ting
3.2
101.
310
1.3
101.
310
1.3
101.
310
1.3
101.
310
1.3
101.
310
7.9
107.
910
7.9
103.
0
15.
Plum
bing
and
Dra
inag
e5.
0
10
0.4
100.
410
0.4
100.
410
0.4
100.
410
1.3
101.
310
1.3
101.
310
1.6
101.
710
0.9
16.
Elec
trica
l ins
talla
tion
6.0
100.
410
0.4
100.
410
0.4
105.
210
0.3
100.
310
0.3
100.
310
0.3
101.
610
1.6
100.
9
OV
ER
AL
L IN
DE
X10
0.0
100.
310
0.3
98.8
98.8
100.
210
0.4
100.
910
0.8
100.
810
1.4
101.
610
1.7
100.
5
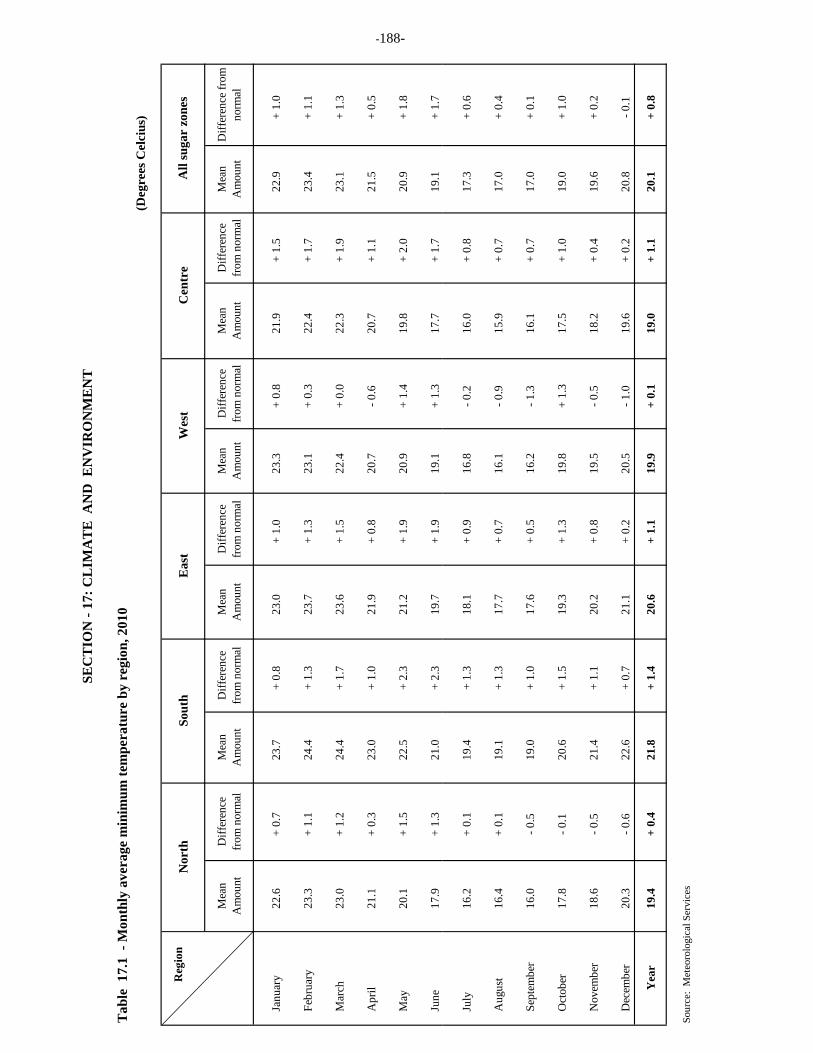
Tab
le 1
7.1
- M
onth
ly a
vera
ge m
inim
um te
mpe
ratu
re b
y re
gion
, 201
0(D
egre
es C
elci
us)
Nor
thSo
uth
Eas
tW
est
Cen
tre
Mea
n
Am
ount
Diff
eren
ce
from
nor
mal
Mea
n
Am
ount
Diff
eren
ce
from
nor
mal
Mea
n
Am
ount
Diff
eren
ce
from
nor
mal
Mea
n
Am
ount
Diff
eren
ce
from
nor
mal
Mea
n
Am
ount
Diff
eren
ce
from
nor
mal
Mea
n
Am
ount
Diff
eren
ce fr
om
norm
al
Ja
nuar
y22
.6
+ 0.
7
23.7
+
0.8
23
.0
+ 1.
0
23.3
+
0.8
21
.9
+ 1.
5
22.9
+
1.0
F
ebru
ary
23.3
+
1.1
24
.4
+ 1.
3
23.7
+
1.3
23
.1
+ 0.
3
22.4
+
1.7
23
.4
+ 1.
1
M
arch
23.0
+
1.2
24
.4
+ 1.
7
23.6
+
1.5
22
.4
+ 0.
0
22.3
+
1.9
23
.1
+ 1.
3
A
pril
21.1
+
0.3
23
.0
+ 1.
0
21.9
+
0.8
20
.7
- 0.6
20
.7
+ 1.
1
21.5
+
0.5
M
ay20
.1
+ 1.
5
22.5
+
2.3
21
.2
+ 1.
9
20.9
+
1.4
19
.8
+ 2.
0
20.9
+
1.8
Ju
ne17
.9
+ 1.
3
21.0
+
2.3
19
.7
+ 1.
9
19.1
+
1.3
17
.7
+ 1.
7
19.1
+
1.7
SEC
TIO
N -
17: C
LIM
AT
E A
ND
EN
VIR
ON
ME
NT
All
suga
r zo
nes
Reg
ion
-188-
Ju
ly16
.2
+ 0.
1
19.4
+
1.3
18
.1
+ 0.
9
16.8
- 0
.2
16.0
+
0.8
17
.3
+ 0.
6
A
ugus
t16
.4
+ 0.
1
19.1
+
1.3
17
.7
+ 0.
7
16.1
- 0
.9
15.9
+
0.7
17
.0
+ 0.
4
S
epte
mbe
r16
.0
- 0.5
19
.0
+ 1.
0
17.6
+
0.5
16
.2
- 1.3
16
.1
+ 0.
7
17.0
+
0.1
O
ctob
er17
.8
- 0.1
20
.6
+ 1.
5
19.3
+
1.3
19
.8
+ 1.
3
17.5
+
1.0
19
.0
+ 1.
0
N
ovem
ber
18.6
- 0
.5
21.4
+
1.1
20
.2
+ 0.
8
19.5
- 0
.5
18.2
+
0.4
19
.6
+ 0.
2
D
ecem
ber
20.3
- 0
.6
22.6
+
0.7
21
.1
+ 0.
2
20.5
- 1
.0
19.6
+
0.2
20
.8
- 0.1
Yea
r19
.4
+ 0.
4
21.8
+
1.4
20
.6
+ 1.
1
19.9
+
0.1
19
.0
+ 1.
1
20.1
+
0.8
Sour
ce:
Met
eoro
logi
cal S
ervi
ces
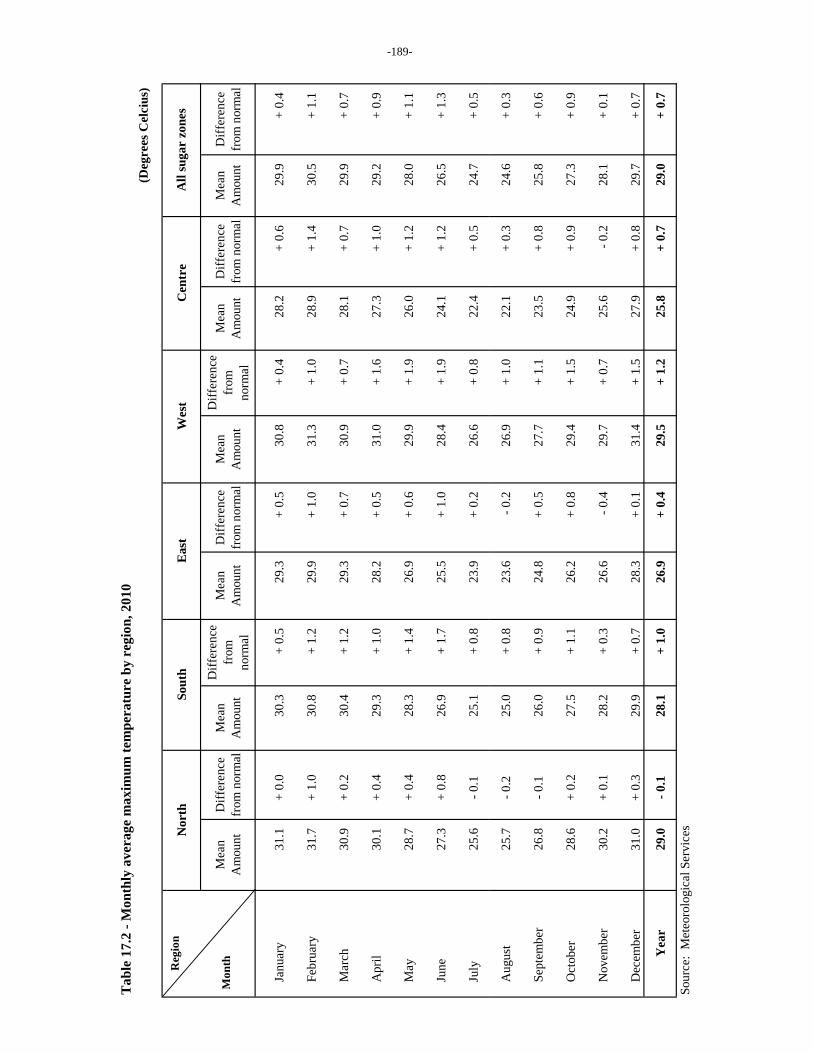
Tab
le 1
7.2
- Mon
thly
ave
rage
max
imum
tem
pera
ture
by
regi
on, 2
010
Nor
thSo
uth
Eas
tW
est
Cen
tre
Mea
n
Am
ount
Diff
eren
ce
from
nor
mal
Mea
n
Am
ount
Diff
eren
ce
from
no
rmal
Mea
n
Am
ount
Diff
eren
ce
from
nor
mal
Mea
n
Am
ount
Diff
eren
ce
from
no
rmal
Mea
n
Am
ount
Diff
eren
ce
from
nor
mal
Mea
n
Am
ount
Diff
eren
ce
from
nor
mal
Ja
nuar
y31
.1
+ 0.
0
30.3
+
0.5
29
.3
+ 0.
5
30.8
+
0.4
28
.2
+ 0.
6
29.9
+
0.4
F
ebru
ary
31.7
+
1.0
30
.8
+ 1.
2
29.9
+
1.0
31
.3
+ 1.
0
28.9
+
1.4
30
.5
+ 1.
1
M
arch
30.9
+
0.2
30
.4
+ 1.
2
29.3
+
0.7
30
.9
+ 0.
7
28.1
+
0.7
29
.9
+ 0.
7
A
pril
30.1
+
0.4
29
.3
+ 1.
0
28.2
+
0.5
31
.0
+ 1.
6
27.3
+
1.0
29
.2
+ 0.
9
M
ay28
.7
+ 0.
4
28.3
+
1.4
26
.9
+ 0.
6
29.9
+
1.9
26
.0
+ 1.
2
28.0
+
1.1
Ju
ne27
.3
+ 0.
8
26.9
+
1.7
25
.5
+ 1.
0
28.4
+
1.9
24
.1
+ 1.
2
26.5
+
1.3
Ju
ly25
.6
- 0.1
25
.1
+ 0.
8
23.9
+
0.2
26
.6
+ 0.
8
22.4
+
0.5
24
.7
+ 0.
5
(D
egre
es C
elci
us)
All
suga
r zo
nes
Reg
ion
Mon
th
-189-
A
ugus
t25
.7
- 0.2
25
.0
+ 0.
8
23.6
- 0
.2
26.9
+
1.0
22
.1
+ 0.
3
24.6
+
0.3
S
epte
mbe
r26
.8
- 0.1
26
.0
+ 0.
9
24.8
+
0.5
27
.7
+ 1.
1
23.5
+
0.8
25
.8
+ 0.
6
O
ctob
er28
.6
+ 0.
2
27.5
+
1.1
26
.2
+ 0.
8
29.4
+
1.5
24
.9
+ 0.
9
27.3
+
0.9
N
ovem
ber
30.2
+
0.1
28
.2
+ 0.
3
26.6
- 0
.4
29.7
+
0.7
25
.6
- 0.2
28
.1
+ 0.
1
D
ecem
ber
31.0
+
0.3
29
.9
+ 0.
7
28.3
+
0.1
31
.4
+ 1.
5
27.9
+
0.8
29
.7
+ 0.
7
Yea
r29
.0
- 0.1
28
.1
+ 1.
0
26.9
+
0.4
29
.5
+ 1.
2
25.8
+
0.7
29
.0
+ 0.
7
Sour
ce:
Met
eoro
logi
cal S
ervi
ces

Tab
le 1
7.3
- Mea
n ra
infa
ll, 2
007
- 201
0M
illim
etre
s
Mea
n%
of L
ong
Term
Mea
nM
ean
% o
f Lon
g Te
rm M
ean
Mea
n%
of L
ong
Term
M
ean
Mea
n%
of L
ong
Term
M
ean
Mea
n%
of L
ong
Term
Mea
nM
ean
% o
f Lon
g Te
rm M
ean
Mea
n%
of L
ong
Term
Mea
nM
ean
% o
f Lon
g Te
rm
Mea
n
Yea
r2,
010
1,
954
97
2,38
2
119
2,
397
11
9
1,
806
90
1,
105
1,22
6
11
1
1,05
5
95
949
86
1,14
2
10
3
Jan
261
347
133
24
1
92
259
99
318
122
150
14
5
96
134
89
69
46
208
13
9
Feb
336
572
170
25
1
75
278
84
374
111
185
38
3
20
7
147
80
130
70
169
91
Mar
242
165
68
50
8
20
9
363
145
271
112
131
85
65
77
59
10
3
79
69
53
Apr
226
119
53
53
24
238
103
138
61
117
88
75
21
18
82
71
21
4
183
May
159
139
88
29
9
18
8
176
112
120
75
78
48
62
15
7
201
12
2
156
14
4
184
Perio
dL
ong
Ter
m
Mea
n (1
971 -
2000
)
2007
2008
2009
2010
Lon
g T
erm
M
ean
(197
1-20
00)
2007
2008
2009
2010
Isla
nd o
f Mau
ritiu
sIs
land
of R
odri
gues
-190-
Jun
115
142
124
16
5
14
4
101
84
60
52
78
32
42
88
113
87
112
46
59
Jul
120
123
102
13
5
11
3
155
126
160
133
81
89
110
41
51
10
6
131
76
94
Aug
122
63
51
72
59
12
9
10
7
15
6
12
8
59
46
79
88
14
8
75
12
7
67
11
3
Sep
81
71
88
348
429
71
90
60
74
44
65
14
7
50
11
3
65
14
9
16
37
Oct
70
105
150
61
87
240
353
45
64
41
50
122
65
161
32
79
46
113
Nov
80
45
56
152
190
18
0
23
0
89
11
1
70
8
11
13
4
192
32
46
50
71
Dec
199
63
32
97
49
20
7
10
7
15
8
71
187
264
53
74
45
64
37
52
Sour
ce: M
aurit
ius M
eteo
rolo
gica
l Ser
vice
s
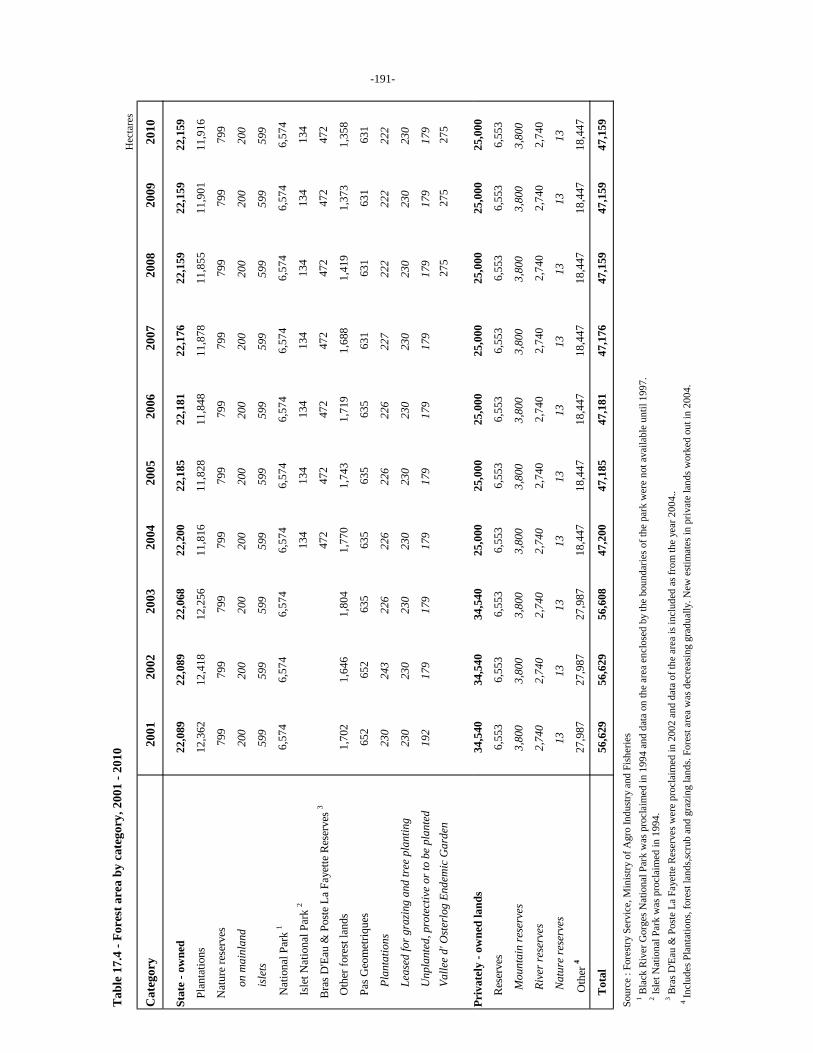
Tab
le 1
7.4
- For
est a
rea
by c
ateg
ory,
200
1 - 2
010
Hec
tare
s
Cat
egor
y20
0120
0220
0320
0420
0520
0620
0720
0820
0920
10
Stat
e - o
wne
d22
,089
22,0
8922
,068
22,2
0022
,185
22,1
8122
,176
22,1
5922
,159
22,1
59
Plan
tatio
ns12
,362
12,4
1812
,256
11,8
1611
,828
11,8
4811
,878
11,8
5511
,901
11,9
16
Nat
ure
rese
rves
799
799
799
799
799
799
799
799
799
799
on
mai
nlan
d20
020
020
020
020
020
020
020
020
020
0
isle
ts59
959
959
959
959
959
959
959
959
959
9
Nat
iona
l Par
k 1
6,57
46,
574
6,57
46,
574
6,57
46,
574
6,57
46,
574
6,57
46,
574
Isle
t Nat
iona
l Par
k 2
134
134
134
134
134
134
134
Bra
s D'E
au &
Pos
te L
a Fa
yette
Res
erve
s 347
247
247
247
247
247
247
2
Oth
er fo
rest
land
s1,
702
1,64
61,
804
1,77
01,
743
1,71
91,
688
1,41
91,
373
1,35
8
Pas
Geo
met
rique
s65
265
263
563
563
563
563
163
163
163
1
Pla
ntat
ions
230
243
226
226
226
226
227
222
222
222
Lea
sed
for g
razi
ng a
nd tr
ee p
lant
ing
230
230
230
230
230
230
230
230
230
230
Unp
lant
ed, p
rote
ctiv
e or
to b
e pl
ante
d19
217
917
917
917
917
917
917
917
917
9
V
alle
e d'
Ost
erlo
g En
dem
ic G
arde
n27
527
527
5
-191-
Priv
atel
y - o
wne
d la
nds
34,5
4034
,540
34,5
4025
,000
25,0
0025
,000
25,0
0025
,000
25,0
0025
,000
Res
erve
s 6,
553
6,55
36,
553
6,55
36,
553
6,55
36,
553
6,55
36,
553
6,55
3
Mou
ntai
n re
serv
es3,
800
3,80
03,
800
3,80
03,
800
3,80
03,
800
3,80
03,
800
3,80
0
Rive
r res
erve
s2,
740
2,74
02,
740
2,74
02,
740
2,74
02,
740
2,74
02,
740
2,74
0
Nat
ure
rese
rves
1313
1313
1313
1313
1313
O
ther
427
,987
27,9
8727
,987
18,4
4718
,447
18,4
4718
,447
18,4
4718
,447
18,4
47
Tot
al56
,629
56,6
2956
,608
47,2
0047
,185
47,1
8147
,176
47,1
5947
,159
47,1
59
Sour
ce :
Fore
stry
Ser
vice
, Min
istry
of A
gro
Indu
stry
and
Fis
herie
s
1 B
lack
Riv
er G
orge
s Nat
iona
l Par
k w
as p
rocl
aim
ed in
199
4 an
d da
ta o
n th
e ar
ea e
nclo
sed
by th
e bo
unda
ries o
f the
par
k w
ere
not a
vaila
ble
until
199
7.
2 Is
let N
atio
nal P
ark
was
pro
clai
med
in 1
994.
3
Bra
s D'E
au &
Pos
te L
a Fa
yette
Res
erve
s wer
e pr
ocla
imed
in 2
002
and
data
of t
he a
rea
is in
clud
ed a
s fro
m th
e ye
ar 2
004.
. 4
Incl
udes
Pla
ntat
ions
, for
est l
ands
,scru
b an
d gr
azin
g la
nds.
Fore
st a
rea
was
dec
reas
ing
grad
ually
. New
est
imat
es in
priv
ate
land
s wor
ked
out i
n 20
04.
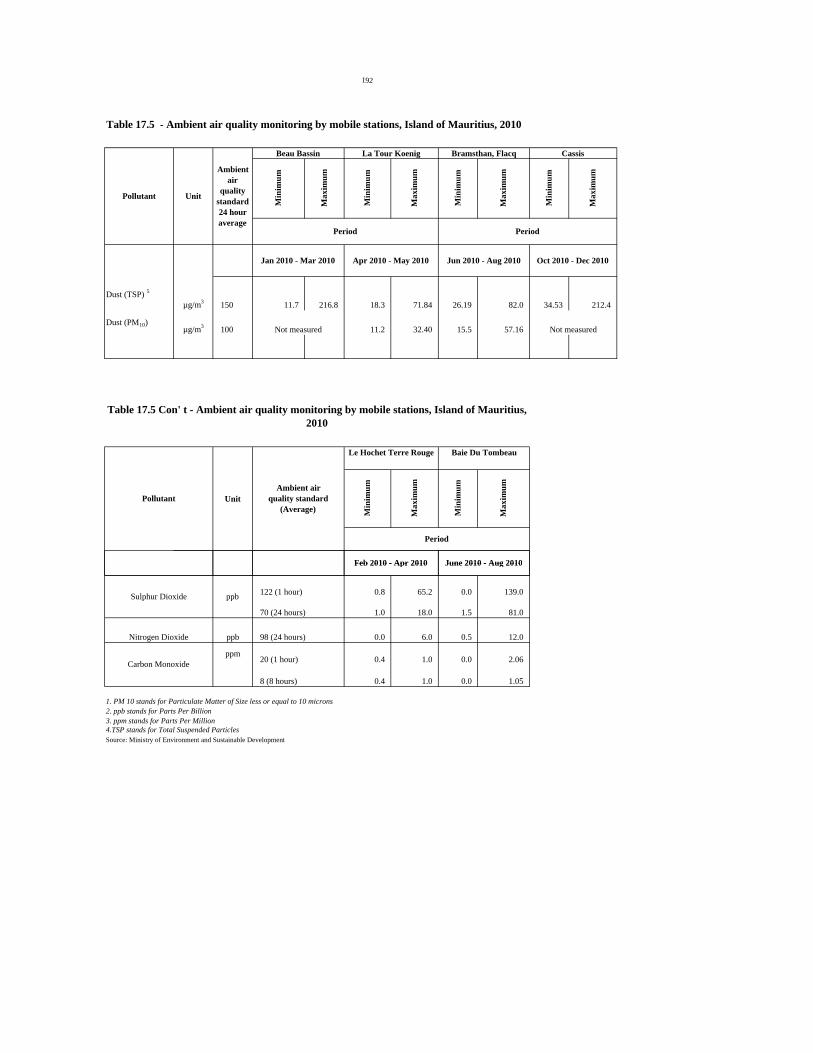
192
Table 17.5 - Ambient air quality monitoring by mobile stations, Island of Mauritius, 2010
Min
imum
Max
imum
Min
imum
Max
imum
Min
imum
Max
imum
Min
imum
Max
imum
Dust (TSP) 5
µg/m3 150 11.7 216.8 18.3 71.84 26.19 82.0 34.53 212.4
Dust (PM10) µg/m3 100 11.2 32.40 15.5 57.16
Unit
Min
imum
Max
imum
Min
imum
Max
imum
Feb 2010 - Apr 2010 June 2010 - Aug 2010
Not measured Not measured
PollutantAmbient air
quality standard (Average)
Le Hochet Terre Rouge Baie Du Tombeau
Period
Table 17.5 Con' t - Ambient air quality monitoring by mobile stations, Island of Mauritius, 2010
Cassis
Period Period
Jan 2010 - Mar 2010 Apr 2010 - May 2010 Jun 2010 - Aug 2010 Oct 2010 - Dec 2010
Pollutant Unit
Ambient air
quality standard 24 hour average
Beau Bassin La Tour Koenig Bramsthan, Flacq
122 (1 hour) 0.8 65.2 0.0 139.0
70 (24 hours) 1.0 18.0 1.5 81.0
ppb 98 (24 hours) 0.0 6.0 0.5 12.0
ppm20 (1 hour) 0.4 1.0 0.0 2.06
8 (8 hours) 0.4 1.0 0.0 1.05
1. PM 10 stands for Particulate Matter of Size less or equal to 10 microns2. ppb stands for Parts Per Billion3. ppm stands for Parts Per Million
Source: Ministry of Environment and Sustainable Development 4.TSP stands for Total Suspended Particles
Feb 2010 - Apr 2010 June 2010 - Aug 2010
Sulphur Dioxide ppb
Nitrogen Dioxide
Carbon Monoxide
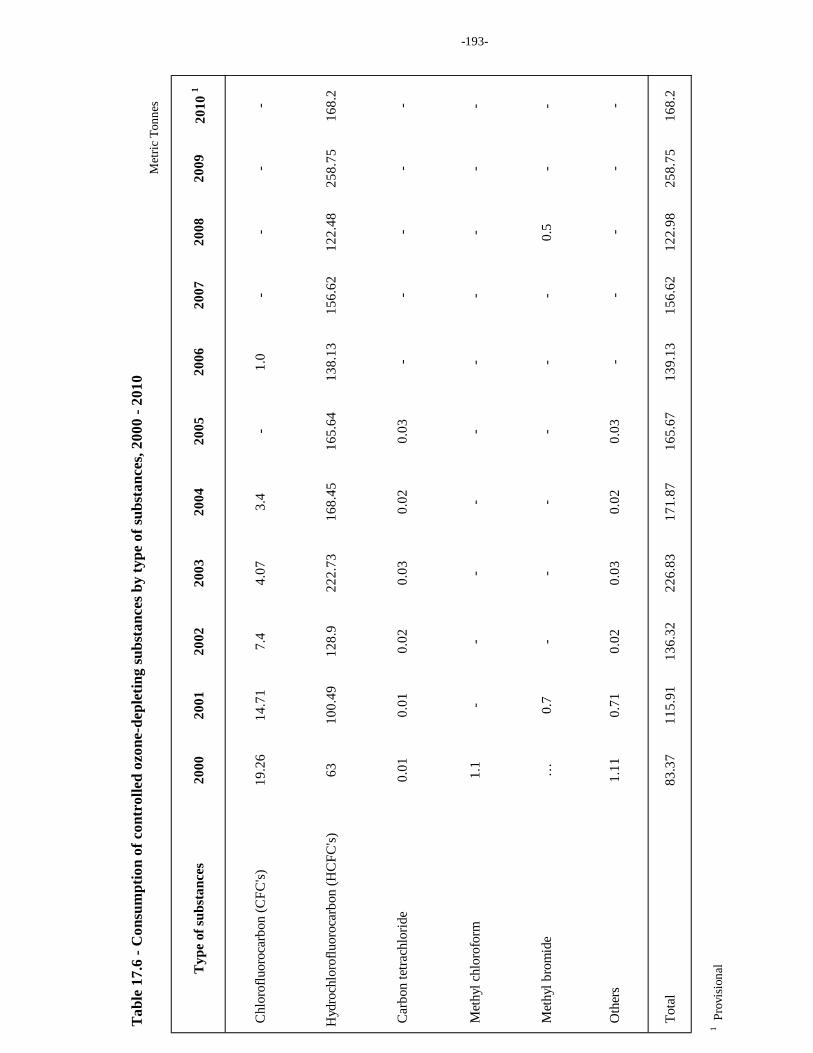
Tab
le 1
7.6
- Con
sum
ptio
n of
con
trol
led
ozon
e-de
plet
ing
subs
tanc
es b
y ty
pe o
f sub
stan
ces,
2000
- 20
10
Typ
e of
subs
tanc
es20
0020
0120
0220
0320
0420
0520
0620
0720
0820
0920
10 1
Chl
orof
luor
ocar
bon
(CFC
's)19
.26
14.7
17.
44.
073.
4-
1.0
--
--
Hyd
roch
loro
fluor
ocar
bon
(HC
FC's)
6310
0.49
128.
922
2.73
168.
4516
5.64
138.
1315
6.62
122.
4825
8.75
168.
2
Car
bon
tetra
chlo
ride
0.01
0.01
0.02
0.03
0.02
0.03
--
--
-
Met
hyl c
hlor
ofor
m1.
1-
--
--
--
--
-
Met
hyl b
rom
ide
…0.
7-
--
--
-0.
5-
-
Oth
ers
1.11
0.71
0.02
0.03
0.02
0.03
--
--
-
Tot
al83
.37
115.
9113
6.32
226.
8317
1.87
165.
6713
9.13
156.
6212
2.98
258.
7516
8.2
1 Pro
visi
onal
Met
ric T
onne
s
-193-
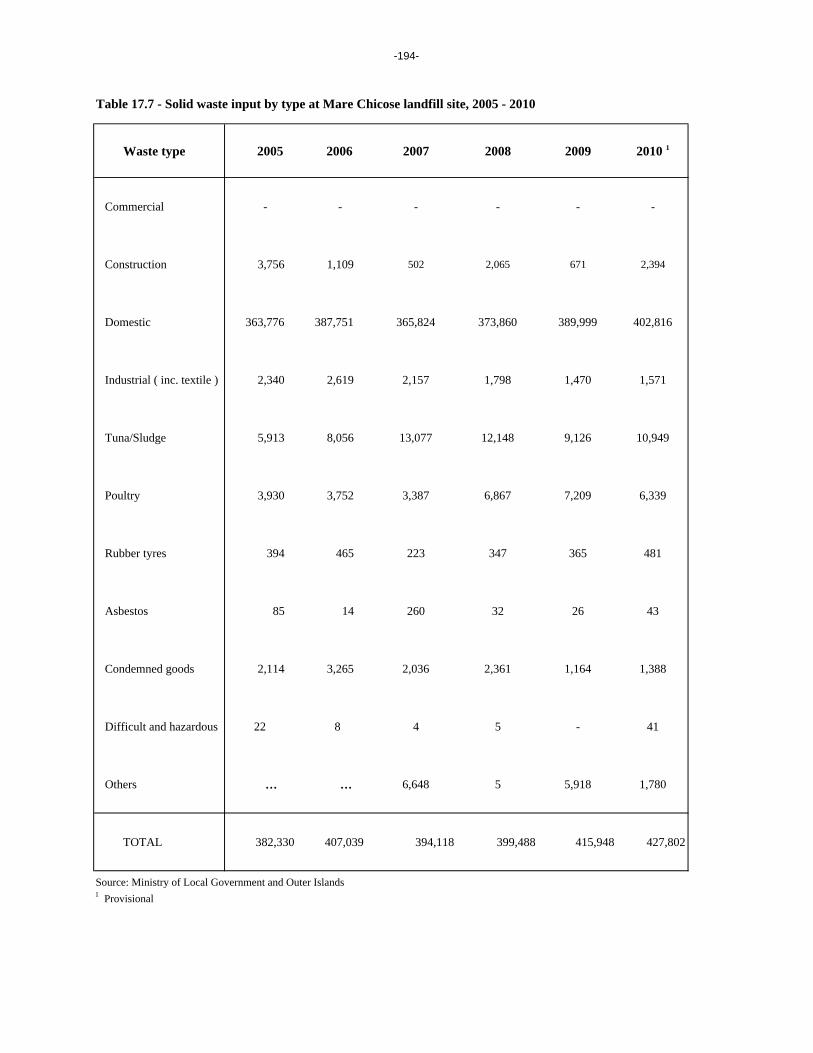
-194-
Table 17.7 - Solid waste input by type at Mare Chicose landfill site, 2005 - 2010
Waste type 2005 2006 2007 2008 2009 2010 1
Commercial - - - - - -
Construction 3,756 1,109 502 2,065 671 2,394
Domestic 363,776 387,751 365,824 373,860 389,999 402,816
Industrial ( inc. textile ) 2,340 2,619 2,157 1,798 1,470 1,571
Tuna/Sludge 5,913 8,056 13,077 12,148 9,126 10,949
Poultry 3,930 3,752 3,387 6,867 7,209 6,339
Rubber tyres 394 465 223 347 365 481
Asbestos 85 14 260 32 26 43
Condemned goods 2,114 3,265 2,036 2,361 1,164 1,388
Difficult and hazardous 22 8 4 5 - 41
Others … … 6,648 5 5,918 1,780
TOTAL 382,330 407,039 394,118 399,488 415,948 427,802
Source: Ministry of Local Government and Outer Islands1 Provisional
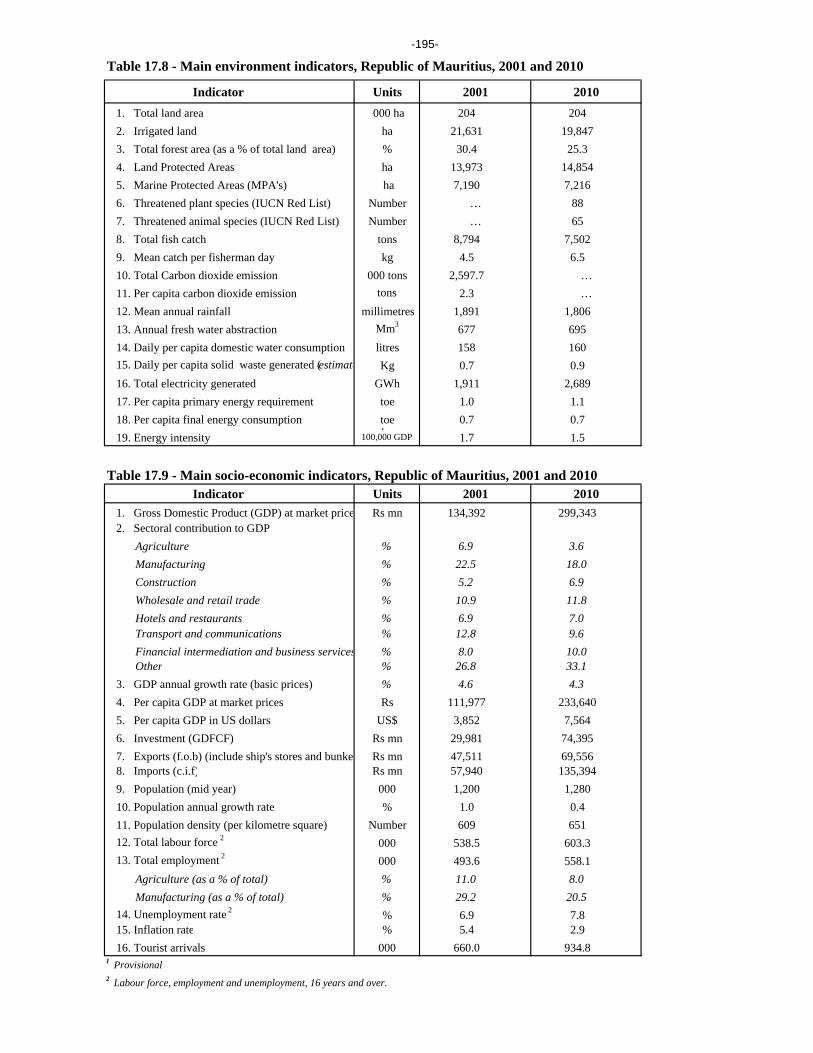
-195-
Indicator Units 2001 20101. Total land area 000 ha 204 2042. Irrigated land ha 21,631 19,8473. Total forest area (as a % of total land area) % 30.4 25.34. Land Protected Areas ha 13,973 14,8545. Marine Protected Areas (MPA's) ha 7,190 7,2166. Threatened plant species (IUCN Red List) Number … 887. Threatened animal species (IUCN Red List) Number … 658. Total fish catch tons 8,794 7,5029. Mean catch per fisherman day kg 4.5 6.510. Total Carbon dioxide emission 000 tons 2,597.7 …11. Per capita carbon dioxide emission tons 2.3 …12. Mean annual rainfall millimetres 1,891 1,80613. Annual fresh water abstraction Mm3 677 69514. Daily per capita domestic water consumption litres 158 16015. Daily per capita solid waste generated (estimate Kg 0.7 0.916. Total electricity generated GWh 1,911 2,68917. Per capita primary energy requirement toe 1.0 1.118. Per capita final energy consumption toe 0.7 0.719. Energy intensity
p100,000 GDP 1.7 1.5
Indicator Units 2001 20101. Gross Domestic Product (GDP) at market price Rs mn 134,392 299,3432. Sectoral contribution to GDP
Agriculture % 6.9 3.6Manufacturing % 22.5 18.0Construction % 5.2 6.9Wholesale and retail trade % 10.9 11.8Hotels and restaurants % 6.9 7.0Transport and communications % 12.8 9.6Financial intermediation and business services % 8.0 10.0Other % 26.8 33.1
3. GDP annual growth rate (basic prices) % 4.6 4.34. Per capita GDP at market prices Rs 111,977 233,6405. Per capita GDP in US dollars US$ 3,852 7,5646. Investment (GDFCF) Rs mn 29,981 74,3957. Exports (f.o.b) (include ship's stores and bunker Rs mn 47,511 69,5568. Imports (c.i.f) Rs mn 57,940 135,3949. Population (mid year) 000 1,200 1,28010. Population annual growth rate % 1.0 0.411. Population density (per kilometre square) Number 609 65112. Total labour force 2 000 538.5 603.313. Total employment 2 000 493.6 558.1
Agriculture (as a % of total) % 11.0 8.0Manufacturing (as a % of total) % 29.2 20.5
14. Unemployment rate 2 % 6.9 7.815. Inflation rate % 5.4 2.916. Tourist arrivals 000 660.0 934.8
1 Provisional2 Labour force, employment and unemployment, 16 years and over.
Table 17.8 - Main environment indicators, Republic of Mauritius, 2001 and 2010
Table 17.9 - Main socio-economic indicators, Republic of Mauritius, 2001 and 2010
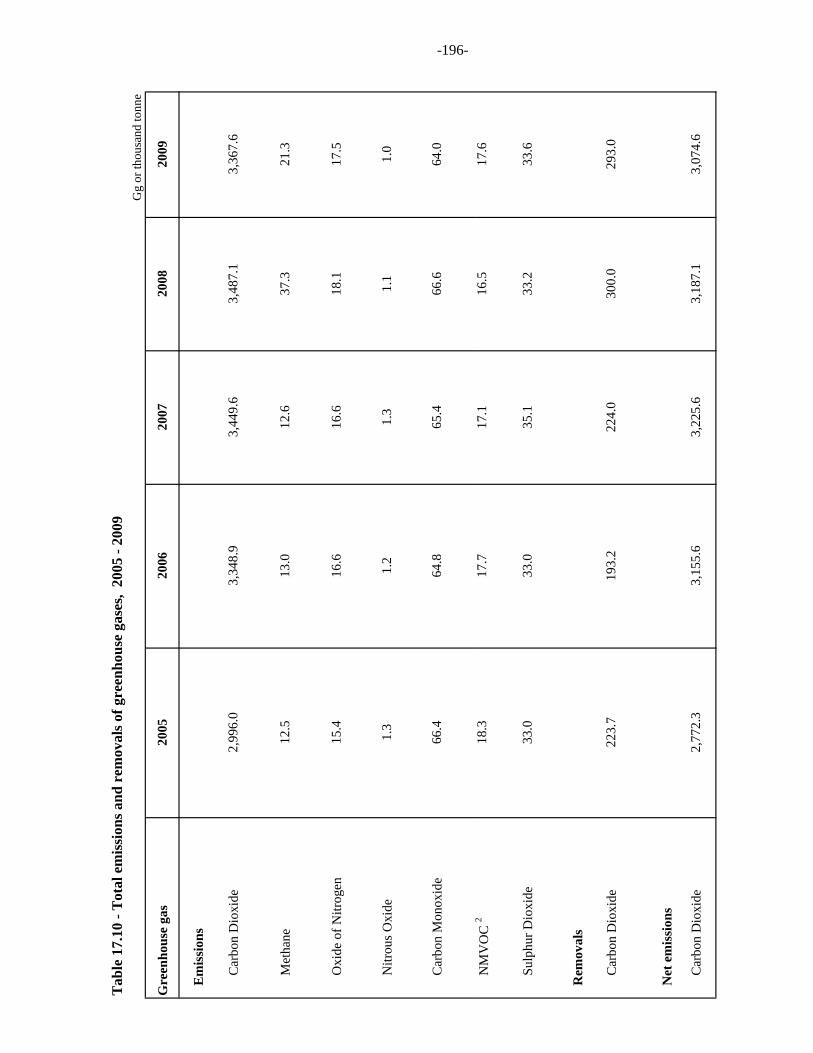
Tab
le 1
7.10
- T
otal
em
issi
ons a
nd r
emov
als o
f gre
enho
use
gase
s, 2
005
- 200
9
Gre
enho
use
gas
Em
issi
ons
Car
bon
Dio
xide
Met
hane
Oxi
de o
f Nitr
ogen
Nitr
ous O
xide
Car
bon
Mon
oxid
e
2
2007
2008
2009
12.5
13.0
12.6
37.3
21.3
2,99
6.0
3,34
8.9
G
g or
thou
sand
tonn
e
2005
2006
1.3
1.2
1.3
1.1
1.0
3,44
9.6
3,48
7.1
3,36
7.6
15.4
16.6
66.4
64.8
16.6
18.1
17.5
65.4
66.6
64.0
-196-
NM
VO
C 2
Sulp
hur D
ioxi
de
Rem
oval
s
Car
bon
Dio
xide
Net
em
issi
ons
Car
bon
Dio
xide
18.3
17.7
17.1
16.5
17.6
300.
029
3.0
35.1
33.2
33.6
2,77
2.3
3,15
5.6
3,22
5.6
3,18
7.1
3,07
4.6
33.0
33.0
223.
719
3.2
224.
0