Embed Size (px)
Citation preview
Economic Research Department
AnnualEnergy-Statistics 2021

Economic Research Department
Annual / Energy-Statistics 2021

About this statistical data book
This publication has been prepared by the Economic Research Department of Repsol with the aim to provide a tool that will aid objective analysis, discussion, and debate on energy markets. In this regard, the Energy Statistical Yearbook is available for access, both in Spanish and English, on the official Repsol website (repsol.com), and where it can also be downloaded in PDF and Excel formats. Further, this space provides interactive charts that may be viewed using Power BI.
The Energy Statistical Yearbook is an energy database with special emphasis on both the oil and natural gas sectors, as well as on electricity generation and sustainability indicators. It contains historical data relating to 50 countries and 10 geographical regions between 20051 and 2020 (the latest estimations). It represents the situation of the world energy sector covering more than 90% of global energy consumption.
Regarding the content and structure of this publication, firstly, it presents a brief analysis of the highlights of recent developments in the energy markets, including oil, natural gas and electricity, as well as CO2 emissions at international level, as well as a special analysis of the energy sector in Spain.
The second section presents a statistical annex with detailed information on the following areas:
• Oil: proven reserves, production, consumption, and prices.
• Natural Gas: proven reserves, production, consumption, and prices.
• Electricity: gross generation and renewables share.
• CO2 Emissions: emissions from fossil fuel combustion, intensity to GDP and emissions per capita.
• Primary Energy Intensity to GDP.
Finally, the Yearbook contains a dashboard for each region and country within the main magnitudes. Here you can find data on primary and final energy demand by both sources and sectors; total power generation and breakdown of sources; hydrocarbon consumption and foreign trade; and sustainability indicators.
In terms of methodology, estimations have been carried out using the most recent available data from various official sources (e.g., governmental, energy reference agencies, JODI and Bloomberg among others) following the same methodology as used by the International Energy Agency (IEA).
Data compilation, aggregation and validation has been made in collaboration with the consultancy firm ENERDATA (www.enerdata.net)
1 For visualization purposes, this document only represents the years from 2011 onwards. You can find the whole period in the downloadable Excel file (https://www.repsol.com/en/energy-and-innovation/energy-yearbook/index.cshtml).
Energy demand recent development .................................................................................... 8
CO2 emissions recent development ....................................................................................... 10
Oil market recent development .............................................................................................. 12
Natural gas market recent development ............................................................................ 14
Power generation recent development ................................................................................ 16
Spanish energy market recent development .................................................................... 18
STATISTICAL ANNEX
OilOil Proved Reserves ..................................................................................................................... 23Oil Production ................................................................................................................................. 24Oil Final Consumption ................................................................................................................ 25
Natural GasNatural Gas Proved Reserves ................................................................................................. 29Natural Gas Production ............................................................................................................ 30Natural Gas Demand .................................................................................................................. 31
Oil and Natural Gas prices .............................................................................................................. 35Electricity Generation
Total Power Generation ............................................................................................................. 37Renewables in Power Generation ....................................................................................... 38
CO2 Emissions from Fossil FuelsTotal CO2 Emissions ................................................................................................................... 40Oil CO2 Emissions ......................................................................................................................... 41Natural Gas CO2 Emissions ...................................................................................................... 42Coal CO2 Emissions ..................................................................................................................... 43CO2 Emissions Intensity to GDP ............................................................................................ 44CO2 Emissions per capita ......................................................................................................... 45
Primary Energy Intensity to GDP ................................................................................................ 47Regional and country data
World ................................................................................................................................................. 50OECD ............................................................................................................................................. 52Non-OECD .................................................................................................................................. 54
Africa ................................................................................................................................................. 56Algeria ......................................................................................................................................... 58Angola ......................................................................................................................................... 60Egypt ............................................................................................................................................ 62Libya ............................................................................................................................................ 64Nigeria ......................................................................................................................................... 66South Africa ............................................................................................................................. 68
Asia-Pacific ...................................................................................................................................... 70Australia ..................................................................................................................................... 72China ............................................................................................................................................. 74India .............................................................................................................................................. 76Indonesia .................................................................................................................................... 78Japan ........................................................................................................................................... 80Malaysia ...................................................................................................................................... 82New Zealand ............................................................................................................................ 84
Contents
South Korea .............................................................................................................................. 86Taiwan ......................................................................................................................................... 88Thailand ..................................................................................................................................... 90Vietnam ....................................................................................................................................... 92
Europe ............................................................................................................................................... 94Belgium ...................................................................................................................................... 96Czech Republic ....................................................................................................................... 98Finland ...................................................................................................................................... 100France ....................................................................................................................................... 102Germany .................................................................................................................................. 104Italy ............................................................................................................................................ 106Netherlands ........................................................................................................................... 108Norway ...................................................................................................................................... 110Poland ........................................................................................................................................ 112Portugal .................................................................................................................................... 114Romania .................................................................................................................................... 116Spain ........................................................................................................................................... 118Sweden ..................................................................................................................................... 120Turkey ......................................................................................................................................... 122United Kingdom .................................................................................................................... 124
Former Soviet Union ................................................................................................................ 126Kazakhstan ............................................................................................................................. 128Russia ........................................................................................................................................ 130Ukraine ...................................................................................................................................... 132Uzbekistan .............................................................................................................................. 134
Middle East ................................................................................................................................... 136Iran .............................................................................................................................................. 138Iraq .............................................................................................................................................. 140Kuwait ........................................................................................................................................ 142Saudi Arabia ........................................................................................................................... 144United Arab Emirates ........................................................................................................ 146
North America ............................................................................................................................. 148Canada ...................................................................................................................................... 150Mexico ........................................................................................................................................ 152United States ......................................................................................................................... 154
South and Central America .................................................................................................. 156Argentina ................................................................................................................................. 158Brazil .......................................................................................................................................... 160Chile ........................................................................................................................................... 162Colombia .................................................................................................................................. 164Peru ............................................................................................................................................ 165Venezuela ................................................................................................................................ 168
Conversion Factors ........................................................................................................................ 170
Glossary
Definitions ............................................................................................................................................. 171Geographical grouping .................................................................................................................... 171

Annual / Energy-Statistics 2021
Energy demand recent development
9
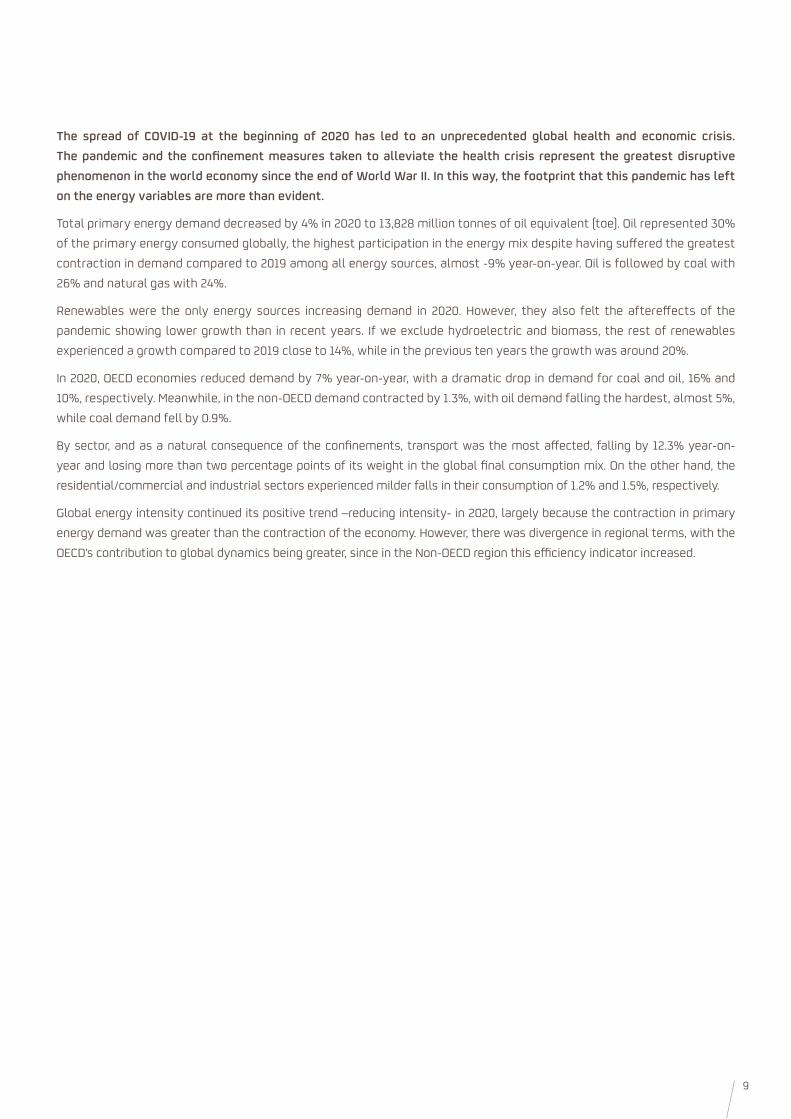
The spread of COVID-19 at the beginning of 2020 has led to an unprecedented global health and economic crisis. The pandemic and the confinement measures taken to alleviate the health crisis represent the greatest disruptive phenomenon in the world economy since the end of World War II. In this way, the footprint that this pandemic has left on the energy variables are more than evident.
Total primary energy demand decreased by 4% in 2020 to 13,828 million tonnes of oil equivalent (toe). Oil represented 30% of the primary energy consumed globally, the highest participation in the energy mix despite having suffered the greatest contraction in demand compared to 2019 among all energy sources, almost -9% year-on-year. Oil is followed by coal with 26% and natural gas with 24%.
Renewables were the only energy sources increasing demand in 2020. However, they also felt the aftereffects of the pandemic showing lower growth than in recent years. If we exclude hydroelectric and biomass, the rest of renewables experienced a growth compared to 2019 close to 14%, while in the previous ten years the growth was around 20%.
In 2020, OECD economies reduced demand by 7% year-on-year, with a dramatic drop in demand for coal and oil, 16% and 10%, respectively. Meanwhile, in the non-OECD demand contracted by 1.3%, with oil demand falling the hardest, almost 5%, while coal demand fell by 0.9%.
By sector, and as a natural consequence of the confinements, transport was the most affected, falling by 12.3% year-on-year and losing more than two percentage points of its weight in the global final consumption mix. On the other hand, the residential/commercial and industrial sectors experienced milder falls in their consumption of 1.2% and 1.5%, respectively.
Global energy intensity continued its positive trend –reducing intensity- in 2020, largely because the contraction in primary energy demand was greater than the contraction of the economy. However, there was divergence in regional terms, with the OECD’s contribution to global dynamics being greater, since in the Non-OECD region this efficiency indicator increased.

Annual / Energy-Statistics 2021
CO2 emissions recent development
11
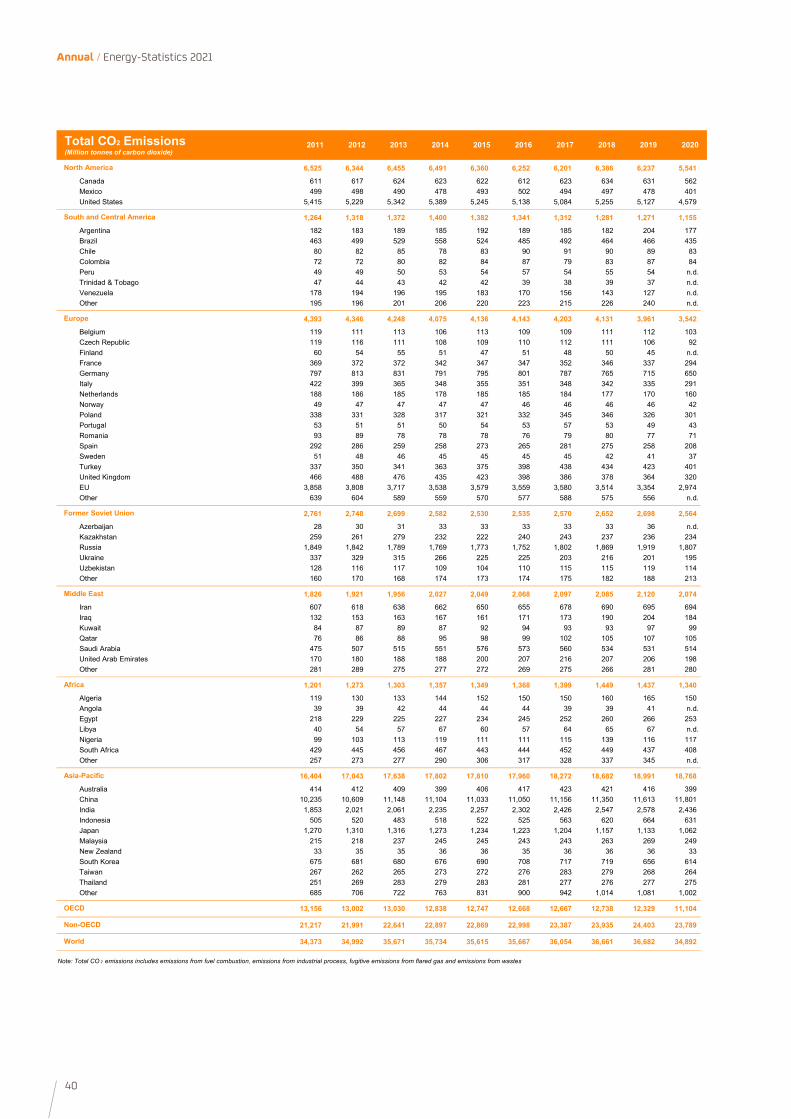
Closely linked to the economic and energy dynamics, CO2 emissions in 2020 fell sharply compared to the previous year (about 5%). A fall 8 times higher than that registered in 2009 due to the subprime crisis.
Regionally, the behavior was very different, and while in North America and Europe emissions fell by more than 10%, in Asia the reduction was a slight 1%. The reason was China, which was one of the few countries that increased its emissions and already emits more CO2 than all the OECD countries combined.
On the opposite side we find the US as the country with the largest reduction in emissions in levels, while Spain was the one with the largest percentage reduction (-19% compared to 2019).
The picture is very different looking at other indicators, such as per capita emissions, where the Countries of the Persian Gulf continue to top the list. As an example, each Qatari generates almost 8 times more CO2 than the world average. In the case of Spain, the fall in emissions has caused that during this 2020 per capita emissions are slightly below the global average (4.4 tons per inhabitant compared to the 4.5 t/hab global average).
Regarding to emissions intensity (emissions per unit of GDP), European countries continue to be the most efficient with their emissions, well below most large emitters, making emissions per dollar of GDP in the EU 45% below the world average. Within the EU, Spain is almost 15% below the European average. It should be noted that most countries have improved this indicator during the year 2020 indicating that, in this time of paralysis due to the pandemic, the reduction in emissions has been greater than the economic contraction.

Annual / Energy-Statistics 2021
Oil market recent development
13
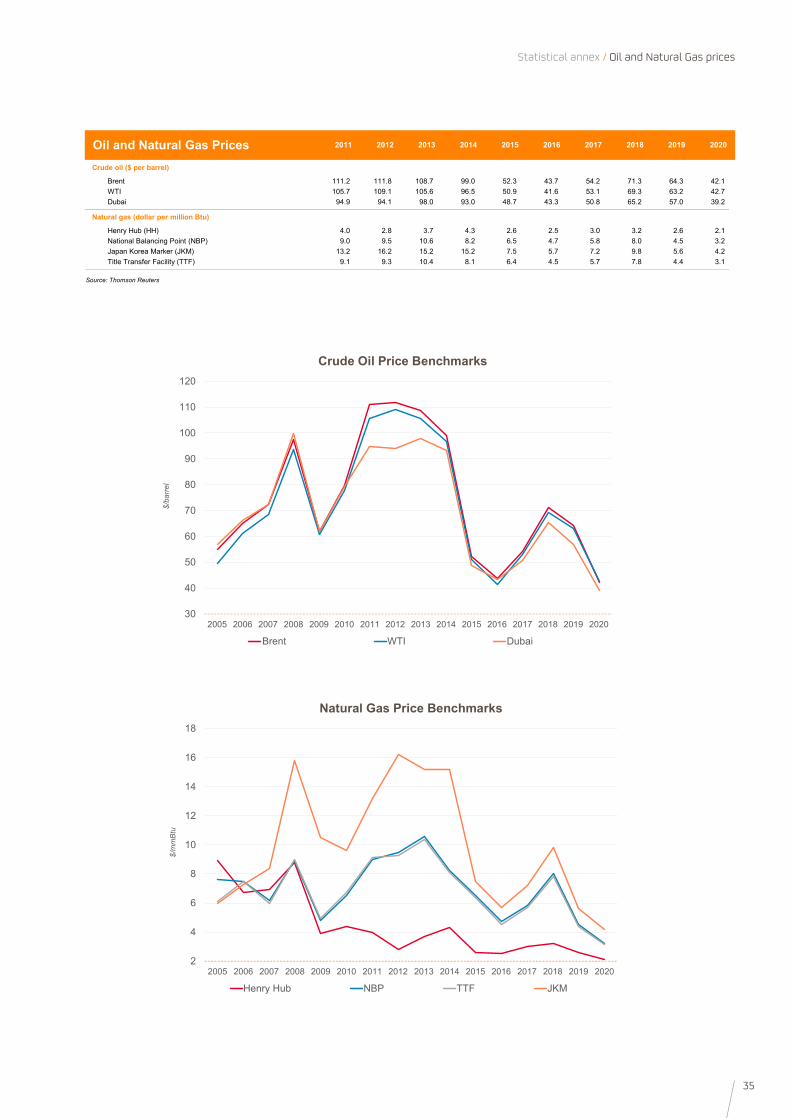
Brent crude price averaged 42 dollars per barrel ($/bl) in 2020, a sharp drop of 35% compared to the average price of 2019. The COVID-19 pandemic has led to an unprecedented crisis in the oil market.
The health and economic crisis derived from the pandemic led the price of crude to evolve with great volatility. In April 2020 Brent prices, the global benchmark, traded below 20 $/bl, a level not seen since the beginning of the century. At those critical moments, US benchmark crude WTI reached negative levels of -37 $/bl for the first time in history. From then on, crude prices began a progressive upward trend, which took prices to 50 $/bl at the end of the year. The levers that supported this trend are found in both supply and demand factors. On the supply side, and except for the response of the OPEC+ group in March 2020 when an agreement to attack the effects of the pandemic on demand was not reached, leading to a price war, the OPEC+ response was more agile than previous occasions and with had successful effects. The group agreed to cut a record 9.7 million bl/d in April 2020. And unlike the price shock that took place in 2015, when prices plummeted 47% vs. 2014, the group carried out and continues to carry out an exhaustive monitoring of the market in real time. As a result, the countries adhering to the agreement progressively relaxed production cuts to 7.7 million bl/d in December 2020. At the time of writing this report, OPEC+ countries agreed to increase production by 400 thousand bl/d on a monthly basis starting August to December, as well as extending the agreement until December 2022. This commitment is a sign of the group’s willingness to rebalance the markets and, at the same time, support prices.
Regarding demand factors, the pandemic led to a drop in global oil demand of 8.7 million bl/d compared to 2019, the largest annual contraction in oil consumption the world has ever seen. The mobility restrictions imposed to stop the spread of the virus brought the global economy in general and oil demand in particular to a drastic halt. The second quarter of the year saw a sharp drop of 16 million bl/d, bringing global oil consumption to 2005 levels. The summer season, associated with greater mobility, underpinned oil consumption which increased by almost 10 million bl/d during the third quarter compared to the previous quarter. This made more evident the dynamics that oil demand follows in times of the COVID/19 pandemic: any relief of the effects of the pandemic through the relaxation of restrictive measures leads to an increase in mobility. This dynamic was accelerated with the appearance of the first vaccines against COVID-19 in November 2020. Brent prices, which by then averaged 43 $/bl, started an upward trend that has led prices to average 73 $/bl in June 2021.
Looking ahead, the evolution of oil prices will depend fundamentally on the evolution of the pandemic. In other words, increases in restrictions caused by the increase in the incidence of the virus, or problems related to vaccination programs may again lead to restrictions on mobility. And vice versa. Likewise, OPEC+’s production cuts agreement should support prices. As has been seen recently, the extension of the agreement until December 2022 is a representative sample of the commitment with the rebalancing of the oil markets, not only from the de facto leaders Saudi Arabia and Russia, but from the OPEC+ group as a whole.

Annual / Energy-Statistics 2021
Natural gas market recent development
15
The year 2020 was marked by the expansion of Covid-19 and the effects it had on economic activity and energy markets. As a result, natural gas prices fell sharply. In the US, the Henry Hub averaged $2.1/MMBtu in 2020, a level not recorded since the mid-90s, while Asian LNG (Japan Korea Marker) prices recorded their lowest level, 4.2 $/MMBtu. In Europe, prices also plummeted, will main prices slightly above 3 $/MMBtu.
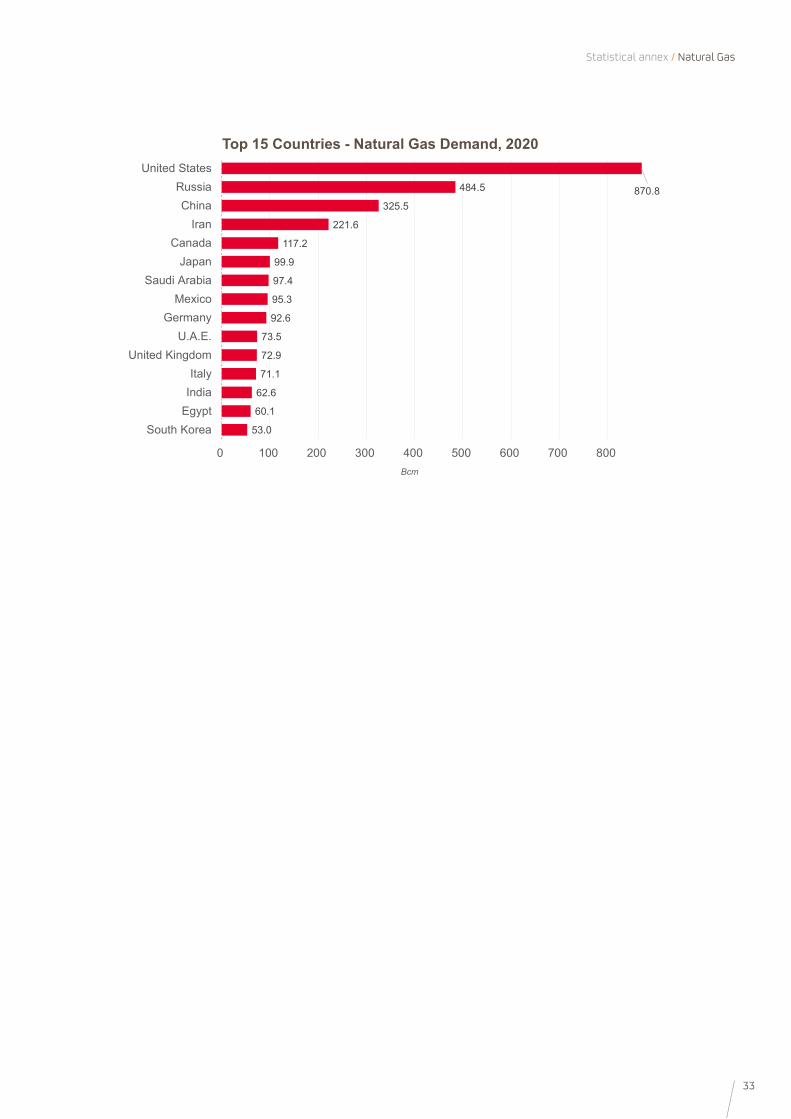
On the demand side, global natural gas consumption fell by 48 Bcm. However, the share of gas in primary energy remained above20%. The drops in gas demand vs 2019 were led by CIS (-18 Bcm), Europe (-16 Bcm) and South-Central America (-15 Bcm). These declines were partially offset by increases in the Middle East and Asia-Pacific (+5 Bcm and +4 Bcm, respectively). An earlier return to economic and industrial activity, allowed these regions to recover progressively normal levels of gas demand.
Despite this context, interruptions in the supply of gas (mainly in Asia-Pacific), the resumption of economic activity and different cold waves experienced in Asia and Europe at the end of the year, caused a strong rebound in demand and prices, which rocketed in 4Q20, offsetting the “bad numbers” of the previous quarters.
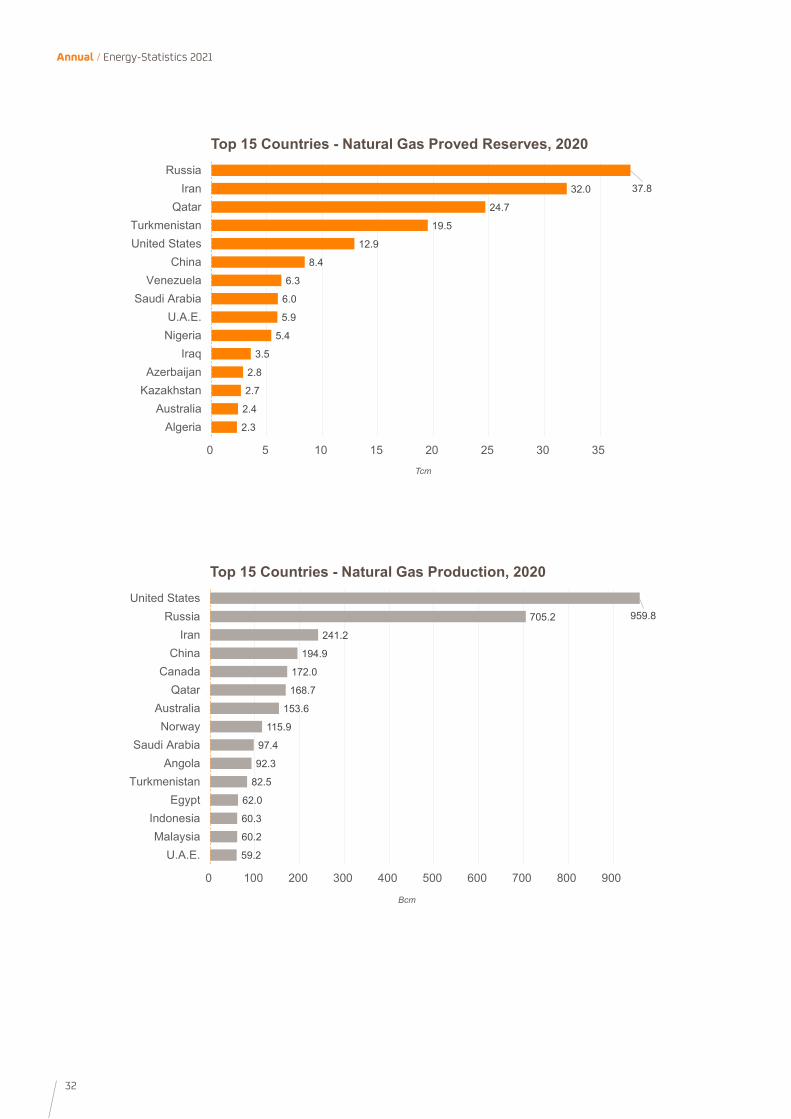
On the supply side, there were also contractions. By main producing regions, Russia led the fall with a production 6% lower than in 2019, about 47 Bcm less. Production also contracted in Europe, with the Netherlands leading the way, which reduced its production share by almost 10 Bcm year-on-year. With demand weakened and as gas prices fell below operating costs, production also fell in the US, even causing the cancellation of LNG cargoes. The average utilization rates of LNG facilities in this country began to decline in April last year, reaching a low of around 30-35% in mid-summer. Even so, with the recovery in 4Q21, U.S. LNG exports increased year-on-year, helped by the entry into operation of new LNG trains and capacity expansions in existing ones.
In summary, global gas production fell by 65 Bcm, surpassing the fall in demand, which helped to balance the natural gas market. Nowadays, Covid-19 is still active although the expansion of vaccination programs has prevented economic and industrial activity from being paralysed again. In fact, during the first half of 2021, the natural gas market has continued the path started at the end of 2020, with a tight market, strong Asian import appetite, low inventories in Europe and very high global prices. For the rest of the year, high price levels are expected to continue, even recovering average levels close to those seen in 2018.

Annual / Energy-Statistics 2021
Power generation recent development
17
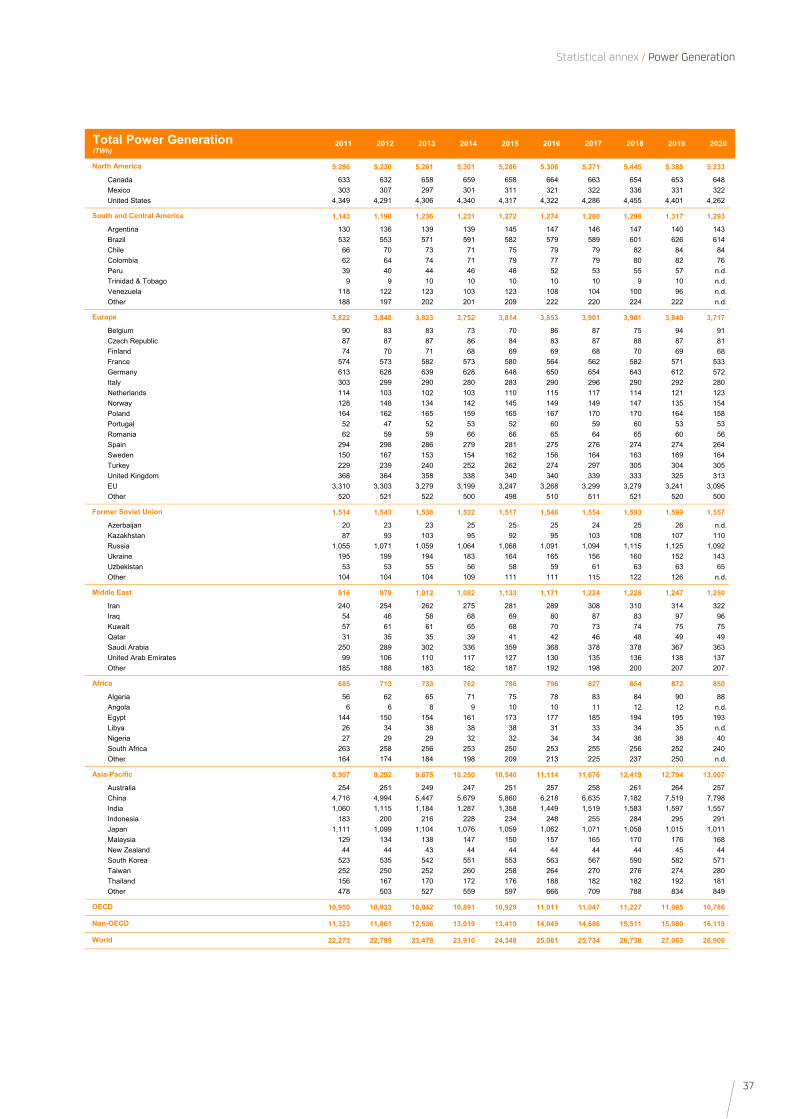
The decline in economic activity in 2020 due to the coronavirus crisis caused the first contraction in global electricity generation since 2009 and, compared to the average growth of demand in the last decade of 3% per year, in 2020 there was a contraction of 0.6%.
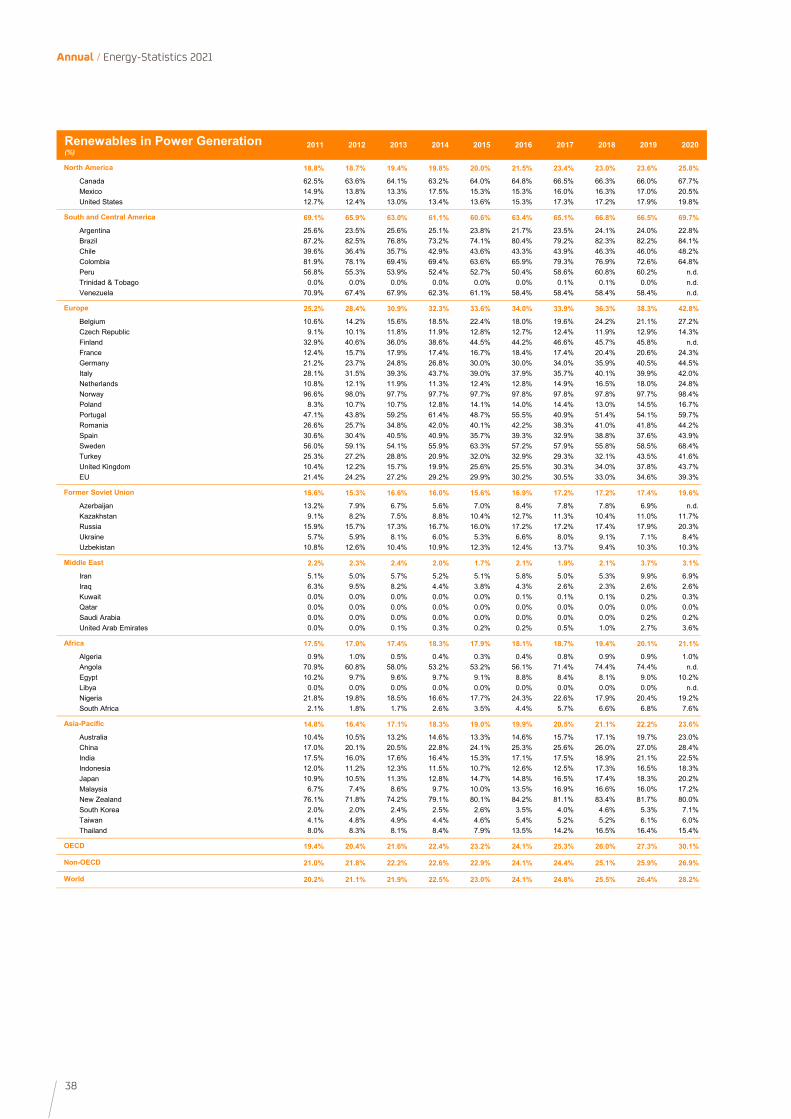
This reduction in demand, together with the new renewable generation capacity, caused the largest increase in the renewable’s generation share in recent years on a global scale, increasing up to two percentage points (p.p) compared to 2019. Only wind increased its share by 0.7 p.p. while solar by 0.5 p.p. It should be noted that the share of generation with renewables - excluding hydroelectric and biomass - in the OECD reached 13.5% in 2020, while in the world it stood at 9.6%.
The only energy source that increased its share in global generation, besides renewables, was natural gas. The rest of the sources lowered their share, with coal being the most affected, falling almost 1.5 p.p. its share.
In the European Union (28) the contraction in electricity demand was much greater than in the rest of the world’s major economies, registering a reduction of 4.5%, compared to -3.1% in the US or the 3.7% increase in electricity demand in China. Within the EU, Spain remained in the intermediate range, with a fall of 3.7%, while France and Germany recorded contractions of 6.7% and 6.5%.

Annual / Energy-Statistics 2021
Spanish energy market recent development
19
The reduction in commercial and industrial activity caused in Spain one of the largest contractions in oil consumption in the world (-18%) much higher than in the countries around us (the fall in the EU as a whole was 13%) and doubling the global average fall.
Within petroleum products, it was diesel that recorded the largest correction in demand in levels. However, in percentage terms it was the kerosene who were most affected by the drastic stoppage of the aviation sector, which caused falls of more than 90% during the second quarter of the year. In the whole of the year, diesel increased its share to almost 60% of the Spanish product mix.
In the case of natural gas consumption, the Spanish system also suffered a significant contraction of 10%, compared to an average growth of 5% in the period 2015-2019. Most of this drop in demand was caused by the reduced need for gas for electricity generation.
The electricity market in Spain in 2020 was characterized by a sharp fall in prices, due to lower demand and the fall in gas prices, as well as the entry of new renewable generation capacity. Finally, prices in the wholesale electricity market averaged below 34 €/MWh during the year, the lowest value since 2004.
In 2020, nearly 3 GW of solar PV power and 1.8 GW of wind power were installed, offsetting the closure of nearly 4 GW of coal-fired generation capacity. With these new installations, solar capacity has multiplied by 2.5 in just two years, and wind has surpassed natural gas combined cycles, positioning itself as the technology with the highest installed capacity in the Spanish park.
In the share of generation by technology there is little change from the previous year. Nuclear continued to be the main source of generation, closely followed by wind power. While the presence of natural gas and coal was significantly reduced given that, faced with a scenario of contraction in demand, the technologies that stop producing are those with the highest operating costs.
Thus, the Spanish mix closed 2020 with 44% of renewable generation, improving 4 percentage points over the previous year, while emission-free generation amounted to 66%.
Consumption indicators for the first months of 2021 for petroleum products do not show a recovery in demand and continue 18% below that recorded in 2019 (with kerosene almost 75% below what was recorded pre-pandemic). In the case of gas, direct consumption has practically recovered (it is 1.5% below 2019), however, the demand for gas for electricity generation is almost 24% below the levels of 2019, weighed down by high gas prices.
In the case of electricity, all historical price records have been broken during the beginning of 2021, but it wasn’t only because of an extraordinary and punctual event, such as the snowfall of the Filomena storm, but it has come hand in hand with the increase in natural gas prices and CO2 emissions. The price of the electricity pool until July has been above 63 €/MWh, 35% above the same dates of the 2015-2019 period. No price easing is expected in the coming months, as both European gas and CO2 futures remain high. Even the intention on the part of the European Union to tighten up emissions targets causes a clearly upside risk in terms of the prices of emission rights, which have already stabilized comfortably above 50 €/t. But let us remember that the wholesale cost of electricity, even at these levels does not explain more than 40% of the final price, the rest are charges and taxes.


Statistical annex

Oil
23
Statistical annex / Oil
2011 2012 2013 2014 2015 2016 2017 2018 2019 2020
224.1 227.9 231.6 236.9 229.2 228.1 228.7 246.1 243.9 242.9
Canada 174.2 173.7 173.0 172.2 171.5 170.5 171.8 170.7 169.1 168.1Mexico 10.2 10.0 10.1 9.8 9.7 7.6 7.0 6.5 6.1 6.1United States 39.8 44.2 48.5 55.0 48.0 50.0 49.9 68.9 68.8 68.8
321.7 322.3 323.6 325.5 322.8 322.7 329.1 324.4 324.0 323.4
Argentina 2.5 2.4 2.3 2.4 2.4 2.2 2.0 2.4 2.5 2.5Brazil 15.0 15.3 15.5 16.2 13.0 12.6 12.8 13.4 12.7 11.9Chile 0.2 0.2 0.2 0.2 0.2 0.2 0.2 0.2 0.2 0.2Colombia 2.0 2.2 2.4 2.4 2.3 2.0 1.7 1.8 2.0 2.0Peru 1.2 1.4 1.6 1.4 1.2 1.2 1.0 0.9 0.8 0.7Trinidad & Tobago 0.7 0.7 0.7 0.7 0.7 0.2 0.2 0.2 0.2 0.2Venezuela 297.6 297.7 298.4 300.0 300.9 302.3 302.8 303.8 303.8 303.8Other 2.5 2.4 2.5 2.3 2.2 2.1 8.5 1.7 1.9 2.0
13.9 14.2 13.7 12.9 13.9 13.1 13.6 14.5 14.2 13.6
France 0.1 0.1 0.1 0.1 0.1 0.1 0.1 0.1 0.1 0.1Germany 0.3 0.3 0.2 0.1 0.1 0.1 0.1 0.1 0.1 0.1Italy 0.5 0.5 0.6 0.5 0.6 0.6 0.5 0.5 0.5 0.5Netherlands 0.3 0.2 0.2 0.2 0.3 0.2 0.1 0.1 0.1 0.1Norway 6.9 7.5 7.0 6.5 8.0 7.6 7.9 8.6 8.5 7.9Poland 0.2 0.2 0.2 0.1 0.1 0.1 0.1 0.1 0.1 0.1Romania 0.6 0.6 0.6 0.6 0.6 0.6 0.6 0.6 0.6 0.6Spain 0.2 0.2 0.2 0.2 0.2 0.2 0.2 0.2 0.2 0.2Turkey 0.3 0.3 0.3 0.3 0.3 0.3 0.3 0.3 0.4 0.4United Kingdom 3.1 3.0 3.0 3.0 2.8 2.6 2.5 2.5 2.7 2.5EU 3.1 2.9 2.8 2.7 2.6 2.4 2.4 2.4 2.4 2.4Other 1.5 1.4 1.3 1.1 0.9 0.7 1.2 1.4 0.9 1.2
144.2 143.9 143.5 141.6 140.8 144.7 145.0 145.7 146.2 146.2
Azerbaijan 7.0 7.0 7.0 7.0 7.0 7.0 7.0 7.0 7.0 7.0Kazakhstan 30.0 30.0 30.0 30.0 30.0 30.0 30.0 30.0 30.0 30.0Russia 105.7 105.5 105.0 103.2 102.4 106.3 106.6 107.2 107.8 107.8Ukraine 0.4 0.4 0.4 0.4 0.4 0.4 0.4 0.4 0.4 0.4Uzbekistan 0.6 0.6 0.6 0.6 0.6 0.6 0.6 0.6 0.6 0.6Other 0.5 0.5 0.5 0.5 0.5 0.5 0.5 0.5 0.5 0.5
797.9 799.3 802.9 803.1 802.9 807.7 807.7 833.9 836.0 835.9
Iran 154.6 157.3 157.8 157.5 158.4 157.2 155.6 155.6 157.8 157.8Iraq 143.1 141.4 140.3 144.2 143.1 142.5 148.8 147.2 145.0 145.0Kuwait 101.5 101.5 101.5 101.5 101.5 101.5 101.5 101.5 101.5 101.5Qatar 23.9 25.2 25.1 25.7 25.2 25.2 25.2 25.2 25.2 25.2Saudi Arabia 265.4 265.9 265.8 266.6 266.5 266.2 266.2 297.7 297.6 297.5United Arab Emirates 97.8 97.8 97.8 97.8 97.8 97.8 97.8 97.8 97.8 97.8Other 11.7 10.2 14.6 9.7 10.5 17.3 12.6 8.8 11.1 11.1
124.6 127.4 127.5 126.8 127.6 127.9 126.6 125.7 125.0 125.1
Algeria 12.2 12.2 12.2 12.2 12.2 12.2 12.2 12.2 12.2 12.2Angola 9.1 9.1 9.0 8.4 9.5 9.5 9.5 8.2 7.8 7.8Egypt 4.3 4.2 3.9 3.7 3.5 3.4 3.6 3.2 3.1 3.1Libya 48.0 48.5 48.4 48.4 48.4 48.4 48.4 48.4 48.4 48.4Nigeria 36.2 37.1 37.1 37.4 37.1 37.5 37.5 37.0 36.9 36.9Other 14.8 16.3 17.0 16.6 17.0 16.9 15.4 16.8 16.6 16.7
47.9 48.5 49.1 47.7 46.6 45.9 45.8 45.9 45.3 45.2
Australia 3.9 3.9 4.0 2.4 2.4 2.4 2.4 2.4 2.4 2.4China 20.4 23.7 24.4 24.6 25.1 25.6 25.6 25.9 26.2 26.0India 5.7 5.7 5.7 5.7 4.8 4.7 4.5 4.5 4.7 4.5Indonesia 3.7 3.7 3.7 3.6 3.6 3.3 3.2 3.2 2.5 2.4Malaysia 3.7 3.7 3.8 3.6 3.0 2.8 2.7 2.7 2.7 2.7New Zealand 0.1 0.1 0.1 0.1 0.1 0.1 0.1 0.0 0.0 0.0Thailand 0.5 0.4 0.5 0.4 0.4 0.3 0.3 0.3 0.3 0.3Vietnam 4.4 4.4 4.4 4.4 4.4 4.4 4.4 4.4 4.4 4.4Other 5.5 2.8 2.6 2.8 2.8 2.3 2.5 2.5 2.2 2.3
242.8 247.2 250.5 253.6 246.8 244.6 256.7 263.7 261.5 260.0
1,431.5 1,436.3 1,441.3 1,440.8 1,437.1 1,445.6 1,439.9 1,472.4 1,473.3 1,472.4
1,173.2 1,175.0 1,180.5 1,180.6 1,182.6 1,189.0 1,215.0 1,214.5 1,216.0 1,216.0
501.1 508.6 511.4 513.8 501.3 501.2 481.6 521.7 518.8 516.4
1,674.3 1,683.6 1,691.9 1,694.4 1,683.9 1,690.3 1,696.6 1,736.1 1,734.8 1,732.4
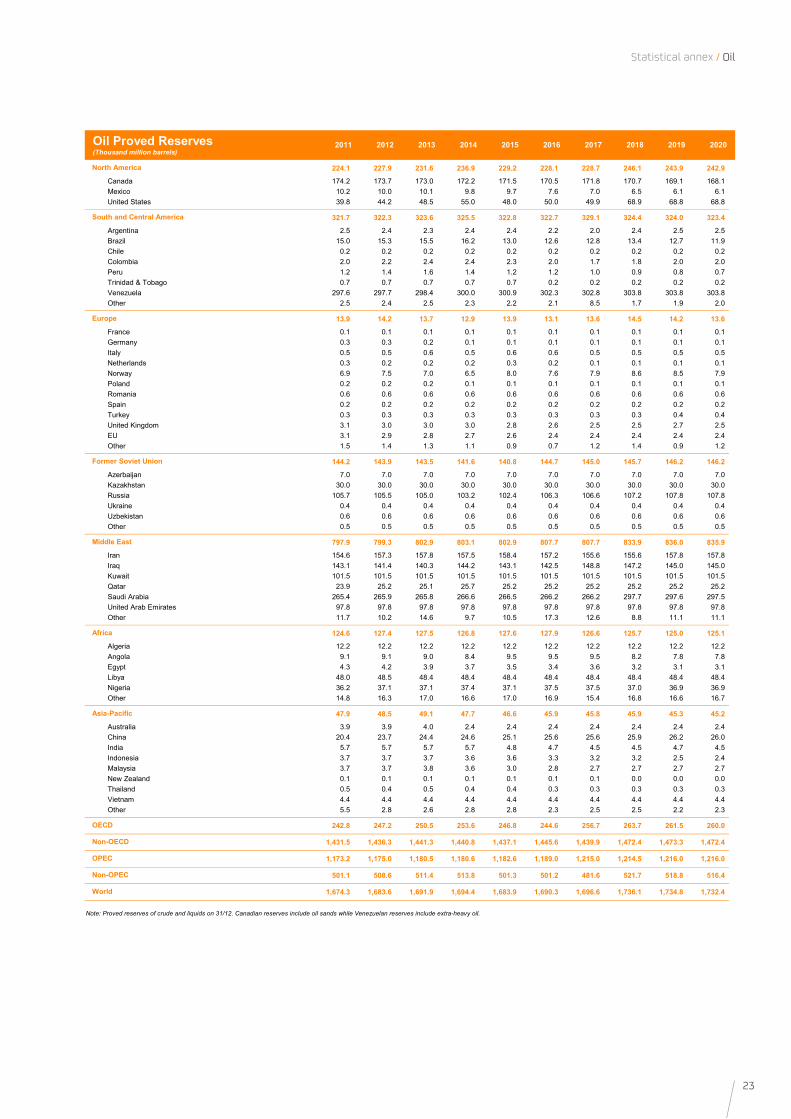
Note: Proved reserves of crude and liquids on 31/12. Canadian reserves include oil sands while Venezuelan reserves include extra-heavy oil.
Europe
South and Central America
North America
Oil Proved Reserves(Thousand million barrels)
Middle East
Former Soviet Union
World
Non-OPEC
OPEC
Non-OECD
OECD
Asia-Pacific
Africa
24
Annual / Energy-Statistics 2021
2011 2012 2013 2014 2015 2016 2017 2018 2019 2020
14,672 15,955 17,352 19,250 20,157 19,591 20,527 22,993 24,636 23,810
Canada 3,649 3,891 4,145 4,425 4,536 4,615 4,990 5,408 5,544 5,303Mexico 2,943 2,920 2,890 2,799 2,597 2,463 2,229 2,073 1,928 1,932United States 8,080 9,144 10,317 12,026 13,024 12,513 13,308 15,512 17,164 16,575
7,502 7,466 7,489 7,710 7,845 7,529 7,269 6,641 6,331 5,914
Argentina 674 674 649 659 650 625 595 621 647 609Brazil 2,211 2,167 2,133 2,367 2,547 2,628 2,755 2,713 2,897 3,044Chile 13 11 11 9 6 5 6 9 12 9Colombia 918 953 1,016 997 1,014 906 862 873 893 788Peru 0 0 0 0 0 0 0 0 1 70Trinidad & Tobago 16 16 16 16 16 16 16 16 16 15Venezuela 2,751 2,733 2,722 2,672 2,665 2,429 2,133 1,534 982 578Other 919 912 942 990 947 920 902 875 883 801
3,975 3,669 3,463 3,471 3,629 3,650 3,605 3,578 3,454 3,653
Czech Republic 8 8 5 7 7 5 7 6 5 8France 49 37 31 28 31 31 30 21 34 35Germany 84 84 76 62 67 68 67 67 62 76Italy 127 138 134 128 131 96 97 110 89 111Netherlands 32 30 31 38 36 24 24 23 18 23Norway 2,040 1,917 1,838 1,889 1,948 1,995 1,969 1,850 1,737 2,001Poland 25 23 30 29 28 22 24 32 30 30Portugal 1 0 1 1 0 1 1 0 1 0Romania 88 85 84 82 82 78 74 73 72 69Spain 20 32 10 6 5 3 2 2 1 1Turkey 46 45 47 48 48 49 49 55 58 62United Kingdom 1,123 955 887 873 972 1,026 1,009 1,109 1,135 1,057EU 3,893 3,583 3,372 3,378 3,538 3,564 3,521 3,490 3,364 3,561Other 332 315 289 280 274 252 252 230 212 180
13,573 13,599 13,833 13,896 14,036 14,205 14,314 14,573 14,643 13,500
Azerbaijan 924 879 885 862 849 829 784 793 765 699Kazakhstan 1,703 1,683 1,733 1,728 1,694 1,669 1,848 1,937 1,942 1,836Russia 10,539 10,623 10,793 10,892 11,084 11,328 11,321 11,494 11,582 10,607Ukraine 69 76 69 61 54 50 49 51 55 54Uzbekistan 71 63 60 56 52 48 46 43 40 38Other 267 275 293 297 303 281 266 255 259 266
27,578 28,120 27,983 28,431 29,761 31,506 31,069 31,640 30,226 27,772
Iran 4,164 3,551 3,289 3,429 3,593 4,422 4,762 4,612 3,370 3,018Iraq 2,741 3,021 3,146 3,415 4,078 4,503 4,563 4,663 4,812 4,148Kuwait 2,771 2,985 3,109 3,090 3,097 3,194 3,014 3,050 2,987 2,717Qatar 895 925 955 950 988 1,012 978 986 979 957Saudi Arabia 11,217 11,742 11,513 11,605 12,045 12,344 11,876 12,345 11,914 11,106United Arab Emirates 3,204 3,355 3,478 3,552 3,762 3,848 3,740 3,801 4,009 3,675Other 2,586 2,541 2,493 2,390 2,198 2,183 2,136 2,183 2,155 2,151
8,823 9,660 8,820 8,390 8,323 7,796 8,205 8,309 8,451 6,997
Algeria 1,672 1,619 1,573 1,585 1,590 1,604 1,530 1,512 1,490 1,356Angola 1,712 1,834 1,772 1,696 1,796 1,743 1,701 1,543 1,449 1,328Egypt 689 694 696 709 696 664 639 649 633 597Libya 485 1,476 953 497 437 426 877 1,029 1,159 384Nigeria 2,490 2,482 2,293 2,330 2,246 1,928 1,986 2,030 2,123 1,856South Africa 120 131 120 103 106 103 106 102 104 92Other 1,655 1,424 1,413 1,470 1,452 1,328 1,366 1,444 1,493 1,384
8,252 8,321 8,138 8,174 8,315 8,018 7,798 7,665 7,720 7,538
Australia 473 465 393 412 371 345 315 345 458 464China 4,044 4,102 4,144 4,181 4,271 3,982 3,892 3,848 3,921 3,970India 915 904 883 881 872 852 861 845 803 750Indonesia 942 902 861 835 817 866 824 798 772 734Japan 17 16 14 13 12 11 12 10 11 10Malaysia 652 657 624 653 701 737 729 723 670 604New Zealand 52 47 41 46 48 41 37 30 30 26South Korea 20 21 19 20 22 24 25 29 28 34Thailand 407 443 438 436 451 462 455 445 442 410Other 730 764 721 697 750 698 648 592 585 536
34,056 35,664 34,628 34,659 36,050 37,117 36,861 36,848 35,041 30,856
54,361 55,219 56,734 59,166 60,587 59,859 60,730 63,597 65,554 63,025
Global biofuels 1,879 1,922 2,090 2,273 2,288 2,391 2,461 2,669 2,779 2,584
2,164 2,171 2,192 2,230 2,282 2,288 2,342 2,377 2,356 2,113
88,417 90,883 91,362 93,825 96,637 96,976 97,591 100,445 100,595 93,881
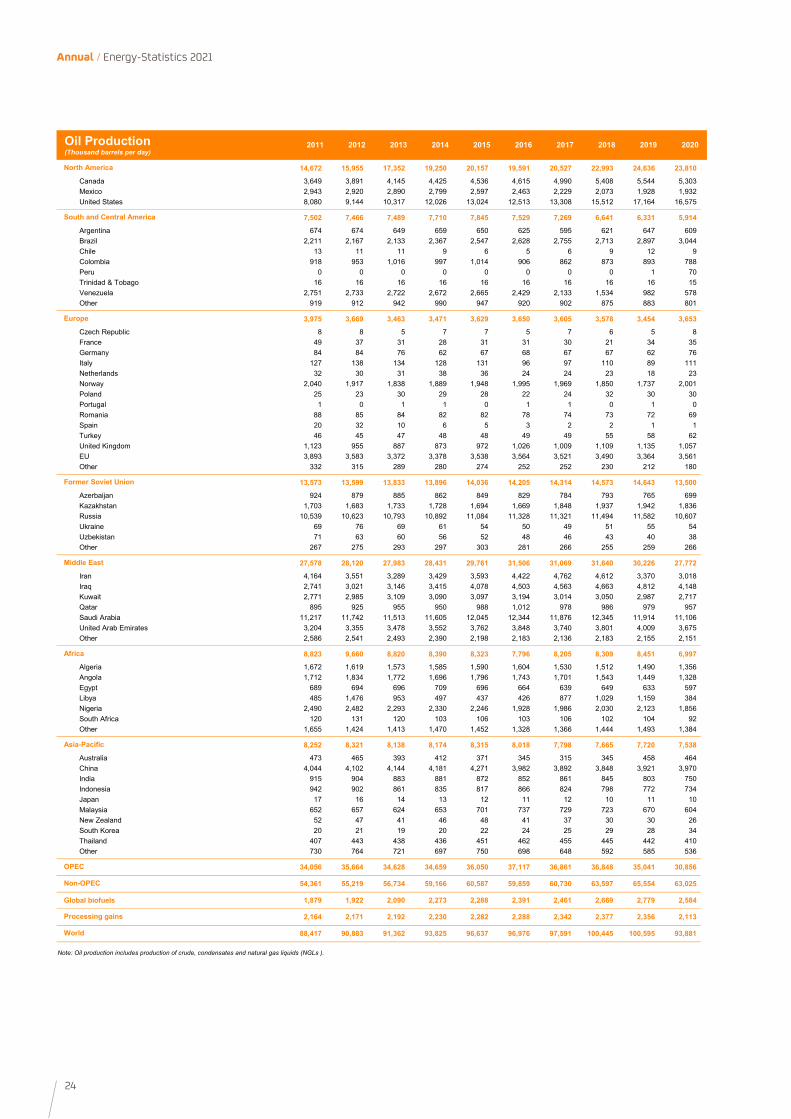
Note: Oil production includes production of crude, condensates and natural gas liquids (NGLs ).
Middle East
Former Soviet Union
Africa
Non-OPEC
World
Processing gains
Asia-Pacific
OPEC
Oil Production(Thousand barrels per day)
North America
South and Central America
Europe
25
Statistical annex / Oil
2011 2012 2013 2014 2015 2016 2017 2018 2019 2020
23,760 23,331 23,773 23,842 24,286 24,518 24,756 25,361 25,285 22,225
Canada 2,392 2,438 2,418 2,389 2,440 2,466 2,464 2,525 2,370 2,102Mexico 2,120 2,102 2,090 2,040 2,006 2,053 2,019 2,019 2,052 1,680United States 19,248 18,791 19,265 19,413 19,840 19,999 20,273 20,822 20,863 18,443
6,532 6,753 6,950 7,074 6,993 6,789 6,736 6,606 6,603 5,953
Argentina 663 679 693 688 682 677 666 648 625 535Brazil 2,869 2,975 3,125 3,257 3,191 3,004 3,043 2,976 3,078 2,928Chile 332 332 339 336 331 352 357 363 369 336Colombia 307 326 324 330 341 375 349 352 361 311Peru 212 219 225 223 235 246 260 265 269 232Trinidad & Tobago 43 40 44 44 46 47 44 37 36 31Venezuela 772 830 828 809 710 629 565 477 360 220Other 1,334 1,352 1,372 1,387 1,457 1,459 1,452 1,488 1,505 1,360
15,041 14,562 14,349 14,257 14,577 14,777 15,176 15,075 15,022 13,146
Belgium 611 596 615 607 623 632 638 683 665 589Czech Republic 198 195 188 202 196 180 214 217 219 192Finland 208 200 211 207 207 210 208 211 204 209France 1,824 1,789 1,764 1,745 1,746 1,707 1,736 1,688 1,690 1,433Germany 2,392 2,389 2,435 2,374 2,368 2,383 2,450 2,333 2,362 2,149Italy 1,494 1,370 1,260 1,266 1,274 1,237 1,244 1,272 1,205 1,021Netherlands 991 963 940 932 921 937 946 931 899 885Norway 225 220 218 216 223 212 215 222 207 180Poland 559 533 505 504 541 582 658 680 694 660Portugal 256 230 234 233 237 237 242 231 250 202Romania 184 192 187 190 194 204 217 214 228 227Spain 1,385 1,301 1,208 1,200 1,247 1,290 1,297 1,332 1,328 1,089Sweden 322 309 307 305 302 317 322 292 296 239Turkey 655 689 747 763 881 942 991 958 989 923United Kingdom 1,582 1,534 1,512 1,518 1,560 1,596 1,625 1,608 1,568 1,212EU 13,642 13,151 12,877 12,799 12,986 13,116 13,453 13,382 13,317 11,600Other 2,155 2,052 2,018 1,995 2,057 2,111 2,173 2,203 2,218 1,936
4,221 4,239 4,333 4,618 4,598 4,492 4,655 4,688 4,780 4,568
Azerbaijan 86 90 97 96 96 96 102 103 104 93Kazakhstan 272 257 348 258 322 349 334 326 332 302Russia 3,094 3,082 3,151 3,529 3,480 3,313 3,499 3,498 3,576 3,456Ukraine 290 286 274 238 220 244 236 243 246 230Uzbekistan 89 81 75 81 81 85 85 93 95 89Other 390 443 388 416 399 405 399 425 427 398
7,432 7,851 8,084 8,372 8,460 8,289 8,319 8,288 8,339 7,749
Iran 1,786 1,856 2,046 2,027 2,002 1,845 1,895 1,984 1,969 1,861Iraq 690 785 861 879 802 857 826 878 871 803Kuwait 448 461 446 449 433 437 435 434 445 419Qatar 173 205 204 230 227 222 248 267 272 230Saudi Arabia 2,785 2,979 2,964 3,196 3,415 3,301 3,205 3,065 3,084 2,967United Arab Emirates 674 713 762 770 838 895 943 880 926 777Other 876 852 801 821 743 732 767 780 772 692
3,559 3,801 4,012 4,154 4,184 4,138 4,156 4,255 4,251 3,825
Algeria 365 389 417 435 447 430 425 437 446 406Angola 104 120 142 156 154 135 119 117 117 109Egypt 757 802 788 840 858 829 773 760 725 637Libya 179 262 280 270 228 208 217 227 235 202Nigeria 310 337 414 454 415 427 431 460 497 491South Africa 626 604 630 620 640 607 643 659 647 555Other 1,218 1,287 1,341 1,379 1,442 1,502 1,548 1,595 1,584 1,425
28,565 29,732 30,435 30,974 32,410 33,208 34,414 34,982 35,444 33,586
Australia 1,098 1,127 1,139 1,128 1,123 1,117 1,170 1,186 1,175 1,020China 9,408 9,803 10,373 10,798 11,639 12,013 12,574 13,002 13,680 13,926India 3,475 3,660 3,725 3,898 4,280 4,510 4,753 4,942 4,988 4,534Indonesia 1,593 1,747 1,735 1,761 1,683 1,594 1,703 1,857 1,824 1,570Japan 4,413 4,675 4,517 4,282 4,163 4,030 3,932 3,786 3,652 3,274Malaysia 637 613 714 731 688 708 731 712 751 639New Zealand 153 152 155 157 161 168 177 180 181 152South Korea 2,259 2,322 2,328 2,348 2,473 2,605 2,630 2,567 2,546 2,413Taiwan 955 945 979 1,019 1,043 1,048 1,035 1,038 987 948Thailand 1,169 1,233 1,320 1,329 1,362 1,392 1,418 1,457 1,462 1,350Other 3,405 3,455 3,450 3,523 3,795 4,023 4,291 4,255 4,198 3,760
46,604 46,112 46,162 45,890 46,641 47,063 47,675 47,994 47,695 42,059
42,510 44,157 45,774 47,401 48,869 49,148 50,538 51,263 52,030 48,994
89,114 90,269 91,936 93,291 95,510 96,211 98,213 99,257 99,725 91,053
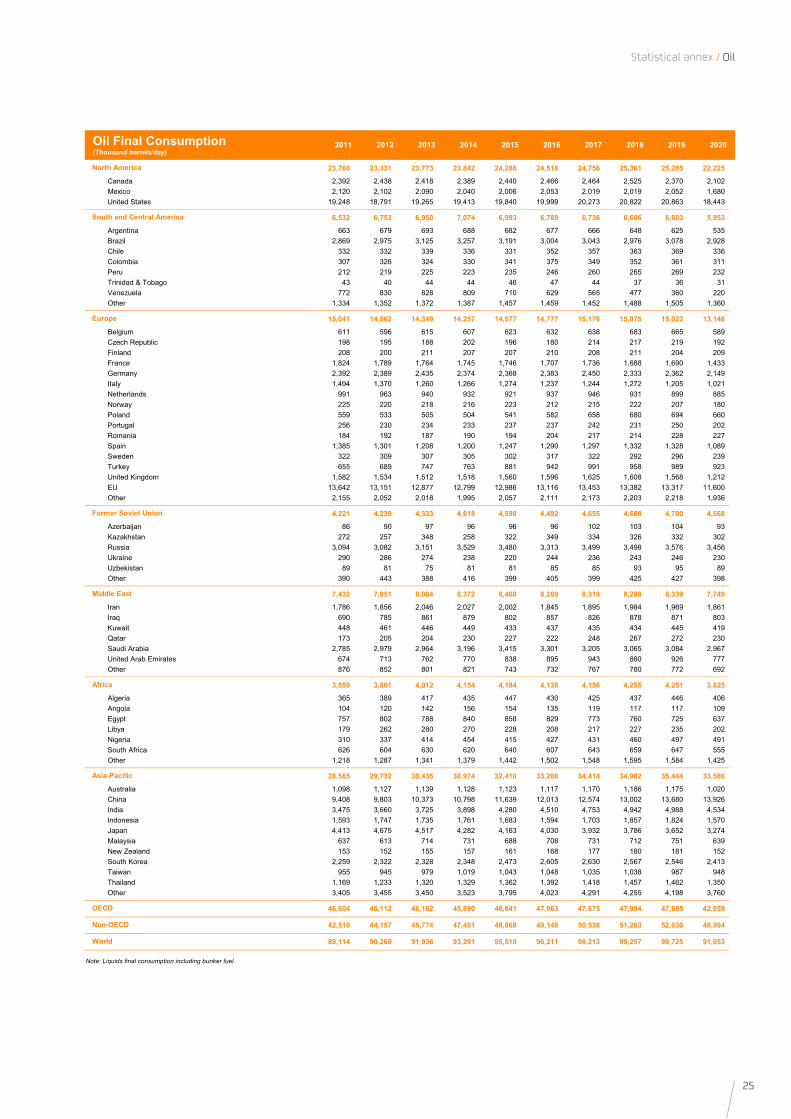
Note: Liquids final consumption including bunker fuel.
Oil Final Consumption(Thousand barrels/day)
North America
South and Central America
Europe
Former Soviet Union
Middle East
Africa
OECD
World
Non-OECD
Asia-Pacific
26
Annual / Energy-Statistics 2021
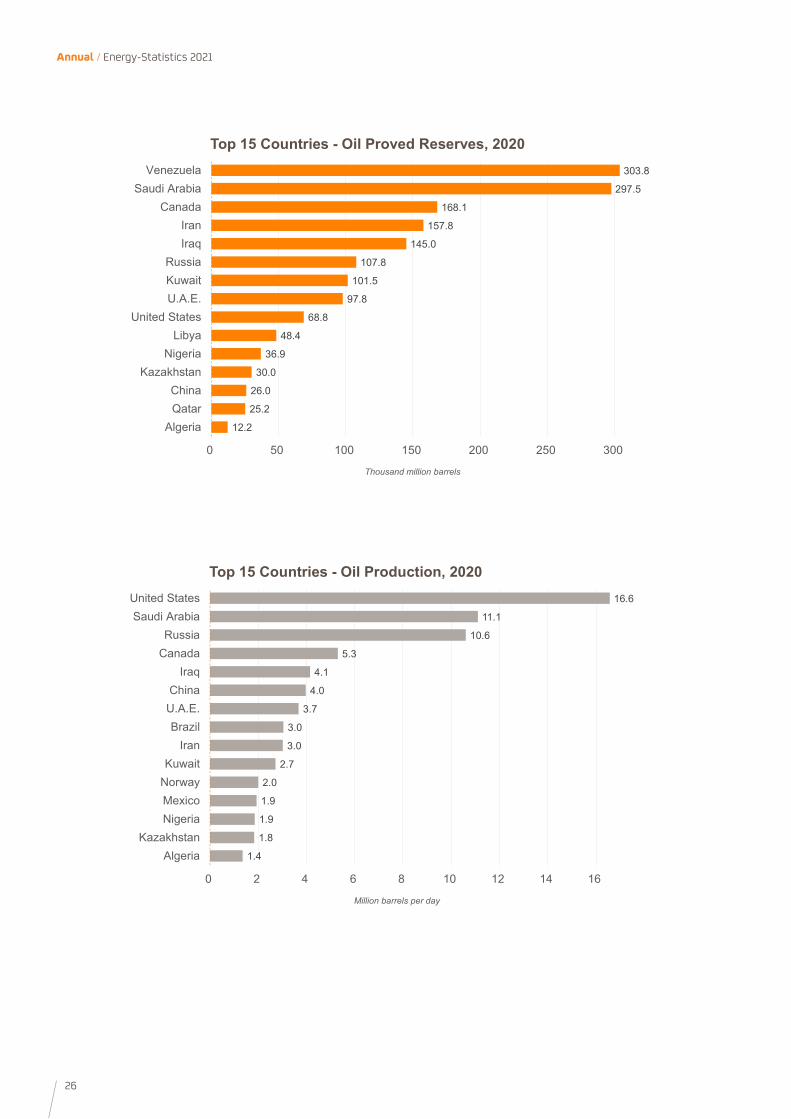
12.2
25.2
26.0
30.0
36.9
48.4
68.8
97.8
101.5
107.8
145.0
157.8
168.1
297.5
303.8
0 50 100 150 200 250 300
AlgeriaQatarChina
KazakhstanNigeria
LibyaUnited States
U.A.E.KuwaitRussia
IraqIran
CanadaSaudi Arabia
Venezuela
Thousand million barrels
Top 15 Countries - Oil Proved Reserves, 2020
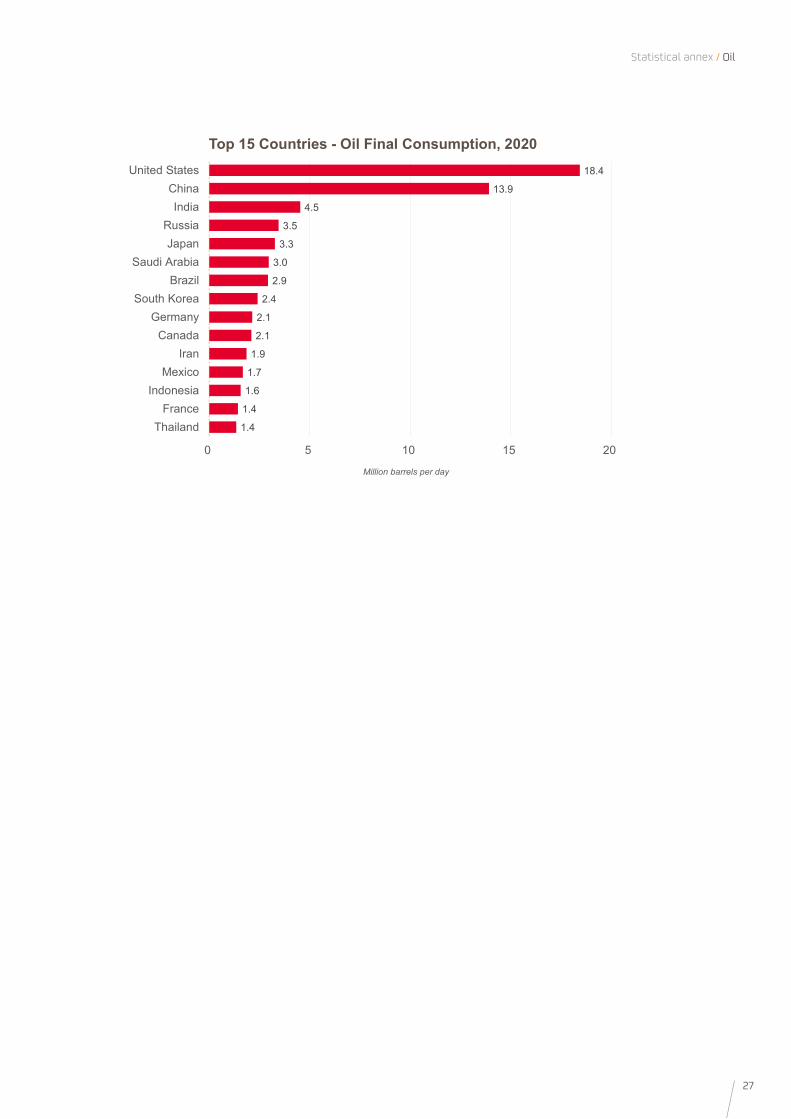
1.4
1.8
1.9
1.9
2.0
2.7
3.0
3.0
3.7
4.0
4.1
5.3
10.6
11.1
16.6
0 2 4 6 8 10 12 14 16
AlgeriaKazakhstan
NigeriaMexicoNorwayKuwait
IranBrazil
U.A.E.China
IraqCanadaRussia
Saudi ArabiaUnited States
Million barrels per day
Top 15 Countries - Oil Production, 2020
27
Statistical annex / Oil
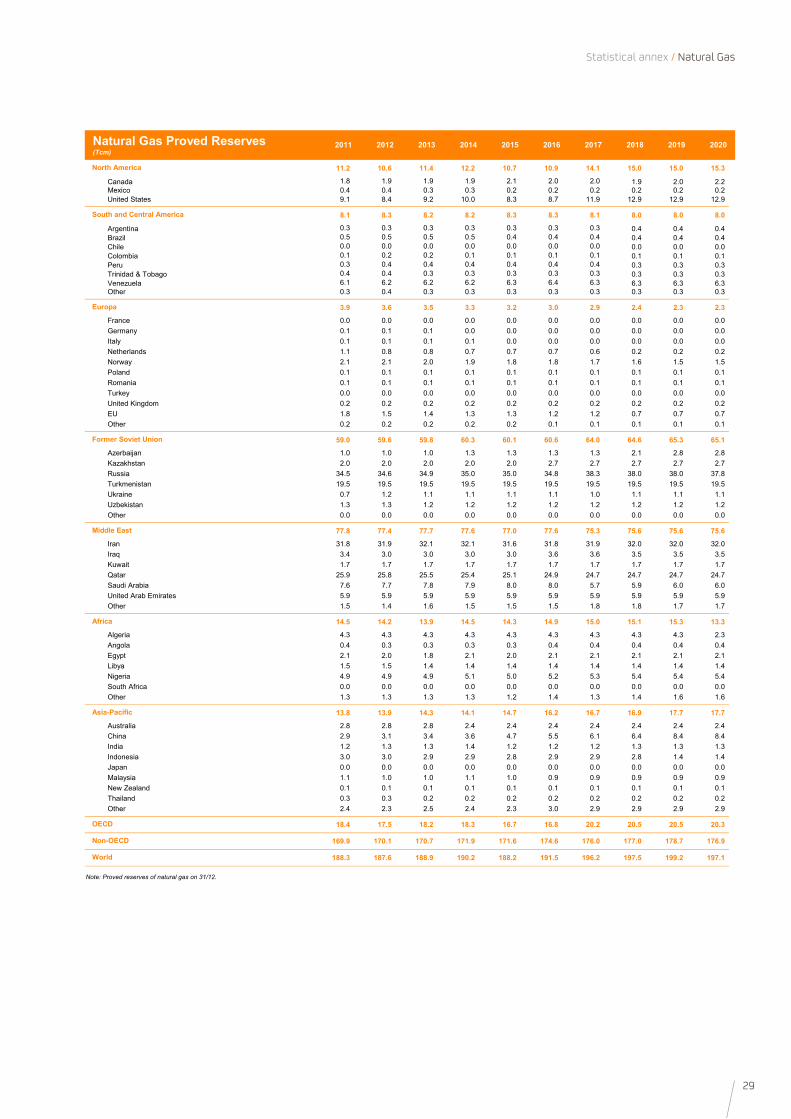
1.4
1.4
1.6
1.7
1.9
2.1
2.1
2.4
2.9
3.0
3.3
3.5
4.5
13.9
18.4
0 5 10 15 20
ThailandFrance
IndonesiaMexico
IranCanada
GermanySouth Korea
BrazilSaudi Arabia
JapanRussia
IndiaChina
United States
Million barrels per day
Top 15 Countries - Oil Final Consumption, 2020

Natural Gas
29
Statistical annex / Natural Gas
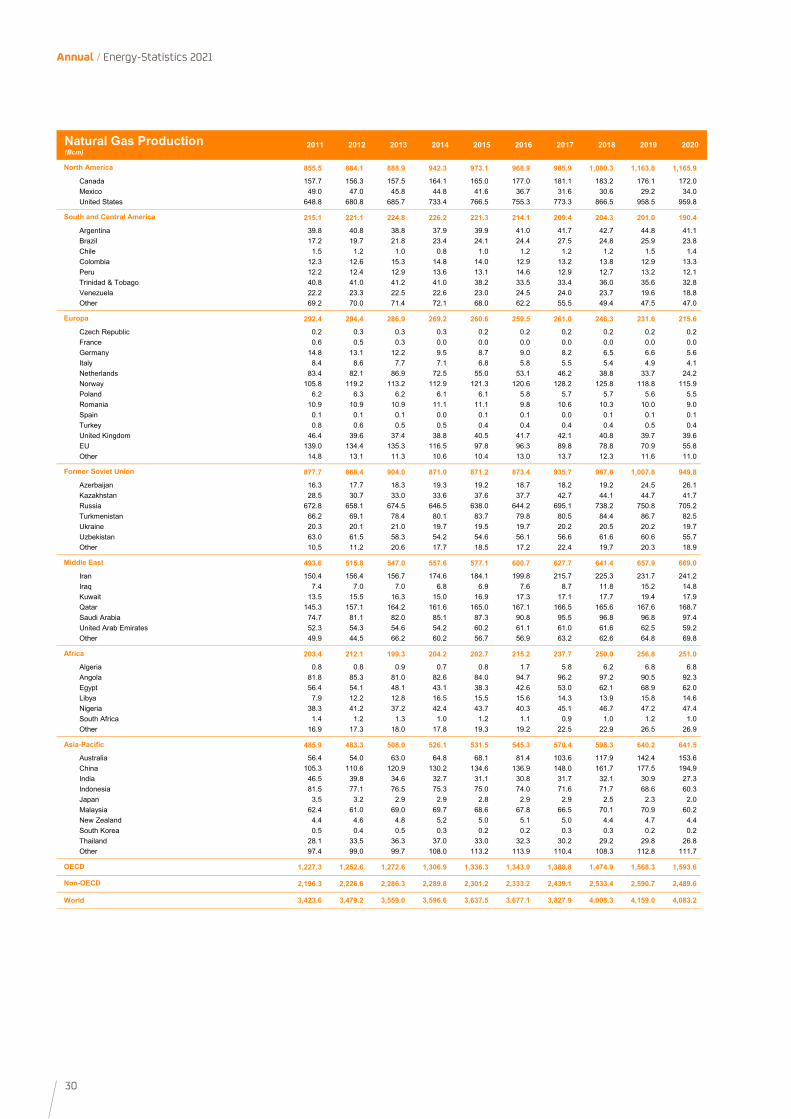
2011 2012 2013 2014 2015 2016 2017 2018 2019 2020
11.2 10.6 11.4 12.2 10.7 10.9 14.1 15.0 15.0 15.3
Canada 1.8 1.9 1.9 1.9 2.1 2.0 2.0 1.9 2.0 2.2Mexico 0.4 0.4 0.3 0.3 0.2 0.2 0.2 0.2 0.2 0.2United States 9.1 8.4 9.2 10.0 8.3 8.7 11.9 12.9 12.9 12.9
8.1 8.3 8.2 8.2 8.3 8.3 8.1 8.0 8.0 8.0
Argentina 0.3 0.3 0.3 0.3 0.3 0.3 0.3 0.4 0.4 0.4Brazil 0.5 0.5 0.5 0.5 0.4 0.4 0.4 0.4 0.4 0.4Chile 0.0 0.0 0.0 0.0 0.0 0.0 0.0 0.0 0.0 0.0Colombia 0.1 0.2 0.2 0.1 0.1 0.1 0.1 0.1 0.1 0.1Peru 0.3 0.4 0.4 0.4 0.4 0.4 0.4 0.3 0.3 0.3Trinidad & Tobago 0.4 0.4 0.3 0.3 0.3 0.3 0.3 0.3 0.3 0.3Venezuela 6.1 6.2 6.2 6.2 6.3 6.4 6.3 6.3 6.3 6.3Other 0.3 0.4 0.3 0.3 0.3 0.3 0.3 0.3 0.3 0.3
3.9 3.6 3.5 3.3 3.2 3.0 2.9 2.4 2.3 2.3
France 0.0 0.0 0.0 0.0 0.0 0.0 0.0 0.0 0.0 0.0Germany 0.1 0.1 0.1 0.0 0.0 0.0 0.0 0.0 0.0 0.0Italy 0.1 0.1 0.1 0.1 0.0 0.0 0.0 0.0 0.0 0.0Netherlands 1.1 0.8 0.8 0.7 0.7 0.7 0.6 0.2 0.2 0.2Norway 2.1 2.1 2.0 1.9 1.8 1.8 1.7 1.6 1.5 1.5Poland 0.1 0.1 0.1 0.1 0.1 0.1 0.1 0.1 0.1 0.1Romania 0.1 0.1 0.1 0.1 0.1 0.1 0.1 0.1 0.1 0.1Turkey 0.0 0.0 0.0 0.0 0.0 0.0 0.0 0.0 0.0 0.0United Kingdom 0.2 0.2 0.2 0.2 0.2 0.2 0.2 0.2 0.2 0.2EU 1.8 1.5 1.4 1.3 1.3 1.2 1.2 0.7 0.7 0.7Other 0.2 0.2 0.2 0.2 0.2 0.1 0.1 0.1 0.1 0.1
59.0 59.6 59.8 60.3 60.1 60.6 64.0 64.6 65.3 65.1
Azerbaijan 1.0 1.0 1.0 1.3 1.3 1.3 1.3 2.1 2.8 2.8Kazakhstan 2.0 2.0 2.0 2.0 2.0 2.7 2.7 2.7 2.7 2.7Russia 34.5 34.6 34.9 35.0 35.0 34.8 38.3 38.0 38.0 37.8Turkmenistan 19.5 19.5 19.5 19.5 19.5 19.5 19.5 19.5 19.5 19.5Ukraine 0.7 1.2 1.1 1.1 1.1 1.1 1.0 1.1 1.1 1.1Uzbekistan 1.3 1.3 1.2 1.2 1.2 1.2 1.2 1.2 1.2 1.2Other 0.0 0.0 0.0 0.0 0.0 0.0 0.0 0.0 0.0 0.0
77.8 77.4 77.7 77.6 77.0 77.6 75.3 75.6 75.6 75.6
Iran 31.8 31.9 32.1 32.1 31.6 31.8 31.9 32.0 32.0 32.0Iraq 3.4 3.0 3.0 3.0 3.0 3.6 3.6 3.5 3.5 3.5Kuwait 1.7 1.7 1.7 1.7 1.7 1.7 1.7 1.7 1.7 1.7Qatar 25.9 25.8 25.5 25.4 25.1 24.9 24.7 24.7 24.7 24.7Saudi Arabia 7.6 7.7 7.8 7.9 8.0 8.0 5.7 5.9 6.0 6.0United Arab Emirates 5.9 5.9 5.9 5.9 5.9 5.9 5.9 5.9 5.9 5.9Other 1.5 1.4 1.6 1.5 1.5 1.5 1.8 1.8 1.7 1.7
14.5 14.2 13.9 14.5 14.3 14.9 15.0 15.1 15.3 13.3
Algeria 4.3 4.3 4.3 4.3 4.3 4.3 4.3 4.3 4.3 2.3Angola 0.4 0.3 0.3 0.3 0.3 0.4 0.4 0.4 0.4 0.4Egypt 2.1 2.0 1.8 2.1 2.0 2.1 2.1 2.1 2.1 2.1Libya 1.5 1.5 1.4 1.4 1.4 1.4 1.4 1.4 1.4 1.4Nigeria 4.9 4.9 4.9 5.1 5.0 5.2 5.3 5.4 5.4 5.4South Africa 0.0 0.0 0.0 0.0 0.0 0.0 0.0 0.0 0.0 0.0Other 1.3 1.3 1.3 1.3 1.2 1.4 1.3 1.4 1.6 1.6
13.8 13.9 14.3 14.1 14.7 16.2 16.7 16.9 17.7 17.7
Australia 2.8 2.8 2.8 2.4 2.4 2.4 2.4 2.4 2.4 2.4China 2.9 3.1 3.4 3.6 4.7 5.5 6.1 6.4 8.4 8.4India 1.2 1.3 1.3 1.4 1.2 1.2 1.2 1.3 1.3 1.3Indonesia 3.0 3.0 2.9 2.9 2.8 2.9 2.9 2.8 1.4 1.4Japan 0.0 0.0 0.0 0.0 0.0 0.0 0.0 0.0 0.0 0.0Malaysia 1.1 1.0 1.0 1.1 1.0 0.9 0.9 0.9 0.9 0.9New Zealand 0.1 0.1 0.1 0.1 0.1 0.1 0.1 0.1 0.1 0.1Thailand 0.3 0.3 0.2 0.2 0.2 0.2 0.2 0.2 0.2 0.2Other 2.4 2.3 2.5 2.4 2.3 3.0 2.9 2.9 2.9 2.9
18.4 17.5 18.2 18.3 16.7 16.8 20.2 20.5 20.5 20.3
169.9 170.1 170.7 171.9 171.6 174.6 176.0 177.0 178.7 176.9
188.3 187.6 188.9 190.2 188.2 191.5 196.2 197.5 199.2 197.1
Note: Proved reserves of natural gas on 31/12.
South and Central America
Middle East
Natural Gas Proved Reserves(Tcm)
Africa
North America
Non-OECD
World
Former Soviet Union
Europa
Asia-Pacific
OECD
30
Annual / Energy-Statistics 2021
2011 2012 2013 2014 2015 2016 2017 2018 2019 2020
855.5 884.1 888.9 942.3 973.1 968.9 985.9 1,080.3 1,163.8 1,165.9
Canada 157.7 156.3 157.5 164.1 165.0 177.0 181.1 183.2 176.1 172.0Mexico 49.0 47.0 45.8 44.8 41.6 36.7 31.6 30.6 29.2 34.0United States 648.8 680.8 685.7 733.4 766.5 755.3 773.3 866.5 958.5 959.8
215.1 221.1 224.8 226.2 221.3 214.1 209.4 204.3 201.0 190.4
Argentina 39.8 40.8 38.8 37.9 39.9 41.0 41.7 42.7 44.8 41.1Brazil 17.2 19.7 21.8 23.4 24.1 24.4 27.5 24.8 25.9 23.8Chile 1.5 1.2 1.0 0.8 1.0 1.2 1.2 1.2 1.5 1.4Colombia 12.3 12.6 15.3 14.8 14.0 12.9 13.2 13.8 12.9 13.3Peru 12.2 12.4 12.9 13.6 13.1 14.6 12.9 12.7 13.2 12.1Trinidad & Tobago 40.8 41.0 41.2 41.0 38.2 33.5 33.4 36.0 35.6 32.8Venezuela 22.2 23.3 22.5 22.6 23.0 24.5 24.0 23.7 19.6 18.8Other 69.2 70.0 71.4 72.1 68.0 62.2 55.5 49.4 47.5 47.0
292.4 294.4 286.9 269.2 260.6 259.5 261.0 246.3 231.6 215.6
Czech Republic 0.2 0.3 0.3 0.3 0.2 0.2 0.2 0.2 0.2 0.2France 0.6 0.5 0.3 0.0 0.0 0.0 0.0 0.0 0.0 0.0Germany 14.8 13.1 12.2 9.5 8.7 9.0 8.2 6.5 6.6 5.6Italy 8.4 8.6 7.7 7.1 6.8 5.8 5.5 5.4 4.9 4.1Netherlands 83.4 82.1 86.9 72.5 55.0 53.1 46.2 38.8 33.7 24.2Norway 105.8 119.2 113.2 112.9 121.3 120.6 128.2 125.8 118.8 115.9Poland 6.2 6.3 6.2 6.1 6.1 5.8 5.7 5.7 5.6 5.5Romania 10.9 10.9 10.9 11.1 11.1 9.8 10.6 10.3 10.0 9.0Spain 0.1 0.1 0.1 0.0 0.1 0.1 0.0 0.1 0.1 0.1Turkey 0.8 0.6 0.5 0.5 0.4 0.4 0.4 0.4 0.5 0.4United Kingdom 46.4 39.6 37.4 38.8 40.5 41.7 42.1 40.8 39.7 39.6EU 139.0 134.4 135.3 116.5 97.8 96.3 89.8 78.8 70.9 55.8Other 14.8 13.1 11.3 10.6 10.4 13.0 13.7 12.3 11.6 11.0
877.7 868.4 904.0 871.0 871.2 873.4 935.7 987.6 1,007.8 949.8
Azerbaijan 16.3 17.7 18.3 19.3 19.2 18.7 18.2 19.2 24.5 26.1Kazakhstan 28.5 30.7 33.0 33.6 37.6 37.7 42.7 44.1 44.7 41.7Russia 672.8 658.1 674.5 646.5 638.0 644.2 695.1 738.2 750.8 705.2Turkmenistan 66.2 69.1 78.4 80.1 83.7 79.8 80.5 84.4 86.7 82.5Ukraine 20.3 20.1 21.0 19.7 19.5 19.7 20.2 20.5 20.2 19.7Uzbekistan 63.0 61.5 58.3 54.2 54.6 56.1 56.6 61.6 60.6 55.7Other 10.5 11.2 20.6 17.7 18.5 17.2 22.4 19.7 20.3 18.9
493.6 515.8 547.0 557.6 577.1 600.7 627.7 641.4 657.9 669.0
Iran 150.4 156.4 156.7 174.6 184.1 199.8 215.7 225.3 231.7 241.2Iraq 7.4 7.0 7.0 6.8 6.9 7.6 8.7 11.8 15.2 14.8Kuwait 13.5 15.5 16.3 15.0 16.9 17.3 17.1 17.7 19.4 17.9Qatar 145.3 157.1 164.2 161.6 165.0 167.1 166.5 165.6 167.6 168.7Saudi Arabia 74.7 81.1 82.0 85.1 87.3 90.8 95.5 96.8 96.8 97.4United Arab Emirates 52.3 54.3 54.6 54.2 60.2 61.1 61.0 61.6 62.5 59.2Other 49.9 44.5 66.2 60.2 56.7 56.9 63.2 62.6 64.8 69.8
203.4 212.1 199.3 204.2 202.7 215.2 237.7 250.0 256.8 251.0
Algeria 0.8 0.8 0.9 0.7 0.8 1.7 5.8 6.2 6.8 6.8Angola 81.8 85.3 81.0 82.6 84.0 94.7 96.2 97.2 90.5 92.3Egypt 56.4 54.1 48.1 43.1 38.3 42.6 53.0 62.1 68.9 62.0Libya 7.9 12.2 12.8 16.5 15.5 15.6 14.3 13.9 15.8 14.6Nigeria 38.3 41.2 37.2 42.4 43.7 40.3 45.1 46.7 47.2 47.4South Africa 1.4 1.2 1.3 1.0 1.2 1.1 0.9 1.0 1.2 1.0Other 16.9 17.3 18.0 17.8 19.3 19.2 22.5 22.9 26.5 26.9
485.9 483.3 508.0 526.1 531.5 545.3 570.4 598.3 640.2 641.5
Australia 56.4 54.0 63.0 64.8 68.1 81.4 103.6 117.9 142.4 153.6China 105.3 110.6 120.9 130.2 134.6 136.9 148.0 161.7 177.5 194.9India 46.5 39.8 34.6 32.7 31.1 30.8 31.7 32.1 30.9 27.3Indonesia 81.5 77.1 76.5 75.3 75.0 74.0 71.6 71.7 68.6 60.3Japan 3.5 3.2 2.9 2.9 2.8 2.9 2.9 2.5 2.3 2.0Malaysia 62.4 61.0 69.0 69.7 68.6 67.8 66.5 70.1 70.9 60.2New Zealand 4.4 4.6 4.8 5.2 5.0 5.1 5.0 4.4 4.7 4.4South Korea 0.5 0.4 0.5 0.3 0.2 0.2 0.3 0.3 0.2 0.2Thailand 28.1 33.5 36.3 37.0 33.0 32.3 30.2 29.2 29.8 26.8Other 97.4 99.0 99.7 108.0 113.2 113.9 110.4 108.3 112.8 111.7
1,227.3 1,252.6 1,272.6 1,306.9 1,336.3 1,343.9 1,388.8 1,474.9 1,568.3 1,593.6
2,196.3 2,226.6 2,286.3 2,289.8 2,301.2 2,333.2 2,439.1 2,533.4 2,590.7 2,489.6
World 3,423.6 3,479.2 3,559.0 3,596.6 3,637.5 3,677.1 3,827.9 4,008.3 4,159.0 4,083.2
Non-OECD
North America
Middle East
Former Soviet Union
Europa
South and Central America
Natural Gas Production(Bcm)
Africa
Asia-Pacific
OECD
31
Statistical annex / Natural Gas
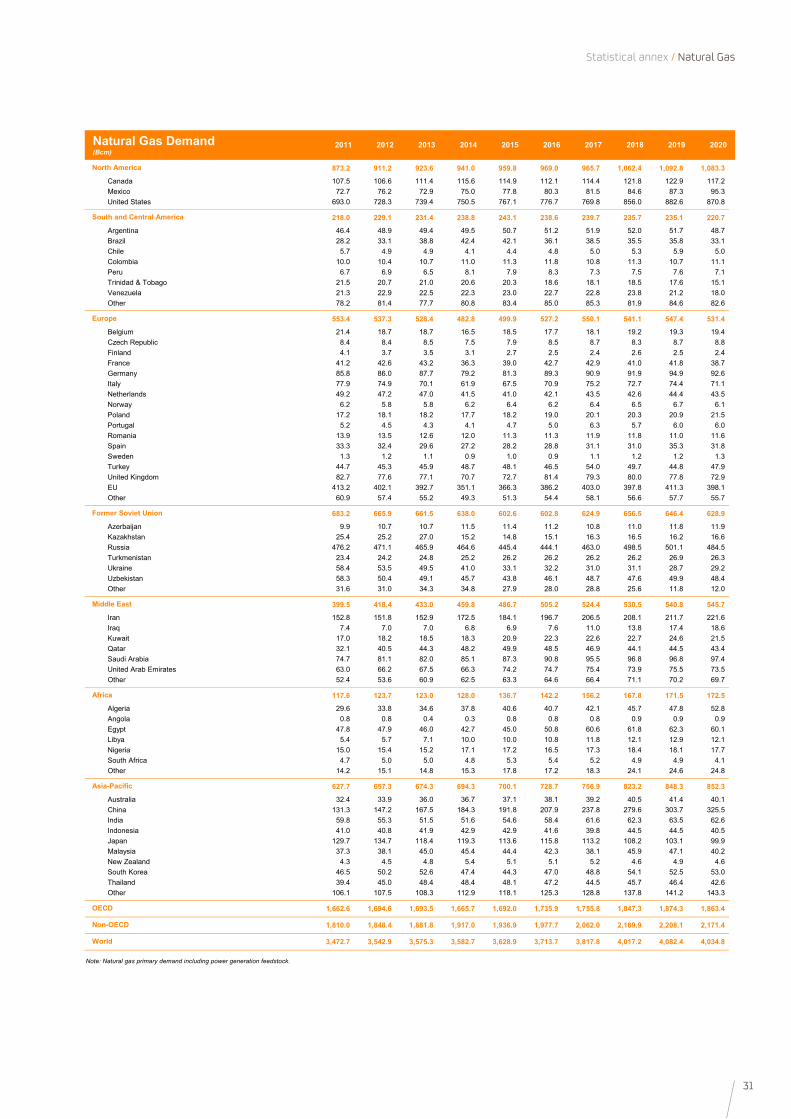
2011 2012 2013 2014 2015 2016 2017 2018 2019 2020
873.2 911.2 923.6 941.0 959.8 969.0 965.7 1,062.4 1,092.8 1,083.3
Canada 107.5 106.6 111.4 115.6 114.9 112.1 114.4 121.8 122.9 117.2Mexico 72.7 76.2 72.9 75.0 77.8 80.3 81.5 84.6 87.3 95.3United States 693.0 728.3 739.4 750.5 767.1 776.7 769.8 856.0 882.6 870.8
218.0 229.1 231.4 238.8 243.1 238.6 239.7 235.7 235.1 220.7
Argentina 46.4 48.9 49.4 49.5 50.7 51.2 51.9 52.0 51.7 48.7Brazil 28.2 33.1 38.8 42.4 42.1 36.1 38.5 35.5 35.8 33.1Chile 5.7 4.9 4.9 4.1 4.4 4.8 5.0 5.3 5.9 5.0Colombia 10.0 10.4 10.7 11.0 11.3 11.8 10.8 11.3 10.7 11.1Peru 6.7 6.9 6.5 8.1 7.9 8.3 7.3 7.5 7.6 7.1Trinidad & Tobago 21.5 20.7 21.0 20.6 20.3 18.6 18.1 18.5 17.6 15.1Venezuela 21.3 22.9 22.5 22.3 23.0 22.7 22.8 23.8 21.2 18.0Other 78.2 81.4 77.7 80.8 83.4 85.0 85.3 81.9 84.6 82.6
553.4 537.3 528.4 482.8 499.9 527.2 550.1 541.1 547.4 531.4
Belgium 21.4 18.7 18.7 16.5 18.5 17.7 18.1 19.2 19.3 19.4Czech Republic 8.4 8.4 8.5 7.5 7.9 8.5 8.7 8.3 8.7 8.8Finland 4.1 3.7 3.5 3.1 2.7 2.5 2.4 2.6 2.5 2.4France 41.2 42.6 43.2 36.3 39.0 42.7 42.9 41.0 41.8 38.7Germany 85.8 86.0 87.7 79.2 81.3 89.3 90.9 91.9 94.9 92.6Italy 77.9 74.9 70.1 61.9 67.5 70.9 75.2 72.7 74.4 71.1Netherlands 49.2 47.2 47.0 41.5 41.0 42.1 43.5 42.6 44.4 43.5Norway 6.2 5.8 5.8 6.2 6.4 6.2 6.4 6.5 6.7 6.1Poland 17.2 18.1 18.2 17.7 18.2 19.0 20.1 20.3 20.9 21.5Portugal 5.2 4.5 4.3 4.1 4.7 5.0 6.3 5.7 6.0 6.0Romania 13.9 13.5 12.6 12.0 11.3 11.3 11.9 11.8 11.0 11.6Spain 33.3 32.4 29.6 27.2 28.2 28.8 31.1 31.0 35.3 31.8Sweden 1.3 1.2 1.1 0.9 1.0 0.9 1.1 1.2 1.2 1.3Turkey 44.7 45.3 45.9 48.7 48.1 46.5 54.0 49.7 44.8 47.9United Kingdom 82.7 77.6 77.1 70.7 72.7 81.4 79.3 80.0 77.8 72.9EU 413.2 402.1 392.7 351.1 366.3 386.2 403.0 397.8 411.3 398.1Other 60.9 57.4 55.2 49.3 51.3 54.4 58.1 56.6 57.7 55.7
683.2 665.9 661.5 638.0 602.6 602.8 624.9 656.5 646.4 628.9
Azerbaijan 9.9 10.7 10.7 11.5 11.4 11.2 10.8 11.0 11.8 11.9Kazakhstan 25.4 25.2 27.0 15.2 14.8 15.1 16.3 16.5 16.2 16.6Russia 476.2 471.1 465.9 464.6 445.4 444.1 463.0 498.5 501.1 484.5Turkmenistan 23.4 24.2 24.8 25.2 26.2 26.2 26.2 26.2 26.9 26.3Ukraine 58.4 53.5 49.5 41.0 33.1 32.2 31.0 31.1 28.7 29.2Uzbekistan 58.3 50.4 49.1 45.7 43.8 46.1 48.7 47.6 49.9 48.4Other 31.6 31.0 34.3 34.8 27.9 28.0 28.8 25.6 11.8 12.0
399.5 418.4 433.0 459.8 486.7 505.2 524.4 530.5 540.8 545.7
Iran 152.8 151.8 152.9 172.5 184.1 196.7 206.5 208.1 211.7 221.6Iraq 7.4 7.0 7.0 6.8 6.9 7.6 11.0 13.8 17.4 18.6Kuwait 17.0 18.2 18.5 18.3 20.9 22.3 22.6 22.7 24.6 21.5Qatar 32.1 40.5 44.3 48.2 49.9 48.5 46.9 44.1 44.5 43.4Saudi Arabia 74.7 81.1 82.0 85.1 87.3 90.8 95.5 96.8 96.8 97.4United Arab Emirates 63.0 66.2 67.5 66.3 74.2 74.7 75.4 73.9 75.5 73.5Other 52.4 53.6 60.9 62.5 63.3 64.6 66.4 71.1 70.2 69.7
117.6 123.7 123.0 128.0 136.7 142.2 156.2 167.8 171.5 172.5
Algeria 29.6 33.8 34.6 37.8 40.6 40.7 42.1 45.7 47.8 52.8Angola 0.8 0.8 0.4 0.3 0.8 0.8 0.8 0.9 0.9 0.9Egypt 47.8 47.9 46.0 42.7 45.0 50.8 60.6 61.8 62.3 60.1Libya 5.4 5.7 7.1 10.0 10.0 10.8 11.8 12.1 12.9 12.1Nigeria 15.0 15.4 15.2 17.1 17.2 16.5 17.3 18.4 18.1 17.7South Africa 4.7 5.0 5.0 4.8 5.3 5.4 5.2 4.9 4.9 4.1Other 14.2 15.1 14.8 15.3 17.8 17.2 18.3 24.1 24.6 24.8
627.7 657.3 674.3 694.3 700.1 728.7 756.9 823.2 848.3 852.3
Australia 32.4 33.9 36.0 36.7 37.1 38.1 39.2 40.5 41.4 40.1China 131.3 147.2 167.5 184.3 191.8 207.9 237.8 279.6 303.7 325.5India 59.8 55.3 51.5 51.6 54.6 58.4 61.6 62.3 63.5 62.6Indonesia 41.0 40.8 41.9 42.9 42.9 41.6 39.8 44.5 44.5 40.5Japan 129.7 134.7 118.4 119.3 113.6 115.8 113.2 108.2 103.1 99.9Malaysia 37.3 38.1 45.0 45.4 44.4 42.3 38.1 45.9 47.1 40.2New Zealand 4.3 4.5 4.8 5.4 5.1 5.1 5.2 4.6 4.9 4.6South Korea 46.5 50.2 52.6 47.4 44.3 47.0 48.8 54.1 52.5 53.0Thailand 39.4 45.0 48.4 48.4 48.1 47.2 44.5 45.7 46.4 42.6Other 106.1 107.5 108.3 112.9 118.1 125.3 128.8 137.8 141.2 143.3
1,662.6 1,694.6 1,693.5 1,665.7 1,692.0 1,735.9 1,755.8 1,847.3 1,874.3 1,863.4
1,810.0 1,848.4 1,881.8 1,917.0 1,936.9 1,977.7 2,062.0 2,169.9 2,208.1 2,171.4
3,472.7 3,542.9 3,575.3 3,582.7 3,628.9 3,713.7 3,817.8 4,017.2 4,082.4 4,034.8
Note: Natural gas primary demand including power generation feedstock.
Middle East
Natural Gas Demand(Bcm)
South and Central America
North America
Former Soviet Union
Europe
Non-OECD
World
Asia-Pacific
Africa
OECD
32
Annual / Energy-Statistics 2021
59.2
60.2
60.3
62.0
82.5
92.3
97.4
115.9
153.6
168.7
172.0
194.9
241.2
705.2 959.8
0 100 200 300 400 500 600 700 800 900
U.A.E.Malaysia
IndonesiaEgypt
TurkmenistanAngola
Saudi ArabiaNorway
AustraliaQatar
CanadaChina
IranRussia
United States
Bcm
Top 15 Countries - Natural Gas Production, 2020
2.3
2.4
2.7
2.8
3.5
5.4
5.9
6.0
6.3
8.4
12.9
19.5
24.7
32.0 37.8
0 5 10 15 20 25 30 35
AlgeriaAustralia
KazakhstanAzerbaijan
IraqNigeriaU.A.E.
Saudi ArabiaVenezuela
ChinaUnited StatesTurkmenistan
QatarIran
Russia
Tcm
Top 15 Countries - Natural Gas Proved Reserves, 2020
33
53.0
60.1
62.6
71.1
72.9
73.5
92.6
95.3
97.4
99.9
117.2
221.6
325.5
484.5 870.8
0 100 200 300 400 500 600 700 800
South KoreaEgyptIndiaItaly
United KingdomU.A.E.
GermanyMexico
Saudi ArabiaJapan
CanadaIran
ChinaRussia
United States
Bcm
Top 15 Countries - Natural Gas Demand, 2020
Statistical annex / Natural Gas

Oil and Natural Gas prices
35
Statistical annex / Oil and Natural Gas prices
30
40
50
60
70
80
90
100
110
120
2005 2006 2007 2008 2009 2010 2011 2012 2013 2014 2015 2016 2017 2018 2019 2020
$/ba
rrel
Crude Oil Price Benchmarks
Brent WTI Dubai
2
4
6
8
10
12
14
16
18
2005 2006 2007 2008 2009 2010 2011 2012 2013 2014 2015 2016 2017 2018 2019 2020
$/mmBtu
Natural Gas Price Benchmarks
Henry Hub NBP TTF JKM
2011 2012 2013 2014 2015 2016 2017 2018 2019 2020
Brent 111.2 111.8 108.7 99.0 52.3 43.7 54.2 71.3 64.3 42.1WTI 105.7 109.1 105.6 96.5 50.9 41.6 53.1 69.3 63.2 42.7Dubai 94.9 94.1 98.0 93.0 48.7 43.3 50.8 65.2 57.0 39.2
Henry Hub (HH) 4.0 2.8 3.7 4.3 2.6 2.5 3.0 3.2 2.6 2.1National Balancing Point (NBP) 9.0 9.5 10.6 8.2 6.5 4.7 5.8 8.0 4.5 3.2Japan Korea Marker (JKM) 13.2 16.2 15.2 15.2 7.5 5.7 7.2 9.8 5.6 4.2Title Transfer Facility (TTF) 9.1 9.3 10.4 8.1 6.4 4.5 5.7 7.8 4.4 3.1
Source: Thomson Reuters
Oil and Natural Gas PricesCrude oil ($ per barrel)
Natural gas (dollar per million Btu)

Power Generation
37
Statistical annex / Power Generation
2011 2012 2013 2014 2015 2016 2017 2018 2019 2020
5,286 5,230 5,261 5,301 5,286 5,306 5,271 5,445 5,385 5,233
Canada 633 632 658 659 658 664 663 654 653 648Mexico 303 307 297 301 311 321 322 336 331 322United States 4,349 4,291 4,306 4,340 4,317 4,322 4,286 4,455 4,401 4,262
1,143 1,190 1,236 1,231 1,272 1,274 1,280 1,298 1,317 1,293
Argentina 130 136 139 139 145 147 146 147 140 143Brazil 532 553 571 591 582 579 589 601 626 614Chile 66 70 73 71 75 79 79 82 84 84Colombia 62 64 74 71 79 77 79 80 82 76Peru 39 40 44 46 48 52 53 55 57 n.d.Trinidad & Tobago 9 9 10 10 10 10 10 9 10 n.d.Venezuela 118 122 123 103 123 108 104 100 96 n.d.Other 188 197 202 201 209 222 220 224 222 n.d.
3,822 3,848 3,823 3,752 3,814 3,853 3,901 3,901 3,849 3,717
Belgium 90 83 83 73 70 86 87 75 94 91Czech Republic 87 87 87 86 84 83 87 88 87 81Finland 74 70 71 68 69 69 68 70 69 68France 574 573 582 573 580 564 562 582 571 533Germany 613 628 639 628 648 650 654 643 612 572Italy 303 299 290 280 283 290 296 290 292 280Netherlands 114 103 102 103 110 115 117 114 121 123Norway 128 148 134 142 145 149 149 147 135 154Poland 164 162 165 159 165 167 170 170 164 158Portugal 52 47 52 53 52 60 59 60 53 53Romania 62 59 59 66 66 65 64 65 60 56Spain 294 298 286 279 281 275 276 274 274 264Sweden 150 167 153 154 162 156 164 163 169 164Turkey 229 239 240 252 262 274 297 305 304 305United Kingdom 368 364 358 338 340 340 339 333 325 313EU 3,310 3,303 3,279 3,199 3,247 3,268 3,299 3,279 3,241 3,095Other 520 521 522 500 498 510 511 521 520 500
1,514 1,543 1,538 1,532 1,517 1,546 1,554 1,593 1,599 1,557
Azerbaijan 20 23 23 25 25 25 24 25 26 n.d.Kazakhstan 87 93 103 95 92 95 103 108 107 110Russia 1,055 1,071 1,059 1,064 1,068 1,091 1,094 1,115 1,125 1,092Ukraine 195 199 194 183 164 165 156 160 152 143Uzbekistan 53 53 55 56 58 59 61 63 63 65Other 104 104 104 109 111 111 115 122 126 n.d.
916 979 1,012 1,082 1,133 1,171 1,224 1,228 1,247 1,250
Iran 240 254 262 275 281 289 308 310 314 322Iraq 54 46 58 68 69 80 87 83 97 96Kuwait 57 61 61 65 68 70 73 74 75 75Qatar 31 35 35 39 41 42 46 48 49 49Saudi Arabia 250 289 302 336 359 368 378 378 367 363United Arab Emirates 99 106 110 117 127 130 135 136 138 137Other 185 188 183 182 187 192 198 200 207 207
685 713 733 762 786 796 827 854 872 850
Algeria 56 62 65 71 75 78 83 84 90 88Angola 6 6 8 9 10 10 11 12 12 n.d.Egypt 144 150 154 161 173 177 185 194 195 193Libya 26 34 38 38 38 31 33 34 35 n.d.Nigeria 27 29 29 32 32 34 34 36 38 40South Africa 263 258 256 253 250 253 255 256 252 240Other 164 174 184 198 209 213 225 237 250 n.d.
8,907 9,292 9,875 10,250 10,540 11,114 11,676 12,419 12,794 13,007
Australia 254 251 249 247 251 257 258 261 264 257China 4,716 4,994 5,447 5,679 5,860 6,218 6,635 7,182 7,519 7,798India 1,060 1,115 1,184 1,287 1,358 1,449 1,519 1,583 1,597 1,557Indonesia 183 200 216 228 234 248 255 284 295 291Japan 1,111 1,099 1,104 1,076 1,059 1,062 1,071 1,058 1,015 1,011Malaysia 129 134 138 147 150 157 165 170 176 168New Zealand 44 44 43 44 44 44 44 44 45 44South Korea 523 535 542 551 553 563 567 590 582 571Taiwan 252 250 252 260 258 264 270 276 274 280Thailand 156 167 170 172 176 188 182 182 192 181Other 478 503 527 559 597 666 709 788 834 849
10,950 10,933 10,942 10,891 10,929 11,011 11,047 11,227 11,085 10,786
11,323 11,861 12,536 13,019 13,419 14,049 14,686 15,511 15,980 16,119
22,273 22,795 23,478 23,910 24,348 25,061 25,734 26,738 27,063 26,906
North America
Total Power Generation(TWh)
World
Non-OECD
OECD
Asia-Pacific
Africa
Middle East
Former Soviet Union
Europe
South and Central America
38
Annual / Energy-Statistics 2021
2011 2012 2013 2014 2015 2016 2017 2018 2019 2020
18.8% 18.7% 19.4% 19.8% 20.0% 21.5% 23.4% 23.0% 23.6% 25.8%
Canada 62.5% 63.6% 64.1% 63.2% 64.0% 64.8% 66.5% 66.3% 66.0% 67.7%Mexico 14.9% 13.8% 13.3% 17.5% 15.3% 15.3% 16.0% 16.3% 17.0% 20.5%United States 12.7% 12.4% 13.0% 13.4% 13.6% 15.3% 17.3% 17.2% 17.9% 19.8%
69.1% 65.9% 63.0% 61.1% 60.6% 63.4% 65.1% 66.8% 66.5% 69.7%
Argentina 25.6% 23.5% 25.6% 25.1% 23.8% 21.7% 23.5% 24.1% 24.0% 22.8%Brazil 87.2% 82.5% 76.8% 73.2% 74.1% 80.4% 79.2% 82.3% 82.2% 84.1%Chile 39.6% 36.4% 35.7% 42.9% 43.6% 43.3% 43.9% 46.3% 46.0% 48.2%Colombia 81.9% 78.1% 69.4% 69.4% 63.6% 65.9% 79.3% 76.9% 72.6% 64.8%Peru 56.8% 55.3% 53.9% 52.4% 52.7% 50.4% 58.6% 60.8% 60.2% n.d.Trinidad & Tobago 0.0% 0.0% 0.0% 0.0% 0.0% 0.0% 0.1% 0.1% 0.0% n.d.Venezuela 70.9% 67.4% 67.9% 62.3% 61.1% 58.4% 58.4% 58.4% 58.4% n.d.
25.2% 28.4% 30.9% 32.3% 33.6% 34.0% 33.9% 36.3% 38.3% 42.8%
Belgium 10.6% 14.2% 15.6% 18.5% 22.4% 18.0% 19.6% 24.2% 21.1% 27.2%Czech Republic 9.1% 10.1% 11.8% 11.9% 12.8% 12.7% 12.4% 11.9% 12.9% 14.3%Finland 32.9% 40.6% 36.0% 38.6% 44.5% 44.2% 46.6% 45.7% 45.8% n.d.France 12.4% 15.7% 17.9% 17.4% 16.7% 18.4% 17.4% 20.4% 20.6% 24.3%Germany 21.2% 23.7% 24.8% 26.8% 30.0% 30.0% 34.0% 35.9% 40.5% 44.5%Italy 28.1% 31.5% 39.3% 43.7% 39.0% 37.9% 35.7% 40.1% 39.9% 42.0%Netherlands 10.8% 12.1% 11.9% 11.3% 12.4% 12.8% 14.9% 16.5% 18.0% 24.8%Norway 96.6% 98.0% 97.7% 97.7% 97.7% 97.8% 97.8% 97.8% 97.7% 98.4%Poland 8.3% 10.7% 10.7% 12.8% 14.1% 14.0% 14.4% 13.0% 14.5% 16.7%Portugal 47.1% 43.8% 59.2% 61.4% 48.7% 55.5% 40.9% 51.4% 54.1% 59.7%Romania 26.6% 25.7% 34.8% 42.0% 40.1% 42.2% 38.3% 41.0% 41.8% 44.2%Spain 30.6% 30.4% 40.5% 40.9% 35.7% 39.3% 32.9% 38.8% 37.6% 43.9%Sweden 56.0% 59.1% 54.1% 55.9% 63.3% 57.2% 57.9% 55.8% 58.5% 68.4%Turkey 25.3% 27.2% 28.8% 20.9% 32.0% 32.9% 29.3% 32.1% 43.5% 41.6%United Kingdom 10.4% 12.2% 15.7% 19.9% 25.6% 25.5% 30.3% 34.0% 37.8% 43.7%EU 21.4% 24.2% 27.2% 29.2% 29.9% 30.2% 30.5% 33.0% 34.6% 39.3%
15.6% 15.3% 16.6% 16.0% 15.6% 16.9% 17.2% 17.2% 17.4% 19.6%
Azerbaijan 13.2% 7.9% 6.7% 5.6% 7.0% 8.4% 7.8% 7.8% 6.9% n.d.Kazakhstan 9.1% 8.2% 7.5% 8.8% 10.4% 12.7% 11.3% 10.4% 11.0% 11.7%Russia 15.9% 15.7% 17.3% 16.7% 16.0% 17.2% 17.2% 17.4% 17.9% 20.3%Ukraine 5.7% 5.9% 8.1% 6.0% 5.3% 6.6% 8.0% 9.1% 7.1% 8.4%Uzbekistan 10.8% 12.6% 10.4% 10.9% 12.3% 12.4% 13.7% 9.4% 10.3% 10.3%
2.2% 2.3% 2.4% 2.0% 1.7% 2.1% 1.9% 2.1% 3.7% 3.1%
Iran 5.1% 5.0% 5.7% 5.2% 5.1% 5.8% 5.0% 5.3% 9.9% 6.9%Iraq 6.3% 9.5% 8.2% 4.4% 3.8% 4.3% 2.6% 2.3% 2.6% 2.6%Kuwait 0.0% 0.0% 0.0% 0.0% 0.0% 0.1% 0.1% 0.1% 0.2% 0.3%Qatar 0.0% 0.0% 0.0% 0.0% 0.0% 0.0% 0.0% 0.0% 0.0% 0.0%Saudi Arabia 0.0% 0.0% 0.0% 0.0% 0.0% 0.0% 0.0% 0.0% 0.2% 0.2%United Arab Emirates 0.0% 0.0% 0.1% 0.3% 0.2% 0.2% 0.5% 1.0% 2.7% 3.6%
17.5% 17.0% 17.4% 18.3% 17.9% 18.1% 18.7% 19.4% 20.1% 21.1%
Algeria 0.9% 1.0% 0.5% 0.4% 0.3% 0.4% 0.8% 0.9% 0.9% 1.0%Angola 70.9% 60.8% 58.0% 53.2% 53.2% 56.1% 71.4% 74.4% 74.4% n.d.Egypt 10.2% 9.7% 9.6% 9.7% 9.1% 8.8% 8.4% 8.1% 9.0% 10.2%Libya 0.0% 0.0% 0.0% 0.0% 0.0% 0.0% 0.0% 0.0% 0.0% n.d.Nigeria 21.8% 19.8% 18.5% 16.6% 17.7% 24.3% 22.6% 17.9% 20.4% 19.2%South Africa 2.1% 1.8% 1.7% 2.6% 3.5% 4.4% 5.7% 6.6% 6.8% 7.6%
14.8% 16.4% 17.1% 18.3% 19.0% 19.9% 20.5% 21.1% 22.2% 23.6%
Australia 10.4% 10.5% 13.2% 14.6% 13.3% 14.6% 15.7% 17.1% 19.7% 23.0%China 17.0% 20.1% 20.5% 22.8% 24.1% 25.3% 25.6% 26.0% 27.0% 28.4%India 17.5% 16.0% 17.6% 16.4% 15.3% 17.1% 17.5% 18.9% 21.1% 22.5%Indonesia 12.0% 11.2% 12.3% 11.5% 10.7% 12.6% 12.5% 17.3% 16.5% 18.3%Japan 10.9% 10.5% 11.3% 12.8% 14.7% 14.8% 16.5% 17.4% 18.3% 20.2%Malaysia 6.7% 7.4% 8.6% 9.7% 10.0% 13.5% 16.9% 16.6% 16.0% 17.2%New Zealand 76.1% 71.8% 74.2% 79.1% 80.1% 84.2% 81.1% 83.4% 81.7% 80.0%South Korea 2.0% 2.0% 2.4% 2.5% 2.6% 3.5% 4.0% 4.6% 5.3% 7.1%Taiwan 4.1% 4.8% 4.9% 4.4% 4.6% 5.4% 5.2% 5.2% 6.1% 6.0%Thailand 8.0% 8.3% 8.1% 8.4% 7.9% 13.5% 14.2% 16.5% 16.4% 15.4%
19.4% 20.4% 21.6% 22.4% 23.2% 24.1% 25.3% 26.0% 27.3% 30.1%
21.0% 21.8% 22.2% 22.6% 22.9% 24.1% 24.4% 25.1% 25.9% 26.9%
20.2% 21.1% 21.9% 22.5% 23.0% 24.1% 24.8% 25.5% 26.4% 28.2%
OECD
Non-OECD
World
Asia-Pacific
Renewables in Power Generation(%)
North America
South and Central America
Africa
Middle East
Former Soviet Union
Europe

CO2 Emissions from Fossil Fuels
40
Annual / Energy-Statistics 2021
2011 2012 2013 2014 2015 2016 2017 2018 2019 2020
6,525 6,344 6,455 6,491 6,360 6,252 6,201 6,386 6,237 5,541
Canada 611 617 624 623 622 612 623 634 631 562Mexico 499 498 490 478 493 502 494 497 478 401United States 5,415 5,229 5,342 5,389 5,245 5,138 5,084 5,255 5,127 4,579
1,264 1,318 1,372 1,400 1,382 1,341 1,312 1,281 1,271 1,155
Argentina 182 183 189 185 192 189 185 182 204 177Brazil 463 499 529 558 524 485 492 464 466 435Chile 80 82 85 78 83 90 91 90 89 83Colombia 72 72 80 82 84 87 79 83 87 84Peru 49 49 50 53 54 57 54 55 54 n.d.Trinidad & Tobago 47 44 43 42 42 39 38 39 37 n.d.Venezuela 178 194 196 195 183 170 156 143 127 n.d.Other 195 196 201 206 220 223 215 226 240 n.d.
4,393 4,346 4,248 4,075 4,136 4,143 4,203 4,131 3,961 3,542
Belgium 119 111 113 106 113 109 109 111 112 103Czech Republic 119 116 111 108 109 110 112 111 106 92Finland 60 54 55 51 47 51 48 50 45 n.d.France 369 372 372 342 347 347 352 346 337 294Germany 797 813 831 791 795 801 787 765 715 650Italy 422 399 365 348 355 351 348 342 335 291Netherlands 188 186 185 178 185 185 184 177 170 160Norway 49 47 47 47 47 46 46 46 46 42Poland 338 331 328 317 321 332 345 346 326 301Portugal 53 51 51 50 54 53 57 53 49 43Romania 93 89 78 78 78 76 79 80 77 71Spain 292 286 259 258 273 265 281 275 258 208Sweden 51 48 46 45 45 45 45 42 41 37Turkey 337 350 341 363 375 398 438 434 423 401United Kingdom 466 488 476 435 423 398 386 378 364 320EU 3,858 3,808 3,717 3,538 3,579 3,559 3,580 3,514 3,354 2,974Other 639 604 589 559 570 577 588 575 556 n.d.
2,761 2,748 2,699 2,582 2,530 2,535 2,570 2,652 2,698 2,564
Azerbaijan 28 30 31 33 33 33 33 33 36 n.d.Kazakhstan 259 261 279 232 222 240 243 237 236 234Russia 1,849 1,842 1,789 1,769 1,773 1,752 1,802 1,869 1,919 1,807Ukraine 337 329 315 266 225 225 203 216 201 195Uzbekistan 128 116 117 109 104 110 115 115 119 114Other 160 170 168 174 173 174 175 182 188 213
1,826 1,921 1,956 2,027 2,049 2,068 2,097 2,085 2,120 2,074
Iran 607 618 638 662 650 655 678 690 695 694Iraq 132 153 163 167 161 171 173 190 204 184Kuwait 84 87 89 87 92 94 93 93 97 99Qatar 76 86 88 95 98 99 102 105 107 105Saudi Arabia 475 507 515 551 576 573 560 534 531 514United Arab Emirates 170 180 188 188 200 207 216 207 206 198Other 281 289 275 277 272 269 275 266 281 280
1,201 1,273 1,303 1,357 1,349 1,368 1,399 1,449 1,437 1,340
Algeria 119 130 133 144 152 150 150 160 165 150Angola 39 39 42 44 44 44 39 39 41 n.d.Egypt 218 229 225 227 234 245 252 260 266 253Libya 40 54 57 67 60 57 64 65 67 n.d.Nigeria 99 103 113 119 111 111 115 139 116 117South Africa 429 445 456 467 443 444 452 449 437 408Other 257 273 277 290 306 317 328 337 345 n.d.
16,404 17,043 17,638 17,802 17,810 17,960 18,272 18,682 18,991 18,768
Australia 414 412 409 399 406 417 423 421 416 399China 10,235 10,609 11,148 11,104 11,033 11,050 11,156 11,350 11,613 11,801India 1,853 2,021 2,061 2,235 2,257 2,302 2,426 2,547 2,578 2,436Indonesia 505 520 483 518 522 525 563 620 664 631Japan 1,270 1,310 1,316 1,273 1,234 1,223 1,204 1,157 1,133 1,062Malaysia 215 218 237 245 245 243 243 263 269 249New Zealand 33 35 35 36 36 35 36 36 36 33South Korea 675 681 680 676 690 708 717 719 656 614Taiwan 267 262 265 273 272 276 283 279 268 264Thailand 251 269 283 279 283 281 277 276 277 275Other 685 706 722 763 831 900 942 1,014 1,081 1,002
13,156 13,002 13,030 12,838 12,747 12,668 12,667 12,738 12,329 11,104
21,217 21,991 22,641 22,897 22,869 22,998 23,387 23,935 24,403 23,789
34,373 34,992 35,671 35,734 35,615 35,667 36,054 36,661 36,682 34,892
Note: Total CO 2 emissions includes emissions from fuel combustion, emissions from industrial process, fugitive emissions from flared gas and emissions from wastes
North America
Total CO2 Emissions(Million tonnes of carbon dioxide)
World
Non-OECD
OECD
Asia-Pacific
Africa
Middle East
Former Soviet Union
Europe
South and Central America
41
Statistical annex / CO2 Emissions from Fossil Fuels
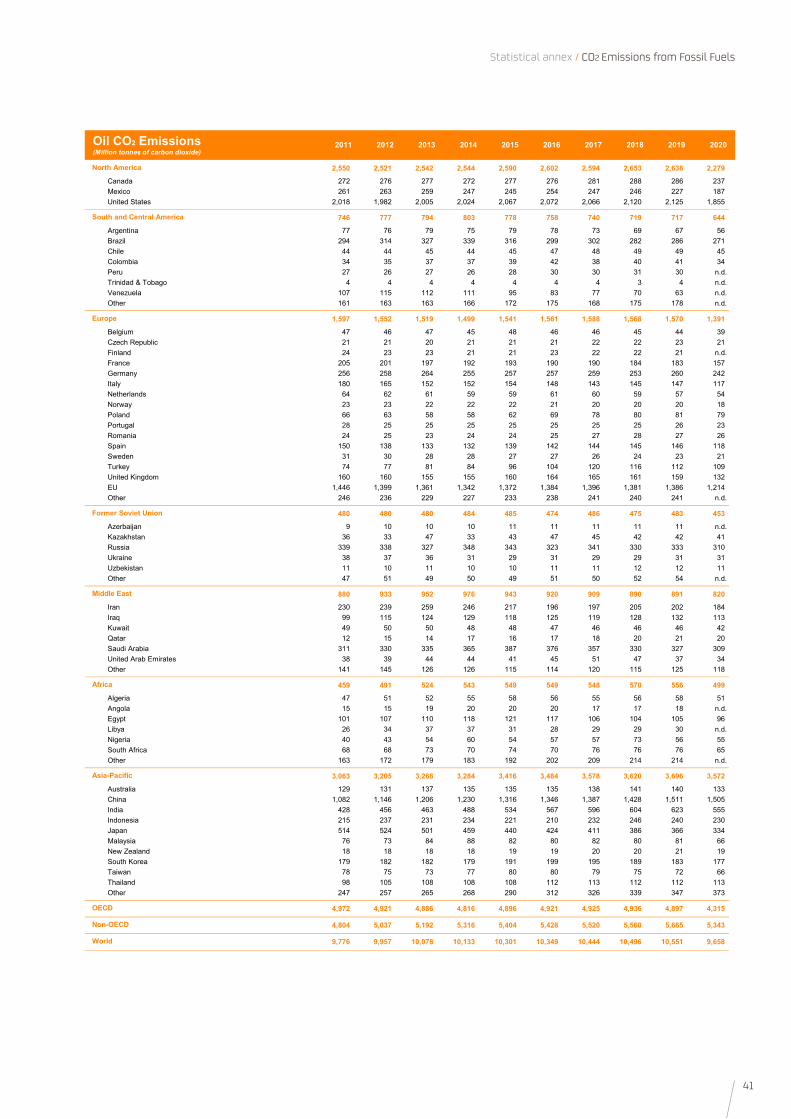
2011 2012 2013 2014 2015 2016 2017 2018 2019 2020
2,550 2,521 2,542 2,544 2,590 2,602 2,594 2,653 2,638 2,279
Canada 272 276 277 272 277 276 281 288 286 237Mexico 261 263 259 247 245 254 247 246 227 187United States 2,018 1,982 2,005 2,024 2,067 2,072 2,066 2,120 2,125 1,855
746 777 794 803 778 758 740 719 717 644
Argentina 77 76 79 75 79 78 73 69 67 56Brazil 294 314 327 339 316 299 302 282 286 271Chile 44 44 45 44 45 47 48 49 49 45Colombia 34 35 37 37 39 42 38 40 41 34Peru 27 26 27 26 28 30 30 31 30 n.d.Trinidad & Tobago 4 4 4 4 4 4 4 3 4 n.d.Venezuela 107 115 112 111 95 83 77 70 63 n.d.Other 161 163 163 166 172 175 168 175 178 n.d.
1,597 1,552 1,519 1,499 1,541 1,561 1,588 1,568 1,570 1,391
Belgium 47 46 47 45 48 46 46 45 44 39Czech Republic 21 21 20 21 21 21 22 22 23 21Finland 24 23 23 21 21 23 22 22 21 n.d.France 205 201 197 192 193 190 190 184 183 157Germany 256 258 264 255 257 257 259 253 260 242Italy 180 165 152 152 154 148 143 145 147 117Netherlands 64 62 61 59 59 61 60 59 57 54Norway 23 23 22 22 22 21 20 20 20 18Poland 66 63 58 58 62 69 78 80 81 79Portugal 28 25 25 25 25 25 25 25 26 23Romania 24 25 23 24 24 25 27 28 27 26Spain 150 138 133 132 139 142 144 145 146 118Sweden 31 30 28 28 27 27 26 24 23 21Turkey 74 77 81 84 96 104 120 116 112 109United Kingdom 160 160 155 155 160 164 165 161 159 132EU 1,446 1,399 1,361 1,342 1,372 1,384 1,396 1,381 1,386 1,214Other 246 236 229 227 233 238 241 240 241 n.d.
480 480 480 484 485 474 486 475 483 453
Azerbaijan 9 10 10 10 11 11 11 11 11 n.d.Kazakhstan 36 33 47 33 43 47 45 42 42 41Russia 339 338 327 348 343 323 341 330 333 310Ukraine 38 37 36 31 29 31 29 29 31 31Uzbekistan 11 10 11 10 10 11 11 12 12 11Other 47 51 49 50 49 51 50 52 54 n.d.
880 933 952 976 943 920 909 890 891 820
Iran 230 239 259 246 217 196 197 205 202 184Iraq 99 115 124 129 118 125 119 128 132 113Kuwait 49 50 50 48 48 47 46 46 46 42Qatar 12 15 14 17 16 17 18 20 21 20Saudi Arabia 311 330 335 365 387 376 357 330 327 309United Arab Emirates 38 39 44 44 41 45 51 47 37 34Other 141 145 126 126 115 114 120 115 125 118
459 491 524 543 549 549 548 570 556 499
Algeria 47 51 52 55 58 56 55 56 58 51Angola 15 15 19 20 20 20 17 17 18 n.d.Egypt 101 107 110 118 121 117 106 104 105 96Libya 26 34 37 37 31 28 29 29 30 n.d.Nigeria 40 43 54 60 54 57 57 73 56 55South Africa 68 68 73 70 74 70 76 76 76 65Other 163 172 179 183 192 202 209 214 214 n.d.
3,063 3,205 3,268 3,284 3,416 3,484 3,578 3,620 3,696 3,572
Australia 129 131 137 135 135 135 138 141 140 133China 1,082 1,146 1,206 1,230 1,316 1,346 1,387 1,428 1,511 1,505India 428 456 463 488 534 567 596 604 623 555Indonesia 215 237 231 234 221 210 232 246 240 230Japan 514 524 501 459 440 424 411 386 366 334Malaysia 76 73 84 88 82 80 82 80 81 66New Zealand 18 18 18 18 19 19 20 20 21 19South Korea 179 182 182 179 191 199 195 189 183 177Taiwan 78 75 73 77 80 80 79 75 72 66Thailand 98 105 108 108 108 112 113 112 112 113Other 247 257 265 268 290 312 326 339 347 373
4,972 4,921 4,886 4,816 4,896 4,921 4,925 4,936 4,897 4,315
4,804 5,037 5,192 5,316 5,404 5,428 5,520 5,560 5,665 5,343
9,776 9,957 10,078 10,133 10,301 10,349 10,444 10,496 10,551 9,658
Africa
Asia-Pacific
OECD
Non-OECD
World
Middle East
Oil CO2 Emissions(Million tonnes of carbon dioxide)
North America
South and Central America
Europe
Former Soviet Union
42
Annual / Energy-Statistics 2021
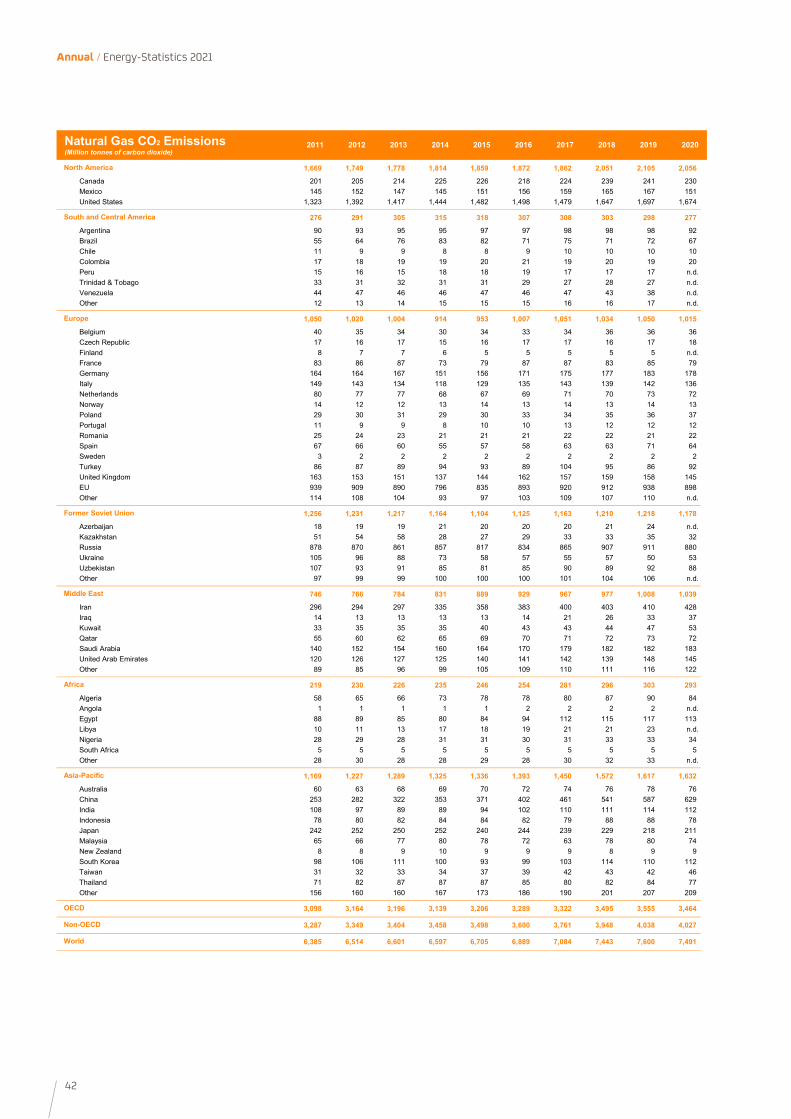
2011 2012 2013 2014 2015 2016 2017 2018 2019 2020
1,669 1,749 1,778 1,814 1,859 1,872 1,862 2,051 2,105 2,056
Canada 201 205 214 225 226 218 224 239 241 230Mexico 145 152 147 145 151 156 159 165 167 151United States 1,323 1,392 1,417 1,444 1,482 1,498 1,479 1,647 1,697 1,674
276 291 305 315 318 307 308 303 298 277
Argentina 90 93 95 95 97 97 98 98 98 92Brazil 55 64 76 83 82 71 75 71 72 67Chile 11 9 9 8 8 9 10 10 10 10Colombia 17 18 19 19 20 21 19 20 19 20Peru 15 16 15 18 18 19 17 17 17 n.d.Trinidad & Tobago 33 31 32 31 31 29 27 28 27 n.d.Venezuela 44 47 46 46 47 46 47 43 38 n.d.Other 12 13 14 15 15 15 16 16 17 n.d.
1,050 1,020 1,004 914 953 1,007 1,051 1,034 1,050 1,015
Belgium 40 35 34 30 34 33 34 36 36 36Czech Republic 17 16 17 15 16 17 17 16 17 18Finland 8 7 7 6 5 5 5 5 5 n.d.France 83 86 87 73 79 87 87 83 85 79Germany 164 164 167 151 156 171 175 177 183 178Italy 149 143 134 118 129 135 143 139 142 136Netherlands 80 77 77 68 67 69 71 70 73 72Norway 14 12 12 13 14 13 14 13 14 13Poland 29 30 31 29 30 33 34 35 36 37Portugal 11 9 9 8 10 10 13 12 12 12Romania 25 24 23 21 21 21 22 22 21 22Spain 67 66 60 55 57 58 63 63 71 64Sweden 3 2 2 2 2 2 2 2 2 2Turkey 86 87 89 94 93 89 104 95 86 92United Kingdom 163 153 151 137 144 162 157 159 158 145EU 939 909 890 796 835 893 920 912 938 898Other 114 108 104 93 97 103 109 107 110 n.d.
1,256 1,231 1,217 1,164 1,104 1,125 1,163 1,210 1,218 1,178
Azerbaijan 18 19 19 21 20 20 20 21 24 n.d.Kazakhstan 51 54 58 28 27 29 33 33 35 32Russia 878 870 861 857 817 834 865 907 911 880Ukraine 105 96 88 73 58 57 55 57 50 53Uzbekistan 107 93 91 85 81 85 90 89 92 88Other 97 99 99 100 100 100 101 104 106 n.d.
746 766 784 831 889 929 967 977 1,008 1,039
Iran 296 294 297 335 358 383 400 403 410 428Iraq 14 13 13 13 13 14 21 26 33 37Kuwait 33 35 35 35 40 43 43 44 47 53Qatar 55 60 62 65 69 70 71 72 73 72Saudi Arabia 140 152 154 160 164 170 179 182 182 183United Arab Emirates 120 126 127 125 140 141 142 139 148 145Other 89 85 96 99 105 109 110 111 116 122
219 230 226 235 246 254 281 296 303 293
Algeria 58 65 66 73 78 78 80 87 90 84Angola 1 1 1 1 1 2 2 2 2 n.d.Egypt 88 89 85 80 84 94 112 115 117 113Libya 10 11 13 17 18 19 21 21 23 n.d.Nigeria 28 29 28 31 31 30 31 33 33 34South Africa 5 5 5 5 5 5 5 5 5 5Other 28 30 28 28 29 28 30 32 33 n.d.
1,169 1,227 1,289 1,325 1,336 1,393 1,450 1,572 1,617 1,632
Australia 60 63 68 69 70 72 74 76 78 76China 253 282 322 353 371 402 461 541 587 629India 108 97 89 89 94 102 110 111 114 112Indonesia 78 80 82 84 84 82 79 88 88 78Japan 242 252 250 252 240 244 239 229 218 211Malaysia 65 66 77 80 78 72 63 78 80 74New Zealand 8 8 9 10 9 9 9 8 9 9South Korea 98 106 111 100 93 99 103 114 110 112Taiwan 31 32 33 34 37 39 42 43 42 46Thailand 71 82 87 87 87 85 80 82 84 77Other 156 160 160 167 173 186 190 201 207 209
3,098 3,164 3,196 3,139 3,206 3,289 3,322 3,495 3,555 3,464
3,287 3,349 3,404 3,458 3,498 3,600 3,761 3,948 4,038 4,027
6,385 6,514 6,601 6,597 6,705 6,889 7,084 7,443 7,600 7,491
Africa
Asia-Pacific
OECD
Non-OECD
World
Middle East
Natural Gas CO2 Emissions(Million tonnes of carbon dioxide)
North America
South and Central America
Europe
Former Soviet Union
43
Statistical annex / CO2 Emissions from Fossil Fuels
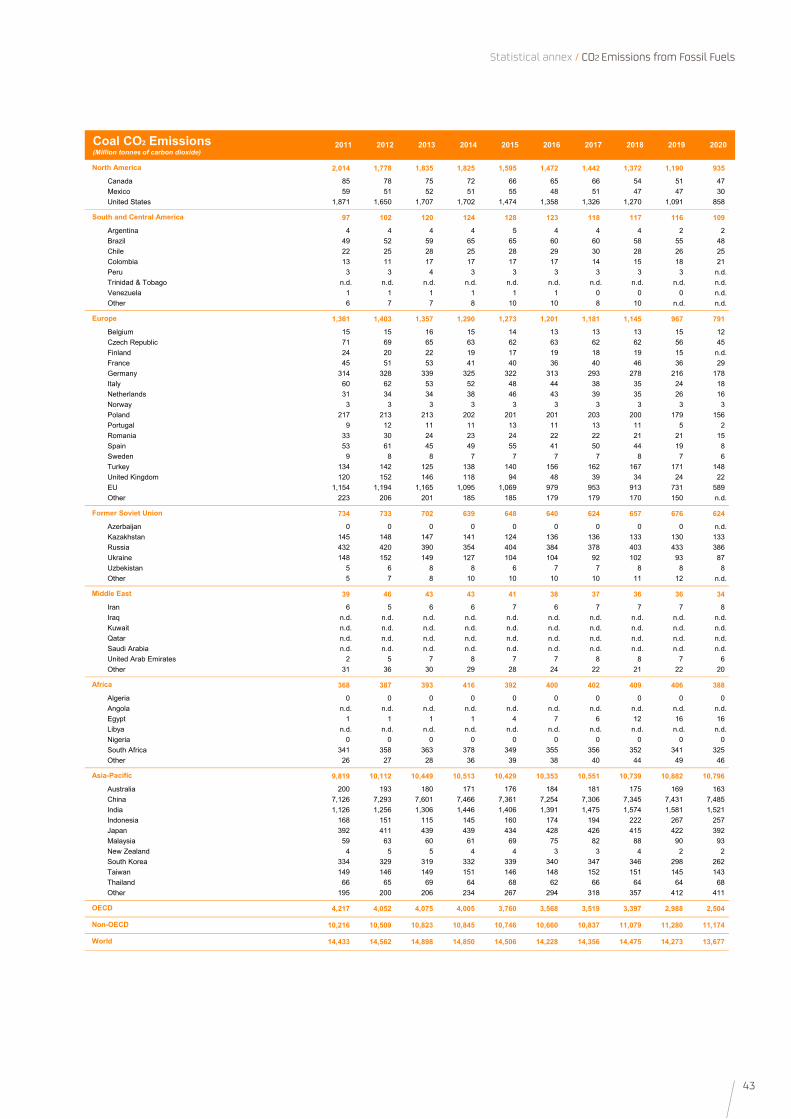
2011 2012 2013 2014 2015 2016 2017 2018 2019 2020
2,014 1,778 1,835 1,825 1,595 1,472 1,442 1,372 1,190 935
Canada 85 78 75 72 66 65 66 54 51 47Mexico 59 51 52 51 55 48 51 47 47 30United States 1,871 1,650 1,707 1,702 1,474 1,358 1,326 1,270 1,091 858
97 102 120 124 128 123 118 117 116 109
Argentina 4 4 4 4 5 4 4 4 2 2Brazil 49 52 59 65 65 60 60 58 55 48Chile 22 25 28 25 28 29 30 28 26 25Colombia 13 11 17 17 17 17 14 15 18 21Peru 3 3 4 3 3 3 3 3 3 n.d.Trinidad & Tobago n.d. n.d. n.d. n.d. n.d. n.d. n.d. n.d. n.d. n.d.Venezuela 1 1 1 1 1 1 0 0 0 n.d.Other 6 7 7 8 10 10 8 10 n.d. n.d.
1,361 1,403 1,357 1,290 1,273 1,201 1,181 1,145 967 791
Belgium 15 15 16 15 14 13 13 13 15 12Czech Republic 71 69 65 63 62 63 62 62 56 45Finland 24 20 22 19 17 19 18 19 15 n.d.France 45 51 53 41 40 36 40 46 36 29Germany 314 328 339 325 322 313 293 278 216 178Italy 60 62 53 52 48 44 38 35 24 18Netherlands 31 34 34 38 46 43 39 35 26 16Norway 3 3 3 3 3 3 3 3 3 3Poland 217 213 213 202 201 201 203 200 179 156Portugal 9 12 11 11 13 11 13 11 5 2Romania 33 30 24 23 24 22 22 21 21 15Spain 53 61 45 49 55 41 50 44 19 8Sweden 9 8 8 7 7 7 7 8 7 6Turkey 134 142 125 138 140 156 162 167 171 148United Kingdom 120 152 146 118 94 48 39 34 24 22EU 1,154 1,194 1,165 1,095 1,069 979 953 913 731 589Other 223 206 201 185 185 179 179 170 150 n.d.
734 733 702 639 648 640 624 657 676 624
Azerbaijan 0 0 0 0 0 0 0 0 0 n.d.Kazakhstan 145 148 147 141 124 136 136 133 130 133Russia 432 420 390 354 404 384 378 403 433 386Ukraine 148 152 149 127 104 104 92 102 93 87Uzbekistan 5 6 8 8 6 7 7 8 8 8Other 5 7 8 10 10 10 10 11 12 n.d.
39 46 43 43 41 38 37 36 36 34
Iran 6 5 6 6 7 6 7 7 7 8Iraq n.d. n.d. n.d. n.d. n.d. n.d. n.d. n.d. n.d. n.d.Kuwait n.d. n.d. n.d. n.d. n.d. n.d. n.d. n.d. n.d. n.d.Qatar n.d. n.d. n.d. n.d. n.d. n.d. n.d. n.d. n.d. n.d.Saudi Arabia n.d. n.d. n.d. n.d. n.d. n.d. n.d. n.d. n.d. n.d.United Arab Emirates 2 5 7 8 7 7 8 8 7 6Other 31 36 30 29 28 24 22 21 22 20
368 387 393 416 392 400 402 409 406 388
Algeria 0 0 0 0 0 0 0 0 0 0Angola n.d. n.d. n.d. n.d. n.d. n.d. n.d. n.d. n.d. n.d.Egypt 1 1 1 1 4 7 6 12 16 16Libya n.d. n.d. n.d. n.d. n.d. n.d. n.d. n.d. n.d. n.d.Nigeria 0 0 0 0 0 0 0 0 0 0South Africa 341 358 363 378 349 355 356 352 341 325Other 26 27 28 36 39 38 40 44 49 46
9,819 10,112 10,449 10,513 10,429 10,353 10,551 10,739 10,882 10,796
Australia 200 193 180 171 176 184 181 175 169 163China 7,126 7,293 7,601 7,466 7,361 7,254 7,306 7,345 7,431 7,485India 1,126 1,256 1,306 1,446 1,406 1,391 1,475 1,574 1,581 1,521Indonesia 168 151 115 145 160 174 194 222 267 257Japan 392 411 439 439 434 428 426 415 422 392Malaysia 59 63 60 61 69 75 82 88 90 93New Zealand 4 5 5 4 4 3 3 4 2 2South Korea 334 329 319 332 339 340 347 346 298 262Taiwan 149 146 149 151 146 148 152 151 145 143Thailand 66 65 69 64 68 62 66 64 64 68Other 195 200 206 234 267 294 318 357 412 411
4,217 4,052 4,075 4,005 3,760 3,568 3,519 3,397 2,988 2,504
10,216 10,509 10,823 10,845 10,746 10,660 10,837 11,079 11,280 11,174
14,433 14,562 14,898 14,850 14,506 14,228 14,356 14,475 14,273 13,677
Africa
Asia-Pacific
OECD
Non-OECD
World
Middle East
Coal CO2 Emissions(Million tonnes of carbon dioxide)
North America
South and Central America
Europe
Former Soviet Union
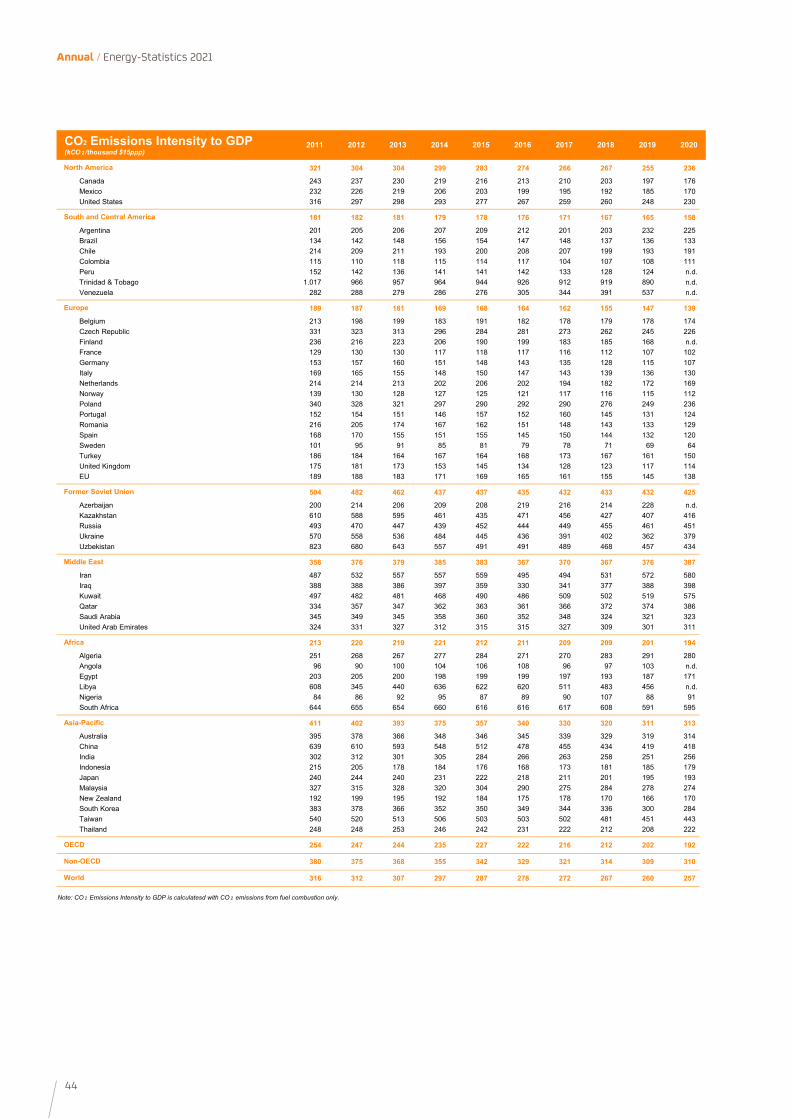
44
Annual / Energy-Statistics 2021
2011 2012 2013 2014 2015 2016 2017 2018 2019 2020
321 304 304 299 283 274 266 267 255 236
Canada 243 237 230 219 216 213 210 203 197 176Mexico 232 226 219 206 203 199 195 192 185 170United States 316 297 298 293 277 267 259 260 248 230
181 182 181 179 178 176 171 167 165 158
Argentina 201 205 206 207 209 212 201 203 232 225Brazil 134 142 148 156 154 147 148 137 136 133Chile 214 209 211 193 200 208 207 199 193 191Colombia 115 110 118 115 114 117 104 107 108 111Peru 152 142 136 141 141 142 133 128 124 n.d.Trinidad & Tobago 1.017 966 957 964 944 926 912 919 890 n.d.Venezuela 282 288 279 286 276 305 344 391 537 n.d.
189 187 181 169 168 164 162 155 147 139
Belgium 213 198 199 183 191 182 178 179 178 174Czech Republic 331 323 313 296 284 281 273 262 245 226Finland 236 216 223 206 190 199 183 185 168 n.d.France 129 130 130 117 118 117 116 112 107 102Germany 153 157 160 151 148 143 135 128 115 107Italy 169 165 155 148 150 147 143 139 136 130Netherlands 214 214 213 202 206 202 194 182 172 169Norway 139 130 128 127 125 121 117 116 115 112Poland 340 328 321 297 290 292 290 276 249 236Portugal 152 154 151 146 157 152 160 145 131 124Romania 216 205 174 167 162 151 148 143 133 129Spain 168 170 155 151 155 145 150 144 132 120Sweden 101 95 91 85 81 79 78 71 69 64Turkey 186 184 164 167 164 168 173 167 161 150United Kingdom 175 181 173 153 145 134 128 123 117 114EU 189 188 183 171 169 165 161 155 145 138
504 482 462 437 437 435 432 433 432 425
Azerbaijan 200 214 206 209 208 219 216 214 228 n.d.Kazakhstan 610 588 595 461 435 471 456 427 407 416Russia 493 470 447 439 452 444 449 455 461 451Ukraine 570 558 536 484 445 436 391 402 362 379Uzbekistan 823 680 643 557 491 491 489 468 457 434
358 376 379 385 383 367 370 367 376 387
Iran 487 532 557 557 559 495 494 531 572 580Iraq 388 388 386 397 359 330 341 377 388 398Kuwait 497 482 481 468 490 486 509 502 519 575Qatar 334 357 347 362 363 361 366 372 374 386Saudi Arabia 345 349 345 358 360 352 348 324 321 323United Arab Emirates 324 331 327 312 315 315 327 309 301 311
213 220 219 221 212 211 209 209 201 194
Algeria 251 268 267 277 284 271 270 283 291 280Angola 96 90 100 104 106 108 96 97 103 n.d.Egypt 203 205 200 198 199 199 197 193 187 171Libya 608 345 440 636 622 620 511 483 456 n.d.Nigeria 84 86 92 95 87 89 90 107 88 91South Africa 644 655 654 660 616 616 617 608 591 595
411 402 393 375 357 340 330 320 311 313
Australia 395 378 366 348 346 345 339 329 319 314China 639 610 593 548 512 478 455 434 419 418India 302 312 301 305 284 266 263 258 251 256Indonesia 215 205 178 184 176 168 173 181 185 179Japan 240 244 240 231 222 218 211 201 195 193Malaysia 327 315 328 320 304 290 275 284 278 274New Zealand 192 199 195 192 184 175 178 170 166 170South Korea 383 378 366 352 350 349 344 336 300 284Taiwan 540 520 513 506 503 503 502 481 451 443Thailand 248 248 253 246 242 231 222 212 208 222
254 247 244 235 227 222 216 212 202 192
380 375 368 355 342 329 321 314 309 310
316 312 307 297 287 278 272 267 260 257
Note: CO 2 Emissions Intensity to GDP is calculatesd with CO 2 emissions from fuel combustion only.
OECD
Non-OECD
World
Asia-Pacific
CO2 Emissions Intensity to GDP(kCO 2 /thousand $15ppp)
North America
South and Central America
Africa
Middle East
Former Soviet Union
Europe
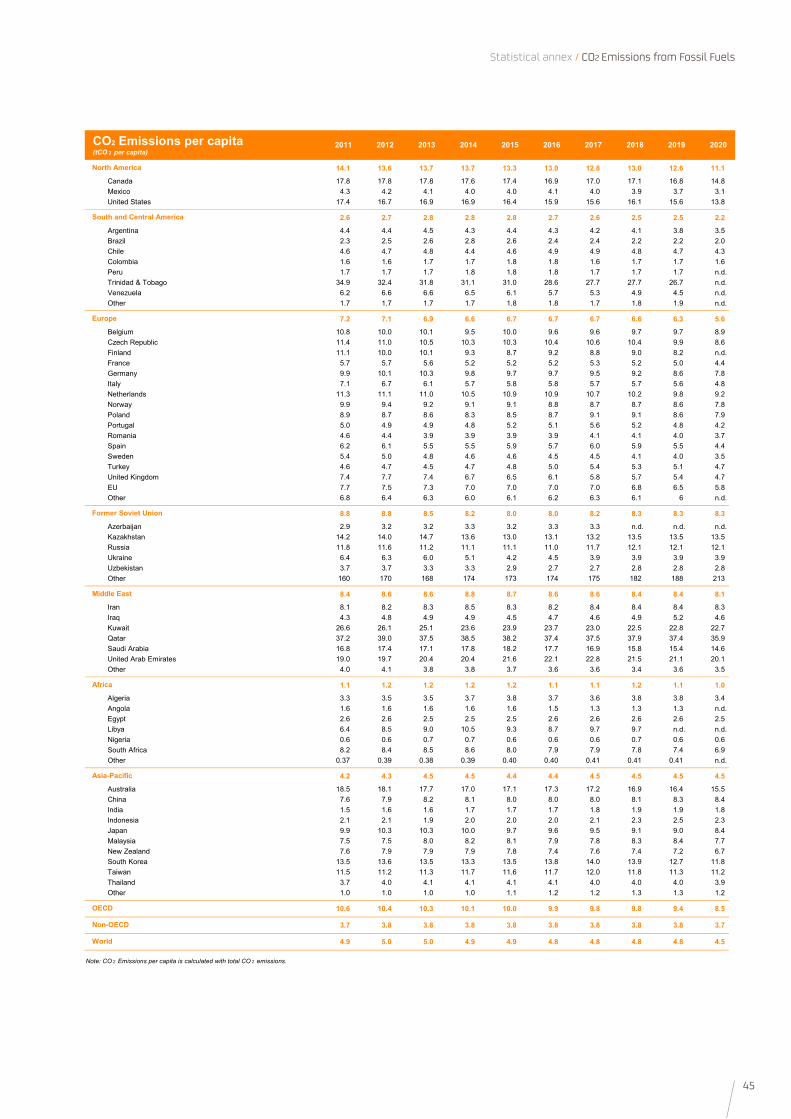
45
Statistical annex / CO2 Emissions from Fossil Fuels
2011 2012 2013 2014 2015 2016 2017 2018 2019 2020
14.1 13.6 13.7 13.7 13.3 13.0 12.8 13.0 12.6 11.1
Canada 17.8 17.8 17.8 17.6 17.4 16.9 17.0 17.1 16.8 14.8Mexico 4.3 4.2 4.1 4.0 4.0 4.1 4.0 3.9 3.7 3.1United States 17.4 16.7 16.9 16.9 16.4 15.9 15.6 16.1 15.6 13.8
2.6 2.7 2.8 2.8 2.8 2.7 2.6 2.5 2.5 2.2
Argentina 4.4 4.4 4.5 4.3 4.4 4.3 4.2 4.1 3.8 3.5Brazil 2.3 2.5 2.6 2.8 2.6 2.4 2.4 2.2 2.2 2.0Chile 4.6 4.7 4.8 4.4 4.6 4.9 4.9 4.8 4.7 4.3Colombia 1.6 1.6 1.7 1.7 1.8 1.8 1.6 1.7 1.7 1.6Peru 1.7 1.7 1.7 1.8 1.8 1.8 1.7 1.7 1.7 n.d.Trinidad & Tobago 34.9 32.4 31.8 31.1 31.0 28.6 27.7 27.7 26.7 n.d.Venezuela 6.2 6.6 6.6 6.5 6.1 5.7 5.3 4.9 4.5 n.d.Other 1.7 1.7 1.7 1.7 1.8 1.8 1.7 1.8 1.9 n.d.
7.2 7.1 6.9 6.6 6.7 6.7 6.7 6.6 6.3 5.6
Belgium 10.8 10.0 10.1 9.5 10.0 9.6 9.6 9.7 9.7 8.9Czech Republic 11.4 11.0 10.5 10.3 10.3 10.4 10.6 10.4 9.9 8.6Finland 11.1 10.0 10.1 9.3 8.7 9.2 8.8 9.0 8.2 n.d.France 5.7 5.7 5.6 5.2 5.2 5.2 5.3 5.2 5.0 4.4Germany 9.9 10.1 10.3 9.8 9.7 9.7 9.5 9.2 8.6 7.8Italy 7.1 6.7 6.1 5.7 5.8 5.8 5.7 5.7 5.6 4.8Netherlands 11.3 11.1 11.0 10.5 10.9 10.9 10.7 10.2 9.8 9.2Norway 9.9 9.4 9.2 9.1 9.1 8.8 8.7 8.7 8.6 7.8Poland 8.9 8.7 8.6 8.3 8.5 8.7 9.1 9.1 8.6 7.9Portugal 5.0 4.9 4.9 4.8 5.2 5.1 5.6 5.2 4.8 4.2Romania 4.6 4.4 3.9 3.9 3.9 3.9 4.1 4.1 4.0 3.7Spain 6.2 6.1 5.5 5.5 5.9 5.7 6.0 5.9 5.5 4.4Sweden 5.4 5.0 4.8 4.6 4.6 4.5 4.5 4.1 4.0 3.5Turkey 4.6 4.7 4.5 4.7 4.8 5.0 5.4 5.3 5.1 4.7United Kingdom 7.4 7.7 7.4 6.7 6.5 6.1 5.8 5.7 5.4 4.7EU 7.7 7.5 7.3 7.0 7.0 7.0 7.0 6.8 6.5 5.8Other 6.8 6.4 6.3 6.0 6.1 6.2 6.3 6.1 6 n.d.
8.8 8.8 8.5 8.2 8.0 8.0 8.2 8.3 8.3 8.3
Azerbaijan 2.9 3.2 3.2 3.3 3.2 3.3 3.3 n.d. n.d. n.d.Kazakhstan 14.2 14.0 14.7 13.6 13.0 13.1 13.2 13.5 13.5 13.5Russia 11.8 11.6 11.2 11.1 11.1 11.0 11.7 12.1 12.1 12.1Ukraine 6.4 6.3 6.0 5.1 4.2 4.5 3.9 3.9 3.9 3.9Uzbekistan 3.7 3.7 3.3 3.3 2.9 2.7 2.7 2.8 2.8 2.8Other 160 170 168 174 173 174 175 182 188 213
8.4 8.6 8.6 8.8 8.7 8.6 8.6 8.4 8.4 8.1
Iran 8.1 8.2 8.3 8.5 8.3 8.2 8.4 8.4 8.4 8.3Iraq 4.3 4.8 4.9 4.9 4.5 4.7 4.6 4.9 5.2 4.6Kuwait 26.6 26.1 25.1 23.6 23.9 23.7 23.0 22.5 22.8 22.7Qatar 37.2 39.0 37.5 38.5 38.2 37.4 37.5 37.9 37.4 35.9Saudi Arabia 16.8 17.4 17.1 17.8 18.2 17.7 16.9 15.8 15.4 14.6United Arab Emirates 19.0 19.7 20.4 20.4 21.6 22.1 22.8 21.5 21.1 20.1Other 4.0 4.1 3.8 3.8 3.7 3.6 3.6 3.4 3.6 3.5
1.1 1.2 1.2 1.2 1.2 1.1 1.1 1.2 1.1 1.0
Algeria 3.3 3.5 3.5 3.7 3.8 3.7 3.6 3.8 3.8 3.4Angola 1.6 1.6 1.6 1.6 1.6 1.5 1.3 1.3 1.3 n.d.Egypt 2.6 2.6 2.5 2.5 2.5 2.6 2.6 2.6 2.6 2.5Libya 6.4 8.5 9.0 10.5 9.3 8.7 9.7 9.7 n.d. n.d.Nigeria 0.6 0.6 0.7 0.7 0.6 0.6 0.6 0.7 0.6 0.6South Africa 8.2 8.4 8.5 8.6 8.0 7.9 7.9 7.8 7.4 6.9Other 0.37 0.39 0.38 0.39 0.40 0.40 0.41 0.41 0.41 n.d.
4.2 4.3 4.5 4.5 4.4 4.4 4.5 4.5 4.5 4.5
Australia 18.5 18.1 17.7 17.0 17.1 17.3 17.2 16.9 16.4 15.5China 7.6 7.9 8.2 8.1 8.0 8.0 8.0 8.1 8.3 8.4India 1.5 1.6 1.6 1.7 1.7 1.7 1.8 1.9 1.9 1.8Indonesia 2.1 2.1 1.9 2.0 2.0 2.0 2.1 2.3 2.5 2.3Japan 9.9 10.3 10.3 10.0 9.7 9.6 9.5 9.1 9.0 8.4Malaysia 7.5 7.5 8.0 8.2 8.1 7.9 7.8 8.3 8.4 7.7New Zealand 7.6 7.9 7.9 7.9 7.8 7.4 7.6 7.4 7.2 6.7South Korea 13.5 13.6 13.5 13.3 13.5 13.8 14.0 13.9 12.7 11.8Taiwan 11.5 11.2 11.3 11.7 11.6 11.7 12.0 11.8 11.3 11.2Thailand 3.7 4.0 4.1 4.1 4.1 4.1 4.0 4.0 4.0 3.9Other 1.0 1.0 1.0 1.0 1.1 1.2 1.2 1.3 1.3 1.2
10.6 10.4 10.3 10.1 10.0 9.9 9.8 9.8 9.4 8.5
3.7 3.8 3.8 3.8 3.8 3.8 3.8 3.8 3.8 3.7
4.9 5.0 5.0 4.9 4.9 4.8 4.8 4.8 4.8 4.5
Note: CO 2 Emissions per capita is calculated with total CO 2 emissions.
Former Soviet Union
CO2 Emissions per capita(tCO 2 per capita)
North America
South and Central America
Europe
World
Middle East
Africa
Asia-Pacific
OECD
Non-OECD

Primary Energy Intensity to GDP
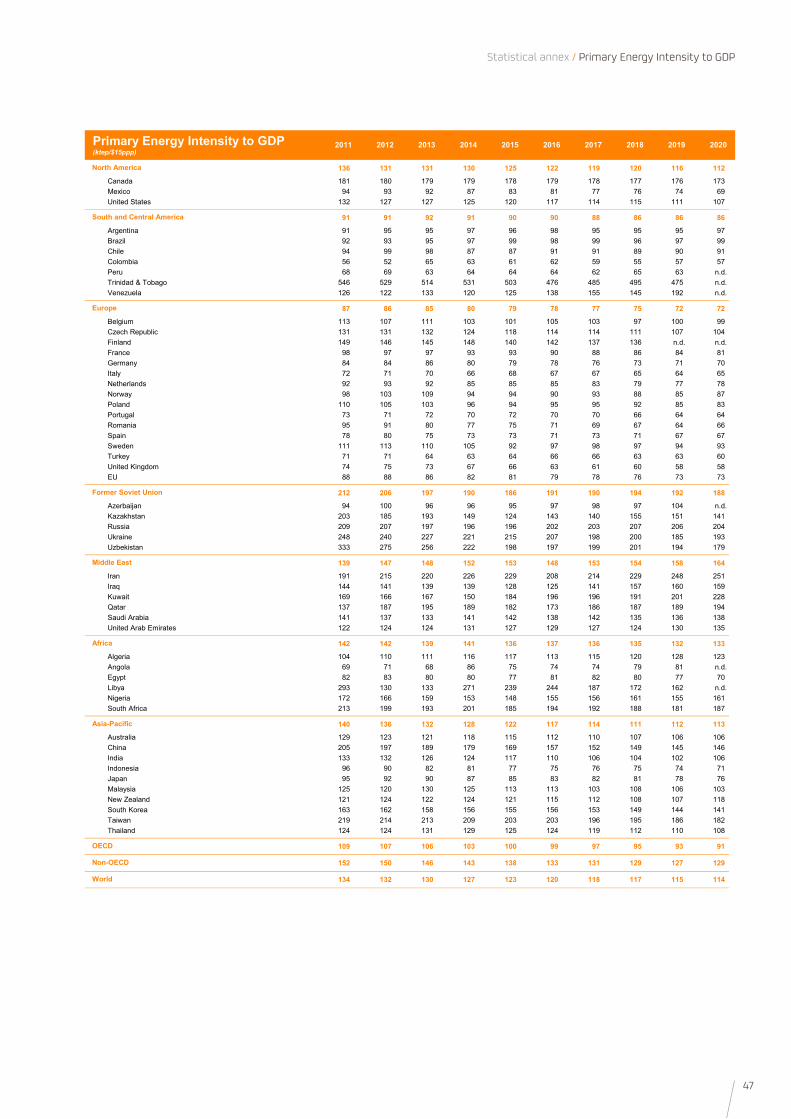
47
Statistical annex / Primary Energy Intensity to GDP
2011 2012 2013 2014 2015 2016 2017 2018 2019 2020
136 131 131 130 125 122 119 120 116 112
Canada 181 180 179 179 178 179 178 177 176 173Mexico 94 93 92 87 83 81 77 76 74 69United States 132 127 127 125 120 117 114 115 111 107
91 91 92 91 90 90 88 86 86 86
Argentina 91 95 95 97 96 98 95 95 95 97Brazil 92 93 95 97 99 98 99 96 97 99Chile 94 99 98 87 87 91 91 89 90 91Colombia 56 52 65 63 61 62 59 55 57 57Peru 68 69 63 64 64 64 62 65 63 n.d.Trinidad & Tobago 546 529 514 531 503 476 485 495 475 n.d.Venezuela 126 122 133 120 125 138 155 145 192 n.d.
87 86 85 80 79 78 77 75 72 72
Belgium 113 107 111 103 101 105 103 97 100 99Czech Republic 131 131 132 124 118 114 114 111 107 104Finland 149 146 145 148 140 142 137 136 n.d. n.d.France 98 97 97 93 93 90 88 86 84 81Germany 84 84 86 80 79 78 76 73 71 70Italy 72 71 70 66 68 67 67 65 64 65Netherlands 92 93 92 85 85 85 83 79 77 78Norway 98 103 109 94 94 90 93 88 85 87Poland 110 105 103 96 94 95 95 92 85 83Portugal 73 71 72 70 72 70 70 66 64 64Romania 95 91 80 77 75 71 69 67 64 66Spain 78 80 75 73 73 71 73 71 67 67Sweden 111 113 110 105 92 97 98 97 94 93Turkey 71 71 64 63 64 66 66 63 63 60United Kingdom 74 75 73 67 66 63 61 60 58 58EU 88 88 86 82 81 79 78 76 73 73
212 206 197 190 186 191 190 194 192 188
Azerbaijan 94 100 96 96 95 97 98 97 104 n.d.Kazakhstan 203 185 193 149 124 143 140 155 151 141Russia 209 207 197 196 196 202 203 207 206 204Ukraine 248 240 227 221 215 207 198 200 185 193Uzbekistan 333 275 256 222 198 197 199 201 194 179
139 147 148 152 153 148 153 154 158 164
Iran 191 215 220 226 229 208 214 229 248 251Iraq 144 141 139 139 128 125 141 157 160 159Kuwait 169 166 167 150 184 196 196 191 201 228Qatar 137 187 195 189 182 173 186 187 189 194Saudi Arabia 141 137 133 141 142 138 142 135 136 138United Arab Emirates 122 124 124 131 127 129 127 124 130 135
142 142 139 141 136 137 136 135 132 133
Algeria 104 110 111 116 117 113 115 120 128 123Angola 69 71 68 86 75 74 74 79 81 n.d.Egypt 82 83 80 80 77 81 82 80 77 70Libya 293 130 133 271 239 244 187 172 162 n.d.Nigeria 172 166 159 153 148 155 156 161 155 161South Africa 213 199 193 201 185 194 192 188 181 187
140 136 132 128 122 117 114 111 112 113
Australia 129 123 121 118 115 112 110 107 106 106China 205 197 189 179 169 157 152 149 145 146India 133 132 126 124 117 110 106 104 102 106Indonesia 96 90 82 81 77 75 76 75 74 71Japan 95 92 90 87 85 83 82 81 78 76Malaysia 125 120 130 125 113 113 103 108 106 103New Zealand 121 124 122 124 121 115 112 108 107 118South Korea 163 162 158 156 155 156 153 149 144 141Taiwan 219 214 213 209 203 203 196 195 186 182Thailand 124 124 131 129 125 124 119 112 110 108
109 107 106 103 100 99 97 95 93 91
152 150 146 143 138 133 131 129 127 129
134 132 130 127 123 120 118 117 115 114
Middle East
Primary Energy Intensity to GDP(ktep/$15ppp)
North America
South and Central America
Europe
Former Soviet Union
OECD
Non-OECD
World
Africa
Asia-Pacific


Regional and country data

50
Annual / Energy-Statistics 2021
2011 2012 2013 2014 2015 2016 2017 2018 2019 2020 Peso en 2020 (%)
13,051.1 13,220.4 13,410.0 13,557.4 13,592.8 13,703.6 13,969.0 14,298.9 14,407.5 13,827.9 100.0
Oil 4,134.7 4,184.4 4,209.6 4,279.8 4,339.2 4,395.4 4,482.2 4,522.6 4,543.5 4,148.8 30.0Gas 2,784.3 2,836.8 2,895.0 2,898.7 2,927.1 3,015.5 3,096.4 3,259.8 3,335.0 3,291.3 23.8Coal 3,817.7 3,858.0 3,904.9 3,934.6 3,842.8 3,739.8 3,780.5 3,829.8 3,770.6 3,621.2 26.2Nuclear 673.1 641.2 646.1 660.7 669.8 679.8 687.0 706.4 728.7 700.4 5.1Hydro 301.9 316.0 327.2 333.6 334.8 347.7 350.1 362.3 368.0 376.4 2.7Biomass 1,207.5 1,237.4 1,255.2 1,259.6 1,267.8 1,292.5 1,309.2 1,324.8 1,342.3 1,343.9 9.7Other renewables 43.4 54.5 68.8 79.6 94.9 113.0 137.6 159.2 183.9 209.5 1.5Electricity balance of trade* 88.4 92.1 103.2 110.8 116.5 119.9 126.0 134.2 135.4 136.5 1.0
9,077.2 9,179.7 9,346.6 9,436.3 9,536.7 9,657.6 9,845.3 10,049.5 10,153.5 9,700.0 100.0
Oil 3,575.1 3,611.5 3,675.2 3,727.1 3,819.7 3,884.0 3,985.9 4,047.7 4,075.5 3,705.3 38.2Gas 1,305.8 1,307.8 1,358.7 1,365.0 1,366.3 1,397.4 1,455.1 1,547.7 1,572.0 1,545.6 15.9Coal 1,317.2 1,326.4 1,326.1 1,328.5 1,306.3 1,262.3 1,226.2 1,191.3 1,204.3 1,171.5 12.1Electricity 1,580.8 1,622.5 1,673.1 1,707.3 1,735.3 1,791.3 1,841.8 1,915.5 1,938.8 1,921.4 19.8Heat 309.4 318.8 314.1 313.0 313.4 328.1 335.9 349.6 354.5 360.5 3.7Biomass 988.9 992.8 999.4 995.4 995.6 994.4 1,000.4 997.7 1,008.4 995.8 10.3
1,915.4 1,960.4 2,019.1 2,056.2 2,093.9 2,155.2 2,213.1 2,299.5 2,327.4 2,313.9 100.0
Oil 89.4 96.3 92.3 89.8 86.9 80.6 73.0 67.9 61.9 55.7 2.4Gas 422.5 440.2 434.4 442.8 475.2 498.6 507.0 529.4 550.5 551.0 23.8Coal 786.4 789.6 828.0 833.6 819.6 823.2 847.6 873.4 849.0 810.5 35.0Nuclear 222.1 211.6 213.2 218.0 221.0 224.3 226.7 233.1 240.5 231.1 10.0Hydro 309.1 323.1 334.4 341.0 342.3 357.0 360.0 371.9 377.3 386.2 16.7Biomass 33.6 36.2 39.1 42.0 44.5 49.0 51.5 54.8 55.2 57.9 2.5Wind 37.6 45.2 55.7 61.7 71.7 82.8 97.4 109.5 122.1 136.9 5.9Solar 5.7 8.9 12.5 17.1 22.3 29.2 39.1 48.6 59.7 72.0 3.1Other renewables 9.1 9.2 9.6 10.1 10.3 10.4 10.8 10.9 11.3 12.6 0.5
9,077.2 9,179.7 9,346.6 9,436.3 9,536.7 9,657.6 9,845.3 10,049.5 10,153.5 9,700.0 100.0
Industry 2,928.0 2,963.6 2,981.6 2,998.0 2,993.8 2,990.6 3,017.3 3,040.5 3,083.1 3,036.5 31.3Transport 2,415.1 2,447.6 2,517.5 2,559.3 2,636.5 2,698.2 2,768.0 2,837.0 2,854.7 2,504.4 25.8Residential/Comercial 2,717.7 2,716.6 2,792.1 2,783.1 2,803.5 2,850.4 2,904.0 2,982.0 3,005.3 2,968.2 30.6
3,575.1 3,611.5 3,675.2 3,727.1 3,819.7 3,884.0 3,985.9 4,047.7 4,075.5 3,705.3 100.0
Industry 278.5 278.2 277.0 270.6 282.3 287.4 289.1 275.6 277.9 273.9 7.4Transport 2,297.9 2,321.2 2,382.9 2,417.1 2,488.5 2,544.4 2,608.6 2,662.3 2,672.4 2,328.7 62.8Residential/Comercial 283.8 278.3 285.9 278.7 287.4 289.9 297.1 295.7 299.7 292.5 7.9
1,305.8 1,307.8 1,358.7 1,365.0 1,366.3 1,397.4 1,455.1 1,547.7 1,572.0 1,545.6 100.0
Industry 513.0 529.3 535.6 544.7 542.1 548.5 573.7 599.4 611.6 604.4 39.1Transport 31.8 33.6 35.6 39.1 41.4 42.4 44.0 51.8 54.0 54.4 3.5Residential/Comercial 597.3 577.0 618.6 610.0 609.3 624.7 640.9 689.7 694.3 678.3 43.9
3,560.4 3,600.7 3,662.8 3,714.9 3,806.3 3,868.7 3,973.3 4,035.3 4,063.4 3,693.8 100.0
Gasoline 968.5 984.6 1,015.5 1,023.5 1,058.2 1,083.9 1,097.9 1,110.1 1,115.6 989.1 26.8Diesel 1,193.2 1,215.0 1,233.3 1,256.6 1,274.8 1,272.0 1,300.4 1,323.9 1,337.4 1,238.1 33.5Heating Oil 282.7 265.0 255.2 250.8 247.1 251.5 260.8 259.3 246.0 229.6 6.2Aviation Jet 258.0 260.9 268.0 277.1 292.4 305.9 324.8 337.0 340.2 211.7 5.7LPG 232.8 237.7 254.2 259.1 270.1 279.1 286.9 299.6 306.9 302.9 8.2
4,281.1 4,310.4 4,307.7 4,274.6 4,461.8 4,644.6 4,824.9 4,892.8 4,856.3 4,502.2 100.0
Oil 3,412.9 3,450.5 3,435.3 3,428.5 3,584.4 3,720.2 3,826.9 3,873.7 3,799.5 3,487.9 77.5Gas 868.2 860.0 872.4 846.1 877.4 924.4 998.0 1,019.1 1,056.9 1,014.3 22.5Gasoline 197.4 202.0 206.2 208.2 223.6 239.8 241.9 249.6 242.8 219.7 4.9Diesel 322.6 332.5 352.4 363.3 379.1 401.8 405.6 412.3 407.0 361.9 8.0Heating Oil 255.0 249.3 250.3 238.8 243.4 237.4 224.2 223.8 192.1 194.9 4.3Aviation Jet 67.7 67.0 71.9 70.8 77.6 86.0 91.6 92.6 94.2 62.9 1.4LPG 84.9 86.4 91.9 100.1 109.4 124.2 130.0 136.0 142.1 137.9 3.1
4,269.5 4,339.2 4,352.7 4,322.2 4,539.0 4,744.5 4,880.9 4,985.6 4,937.4 4,641.4 100.0
Oil 3,411.0 3,469.1 3,464.1 3,452.2 3,636.8 3,799.6 3,852.5 3,924.4 3,828.3 3,574.9 77.0Gas 858.5 870.1 888.6 870.0 902.2 944.9 1,028.4 1,061.2 1,109.1 1,066.5 23.0Gasoline 183.8 196.5 190.9 198.5 225.5 240.1 242.6 252.1 238.8 205.7 4.4Diesel 328.3 348.8 358.0 360.7 386.2 411.2 429.4 428.0 423.7 393.7 8.5Heating Oil 294.8 284.2 300.4 291.8 303.3 282.9 269.0 266.8 230.7 229.9 5.0Aviation Jet 76.5 80.1 87.1 84.4 89.3 92.7 98.6 103.6 102.7 78.4 1.7LPG 81.3 81.5 81.0 100.5 108.4 123.7 128.2 129.6 126.4 128.5 2.8
30,773.6 31,216.6 31,764.2 31,769.5 31,702.5 31,677.1 32,101.8 32,641.8 32,660.7 31,067.3 -
316.4 311.8 307.3 297.3 287.2 278.2 272.0 267.2 260.2 256.8 -
85.3 83.6 82.6 80.4 78.7 77.2 75.8 74.7 73.4 72.5 -
134.2 132.0 129.7 126.9 123.1 120.3 118.4 117.0 114.8 114.3 -
*Heat is included
Final energy intensity (toe/million $15ppp)
Total energy intensity (toe/million $15ppp)
Natural gas final consumption, by sector
Refined products consumption
Imports
Exports
CO2 Emissions (Million tons CO 2 )
CO2 Intensity (tCO 2 /million $15ppp)
Oil final consumption, by sector
World(Million toe)
Total primary energy demand, by source
Total final consumption, by source
Electricity generation, by source
Total final consumption, by sector
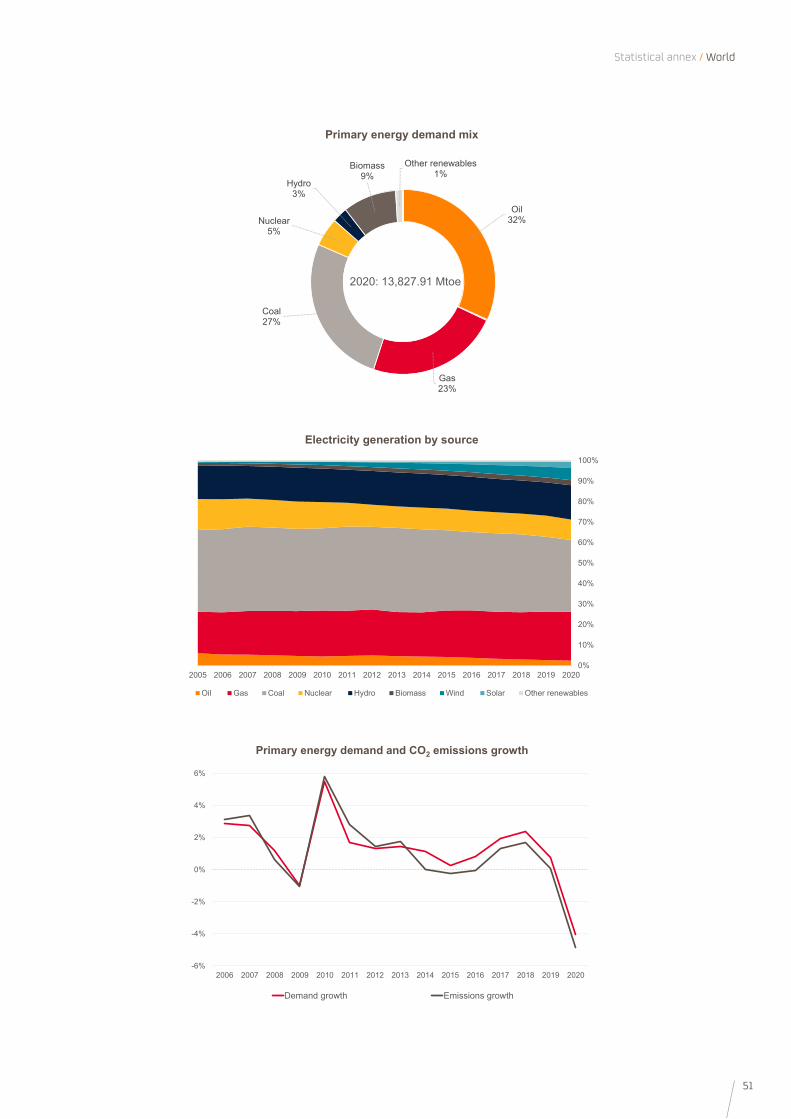
51
0%
10%
20%
30%
40%
50%
60%
70%
80%
90%
100%
2005 2006 2007 2008 2009 2010 2011 2012 2013 2014 2015 2016 2017 2018 2019 2020
Oil Gas Coal Nuclear Hydro Biomass Wind Solar Other renewables
Electricity generation by source
-6%
-4%
-2%
0%
2%
4%
6%
2006 2007 2008 2009 2010 2011 2012 2013 2014 2015 2016 2017 2018 2019 2020
Demand growth Emissions growth
Primary energy demand and CO2 emissions growth
Statistical annex / World
Oil 32%
Gas23%
Coal27%
Nuclear5%
Hydro3%
Biomass9%
Other renewables1%
2020: 13,827.91 Mtoe
Primary energy demand mix

52
Annual / Energy-Statistics 2021
2011 2012 2013 2014 2015 2016 2017 2018 2019 2020 Peso en 2020 (%)
5,342.1 5,303.7 5,338.0 5,288.4 5,289.0 5,291.6 5,325.2 5,381.5 5,316.3 4,942.6 100.0
Oil 1,935.8 1,924.6 1,898.5 1,877.8 1,904.3 1,898.6 1,917.7 1,907.0 1,893.1 1,695.4 34.3Gas 1,318.3 1,345.2 1,368.2 1,347.9 1,375.3 1,418.6 1,433.2 1,496.8 1,526.4 1,491.8 30.2Coal 1,070.0 1,025.1 1,030.4 1,010.7 947.4 898.7 881.1 854.0 756.5 635.0 12.8Nuclear 543.9 508.6 511.4 516.1 513.6 512.3 509.6 515.8 519.4 487.5 9.9Hydro 119.6 119.7 121.8 120.7 118.9 121.2 120.3 122.8 120.5 124.5 2.5Biomass 278.8 299.0 313.9 313.1 316.5 320.5 330.3 339.5 342.0 336.1 6.8Other renewables 33.9 41.2 49.6 56.2 65.3 72.5 84.2 91.6 103.8 117.2 2.4Electricity balance of trade* 41.8 40.4 44.2 46.0 47.7 49.2 48.8 54.0 54.5 55.1 1.1
3,656.7 3,633.9 3,688.9 3,655.8 3,680.3 3,711.4 3,754.1 3,816.6 3,799.4 3,518.1 100.0
Oil 1,716.5 1,691.6 1,697.1 1,691.2 1,721.8 1,736.9 1,753.7 1,759.2 1,753.3 1,563.4 44.4Gas 689.3 686.1 724.1 710.1 701.8 710.3 728.4 764.9 768.2 732.8 20.8Coal 180.4 176.2 173.8 171.2 167.9 161.4 162.4 158.1 152.1 133.5 3.8Electricity 806.7 805.7 808.7 805.6 808.7 818.6 820.1 835.0 825.4 796.0 22.6Heat 67.8 68.4 68.3 65.1 65.9 69.2 69.1 71.0 70.8 71.1 2.0Biomass 196.0 205.8 216.8 212.7 214.1 215.1 220.4 228.4 229.6 221.3 6.3
941.7 940.3 941.0 936.6 939.9 947.0 950.1 965.6 953.3 927.6 100.0
Oil 30.6 34.2 29.6 24.1 22.4 21.1 19.0 17.7 15.4 11.8 1.3Gas 229.7 239.3 228.2 226.1 244.5 259.0 256.3 269.6 283.1 286.8 30.9Coal 312.3 300.6 304.4 299.4 278.1 261.7 258.0 248.9 215.2 179.7 19.4Nuclear 179.5 167.8 168.8 170.3 169.5 169.1 168.2 170.2 171.4 160.9 17.3Hydro 125.0 125.1 127.0 125.9 124.0 126.7 126.1 128.3 125.6 130.0 14.0Biomass 23.8 25.6 26.8 28.1 29.4 30.2 31.3 32.1 32.3 32.9 3.6Wind 28.5 32.8 38.6 42.1 48.1 52.2 60.0 64.0 71.4 80.0 8.6Solar 5.3 8.0 10.4 13.3 16.4 19.5 23.4 27.0 30.9 36.5 3.9Other renewables 6.9 6.9 7.2 7.4 7.5 7.6 7.8 7.7 7.9 9.0 1.0
3,656.7 3,633.9 3,688.9 3,655.8 3,680.3 3,711.4 3,754.1 3,816.6 3,799.4 3,518.1 100.0
Industry 868.0 866.8 868.8 863.5 860.6 860.8 873.0 890.6 882.8 831.4 23.6Transport 1,164.1 1,151.4 1,170.7 1,173.3 1,205.8 1,224.5 1,237.2 1,254.2 1,252.2 1,093.6 31.1Residential/Comercial 1,189.7 1,174.5 1,216.3 1,175.7 1,175.7 1,182.1 1,185.0 1,215.6 1,205.6 1,157.4 32.9
1,716.5 1,691.6 1,697.1 1,691.2 1,721.8 1,736.9 1,753.7 1,759.2 1,753.3 1,563.4 100.0
Industry 92.7 88.9 84.6 79.6 81.8 80.4 80.5 83.2 81.9 74.5 4.8Transport 1,109.7 1,090.7 1,107.5 1,108.6 1,140.3 1,155.9 1,165.7 1,181.2 1,178.5 1,024.1 65.5Residential/Comercial 136.3 129.2 131.3 119.7 122.0 121.4 119.7 111.6 109.5 102.0 6.5
689.3 686.1 724.1 710.1 701.8 710.3 728.4 764.9 768.2 732.8 100.0
Industry 252.7 259.9 263.1 264.7 261.3 266.2 272.3 282.4 283.7 273.6 37.3Transport 3.3 3.4 3.6 3.9 4.0 4.1 4.2 4.5 4.6 4.4 0.6Residential/Comercial 394.9 383.4 417.5 400.7 395.4 394.9 401.1 426.0 425.5 402.0 54.9
1,711.1 1,686.5 1,691.6 1,685.7 1,715.0 1,731.5 1,746.8 1,751.6 1,746.1 1,556.8 100.0
Gasoline 601.0 591.1 593.3 591.8 603.6 611.9 608.7 614.7 613.3 530.5 34.1Diesel 591.9 584.5 588.5 591.5 599.2 602.1 612.2 617.0 612.3 559.9 36.0Heating Oil 31.9 27.7 21.4 18.7 20.3 18.4 17.6 16.5 15.8 12.0 0.8Aviation Jet 68.8 68.9 71.7 73.8 77.0 79.7 83.3 85.2 86.8 54.2 3.5LPG 103.7 103.0 111.2 107.7 108.8 107.9 105.2 109.1 110.0 105.9 6.8
2,731.9 2,705.3 2,636.0 2,554.7 2,658.4 2,744.7 2,819.1 2,801.8 2,750.3 2,463.1 100.0
Oil 2,075.8 2,057.4 1,986.6 1,935.1 2,024.2 2,072.3 2,101.5 2,084.7 2,006.8 1,762.5 71.6Gas 656.1 647.9 649.4 619.6 634.2 672.4 717.7 717.1 743.4 700.6 28.4Gasoline 92.4 91.3 84.8 82.0 92.5 99.7 97.6 100.1 100.8 96.2 3.9Diesel 155.8 159.8 169.6 168.1 182.2 194.4 196.0 196.0 192.8 180.8 7.3Heating Oil 94.8 92.6 91.6 87.4 86.8 84.2 67.1 68.5 57.2 60.4 2.5Aviation Jet 40.0 40.4 44.1 44.3 49.5 54.4 57.4 59.7 62.4 40.3 1.6LPG 50.1 50.2 51.3 52.3 54.4 59.3 59.7 62.2 62.4 58.0 2.4
1,190.0 1,228.1 1,252.5 1,287.5 1,382.6 1,457.4 1,585.5 1,665.2 1,737.6 1,707.7 100.0
Oil 882.5 911.3 934.4 978.6 1,052.6 1,097.9 1,168.0 1,233.6 1,267.4 1,223.7 71.7Gas 307.6 316.8 318.0 308.9 330.0 359.5 417.4 431.6 470.1 483.9 28.3Gasoline 107.6 118.8 113.9 117.9 134.7 140.9 148.6 152.3 143.8 118.7 7.0Diesel 169.1 188.1 196.3 191.1 201.9 206.9 220.9 205.2 211.2 195.9 11.5Heating Oil 107.1 102.8 105.0 107.3 113.4 108.9 92.3 90.6 72.0 72.8 4.3Aviation Jet 34.2 38.1 39.7 37.7 40.4 42.6 45.5 49.3 47.8 35.3 2.1LPG 9.5 10.2 10.3 26.9 35.5 42.3 47.2 50.6 56.8 63.8 3.7
12,409.4 12,262.6 12,281.5 12,084.3 11,989.1 11,920.5 11,912.6 11,979.3 11,595.0 10,442.4 -
253.5 247.3 243.8 234.9 227.2 221.8 216.2 212.3 202.2 191.5 -
67.3 65.8 66.1 63.8 62.8 62.1 61.1 60.9 59.6 57.8 -
109.1 106.9 106.0 102.8 100.2 98.5 96.6 95.4 92.7 90.7 -
*Heat is included
Final energy intensity (toe/million $15ppp)
Total energy intensity (toe/million $15ppp)
Natural gas final consumption, by sector
Refined products consumption
Imports
Exports
CO2 Emissions (Million tons CO 2 )
CO2 Intensity (tCO 2 /million $15ppp)
Oil final consumption, by sector
OECD(Million toe)
Total primary energy demand, by source
Total final consumption, by source
Electricity generation, by source
Total final consumption, by sector
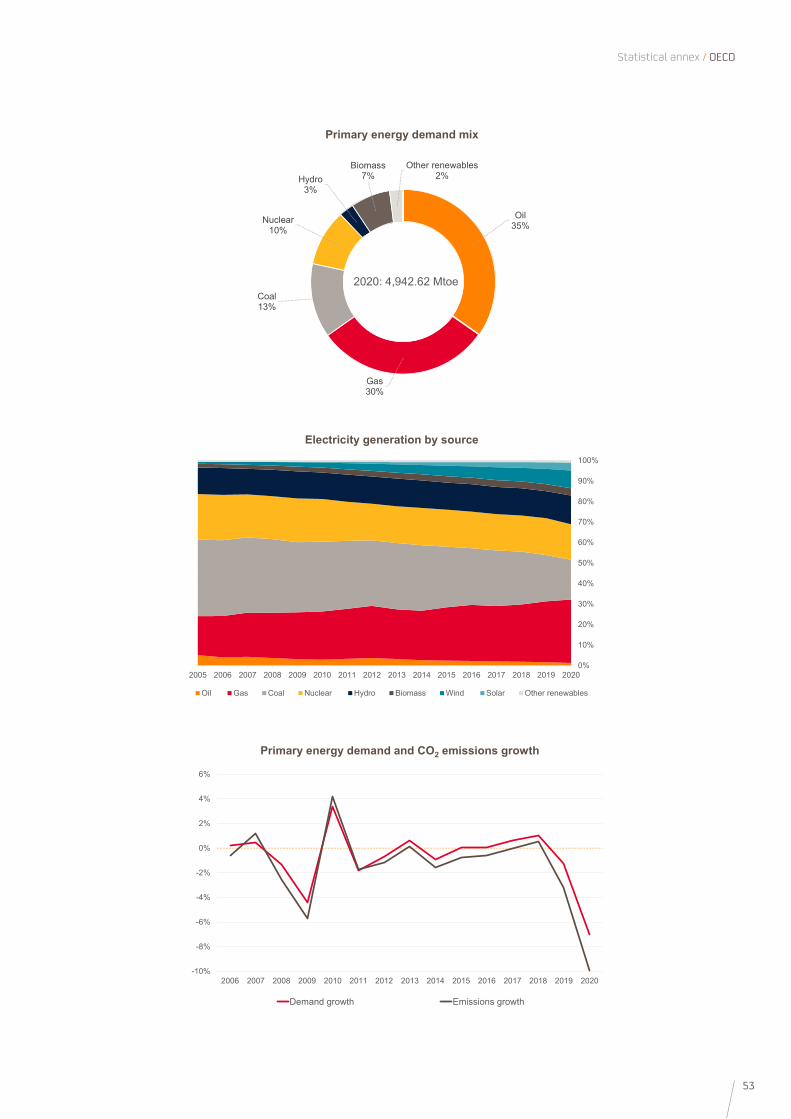
53
Statistical annex / OECD
0%
10%
20%
30%
40%
50%
60%
70%
80%
90%
100%
2005 2006 2007 2008 2009 2010 2011 2012 2013 2014 2015 2016 2017 2018 2019 2020
Oil Gas Coal Nuclear Hydro Biomass Wind Solar Other renewables
Electricity generation by source
-10%
-8%
-6%
-4%
-2%
0%
2%
4%
6%
2006 2007 2008 2009 2010 2011 2012 2013 2014 2015 2016 2017 2018 2019 2020
Demand growth Emissions growth
Primary energy demand and CO2 emissions growth
Oil 35%
Gas30%
Coal13%
Nuclear10%
Hydro3%
Biomass7%
Other renewables2%
2020: 4,942.62 Mtoe
Primary energy demand mix
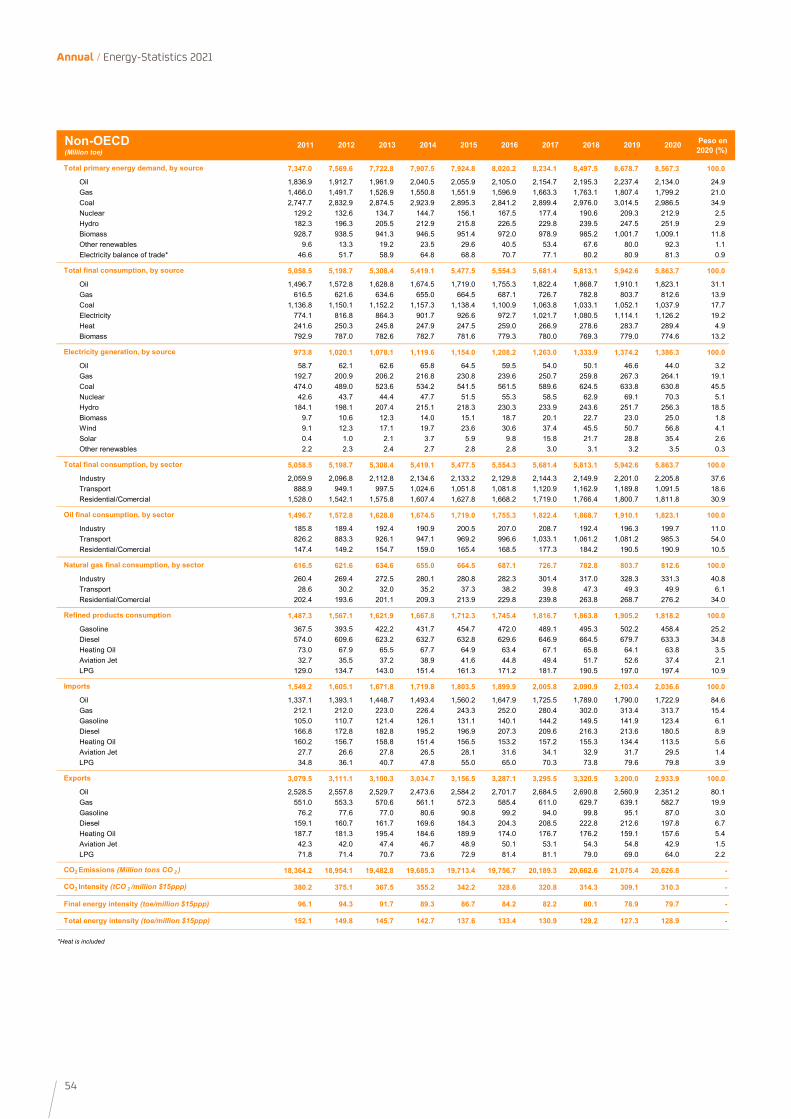
54
Annual / Energy-Statistics 2021
2011 2012 2013 2014 2015 2016 2017 2018 2019 2020 Peso en 2020 (%)
7,347.0 7,569.6 7,722.8 7,907.5 7,924.8 8,020.2 8,234.1 8,497.5 8,678.7 8,567.3 100.0
Oil 1,836.9 1,912.7 1,961.9 2,040.5 2,055.9 2,105.0 2,154.7 2,195.3 2,237.4 2,134.0 24.9Gas 1,466.0 1,491.7 1,526.9 1,550.8 1,551.9 1,596.9 1,663.3 1,763.1 1,807.4 1,799.2 21.0Coal 2,747.7 2,832.9 2,874.5 2,923.9 2,895.3 2,841.2 2,899.4 2,976.0 3,014.5 2,986.5 34.9Nuclear 129.2 132.6 134.7 144.7 156.1 167.5 177.4 190.6 209.3 212.9 2.5Hydro 182.3 196.3 205.5 212.9 215.8 226.5 229.8 239.5 247.5 251.9 2.9Biomass 928.7 938.5 941.3 946.5 951.4 972.0 978.9 985.2 1,001.7 1,009.1 11.8Other renewables 9.6 13.3 19.2 23.5 29.6 40.5 53.4 67.6 80.0 92.3 1.1Electricity balance of trade* 46.6 51.7 58.9 64.8 68.8 70.7 77.1 80.2 80.9 81.3 0.9
5,058.5 5,198.7 5,308.4 5,419.1 5,477.5 5,554.3 5,681.4 5,813.1 5,942.6 5,863.7 100.0
Oil 1,496.7 1,572.8 1,628.8 1,674.5 1,719.0 1,755.3 1,822.4 1,868.7 1,910.1 1,823.1 31.1Gas 616.5 621.6 634.6 655.0 664.5 687.1 726.7 782.8 803.7 812.6 13.9Coal 1,136.8 1,150.1 1,152.2 1,157.3 1,138.4 1,100.9 1,063.8 1,033.1 1,052.1 1,037.9 17.7Electricity 774.1 816.8 864.3 901.7 926.6 972.7 1,021.7 1,080.5 1,114.1 1,126.2 19.2Heat 241.6 250.3 245.8 247.9 247.5 259.0 266.9 278.6 283.7 289.4 4.9Biomass 792.9 787.0 782.6 782.7 781.6 779.3 780.0 769.3 779.0 774.6 13.2
973.8 1,020.1 1,078.1 1,119.6 1,154.0 1,208.2 1,263.0 1,333.9 1,374.2 1,386.3 100.0
Oil 58.7 62.1 62.6 65.8 64.5 59.5 54.0 50.1 46.6 44.0 3.2Gas 192.7 200.9 206.2 216.8 230.8 239.6 250.7 259.8 267.3 264.1 19.1Coal 474.0 489.0 523.6 534.2 541.5 561.5 589.6 624.5 633.8 630.8 45.5Nuclear 42.6 43.7 44.4 47.7 51.5 55.3 58.5 62.9 69.1 70.3 5.1Hydro 184.1 198.1 207.4 215.1 218.3 230.3 233.9 243.6 251.7 256.3 18.5Biomass 9.7 10.6 12.3 14.0 15.1 18.7 20.1 22.7 23.0 25.0 1.8Wind 9.1 12.3 17.1 19.7 23.6 30.6 37.4 45.5 50.7 56.8 4.1Solar 0.4 1.0 2.1 3.7 5.9 9.8 15.8 21.7 28.8 35.4 2.6Other renewables 2.2 2.3 2.4 2.7 2.8 2.8 3.0 3.1 3.2 3.5 0.3
5,058.5 5,198.7 5,308.4 5,419.1 5,477.5 5,554.3 5,681.4 5,813.1 5,942.6 5,863.7 100.0
Industry 2,059.9 2,096.8 2,112.8 2,134.6 2,133.2 2,129.8 2,144.3 2,149.9 2,201.0 2,205.8 37.6Transport 888.9 949.1 997.5 1,024.6 1,051.8 1,081.8 1,120.9 1,162.9 1,189.8 1,091.5 18.6Residential/Comercial 1,528.0 1,542.1 1,575.8 1,607.4 1,627.8 1,668.2 1,719.0 1,766.4 1,800.7 1,811.8 30.9
1,496.7 1,572.8 1,628.8 1,674.5 1,719.0 1,755.3 1,822.4 1,868.7 1,910.1 1,823.1 100.0
Industry 185.8 189.4 192.4 190.9 200.5 207.0 208.7 192.4 196.3 199.7 11.0Transport 826.2 883.3 926.1 947.1 969.2 996.6 1,033.1 1,061.2 1,081.2 985.3 54.0Residential/Comercial 147.4 149.2 154.7 159.0 165.4 168.5 177.3 184.2 190.5 190.9 10.5
616.5 621.6 634.6 655.0 664.5 687.1 726.7 782.8 803.7 812.6 100.0
Industry 260.4 269.4 272.5 280.1 280.8 282.3 301.4 317.0 328.3 331.3 40.8Transport 28.6 30.2 32.0 35.2 37.3 38.2 39.8 47.3 49.3 49.9 6.1Residential/Comercial 202.4 193.6 201.1 209.3 213.9 229.8 239.8 263.8 268.7 276.2 34.0
1,487.3 1,567.1 1,621.9 1,667.8 1,712.3 1,745.4 1,816.7 1,863.8 1,905.2 1,818.2 100.0
Gasoline 367.5 393.5 422.2 431.7 454.7 472.0 489.1 495.3 502.2 458.4 25.2Diesel 574.0 609.6 623.2 632.7 632.8 629.6 646.9 664.5 679.7 633.3 34.8Heating Oil 73.0 67.9 65.5 67.7 64.9 63.4 67.1 65.8 64.1 63.8 3.5Aviation Jet 32.7 35.5 37.2 38.9 41.6 44.8 49.4 51.7 52.6 37.4 2.1LPG 129.0 134.7 143.0 151.4 161.3 171.2 181.7 190.5 197.0 197.4 10.9
1,549.2 1,605.1 1,671.8 1,719.8 1,803.5 1,899.9 2,005.8 2,090.9 2,103.4 2,036.6 100.0
Oil 1,337.1 1,393.1 1,448.7 1,493.4 1,560.2 1,647.9 1,725.5 1,789.0 1,790.0 1,722.9 84.6Gas 212.1 212.0 223.0 226.4 243.3 252.0 280.4 302.0 313.4 313.7 15.4Gasoline 105.0 110.7 121.4 126.1 131.1 140.1 144.2 149.5 141.9 123.4 6.1Diesel 166.8 172.8 182.8 195.2 196.9 207.3 209.6 216.3 213.6 180.5 8.9Heating Oil 160.2 156.7 158.8 151.4 156.5 153.2 157.2 155.3 134.4 113.5 5.6Aviation Jet 27.7 26.6 27.8 26.5 28.1 31.6 34.1 32.9 31.7 29.5 1.4LPG 34.8 36.1 40.7 47.8 55.0 65.0 70.3 73.8 79.6 79.8 3.9
3,079.5 3,111.1 3,100.3 3,034.7 3,156.5 3,287.1 3,295.5 3,320.5 3,200.0 2,933.9 100.0
Oil 2,528.5 2,557.8 2,529.7 2,473.6 2,584.2 2,701.7 2,684.5 2,690.8 2,560.9 2,351.2 80.1Gas 551.0 553.3 570.6 561.1 572.3 585.4 611.0 629.7 639.1 582.7 19.9Gasoline 76.2 77.6 77.0 80.6 90.8 99.2 94.0 99.8 95.1 87.0 3.0Diesel 159.1 160.7 161.7 169.6 184.3 204.3 208.5 222.8 212.6 197.8 6.7Heating Oil 187.7 181.3 195.4 184.6 189.9 174.0 176.7 176.2 159.1 157.6 5.4Aviation Jet 42.3 42.0 47.4 46.7 48.9 50.1 53.1 54.3 54.8 42.9 1.5LPG 71.8 71.4 70.7 73.6 72.9 81.4 81.1 79.0 69.0 64.0 2.2
18,364.2 18,954.1 19,482.8 19,685.3 19,713.4 19,756.7 20,189.3 20,662.6 21,075.4 20,626.8 -
380.2 375.1 367.5 355.2 342.2 328.6 320.8 314.3 309.1 310.3 -
96.1 94.3 91.7 89.3 86.7 84.2 82.2 80.1 78.9 79.7 -
152.1 149.8 145.7 142.7 137.6 133.4 130.9 129.2 127.3 128.9 -
*Heat is included
Final energy intensity (toe/million $15ppp)
Total energy intensity (toe/million $15ppp)
Natural gas final consumption, by sector
Refined products consumption
Imports
Exports
CO2 Emissions (Million tons CO 2 )
CO2 Intensity (tCO 2 /million $15ppp)
Oil final consumption, by sector
Non-OECD(Million toe)
Total primary energy demand, by source
Total final consumption, by source
Electricity generation, by source
Total final consumption, by sector
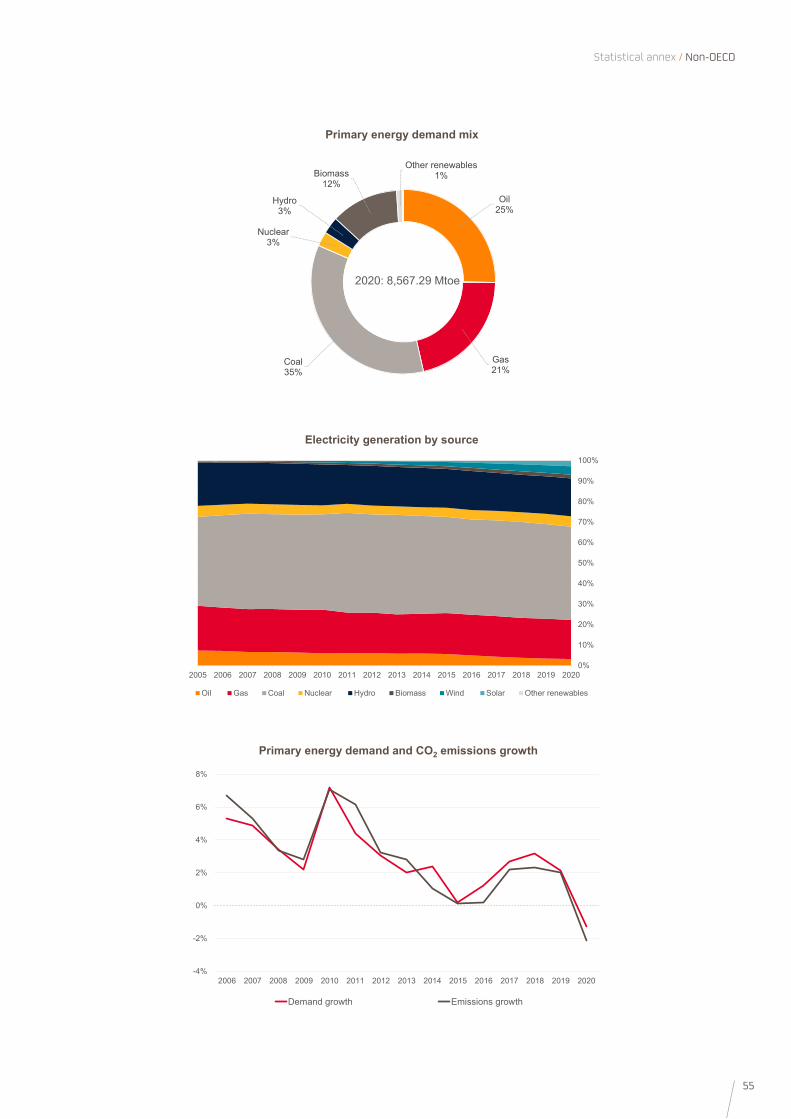
55
Statistical annex / Non-OECD
0%
10%
20%
30%
40%
50%
60%
70%
80%
90%
100%
2005 2006 2007 2008 2009 2010 2011 2012 2013 2014 2015 2016 2017 2018 2019 2020
Oil Gas Coal Nuclear Hydro Biomass Wind Solar Other renewables
Electricity generation by source
-4%
-2%
0%
2%
4%
6%
8%
2006 2007 2008 2009 2010 2011 2012 2013 2014 2015 2016 2017 2018 2019 2020
Demand growth Emissions growth
Primary energy demand and CO2 emissions growth
Oil 25%
Gas21%
Coal35%
Nuclear3%
Hydro3%
Biomass12%
Other renewables1%
2020: 8,567.29 Mtoe
Primary energy demand mix
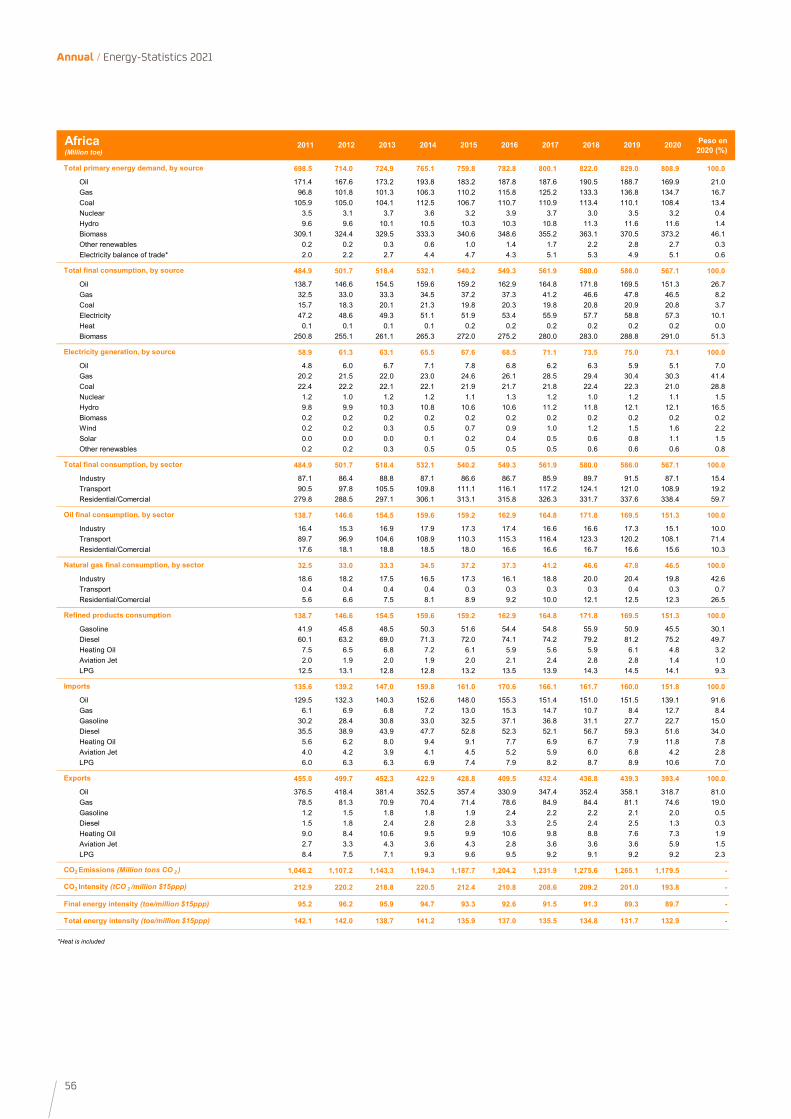
56
Annual / Energy-Statistics 2021
2011 2012 2013 2014 2015 2016 2017 2018 2019 2020 Peso en 2020 (%)
698.5 714.0 724.9 765.1 759.8 782.8 800.1 822.0 829.0 808.9 100.0
Oil 171.4 167.6 173.2 193.8 183.2 187.8 187.6 190.5 188.7 169.9 21.0Gas 96.8 101.8 101.3 106.3 110.2 115.8 125.2 133.3 136.8 134.7 16.7Coal 105.9 105.0 104.1 112.5 106.7 110.7 110.9 113.4 110.1 108.4 13.4Nuclear 3.5 3.1 3.7 3.6 3.2 3.9 3.7 3.0 3.5 3.2 0.4Hydro 9.6 9.6 10.1 10.5 10.3 10.3 10.8 11.3 11.6 11.6 1.4Biomass 309.1 324.4 329.5 333.3 340.6 348.6 355.2 363.1 370.5 373.2 46.1Other renewables 0.2 0.2 0.3 0.6 1.0 1.4 1.7 2.2 2.8 2.7 0.3Electricity balance of trade* 2.0 2.2 2.7 4.4 4.7 4.3 5.1 5.3 4.9 5.1 0.6
484.9 501.7 518.4 532.1 540.2 549.3 561.9 580.0 586.0 567.1 100.0
Oil 138.7 146.6 154.5 159.6 159.2 162.9 164.8 171.8 169.5 151.3 26.7Gas 32.5 33.0 33.3 34.5 37.2 37.3 41.2 46.6 47.8 46.5 8.2Coal 15.7 18.3 20.1 21.3 19.8 20.3 19.8 20.8 20.9 20.8 3.7Electricity 47.2 48.6 49.3 51.1 51.9 53.4 55.9 57.7 58.8 57.3 10.1Heat 0.1 0.1 0.1 0.1 0.2 0.2 0.2 0.2 0.2 0.2 0.0Biomass 250.8 255.1 261.1 265.3 272.0 275.2 280.0 283.0 288.8 291.0 51.3
58.9 61.3 63.1 65.5 67.6 68.5 71.1 73.5 75.0 73.1 100.0
Oil 4.8 6.0 6.7 7.1 7.8 6.8 6.2 6.3 5.9 5.1 7.0Gas 20.2 21.5 22.0 23.0 24.6 26.1 28.5 29.4 30.4 30.3 41.4Coal 22.4 22.2 22.1 22.1 21.9 21.7 21.8 22.4 22.3 21.0 28.8Nuclear 1.2 1.0 1.2 1.2 1.1 1.3 1.2 1.0 1.2 1.1 1.5Hydro 9.8 9.9 10.3 10.8 10.6 10.6 11.2 11.8 12.1 12.1 16.5Biomass 0.2 0.2 0.2 0.2 0.2 0.2 0.2 0.2 0.2 0.2 0.2Wind 0.2 0.2 0.3 0.5 0.7 0.9 1.0 1.2 1.5 1.6 2.2Solar 0.0 0.0 0.0 0.1 0.2 0.4 0.5 0.6 0.8 1.1 1.5Other renewables 0.2 0.2 0.3 0.5 0.5 0.5 0.5 0.6 0.6 0.6 0.8
484.9 501.7 518.4 532.1 540.2 549.3 561.9 580.0 586.0 567.1 100.0
Industry 87.1 86.4 88.8 87.1 86.6 86.7 85.9 89.7 91.5 87.1 15.4Transport 90.5 97.8 105.5 109.8 111.1 116.1 117.2 124.1 121.0 108.9 19.2Residential/Comercial 279.8 288.5 297.1 306.1 313.1 315.8 326.3 331.7 337.6 338.4 59.7
138.7 146.6 154.5 159.6 159.2 162.9 164.8 171.8 169.5 151.3 100.0
Industry 16.4 15.3 16.9 17.9 17.3 17.4 16.6 16.6 17.3 15.1 10.0Transport 89.7 96.9 104.6 108.9 110.3 115.3 116.4 123.3 120.2 108.1 71.4Residential/Comercial 17.6 18.1 18.8 18.5 18.0 16.6 16.6 16.7 16.6 15.6 10.3
32.5 33.0 33.3 34.5 37.2 37.3 41.2 46.6 47.8 46.5 100.0
Industry 18.6 18.2 17.5 16.5 17.3 16.1 18.8 20.0 20.4 19.8 42.6Transport 0.4 0.4 0.4 0.4 0.3 0.3 0.3 0.3 0.4 0.3 0.7Residential/Comercial 5.6 6.6 7.5 8.1 8.9 9.2 10.0 12.1 12.5 12.3 26.5
138.7 146.6 154.5 159.6 159.2 162.9 164.8 171.8 169.5 151.3 100.0
Gasoline 41.9 45.8 48.5 50.3 51.6 54.4 54.8 55.9 50.9 45.5 30.1Diesel 60.1 63.2 69.0 71.3 72.0 74.1 74.2 79.2 81.2 75.2 49.7Heating Oil 7.5 6.5 6.8 7.2 6.1 5.9 5.6 5.9 6.1 4.8 3.2Aviation Jet 2.0 1.9 2.0 1.9 2.0 2.1 2.4 2.8 2.8 1.4 1.0LPG 12.5 13.1 12.8 12.8 13.2 13.5 13.9 14.3 14.5 14.1 9.3
135.6 139.2 147.0 159.8 161.0 170.6 166.1 161.7 160.0 151.8 100.0
Oil 129.5 132.3 140.3 152.6 148.0 155.3 151.4 151.0 151.5 139.1 91.6Gas 6.1 6.9 6.8 7.2 13.0 15.3 14.7 10.7 8.4 12.7 8.4Gasoline 30.2 28.4 30.8 33.0 32.5 37.1 36.8 31.1 27.7 22.7 15.0Diesel 35.5 38.9 43.9 47.7 52.8 52.3 52.1 56.7 59.3 51.6 34.0Heating Oil 5.6 6.2 8.0 9.4 9.1 7.7 6.9 6.7 7.9 11.8 7.8Aviation Jet 4.0 4.2 3.9 4.1 4.5 5.2 5.9 6.0 6.8 4.2 2.8LPG 6.0 6.3 6.3 6.9 7.4 7.9 8.2 8.7 8.9 10.6 7.0
455.0 499.7 452.3 422.9 428.8 409.5 432.4 436.8 439.3 393.4 100.0
Oil 376.5 418.4 381.4 352.5 357.4 330.9 347.4 352.4 358.1 318.7 81.0Gas 78.5 81.3 70.9 70.4 71.4 78.6 84.9 84.4 81.1 74.6 19.0Gasoline 1.2 1.5 1.8 1.8 1.9 2.4 2.2 2.2 2.1 2.0 0.5Diesel 1.5 1.8 2.4 2.8 2.8 3.3 2.5 2.4 2.5 1.3 0.3Heating Oil 9.0 8.4 10.6 9.5 9.9 10.6 9.8 8.8 7.6 7.3 1.9Aviation Jet 2.7 3.3 4.3 3.6 4.3 2.8 3.6 3.6 3.6 5.9 1.5LPG 8.4 7.5 7.1 9.3 9.6 9.5 9.2 9.1 9.2 9.2 2.3
1,046.2 1,107.2 1,143.3 1,194.3 1,187.7 1,204.2 1,231.9 1,275.6 1,265.1 1,179.5 -
212.9 220.2 218.8 220.5 212.4 210.8 208.6 209.2 201.0 193.8 -
95.2 96.2 95.9 94.7 93.3 92.6 91.5 91.3 89.3 89.7 -
142.1 142.0 138.7 141.2 135.9 137.0 135.5 134.8 131.7 132.9 -
*Heat is included
Final energy intensity (toe/million $15ppp)
Total energy intensity (toe/million $15ppp)
Natural gas final consumption, by sector
Refined products consumption
Imports
Exports
CO2 Emissions (Million tons CO 2 )
CO2 Intensity (tCO 2 /million $15ppp)
Oil final consumption, by sector
Africa(Million toe)
Total primary energy demand, by source
Total final consumption, by source
Electricity generation, by source
Total final consumption, by sector
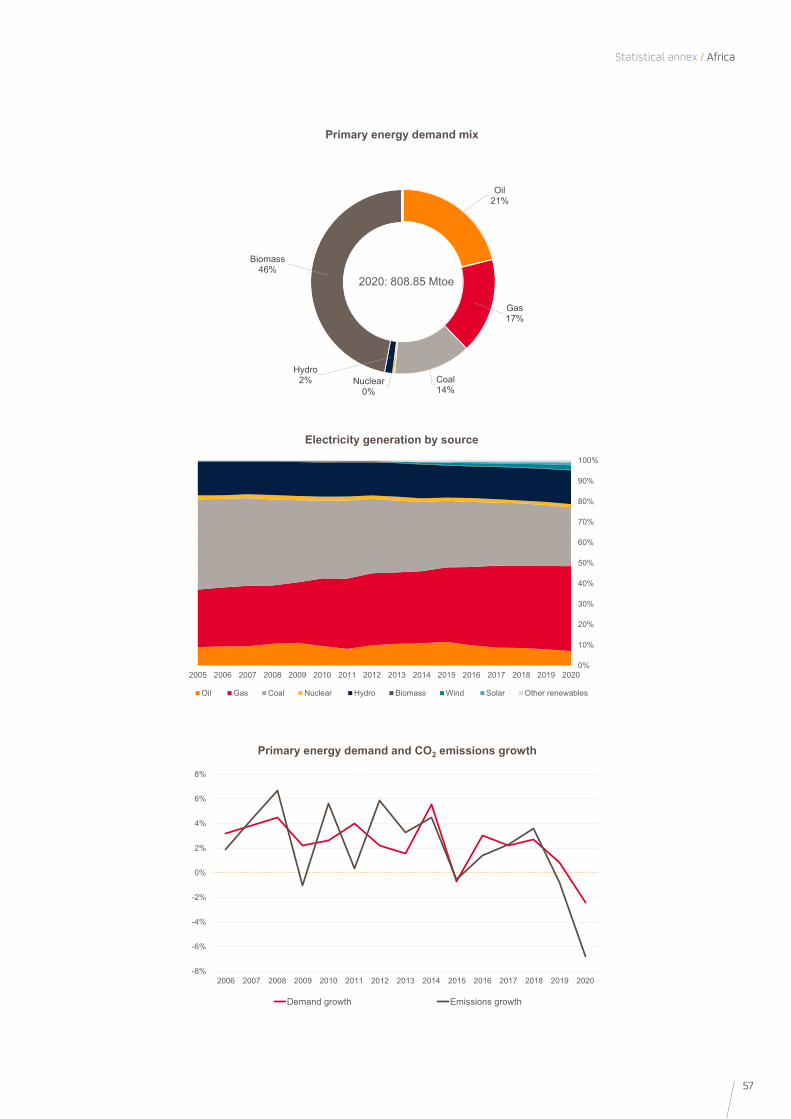
57
Statistical annex / Africa
0%
10%
20%
30%
40%
50%
60%
70%
80%
90%
100%
2005 2006 2007 2008 2009 2010 2011 2012 2013 2014 2015 2016 2017 2018 2019 2020
Oil Gas Coal Nuclear Hydro Biomass Wind Solar Other renewables
Electricity generation by source
-8%
-6%
-4%
-2%
0%
2%
4%
6%
8%
2006 2007 2008 2009 2010 2011 2012 2013 2014 2015 2016 2017 2018 2019 2020
Demand growth Emissions growth
Primary energy demand and CO2 emissions growth
Oil 21%
Gas17%
Coal14%
Nuclear0%
Hydro2%
Biomass46%
2020: 808.85 Mtoe
Primary energy demand mix

58
Annual / Energy-Statistics 2021
2011 2012 2013 2014 2015 2016 2017 2018 2019 2020 Peso en 2020 (%)
43.3 47.4 49.1 53.6 56.0 55.6 57.2 60.9 65.3 59.2 100.0
Oil 18.2 19.0 20.2 21.1 21.5 20.9 21.0 21.6 24.7 21.5 36.2Gas 24.8 28.0 28.6 32.3 34.4 34.7 35.9 38.9 40.2 37.4 63.1Coal 0.3 0.3 0.2 0.2 0.1 0.0 0.2 0.4 0.3 0.3 0.5Nuclear 0.0 0.0 0.0 0.0 0.0 0.0 0.0 0.0 0.0 0.0 0.0Hydro 0.0 0.1 0.0 0.0 0.0 0.0 0.0 0.0 0.0 0.0 0.0Biomass 0.0 0.0 0.0 0.0 0.0 0.0 0.0 0.0 0.0 0.0 0.0Other renewables 0.0 0.0 0.0 0.0 0.0 0.0 0.0 0.1 0.1 0.1 0.1Electricity balance of trade* -0.0 -0.0 -0.0 -0.0 -0.0 -0.0 -0.0 -0.0 -0.0 -0.0 -0.0
27.5 30.8 32.4 34.6 36.9 37.1 37.7 41.8 43.3 40.5 100.0
Oil 15.0 16.6 17.4 18.1 18.4 17.9 17.7 18.0 18.9 16.5 40.8Gas 9.1 10.5 11.0 12.5 14.1 14.8 15.0 18.4 18.9 18.7 46.1Coal 0.2 0.2 0.2 0.1 0.1 0.0 0.2 0.3 0.2 0.2 0.5Electricity 3.1 3.5 3.7 3.9 4.3 4.5 4.8 5.0 5.3 5.1 12.6Heat 0.0 0.0 0.0 0.0 0.0 0.0 0.0 0.0 0.0 0.0 0.0Biomass 0.0 0.0 0.0 0.0 0.0 0.0 0.0 0.0 0.0 0.0 0.0
4.8 5.3 5.6 6.1 6.5 6.7 7.2 7.3 7.7 7.5 100.0
Oil 0.1 0.1 0.1 0.1 0.1 0.1 0.0 0.0 0.0 0.0 0.4Gas 4.7 5.2 5.5 6.0 6.4 6.6 7.1 7.2 7.6 7.4 98.6Coal 0.0 0.0 0.0 0.0 0.0 0.0 0.0 0.0 0.0 0.0 0.0Nuclear 0.0 0.0 0.0 0.0 0.0 0.0 0.0 0.0 0.0 0.0 0.0Hydro 0.0 0.1 0.0 0.0 0.0 0.0 0.0 0.0 0.0 0.0 0.2Biomass 0.0 0.0 0.0 0.0 0.0 0.0 0.0 0.0 0.0 0.0 0.0Wind 0.0 0.0 0.0 0.0 0.0 0.0 0.0 0.0 0.0 0.0 0.0Solar 0.0 0.0 0.0 0.0 0.0 0.0 0.0 0.1 0.1 0.1 0.8Other renewables -0.0 -0.0 0.0 0.0 0.0 -0.0 0.0 0.0 0.0 0.0 0.0
27.5 30.8 32.4 34.6 36.9 37.1 37.7 41.8 43.3 40.5 100.0
Industry 5.4 5.3 5.4 5.5 5.9 6.0 6.6 7.0 7.8 7.5 18.4Transport 10.9 12.4 13.0 14.1 15.0 14.5 14.3 14.6 14.7 12.7 31.2Residential/Comercial 8.5 9.5 10.7 10.5 11.6 11.8 12.7 14.7 15.7 15.4 38.0
15.0 16.6 17.4 18.1 18.4 17.9 17.7 18.0 18.9 16.5 100.0
Industry 1.0 0.8 0.8 0.8 0.8 0.8 0.8 0.6 0.8 0.7 4.5Transport 10.9 12.3 13.0 14.0 14.9 14.4 14.3 14.5 14.6 12.6 76.3Residential/Comercial 2.4 2.4 2.6 1.9 2.0 1.9 2.1 2.3 2.8 2.6 15.5
9.1 10.5 11.0 12.5 14.1 14.8 15.0 18.4 18.9 18.7 100.0
Industry 3.0 3.0 3.1 3.2 3.4 3.6 3.9 4.3 4.9 4.8 25.6Transport 0.0 0.0 0.0 0.0 0.0 0.0 0.0 0.0 0.0 0.0 0.0Residential/Comercial 4.2 5.1 5.8 6.2 7.0 7.2 7.7 9.3 9.6 9.6 51.6
15.0 16.6 17.4 18.1 18.4 17.9 17.7 18.0 18.9 16.5 100.0
Gasoline 3.2 3.7 4.1 4.4 4.7 4.6 4.4 4.2 4.2 3.6 21.6Diesel 8.8 9.3 9.8 9.9 10.5 10.3 10.2 10.5 10.7 9.2 55.9Heating Oil 0.0 0.0 0.0 0.0 0.0 0.0 0.0 0.0 0.0 0.0 0.0Aviation Jet 0.0 0.1 0.1 0.1 0.1 0.1 0.1 0.1 0.1 0.0 0.3LPG 2.4 2.5 2.4 2.2 2.2 2.2 2.3 2.6 2.8 2.7 16.2
2.4 4.9 5.5 3.5 4.4 3.9 3.8 1.0 2.5 1.3 100.0
Oil 2.4 4.9 5.5 3.5 4.4 3.9 3.8 1.0 2.5 1.3 100.0Gas 0.0 0.0 0.0 0.0 0.0 0.0 0.0 0.0 0.0 0.0 0.0Gasoline 0.4 1.3 1.7 1.1 1.7 1.7 1.7 0.1 0.6 0.5 43.3Diesel 1.3 2.9 2.8 1.1 1.8 1.5 1.5 0.3 0.9 0.3 25.9Heating Oil 0.2 0.2 0.2 0.2 0.2 0.1 0.2 0.1 0.1 0.1 4.5Aviation Jet 0.0 0.0 0.0 0.0 0.0 0.0 0.0 0.0 0.0 0.0 0.0LPG 0.0 0.0 0.0 0.0 0.0 0.0 0.0 0.0 0.0 0.0 0.0
108.2 104.6 96.9 95.0 95.0 104.6 102.1 95.1 87.3 81.0 100.0
Oil 63.4 60.0 56.6 57.0 58.0 58.7 56.2 51.3 50.9 47.0 58.0Gas 44.8 44.5 40.3 38.0 37.0 45.9 45.9 43.7 36.4 34.0 42.0Gasoline 0.0 0.0 0.0 0.0 0.0 0.0 0.0 0.0 0.0 0.1 0.1Diesel 0.0 0.0 0.0 0.0 0.0 0.0 0.0 0.0 0.0 0.0 0.0Heating Oil 5.5 4.9 5.1 6.2 6.4 6.7 6.1 5.6 5.5 5.4 6.7Aviation Jet 0.8 0.7 1.2 1.6 1.1 1.2 1.2 1.0 0.7 1.3 1.6LPG 7.1 6.5 6.3 8.5 8.9 8.6 8.2 7.8 7.4 7.4 9.1
104.8 115.5 118.4 127.4 135.5 133.4 134.7 143.4 148.4 135.1 -
251.2 267.6 266.9 276.7 283.7 270.8 269.9 283.4 290.9 280.1 -
61.3 65.0 67.2 67.1 69.5 67.3 69.1 73.5 76.8 75.6 -
103.9 109.8 110.7 116.3 117.4 112.8 114.6 120.4 127.9 122.7 -
*Heat is included
Final energy intensity (toe/million $15ppp)
Total energy intensity (toe/million $15ppp)
Natural gas final consumption, by sector
Refined products consumption
Imports
Exports
CO2 Emissions (Million tons CO 2 )
CO2 Intensity (tCO 2 /million $15ppp)
Oil final consumption, by sector
Algeria(Million toe)
Total primary energy demand, by source
Total final consumption, by source
Electricity generation, by source
Total final consumption, by sector
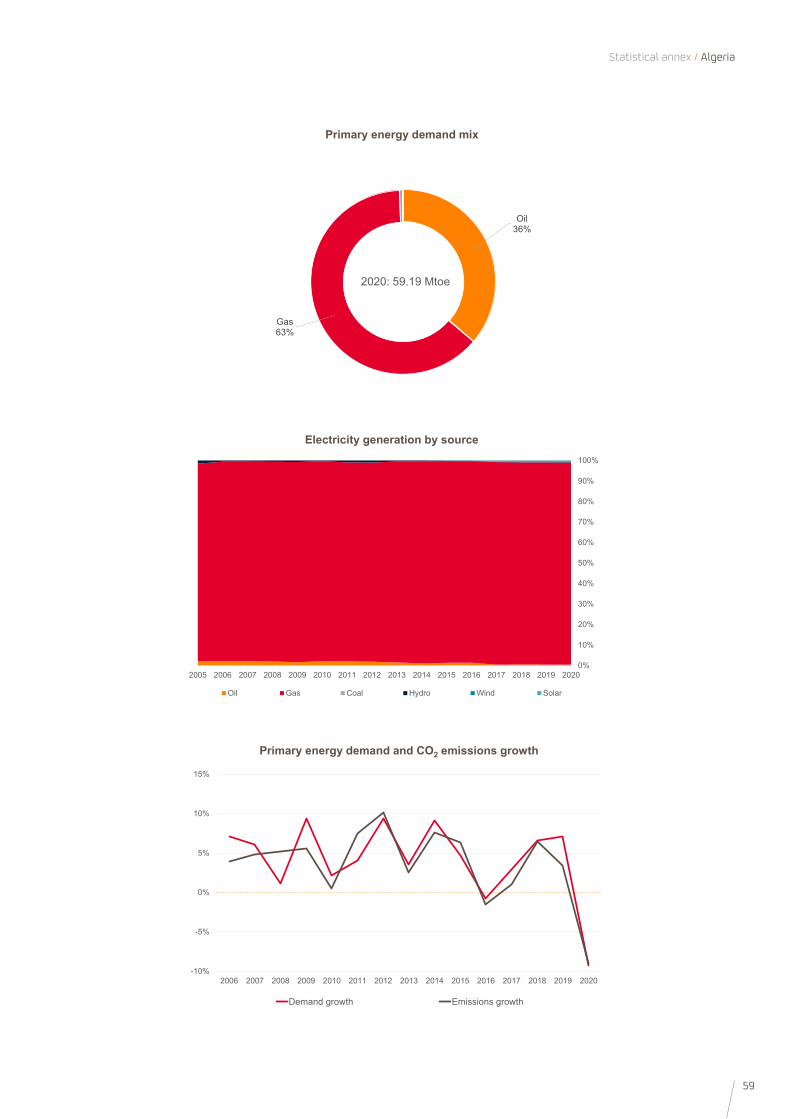
59
Statistical annex / Algeria
0%
10%
20%
30%
40%
50%
60%
70%
80%
90%
100%
2005 2006 2007 2008 2009 2010 2011 2012 2013 2014 2015 2016 2017 2018 2019 2020
Oil Gas Coal Hydro Wind Solar
Electricity generation by source
-10%
-5%
0%
5%
10%
15%
2006 2007 2008 2009 2010 2011 2012 2013 2014 2015 2016 2017 2018 2019 2020
Demand growth Emissions growth
Primary energy demand and CO2 emissions growth
Oil 36%
Gas63%
2020: 59.19 Mtoe
Primary energy demand mix
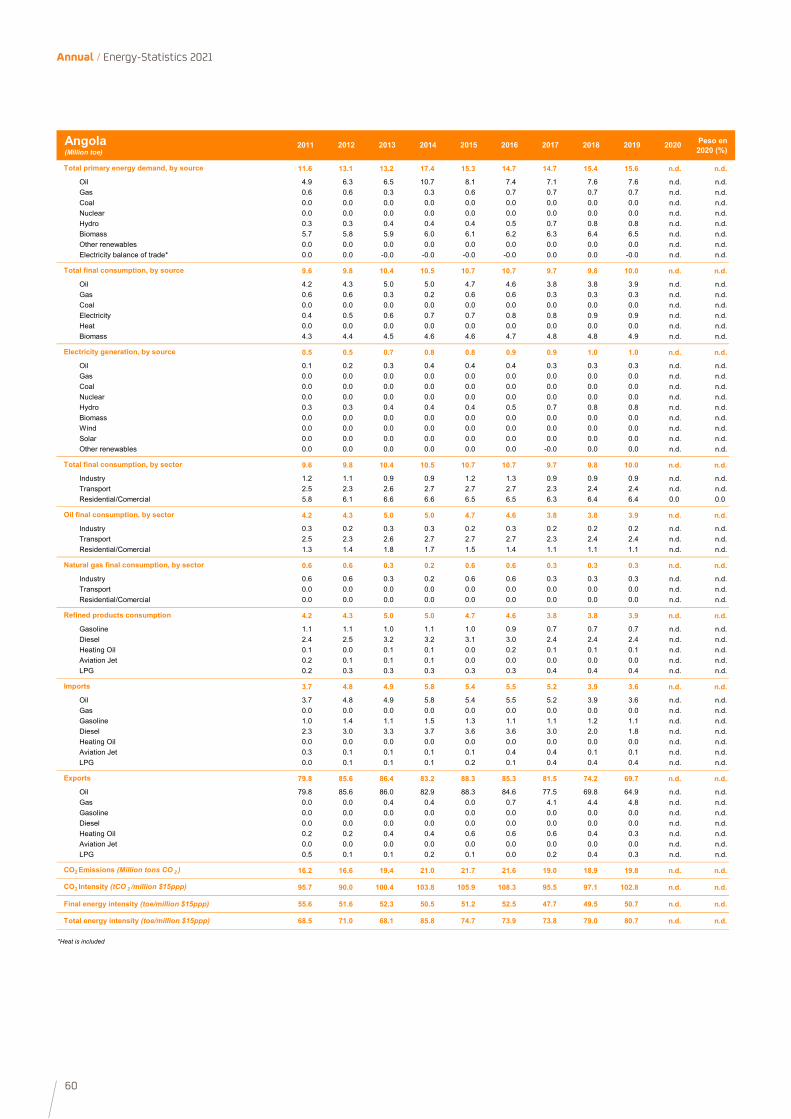
60
Annual / Energy-Statistics 2021
2011 2012 2013 2014 2015 2016 2017 2018 2019 2020 Peso en 2020 (%)
11.6 13.1 13.2 17.4 15.3 14.7 14.7 15.4 15.6 n.d. n.d.
Oil 4.9 6.3 6.5 10.7 8.1 7.4 7.1 7.6 7.6 n.d. n.d.Gas 0.6 0.6 0.3 0.3 0.6 0.7 0.7 0.7 0.7 n.d. n.d.Coal 0.0 0.0 0.0 0.0 0.0 0.0 0.0 0.0 0.0 n.d. n.d.Nuclear 0.0 0.0 0.0 0.0 0.0 0.0 0.0 0.0 0.0 n.d. n.d.Hydro 0.3 0.3 0.4 0.4 0.4 0.5 0.7 0.8 0.8 n.d. n.d.Biomass 5.7 5.8 5.9 6.0 6.1 6.2 6.3 6.4 6.5 n.d. n.d.Other renewables 0.0 0.0 0.0 0.0 0.0 0.0 0.0 0.0 0.0 n.d. n.d.Electricity balance of trade* 0.0 0.0 -0.0 -0.0 -0.0 -0.0 0.0 0.0 -0.0 n.d. n.d.
9.6 9.8 10.4 10.5 10.7 10.7 9.7 9.8 10.0 n.d. n.d.
Oil 4.2 4.3 5.0 5.0 4.7 4.6 3.8 3.8 3.9 n.d. n.d.Gas 0.6 0.6 0.3 0.2 0.6 0.6 0.3 0.3 0.3 n.d. n.d.Coal 0.0 0.0 0.0 0.0 0.0 0.0 0.0 0.0 0.0 n.d. n.d.Electricity 0.4 0.5 0.6 0.7 0.7 0.8 0.8 0.9 0.9 n.d. n.d.Heat 0.0 0.0 0.0 0.0 0.0 0.0 0.0 0.0 0.0 n.d. n.d.Biomass 4.3 4.4 4.5 4.6 4.6 4.7 4.8 4.8 4.9 n.d. n.d.
0.5 0.5 0.7 0.8 0.8 0.9 0.9 1.0 1.0 n.d. n.d.
Oil 0.1 0.2 0.3 0.4 0.4 0.4 0.3 0.3 0.3 n.d. n.d.Gas 0.0 0.0 0.0 0.0 0.0 0.0 0.0 0.0 0.0 n.d. n.d.Coal 0.0 0.0 0.0 0.0 0.0 0.0 0.0 0.0 0.0 n.d. n.d.Nuclear 0.0 0.0 0.0 0.0 0.0 0.0 0.0 0.0 0.0 n.d. n.d.Hydro 0.3 0.3 0.4 0.4 0.4 0.5 0.7 0.8 0.8 n.d. n.d.Biomass 0.0 0.0 0.0 0.0 0.0 0.0 0.0 0.0 0.0 n.d. n.d.Wind 0.0 0.0 0.0 0.0 0.0 0.0 0.0 0.0 0.0 n.d. n.d.Solar 0.0 0.0 0.0 0.0 0.0 0.0 0.0 0.0 0.0 n.d. n.d.Other renewables 0.0 0.0 0.0 0.0 0.0 0.0 -0.0 0.0 0.0 n.d. n.d.
9.6 9.8 10.4 10.5 10.7 10.7 9.7 9.8 10.0 n.d. n.d.
Industry 1.2 1.1 0.9 0.9 1.2 1.3 0.9 0.9 0.9 n.d. n.d.Transport 2.5 2.3 2.6 2.7 2.7 2.7 2.3 2.4 2.4 n.d. n.d.Residential/Comercial 5.8 6.1 6.6 6.6 6.5 6.5 6.3 6.4 6.4 0.0 0.0
4.2 4.3 5.0 5.0 4.7 4.6 3.8 3.8 3.9 n.d. n.d.
Industry 0.3 0.2 0.3 0.3 0.2 0.3 0.2 0.2 0.2 n.d. n.d.Transport 2.5 2.3 2.6 2.7 2.7 2.7 2.3 2.4 2.4 n.d. n.d.Residential/Comercial 1.3 1.4 1.8 1.7 1.5 1.4 1.1 1.1 1.1 n.d. n.d.
0.6 0.6 0.3 0.2 0.6 0.6 0.3 0.3 0.3 n.d. n.d.
Industry 0.6 0.6 0.3 0.2 0.6 0.6 0.3 0.3 0.3 n.d. n.d.Transport 0.0 0.0 0.0 0.0 0.0 0.0 0.0 0.0 0.0 n.d. n.d.Residential/Comercial 0.0 0.0 0.0 0.0 0.0 0.0 0.0 0.0 0.0 n.d. n.d.
4.2 4.3 5.0 5.0 4.7 4.6 3.8 3.8 3.9 n.d. n.d.
Gasoline 1.1 1.1 1.0 1.1 1.0 0.9 0.7 0.7 0.7 n.d. n.d.Diesel 2.4 2.5 3.2 3.2 3.1 3.0 2.4 2.4 2.4 n.d. n.d.Heating Oil 0.1 0.0 0.1 0.1 0.0 0.2 0.1 0.1 0.1 n.d. n.d.Aviation Jet 0.2 0.1 0.1 0.1 0.0 0.0 0.0 0.0 0.0 n.d. n.d.LPG 0.2 0.3 0.3 0.3 0.3 0.3 0.4 0.4 0.4 n.d. n.d.
3.7 4.8 4.9 5.8 5.4 5.5 5.2 3.9 3.6 n.d. n.d.
Oil 3.7 4.8 4.9 5.8 5.4 5.5 5.2 3.9 3.6 n.d. n.d.Gas 0.0 0.0 0.0 0.0 0.0 0.0 0.0 0.0 0.0 n.d. n.d.Gasoline 1.0 1.4 1.1 1.5 1.3 1.1 1.1 1.2 1.1 n.d. n.d.Diesel 2.3 3.0 3.3 3.7 3.6 3.6 3.0 2.0 1.8 n.d. n.d.Heating Oil 0.0 0.0 0.0 0.0 0.0 0.0 0.0 0.0 0.0 n.d. n.d.Aviation Jet 0.3 0.1 0.1 0.1 0.1 0.4 0.4 0.1 0.1 n.d. n.d.LPG 0.0 0.1 0.1 0.1 0.2 0.1 0.4 0.4 0.4 n.d. n.d.
79.8 85.6 86.4 83.2 88.3 85.3 81.5 74.2 69.7 n.d. n.d.
Oil 79.8 85.6 86.0 82.9 88.3 84.6 77.5 69.8 64.9 n.d. n.d.Gas 0.0 0.0 0.4 0.4 0.0 0.7 4.1 4.4 4.8 n.d. n.d.Gasoline 0.0 0.0 0.0 0.0 0.0 0.0 0.0 0.0 0.0 n.d. n.d.Diesel 0.0 0.0 0.0 0.0 0.0 0.0 0.0 0.0 0.0 n.d. n.d.Heating Oil 0.2 0.2 0.4 0.4 0.6 0.6 0.6 0.4 0.3 n.d. n.d.Aviation Jet 0.0 0.0 0.0 0.0 0.0 0.0 0.0 0.0 0.0 n.d. n.d.LPG 0.5 0.1 0.1 0.2 0.1 0.0 0.2 0.4 0.3 n.d. n.d.
16.2 16.6 19.4 21.0 21.7 21.6 19.0 18.9 19.8 n.d. n.d.
95.7 90.0 100.4 103.8 105.9 108.3 95.5 97.1 102.8 n.d. n.d.
55.6 51.6 52.3 50.5 51.2 52.5 47.7 49.5 50.7 n.d. n.d.
68.5 71.0 68.1 85.8 74.7 73.9 73.8 79.0 80.7 n.d. n.d.
*Heat is included
Final energy intensity (toe/million $15ppp)
Total energy intensity (toe/million $15ppp)
Natural gas final consumption, by sector
Refined products consumption
Imports
Exports
CO2 Emissions (Million tons CO 2 )
CO2 Intensity (tCO 2 /million $15ppp)
Oil final consumption, by sector
Angola(Million toe)
Total primary energy demand, by source
Total final consumption, by source
Electricity generation, by source
Total final consumption, by sector
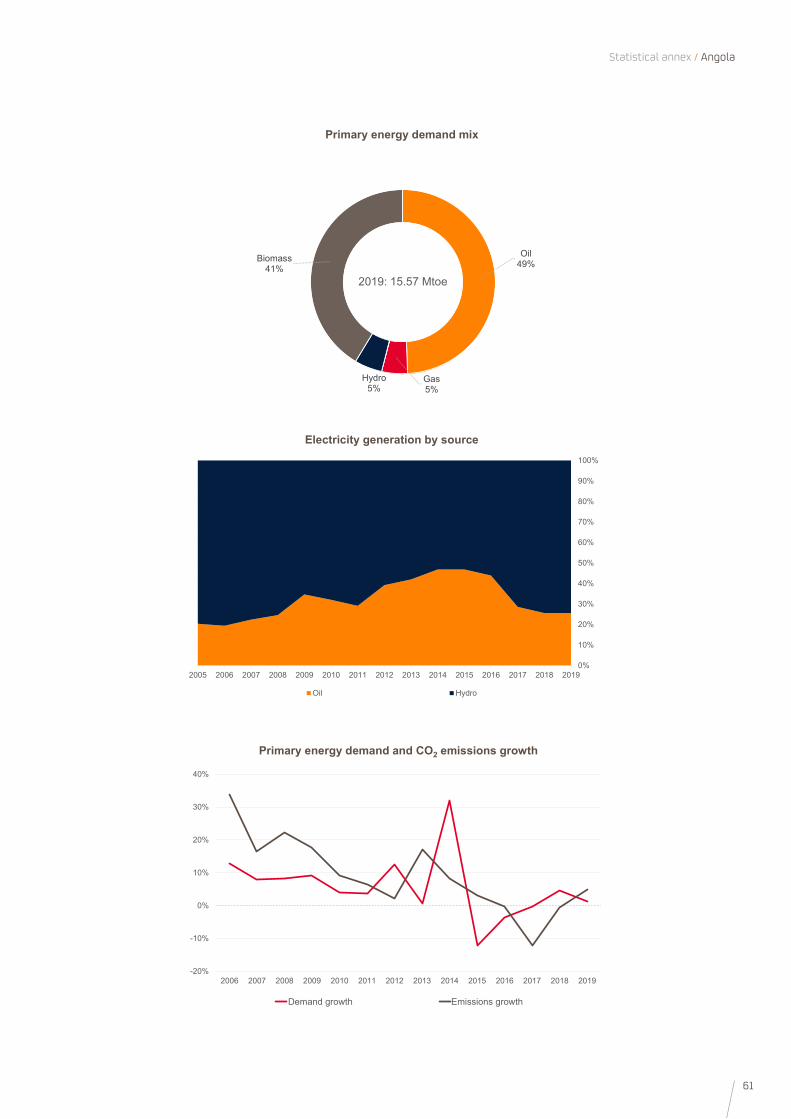
61
Statistical annex / Angola
0%
10%
20%
30%
40%
50%
60%
70%
80%
90%
100%
2005 2006 2007 2008 2009 2010 2011 2012 2013 2014 2015 2016 2017 2018 2019
Oil Hydro
Electricity generation by source
-20%
-10%
0%
10%
20%
30%
40%
2006 2007 2008 2009 2010 2011 2012 2013 2014 2015 2016 2017 2018 2019
Demand growth Emissions growth
Primary energy demand and CO2 emissions growth
Oil 49%
Gas5%
Hydro5%
Biomass41%
2019: 15.57 Mtoe
Primary energy demand mix
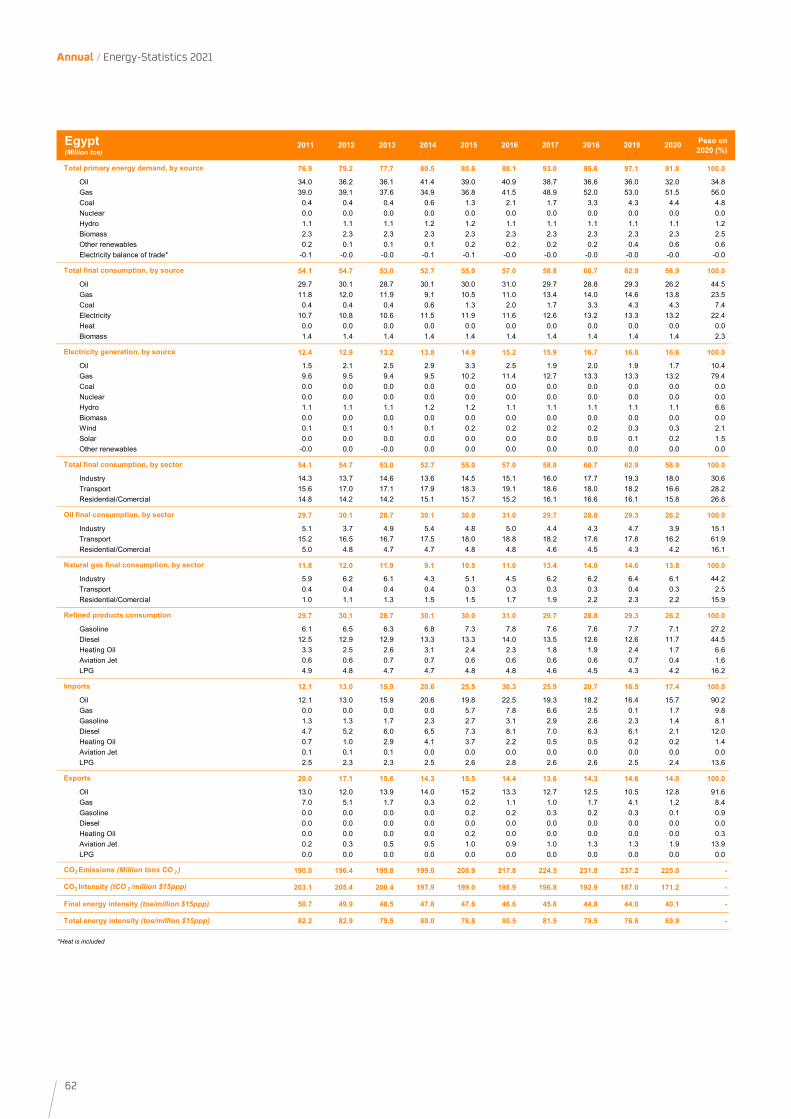
62
Annual / Energy-Statistics 2021
2011 2012 2013 2014 2015 2016 2017 2018 2019 2020 Peso en 2020 (%)
76.9 79.2 77.7 80.5 80.6 88.1 93.0 95.6 97.1 91.8 100.0
Oil 34.0 36.2 36.1 41.4 39.0 40.9 38.7 36.6 36.0 32.0 34.8Gas 39.0 39.1 37.6 34.9 36.8 41.5 48.9 52.0 53.0 51.5 56.0Coal 0.4 0.4 0.4 0.6 1.3 2.1 1.7 3.3 4.3 4.4 4.8Nuclear 0.0 0.0 0.0 0.0 0.0 0.0 0.0 0.0 0.0 0.0 0.0Hydro 1.1 1.1 1.1 1.2 1.2 1.1 1.1 1.1 1.1 1.1 1.2Biomass 2.3 2.3 2.3 2.3 2.3 2.3 2.3 2.3 2.3 2.3 2.5Other renewables 0.2 0.1 0.1 0.1 0.2 0.2 0.2 0.2 0.4 0.6 0.6Electricity balance of trade* -0.1 -0.0 -0.0 -0.1 -0.1 -0.0 -0.0 -0.0 -0.0 -0.0 -0.0
54.1 54.7 53.0 52.7 55.0 57.0 58.8 60.7 62.9 58.9 100.0
Oil 29.7 30.1 28.7 30.1 30.0 31.0 29.7 28.8 29.3 26.2 44.5Gas 11.8 12.0 11.9 9.1 10.5 11.0 13.4 14.0 14.6 13.8 23.5Coal 0.4 0.4 0.4 0.6 1.3 2.0 1.7 3.3 4.3 4.3 7.4Electricity 10.7 10.8 10.6 11.5 11.9 11.6 12.6 13.2 13.3 13.2 22.4Heat 0.0 0.0 0.0 0.0 0.0 0.0 0.0 0.0 0.0 0.0 0.0Biomass 1.4 1.4 1.4 1.4 1.4 1.4 1.4 1.4 1.4 1.4 2.3
12.4 12.9 13.2 13.8 14.9 15.2 15.9 16.7 16.8 16.6 100.0
Oil 1.5 2.1 2.5 2.9 3.3 2.5 1.9 2.0 1.9 1.7 10.4Gas 9.6 9.5 9.4 9.5 10.2 11.4 12.7 13.3 13.3 13.2 79.4Coal 0.0 0.0 0.0 0.0 0.0 0.0 0.0 0.0 0.0 0.0 0.0Nuclear 0.0 0.0 0.0 0.0 0.0 0.0 0.0 0.0 0.0 0.0 0.0Hydro 1.1 1.1 1.1 1.2 1.2 1.1 1.1 1.1 1.1 1.1 6.6Biomass 0.0 0.0 0.0 0.0 0.0 0.0 0.0 0.0 0.0 0.0 0.0Wind 0.1 0.1 0.1 0.1 0.2 0.2 0.2 0.2 0.3 0.3 2.1Solar 0.0 0.0 0.0 0.0 0.0 0.0 0.0 0.0 0.1 0.2 1.5Other renewables -0.0 0.0 -0.0 0.0 0.0 0.0 0.0 0.0 0.0 0.0 0.0
54.1 54.7 53.0 52.7 55.0 57.0 58.8 60.7 62.9 58.9 100.0
Industry 14.3 13.7 14.6 13.6 14.5 15.1 16.0 17.7 19.3 18.0 30.6Transport 15.6 17.0 17.1 17.9 18.3 19.1 18.6 18.0 18.2 16.6 28.2Residential/Comercial 14.8 14.2 14.2 15.1 15.7 15.2 16.1 16.6 16.1 15.8 26.8
29.7 30.1 28.7 30.1 30.0 31.0 29.7 28.8 29.3 26.2 100.0
Industry 5.1 3.7 4.9 5.4 4.8 5.0 4.4 4.3 4.7 3.9 15.1Transport 15.2 16.5 16.7 17.5 18.0 18.8 18.2 17.6 17.8 16.2 61.9Residential/Comercial 5.0 4.8 4.7 4.7 4.8 4.8 4.6 4.5 4.3 4.2 16.1
11.8 12.0 11.9 9.1 10.5 11.0 13.4 14.0 14.6 13.8 100.0
Industry 5.9 6.2 6.1 4.3 5.1 4.5 6.2 6.2 6.4 6.1 44.2Transport 0.4 0.4 0.4 0.4 0.3 0.3 0.3 0.3 0.4 0.3 2.5Residential/Comercial 1.0 1.1 1.3 1.5 1.5 1.7 1.9 2.2 2.3 2.2 15.9
29.7 30.1 28.7 30.1 30.0 31.0 29.7 28.8 29.3 26.2 100.0
Gasoline 6.1 6.5 6.3 6.8 7.3 7.8 7.6 7.6 7.7 7.1 27.2Diesel 12.5 12.9 12.9 13.3 13.3 14.0 13.5 12.6 12.6 11.7 44.5Heating Oil 3.3 2.5 2.6 3.1 2.4 2.3 1.8 1.9 2.4 1.7 6.6Aviation Jet 0.6 0.6 0.7 0.7 0.6 0.6 0.6 0.6 0.7 0.4 1.6LPG 4.9 4.8 4.7 4.7 4.8 4.8 4.6 4.5 4.3 4.2 16.2
12.1 13.0 15.9 20.6 25.5 30.3 25.9 20.7 16.5 17.4 100.0
Oil 12.1 13.0 15.9 20.6 19.8 22.5 19.3 18.2 16.4 15.7 90.2Gas 0.0 0.0 0.0 0.0 5.7 7.8 6.6 2.5 0.1 1.7 9.8Gasoline 1.3 1.3 1.7 2.3 2.7 3.1 2.9 2.6 2.3 1.4 8.1Diesel 4.7 5.2 6.0 6.5 7.3 8.1 7.0 6.3 6.1 2.1 12.0Heating Oil 0.7 1.0 2.9 4.1 3.7 2.2 0.5 0.5 0.2 0.2 1.4Aviation Jet 0.1 0.1 0.1 0.0 0.0 0.0 0.0 0.0 0.0 0.0 0.0LPG 2.5 2.3 2.3 2.5 2.6 2.8 2.6 2.6 2.5 2.4 13.6
20.0 17.1 15.6 14.3 15.5 14.4 13.6 14.3 14.6 14.0 100.0
Oil 13.0 12.0 13.9 14.0 15.2 13.3 12.7 12.5 10.5 12.8 91.6Gas 7.0 5.1 1.7 0.3 0.2 1.1 1.0 1.7 4.1 1.2 8.4Gasoline 0.0 0.0 0.0 0.0 0.2 0.2 0.3 0.2 0.3 0.1 0.9Diesel 0.0 0.0 0.0 0.0 0.0 0.0 0.0 0.0 0.0 0.0 0.0Heating Oil 0.0 0.0 0.0 0.0 0.2 0.0 0.0 0.0 0.0 0.0 0.3Aviation Jet 0.2 0.3 0.5 0.5 1.0 0.9 1.0 1.3 1.3 1.9 13.9LPG 0.0 0.0 0.0 0.0 0.0 0.0 0.0 0.0 0.0 0.0 0.0
190.0 196.4 195.8 199.0 208.9 217.8 224.5 231.8 237.2 225.0 -
203.1 205.4 200.4 197.9 199.0 198.9 196.8 192.9 187.0 171.2 -
50.7 49.9 48.5 47.8 47.6 46.6 45.8 44.8 44.0 40.1 -
82.2 82.9 79.5 80.0 76.8 80.5 81.5 79.5 76.6 69.9 -
*Heat is included
Final energy intensity (toe/million $15ppp)
Total energy intensity (toe/million $15ppp)
Natural gas final consumption, by sector
Refined products consumption
Imports
Exports
CO2 Emissions (Million tons CO 2 )
CO2 Intensity (tCO 2 /million $15ppp)
Oil final consumption, by sector
Egypt(Million toe)
Total primary energy demand, by source
Total final consumption, by source
Electricity generation, by source
Total final consumption, by sector
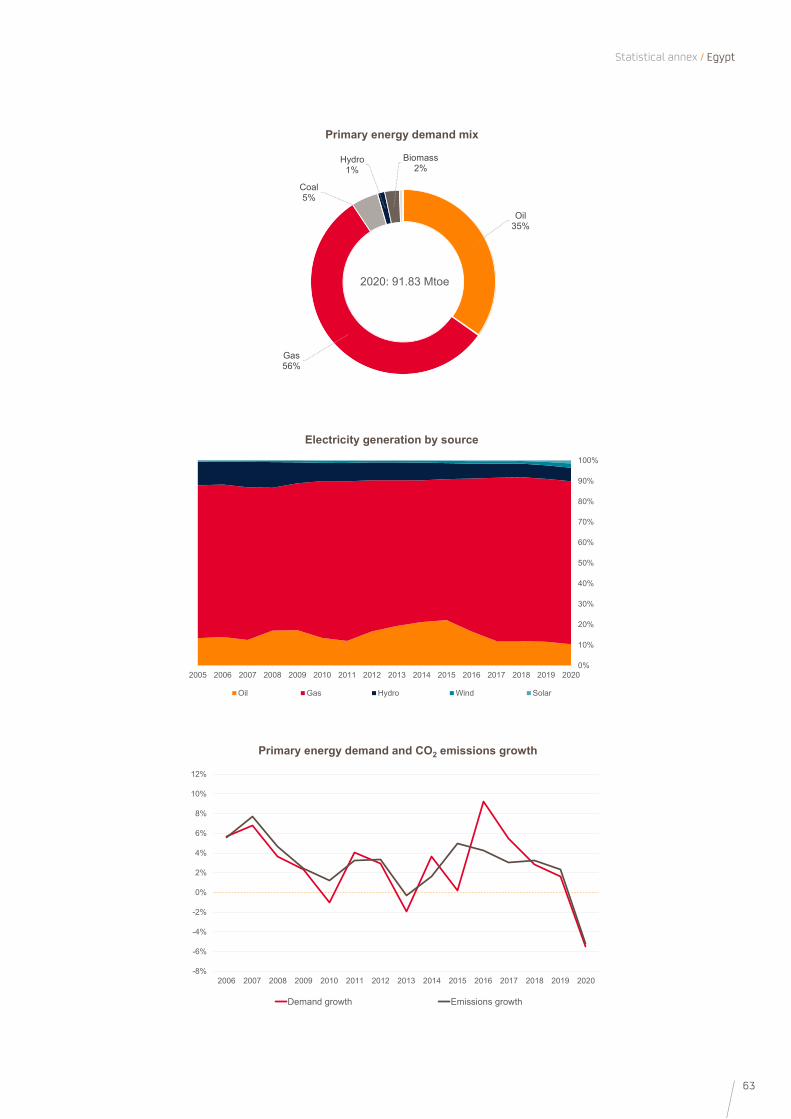
63
Statistical annex / Egypt
0%
10%
20%
30%
40%
50%
60%
70%
80%
90%
100%
2005 2006 2007 2008 2009 2010 2011 2012 2013 2014 2015 2016 2017 2018 2019 2020
Oil Gas Hydro Wind Solar
Electricity generation by source
-8%
-6%
-4%
-2%
0%
2%
4%
6%
8%
10%
12%
2006 2007 2008 2009 2010 2011 2012 2013 2014 2015 2016 2017 2018 2019 2020
Demand growth Emissions growth
Primary energy demand and CO2 emissions growth
Oil 35%
Gas56%
Coal5%
Hydro1%
Biomass2%
2020: 91.83 Mtoe
Primary energy demand mix
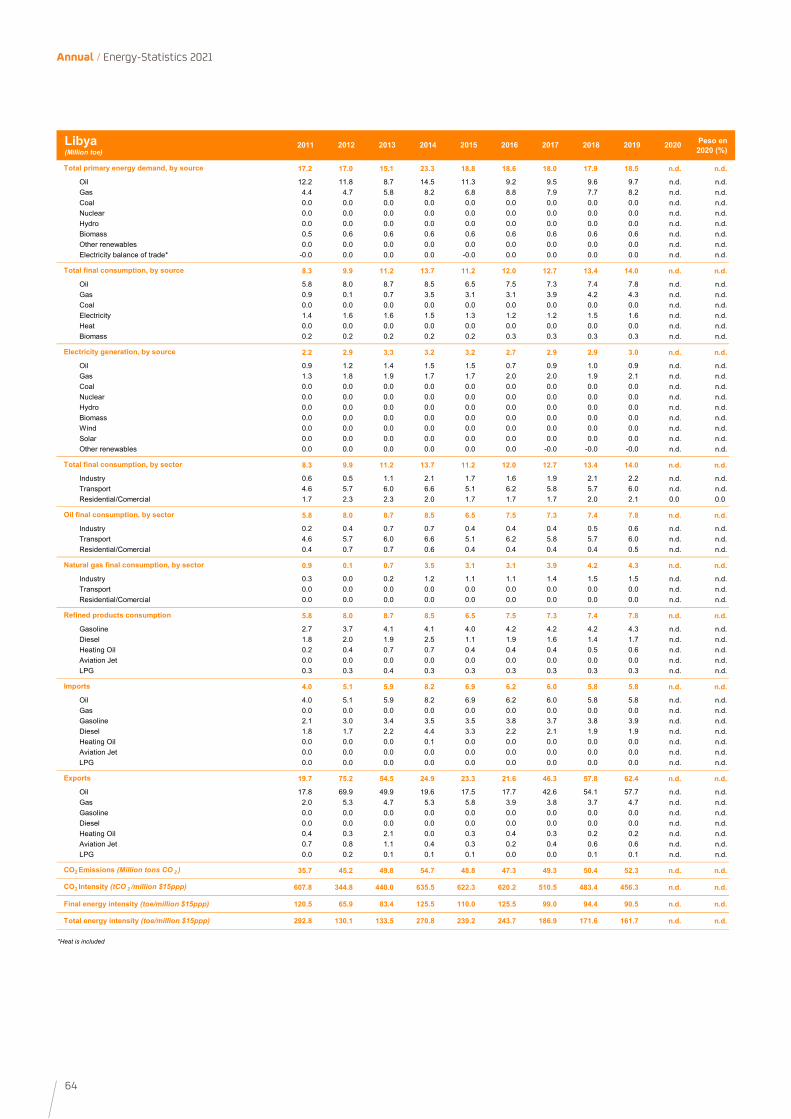
64
Annual / Energy-Statistics 2021
2011 2012 2013 2014 2015 2016 2017 2018 2019 2020 Peso en 2020 (%)
17.2 17.0 15.1 23.3 18.8 18.6 18.0 17.9 18.5 n.d. n.d.
Oil 12.2 11.8 8.7 14.5 11.3 9.2 9.5 9.6 9.7 n.d. n.d.Gas 4.4 4.7 5.8 8.2 6.8 8.8 7.9 7.7 8.2 n.d. n.d.Coal 0.0 0.0 0.0 0.0 0.0 0.0 0.0 0.0 0.0 n.d. n.d.Nuclear 0.0 0.0 0.0 0.0 0.0 0.0 0.0 0.0 0.0 n.d. n.d.Hydro 0.0 0.0 0.0 0.0 0.0 0.0 0.0 0.0 0.0 n.d. n.d.Biomass 0.5 0.6 0.6 0.6 0.6 0.6 0.6 0.6 0.6 n.d. n.d.Other renewables 0.0 0.0 0.0 0.0 0.0 0.0 0.0 0.0 0.0 n.d. n.d.Electricity balance of trade* -0.0 0.0 0.0 0.0 -0.0 0.0 0.0 0.0 0.0 n.d. n.d.
8.3 9.9 11.2 13.7 11.2 12.0 12.7 13.4 14.0 n.d. n.d.
Oil 5.8 8.0 8.7 8.5 6.5 7.5 7.3 7.4 7.8 n.d. n.d.Gas 0.9 0.1 0.7 3.5 3.1 3.1 3.9 4.2 4.3 n.d. n.d.Coal 0.0 0.0 0.0 0.0 0.0 0.0 0.0 0.0 0.0 n.d. n.d.Electricity 1.4 1.6 1.6 1.5 1.3 1.2 1.2 1.5 1.6 n.d. n.d.Heat 0.0 0.0 0.0 0.0 0.0 0.0 0.0 0.0 0.0 n.d. n.d.Biomass 0.2 0.2 0.2 0.2 0.2 0.3 0.3 0.3 0.3 n.d. n.d.
2.2 2.9 3.3 3.2 3.2 2.7 2.9 2.9 3.0 n.d. n.d.
Oil 0.9 1.2 1.4 1.5 1.5 0.7 0.9 1.0 0.9 n.d. n.d.Gas 1.3 1.8 1.9 1.7 1.7 2.0 2.0 1.9 2.1 n.d. n.d.Coal 0.0 0.0 0.0 0.0 0.0 0.0 0.0 0.0 0.0 n.d. n.d.Nuclear 0.0 0.0 0.0 0.0 0.0 0.0 0.0 0.0 0.0 n.d. n.d.Hydro 0.0 0.0 0.0 0.0 0.0 0.0 0.0 0.0 0.0 n.d. n.d.Biomass 0.0 0.0 0.0 0.0 0.0 0.0 0.0 0.0 0.0 n.d. n.d.Wind 0.0 0.0 0.0 0.0 0.0 0.0 0.0 0.0 0.0 n.d. n.d.Solar 0.0 0.0 0.0 0.0 0.0 0.0 0.0 0.0 0.0 n.d. n.d.Other renewables 0.0 0.0 0.0 0.0 0.0 0.0 -0.0 -0.0 -0.0 n.d. n.d.
8.3 9.9 11.2 13.7 11.2 12.0 12.7 13.4 14.0 n.d. n.d.
Industry 0.6 0.5 1.1 2.1 1.7 1.6 1.9 2.1 2.2 n.d. n.d.Transport 4.6 5.7 6.0 6.6 5.1 6.2 5.8 5.7 6.0 n.d. n.d.Residential/Comercial 1.7 2.3 2.3 2.0 1.7 1.7 1.7 2.0 2.1 0.0 0.0
5.8 8.0 8.7 8.5 6.5 7.5 7.3 7.4 7.8 n.d. n.d.
Industry 0.2 0.4 0.7 0.7 0.4 0.4 0.4 0.5 0.6 n.d. n.d.Transport 4.6 5.7 6.0 6.6 5.1 6.2 5.8 5.7 6.0 n.d. n.d.Residential/Comercial 0.4 0.7 0.7 0.6 0.4 0.4 0.4 0.4 0.5 n.d. n.d.
0.9 0.1 0.7 3.5 3.1 3.1 3.9 4.2 4.3 n.d. n.d.
Industry 0.3 0.0 0.2 1.2 1.1 1.1 1.4 1.5 1.5 n.d. n.d.Transport 0.0 0.0 0.0 0.0 0.0 0.0 0.0 0.0 0.0 n.d. n.d.Residential/Comercial 0.0 0.0 0.0 0.0 0.0 0.0 0.0 0.0 0.0 n.d. n.d.
5.8 8.0 8.7 8.5 6.5 7.5 7.3 7.4 7.8 n.d. n.d.
Gasoline 2.7 3.7 4.1 4.1 4.0 4.2 4.2 4.2 4.3 n.d. n.d.Diesel 1.8 2.0 1.9 2.5 1.1 1.9 1.6 1.4 1.7 n.d. n.d.Heating Oil 0.2 0.4 0.7 0.7 0.4 0.4 0.4 0.5 0.6 n.d. n.d.Aviation Jet 0.0 0.0 0.0 0.0 0.0 0.0 0.0 0.0 0.0 n.d. n.d.LPG 0.3 0.3 0.4 0.3 0.3 0.3 0.3 0.3 0.3 n.d. n.d.
4.0 5.1 5.9 8.2 6.9 6.2 6.0 5.8 5.8 n.d. n.d.
Oil 4.0 5.1 5.9 8.2 6.9 6.2 6.0 5.8 5.8 n.d. n.d.Gas 0.0 0.0 0.0 0.0 0.0 0.0 0.0 0.0 0.0 n.d. n.d.Gasoline 2.1 3.0 3.4 3.5 3.5 3.8 3.7 3.8 3.9 n.d. n.d.Diesel 1.8 1.7 2.2 4.4 3.3 2.2 2.1 1.9 1.9 n.d. n.d.Heating Oil 0.0 0.0 0.0 0.1 0.0 0.0 0.0 0.0 0.0 n.d. n.d.Aviation Jet 0.0 0.0 0.0 0.0 0.0 0.0 0.0 0.0 0.0 n.d. n.d.LPG 0.0 0.0 0.0 0.0 0.0 0.0 0.0 0.0 0.0 n.d. n.d.
19.7 75.2 54.5 24.9 23.3 21.6 46.3 57.8 62.4 n.d. n.d.
Oil 17.8 69.9 49.9 19.6 17.5 17.7 42.6 54.1 57.7 n.d. n.d.Gas 2.0 5.3 4.7 5.3 5.8 3.9 3.8 3.7 4.7 n.d. n.d.Gasoline 0.0 0.0 0.0 0.0 0.0 0.0 0.0 0.0 0.0 n.d. n.d.Diesel 0.0 0.0 0.0 0.0 0.0 0.0 0.0 0.0 0.0 n.d. n.d.Heating Oil 0.4 0.3 2.1 0.0 0.3 0.4 0.3 0.2 0.2 n.d. n.d.Aviation Jet 0.7 0.8 1.1 0.4 0.3 0.2 0.4 0.6 0.6 n.d. n.d.LPG 0.0 0.2 0.1 0.1 0.1 0.0 0.0 0.1 0.1 n.d. n.d.
35.7 45.2 49.8 54.7 48.8 47.3 49.3 50.4 52.3 n.d. n.d.
607.8 344.8 440.0 635.5 622.3 620.2 510.5 483.4 456.3 n.d. n.d.
120.5 65.9 83.4 125.5 110.0 125.5 99.0 94.4 90.5 n.d. n.d.
292.8 130.1 133.5 270.8 239.2 243.7 186.9 171.6 161.7 n.d. n.d.
*Heat is included
Final energy intensity (toe/million $15ppp)
Total energy intensity (toe/million $15ppp)
Natural gas final consumption, by sector
Refined products consumption
Imports
Exports
CO2 Emissions (Million tons CO 2 )
CO2 Intensity (tCO 2 /million $15ppp)
Oil final consumption, by sector
Libya(Million toe)
Total primary energy demand, by source
Total final consumption, by source
Electricity generation, by source
Total final consumption, by sector
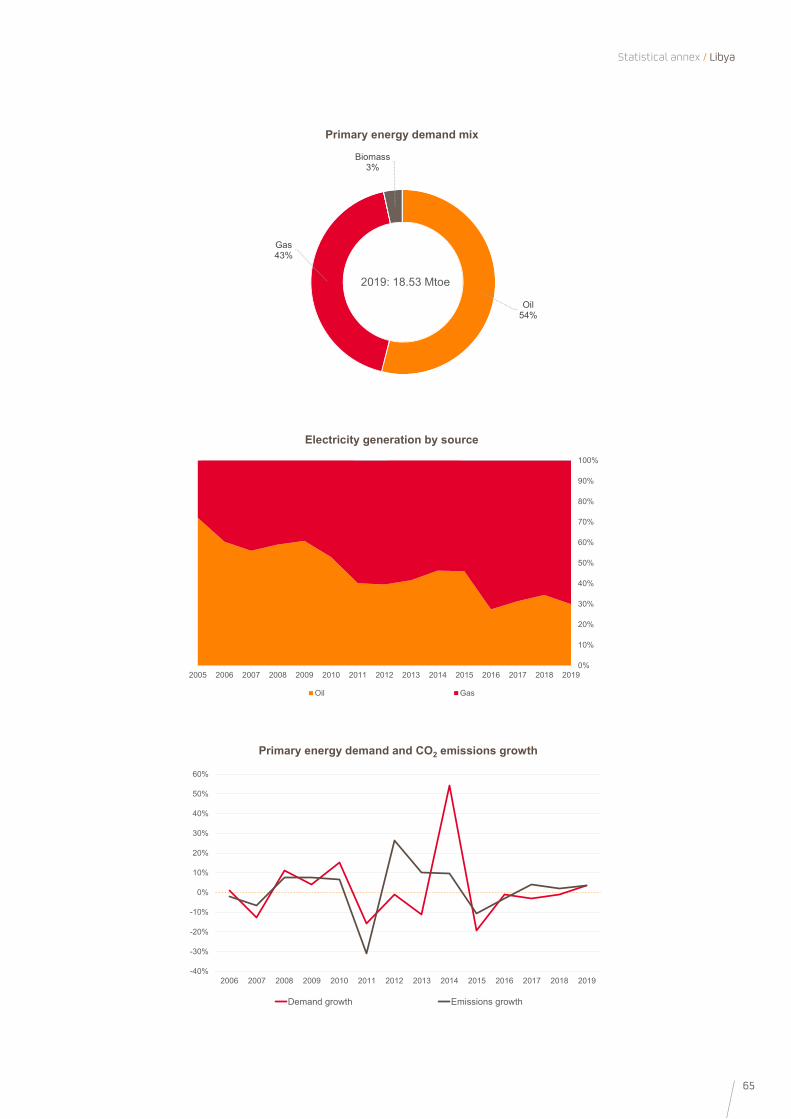
65
Statistical annex / Libya
0%
10%
20%
30%
40%
50%
60%
70%
80%
90%
100%
2005 2006 2007 2008 2009 2010 2011 2012 2013 2014 2015 2016 2017 2018 2019
Oil Gas
Electricity generation by source
-40%
-30%
-20%
-10%
0%
10%
20%
30%
40%
50%
60%
2006 2007 2008 2009 2010 2011 2012 2013 2014 2015 2016 2017 2018 2019
Demand growth Emissions growth
Primary energy demand and CO2 emissions growth
Oil 54%
Gas43%
Biomass3%
2019: 18.53 Mtoe
Primary energy demand mix
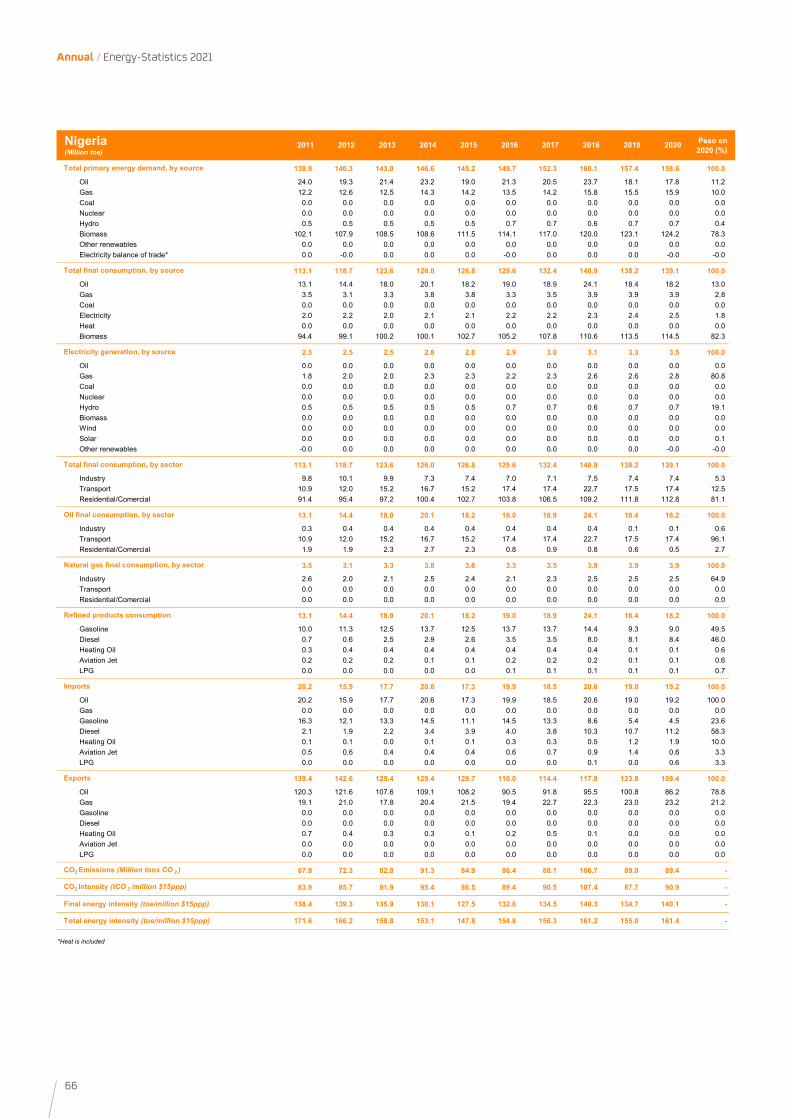
66
Annual / Energy-Statistics 2021
2011 2012 2013 2014 2015 2016 2017 2018 2019 2020 Peso en 2020 (%)
138.9 140.3 143.0 146.6 145.2 149.7 152.3 160.1 157.4 158.6 100.0
Oil 24.0 19.3 21.4 23.2 19.0 21.3 20.5 23.7 18.1 17.8 11.2Gas 12.2 12.6 12.5 14.3 14.2 13.5 14.2 15.8 15.5 15.9 10.0Coal 0.0 0.0 0.0 0.0 0.0 0.0 0.0 0.0 0.0 0.0 0.0Nuclear 0.0 0.0 0.0 0.0 0.0 0.0 0.0 0.0 0.0 0.0 0.0Hydro 0.5 0.5 0.5 0.5 0.5 0.7 0.7 0.6 0.7 0.7 0.4Biomass 102.1 107.9 108.5 108.6 111.5 114.1 117.0 120.0 123.1 124.2 78.3Other renewables 0.0 0.0 0.0 0.0 0.0 0.0 0.0 0.0 0.0 0.0 0.0Electricity balance of trade* 0.0 -0.0 0.0 0.0 0.0 -0.0 0.0 0.0 0.0 -0.0 -0.0
113.1 118.7 123.6 126.0 126.8 129.6 132.4 140.9 138.2 139.1 100.0
Oil 13.1 14.4 18.0 20.1 18.2 19.0 18.9 24.1 18.4 18.2 13.0Gas 3.5 3.1 3.3 3.8 3.8 3.3 3.5 3.9 3.9 3.9 2.8Coal 0.0 0.0 0.0 0.0 0.0 0.0 0.0 0.0 0.0 0.0 0.0Electricity 2.0 2.2 2.0 2.1 2.1 2.2 2.2 2.3 2.4 2.5 1.8Heat 0.0 0.0 0.0 0.0 0.0 0.0 0.0 0.0 0.0 0.0 0.0Biomass 94.4 99.1 100.2 100.1 102.7 105.2 107.8 110.6 113.5 114.5 82.3
2.3 2.5 2.5 2.8 2.8 2.9 3.0 3.1 3.3 3.5 100.0
Oil 0.0 0.0 0.0 0.0 0.0 0.0 0.0 0.0 0.0 0.0 0.0Gas 1.8 2.0 2.0 2.3 2.3 2.2 2.3 2.6 2.6 2.8 80.8Coal 0.0 0.0 0.0 0.0 0.0 0.0 0.0 0.0 0.0 0.0 0.0Nuclear 0.0 0.0 0.0 0.0 0.0 0.0 0.0 0.0 0.0 0.0 0.0Hydro 0.5 0.5 0.5 0.5 0.5 0.7 0.7 0.6 0.7 0.7 19.1Biomass 0.0 0.0 0.0 0.0 0.0 0.0 0.0 0.0 0.0 0.0 0.0Wind 0.0 0.0 0.0 0.0 0.0 0.0 0.0 0.0 0.0 0.0 0.0Solar 0.0 0.0 0.0 0.0 0.0 0.0 0.0 0.0 0.0 0.0 0.1Other renewables -0.0 0.0 0.0 0.0 0.0 0.0 0.0 0.0 0.0 -0.0 -0.0
113.1 118.7 123.6 126.0 126.8 129.6 132.4 140.9 138.2 139.1 100.0
Industry 9.8 10.1 9.9 7.3 7.4 7.0 7.1 7.5 7.4 7.4 5.3Transport 10.9 12.0 15.2 16.7 15.2 17.4 17.4 22.7 17.5 17.4 12.5Residential/Comercial 91.4 95.4 97.2 100.4 102.7 103.8 106.5 109.2 111.8 112.8 81.1
13.1 14.4 18.0 20.1 18.2 19.0 18.9 24.1 18.4 18.2 100.0
Industry 0.3 0.4 0.4 0.4 0.4 0.4 0.4 0.4 0.1 0.1 0.6Transport 10.9 12.0 15.2 16.7 15.2 17.4 17.4 22.7 17.5 17.4 96.1Residential/Comercial 1.9 1.9 2.3 2.7 2.3 0.8 0.9 0.8 0.6 0.5 2.7
3.5 3.1 3.3 3.8 3.8 3.3 3.5 3.9 3.9 3.9 100.0
Industry 2.6 2.0 2.1 2.5 2.4 2.1 2.3 2.5 2.5 2.5 64.9Transport 0.0 0.0 0.0 0.0 0.0 0.0 0.0 0.0 0.0 0.0 0.0Residential/Comercial 0.0 0.0 0.0 0.0 0.0 0.0 0.0 0.0 0.0 0.0 0.0
13.1 14.4 18.0 20.1 18.2 19.0 18.9 24.1 18.4 18.2 100.0
Gasoline 10.0 11.3 12.5 13.7 12.5 13.7 13.7 14.4 9.3 9.0 49.5Diesel 0.7 0.6 2.5 2.9 2.6 3.5 3.5 8.0 8.1 8.4 46.0Heating Oil 0.3 0.4 0.4 0.4 0.4 0.4 0.4 0.4 0.1 0.1 0.6Aviation Jet 0.2 0.2 0.2 0.1 0.1 0.2 0.2 0.2 0.1 0.1 0.6LPG 0.0 0.0 0.0 0.0 0.0 0.1 0.1 0.1 0.1 0.1 0.7
20.2 15.9 17.7 20.6 17.3 19.9 18.5 20.6 19.0 19.2 100.0
Oil 20.2 15.9 17.7 20.6 17.3 19.9 18.5 20.6 19.0 19.2 100.0Gas 0.0 0.0 0.0 0.0 0.0 0.0 0.0 0.0 0.0 0.0 0.0Gasoline 16.3 12.1 13.3 14.5 11.1 14.5 13.3 8.6 5.4 4.5 23.6Diesel 2.1 1.9 2.2 3.4 3.9 4.0 3.8 10.3 10.7 11.2 58.3Heating Oil 0.1 0.1 0.0 0.1 0.1 0.3 0.3 0.5 1.2 1.9 10.0Aviation Jet 0.5 0.6 0.4 0.4 0.4 0.6 0.7 0.9 1.4 0.6 3.3LPG 0.0 0.0 0.0 0.0 0.0 0.0 0.0 0.1 0.0 0.6 3.3
139.4 142.6 125.4 129.4 129.7 110.0 114.4 117.8 123.8 109.4 100.0
Oil 120.3 121.6 107.6 109.1 108.2 90.5 91.8 95.5 100.8 86.2 78.8Gas 19.1 21.0 17.8 20.4 21.5 19.4 22.7 22.3 23.0 23.2 21.2Gasoline 0.0 0.0 0.0 0.0 0.0 0.0 0.0 0.0 0.0 0.0 0.0Diesel 0.0 0.0 0.0 0.0 0.0 0.0 0.0 0.0 0.0 0.0 0.0Heating Oil 0.7 0.4 0.3 0.3 0.1 0.2 0.5 0.1 0.0 0.0 0.0Aviation Jet 0.0 0.0 0.0 0.0 0.0 0.0 0.0 0.0 0.0 0.0 0.0LPG 0.0 0.0 0.0 0.0 0.0 0.0 0.0 0.0 0.0 0.0 0.0
67.9 72.3 82.8 91.3 84.9 86.4 88.1 106.7 89.0 89.4 -
83.9 85.7 91.9 95.4 86.5 89.4 90.5 107.4 87.7 90.9 -
138.4 139.3 135.9 130.1 127.5 132.6 134.5 140.3 134.7 140.1 -
171.6 166.2 158.8 153.1 147.8 154.8 156.3 161.2 155.0 161.4 -
*Heat is included
Final energy intensity (toe/million $15ppp)
Total energy intensity (toe/million $15ppp)
Natural gas final consumption, by sector
Refined products consumption
Imports
Exports
CO2 Emissions (Million tons CO 2 )
CO2 Intensity (tCO 2 /million $15ppp)
Oil final consumption, by sector
Nigeria(Million toe)
Total primary energy demand, by source
Total final consumption, by source
Electricity generation, by source
Total final consumption, by sector
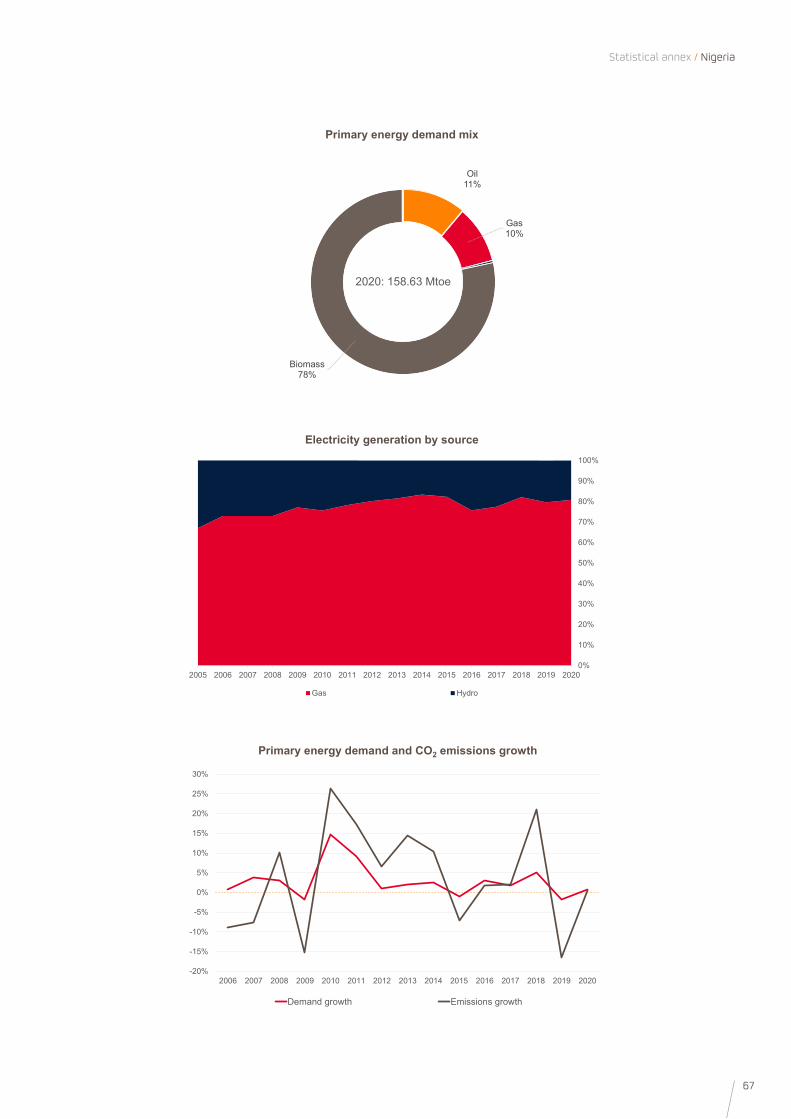
67
Statistical annex / Nigeria
0%
10%
20%
30%
40%
50%
60%
70%
80%
90%
100%
2005 2006 2007 2008 2009 2010 2011 2012 2013 2014 2015 2016 2017 2018 2019 2020
Gas Hydro
Electricity generation by source
-20%
-15%
-10%
-5%
0%
5%
10%
15%
20%
25%
30%
2006 2007 2008 2009 2010 2011 2012 2013 2014 2015 2016 2017 2018 2019 2020
Demand growth Emissions growth
Primary energy demand and CO2 emissions growth
Oil 11%
Gas10%
Biomass78%
2020: 158.63 Mtoe
Primary energy demand mix
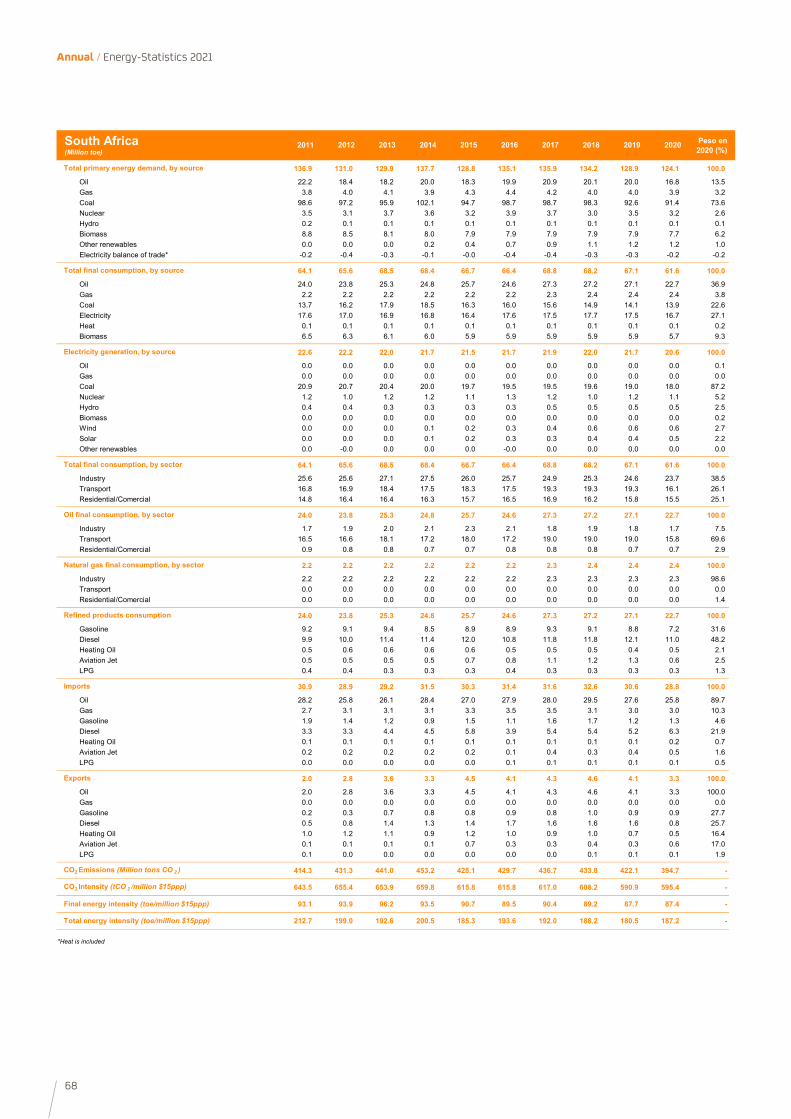
68
Annual / Energy-Statistics 2021
2011 2012 2013 2014 2015 2016 2017 2018 2019 2020 Peso en 2020 (%)
136.9 131.0 129.9 137.7 128.8 135.1 135.9 134.2 128.9 124.1 100.0
Oil 22.2 18.4 18.2 20.0 18.3 19.9 20.9 20.1 20.0 16.8 13.5Gas 3.8 4.0 4.1 3.9 4.3 4.4 4.2 4.0 4.0 3.9 3.2Coal 98.6 97.2 95.9 102.1 94.7 98.7 98.7 98.3 92.6 91.4 73.6Nuclear 3.5 3.1 3.7 3.6 3.2 3.9 3.7 3.0 3.5 3.2 2.6Hydro 0.2 0.1 0.1 0.1 0.1 0.1 0.1 0.1 0.1 0.1 0.1Biomass 8.8 8.5 8.1 8.0 7.9 7.9 7.9 7.9 7.9 7.7 6.2Other renewables 0.0 0.0 0.0 0.2 0.4 0.7 0.9 1.1 1.2 1.2 1.0Electricity balance of trade* -0.2 -0.4 -0.3 -0.1 -0.0 -0.4 -0.4 -0.3 -0.3 -0.2 -0.2
64.1 65.6 68.5 68.4 66.7 66.4 68.8 68.2 67.1 61.6 100.0
Oil 24.0 23.8 25.3 24.8 25.7 24.6 27.3 27.2 27.1 22.7 36.9Gas 2.2 2.2 2.2 2.2 2.2 2.2 2.3 2.4 2.4 2.4 3.8Coal 13.7 16.2 17.9 18.5 16.3 16.0 15.6 14.9 14.1 13.9 22.6Electricity 17.6 17.0 16.9 16.8 16.4 17.6 17.5 17.7 17.5 16.7 27.1Heat 0.1 0.1 0.1 0.1 0.1 0.1 0.1 0.1 0.1 0.1 0.2Biomass 6.5 6.3 6.1 6.0 5.9 5.9 5.9 5.9 5.9 5.7 9.3
22.6 22.2 22.0 21.7 21.5 21.7 21.9 22.0 21.7 20.6 100.0
Oil 0.0 0.0 0.0 0.0 0.0 0.0 0.0 0.0 0.0 0.0 0.1Gas 0.0 0.0 0.0 0.0 0.0 0.0 0.0 0.0 0.0 0.0 0.0Coal 20.9 20.7 20.4 20.0 19.7 19.5 19.5 19.6 19.0 18.0 87.2Nuclear 1.2 1.0 1.2 1.2 1.1 1.3 1.2 1.0 1.2 1.1 5.2Hydro 0.4 0.4 0.3 0.3 0.3 0.3 0.5 0.5 0.5 0.5 2.5Biomass 0.0 0.0 0.0 0.0 0.0 0.0 0.0 0.0 0.0 0.0 0.2Wind 0.0 0.0 0.0 0.1 0.2 0.3 0.4 0.6 0.6 0.6 2.7Solar 0.0 0.0 0.0 0.1 0.2 0.3 0.3 0.4 0.4 0.5 2.2Other renewables 0.0 -0.0 0.0 0.0 0.0 -0.0 0.0 0.0 0.0 0.0 0.0
64.1 65.6 68.5 68.4 66.7 66.4 68.8 68.2 67.1 61.6 100.0
Industry 25.6 25.6 27.1 27.5 26.0 25.7 24.9 25.3 24.6 23.7 38.5Transport 16.8 16.9 18.4 17.5 18.3 17.5 19.3 19.3 19.3 16.1 26.1Residential/Comercial 14.8 16.4 16.4 16.3 15.7 16.5 16.9 16.2 15.8 15.5 25.1
24.0 23.8 25.3 24.8 25.7 24.6 27.3 27.2 27.1 22.7 100.0
Industry 1.7 1.9 2.0 2.1 2.3 2.1 1.8 1.9 1.8 1.7 7.5Transport 16.5 16.6 18.1 17.2 18.0 17.2 19.0 19.0 19.0 15.8 69.6Residential/Comercial 0.9 0.8 0.8 0.7 0.7 0.8 0.8 0.8 0.7 0.7 2.9
2.2 2.2 2.2 2.2 2.2 2.2 2.3 2.4 2.4 2.4 100.0
Industry 2.2 2.2 2.2 2.2 2.2 2.2 2.3 2.3 2.3 2.3 98.6Transport 0.0 0.0 0.0 0.0 0.0 0.0 0.0 0.0 0.0 0.0 0.0Residential/Comercial 0.0 0.0 0.0 0.0 0.0 0.0 0.0 0.0 0.0 0.0 1.4
24.0 23.8 25.3 24.8 25.7 24.6 27.3 27.2 27.1 22.7 100.0
Gasoline 9.2 9.1 9.4 8.5 8.9 8.9 9.3 9.1 8.8 7.2 31.6Diesel 9.9 10.0 11.4 11.4 12.0 10.8 11.8 11.8 12.1 11.0 48.2Heating Oil 0.5 0.6 0.6 0.6 0.6 0.5 0.5 0.5 0.4 0.5 2.1Aviation Jet 0.5 0.5 0.5 0.5 0.7 0.8 1.1 1.2 1.3 0.6 2.5LPG 0.4 0.4 0.3 0.3 0.3 0.4 0.3 0.3 0.3 0.3 1.3
30.9 28.9 29.2 31.5 30.3 31.4 31.6 32.6 30.6 28.8 100.0
Oil 28.2 25.8 26.1 28.4 27.0 27.9 28.0 29.5 27.6 25.8 89.7Gas 2.7 3.1 3.1 3.1 3.3 3.5 3.5 3.1 3.0 3.0 10.3Gasoline 1.9 1.4 1.2 0.9 1.5 1.1 1.6 1.7 1.2 1.3 4.6Diesel 3.3 3.3 4.4 4.5 5.8 3.9 5.4 5.4 5.2 6.3 21.9Heating Oil 0.1 0.1 0.1 0.1 0.1 0.1 0.1 0.1 0.1 0.2 0.7Aviation Jet 0.2 0.2 0.2 0.2 0.2 0.1 0.4 0.3 0.4 0.5 1.6LPG 0.0 0.0 0.0 0.0 0.0 0.1 0.1 0.1 0.1 0.1 0.5
2.0 2.8 3.6 3.3 4.5 4.1 4.3 4.6 4.1 3.3 100.0
Oil 2.0 2.8 3.6 3.3 4.5 4.1 4.3 4.6 4.1 3.3 100.0Gas 0.0 0.0 0.0 0.0 0.0 0.0 0.0 0.0 0.0 0.0 0.0Gasoline 0.2 0.3 0.7 0.8 0.8 0.9 0.8 1.0 0.9 0.9 27.7Diesel 0.5 0.8 1.4 1.3 1.4 1.7 1.6 1.6 1.6 0.8 25.7Heating Oil 1.0 1.2 1.1 0.9 1.2 1.0 0.9 1.0 0.7 0.5 16.4Aviation Jet 0.1 0.1 0.1 0.1 0.7 0.3 0.3 0.4 0.3 0.6 17.0LPG 0.1 0.0 0.0 0.0 0.0 0.0 0.0 0.1 0.1 0.1 1.9
414.3 431.3 441.0 453.2 428.1 429.7 436.7 433.8 422.1 394.7 -
643.5 655.4 653.9 659.8 615.8 615.8 617.0 608.2 590.9 595.4 -
93.1 93.9 96.2 93.5 90.7 89.5 90.4 89.2 87.7 87.4 -
212.7 199.0 192.6 200.5 185.3 193.6 192.0 188.2 180.5 187.2 -
*Heat is included
Final energy intensity (toe/million $15ppp)
Total energy intensity (toe/million $15ppp)
Natural gas final consumption, by sector
Refined products consumption
Imports
Exports
CO2 Emissions (Million tons CO 2 )
CO2 Intensity (tCO 2 /million $15ppp)
Oil final consumption, by sector
South Africa(Million toe)
Total primary energy demand, by source
Total final consumption, by source
Electricity generation, by source
Total final consumption, by sector
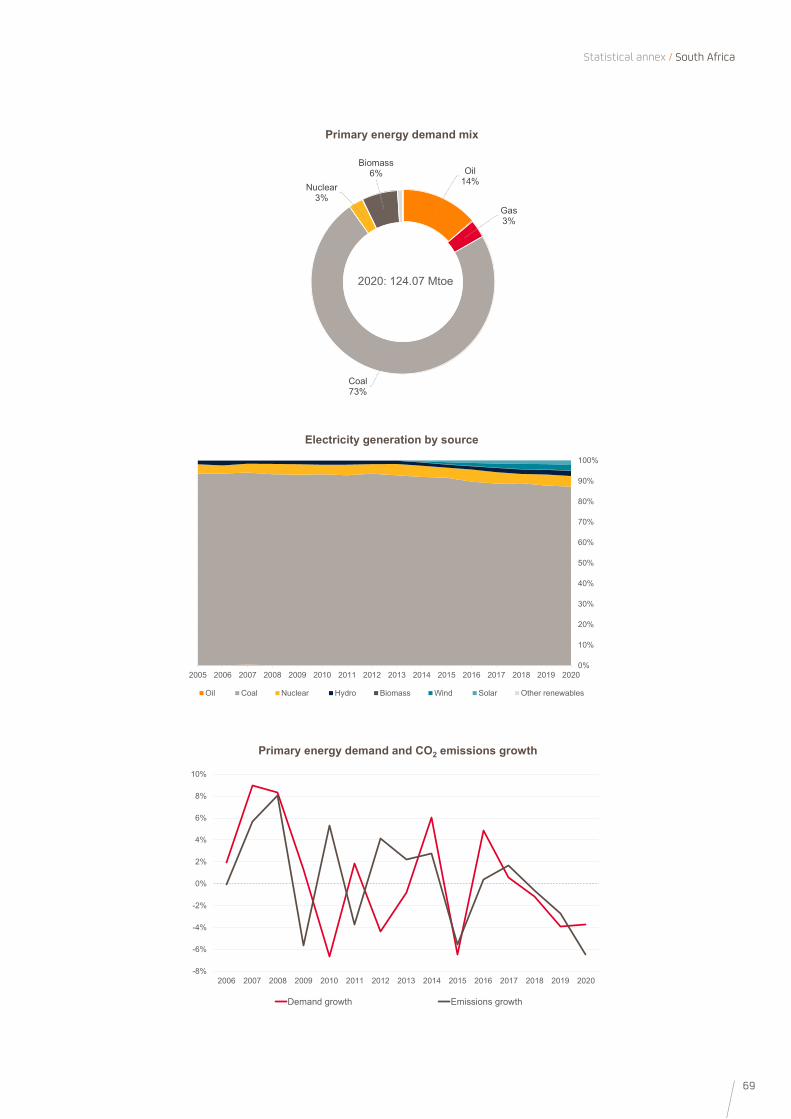
69
Statistical annex / South Africa
0%
10%
20%
30%
40%
50%
60%
70%
80%
90%
100%
2005 2006 2007 2008 2009 2010 2011 2012 2013 2014 2015 2016 2017 2018 2019 2020
Oil Coal Nuclear Hydro Biomass Wind Solar Other renewables
Electricity generation by source
-8%
-6%
-4%
-2%
0%
2%
4%
6%
8%
10%
2006 2007 2008 2009 2010 2011 2012 2013 2014 2015 2016 2017 2018 2019 2020
Demand growth Emissions growth
Primary energy demand and CO2 emissions growth
Oil 14%
Gas3%
Coal73%
Nuclear3%
Biomass6%
2020: 124.07 Mtoe
Primary energy demand mix

70
Annual / Energy-Statistics 2021
2011 2012 2013 2014 2015 2016 2017 2018 2019 2020 Peso en 2020 (%)
5,164.5 5,310.4 5,440.4 5,560.5 5,610.0 5,650.6 5,804.3 6,004.4 6,138.7 6,107.9 100.0
Oil 1,230.7 1,287.0 1,314.1 1,339.5 1,388.3 1,424.3 1,462.2 1,519.2 1,547.8 1,510.4 24.7Gas 518.1 540.3 570.3 586.9 585.4 603.5 628.9 677.3 698.4 702.2 11.5Coal 2,634.7 2,708.8 2,767.1 2,815.9 2,796.0 2,738.5 2,797.7 2,856.2 2,895.2 2,871.1 47.0Nuclear 110.1 89.0 88.8 97.3 110.4 122.5 130.3 148.4 169.8 173.0 2.8Hydro 96.7 110.7 118.3 130.8 135.0 141.1 144.1 149.9 157.2 162.9 2.7Biomass 513.0 506.3 500.7 500.5 495.9 508.9 511.7 507.0 512.0 513.7 8.4Other renewables 10.5 14.0 20.0 24.2 30.0 40.5 53.1 66.7 78.2 91.0 1.5Electricity balance of trade* 50.7 54.3 61.1 65.5 69.0 71.3 76.3 79.7 80.1 83.5 1.4
3,583.4 3,687.4 3,784.4 3,850.1 3,910.0 3,959.8 4,043.2 4,114.6 4,221.1 4,182.6 100.0
Oil 1,063.0 1,111.6 1,151.3 1,176.1 1,229.6 1,260.1 1,308.9 1,338.3 1,374.0 1,331.1 31.8Gas 231.0 246.8 262.4 268.6 268.2 282.2 306.6 335.0 346.9 355.4 8.5Coal 1,101.6 1,110.3 1,113.4 1,117.6 1,104.5 1,065.2 1,027.9 993.9 1,015.4 997.5 23.8Electricity 637.0 669.5 709.7 739.8 760.8 803.0 845.3 897.7 925.0 938.2 22.4Heat 90.3 98.9 109.2 114.5 121.9 131.1 139.0 148.9 157.8 167.7 4.0Biomass 460.6 450.3 438.4 433.6 425.2 418.3 415.6 400.9 402.0 392.7 9.4
766.0 799.1 849.2 881.5 906.4 955.8 1,004.1 1,068.0 1,100.3 1,118.6 100.0
Oil 28.3 29.8 26.8 22.8 20.1 19.5 17.2 15.2 12.3 10.9 1.0Gas 105.7 108.0 111.8 114.4 117.0 122.0 121.9 126.8 128.4 127.7 11.4Coal 473.5 491.8 526.0 538.9 548.2 567.3 597.6 630.4 637.7 635.4 56.8Nuclear 36.3 29.4 29.3 32.1 36.4 40.4 43.0 49.0 56.0 57.1 5.1Hydro 98.8 112.7 120.4 132.9 137.3 145.0 148.2 154.0 161.4 167.2 15.0Biomass 8.6 9.2 10.5 11.6 12.6 16.5 18.3 21.0 21.5 23.8 2.1Wind 9.5 12.3 16.6 18.5 21.1 26.9 32.7 40.1 44.2 49.8 4.5Solar 1.0 1.7 3.4 5.8 8.9 13.6 20.4 26.6 34.0 41.2 3.7Other renewables 4.3 4.3 4.4 4.6 4.7 4.7 4.8 4.9 4.9 5.3 0.5
3,583.4 3,687.4 3,784.4 3,850.1 3,910.0 3,959.8 4,043.2 4,114.6 4,221.1 4,182.6 100.0
Industry 1,640.2 1,670.3 1,697.2 1,717.1 1,723.9 1,709.9 1,723.4 1,736.2 1,780.6 1,782.4 42.6Transport 561.9 598.8 631.3 645.9 678.2 702.4 732.2 758.5 782.5 727.9 17.4Residential/Comercial 944.1 956.7 973.1 982.3 993.4 1,022.8 1,053.4 1,065.3 1,091.0 1,099.9 26.3
1,063.0 1,111.6 1,151.3 1,176.1 1,229.6 1,260.1 1,308.9 1,338.3 1,374.0 1,331.1 100.0
Industry 119.3 124.1 120.3 114.9 125.2 128.2 127.8 120.8 123.2 127.5 9.6Transport 529.7 564.2 593.3 604.2 634.3 654.4 681.5 701.0 721.1 666.3 50.1Residential/Comercial 117.4 118.4 121.7 124.8 131.3 136.0 142.7 143.2 148.1 149.3 11.2
231.0 246.8 262.4 268.6 268.2 282.2 306.6 335.0 346.9 355.4 100.0
Industry 93.2 98.9 106.3 108.7 104.8 111.4 127.4 141.4 146.6 149.8 42.1Transport 18.2 19.0 20.8 23.3 25.0 25.9 27.4 30.9 32.3 33.9 9.5Residential/Comercial 77.8 81.7 84.4 86.6 89.5 94.1 100.7 108.8 112.7 117.4 33.0
1,059.9 1,107.2 1,148.2 1,170.7 1,224.2 1,255.0 1,305.5 1,335.2 1,370.9 1,327.9 100.0
Gasoline 223.1 234.3 255.6 258.3 282.5 293.7 305.4 312.8 325.4 303.8 22.9Diesel 380.8 410.4 415.3 418.2 426.0 423.7 438.8 448.2 456.5 425.9 32.1Heating Oil 42.7 37.8 34.2 33.2 32.4 32.8 32.3 31.6 29.6 28.3 2.1Aviation Jet 24.8 26.4 29.7 32.4 35.9 39.5 43.0 44.5 45.6 35.3 2.7LPG 92.8 93.5 100.0 106.6 112.0 123.8 131.3 134.6 140.6 142.1 10.7
1,568.7 1,636.5 1,678.0 1,707.9 1,779.5 1,886.7 1,988.7 2,067.5 2,088.5 2,036.0 100.0
Oil 1,346.7 1,399.3 1,424.4 1,448.7 1,522.2 1,611.7 1,687.7 1,736.9 1,750.7 1,691.9 83.1Gas 222.1 237.2 253.6 259.2 257.3 275.0 301.0 330.5 337.8 344.0 16.9Gasoline 47.8 53.3 57.8 57.3 60.3 62.0 62.2 66.3 69.4 63.5 3.1Diesel 70.7 68.2 67.3 74.9 74.2 83.9 91.6 94.4 95.5 80.2 3.9Heating Oil 121.7 119.5 124.0 115.7 116.2 114.0 117.6 111.1 93.4 94.0 4.6Aviation Jet 20.8 20.1 22.0 20.5 21.9 26.0 28.1 26.9 24.4 20.0 1.0LPG 41.5 43.2 45.0 50.3 56.3 66.4 70.0 72.5 79.0 76.8 3.8
478.3 472.0 483.6 485.1 513.2 550.8 577.0 568.7 581.3 565.2 100.0
Oil 372.7 372.3 378.7 376.8 398.1 422.7 429.2 414.9 404.8 377.7 66.8Gas 105.6 99.7 104.9 108.3 115.1 128.1 147.9 153.7 176.5 187.6 33.2Gasoline 56.0 61.1 59.9 64.8 68.8 71.0 71.1 71.1 74.0 67.7 12.0Diesel 96.8 99.5 103.8 104.3 108.5 120.5 125.0 128.2 133.7 123.9 21.9Heating Oil 64.5 58.1 61.4 56.2 56.6 57.4 61.4 57.9 47.4 53.1 9.4Aviation Jet 34.3 35.7 39.1 40.1 44.3 48.2 50.5 50.0 50.3 38.7 6.8LPG 4.7 4.2 4.2 4.4 4.1 4.2 4.6 5.4 6.1 6.7 1.2
14,119.7 14,616.6 15,082.9 15,197.9 15,254.7 15,316.5 15,673.6 16,024.7 16,288.9 16,097.0 -
406.6 411.5 403.2 393.7 376.1 358.0 340.7 330.0 320.2 311.5 -
105.9 104.4 101.7 98.8 95.3 91.8 88.1 85.1 82.2 80.7 -
153.1 150.5 146.5 142.0 137.6 131.6 125.7 122.2 120.0 117.4 -
*Heat is included
Final energy intensity (toe/million $15ppp)
Total energy intensity (toe/million $15ppp)
Natural gas final consumption, by sector
Refined products consumption
Imports
Exports
CO2 Emissions (Million tons CO 2 )
CO2 Intensity (tCO 2 /million $15ppp)
Oil final consumption, by sector
Asia-Pacific(Million toe)
Total primary energy demand, by source
Total final consumption, by source
Electricity generation, by source
Total final consumption, by sector
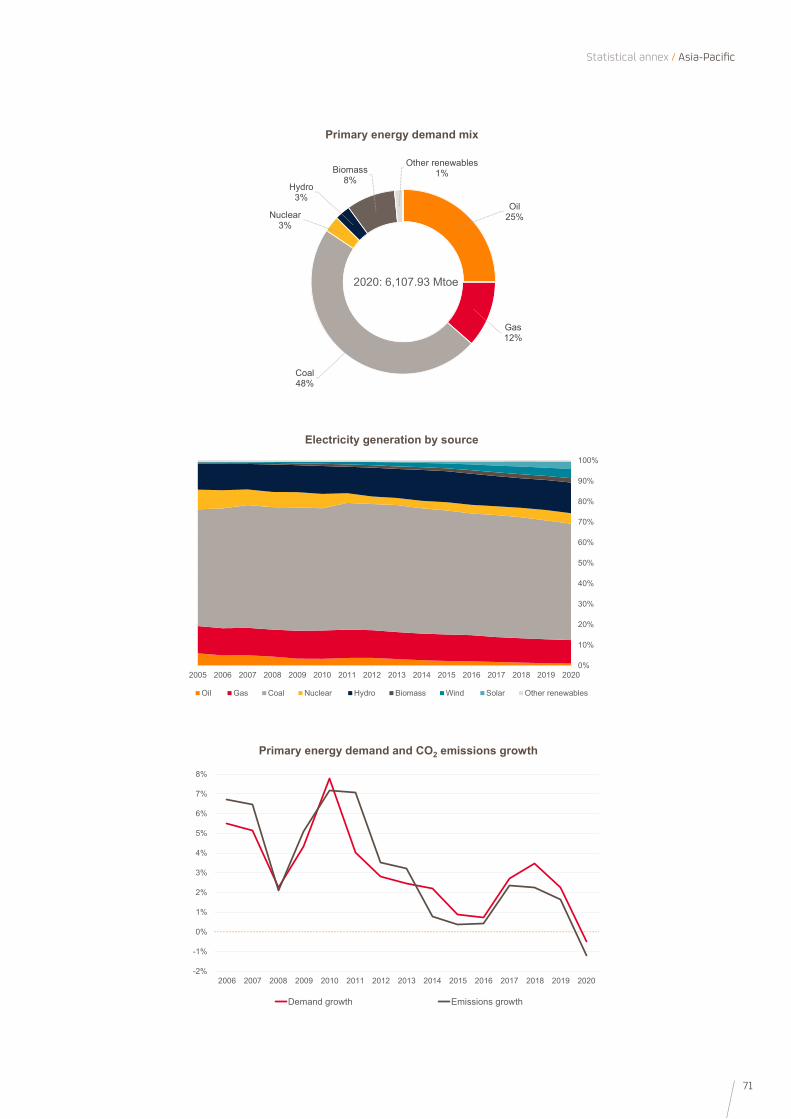
71
Statistical annex / Asia-Pacific
0%
10%
20%
30%
40%
50%
60%
70%
80%
90%
100%
2005 2006 2007 2008 2009 2010 2011 2012 2013 2014 2015 2016 2017 2018 2019 2020
Oil Gas Coal Nuclear Hydro Biomass Wind Solar Other renewables
Electricity generation by source
-2%
-1%
0%
1%
2%
3%
4%
5%
6%
7%
8%
2006 2007 2008 2009 2010 2011 2012 2013 2014 2015 2016 2017 2018 2019 2020
Demand growth Emissions growth
Primary energy demand and CO2 emissions growth
Oil 25%
Gas12%
Coal48%
Nuclear3%
Hydro3%
Biomass8%
Other renewables1%
2020: 6,107.93 Mtoe
Primary energy demand mix

72
Annual / Energy-Statistics 2021
2011 2012 2013 2014 2015 2016 2017 2018 2019 2020 Peso en 2020 (%)
127.0 125.6 127.5 126.9 126.7 126.5 127.6 128.0 128.7 126.1 100.0
Oil 43.2 44.1 45.1 44.5 42.5 43.0 42.9 43.4 43.9 42.2 33.5Gas 28.7 27.5 30.9 32.9 33.1 30.6 31.3 32.6 33.3 33.6 26.6Coal 48.1 47.0 43.7 41.5 42.9 44.5 44.5 42.9 41.9 40.3 32.0Nuclear 0.0 0.0 0.0 0.0 0.0 0.0 0.0 0.0 0.0 0.0 0.0Hydro 1.4 1.2 1.6 1.6 1.1 1.3 1.4 1.4 1.3 1.4 1.1Biomass 4.7 4.7 4.9 4.9 5.2 5.1 5.5 5.2 5.0 4.8 3.8Other renewables 0.6 0.8 1.0 1.2 1.4 1.6 1.8 2.2 2.8 3.4 2.7Electricity balance of trade* 0.3 0.3 0.3 0.3 0.4 0.4 0.4 0.4 0.4 0.4 0.4
79.3 80.0 81.7 81.7 81.3 82.0 82.5 83.7 84.7 82.3 100.0
Oil 41.2 42.6 43.0 43.1 42.5 43.1 43.7 44.6 45.2 43.3 52.7Gas 11.7 11.7 12.9 13.2 13.0 12.7 12.5 12.5 13.0 13.2 16.0Coal 3.7 3.2 3.1 3.1 3.0 3.4 3.6 3.8 3.7 3.5 4.3Electricity 18.2 18.0 18.0 17.9 18.2 18.2 18.2 18.3 18.6 18.1 22.0Heat 0.3 0.3 0.3 0.3 0.4 0.4 0.4 0.4 0.4 0.4 0.5Biomass 4.1 4.1 4.4 4.2 4.3 4.2 4.3 4.1 3.9 3.7 4.5
21.8 21.6 21.4 21.3 21.6 22.1 22.2 22.4 22.7 22.1 100.0
Oil 0.5 0.3 0.6 0.4 0.6 0.5 0.5 0.4 0.4 0.3 1.3Gas 4.2 4.2 4.4 4.7 4.5 4.3 4.3 4.6 4.5 3.9 17.8Coal 14.8 14.8 13.7 13.1 13.6 14.0 13.9 13.6 13.3 12.8 57.9Nuclear 0.0 0.0 0.0 0.0 0.0 0.0 0.0 0.0 0.0 0.0 0.0Hydro 1.4 1.2 1.6 1.6 1.2 1.3 1.4 1.4 1.4 1.4 6.5Biomass 0.2 0.3 0.3 0.3 0.3 0.3 0.3 0.3 0.3 0.3 1.2Wind 0.5 0.6 0.7 0.9 1.0 1.0 1.1 1.3 1.5 1.8 8.1Solar 0.1 0.2 0.3 0.3 0.4 0.5 0.7 0.9 1.3 1.6 7.1Other renewables 0.0 0.0 0.0 0.0 0.0 0.0 0.0 0.0 0.0 0.0 0.0
79.3 80.0 81.7 81.7 81.3 82.0 82.5 83.7 84.7 82.3 100.0
Industry 24.1 24.0 24.4 24.1 23.0 22.9 22.8 23.1 23.6 23.0 28.0Transport 30.6 30.8 31.3 31.4 32.2 32.5 33.1 33.7 33.8 32.0 38.8Residential/Comercial 17.4 17.5 17.8 17.8 18.3 18.5 18.6 18.8 18.9 19.0 23.1
41.2 42.6 43.0 43.1 42.5 43.1 43.7 44.6 45.2 43.3 100.0
Industry 3.9 4.5 4.6 4.5 3.9 3.6 3.6 3.9 3.9 4.0 9.2Transport 29.9 30.1 30.6 30.6 31.3 31.7 32.4 33.0 33.1 31.2 72.1Residential/Comercial 1.1 1.1 1.1 1.1 1.1 1.2 1.2 1.2 1.2 1.2 2.8
11.7 11.7 12.9 13.2 13.0 12.7 12.5 12.5 13.0 13.2 100.0
Industry 6.9 6.9 7.1 7.0 6.7 6.4 6.2 6.2 6.7 6.8 51.8Transport 0.1 0.1 0.1 0.1 0.1 0.1 0.1 0.1 0.1 0.1 0.7Residential/Comercial 4.1 4.1 4.4 4.6 4.7 4.8 4.9 4.9 4.9 5.1 38.3
41.2 42.6 43.0 43.1 42.5 43.0 43.6 44.6 45.2 43.3 100.0
Gasoline 15.1 14.8 14.8 14.3 14.4 14.3 14.8 14.6 14.6 13.4 30.8Diesel 15.4 16.3 17.3 17.8 18.4 18.9 19.6 20.7 21.1 21.3 49.1Heating Oil 0.9 0.9 0.8 0.6 0.3 0.2 0.1 0.2 0.2 0.1 0.3Aviation Jet 2.6 2.7 2.9 3.0 3.0 3.1 3.0 3.1 3.2 2.5 5.7LPG 2.2 2.2 2.2 2.2 2.1 2.0 1.7 1.6 1.5 1.4 3.2
45.2 46.2 49.0 48.6 47.6 48.6 49.7 52.9 52.6 48.9 100.0
Oil 40.8 42.3 44.6 43.9 43.3 43.7 45.3 48.9 48.3 45.0 92.1Gas 4.4 3.9 4.4 4.7 4.3 4.9 4.4 4.0 4.3 3.9 7.9Gasoline 2.1 2.9 2.9 2.8 4.3 5.2 5.4 5.0 4.7 4.6 9.4Diesel 7.5 9.6 10.6 11.4 12.7 15.2 15.7 17.3 17.7 18.9 38.6Heating Oil 1.5 1.6 1.6 1.3 0.2 0.3 0.2 0.7 0.7 0.6 1.3Aviation Jet 1.8 1.9 2.7 2.9 3.6 4.7 4.9 5.2 4.9 4.1 8.3LPG 0.5 0.6 0.5 0.4 0.6 0.5 0.6 0.5 0.5 0.4 0.9
42.1 39.1 43.0 41.8 44.0 56.8 74.5 85.9 108.8 121.2 100.0
Oil 18.7 17.0 15.5 14.5 14.6 13.4 13.0 13.2 15.1 18.4 15.2Gas 23.4 22.1 27.5 27.2 29.4 43.4 61.4 72.7 93.7 102.8 84.8Gasoline 0.1 0.1 0.1 0.1 0.1 0.1 0.2 0.1 0.2 0.1 0.1Diesel 0.1 0.1 0.1 0.1 0.1 0.0 0.1 0.1 0.1 0.1 0.1Heating Oil 0.2 0.5 0.2 0.0 0.1 0.2 0.3 0.2 0.2 0.3 0.2Aviation Jet 0.0 0.0 0.0 0.0 0.0 0.0 0.1 0.1 0.0 0.1 0.1LPG 1.5 1.3 1.5 1.5 1.3 1.2 1.4 1.4 1.8 3.2 2.7
389.4 388.0 385.0 375.3 380.8 390.7 393.5 392.1 387.3 371.8 -
394.7 378.4 366.1 348.0 345.5 345.0 339.4 328.5 318.6 313.7 -
75.2 72.6 72.1 70.0 68.8 67.4 66.5 65.5 65.0 64.7 -
128.7 122.5 121.2 117.6 114.9 111.7 110.1 107.3 105.9 106.4 -
*Heat is included
Final energy intensity (toe/million $15ppp)
Total energy intensity (toe/million $15ppp)
Natural gas final consumption, by sector
Refined products consumption
Imports
Exports
CO2 Emissions (Million tons CO 2 )
CO2 Intensity (tCO 2 /million $15ppp)
Oil final consumption, by sector
Australia(Million toe)
Total primary energy demand, by source
Total final consumption, by source
Electricity generation, by source
Total final consumption, by sector
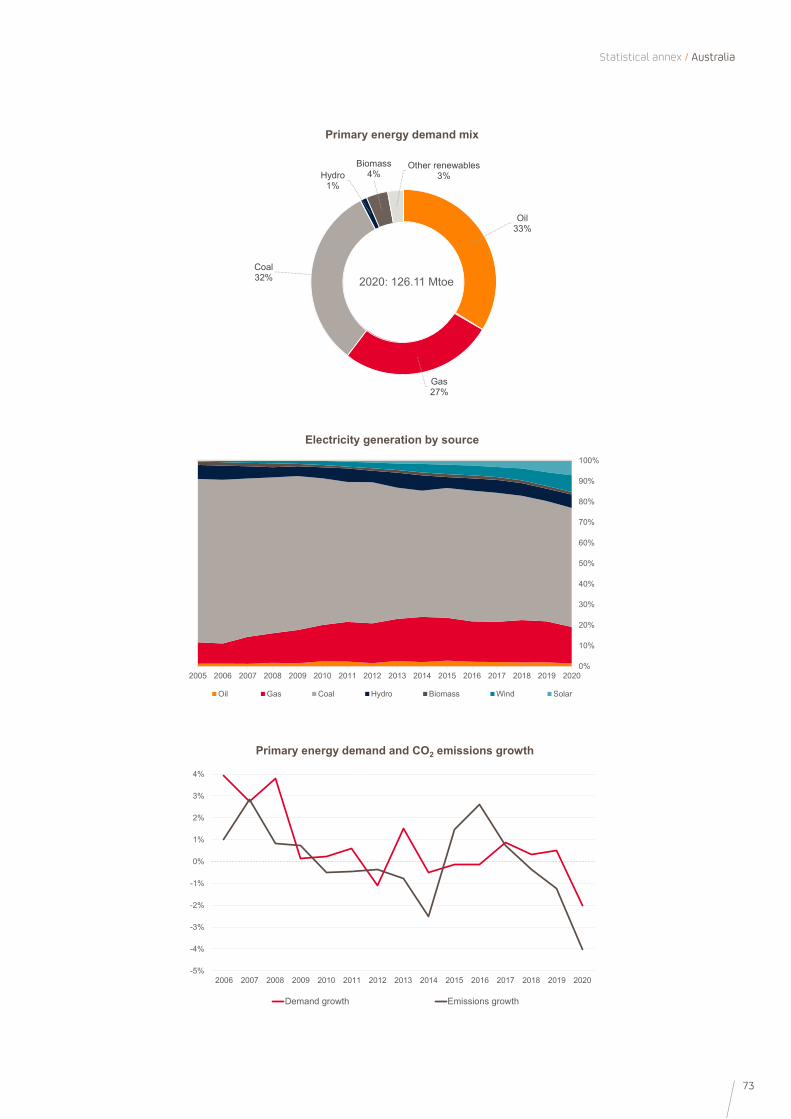
73
Statistical annex / Australia
0%
10%
20%
30%
40%
50%
60%
70%
80%
90%
100%
2005 2006 2007 2008 2009 2010 2011 2012 2013 2014 2015 2016 2017 2018 2019 2020
Oil Gas Coal Hydro Biomass Wind Solar
Electricity generation by source
-5%
-4%
-3%
-2%
-1%
0%
1%
2%
3%
4%
2006 2007 2008 2009 2010 2011 2012 2013 2014 2015 2016 2017 2018 2019 2020
Demand growth Emissions growth
Primary energy demand and CO2 emissions growth
Oil 33%
Gas27%
Coal32%
Hydro1%
Biomass4%
Other renewables3%
2020: 126.11 Mtoe
Primary energy demand mix

74
Annual / Energy-Statistics 2021
2011 2012 2013 2014 2015 2016 2017 2018 2019 2020 Peso en 2020 (%)
2,722.6 2,820.7 2,911.6 2,966.0 2,993.7 2,977.2 3,070.1 3,201.2 3,309.3 3,381.4 100.0
Oil 443.3 465.3 486.8 506.3 535.7 548.1 572.5 615.8 656.7 680.2 20.1Gas 110.0 123.4 140.5 153.6 158.5 170.7 195.1 230.3 250.1 268.1 7.9Coal 1,940.5 1,985.9 2,025.1 2,023.9 1,996.9 1,932.5 1,954.2 1,978.6 1,998.4 2,010.7 59.5Nuclear 22.5 25.4 29.1 34.5 44.5 55.6 64.6 76.9 90.9 95.6 2.8Hydro 59.2 74.2 78.2 90.4 95.8 100.0 99.5 103.1 109.2 113.5 3.4Biomass 126.7 120.2 114.2 114.8 113.7 112.7 115.2 116.7 115.2 113.7 3.4Other renewables 6.3 8.8 13.5 15.9 19.8 26.9 36.7 46.7 54.6 64.4 1.9Electricity balance of trade* 14.3 17.5 24.3 26.4 28.7 30.7 32.3 33.2 34.1 35.2 1.0
1,859.1 1,931.5 2,004.0 2,046.1 2,079.9 2,093.1 2,117.6 2,166.4 2,237.6 2,283.7 100.0
Oil 385.5 408.2 432.7 451.3 480.4 494.7 514.3 535.4 564.6 581.5 25.5Gas 78.8 88.1 98.8 108.0 108.1 117.0 134.2 155.6 166.2 180.7 7.9Coal 868.7 885.3 889.1 882.3 868.8 829.7 781.8 741.3 740.6 735.1 32.2Electricity 332.2 355.0 387.0 405.6 419.4 445.2 476.3 516.9 542.3 561.4 24.6Heat 81.6 90.2 100.7 105.5 112.9 121.7 129.0 137.6 146.6 156.2 6.8Biomass 112.2 104.6 95.8 93.5 90.3 84.9 82.0 79.6 77.3 68.7 3.0
405.6 429.5 468.5 488.4 503.9 534.7 570.7 617.6 646.7 670.6 100.0
Oil 1.0 0.9 0.9 0.8 0.8 0.9 0.8 0.9 1.0 1.1 0.2Gas 8.3 8.5 9.2 9.8 12.5 14.7 15.7 19.3 22.2 22.6 3.4Coal 319.2 324.3 352.0 353.9 353.4 364.8 385.7 410.5 417.4 423.5 63.2Nuclear 7.4 8.4 9.6 11.4 14.7 18.3 21.3 25.4 30.0 31.5 4.7Hydro 60.1 75.0 79.1 91.5 97.2 102.6 102.3 106.0 112.2 116.6 17.4Biomass 3.3 3.5 4.2 4.9 5.5 6.5 8.0 8.9 9.2 10.9 1.6Wind 6.0 8.3 12.1 13.4 16.0 20.4 25.4 31.5 34.6 40.1 6.0Solar 0.2 0.5 1.3 2.5 3.9 6.5 11.3 15.2 20.0 24.2 3.6Other renewables 0.0 0.0 0.0 0.0 0.0 0.0 0.0 0.0 0.0 0.0 0.0
1,859.1 1,931.5 2,004.0 2,046.1 2,079.9 2,093.1 2,117.6 2,166.4 2,237.6 2,283.7 100.0
Industry 1,089.5 1,119.7 1,141.5 1,140.0 1,133.4 1,113.9 1,102.5 1,104.0 1,127.1 1,155.4 50.6Transport 216.1 238.2 257.9 268.6 289.1 296.3 310.3 324.2 338.8 320.7 14.0Residential/Comercial 368.0 380.9 398.2 410.3 428.1 447.3 469.8 491.0 511.5 520.9 22.8
385.5 408.2 432.7 451.3 480.4 494.7 514.3 535.4 564.6 581.5 100.0
Industry 48.4 51.1 49.6 41.2 46.4 49.6 47.2 45.5 49.1 58.3 10.0Transport 198.7 219.1 236.3 244.0 262.2 267.2 278.4 288.0 299.8 280.6 48.3Residential/Comercial 38.4 40.1 42.7 45.9 51.7 54.8 58.2 60.2 62.9 64.6 11.1
78.8 88.1 98.8 108.0 108.1 117.0 134.2 155.6 166.2 180.7 100.0
Industry 29.7 32.8 39.2 42.1 40.2 45.7 58.3 67.4 72.0 78.3 43.3Transport 9.2 10.2 11.9 14.6 16.3 17.1 18.7 21.8 23.3 25.3 14.0Residential/Comercial 30.7 33.7 36.4 39.2 41.6 43.8 48.4 56.2 60.0 65.2 36.1
384.0 407.3 431.2 447.4 477.0 491.6 513.6 534.9 564.0 580.9 100.0
Gasoline 78.2 84.1 96.5 100.7 117.1 122.2 127.9 132.3 139.2 129.6 22.3Diesel 153.8 168.7 170.8 171.4 173.1 167.6 168.3 172.3 177.1 168.7 29.0Heating Oil 11.9 10.7 12.2 12.6 11.1 10.3 11.6 11.9 11.9 12.0 2.1Aviation Jet 11.1 12.3 14.0 15.7 18.0 20.4 23.1 23.9 25.4 21.6 3.7LPG 27.3 27.4 30.6 35.4 40.5 47.6 53.4 55.2 58.1 61.1 10.5
332.3 356.3 376.1 401.9 437.7 495.9 556.7 628.7 680.0 716.4 100.0
Oil 307.8 323.0 334.5 354.9 389.1 436.8 482.4 530.8 575.4 606.2 84.6Gas 24.5 33.3 41.7 46.9 48.6 59.0 74.2 97.9 104.6 110.1 15.4Gasoline 0.0 0.0 0.0 0.0 0.2 0.2 0.0 0.4 0.3 0.5 0.1Diesel 2.4 0.9 0.3 0.5 0.4 0.9 0.8 0.7 1.2 1.3 0.2Heating Oil 26.8 26.8 23.5 17.8 15.4 11.7 13.6 16.7 14.8 12.7 1.8Aviation Jet 5.5 5.4 5.5 4.0 3.6 3.6 3.8 4.2 2.9 2.1 0.3LPG 4.2 4.3 5.4 8.9 14.9 20.1 23.1 22.6 24.6 23.3 3.3
35.7 33.3 36.8 37.2 46.8 59.4 65.2 69.8 77.3 74.4 100.0
Oil 33.0 30.9 34.5 35.0 44.1 56.6 62.2 66.9 74.2 69.3 93.1Gas 2.7 2.4 2.3 2.2 2.7 2.8 3.0 2.8 3.0 5.1 6.9Gasoline 4.2 3.0 4.8 5.2 6.1 10.0 10.8 13.3 16.9 16.6 22.3Diesel 2.1 1.9 2.8 4.2 7.3 15.7 17.5 18.9 21.8 20.2 27.1Heating Oil 12.3 11.6 11.3 9.5 10.5 9.9 11.1 12.3 11.1 15.8 21.2Aviation Jet 6.7 7.7 9.5 11.0 12.7 13.5 13.5 15.1 18.1 10.3 13.8LPG 1.4 1.5 1.5 1.7 1.7 1.6 1.6 1.4 1.7 1.2 1.6
8,488.0 8,749.0 9,161.2 9,082.9 9,076.7 9,032.8 9,185.7 9,345.8 9,561.9 9,716.8 -
638.6 610.3 593.0 547.9 512.2 477.5 454.9 434.3 418.7 418.0 -
130.4 125.6 120.6 113.7 108.3 101.9 96.6 92.4 89.7 88.9 -
204.8 196.8 188.5 178.9 168.9 157.4 152.0 148.8 144.9 145.5 -
*Heat is included
Final energy intensity (toe/million $15ppp)
Total energy intensity (toe/million $15ppp)
Natural gas final consumption, by sector
Refined products consumption
Imports
Exports
CO2 Emissions (Million tons CO 2 )
CO2 Intensity (tCO 2 /million $15ppp)
Oil final consumption, by sector
China(Million toe)
Total primary energy demand, by source
Total final consumption, by source
Electricity generation, by source
Total final consumption, by sector
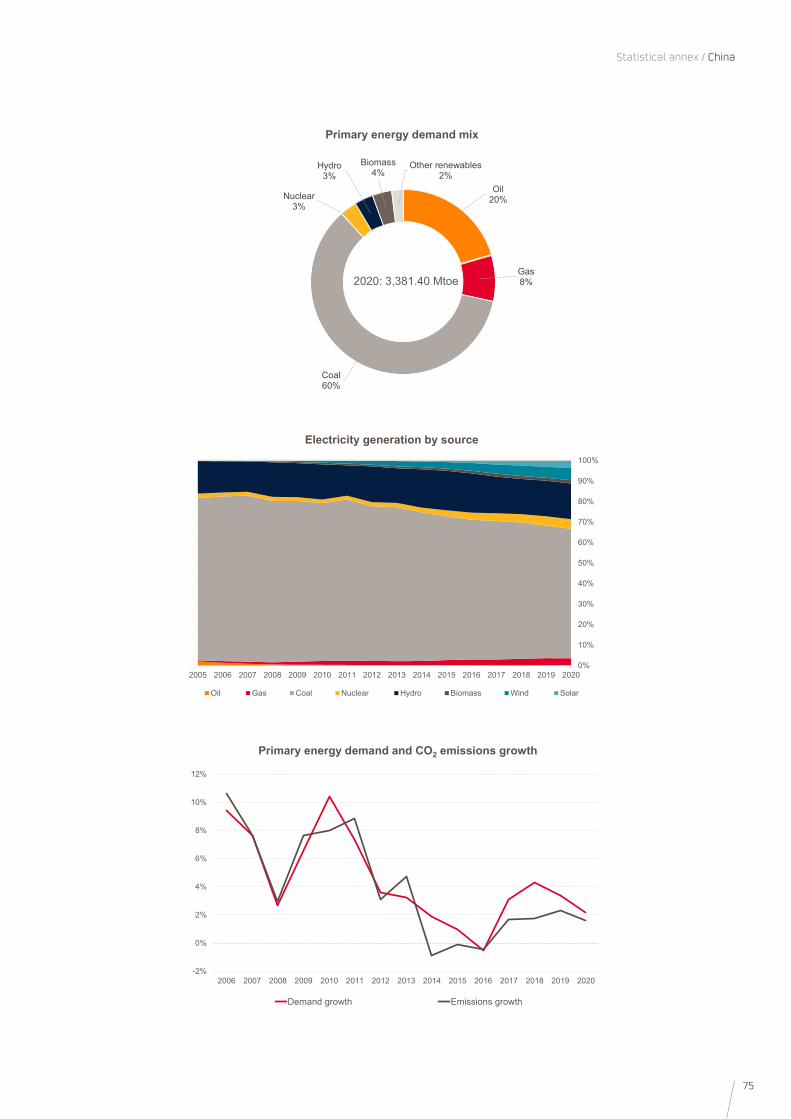
75
Statistical annex / China
0%
10%
20%
30%
40%
50%
60%
70%
80%
90%
100%
2005 2006 2007 2008 2009 2010 2011 2012 2013 2014 2015 2016 2017 2018 2019 2020
Oil Gas Coal Nuclear Hydro Biomass Wind Solar
Electricity generation by source
-2%
0%
2%
4%
6%
8%
10%
12%
2006 2007 2008 2009 2010 2011 2012 2013 2014 2015 2016 2017 2018 2019 2020
Demand growth Emissions growth
Primary energy demand and CO2 emissions growth
Oil 20%
Gas8%
Coal60%
Nuclear3%
Hydro3%
Biomass4%
Other renewables2%
2020: 3,381.40 Mtoe
Primary energy demand mix
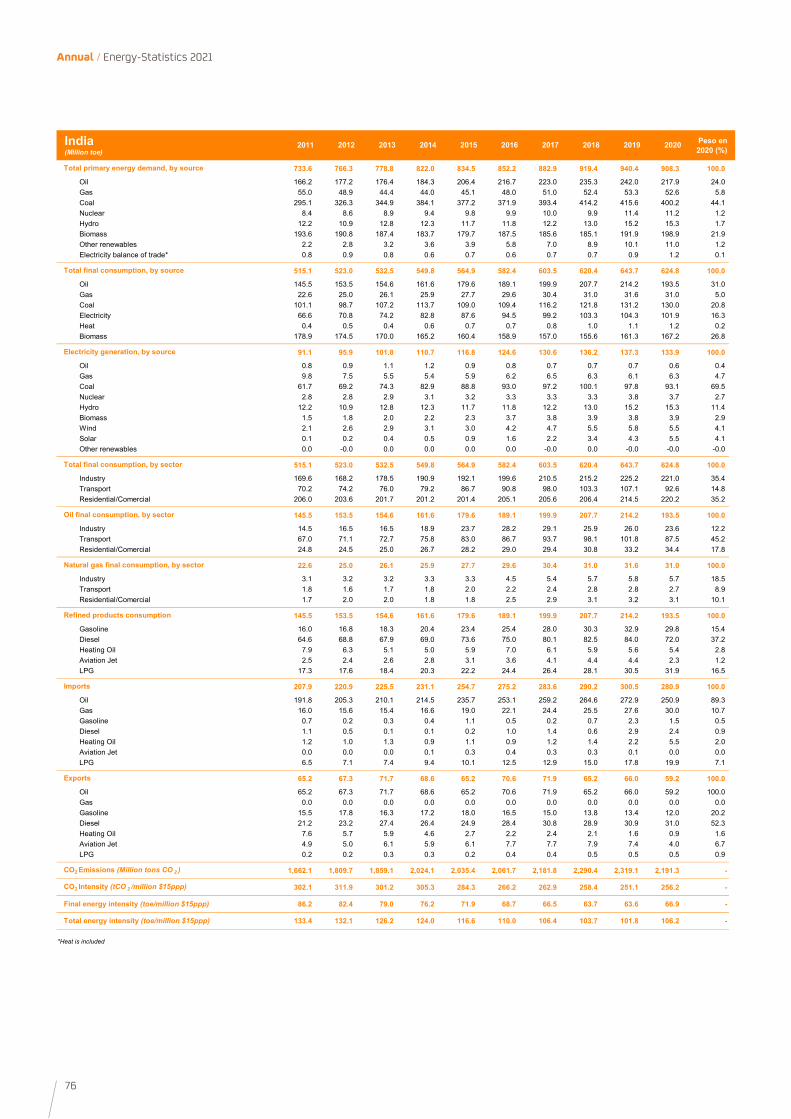
76
Annual / Energy-Statistics 2021
2011 2012 2013 2014 2015 2016 2017 2018 2019 2020 Peso en 2020 (%)
733.6 766.3 778.8 822.0 834.5 852.2 882.9 919.4 940.4 908.3 100.0
Oil 166.2 177.2 176.4 184.3 206.4 216.7 223.0 235.3 242.0 217.9 24.0Gas 55.0 48.9 44.4 44.0 45.1 48.0 51.0 52.4 53.3 52.6 5.8Coal 295.1 326.3 344.9 384.1 377.2 371.9 393.4 414.2 415.6 400.2 44.1Nuclear 8.4 8.6 8.9 9.4 9.8 9.9 10.0 9.9 11.4 11.2 1.2Hydro 12.2 10.9 12.8 12.3 11.7 11.8 12.2 13.0 15.2 15.3 1.7Biomass 193.6 190.8 187.4 183.7 179.7 187.5 185.6 185.1 191.9 198.9 21.9Other renewables 2.2 2.8 3.2 3.6 3.9 5.8 7.0 8.9 10.1 11.0 1.2Electricity balance of trade* 0.8 0.9 0.8 0.6 0.7 0.6 0.7 0.7 0.9 1.2 0.1
515.1 523.0 532.5 549.8 564.9 582.4 603.5 620.4 643.7 624.8 100.0
Oil 145.5 153.5 154.6 161.6 179.6 189.1 199.9 207.7 214.2 193.5 31.0Gas 22.6 25.0 26.1 25.9 27.7 29.6 30.4 31.0 31.6 31.0 5.0Coal 101.1 98.7 107.2 113.7 109.0 109.4 116.2 121.8 131.2 130.0 20.8Electricity 66.6 70.8 74.2 82.8 87.6 94.5 99.2 103.3 104.3 101.9 16.3Heat 0.4 0.5 0.4 0.6 0.7 0.7 0.8 1.0 1.1 1.2 0.2Biomass 178.9 174.5 170.0 165.2 160.4 158.9 157.0 155.6 161.3 167.2 26.8
91.1 95.9 101.8 110.7 116.8 124.6 130.6 136.2 137.3 133.9 100.0
Oil 0.8 0.9 1.1 1.2 0.9 0.8 0.7 0.7 0.7 0.6 0.4Gas 9.8 7.5 5.5 5.4 5.9 6.2 6.5 6.3 6.1 6.3 4.7Coal 61.7 69.2 74.3 82.9 88.8 93.0 97.2 100.1 97.8 93.1 69.5Nuclear 2.8 2.8 2.9 3.1 3.2 3.3 3.3 3.3 3.8 3.7 2.7Hydro 12.2 10.9 12.8 12.3 11.7 11.8 12.2 13.0 15.2 15.3 11.4Biomass 1.5 1.8 2.0 2.2 2.3 3.7 3.8 3.9 3.8 3.9 2.9Wind 2.1 2.6 2.9 3.1 3.0 4.2 4.7 5.5 5.8 5.5 4.1Solar 0.1 0.2 0.4 0.5 0.9 1.6 2.2 3.4 4.3 5.5 4.1Other renewables 0.0 -0.0 0.0 0.0 0.0 0.0 -0.0 0.0 -0.0 -0.0 -0.0
515.1 523.0 532.5 549.8 564.9 582.4 603.5 620.4 643.7 624.8 100.0
Industry 169.6 168.2 178.5 190.9 192.1 199.6 210.5 215.2 225.2 221.0 35.4Transport 70.2 74.2 76.0 79.2 86.7 90.8 98.0 103.3 107.1 92.6 14.8Residential/Comercial 206.0 203.6 201.7 201.2 201.4 205.1 205.6 206.4 214.5 220.2 35.2
145.5 153.5 154.6 161.6 179.6 189.1 199.9 207.7 214.2 193.5 100.0
Industry 14.5 16.5 16.5 18.9 23.7 28.2 29.1 25.9 26.0 23.6 12.2Transport 67.0 71.1 72.7 75.8 83.0 86.7 93.7 98.1 101.8 87.5 45.2Residential/Comercial 24.8 24.5 25.0 26.7 28.2 29.0 29.4 30.8 33.2 34.4 17.8
22.6 25.0 26.1 25.9 27.7 29.6 30.4 31.0 31.6 31.0 100.0
Industry 3.1 3.2 3.2 3.3 3.3 4.5 5.4 5.7 5.8 5.7 18.5Transport 1.8 1.6 1.7 1.8 2.0 2.2 2.4 2.8 2.8 2.7 8.9Residential/Comercial 1.7 2.0 2.0 1.8 1.8 2.5 2.9 3.1 3.2 3.1 10.1
145.5 153.5 154.6 161.6 179.6 189.1 199.9 207.7 214.2 193.5 100.0
Gasoline 16.0 16.8 18.3 20.4 23.4 25.4 28.0 30.3 32.9 29.8 15.4Diesel 64.6 68.8 67.9 69.0 73.6 75.0 80.1 82.5 84.0 72.0 37.2Heating Oil 7.9 6.3 5.1 5.0 5.9 7.0 6.1 5.9 5.6 5.4 2.8Aviation Jet 2.5 2.4 2.6 2.8 3.1 3.6 4.1 4.4 4.4 2.3 1.2LPG 17.3 17.6 18.4 20.3 22.2 24.4 26.4 28.1 30.5 31.9 16.5
207.9 220.9 225.5 231.1 254.7 275.2 283.6 290.2 300.5 280.9 100.0
Oil 191.8 205.3 210.1 214.5 235.7 253.1 259.2 264.6 272.9 250.9 89.3Gas 16.0 15.6 15.4 16.6 19.0 22.1 24.4 25.5 27.6 30.0 10.7Gasoline 0.7 0.2 0.3 0.4 1.1 0.5 0.2 0.7 2.3 1.5 0.5Diesel 1.1 0.5 0.1 0.1 0.2 1.0 1.4 0.6 2.9 2.4 0.9Heating Oil 1.2 1.0 1.3 0.9 1.1 0.9 1.2 1.4 2.2 5.5 2.0Aviation Jet 0.0 0.0 0.0 0.1 0.3 0.4 0.3 0.3 0.1 0.0 0.0LPG 6.5 7.1 7.4 9.4 10.1 12.5 12.9 15.0 17.8 19.9 7.1
65.2 67.3 71.7 68.6 65.2 70.6 71.9 65.2 66.0 59.2 100.0
Oil 65.2 67.3 71.7 68.6 65.2 70.6 71.9 65.2 66.0 59.2 100.0Gas 0.0 0.0 0.0 0.0 0.0 0.0 0.0 0.0 0.0 0.0 0.0Gasoline 15.5 17.8 16.3 17.2 18.0 16.5 15.0 13.8 13.4 12.0 20.2Diesel 21.2 23.2 27.4 26.4 24.9 28.4 30.8 28.9 30.9 31.0 52.3Heating Oil 7.6 5.7 5.9 4.6 2.7 2.2 2.4 2.1 1.6 0.9 1.6Aviation Jet 4.9 5.0 6.1 5.9 6.1 7.7 7.7 7.9 7.4 4.0 6.7LPG 0.2 0.2 0.3 0.3 0.2 0.4 0.4 0.5 0.5 0.5 0.9
1,662.1 1,809.7 1,859.1 2,024.1 2,035.4 2,061.7 2,181.8 2,290.4 2,319.1 2,191.3 -
302.1 311.9 301.2 305.3 284.3 266.2 262.9 258.4 251.1 256.2 -
86.2 82.4 79.0 76.2 71.9 68.7 66.5 63.7 63.6 66.9 -
133.4 132.1 126.2 124.0 116.6 110.0 106.4 103.7 101.8 106.2 -
*Heat is included
Final energy intensity (toe/million $15ppp)
Total energy intensity (toe/million $15ppp)
Natural gas final consumption, by sector
Refined products consumption
Imports
Exports
CO2 Emissions (Million tons CO 2 )
CO2 Intensity (tCO 2 /million $15ppp)
Oil final consumption, by sector
India(Million toe)
Total primary energy demand, by source
Total final consumption, by source
Electricity generation, by source
Total final consumption, by sector
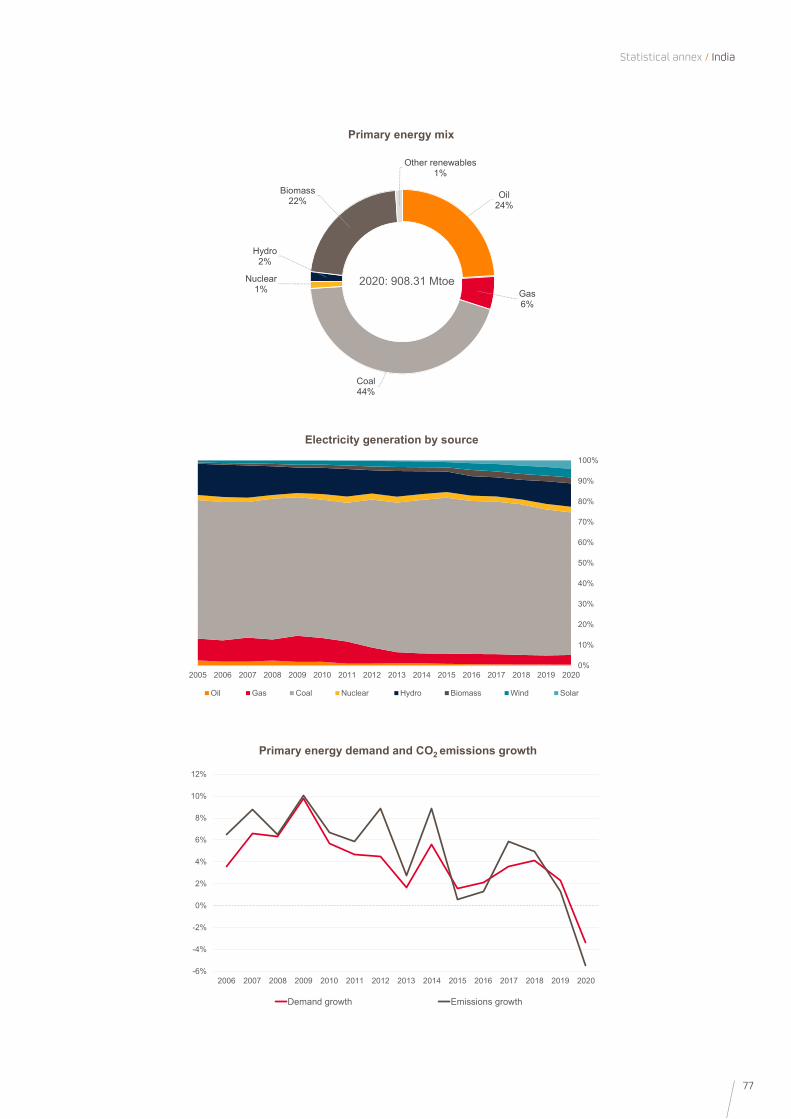
77
Oil 24%
Gas6%
Coal44%
Nuclear1%
Hydro2%
Biomass22%
Other renewables1%
2020: 908.31 Mtoe
Primary energy mix
Statistical annex / India
0%
10%
20%
30%
40%
50%
60%
70%
80%
90%
100%
2005 2006 2007 2008 2009 2010 2011 2012 2013 2014 2015 2016 2017 2018 2019 2020
Oil Gas Coal Nuclear Hydro Biomass Wind Solar
Electricity generation by source
-6%
-4%
-2%
0%
2%
4%
6%
8%
10%
12%
2006 2007 2008 2009 2010 2011 2012 2013 2014 2015 2016 2017 2018 2019 2020
Demand growth Emissions growth
Primary energy demand and CO2 emissions growth
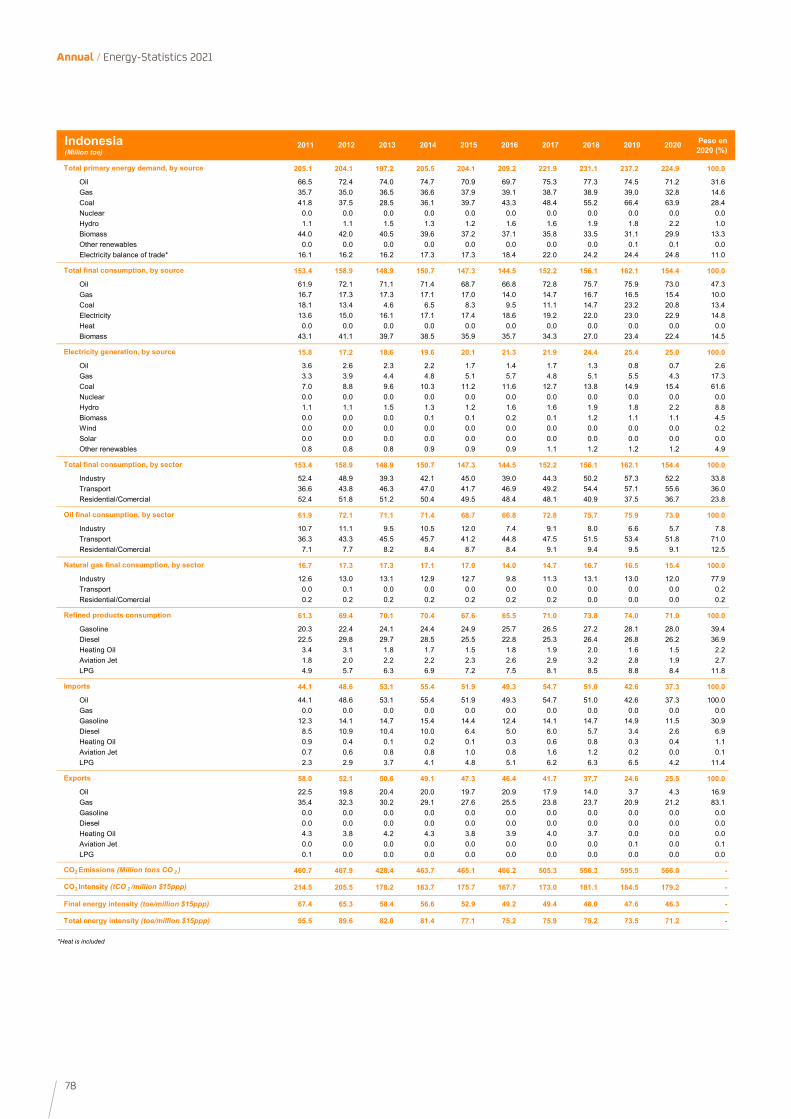
78
Annual / Energy-Statistics 2021
2011 2012 2013 2014 2015 2016 2017 2018 2019 2020 Peso en 2020 (%)
205.1 204.1 197.2 205.5 204.1 209.2 221.9 231.1 237.2 224.9 100.0
Oil 66.5 72.4 74.0 74.7 70.9 69.7 75.3 77.3 74.5 71.2 31.6Gas 35.7 35.0 36.5 36.6 37.9 39.1 38.7 38.9 39.0 32.8 14.6Coal 41.8 37.5 28.5 36.1 39.7 43.3 48.4 55.2 66.4 63.9 28.4Nuclear 0.0 0.0 0.0 0.0 0.0 0.0 0.0 0.0 0.0 0.0 0.0Hydro 1.1 1.1 1.5 1.3 1.2 1.6 1.6 1.9 1.8 2.2 1.0Biomass 44.0 42.0 40.5 39.6 37.2 37.1 35.8 33.5 31.1 29.9 13.3Other renewables 0.0 0.0 0.0 0.0 0.0 0.0 0.0 0.0 0.1 0.1 0.0Electricity balance of trade* 16.1 16.2 16.2 17.3 17.3 18.4 22.0 24.2 24.4 24.8 11.0
153.4 158.9 148.9 150.7 147.3 144.5 152.2 156.1 162.1 154.4 100.0
Oil 61.9 72.1 71.1 71.4 68.7 66.8 72.8 75.7 75.9 73.0 47.3Gas 16.7 17.3 17.3 17.1 17.0 14.0 14.7 16.7 16.5 15.4 10.0Coal 18.1 13.4 4.6 6.5 8.3 9.5 11.1 14.7 23.2 20.8 13.4Electricity 13.6 15.0 16.1 17.1 17.4 18.6 19.2 22.0 23.0 22.9 14.8Heat 0.0 0.0 0.0 0.0 0.0 0.0 0.0 0.0 0.0 0.0 0.0Biomass 43.1 41.1 39.7 38.5 35.9 35.7 34.3 27.0 23.4 22.4 14.5
15.8 17.2 18.6 19.6 20.1 21.3 21.9 24.4 25.4 25.0 100.0
Oil 3.6 2.6 2.3 2.2 1.7 1.4 1.7 1.3 0.8 0.7 2.6Gas 3.3 3.9 4.4 4.8 5.1 5.7 4.8 5.1 5.5 4.3 17.3Coal 7.0 8.8 9.6 10.3 11.2 11.6 12.7 13.8 14.9 15.4 61.6Nuclear 0.0 0.0 0.0 0.0 0.0 0.0 0.0 0.0 0.0 0.0 0.0Hydro 1.1 1.1 1.5 1.3 1.2 1.6 1.6 1.9 1.8 2.2 8.8Biomass 0.0 0.0 0.0 0.1 0.1 0.2 0.1 1.2 1.1 1.1 4.5Wind 0.0 0.0 0.0 0.0 0.0 0.0 0.0 0.0 0.0 0.0 0.2Solar 0.0 0.0 0.0 0.0 0.0 0.0 0.0 0.0 0.0 0.0 0.0Other renewables 0.8 0.8 0.8 0.9 0.9 0.9 1.1 1.2 1.2 1.2 4.9
153.4 158.9 148.9 150.7 147.3 144.5 152.2 156.1 162.1 154.4 100.0
Industry 52.4 48.9 39.3 42.1 45.0 39.0 44.3 50.2 57.3 52.2 33.8Transport 36.6 43.8 46.3 47.0 41.7 46.9 49.2 54.4 57.1 55.6 36.0Residential/Comercial 52.4 51.8 51.2 50.4 49.5 48.4 48.1 40.9 37.5 36.7 23.8
61.9 72.1 71.1 71.4 68.7 66.8 72.8 75.7 75.9 73.0 100.0
Industry 10.7 11.1 9.5 10.5 12.0 7.4 9.1 8.0 6.6 5.7 7.8Transport 36.3 43.3 45.5 45.7 41.2 44.8 47.5 51.5 53.4 51.8 71.0Residential/Comercial 7.1 7.7 8.2 8.4 8.7 8.4 9.1 9.4 9.5 9.1 12.5
16.7 17.3 17.3 17.1 17.0 14.0 14.7 16.7 16.5 15.4 100.0
Industry 12.6 13.0 13.1 12.9 12.7 9.8 11.3 13.1 13.0 12.0 77.9Transport 0.0 0.1 0.0 0.0 0.0 0.0 0.0 0.0 0.0 0.0 0.2Residential/Comercial 0.2 0.2 0.2 0.2 0.2 0.2 0.2 0.0 0.0 0.0 0.2
61.3 69.4 70.1 70.4 67.6 65.5 71.0 73.8 74.0 71.0 100.0
Gasoline 20.3 22.4 24.1 24.4 24.9 25.7 26.5 27.2 28.1 28.0 39.4Diesel 22.5 29.8 29.7 28.5 25.5 22.8 25.3 26.4 26.8 26.2 36.9Heating Oil 3.4 3.1 1.8 1.7 1.5 1.8 1.9 2.0 1.6 1.5 2.2Aviation Jet 1.8 2.0 2.2 2.2 2.3 2.6 2.9 3.2 2.8 1.9 2.7LPG 4.9 5.7 6.3 6.9 7.2 7.5 8.1 8.5 8.8 8.4 11.8
44.1 48.6 53.1 55.4 51.9 49.3 54.7 51.0 42.6 37.3 100.0
Oil 44.1 48.6 53.1 55.4 51.9 49.3 54.7 51.0 42.6 37.3 100.0Gas 0.0 0.0 0.0 0.0 0.0 0.0 0.0 0.0 0.0 0.0 0.0Gasoline 12.3 14.1 14.7 15.4 14.4 12.4 14.1 14.7 14.9 11.5 30.9Diesel 8.5 10.9 10.4 10.0 6.4 5.0 6.0 5.7 3.4 2.6 6.9Heating Oil 0.9 0.4 0.1 0.2 0.1 0.3 0.6 0.8 0.3 0.4 1.1Aviation Jet 0.7 0.6 0.8 0.8 1.0 0.8 1.6 1.2 0.2 0.0 0.1LPG 2.3 2.9 3.7 4.1 4.8 5.1 6.2 6.3 6.5 4.2 11.4
58.0 52.1 50.6 49.1 47.3 46.4 41.7 37.7 24.6 25.5 100.0
Oil 22.5 19.8 20.4 20.0 19.7 20.9 17.9 14.0 3.7 4.3 16.9Gas 35.4 32.3 30.2 29.1 27.6 25.5 23.8 23.7 20.9 21.2 83.1Gasoline 0.0 0.0 0.0 0.0 0.0 0.0 0.0 0.0 0.0 0.0 0.0Diesel 0.0 0.0 0.0 0.0 0.0 0.0 0.0 0.0 0.0 0.0 0.0Heating Oil 4.3 3.8 4.2 4.3 3.8 3.9 4.0 3.7 0.0 0.0 0.0Aviation Jet 0.0 0.0 0.0 0.0 0.0 0.0 0.0 0.0 0.1 0.0 0.1LPG 0.1 0.0 0.0 0.0 0.0 0.0 0.0 0.0 0.0 0.0 0.0
460.7 467.9 428.4 463.7 465.1 466.2 505.3 556.3 595.5 566.0 -
214.5 205.5 178.2 183.7 175.7 167.7 173.0 181.1 184.5 179.2 -
67.4 65.3 58.4 56.6 52.9 49.2 49.4 48.0 47.6 46.3 -
95.5 89.6 82.0 81.4 77.1 75.2 75.9 75.2 73.5 71.2 -
*Heat is included
Final energy intensity (toe/million $15ppp)
Total energy intensity (toe/million $15ppp)
Natural gas final consumption, by sector
Refined products consumption
Imports
Exports
CO2 Emissions (Million tons CO 2 )
CO2 Intensity (tCO 2 /million $15ppp)
Oil final consumption, by sector
Indonesia(Million toe)
Total primary energy demand, by source
Total final consumption, by source
Electricity generation, by source
Total final consumption, by sector
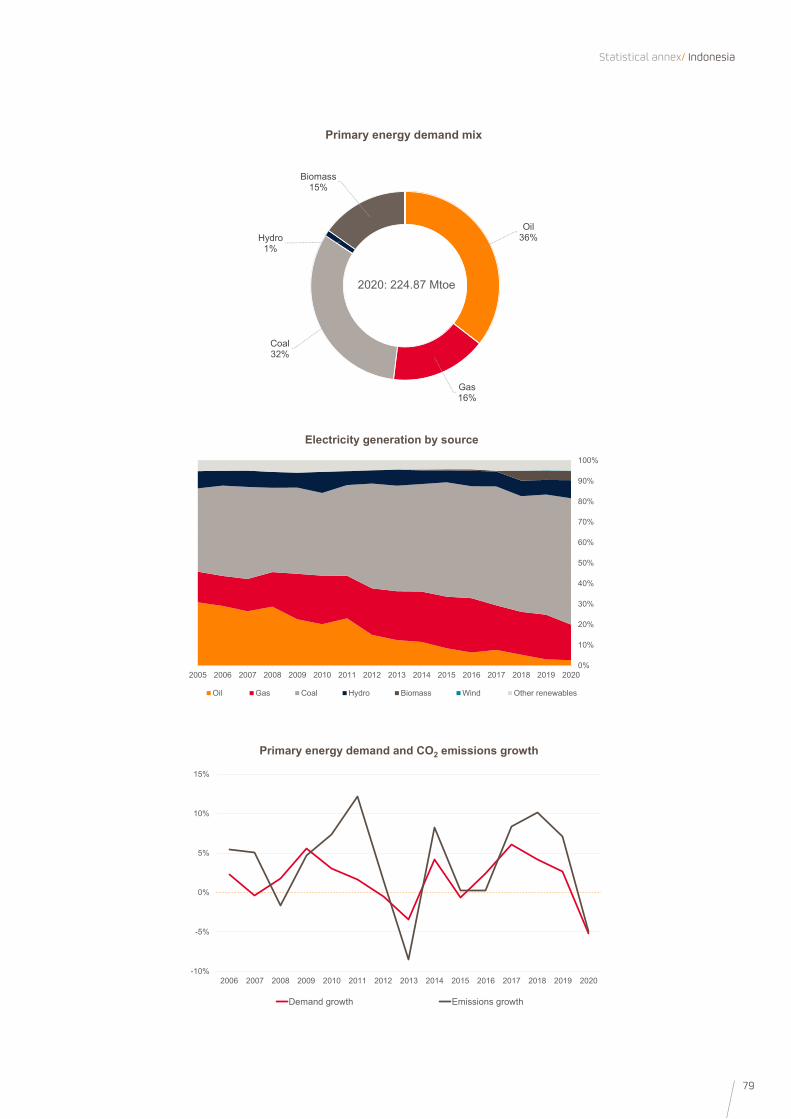
79
Statistical annex/ Indonesia
0%
10%
20%
30%
40%
50%
60%
70%
80%
90%
100%
2005 2006 2007 2008 2009 2010 2011 2012 2013 2014 2015 2016 2017 2018 2019 2020
Oil Gas Coal Hydro Biomass Wind Other renewables
Electricity generation by source
-10%
-5%
0%
5%
10%
15%
2006 2007 2008 2009 2010 2011 2012 2013 2014 2015 2016 2017 2018 2019 2020
Demand growth Emissions growth
Primary energy demand and CO2 emissions growth
Oil 36%
Gas16%
Coal32%
Hydro1%
Biomass15%
2020: 224.87 Mtoe
Primary energy demand mix

80
Annual / Energy-Statistics 2021
2011 2012 2013 2014 2015 2016 2017 2018 2019 2020 Peso en 2020 (%)
465.7 455.8 456.5 441.6 434.3 429.1 433.7 427.6 416.4 386.3 100.0
Oil 206.8 209.7 200.6 190.3 184.0 176.9 176.0 166.2 159.5 144.1 37.3Gas 99.8 105.0 105.1 106.6 100.2 101.7 100.9 97.0 92.3 89.5 23.2Coal 107.9 112.8 122.5 117.8 119.1 116.4 116.4 114.4 112.9 103.8 26.9Nuclear 26.5 4.2 2.4 0.0 2.5 4.7 8.6 16.9 18.1 13.3 3.4Hydro 7.3 6.6 6.8 7.2 7.5 6.8 7.2 7.0 6.4 7.0 1.8Biomass 12.0 12.1 13.0 12.8 13.1 13.8 15.0 15.9 16.5 17.2 4.5Other renewables 0.8 1.0 1.6 2.4 3.5 4.5 5.3 6.0 6.7 7.5 2.0Electricity balance of trade* 4.6 4.5 4.6 4.5 4.4 4.3 4.3 4.2 4.0 3.9 1.0
328.3 325.6 327.3 318.1 313.8 309.5 312.0 302.3 299.0 275.8 100.0
Oil 163.3 161.0 162.1 155.8 154.8 150.9 151.3 144.3 143.5 132.6 48.1Gas 29.9 29.5 28.8 28.4 28.6 28.6 29.4 29.0 28.3 26.0 9.4Coal 42.5 43.1 44.1 43.3 41.9 41.3 41.3 40.5 41.0 33.5 12.1Electricity 85.7 85.3 85.1 83.7 81.7 81.7 83.0 81.3 79.0 76.6 27.8Heat 1.0 1.0 1.0 0.9 0.9 0.9 0.9 0.9 0.9 0.9 0.3Biomass 5.9 5.8 6.2 5.9 6.0 6.1 6.2 6.2 6.3 6.3 2.3
95.5 94.5 95.0 92.5 91.1 91.3 92.1 91.0 87.3 87.0 100.0
Oil 13.5 16.2 13.5 9.9 8.4 7.1 5.9 4.5 3.6 2.5 2.9Gas 34.5 36.6 36.9 37.7 35.2 35.9 34.5 32.5 30.0 31.2 35.8Coal 25.6 27.6 30.2 30.3 30.4 30.0 30.3 29.1 28.3 27.7 31.8Nuclear 8.8 1.4 0.8 0.0 0.8 1.6 2.8 5.6 6.0 4.4 5.1Hydro 7.9 7.2 7.3 7.5 7.8 7.4 7.8 7.6 6.9 7.6 8.7Biomass 2.5 2.6 2.7 2.7 2.9 2.9 3.5 3.8 4.0 4.3 5.0Wind 0.4 0.4 0.4 0.4 0.5 0.5 0.6 0.6 0.7 0.7 0.8Solar 0.4 0.6 1.1 2.0 3.0 3.9 4.7 5.4 6.0 6.8 7.8Other renewables 2.0 2.0 2.1 2.0 2.0 2.0 2.0 1.9 1.8 1.8 2.0
328.3 325.6 327.3 318.1 313.8 309.5 312.0 302.3 299.0 275.8 100.0
Industry 103.2 102.5 103.0 100.5 96.7 96.2 96.0 94.4 93.7 83.4 30.2Transport 77.2 76.0 75.8 74.0 74.0 73.0 72.2 71.2 69.6 63.5 23.0Residential/Comercial 99.9 98.8 98.8 95.8 92.8 92.4 94.9 90.4 88.7 85.1 30.8
163.3 161.0 162.1 155.8 154.8 150.9 151.3 144.3 143.5 132.6 100.0
Industry 15.9 14.9 14.0 13.2 11.7 11.6 10.9 10.2 10.3 9.4 7.1Transport 75.4 74.2 74.0 72.1 72.1 71.0 70.3 69.2 67.7 61.7 46.5Residential/Comercial 26.4 25.9 26.7 24.8 22.7 22.3 23.1 20.6 20.4 19.4 14.6
29.9 29.5 28.8 28.4 28.6 28.6 29.4 29.0 28.3 26.0 100.0
Industry 11.4 11.4 11.2 11.0 10.9 11.1 11.3 11.4 10.9 9.8 37.7Transport 0.1 0.1 0.1 0.1 0.1 0.1 0.1 0.0 0.0 0.0 0.1Residential/Comercial 18.0 17.6 17.1 17.1 17.4 17.2 17.9 17.3 17.2 15.9 61.4
162.9 160.6 161.8 155.6 154.5 150.8 151.0 144.2 143.4 132.5 100.0
Gasoline 44.6 44.0 43.1 41.1 41.1 40.6 39.9 39.0 37.9 35.0 26.4Diesel 40.0 39.4 40.0 38.7 38.4 38.0 38.1 37.9 37.6 35.4 26.7Heating Oil 6.6 6.1 5.6 5.2 4.5 4.7 4.7 4.4 4.0 3.4 2.6Aviation Jet 3.5 3.3 4.2 4.4 4.5 4.4 4.3 4.1 4.2 2.7 2.0LPG 14.0 14.0 14.5 14.1 12.5 11.8 11.6 10.1 9.3 8.6 6.5
327.8 335.8 329.5 317.1 309.2 303.5 301.7 289.9 274.6 249.6 100.0
Oil 230.4 234.1 226.7 212.9 211.4 204.3 203.5 195.5 186.6 164.5 65.9Gas 97.4 101.7 102.7 104.3 97.8 99.2 98.2 94.3 88.0 85.1 34.1Gasoline 2.3 2.3 1.3 1.2 1.3 0.7 1.0 1.7 1.9 2.5 1.0Diesel 0.8 0.6 0.3 0.6 0.5 0.4 0.5 0.6 0.7 1.1 0.4Heating Oil 7.0 8.7 6.4 4.4 3.2 2.3 2.2 1.8 0.5 0.2 0.1Aviation Jet 1.1 1.3 0.8 0.5 0.7 0.7 1.3 1.3 1.1 0.4 0.2LPG 14.4 15.1 13.7 13.3 12.4 12.0 12.2 12.1 11.9 10.9 4.4
13.9 13.0 17.0 15.8 18.5 18.5 17.7 17.7 19.8 12.4 100.0
Oil 13.9 13.0 17.0 15.8 18.5 18.5 17.7 17.7 19.8 12.4 100.0Gas 0.0 0.0 0.0 0.0 0.0 0.0 0.0 0.0 0.0 0.0 0.0Gasoline 1.0 0.9 1.4 2.4 3.1 2.4 3.0 2.6 2.7 1.8 14.9Diesel 6.8 6.1 9.2 7.8 8.8 8.3 8.7 8.0 10.8 4.9 40.0Heating Oil 2.6 2.7 1.9 1.7 2.2 3.1 2.5 2.8 2.4 2.7 21.6Aviation Jet 2.1 2.3 2.9 2.4 2.8 2.9 2.2 2.7 3.0 1.3 10.2LPG 0.1 0.0 0.1 0.1 0.1 0.1 0.1 0.1 0.1 0.0 0.3
1,170.9 1,211.0 1,214.8 1,173.8 1,138.2 1,128.2 1,110.4 1,066.5 1,044.4 979.4 -
239.8 244.4 240.3 231.3 221.6 218.3 210.8 200.9 195.4 192.5 -
58.5 57.0 55.9 54.2 52.4 51.7 50.9 49.2 48.1 46.5 -
95.4 92.0 90.3 87.0 84.6 83.0 82.3 80.6 77.9 75.9 -
*Heat is included
Final energy intensity (toe/million $15ppp)
Total energy intensity (toe/million $15ppp)
Natural gas final consumption, by sector
Refined products consumption
Imports
Exports
CO2 Emissions (Million tons CO 2 )
CO2 Intensity (tCO 2 /million $15ppp)
Oil final consumption, by sector
Japan(Million toe)
Total primary energy demand, by source
Total final consumption, by source
Electricity generation, by source
Total final consumption, by sector
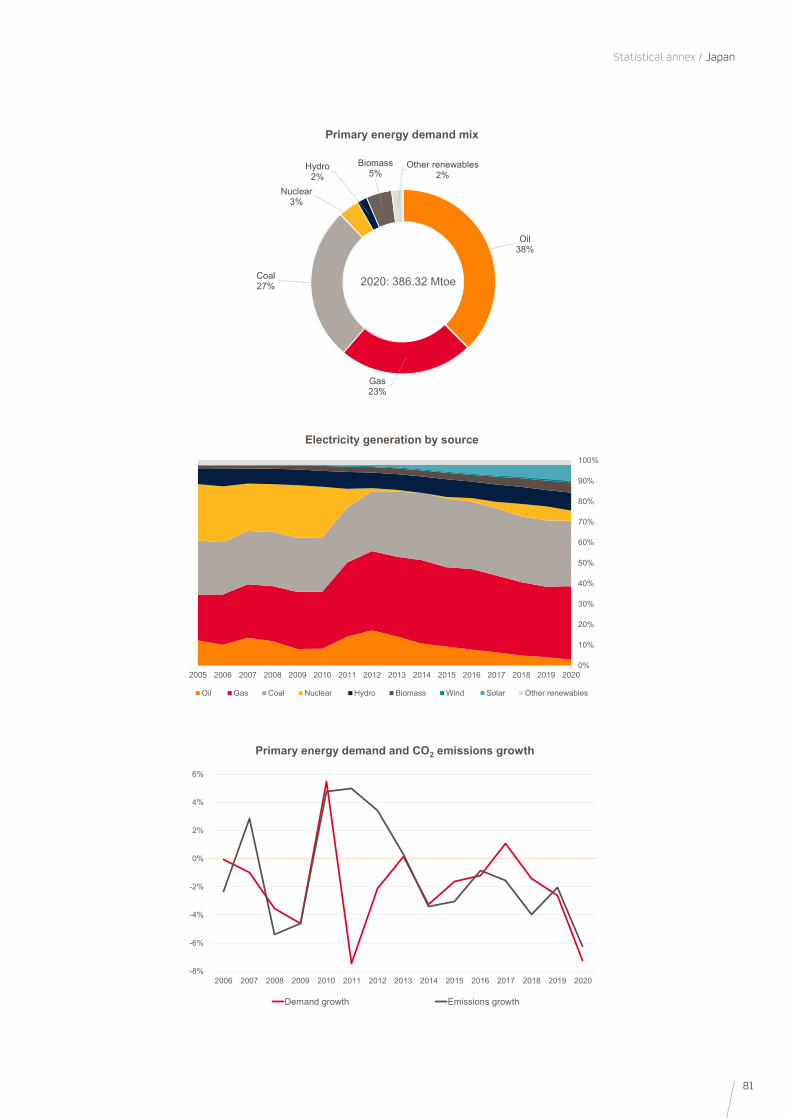
81
Statistical annex / Japan
0%
10%
20%
30%
40%
50%
60%
70%
80%
90%
100%
2005 2006 2007 2008 2009 2010 2011 2012 2013 2014 2015 2016 2017 2018 2019 2020
Oil Gas Coal Nuclear Hydro Biomass Wind Solar Other renewables
Electricity generation by source
-8%
-6%
-4%
-2%
0%
2%
4%
6%
2006 2007 2008 2009 2010 2011 2012 2013 2014 2015 2016 2017 2018 2019 2020
Demand growth Emissions growth
Primary energy demand and CO2 emissions growth
Oil 38%
Gas23%
Coal27%
Nuclear3%
Hydro2%
Biomass5%
Other renewables2%
2020: 386.32 Mtoe
Primary energy demand mix
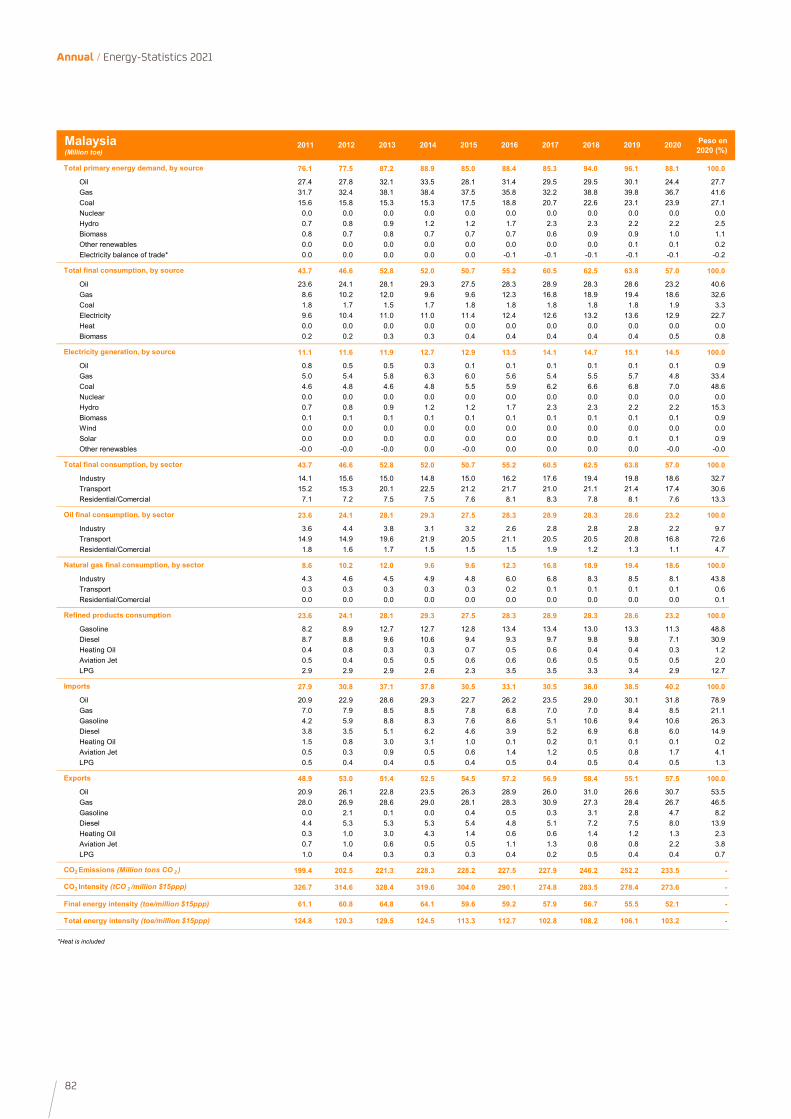
82
Annual / Energy-Statistics 2021
2011 2012 2013 2014 2015 2016 2017 2018 2019 2020 Peso en 2020 (%)
76.1 77.5 87.2 88.9 85.0 88.4 85.3 94.0 96.1 88.1 100.0
Oil 27.4 27.8 32.1 33.5 28.1 31.4 29.5 29.5 30.1 24.4 27.7Gas 31.7 32.4 38.1 38.4 37.5 35.8 32.2 38.8 39.8 36.7 41.6Coal 15.6 15.8 15.3 15.3 17.5 18.8 20.7 22.6 23.1 23.9 27.1Nuclear 0.0 0.0 0.0 0.0 0.0 0.0 0.0 0.0 0.0 0.0 0.0Hydro 0.7 0.8 0.9 1.2 1.2 1.7 2.3 2.3 2.2 2.2 2.5Biomass 0.8 0.7 0.8 0.7 0.7 0.7 0.6 0.9 0.9 1.0 1.1Other renewables 0.0 0.0 0.0 0.0 0.0 0.0 0.0 0.0 0.1 0.1 0.2Electricity balance of trade* 0.0 0.0 0.0 0.0 0.0 -0.1 -0.1 -0.1 -0.1 -0.1 -0.2
43.7 46.6 52.8 52.0 50.7 55.2 60.5 62.5 63.8 57.0 100.0
Oil 23.6 24.1 28.1 29.3 27.5 28.3 28.9 28.3 28.6 23.2 40.6Gas 8.6 10.2 12.0 9.6 9.6 12.3 16.8 18.9 19.4 18.6 32.6Coal 1.8 1.7 1.5 1.7 1.8 1.8 1.8 1.8 1.8 1.9 3.3Electricity 9.6 10.4 11.0 11.0 11.4 12.4 12.6 13.2 13.6 12.9 22.7Heat 0.0 0.0 0.0 0.0 0.0 0.0 0.0 0.0 0.0 0.0 0.0Biomass 0.2 0.2 0.3 0.3 0.4 0.4 0.4 0.4 0.4 0.5 0.8
11.1 11.6 11.9 12.7 12.9 13.5 14.1 14.7 15.1 14.5 100.0
Oil 0.8 0.5 0.5 0.3 0.1 0.1 0.1 0.1 0.1 0.1 0.9Gas 5.0 5.4 5.8 6.3 6.0 5.6 5.4 5.5 5.7 4.8 33.4Coal 4.6 4.8 4.6 4.8 5.5 5.9 6.2 6.6 6.8 7.0 48.6Nuclear 0.0 0.0 0.0 0.0 0.0 0.0 0.0 0.0 0.0 0.0 0.0Hydro 0.7 0.8 0.9 1.2 1.2 1.7 2.3 2.3 2.2 2.2 15.3Biomass 0.1 0.1 0.1 0.1 0.1 0.1 0.1 0.1 0.1 0.1 0.9Wind 0.0 0.0 0.0 0.0 0.0 0.0 0.0 0.0 0.0 0.0 0.0Solar 0.0 0.0 0.0 0.0 0.0 0.0 0.0 0.0 0.1 0.1 0.9Other renewables -0.0 -0.0 -0.0 0.0 -0.0 0.0 0.0 0.0 0.0 -0.0 -0.0
43.7 46.6 52.8 52.0 50.7 55.2 60.5 62.5 63.8 57.0 100.0
Industry 14.1 15.6 15.0 14.8 15.0 16.2 17.6 19.4 19.8 18.6 32.7Transport 15.2 15.3 20.1 22.5 21.2 21.7 21.0 21.1 21.4 17.4 30.6Residential/Comercial 7.1 7.2 7.5 7.5 7.6 8.1 8.3 7.8 8.1 7.6 13.3
23.6 24.1 28.1 29.3 27.5 28.3 28.9 28.3 28.6 23.2 100.0
Industry 3.6 4.4 3.8 3.1 3.2 2.6 2.8 2.8 2.8 2.2 9.7Transport 14.9 14.9 19.6 21.9 20.5 21.1 20.5 20.5 20.8 16.8 72.6Residential/Comercial 1.8 1.6 1.7 1.5 1.5 1.5 1.9 1.2 1.3 1.1 4.7
8.6 10.2 12.0 9.6 9.6 12.3 16.8 18.9 19.4 18.6 100.0
Industry 4.3 4.6 4.5 4.9 4.8 6.0 6.8 8.3 8.5 8.1 43.8Transport 0.3 0.3 0.3 0.3 0.3 0.2 0.1 0.1 0.1 0.1 0.6Residential/Comercial 0.0 0.0 0.0 0.0 0.0 0.0 0.0 0.0 0.0 0.0 0.1
23.6 24.1 28.1 29.3 27.5 28.3 28.9 28.3 28.6 23.2 100.0
Gasoline 8.2 8.9 12.7 12.7 12.8 13.4 13.4 13.0 13.3 11.3 48.8Diesel 8.7 8.8 9.6 10.6 9.4 9.3 9.7 9.8 9.8 7.1 30.9Heating Oil 0.4 0.8 0.3 0.3 0.7 0.5 0.6 0.4 0.4 0.3 1.2Aviation Jet 0.5 0.4 0.5 0.5 0.6 0.6 0.6 0.5 0.5 0.5 2.0LPG 2.9 2.9 2.9 2.6 2.3 3.5 3.5 3.3 3.4 2.9 12.7
27.9 30.8 37.1 37.8 30.5 33.1 30.5 36.0 38.5 40.2 100.0
Oil 20.9 22.9 28.6 29.3 22.7 26.2 23.5 29.0 30.1 31.8 78.9Gas 7.0 7.9 8.5 8.5 7.8 6.8 7.0 7.0 8.4 8.5 21.1Gasoline 4.2 5.9 8.8 8.3 7.6 8.6 5.1 10.6 9.4 10.6 26.3Diesel 3.8 3.5 5.1 6.2 4.6 3.9 5.2 6.9 6.8 6.0 14.9Heating Oil 1.5 0.8 3.0 3.1 1.0 0.1 0.2 0.1 0.1 0.1 0.2Aviation Jet 0.5 0.3 0.9 0.5 0.6 1.4 1.2 0.5 0.8 1.7 4.1LPG 0.5 0.4 0.4 0.5 0.4 0.5 0.4 0.5 0.4 0.5 1.3
48.9 53.0 51.4 52.5 54.5 57.2 56.9 58.4 55.1 57.5 100.0
Oil 20.9 26.1 22.8 23.5 26.3 28.9 26.0 31.0 26.6 30.7 53.5Gas 28.0 26.9 28.6 29.0 28.1 28.3 30.9 27.3 28.4 26.7 46.5Gasoline 0.0 2.1 0.1 0.0 0.4 0.5 0.3 3.1 2.8 4.7 8.2Diesel 4.4 5.3 5.3 5.3 5.4 4.8 5.1 7.2 7.5 8.0 13.9Heating Oil 0.3 1.0 3.0 4.3 1.4 0.6 0.6 1.4 1.2 1.3 2.3Aviation Jet 0.7 1.0 0.6 0.5 0.5 1.1 1.3 0.8 0.8 2.2 3.8LPG 1.0 0.4 0.3 0.3 0.3 0.4 0.2 0.5 0.4 0.4 0.7
199.4 202.5 221.3 228.3 228.2 227.5 227.9 246.2 252.2 233.5 -
326.7 314.6 328.4 319.6 304.0 290.1 274.8 283.5 278.4 273.6 -
61.1 60.8 64.8 64.1 59.6 59.2 57.9 56.7 55.5 52.1 -
124.8 120.3 129.5 124.5 113.3 112.7 102.8 108.2 106.1 103.2 -
*Heat is included
Final energy intensity (toe/million $15ppp)
Total energy intensity (toe/million $15ppp)
Natural gas final consumption, by sector
Refined products consumption
Imports
Exports
CO2 Emissions (Million tons CO 2 )
CO2 Intensity (tCO 2 /million $15ppp)
Oil final consumption, by sector
Malaysia(Million toe)
Total primary energy demand, by source
Total final consumption, by source
Electricity generation, by source
Total final consumption, by sector
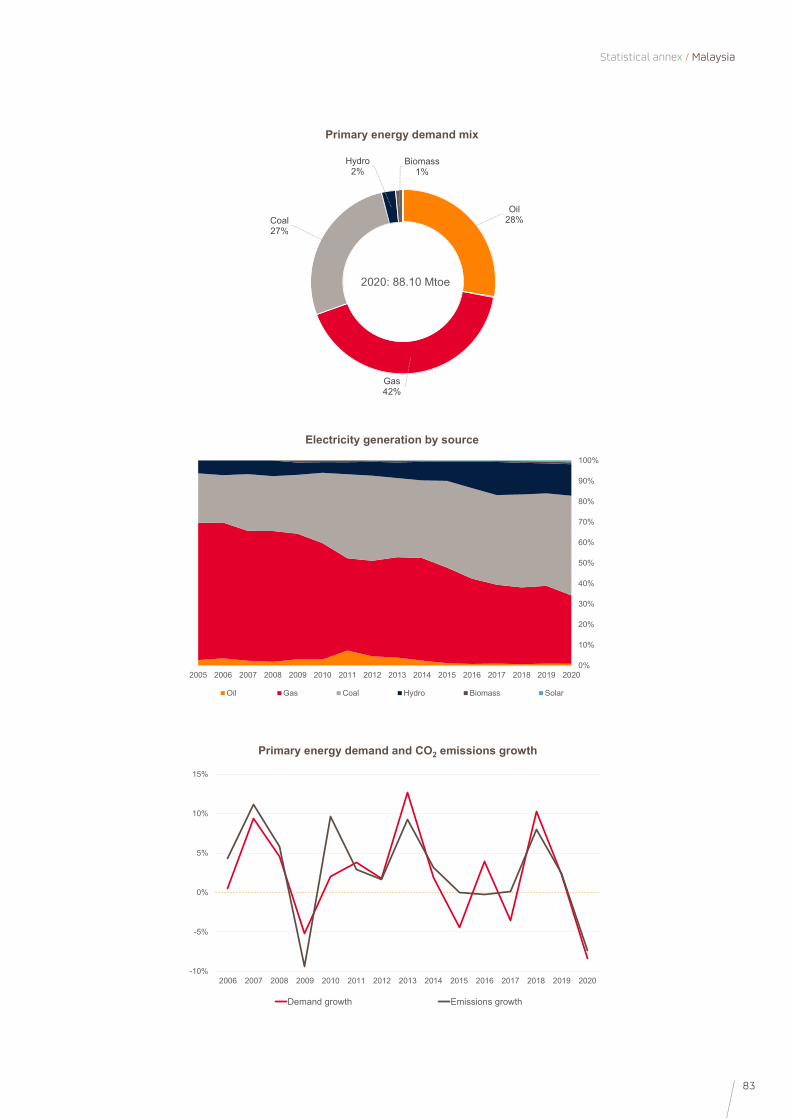
83
Statistical annex / Malaysia
0%
10%
20%
30%
40%
50%
60%
70%
80%
90%
100%
2005 2006 2007 2008 2009 2010 2011 2012 2013 2014 2015 2016 2017 2018 2019 2020
Oil Gas Coal Hydro Biomass Solar
Electricity generation by source
-10%
-5%
0%
5%
10%
15%
2006 2007 2008 2009 2010 2011 2012 2013 2014 2015 2016 2017 2018 2019 2020
Demand growth Emissions growth
Primary energy demand and CO2 emissions growth
Oil 28%
Gas42%
Coal27%
Hydro2%
Biomass1%
2020: 88.10 Mtoe
Primary energy demand mix
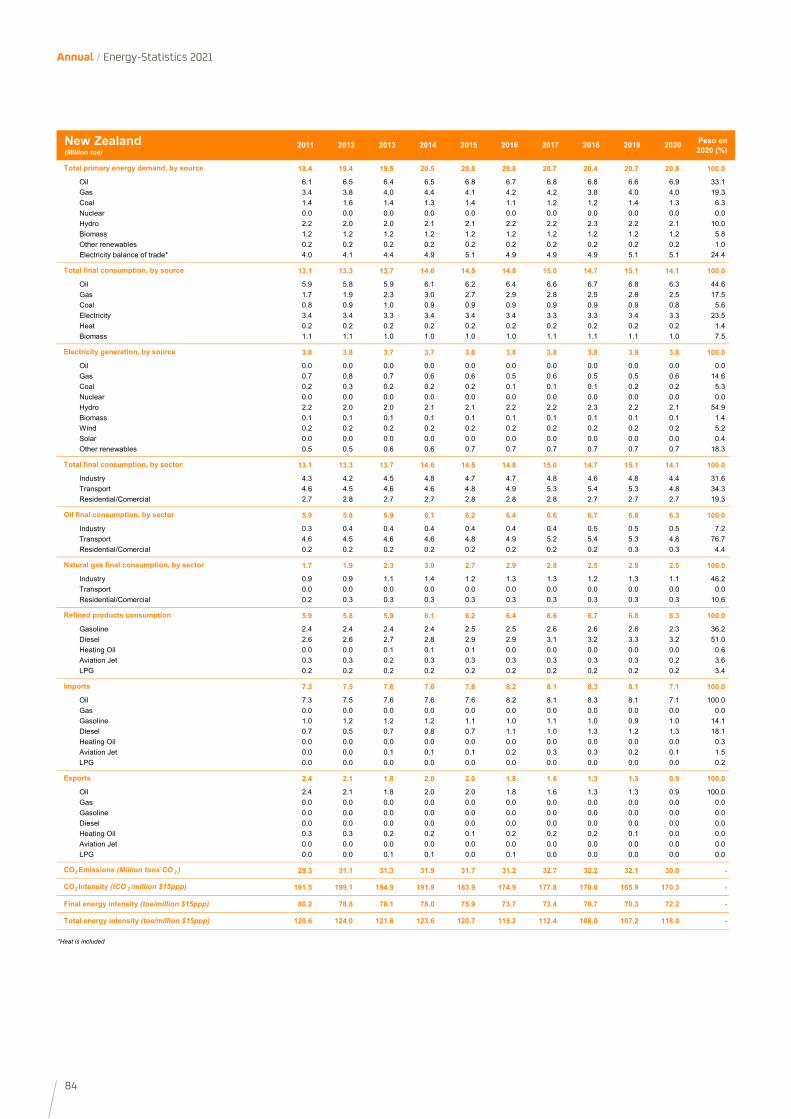
84
Annual / Energy-Statistics 2021
2011 2012 2013 2014 2015 2016 2017 2018 2019 2020 Peso en 2020 (%)
18.4 19.4 19.5 20.5 20.8 20.6 20.7 20.4 20.7 20.8 100.0
Oil 6.1 6.5 6.4 6.5 6.8 6.7 6.8 6.8 6.6 6.9 33.1Gas 3.4 3.8 4.0 4.4 4.1 4.2 4.2 3.8 4.0 4.0 19.3Coal 1.4 1.6 1.4 1.3 1.4 1.1 1.2 1.2 1.4 1.3 6.3Nuclear 0.0 0.0 0.0 0.0 0.0 0.0 0.0 0.0 0.0 0.0 0.0Hydro 2.2 2.0 2.0 2.1 2.1 2.2 2.2 2.3 2.2 2.1 10.0Biomass 1.2 1.2 1.2 1.2 1.2 1.2 1.2 1.2 1.2 1.2 5.8Other renewables 0.2 0.2 0.2 0.2 0.2 0.2 0.2 0.2 0.2 0.2 1.0Electricity balance of trade* 4.0 4.1 4.4 4.9 5.1 4.9 4.9 4.9 5.1 5.1 24.4
13.1 13.3 13.7 14.6 14.5 14.8 15.0 14.7 15.1 14.1 100.0
Oil 5.9 5.8 5.9 6.1 6.2 6.4 6.6 6.7 6.8 6.3 44.6Gas 1.7 1.9 2.3 3.0 2.7 2.9 2.8 2.5 2.8 2.5 17.5Coal 0.8 0.9 1.0 0.9 0.9 0.9 0.9 0.9 0.9 0.8 5.6Electricity 3.4 3.4 3.3 3.4 3.4 3.4 3.3 3.3 3.4 3.3 23.5Heat 0.2 0.2 0.2 0.2 0.2 0.2 0.2 0.2 0.2 0.2 1.4Biomass 1.1 1.1 1.0 1.0 1.0 1.0 1.1 1.1 1.1 1.0 7.5
3.8 3.8 3.7 3.7 3.8 3.8 3.8 3.8 3.9 3.8 100.0
Oil 0.0 0.0 0.0 0.0 0.0 0.0 0.0 0.0 0.0 0.0 0.0Gas 0.7 0.8 0.7 0.6 0.6 0.5 0.6 0.5 0.5 0.6 14.6Coal 0.2 0.3 0.2 0.2 0.2 0.1 0.1 0.1 0.2 0.2 5.3Nuclear 0.0 0.0 0.0 0.0 0.0 0.0 0.0 0.0 0.0 0.0 0.0Hydro 2.2 2.0 2.0 2.1 2.1 2.2 2.2 2.3 2.2 2.1 54.9Biomass 0.1 0.1 0.1 0.1 0.1 0.1 0.1 0.1 0.1 0.1 1.4Wind 0.2 0.2 0.2 0.2 0.2 0.2 0.2 0.2 0.2 0.2 5.2Solar 0.0 0.0 0.0 0.0 0.0 0.0 0.0 0.0 0.0 0.0 0.4Other renewables 0.5 0.5 0.6 0.6 0.7 0.7 0.7 0.7 0.7 0.7 18.3
13.1 13.3 13.7 14.6 14.5 14.8 15.0 14.7 15.1 14.1 100.0
Industry 4.3 4.2 4.5 4.8 4.7 4.7 4.8 4.6 4.8 4.4 31.6Transport 4.6 4.5 4.6 4.6 4.8 4.9 5.3 5.4 5.3 4.8 34.3Residential/Comercial 2.7 2.8 2.7 2.7 2.8 2.8 2.8 2.7 2.7 2.7 19.3
5.9 5.8 5.9 6.1 6.2 6.4 6.6 6.7 6.8 6.3 100.0
Industry 0.3 0.4 0.4 0.4 0.4 0.4 0.4 0.5 0.5 0.5 7.2Transport 4.6 4.5 4.6 4.6 4.8 4.9 5.2 5.4 5.3 4.8 76.7Residential/Comercial 0.2 0.2 0.2 0.2 0.2 0.2 0.2 0.2 0.3 0.3 4.4
1.7 1.9 2.3 3.0 2.7 2.9 2.8 2.5 2.8 2.5 100.0
Industry 0.9 0.9 1.1 1.4 1.2 1.3 1.3 1.2 1.3 1.1 46.2Transport 0.0 0.0 0.0 0.0 0.0 0.0 0.0 0.0 0.0 0.0 0.0Residential/Comercial 0.2 0.3 0.3 0.3 0.3 0.3 0.3 0.3 0.3 0.3 10.6
5.9 5.8 5.9 6.1 6.2 6.4 6.6 6.7 6.8 6.3 100.0
Gasoline 2.4 2.4 2.4 2.4 2.5 2.5 2.6 2.6 2.6 2.3 36.2Diesel 2.6 2.6 2.7 2.8 2.9 2.9 3.1 3.2 3.3 3.2 51.0Heating Oil 0.0 0.0 0.1 0.1 0.1 0.0 0.0 0.0 0.0 0.0 0.6Aviation Jet 0.3 0.3 0.2 0.3 0.3 0.3 0.3 0.3 0.3 0.2 3.6LPG 0.2 0.2 0.2 0.2 0.2 0.2 0.2 0.2 0.2 0.2 3.4
7.3 7.5 7.6 7.6 7.6 8.2 8.1 8.3 8.1 7.1 100.0
Oil 7.3 7.5 7.6 7.6 7.6 8.2 8.1 8.3 8.1 7.1 100.0Gas 0.0 0.0 0.0 0.0 0.0 0.0 0.0 0.0 0.0 0.0 0.0Gasoline 1.0 1.2 1.2 1.2 1.1 1.0 1.1 1.0 0.9 1.0 14.1Diesel 0.7 0.5 0.7 0.8 0.7 1.1 1.0 1.3 1.2 1.3 18.1Heating Oil 0.0 0.0 0.0 0.0 0.0 0.0 0.0 0.0 0.0 0.0 0.3Aviation Jet 0.0 0.0 0.1 0.1 0.1 0.2 0.3 0.3 0.2 0.1 1.5LPG 0.0 0.0 0.0 0.0 0.0 0.0 0.0 0.0 0.0 0.0 0.2
2.4 2.1 1.8 2.0 2.0 1.8 1.6 1.3 1.3 0.9 100.0
Oil 2.4 2.1 1.8 2.0 2.0 1.8 1.6 1.3 1.3 0.9 100.0Gas 0.0 0.0 0.0 0.0 0.0 0.0 0.0 0.0 0.0 0.0 0.0Gasoline 0.0 0.0 0.0 0.0 0.0 0.0 0.0 0.0 0.0 0.0 0.0Diesel 0.0 0.0 0.0 0.0 0.0 0.0 0.0 0.0 0.0 0.0 0.0Heating Oil 0.3 0.3 0.2 0.2 0.1 0.2 0.2 0.2 0.1 0.0 0.0Aviation Jet 0.0 0.0 0.0 0.0 0.0 0.0 0.0 0.0 0.0 0.0 0.0LPG 0.0 0.0 0.1 0.1 0.0 0.1 0.0 0.0 0.0 0.0 0.0
29.3 31.1 31.3 31.9 31.7 31.2 32.7 32.2 32.1 30.0 -
191.5 199.1 194.9 191.9 183.9 174.9 177.8 170.0 165.9 170.3 -
80.2 78.8 78.1 78.0 75.9 73.7 73.4 70.7 70.3 72.2 -
120.6 124.0 121.6 123.6 120.7 115.2 112.4 108.0 107.2 118.0 -
*Heat is included
Final energy intensity (toe/million $15ppp)
Total energy intensity (toe/million $15ppp)
Natural gas final consumption, by sector
Refined products consumption
Imports
Exports
CO2 Emissions (Million tons CO 2 )
CO2 Intensity (tCO 2 /million $15ppp)
Oil final consumption, by sector
New Zealand(Million toe)
Total primary energy demand, by source
Total final consumption, by source
Electricity generation, by source
Total final consumption, by sector
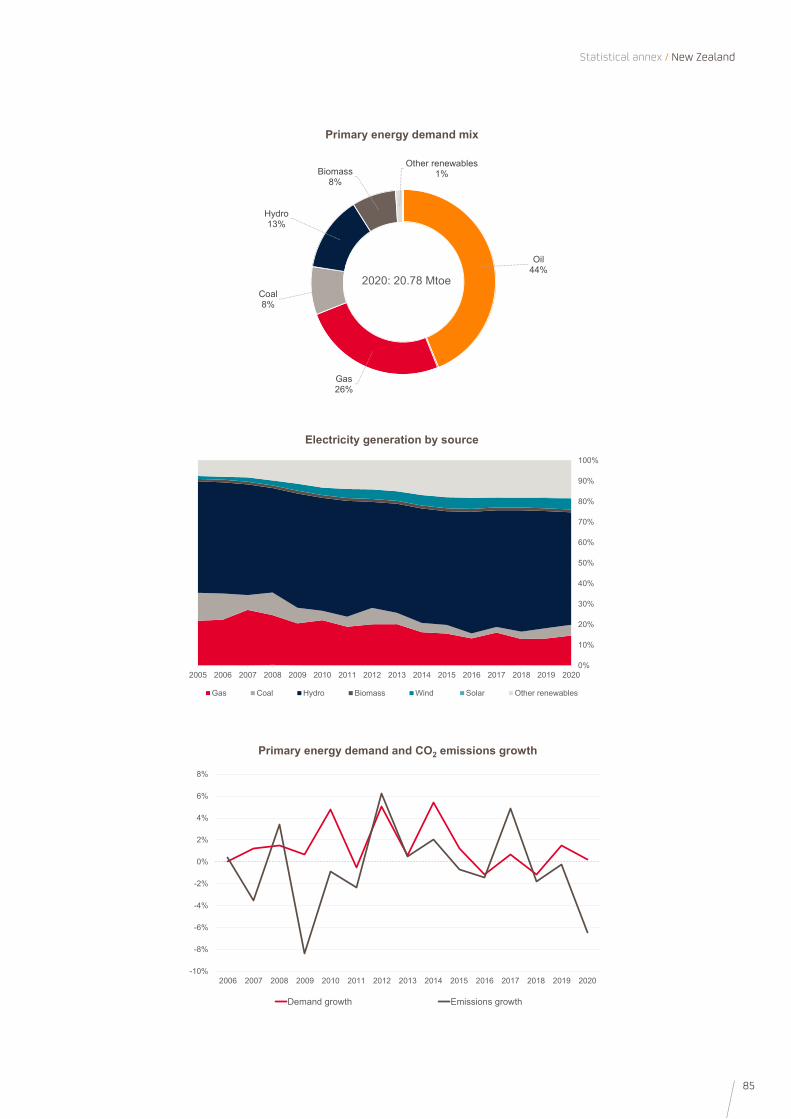
85
Statistical annex / New Zealand
0%
10%
20%
30%
40%
50%
60%
70%
80%
90%
100%
2005 2006 2007 2008 2009 2010 2011 2012 2013 2014 2015 2016 2017 2018 2019 2020
Gas Coal Hydro Biomass Wind Solar Other renewables
Electricity generation by source
-10%
-8%
-6%
-4%
-2%
0%
2%
4%
6%
8%
2006 2007 2008 2009 2010 2011 2012 2013 2014 2015 2016 2017 2018 2019 2020
Demand growth Emissions growth
Primary energy demand and CO2 emissions growth
Oil 44%
Gas26%
Coal8%
Hydro13%
Biomass8%
Other renewables1%
2020: 20.78 Mtoe
Primary energy demand mix
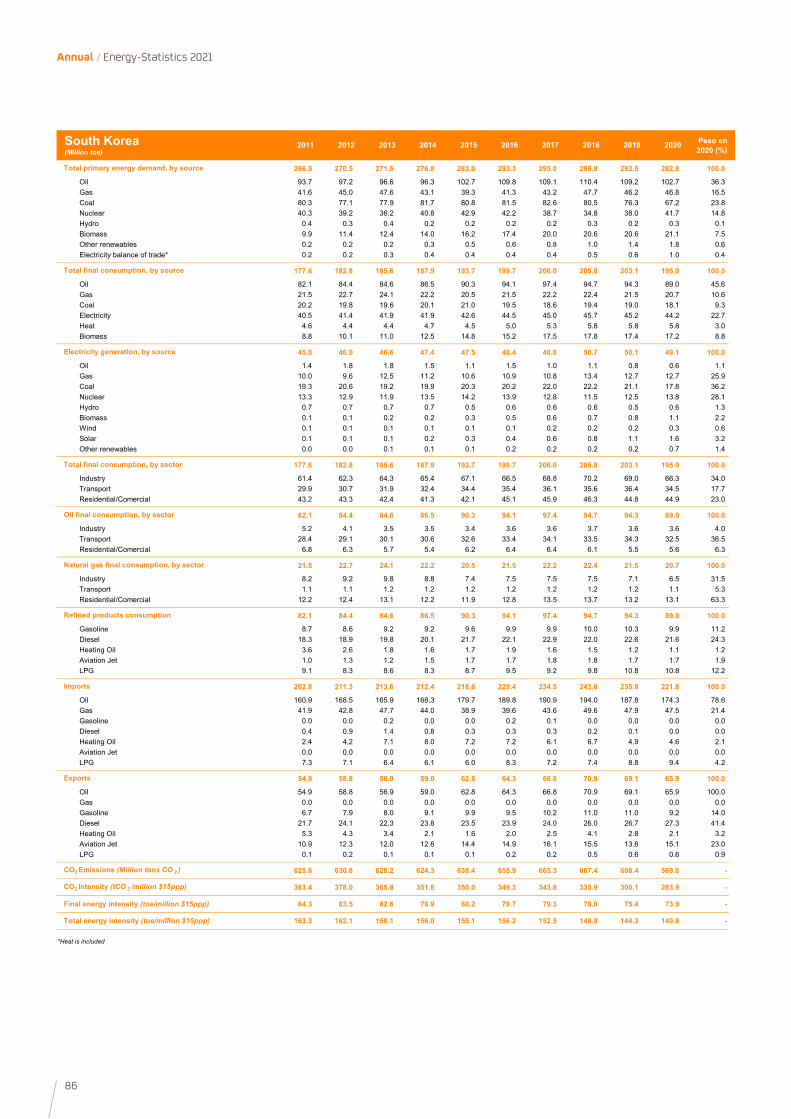
86
Annual / Energy-Statistics 2021
2011 2012 2013 2014 2015 2016 2017 2018 2019 2020 Peso en 2020 (%)
266.5 270.5 271.5 276.8 283.0 293.3 295.0 295.8 292.5 282.8 100.0
Oil 93.7 97.2 96.6 96.3 102.7 109.8 109.1 110.4 109.2 102.7 36.3Gas 41.6 45.0 47.6 43.1 39.3 41.3 43.2 47.7 46.2 46.8 16.5Coal 80.3 77.1 77.9 81.7 80.8 81.5 82.6 80.5 76.3 67.2 23.8Nuclear 40.3 39.2 36.2 40.8 42.9 42.2 38.7 34.8 38.0 41.7 14.8Hydro 0.4 0.3 0.4 0.2 0.2 0.2 0.2 0.3 0.2 0.3 0.1Biomass 9.9 11.4 12.4 14.0 16.2 17.4 20.0 20.6 20.6 21.1 7.5Other renewables 0.2 0.2 0.2 0.3 0.5 0.6 0.8 1.0 1.4 1.8 0.6Electricity balance of trade* 0.2 0.2 0.3 0.4 0.4 0.4 0.4 0.5 0.6 1.0 0.4
177.6 182.8 185.6 187.9 193.7 199.7 206.0 205.8 203.1 195.0 100.0
Oil 82.1 84.4 84.6 86.5 90.3 94.1 97.4 94.7 94.3 89.0 45.6Gas 21.5 22.7 24.1 22.2 20.5 21.5 22.2 22.4 21.5 20.7 10.6Coal 20.2 19.8 19.6 20.1 21.0 19.5 18.6 19.4 19.0 18.1 9.3Electricity 40.5 41.4 41.9 41.9 42.6 44.5 45.0 45.7 45.2 44.2 22.7Heat 4.6 4.4 4.4 4.7 4.5 5.0 5.3 5.8 5.8 5.8 3.0Biomass 8.8 10.1 11.0 12.5 14.8 15.2 17.5 17.8 17.4 17.2 8.8
45.0 46.0 46.6 47.4 47.5 48.4 48.8 50.7 50.1 49.1 100.0
Oil 1.4 1.8 1.8 1.5 1.1 1.5 1.0 1.1 0.8 0.6 1.1Gas 10.0 9.6 12.5 11.2 10.6 10.9 10.8 13.4 12.7 12.7 25.9Coal 19.3 20.6 19.2 19.9 20.3 20.2 22.0 22.2 21.1 17.8 36.2Nuclear 13.3 12.9 11.9 13.5 14.2 13.9 12.8 11.5 12.5 13.8 28.1Hydro 0.7 0.7 0.7 0.7 0.5 0.6 0.6 0.6 0.5 0.6 1.3Biomass 0.1 0.1 0.2 0.2 0.3 0.5 0.6 0.7 0.8 1.1 2.2Wind 0.1 0.1 0.1 0.1 0.1 0.1 0.2 0.2 0.2 0.3 0.6Solar 0.1 0.1 0.1 0.2 0.3 0.4 0.6 0.8 1.1 1.6 3.2Other renewables 0.0 0.0 0.1 0.1 0.1 0.2 0.2 0.2 0.2 0.7 1.4
177.6 182.8 185.6 187.9 193.7 199.7 206.0 205.8 203.1 195.0 100.0
Industry 61.4 62.3 64.3 65.4 67.1 66.5 68.8 70.2 69.0 66.3 34.0Transport 29.9 30.7 31.9 32.4 34.4 35.4 36.1 35.6 36.4 34.5 17.7Residential/Comercial 43.2 43.3 42.4 41.3 42.1 45.1 45.9 46.3 44.8 44.9 23.0
82.1 84.4 84.6 86.5 90.3 94.1 97.4 94.7 94.3 89.0 100.0
Industry 5.2 4.1 3.5 3.5 3.4 3.6 3.6 3.7 3.6 3.6 4.0Transport 28.4 29.1 30.1 30.6 32.6 33.4 34.1 33.5 34.3 32.5 36.5Residential/Comercial 6.8 6.3 5.7 5.4 6.2 6.4 6.4 6.1 5.5 5.6 6.3
21.5 22.7 24.1 22.2 20.5 21.5 22.2 22.4 21.5 20.7 100.0
Industry 8.2 9.2 9.8 8.8 7.4 7.5 7.5 7.5 7.1 6.5 31.5Transport 1.1 1.1 1.2 1.2 1.2 1.2 1.2 1.2 1.2 1.1 5.3Residential/Comercial 12.2 12.4 13.1 12.2 11.9 12.8 13.5 13.7 13.2 13.1 63.3
82.1 84.4 84.6 86.5 90.3 94.1 97.4 94.7 94.3 89.0 100.0
Gasoline 8.7 8.6 9.2 9.2 9.6 9.9 9.9 10.0 10.3 9.9 11.2Diesel 18.3 18.9 19.8 20.1 21.7 22.1 22.9 22.0 22.6 21.6 24.3Heating Oil 3.6 2.6 1.8 1.6 1.7 1.9 1.6 1.5 1.2 1.1 1.2Aviation Jet 1.0 1.3 1.2 1.5 1.7 1.7 1.8 1.8 1.7 1.7 1.9LPG 9.1 8.3 8.6 8.3 8.7 9.5 9.2 9.8 10.8 10.8 12.2
202.8 211.3 213.6 212.4 218.6 229.4 234.5 243.6 235.8 221.8 100.0
Oil 160.9 168.5 165.9 168.3 179.7 189.8 190.9 194.0 187.8 174.3 78.6Gas 41.9 42.8 47.7 44.0 38.9 39.6 43.6 49.6 47.9 47.5 21.4Gasoline 0.0 0.0 0.2 0.0 0.0 0.2 0.1 0.0 0.0 0.0 0.0Diesel 0.4 0.9 1.4 0.8 0.3 0.3 0.3 0.2 0.1 0.0 0.0Heating Oil 2.4 4.2 7.1 8.0 7.2 7.2 6.1 6.7 4.9 4.6 2.1Aviation Jet 0.0 0.0 0.0 0.0 0.0 0.0 0.0 0.0 0.0 0.0 0.0LPG 7.3 7.1 6.4 6.1 6.0 8.3 7.2 7.4 8.8 9.4 4.2
54.9 58.8 56.9 59.0 62.8 64.3 66.8 70.9 69.1 65.9 100.0
Oil 54.9 58.8 56.9 59.0 62.8 64.3 66.8 70.9 69.1 65.9 100.0Gas 0.0 0.0 0.0 0.0 0.0 0.0 0.0 0.0 0.0 0.0 0.0Gasoline 6.7 7.9 8.0 9.1 9.9 9.5 10.2 11.0 11.0 9.2 14.0Diesel 21.7 24.1 22.3 23.8 23.5 23.9 24.0 26.0 26.7 27.3 41.4Heating Oil 5.3 4.3 3.4 2.1 1.6 2.0 2.5 4.1 2.8 2.1 3.2Aviation Jet 10.9 12.3 12.0 12.6 14.4 14.9 16.1 15.5 13.6 15.1 23.0LPG 0.1 0.2 0.1 0.1 0.1 0.2 0.2 0.5 0.6 0.6 0.9
625.6 630.8 628.2 624.3 638.4 655.9 665.3 667.4 608.4 569.8 -
383.4 378.0 365.8 351.8 350.0 349.3 343.8 335.9 300.1 283.9 -
84.3 83.5 82.6 79.9 80.2 79.7 79.3 78.0 75.4 73.9 -
163.3 162.1 158.1 156.0 155.1 156.2 152.5 148.9 144.3 140.9 -
*Heat is included
Final energy intensity (toe/million $15ppp)
Total energy intensity (toe/million $15ppp)
Natural gas final consumption, by sector
Refined products consumption
Imports
Exports
CO2 Emissions (Million tons CO 2 )
CO2 Intensity (tCO 2 /million $15ppp)
Oil final consumption, by sector
South Korea(Million toe)
Total primary energy demand, by source
Total final consumption, by source
Electricity generation, by source
Total final consumption, by sector
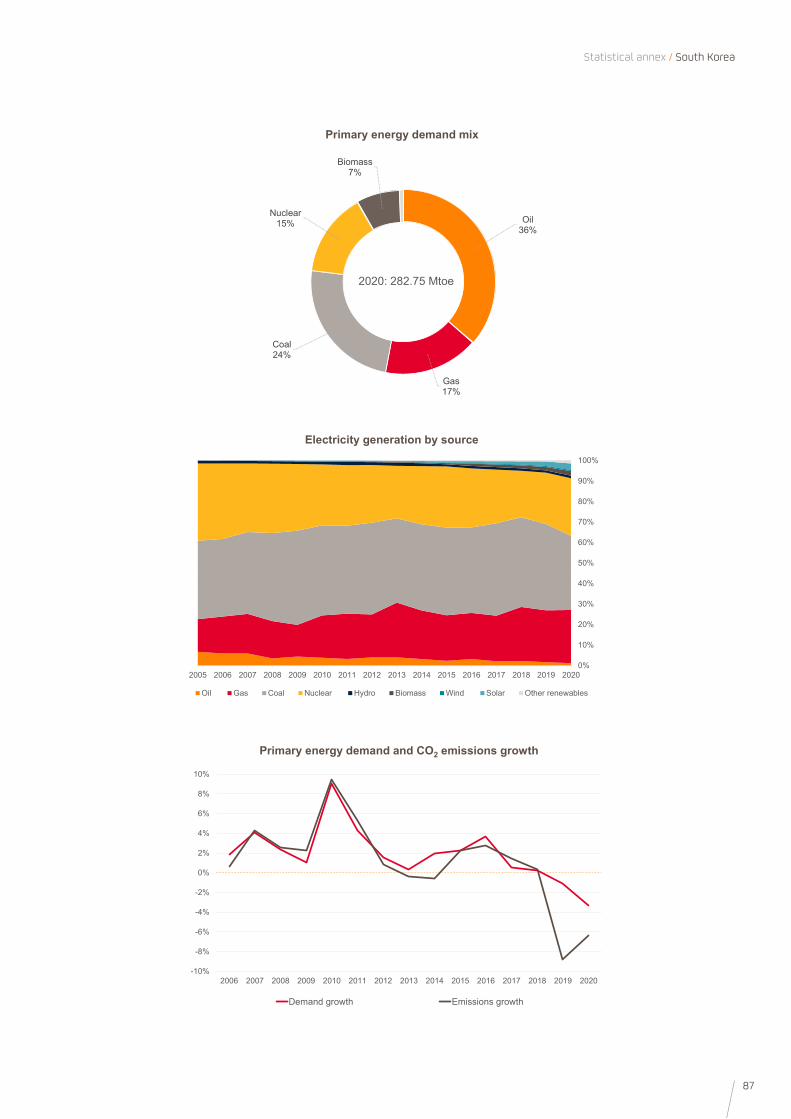
87
Statistical annex / South Korea
0%
10%
20%
30%
40%
50%
60%
70%
80%
90%
100%
2005 2006 2007 2008 2009 2010 2011 2012 2013 2014 2015 2016 2017 2018 2019 2020
Oil Gas Coal Nuclear Hydro Biomass Wind Solar Other renewables
Electricity generation by source
-10%
-8%
-6%
-4%
-2%
0%
2%
4%
6%
8%
10%
2006 2007 2008 2009 2010 2011 2012 2013 2014 2015 2016 2017 2018 2019 2020
Demand growth Emissions growth
Primary energy demand and CO2 emissions growth
Oil 36%
Gas17%
Coal24%
Nuclear15%
Biomass7%
2020: 282.75 Mtoe
Primary energy demand mix

88
Annual / Energy-Statistics 2021
2011 2012 2013 2014 2015 2016 2017 2018 2019 2020 Peso en 2020 (%)
105.5 105.0 106.9 109.1 106.9 108.6 107.4 110.3 107.6 105.5 100.0
Oil 41.4 40.9 42.0 42.8 43.0 43.6 43.0 43.1 40.0 39.2 37.2Gas 13.1 13.7 13.7 14.5 15.6 16.3 17.9 18.1 17.8 19.3 18.3Coal 37.7 37.5 37.9 38.5 36.5 38.1 38.3 39.5 38.7 36.2 34.3Nuclear 11.0 10.5 10.9 11.0 9.5 8.3 5.8 7.2 8.4 8.2 7.8Hydro 0.3 0.5 0.5 0.4 0.4 0.6 0.5 0.4 0.5 0.3 0.2Biomass 1.6 1.7 1.7 1.6 1.6 1.5 1.5 1.5 1.5 1.5 1.4Other renewables 0.1 0.1 0.2 0.2 0.2 0.2 0.3 0.4 0.5 0.7 0.7Electricity balance of trade* 0.1 0.1 0.1 0.1 0.1 0.1 0.1 0.1 0.1 0.1 0.1
70.1 69.9 72.6 73.8 73.5 74.3 73.6 74.8 72.4 73.0 100.0
Oil 37.4 37.3 38.8 39.1 39.3 39.3 38.6 39.2 36.9 37.1 50.8Gas 2.2 2.4 2.5 2.7 2.8 3.0 3.2 3.5 3.6 3.7 5.1Coal 9.5 9.1 10.0 10.1 9.6 9.9 9.4 8.6 8.6 8.4 11.5Electricity 19.2 19.1 19.5 20.0 19.9 20.3 20.8 21.3 21.2 21.7 29.7Heat 1.4 1.5 1.4 1.4 1.3 1.3 1.3 1.9 1.8 1.8 2.4Biomass 0.5 0.5 0.5 0.5 0.5 0.4 0.4 0.4 0.4 0.4 0.5
21.7 21.5 21.7 22.4 22.2 22.7 23.2 23.7 23.6 24.1 100.0
Oil 0.8 0.7 0.6 0.7 1.0 1.0 1.1 0.7 0.5 0.4 1.6Gas 5.5 5.7 5.9 6.3 6.8 7.2 7.9 7.9 7.8 8.6 35.7Coal 10.7 10.5 10.5 10.6 10.1 10.4 11.0 11.3 10.9 10.8 44.9Nuclear 3.6 3.5 3.6 3.6 3.1 2.7 1.9 2.4 2.8 2.7 11.2Hydro 0.6 0.7 0.7 0.6 0.6 0.8 0.8 0.7 0.8 0.5 2.2Biomass 0.3 0.3 0.3 0.3 0.3 0.3 0.3 0.3 0.3 0.3 1.3Wind 0.1 0.1 0.1 0.1 0.1 0.1 0.1 0.1 0.2 0.2 0.9Solar 0.0 0.0 0.0 0.0 0.1 0.1 0.1 0.2 0.3 0.5 2.2Other renewables -0.0 0.0 0.0 -0.0 0.0 0.0 0.0 0.0 0.0 0.0 0.0
70.1 69.9 72.6 73.8 73.5 74.3 73.6 74.8 72.4 73.0 100.0
Industry 26.7 26.1 27.0 27.3 26.3 26.7 26.6 27.1 26.6 26.6 36.5Transport 12.1 11.8 11.8 12.0 12.3 12.6 12.5 12.3 12.4 12.4 17.0Residential/Comercial 10.9 10.7 10.7 10.9 11.0 11.3 11.3 11.1 11.0 11.3 15.5
37.4 37.3 38.8 39.1 39.3 39.3 38.6 39.2 36.9 37.1 100.0
Industry 3.7 3.1 2.8 2.5 2.0 1.8 1.8 1.6 1.3 1.1 2.9Transport 12.0 11.7 11.7 11.8 12.2 12.5 12.4 12.1 12.2 12.3 33.1Residential/Comercial 1.8 1.8 1.8 1.7 1.7 1.7 1.7 1.7 1.6 1.7 4.6
2.2 2.4 2.5 2.7 2.8 3.0 3.2 3.5 3.6 3.7 100.0
Industry 1.2 1.5 1.6 1.8 1.9 2.0 2.3 2.5 2.6 2.7 71.9Transport 0.0 0.0 0.0 0.0 0.0 0.0 0.0 0.0 0.0 0.0 0.0Residential/Comercial 1.0 0.9 0.9 1.0 0.9 1.0 1.0 1.0 1.0 1.0 26.8
37.4 37.3 38.8 39.1 39.3 39.3 38.6 39.2 36.9 37.1 100.0
Gasoline 7.7 7.5 7.5 7.6 7.9 8.2 8.0 7.8 7.8 7.9 21.4Diesel 4.7 4.6 4.6 4.7 4.7 4.8 4.7 4.7 4.8 4.9 13.1Heating Oil 3.8 3.2 2.9 2.5 2.1 1.9 1.8 1.6 1.2 1.0 2.6Aviation Jet 0.2 0.2 0.2 0.2 0.3 0.2 0.3 0.2 0.2 0.2 0.5LPG 2.6 2.3 3.0 3.0 2.6 3.3 2.6 3.1 3.1 2.6 6.9
70.6 74.5 75.1 79.0 78.7 80.6 81.7 82.9 81.1 74.8 100.0
Oil 57.6 61.0 61.5 64.7 63.4 64.6 63.9 64.8 63.1 55.5 74.2Gas 12.9 13.5 13.5 14.3 15.3 16.0 17.8 18.2 18.0 19.3 25.8Gasoline 0.1 0.0 0.0 0.0 0.2 0.1 0.1 0.1 0.2 0.2 0.3Diesel 0.0 0.0 0.0 0.0 0.1 0.0 0.0 0.0 0.0 0.0 0.0Heating Oil 1.4 1.0 1.5 1.8 1.0 1.7 2.5 2.2 1.2 0.6 0.7Aviation Jet 0.0 0.0 0.0 0.0 0.2 0.2 0.1 0.1 0.0 0.1 0.1LPG 1.3 0.9 1.4 2.0 1.6 2.1 1.5 2.1 2.1 1.8 2.4
13.9 17.0 17.5 17.5 17.0 17.3 17.3 18.4 19.6 13.0 100.0
Oil 13.9 17.0 17.5 17.5 17.0 17.3 17.3 18.4 19.6 13.0 100.0Gas 0.0 0.0 0.0 0.0 0.0 0.0 0.0 0.0 0.0 0.0 0.0Gasoline 2.8 3.4 4.3 4.2 4.3 4.7 4.4 4.1 3.7 1.8 14.0Diesel 7.7 9.3 9.9 9.9 9.0 8.9 8.3 9.4 10.0 6.6 50.7Heating Oil 0.9 1.3 0.6 0.7 1.0 1.3 1.6 1.9 1.8 1.6 12.3Aviation Jet 1.1 1.3 1.3 1.0 1.0 0.9 0.8 1.0 0.9 0.8 6.1LPG 0.0 0.1 0.1 0.1 0.0 0.0 0.0 0.1 0.0 0.0 0.3
259.9 255.5 257.4 264.5 265.1 268.5 275.8 271.7 261.2 257.1 -
540.0 520.1 512.6 506.4 503.4 502.8 502.0 481.3 450.5 443.3 -
105.0 100.6 100.2 97.7 95.6 96.2 93.0 90.7 87.5 88.1 -
219.1 213.8 212.9 208.8 202.9 203.5 195.5 195.4 185.5 181.8 -
*Heat is included
Final energy intensity (toe/million $15ppp)
Total energy intensity (toe/million $15ppp)
Natural gas final consumption, by sector
Refined products consumption
Imports
Exports
CO2 Emissions (Million tons CO 2 )
CO2 Intensity (tCO 2 /million $15ppp)
Oil final consumption, by sector
Taiwan(Million toe)
Total primary energy demand, by source
Total final consumption, by source
Electricity generation, by source
Total final consumption, by sector
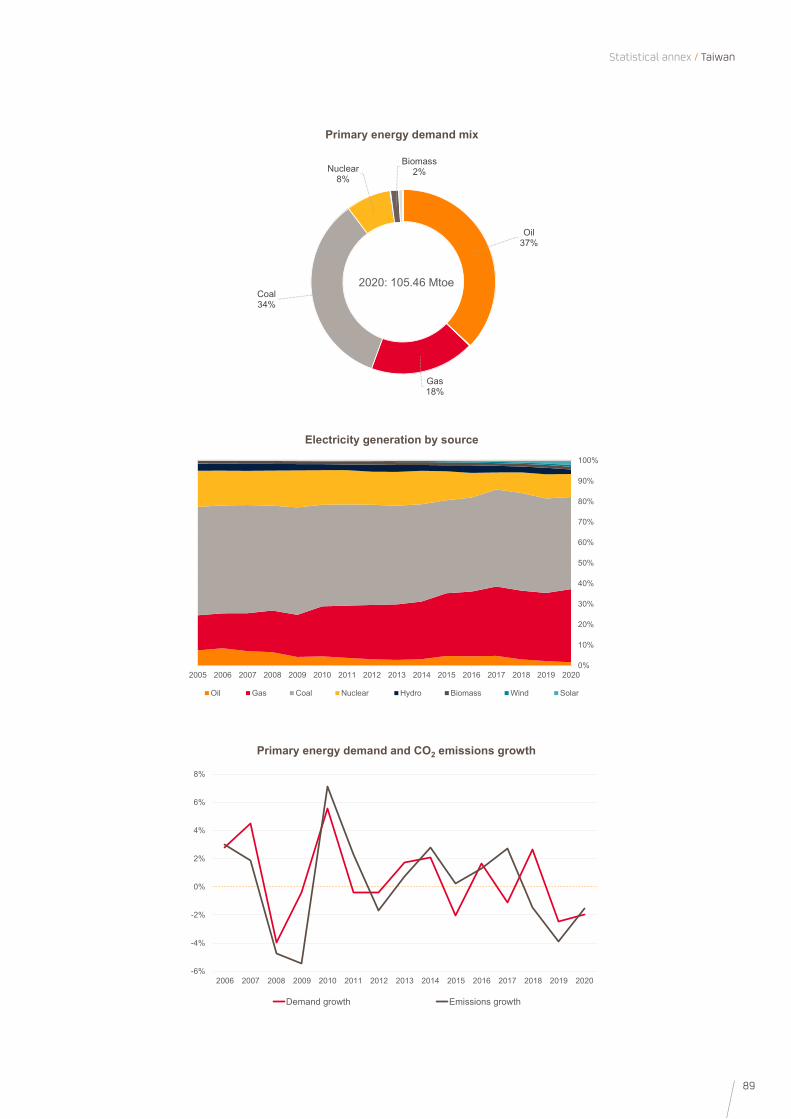
89
Statistical annex / Taiwan
0%
10%
20%
30%
40%
50%
60%
70%
80%
90%
100%
2005 2006 2007 2008 2009 2010 2011 2012 2013 2014 2015 2016 2017 2018 2019 2020
Oil Gas Coal Nuclear Hydro Biomass Wind Solar
Electricity generation by source
-6%
-4%
-2%
0%
2%
4%
6%
8%
2006 2007 2008 2009 2010 2011 2012 2013 2014 2015 2016 2017 2018 2019 2020
Demand growth Emissions growth
Primary energy demand and CO2 emissions growth
Oil 37%
Gas18%
Coal34%
Nuclear8%
Biomass2%
2020: 105.46 Mtoe
Primary energy demand mix

90
Annual / Energy-Statistics 2021
2011 2012 2013 2014 2015 2016 2017 2018 2019 2020 Peso en 2020 (%)
117.6 126.3 136.3 135.6 136.2 139.4 138.6 135.8 136.5 125.4 100.0
Oil 47.2 49.5 54.9 54.6 54.7 56.6 57.0 55.4 54.8 49.4 39.4Gas 30.8 35.2 37.9 37.8 37.8 36.9 36.0 35.5 36.1 33.0 26.4Coal 16.4 16.5 17.2 15.9 16.9 15.4 16.4 15.8 16.0 17.0 13.5Nuclear 0.0 0.0 0.0 0.0 0.0 0.0 0.0 0.0 0.0 0.0 0.0Hydro 0.7 0.8 0.5 0.5 0.3 0.3 0.4 0.7 0.5 0.4 0.3Biomass 21.8 23.5 24.7 25.7 25.3 28.2 26.3 25.7 26.4 22.5 17.9Other renewables 0.0 0.1 0.1 0.1 0.2 0.3 0.5 0.5 0.8 0.7 0.5Electricity balance of trade* 0.8 0.7 1.0 0.9 1.1 1.6 2.0 2.2 2.0 2.4 1.9
85.7 91.9 95.9 96.6 98.0 97.1 98.8 100.2 102.2 90.4 100.0
Oil 45.4 48.3 51.8 51.8 51.9 53.5 53.8 54.7 55.4 48.0 53.1Gas 5.8 6.1 7.1 7.4 7.1 7.1 6.9 7.2 7.0 5.5 6.1Coal 7.5 7.8 7.3 6.4 8.2 6.1 7.5 6.8 7.1 7.9 8.7Electricity 12.8 13.9 14.1 14.5 15.0 15.9 15.9 16.2 16.7 16.1 17.9Heat 0.0 0.0 0.0 0.0 0.0 0.0 0.0 0.0 0.0 0.0 0.0Biomass 14.2 15.7 15.5 16.5 15.9 14.5 14.7 15.3 16.0 12.9 14.3
13.4 14.3 14.6 14.8 15.2 16.1 15.6 15.7 16.5 15.6 100.0
Oil 0.2 0.2 0.1 0.1 0.1 0.0 0.0 0.0 0.0 0.0 0.1Gas 9.2 10.1 10.1 10.2 10.9 10.7 10.3 9.9 10.7 10.1 65.0Coal 3.0 2.9 3.2 3.2 3.0 3.2 3.1 3.1 3.1 3.0 19.4Nuclear 0.0 0.0 0.0 0.0 0.0 0.0 0.0 0.0 0.0 0.0 0.0Hydro 0.7 0.8 0.5 0.5 0.3 0.3 0.4 0.7 0.5 0.4 2.5Biomass 0.4 0.4 0.6 0.6 0.6 1.6 1.3 1.4 1.4 1.3 8.5Wind 0.0 0.0 0.0 0.0 0.0 0.0 0.1 0.1 0.3 0.3 1.7Solar 0.0 0.0 0.1 0.1 0.2 0.3 0.4 0.4 0.4 0.4 2.7Other renewables 0.0 0.0 0.0 0.0 0.0 0.0 0.0 0.0 0.0 -0.0 -0.0
85.7 91.9 95.9 96.6 98.0 97.1 98.8 100.2 102.2 90.4 100.0
Industry 25.1 28.2 28.4 30.6 31.1 30.2 30.4 30.2 30.9 28.4 31.4Transport 21.1 22.4 22.7 22.4 23.8 25.2 27.3 27.6 28.4 27.4 30.4Residential/Comercial 16.9 18.1 17.5 16.6 16.6 15.8 15.6 14.9 15.4 14.3 15.8
45.4 48.3 51.8 51.8 51.9 53.5 53.8 54.7 55.4 48.0 100.0
Industry 2.9 3.7 5.0 6.3 4.8 5.5 4.0 2.9 2.8 2.5 5.2Transport 18.5 19.2 19.0 18.4 19.8 21.3 23.6 23.9 24.7 24.1 50.3Residential/Comercial 3.1 3.6 2.8 2.6 2.5 2.5 2.5 2.5 2.5 2.4 5.0
5.8 6.1 7.1 7.4 7.1 7.1 6.9 7.2 7.0 5.5 100.0
Industry 2.2 2.4 2.4 2.4 3.0 3.2 3.2 3.4 3.5 3.1 55.8Transport 1.9 2.3 2.5 2.6 2.5 2.3 2.0 1.8 1.6 1.1 20.5Residential/Comercial 0.0 0.0 0.0 0.0 0.0 0.0 0.0 0.0 0.0 0.0 0.0
45.0 47.8 51.6 51.7 51.3 52.9 53.2 54.1 54.8 47.4 100.0
Gasoline 5.2 5.4 5.5 5.6 6.3 7.0 7.1 7.3 7.6 7.5 15.8Diesel 16.6 17.9 18.1 18.3 18.0 18.6 19.0 18.5 19.3 18.8 39.6Heating Oil 0.9 1.0 1.0 1.0 0.6 0.9 0.8 0.7 0.7 0.7 1.5Aviation Jet 0.5 0.5 0.6 0.6 0.9 0.9 1.0 0.9 0.9 0.3 0.7LPG 7.9 8.6 8.7 8.7 7.7 7.1 7.3 7.7 7.2 6.5 13.7
52.7 56.9 59.9 57.8 62.8 62.8 66.1 69.1 67.2 62.9 100.0
Oil 43.9 47.9 50.4 49.0 50.8 51.2 53.7 56.4 54.4 49.9 79.3Gas 8.8 9.0 9.5 8.9 12.0 11.6 12.4 12.6 12.8 13.1 20.7Gasoline 0.0 0.3 0.2 0.7 0.6 1.2 1.3 1.2 1.7 1.1 1.7Diesel 0.0 0.0 0.2 0.3 0.1 0.7 0.7 0.5 2.1 0.0 0.1Heating Oil 0.3 0.3 0.3 0.4 0.2 0.1 0.1 0.0 0.0 0.0 0.0Aviation Jet 0.0 0.0 0.0 0.0 0.0 0.1 0.0 0.0 0.3 0.1 0.2LPG 1.7 2.0 2.3 2.5 1.6 0.5 0.8 0.8 0.6 0.5 0.8
11.6 14.2 14.3 12.6 14.1 12.9 14.1 15.0 11.7 12.6 100.0
Oil 11.6 14.2 14.3 12.6 14.1 12.9 14.1 15.0 11.7 12.6 100.0Gas 0.0 0.0 0.0 0.0 0.0 0.0 0.0 0.0 0.0 0.0 0.0Gasoline 0.7 1.2 1.2 1.0 1.1 1.1 1.2 1.3 0.9 1.0 7.8Diesel 3.5 4.7 4.2 3.8 5.4 4.2 4.6 4.8 3.3 5.0 39.9Heating Oil 3.3 3.7 3.6 3.6 3.5 3.1 3.3 3.3 3.1 2.5 19.9Aviation Jet 1.0 0.6 1.2 1.0 1.2 0.4 0.6 0.8 0.7 0.5 4.4LPG 0.0 0.0 0.0 0.0 0.0 0.1 0.3 0.5 0.4 0.3 2.2
235.0 252.0 263.9 259.6 263.6 259.9 259.8 258.3 259.5 257.8 -
248.0 247.9 252.8 246.3 242.4 231.3 222.2 212.2 208.3 221.6 -
70.5 71.3 69.6 69.8 69.4 66.1 65.0 62.1 62.4 62.3 -
124.1 124.2 130.5 128.6 125.3 124.0 118.6 111.6 109.6 107.8 -
*Heat is included
Final energy intensity (toe/million $15ppp)
Total energy intensity (toe/million $15ppp)
Natural gas final consumption, by sector
Refined products consumption
Imports
Exports
CO2 Emissions (Million tons CO 2 )
CO2 Intensity (tCO 2 /million $15ppp)
Oil final consumption, by sector
Thailand(Million toe)
Total primary energy demand, by source
Total final consumption, by source
Electricity generation, by source
Total final consumption, by sector
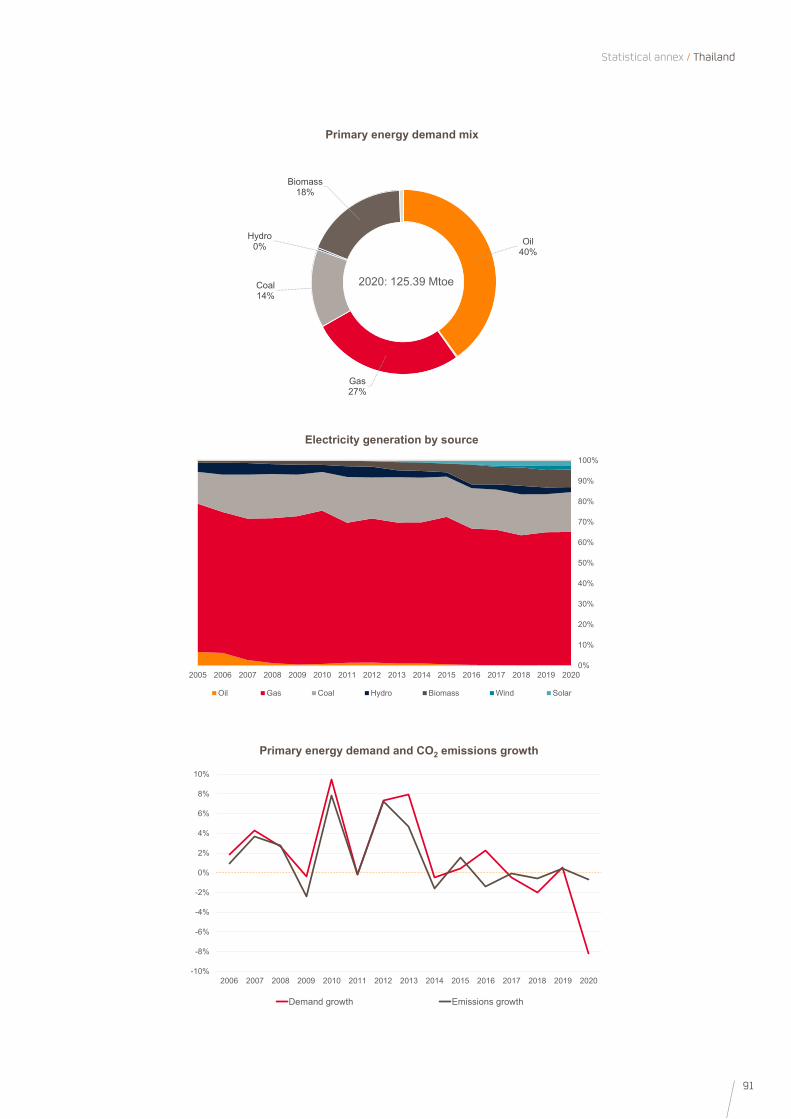
91
Statistical annex / Thailand
0%
10%
20%
30%
40%
50%
60%
70%
80%
90%
100%
2005 2006 2007 2008 2009 2010 2011 2012 2013 2014 2015 2016 2017 2018 2019 2020
Oil Gas Coal Hydro Biomass Wind Solar
Electricity generation by source
-10%
-8%
-6%
-4%
-2%
0%
2%
4%
6%
8%
10%
2006 2007 2008 2009 2010 2011 2012 2013 2014 2015 2016 2017 2018 2019 2020
Demand growth Emissions growth
Primary energy demand and CO2 emissions growth
Oil 40%
Gas27%
Coal14%
Hydro0%
Biomass18%
2020: 125.39 Mtoe
Primary energy demand mix
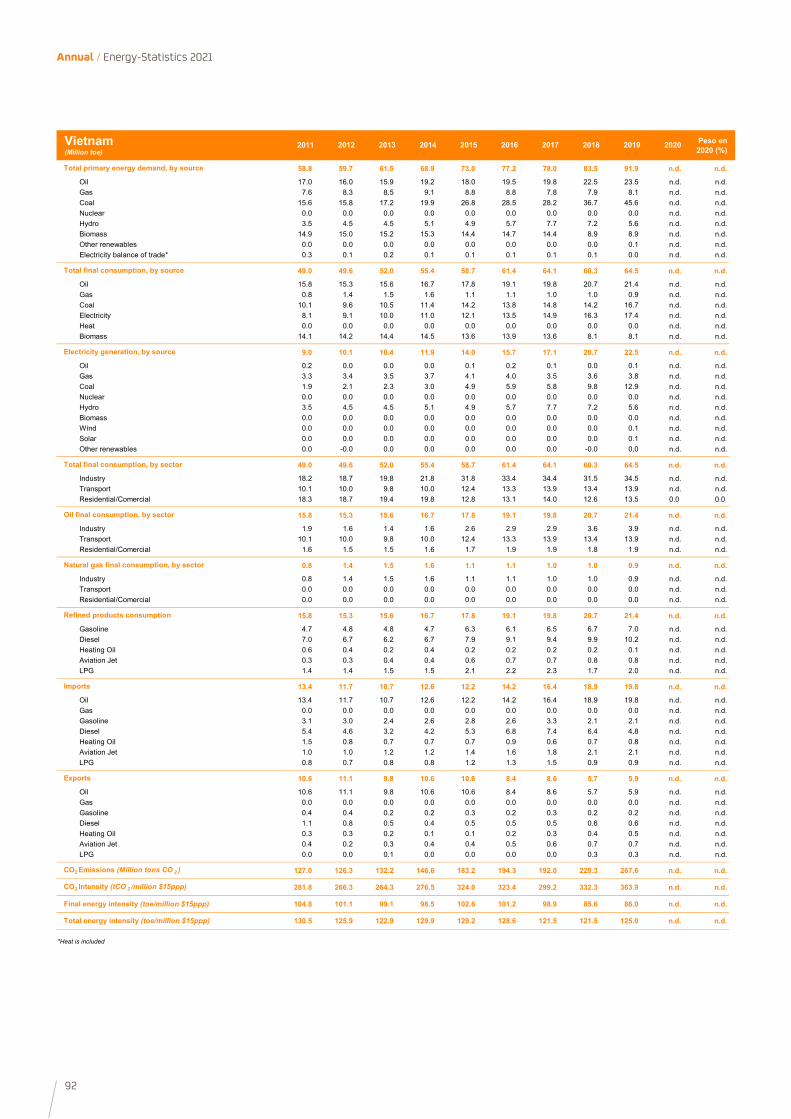
92
Annual / Energy-Statistics 2021
2011 2012 2013 2014 2015 2016 2017 2018 2019 2020 Peso en 2020 (%)
58.8 59.7 61.5 68.9 73.0 77.2 78.0 83.5 91.9 n.d. n.d.
Oil 17.0 16.0 15.9 19.2 18.0 19.5 19.8 22.5 23.5 n.d. n.d.Gas 7.6 8.3 8.5 9.1 8.8 8.8 7.8 7.9 8.1 n.d. n.d.Coal 15.6 15.8 17.2 19.9 26.8 28.5 28.2 36.7 45.6 n.d. n.d.Nuclear 0.0 0.0 0.0 0.0 0.0 0.0 0.0 0.0 0.0 n.d. n.d.Hydro 3.5 4.5 4.5 5.1 4.9 5.7 7.7 7.2 5.6 n.d. n.d.Biomass 14.9 15.0 15.2 15.3 14.4 14.7 14.4 8.9 8.9 n.d. n.d.Other renewables 0.0 0.0 0.0 0.0 0.0 0.0 0.0 0.0 0.1 n.d. n.d.Electricity balance of trade* 0.3 0.1 0.2 0.1 0.1 0.1 0.1 0.1 0.0 n.d. n.d.
49.0 49.6 52.0 55.4 58.7 61.4 64.1 60.3 64.5 n.d. n.d.
Oil 15.8 15.3 15.6 16.7 17.8 19.1 19.8 20.7 21.4 n.d. n.d.Gas 0.8 1.4 1.5 1.6 1.1 1.1 1.0 1.0 0.9 n.d. n.d.Coal 10.1 9.6 10.5 11.4 14.2 13.8 14.8 14.2 16.7 n.d. n.d.Electricity 8.1 9.1 10.0 11.0 12.1 13.5 14.9 16.3 17.4 n.d. n.d.Heat 0.0 0.0 0.0 0.0 0.0 0.0 0.0 0.0 0.0 n.d. n.d.Biomass 14.1 14.2 14.4 14.5 13.6 13.9 13.6 8.1 8.1 n.d. n.d.
9.0 10.1 10.4 11.9 14.0 15.7 17.1 20.7 22.5 n.d. n.d.
Oil 0.2 0.0 0.0 0.0 0.1 0.2 0.1 0.0 0.1 n.d. n.d.Gas 3.3 3.4 3.5 3.7 4.1 4.0 3.5 3.6 3.8 n.d. n.d.Coal 1.9 2.1 2.3 3.0 4.9 5.9 5.8 9.8 12.9 n.d. n.d.Nuclear 0.0 0.0 0.0 0.0 0.0 0.0 0.0 0.0 0.0 n.d. n.d.Hydro 3.5 4.5 4.5 5.1 4.9 5.7 7.7 7.2 5.6 n.d. n.d.Biomass 0.0 0.0 0.0 0.0 0.0 0.0 0.0 0.0 0.0 n.d. n.d.Wind 0.0 0.0 0.0 0.0 0.0 0.0 0.0 0.0 0.1 n.d. n.d.Solar 0.0 0.0 0.0 0.0 0.0 0.0 0.0 0.0 0.1 n.d. n.d.Other renewables 0.0 -0.0 0.0 0.0 0.0 0.0 0.0 -0.0 0.0 n.d. n.d.
49.0 49.6 52.0 55.4 58.7 61.4 64.1 60.3 64.5 n.d. n.d.
Industry 18.2 18.7 19.8 21.8 31.8 33.4 34.4 31.5 34.5 n.d. n.d.Transport 10.1 10.0 9.8 10.0 12.4 13.3 13.9 13.4 13.9 n.d. n.d.Residential/Comercial 18.3 18.7 19.4 19.8 12.8 13.1 14.0 12.6 13.5 0.0 0.0
15.8 15.3 15.6 16.7 17.8 19.1 19.8 20.7 21.4 n.d. n.d.
Industry 1.9 1.6 1.4 1.6 2.6 2.9 2.9 3.6 3.9 n.d. n.d.Transport 10.1 10.0 9.8 10.0 12.4 13.3 13.9 13.4 13.9 n.d. n.d.Residential/Comercial 1.6 1.5 1.5 1.6 1.7 1.9 1.9 1.8 1.9 n.d. n.d.
0.8 1.4 1.5 1.6 1.1 1.1 1.0 1.0 0.9 n.d. n.d.
Industry 0.8 1.4 1.5 1.6 1.1 1.1 1.0 1.0 0.9 n.d. n.d.Transport 0.0 0.0 0.0 0.0 0.0 0.0 0.0 0.0 0.0 n.d. n.d.Residential/Comercial 0.0 0.0 0.0 0.0 0.0 0.0 0.0 0.0 0.0 n.d. n.d.
15.8 15.3 15.6 16.7 17.8 19.1 19.8 20.7 21.4 n.d. n.d.
Gasoline 4.7 4.8 4.8 4.7 6.3 6.1 6.5 6.7 7.0 n.d. n.d.Diesel 7.0 6.7 6.2 6.7 7.9 9.1 9.4 9.9 10.2 n.d. n.d.Heating Oil 0.6 0.4 0.2 0.4 0.2 0.2 0.2 0.2 0.1 n.d. n.d.Aviation Jet 0.3 0.3 0.4 0.4 0.6 0.7 0.7 0.8 0.8 n.d. n.d.LPG 1.4 1.4 1.5 1.5 2.1 2.2 2.3 1.7 2.0 n.d. n.d.
13.4 11.7 10.7 12.6 12.2 14.2 16.4 18.9 19.8 n.d. n.d.
Oil 13.4 11.7 10.7 12.6 12.2 14.2 16.4 18.9 19.8 n.d. n.d.Gas 0.0 0.0 0.0 0.0 0.0 0.0 0.0 0.0 0.0 n.d. n.d.Gasoline 3.1 3.0 2.4 2.6 2.8 2.6 3.3 2.1 2.1 n.d. n.d.Diesel 5.4 4.6 3.2 4.2 5.3 6.8 7.4 6.4 4.8 n.d. n.d.Heating Oil 1.5 0.8 0.7 0.7 0.7 0.9 0.6 0.7 0.8 n.d. n.d.Aviation Jet 1.0 1.0 1.2 1.2 1.4 1.6 1.8 2.1 2.1 n.d. n.d.LPG 0.8 0.7 0.8 0.8 1.2 1.3 1.5 0.9 0.9 n.d. n.d.
10.6 11.1 9.8 10.6 10.6 8.4 8.6 5.7 5.9 n.d. n.d.
Oil 10.6 11.1 9.8 10.6 10.6 8.4 8.6 5.7 5.9 n.d. n.d.Gas 0.0 0.0 0.0 0.0 0.0 0.0 0.0 0.0 0.0 n.d. n.d.Gasoline 0.4 0.4 0.2 0.2 0.3 0.2 0.3 0.2 0.2 n.d. n.d.Diesel 1.1 0.8 0.5 0.4 0.5 0.5 0.5 0.6 0.6 n.d. n.d.Heating Oil 0.3 0.3 0.2 0.1 0.1 0.2 0.3 0.4 0.5 n.d. n.d.Aviation Jet 0.4 0.2 0.3 0.4 0.4 0.5 0.6 0.7 0.7 n.d. n.d.LPG 0.0 0.0 0.1 0.0 0.0 0.0 0.0 0.3 0.3 n.d. n.d.
127.0 126.3 132.2 146.6 183.2 194.3 192.0 228.3 267.6 n.d. n.d.
281.8 266.3 264.3 276.5 324.0 323.4 299.2 332.3 363.9 n.d. n.d.
104.8 101.1 99.1 98.5 102.6 101.2 98.9 85.6 86.0 n.d. n.d.
130.5 125.9 122.9 129.9 129.2 128.6 121.5 121.5 125.0 n.d. n.d.
*Heat is included
Final energy intensity (toe/million $15ppp)
Total energy intensity (toe/million $15ppp)
Natural gas final consumption, by sector
Refined products consumption
Imports
Exports
CO2 Emissions (Million tons CO 2 )
CO2 Intensity (tCO 2 /million $15ppp)
Oil final consumption, by sector
Vietnam(Million toe)
Total primary energy demand, by source
Total final consumption, by source
Electricity generation, by source
Total final consumption, by sector
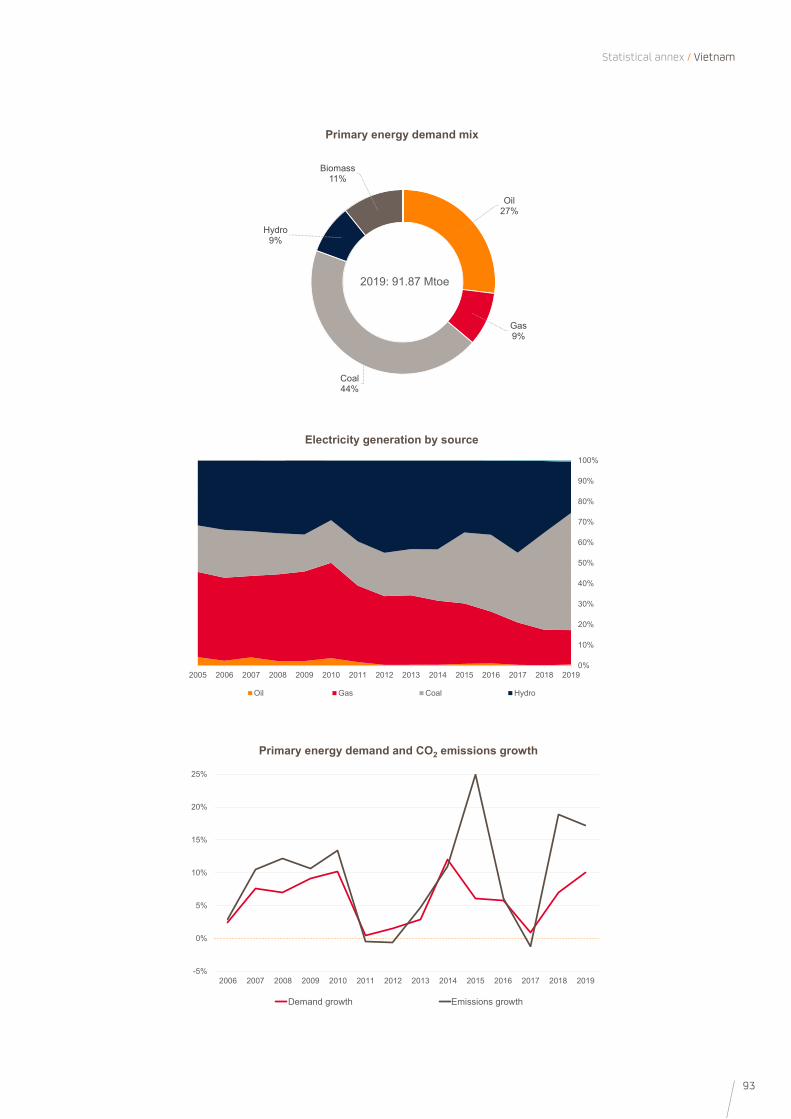
93
Statistical annex / Vietnam
0%
10%
20%
30%
40%
50%
60%
70%
80%
90%
100%
2005 2006 2007 2008 2009 2010 2011 2012 2013 2014 2015 2016 2017 2018 2019
Oil Gas Coal Hydro
Electricity generation by source
-5%
0%
5%
10%
15%
20%
25%
2006 2007 2008 2009 2010 2011 2012 2013 2014 2015 2016 2017 2018 2019
Demand growth Emissions growth
Primary energy demand and CO2 emissions growth
Oil 27%
Gas9%
Coal44%
Hydro9%
Biomass11%
2019: 91.87 Mtoe
Primary energy demand mix
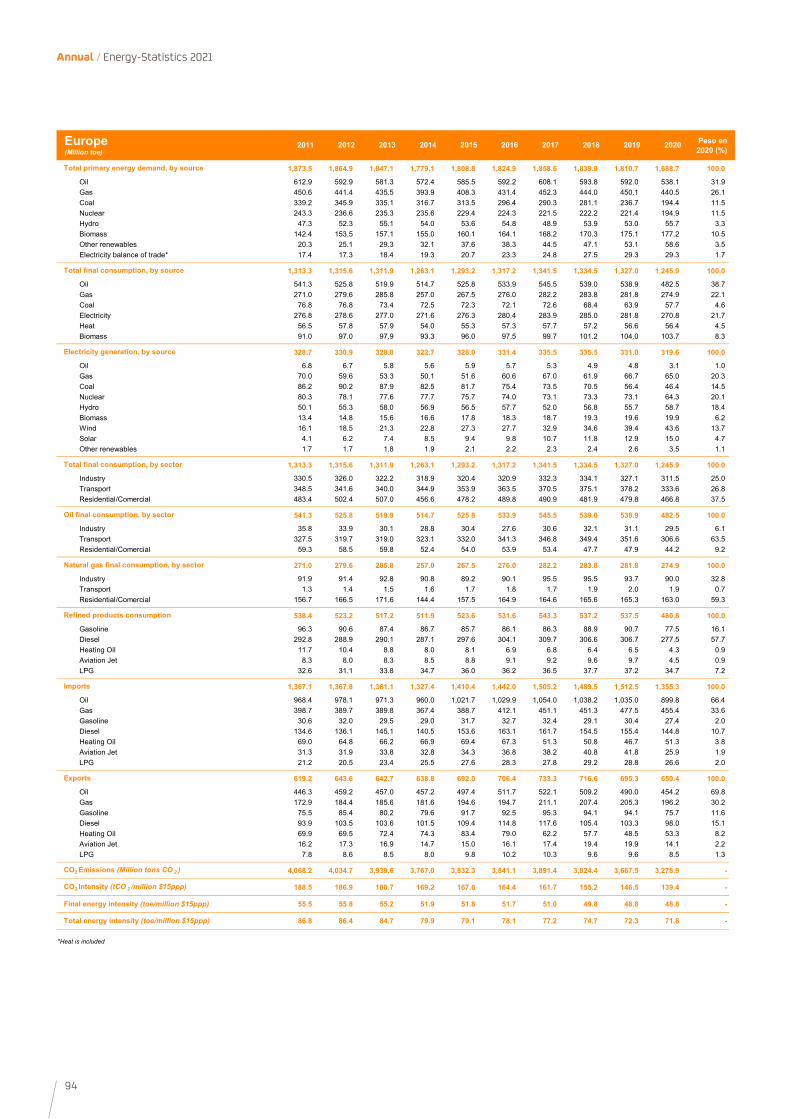
94
Annual / Energy-Statistics 2021
2011 2012 2013 2014 2015 2016 2017 2018 2019 2020 Peso en 2020 (%)
1,873.5 1,864.9 1,847.1 1,779.1 1,808.8 1,824.9 1,858.6 1,839.9 1,810.7 1,688.7 100.0
Oil 612.9 592.9 581.3 572.4 585.5 592.2 608.1 593.8 592.0 538.1 31.9Gas 450.6 441.4 435.5 393.9 408.3 431.4 452.3 444.0 450.1 440.5 26.1Coal 339.2 345.9 335.1 316.7 313.5 296.4 290.3 281.1 236.7 194.4 11.5Nuclear 243.3 236.6 235.3 235.6 229.4 224.3 221.5 222.2 221.4 194.9 11.5Hydro 47.3 52.3 55.1 54.0 53.6 54.8 48.9 53.9 53.0 55.7 3.3Biomass 142.4 153.5 157.1 155.0 160.1 164.1 168.2 170.3 175.1 177.2 10.5Other renewables 20.3 25.1 29.3 32.1 37.6 38.3 44.5 47.1 53.1 58.6 3.5Electricity balance of trade* 17.4 17.3 18.4 19.3 20.7 23.3 24.8 27.5 29.3 29.3 1.7
1,313.3 1,315.6 1,311.9 1,263.1 1,293.2 1,317.2 1,341.5 1,334.5 1,327.0 1,245.9 100.0
Oil 541.3 525.8 519.9 514.7 525.8 533.9 545.5 539.0 538.9 482.5 38.7Gas 271.0 279.6 285.8 257.0 267.5 276.0 282.2 283.8 281.8 274.9 22.1Coal 76.8 76.8 73.4 72.5 72.3 72.1 72.6 68.4 63.9 57.7 4.6Electricity 276.8 278.6 277.0 271.6 276.3 280.4 283.9 285.0 281.8 270.8 21.7Heat 56.5 57.8 57.9 54.0 55.3 57.3 57.7 57.2 56.6 56.4 4.5Biomass 91.0 97.0 97.9 93.3 96.0 97.5 99.7 101.2 104.0 103.7 8.3
328.7 330.9 328.8 322.7 328.0 331.4 335.5 335.5 331.0 319.6 100.0
Oil 6.8 6.7 5.8 5.6 5.9 5.7 5.3 4.9 4.8 3.1 1.0Gas 70.0 59.6 53.3 50.1 51.6 60.6 67.0 61.9 66.7 65.0 20.3Coal 86.2 90.2 87.9 82.5 81.7 75.4 73.5 70.5 56.4 46.4 14.5Nuclear 80.3 78.1 77.6 77.7 75.7 74.0 73.1 73.3 73.1 64.3 20.1Hydro 50.1 55.3 58.0 56.9 56.5 57.7 52.0 56.8 55.7 58.7 18.4Biomass 13.4 14.8 15.6 16.6 17.8 18.3 18.7 19.3 19.6 19.9 6.2Wind 16.1 18.5 21.3 22.8 27.3 27.7 32.9 34.6 39.4 43.6 13.7Solar 4.1 6.2 7.4 8.5 9.4 9.8 10.7 11.8 12.9 15.0 4.7Other renewables 1.7 1.7 1.8 1.9 2.1 2.2 2.3 2.4 2.6 3.5 1.1
1,313.3 1,315.6 1,311.9 1,263.1 1,293.2 1,317.2 1,341.5 1,334.5 1,327.0 1,245.9 100.0
Industry 330.5 326.0 322.2 318.9 320.4 320.9 332.3 334.1 327.1 311.5 25.0Transport 348.5 341.6 340.0 344.9 353.9 363.5 370.5 375.1 378.2 333.6 26.8Residential/Comercial 483.4 502.4 507.0 456.6 478.2 489.8 490.9 481.9 479.8 466.8 37.5
541.3 525.8 519.9 514.7 525.8 533.9 545.5 539.0 538.9 482.5 100.0
Industry 35.8 33.9 30.1 28.8 30.4 27.6 30.6 32.1 31.1 29.5 6.1Transport 327.5 319.7 319.0 323.1 332.0 341.3 346.8 349.4 351.6 306.6 63.5Residential/Comercial 59.3 58.5 59.8 52.4 54.0 53.9 53.4 47.7 47.9 44.2 9.2
271.0 279.6 285.8 257.0 267.5 276.0 282.2 283.8 281.8 274.9 100.0
Industry 91.9 91.4 92.8 90.8 89.2 90.1 95.5 95.5 93.7 90.0 32.8Transport 1.3 1.4 1.5 1.6 1.7 1.8 1.7 1.9 2.0 1.9 0.7Residential/Comercial 156.7 166.5 171.6 144.4 157.5 164.9 164.6 165.6 165.3 163.0 59.3
538.4 523.2 517.2 511.9 523.6 531.6 543.3 537.2 537.5 480.8 100.0
Gasoline 96.3 90.6 87.4 86.7 85.7 86.1 86.3 88.9 90.7 77.5 16.1Diesel 292.8 288.9 290.1 287.1 297.6 304.1 309.7 306.6 306.7 277.5 57.7Heating Oil 11.7 10.4 8.8 8.0 8.1 6.9 6.8 6.4 6.5 4.3 0.9Aviation Jet 8.3 8.0 8.3 8.5 8.8 9.1 9.2 9.6 9.7 4.5 0.9LPG 32.6 31.1 33.8 34.7 36.0 36.2 36.5 37.7 37.2 34.7 7.2
1,367.1 1,367.8 1,361.1 1,327.4 1,410.4 1,442.0 1,505.2 1,489.5 1,512.5 1,355.3 100.0
Oil 968.4 978.1 971.3 960.0 1,021.7 1,029.9 1,054.0 1,038.2 1,035.0 899.8 66.4Gas 398.7 389.7 389.8 367.4 388.7 412.1 451.1 451.3 477.5 455.4 33.6Gasoline 30.6 32.0 29.5 29.0 31.7 32.7 32.4 29.1 30.4 27.4 2.0Diesel 134.6 136.1 145.1 140.5 153.6 163.1 161.7 154.5 155.4 144.8 10.7Heating Oil 69.0 64.8 66.2 66.9 69.4 67.3 51.3 50.8 46.7 51.3 3.8Aviation Jet 31.3 31.9 33.8 32.8 34.3 36.8 38.2 40.8 41.8 25.9 1.9LPG 21.2 20.5 23.4 25.5 27.6 28.3 27.8 29.2 28.8 26.6 2.0
619.2 643.6 642.7 638.8 692.0 706.4 733.3 716.6 695.3 650.4 100.0
Oil 446.3 459.2 457.0 457.2 497.4 511.7 522.1 509.2 490.0 454.2 69.8Gas 172.9 184.4 185.6 181.6 194.6 194.7 211.1 207.4 205.3 196.2 30.2Gasoline 75.5 85.4 80.2 79.6 91.7 92.5 95.3 94.1 94.1 75.7 11.6Diesel 93.9 103.5 103.6 101.5 109.4 114.8 117.6 105.4 103.3 98.0 15.1Heating Oil 69.9 69.5 72.4 74.3 83.4 79.0 62.2 57.7 48.5 53.3 8.2Aviation Jet 16.2 17.3 16.9 14.7 15.0 16.1 17.4 19.4 19.9 14.1 2.2LPG 7.8 8.6 8.5 8.0 9.8 10.2 10.3 9.6 9.6 8.5 1.3
4,068.2 4,034.7 3,939.6 3,767.0 3,832.3 3,841.1 3,891.4 3,824.4 3,667.5 3,278.9 -
188.5 186.9 180.7 169.2 167.6 164.4 161.7 155.2 146.5 139.4 -
55.5 55.8 55.2 51.9 51.8 51.7 51.0 49.8 48.8 48.8 -
86.8 86.4 84.7 79.9 79.1 78.1 77.2 74.7 72.3 71.8 -
*Heat is included
Final energy intensity (toe/million $15ppp)
Total energy intensity (toe/million $15ppp)
Natural gas final consumption, by sector
Refined products consumption
Imports
Exports
CO2 Emissions (Million tons CO 2 )
CO2 Intensity (tCO 2 /million $15ppp)
Oil final consumption, by sector
Europe(Million toe)
Total primary energy demand, by source
Total final consumption, by source
Electricity generation, by source
Total final consumption, by sector
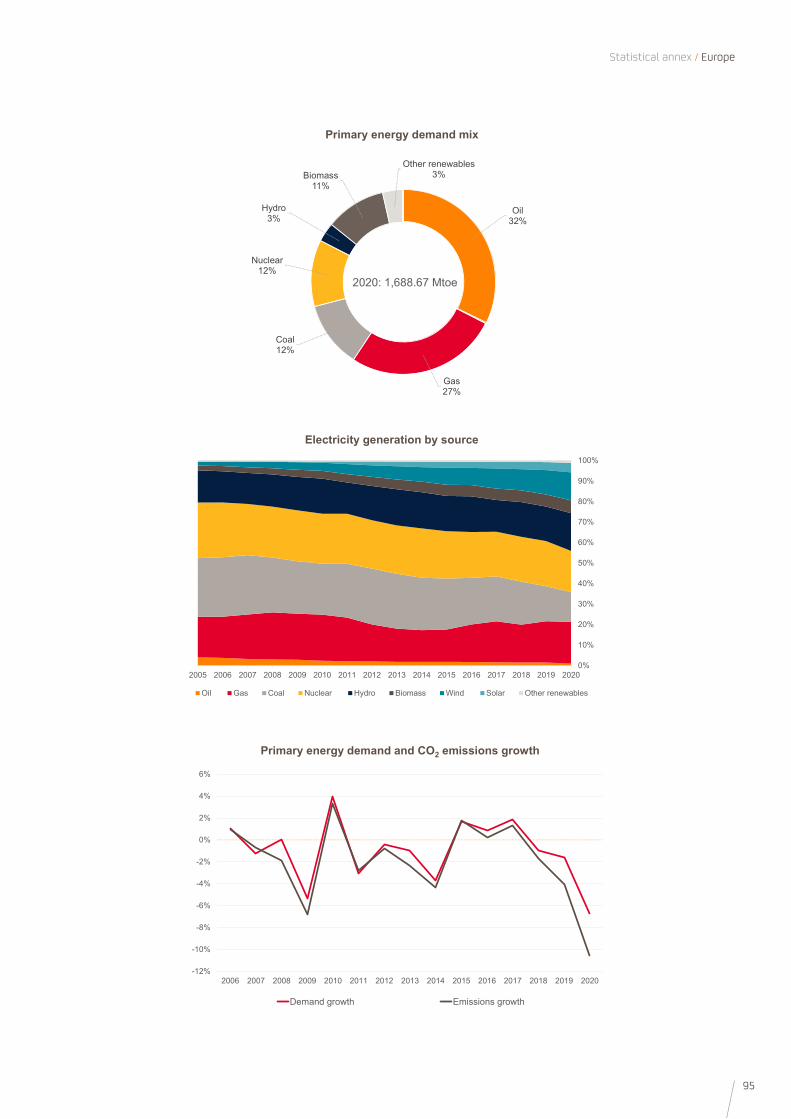
95
Statistical annex / Europe
0%
10%
20%
30%
40%
50%
60%
70%
80%
90%
100%
2005 2006 2007 2008 2009 2010 2011 2012 2013 2014 2015 2016 2017 2018 2019 2020
Oil Gas Coal Nuclear Hydro Biomass Wind Solar Other renewables
Electricity generation by source
-12%
-10%
-8%
-6%
-4%
-2%
0%
2%
4%
6%
2006 2007 2008 2009 2010 2011 2012 2013 2014 2015 2016 2017 2018 2019 2020
Demand growth Emissions growth
Primary energy demand and CO2 emissions growth
Oil 32%
Gas27%
Coal12%
Nuclear12%
Hydro3%
Biomass11%
Other renewables3%
2020: 1,688.67 Mtoe
Primary energy demand mix
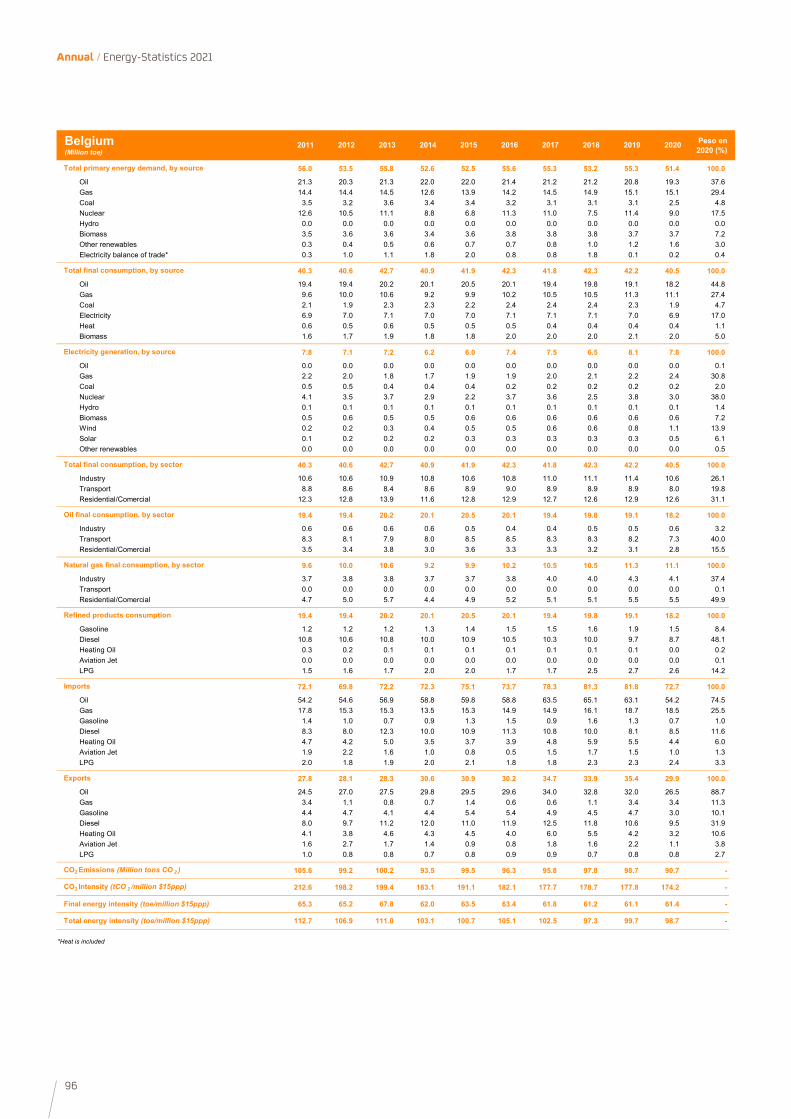
96
Annual / Energy-Statistics 2021
2011 2012 2013 2014 2015 2016 2017 2018 2019 2020 Peso en 2020 (%)
56.0 53.5 55.8 52.6 52.5 55.6 55.3 53.2 55.3 51.4 100.0
Oil 21.3 20.3 21.3 22.0 22.0 21.4 21.2 21.2 20.8 19.3 37.6Gas 14.4 14.4 14.5 12.6 13.9 14.2 14.5 14.9 15.1 15.1 29.4Coal 3.5 3.2 3.6 3.4 3.4 3.2 3.1 3.1 3.1 2.5 4.8Nuclear 12.6 10.5 11.1 8.8 6.8 11.3 11.0 7.5 11.4 9.0 17.5Hydro 0.0 0.0 0.0 0.0 0.0 0.0 0.0 0.0 0.0 0.0 0.0Biomass 3.5 3.6 3.6 3.4 3.6 3.8 3.8 3.8 3.7 3.7 7.2Other renewables 0.3 0.4 0.5 0.6 0.7 0.7 0.8 1.0 1.2 1.6 3.0Electricity balance of trade* 0.3 1.0 1.1 1.8 2.0 0.8 0.8 1.8 0.1 0.2 0.4
40.3 40.6 42.7 40.9 41.9 42.3 41.8 42.3 42.2 40.5 100.0
Oil 19.4 19.4 20.2 20.1 20.5 20.1 19.4 19.8 19.1 18.2 44.8Gas 9.6 10.0 10.6 9.2 9.9 10.2 10.5 10.5 11.3 11.1 27.4Coal 2.1 1.9 2.3 2.3 2.2 2.4 2.4 2.4 2.3 1.9 4.7Electricity 6.9 7.0 7.1 7.0 7.0 7.1 7.1 7.1 7.0 6.9 17.0Heat 0.6 0.5 0.6 0.5 0.5 0.5 0.4 0.4 0.4 0.4 1.1Biomass 1.6 1.7 1.9 1.8 1.8 2.0 2.0 2.0 2.1 2.0 5.0
7.8 7.1 7.2 6.2 6.0 7.4 7.5 6.5 8.1 7.8 100.0
Oil 0.0 0.0 0.0 0.0 0.0 0.0 0.0 0.0 0.0 0.0 0.1Gas 2.2 2.0 1.8 1.7 1.9 1.9 2.0 2.1 2.2 2.4 30.8Coal 0.5 0.5 0.4 0.4 0.4 0.2 0.2 0.2 0.2 0.2 2.0Nuclear 4.1 3.5 3.7 2.9 2.2 3.7 3.6 2.5 3.8 3.0 38.0Hydro 0.1 0.1 0.1 0.1 0.1 0.1 0.1 0.1 0.1 0.1 1.4Biomass 0.5 0.6 0.5 0.5 0.6 0.6 0.6 0.6 0.6 0.6 7.2Wind 0.2 0.2 0.3 0.4 0.5 0.5 0.6 0.6 0.8 1.1 13.9Solar 0.1 0.2 0.2 0.2 0.3 0.3 0.3 0.3 0.3 0.5 6.1Other renewables 0.0 0.0 0.0 0.0 0.0 0.0 0.0 0.0 0.0 0.0 0.5
40.3 40.6 42.7 40.9 41.9 42.3 41.8 42.3 42.2 40.5 100.0
Industry 10.6 10.6 10.9 10.8 10.6 10.8 11.0 11.1 11.4 10.6 26.1Transport 8.8 8.6 8.4 8.6 8.9 9.0 8.9 8.9 8.9 8.0 19.8Residential/Comercial 12.3 12.8 13.9 11.6 12.8 12.9 12.7 12.6 12.9 12.6 31.1
19.4 19.4 20.2 20.1 20.5 20.1 19.4 19.8 19.1 18.2 100.0
Industry 0.6 0.6 0.6 0.6 0.5 0.4 0.4 0.5 0.5 0.6 3.2Transport 8.3 8.1 7.9 8.0 8.5 8.5 8.3 8.3 8.2 7.3 40.0Residential/Comercial 3.5 3.4 3.8 3.0 3.6 3.3 3.3 3.2 3.1 2.8 15.5
9.6 10.0 10.6 9.2 9.9 10.2 10.5 10.5 11.3 11.1 100.0
Industry 3.7 3.8 3.8 3.7 3.7 3.8 4.0 4.0 4.3 4.1 37.4Transport 0.0 0.0 0.0 0.0 0.0 0.0 0.0 0.0 0.0 0.0 0.1Residential/Comercial 4.7 5.0 5.7 4.4 4.9 5.2 5.1 5.1 5.5 5.5 49.9
19.4 19.4 20.2 20.1 20.5 20.1 19.4 19.8 19.1 18.2 100.0
Gasoline 1.2 1.2 1.2 1.3 1.4 1.5 1.5 1.6 1.9 1.5 8.4Diesel 10.8 10.6 10.8 10.0 10.9 10.5 10.3 10.0 9.7 8.7 48.1Heating Oil 0.3 0.2 0.1 0.1 0.1 0.1 0.1 0.1 0.1 0.0 0.2Aviation Jet 0.0 0.0 0.0 0.0 0.0 0.0 0.0 0.0 0.0 0.0 0.1LPG 1.5 1.6 1.7 2.0 2.0 1.7 1.7 2.5 2.7 2.6 14.2
72.1 69.8 72.2 72.3 75.1 73.7 78.3 81.3 81.8 72.7 100.0
Oil 54.2 54.6 56.9 58.8 59.8 58.8 63.5 65.1 63.1 54.2 74.5Gas 17.8 15.3 15.3 13.5 15.3 14.9 14.9 16.1 18.7 18.5 25.5Gasoline 1.4 1.0 0.7 0.9 1.3 1.5 0.9 1.6 1.3 0.7 1.0Diesel 8.3 8.0 12.3 10.0 10.9 11.3 10.8 10.0 8.1 8.5 11.6Heating Oil 4.7 4.2 5.0 3.5 3.7 3.9 4.8 5.9 5.5 4.4 6.0Aviation Jet 1.9 2.2 1.6 1.0 0.8 0.5 1.5 1.7 1.5 1.0 1.3LPG 2.0 1.8 1.9 2.0 2.1 1.8 1.8 2.3 2.3 2.4 3.3
27.8 28.1 28.3 30.6 30.9 30.2 34.7 33.9 35.4 29.9 100.0
Oil 24.5 27.0 27.5 29.8 29.5 29.6 34.0 32.8 32.0 26.5 88.7Gas 3.4 1.1 0.8 0.7 1.4 0.6 0.6 1.1 3.4 3.4 11.3Gasoline 4.4 4.7 4.1 4.4 5.4 5.4 4.9 4.5 4.7 3.0 10.1Diesel 8.0 9.7 11.2 12.0 11.0 11.9 12.5 11.8 10.6 9.5 31.9Heating Oil 4.1 3.8 4.6 4.3 4.5 4.0 6.0 5.5 4.2 3.2 10.6Aviation Jet 1.6 2.7 1.7 1.4 0.9 0.8 1.8 1.6 2.2 1.1 3.8LPG 1.0 0.8 0.8 0.7 0.8 0.9 0.9 0.7 0.8 0.8 2.7
105.6 99.2 100.2 93.5 99.5 96.3 95.8 97.8 98.7 90.7 -
212.6 198.2 199.4 183.1 191.1 182.1 177.7 178.7 177.8 174.2 -
65.3 65.2 67.8 62.0 63.5 63.4 61.8 61.2 61.1 61.4 -
112.7 106.9 111.0 103.1 100.7 105.1 102.5 97.3 99.7 98.7 -
*Heat is included
Final energy intensity (toe/million $15ppp)
Total energy intensity (toe/million $15ppp)
Natural gas final consumption, by sector
Refined products consumption
Imports
Exports
CO2 Emissions (Million tons CO 2 )
CO2 Intensity (tCO 2 /million $15ppp)
Oil final consumption, by sector
Belgium(Million toe)
Total primary energy demand, by source
Total final consumption, by source
Electricity generation, by source
Total final consumption, by sector
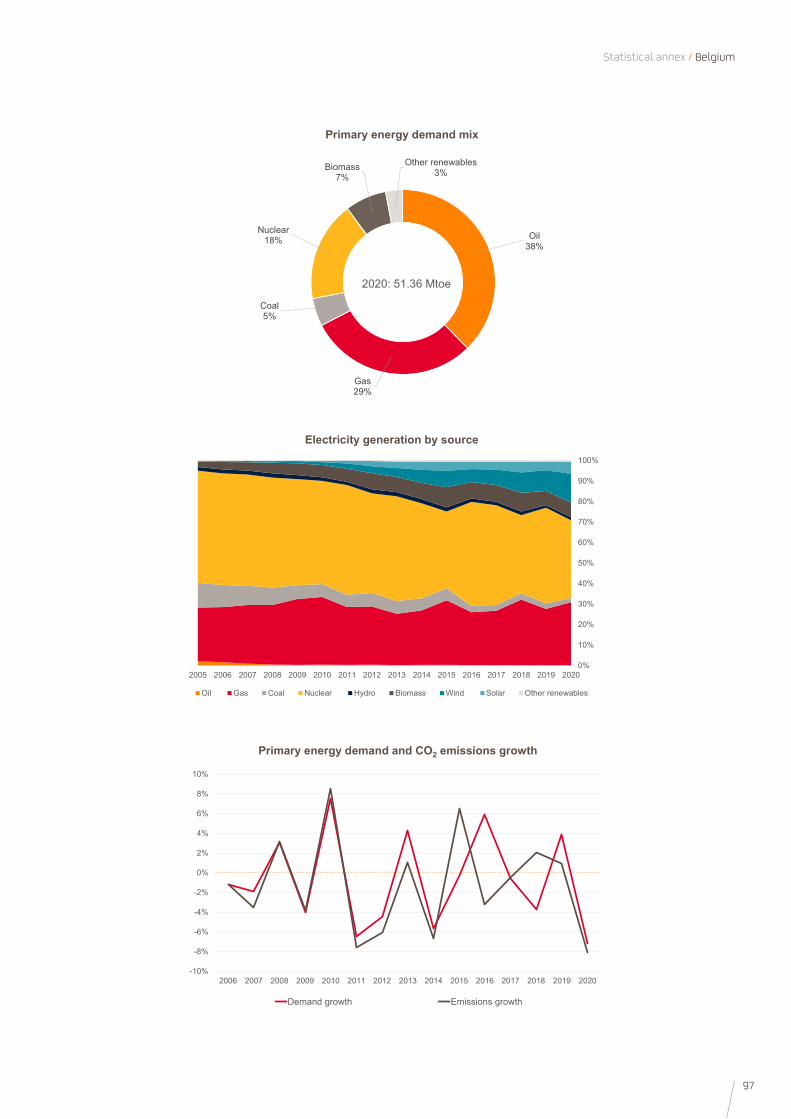
97
Statistical annex / Belgium
0%
10%
20%
30%
40%
50%
60%
70%
80%
90%
100%
2005 2006 2007 2008 2009 2010 2011 2012 2013 2014 2015 2016 2017 2018 2019 2020
Oil Gas Coal Nuclear Hydro Biomass Wind Solar Other renewables
Electricity generation by source
-10%
-8%
-6%
-4%
-2%
0%
2%
4%
6%
8%
10%
2006 2007 2008 2009 2010 2011 2012 2013 2014 2015 2016 2017 2018 2019 2020
Demand growth Emissions growth
Primary energy demand and CO2 emissions growth
Oil 38%
Gas29%
Coal5%
Nuclear18%
Biomass7%
Other renewables3%
2020: 51.36 Mtoe
Primary energy demand mix
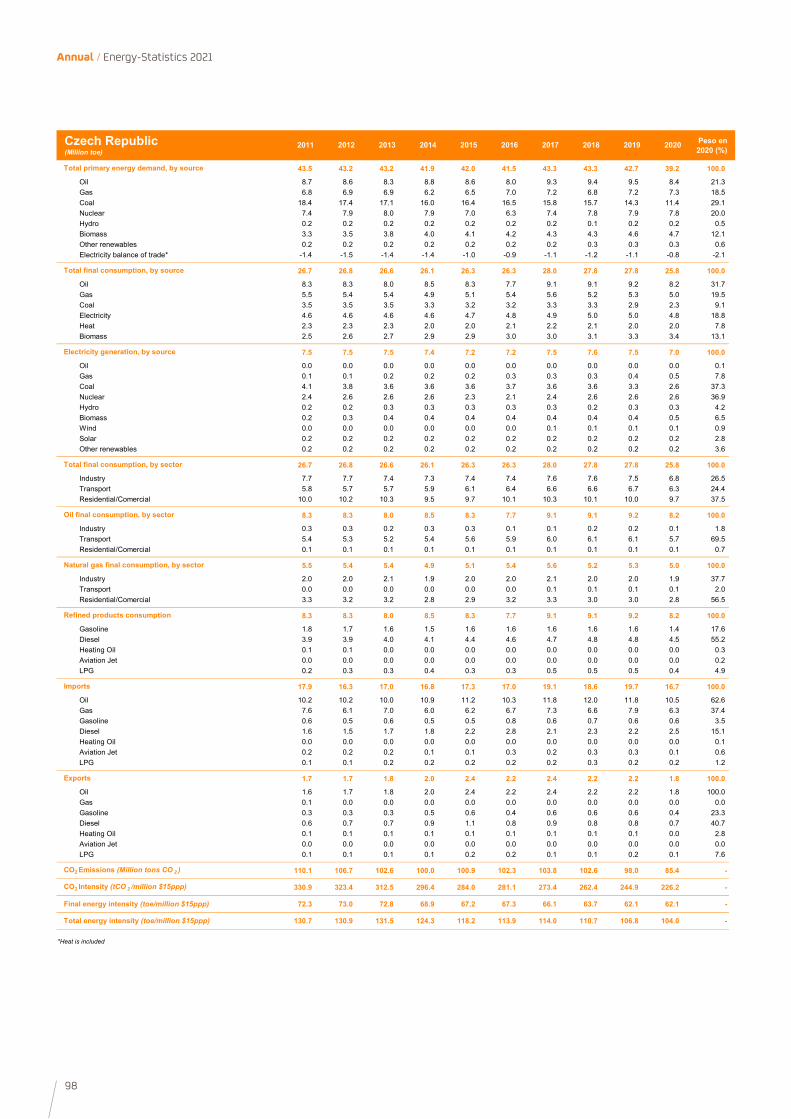
98
Annual / Energy-Statistics 2021
2011 2012 2013 2014 2015 2016 2017 2018 2019 2020 Peso en 2020 (%)
43.5 43.2 43.2 41.9 42.0 41.5 43.3 43.3 42.7 39.2 100.0
Oil 8.7 8.6 8.3 8.8 8.6 8.0 9.3 9.4 9.5 8.4 21.3Gas 6.8 6.9 6.9 6.2 6.5 7.0 7.2 6.8 7.2 7.3 18.5Coal 18.4 17.4 17.1 16.0 16.4 16.5 15.8 15.7 14.3 11.4 29.1Nuclear 7.4 7.9 8.0 7.9 7.0 6.3 7.4 7.8 7.9 7.8 20.0Hydro 0.2 0.2 0.2 0.2 0.2 0.2 0.2 0.1 0.2 0.2 0.5Biomass 3.3 3.5 3.8 4.0 4.1 4.2 4.3 4.3 4.6 4.7 12.1Other renewables 0.2 0.2 0.2 0.2 0.2 0.2 0.2 0.3 0.3 0.3 0.6Electricity balance of trade* -1.4 -1.5 -1.4 -1.4 -1.0 -0.9 -1.1 -1.2 -1.1 -0.8 -2.1
26.7 26.8 26.6 26.1 26.3 26.3 28.0 27.8 27.8 25.8 100.0
Oil 8.3 8.3 8.0 8.5 8.3 7.7 9.1 9.1 9.2 8.2 31.7Gas 5.5 5.4 5.4 4.9 5.1 5.4 5.6 5.2 5.3 5.0 19.5Coal 3.5 3.5 3.5 3.3 3.2 3.2 3.3 3.3 2.9 2.3 9.1Electricity 4.6 4.6 4.6 4.6 4.7 4.8 4.9 5.0 5.0 4.8 18.8Heat 2.3 2.3 2.3 2.0 2.0 2.1 2.2 2.1 2.0 2.0 7.8Biomass 2.5 2.6 2.7 2.9 2.9 3.0 3.0 3.1 3.3 3.4 13.1
7.5 7.5 7.5 7.4 7.2 7.2 7.5 7.6 7.5 7.0 100.0
Oil 0.0 0.0 0.0 0.0 0.0 0.0 0.0 0.0 0.0 0.0 0.1Gas 0.1 0.1 0.2 0.2 0.2 0.3 0.3 0.3 0.4 0.5 7.8Coal 4.1 3.8 3.6 3.6 3.6 3.7 3.6 3.6 3.3 2.6 37.3Nuclear 2.4 2.6 2.6 2.6 2.3 2.1 2.4 2.6 2.6 2.6 36.9Hydro 0.2 0.2 0.3 0.3 0.3 0.3 0.3 0.2 0.3 0.3 4.2Biomass 0.2 0.3 0.4 0.4 0.4 0.4 0.4 0.4 0.4 0.5 6.5Wind 0.0 0.0 0.0 0.0 0.0 0.0 0.1 0.1 0.1 0.1 0.9Solar 0.2 0.2 0.2 0.2 0.2 0.2 0.2 0.2 0.2 0.2 2.8Other renewables 0.2 0.2 0.2 0.2 0.2 0.2 0.2 0.2 0.2 0.2 3.6
26.7 26.8 26.6 26.1 26.3 26.3 28.0 27.8 27.8 25.8 100.0
Industry 7.7 7.7 7.4 7.3 7.4 7.4 7.6 7.6 7.5 6.8 26.5Transport 5.8 5.7 5.7 5.9 6.1 6.4 6.6 6.6 6.7 6.3 24.4Residential/Comercial 10.0 10.2 10.3 9.5 9.7 10.1 10.3 10.1 10.0 9.7 37.5
8.3 8.3 8.0 8.5 8.3 7.7 9.1 9.1 9.2 8.2 100.0
Industry 0.3 0.3 0.2 0.3 0.3 0.1 0.1 0.2 0.2 0.1 1.8Transport 5.4 5.3 5.2 5.4 5.6 5.9 6.0 6.1 6.1 5.7 69.5Residential/Comercial 0.1 0.1 0.1 0.1 0.1 0.1 0.1 0.1 0.1 0.1 0.7
5.5 5.4 5.4 4.9 5.1 5.4 5.6 5.2 5.3 5.0 100.0
Industry 2.0 2.0 2.1 1.9 2.0 2.0 2.1 2.0 2.0 1.9 37.7Transport 0.0 0.0 0.0 0.0 0.0 0.0 0.1 0.1 0.1 0.1 2.0Residential/Comercial 3.3 3.2 3.2 2.8 2.9 3.2 3.3 3.0 3.0 2.8 56.5
8.3 8.3 8.0 8.5 8.3 7.7 9.1 9.1 9.2 8.2 100.0
Gasoline 1.8 1.7 1.6 1.5 1.6 1.6 1.6 1.6 1.6 1.4 17.6Diesel 3.9 3.9 4.0 4.1 4.4 4.6 4.7 4.8 4.8 4.5 55.2Heating Oil 0.1 0.1 0.0 0.0 0.0 0.0 0.0 0.0 0.0 0.0 0.3Aviation Jet 0.0 0.0 0.0 0.0 0.0 0.0 0.0 0.0 0.0 0.0 0.2LPG 0.2 0.3 0.3 0.4 0.3 0.3 0.5 0.5 0.5 0.4 4.9
17.9 16.3 17.0 16.8 17.3 17.0 19.1 18.6 19.7 16.7 100.0
Oil 10.2 10.2 10.0 10.9 11.2 10.3 11.8 12.0 11.8 10.5 62.6Gas 7.6 6.1 7.0 6.0 6.2 6.7 7.3 6.6 7.9 6.3 37.4Gasoline 0.6 0.5 0.6 0.5 0.5 0.8 0.6 0.7 0.6 0.6 3.5Diesel 1.6 1.5 1.7 1.8 2.2 2.8 2.1 2.3 2.2 2.5 15.1Heating Oil 0.0 0.0 0.0 0.0 0.0 0.0 0.0 0.0 0.0 0.0 0.1Aviation Jet 0.2 0.2 0.2 0.1 0.1 0.3 0.2 0.3 0.3 0.1 0.6LPG 0.1 0.1 0.2 0.2 0.2 0.2 0.2 0.3 0.2 0.2 1.2
1.7 1.7 1.8 2.0 2.4 2.2 2.4 2.2 2.2 1.8 100.0
Oil 1.6 1.7 1.8 2.0 2.4 2.2 2.4 2.2 2.2 1.8 100.0Gas 0.1 0.0 0.0 0.0 0.0 0.0 0.0 0.0 0.0 0.0 0.0Gasoline 0.3 0.3 0.3 0.5 0.6 0.4 0.6 0.6 0.6 0.4 23.3Diesel 0.6 0.7 0.7 0.9 1.1 0.8 0.9 0.8 0.8 0.7 40.7Heating Oil 0.1 0.1 0.1 0.1 0.1 0.1 0.1 0.1 0.1 0.0 2.8Aviation Jet 0.0 0.0 0.0 0.0 0.0 0.0 0.0 0.0 0.0 0.0 0.0LPG 0.1 0.1 0.1 0.1 0.2 0.2 0.1 0.1 0.2 0.1 7.6
110.1 106.7 102.6 100.0 100.9 102.3 103.8 102.6 98.0 85.4 -
330.9 323.4 312.5 296.4 284.0 281.1 273.4 262.4 244.9 226.2 -
72.3 73.0 72.8 68.9 67.2 67.3 66.1 63.7 62.1 62.1 -
130.7 130.9 131.5 124.3 118.2 113.9 114.0 110.7 106.8 104.0 -
*Heat is included
Final energy intensity (toe/million $15ppp)
Total energy intensity (toe/million $15ppp)
Natural gas final consumption, by sector
Refined products consumption
Imports
Exports
CO2 Emissions (Million tons CO 2 )
CO2 Intensity (tCO 2 /million $15ppp)
Oil final consumption, by sector
Czech Republic(Million toe)
Total primary energy demand, by source
Total final consumption, by source
Electricity generation, by source
Total final consumption, by sector
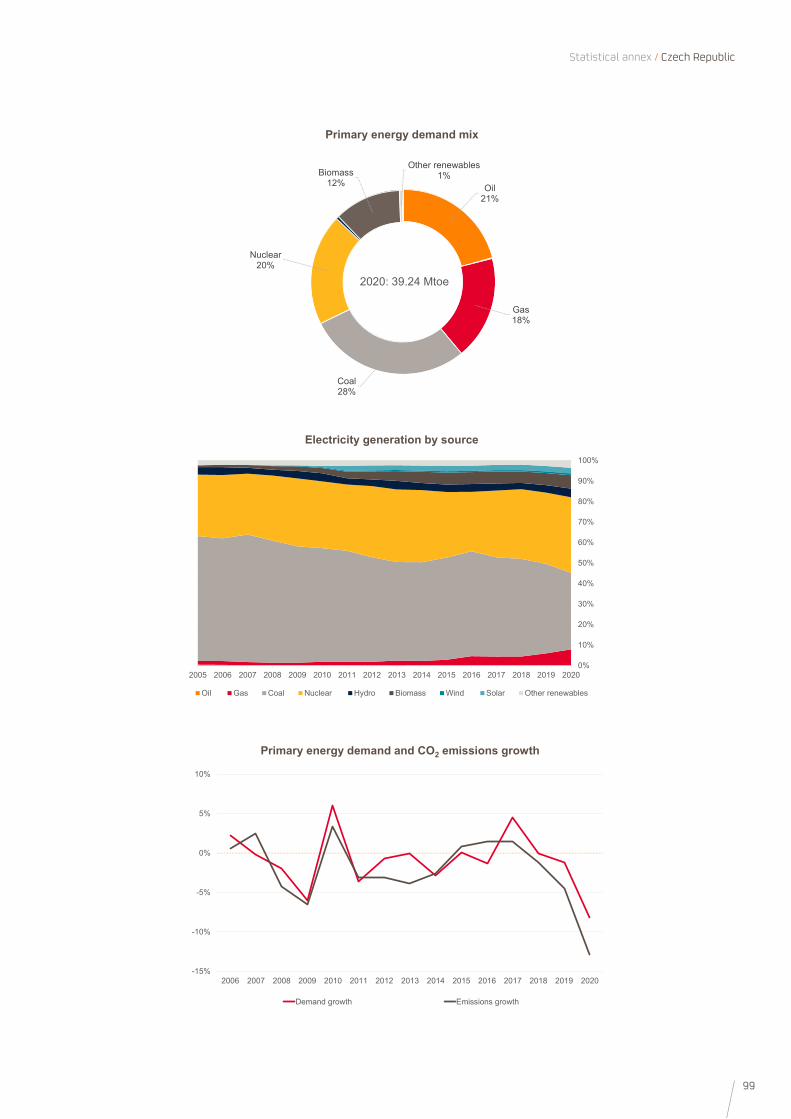
99
Statistical annex / Czech Republic
0%
10%
20%
30%
40%
50%
60%
70%
80%
90%
100%
2005 2006 2007 2008 2009 2010 2011 2012 2013 2014 2015 2016 2017 2018 2019 2020
Oil Gas Coal Nuclear Hydro Biomass Wind Solar Other renewables
Electricity generation by source
-15%
-10%
-5%
0%
5%
10%
2006 2007 2008 2009 2010 2011 2012 2013 2014 2015 2016 2017 2018 2019 2020
Demand growth Emissions growth
Primary energy demand and CO2 emissions growth
Oil 21%
Gas18%
Coal28%
Nuclear20%
Biomass12%
Other renewables1%
2020: 39.24 Mtoe
Primary energy demand mix
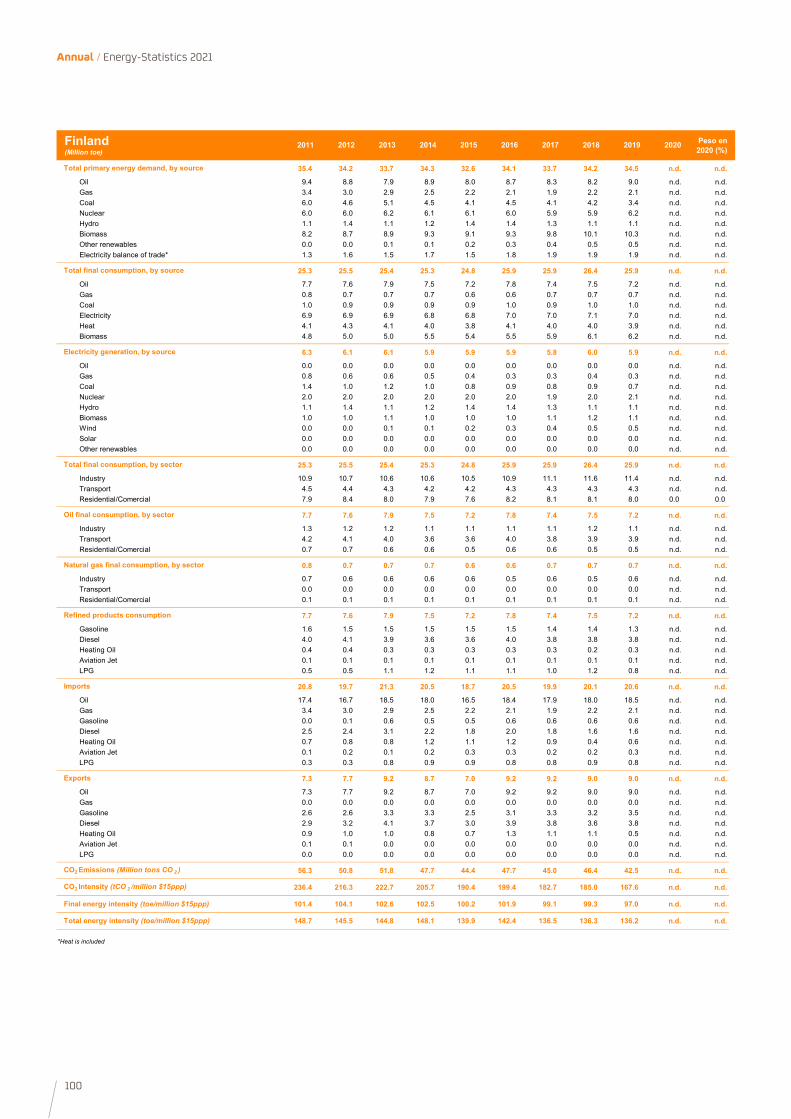
100
Annual / Energy-Statistics 2021
2011 2012 2013 2014 2015 2016 2017 2018 2019 2020 Peso en 2020 (%)
35.4 34.2 33.7 34.3 32.6 34.1 33.7 34.2 34.5 n.d. n.d.
Oil 9.4 8.8 7.9 8.9 8.0 8.7 8.3 8.2 9.0 n.d. n.d.Gas 3.4 3.0 2.9 2.5 2.2 2.1 1.9 2.2 2.1 n.d. n.d.Coal 6.0 4.6 5.1 4.5 4.1 4.5 4.1 4.2 3.4 n.d. n.d.Nuclear 6.0 6.0 6.2 6.1 6.1 6.0 5.9 5.9 6.2 n.d. n.d.Hydro 1.1 1.4 1.1 1.2 1.4 1.4 1.3 1.1 1.1 n.d. n.d.Biomass 8.2 8.7 8.9 9.3 9.1 9.3 9.8 10.1 10.3 n.d. n.d.Other renewables 0.0 0.0 0.1 0.1 0.2 0.3 0.4 0.5 0.5 n.d. n.d.Electricity balance of trade* 1.3 1.6 1.5 1.7 1.5 1.8 1.9 1.9 1.9 n.d. n.d.
25.3 25.5 25.4 25.3 24.8 25.9 25.9 26.4 25.9 n.d. n.d.
Oil 7.7 7.6 7.9 7.5 7.2 7.8 7.4 7.5 7.2 n.d. n.d.Gas 0.8 0.7 0.7 0.7 0.6 0.6 0.7 0.7 0.7 n.d. n.d.Coal 1.0 0.9 0.9 0.9 0.9 1.0 0.9 1.0 1.0 n.d. n.d.Electricity 6.9 6.9 6.9 6.8 6.8 7.0 7.0 7.1 7.0 n.d. n.d.Heat 4.1 4.3 4.1 4.0 3.8 4.1 4.0 4.0 3.9 n.d. n.d.Biomass 4.8 5.0 5.0 5.5 5.4 5.5 5.9 6.1 6.2 n.d. n.d.
6.3 6.1 6.1 5.9 5.9 5.9 5.8 6.0 5.9 n.d. n.d.
Oil 0.0 0.0 0.0 0.0 0.0 0.0 0.0 0.0 0.0 n.d. n.d.Gas 0.8 0.6 0.6 0.5 0.4 0.3 0.3 0.4 0.3 n.d. n.d.Coal 1.4 1.0 1.2 1.0 0.8 0.9 0.8 0.9 0.7 n.d. n.d.Nuclear 2.0 2.0 2.0 2.0 2.0 2.0 1.9 2.0 2.1 n.d. n.d.Hydro 1.1 1.4 1.1 1.2 1.4 1.4 1.3 1.1 1.1 n.d. n.d.Biomass 1.0 1.0 1.1 1.0 1.0 1.0 1.1 1.2 1.1 n.d. n.d.Wind 0.0 0.0 0.1 0.1 0.2 0.3 0.4 0.5 0.5 n.d. n.d.Solar 0.0 0.0 0.0 0.0 0.0 0.0 0.0 0.0 0.0 n.d. n.d.Other renewables 0.0 0.0 0.0 0.0 0.0 0.0 0.0 0.0 0.0 n.d. n.d.
25.3 25.5 25.4 25.3 24.8 25.9 25.9 26.4 25.9 n.d. n.d.
Industry 10.9 10.7 10.6 10.6 10.5 10.9 11.1 11.6 11.4 n.d. n.d.Transport 4.5 4.4 4.3 4.2 4.2 4.3 4.3 4.3 4.3 n.d. n.d.Residential/Comercial 7.9 8.4 8.0 7.9 7.6 8.2 8.1 8.1 8.0 0.0 0.0
7.7 7.6 7.9 7.5 7.2 7.8 7.4 7.5 7.2 n.d. n.d.
Industry 1.3 1.2 1.2 1.1 1.1 1.1 1.1 1.2 1.1 n.d. n.d.Transport 4.2 4.1 4.0 3.6 3.6 4.0 3.8 3.9 3.9 n.d. n.d.Residential/Comercial 0.7 0.7 0.6 0.6 0.5 0.6 0.6 0.5 0.5 n.d. n.d.
0.8 0.7 0.7 0.7 0.6 0.6 0.7 0.7 0.7 n.d. n.d.
Industry 0.7 0.6 0.6 0.6 0.6 0.5 0.6 0.5 0.6 n.d. n.d.Transport 0.0 0.0 0.0 0.0 0.0 0.0 0.0 0.0 0.0 n.d. n.d.Residential/Comercial 0.1 0.1 0.1 0.1 0.1 0.1 0.1 0.1 0.1 n.d. n.d.
7.7 7.6 7.9 7.5 7.2 7.8 7.4 7.5 7.2 n.d. n.d.
Gasoline 1.6 1.5 1.5 1.5 1.5 1.5 1.4 1.4 1.3 n.d. n.d.Diesel 4.0 4.1 3.9 3.6 3.6 4.0 3.8 3.8 3.8 n.d. n.d.Heating Oil 0.4 0.4 0.3 0.3 0.3 0.3 0.3 0.2 0.3 n.d. n.d.Aviation Jet 0.1 0.1 0.1 0.1 0.1 0.1 0.1 0.1 0.1 n.d. n.d.LPG 0.5 0.5 1.1 1.2 1.1 1.1 1.0 1.2 0.8 n.d. n.d.
20.8 19.7 21.3 20.5 18.7 20.5 19.9 20.1 20.6 n.d. n.d.
Oil 17.4 16.7 18.5 18.0 16.5 18.4 17.9 18.0 18.5 n.d. n.d.Gas 3.4 3.0 2.9 2.5 2.2 2.1 1.9 2.2 2.1 n.d. n.d.Gasoline 0.0 0.1 0.6 0.5 0.5 0.6 0.6 0.6 0.6 n.d. n.d.Diesel 2.5 2.4 3.1 2.2 1.8 2.0 1.8 1.6 1.6 n.d. n.d.Heating Oil 0.7 0.8 0.8 1.2 1.1 1.2 0.9 0.4 0.6 n.d. n.d.Aviation Jet 0.1 0.2 0.1 0.2 0.3 0.3 0.2 0.2 0.3 n.d. n.d.LPG 0.3 0.3 0.8 0.9 0.9 0.8 0.8 0.9 0.8 n.d. n.d.
7.3 7.7 9.2 8.7 7.0 9.2 9.2 9.0 9.0 n.d. n.d.
Oil 7.3 7.7 9.2 8.7 7.0 9.2 9.2 9.0 9.0 n.d. n.d.Gas 0.0 0.0 0.0 0.0 0.0 0.0 0.0 0.0 0.0 n.d. n.d.Gasoline 2.6 2.6 3.3 3.3 2.5 3.1 3.3 3.2 3.5 n.d. n.d.Diesel 2.9 3.2 4.1 3.7 3.0 3.9 3.8 3.6 3.8 n.d. n.d.Heating Oil 0.9 1.0 1.0 0.8 0.7 1.3 1.1 1.1 0.5 n.d. n.d.Aviation Jet 0.1 0.1 0.0 0.0 0.0 0.0 0.0 0.0 0.0 n.d. n.d.LPG 0.0 0.0 0.0 0.0 0.0 0.0 0.0 0.0 0.0 n.d. n.d.
56.3 50.8 51.8 47.7 44.4 47.7 45.0 46.4 42.5 n.d. n.d.
236.4 216.3 222.7 205.7 190.4 199.4 182.7 185.0 167.6 n.d. n.d.
101.4 104.1 102.6 102.5 100.2 101.9 99.1 99.3 97.0 n.d. n.d.
148.7 145.5 144.8 148.1 139.9 142.4 136.5 136.3 136.2 n.d. n.d.
*Heat is included
Final energy intensity (toe/million $15ppp)
Total energy intensity (toe/million $15ppp)
Natural gas final consumption, by sector
Refined products consumption
Imports
Exports
CO2 Emissions (Million tons CO 2 )
CO2 Intensity (tCO 2 /million $15ppp)
Oil final consumption, by sector
Finland(Million toe)
Total primary energy demand, by source
Total final consumption, by source
Electricity generation, by source
Total final consumption, by sector
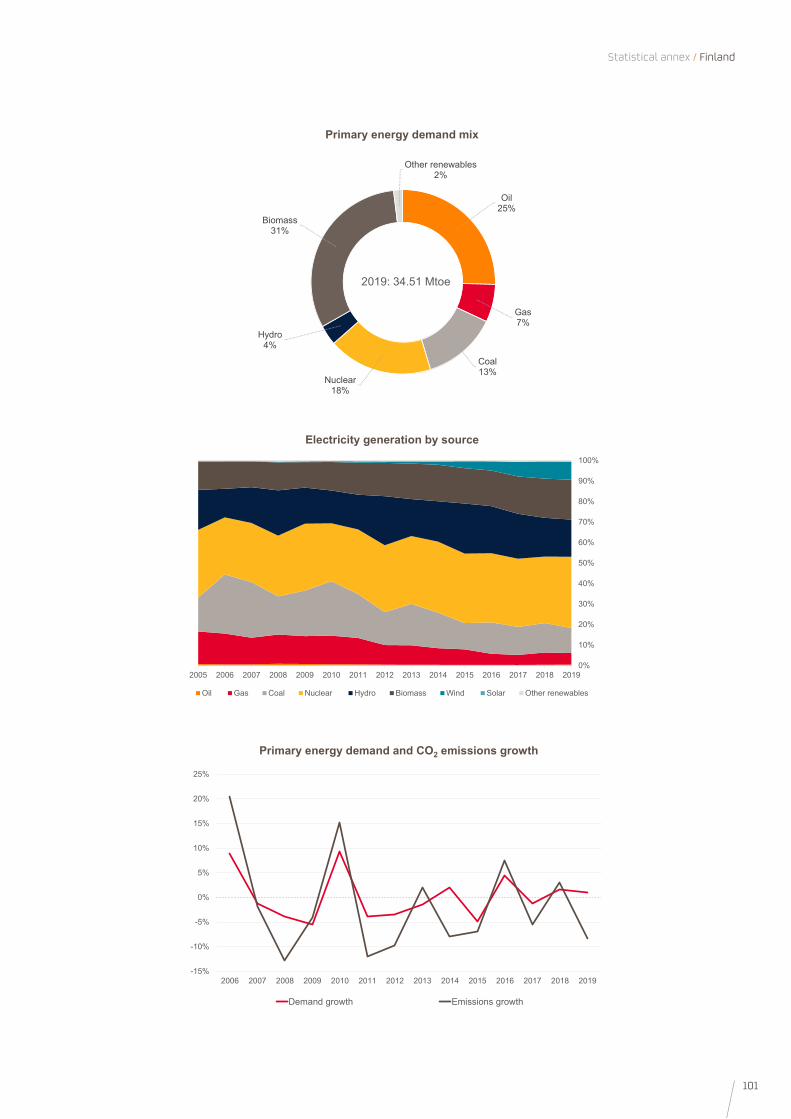
101
Statistical annex / Finland
0%
10%
20%
30%
40%
50%
60%
70%
80%
90%
100%
2005 2006 2007 2008 2009 2010 2011 2012 2013 2014 2015 2016 2017 2018 2019
Oil Gas Coal Nuclear Hydro Biomass Wind Solar Other renewables
Electricity generation by source
-15%
-10%
-5%
0%
5%
10%
15%
20%
25%
2006 2007 2008 2009 2010 2011 2012 2013 2014 2015 2016 2017 2018 2019
Demand growth Emissions growth
Primary energy demand and CO2 emissions growth
Oil 25%
Gas7%
Coal13%
Nuclear18%
Hydro4%
Biomass31%
Other renewables2%
2019: 34.51 Mtoe
Primary energy demand mix
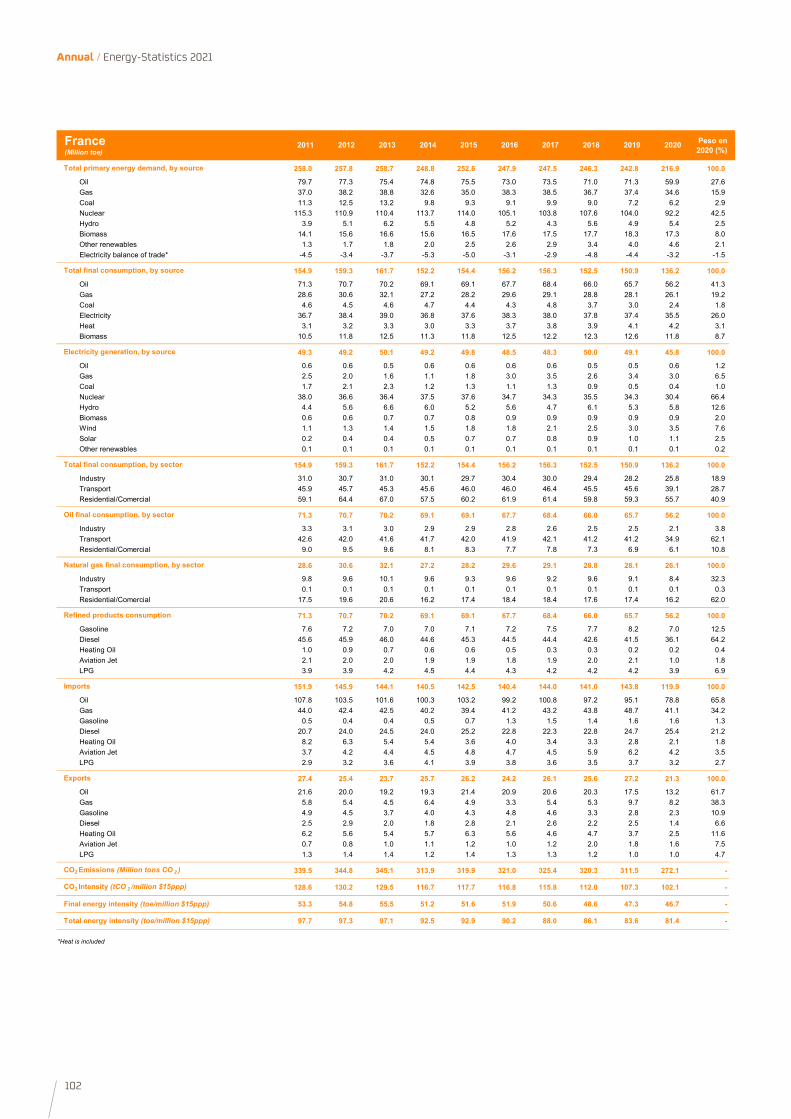
102
Annual / Energy-Statistics 2021
2011 2012 2013 2014 2015 2016 2017 2018 2019 2020 Peso en 2020 (%)
258.0 257.8 258.7 248.8 252.6 247.9 247.5 246.3 242.8 216.9 100.0
Oil 79.7 77.3 75.4 74.8 75.5 73.0 73.5 71.0 71.3 59.9 27.6Gas 37.0 38.2 38.8 32.6 35.0 38.3 38.5 36.7 37.4 34.6 15.9Coal 11.3 12.5 13.2 9.8 9.3 9.1 9.9 9.0 7.2 6.2 2.9Nuclear 115.3 110.9 110.4 113.7 114.0 105.1 103.8 107.6 104.0 92.2 42.5Hydro 3.9 5.1 6.2 5.5 4.8 5.2 4.3 5.6 4.9 5.4 2.5Biomass 14.1 15.6 16.6 15.6 16.5 17.6 17.5 17.7 18.3 17.3 8.0Other renewables 1.3 1.7 1.8 2.0 2.5 2.6 2.9 3.4 4.0 4.6 2.1Electricity balance of trade* -4.5 -3.4 -3.7 -5.3 -5.0 -3.1 -2.9 -4.8 -4.4 -3.2 -1.5
154.9 159.3 161.7 152.2 154.4 156.2 156.3 152.5 150.9 136.2 100.0
Oil 71.3 70.7 70.2 69.1 69.1 67.7 68.4 66.0 65.7 56.2 41.3Gas 28.6 30.6 32.1 27.2 28.2 29.6 29.1 28.8 28.1 26.1 19.2Coal 4.6 4.5 4.6 4.7 4.4 4.3 4.8 3.7 3.0 2.4 1.8Electricity 36.7 38.4 39.0 36.8 37.6 38.3 38.0 37.8 37.4 35.5 26.0Heat 3.1 3.2 3.3 3.0 3.3 3.7 3.8 3.9 4.1 4.2 3.1Biomass 10.5 11.8 12.5 11.3 11.8 12.5 12.2 12.3 12.6 11.8 8.7
49.3 49.2 50.1 49.2 49.8 48.5 48.3 50.0 49.1 45.8 100.0
Oil 0.6 0.6 0.5 0.6 0.6 0.6 0.6 0.5 0.5 0.6 1.2Gas 2.5 2.0 1.6 1.1 1.8 3.0 3.5 2.6 3.4 3.0 6.5Coal 1.7 2.1 2.3 1.2 1.3 1.1 1.3 0.9 0.5 0.4 1.0Nuclear 38.0 36.6 36.4 37.5 37.6 34.7 34.3 35.5 34.3 30.4 66.4Hydro 4.4 5.6 6.6 6.0 5.2 5.6 4.7 6.1 5.3 5.8 12.6Biomass 0.6 0.6 0.7 0.7 0.8 0.9 0.9 0.9 0.9 0.9 2.0Wind 1.1 1.3 1.4 1.5 1.8 1.8 2.1 2.5 3.0 3.5 7.6Solar 0.2 0.4 0.4 0.5 0.7 0.7 0.8 0.9 1.0 1.1 2.5Other renewables 0.1 0.1 0.1 0.1 0.1 0.1 0.1 0.1 0.1 0.1 0.2
154.9 159.3 161.7 152.2 154.4 156.2 156.3 152.5 150.9 136.2 100.0
Industry 31.0 30.7 31.0 30.1 29.7 30.4 30.0 29.4 28.2 25.8 18.9Transport 45.9 45.7 45.3 45.6 46.0 46.0 46.4 45.5 45.6 39.1 28.7Residential/Comercial 59.1 64.4 67.0 57.5 60.2 61.9 61.4 59.8 59.3 55.7 40.9
71.3 70.7 70.2 69.1 69.1 67.7 68.4 66.0 65.7 56.2 100.0
Industry 3.3 3.1 3.0 2.9 2.9 2.8 2.6 2.5 2.5 2.1 3.8Transport 42.6 42.0 41.6 41.7 42.0 41.9 42.1 41.2 41.2 34.9 62.1Residential/Comercial 9.0 9.5 9.6 8.1 8.3 7.7 7.8 7.3 6.9 6.1 10.8
28.6 30.6 32.1 27.2 28.2 29.6 29.1 28.8 28.1 26.1 100.0
Industry 9.8 9.6 10.1 9.6 9.3 9.6 9.2 9.6 9.1 8.4 32.3Transport 0.1 0.1 0.1 0.1 0.1 0.1 0.1 0.1 0.1 0.1 0.3Residential/Comercial 17.5 19.6 20.6 16.2 17.4 18.4 18.4 17.6 17.4 16.2 62.0
71.3 70.7 70.2 69.1 69.1 67.7 68.4 66.0 65.7 56.2 100.0
Gasoline 7.6 7.2 7.0 7.0 7.1 7.2 7.5 7.7 8.2 7.0 12.5Diesel 45.6 45.9 46.0 44.6 45.3 44.5 44.4 42.6 41.5 36.1 64.2Heating Oil 1.0 0.9 0.7 0.6 0.6 0.5 0.3 0.3 0.2 0.2 0.4Aviation Jet 2.1 2.0 2.0 1.9 1.9 1.8 1.9 2.0 2.1 1.0 1.8LPG 3.9 3.9 4.2 4.5 4.4 4.3 4.2 4.2 4.2 3.9 6.9
151.9 145.9 144.1 140.5 142.5 140.4 144.0 141.0 143.8 119.9 100.0
Oil 107.8 103.5 101.6 100.3 103.2 99.2 100.8 97.2 95.1 78.8 65.8Gas 44.0 42.4 42.5 40.2 39.4 41.2 43.2 43.8 48.7 41.1 34.2Gasoline 0.5 0.4 0.4 0.5 0.7 1.3 1.5 1.4 1.6 1.6 1.3Diesel 20.7 24.0 24.5 24.0 25.2 22.8 22.3 22.8 24.7 25.4 21.2Heating Oil 8.2 6.3 5.4 5.4 3.6 4.0 3.4 3.3 2.8 2.1 1.8Aviation Jet 3.7 4.2 4.4 4.5 4.8 4.7 4.5 5.9 6.2 4.2 3.5LPG 2.9 3.2 3.6 4.1 3.9 3.8 3.6 3.5 3.7 3.2 2.7
27.4 25.4 23.7 25.7 26.2 24.2 26.1 25.6 27.2 21.3 100.0
Oil 21.6 20.0 19.2 19.3 21.4 20.9 20.6 20.3 17.5 13.2 61.7Gas 5.8 5.4 4.5 6.4 4.9 3.3 5.4 5.3 9.7 8.2 38.3Gasoline 4.9 4.5 3.7 4.0 4.3 4.8 4.6 3.3 2.8 2.3 10.9Diesel 2.5 2.9 2.0 1.8 2.8 2.1 2.6 2.2 2.5 1.4 6.6Heating Oil 6.2 5.6 5.4 5.7 6.3 5.6 4.6 4.7 3.7 2.5 11.6Aviation Jet 0.7 0.8 1.0 1.1 1.2 1.0 1.2 2.0 1.8 1.6 7.5LPG 1.3 1.4 1.4 1.2 1.4 1.3 1.3 1.2 1.0 1.0 4.7
339.5 344.8 345.1 313.9 319.9 321.0 325.4 320.3 311.5 272.1 -
128.6 130.2 129.5 116.7 117.7 116.8 115.8 112.0 107.3 102.1 -
53.3 54.8 55.5 51.2 51.6 51.9 50.6 48.6 47.3 46.7 -
97.7 97.3 97.1 92.5 92.9 90.2 88.0 86.1 83.6 81.4 -
*Heat is included
Final energy intensity (toe/million $15ppp)
Total energy intensity (toe/million $15ppp)
Natural gas final consumption, by sector
Refined products consumption
Imports
Exports
CO2 Emissions (Million tons CO 2 )
CO2 Intensity (tCO 2 /million $15ppp)
Oil final consumption, by sector
France(Million toe)
Total primary energy demand, by source
Total final consumption, by source
Electricity generation, by source
Total final consumption, by sector
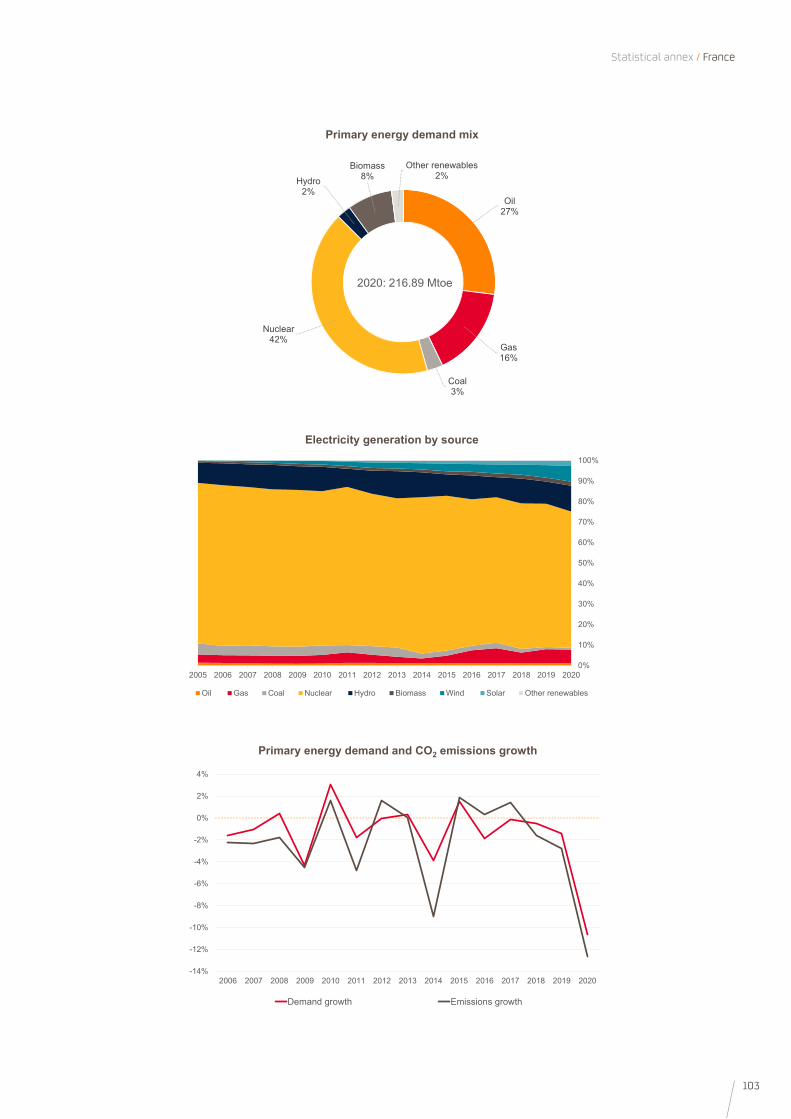
103
Statistical annex / France
0%
10%
20%
30%
40%
50%
60%
70%
80%
90%
100%
2005 2006 2007 2008 2009 2010 2011 2012 2013 2014 2015 2016 2017 2018 2019 2020
Oil Gas Coal Nuclear Hydro Biomass Wind Solar Other renewables
Electricity generation by source
-14%
-12%
-10%
-8%
-6%
-4%
-2%
0%
2%
4%
2006 2007 2008 2009 2010 2011 2012 2013 2014 2015 2016 2017 2018 2019 2020
Demand growth Emissions growth
Primary energy demand and CO2 emissions growth
Oil 27%
Gas16%
Coal3%
Nuclear42%
Hydro2%
Biomass8%
Other renewables2%
2020: 216.89 Mtoe
Primary energy demand mix

104
Annual / Energy-Statistics 2021
2011 2012 2013 2014 2015 2016 2017 2018 2019 2020 Peso en 2020 (%)
312.6 314.9 321.6 307.4 309.0 310.2 311.2 302.2 294.1 275.5 100.0
Oil 101.2 100.8 103.2 101.0 101.2 101.4 103.0 98.0 100.0 93.4 33.9Gas 69.6 69.8 73.1 63.4 65.1 70.3 75.3 73.5 75.9 74.1 26.9Coal 78.1 80.2 81.6 79.6 79.4 77.2 71.4 68.8 53.3 43.9 15.9Nuclear 28.1 25.9 25.4 25.3 23.9 22.1 19.9 19.8 19.6 16.8 6.1Hydro 1.5 1.9 2.0 1.7 1.6 1.8 1.7 1.5 1.8 1.6 0.6Biomass 27.6 30.6 31.1 30.3 30.5 30.5 30.8 30.1 30.5 30.6 11.1Other renewables 6.0 6.7 7.2 8.1 10.3 10.1 12.5 13.4 14.6 15.7 5.7Electricity balance of trade* 0.5 -1.0 -1.9 -1.9 -3.1 -3.3 -3.5 -3.0 -1.6 -0.4 -0.2
226.1 229.5 234.8 223.9 227.2 230.5 233.2 229.0 230.4 218.8 100.0
Oil 91.9 91.8 94.1 92.1 92.1 92.2 94.1 89.5 92.5 85.4 39.0Gas 50.2 52.0 55.0 49.7 51.4 54.8 55.2 56.8 56.6 55.6 25.4Coal 13.2 13.3 13.2 13.2 14.1 13.7 13.7 13.3 12.5 11.0 5.0Electricity 45.1 45.1 44.9 44.0 44.3 44.5 44.6 44.0 43.0 41.0 18.8Heat 10.6 10.9 11.0 9.9 10.3 10.5 10.6 10.4 10.2 10.0 4.6Biomass 15.0 16.3 16.6 15.0 15.0 14.8 15.1 15.0 15.5 15.8 7.2
52.7 54.0 54.9 54.0 55.8 55.9 56.2 55.3 52.6 49.2 100.0
Oil 0.6 0.7 0.6 0.5 0.5 0.5 0.5 0.4 0.4 0.4 0.7Gas 7.5 6.7 5.9 5.4 5.4 7.1 7.5 7.2 8.1 8.5 17.2Coal 23.4 24.6 25.7 24.5 24.4 23.5 21.7 20.6 15.6 12.2 24.8Nuclear 9.3 8.6 8.4 8.4 7.9 7.3 6.6 6.5 6.5 5.5 11.2Hydro 2.0 2.4 2.5 2.2 2.1 2.2 2.2 2.1 2.3 2.1 4.3Biomass 3.7 4.3 4.5 4.8 4.9 5.0 5.0 5.0 4.9 4.7 9.5Wind 4.3 4.4 4.5 5.0 6.9 6.9 9.1 9.5 10.6 11.1 22.6Solar 1.7 2.3 2.7 3.1 3.3 3.3 3.4 3.9 4.0 4.5 9.2Other renewables 0.2 0.2 0.2 0.2 0.2 0.2 0.2 0.2 0.2 0.2 0.3
226.1 229.5 234.8 223.9 227.2 230.5 233.2 229.0 230.4 218.8 100.0
Industry 62.8 62.8 62.5 62.2 62.6 63.1 63.8 64.3 62.5 58.2 26.6Transport 53.8 53.4 54.4 55.2 55.9 57.0 57.8 58.9 60.9 58.2 26.6Residential/Comercial 85.4 90.0 94.6 82.8 85.8 87.3 87.1 83.2 84.1 82.4 37.7
91.9 91.8 94.1 92.1 92.1 92.2 94.1 89.5 92.5 85.4 100.0
Industry 3.5 3.2 3.1 2.8 3.0 2.4 2.2 3.6 3.7 3.0 3.5Transport 49.7 49.1 50.4 51.1 52.0 53.1 53.9 54.9 57.0 53.4 62.6Residential/Comercial 19.1 20.1 21.7 19.0 18.5 18.3 18.1 13.4 14.0 13.5 15.8
50.2 52.0 55.0 49.7 51.4 54.8 55.2 56.8 56.6 55.6 100.0
Industry 19.5 19.6 19.6 19.2 19.2 20.0 20.9 20.3 19.9 19.1 34.4Transport 0.2 0.2 0.2 0.2 0.2 0.2 0.1 0.1 0.1 0.1 0.2Residential/Comercial 27.8 29.9 32.4 27.4 29.3 31.7 31.3 33.1 33.3 33.3 60.0
91.9 91.8 94.1 92.1 92.1 92.2 94.1 89.5 92.5 85.4 100.0
Gasoline 19.3 18.1 18.1 18.2 17.9 17.9 18.2 20.4 20.7 18.8 22.0Diesel 48.8 50.3 52.9 50.5 51.3 52.0 52.8 49.7 52.2 50.1 58.7Heating Oil 3.0 3.0 2.5 2.5 2.7 1.5 1.5 1.4 1.4 0.8 0.9Aviation Jet 0.7 0.7 0.7 0.7 0.7 0.8 0.7 0.6 0.6 0.5 0.6LPG 3.0 3.1 3.2 2.7 2.8 2.9 3.8 3.5 3.8 3.5 4.1
200.4 201.7 212.3 203.7 216.6 225.6 238.1 233.4 241.8 229.2 100.0
Oil 125.3 127.6 130.3 128.4 130.7 132.0 133.9 127.6 130.0 119.5 52.1Gas 75.1 74.1 81.9 75.3 85.9 93.5 104.2 105.9 111.8 109.7 47.9Gasoline 2.0 1.6 1.9 1.9 2.0 1.6 2.3 2.5 3.3 1.9 0.8Diesel 13.8 13.8 18.0 17.1 18.7 19.5 19.7 18.8 20.1 17.7 7.7Heating Oil 2.7 2.3 2.4 2.4 1.8 2.4 2.2 2.0 1.6 1.3 0.6Aviation Jet 4.3 5.0 5.4 4.9 5.1 5.1 6.1 6.7 7.0 3.1 1.4LPG 1.0 1.2 1.1 0.7 0.8 0.9 1.0 1.2 1.3 1.4 0.6
33.1 33.1 38.5 39.8 49.7 51.2 60.5 62.2 65.4 64.5 100.0
Oil 18.3 18.8 20.1 21.1 22.5 22.8 23.4 22.5 22.1 22.2 34.5Gas 14.7 14.3 18.4 18.7 27.2 28.4 37.1 39.7 43.2 42.3 65.5Gasoline 5.0 5.2 5.3 5.0 4.6 5.3 6.0 5.3 5.1 5.6 8.7Diesel 6.5 6.3 7.0 7.7 8.4 9.5 9.0 8.2 7.4 8.1 12.6Heating Oil 1.9 2.0 2.6 3.0 2.9 2.1 1.8 2.5 2.6 2.7 4.1Aviation Jet 0.8 1.2 1.2 0.9 1.2 0.9 1.3 1.4 1.4 0.7 1.1LPG 0.3 0.3 0.3 0.3 0.3 0.2 0.2 0.2 0.3 0.3 0.5
751.9 768.3 788.5 749.7 754.5 761.5 746.0 726.0 678.1 617.0 -
153.0 156.5 160.0 150.7 148.3 142.7 134.7 127.7 114.6 107.3 -
54.9 55.7 56.9 52.7 52.9 52.5 51.5 50.7 50.8 51.3 -
84.2 84.4 85.9 80.3 79.3 77.9 76.3 73.0 70.6 69.8 -
*Heat is included
Final energy intensity (toe/million $15ppp)
Total energy intensity (toe/million $15ppp)
Natural gas final consumption, by sector
Refined products consumption
Imports
Exports
CO2 Emissions (Million tons CO 2 )
CO2 Intensity (tCO 2 /million $15ppp)
Oil final consumption, by sector
Germany(Million toe)
Total primary energy demand, by source
Total final consumption, by source
Electricity generation, by source
Total final consumption, by sector
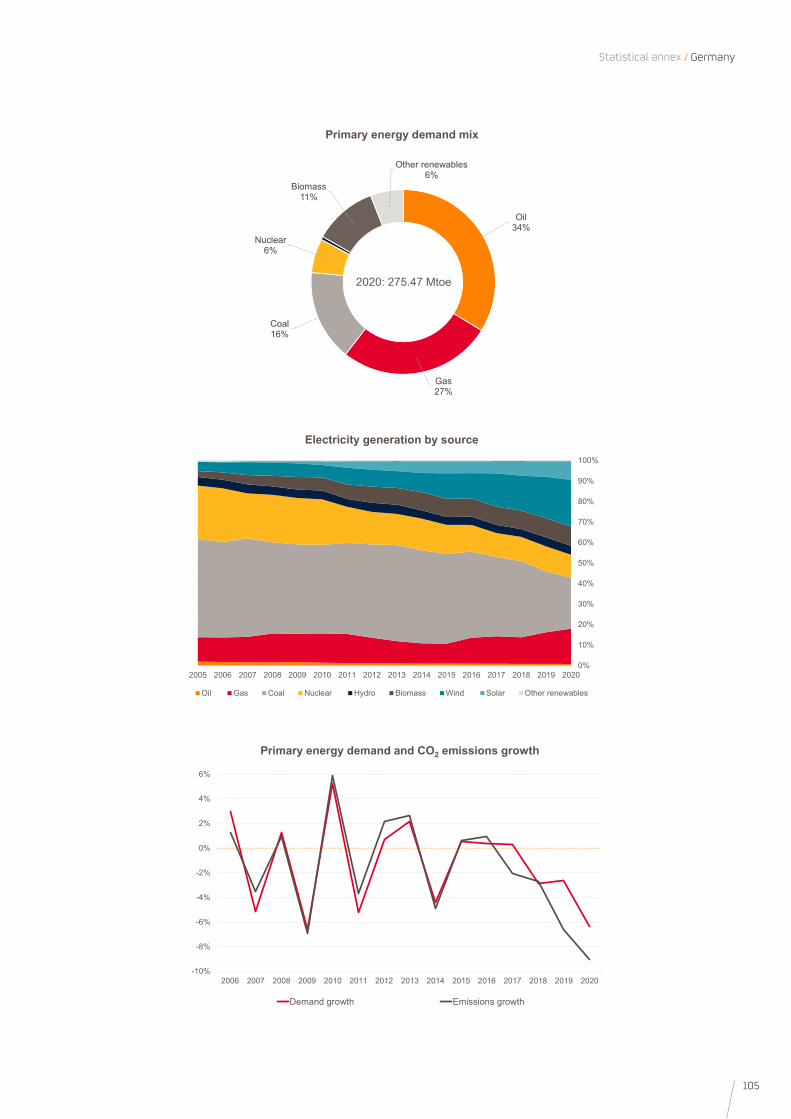
105
Statistical annex / Germany
0%
10%
20%
30%
40%
50%
60%
70%
80%
90%
100%
2005 2006 2007 2008 2009 2010 2011 2012 2013 2014 2015 2016 2017 2018 2019 2020
Oil Gas Coal Nuclear Hydro Biomass Wind Solar Other renewables
Electricity generation by source
-10%
-8%
-6%
-4%
-2%
0%
2%
4%
6%
2006 2007 2008 2009 2010 2011 2012 2013 2014 2015 2016 2017 2018 2019 2020
Demand growth Emissions growth
Primary energy demand and CO2 emissions growth
Oil 34%
Gas27%
Coal16%
Nuclear6%
Biomass11%
Other renewables6%
2020: 275.47 Mtoe
Primary energy demand mix

106
Annual / Energy-Statistics 2021
2011 2012 2013 2014 2015 2016 2017 2018 2019 2020 Peso en 2020 (%)
168.2 161.5 155.6 147.0 152.8 151.2 153.6 150.9 149.3 137.1 100.0
Oil 62.7 55.6 53.3 51.6 53.6 51.5 52.0 51.0 50.8 43.0 31.4Gas 63.8 61.4 57.4 50.7 55.3 58.1 61.5 59.5 60.9 58.2 42.4Coal 15.3 15.7 13.5 13.1 12.3 11.0 9.3 8.6 6.1 4.5 3.3Nuclear 0.0 0.0 0.0 0.0 0.0 0.0 0.0 0.0 0.0 0.0 0.0Hydro 3.9 3.6 4.5 5.0 3.9 3.6 3.1 4.2 3.9 4.0 2.9Biomass 11.3 13.5 14.6 14.0 14.6 14.4 14.9 14.5 14.8 15.2 11.1Other renewables 1.8 2.8 3.1 3.2 3.2 3.4 3.6 3.5 3.8 3.8 2.8Electricity balance of trade* 9.3 9.0 9.0 9.4 9.8 9.2 9.1 9.6 9.0 8.5 6.2
129.1 126.5 121.7 117.4 119.6 118.9 119.6 119.6 118.2 107.5 100.0
Oil 53.7 49.5 46.5 47.8 47.1 46.1 45.5 45.9 45.0 37.3 34.7Gas 35.8 35.7 35.5 31.2 33.4 33.7 34.4 34.0 33.3 32.0 29.8Coal 3.7 3.5 2.6 2.7 2.0 2.2 1.6 1.7 1.8 1.3 1.2Electricity 25.9 25.5 24.7 24.2 24.7 24.6 25.1 25.2 25.0 23.6 22.0Heat 3.5 3.7 4.0 4.0 4.2 4.3 4.5 4.6 4.5 4.5 4.2Biomass 6.5 8.6 8.5 7.4 8.3 8.0 8.6 8.3 8.6 8.8 8.2
26.0 25.7 24.9 24.1 24.3 24.9 25.4 24.9 25.1 24.1 100.0
Oil 1.7 1.6 1.3 1.2 1.2 1.0 1.0 0.9 1.0 0.7 2.9Gas 12.4 11.1 9.4 8.1 9.5 10.8 12.1 11.1 12.4 12.0 49.6Coal 4.3 4.7 4.2 4.0 3.9 3.3 3.0 2.7 1.4 1.0 4.3Nuclear 0.0 0.0 0.0 0.0 0.0 0.0 0.0 0.0 0.0 0.0 0.0Hydro 4.1 3.8 4.7 5.2 4.0 3.8 3.3 4.3 4.1 4.1 17.0Biomass 1.1 1.3 1.7 1.8 1.9 1.9 1.9 1.9 1.9 1.9 7.8Wind 0.8 1.2 1.3 1.3 1.3 1.5 1.5 1.5 1.7 1.6 6.7Solar 0.9 1.6 1.9 1.9 2.0 1.9 2.1 1.9 2.0 2.2 9.3Other renewables 0.6 0.5 0.6 0.6 0.6 0.6 0.6 0.6 0.6 0.6 2.3
129.1 126.5 121.7 117.4 119.6 118.9 119.6 119.6 118.2 107.5 100.0
Industry 30.2 28.7 26.6 26.0 26.0 26.2 25.7 25.0 24.8 22.6 21.0Transport 38.6 36.8 35.9 37.2 36.3 35.9 34.5 35.6 35.3 29.1 27.0Residential/Comercial 48.1 50.3 50.1 44.2 47.9 47.6 48.5 48.8 48.6 47.4 44.1
53.7 49.5 46.5 47.8 47.1 46.1 45.5 45.9 45.0 37.3 100.0
Industry 3.4 2.8 2.4 1.9 2.8 2.5 1.8 1.9 1.9 1.6 4.2Transport 35.6 33.8 32.9 34.4 33.3 33.0 31.7 32.5 32.4 26.1 69.9Residential/Comercial 3.8 3.4 3.3 2.8 2.9 2.8 2.6 2.7 2.7 2.6 6.9
35.8 35.7 35.5 31.2 33.4 33.7 34.4 34.0 33.3 32.0 100.0
Industry 9.3 9.0 8.7 8.5 8.3 8.4 8.9 8.6 8.5 7.8 24.4Transport 0.7 0.8 0.8 0.9 0.9 0.9 0.8 0.9 1.0 0.9 2.8Residential/Comercial 25.2 25.4 25.3 21.2 23.5 23.6 23.9 23.7 23.0 22.6 70.6
53.7 49.5 46.5 47.8 47.1 46.1 45.5 45.9 45.0 37.3 100.0
Gasoline 10.0 9.3 8.7 8.8 8.2 7.8 7.6 7.8 7.8 6.1 16.5Diesel 28.4 26.7 25.8 26.8 26.2 26.1 24.6 25.6 25.2 21.6 57.8Heating Oil 1.4 1.2 1.2 1.2 1.5 1.7 1.3 1.2 1.3 1.0 2.8Aviation Jet 0.8 0.8 0.8 0.8 0.8 0.9 0.9 1.0 1.0 0.4 1.0LPG 3.5 3.6 3.6 3.5 3.6 3.6 3.7 3.5 3.6 3.2 8.6
147.4 140.9 128.7 116.9 130.9 135.2 142.0 137.1 139.7 120.1 100.0
Oil 89.8 85.4 78.0 71.3 80.7 81.8 85.0 81.5 81.6 65.9 54.9Gas 57.6 55.5 50.8 45.7 50.2 53.5 57.0 55.6 58.1 54.2 45.1Gasoline 0.1 0.0 0.4 0.4 0.5 0.4 0.1 0.4 0.4 0.4 0.3Diesel 2.6 2.1 3.1 3.2 3.1 4.5 5.1 5.4 5.3 4.6 3.9Heating Oil 0.8 0.6 0.5 0.3 0.3 0.8 0.8 1.6 1.0 1.2 1.0Aviation Jet 1.3 1.1 1.5 1.6 1.9 2.1 2.3 2.4 2.6 0.8 0.7LPG 2.2 2.3 2.6 2.4 2.5 2.6 2.6 2.5 2.7 2.3 1.9
27.6 30.5 25.1 21.4 28.5 30.1 32.4 30.2 28.6 24.2 100.0
Oil 27.5 30.4 24.9 21.2 28.3 29.9 32.1 29.9 28.3 24.0 98.9Gas 0.1 0.1 0.2 0.2 0.2 0.2 0.2 0.3 0.3 0.3 1.1Gasoline 8.9 9.7 8.3 7.4 9.0 8.5 8.9 8.9 8.9 6.6 27.2Diesel 9.5 10.9 8.6 5.6 9.1 9.5 10.4 9.1 9.8 7.8 32.3Heating Oil 2.7 3.0 2.1 2.7 3.9 4.5 5.0 4.3 3.6 3.2 13.2Aviation Jet 0.2 0.1 0.0 0.0 0.0 0.1 0.2 0.3 0.3 0.1 0.2LPG 0.4 0.4 0.5 0.2 0.3 0.4 0.3 0.2 0.3 0.3 1.2
393.5 374.9 343.7 328.1 336.0 333.1 329.2 324.0 317.4 275.8 -
168.5 165.4 154.5 147.5 149.9 146.7 142.6 139.2 136.0 129.7 -
51.3 52.4 51.9 49.5 50.4 49.6 48.4 48.3 47.9 48.0 -
72.0 71.3 70.0 66.1 68.2 66.6 66.5 64.9 64.0 64.5 -
*Heat is included
Final energy intensity (toe/million $15ppp)
Total energy intensity (toe/million $15ppp)
Natural gas final consumption, by sector
Refined products consumption
Imports
Exports
CO2 Emissions (Million tons CO 2 )
CO2 Intensity (tCO 2 /million $15ppp)
Oil final consumption, by sector
Italy(Million toe)
Total primary energy demand, by source
Total final consumption, by source
Electricity generation, by source
Total final consumption, by sector
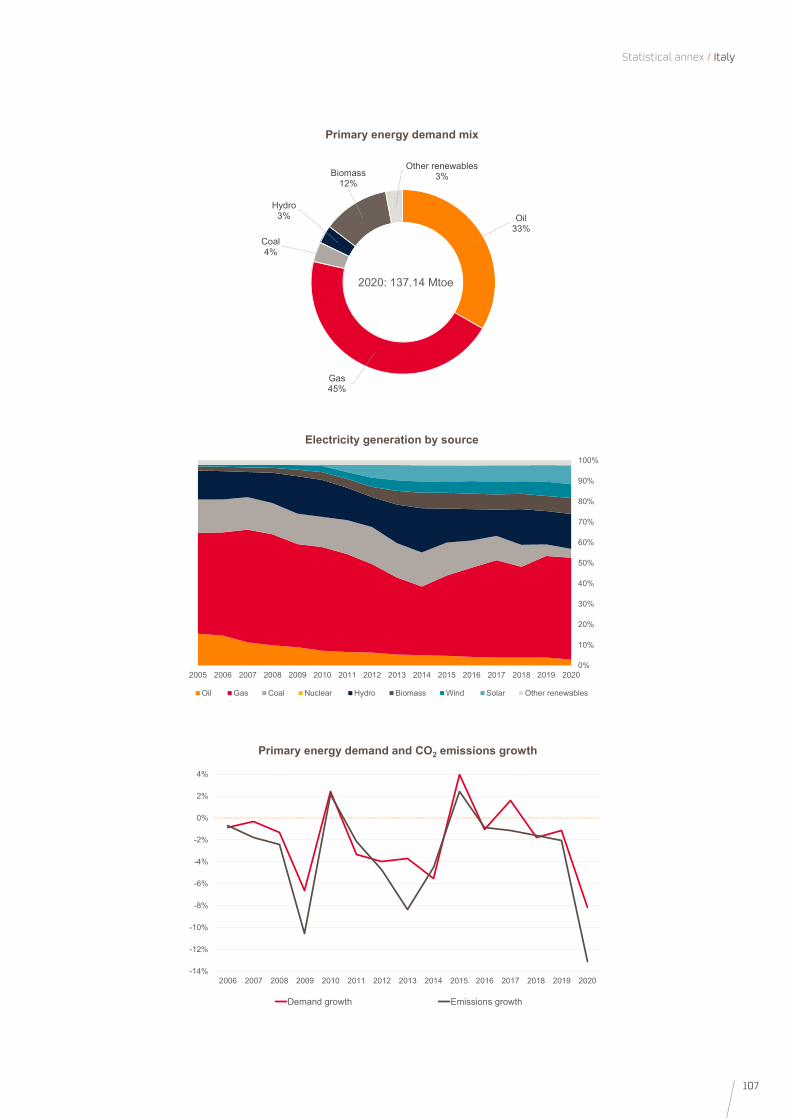
107
Statistical annex / Italy
0%
10%
20%
30%
40%
50%
60%
70%
80%
90%
100%
2005 2006 2007 2008 2009 2010 2011 2012 2013 2014 2015 2016 2017 2018 2019 2020
Oil Gas Coal Nuclear Hydro Biomass Wind Solar Other renewables
Electricity generation by source
-14%
-12%
-10%
-8%
-6%
-4%
-2%
0%
2%
4%
2006 2007 2008 2009 2010 2011 2012 2013 2014 2015 2016 2017 2018 2019 2020
Demand growth Emissions growth
Primary energy demand and CO2 emissions growth
Oil 33%
Gas45%
Coal4%
Hydro3%
Biomass12%
Other renewables3%
2020: 137.14 Mtoe
Primary energy demand mix
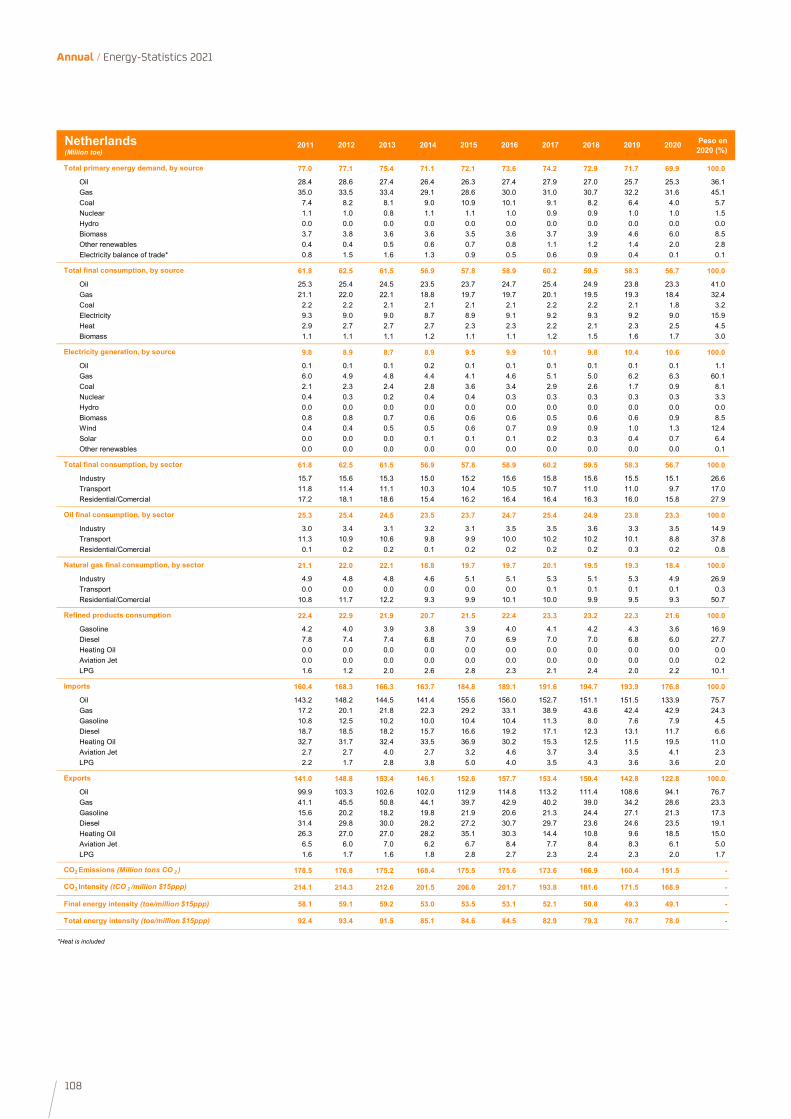
108
Annual / Energy-Statistics 2021
2011 2012 2013 2014 2015 2016 2017 2018 2019 2020 Peso en 2020 (%)
77.0 77.1 75.4 71.1 72.1 73.6 74.2 72.9 71.7 69.9 100.0
Oil 28.4 28.6 27.4 26.4 26.3 27.4 27.9 27.0 25.7 25.3 36.1Gas 35.0 33.5 33.4 29.1 28.6 30.0 31.0 30.7 32.2 31.6 45.1Coal 7.4 8.2 8.1 9.0 10.9 10.1 9.1 8.2 6.4 4.0 5.7Nuclear 1.1 1.0 0.8 1.1 1.1 1.0 0.9 0.9 1.0 1.0 1.5Hydro 0.0 0.0 0.0 0.0 0.0 0.0 0.0 0.0 0.0 0.0 0.0Biomass 3.7 3.8 3.6 3.6 3.5 3.6 3.7 3.9 4.6 6.0 8.5Other renewables 0.4 0.4 0.5 0.6 0.7 0.8 1.1 1.2 1.4 2.0 2.8Electricity balance of trade* 0.8 1.5 1.6 1.3 0.9 0.5 0.6 0.9 0.4 0.1 0.1
61.8 62.5 61.5 56.9 57.8 58.9 60.2 59.5 58.3 56.7 100.0
Oil 25.3 25.4 24.5 23.5 23.7 24.7 25.4 24.9 23.8 23.3 41.0Gas 21.1 22.0 22.1 18.8 19.7 19.7 20.1 19.5 19.3 18.4 32.4Coal 2.2 2.2 2.1 2.1 2.1 2.1 2.2 2.2 2.1 1.8 3.2Electricity 9.3 9.0 9.0 8.7 8.9 9.1 9.2 9.3 9.2 9.0 15.9Heat 2.9 2.7 2.7 2.7 2.3 2.3 2.2 2.1 2.3 2.5 4.5Biomass 1.1 1.1 1.1 1.2 1.1 1.1 1.2 1.5 1.6 1.7 3.0
9.8 8.9 8.7 8.9 9.5 9.9 10.1 9.8 10.4 10.6 100.0
Oil 0.1 0.1 0.1 0.2 0.1 0.1 0.1 0.1 0.1 0.1 1.1Gas 6.0 4.9 4.8 4.4 4.1 4.6 5.1 5.0 6.2 6.3 60.1Coal 2.1 2.3 2.4 2.8 3.6 3.4 2.9 2.6 1.7 0.9 8.1Nuclear 0.4 0.3 0.2 0.4 0.4 0.3 0.3 0.3 0.3 0.3 3.3Hydro 0.0 0.0 0.0 0.0 0.0 0.0 0.0 0.0 0.0 0.0 0.0Biomass 0.8 0.8 0.7 0.6 0.6 0.6 0.5 0.6 0.6 0.9 8.5Wind 0.4 0.4 0.5 0.5 0.6 0.7 0.9 0.9 1.0 1.3 12.4Solar 0.0 0.0 0.0 0.1 0.1 0.1 0.2 0.3 0.4 0.7 6.4Other renewables 0.0 0.0 0.0 0.0 0.0 0.0 0.0 0.0 0.0 0.0 0.1
61.8 62.5 61.5 56.9 57.8 58.9 60.2 59.5 58.3 56.7 100.0
Industry 15.7 15.6 15.3 15.0 15.2 15.6 15.8 15.6 15.5 15.1 26.6Transport 11.8 11.4 11.1 10.3 10.4 10.5 10.7 11.0 11.0 9.7 17.0Residential/Comercial 17.2 18.1 18.6 15.4 16.2 16.4 16.4 16.3 16.0 15.8 27.9
25.3 25.4 24.5 23.5 23.7 24.7 25.4 24.9 23.8 23.3 100.0
Industry 3.0 3.4 3.1 3.2 3.1 3.5 3.5 3.6 3.3 3.5 14.9Transport 11.3 10.9 10.6 9.8 9.9 10.0 10.2 10.2 10.1 8.8 37.8Residential/Comercial 0.1 0.2 0.2 0.1 0.2 0.2 0.2 0.2 0.3 0.2 0.8
21.1 22.0 22.1 18.8 19.7 19.7 20.1 19.5 19.3 18.4 100.0
Industry 4.9 4.8 4.8 4.6 5.1 5.1 5.3 5.1 5.3 4.9 26.9Transport 0.0 0.0 0.0 0.0 0.0 0.0 0.1 0.1 0.1 0.1 0.3Residential/Comercial 10.8 11.7 12.2 9.3 9.9 10.1 10.0 9.9 9.5 9.3 50.7
22.4 22.9 21.9 20.7 21.5 22.4 23.3 23.2 22.3 21.6 100.0
Gasoline 4.2 4.0 3.9 3.8 3.9 4.0 4.1 4.2 4.3 3.6 16.9Diesel 7.8 7.4 7.4 6.8 7.0 6.9 7.0 7.0 6.8 6.0 27.7Heating Oil 0.0 0.0 0.0 0.0 0.0 0.0 0.0 0.0 0.0 0.0 0.0Aviation Jet 0.0 0.0 0.0 0.0 0.0 0.0 0.0 0.0 0.0 0.0 0.2LPG 1.6 1.2 2.0 2.6 2.8 2.3 2.1 2.4 2.0 2.2 10.1
160.4 168.3 166.3 163.7 184.8 189.1 191.6 194.7 193.9 176.8 100.0
Oil 143.2 148.2 144.5 141.4 155.6 156.0 152.7 151.1 151.5 133.9 75.7Gas 17.2 20.1 21.8 22.3 29.2 33.1 38.9 43.6 42.4 42.9 24.3Gasoline 10.8 12.5 10.2 10.0 10.4 10.4 11.3 8.0 7.6 7.9 4.5Diesel 18.7 18.5 18.2 15.7 16.6 19.2 17.1 12.3 13.1 11.7 6.6Heating Oil 32.7 31.7 32.4 33.5 36.9 30.2 15.3 12.5 11.5 19.5 11.0Aviation Jet 2.7 2.7 4.0 2.7 3.2 4.6 3.7 3.4 3.5 4.1 2.3LPG 2.2 1.7 2.8 3.8 5.0 4.0 3.5 4.3 3.6 3.6 2.0
141.0 148.8 153.4 146.1 152.6 157.7 153.4 150.4 142.8 122.8 100.0
Oil 99.9 103.3 102.6 102.0 112.9 114.8 113.2 111.4 108.6 94.1 76.7Gas 41.1 45.5 50.8 44.1 39.7 42.9 40.2 39.0 34.2 28.6 23.3Gasoline 15.6 20.2 18.2 19.8 21.9 20.6 21.3 24.4 27.1 21.3 17.3Diesel 31.4 29.8 30.0 28.2 27.2 30.7 29.7 23.6 24.6 23.5 19.1Heating Oil 26.3 27.0 27.0 28.2 35.1 30.3 14.4 10.8 9.6 18.5 15.0Aviation Jet 6.5 6.0 7.0 6.2 6.7 8.4 7.7 8.4 8.3 6.1 5.0LPG 1.6 1.7 1.6 1.8 2.8 2.7 2.3 2.4 2.3 2.0 1.7
178.5 176.8 175.2 168.4 175.5 175.6 173.6 166.9 160.4 151.5 -
214.1 214.3 212.6 201.5 206.0 201.7 193.8 181.6 171.5 168.9 -
58.1 59.1 59.2 53.0 53.5 53.1 52.1 50.8 49.3 49.1 -
92.4 93.4 91.5 85.1 84.6 84.5 82.9 79.3 76.7 78.0 -
*Heat is included
Final energy intensity (toe/million $15ppp)
Total energy intensity (toe/million $15ppp)
Natural gas final consumption, by sector
Refined products consumption
Imports
Exports
CO2 Emissions (Million tons CO 2 )
CO2 Intensity (tCO 2 /million $15ppp)
Oil final consumption, by sector
Netherlands(Million toe)
Total primary energy demand, by source
Total final consumption, by source
Electricity generation, by source
Total final consumption, by sector
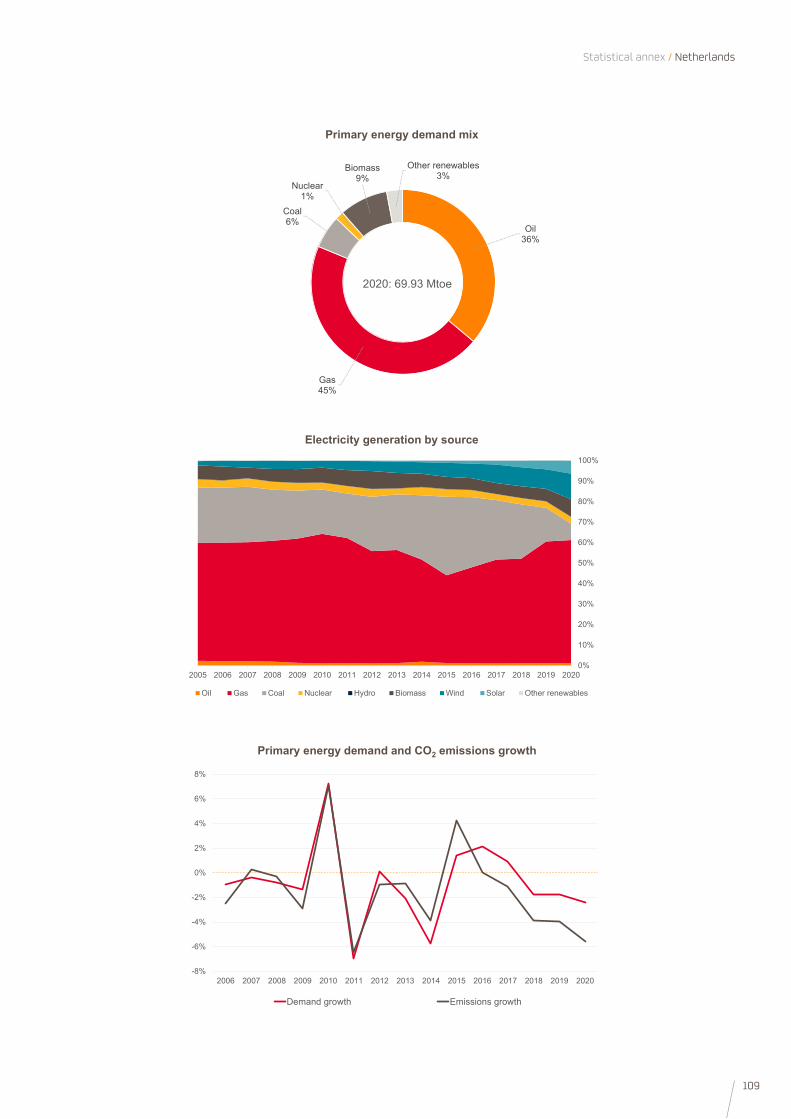
109
Statistical annex / Netherlands
0%
10%
20%
30%
40%
50%
60%
70%
80%
90%
100%
2005 2006 2007 2008 2009 2010 2011 2012 2013 2014 2015 2016 2017 2018 2019 2020
Oil Gas Coal Nuclear Hydro Biomass Wind Solar Other renewables
Electricity generation by source
-8%
-6%
-4%
-2%
0%
2%
4%
6%
8%
2006 2007 2008 2009 2010 2011 2012 2013 2014 2015 2016 2017 2018 2019 2020
Demand growth Emissions growth
Primary energy demand and CO2 emissions growth
Oil 36%
Gas45%
Coal6%
Nuclear1%
Biomass9%
Other renewables3%
2020: 69.93 Mtoe
Primary energy demand mix
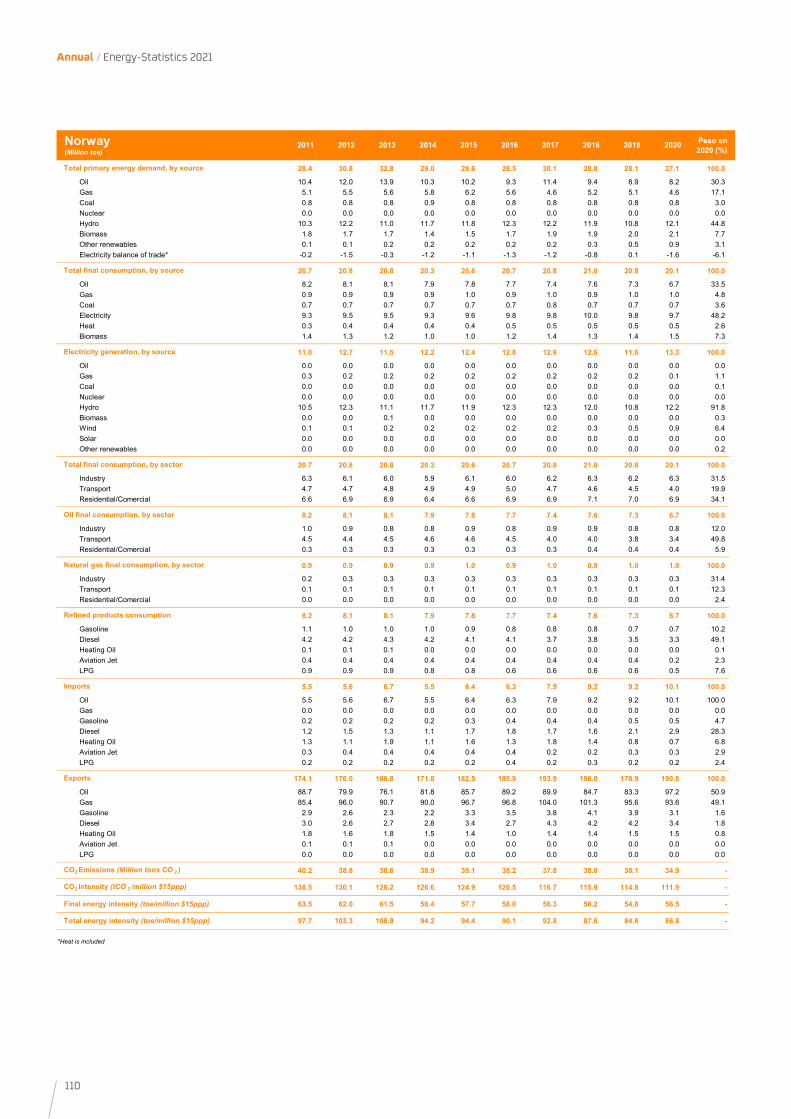
110
Annual / Energy-Statistics 2021
2011 2012 2013 2014 2015 2016 2017 2018 2019 2020 Peso en 2020 (%)
28.4 30.8 32.8 29.0 29.6 28.5 30.1 28.8 28.1 27.1 100.0
Oil 10.4 12.0 13.9 10.3 10.2 9.3 11.4 9.4 8.9 8.2 30.3Gas 5.1 5.5 5.6 5.8 6.2 5.6 4.6 5.2 5.1 4.6 17.1Coal 0.8 0.8 0.8 0.9 0.8 0.8 0.8 0.8 0.8 0.8 3.0Nuclear 0.0 0.0 0.0 0.0 0.0 0.0 0.0 0.0 0.0 0.0 0.0Hydro 10.3 12.2 11.0 11.7 11.8 12.3 12.2 11.9 10.8 12.1 44.8Biomass 1.8 1.7 1.7 1.4 1.5 1.7 1.9 1.9 2.0 2.1 7.7Other renewables 0.1 0.1 0.2 0.2 0.2 0.2 0.2 0.3 0.5 0.9 3.1Electricity balance of trade* -0.2 -1.5 -0.3 -1.2 -1.1 -1.3 -1.2 -0.8 0.1 -1.6 -6.1
20.7 20.8 20.8 20.3 20.6 20.7 20.8 21.0 20.8 20.1 100.0
Oil 8.2 8.1 8.1 7.9 7.8 7.7 7.4 7.6 7.3 6.7 33.5Gas 0.9 0.9 0.9 0.9 1.0 0.9 1.0 0.9 1.0 1.0 4.8Coal 0.7 0.7 0.7 0.7 0.7 0.7 0.8 0.7 0.7 0.7 3.6Electricity 9.3 9.5 9.5 9.3 9.6 9.8 9.8 10.0 9.8 9.7 48.2Heat 0.3 0.4 0.4 0.4 0.4 0.5 0.5 0.5 0.5 0.5 2.6Biomass 1.4 1.3 1.2 1.0 1.0 1.2 1.4 1.3 1.4 1.5 7.3
11.0 12.7 11.5 12.2 12.4 12.8 12.9 12.6 11.6 13.3 100.0
Oil 0.0 0.0 0.0 0.0 0.0 0.0 0.0 0.0 0.0 0.0 0.0Gas 0.3 0.2 0.2 0.2 0.2 0.2 0.2 0.2 0.2 0.1 1.1Coal 0.0 0.0 0.0 0.0 0.0 0.0 0.0 0.0 0.0 0.0 0.1Nuclear 0.0 0.0 0.0 0.0 0.0 0.0 0.0 0.0 0.0 0.0 0.0Hydro 10.5 12.3 11.1 11.7 11.9 12.3 12.3 12.0 10.8 12.2 91.8Biomass 0.0 0.0 0.1 0.0 0.0 0.0 0.0 0.0 0.0 0.0 0.3Wind 0.1 0.1 0.2 0.2 0.2 0.2 0.2 0.3 0.5 0.9 6.4Solar 0.0 0.0 0.0 0.0 0.0 0.0 0.0 0.0 0.0 0.0 0.0Other renewables 0.0 0.0 0.0 0.0 0.0 0.0 0.0 0.0 0.0 0.0 0.2
20.7 20.8 20.8 20.3 20.6 20.7 20.8 21.0 20.8 20.1 100.0
Industry 6.3 6.1 6.0 5.9 6.1 6.0 6.2 6.3 6.2 6.3 31.5Transport 4.7 4.7 4.8 4.9 4.9 5.0 4.7 4.6 4.5 4.0 19.9Residential/Comercial 6.6 6.9 6.9 6.4 6.6 6.9 6.9 7.1 7.0 6.9 34.1
8.2 8.1 8.1 7.9 7.8 7.7 7.4 7.6 7.3 6.7 100.0
Industry 1.0 0.9 0.8 0.8 0.9 0.8 0.9 0.9 0.8 0.8 12.0Transport 4.5 4.4 4.5 4.6 4.6 4.5 4.0 4.0 3.8 3.4 49.8Residential/Comercial 0.3 0.3 0.3 0.3 0.3 0.3 0.3 0.4 0.4 0.4 5.9
0.9 0.9 0.9 0.9 1.0 0.9 1.0 0.9 1.0 1.0 100.0
Industry 0.2 0.3 0.3 0.3 0.3 0.3 0.3 0.3 0.3 0.3 31.4Transport 0.1 0.1 0.1 0.1 0.1 0.1 0.1 0.1 0.1 0.1 12.3Residential/Comercial 0.0 0.0 0.0 0.0 0.0 0.0 0.0 0.0 0.0 0.0 2.4
8.2 8.1 8.1 7.9 7.8 7.7 7.4 7.6 7.3 6.7 100.0
Gasoline 1.1 1.0 1.0 1.0 0.9 0.8 0.8 0.8 0.7 0.7 10.2Diesel 4.2 4.2 4.3 4.2 4.1 4.1 3.7 3.8 3.5 3.3 49.1Heating Oil 0.1 0.1 0.1 0.0 0.0 0.0 0.0 0.0 0.0 0.0 0.1Aviation Jet 0.4 0.4 0.4 0.4 0.4 0.4 0.4 0.4 0.4 0.2 2.3LPG 0.9 0.9 0.9 0.8 0.8 0.6 0.6 0.6 0.6 0.5 7.6
5.5 5.6 6.7 5.5 6.4 6.3 7.9 9.2 9.2 10.1 100.0
Oil 5.5 5.6 6.7 5.5 6.4 6.3 7.9 9.2 9.2 10.1 100.0Gas 0.0 0.0 0.0 0.0 0.0 0.0 0.0 0.0 0.0 0.0 0.0Gasoline 0.2 0.2 0.2 0.2 0.3 0.4 0.4 0.4 0.5 0.5 4.7Diesel 1.2 1.5 1.3 1.1 1.7 1.8 1.7 1.6 2.1 2.9 28.3Heating Oil 1.3 1.1 1.9 1.1 1.6 1.3 1.8 1.4 0.8 0.7 6.8Aviation Jet 0.3 0.4 0.4 0.4 0.4 0.4 0.2 0.2 0.3 0.3 2.9LPG 0.2 0.2 0.2 0.2 0.2 0.4 0.2 0.3 0.2 0.2 2.4
174.1 176.0 166.8 171.8 182.5 185.9 193.9 186.0 178.9 190.8 100.0
Oil 88.7 79.9 76.1 81.8 85.7 89.2 89.9 84.7 83.3 97.2 50.9Gas 85.4 96.0 90.7 90.0 96.7 96.8 104.0 101.3 95.6 93.6 49.1Gasoline 2.9 2.6 2.3 2.2 3.3 3.5 3.8 4.1 3.9 3.1 1.6Diesel 3.0 2.6 2.7 2.8 3.4 2.7 4.3 4.2 4.2 3.4 1.8Heating Oil 1.8 1.6 1.8 1.5 1.4 1.0 1.4 1.4 1.5 1.5 0.8Aviation Jet 0.1 0.1 0.1 0.0 0.0 0.0 0.0 0.0 0.0 0.0 0.0LPG 0.0 0.0 0.0 0.0 0.0 0.0 0.0 0.0 0.0 0.0 0.0
40.2 38.8 38.6 38.9 39.1 38.2 37.8 38.0 38.1 34.9 -
138.5 130.1 128.2 126.6 124.9 120.5 116.7 115.9 114.8 111.9 -
63.5 62.0 61.5 58.4 57.7 58.0 56.3 56.2 54.8 56.5 -
97.7 103.3 108.9 94.2 94.4 90.1 92.8 87.6 84.8 86.8 -
*Heat is included
Final energy intensity (toe/million $15ppp)
Total energy intensity (toe/million $15ppp)
Natural gas final consumption, by sector
Refined products consumption
Imports
Exports
CO2 Emissions (Million tons CO 2 )
CO2 Intensity (tCO 2 /million $15ppp)
Oil final consumption, by sector
Norway(Million toe)
Total primary energy demand, by source
Total final consumption, by source
Electricity generation, by source
Total final consumption, by sector
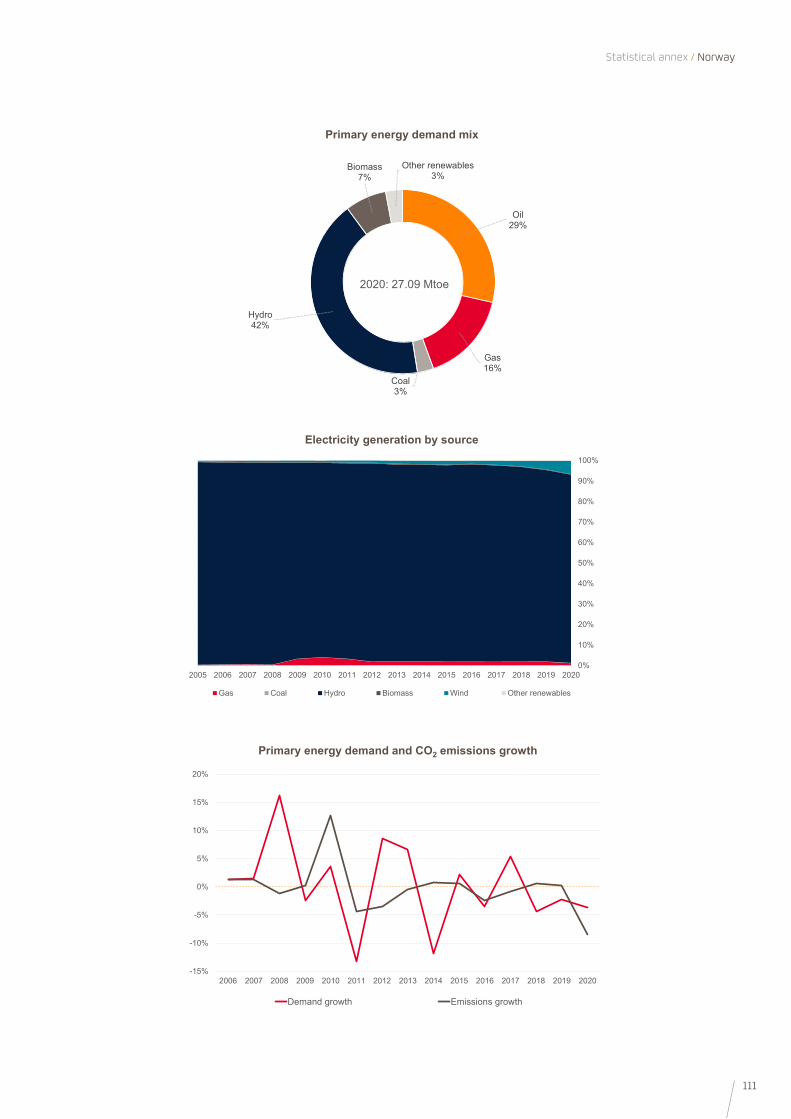
111
Statistical annex / Norway
0%
10%
20%
30%
40%
50%
60%
70%
80%
90%
100%
2005 2006 2007 2008 2009 2010 2011 2012 2013 2014 2015 2016 2017 2018 2019 2020
Gas Coal Hydro Biomass Wind Other renewables
Electricity generation by source
-15%
-10%
-5%
0%
5%
10%
15%
20%
2006 2007 2008 2009 2010 2011 2012 2013 2014 2015 2016 2017 2018 2019 2020
Demand growth Emissions growth
Primary energy demand and CO2 emissions growth
Oil 29%
Gas16%
Coal3%
Hydro42%
Biomass7%
Other renewables3%
2020: 27.09 Mtoe
Primary energy demand mix
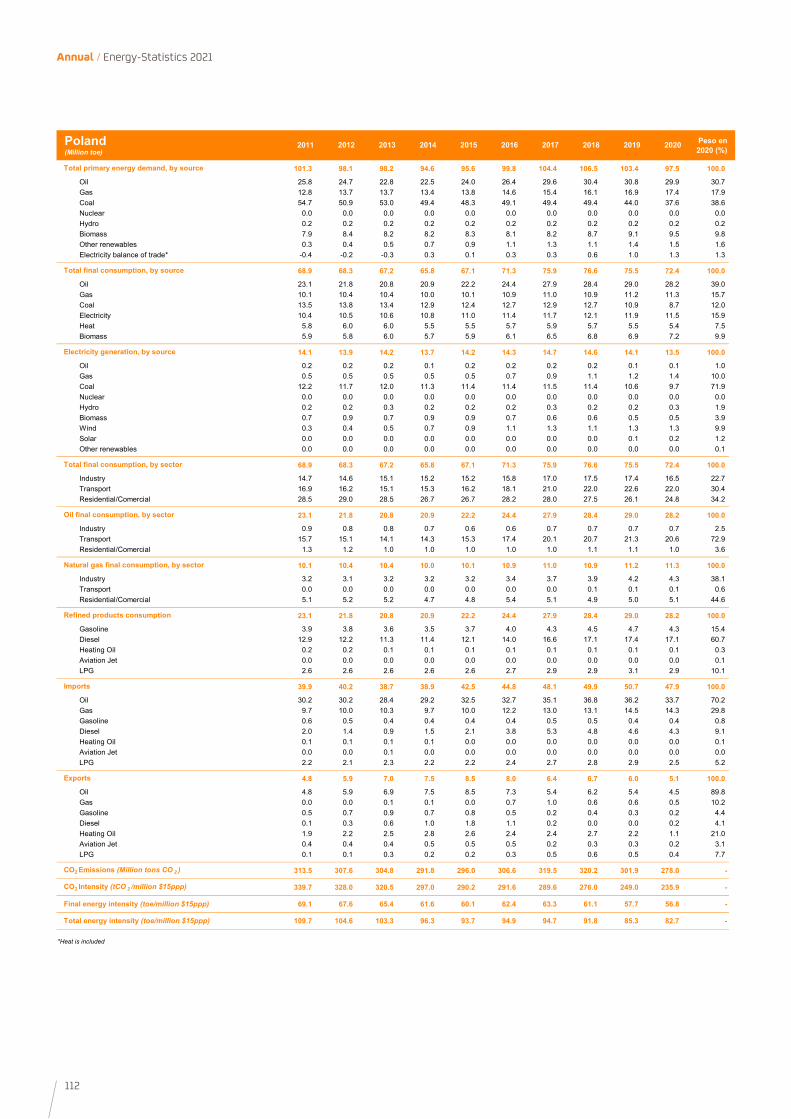
112
Annual / Energy-Statistics 2021
2011 2012 2013 2014 2015 2016 2017 2018 2019 2020 Peso en 2020 (%)
101.3 98.1 98.2 94.6 95.6 99.8 104.4 106.5 103.4 97.5 100.0
Oil 25.8 24.7 22.8 22.5 24.0 26.4 29.6 30.4 30.8 29.9 30.7Gas 12.8 13.7 13.7 13.4 13.8 14.6 15.4 16.1 16.9 17.4 17.9Coal 54.7 50.9 53.0 49.4 48.3 49.1 49.4 49.4 44.0 37.6 38.6Nuclear 0.0 0.0 0.0 0.0 0.0 0.0 0.0 0.0 0.0 0.0 0.0Hydro 0.2 0.2 0.2 0.2 0.2 0.2 0.2 0.2 0.2 0.2 0.2Biomass 7.9 8.4 8.2 8.2 8.3 8.1 8.2 8.7 9.1 9.5 9.8Other renewables 0.3 0.4 0.5 0.7 0.9 1.1 1.3 1.1 1.4 1.5 1.6Electricity balance of trade* -0.4 -0.2 -0.3 0.3 0.1 0.3 0.3 0.6 1.0 1.3 1.3
68.9 68.3 67.2 65.8 67.1 71.3 75.9 76.6 75.5 72.4 100.0
Oil 23.1 21.8 20.8 20.9 22.2 24.4 27.9 28.4 29.0 28.2 39.0Gas 10.1 10.4 10.4 10.0 10.1 10.9 11.0 10.9 11.2 11.3 15.7Coal 13.5 13.8 13.4 12.9 12.4 12.7 12.9 12.7 10.9 8.7 12.0Electricity 10.4 10.5 10.6 10.8 11.0 11.4 11.7 12.1 11.9 11.5 15.9Heat 5.8 6.0 6.0 5.5 5.5 5.7 5.9 5.7 5.5 5.4 7.5Biomass 5.9 5.8 6.0 5.7 5.9 6.1 6.5 6.8 6.9 7.2 9.9
14.1 13.9 14.2 13.7 14.2 14.3 14.7 14.6 14.1 13.5 100.0
Oil 0.2 0.2 0.2 0.1 0.2 0.2 0.2 0.2 0.1 0.1 1.0Gas 0.5 0.5 0.5 0.5 0.5 0.7 0.9 1.1 1.2 1.4 10.0Coal 12.2 11.7 12.0 11.3 11.4 11.4 11.5 11.4 10.6 9.7 71.9Nuclear 0.0 0.0 0.0 0.0 0.0 0.0 0.0 0.0 0.0 0.0 0.0Hydro 0.2 0.2 0.3 0.2 0.2 0.2 0.3 0.2 0.2 0.3 1.9Biomass 0.7 0.9 0.7 0.9 0.9 0.7 0.6 0.6 0.5 0.5 3.9Wind 0.3 0.4 0.5 0.7 0.9 1.1 1.3 1.1 1.3 1.3 9.9Solar 0.0 0.0 0.0 0.0 0.0 0.0 0.0 0.0 0.1 0.2 1.2Other renewables 0.0 0.0 0.0 0.0 0.0 0.0 0.0 0.0 0.0 0.0 0.1
68.9 68.3 67.2 65.8 67.1 71.3 75.9 76.6 75.5 72.4 100.0
Industry 14.7 14.6 15.1 15.2 15.2 15.8 17.0 17.5 17.4 16.5 22.7Transport 16.9 16.2 15.1 15.3 16.2 18.1 21.0 22.0 22.6 22.0 30.4Residential/Comercial 28.5 29.0 28.5 26.7 26.7 28.2 28.0 27.5 26.1 24.8 34.2
23.1 21.8 20.8 20.9 22.2 24.4 27.9 28.4 29.0 28.2 100.0
Industry 0.9 0.8 0.8 0.7 0.6 0.6 0.7 0.7 0.7 0.7 2.5Transport 15.7 15.1 14.1 14.3 15.3 17.4 20.1 20.7 21.3 20.6 72.9Residential/Comercial 1.3 1.2 1.0 1.0 1.0 1.0 1.0 1.1 1.1 1.0 3.6
10.1 10.4 10.4 10.0 10.1 10.9 11.0 10.9 11.2 11.3 100.0
Industry 3.2 3.1 3.2 3.2 3.2 3.4 3.7 3.9 4.2 4.3 38.1Transport 0.0 0.0 0.0 0.0 0.0 0.0 0.0 0.1 0.1 0.1 0.6Residential/Comercial 5.1 5.2 5.2 4.7 4.8 5.4 5.1 4.9 5.0 5.1 44.6
23.1 21.8 20.8 20.9 22.2 24.4 27.9 28.4 29.0 28.2 100.0
Gasoline 3.9 3.8 3.6 3.5 3.7 4.0 4.3 4.5 4.7 4.3 15.4Diesel 12.9 12.2 11.3 11.4 12.1 14.0 16.6 17.1 17.4 17.1 60.7Heating Oil 0.2 0.2 0.1 0.1 0.1 0.1 0.1 0.1 0.1 0.1 0.3Aviation Jet 0.0 0.0 0.0 0.0 0.0 0.0 0.0 0.0 0.0 0.0 0.1LPG 2.6 2.6 2.6 2.6 2.6 2.7 2.9 2.9 3.1 2.9 10.1
39.9 40.2 38.7 38.9 42.5 44.8 48.1 49.9 50.7 47.9 100.0
Oil 30.2 30.2 28.4 29.2 32.5 32.7 35.1 36.8 36.2 33.7 70.2Gas 9.7 10.0 10.3 9.7 10.0 12.2 13.0 13.1 14.5 14.3 29.8Gasoline 0.6 0.5 0.4 0.4 0.4 0.4 0.5 0.5 0.4 0.4 0.8Diesel 2.0 1.4 0.9 1.5 2.1 3.8 5.3 4.8 4.6 4.3 9.1Heating Oil 0.1 0.1 0.1 0.1 0.0 0.0 0.0 0.0 0.0 0.0 0.1Aviation Jet 0.0 0.0 0.1 0.0 0.0 0.0 0.0 0.0 0.0 0.0 0.0LPG 2.2 2.1 2.3 2.2 2.2 2.4 2.7 2.8 2.9 2.5 5.2
4.8 5.9 7.0 7.5 8.5 8.0 6.4 6.7 6.0 5.1 100.0
Oil 4.8 5.9 6.9 7.5 8.5 7.3 5.4 6.2 5.4 4.5 89.8Gas 0.0 0.0 0.1 0.1 0.0 0.7 1.0 0.6 0.6 0.5 10.2Gasoline 0.5 0.7 0.9 0.7 0.8 0.5 0.2 0.4 0.3 0.2 4.4Diesel 0.1 0.3 0.6 1.0 1.8 1.1 0.2 0.0 0.0 0.2 4.1Heating Oil 1.9 2.2 2.5 2.8 2.6 2.4 2.4 2.7 2.2 1.1 21.0Aviation Jet 0.4 0.4 0.4 0.5 0.5 0.5 0.2 0.3 0.3 0.2 3.1LPG 0.1 0.1 0.3 0.2 0.2 0.3 0.5 0.6 0.5 0.4 7.7
313.5 307.6 304.8 291.8 296.0 306.6 319.5 320.2 301.9 278.0 -
339.7 328.0 320.5 297.0 290.2 291.6 289.6 276.0 249.0 235.9 -
69.1 67.6 65.4 61.6 60.1 62.4 63.3 61.1 57.7 56.8 -
109.7 104.6 103.3 96.3 93.7 94.9 94.7 91.8 85.3 82.7 -
*Heat is included
Final energy intensity (toe/million $15ppp)
Total energy intensity (toe/million $15ppp)
Natural gas final consumption, by sector
Refined products consumption
Imports
Exports
CO2 Emissions (Million tons CO 2 )
CO2 Intensity (tCO 2 /million $15ppp)
Oil final consumption, by sector
Poland(Million toe)
Total primary energy demand, by source
Total final consumption, by source
Electricity generation, by source
Total final consumption, by sector
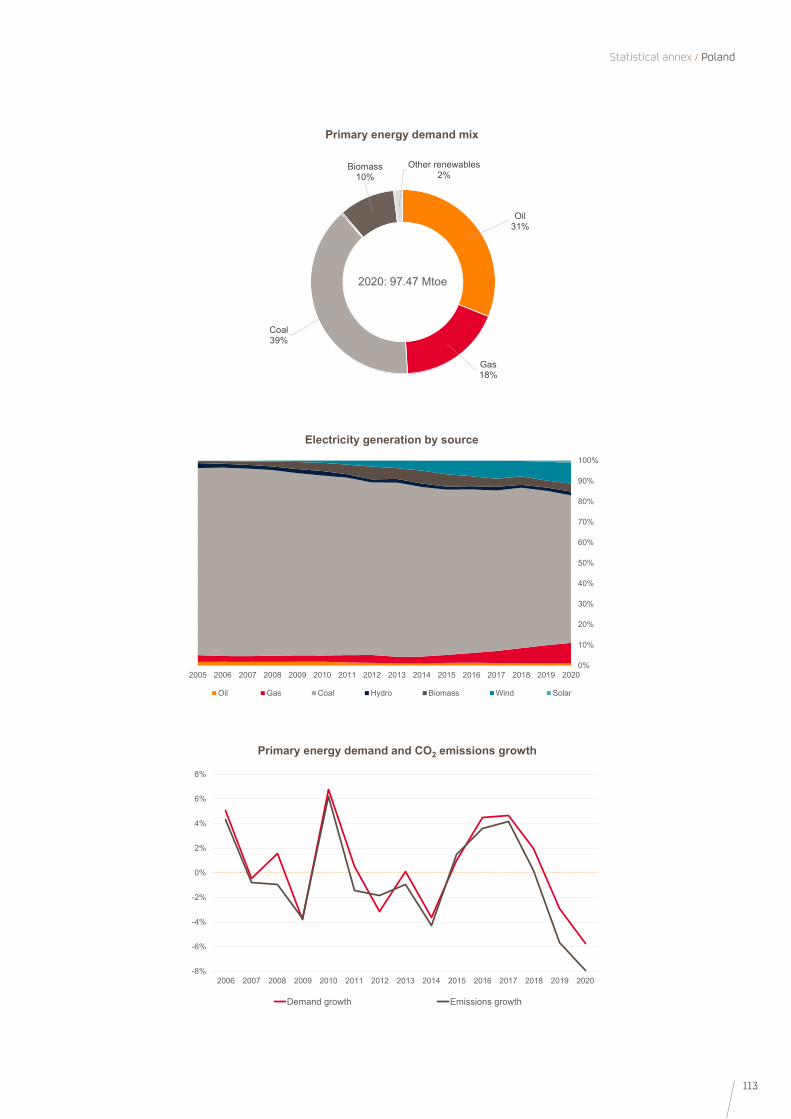
113
Statistical annex / Poland
0%
10%
20%
30%
40%
50%
60%
70%
80%
90%
100%
2005 2006 2007 2008 2009 2010 2011 2012 2013 2014 2015 2016 2017 2018 2019 2020
Oil Gas Coal Hydro Biomass Wind Solar
Electricity generation by source
-8%
-6%
-4%
-2%
0%
2%
4%
6%
8%
2006 2007 2008 2009 2010 2011 2012 2013 2014 2015 2016 2017 2018 2019 2020
Demand growth Emissions growth
Primary energy demand and CO2 emissions growth
Oil 31%
Gas18%
Coal39%
Biomass10%
Other renewables2%
2020: 97.47 Mtoe
Primary energy demand mix

114
Annual / Energy-Statistics 2021
2011 2012 2013 2014 2015 2016 2017 2018 2019 2020 Peso en 2020 (%)
22.8 21.5 21.6 21.2 22.0 21.9 22.8 22.1 21.7 20.0 100.0
Oil 10.6 9.4 9.5 9.3 9.4 9.3 9.4 8.9 9.6 8.5 42.5Gas 4.5 3.9 3.8 3.5 4.1 4.3 5.4 5.0 5.2 5.1 25.5Coal 2.2 2.9 2.7 2.7 3.3 2.8 3.2 2.7 1.3 0.6 2.8Nuclear 0.0 0.0 0.0 0.0 0.0 0.0 0.0 0.0 0.0 0.0 0.0Hydro 1.0 0.5 1.2 1.3 0.7 1.4 0.5 1.1 0.7 1.0 5.2Biomass 3.3 2.9 3.0 3.0 3.0 3.1 3.1 3.1 3.0 3.2 16.0Other renewables 0.8 0.9 1.1 1.1 1.1 1.1 1.1 1.2 1.3 1.2 6.0Electricity balance of trade* 0.5 0.9 0.5 0.3 0.5 -0.2 0.0 0.1 0.6 0.4 2.1
18.2 16.4 16.2 16.2 16.2 16.2 16.4 16.2 17.0 15.9 100.0
Oil 9.4 8.2 8.1 8.2 8.2 8.0 8.2 7.8 8.4 7.4 46.2Gas 1.6 1.6 1.6 1.5 1.6 1.6 1.7 1.8 1.8 1.8 11.4Coal 0.0 0.0 0.0 0.0 0.0 0.0 0.0 0.0 0.0 0.0 0.1Electricity 4.2 4.0 3.9 3.9 3.9 4.0 4.0 4.1 4.1 3.9 24.4Heat 0.4 0.4 0.4 0.3 0.3 0.3 0.3 0.3 0.3 0.4 2.3Biomass 2.5 2.1 2.2 2.1 2.2 2.2 2.2 2.2 2.4 2.5 15.7
4.5 4.0 4.4 4.5 4.5 5.2 5.1 5.1 4.6 4.6 100.0
Oil 0.2 0.2 0.1 0.1 0.1 0.1 0.1 0.1 0.1 0.1 2.1Gas 1.3 0.9 0.6 0.6 0.9 1.1 1.6 1.3 1.5 1.5 33.2Coal 0.8 1.1 1.0 1.0 1.3 1.1 1.3 1.0 0.5 0.2 4.4Nuclear 0.0 0.0 0.0 0.0 0.0 0.0 0.0 0.0 0.0 0.0 0.0Hydro 1.0 0.6 1.3 1.4 0.8 1.5 0.7 1.2 0.9 1.2 26.2Biomass 0.3 0.3 0.3 0.3 0.3 0.3 0.3 0.3 0.3 0.3 7.3Wind 0.8 0.9 1.0 1.0 1.0 1.1 1.1 1.1 1.2 1.1 23.1Solar 0.0 0.0 0.0 0.1 0.1 0.1 0.1 0.1 0.1 0.2 3.3Other renewables 0.0 0.0 0.0 0.0 0.0 0.0 0.0 0.0 0.0 0.0 0.4
18.2 16.4 16.2 16.2 16.2 16.2 16.4 16.2 17.0 15.9 100.0
Industry 5.3 4.6 4.6 4.4 4.4 4.4 4.5 4.6 4.9 4.9 30.6Transport 6.0 5.5 5.4 5.5 5.6 5.7 5.8 5.8 6.1 5.1 32.0Residential/Comercial 4.6 4.5 4.4 4.5 4.5 4.5 4.5 4.6 4.6 4.5 28.3
9.4 8.2 8.1 8.2 8.2 8.0 8.2 7.8 8.4 7.4 100.0
Industry 0.9 0.7 0.7 0.7 0.7 0.6 0.6 0.6 0.7 0.7 9.5Transport 5.7 5.2 5.1 5.2 5.2 5.4 5.5 5.5 5.7 4.8 64.9Residential/Comercial 0.8 0.7 0.6 0.6 0.6 0.6 0.6 0.6 0.6 0.5 7.1
1.6 1.6 1.6 1.5 1.6 1.6 1.7 1.8 1.8 1.8 100.0
Industry 1.2 1.1 1.1 1.1 1.1 1.1 1.2 1.2 1.3 1.3 69.4Transport 0.0 0.0 0.0 0.0 0.0 0.0 0.0 0.0 0.0 0.0 1.0Residential/Comercial 0.5 0.5 0.5 0.5 0.5 0.5 0.5 0.5 0.5 0.5 29.3
9.4 8.2 8.1 8.2 8.2 8.0 8.2 7.8 8.4 7.4 100.0
Gasoline 1.3 1.2 1.2 1.1 1.1 1.1 1.1 1.1 1.1 0.9 12.5Diesel 4.8 4.4 4.3 4.4 4.5 4.6 4.7 4.7 4.9 4.2 57.6Heating Oil 0.3 0.3 0.2 0.2 0.2 0.2 0.2 0.2 0.2 0.2 2.1Aviation Jet 0.1 0.1 0.1 0.1 0.1 0.2 0.2 0.2 0.2 0.1 1.1LPG 0.8 0.6 0.9 1.1 0.9 0.9 0.8 0.7 0.9 0.9 12.0
19.6 18.5 20.0 18.8 22.2 22.0 23.9 21.9 22.1 20.0 100.0
Oil 15.0 14.5 16.2 15.3 18.1 17.8 18.4 16.9 16.8 14.9 74.2Gas 4.5 3.9 3.8 3.5 4.1 4.3 5.4 5.1 5.3 5.2 25.8Gasoline 0.2 0.2 0.1 0.2 0.1 0.2 0.1 0.2 0.2 0.2 1.0Diesel 1.4 0.9 0.6 0.7 0.8 1.0 0.9 0.9 1.1 0.9 4.6Heating Oil 0.4 0.2 0.2 0.2 0.3 0.2 0.2 0.4 0.3 0.4 2.0Aviation Jet 0.3 0.2 0.0 0.1 0.0 0.0 0.1 0.1 0.3 0.0 0.0LPG 0.5 0.5 0.7 0.9 0.8 0.8 0.7 0.6 0.8 0.8 4.0
2.9 3.7 5.6 4.8 6.9 6.8 7.0 5.4 4.8 5.3 100.0
Oil 2.9 3.7 5.6 4.8 6.9 6.8 7.0 5.4 4.8 5.3 100.0Gas 0.0 0.0 0.0 0.0 0.0 0.0 0.0 0.0 0.0 0.0 0.0Gasoline 0.8 0.9 1.4 1.0 1.9 1.8 2.0 1.7 1.6 1.3 24.9Diesel 0.1 0.4 1.7 1.3 2.3 2.1 2.1 1.2 0.9 1.3 25.0Heating Oil 1.2 1.4 1.5 1.5 1.6 1.6 1.5 1.2 1.1 1.5 29.3Aviation Jet 0.0 0.0 0.0 0.0 0.0 0.0 0.0 0.0 0.0 0.0 0.0LPG 0.1 0.1 0.1 0.0 0.1 0.1 0.0 0.1 0.1 0.0 0.7
48.0 46.5 45.1 44.2 48.2 47.6 52.0 48.1 44.5 38.9 -
152.3 153.8 150.5 146.3 156.9 151.9 160.2 144.8 131.1 124.0 -
52.0 49.9 49.6 48.9 48.5 47.8 46.9 46.6 47.0 47.5 -
72.5 71.0 72.0 70.3 71.7 69.7 70.4 66.4 63.9 63.8 -
*Heat is included
Final energy intensity (toe/million $15ppp)
Total energy intensity (toe/million $15ppp)
Natural gas final consumption, by sector
Refined products consumption
Imports
Exports
CO2 Emissions (Million tons CO 2 )
CO2 Intensity (tCO 2 /million $15ppp)
Oil final consumption, by sector
Portugal(Million toe)
Total primary energy demand, by source
Total final consumption, by source
Electricity generation, by source
Total final consumption, by sector
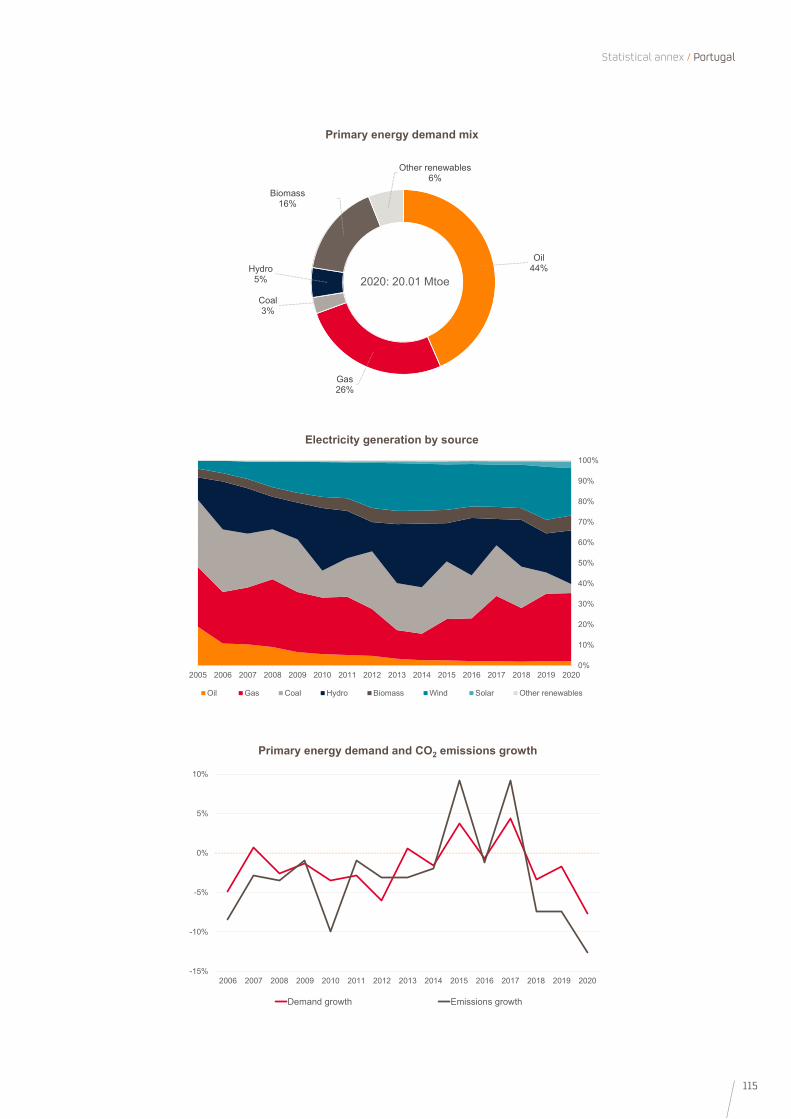
115
Statistical annex / Portugal
0%
10%
20%
30%
40%
50%
60%
70%
80%
90%
100%
2005 2006 2007 2008 2009 2010 2011 2012 2013 2014 2015 2016 2017 2018 2019 2020
Oil Gas Coal Hydro Biomass Wind Solar Other renewables
Electricity generation by source
-15%
-10%
-5%
0%
5%
10%
2006 2007 2008 2009 2010 2011 2012 2013 2014 2015 2016 2017 2018 2019 2020
Demand growth Emissions growth
Primary energy demand and CO2 emissions growth
Oil 44%
Gas26%
Coal3%
Hydro5%
Biomass16%
Other renewables6%
2020: 20.01 Mtoe
Primary energy demand mix

116
Annual / Energy-Statistics 2021
2011 2012 2013 2014 2015 2016 2017 2018 2019 2020 Peso en 2020 (%)
35.9 35.0 32.0 31.6 31.9 31.9 33.4 33.6 33.1 32.4 100.0
Oil 8.6 8.4 8.0 8.0 8.6 8.8 9.5 9.8 9.8 9.8 30.2Gas 11.1 10.8 9.8 9.3 8.9 9.0 9.6 9.8 9.1 9.6 29.7Coal 8.1 7.6 5.7 5.7 5.9 5.3 5.4 5.1 4.9 3.4 10.4Nuclear 3.1 3.0 3.0 3.0 3.0 2.9 3.0 3.0 2.9 3.0 9.2Hydro 1.3 1.0 1.3 1.6 1.4 1.6 1.2 1.5 1.3 1.3 4.0Biomass 3.7 3.9 3.9 3.9 3.8 4.0 4.0 4.0 4.1 4.2 13.0Other renewables 0.1 0.2 0.4 0.7 0.8 0.7 0.8 0.7 0.7 0.8 2.3Electricity balance of trade* -0.1 0.0 -0.1 -0.6 -0.6 -0.4 -0.2 -0.2 0.2 0.4 1.2
24.0 24.4 23.2 23.1 22.8 23.2 24.1 24.4 24.8 24.8 100.0
Oil 7.1 7.6 7.1 7.3 7.6 8.0 8.3 8.6 9.0 9.0 36.5Gas 7.0 6.9 6.5 6.3 5.6 5.5 5.9 6.1 6.0 6.2 25.0Coal 0.9 1.0 0.9 0.9 1.0 0.9 0.8 0.8 0.9 0.7 2.8Electricity 3.7 3.6 3.5 3.6 3.7 3.7 3.8 3.9 3.9 3.8 15.3Heat 1.7 1.5 1.4 1.3 1.3 1.3 1.3 1.3 1.1 1.1 4.4Biomass 3.6 3.8 3.8 3.7 3.6 3.8 3.8 3.8 3.9 4.0 16.0
5.4 5.1 5.1 5.6 5.7 5.6 5.5 5.6 5.1 4.8 100.0
Oil 0.1 0.1 0.0 0.0 0.0 0.1 0.1 0.1 0.1 0.0 0.8Gas 0.7 0.7 0.8 0.7 0.8 0.8 0.9 0.9 0.8 0.8 16.6Coal 2.1 2.0 1.5 1.5 1.6 1.4 1.4 1.4 1.2 0.9 18.1Nuclear 1.0 1.0 1.0 1.0 1.0 1.0 1.0 1.0 1.0 1.0 20.4Hydro 1.3 1.1 1.3 1.7 1.5 1.6 1.3 1.6 1.4 1.3 27.7Biomass 0.0 0.0 0.0 0.0 0.0 0.0 0.0 0.0 0.0 0.0 1.0Wind 0.1 0.2 0.4 0.5 0.6 0.6 0.6 0.5 0.6 0.6 12.4Solar 0.0 0.0 0.0 0.1 0.2 0.2 0.2 0.2 0.2 0.2 3.1Other renewables 0.0 0.0 0.0 0.0 0.0 0.0 0.0 -0.0 0.0 0.0 0.0
24.0 24.4 23.2 23.1 22.8 23.2 24.1 24.4 24.8 24.8 100.0
Industry 7.1 6.8 6.3 6.4 6.4 6.3 6.4 6.6 6.7 6.5 26.3Transport 5.0 5.4 5.3 5.3 5.4 5.8 6.2 6.4 6.6 6.5 26.3Residential/Comercial 9.6 9.8 9.5 9.2 9.2 9.3 9.6 9.6 9.6 9.7 39.1
7.1 7.6 7.1 7.3 7.6 8.0 8.3 8.6 9.0 9.0 100.0
Industry 0.8 0.9 0.8 0.9 0.9 0.9 0.9 1.0 1.1 1.2 13.3Transport 4.7 5.1 5.0 5.1 5.1 5.5 5.8 6.0 6.1 6.0 66.8Residential/Comercial 0.3 0.2 0.2 0.3 0.3 0.3 0.3 0.3 0.4 0.3 3.7
7.0 6.9 6.5 6.3 5.6 5.5 5.9 6.1 6.0 6.2 100.0
Industry 3.0 2.6 2.4 2.5 2.2 2.1 2.2 2.3 2.2 2.2 36.0Transport 0.0 0.0 0.0 0.0 0.0 0.0 0.0 0.0 0.0 0.0 0.0Residential/Comercial 3.1 3.3 3.2 2.9 3.0 3.1 3.3 3.3 3.3 3.5 55.7
7.1 7.6 7.1 7.3 7.6 8.0 8.3 8.6 9.0 9.0 100.0
Gasoline 1.3 1.4 1.3 1.4 1.3 1.4 1.4 1.4 1.4 1.2 13.8Diesel 3.9 4.4 4.2 4.2 4.4 4.7 5.1 5.3 5.5 5.6 62.2Heating Oil 0.1 0.0 0.0 0.0 0.0 0.0 0.0 0.0 0.0 0.0 0.1Aviation Jet 0.1 0.0 0.0 0.0 0.0 0.0 0.0 0.0 0.0 0.0 0.1LPG 0.5 0.4 0.4 0.4 0.4 0.4 0.5 0.5 0.5 0.4 4.8
10.4 10.2 9.0 9.7 9.9 11.7 12.1 12.9 14.4 12.6 100.0
Oil 7.9 7.9 7.8 9.3 9.7 10.5 11.2 11.7 12.1 10.8 86.0Gas 2.5 2.3 1.2 0.5 0.2 1.2 1.0 1.2 2.2 1.8 14.0Gasoline 0.1 0.1 0.1 0.1 0.1 0.1 0.1 0.1 0.1 0.1 0.9Diesel 1.3 1.6 1.1 1.0 1.2 1.3 1.4 1.5 1.2 1.4 10.8Heating Oil 0.0 0.0 0.0 0.0 0.0 0.0 0.0 0.0 0.0 0.0 0.0Aviation Jet 0.1 0.0 0.0 0.0 0.0 0.0 0.1 0.1 0.0 0.0 0.2LPG 0.1 0.1 0.1 0.1 0.2 0.2 0.3 0.2 0.2 0.3 2.3
3.8 3.5 3.9 4.7 4.9 5.3 5.2 5.5 5.6 4.4 100.0
Oil 3.8 3.5 3.9 4.7 4.9 5.3 5.2 5.4 5.6 4.3 97.3Gas 0.0 0.0 0.0 0.0 0.0 0.0 0.0 0.0 0.0 0.1 2.7Gasoline 1.8 1.6 1.8 1.8 1.9 2.2 2.0 2.3 2.3 2.0 44.6Diesel 0.7 0.7 0.9 1.7 1.6 1.7 1.6 1.6 1.6 1.1 24.7Heating Oil 0.3 0.3 0.2 0.2 0.2 0.2 0.2 0.1 0.1 0.1 1.8Aviation Jet 0.2 0.2 0.2 0.2 0.3 0.3 0.3 0.3 0.4 0.2 4.4LPG 0.2 0.2 0.2 0.2 0.3 0.3 0.3 0.4 0.3 0.3 6.7
81.6 79.1 69.6 69.1 69.4 67.9 71.1 71.6 69.1 63.9 -
216.1 205.3 174.3 167.4 162.0 151.2 147.7 143.1 132.7 129.1 -
58.9 58.7 54.3 52.1 50.5 48.9 47.7 46.6 45.4 47.6 -
94.9 90.8 80.1 76.7 74.5 70.9 69.4 67.2 63.7 65.5 -
*Heat is included
Final energy intensity (toe/million $15ppp)
Total energy intensity (toe/million $15ppp)
Natural gas final consumption, by sector
Refined products consumption
Imports
Exports
CO2 Emissions (Million tons CO 2 )
CO2 Intensity (tCO 2 /million $15ppp)
Oil final consumption, by sector
Romania(Million toe)
Total primary energy demand, by source
Total final consumption, by source
Electricity generation, by source
Total final consumption, by sector
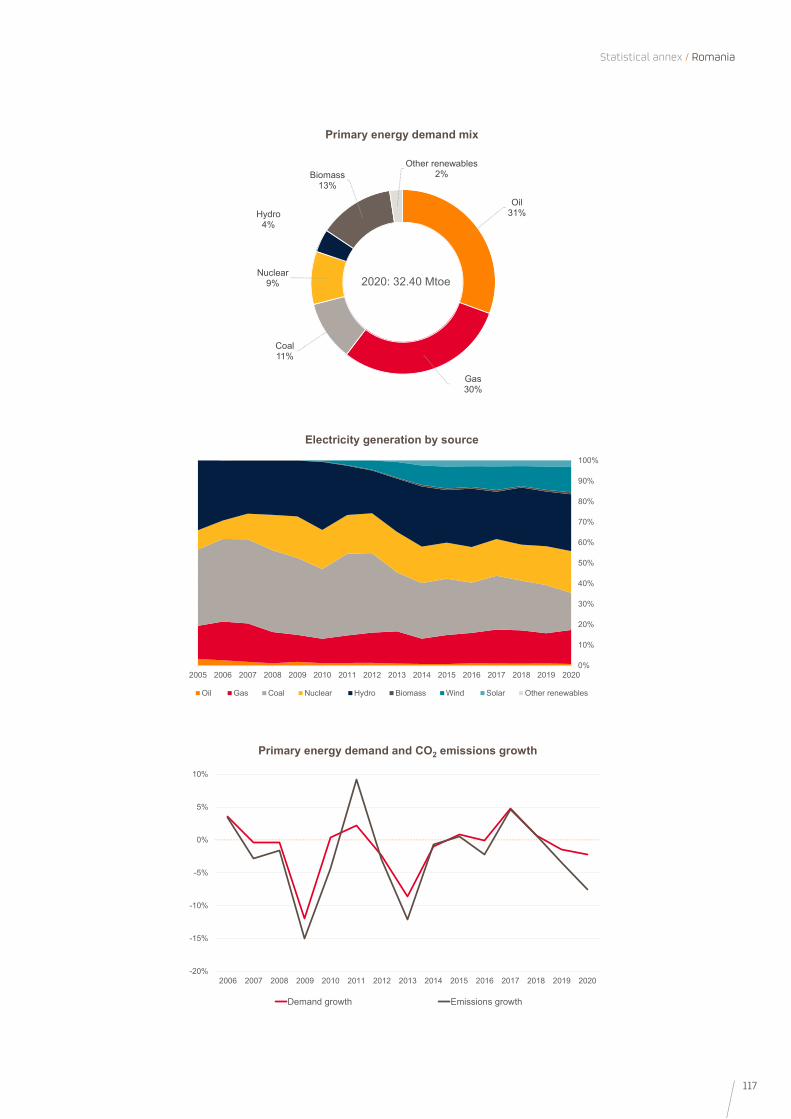
117
Statistical annex / Romania
0%
10%
20%
30%
40%
50%
60%
70%
80%
90%
100%
2005 2006 2007 2008 2009 2010 2011 2012 2013 2014 2015 2016 2017 2018 2019 2020
Oil Gas Coal Nuclear Hydro Biomass Wind Solar Other renewables
Electricity generation by source
-20%
-15%
-10%
-5%
0%
5%
10%
2006 2007 2008 2009 2010 2011 2012 2013 2014 2015 2016 2017 2018 2019 2020
Demand growth Emissions growth
Primary energy demand and CO2 emissions growth
Oil 31%
Gas30%
Coal11%
Nuclear9%
Hydro4%
Biomass13%
Other renewables2%
2020: 32.40 Mtoe
Primary energy demand mix
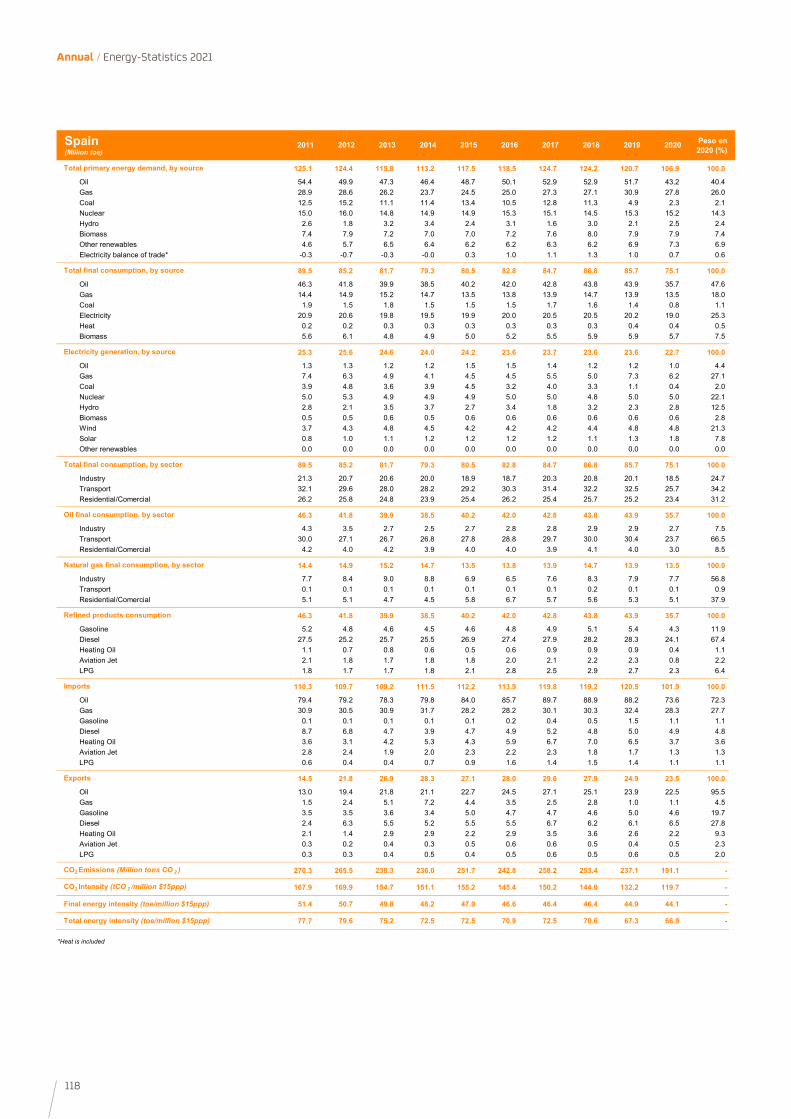
118
Annual / Energy-Statistics 2021
2011 2012 2013 2014 2015 2016 2017 2018 2019 2020 Peso en 2020 (%)
125.1 124.4 115.8 113.2 117.5 118.5 124.7 124.2 120.7 106.9 100.0
Oil 54.4 49.9 47.3 46.4 48.7 50.1 52.9 52.9 51.7 43.2 40.4Gas 28.9 28.6 26.2 23.7 24.5 25.0 27.3 27.1 30.9 27.8 26.0Coal 12.5 15.2 11.1 11.4 13.4 10.5 12.8 11.3 4.9 2.3 2.1Nuclear 15.0 16.0 14.8 14.9 14.9 15.3 15.1 14.5 15.3 15.2 14.3Hydro 2.6 1.8 3.2 3.4 2.4 3.1 1.6 3.0 2.1 2.5 2.4Biomass 7.4 7.9 7.2 7.0 7.0 7.2 7.6 8.0 7.9 7.9 7.4Other renewables 4.6 5.7 6.5 6.4 6.2 6.2 6.3 6.2 6.9 7.3 6.9Electricity balance of trade* -0.3 -0.7 -0.3 -0.0 0.3 1.0 1.1 1.3 1.0 0.7 0.6
89.5 85.2 81.7 79.3 80.5 82.8 84.7 86.8 85.7 75.1 100.0
Oil 46.3 41.8 39.9 38.5 40.2 42.0 42.8 43.8 43.9 35.7 47.6Gas 14.4 14.9 15.2 14.7 13.5 13.8 13.9 14.7 13.9 13.5 18.0Coal 1.9 1.5 1.8 1.5 1.5 1.5 1.7 1.6 1.4 0.8 1.1Electricity 20.9 20.6 19.8 19.5 19.9 20.0 20.5 20.5 20.2 19.0 25.3Heat 0.2 0.2 0.3 0.3 0.3 0.3 0.3 0.3 0.4 0.4 0.5Biomass 5.6 6.1 4.8 4.9 5.0 5.2 5.5 5.9 5.9 5.7 7.5
25.3 25.6 24.6 24.0 24.2 23.6 23.7 23.6 23.6 22.7 100.0
Oil 1.3 1.3 1.2 1.2 1.5 1.5 1.4 1.2 1.2 1.0 4.4Gas 7.4 6.3 4.9 4.1 4.5 4.5 5.5 5.0 7.3 6.2 27.1Coal 3.9 4.8 3.6 3.9 4.5 3.2 4.0 3.3 1.1 0.4 2.0Nuclear 5.0 5.3 4.9 4.9 4.9 5.0 5.0 4.8 5.0 5.0 22.1Hydro 2.8 2.1 3.5 3.7 2.7 3.4 1.8 3.2 2.3 2.8 12.5Biomass 0.5 0.5 0.6 0.5 0.6 0.6 0.6 0.6 0.6 0.6 2.8Wind 3.7 4.3 4.8 4.5 4.2 4.2 4.2 4.4 4.8 4.8 21.3Solar 0.8 1.0 1.1 1.2 1.2 1.2 1.2 1.1 1.3 1.8 7.8Other renewables 0.0 0.0 0.0 0.0 0.0 0.0 0.0 0.0 0.0 0.0 0.0
89.5 85.2 81.7 79.3 80.5 82.8 84.7 86.8 85.7 75.1 100.0
Industry 21.3 20.7 20.6 20.0 18.9 18.7 20.3 20.8 20.1 18.5 24.7Transport 32.1 29.6 28.0 28.2 29.2 30.3 31.4 32.2 32.5 25.7 34.2Residential/Comercial 26.2 25.8 24.8 23.9 25.4 26.2 25.4 25.7 25.2 23.4 31.2
46.3 41.8 39.9 38.5 40.2 42.0 42.8 43.8 43.9 35.7 100.0
Industry 4.3 3.5 2.7 2.5 2.7 2.8 2.8 2.9 2.9 2.7 7.5Transport 30.0 27.1 26.7 26.8 27.8 28.8 29.7 30.0 30.4 23.7 66.5Residential/Comercial 4.2 4.0 4.2 3.9 4.0 4.0 3.9 4.1 4.0 3.0 8.5
14.4 14.9 15.2 14.7 13.5 13.8 13.9 14.7 13.9 13.5 100.0
Industry 7.7 8.4 9.0 8.8 6.9 6.5 7.6 8.3 7.9 7.7 56.8Transport 0.1 0.1 0.1 0.1 0.1 0.1 0.1 0.2 0.1 0.1 0.9Residential/Comercial 5.1 5.1 4.7 4.5 5.8 6.7 5.7 5.6 5.3 5.1 37.9
46.3 41.8 39.9 38.5 40.2 42.0 42.8 43.8 43.9 35.7 100.0
Gasoline 5.2 4.8 4.6 4.5 4.6 4.8 4.9 5.1 5.4 4.3 11.9Diesel 27.5 25.2 25.7 25.5 26.9 27.4 27.9 28.2 28.3 24.1 67.4Heating Oil 1.1 0.7 0.8 0.6 0.5 0.6 0.9 0.9 0.9 0.4 1.1Aviation Jet 2.1 1.8 1.7 1.8 1.8 2.0 2.1 2.2 2.3 0.8 2.2LPG 1.8 1.7 1.7 1.8 2.1 2.8 2.5 2.9 2.7 2.3 6.4
110.3 109.7 109.2 111.5 112.2 113.9 119.8 119.2 120.5 101.9 100.0
Oil 79.4 79.2 78.3 79.8 84.0 85.7 89.7 88.9 88.2 73.6 72.3Gas 30.9 30.5 30.9 31.7 28.2 28.2 30.1 30.3 32.4 28.3 27.7Gasoline 0.1 0.1 0.1 0.1 0.1 0.2 0.4 0.5 1.5 1.1 1.1Diesel 8.7 6.8 4.7 3.9 4.7 4.9 5.2 4.8 5.0 4.9 4.8Heating Oil 3.6 3.1 4.2 5.3 4.3 5.9 6.7 7.0 6.5 3.7 3.6Aviation Jet 2.8 2.4 1.9 2.0 2.3 2.2 2.3 1.8 1.7 1.3 1.3LPG 0.6 0.4 0.4 0.7 0.9 1.6 1.4 1.5 1.4 1.1 1.1
14.5 21.8 26.9 28.3 27.1 28.0 29.6 27.9 24.9 23.5 100.0
Oil 13.0 19.4 21.8 21.1 22.7 24.5 27.1 25.1 23.9 22.5 95.5Gas 1.5 2.4 5.1 7.2 4.4 3.5 2.5 2.8 1.0 1.1 4.5Gasoline 3.5 3.5 3.6 3.4 5.0 4.7 4.7 4.6 5.0 4.6 19.7Diesel 2.4 6.3 5.5 5.2 5.5 5.5 6.7 6.2 6.1 6.5 27.8Heating Oil 2.1 1.4 2.9 2.9 2.2 2.9 3.5 3.6 2.6 2.2 9.3Aviation Jet 0.3 0.2 0.4 0.3 0.5 0.6 0.6 0.5 0.4 0.5 2.3LPG 0.3 0.3 0.4 0.5 0.4 0.5 0.6 0.5 0.6 0.5 2.0
270.3 265.5 238.3 236.0 251.7 242.8 258.2 253.4 237.1 191.1 -
167.9 169.9 154.7 151.1 155.2 145.4 150.2 144.0 132.2 119.7 -
51.4 50.7 49.8 48.2 47.0 46.6 46.4 46.4 44.9 44.1 -
77.7 79.6 75.2 72.5 72.5 70.9 72.5 70.6 67.3 66.9 -
*Heat is included
Final energy intensity (toe/million $15ppp)
Total energy intensity (toe/million $15ppp)
Natural gas final consumption, by sector
Refined products consumption
Imports
Exports
CO2 Emissions (Million tons CO 2 )
CO2 Intensity (tCO 2 /million $15ppp)
Oil final consumption, by sector
Spain(Million toe)
Total primary energy demand, by source
Total final consumption, by source
Electricity generation, by source
Total final consumption, by sector
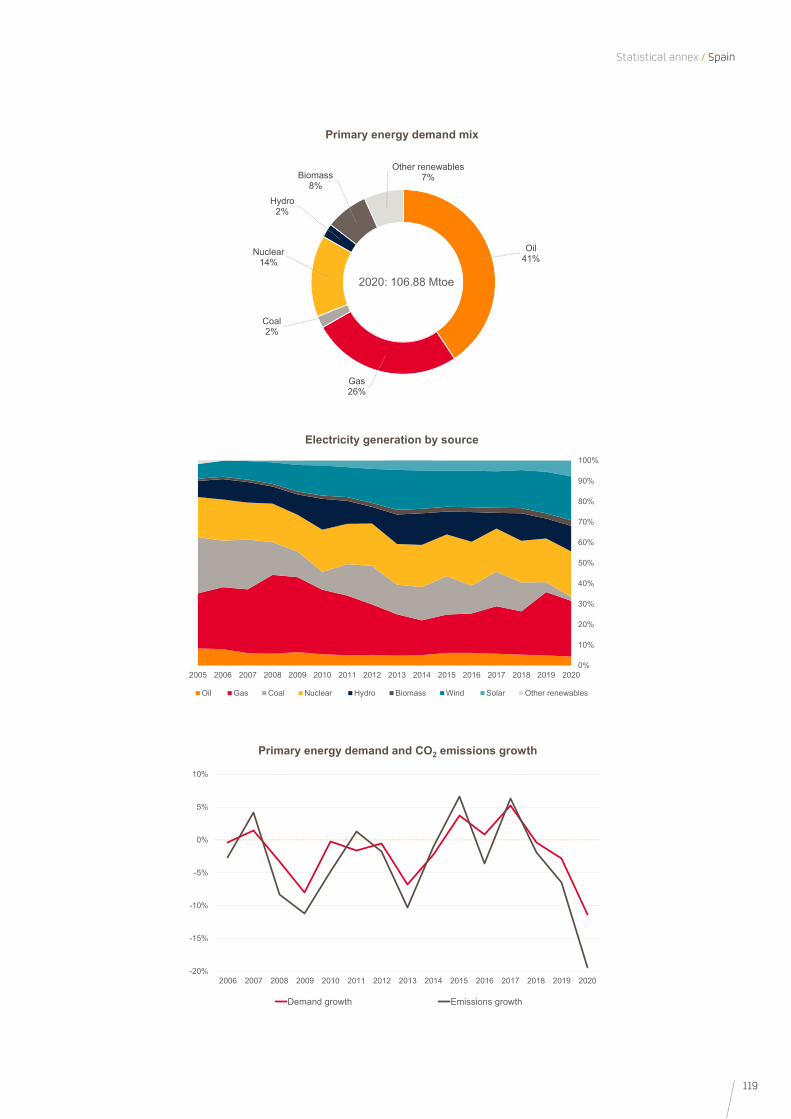
119
Statistical annex / Spain
0%
10%
20%
30%
40%
50%
60%
70%
80%
90%
100%
2005 2006 2007 2008 2009 2010 2011 2012 2013 2014 2015 2016 2017 2018 2019 2020
Oil Gas Coal Nuclear Hydro Biomass Wind Solar Other renewables
Electricity generation by source
-20%
-15%
-10%
-5%
0%
5%
10%
2006 2007 2008 2009 2010 2011 2012 2013 2014 2015 2016 2017 2018 2019 2020
Demand growth Emissions growth
Primary energy demand and CO2 emissions growth
Oil 41%
Gas26%
Coal2%
Nuclear14%
Hydro2%
Biomass8%
Other renewables7%
2020: 106.88 Mtoe
Primary energy demand mix
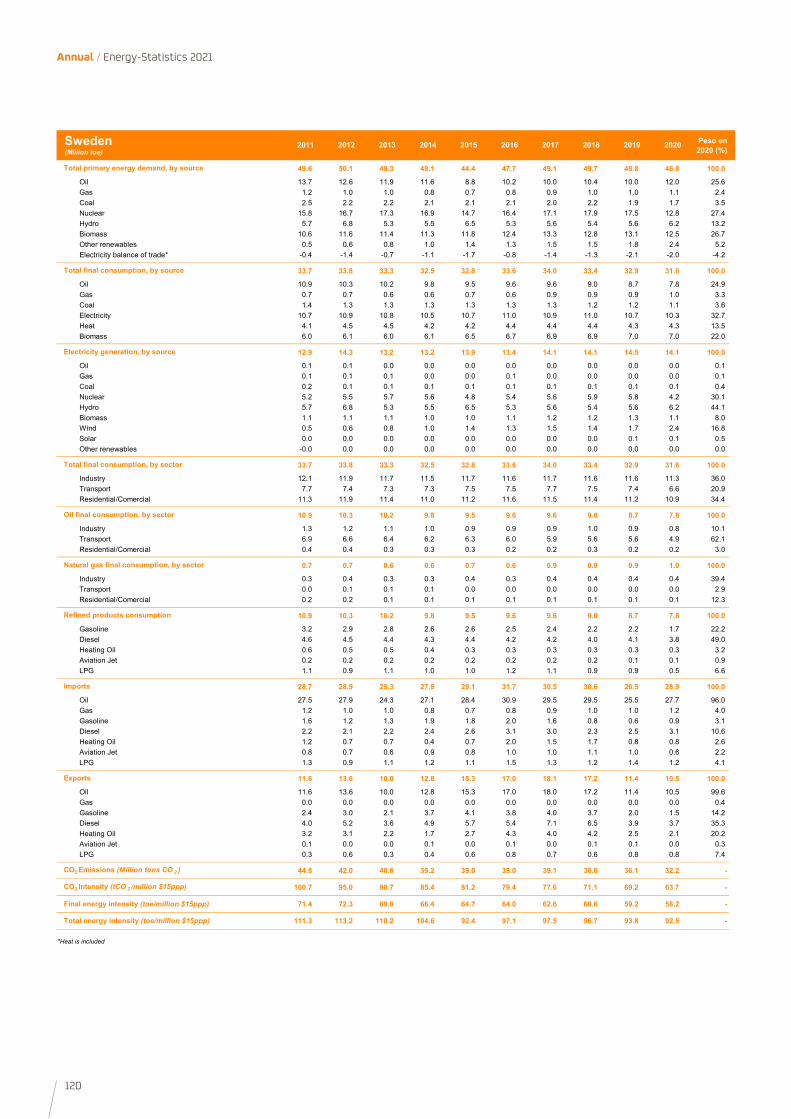
120
Annual / Energy-Statistics 2021
2011 2012 2013 2014 2015 2016 2017 2018 2019 2020 Peso en 2020 (%)
49.6 50.1 49.3 48.1 44.4 47.7 49.1 49.7 48.8 46.8 100.0
Oil 13.7 12.6 11.9 11.6 8.8 10.2 10.0 10.4 10.0 12.0 25.6Gas 1.2 1.0 1.0 0.8 0.7 0.8 0.9 1.0 1.0 1.1 2.4Coal 2.5 2.2 2.2 2.1 2.1 2.1 2.0 2.2 1.9 1.7 3.5Nuclear 15.8 16.7 17.3 16.9 14.7 16.4 17.1 17.9 17.5 12.8 27.4Hydro 5.7 6.8 5.3 5.5 6.5 5.3 5.6 5.4 5.6 6.2 13.2Biomass 10.6 11.6 11.4 11.3 11.8 12.4 13.3 12.8 13.1 12.5 26.7Other renewables 0.5 0.6 0.8 1.0 1.4 1.3 1.5 1.5 1.8 2.4 5.2Electricity balance of trade* -0.4 -1.4 -0.7 -1.1 -1.7 -0.8 -1.4 -1.3 -2.1 -2.0 -4.2
33.7 33.8 33.3 32.5 32.8 33.6 34.0 33.4 32.9 31.6 100.0
Oil 10.9 10.3 10.2 9.8 9.5 9.6 9.6 9.0 8.7 7.8 24.9Gas 0.7 0.7 0.6 0.6 0.7 0.6 0.9 0.9 0.9 1.0 3.3Coal 1.4 1.3 1.3 1.3 1.3 1.3 1.3 1.2 1.2 1.1 3.6Electricity 10.7 10.9 10.8 10.5 10.7 11.0 10.9 11.0 10.7 10.3 32.7Heat 4.1 4.5 4.5 4.2 4.2 4.4 4.4 4.4 4.3 4.3 13.5Biomass 6.0 6.1 6.0 6.1 6.5 6.7 6.9 6.9 7.0 7.0 22.0
12.9 14.3 13.2 13.2 13.9 13.4 14.1 14.1 14.5 14.1 100.0
Oil 0.1 0.1 0.0 0.0 0.0 0.0 0.0 0.0 0.0 0.0 0.1Gas 0.1 0.1 0.1 0.0 0.0 0.1 0.0 0.0 0.0 0.0 0.1Coal 0.2 0.1 0.1 0.1 0.1 0.1 0.1 0.1 0.1 0.1 0.4Nuclear 5.2 5.5 5.7 5.6 4.8 5.4 5.6 5.9 5.8 4.2 30.1Hydro 5.7 6.8 5.3 5.5 6.5 5.3 5.6 5.4 5.6 6.2 44.1Biomass 1.1 1.1 1.1 1.0 1.0 1.1 1.2 1.2 1.3 1.1 8.0Wind 0.5 0.6 0.8 1.0 1.4 1.3 1.5 1.4 1.7 2.4 16.8Solar 0.0 0.0 0.0 0.0 0.0 0.0 0.0 0.0 0.1 0.1 0.5Other renewables -0.0 0.0 0.0 0.0 0.0 0.0 0.0 0.0 0.0 0.0 0.0
33.7 33.8 33.3 32.5 32.8 33.6 34.0 33.4 32.9 31.6 100.0
Industry 12.1 11.9 11.7 11.5 11.7 11.6 11.7 11.6 11.6 11.3 36.0Transport 7.7 7.4 7.3 7.3 7.5 7.5 7.7 7.5 7.4 6.6 20.9Residential/Comercial 11.3 11.9 11.4 11.0 11.2 11.6 11.5 11.4 11.2 10.9 34.4
10.9 10.3 10.2 9.8 9.5 9.6 9.6 9.0 8.7 7.8 100.0
Industry 1.3 1.2 1.1 1.0 0.9 0.9 0.9 1.0 0.9 0.8 10.1Transport 6.9 6.6 6.4 6.2 6.3 6.0 5.9 5.6 5.6 4.9 62.1Residential/Comercial 0.4 0.4 0.3 0.3 0.3 0.2 0.2 0.3 0.2 0.2 3.0
0.7 0.7 0.6 0.6 0.7 0.6 0.9 0.9 0.9 1.0 100.0
Industry 0.3 0.4 0.3 0.3 0.4 0.3 0.4 0.4 0.4 0.4 39.4Transport 0.0 0.1 0.1 0.1 0.0 0.0 0.0 0.0 0.0 0.0 2.9Residential/Comercial 0.2 0.2 0.1 0.1 0.1 0.1 0.1 0.1 0.1 0.1 12.3
10.9 10.3 10.2 9.8 9.5 9.6 9.6 9.0 8.7 7.8 100.0
Gasoline 3.2 2.9 2.8 2.6 2.6 2.5 2.4 2.2 2.2 1.7 22.2Diesel 4.6 4.5 4.4 4.3 4.4 4.2 4.2 4.0 4.1 3.8 49.0Heating Oil 0.6 0.5 0.5 0.4 0.3 0.3 0.3 0.3 0.3 0.3 3.2Aviation Jet 0.2 0.2 0.2 0.2 0.2 0.2 0.2 0.2 0.1 0.1 0.9LPG 1.1 0.9 1.1 1.0 1.0 1.2 1.1 0.9 0.9 0.5 6.6
28.7 28.9 25.3 27.8 29.1 31.7 30.5 30.6 26.5 28.9 100.0
Oil 27.5 27.9 24.3 27.1 28.4 30.9 29.5 29.5 25.5 27.7 96.0Gas 1.2 1.0 1.0 0.8 0.7 0.8 0.9 1.0 1.0 1.2 4.0Gasoline 1.6 1.2 1.3 1.9 1.8 2.0 1.6 0.8 0.6 0.9 3.1Diesel 2.2 2.1 2.2 2.4 2.6 3.1 3.0 2.3 2.5 3.1 10.6Heating Oil 1.2 0.7 0.7 0.4 0.7 2.0 1.5 1.7 0.8 0.8 2.6Aviation Jet 0.8 0.7 0.6 0.9 0.8 1.0 1.0 1.1 1.0 0.6 2.2LPG 1.3 0.9 1.1 1.2 1.1 1.5 1.3 1.2 1.4 1.2 4.1
11.6 13.6 10.0 12.8 15.3 17.0 18.1 17.2 11.4 10.5 100.0
Oil 11.6 13.6 10.0 12.8 15.3 17.0 18.0 17.2 11.4 10.5 99.6Gas 0.0 0.0 0.0 0.0 0.0 0.0 0.0 0.0 0.0 0.0 0.4Gasoline 2.4 3.0 2.1 3.7 4.1 3.8 4.0 3.7 2.0 1.5 14.2Diesel 4.0 5.2 3.6 4.9 5.7 5.4 7.1 6.5 3.9 3.7 35.3Heating Oil 3.2 3.1 2.2 1.7 2.7 4.3 4.0 4.2 2.5 2.1 20.2Aviation Jet 0.1 0.0 0.0 0.1 0.0 0.1 0.0 0.1 0.1 0.0 0.3LPG 0.3 0.6 0.3 0.4 0.6 0.8 0.7 0.6 0.8 0.8 7.4
44.8 42.0 40.6 39.2 39.0 39.0 39.1 36.6 36.1 32.2 -
100.7 95.0 90.7 85.4 81.2 79.4 77.6 71.1 69.2 63.7 -
71.4 72.3 69.8 66.4 64.7 64.0 62.6 60.6 59.2 58.2 -
111.3 113.2 110.2 104.6 92.4 97.1 97.5 96.7 93.8 92.5 -
*Heat is included
Final energy intensity (toe/million $15ppp)
Total energy intensity (toe/million $15ppp)
Natural gas final consumption, by sector
Refined products consumption
Imports
Exports
CO2 Emissions (Million tons CO 2 )
CO2 Intensity (tCO 2 /million $15ppp)
Oil final consumption, by sector
Sweden(Million toe)
Total primary energy demand, by source
Total final consumption, by source
Electricity generation, by source
Total final consumption, by sector
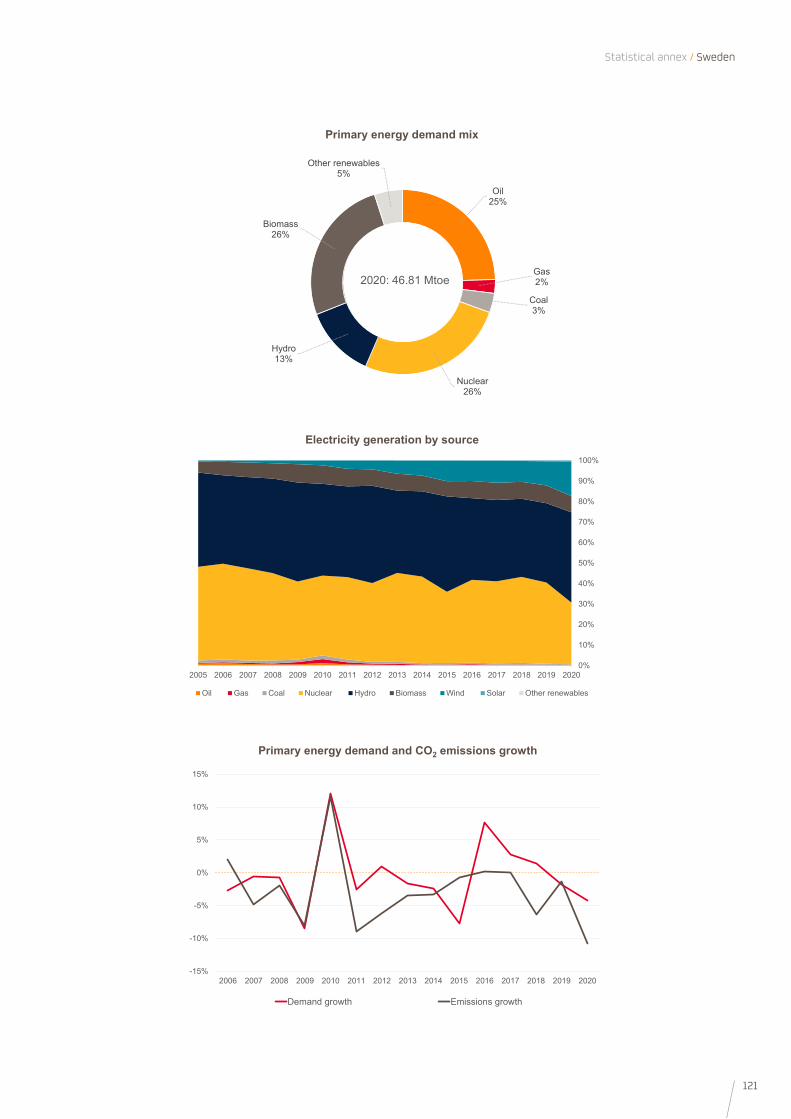
121
Statistical annex / Sweden
0%
10%
20%
30%
40%
50%
60%
70%
80%
90%
100%
2005 2006 2007 2008 2009 2010 2011 2012 2013 2014 2015 2016 2017 2018 2019 2020
Oil Gas Coal Nuclear Hydro Biomass Wind Solar Other renewables
Electricity generation by source
-15%
-10%
-5%
0%
5%
10%
15%
2006 2007 2008 2009 2010 2011 2012 2013 2014 2015 2016 2017 2018 2019 2020
Demand growth Emissions growth
Primary energy demand and CO2 emissions growth
Oil 25%
Gas2%
Coal3%
Nuclear26%
Hydro13%
Biomass26%
Other renewables5%
2020: 46.81 Mtoe
Primary energy demand mix
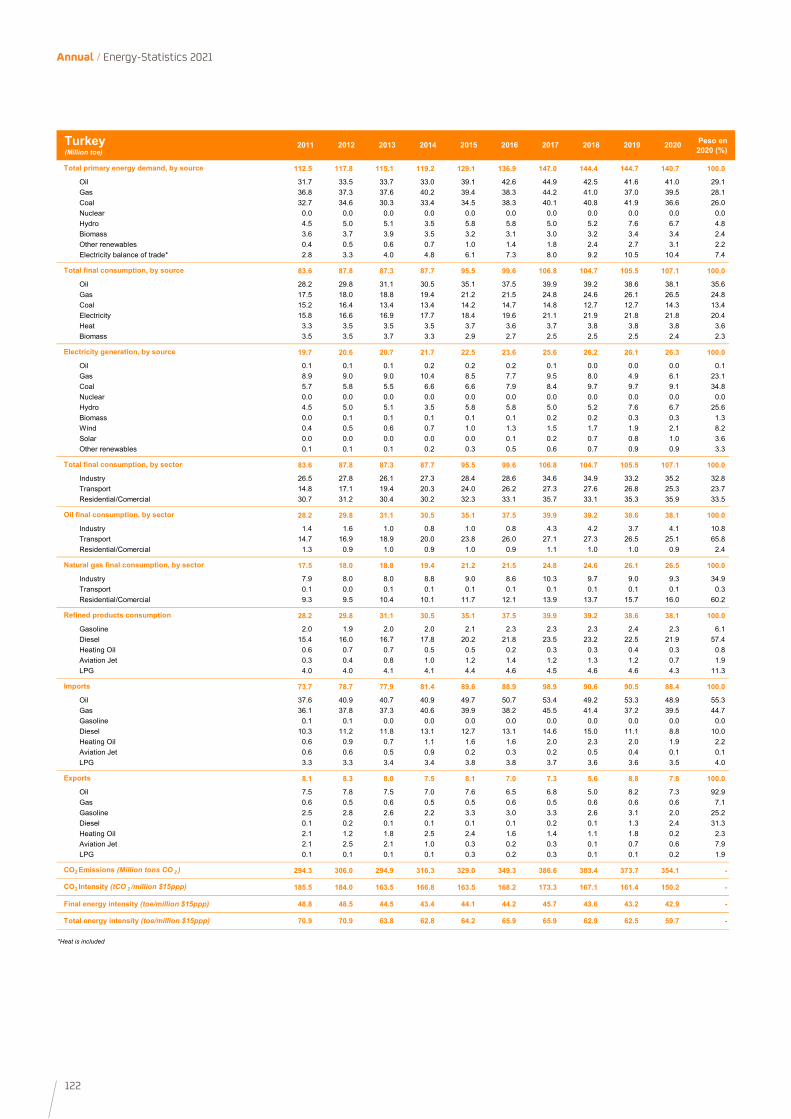
122
Annual / Energy-Statistics 2021
2011 2012 2013 2014 2015 2016 2017 2018 2019 2020 Peso en 2020 (%)
112.5 117.8 115.1 119.2 129.1 136.9 147.0 144.4 144.7 140.7 100.0
Oil 31.7 33.5 33.7 33.0 39.1 42.6 44.9 42.5 41.6 41.0 29.1Gas 36.8 37.3 37.6 40.2 39.4 38.3 44.2 41.0 37.0 39.5 28.1Coal 32.7 34.6 30.3 33.4 34.5 38.3 40.1 40.8 41.9 36.6 26.0Nuclear 0.0 0.0 0.0 0.0 0.0 0.0 0.0 0.0 0.0 0.0 0.0Hydro 4.5 5.0 5.1 3.5 5.8 5.8 5.0 5.2 7.6 6.7 4.8Biomass 3.6 3.7 3.9 3.5 3.2 3.1 3.0 3.2 3.4 3.4 2.4Other renewables 0.4 0.5 0.6 0.7 1.0 1.4 1.8 2.4 2.7 3.1 2.2Electricity balance of trade* 2.8 3.3 4.0 4.8 6.1 7.3 8.0 9.2 10.5 10.4 7.4
83.6 87.8 87.3 87.7 95.5 99.6 106.8 104.7 105.5 107.1 100.0
Oil 28.2 29.8 31.1 30.5 35.1 37.5 39.9 39.2 38.6 38.1 35.6Gas 17.5 18.0 18.8 19.4 21.2 21.5 24.8 24.6 26.1 26.5 24.8Coal 15.2 16.4 13.4 13.4 14.2 14.7 14.8 12.7 12.7 14.3 13.4Electricity 15.8 16.6 16.9 17.7 18.4 19.6 21.1 21.9 21.8 21.8 20.4Heat 3.3 3.5 3.5 3.5 3.7 3.6 3.7 3.8 3.8 3.8 3.6Biomass 3.5 3.5 3.7 3.3 2.9 2.7 2.5 2.5 2.5 2.4 2.3
19.7 20.6 20.7 21.7 22.5 23.6 25.6 26.2 26.1 26.3 100.0
Oil 0.1 0.1 0.1 0.2 0.2 0.2 0.1 0.0 0.0 0.0 0.1Gas 8.9 9.0 9.0 10.4 8.5 7.7 9.5 8.0 4.9 6.1 23.1Coal 5.7 5.8 5.5 6.6 6.6 7.9 8.4 9.7 9.7 9.1 34.8Nuclear 0.0 0.0 0.0 0.0 0.0 0.0 0.0 0.0 0.0 0.0 0.0Hydro 4.5 5.0 5.1 3.5 5.8 5.8 5.0 5.2 7.6 6.7 25.6Biomass 0.0 0.1 0.1 0.1 0.1 0.1 0.2 0.2 0.3 0.3 1.3Wind 0.4 0.5 0.6 0.7 1.0 1.3 1.5 1.7 1.9 2.1 8.2Solar 0.0 0.0 0.0 0.0 0.0 0.1 0.2 0.7 0.8 1.0 3.6Other renewables 0.1 0.1 0.1 0.2 0.3 0.5 0.6 0.7 0.9 0.9 3.3
83.6 87.8 87.3 87.7 95.5 99.6 106.8 104.7 105.5 107.1 100.0
Industry 26.5 27.8 26.1 27.3 28.4 28.6 34.6 34.9 33.2 35.2 32.8Transport 14.8 17.1 19.4 20.3 24.0 26.2 27.3 27.6 26.8 25.3 23.7Residential/Comercial 30.7 31.2 30.4 30.2 32.3 33.1 35.7 33.1 35.3 35.9 33.5
28.2 29.8 31.1 30.5 35.1 37.5 39.9 39.2 38.6 38.1 100.0
Industry 1.4 1.6 1.0 0.8 1.0 0.8 4.3 4.2 3.7 4.1 10.8Transport 14.7 16.9 18.9 20.0 23.8 26.0 27.1 27.3 26.5 25.1 65.8Residential/Comercial 1.3 0.9 1.0 0.9 1.0 0.9 1.1 1.0 1.0 0.9 2.4
17.5 18.0 18.8 19.4 21.2 21.5 24.8 24.6 26.1 26.5 100.0
Industry 7.9 8.0 8.0 8.8 9.0 8.6 10.3 9.7 9.0 9.3 34.9Transport 0.1 0.0 0.1 0.1 0.1 0.1 0.1 0.1 0.1 0.1 0.3Residential/Comercial 9.3 9.5 10.4 10.1 11.7 12.1 13.9 13.7 15.7 16.0 60.2
28.2 29.8 31.1 30.5 35.1 37.5 39.9 39.2 38.6 38.1 100.0
Gasoline 2.0 1.9 2.0 2.0 2.1 2.3 2.3 2.3 2.4 2.3 6.1Diesel 15.4 16.0 16.7 17.8 20.2 21.8 23.5 23.2 22.5 21.9 57.4Heating Oil 0.6 0.7 0.7 0.5 0.5 0.2 0.3 0.3 0.4 0.3 0.8Aviation Jet 0.3 0.4 0.8 1.0 1.2 1.4 1.2 1.3 1.2 0.7 1.9LPG 4.0 4.0 4.1 4.1 4.4 4.6 4.5 4.6 4.6 4.3 11.3
73.7 78.7 77.9 81.4 89.6 88.9 98.9 90.6 90.5 88.4 100.0
Oil 37.6 40.9 40.7 40.9 49.7 50.7 53.4 49.2 53.3 48.9 55.3Gas 36.1 37.8 37.3 40.6 39.9 38.2 45.5 41.4 37.2 39.5 44.7Gasoline 0.1 0.1 0.0 0.0 0.0 0.0 0.0 0.0 0.0 0.0 0.0Diesel 10.3 11.2 11.8 13.1 12.7 13.1 14.6 15.0 11.1 8.8 10.0Heating Oil 0.6 0.9 0.7 1.1 1.6 1.6 2.0 2.3 2.0 1.9 2.2Aviation Jet 0.6 0.6 0.5 0.9 0.2 0.3 0.2 0.5 0.4 0.1 0.1LPG 3.3 3.3 3.4 3.4 3.8 3.8 3.7 3.6 3.6 3.5 4.0
8.1 8.3 8.0 7.5 8.1 7.0 7.3 5.6 8.8 7.8 100.0
Oil 7.5 7.8 7.5 7.0 7.6 6.5 6.8 5.0 8.2 7.3 92.9Gas 0.6 0.5 0.6 0.5 0.5 0.6 0.5 0.6 0.6 0.6 7.1Gasoline 2.5 2.8 2.6 2.2 3.3 3.0 3.3 2.6 3.1 2.0 25.2Diesel 0.1 0.2 0.1 0.1 0.1 0.1 0.2 0.1 1.3 2.4 31.3Heating Oil 2.1 1.2 1.8 2.5 2.4 1.6 1.4 1.1 1.8 0.2 2.3Aviation Jet 2.1 2.5 2.1 1.0 0.3 0.2 0.3 0.1 0.7 0.6 7.9LPG 0.1 0.1 0.1 0.1 0.3 0.2 0.3 0.1 0.1 0.2 1.9
294.3 306.0 294.9 316.3 329.0 349.3 386.6 383.4 373.7 354.1 -
185.5 184.0 163.5 166.8 163.5 168.2 173.3 167.1 161.4 150.2 -
48.8 48.5 44.5 43.4 44.1 44.2 45.7 43.6 43.2 42.9 -
70.9 70.9 63.8 62.8 64.2 65.9 65.9 62.9 62.5 59.7 -
*Heat is included
Final energy intensity (toe/million $15ppp)
Total energy intensity (toe/million $15ppp)
Natural gas final consumption, by sector
Refined products consumption
Imports
Exports
CO2 Emissions (Million tons CO 2 )
CO2 Intensity (tCO 2 /million $15ppp)
Oil final consumption, by sector
Turkey(Million toe)
Total primary energy demand, by source
Total final consumption, by source
Electricity generation, by source
Total final consumption, by sector
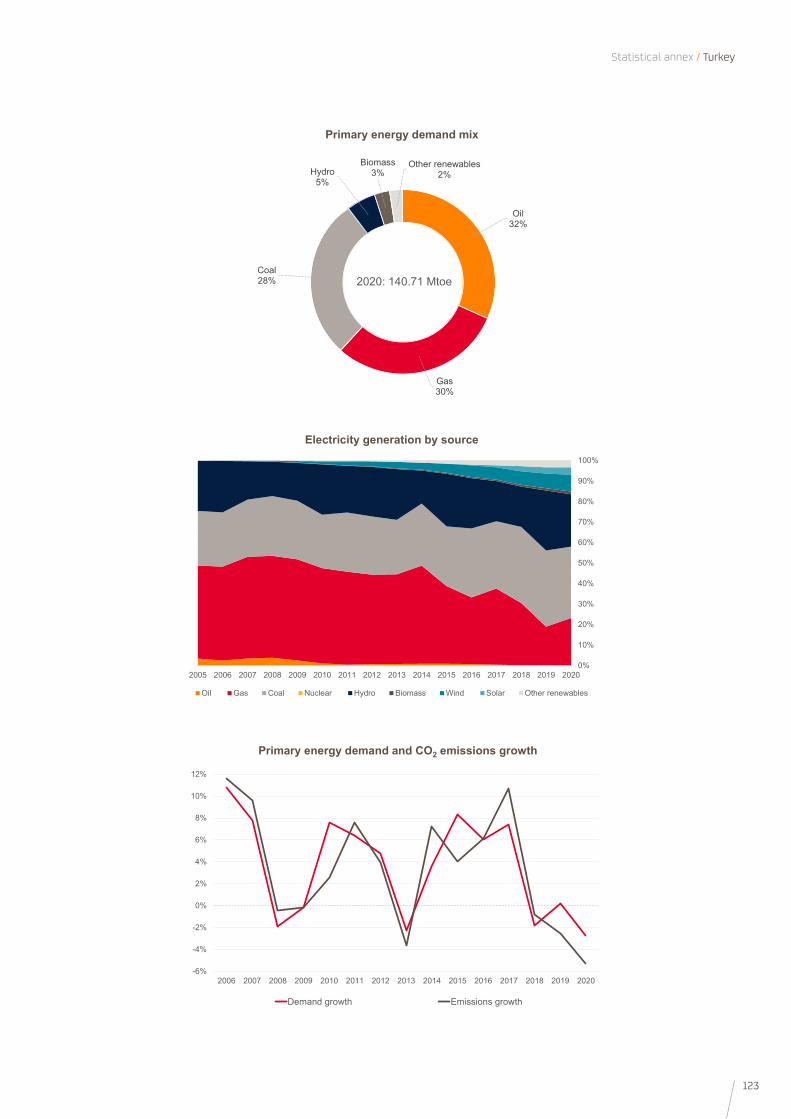
123
Statistical annex / Turkey
0%
10%
20%
30%
40%
50%
60%
70%
80%
90%
100%
2005 2006 2007 2008 2009 2010 2011 2012 2013 2014 2015 2016 2017 2018 2019 2020
Oil Gas Coal Nuclear Hydro Biomass Wind Solar Other renewables
Electricity generation by source
-6%
-4%
-2%
0%
2%
4%
6%
8%
10%
12%
2006 2007 2008 2009 2010 2011 2012 2013 2014 2015 2016 2017 2018 2019 2020
Demand growth Emissions growth
Primary energy demand and CO2 emissions growth
Oil 32%
Gas30%
Coal28%
Hydro5%
Biomass3%
Other renewables2%
2020: 140.71 Mtoe
Primary energy demand mix
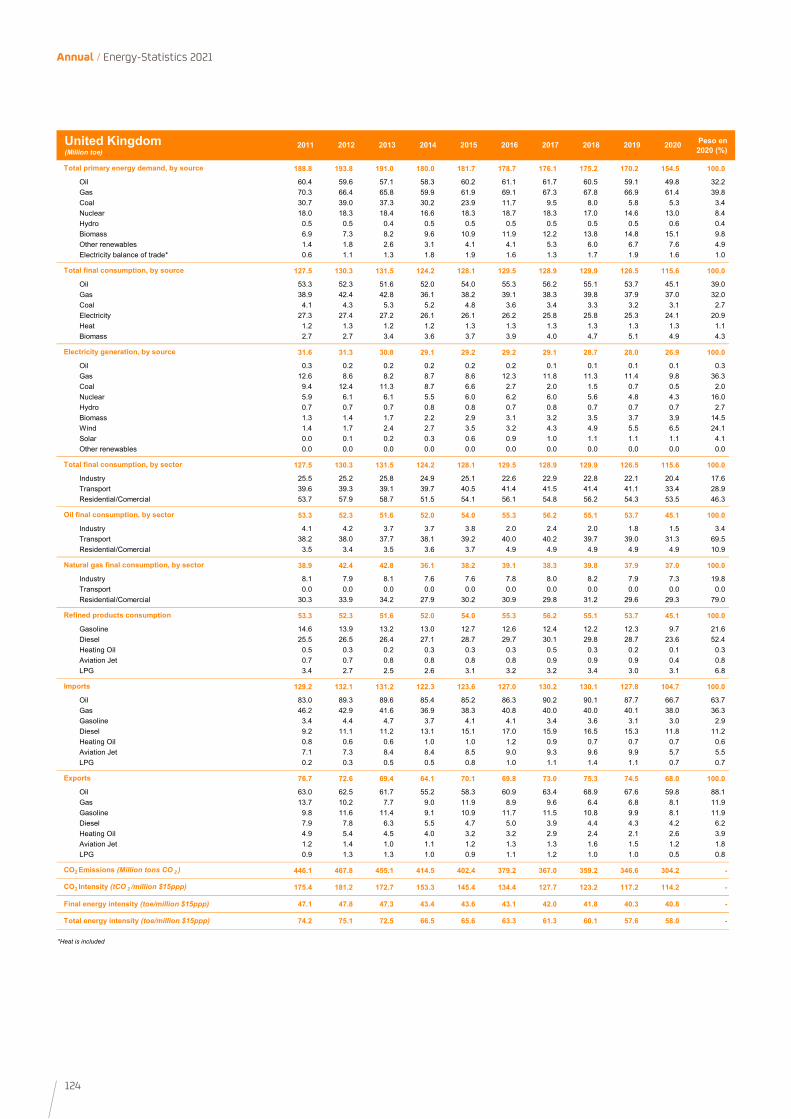
124
Annual / Energy-Statistics 2021
2011 2012 2013 2014 2015 2016 2017 2018 2019 2020 Peso en 2020 (%)
188.8 193.8 191.0 180.0 181.7 178.7 176.1 175.2 170.2 154.5 100.0
Oil 60.4 59.6 57.1 58.3 60.2 61.1 61.7 60.5 59.1 49.8 32.2Gas 70.3 66.4 65.8 59.9 61.9 69.1 67.3 67.8 66.9 61.4 39.8Coal 30.7 39.0 37.3 30.2 23.9 11.7 9.5 8.0 5.8 5.3 3.4Nuclear 18.0 18.3 18.4 16.6 18.3 18.7 18.3 17.0 14.6 13.0 8.4Hydro 0.5 0.5 0.4 0.5 0.5 0.5 0.5 0.5 0.5 0.6 0.4Biomass 6.9 7.3 8.2 9.6 10.9 11.9 12.2 13.8 14.8 15.1 9.8Other renewables 1.4 1.8 2.6 3.1 4.1 4.1 5.3 6.0 6.7 7.6 4.9Electricity balance of trade* 0.6 1.1 1.3 1.8 1.9 1.6 1.3 1.7 1.9 1.6 1.0
127.5 130.3 131.5 124.2 128.1 129.5 128.9 129.9 126.5 115.6 100.0
Oil 53.3 52.3 51.6 52.0 54.0 55.3 56.2 55.1 53.7 45.1 39.0Gas 38.9 42.4 42.8 36.1 38.2 39.1 38.3 39.8 37.9 37.0 32.0Coal 4.1 4.3 5.3 5.2 4.8 3.6 3.4 3.3 3.2 3.1 2.7Electricity 27.3 27.4 27.2 26.1 26.1 26.2 25.8 25.8 25.3 24.1 20.9Heat 1.2 1.3 1.2 1.2 1.3 1.3 1.3 1.3 1.3 1.3 1.1Biomass 2.7 2.7 3.4 3.6 3.7 3.9 4.0 4.7 5.1 4.9 4.3
31.6 31.3 30.8 29.1 29.2 29.2 29.1 28.7 28.0 26.9 100.0
Oil 0.3 0.2 0.2 0.2 0.2 0.2 0.1 0.1 0.1 0.1 0.3Gas 12.6 8.6 8.2 8.7 8.6 12.3 11.8 11.3 11.4 9.8 36.3Coal 9.4 12.4 11.3 8.7 6.6 2.7 2.0 1.5 0.7 0.5 2.0Nuclear 5.9 6.1 6.1 5.5 6.0 6.2 6.0 5.6 4.8 4.3 16.0Hydro 0.7 0.7 0.7 0.8 0.8 0.7 0.8 0.7 0.7 0.7 2.7Biomass 1.3 1.4 1.7 2.2 2.9 3.1 3.2 3.5 3.7 3.9 14.5Wind 1.4 1.7 2.4 2.7 3.5 3.2 4.3 4.9 5.5 6.5 24.1Solar 0.0 0.1 0.2 0.3 0.6 0.9 1.0 1.1 1.1 1.1 4.1Other renewables 0.0 0.0 0.0 0.0 0.0 0.0 0.0 0.0 0.0 0.0 0.0
127.5 130.3 131.5 124.2 128.1 129.5 128.9 129.9 126.5 115.6 100.0
Industry 25.5 25.2 25.8 24.9 25.1 22.6 22.9 22.8 22.1 20.4 17.6Transport 39.6 39.3 39.1 39.7 40.5 41.4 41.5 41.4 41.1 33.4 28.9Residential/Comercial 53.7 57.9 58.7 51.5 54.1 56.1 54.8 56.2 54.3 53.5 46.3
53.3 52.3 51.6 52.0 54.0 55.3 56.2 55.1 53.7 45.1 100.0
Industry 4.1 4.2 3.7 3.7 3.8 2.0 2.4 2.0 1.8 1.5 3.4Transport 38.2 38.0 37.7 38.1 39.2 40.0 40.2 39.7 39.0 31.3 69.5Residential/Comercial 3.5 3.4 3.5 3.6 3.7 4.9 4.9 4.9 4.9 4.9 10.9
38.9 42.4 42.8 36.1 38.2 39.1 38.3 39.8 37.9 37.0 100.0
Industry 8.1 7.9 8.1 7.6 7.6 7.8 8.0 8.2 7.9 7.3 19.8Transport 0.0 0.0 0.0 0.0 0.0 0.0 0.0 0.0 0.0 0.0 0.0Residential/Comercial 30.3 33.9 34.2 27.9 30.2 30.9 29.8 31.2 29.6 29.3 79.0
53.3 52.3 51.6 52.0 54.0 55.3 56.2 55.1 53.7 45.1 100.0
Gasoline 14.6 13.9 13.2 13.0 12.7 12.6 12.4 12.2 12.3 9.7 21.6Diesel 25.5 26.5 26.4 27.1 28.7 29.7 30.1 29.8 28.7 23.6 52.4Heating Oil 0.5 0.3 0.2 0.3 0.3 0.3 0.5 0.3 0.2 0.1 0.3Aviation Jet 0.7 0.7 0.8 0.8 0.8 0.8 0.9 0.9 0.9 0.4 0.8LPG 3.4 2.7 2.5 2.6 3.1 3.2 3.2 3.4 3.0 3.1 6.8
129.2 132.1 131.2 122.3 123.6 127.0 130.2 130.1 127.8 104.7 100.0
Oil 83.0 89.3 89.6 85.4 85.2 86.3 90.2 90.1 87.7 66.7 63.7Gas 46.2 42.9 41.6 36.9 38.3 40.8 40.0 40.0 40.1 38.0 36.3Gasoline 3.4 4.4 4.7 3.7 4.1 4.1 3.4 3.6 3.1 3.0 2.9Diesel 9.2 11.1 11.2 13.1 15.1 17.0 15.9 16.5 15.3 11.8 11.2Heating Oil 0.8 0.6 0.6 1.0 1.0 1.2 0.9 0.7 0.7 0.7 0.6Aviation Jet 7.1 7.3 8.4 8.4 8.5 9.0 9.3 9.6 9.9 5.7 5.5LPG 0.2 0.3 0.5 0.5 0.8 1.0 1.1 1.4 1.1 0.7 0.7
76.7 72.6 69.4 64.1 70.1 69.8 73.0 75.3 74.5 68.0 100.0
Oil 63.0 62.5 61.7 55.2 58.3 60.9 63.4 68.9 67.6 59.8 88.1Gas 13.7 10.2 7.7 9.0 11.9 8.9 9.6 6.4 6.8 8.1 11.9Gasoline 9.8 11.6 11.4 9.1 10.9 11.7 11.5 10.8 9.9 8.1 11.9Diesel 7.9 7.8 6.3 5.5 4.7 5.0 3.9 4.4 4.3 4.2 6.2Heating Oil 4.9 5.4 4.5 4.0 3.2 3.2 2.9 2.4 2.1 2.6 3.9Aviation Jet 1.2 1.4 1.0 1.1 1.2 1.3 1.3 1.6 1.5 1.2 1.8LPG 0.9 1.3 1.3 1.0 0.9 1.1 1.2 1.0 1.0 0.5 0.8
446.1 467.8 455.1 414.5 402.4 379.2 367.0 359.2 346.6 304.2 -
175.4 181.2 172.7 153.3 145.4 134.4 127.7 123.2 117.2 114.2 -
47.1 47.8 47.3 43.4 43.6 43.1 42.0 41.8 40.3 40.8 -
74.2 75.1 72.5 66.5 65.6 63.3 61.3 60.1 57.6 58.0 -
*Heat is included
Final energy intensity (toe/million $15ppp)
Total energy intensity (toe/million $15ppp)
Natural gas final consumption, by sector
Refined products consumption
Imports
Exports
CO2 Emissions (Million tons CO 2 )
CO2 Intensity (tCO 2 /million $15ppp)
Oil final consumption, by sector
United Kingdom(Million toe)
Total primary energy demand, by source
Total final consumption, by source
Electricity generation, by source
Total final consumption, by sector
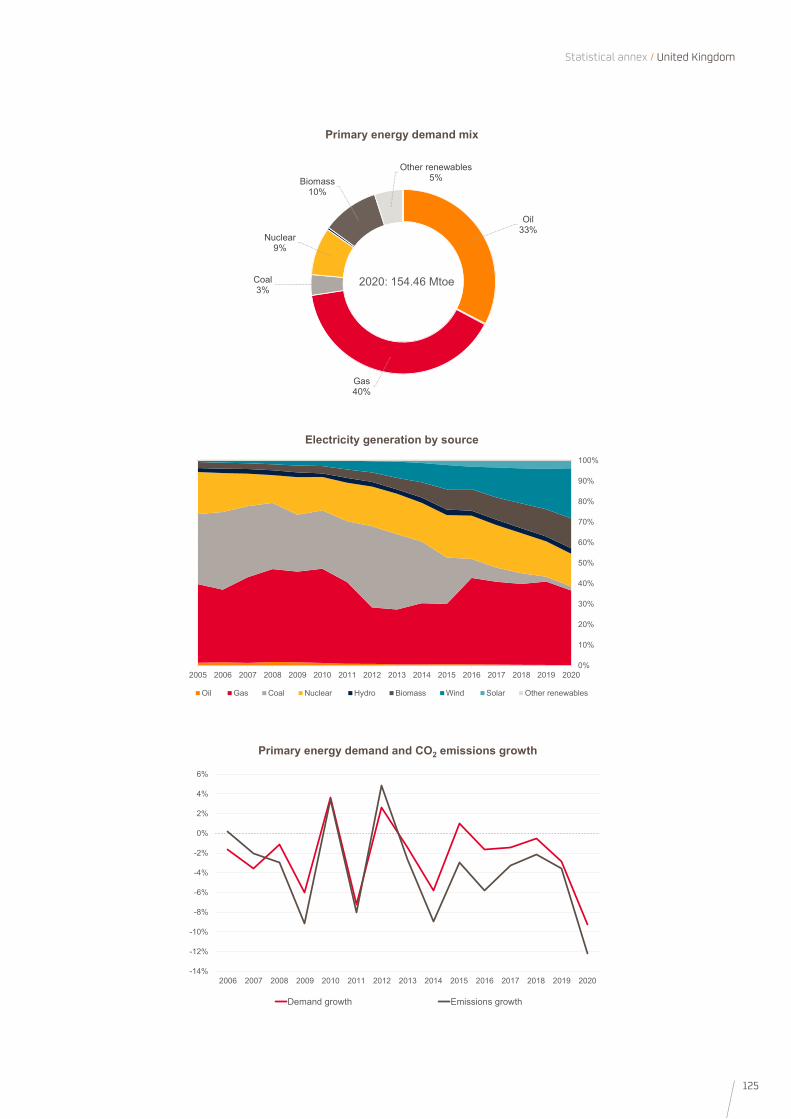
125
Statistical annex / United Kingdom
0%
10%
20%
30%
40%
50%
60%
70%
80%
90%
100%
2005 2006 2007 2008 2009 2010 2011 2012 2013 2014 2015 2016 2017 2018 2019 2020
Oil Gas Coal Nuclear Hydro Biomass Wind Solar Other renewables
Electricity generation by source
-14%
-12%
-10%
-8%
-6%
-4%
-2%
0%
2%
4%
6%
2006 2007 2008 2009 2010 2011 2012 2013 2014 2015 2016 2017 2018 2019 2020
Demand growth Emissions growth
Primary energy demand and CO2 emissions growth
Oil 33%
Gas40%
Coal3%
Nuclear9%
Biomass10%
Other renewables5%
2020: 154.46 Mtoe
Primary energy demand mix
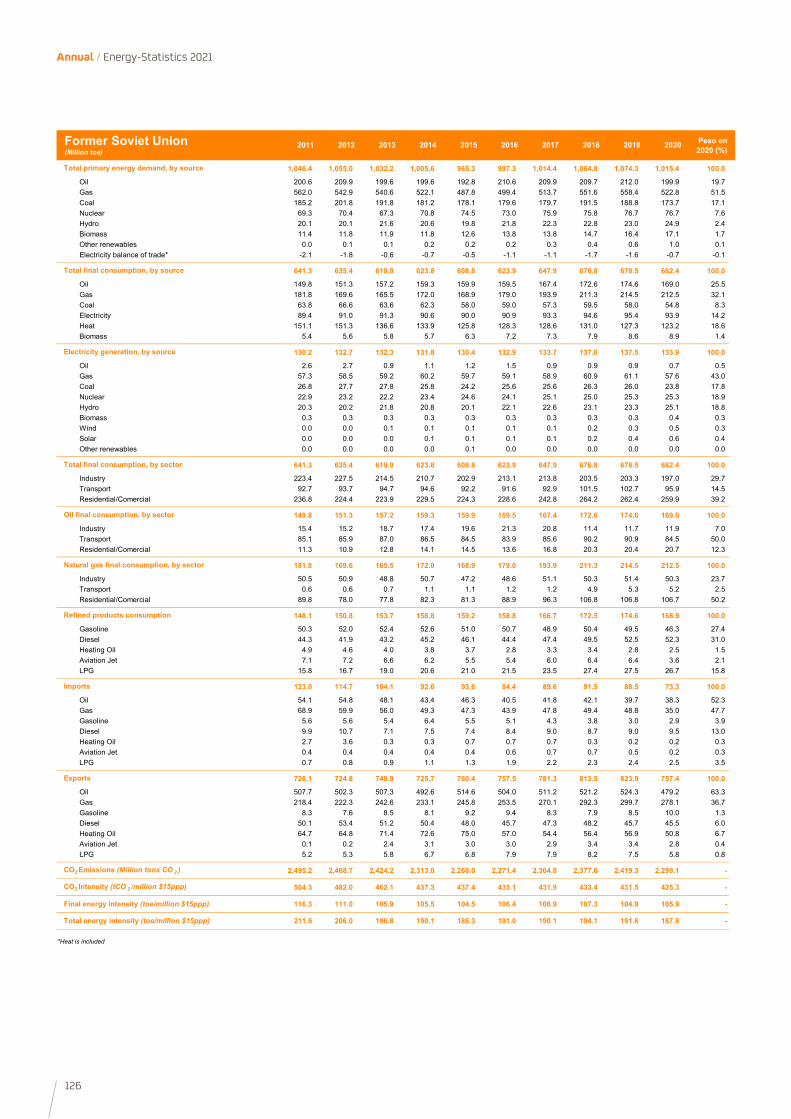
126
Annual / Energy-Statistics 2021
2011 2012 2013 2014 2015 2016 2017 2018 2019 2020 Peso en 2020 (%)
1,046.4 1,055.0 1,032.2 1,005.6 965.3 997.3 1,014.4 1,064.8 1,074.3 1,015.4 100.0
Oil 200.6 209.9 199.6 199.6 192.8 210.6 209.9 209.7 212.0 199.9 19.7Gas 562.0 542.9 540.6 522.1 487.8 499.4 513.7 551.6 558.4 522.8 51.5Coal 185.2 201.8 191.8 181.2 178.1 179.6 179.7 191.5 188.8 173.7 17.1Nuclear 69.3 70.4 67.3 70.8 74.5 73.0 75.9 75.8 76.7 76.7 7.6Hydro 20.1 20.1 21.6 20.6 19.8 21.8 22.3 22.8 23.0 24.9 2.4Biomass 11.4 11.8 11.9 11.8 12.6 13.8 13.8 14.7 16.4 17.1 1.7Other renewables 0.0 0.1 0.1 0.2 0.2 0.2 0.3 0.4 0.6 1.0 0.1Electricity balance of trade* -2.1 -1.8 -0.6 -0.7 -0.5 -1.1 -1.1 -1.7 -1.6 -0.7 -0.1
641.3 635.4 619.9 623.8 608.8 623.9 647.9 676.8 678.5 662.4 100.0
Oil 149.8 151.3 157.2 159.3 159.9 159.5 167.4 172.6 174.6 169.0 25.5Gas 181.8 169.6 165.5 172.0 168.9 179.0 193.9 211.3 214.5 212.5 32.1Coal 63.8 66.6 63.6 62.3 58.0 59.0 57.3 59.5 58.0 54.8 8.3Electricity 89.4 91.0 91.3 90.6 90.0 90.9 93.3 94.6 95.4 93.9 14.2Heat 151.1 151.3 136.6 133.9 125.8 128.3 128.6 131.0 127.3 123.2 18.6Biomass 5.4 5.6 5.8 5.7 6.3 7.2 7.3 7.9 8.6 8.9 1.4
130.2 132.7 132.3 131.8 130.4 132.9 133.7 137.0 137.5 133.9 100.0
Oil 2.6 2.7 0.9 1.1 1.2 1.5 0.9 0.9 0.9 0.7 0.5Gas 57.3 58.5 59.2 60.2 59.7 59.1 58.9 60.9 61.1 57.6 43.0Coal 26.8 27.7 27.8 25.8 24.2 25.6 25.6 26.3 26.0 23.8 17.8Nuclear 22.9 23.2 22.2 23.4 24.6 24.1 25.1 25.0 25.3 25.3 18.9Hydro 20.3 20.2 21.8 20.8 20.1 22.1 22.6 23.1 23.3 25.1 18.8Biomass 0.3 0.3 0.3 0.3 0.3 0.3 0.3 0.3 0.3 0.4 0.3Wind 0.0 0.0 0.1 0.1 0.1 0.1 0.1 0.2 0.3 0.5 0.3Solar 0.0 0.0 0.0 0.1 0.1 0.1 0.1 0.2 0.4 0.6 0.4Other renewables 0.0 0.0 0.0 0.0 0.1 0.0 0.0 0.0 0.0 0.0 0.0
641.3 635.4 619.9 623.8 608.8 623.9 647.9 676.8 678.5 662.4 100.0
Industry 223.4 227.5 214.5 210.7 202.9 213.1 213.8 203.5 203.3 197.0 29.7Transport 92.7 93.7 94.7 94.6 92.2 91.6 92.9 101.5 102.7 95.9 14.5Residential/Comercial 236.8 224.4 223.9 229.5 224.3 228.6 242.8 264.2 262.4 259.9 39.2
149.8 151.3 157.2 159.3 159.9 159.5 167.4 172.6 174.6 169.0 100.0
Industry 15.4 15.2 18.7 17.4 19.6 21.3 20.8 11.4 11.7 11.9 7.0Transport 85.1 85.9 87.0 86.5 84.5 83.9 85.6 90.2 90.9 84.5 50.0Residential/Comercial 11.3 10.9 12.8 14.1 14.5 13.6 16.8 20.3 20.4 20.7 12.3
181.8 169.6 165.5 172.0 168.9 179.0 193.9 211.3 214.5 212.5 100.0
Industry 50.5 50.9 48.8 50.7 47.2 48.6 51.1 50.3 51.4 50.3 23.7Transport 0.6 0.6 0.7 1.1 1.1 1.2 1.2 4.9 5.3 5.2 2.5Residential/Comercial 89.8 78.0 77.8 82.3 81.3 88.9 96.3 106.8 106.8 106.7 50.2
148.1 150.8 153.7 158.8 159.2 158.8 166.7 172.5 174.6 168.9 100.0
Gasoline 50.3 52.0 52.4 52.6 51.0 50.7 48.9 50.4 49.5 46.3 27.4Diesel 44.3 41.9 43.2 45.2 46.1 44.4 47.4 49.5 52.5 52.3 31.0Heating Oil 4.9 4.6 4.0 3.8 3.7 2.8 3.3 3.4 2.8 2.5 1.5Aviation Jet 7.1 7.2 6.6 6.2 5.5 5.4 6.0 6.4 6.4 3.6 2.1LPG 15.8 16.7 19.0 20.6 21.0 21.5 23.5 27.4 27.5 26.7 15.8
123.0 114.7 104.1 92.6 93.6 84.4 89.6 91.5 88.5 73.3 100.0
Oil 54.1 54.8 48.1 43.4 46.3 40.5 41.8 42.1 39.7 38.3 52.3Gas 68.9 59.9 56.0 49.3 47.3 43.9 47.8 49.4 48.8 35.0 47.7Gasoline 5.6 5.6 5.4 6.4 5.5 5.1 4.3 3.8 3.0 2.9 3.9Diesel 9.9 10.7 7.1 7.5 7.4 8.4 9.0 8.7 9.0 9.5 13.0Heating Oil 2.7 3.6 0.3 0.3 0.7 0.7 0.7 0.3 0.2 0.2 0.3Aviation Jet 0.4 0.4 0.4 0.4 0.4 0.6 0.7 0.7 0.5 0.2 0.3LPG 0.7 0.8 0.9 1.1 1.3 1.9 2.2 2.3 2.4 2.5 3.5
726.1 724.6 749.9 725.7 760.4 757.5 781.3 813.5 823.9 757.4 100.0
Oil 507.7 502.3 507.3 492.6 514.6 504.0 511.2 521.2 524.3 479.2 63.3Gas 218.4 222.3 242.6 233.1 245.8 253.5 270.1 292.3 299.7 278.1 36.7Gasoline 8.3 7.6 8.5 8.1 9.2 9.4 8.3 7.9 8.5 10.0 1.3Diesel 50.1 53.4 51.2 50.4 48.0 45.7 47.3 48.2 45.7 45.5 6.0Heating Oil 64.7 64.8 71.4 72.6 75.0 57.0 54.4 56.4 56.9 50.8 6.7Aviation Jet 0.1 0.2 2.4 3.1 3.0 3.0 2.9 3.4 3.4 2.8 0.4LPG 5.2 5.3 5.8 6.7 6.8 7.9 7.9 8.2 7.5 5.8 0.8
2,495.2 2,468.7 2,424.2 2,313.0 2,266.0 2,271.4 2,304.8 2,377.6 2,419.3 2,299.1 -
504.3 482.0 462.1 437.3 437.4 435.1 431.9 433.4 431.5 425.3 -
116.3 111.0 105.9 105.5 104.5 106.4 106.9 107.3 104.9 105.9 -
211.5 206.0 196.8 190.1 186.3 191.0 190.1 194.1 191.6 187.8 -
*Heat is included
Final energy intensity (toe/million $15ppp)
Total energy intensity (toe/million $15ppp)
Natural gas final consumption, by sector
Refined products consumption
Imports
Exports
CO2 Emissions (Million tons CO 2 )
CO2 Intensity (tCO 2 /million $15ppp)
Oil final consumption, by sector
Former Soviet Union(Million toe)
Total primary energy demand, by source
Total final consumption, by source
Electricity generation, by source
Total final consumption, by sector
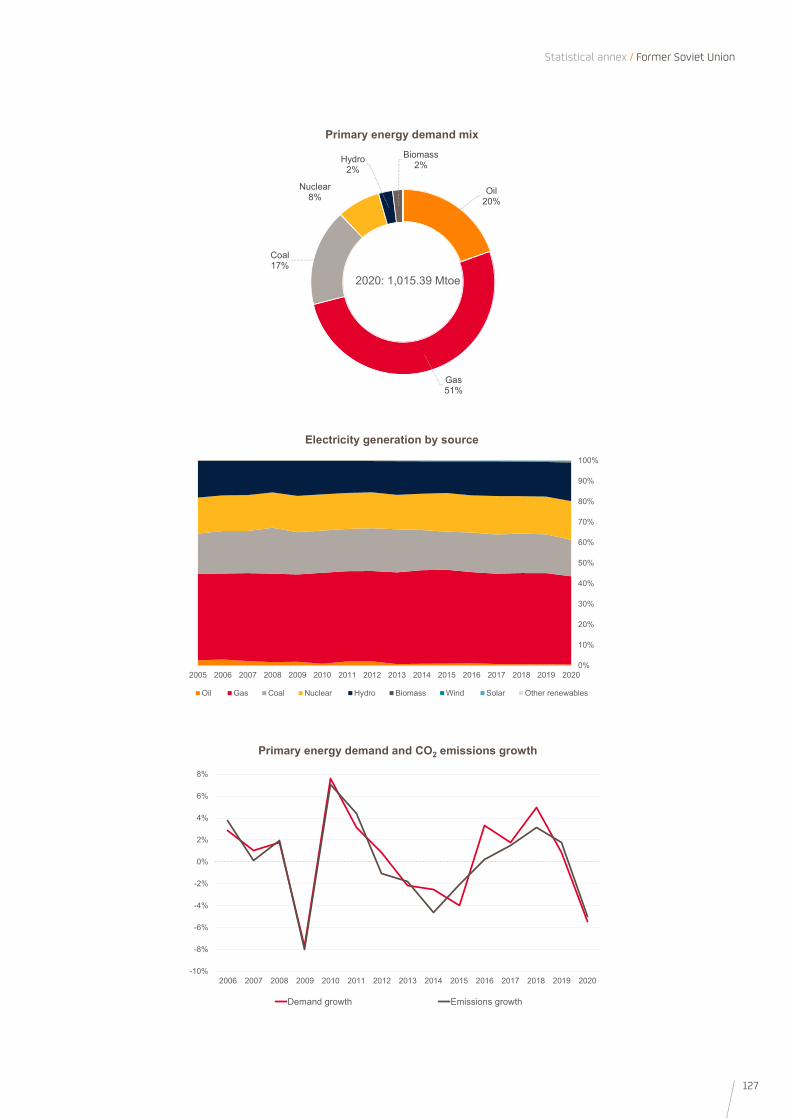
127
Statistical annex / Former Soviet Union
0%
10%
20%
30%
40%
50%
60%
70%
80%
90%
100%
2005 2006 2007 2008 2009 2010 2011 2012 2013 2014 2015 2016 2017 2018 2019 2020
Oil Gas Coal Nuclear Hydro Biomass Wind Solar Other renewables
Electricity generation by source
-10%
-8%
-6%
-4%
-2%
0%
2%
4%
6%
8%
2006 2007 2008 2009 2010 2011 2012 2013 2014 2015 2016 2017 2018 2019 2020
Demand growth Emissions growth
Primary energy demand and CO2 emissions growth
Oil 20%
Gas51%
Coal17%
Nuclear8%
Hydro2%
Biomass2%
2020: 1,015.39 Mtoe
Primary energy demand mix
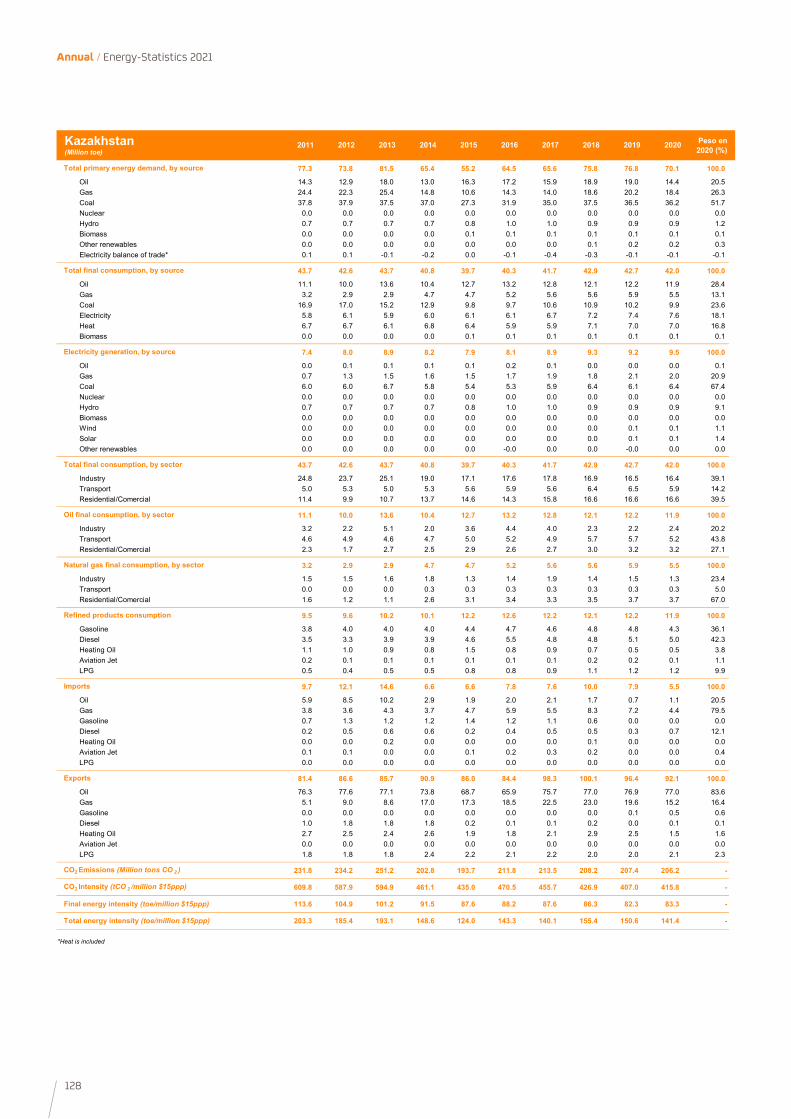
128
Annual / Energy-Statistics 2021
2011 2012 2013 2014 2015 2016 2017 2018 2019 2020 Peso en 2020 (%)
77.3 73.8 81.5 65.4 55.2 64.5 65.6 75.8 76.8 70.1 100.0
Oil 14.3 12.9 18.0 13.0 16.3 17.2 15.9 18.9 19.0 14.4 20.5Gas 24.4 22.3 25.4 14.8 10.6 14.3 14.0 18.6 20.2 18.4 26.3Coal 37.8 37.9 37.5 37.0 27.3 31.9 35.0 37.5 36.5 36.2 51.7Nuclear 0.0 0.0 0.0 0.0 0.0 0.0 0.0 0.0 0.0 0.0 0.0Hydro 0.7 0.7 0.7 0.7 0.8 1.0 1.0 0.9 0.9 0.9 1.2Biomass 0.0 0.0 0.0 0.0 0.1 0.1 0.1 0.1 0.1 0.1 0.1Other renewables 0.0 0.0 0.0 0.0 0.0 0.0 0.0 0.1 0.2 0.2 0.3Electricity balance of trade* 0.1 0.1 -0.1 -0.2 0.0 -0.1 -0.4 -0.3 -0.1 -0.1 -0.1
43.7 42.6 43.7 40.8 39.7 40.3 41.7 42.9 42.7 42.0 100.0
Oil 11.1 10.0 13.6 10.4 12.7 13.2 12.8 12.1 12.2 11.9 28.4Gas 3.2 2.9 2.9 4.7 4.7 5.2 5.6 5.6 5.9 5.5 13.1Coal 16.9 17.0 15.2 12.9 9.8 9.7 10.6 10.9 10.2 9.9 23.6Electricity 5.8 6.1 5.9 6.0 6.1 6.1 6.7 7.2 7.4 7.6 18.1Heat 6.7 6.7 6.1 6.8 6.4 5.9 5.9 7.1 7.0 7.0 16.8Biomass 0.0 0.0 0.0 0.0 0.1 0.1 0.1 0.1 0.1 0.1 0.1
7.4 8.0 8.9 8.2 7.9 8.1 8.9 9.3 9.2 9.5 100.0
Oil 0.0 0.1 0.1 0.1 0.1 0.2 0.1 0.0 0.0 0.0 0.1Gas 0.7 1.3 1.5 1.6 1.5 1.7 1.9 1.8 2.1 2.0 20.9Coal 6.0 6.0 6.7 5.8 5.4 5.3 5.9 6.4 6.1 6.4 67.4Nuclear 0.0 0.0 0.0 0.0 0.0 0.0 0.0 0.0 0.0 0.0 0.0Hydro 0.7 0.7 0.7 0.7 0.8 1.0 1.0 0.9 0.9 0.9 9.1Biomass 0.0 0.0 0.0 0.0 0.0 0.0 0.0 0.0 0.0 0.0 0.0Wind 0.0 0.0 0.0 0.0 0.0 0.0 0.0 0.0 0.1 0.1 1.1Solar 0.0 0.0 0.0 0.0 0.0 0.0 0.0 0.0 0.1 0.1 1.4Other renewables 0.0 0.0 0.0 0.0 0.0 -0.0 0.0 0.0 -0.0 0.0 0.0
43.7 42.6 43.7 40.8 39.7 40.3 41.7 42.9 42.7 42.0 100.0
Industry 24.8 23.7 25.1 19.0 17.1 17.6 17.8 16.9 16.5 16.4 39.1Transport 5.0 5.3 5.0 5.3 5.6 5.9 5.6 6.4 6.5 5.9 14.2Residential/Comercial 11.4 9.9 10.7 13.7 14.6 14.3 15.8 16.6 16.6 16.6 39.5
11.1 10.0 13.6 10.4 12.7 13.2 12.8 12.1 12.2 11.9 100.0
Industry 3.2 2.2 5.1 2.0 3.6 4.4 4.0 2.3 2.2 2.4 20.2Transport 4.6 4.9 4.6 4.7 5.0 5.2 4.9 5.7 5.7 5.2 43.8Residential/Comercial 2.3 1.7 2.7 2.5 2.9 2.6 2.7 3.0 3.2 3.2 27.1
3.2 2.9 2.9 4.7 4.7 5.2 5.6 5.6 5.9 5.5 100.0
Industry 1.5 1.5 1.6 1.8 1.3 1.4 1.9 1.4 1.5 1.3 23.4Transport 0.0 0.0 0.0 0.3 0.3 0.3 0.3 0.3 0.3 0.3 5.0Residential/Comercial 1.6 1.2 1.1 2.6 3.1 3.4 3.3 3.5 3.7 3.7 67.0
9.5 9.6 10.2 10.1 12.2 12.6 12.2 12.1 12.2 11.9 100.0
Gasoline 3.8 4.0 4.0 4.0 4.4 4.7 4.6 4.8 4.8 4.3 36.1Diesel 3.5 3.3 3.9 3.9 4.6 5.5 4.8 4.8 5.1 5.0 42.3Heating Oil 1.1 1.0 0.9 0.8 1.5 0.8 0.9 0.7 0.5 0.5 3.8Aviation Jet 0.2 0.1 0.1 0.1 0.1 0.1 0.1 0.2 0.2 0.1 1.1LPG 0.5 0.4 0.5 0.5 0.8 0.8 0.9 1.1 1.2 1.2 9.9
9.7 12.1 14.6 6.6 6.6 7.8 7.6 10.0 7.9 5.5 100.0
Oil 5.9 8.5 10.2 2.9 1.9 2.0 2.1 1.7 0.7 1.1 20.5Gas 3.8 3.6 4.3 3.7 4.7 5.9 5.5 8.3 7.2 4.4 79.5Gasoline 0.7 1.3 1.2 1.2 1.4 1.2 1.1 0.6 0.0 0.0 0.0Diesel 0.2 0.5 0.6 0.6 0.2 0.4 0.5 0.5 0.3 0.7 12.1Heating Oil 0.0 0.0 0.2 0.0 0.0 0.0 0.0 0.1 0.0 0.0 0.0Aviation Jet 0.1 0.1 0.0 0.0 0.1 0.2 0.3 0.2 0.0 0.0 0.4LPG 0.0 0.0 0.0 0.0 0.0 0.0 0.0 0.0 0.0 0.0 0.0
81.4 86.6 85.7 90.9 86.0 84.4 98.3 100.1 96.4 92.1 100.0
Oil 76.3 77.6 77.1 73.8 68.7 65.9 75.7 77.0 76.9 77.0 83.6Gas 5.1 9.0 8.6 17.0 17.3 18.5 22.5 23.0 19.6 15.2 16.4Gasoline 0.0 0.0 0.0 0.0 0.0 0.0 0.0 0.0 0.1 0.5 0.6Diesel 1.0 1.8 1.8 1.8 0.2 0.1 0.1 0.2 0.0 0.1 0.1Heating Oil 2.7 2.5 2.4 2.6 1.9 1.8 2.1 2.9 2.5 1.5 1.6Aviation Jet 0.0 0.0 0.0 0.0 0.0 0.0 0.0 0.0 0.0 0.0 0.0LPG 1.8 1.8 1.8 2.4 2.2 2.1 2.2 2.0 2.0 2.1 2.3
231.8 234.2 251.2 202.8 193.7 211.8 213.5 208.2 207.4 206.2 -
609.8 587.9 594.9 461.1 435.0 470.5 455.7 426.9 407.0 415.8 -
113.6 104.9 101.2 91.5 87.6 88.2 87.6 86.3 82.3 83.3 -
203.3 185.4 193.1 148.6 124.0 143.3 140.1 155.4 150.6 141.4 -
*Heat is included
Final energy intensity (toe/million $15ppp)
Total energy intensity (toe/million $15ppp)
Natural gas final consumption, by sector
Refined products consumption
Imports
Exports
CO2 Emissions (Million tons CO 2 )
CO2 Intensity (tCO 2 /million $15ppp)
Oil final consumption, by sector
Kazakhstan(Million toe)
Total primary energy demand, by source
Total final consumption, by source
Electricity generation, by source
Total final consumption, by sector
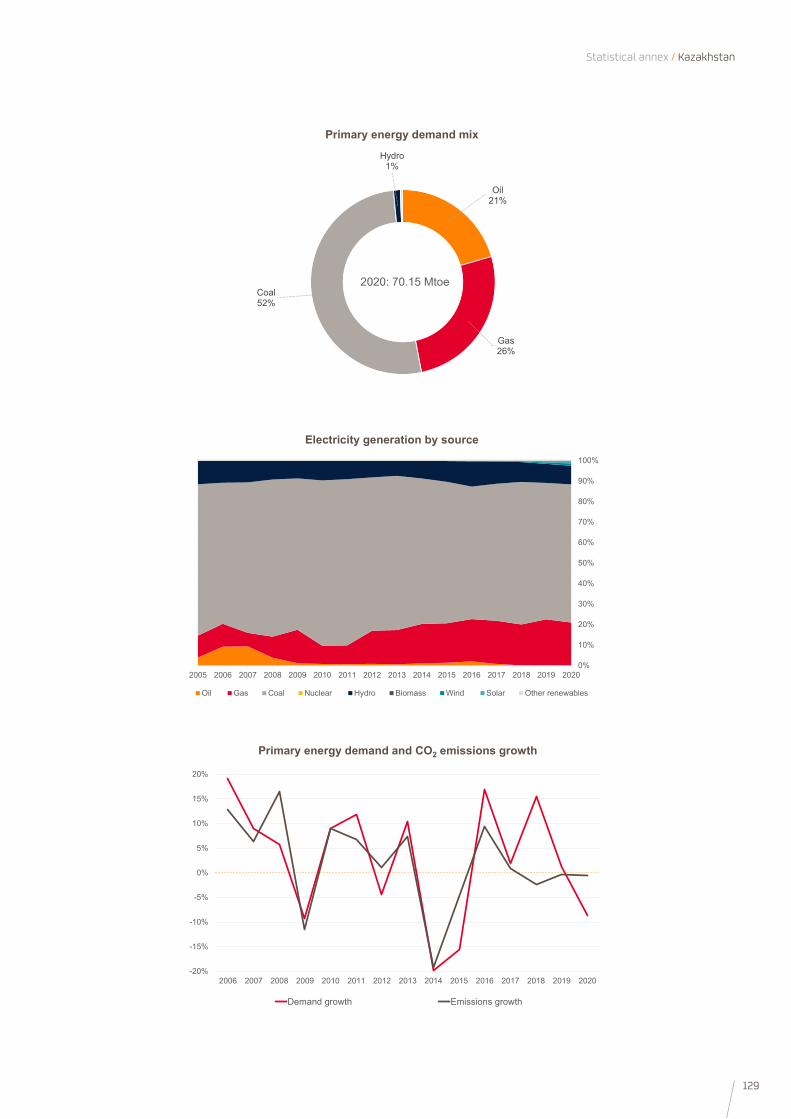
129
Statistical annex / Kazakhstan
0%
10%
20%
30%
40%
50%
60%
70%
80%
90%
100%
2005 2006 2007 2008 2009 2010 2011 2012 2013 2014 2015 2016 2017 2018 2019 2020
Oil Gas Coal Nuclear Hydro Biomass Wind Solar Other renewables
Electricity generation by source
-20%
-15%
-10%
-5%
0%
5%
10%
15%
20%
2006 2007 2008 2009 2010 2011 2012 2013 2014 2015 2016 2017 2018 2019 2020
Demand growth Emissions growth
Primary energy demand and CO2 emissions growth
Oil 21%
Gas26%
Coal52%
Hydro1%
2020: 70.15 Mtoe
Primary energy demand mix
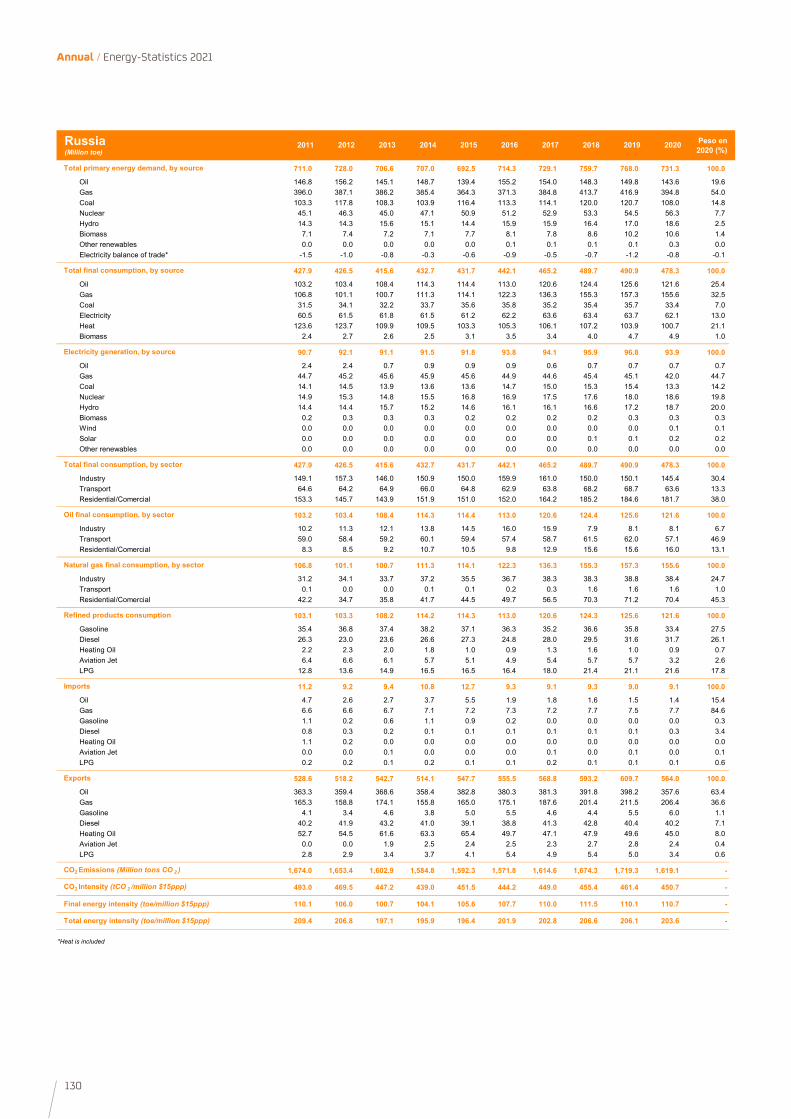
130
Annual / Energy-Statistics 2021
2011 2012 2013 2014 2015 2016 2017 2018 2019 2020 Peso en 2020 (%)
711.0 728.0 706.6 707.0 692.5 714.3 729.1 759.7 768.0 731.3 100.0
Oil 146.8 156.2 145.1 148.7 139.4 155.2 154.0 148.3 149.8 143.6 19.6Gas 396.0 387.1 386.2 385.4 364.3 371.3 384.8 413.7 416.9 394.8 54.0Coal 103.3 117.8 108.3 103.9 116.4 113.3 114.1 120.0 120.7 108.0 14.8Nuclear 45.1 46.3 45.0 47.1 50.9 51.2 52.9 53.3 54.5 56.3 7.7Hydro 14.3 14.3 15.6 15.1 14.4 15.9 15.9 16.4 17.0 18.6 2.5Biomass 7.1 7.4 7.2 7.1 7.7 8.1 7.8 8.6 10.2 10.6 1.4Other renewables 0.0 0.0 0.0 0.0 0.0 0.1 0.1 0.1 0.1 0.3 0.0Electricity balance of trade* -1.5 -1.0 -0.8 -0.3 -0.6 -0.9 -0.5 -0.7 -1.2 -0.8 -0.1
427.9 426.5 415.6 432.7 431.7 442.1 465.2 489.7 490.9 478.3 100.0
Oil 103.2 103.4 108.4 114.3 114.4 113.0 120.6 124.4 125.6 121.6 25.4Gas 106.8 101.1 100.7 111.3 114.1 122.3 136.3 155.3 157.3 155.6 32.5Coal 31.5 34.1 32.2 33.7 35.6 35.8 35.2 35.4 35.7 33.4 7.0Electricity 60.5 61.5 61.8 61.5 61.2 62.2 63.6 63.4 63.7 62.1 13.0Heat 123.6 123.7 109.9 109.5 103.3 105.3 106.1 107.2 103.9 100.7 21.1Biomass 2.4 2.7 2.6 2.5 3.1 3.5 3.4 4.0 4.7 4.9 1.0
90.7 92.1 91.1 91.5 91.8 93.8 94.1 95.9 96.8 93.9 100.0
Oil 2.4 2.4 0.7 0.9 0.9 0.9 0.6 0.7 0.7 0.7 0.7Gas 44.7 45.2 45.6 45.9 45.6 44.9 44.6 45.4 45.1 42.0 44.7Coal 14.1 14.5 13.9 13.6 13.6 14.7 15.0 15.3 15.4 13.3 14.2Nuclear 14.9 15.3 14.8 15.5 16.8 16.9 17.5 17.6 18.0 18.6 19.8Hydro 14.4 14.4 15.7 15.2 14.6 16.1 16.1 16.6 17.2 18.7 20.0Biomass 0.2 0.3 0.3 0.3 0.2 0.2 0.2 0.2 0.3 0.3 0.3Wind 0.0 0.0 0.0 0.0 0.0 0.0 0.0 0.0 0.0 0.1 0.1Solar 0.0 0.0 0.0 0.0 0.0 0.0 0.0 0.1 0.1 0.2 0.2Other renewables 0.0 0.0 0.0 0.0 0.0 0.0 0.0 0.0 0.0 0.0 0.0
427.9 426.5 415.6 432.7 431.7 442.1 465.2 489.7 490.9 478.3 100.0
Industry 149.1 157.3 146.0 150.9 150.0 159.9 161.0 150.0 150.1 145.4 30.4Transport 64.6 64.2 64.9 66.0 64.8 62.9 63.8 68.2 68.7 63.6 13.3Residential/Comercial 153.3 145.7 143.9 151.9 151.0 152.0 164.2 185.2 184.6 181.7 38.0
103.2 103.4 108.4 114.3 114.4 113.0 120.6 124.4 125.6 121.6 100.0
Industry 10.2 11.3 12.1 13.8 14.5 16.0 15.9 7.9 8.1 8.1 6.7Transport 59.0 58.4 59.2 60.1 59.4 57.4 58.7 61.5 62.0 57.1 46.9Residential/Comercial 8.3 8.5 9.2 10.7 10.5 9.8 12.9 15.6 15.6 16.0 13.1
106.8 101.1 100.7 111.3 114.1 122.3 136.3 155.3 157.3 155.6 100.0
Industry 31.2 34.1 33.7 37.2 35.5 36.7 38.3 38.3 38.8 38.4 24.7Transport 0.1 0.0 0.0 0.1 0.1 0.2 0.3 1.6 1.6 1.6 1.0Residential/Comercial 42.2 34.7 35.8 41.7 44.5 49.7 56.5 70.3 71.2 70.4 45.3
103.1 103.3 108.2 114.2 114.3 113.0 120.6 124.3 125.6 121.6 100.0
Gasoline 35.4 36.8 37.4 38.2 37.1 36.3 35.2 36.6 35.8 33.4 27.5Diesel 26.3 23.0 23.6 26.6 27.3 24.8 28.0 29.5 31.6 31.7 26.1Heating Oil 2.2 2.3 2.0 1.8 1.0 0.9 1.3 1.6 1.0 0.9 0.7Aviation Jet 6.4 6.6 6.1 5.7 5.1 4.9 5.4 5.7 5.7 3.2 2.6LPG 12.8 13.6 14.9 16.5 16.5 16.4 18.0 21.4 21.1 21.6 17.8
11.2 9.2 9.4 10.8 12.7 9.3 9.1 9.3 9.0 9.1 100.0
Oil 4.7 2.6 2.7 3.7 5.5 1.9 1.8 1.6 1.5 1.4 15.4Gas 6.6 6.6 6.7 7.1 7.2 7.3 7.2 7.7 7.5 7.7 84.6Gasoline 1.1 0.2 0.6 1.1 0.9 0.2 0.0 0.0 0.0 0.0 0.3Diesel 0.8 0.3 0.2 0.1 0.1 0.1 0.1 0.1 0.1 0.3 3.4Heating Oil 1.1 0.2 0.0 0.0 0.0 0.0 0.0 0.0 0.0 0.0 0.0Aviation Jet 0.0 0.0 0.1 0.0 0.0 0.0 0.1 0.0 0.1 0.0 0.1LPG 0.2 0.2 0.1 0.2 0.1 0.1 0.2 0.1 0.1 0.1 0.6
528.6 518.2 542.7 514.1 547.7 555.5 568.8 593.2 609.7 564.0 100.0
Oil 363.3 359.4 368.6 358.4 382.8 380.3 381.3 391.8 398.2 357.6 63.4Gas 165.3 158.8 174.1 155.8 165.0 175.1 187.6 201.4 211.5 206.4 36.6Gasoline 4.1 3.4 4.6 3.8 5.0 5.5 4.6 4.4 5.5 6.0 1.1Diesel 40.2 41.9 43.2 41.0 39.1 38.8 41.3 42.8 40.4 40.2 7.1Heating Oil 52.7 54.5 61.6 63.3 65.4 49.7 47.1 47.9 49.6 45.0 8.0Aviation Jet 0.0 0.0 1.9 2.5 2.4 2.5 2.3 2.7 2.8 2.4 0.4LPG 2.8 2.9 3.4 3.7 4.1 5.4 4.9 5.4 5.0 3.4 0.6
1,674.0 1,653.4 1,602.9 1,584.8 1,592.3 1,571.8 1,614.6 1,674.3 1,719.3 1,619.1 -
493.0 469.5 447.2 439.0 451.5 444.2 449.0 455.4 461.4 450.7 -
110.1 106.0 100.7 104.1 105.6 107.7 110.0 111.5 110.1 110.7 -
209.4 206.8 197.1 195.9 196.4 201.9 202.8 206.6 206.1 203.6 -
*Heat is included
Final energy intensity (toe/million $15ppp)
Total energy intensity (toe/million $15ppp)
Natural gas final consumption, by sector
Refined products consumption
Imports
Exports
CO2 Emissions (Million tons CO 2 )
CO2 Intensity (tCO 2 /million $15ppp)
Oil final consumption, by sector
Russia(Million toe)
Total primary energy demand, by source
Total final consumption, by source
Electricity generation, by source
Total final consumption, by sector
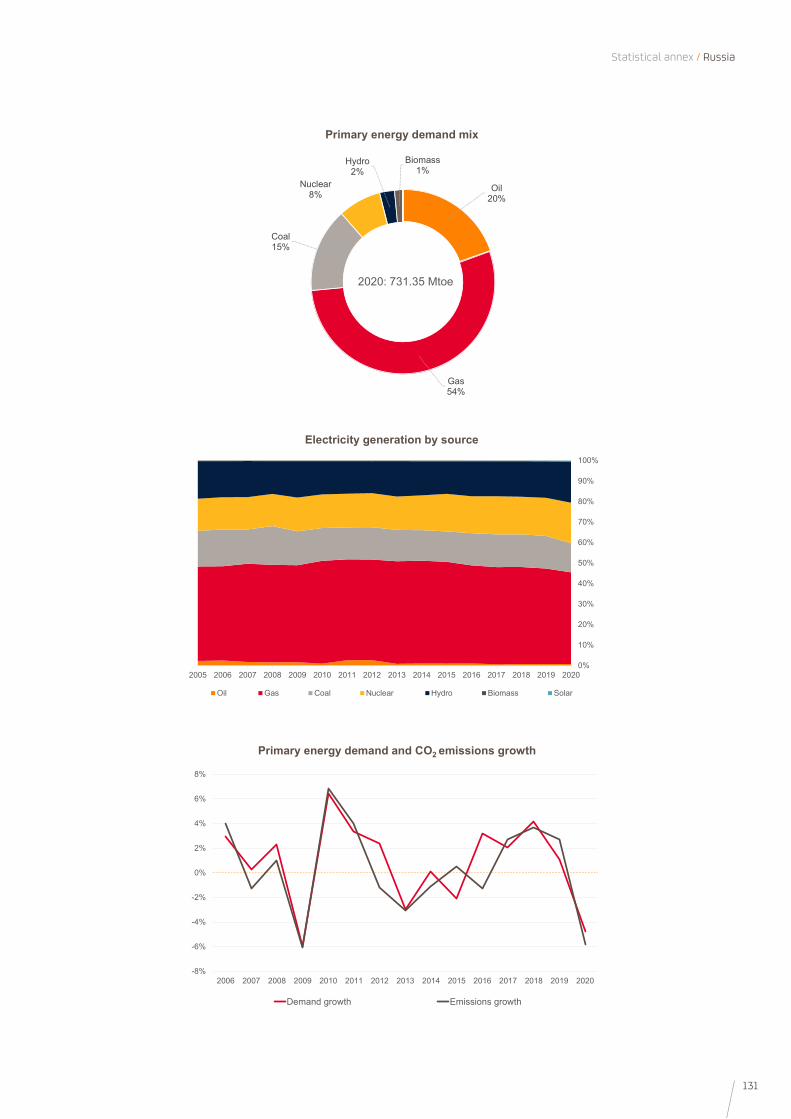
131
Statistical annex / Russia
0%
10%
20%
30%
40%
50%
60%
70%
80%
90%
100%
2005 2006 2007 2008 2009 2010 2011 2012 2013 2014 2015 2016 2017 2018 2019 2020
Oil Gas Coal Nuclear Hydro Biomass Solar
Electricity generation by source
-8%
-6%
-4%
-2%
0%
2%
4%
6%
8%
2006 2007 2008 2009 2010 2011 2012 2013 2014 2015 2016 2017 2018 2019 2020
Demand growth Emissions growth
Primary energy demand and CO2 emissions growth
Oil 20%
Gas54%
Coal15%
Nuclear8%
Hydro2%
Biomass1%
2020: 731.35 Mtoe
Primary energy demand mix
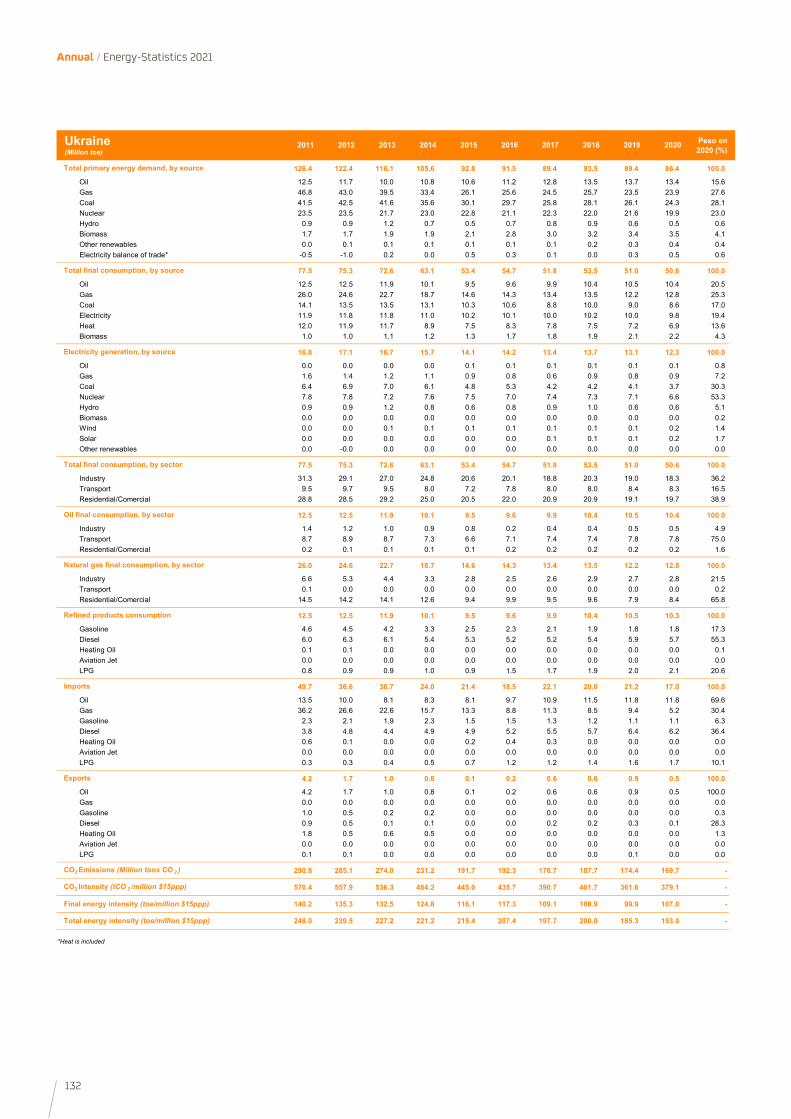
132
Annual / Energy-Statistics 2021
2011 2012 2013 2014 2015 2016 2017 2018 2019 2020 Peso en 2020 (%)
126.4 122.4 116.1 105.6 92.8 91.5 89.4 93.5 89.4 86.4 100.0
Oil 12.5 11.7 10.0 10.8 10.6 11.2 12.8 13.5 13.7 13.4 15.6Gas 46.8 43.0 39.5 33.4 26.1 25.6 24.5 25.7 23.5 23.9 27.6Coal 41.5 42.5 41.6 35.6 30.1 29.7 25.8 28.1 26.1 24.3 28.1Nuclear 23.5 23.5 21.7 23.0 22.8 21.1 22.3 22.0 21.6 19.9 23.0Hydro 0.9 0.9 1.2 0.7 0.5 0.7 0.8 0.9 0.6 0.5 0.6Biomass 1.7 1.7 1.9 1.9 2.1 2.8 3.0 3.2 3.4 3.5 4.1Other renewables 0.0 0.1 0.1 0.1 0.1 0.1 0.1 0.2 0.3 0.4 0.4Electricity balance of trade* -0.5 -1.0 0.2 0.0 0.5 0.3 0.1 0.0 0.3 0.5 0.6
77.5 75.3 72.6 63.1 53.4 54.7 51.8 53.5 51.0 50.6 100.0
Oil 12.5 12.5 11.9 10.1 9.5 9.6 9.9 10.4 10.5 10.4 20.5Gas 26.0 24.6 22.7 18.7 14.6 14.3 13.4 13.5 12.2 12.8 25.3Coal 14.1 13.5 13.5 13.1 10.3 10.6 8.8 10.0 9.0 8.6 17.0Electricity 11.9 11.8 11.8 11.0 10.2 10.1 10.0 10.2 10.0 9.8 19.4Heat 12.0 11.9 11.7 8.9 7.5 8.3 7.8 7.5 7.2 6.9 13.6Biomass 1.0 1.0 1.1 1.2 1.3 1.7 1.8 1.9 2.1 2.2 4.3
16.8 17.1 16.7 15.7 14.1 14.2 13.4 13.7 13.1 12.3 100.0
Oil 0.0 0.0 0.0 0.0 0.1 0.1 0.1 0.1 0.1 0.1 0.8Gas 1.6 1.4 1.2 1.1 0.9 0.8 0.6 0.9 0.8 0.9 7.2Coal 6.4 6.9 7.0 6.1 4.8 5.3 4.2 4.2 4.1 3.7 30.3Nuclear 7.8 7.8 7.2 7.6 7.5 7.0 7.4 7.3 7.1 6.6 53.3Hydro 0.9 0.9 1.2 0.8 0.6 0.8 0.9 1.0 0.6 0.6 5.1Biomass 0.0 0.0 0.0 0.0 0.0 0.0 0.0 0.0 0.0 0.0 0.2Wind 0.0 0.0 0.1 0.1 0.1 0.1 0.1 0.1 0.1 0.2 1.4Solar 0.0 0.0 0.0 0.0 0.0 0.0 0.1 0.1 0.1 0.2 1.7Other renewables 0.0 -0.0 0.0 0.0 0.0 0.0 0.0 0.0 0.0 0.0 0.0
77.5 75.3 72.6 63.1 53.4 54.7 51.8 53.5 51.0 50.6 100.0
Industry 31.3 29.1 27.0 24.8 20.6 20.1 18.8 20.3 19.0 18.3 36.2Transport 9.5 9.7 9.5 8.0 7.2 7.8 8.0 8.0 8.4 8.3 16.5Residential/Comercial 28.8 28.5 29.2 25.0 20.5 22.0 20.9 20.9 19.1 19.7 38.9
12.5 12.5 11.9 10.1 9.5 9.6 9.9 10.4 10.5 10.4 100.0
Industry 1.4 1.2 1.0 0.9 0.8 0.2 0.4 0.4 0.5 0.5 4.9Transport 8.7 8.9 8.7 7.3 6.6 7.1 7.4 7.4 7.8 7.8 75.0Residential/Comercial 0.2 0.1 0.1 0.1 0.1 0.2 0.2 0.2 0.2 0.2 1.6
26.0 24.6 22.7 18.7 14.6 14.3 13.4 13.5 12.2 12.8 100.0
Industry 6.6 5.3 4.4 3.3 2.8 2.5 2.6 2.9 2.7 2.8 21.5Transport 0.1 0.0 0.0 0.0 0.0 0.0 0.0 0.0 0.0 0.0 0.2Residential/Comercial 14.5 14.2 14.1 12.6 9.4 9.9 9.5 9.6 7.9 8.4 65.8
12.5 12.5 11.9 10.1 9.5 9.6 9.9 10.4 10.5 10.3 100.0
Gasoline 4.6 4.5 4.2 3.3 2.5 2.3 2.1 1.9 1.8 1.8 17.3Diesel 6.0 6.3 6.1 5.4 5.3 5.2 5.2 5.4 5.9 5.7 55.3Heating Oil 0.1 0.1 0.0 0.0 0.0 0.0 0.0 0.0 0.0 0.0 0.1Aviation Jet 0.0 0.0 0.0 0.0 0.0 0.0 0.0 0.0 0.0 0.0 0.0LPG 0.8 0.9 0.9 1.0 0.9 1.5 1.7 1.9 2.0 2.1 20.6
49.7 36.6 30.7 24.0 21.4 18.5 22.1 20.0 21.2 17.0 100.0
Oil 13.5 10.0 8.1 8.3 8.1 9.7 10.9 11.5 11.8 11.8 69.6Gas 36.2 26.6 22.6 15.7 13.3 8.8 11.3 8.5 9.4 5.2 30.4Gasoline 2.3 2.1 1.9 2.3 1.5 1.5 1.3 1.2 1.1 1.1 6.3Diesel 3.8 4.8 4.4 4.9 4.9 5.2 5.5 5.7 6.4 6.2 36.4Heating Oil 0.6 0.1 0.0 0.0 0.2 0.4 0.3 0.0 0.0 0.0 0.0Aviation Jet 0.0 0.0 0.0 0.0 0.0 0.0 0.0 0.0 0.0 0.0 0.0LPG 0.3 0.3 0.4 0.5 0.7 1.2 1.2 1.4 1.6 1.7 10.1
4.2 1.7 1.0 0.8 0.1 0.2 0.6 0.6 0.9 0.5 100.0
Oil 4.2 1.7 1.0 0.8 0.1 0.2 0.6 0.6 0.9 0.5 100.0Gas 0.0 0.0 0.0 0.0 0.0 0.0 0.0 0.0 0.0 0.0 0.0Gasoline 1.0 0.5 0.2 0.2 0.0 0.0 0.0 0.0 0.0 0.0 0.3Diesel 0.9 0.5 0.1 0.1 0.0 0.0 0.2 0.2 0.3 0.1 28.3Heating Oil 1.8 0.5 0.6 0.5 0.0 0.0 0.0 0.0 0.0 0.0 1.3Aviation Jet 0.0 0.0 0.0 0.0 0.0 0.0 0.0 0.0 0.0 0.0 0.0LPG 0.1 0.1 0.0 0.0 0.0 0.0 0.0 0.0 0.1 0.0 0.0
290.8 285.1 274.0 231.2 191.7 192.3 176.7 187.7 174.4 169.7 -
570.4 557.9 536.3 484.2 445.0 435.7 390.7 401.7 361.6 379.1 -
140.2 135.3 132.5 124.8 116.1 117.3 109.1 108.9 99.9 107.0 -
248.0 239.5 227.2 221.2 215.4 207.4 197.7 200.0 185.3 193.0 -
*Heat is included
Final energy intensity (toe/million $15ppp)
Total energy intensity (toe/million $15ppp)
Natural gas final consumption, by sector
Refined products consumption
Imports
Exports
CO2 Emissions (Million tons CO 2 )
CO2 Intensity (tCO 2 /million $15ppp)
Oil final consumption, by sector
Ukraine(Million toe)
Total primary energy demand, by source
Total final consumption, by source
Electricity generation, by source
Total final consumption, by sector
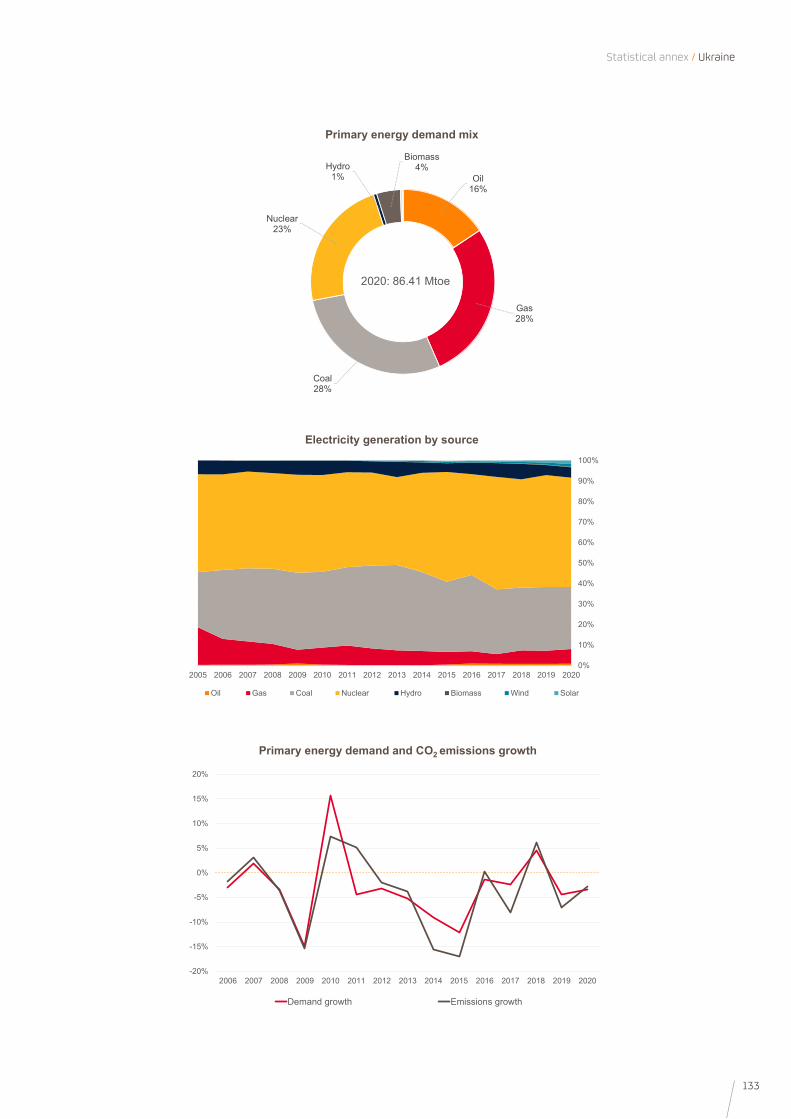
133
Statistical annex / Ukraine
0%
10%
20%
30%
40%
50%
60%
70%
80%
90%
100%
2005 2006 2007 2008 2009 2010 2011 2012 2013 2014 2015 2016 2017 2018 2019 2020
Oil Gas Coal Nuclear Hydro Biomass Wind Solar
Electricity generation by source
-20%
-15%
-10%
-5%
0%
5%
10%
15%
20%
2006 2007 2008 2009 2010 2011 2012 2013 2014 2015 2016 2017 2018 2019 2020
Demand growth Emissions growth
Primary energy demand and CO2 emissions growth
Oil 16%
Gas28%
Coal28%
Nuclear23%
Hydro1%
Biomass4%
2020: 86.41 Mtoe
Primary energy demand mix
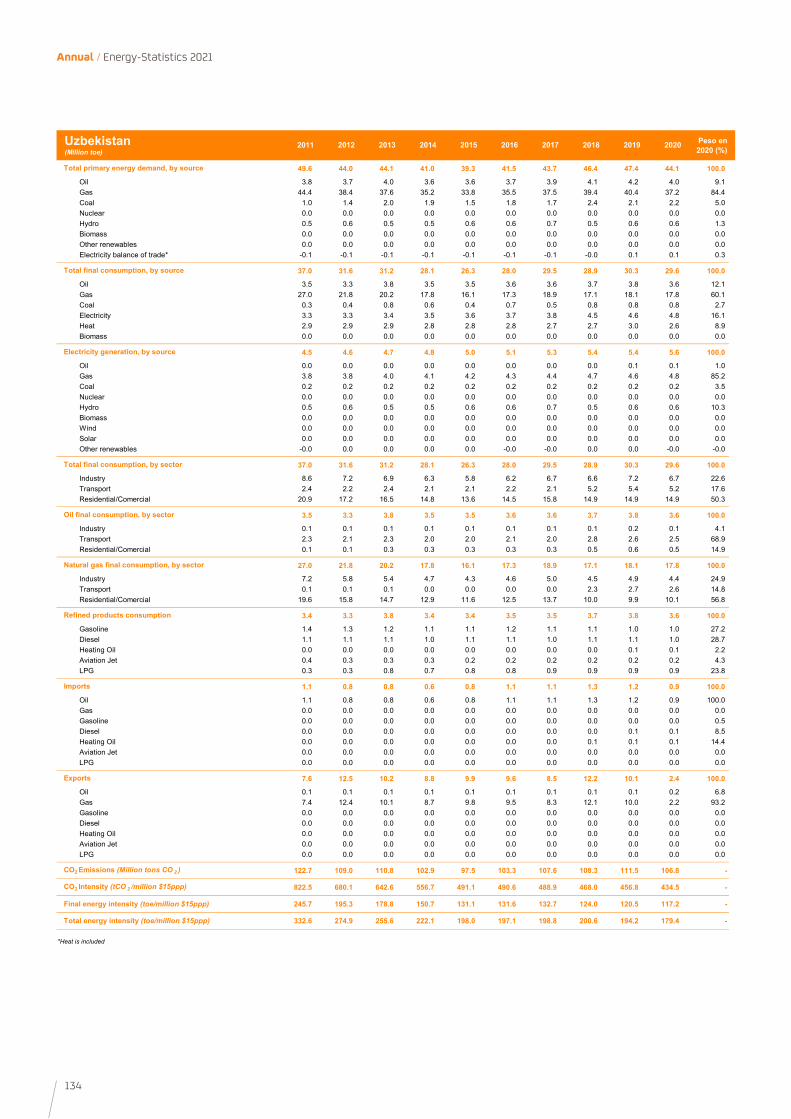
134
Annual / Energy-Statistics 2021
2011 2012 2013 2014 2015 2016 2017 2018 2019 2020 Peso en 2020 (%)
49.6 44.0 44.1 41.0 39.3 41.5 43.7 46.4 47.4 44.1 100.0
Oil 3.8 3.7 4.0 3.6 3.6 3.7 3.9 4.1 4.2 4.0 9.1Gas 44.4 38.4 37.6 35.2 33.8 35.5 37.5 39.4 40.4 37.2 84.4Coal 1.0 1.4 2.0 1.9 1.5 1.8 1.7 2.4 2.1 2.2 5.0Nuclear 0.0 0.0 0.0 0.0 0.0 0.0 0.0 0.0 0.0 0.0 0.0Hydro 0.5 0.6 0.5 0.5 0.6 0.6 0.7 0.5 0.6 0.6 1.3Biomass 0.0 0.0 0.0 0.0 0.0 0.0 0.0 0.0 0.0 0.0 0.0Other renewables 0.0 0.0 0.0 0.0 0.0 0.0 0.0 0.0 0.0 0.0 0.0Electricity balance of trade* -0.1 -0.1 -0.1 -0.1 -0.1 -0.1 -0.1 -0.0 0.1 0.1 0.3
37.0 31.6 31.2 28.1 26.3 28.0 29.5 28.9 30.3 29.6 100.0
Oil 3.5 3.3 3.8 3.5 3.5 3.6 3.6 3.7 3.8 3.6 12.1Gas 27.0 21.8 20.2 17.8 16.1 17.3 18.9 17.1 18.1 17.8 60.1Coal 0.3 0.4 0.8 0.6 0.4 0.7 0.5 0.8 0.8 0.8 2.7Electricity 3.3 3.3 3.4 3.5 3.6 3.7 3.8 4.5 4.6 4.8 16.1Heat 2.9 2.9 2.9 2.8 2.8 2.8 2.7 2.7 3.0 2.6 8.9Biomass 0.0 0.0 0.0 0.0 0.0 0.0 0.0 0.0 0.0 0.0 0.0
4.5 4.6 4.7 4.8 5.0 5.1 5.3 5.4 5.4 5.6 100.0
Oil 0.0 0.0 0.0 0.0 0.0 0.0 0.0 0.0 0.1 0.1 1.0Gas 3.8 3.8 4.0 4.1 4.2 4.3 4.4 4.7 4.6 4.8 85.2Coal 0.2 0.2 0.2 0.2 0.2 0.2 0.2 0.2 0.2 0.2 3.5Nuclear 0.0 0.0 0.0 0.0 0.0 0.0 0.0 0.0 0.0 0.0 0.0Hydro 0.5 0.6 0.5 0.5 0.6 0.6 0.7 0.5 0.6 0.6 10.3Biomass 0.0 0.0 0.0 0.0 0.0 0.0 0.0 0.0 0.0 0.0 0.0Wind 0.0 0.0 0.0 0.0 0.0 0.0 0.0 0.0 0.0 0.0 0.0Solar 0.0 0.0 0.0 0.0 0.0 0.0 0.0 0.0 0.0 0.0 0.0Other renewables -0.0 0.0 0.0 0.0 0.0 -0.0 -0.0 0.0 0.0 -0.0 -0.0
37.0 31.6 31.2 28.1 26.3 28.0 29.5 28.9 30.3 29.6 100.0
Industry 8.6 7.2 6.9 6.3 5.8 6.2 6.7 6.6 7.2 6.7 22.6Transport 2.4 2.2 2.4 2.1 2.1 2.2 2.1 5.2 5.4 5.2 17.6Residential/Comercial 20.9 17.2 16.5 14.8 13.6 14.5 15.8 14.9 14.9 14.9 50.3
3.5 3.3 3.8 3.5 3.5 3.6 3.6 3.7 3.8 3.6 100.0
Industry 0.1 0.1 0.1 0.1 0.1 0.1 0.1 0.1 0.2 0.1 4.1Transport 2.3 2.1 2.3 2.0 2.0 2.1 2.0 2.8 2.6 2.5 68.9Residential/Comercial 0.1 0.1 0.3 0.3 0.3 0.3 0.3 0.5 0.6 0.5 14.9
27.0 21.8 20.2 17.8 16.1 17.3 18.9 17.1 18.1 17.8 100.0
Industry 7.2 5.8 5.4 4.7 4.3 4.6 5.0 4.5 4.9 4.4 24.9Transport 0.1 0.1 0.1 0.0 0.0 0.0 0.0 2.3 2.7 2.6 14.8Residential/Comercial 19.6 15.8 14.7 12.9 11.6 12.5 13.7 10.0 9.9 10.1 56.8
3.4 3.3 3.8 3.4 3.4 3.5 3.5 3.7 3.8 3.6 100.0
Gasoline 1.4 1.3 1.2 1.1 1.1 1.2 1.1 1.1 1.0 1.0 27.2Diesel 1.1 1.1 1.1 1.0 1.1 1.1 1.0 1.1 1.1 1.0 28.7Heating Oil 0.0 0.0 0.0 0.0 0.0 0.0 0.0 0.0 0.1 0.1 2.2Aviation Jet 0.4 0.3 0.3 0.3 0.2 0.2 0.2 0.2 0.2 0.2 4.3LPG 0.3 0.3 0.8 0.7 0.8 0.8 0.9 0.9 0.9 0.9 23.8
1.1 0.8 0.8 0.6 0.8 1.1 1.1 1.3 1.2 0.9 100.0
Oil 1.1 0.8 0.8 0.6 0.8 1.1 1.1 1.3 1.2 0.9 100.0Gas 0.0 0.0 0.0 0.0 0.0 0.0 0.0 0.0 0.0 0.0 0.0Gasoline 0.0 0.0 0.0 0.0 0.0 0.0 0.0 0.0 0.0 0.0 0.5Diesel 0.0 0.0 0.0 0.0 0.0 0.0 0.0 0.0 0.1 0.1 8.5Heating Oil 0.0 0.0 0.0 0.0 0.0 0.0 0.0 0.1 0.1 0.1 14.4Aviation Jet 0.0 0.0 0.0 0.0 0.0 0.0 0.0 0.0 0.0 0.0 0.0LPG 0.0 0.0 0.0 0.0 0.0 0.0 0.0 0.0 0.0 0.0 0.0
7.6 12.5 10.2 8.8 9.9 9.6 8.5 12.2 10.1 2.4 100.0
Oil 0.1 0.1 0.1 0.1 0.1 0.1 0.1 0.1 0.1 0.2 6.8Gas 7.4 12.4 10.1 8.7 9.8 9.5 8.3 12.1 10.0 2.2 93.2Gasoline 0.0 0.0 0.0 0.0 0.0 0.0 0.0 0.0 0.0 0.0 0.0Diesel 0.0 0.0 0.0 0.0 0.0 0.0 0.0 0.0 0.0 0.0 0.0Heating Oil 0.0 0.0 0.0 0.0 0.0 0.0 0.0 0.0 0.0 0.0 0.0Aviation Jet 0.0 0.0 0.0 0.0 0.0 0.0 0.0 0.0 0.0 0.0 0.0LPG 0.0 0.0 0.0 0.0 0.0 0.0 0.0 0.0 0.0 0.0 0.0
122.7 109.0 110.8 102.9 97.5 103.3 107.6 108.3 111.5 106.8 -
822.5 680.1 642.6 556.7 491.1 490.6 488.9 468.0 456.8 434.5 -
245.7 195.3 178.8 150.7 131.1 131.6 132.7 124.0 120.5 117.2 -
332.6 274.9 255.6 222.1 198.0 197.1 198.8 200.6 194.2 179.4 -
*Heat is included
Final energy intensity (toe/million $15ppp)
Total energy intensity (toe/million $15ppp)
Natural gas final consumption, by sector
Refined products consumption
Imports
Exports
CO2 Emissions (Million tons CO 2 )
CO2 Intensity (tCO 2 /million $15ppp)
Oil final consumption, by sector
Uzbekistan(Million toe)
Total primary energy demand, by source
Total final consumption, by source
Electricity generation, by source
Total final consumption, by sector
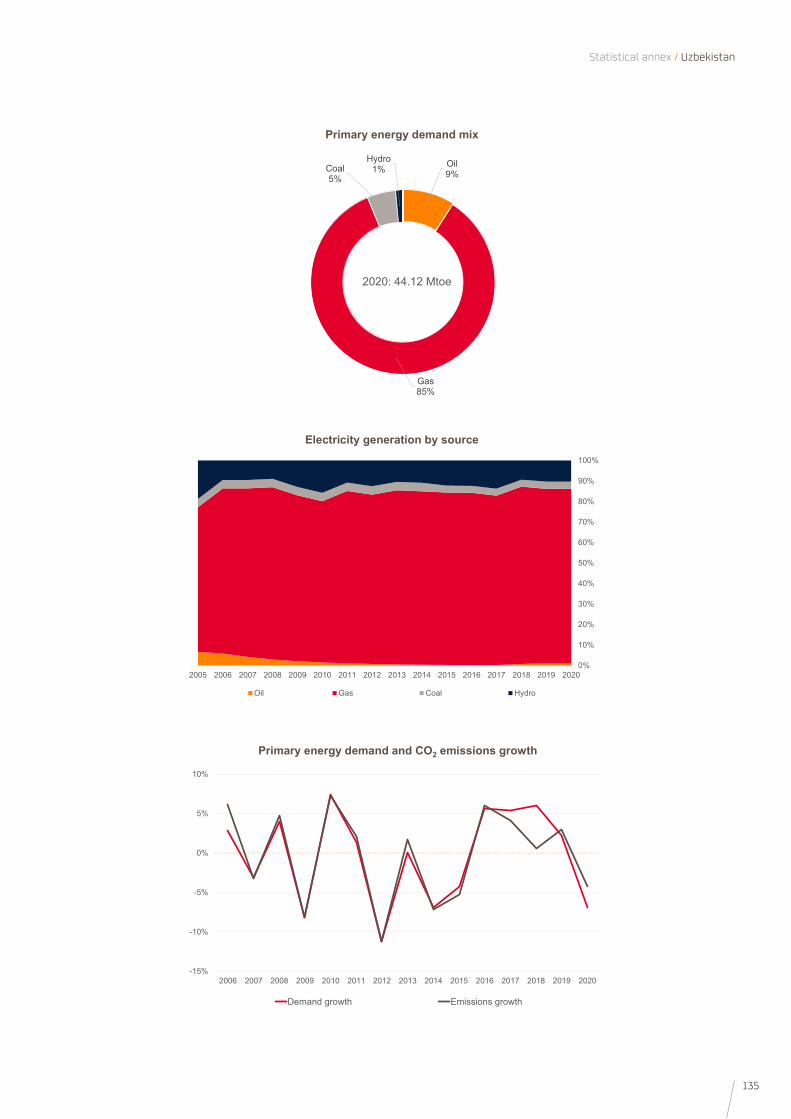
135
Statistical annex / Uzbekistan
0%
10%
20%
30%
40%
50%
60%
70%
80%
90%
100%
2005 2006 2007 2008 2009 2010 2011 2012 2013 2014 2015 2016 2017 2018 2019 2020
Oil Gas Coal Hydro
Electricity generation by source
-15%
-10%
-5%
0%
5%
10%
2006 2007 2008 2009 2010 2011 2012 2013 2014 2015 2016 2017 2018 2019 2020
Demand growth Emissions growth
Primary energy demand and CO2 emissions growth
Oil 9%
Gas85%
Coal5%
Hydro1%
2020: 44.12 Mtoe
Primary energy demand mix
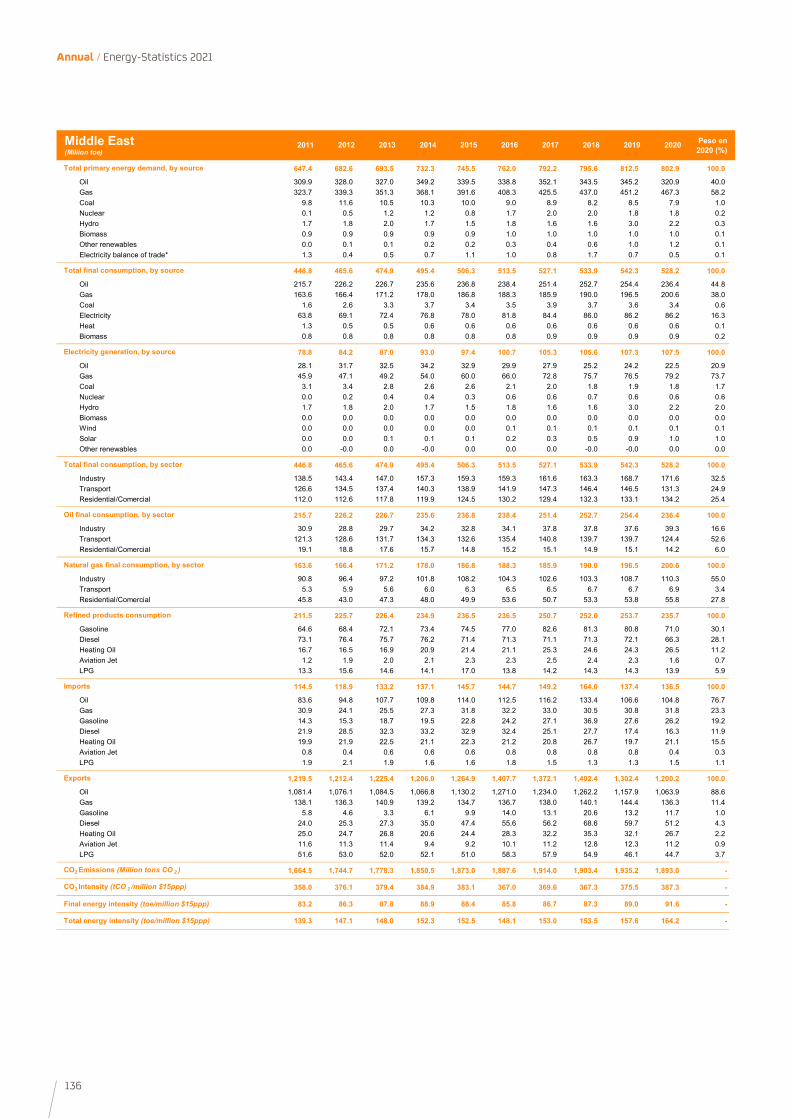
136
Annual / Energy-Statistics 2021
2011 2012 2013 2014 2015 2016 2017 2018 2019 2020 Peso en 2020 (%)
647.4 682.6 693.5 732.3 745.5 762.0 792.2 795.6 812.5 802.9 100.0
Oil 309.9 328.0 327.0 349.2 339.5 338.8 352.1 343.5 345.2 320.9 40.0Gas 323.7 339.3 351.3 368.1 391.6 408.3 425.5 437.0 451.2 467.3 58.2Coal 9.8 11.6 10.5 10.3 10.0 9.0 8.9 8.2 8.5 7.9 1.0Nuclear 0.1 0.5 1.2 1.2 0.8 1.7 2.0 2.0 1.8 1.8 0.2Hydro 1.7 1.8 2.0 1.7 1.5 1.8 1.6 1.6 3.0 2.2 0.3Biomass 0.9 0.9 0.9 0.9 0.9 1.0 1.0 1.0 1.0 1.0 0.1Other renewables 0.0 0.1 0.1 0.2 0.2 0.3 0.4 0.6 1.0 1.2 0.1Electricity balance of trade* 1.3 0.4 0.5 0.7 1.1 1.0 0.8 1.7 0.7 0.5 0.1
446.8 465.6 474.9 495.4 506.3 513.5 527.1 533.9 542.3 528.2 100.0
Oil 215.7 226.2 226.7 235.6 236.8 238.4 251.4 252.7 254.4 236.4 44.8Gas 163.6 166.4 171.2 178.0 186.8 188.3 185.9 190.0 196.5 200.6 38.0Coal 1.6 2.6 3.3 3.7 3.4 3.5 3.9 3.7 3.6 3.4 0.6Electricity 63.8 69.1 72.4 76.8 78.0 81.8 84.4 86.0 86.2 86.2 16.3Heat 1.3 0.5 0.5 0.6 0.6 0.6 0.6 0.6 0.6 0.6 0.1Biomass 0.8 0.8 0.8 0.8 0.8 0.8 0.9 0.9 0.9 0.9 0.2
78.8 84.2 87.0 93.0 97.4 100.7 105.3 105.6 107.3 107.5 100.0
Oil 28.1 31.7 32.5 34.2 32.9 29.9 27.9 25.2 24.2 22.5 20.9Gas 45.9 47.1 49.2 54.0 60.0 66.0 72.8 75.7 76.5 79.2 73.7Coal 3.1 3.4 2.8 2.6 2.6 2.1 2.0 1.8 1.9 1.8 1.7Nuclear 0.0 0.2 0.4 0.4 0.3 0.6 0.6 0.7 0.6 0.6 0.6Hydro 1.7 1.8 2.0 1.7 1.5 1.8 1.6 1.6 3.0 2.2 2.0Biomass 0.0 0.0 0.0 0.0 0.0 0.0 0.0 0.0 0.0 0.0 0.0Wind 0.0 0.0 0.0 0.0 0.0 0.1 0.1 0.1 0.1 0.1 0.1Solar 0.0 0.0 0.1 0.1 0.1 0.2 0.3 0.5 0.9 1.0 1.0Other renewables 0.0 -0.0 0.0 -0.0 0.0 0.0 0.0 -0.0 -0.0 0.0 0.0
446.8 465.6 474.9 495.4 506.3 513.5 527.1 533.9 542.3 528.2 100.0
Industry 138.5 143.4 147.0 157.3 159.3 159.3 161.6 163.3 168.7 171.6 32.5Transport 126.6 134.5 137.4 140.3 138.9 141.9 147.3 146.4 146.5 131.3 24.9Residential/Comercial 112.0 112.6 117.8 119.9 124.5 130.2 129.4 132.3 133.1 134.2 25.4
215.7 226.2 226.7 235.6 236.8 238.4 251.4 252.7 254.4 236.4 100.0
Industry 30.9 28.8 29.7 34.2 32.8 34.1 37.8 37.8 37.6 39.3 16.6Transport 121.3 128.6 131.7 134.3 132.6 135.4 140.8 139.7 139.7 124.4 52.6Residential/Comercial 19.1 18.8 17.6 15.7 14.8 15.2 15.1 14.9 15.1 14.2 6.0
163.6 166.4 171.2 178.0 186.8 188.3 185.9 190.0 196.5 200.6 100.0
Industry 90.8 96.4 97.2 101.8 108.2 104.3 102.6 103.3 108.7 110.3 55.0Transport 5.3 5.9 5.6 6.0 6.3 6.5 6.5 6.7 6.7 6.9 3.4Residential/Comercial 45.8 43.0 47.3 48.0 49.9 53.6 50.7 53.3 53.8 55.8 27.8
211.5 225.7 226.4 234.9 236.5 236.5 250.7 252.0 253.7 235.7 100.0
Gasoline 64.6 68.4 72.1 73.4 74.5 77.0 82.6 81.3 80.8 71.0 30.1Diesel 73.1 76.4 75.7 76.2 71.4 71.3 71.1 71.3 72.1 66.3 28.1Heating Oil 16.7 16.5 16.9 20.9 21.4 21.1 25.3 24.6 24.3 26.5 11.2Aviation Jet 1.2 1.9 2.0 2.1 2.3 2.3 2.5 2.4 2.3 1.6 0.7LPG 13.3 15.6 14.6 14.1 17.0 13.8 14.2 14.3 14.3 13.9 5.9
114.5 118.9 133.2 137.1 145.7 144.7 149.2 164.0 137.4 136.5 100.0
Oil 83.6 94.8 107.7 109.8 114.0 112.5 116.2 133.4 106.6 104.8 76.7Gas 30.9 24.1 25.5 27.3 31.8 32.2 33.0 30.5 30.8 31.8 23.3Gasoline 14.3 15.3 18.7 19.5 22.8 24.2 27.1 36.9 27.6 26.2 19.2Diesel 21.9 28.5 32.3 33.2 32.9 32.4 25.1 27.7 17.4 16.3 11.9Heating Oil 19.9 21.9 22.5 21.1 22.3 21.2 20.8 26.7 19.7 21.1 15.5Aviation Jet 0.8 0.4 0.6 0.6 0.6 0.8 0.8 0.8 0.8 0.4 0.3LPG 1.9 2.1 1.9 1.6 1.6 1.8 1.5 1.3 1.3 1.5 1.1
1,219.5 1,212.4 1,225.4 1,206.0 1,264.9 1,407.7 1,372.1 1,402.4 1,302.4 1,200.2 100.0
Oil 1,081.4 1,076.1 1,084.5 1,066.8 1,130.2 1,271.0 1,234.0 1,262.2 1,157.9 1,063.9 88.6Gas 138.1 136.3 140.9 139.2 134.7 136.7 138.0 140.1 144.4 136.3 11.4Gasoline 5.8 4.6 3.3 6.1 9.9 14.0 13.1 20.6 13.2 11.7 1.0Diesel 24.0 25.3 27.3 35.0 47.4 55.6 56.2 68.6 59.7 51.2 4.3Heating Oil 25.0 24.7 26.8 20.6 24.4 28.3 32.2 35.3 32.1 26.7 2.2Aviation Jet 11.6 11.3 11.4 9.4 9.2 10.1 11.2 12.8 12.3 11.2 0.9LPG 51.6 53.0 52.0 52.1 51.0 58.3 57.9 54.9 46.1 44.7 3.7
1,664.5 1,744.7 1,778.3 1,850.5 1,873.0 1,887.6 1,914.0 1,903.4 1,935.2 1,893.0 -
358.0 376.1 379.4 384.9 383.1 367.0 369.6 367.3 375.5 387.3 -
83.2 86.3 87.8 88.9 88.4 85.8 86.7 87.3 89.0 91.6 -
139.3 147.1 148.0 152.3 152.5 148.1 153.0 153.5 157.6 164.2 -
*Heat is included
Final energy intensity (toe/million $15ppp)
Total energy intensity (toe/million $15ppp)
Natural gas final consumption, by sector
Refined products consumption
Imports
Exports
CO2 Emissions (Million tons CO 2 )
CO2 Intensity (tCO 2 /million $15ppp)
Oil final consumption, by sector
Middle East(Million toe)
Total primary energy demand, by source
Total final consumption, by source
Electricity generation, by source
Total final consumption, by sector
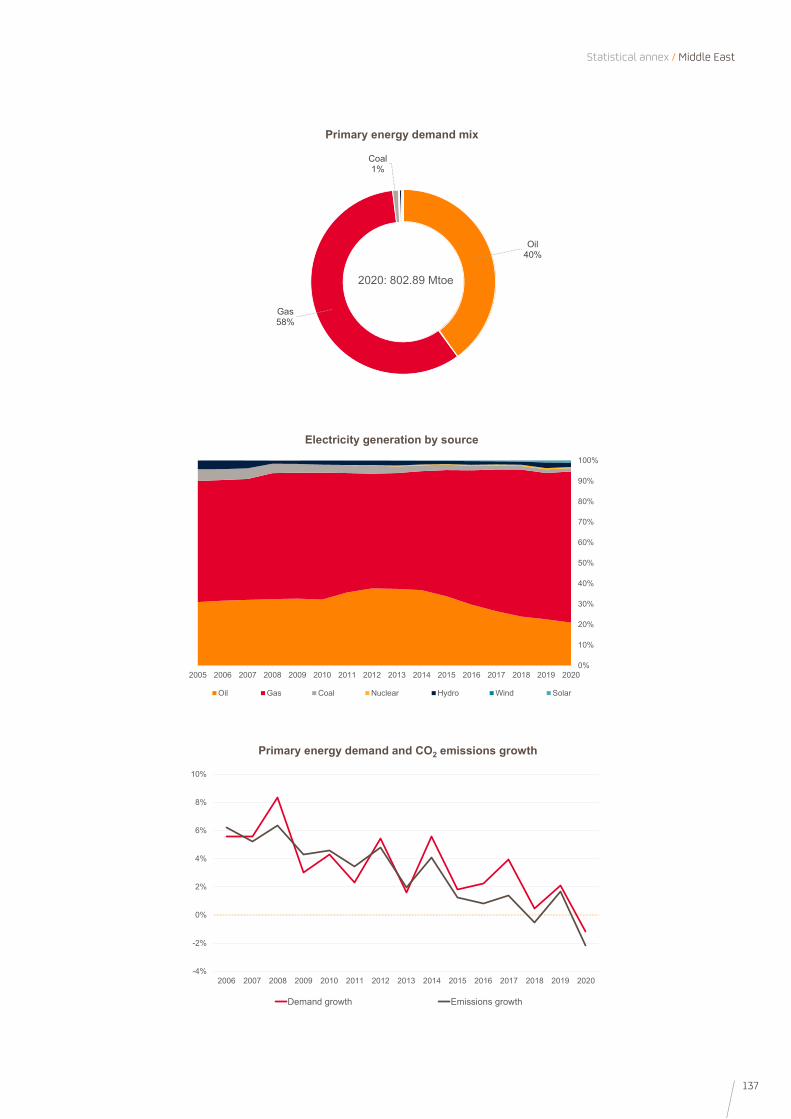
137
Statistical annex / Middle East
0%
10%
20%
30%
40%
50%
60%
70%
80%
90%
100%
2005 2006 2007 2008 2009 2010 2011 2012 2013 2014 2015 2016 2017 2018 2019 2020
Oil Gas Coal Nuclear Hydro Wind Solar
Electricity generation by source
-4%
-2%
0%
2%
4%
6%
8%
10%
2006 2007 2008 2009 2010 2011 2012 2013 2014 2015 2016 2017 2018 2019 2020
Demand growth Emissions growth
Primary energy demand and CO2 emissions growth
Oil 40%
Gas58%
Coal1%
2020: 802.89 Mtoe
Primary energy demand mix
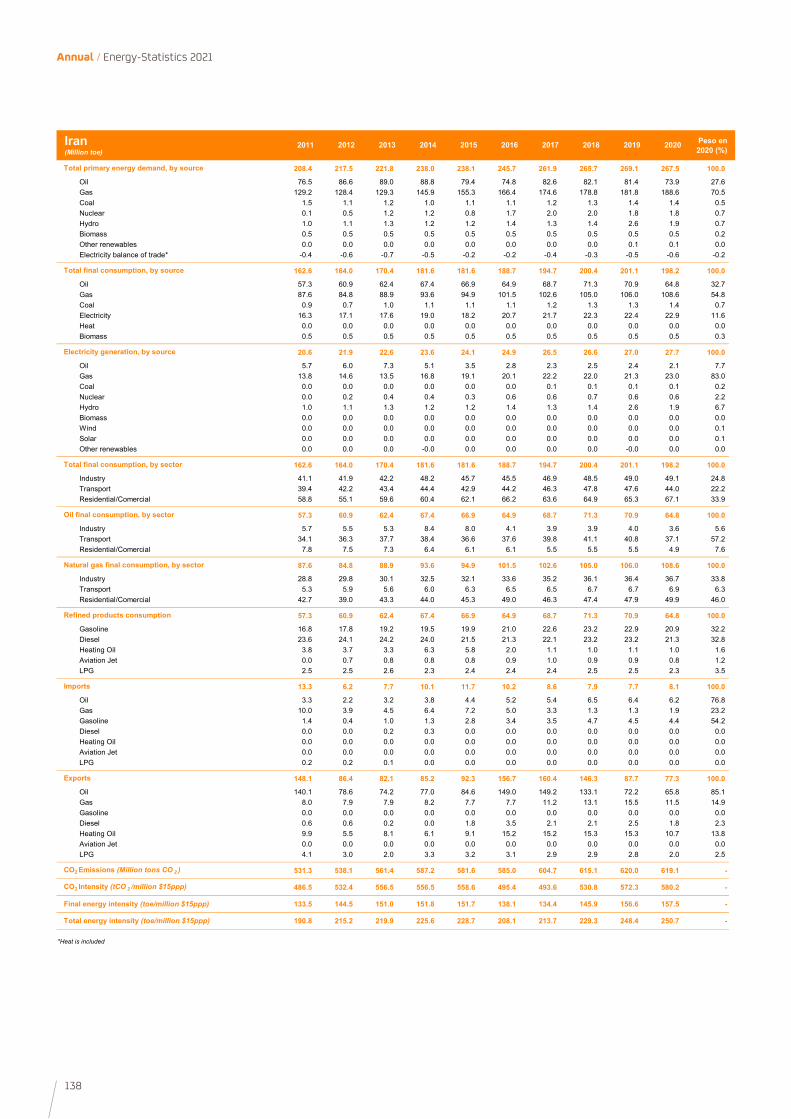
138
Annual / Energy-Statistics 2021
2011 2012 2013 2014 2015 2016 2017 2018 2019 2020 Peso en 2020 (%)
208.4 217.5 221.8 238.0 238.1 245.7 261.9 265.7 269.1 267.5 100.0
Oil 76.5 86.6 89.0 88.8 79.4 74.8 82.6 82.1 81.4 73.9 27.6Gas 129.2 128.4 129.3 145.9 155.3 166.4 174.6 178.8 181.8 188.6 70.5Coal 1.5 1.1 1.2 1.0 1.1 1.1 1.2 1.3 1.4 1.4 0.5Nuclear 0.1 0.5 1.2 1.2 0.8 1.7 2.0 2.0 1.8 1.8 0.7Hydro 1.0 1.1 1.3 1.2 1.2 1.4 1.3 1.4 2.6 1.9 0.7Biomass 0.5 0.5 0.5 0.5 0.5 0.5 0.5 0.5 0.5 0.5 0.2Other renewables 0.0 0.0 0.0 0.0 0.0 0.0 0.0 0.0 0.1 0.1 0.0Electricity balance of trade* -0.4 -0.6 -0.7 -0.5 -0.2 -0.2 -0.4 -0.3 -0.5 -0.6 -0.2
162.6 164.0 170.4 181.6 181.6 188.7 194.7 200.4 201.1 198.2 100.0
Oil 57.3 60.9 62.4 67.4 66.9 64.9 68.7 71.3 70.9 64.8 32.7Gas 87.6 84.8 88.9 93.6 94.9 101.5 102.6 105.0 106.0 108.6 54.8Coal 0.9 0.7 1.0 1.1 1.1 1.1 1.2 1.3 1.3 1.4 0.7Electricity 16.3 17.1 17.6 19.0 18.2 20.7 21.7 22.3 22.4 22.9 11.6Heat 0.0 0.0 0.0 0.0 0.0 0.0 0.0 0.0 0.0 0.0 0.0Biomass 0.5 0.5 0.5 0.5 0.5 0.5 0.5 0.5 0.5 0.5 0.3
20.6 21.9 22.6 23.6 24.1 24.9 26.5 26.6 27.0 27.7 100.0
Oil 5.7 6.0 7.3 5.1 3.5 2.8 2.3 2.5 2.4 2.1 7.7Gas 13.8 14.6 13.5 16.8 19.1 20.1 22.2 22.0 21.3 23.0 83.0Coal 0.0 0.0 0.0 0.0 0.0 0.0 0.1 0.1 0.1 0.1 0.2Nuclear 0.0 0.2 0.4 0.4 0.3 0.6 0.6 0.7 0.6 0.6 2.2Hydro 1.0 1.1 1.3 1.2 1.2 1.4 1.3 1.4 2.6 1.9 6.7Biomass 0.0 0.0 0.0 0.0 0.0 0.0 0.0 0.0 0.0 0.0 0.0Wind 0.0 0.0 0.0 0.0 0.0 0.0 0.0 0.0 0.0 0.0 0.1Solar 0.0 0.0 0.0 0.0 0.0 0.0 0.0 0.0 0.0 0.0 0.1Other renewables 0.0 0.0 0.0 -0.0 0.0 0.0 0.0 0.0 -0.0 0.0 0.0
162.6 164.0 170.4 181.6 181.6 188.7 194.7 200.4 201.1 198.2 100.0
Industry 41.1 41.9 42.2 48.2 45.7 45.5 46.9 48.5 49.0 49.1 24.8Transport 39.4 42.2 43.4 44.4 42.9 44.2 46.3 47.8 47.6 44.0 22.2Residential/Comercial 58.8 55.1 59.6 60.4 62.1 66.2 63.6 64.9 65.3 67.1 33.9
57.3 60.9 62.4 67.4 66.9 64.9 68.7 71.3 70.9 64.8 100.0
Industry 5.7 5.5 5.3 8.4 8.0 4.1 3.9 3.9 4.0 3.6 5.6Transport 34.1 36.3 37.7 38.4 36.6 37.6 39.8 41.1 40.8 37.1 57.2Residential/Comercial 7.8 7.5 7.3 6.4 6.1 6.1 5.5 5.5 5.5 4.9 7.6
87.6 84.8 88.9 93.6 94.9 101.5 102.6 105.0 106.0 108.6 100.0
Industry 28.8 29.8 30.1 32.5 32.1 33.6 35.2 36.1 36.4 36.7 33.8Transport 5.3 5.9 5.6 6.0 6.3 6.5 6.5 6.7 6.7 6.9 6.3Residential/Comercial 42.7 39.0 43.3 44.0 45.3 49.0 46.3 47.4 47.9 49.9 46.0
57.3 60.9 62.4 67.4 66.9 64.9 68.7 71.3 70.9 64.8 100.0
Gasoline 16.8 17.8 19.2 19.5 19.9 21.0 22.6 23.2 22.9 20.9 32.2Diesel 23.6 24.1 24.2 24.0 21.5 21.3 22.1 23.2 23.2 21.3 32.8Heating Oil 3.8 3.7 3.3 6.3 5.8 2.0 1.1 1.0 1.1 1.0 1.6Aviation Jet 0.0 0.7 0.8 0.8 0.8 0.9 1.0 0.9 0.9 0.8 1.2LPG 2.5 2.5 2.6 2.3 2.4 2.4 2.4 2.5 2.5 2.3 3.5
13.3 6.2 7.7 10.1 11.7 10.2 8.6 7.9 7.7 8.1 100.0
Oil 3.3 2.2 3.2 3.8 4.4 5.2 5.4 6.5 6.4 6.2 76.8Gas 10.0 3.9 4.5 6.4 7.2 5.0 3.3 1.3 1.3 1.9 23.2Gasoline 1.4 0.4 1.0 1.3 2.8 3.4 3.5 4.7 4.5 4.4 54.2Diesel 0.0 0.0 0.2 0.3 0.0 0.0 0.0 0.0 0.0 0.0 0.0Heating Oil 0.0 0.0 0.0 0.0 0.0 0.0 0.0 0.0 0.0 0.0 0.0Aviation Jet 0.0 0.0 0.0 0.0 0.0 0.0 0.0 0.0 0.0 0.0 0.0LPG 0.2 0.2 0.1 0.0 0.0 0.0 0.0 0.0 0.0 0.0 0.0
148.1 86.4 82.1 85.2 92.3 156.7 160.4 146.3 87.7 77.3 100.0
Oil 140.1 78.6 74.2 77.0 84.6 149.0 149.2 133.1 72.2 65.8 85.1Gas 8.0 7.9 7.9 8.2 7.7 7.7 11.2 13.1 15.5 11.5 14.9Gasoline 0.0 0.0 0.0 0.0 0.0 0.0 0.0 0.0 0.0 0.0 0.0Diesel 0.6 0.6 0.2 0.0 1.8 3.5 2.1 2.1 2.5 1.8 2.3Heating Oil 9.9 5.5 8.1 6.1 9.1 15.2 15.2 15.3 15.3 10.7 13.8Aviation Jet 0.0 0.0 0.0 0.0 0.0 0.0 0.0 0.0 0.0 0.0 0.0LPG 4.1 3.0 2.0 3.3 3.2 3.1 2.9 2.9 2.8 2.0 2.5
531.3 538.1 561.4 587.2 581.6 585.0 604.7 615.1 620.0 619.1 -
486.5 532.4 556.5 556.5 558.6 495.4 493.6 530.8 572.3 580.2 -
133.5 144.5 151.0 151.8 151.7 138.1 134.4 145.9 156.6 157.5 -
190.8 215.2 219.9 225.6 228.7 208.1 213.7 229.3 248.4 250.7 -
*Heat is included
Final energy intensity (toe/million $15ppp)
Total energy intensity (toe/million $15ppp)
Natural gas final consumption, by sector
Refined products consumption
Imports
Exports
CO2 Emissions (Million tons CO 2 )
CO2 Intensity (tCO 2 /million $15ppp)
Oil final consumption, by sector
Iran(Million toe)
Total primary energy demand, by source
Total final consumption, by source
Electricity generation, by source
Total final consumption, by sector
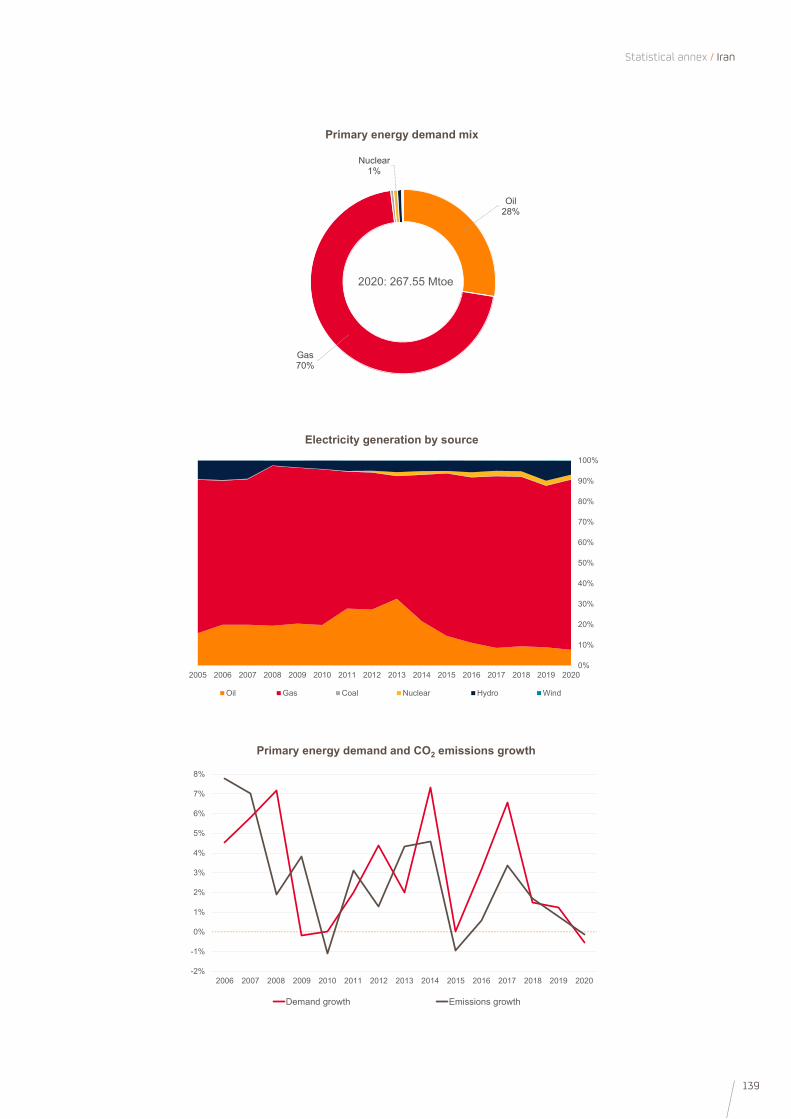
139
Statistical annex / Iran
0%
10%
20%
30%
40%
50%
60%
70%
80%
90%
100%
2005 2006 2007 2008 2009 2010 2011 2012 2013 2014 2015 2016 2017 2018 2019 2020
Oil Gas Coal Nuclear Hydro Wind
Electricity generation by source
-2%
-1%
0%
1%
2%
3%
4%
5%
6%
7%
8%
2006 2007 2008 2009 2010 2011 2012 2013 2014 2015 2016 2017 2018 2019 2020
Demand growth Emissions growth
Primary energy demand and CO2 emissions growth
Oil 28%
Gas70%
Nuclear1%
2020: 267.55 Mtoe
Primary energy demand mix
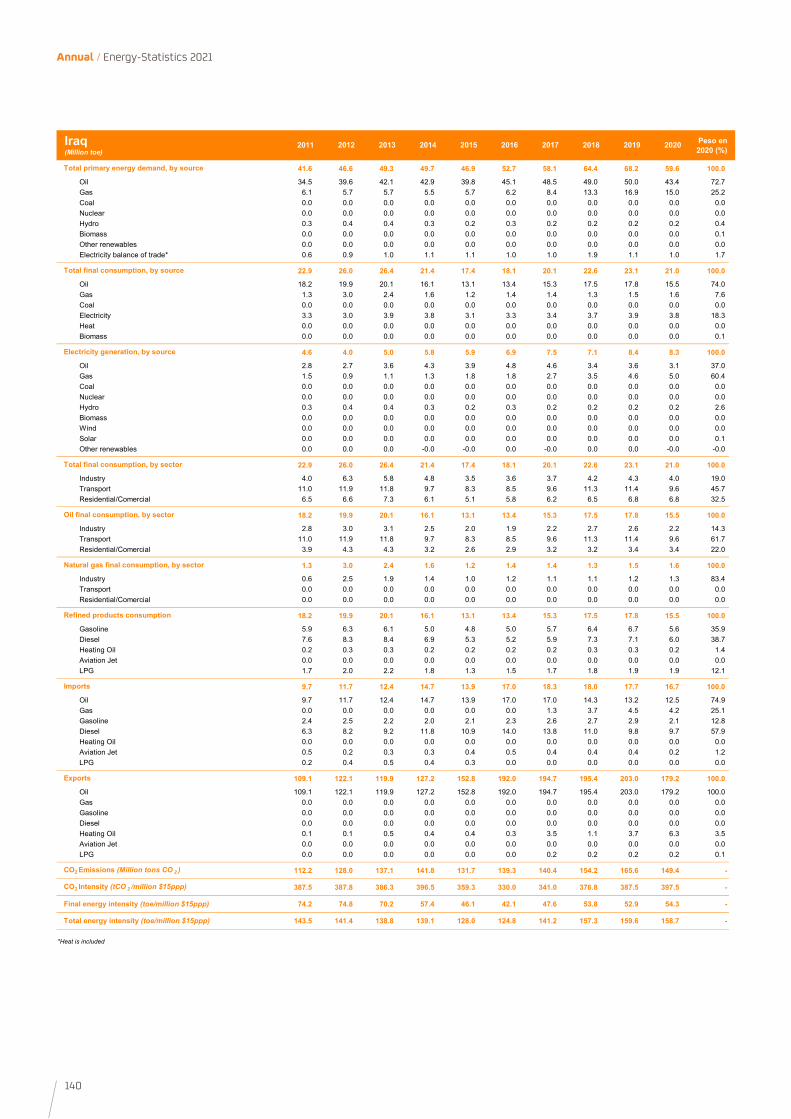
140
Annual / Energy-Statistics 2021
2011 2012 2013 2014 2015 2016 2017 2018 2019 2020 Peso en 2020 (%)
41.6 46.6 49.3 49.7 46.9 52.7 58.1 64.4 68.2 59.6 100.0
Oil 34.5 39.6 42.1 42.9 39.8 45.1 48.5 49.0 50.0 43.4 72.7Gas 6.1 5.7 5.7 5.5 5.7 6.2 8.4 13.3 16.9 15.0 25.2Coal 0.0 0.0 0.0 0.0 0.0 0.0 0.0 0.0 0.0 0.0 0.0Nuclear 0.0 0.0 0.0 0.0 0.0 0.0 0.0 0.0 0.0 0.0 0.0Hydro 0.3 0.4 0.4 0.3 0.2 0.3 0.2 0.2 0.2 0.2 0.4Biomass 0.0 0.0 0.0 0.0 0.0 0.0 0.0 0.0 0.0 0.0 0.1Other renewables 0.0 0.0 0.0 0.0 0.0 0.0 0.0 0.0 0.0 0.0 0.0Electricity balance of trade* 0.6 0.9 1.0 1.1 1.1 1.0 1.0 1.9 1.1 1.0 1.7
22.9 26.0 26.4 21.4 17.4 18.1 20.1 22.6 23.1 21.0 100.0
Oil 18.2 19.9 20.1 16.1 13.1 13.4 15.3 17.5 17.8 15.5 74.0Gas 1.3 3.0 2.4 1.6 1.2 1.4 1.4 1.3 1.5 1.6 7.6Coal 0.0 0.0 0.0 0.0 0.0 0.0 0.0 0.0 0.0 0.0 0.0Electricity 3.3 3.0 3.9 3.8 3.1 3.3 3.4 3.7 3.9 3.8 18.3Heat 0.0 0.0 0.0 0.0 0.0 0.0 0.0 0.0 0.0 0.0 0.0Biomass 0.0 0.0 0.0 0.0 0.0 0.0 0.0 0.0 0.0 0.0 0.1
4.6 4.0 5.0 5.8 5.9 6.9 7.5 7.1 8.4 8.3 100.0
Oil 2.8 2.7 3.6 4.3 3.9 4.8 4.6 3.4 3.6 3.1 37.0Gas 1.5 0.9 1.1 1.3 1.8 1.8 2.7 3.5 4.6 5.0 60.4Coal 0.0 0.0 0.0 0.0 0.0 0.0 0.0 0.0 0.0 0.0 0.0Nuclear 0.0 0.0 0.0 0.0 0.0 0.0 0.0 0.0 0.0 0.0 0.0Hydro 0.3 0.4 0.4 0.3 0.2 0.3 0.2 0.2 0.2 0.2 2.6Biomass 0.0 0.0 0.0 0.0 0.0 0.0 0.0 0.0 0.0 0.0 0.0Wind 0.0 0.0 0.0 0.0 0.0 0.0 0.0 0.0 0.0 0.0 0.0Solar 0.0 0.0 0.0 0.0 0.0 0.0 0.0 0.0 0.0 0.0 0.1Other renewables 0.0 0.0 0.0 -0.0 -0.0 0.0 -0.0 0.0 0.0 -0.0 -0.0
22.9 26.0 26.4 21.4 17.4 18.1 20.1 22.6 23.1 21.0 100.0
Industry 4.0 6.3 5.8 4.8 3.5 3.6 3.7 4.2 4.3 4.0 19.0Transport 11.0 11.9 11.8 9.7 8.3 8.5 9.6 11.3 11.4 9.6 45.7Residential/Comercial 6.5 6.6 7.3 6.1 5.1 5.8 6.2 6.5 6.8 6.8 32.5
18.2 19.9 20.1 16.1 13.1 13.4 15.3 17.5 17.8 15.5 100.0
Industry 2.8 3.0 3.1 2.5 2.0 1.9 2.2 2.7 2.6 2.2 14.3Transport 11.0 11.9 11.8 9.7 8.3 8.5 9.6 11.3 11.4 9.6 61.7Residential/Comercial 3.9 4.3 4.3 3.2 2.6 2.9 3.2 3.2 3.4 3.4 22.0
1.3 3.0 2.4 1.6 1.2 1.4 1.4 1.3 1.5 1.6 100.0
Industry 0.6 2.5 1.9 1.4 1.0 1.2 1.1 1.1 1.2 1.3 83.4Transport 0.0 0.0 0.0 0.0 0.0 0.0 0.0 0.0 0.0 0.0 0.0Residential/Comercial 0.0 0.0 0.0 0.0 0.0 0.0 0.0 0.0 0.0 0.0 0.0
18.2 19.9 20.1 16.1 13.1 13.4 15.3 17.5 17.8 15.5 100.0
Gasoline 5.9 6.3 6.1 5.0 4.8 5.0 5.7 6.4 6.7 5.6 35.9Diesel 7.6 8.3 8.4 6.9 5.3 5.2 5.9 7.3 7.1 6.0 38.7Heating Oil 0.2 0.3 0.3 0.2 0.2 0.2 0.2 0.3 0.3 0.2 1.4Aviation Jet 0.0 0.0 0.0 0.0 0.0 0.0 0.0 0.0 0.0 0.0 0.0LPG 1.7 2.0 2.2 1.8 1.3 1.5 1.7 1.8 1.9 1.9 12.1
9.7 11.7 12.4 14.7 13.9 17.0 18.3 18.0 17.7 16.7 100.0
Oil 9.7 11.7 12.4 14.7 13.9 17.0 17.0 14.3 13.2 12.5 74.9Gas 0.0 0.0 0.0 0.0 0.0 0.0 1.3 3.7 4.5 4.2 25.1Gasoline 2.4 2.5 2.2 2.0 2.1 2.3 2.6 2.7 2.9 2.1 12.8Diesel 6.3 8.2 9.2 11.8 10.9 14.0 13.8 11.0 9.8 9.7 57.9Heating Oil 0.0 0.0 0.0 0.0 0.0 0.0 0.0 0.0 0.0 0.0 0.0Aviation Jet 0.5 0.2 0.3 0.3 0.4 0.5 0.4 0.4 0.4 0.2 1.2LPG 0.2 0.4 0.5 0.4 0.3 0.0 0.0 0.0 0.0 0.0 0.0
109.1 122.1 119.9 127.2 152.8 192.0 194.7 195.4 203.0 179.2 100.0
Oil 109.1 122.1 119.9 127.2 152.8 192.0 194.7 195.4 203.0 179.2 100.0Gas 0.0 0.0 0.0 0.0 0.0 0.0 0.0 0.0 0.0 0.0 0.0Gasoline 0.0 0.0 0.0 0.0 0.0 0.0 0.0 0.0 0.0 0.0 0.0Diesel 0.0 0.0 0.0 0.0 0.0 0.0 0.0 0.0 0.0 0.0 0.0Heating Oil 0.1 0.1 0.5 0.4 0.4 0.3 3.5 1.1 3.7 6.3 3.5Aviation Jet 0.0 0.0 0.0 0.0 0.0 0.0 0.0 0.0 0.0 0.0 0.0LPG 0.0 0.0 0.0 0.0 0.0 0.0 0.2 0.2 0.2 0.2 0.1
112.2 128.0 137.1 141.8 131.7 139.3 140.4 154.2 165.6 149.4 -
387.5 387.8 386.3 396.5 359.3 330.0 341.0 376.8 387.5 397.5 -
74.2 74.8 70.2 57.4 46.1 42.1 47.6 53.8 52.9 54.3 -
143.5 141.4 138.8 139.1 128.0 124.8 141.2 157.3 159.6 158.7 -
*Heat is included
Final energy intensity (toe/million $15ppp)
Total energy intensity (toe/million $15ppp)
Natural gas final consumption, by sector
Refined products consumption
Imports
Exports
CO2 Emissions (Million tons CO 2 )
CO2 Intensity (tCO 2 /million $15ppp)
Oil final consumption, by sector
Iraq(Million toe)
Total primary energy demand, by source
Total final consumption, by source
Electricity generation, by source
Total final consumption, by sector
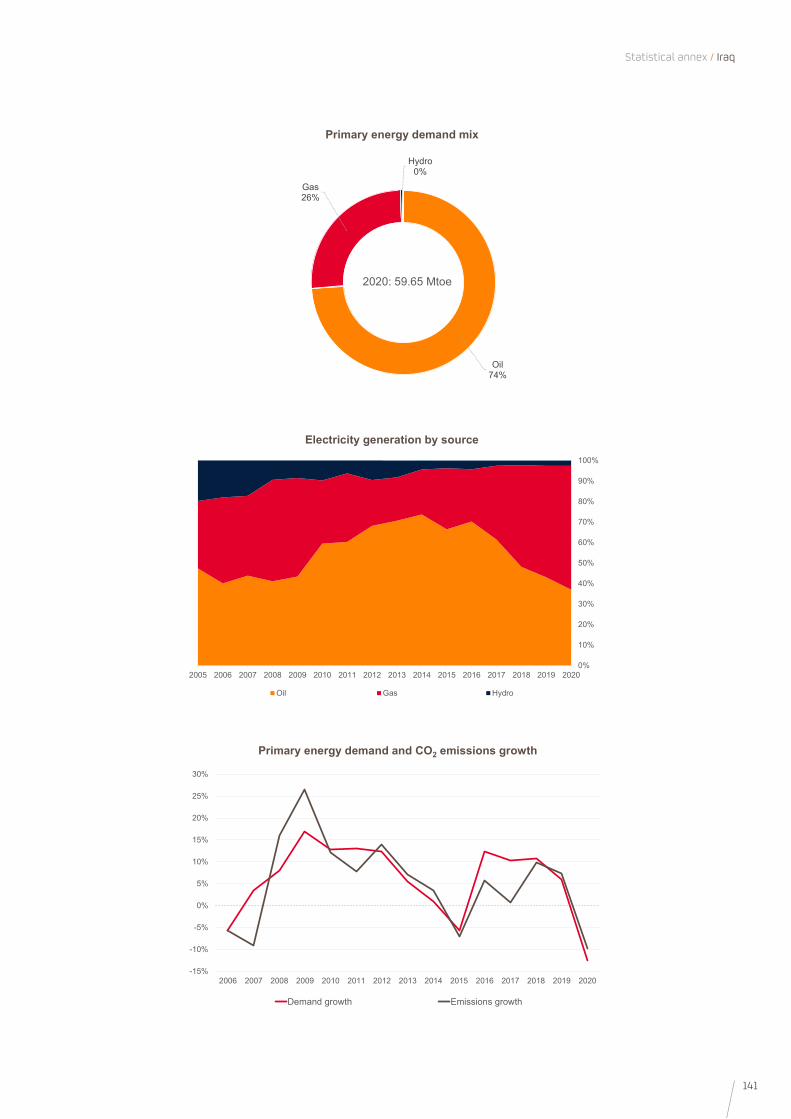
141
Statistical annex / Iraq
0%
10%
20%
30%
40%
50%
60%
70%
80%
90%
100%
2005 2006 2007 2008 2009 2010 2011 2012 2013 2014 2015 2016 2017 2018 2019 2020
Oil Gas Hydro
Electricity generation by source
-15%
-10%
-5%
0%
5%
10%
15%
20%
25%
30%
2006 2007 2008 2009 2010 2011 2012 2013 2014 2015 2016 2017 2018 2019 2020
Demand growth Emissions growth
Primary energy demand and CO2 emissions growth
Oil 74%
Gas26%
Hydro0%
2020: 59.65 Mtoe
Primary energy demand mix
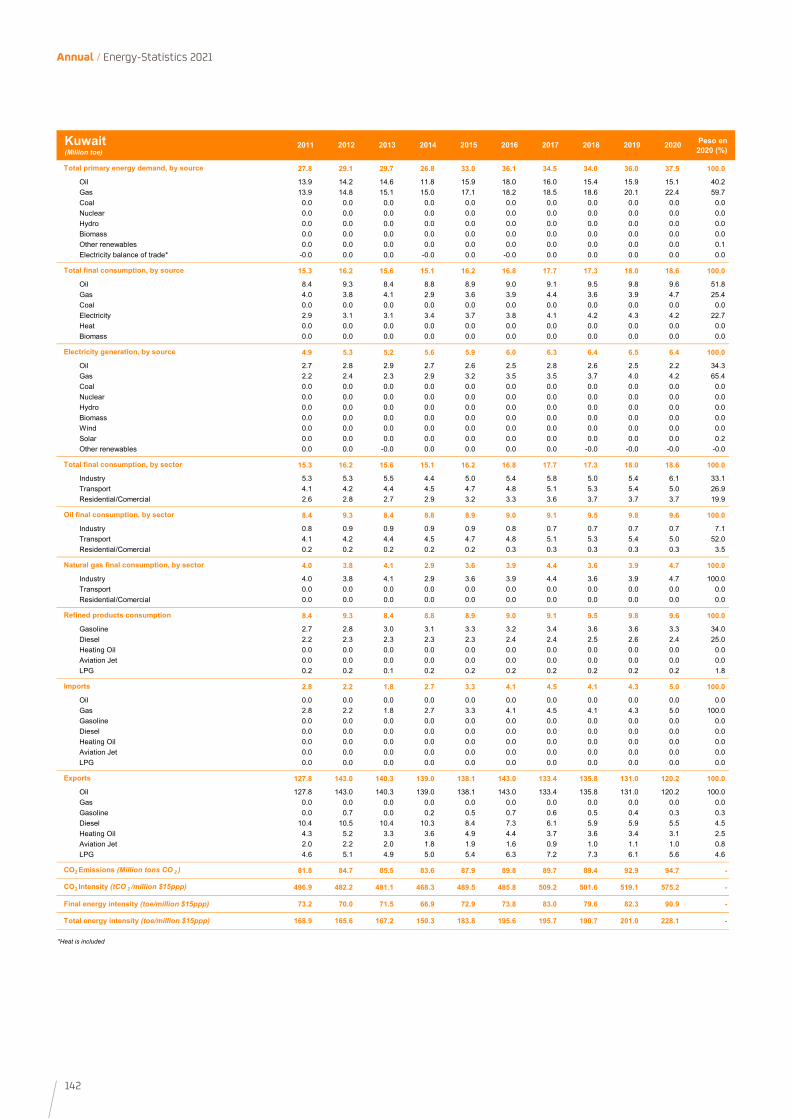
142
Annual / Energy-Statistics 2021
2011 2012 2013 2014 2015 2016 2017 2018 2019 2020 Peso en 2020 (%)
27.8 29.1 29.7 26.8 33.0 36.1 34.5 34.0 36.0 37.5 100.0
Oil 13.9 14.2 14.6 11.8 15.9 18.0 16.0 15.4 15.9 15.1 40.2Gas 13.9 14.8 15.1 15.0 17.1 18.2 18.5 18.6 20.1 22.4 59.7Coal 0.0 0.0 0.0 0.0 0.0 0.0 0.0 0.0 0.0 0.0 0.0Nuclear 0.0 0.0 0.0 0.0 0.0 0.0 0.0 0.0 0.0 0.0 0.0Hydro 0.0 0.0 0.0 0.0 0.0 0.0 0.0 0.0 0.0 0.0 0.0Biomass 0.0 0.0 0.0 0.0 0.0 0.0 0.0 0.0 0.0 0.0 0.0Other renewables 0.0 0.0 0.0 0.0 0.0 0.0 0.0 0.0 0.0 0.0 0.1Electricity balance of trade* -0.0 0.0 0.0 -0.0 0.0 -0.0 0.0 0.0 0.0 0.0 0.0
15.3 16.2 15.6 15.1 16.2 16.8 17.7 17.3 18.0 18.6 100.0
Oil 8.4 9.3 8.4 8.8 8.9 9.0 9.1 9.5 9.8 9.6 51.8Gas 4.0 3.8 4.1 2.9 3.6 3.9 4.4 3.6 3.9 4.7 25.4Coal 0.0 0.0 0.0 0.0 0.0 0.0 0.0 0.0 0.0 0.0 0.0Electricity 2.9 3.1 3.1 3.4 3.7 3.8 4.1 4.2 4.3 4.2 22.7Heat 0.0 0.0 0.0 0.0 0.0 0.0 0.0 0.0 0.0 0.0 0.0Biomass 0.0 0.0 0.0 0.0 0.0 0.0 0.0 0.0 0.0 0.0 0.0
4.9 5.3 5.2 5.6 5.9 6.0 6.3 6.4 6.5 6.4 100.0
Oil 2.7 2.8 2.9 2.7 2.6 2.5 2.8 2.6 2.5 2.2 34.3Gas 2.2 2.4 2.3 2.9 3.2 3.5 3.5 3.7 4.0 4.2 65.4Coal 0.0 0.0 0.0 0.0 0.0 0.0 0.0 0.0 0.0 0.0 0.0Nuclear 0.0 0.0 0.0 0.0 0.0 0.0 0.0 0.0 0.0 0.0 0.0Hydro 0.0 0.0 0.0 0.0 0.0 0.0 0.0 0.0 0.0 0.0 0.0Biomass 0.0 0.0 0.0 0.0 0.0 0.0 0.0 0.0 0.0 0.0 0.0Wind 0.0 0.0 0.0 0.0 0.0 0.0 0.0 0.0 0.0 0.0 0.0Solar 0.0 0.0 0.0 0.0 0.0 0.0 0.0 0.0 0.0 0.0 0.2Other renewables 0.0 0.0 -0.0 0.0 0.0 0.0 0.0 -0.0 -0.0 -0.0 -0.0
15.3 16.2 15.6 15.1 16.2 16.8 17.7 17.3 18.0 18.6 100.0
Industry 5.3 5.3 5.5 4.4 5.0 5.4 5.8 5.0 5.4 6.1 33.1Transport 4.1 4.2 4.4 4.5 4.7 4.8 5.1 5.3 5.4 5.0 26.9Residential/Comercial 2.6 2.8 2.7 2.9 3.2 3.3 3.6 3.7 3.7 3.7 19.9
8.4 9.3 8.4 8.8 8.9 9.0 9.1 9.5 9.8 9.6 100.0
Industry 0.8 0.9 0.9 0.9 0.9 0.8 0.7 0.7 0.7 0.7 7.1Transport 4.1 4.2 4.4 4.5 4.7 4.8 5.1 5.3 5.4 5.0 52.0Residential/Comercial 0.2 0.2 0.2 0.2 0.2 0.3 0.3 0.3 0.3 0.3 3.5
4.0 3.8 4.1 2.9 3.6 3.9 4.4 3.6 3.9 4.7 100.0
Industry 4.0 3.8 4.1 2.9 3.6 3.9 4.4 3.6 3.9 4.7 100.0Transport 0.0 0.0 0.0 0.0 0.0 0.0 0.0 0.0 0.0 0.0 0.0Residential/Comercial 0.0 0.0 0.0 0.0 0.0 0.0 0.0 0.0 0.0 0.0 0.0
8.4 9.3 8.4 8.8 8.9 9.0 9.1 9.5 9.8 9.6 100.0
Gasoline 2.7 2.8 3.0 3.1 3.3 3.2 3.4 3.6 3.6 3.3 34.0Diesel 2.2 2.3 2.3 2.3 2.3 2.4 2.4 2.5 2.6 2.4 25.0Heating Oil 0.0 0.0 0.0 0.0 0.0 0.0 0.0 0.0 0.0 0.0 0.0Aviation Jet 0.0 0.0 0.0 0.0 0.0 0.0 0.0 0.0 0.0 0.0 0.0LPG 0.2 0.2 0.1 0.2 0.2 0.2 0.2 0.2 0.2 0.2 1.8
2.8 2.2 1.8 2.7 3.3 4.1 4.5 4.1 4.3 5.0 100.0
Oil 0.0 0.0 0.0 0.0 0.0 0.0 0.0 0.0 0.0 0.0 0.0Gas 2.8 2.2 1.8 2.7 3.3 4.1 4.5 4.1 4.3 5.0 100.0Gasoline 0.0 0.0 0.0 0.0 0.0 0.0 0.0 0.0 0.0 0.0 0.0Diesel 0.0 0.0 0.0 0.0 0.0 0.0 0.0 0.0 0.0 0.0 0.0Heating Oil 0.0 0.0 0.0 0.0 0.0 0.0 0.0 0.0 0.0 0.0 0.0Aviation Jet 0.0 0.0 0.0 0.0 0.0 0.0 0.0 0.0 0.0 0.0 0.0LPG 0.0 0.0 0.0 0.0 0.0 0.0 0.0 0.0 0.0 0.0 0.0
127.8 143.0 140.3 139.0 138.1 143.0 133.4 135.8 131.0 120.2 100.0
Oil 127.8 143.0 140.3 139.0 138.1 143.0 133.4 135.8 131.0 120.2 100.0Gas 0.0 0.0 0.0 0.0 0.0 0.0 0.0 0.0 0.0 0.0 0.0Gasoline 0.0 0.7 0.0 0.2 0.5 0.7 0.6 0.5 0.4 0.3 0.3Diesel 10.4 10.5 10.4 10.3 8.4 7.3 6.1 5.9 5.9 5.5 4.5Heating Oil 4.3 5.2 3.3 3.6 4.9 4.4 3.7 3.6 3.4 3.1 2.5Aviation Jet 2.0 2.2 2.0 1.8 1.9 1.6 0.9 1.0 1.1 1.0 0.8LPG 4.6 5.1 4.9 5.0 5.4 6.3 7.2 7.3 6.1 5.6 4.6
81.8 84.7 85.5 83.6 87.9 89.8 89.7 89.4 92.9 94.7 -
496.9 482.2 481.1 468.3 489.5 485.8 509.2 501.6 519.1 575.2 -
73.2 70.0 71.5 66.9 72.9 73.8 83.0 79.6 82.3 90.9 -
168.9 165.6 167.2 150.3 183.8 195.6 195.7 190.7 201.0 228.1 -
*Heat is included
Final energy intensity (toe/million $15ppp)
Total energy intensity (toe/million $15ppp)
Natural gas final consumption, by sector
Refined products consumption
Imports
Exports
CO2 Emissions (Million tons CO 2 )
CO2 Intensity (tCO 2 /million $15ppp)
Oil final consumption, by sector
Kuwait(Million toe)
Total primary energy demand, by source
Total final consumption, by source
Electricity generation, by source
Total final consumption, by sector
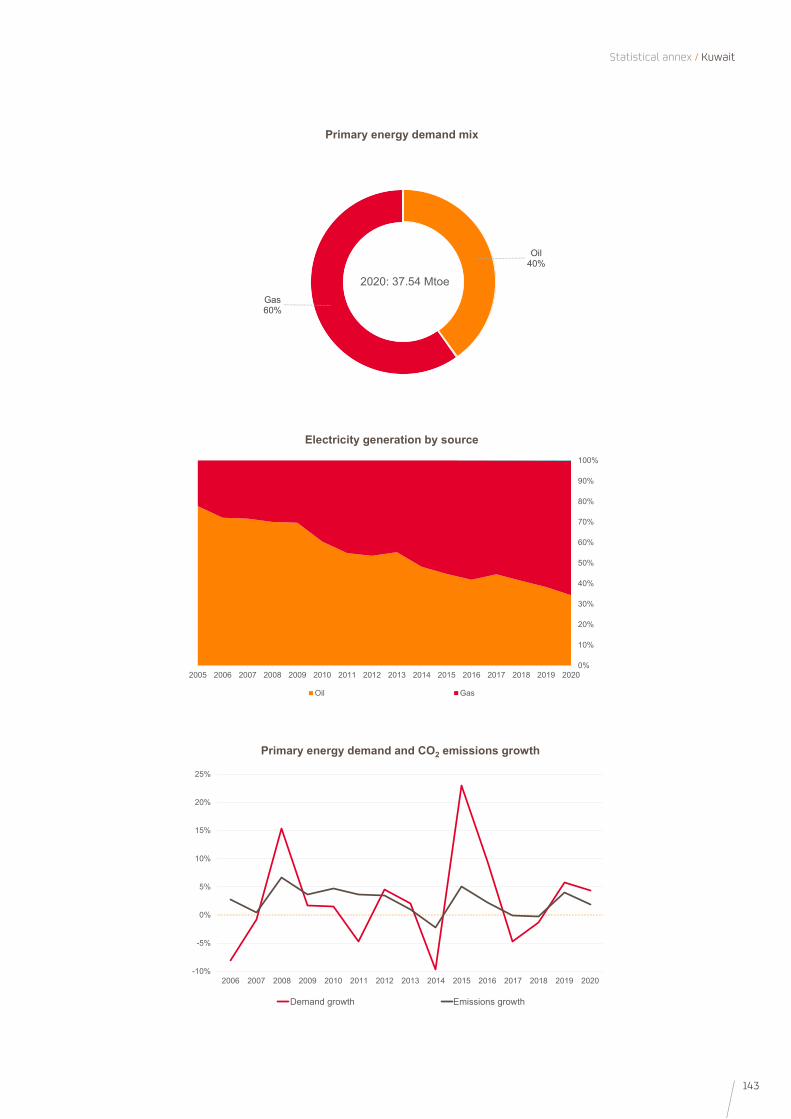
143
Statistical annex / Kuwait
0%
10%
20%
30%
40%
50%
60%
70%
80%
90%
100%
2005 2006 2007 2008 2009 2010 2011 2012 2013 2014 2015 2016 2017 2018 2019 2020
Oil Gas
Electricity generation by source
-10%
-5%
0%
5%
10%
15%
20%
25%
2006 2007 2008 2009 2010 2011 2012 2013 2014 2015 2016 2017 2018 2019 2020
Demand growth Emissions growth
Primary energy demand and CO2 emissions growth
Oil 40%
Gas60%
2020: 37.54 Mtoe
Primary energy demand mix
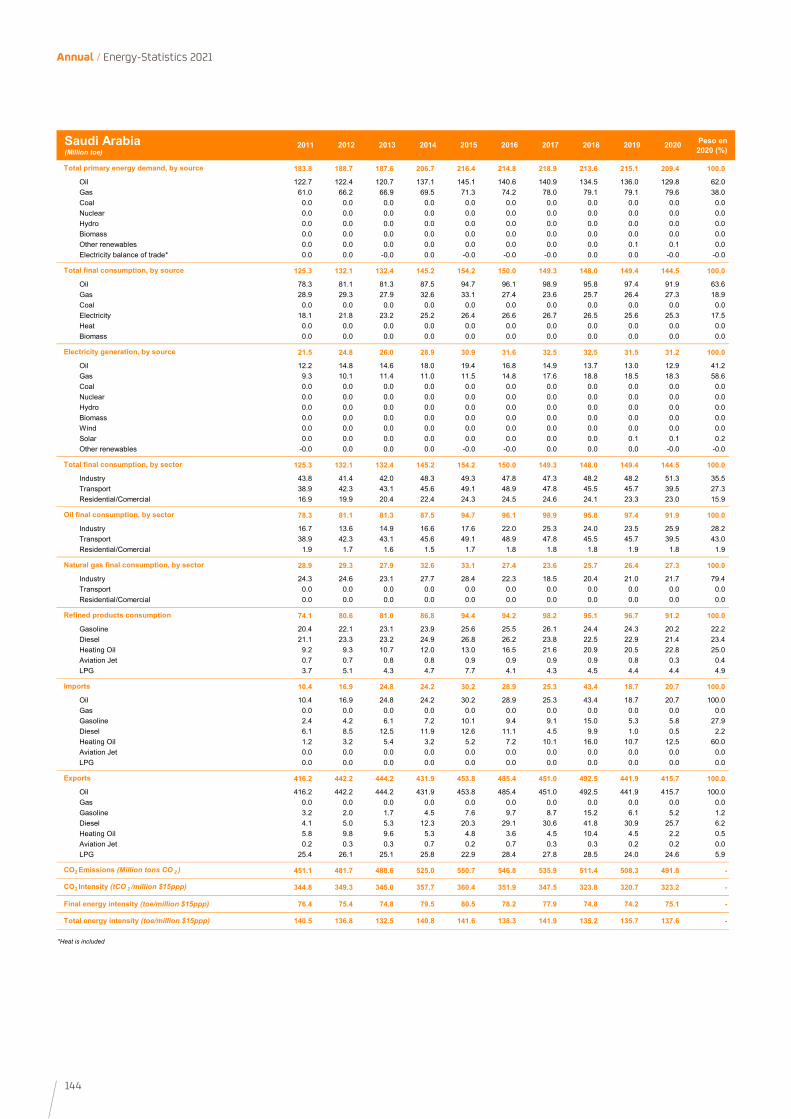
144
Annual / Energy-Statistics 2021
2011 2012 2013 2014 2015 2016 2017 2018 2019 2020 Peso en 2020 (%)
183.8 188.7 187.6 206.7 216.4 214.8 218.9 213.6 215.1 209.4 100.0
Oil 122.7 122.4 120.7 137.1 145.1 140.6 140.9 134.5 136.0 129.8 62.0Gas 61.0 66.2 66.9 69.5 71.3 74.2 78.0 79.1 79.1 79.6 38.0Coal 0.0 0.0 0.0 0.0 0.0 0.0 0.0 0.0 0.0 0.0 0.0Nuclear 0.0 0.0 0.0 0.0 0.0 0.0 0.0 0.0 0.0 0.0 0.0Hydro 0.0 0.0 0.0 0.0 0.0 0.0 0.0 0.0 0.0 0.0 0.0Biomass 0.0 0.0 0.0 0.0 0.0 0.0 0.0 0.0 0.0 0.0 0.0Other renewables 0.0 0.0 0.0 0.0 0.0 0.0 0.0 0.0 0.1 0.1 0.0Electricity balance of trade* 0.0 0.0 -0.0 0.0 -0.0 -0.0 -0.0 0.0 0.0 -0.0 -0.0
125.3 132.1 132.4 145.2 154.2 150.0 149.3 148.0 149.4 144.5 100.0
Oil 78.3 81.1 81.3 87.5 94.7 96.1 98.9 95.8 97.4 91.9 63.6Gas 28.9 29.3 27.9 32.6 33.1 27.4 23.6 25.7 26.4 27.3 18.9Coal 0.0 0.0 0.0 0.0 0.0 0.0 0.0 0.0 0.0 0.0 0.0Electricity 18.1 21.8 23.2 25.2 26.4 26.6 26.7 26.5 25.6 25.3 17.5Heat 0.0 0.0 0.0 0.0 0.0 0.0 0.0 0.0 0.0 0.0 0.0Biomass 0.0 0.0 0.0 0.0 0.0 0.0 0.0 0.0 0.0 0.0 0.0
21.5 24.8 26.0 28.9 30.9 31.6 32.5 32.5 31.5 31.2 100.0
Oil 12.2 14.8 14.6 18.0 19.4 16.8 14.9 13.7 13.0 12.9 41.2Gas 9.3 10.1 11.4 11.0 11.5 14.8 17.6 18.8 18.5 18.3 58.6Coal 0.0 0.0 0.0 0.0 0.0 0.0 0.0 0.0 0.0 0.0 0.0Nuclear 0.0 0.0 0.0 0.0 0.0 0.0 0.0 0.0 0.0 0.0 0.0Hydro 0.0 0.0 0.0 0.0 0.0 0.0 0.0 0.0 0.0 0.0 0.0Biomass 0.0 0.0 0.0 0.0 0.0 0.0 0.0 0.0 0.0 0.0 0.0Wind 0.0 0.0 0.0 0.0 0.0 0.0 0.0 0.0 0.0 0.0 0.0Solar 0.0 0.0 0.0 0.0 0.0 0.0 0.0 0.0 0.1 0.1 0.2Other renewables -0.0 0.0 0.0 0.0 -0.0 -0.0 0.0 0.0 0.0 -0.0 -0.0
125.3 132.1 132.4 145.2 154.2 150.0 149.3 148.0 149.4 144.5 100.0
Industry 43.8 41.4 42.0 48.3 49.3 47.8 47.3 48.2 48.2 51.3 35.5Transport 38.9 42.3 43.1 45.6 49.1 48.9 47.8 45.5 45.7 39.5 27.3Residential/Comercial 16.9 19.9 20.4 22.4 24.3 24.5 24.6 24.1 23.3 23.0 15.9
78.3 81.1 81.3 87.5 94.7 96.1 98.9 95.8 97.4 91.9 100.0
Industry 16.7 13.6 14.9 16.6 17.6 22.0 25.3 24.0 23.5 25.9 28.2Transport 38.9 42.3 43.1 45.6 49.1 48.9 47.8 45.5 45.7 39.5 43.0Residential/Comercial 1.9 1.7 1.6 1.5 1.7 1.8 1.8 1.8 1.9 1.8 1.9
28.9 29.3 27.9 32.6 33.1 27.4 23.6 25.7 26.4 27.3 100.0
Industry 24.3 24.6 23.1 27.7 28.4 22.3 18.5 20.4 21.0 21.7 79.4Transport 0.0 0.0 0.0 0.0 0.0 0.0 0.0 0.0 0.0 0.0 0.0Residential/Comercial 0.0 0.0 0.0 0.0 0.0 0.0 0.0 0.0 0.0 0.0 0.0
74.1 80.6 81.0 86.8 94.4 94.2 98.2 95.1 96.7 91.2 100.0
Gasoline 20.4 22.1 23.1 23.9 25.6 25.5 26.1 24.4 24.3 20.2 22.2Diesel 21.1 23.3 23.2 24.9 26.8 26.2 23.8 22.5 22.9 21.4 23.4Heating Oil 9.2 9.3 10.7 12.0 13.0 16.5 21.6 20.9 20.5 22.8 25.0Aviation Jet 0.7 0.7 0.8 0.8 0.9 0.9 0.9 0.9 0.8 0.3 0.4LPG 3.7 5.1 4.3 4.7 7.7 4.1 4.3 4.5 4.4 4.4 4.9
10.4 16.9 24.8 24.2 30.2 28.9 25.3 43.4 18.7 20.7 100.0
Oil 10.4 16.9 24.8 24.2 30.2 28.9 25.3 43.4 18.7 20.7 100.0Gas 0.0 0.0 0.0 0.0 0.0 0.0 0.0 0.0 0.0 0.0 0.0Gasoline 2.4 4.2 6.1 7.2 10.1 9.4 9.1 15.0 5.3 5.8 27.9Diesel 6.1 8.5 12.5 11.9 12.6 11.1 4.5 9.9 1.0 0.5 2.2Heating Oil 1.2 3.2 5.4 3.2 5.2 7.2 10.1 16.0 10.7 12.5 60.0Aviation Jet 0.0 0.0 0.0 0.0 0.0 0.0 0.0 0.0 0.0 0.0 0.0LPG 0.0 0.0 0.0 0.0 0.0 0.0 0.0 0.0 0.0 0.0 0.0
416.2 442.2 444.2 431.9 453.8 485.4 451.0 492.5 441.9 415.7 100.0
Oil 416.2 442.2 444.2 431.9 453.8 485.4 451.0 492.5 441.9 415.7 100.0Gas 0.0 0.0 0.0 0.0 0.0 0.0 0.0 0.0 0.0 0.0 0.0Gasoline 3.2 2.0 1.7 4.5 7.6 9.7 8.7 15.2 6.1 5.2 1.2Diesel 4.1 5.0 5.3 12.3 20.3 29.1 30.6 41.8 30.9 25.7 6.2Heating Oil 5.8 9.8 9.6 5.3 4.8 3.6 4.5 10.4 4.5 2.2 0.5Aviation Jet 0.2 0.3 0.3 0.7 0.2 0.7 0.3 0.3 0.2 0.2 0.0LPG 25.4 26.1 25.1 25.8 22.9 28.4 27.8 28.5 24.0 24.6 5.9
451.1 481.7 488.6 525.0 550.7 546.8 535.9 511.4 508.3 491.8 -
344.8 349.3 345.0 357.7 360.4 351.9 347.5 323.8 320.7 323.2 -
76.4 75.4 74.8 79.5 80.5 78.2 77.9 74.8 74.2 75.1 -
140.5 136.8 132.5 140.8 141.6 138.3 141.9 135.2 135.7 137.6 -
*Heat is included
Final energy intensity (toe/million $15ppp)
Total energy intensity (toe/million $15ppp)
Natural gas final consumption, by sector
Refined products consumption
Imports
Exports
CO2 Emissions (Million tons CO 2 )
CO2 Intensity (tCO 2 /million $15ppp)
Oil final consumption, by sector
Saudi Arabia(Million toe)
Total primary energy demand, by source
Total final consumption, by source
Electricity generation, by source
Total final consumption, by sector

145
Statistical annex / Saudi Arabia
0%
10%
20%
30%
40%
50%
60%
70%
80%
90%
100%
2005 2006 2007 2008 2009 2010 2011 2012 2013 2014 2015 2016 2017 2018 2019 2020
Oil Gas Solar
Electricity generation by source
-6%
-4%
-2%
0%
2%
4%
6%
8%
10%
12%
2006 2007 2008 2009 2010 2011 2012 2013 2014 2015 2016 2017 2018 2019 2020
Demand growth Emissions growth
Primary energy demand and CO2 emissions growth
Oil 62%
Gas38%
2020: 209.38 Mtoe
Primary energy demand mix
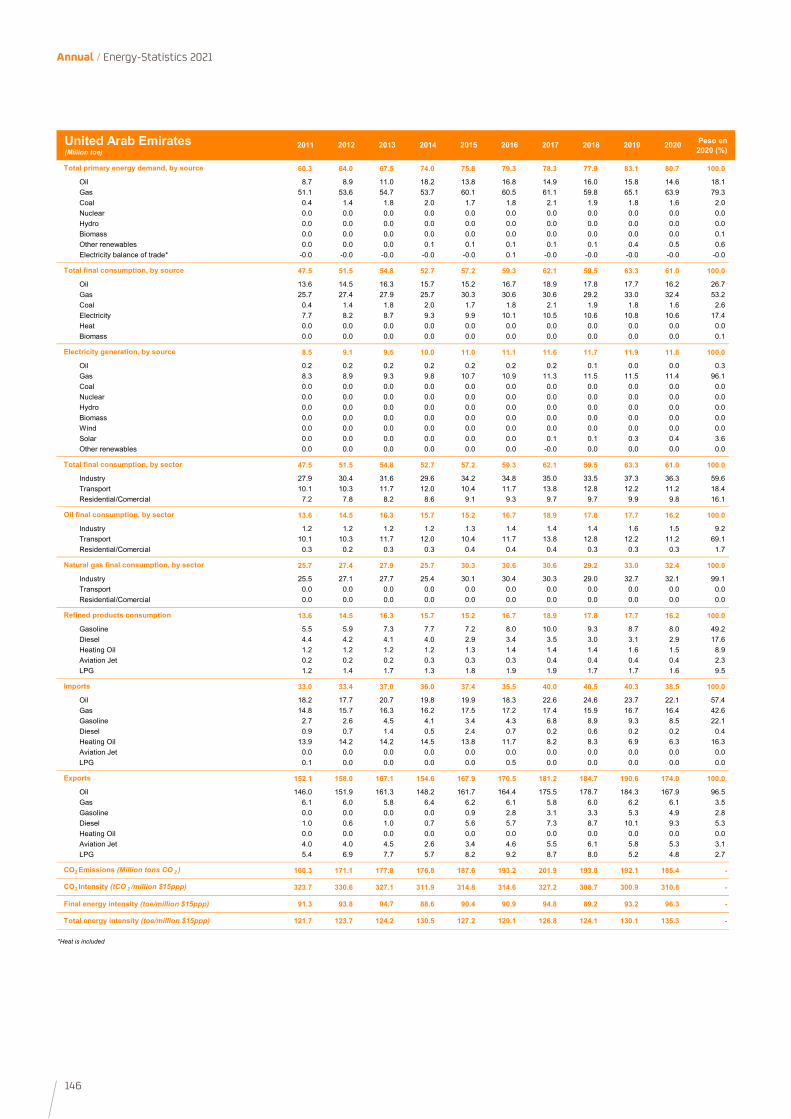
146
Annual / Energy-Statistics 2021
2011 2012 2013 2014 2015 2016 2017 2018 2019 2020 Peso en 2020 (%)
60.3 64.0 67.5 74.0 75.8 79.3 78.3 77.9 83.1 80.7 100.0
Oil 8.7 8.9 11.0 18.2 13.8 16.8 14.9 16.0 15.8 14.6 18.1Gas 51.1 53.6 54.7 53.7 60.1 60.5 61.1 59.8 65.1 63.9 79.3Coal 0.4 1.4 1.8 2.0 1.7 1.8 2.1 1.9 1.8 1.6 2.0Nuclear 0.0 0.0 0.0 0.0 0.0 0.0 0.0 0.0 0.0 0.0 0.0Hydro 0.0 0.0 0.0 0.0 0.0 0.0 0.0 0.0 0.0 0.0 0.0Biomass 0.0 0.0 0.0 0.0 0.0 0.0 0.0 0.0 0.0 0.0 0.1Other renewables 0.0 0.0 0.0 0.1 0.1 0.1 0.1 0.1 0.4 0.5 0.6Electricity balance of trade* -0.0 -0.0 -0.0 -0.0 -0.0 0.1 -0.0 -0.0 -0.0 -0.0 -0.0
47.5 51.5 54.8 52.7 57.2 59.3 62.1 59.5 63.3 61.0 100.0
Oil 13.6 14.5 16.3 15.7 15.2 16.7 18.9 17.8 17.7 16.2 26.7Gas 25.7 27.4 27.9 25.7 30.3 30.6 30.6 29.2 33.0 32.4 53.2Coal 0.4 1.4 1.8 2.0 1.7 1.8 2.1 1.9 1.8 1.6 2.6Electricity 7.7 8.2 8.7 9.3 9.9 10.1 10.5 10.6 10.8 10.6 17.4Heat 0.0 0.0 0.0 0.0 0.0 0.0 0.0 0.0 0.0 0.0 0.0Biomass 0.0 0.0 0.0 0.0 0.0 0.0 0.0 0.0 0.0 0.0 0.1
8.5 9.1 9.5 10.0 11.0 11.1 11.6 11.7 11.9 11.8 100.0
Oil 0.2 0.2 0.2 0.2 0.2 0.2 0.2 0.1 0.0 0.0 0.3Gas 8.3 8.9 9.3 9.8 10.7 10.9 11.3 11.5 11.5 11.4 96.1Coal 0.0 0.0 0.0 0.0 0.0 0.0 0.0 0.0 0.0 0.0 0.0Nuclear 0.0 0.0 0.0 0.0 0.0 0.0 0.0 0.0 0.0 0.0 0.0Hydro 0.0 0.0 0.0 0.0 0.0 0.0 0.0 0.0 0.0 0.0 0.0Biomass 0.0 0.0 0.0 0.0 0.0 0.0 0.0 0.0 0.0 0.0 0.0Wind 0.0 0.0 0.0 0.0 0.0 0.0 0.0 0.0 0.0 0.0 0.0Solar 0.0 0.0 0.0 0.0 0.0 0.0 0.1 0.1 0.3 0.4 3.6Other renewables 0.0 0.0 0.0 0.0 0.0 0.0 -0.0 0.0 0.0 0.0 0.0
47.5 51.5 54.8 52.7 57.2 59.3 62.1 59.5 63.3 61.0 100.0
Industry 27.9 30.4 31.6 29.6 34.2 34.8 35.0 33.5 37.3 36.3 59.6Transport 10.1 10.3 11.7 12.0 10.4 11.7 13.8 12.8 12.2 11.2 18.4Residential/Comercial 7.2 7.8 8.2 8.6 9.1 9.3 9.7 9.7 9.9 9.8 16.1
13.6 14.5 16.3 15.7 15.2 16.7 18.9 17.8 17.7 16.2 100.0
Industry 1.2 1.2 1.2 1.2 1.3 1.4 1.4 1.4 1.6 1.5 9.2Transport 10.1 10.3 11.7 12.0 10.4 11.7 13.8 12.8 12.2 11.2 69.1Residential/Comercial 0.3 0.2 0.3 0.3 0.4 0.4 0.4 0.3 0.3 0.3 1.7
25.7 27.4 27.9 25.7 30.3 30.6 30.6 29.2 33.0 32.4 100.0
Industry 25.5 27.1 27.7 25.4 30.1 30.4 30.3 29.0 32.7 32.1 99.1Transport 0.0 0.0 0.0 0.0 0.0 0.0 0.0 0.0 0.0 0.0 0.0Residential/Comercial 0.0 0.0 0.0 0.0 0.0 0.0 0.0 0.0 0.0 0.0 0.0
13.6 14.5 16.3 15.7 15.2 16.7 18.9 17.8 17.7 16.2 100.0
Gasoline 5.5 5.9 7.3 7.7 7.2 8.0 10.0 9.3 8.7 8.0 49.2Diesel 4.4 4.2 4.1 4.0 2.9 3.4 3.5 3.0 3.1 2.9 17.6Heating Oil 1.2 1.2 1.2 1.2 1.3 1.4 1.4 1.4 1.6 1.5 8.9Aviation Jet 0.2 0.2 0.2 0.3 0.3 0.3 0.4 0.4 0.4 0.4 2.3LPG 1.2 1.4 1.7 1.3 1.8 1.9 1.9 1.7 1.7 1.6 9.5
33.0 33.4 37.0 36.0 37.4 35.5 40.0 40.5 40.3 38.5 100.0
Oil 18.2 17.7 20.7 19.8 19.9 18.3 22.6 24.6 23.7 22.1 57.4Gas 14.8 15.7 16.3 16.2 17.5 17.2 17.4 15.9 16.7 16.4 42.6Gasoline 2.7 2.6 4.5 4.1 3.4 4.3 6.8 8.9 9.3 8.5 22.1Diesel 0.9 0.7 1.4 0.5 2.4 0.7 0.2 0.6 0.2 0.2 0.4Heating Oil 13.9 14.2 14.2 14.5 13.8 11.7 8.2 8.3 6.9 6.3 16.3Aviation Jet 0.0 0.0 0.0 0.0 0.0 0.0 0.0 0.0 0.0 0.0 0.0LPG 0.1 0.0 0.0 0.0 0.0 0.5 0.0 0.0 0.0 0.0 0.0
152.1 158.0 167.1 154.6 167.9 170.5 181.2 184.7 190.6 174.0 100.0
Oil 146.0 151.9 161.3 148.2 161.7 164.4 175.5 178.7 184.3 167.9 96.5Gas 6.1 6.0 5.8 6.4 6.2 6.1 5.8 6.0 6.2 6.1 3.5Gasoline 0.0 0.0 0.0 0.0 0.9 2.8 3.1 3.3 5.3 4.9 2.8Diesel 1.0 0.6 1.0 0.7 5.6 5.7 7.3 8.7 10.1 9.3 5.3Heating Oil 0.0 0.0 0.0 0.0 0.0 0.0 0.0 0.0 0.0 0.0 0.0Aviation Jet 4.0 4.0 4.5 2.6 3.4 4.6 5.5 6.1 5.8 5.3 3.1LPG 5.4 6.9 7.7 5.7 8.2 9.2 8.7 8.0 5.2 4.8 2.7
160.3 171.1 177.8 176.8 187.6 193.2 201.9 193.8 192.1 185.4 -
323.7 330.6 327.1 311.9 314.8 314.6 327.2 308.7 300.9 310.8 -
91.3 93.8 94.7 88.6 90.4 90.9 94.8 89.2 93.2 96.3 -
121.7 123.7 124.2 130.5 127.2 129.1 126.8 124.1 130.1 135.3 -
*Heat is included
Final energy intensity (toe/million $15ppp)
Total energy intensity (toe/million $15ppp)
Natural gas final consumption, by sector
Refined products consumption
Imports
Exports
CO2 Emissions (Million tons CO 2 )
CO2 Intensity (tCO 2 /million $15ppp)
Oil final consumption, by sector
United Arab Emirates(Million toe)
Total primary energy demand, by source
Total final consumption, by source
Electricity generation, by source
Total final consumption, by sector
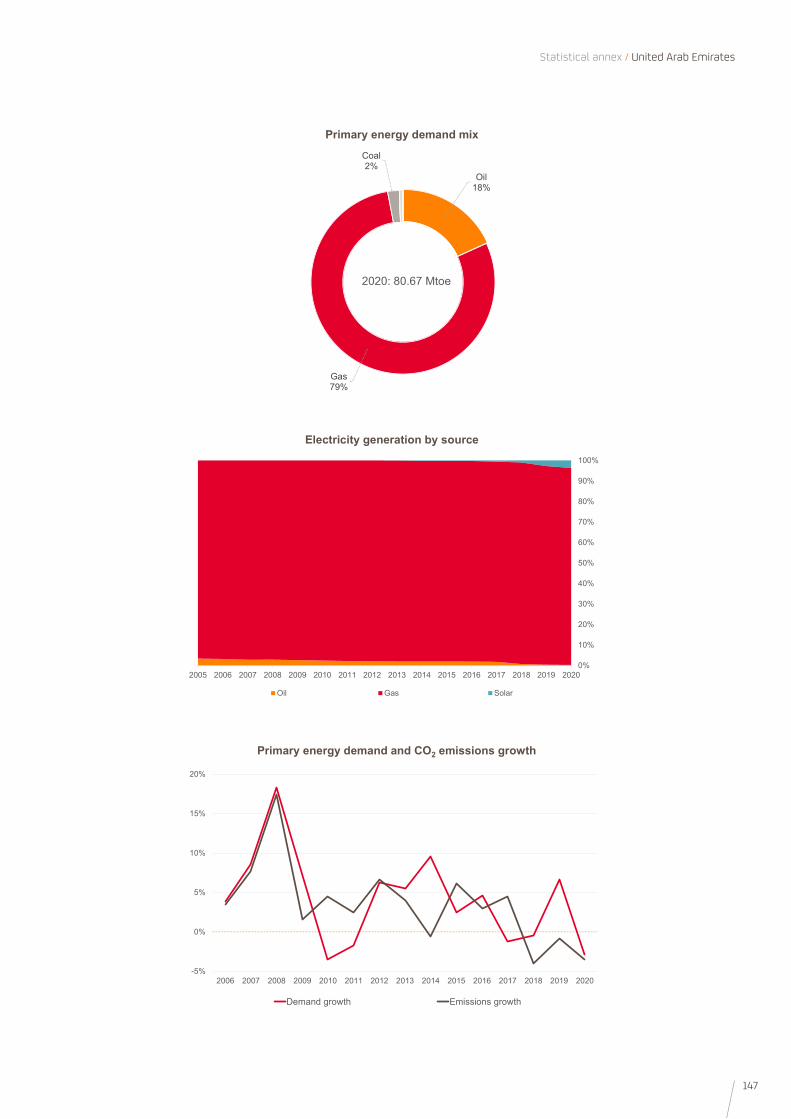
147
Statistical annex / United Arab Emirates
0%
10%
20%
30%
40%
50%
60%
70%
80%
90%
100%
2005 2006 2007 2008 2009 2010 2011 2012 2013 2014 2015 2016 2017 2018 2019 2020
Oil Gas Solar
Electricity generation by source
-5%
0%
5%
10%
15%
20%
2006 2007 2008 2009 2010 2011 2012 2013 2014 2015 2016 2017 2018 2019 2020
Demand growth Emissions growth
Primary energy demand and CO2 emissions growth
Oil 18%
Gas79%
Coal2%
2020: 80.67 Mtoe
Primary energy demand mix

148
Annual / Energy-Statistics 2021
2011 2012 2013 2014 2015 2016 2017 2018 2019 2020 Peso en 2020 (%)
2,645.7 2,613.5 2,657.2 2,687.0 2,660.2 2,640.7 2,636.2 2,715.0 2,690.6 2,477.7 100.0
Oil 978.3 976.1 972.1 973.1 988.9 976.0 982.5 993.5 989.2 868.9 35.1Gas 708.1 737.7 756.1 776.6 799.0 817.3 810.2 880.1 907.0 884.4 35.7Coal 514.5 456.7 464.4 464.8 404.2 372.8 360.8 347.8 300.3 236.7 9.6Nuclear 241.1 235.8 244.3 246.9 245.9 248.1 247.8 249.1 249.2 244.4 9.9Hydro 63.1 59.4 59.4 58.7 57.1 59.0 62.7 61.4 59.9 60.7 2.4Biomass 112.9 117.6 126.0 128.8 124.6 122.9 124.3 130.5 128.2 119.5 4.8Other renewables 12.0 14.4 18.0 20.7 23.0 28.0 32.2 35.5 39.9 45.8 1.8Electricity balance of trade* 15.8 15.8 16.9 17.3 17.4 16.6 15.7 17.1 16.9 17.4 0.7
1,777.9 1,748.0 1,796.0 1,818.8 1,813.0 1,817.6 1,827.9 1,906.0 1,901.3 1,734.9 100.0
Oil 886.6 875.2 883.8 887.8 905.9 912.2 912.9 933.9 930.1 815.0 47.0Gas 364.6 351.6 379.7 395.2 377.9 376.9 388.7 423.4 428.8 403.7 23.3Coal 39.8 35.5 35.5 34.0 31.7 27.1 28.2 28.2 26.6 22.5 1.3Electricity 387.4 383.6 387.4 391.0 390.5 394.0 390.8 405.2 401.0 386.0 22.2Heat 9.7 9.7 9.1 9.2 8.9 9.9 9.0 10.8 10.9 11.2 0.6Biomass 89.7 92.4 100.5 101.6 98.1 97.5 98.3 104.6 103.9 96.5 5.6
454.6 449.8 452.5 455.9 454.6 456.4 453.3 468.3 463.1 450.0 100.0
Oil 8.2 8.3 8.0 6.9 6.7 6.6 6.6 7.2 6.2 5.9 1.3Gas 109.1 128.2 118.8 119.8 139.6 143.8 136.0 153.5 165.3 169.9 37.8Coal 170.7 149.8 155.6 155.9 134.7 124.8 121.5 116.3 98.6 76.3 17.0Nuclear 79.6 77.8 80.6 81.5 81.2 81.9 81.8 82.2 82.2 80.7 17.9Hydro 65.1 61.1 61.1 60.5 58.8 60.9 64.7 63.3 61.6 62.4 13.9Biomass 7.3 7.5 7.7 7.9 7.8 7.8 7.9 7.8 7.4 7.2 1.6Wind 11.4 13.5 16.5 18.3 19.7 23.3 25.7 27.7 30.1 34.1 7.6Solar 0.6 1.0 1.5 2.4 3.3 4.7 6.5 7.8 9.2 11.0 2.5Other renewables 2.7 2.7 2.7 2.7 2.6 2.6 2.6 2.5 2.5 2.5 0.6
1,777.9 1,748.0 1,796.0 1,818.8 1,813.0 1,817.6 1,827.9 1,906.0 1,901.3 1,734.9 100.0
Industry 351.7 354.2 354.0 352.4 351.9 352.7 352.3 368.4 368.7 346.5 20.0Transport 678.7 672.5 691.2 690.9 711.6 720.7 726.1 739.4 735.7 631.6 36.4Residential/Comercial 559.4 526.6 563.8 579.0 558.8 551.0 549.8 593.1 587.9 556.1 32.1
886.6 875.2 883.8 887.8 905.9 912.2 912.9 933.9 930.1 815.0 100.0
Industry 30.6 30.4 30.2 27.4 30.2 31.8 29.8 31.7 31.6 26.9 3.3Transport 648.9 637.2 652.6 651.8 671.9 678.1 682.0 696.0 692.3 592.6 72.7Residential/Comercial 41.5 36.1 37.4 35.5 37.5 36.7 34.5 34.8 33.3 30.3 3.7
364.6 351.6 379.7 395.2 377.9 376.9 388.7 423.4 428.8 403.7 100.0
Industry 137.7 144.2 144.1 148.2 148.2 152.3 153.2 163.2 166.1 161.3 40.0Transport 0.7 0.8 0.7 0.9 1.0 1.1 1.3 1.3 1.4 1.4 0.3Residential/Comercial 207.8 186.8 215.0 226.0 207.4 199.0 204.4 228.7 229.2 209.3 51.9
884.6 873.1 881.4 885.3 901.6 909.2 908.5 928.2 924.5 810.1 100.0
Gasoline 433.1 429.4 434.8 436.2 448.3 456.2 452.7 457.2 454.7 389.9 48.1Diesel 227.5 223.3 223.2 230.5 225.6 221.7 225.1 233.1 228.5 208.0 25.7Heating Oil 8.2 6.8 3.4 2.5 4.9 4.0 3.8 3.3 3.4 2.7 0.3Aviation Jet 52.8 53.1 54.6 55.7 58.1 60.6 64.2 65.6 67.1 42.4 5.2LPG 45.7 46.8 52.1 48.4 49.8 48.5 46.2 49.7 51.0 50.0 6.2
807.1 759.1 697.3 663.3 691.3 742.4 751.7 747.6 698.2 606.3 100.0
Oil 686.0 641.5 586.3 559.1 581.7 620.3 624.6 623.0 565.2 491.3 81.0Gas 121.1 117.7 111.0 104.2 109.6 122.1 127.1 124.5 132.9 115.0 19.0Gasoline 56.7 53.1 50.3 48.8 55.0 60.7 58.3 63.5 63.7 61.4 10.1Diesel 15.3 14.4 15.5 18.8 20.5 19.9 22.8 27.6 24.4 20.7 3.4Heating Oil 21.1 19.3 16.4 12.9 13.2 13.8 14.3 15.4 11.3 11.1 1.8Aviation Jet 6.5 5.8 6.9 8.1 11.0 12.1 12.9 12.4 14.9 10.2 1.7LPG 7.0 7.2 7.3 7.2 8.3 10.4 12.1 13.3 12.7 10.7 1.8
471.6 486.6 505.7 544.0 580.4 627.2 709.2 788.5 859.4 866.8 100.0
Oil 360.0 376.0 400.5 443.5 474.1 505.8 564.2 636.8 687.8 684.1 78.9Gas 111.5 110.6 105.2 100.5 106.4 121.4 145.0 151.7 171.7 182.7 21.1Gasoline 29.6 29.7 29.8 31.8 35.9 43.1 46.8 50.5 42.1 37.0 4.3Diesel 50.0 58.3 64.8 61.5 65.8 66.3 76.8 70.9 75.4 69.9 8.1Heating Oil 31.4 28.3 29.0 30.6 27.3 25.4 25.3 26.5 18.5 15.1 1.7Aviation Jet 5.6 7.0 8.3 8.5 8.8 9.2 10.4 12.3 12.1 5.1 0.6LPG 0.5 0.6 0.7 17.6 24.8 31.4 35.9 39.8 45.4 52.0 6.0
6,259.8 6,074.2 6,177.3 6,205.4 6,065.5 5,967.3 5,919.0 6,096.4 5,953.6 5,290.8 -
326.7 311.9 295.7 295.3 289.3 275.2 266.3 258.3 258.9 248.2 -
91.7 88.6 85.1 85.9 84.8 82.3 81.1 79.8 80.9 79.3 -
134.9 131.8 127.2 127.0 125.3 120.7 117.9 115.1 115.3 112.2 -
*Heat is included
Exports
Total energy intensity (toe/million $15ppp)
Final energy intensity (toe/million $15ppp)
CO2 Intensity (tCO 2 /million $15ppp)
CO2 Emissions (Million tons CO 2 )
North America(Million toe)
Total final consumption, by source
Total primary energy demand, by source
Imports
Refined products consumption
Natural gas final consumption, by sector
Oil final consumption, by sector
Total final consumption, by sector
Electricity generation, by source
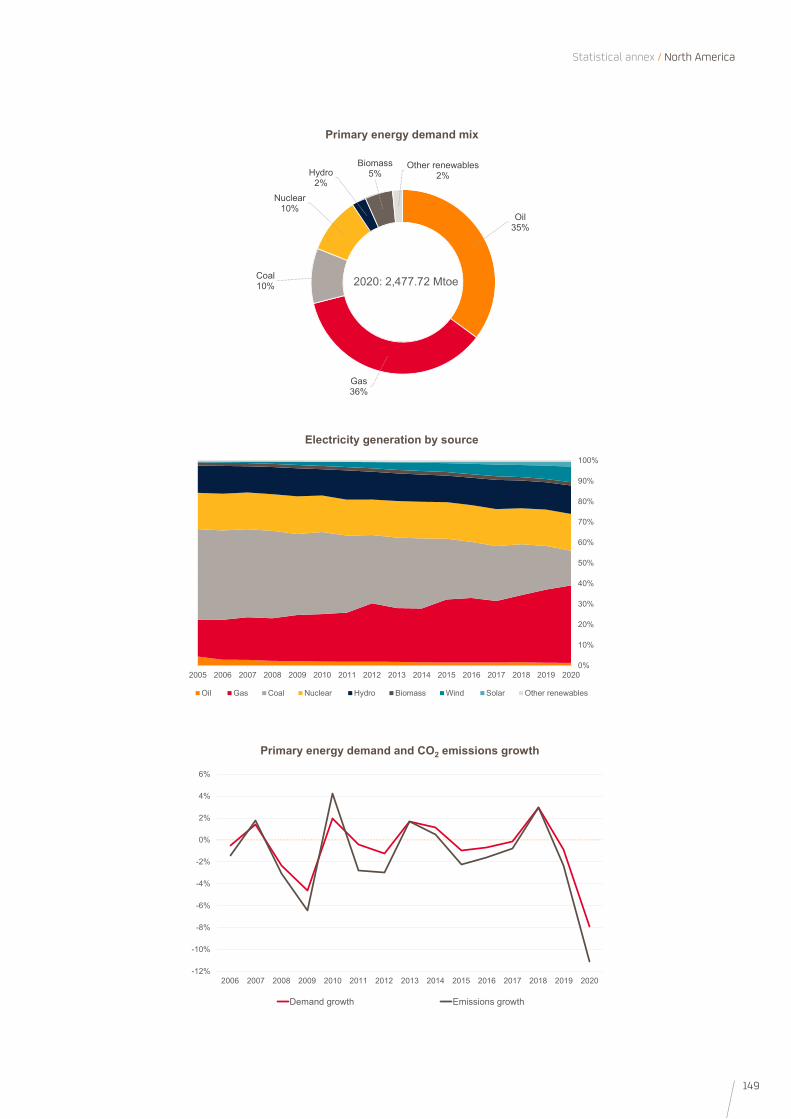
149
Statistical annex / North America
0%
10%
20%
30%
40%
50%
60%
70%
80%
90%
100%
2005 2006 2007 2008 2009 2010 2011 2012 2013 2014 2015 2016 2017 2018 2019 2020
Oil Gas Coal Nuclear Hydro Biomass Wind Solar Other renewables
Electricity generation by source
-12%
-10%
-8%
-6%
-4%
-2%
0%
2%
4%
6%
2006 2007 2008 2009 2010 2011 2012 2013 2014 2015 2016 2017 2018 2019 2020
Demand growth Emissions growth
Primary energy demand and CO2 emissions growth
Oil 35%
Gas36%
Coal10%
Nuclear10%
Hydro2%
Biomass5%
Other renewables2%
2020: 2,477.72 Mtoe
Primary energy demand mix
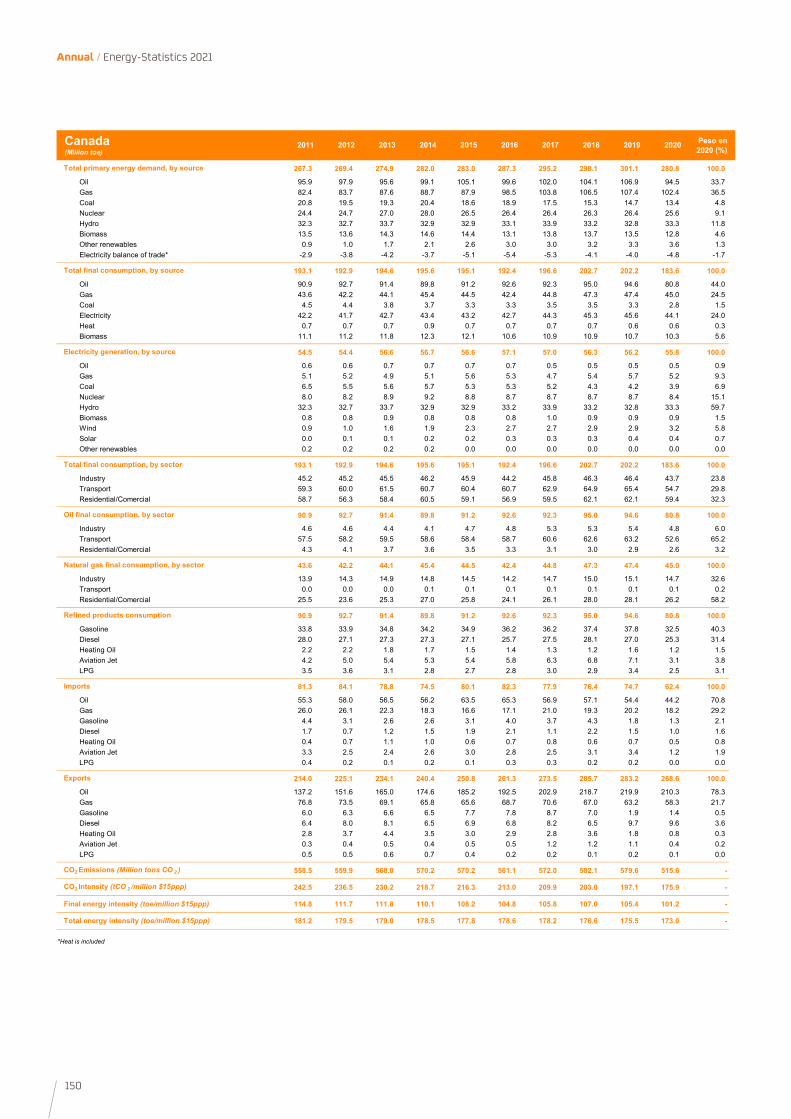
150
Annual / Energy-Statistics 2021
2011 2012 2013 2014 2015 2016 2017 2018 2019 2020 Peso en 2020 (%)
267.3 269.4 274.9 282.0 283.0 287.3 295.2 298.1 301.1 280.8 100.0
Oil 95.9 97.9 95.6 99.1 105.1 99.6 102.0 104.1 106.9 94.5 33.7Gas 82.4 83.7 87.6 88.7 87.9 98.5 103.8 106.5 107.4 102.4 36.5Coal 20.8 19.5 19.3 20.4 18.6 18.9 17.5 15.3 14.7 13.4 4.8Nuclear 24.4 24.7 27.0 28.0 26.5 26.4 26.4 26.3 26.4 25.6 9.1Hydro 32.3 32.7 33.7 32.9 32.9 33.1 33.9 33.2 32.8 33.3 11.8Biomass 13.5 13.6 14.3 14.6 14.4 13.1 13.8 13.7 13.5 12.8 4.6Other renewables 0.9 1.0 1.7 2.1 2.6 3.0 3.0 3.2 3.3 3.6 1.3Electricity balance of trade* -2.9 -3.8 -4.2 -3.7 -5.1 -5.4 -5.3 -4.1 -4.0 -4.8 -1.7
193.1 192.9 194.6 195.6 195.1 192.4 196.6 202.7 202.2 183.6 100.0
Oil 90.9 92.7 91.4 89.8 91.2 92.6 92.3 95.0 94.6 80.8 44.0Gas 43.6 42.2 44.1 45.4 44.5 42.4 44.8 47.3 47.4 45.0 24.5Coal 4.5 4.4 3.8 3.7 3.3 3.3 3.5 3.5 3.3 2.8 1.5Electricity 42.2 41.7 42.7 43.4 43.2 42.7 44.3 45.3 45.6 44.1 24.0Heat 0.7 0.7 0.7 0.9 0.7 0.7 0.7 0.7 0.6 0.6 0.3Biomass 11.1 11.2 11.8 12.3 12.1 10.6 10.9 10.9 10.7 10.3 5.6
54.5 54.4 56.6 56.7 56.6 57.1 57.0 56.3 56.2 55.8 100.0
Oil 0.6 0.6 0.7 0.7 0.7 0.7 0.5 0.5 0.5 0.5 0.9Gas 5.1 5.2 4.9 5.1 5.6 5.3 4.7 5.4 5.7 5.2 9.3Coal 6.5 5.5 5.6 5.7 5.3 5.3 5.2 4.3 4.2 3.9 6.9Nuclear 8.0 8.2 8.9 9.2 8.8 8.7 8.7 8.7 8.7 8.4 15.1Hydro 32.3 32.7 33.7 32.9 32.9 33.2 33.9 33.2 32.8 33.3 59.7Biomass 0.8 0.8 0.9 0.8 0.8 0.8 1.0 0.9 0.9 0.9 1.5Wind 0.9 1.0 1.6 1.9 2.3 2.7 2.7 2.9 2.9 3.2 5.8Solar 0.0 0.1 0.1 0.2 0.2 0.3 0.3 0.3 0.4 0.4 0.7Other renewables 0.2 0.2 0.2 0.2 0.0 0.0 0.0 0.0 0.0 0.0 0.0
193.1 192.9 194.6 195.6 195.1 192.4 196.6 202.7 202.2 183.6 100.0
Industry 45.2 45.2 45.5 46.2 45.9 44.2 45.8 46.3 46.4 43.7 23.8Transport 59.3 60.0 61.5 60.7 60.4 60.7 62.9 64.9 65.4 54.7 29.8Residential/Comercial 58.7 56.3 58.4 60.5 59.1 56.9 59.5 62.1 62.1 59.4 32.3
90.9 92.7 91.4 89.8 91.2 92.6 92.3 95.0 94.6 80.8 100.0
Industry 4.6 4.6 4.4 4.1 4.7 4.8 5.3 5.3 5.4 4.8 6.0Transport 57.5 58.2 59.5 58.6 58.4 58.7 60.6 62.6 63.2 52.6 65.2Residential/Comercial 4.3 4.1 3.7 3.6 3.5 3.3 3.1 3.0 2.9 2.6 3.2
43.6 42.2 44.1 45.4 44.5 42.4 44.8 47.3 47.4 45.0 100.0
Industry 13.9 14.3 14.9 14.8 14.5 14.2 14.7 15.0 15.1 14.7 32.6Transport 0.0 0.0 0.0 0.1 0.1 0.1 0.1 0.1 0.1 0.1 0.2Residential/Comercial 25.5 23.6 25.3 27.0 25.8 24.1 26.1 28.0 28.1 26.2 58.2
90.9 92.7 91.4 89.8 91.2 92.6 92.3 95.0 94.6 80.8 100.0
Gasoline 33.8 33.9 34.8 34.2 34.9 36.2 36.2 37.4 37.8 32.5 40.3Diesel 28.0 27.1 27.3 27.3 27.1 25.7 27.5 28.1 27.0 25.3 31.4Heating Oil 2.2 2.2 1.8 1.7 1.5 1.4 1.3 1.2 1.6 1.2 1.5Aviation Jet 4.2 5.0 5.4 5.3 5.4 5.8 6.3 6.8 7.1 3.1 3.8LPG 3.5 3.6 3.1 2.8 2.7 2.8 3.0 2.9 3.4 2.5 3.1
81.3 84.1 78.8 74.5 80.1 82.3 77.9 76.4 74.7 62.4 100.0
Oil 55.3 58.0 56.5 56.2 63.5 65.3 56.9 57.1 54.4 44.2 70.8Gas 26.0 26.1 22.3 18.3 16.6 17.1 21.0 19.3 20.2 18.2 29.2Gasoline 4.4 3.1 2.6 2.6 3.1 4.0 3.7 4.3 1.8 1.3 2.1Diesel 1.7 0.7 1.2 1.5 1.9 2.1 1.1 2.2 1.5 1.0 1.6Heating Oil 0.4 0.7 1.1 1.0 0.6 0.7 0.8 0.6 0.7 0.5 0.8Aviation Jet 3.3 2.5 2.4 2.6 3.0 2.8 2.5 3.1 3.4 1.2 1.9LPG 0.4 0.2 0.1 0.2 0.1 0.3 0.3 0.2 0.2 0.0 0.0
214.0 225.1 234.1 240.4 250.8 261.3 273.5 285.7 283.2 268.6 100.0
Oil 137.2 151.6 165.0 174.6 185.2 192.5 202.9 218.7 219.9 210.3 78.3Gas 76.8 73.5 69.1 65.8 65.6 68.7 70.6 67.0 63.2 58.3 21.7Gasoline 6.0 6.3 6.6 6.5 7.7 7.8 8.7 7.0 1.9 1.4 0.5Diesel 6.4 8.0 8.1 6.5 6.9 6.8 8.2 6.5 9.7 9.6 3.6Heating Oil 2.8 3.7 4.4 3.5 3.0 2.9 2.8 3.6 1.8 0.8 0.3Aviation Jet 0.3 0.4 0.5 0.4 0.5 0.5 1.2 1.2 1.1 0.4 0.2LPG 0.5 0.5 0.6 0.7 0.4 0.2 0.2 0.1 0.2 0.1 0.0
558.5 559.9 568.0 570.2 570.2 561.1 572.0 582.1 579.6 515.6 -
242.5 236.5 230.2 218.7 216.3 213.0 209.9 203.0 197.1 175.9 -
114.8 111.7 111.8 110.1 108.2 104.8 105.8 107.0 105.4 101.2 -
181.2 179.5 179.0 178.5 177.8 178.6 178.2 176.6 175.5 173.0 -
*Heat is included
Final energy intensity (toe/million $15ppp)
Total energy intensity (toe/million $15ppp)
Natural gas final consumption, by sector
Refined products consumption
Imports
Exports
CO2 Emissions (Million tons CO 2 )
CO2 Intensity (tCO 2 /million $15ppp)
Oil final consumption, by sector
Canada(Million toe)
Total primary energy demand, by source
Total final consumption, by source
Electricity generation, by source
Total final consumption, by sector
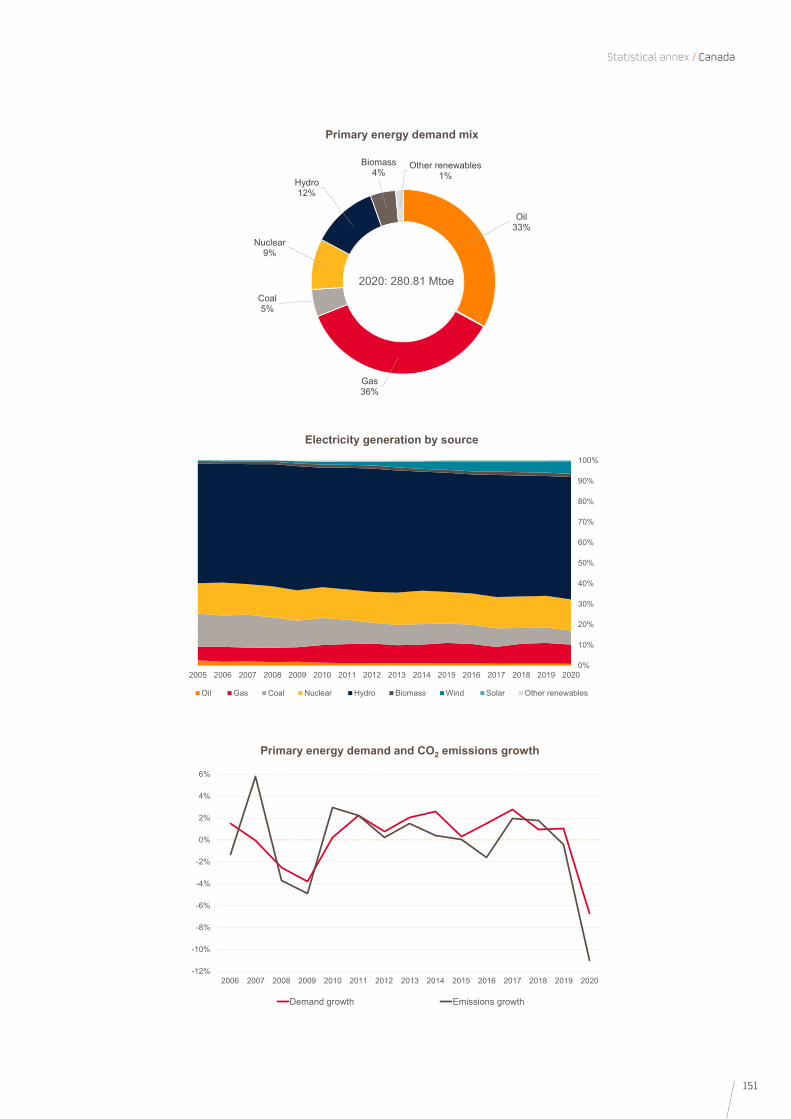
151
Statistical annex / Canada
0%
10%
20%
30%
40%
50%
60%
70%
80%
90%
100%
2005 2006 2007 2008 2009 2010 2011 2012 2013 2014 2015 2016 2017 2018 2019 2020
Oil Gas Coal Nuclear Hydro Biomass Wind Solar Other renewables
Electricity generation by source
-12%
-10%
-8%
-6%
-4%
-2%
0%
2%
4%
6%
2006 2007 2008 2009 2010 2011 2012 2013 2014 2015 2016 2017 2018 2019 2020
Demand growth Emissions growth
Primary energy demand and CO2 emissions growth
Oil 33%
Gas36%
Coal5%
Nuclear9%
Hydro12%
Biomass4%
Other renewables1%
2020: 280.81 Mtoe
Primary energy demand mix
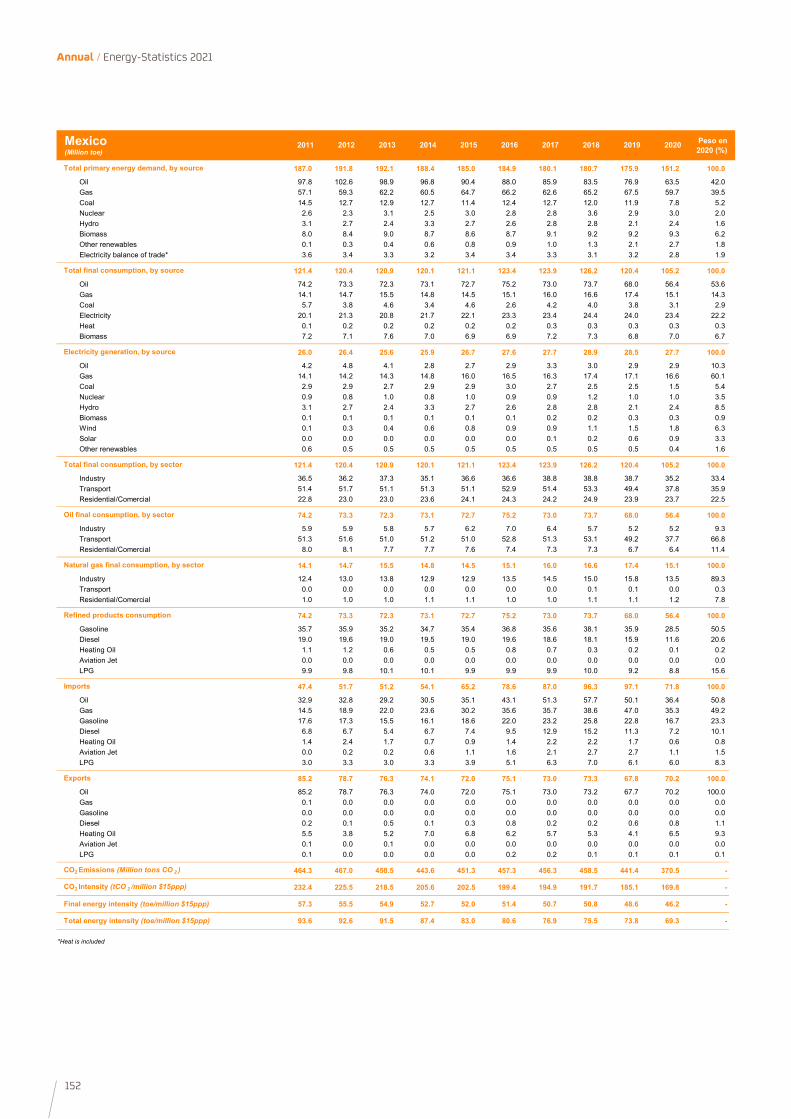
152
Annual / Energy-Statistics 2021
2011 2012 2013 2014 2015 2016 2017 2018 2019 2020 Peso en 2020 (%)
187.0 191.8 192.1 188.4 185.0 184.9 180.1 180.7 175.9 151.2 100.0
Oil 97.8 102.6 98.9 96.8 90.4 88.0 85.9 83.5 76.9 63.5 42.0Gas 57.1 59.3 62.2 60.5 64.7 66.2 62.6 65.2 67.5 59.7 39.5Coal 14.5 12.7 12.9 12.7 11.4 12.4 12.7 12.0 11.9 7.8 5.2Nuclear 2.6 2.3 3.1 2.5 3.0 2.8 2.8 3.6 2.9 3.0 2.0Hydro 3.1 2.7 2.4 3.3 2.7 2.6 2.8 2.8 2.1 2.4 1.6Biomass 8.0 8.4 9.0 8.7 8.6 8.7 9.1 9.2 9.2 9.3 6.2Other renewables 0.1 0.3 0.4 0.6 0.8 0.9 1.0 1.3 2.1 2.7 1.8Electricity balance of trade* 3.6 3.4 3.3 3.2 3.4 3.4 3.3 3.1 3.2 2.8 1.9
121.4 120.4 120.9 120.1 121.1 123.4 123.9 126.2 120.4 105.2 100.0
Oil 74.2 73.3 72.3 73.1 72.7 75.2 73.0 73.7 68.0 56.4 53.6Gas 14.1 14.7 15.5 14.8 14.5 15.1 16.0 16.6 17.4 15.1 14.3Coal 5.7 3.8 4.6 3.4 4.6 2.6 4.2 4.0 3.8 3.1 2.9Electricity 20.1 21.3 20.8 21.7 22.1 23.3 23.4 24.4 24.0 23.4 22.2Heat 0.1 0.2 0.2 0.2 0.2 0.2 0.3 0.3 0.3 0.3 0.3Biomass 7.2 7.1 7.6 7.0 6.9 6.9 7.2 7.3 6.8 7.0 6.7
26.0 26.4 25.6 25.9 26.7 27.6 27.7 28.9 28.5 27.7 100.0
Oil 4.2 4.8 4.1 2.8 2.7 2.9 3.3 3.0 2.9 2.9 10.3Gas 14.1 14.2 14.3 14.8 16.0 16.5 16.3 17.4 17.1 16.6 60.1Coal 2.9 2.9 2.7 2.9 2.9 3.0 2.7 2.5 2.5 1.5 5.4Nuclear 0.9 0.8 1.0 0.8 1.0 0.9 0.9 1.2 1.0 1.0 3.5Hydro 3.1 2.7 2.4 3.3 2.7 2.6 2.8 2.8 2.1 2.4 8.5Biomass 0.1 0.1 0.1 0.1 0.1 0.1 0.2 0.2 0.3 0.3 0.9Wind 0.1 0.3 0.4 0.6 0.8 0.9 0.9 1.1 1.5 1.8 6.3Solar 0.0 0.0 0.0 0.0 0.0 0.0 0.1 0.2 0.6 0.9 3.3Other renewables 0.6 0.5 0.5 0.5 0.5 0.5 0.5 0.5 0.5 0.4 1.6
121.4 120.4 120.9 120.1 121.1 123.4 123.9 126.2 120.4 105.2 100.0
Industry 36.5 36.2 37.3 35.1 36.6 36.6 38.8 38.8 38.7 35.2 33.4Transport 51.4 51.7 51.1 51.3 51.1 52.9 51.4 53.3 49.4 37.8 35.9Residential/Comercial 22.8 23.0 23.0 23.6 24.1 24.3 24.2 24.9 23.9 23.7 22.5
74.2 73.3 72.3 73.1 72.7 75.2 73.0 73.7 68.0 56.4 100.0
Industry 5.9 5.9 5.8 5.7 6.2 7.0 6.4 5.7 5.2 5.2 9.3Transport 51.3 51.6 51.0 51.2 51.0 52.8 51.3 53.1 49.2 37.7 66.8Residential/Comercial 8.0 8.1 7.7 7.7 7.6 7.4 7.3 7.3 6.7 6.4 11.4
14.1 14.7 15.5 14.8 14.5 15.1 16.0 16.6 17.4 15.1 100.0
Industry 12.4 13.0 13.8 12.9 12.9 13.5 14.5 15.0 15.8 13.5 89.3Transport 0.0 0.0 0.0 0.0 0.0 0.0 0.0 0.1 0.1 0.0 0.3Residential/Comercial 1.0 1.0 1.0 1.1 1.1 1.0 1.0 1.1 1.1 1.2 7.8
74.2 73.3 72.3 73.1 72.7 75.2 73.0 73.7 68.0 56.4 100.0
Gasoline 35.7 35.9 35.2 34.7 35.4 36.8 35.6 38.1 35.9 28.5 50.5Diesel 19.0 19.6 19.0 19.5 19.0 19.6 18.6 18.1 15.9 11.6 20.6Heating Oil 1.1 1.2 0.6 0.5 0.5 0.8 0.7 0.3 0.2 0.1 0.2Aviation Jet 0.0 0.0 0.0 0.0 0.0 0.0 0.0 0.0 0.0 0.0 0.0LPG 9.9 9.8 10.1 10.1 9.9 9.9 9.9 10.0 9.2 8.8 15.6
47.4 51.7 51.2 54.1 65.2 78.6 87.0 96.3 97.1 71.8 100.0
Oil 32.9 32.8 29.2 30.5 35.1 43.1 51.3 57.7 50.1 36.4 50.8Gas 14.5 18.9 22.0 23.6 30.2 35.6 35.7 38.6 47.0 35.3 49.2Gasoline 17.6 17.3 15.5 16.1 18.6 22.0 23.2 25.8 22.8 16.7 23.3Diesel 6.8 6.7 5.4 6.7 7.4 9.5 12.9 15.2 11.3 7.2 10.1Heating Oil 1.4 2.4 1.7 0.7 0.9 1.4 2.2 2.2 1.7 0.6 0.8Aviation Jet 0.0 0.2 0.2 0.6 1.1 1.6 2.1 2.7 2.7 1.1 1.5LPG 3.0 3.3 3.0 3.3 3.9 5.1 6.3 7.0 6.1 6.0 8.3
85.2 78.7 76.3 74.1 72.0 75.1 73.0 73.3 67.8 70.2 100.0
Oil 85.2 78.7 76.3 74.0 72.0 75.1 73.0 73.2 67.7 70.2 100.0Gas 0.1 0.0 0.0 0.0 0.0 0.0 0.0 0.0 0.0 0.0 0.0Gasoline 0.0 0.0 0.0 0.0 0.0 0.0 0.0 0.0 0.0 0.0 0.0Diesel 0.2 0.1 0.5 0.1 0.3 0.8 0.2 0.2 0.6 0.8 1.1Heating Oil 5.5 3.8 5.2 7.0 6.8 6.2 5.7 5.3 4.1 6.5 9.3Aviation Jet 0.1 0.0 0.1 0.0 0.0 0.0 0.0 0.0 0.0 0.0 0.0LPG 0.1 0.0 0.0 0.0 0.0 0.2 0.2 0.1 0.1 0.1 0.1
464.3 467.0 458.5 443.6 451.3 457.3 456.3 458.5 441.4 370.5 -
232.4 225.5 218.5 205.6 202.5 199.4 194.9 191.7 185.1 169.8 -
57.3 55.5 54.9 52.7 52.0 51.4 50.7 50.8 48.6 46.2 -
93.6 92.6 91.5 87.4 83.0 80.6 76.9 75.5 73.8 69.3 -
*Heat is included
Final energy intensity (toe/million $15ppp)
Total energy intensity (toe/million $15ppp)
Natural gas final consumption, by sector
Refined products consumption
Imports
Exports
CO2 Emissions (Million tons CO 2 )
CO2 Intensity (tCO 2 /million $15ppp)
Oil final consumption, by sector
Mexico(Million toe)
Total primary energy demand, by source
Total final consumption, by source
Electricity generation, by source
Total final consumption, by sector
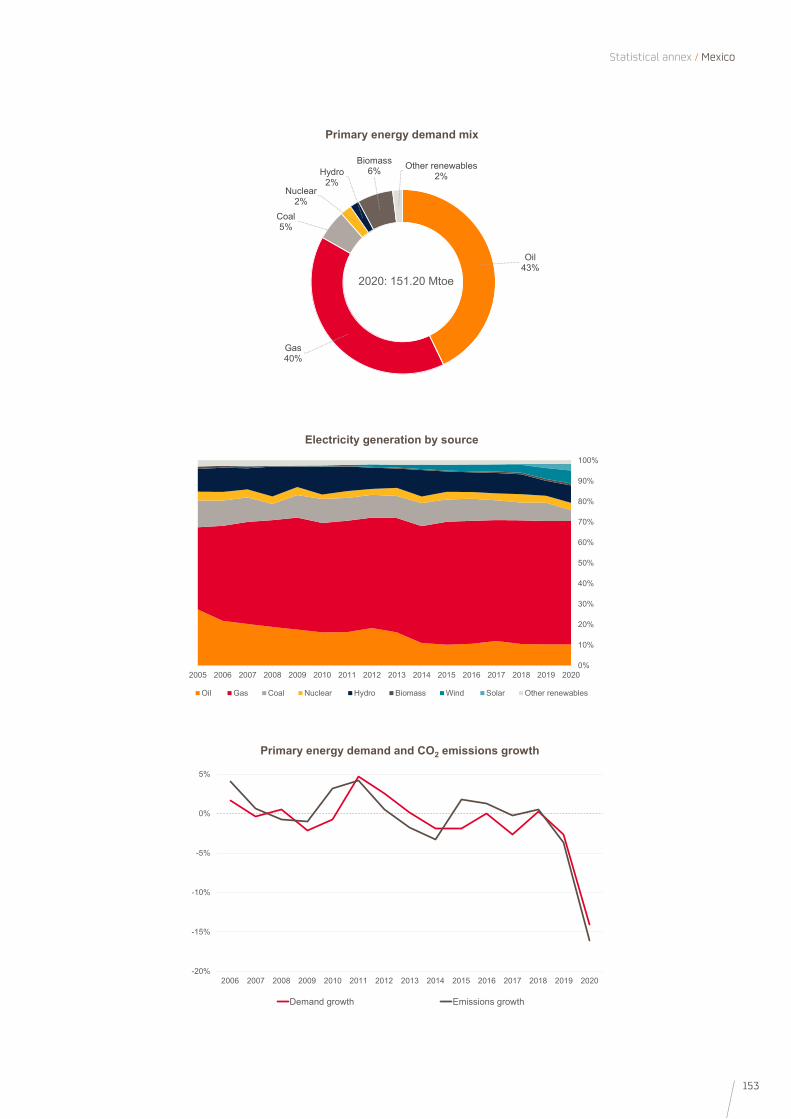
153
Statistical annex / Mexico
0%
10%
20%
30%
40%
50%
60%
70%
80%
90%
100%
2005 2006 2007 2008 2009 2010 2011 2012 2013 2014 2015 2016 2017 2018 2019 2020
Oil Gas Coal Nuclear Hydro Biomass Wind Solar Other renewables
Electricity generation by source
-20%
-15%
-10%
-5%
0%
5%
2006 2007 2008 2009 2010 2011 2012 2013 2014 2015 2016 2017 2018 2019 2020
Demand growth Emissions growth
Primary energy demand and CO2 emissions growth
Oil 43%
Gas40%
Coal5%
Nuclear2%
Hydro2%
Biomass6% Other renewables
2%
2020: 151.20 Mtoe
Primary energy demand mix

154
Annual / Energy-Statistics 2021
2011 2012 2013 2014 2015 2016 2017 2018 2019 2020 Peso en 2020 (%)
2,191.4 2,152.3 2,190.2 2,216.5 2,192.2 2,168.5 2,161.0 2,236.2 2,213.7 2,045.7 100.0
Oil 784.5 775.5 777.6 777.2 793.4 788.5 794.6 805.9 805.4 710.8 34.7Gas 568.6 594.7 606.4 627.4 646.4 652.6 643.7 708.3 732.0 722.3 35.3Coal 479.1 424.5 432.1 431.7 374.1 341.5 330.7 320.6 273.7 215.5 10.5Nuclear 214.1 208.8 214.2 216.5 216.4 218.9 218.6 219.3 219.9 215.8 10.6Hydro 27.7 24.0 23.3 22.5 21.6 23.2 26.0 25.4 25.0 25.1 1.2Biomass 91.5 95.6 102.7 105.5 101.5 101.1 101.4 107.6 105.5 97.3 4.8Other renewables 10.9 13.1 16.0 18.0 19.7 24.1 28.2 31.0 34.5 39.5 1.9Electricity balance of trade* 15.1 16.1 17.8 17.7 19.1 18.7 17.7 18.1 17.6 19.4 0.9
1,463.4 1,434.7 1,480.5 1,503.0 1,496.8 1,501.9 1,507.4 1,577.2 1,578.7 1,446.0 100.0
Oil 721.5 709.1 720.1 724.9 741.9 744.4 747.6 765.1 767.5 677.8 46.9Gas 307.0 294.7 320.0 335.0 318.9 319.4 327.9 359.6 364.0 343.6 23.8Coal 29.5 27.3 27.1 26.9 23.7 21.2 20.6 20.7 19.5 16.5 1.1Electricity 325.0 320.5 323.9 325.9 325.2 328.0 323.0 335.5 331.3 318.5 22.0Heat 8.9 8.8 8.3 8.1 8.0 8.9 8.0 9.8 9.9 10.3 0.7Biomass 71.4 74.2 81.2 82.3 79.1 79.9 80.2 86.5 86.4 79.3 5.5
374.1 369.0 370.3 373.3 371.3 371.7 368.6 383.2 378.5 366.6 100.0
Oil 3.4 2.8 3.2 3.4 3.3 3.0 2.8 3.7 2.7 2.5 0.7Gas 89.9 108.8 99.6 99.9 118.0 122.0 115.0 130.7 142.5 148.1 40.4Coal 161.3 141.3 147.3 147.3 126.5 116.4 113.6 109.4 91.8 71.0 19.4Nuclear 70.6 68.9 70.7 71.4 71.4 72.2 72.1 72.4 72.6 71.2 19.4Hydro 29.6 25.7 24.9 24.2 23.3 25.1 28.0 27.3 26.7 26.8 7.3Biomass 6.4 6.5 6.7 7.0 6.9 6.8 6.8 6.7 6.2 6.1 1.7Wind 10.4 12.2 14.6 15.8 16.6 19.7 22.1 23.7 25.7 29.1 7.9Solar 0.5 0.9 1.4 2.2 3.1 4.3 6.1 7.3 8.3 9.7 2.7Other renewables 1.9 1.9 2.0 2.0 2.1 2.1 2.1 2.1 2.0 2.1 0.6
1,463.4 1,434.7 1,480.5 1,503.0 1,496.8 1,501.9 1,507.4 1,577.2 1,578.7 1,446.0 100.0
Industry 270.0 272.8 271.2 271.1 269.4 272.0 267.7 283.3 283.6 267.6 18.5Transport 568.0 560.8 578.6 579.0 600.1 607.0 611.7 621.2 620.9 539.1 37.3Residential/Comercial 477.9 447.2 482.4 494.9 475.6 469.8 466.1 506.1 501.8 472.9 32.7
721.5 709.1 720.1 724.9 741.9 744.4 747.6 765.1 767.5 677.8 100.0
Industry 20.1 19.8 20.1 17.5 19.2 19.9 18.1 20.8 21.0 16.9 2.5Transport 540.1 527.5 542.0 542.1 562.5 566.6 570.2 580.3 579.9 502.3 74.1Residential/Comercial 29.2 24.0 26.0 24.2 26.4 26.0 24.1 24.5 23.6 21.3 3.1
307.0 294.7 320.0 335.0 318.9 319.4 327.9 359.6 364.0 343.6 100.0
Industry 111.4 117.0 115.4 120.5 120.8 124.6 124.1 133.2 135.2 133.1 38.7Transport 0.7 0.7 0.7 0.8 0.9 1.0 1.1 1.2 1.3 1.3 0.4Residential/Comercial 181.3 162.2 188.7 197.9 180.5 173.8 177.3 199.6 200.0 182.0 53.0
719.5 707.0 717.6 722.4 737.6 741.4 743.2 759.5 761.9 673.0 100.0
Gasoline 363.6 359.6 364.8 367.4 377.9 383.3 380.8 381.7 380.9 328.9 48.9Diesel 180.5 176.7 176.9 183.7 179.5 176.5 179.0 186.9 185.6 171.0 25.4Heating Oil 4.9 3.3 1.0 0.3 2.9 1.8 1.8 1.9 1.7 1.3 0.2Aviation Jet 48.6 48.1 49.2 50.4 52.8 54.8 57.9 58.8 60.0 39.3 5.8LPG 32.3 33.3 38.9 35.6 37.3 35.7 33.3 36.9 38.4 38.7 5.7
678.4 623.4 567.3 534.7 546.0 581.5 586.8 574.9 526.4 472.1 100.0
Oil 597.8 550.7 500.6 472.4 483.1 511.9 516.4 508.2 460.7 410.7 87.0Gas 80.6 72.7 66.7 62.3 62.9 69.5 70.4 66.7 65.7 61.4 13.0Gasoline 34.7 32.8 32.2 30.0 33.3 34.6 31.3 33.4 39.1 43.3 9.2Diesel 6.8 6.9 8.9 10.6 11.2 8.4 8.8 10.1 11.7 12.4 2.6Heating Oil 19.3 16.2 13.6 11.2 11.7 11.6 11.3 12.6 8.9 10.0 2.1Aviation Jet 3.1 3.1 4.4 4.9 6.9 7.6 8.3 6.7 8.8 8.0 1.7LPG 3.5 3.7 4.2 3.7 4.3 5.0 5.6 6.1 6.4 4.7 1.0
172.3 182.8 195.2 229.5 257.6 290.8 362.7 429.6 508.5 528.0 100.0
Oil 137.7 145.7 159.2 194.8 216.9 238.2 288.3 344.8 400.1 403.6 76.4Gas 34.6 37.1 36.0 34.7 40.7 52.7 74.4 84.7 108.4 124.4 23.6Gasoline 23.7 23.3 23.2 25.3 28.3 35.3 38.1 43.4 40.3 35.6 6.7Diesel 43.3 50.1 56.3 54.9 58.5 58.7 68.5 64.2 65.1 59.5 11.3Heating Oil 23.1 20.7 19.4 20.1 17.5 16.3 16.8 17.6 12.6 7.8 1.5Aviation Jet 5.3 6.6 7.8 8.1 8.3 8.7 9.2 11.1 11.0 4.7 0.9LPG 0.0 0.0 0.0 17.0 24.4 31.0 35.6 39.6 45.2 51.8 9.8
5,237.0 5,047.4 5,150.9 5,191.6 5,044.1 4,948.9 4,890.7 5,055.8 4,932.6 4,404.7 -
315.5 297.4 298.0 293.2 276.9 267.4 258.6 259.7 248.0 229.5 -
80.4 76.5 78.1 76.9 74.8 73.8 72.0 73.3 71.6 67.4 -
132.0 126.8 126.7 125.2 120.3 117.2 114.3 114.9 111.3 106.6 -
*Heat is included
Final energy intensity (toe/million $15ppp)
Total energy intensity (toe/million $15ppp)
Natural gas final consumption, by sector
Refined products consumption
Imports
Exports
CO2 Emissions (Million tons CO 2 )
CO2 Intensity (tCO 2 /million $15ppp)
Oil final consumption, by sector
United States(Million toe)
Total primary energy demand, by source
Total final consumption, by source
Electricity generation, by source
Total final consumption, by sector
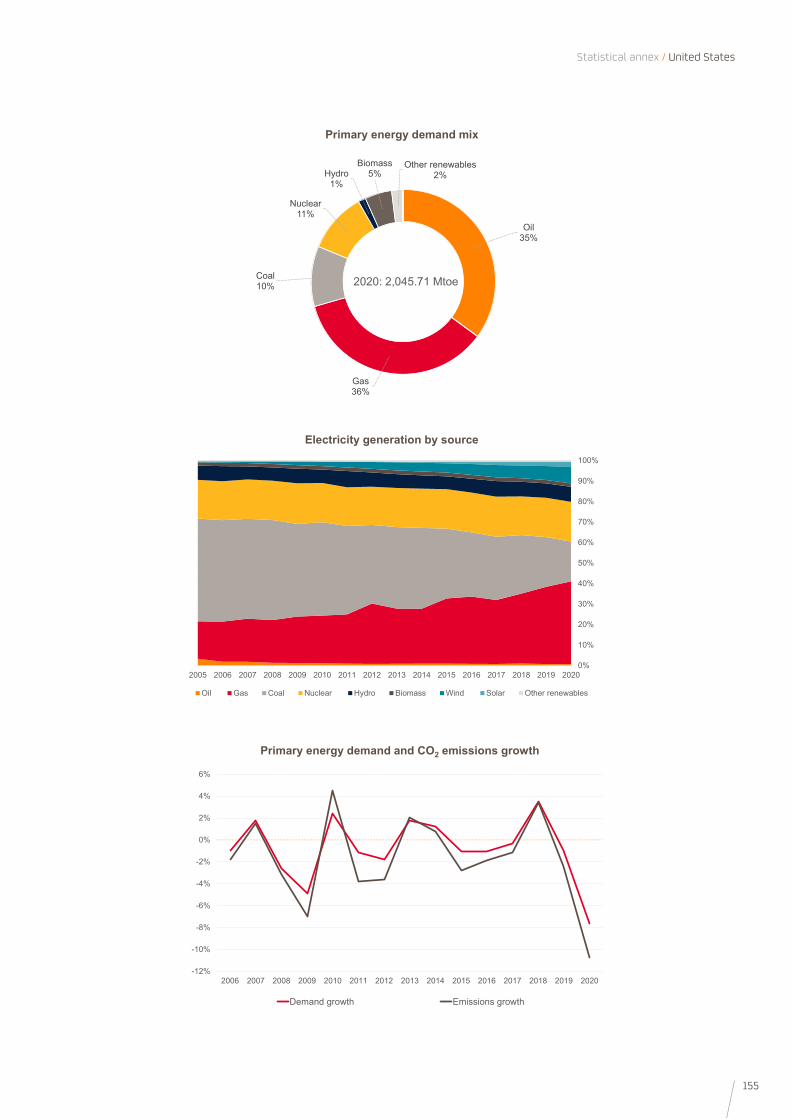
155
Statistical annex / United States
0%
10%
20%
30%
40%
50%
60%
70%
80%
90%
100%
2005 2006 2007 2008 2009 2010 2011 2012 2013 2014 2015 2016 2017 2018 2019 2020
Oil Gas Coal Nuclear Hydro Biomass Wind Solar Other renewables
Electricity generation by source
-12%
-10%
-8%
-6%
-4%
-2%
0%
2%
4%
6%
2006 2007 2008 2009 2010 2011 2012 2013 2014 2015 2016 2017 2018 2019 2020
Demand growth Emissions growth
Primary energy demand and CO2 emissions growth
Oil 35%
Gas36%
Coal10%
Nuclear11%
Hydro1%
Biomass5%
Other renewables2%
2020: 2,045.71 Mtoe
Primary energy demand mix
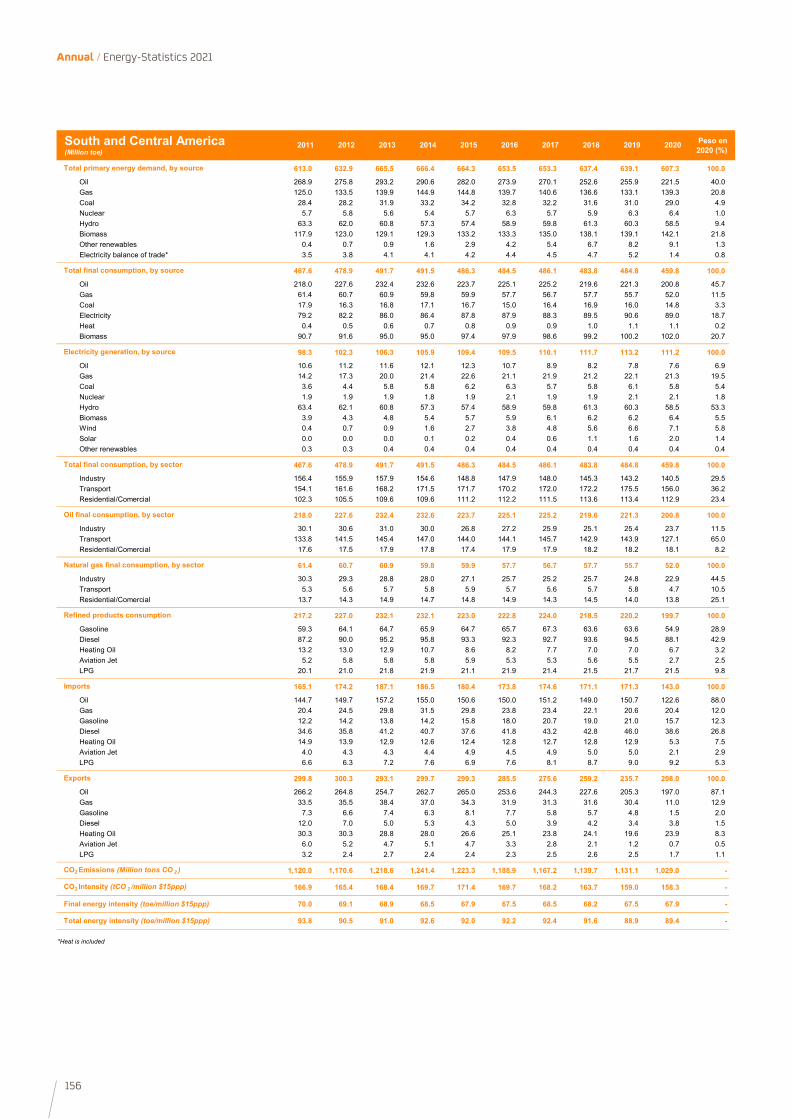
156
Annual / Energy-Statistics 2021
2011 2012 2013 2014 2015 2016 2017 2018 2019 2020 Peso en 2020 (%)
613.0 632.9 665.5 666.4 664.3 653.5 653.3 637.4 639.1 607.3 100.0
Oil 268.9 275.8 293.2 290.6 282.0 273.9 270.1 252.6 255.9 221.5 40.0Gas 125.0 133.5 139.9 144.9 144.8 139.7 140.6 136.6 133.1 139.3 20.8Coal 28.4 28.2 31.9 33.2 34.2 32.8 32.2 31.6 31.0 29.0 4.9Nuclear 5.7 5.8 5.6 5.4 5.7 6.3 5.7 5.9 6.3 6.4 1.0Hydro 63.3 62.0 60.8 57.3 57.4 58.9 59.8 61.3 60.3 58.5 9.4Biomass 117.9 123.0 129.1 129.3 133.2 133.3 135.0 138.1 139.1 142.1 21.8Other renewables 0.4 0.7 0.9 1.6 2.9 4.2 5.4 6.7 8.2 9.1 1.3Electricity balance of trade* 3.5 3.8 4.1 4.1 4.2 4.4 4.5 4.7 5.2 1.4 0.8
467.6 478.9 491.7 491.5 486.3 484.5 486.1 483.8 484.8 459.8 100.0
Oil 218.0 227.6 232.4 232.6 223.7 225.1 225.2 219.6 221.3 200.8 45.7Gas 61.4 60.7 60.9 59.8 59.9 57.7 56.7 57.7 55.7 52.0 11.5Coal 17.9 16.3 16.8 17.1 16.7 15.0 16.4 16.9 16.0 14.8 3.3Electricity 79.2 82.2 86.0 86.4 87.8 87.9 88.3 89.5 90.6 89.0 18.7Heat 0.4 0.5 0.6 0.7 0.8 0.9 0.9 1.0 1.1 1.1 0.2Biomass 90.7 91.6 95.0 95.0 97.4 97.9 98.6 99.2 100.2 102.0 20.7
98.3 102.3 106.3 105.9 109.4 109.5 110.1 111.7 113.2 111.2 100.0
Oil 10.6 11.2 11.6 12.1 12.3 10.7 8.9 8.2 7.8 7.6 6.9Gas 14.2 17.3 20.0 21.4 22.6 21.1 21.9 21.2 22.1 21.3 19.5Coal 3.6 4.4 5.8 5.8 6.2 6.3 5.7 5.8 6.1 5.8 5.4Nuclear 1.9 1.9 1.9 1.8 1.9 2.1 1.9 1.9 2.1 2.1 1.8Hydro 63.4 62.1 60.8 57.3 57.4 58.9 59.8 61.3 60.3 58.5 53.3Biomass 3.9 4.3 4.8 5.4 5.7 5.9 6.1 6.2 6.2 6.4 5.5Wind 0.4 0.7 0.9 1.6 2.7 3.8 4.8 5.6 6.6 7.1 5.8Solar 0.0 0.0 0.0 0.1 0.2 0.4 0.6 1.1 1.6 2.0 1.4Other renewables 0.3 0.3 0.4 0.4 0.4 0.4 0.4 0.4 0.4 0.4 0.4
467.6 478.9 491.7 491.5 486.3 484.5 486.1 483.8 484.8 459.8 100.0
Industry 156.4 155.9 157.9 154.6 148.8 147.9 148.0 145.3 143.2 140.5 29.5Transport 154.1 161.6 168.2 171.5 171.7 170.2 172.0 172.2 175.5 156.0 36.2Residential/Comercial 102.3 105.5 109.6 109.6 111.2 112.2 111.5 113.6 113.4 112.9 23.4
218.0 227.6 232.4 232.6 223.7 225.1 225.2 219.6 221.3 200.8 100.0
Industry 30.1 30.6 31.0 30.0 26.8 27.2 25.9 25.1 25.4 23.7 11.5Transport 133.8 141.5 145.4 147.0 144.0 144.1 145.7 142.9 143.9 127.1 65.0Residential/Comercial 17.6 17.5 17.9 17.8 17.4 17.9 17.9 18.2 18.2 18.1 8.2
61.4 60.7 60.9 59.8 59.9 57.7 56.7 57.7 55.7 52.0 100.0
Industry 30.3 29.3 28.8 28.0 27.1 25.7 25.2 25.7 24.8 22.9 44.5Transport 5.3 5.6 5.7 5.8 5.9 5.7 5.6 5.7 5.8 4.7 10.5Residential/Comercial 13.7 14.3 14.9 14.7 14.8 14.9 14.3 14.5 14.0 13.8 25.1
217.2 227.0 232.1 232.1 223.0 222.8 224.0 218.5 220.2 199.7 100.0
Gasoline 59.3 64.1 64.7 65.9 64.7 65.7 67.3 63.6 63.6 54.9 28.9Diesel 87.2 90.0 95.2 95.8 93.3 92.3 92.7 93.6 94.5 88.1 42.9Heating Oil 13.2 13.0 12.9 10.7 8.6 8.2 7.7 7.0 7.0 6.7 3.2Aviation Jet 5.2 5.8 5.8 5.8 5.9 5.3 5.3 5.6 5.5 2.7 2.5LPG 20.1 21.0 21.8 21.9 21.1 21.9 21.4 21.5 21.7 21.5 9.8
165.1 174.2 187.1 186.5 180.4 173.8 174.6 171.1 171.3 143.0 100.0
Oil 144.7 149.7 157.2 155.0 150.6 150.0 151.2 149.0 150.7 122.6 88.0Gas 20.4 24.5 29.8 31.5 29.8 23.8 23.4 22.1 20.6 20.4 12.0Gasoline 12.2 14.2 13.8 14.2 15.8 18.0 20.7 19.0 21.0 15.7 12.3Diesel 34.6 35.8 41.2 40.7 37.6 41.8 43.2 42.8 46.0 38.6 26.8Heating Oil 14.9 13.9 12.9 12.6 12.4 12.8 12.7 12.8 12.9 5.3 7.5Aviation Jet 4.0 4.3 4.3 4.4 4.9 4.5 4.9 5.0 5.0 2.1 2.9LPG 6.6 6.3 7.2 7.6 6.9 7.6 8.1 8.7 9.0 9.2 5.3
299.8 300.3 293.1 299.7 299.3 285.5 275.6 259.2 235.7 208.0 100.0
Oil 266.2 264.8 254.7 262.7 265.0 253.6 244.3 227.6 205.3 197.0 87.1Gas 33.5 35.5 38.4 37.0 34.3 31.9 31.3 31.6 30.4 11.0 12.9Gasoline 7.3 6.6 7.4 6.3 8.1 7.7 5.8 5.7 4.8 1.5 2.0Diesel 12.0 7.0 5.0 5.3 4.3 5.0 3.9 4.2 3.4 3.8 1.5Heating Oil 30.3 30.3 28.8 28.0 26.6 25.1 23.8 24.1 19.6 23.9 8.3Aviation Jet 6.0 5.2 4.7 5.1 4.7 3.3 2.8 2.1 1.2 0.7 0.5LPG 3.2 2.4 2.7 2.4 2.4 2.3 2.5 2.6 2.5 1.7 1.1
1,120.0 1,170.6 1,218.6 1,241.4 1,223.3 1,188.9 1,167.2 1,139.7 1,131.1 1,029.0 -
166.9 165.4 168.4 169.7 171.4 169.7 168.2 163.7 159.0 158.3 -
70.0 69.1 68.9 68.5 67.9 67.5 68.5 68.2 67.5 67.9 -
93.8 90.5 91.0 92.6 92.0 92.2 92.4 91.6 88.9 89.4 -
*Heat is included
Final energy intensity (toe/million $15ppp)
Total energy intensity (toe/million $15ppp)
Natural gas final consumption, by sector
Refined products consumption
Imports
Exports
CO2 Emissions (Million tons CO 2 )
CO2 Intensity (tCO 2 /million $15ppp)
Oil final consumption, by sector
South and Central America(Million toe)
Total primary energy demand, by source
Total final consumption, by source
Electricity generation, by source
Total final consumption, by sector
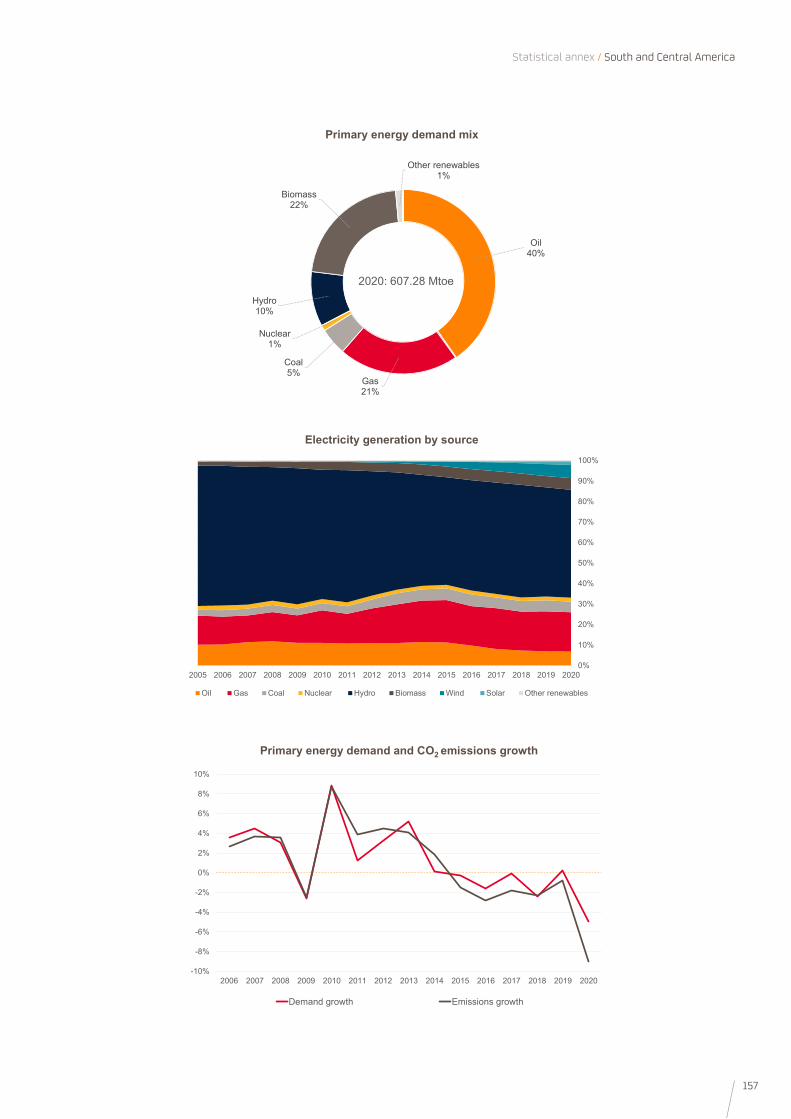
157
Statistical annex / South and Central America
0%
10%
20%
30%
40%
50%
60%
70%
80%
90%
100%
2005 2006 2007 2008 2009 2010 2011 2012 2013 2014 2015 2016 2017 2018 2019 2020
Oil Gas Coal Nuclear Hydro Biomass Wind Solar Other renewables
Electricity generation by source
-10%
-8%
-6%
-4%
-2%
0%
2%
4%
6%
8%
10%
2006 2007 2008 2009 2010 2011 2012 2013 2014 2015 2016 2017 2018 2019 2020
Demand growth Emissions growth
Primary energy demand and CO2 emissions growth
Oil 40%
Gas21%
Coal5%
Nuclear1%
Hydro10%
Biomass22%
Other renewables1%
2020: 607.28 Mtoe
Primary energy demand mix
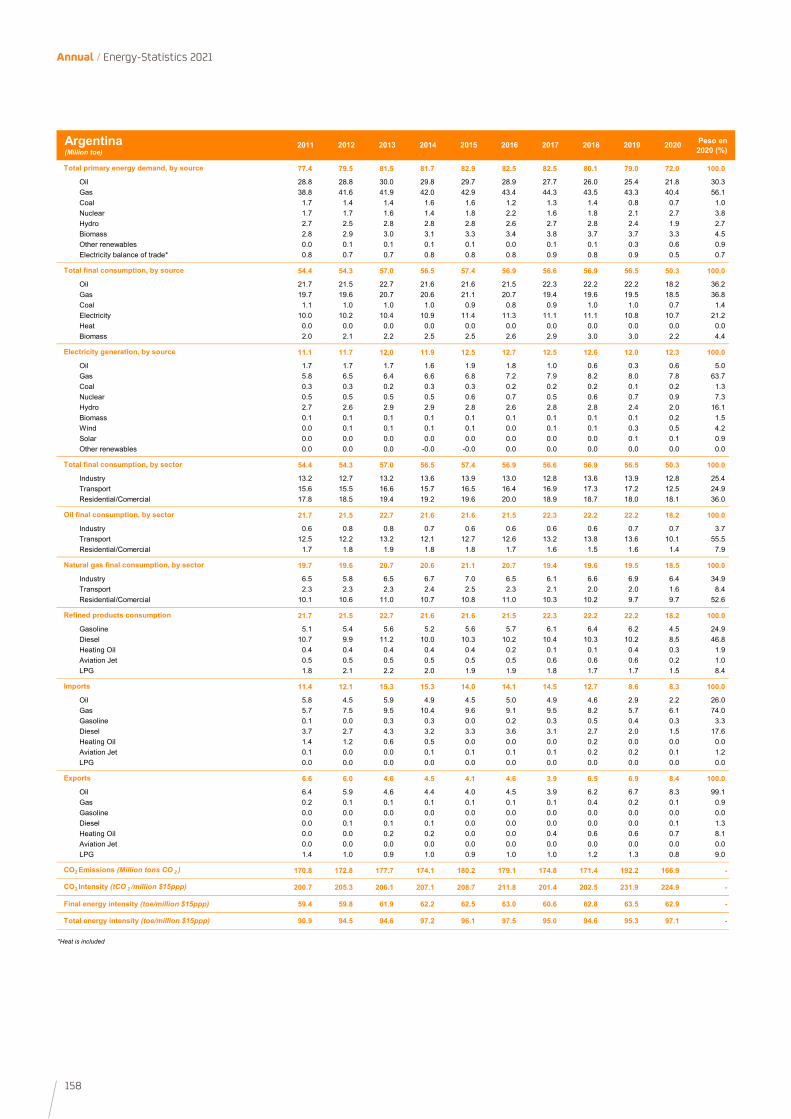
158
Annual / Energy-Statistics 2021
2011 2012 2013 2014 2015 2016 2017 2018 2019 2020 Peso en 2020 (%)
77.4 79.5 81.5 81.7 82.9 82.5 82.5 80.1 79.0 72.0 100.0
Oil 28.8 28.8 30.0 29.8 29.7 28.9 27.7 26.0 25.4 21.8 30.3Gas 38.8 41.6 41.9 42.0 42.9 43.4 44.3 43.5 43.3 40.4 56.1Coal 1.7 1.4 1.4 1.6 1.6 1.2 1.3 1.4 0.8 0.7 1.0Nuclear 1.7 1.7 1.6 1.4 1.8 2.2 1.6 1.8 2.1 2.7 3.8Hydro 2.7 2.5 2.8 2.8 2.8 2.6 2.7 2.8 2.4 1.9 2.7Biomass 2.8 2.9 3.0 3.1 3.3 3.4 3.8 3.7 3.7 3.3 4.5Other renewables 0.0 0.1 0.1 0.1 0.1 0.0 0.1 0.1 0.3 0.6 0.9Electricity balance of trade* 0.8 0.7 0.7 0.8 0.8 0.8 0.9 0.8 0.9 0.5 0.7
54.4 54.3 57.0 56.5 57.4 56.9 56.6 56.9 56.5 50.3 100.0
Oil 21.7 21.5 22.7 21.6 21.6 21.5 22.3 22.2 22.2 18.2 36.2Gas 19.7 19.6 20.7 20.6 21.1 20.7 19.4 19.6 19.5 18.5 36.8Coal 1.1 1.0 1.0 1.0 0.9 0.8 0.9 1.0 1.0 0.7 1.4Electricity 10.0 10.2 10.4 10.9 11.4 11.3 11.1 11.1 10.8 10.7 21.2Heat 0.0 0.0 0.0 0.0 0.0 0.0 0.0 0.0 0.0 0.0 0.0Biomass 2.0 2.1 2.2 2.5 2.5 2.6 2.9 3.0 3.0 2.2 4.4
11.1 11.7 12.0 11.9 12.5 12.7 12.5 12.6 12.0 12.3 100.0
Oil 1.7 1.7 1.7 1.6 1.9 1.8 1.0 0.6 0.3 0.6 5.0Gas 5.8 6.5 6.4 6.6 6.8 7.2 7.9 8.2 8.0 7.8 63.7Coal 0.3 0.3 0.2 0.3 0.3 0.2 0.2 0.2 0.1 0.2 1.3Nuclear 0.5 0.5 0.5 0.5 0.6 0.7 0.5 0.6 0.7 0.9 7.3Hydro 2.7 2.6 2.9 2.9 2.8 2.6 2.8 2.8 2.4 2.0 16.1Biomass 0.1 0.1 0.1 0.1 0.1 0.1 0.1 0.1 0.1 0.2 1.5Wind 0.0 0.1 0.1 0.1 0.1 0.0 0.1 0.1 0.3 0.5 4.2Solar 0.0 0.0 0.0 0.0 0.0 0.0 0.0 0.0 0.1 0.1 0.9Other renewables 0.0 0.0 0.0 -0.0 -0.0 0.0 0.0 0.0 0.0 0.0 0.0
54.4 54.3 57.0 56.5 57.4 56.9 56.6 56.9 56.5 50.3 100.0
Industry 13.2 12.7 13.2 13.6 13.9 13.0 12.8 13.6 13.9 12.8 25.4Transport 15.6 15.5 16.6 15.7 16.5 16.4 16.9 17.3 17.2 12.5 24.9Residential/Comercial 17.8 18.5 19.4 19.2 19.6 20.0 18.9 18.7 18.0 18.1 36.0
21.7 21.5 22.7 21.6 21.6 21.5 22.3 22.2 22.2 18.2 100.0
Industry 0.6 0.8 0.8 0.7 0.6 0.6 0.6 0.6 0.7 0.7 3.7Transport 12.5 12.2 13.2 12.1 12.7 12.6 13.2 13.8 13.6 10.1 55.5Residential/Comercial 1.7 1.8 1.9 1.8 1.8 1.7 1.6 1.5 1.6 1.4 7.9
19.7 19.6 20.7 20.6 21.1 20.7 19.4 19.6 19.5 18.5 100.0
Industry 6.5 5.8 6.5 6.7 7.0 6.5 6.1 6.6 6.9 6.4 34.9Transport 2.3 2.3 2.3 2.4 2.5 2.3 2.1 2.0 2.0 1.6 8.4Residential/Comercial 10.1 10.6 11.0 10.7 10.8 11.0 10.3 10.2 9.7 9.7 52.6
21.7 21.5 22.7 21.6 21.6 21.5 22.3 22.2 22.2 18.2 100.0
Gasoline 5.1 5.4 5.6 5.2 5.6 5.7 6.1 6.4 6.2 4.5 24.9Diesel 10.7 9.9 11.2 10.0 10.3 10.2 10.4 10.3 10.2 8.5 46.8Heating Oil 0.4 0.4 0.4 0.4 0.4 0.2 0.1 0.1 0.4 0.3 1.9Aviation Jet 0.5 0.5 0.5 0.5 0.5 0.5 0.6 0.6 0.6 0.2 1.0LPG 1.8 2.1 2.2 2.0 1.9 1.9 1.8 1.7 1.7 1.5 8.4
11.4 12.1 15.3 15.3 14.0 14.1 14.5 12.7 8.6 8.3 100.0
Oil 5.8 4.5 5.9 4.9 4.5 5.0 4.9 4.6 2.9 2.2 26.0Gas 5.7 7.5 9.5 10.4 9.6 9.1 9.5 8.2 5.7 6.1 74.0Gasoline 0.1 0.0 0.3 0.3 0.0 0.2 0.3 0.5 0.4 0.3 3.3Diesel 3.7 2.7 4.3 3.2 3.3 3.6 3.1 2.7 2.0 1.5 17.6Heating Oil 1.4 1.2 0.6 0.5 0.0 0.0 0.0 0.2 0.0 0.0 0.0Aviation Jet 0.1 0.0 0.0 0.1 0.1 0.1 0.1 0.2 0.2 0.1 1.2LPG 0.0 0.0 0.0 0.0 0.0 0.0 0.0 0.0 0.0 0.0 0.0
6.6 6.0 4.6 4.5 4.1 4.6 3.9 6.5 6.9 8.4 100.0
Oil 6.4 5.9 4.6 4.4 4.0 4.5 3.9 6.2 6.7 8.3 99.1Gas 0.2 0.1 0.1 0.1 0.1 0.1 0.1 0.4 0.2 0.1 0.9Gasoline 0.0 0.0 0.0 0.0 0.0 0.0 0.0 0.0 0.0 0.0 0.0Diesel 0.0 0.1 0.1 0.1 0.0 0.0 0.0 0.0 0.0 0.1 1.3Heating Oil 0.0 0.0 0.2 0.2 0.0 0.0 0.4 0.6 0.6 0.7 8.1Aviation Jet 0.0 0.0 0.0 0.0 0.0 0.0 0.0 0.0 0.0 0.0 0.0LPG 1.4 1.0 0.9 1.0 0.9 1.0 1.0 1.2 1.3 0.8 9.0
170.8 172.8 177.7 174.1 180.2 179.1 174.8 171.4 192.2 166.9 -
200.7 205.3 206.1 207.1 208.7 211.8 201.4 202.5 231.9 224.9 -
59.4 59.8 61.9 62.2 62.5 63.0 60.6 62.8 63.5 62.9 -
90.9 94.5 94.6 97.2 96.1 97.5 95.0 94.6 95.3 97.1 -
*Heat is included
Final energy intensity (toe/million $15ppp)
Total energy intensity (toe/million $15ppp)
Natural gas final consumption, by sector
Refined products consumption
Imports
Exports
CO2 Emissions (Million tons CO 2 )
CO2 Intensity (tCO 2 /million $15ppp)
Oil final consumption, by sector
Argentina(Million toe)
Total primary energy demand, by source
Total final consumption, by source
Electricity generation, by source
Total final consumption, by sector
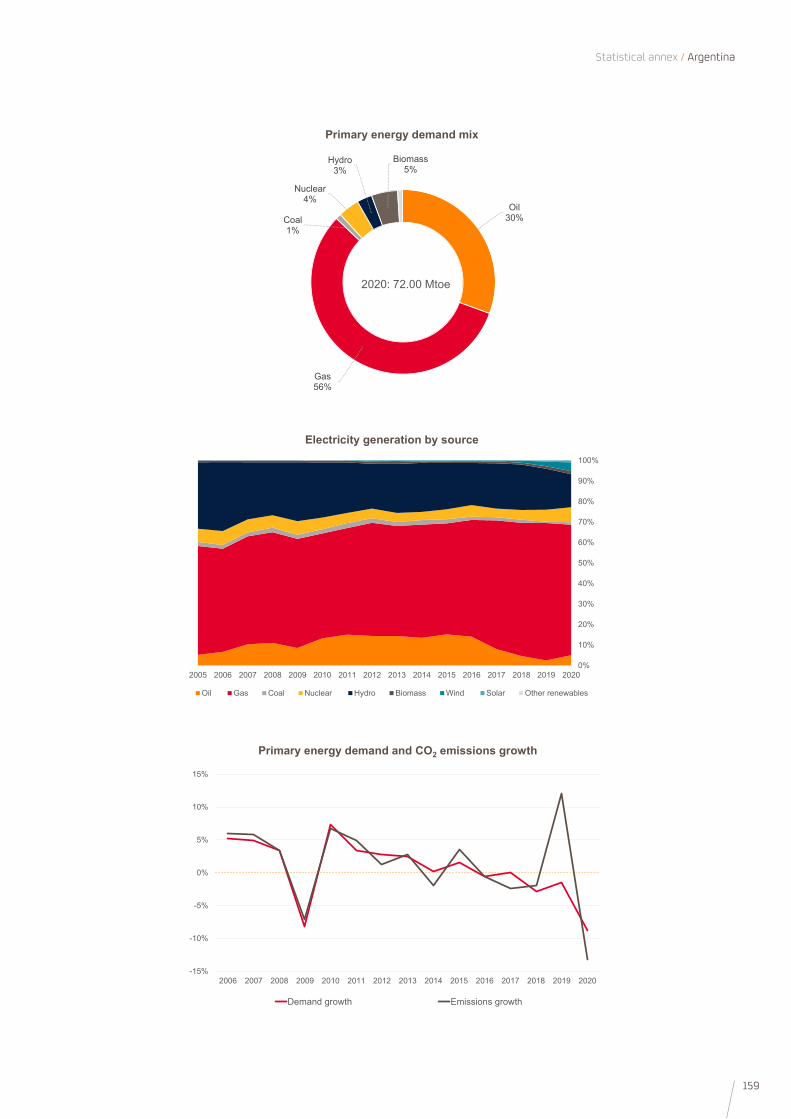
159
Statistical annex / Argentina
0%
10%
20%
30%
40%
50%
60%
70%
80%
90%
100%
2005 2006 2007 2008 2009 2010 2011 2012 2013 2014 2015 2016 2017 2018 2019 2020
Oil Gas Coal Nuclear Hydro Biomass Wind Solar Other renewables
Electricity generation by source
-15%
-10%
-5%
0%
5%
10%
15%
2006 2007 2008 2009 2010 2011 2012 2013 2014 2015 2016 2017 2018 2019 2020
Demand growth Emissions growth
Primary energy demand and CO2 emissions growth
Oil 30%
Gas56%
Coal1%
Nuclear4%
Hydro3%
Biomass5%
2020: 72.00 Mtoe
Primary energy demand mix
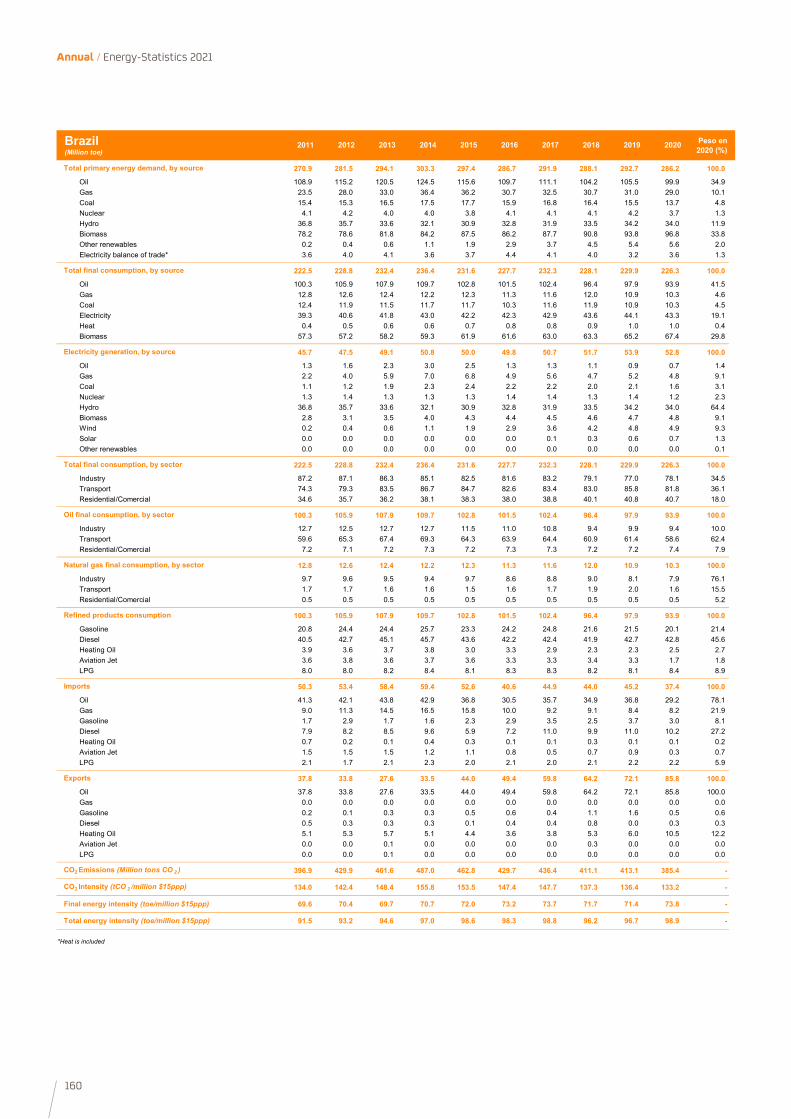
160
Annual / Energy-Statistics 2021
2011 2012 2013 2014 2015 2016 2017 2018 2019 2020 Peso en 2020 (%)
270.9 281.5 294.1 303.3 297.4 286.7 291.9 288.1 292.7 286.2 100.0
Oil 108.9 115.2 120.5 124.5 115.6 109.7 111.1 104.2 105.5 99.9 34.9Gas 23.5 28.0 33.0 36.4 36.2 30.7 32.5 30.7 31.0 29.0 10.1Coal 15.4 15.3 16.5 17.5 17.7 15.9 16.8 16.4 15.5 13.7 4.8Nuclear 4.1 4.2 4.0 4.0 3.8 4.1 4.1 4.1 4.2 3.7 1.3Hydro 36.8 35.7 33.6 32.1 30.9 32.8 31.9 33.5 34.2 34.0 11.9Biomass 78.2 78.6 81.8 84.2 87.5 86.2 87.7 90.8 93.8 96.8 33.8Other renewables 0.2 0.4 0.6 1.1 1.9 2.9 3.7 4.5 5.4 5.6 2.0Electricity balance of trade* 3.6 4.0 4.1 3.6 3.7 4.4 4.1 4.0 3.2 3.6 1.3
222.5 228.8 232.4 236.4 231.6 227.7 232.3 228.1 229.9 226.3 100.0
Oil 100.3 105.9 107.9 109.7 102.8 101.5 102.4 96.4 97.9 93.9 41.5Gas 12.8 12.6 12.4 12.2 12.3 11.3 11.6 12.0 10.9 10.3 4.6Coal 12.4 11.9 11.5 11.7 11.7 10.3 11.6 11.9 10.9 10.3 4.5Electricity 39.3 40.6 41.8 43.0 42.2 42.3 42.9 43.6 44.1 43.3 19.1Heat 0.4 0.5 0.6 0.6 0.7 0.8 0.8 0.9 1.0 1.0 0.4Biomass 57.3 57.2 58.2 59.3 61.9 61.6 63.0 63.3 65.2 67.4 29.8
45.7 47.5 49.1 50.8 50.0 49.8 50.7 51.7 53.9 52.8 100.0
Oil 1.3 1.6 2.3 3.0 2.5 1.3 1.3 1.1 0.9 0.7 1.4Gas 2.2 4.0 5.9 7.0 6.8 4.9 5.6 4.7 5.2 4.8 9.1Coal 1.1 1.2 1.9 2.3 2.4 2.2 2.2 2.0 2.1 1.6 3.1Nuclear 1.3 1.4 1.3 1.3 1.3 1.4 1.4 1.3 1.4 1.2 2.3Hydro 36.8 35.7 33.6 32.1 30.9 32.8 31.9 33.5 34.2 34.0 64.4Biomass 2.8 3.1 3.5 4.0 4.3 4.4 4.5 4.6 4.7 4.8 9.1Wind 0.2 0.4 0.6 1.1 1.9 2.9 3.6 4.2 4.8 4.9 9.3Solar 0.0 0.0 0.0 0.0 0.0 0.0 0.1 0.3 0.6 0.7 1.3Other renewables 0.0 0.0 0.0 0.0 0.0 0.0 0.0 0.0 0.0 0.0 0.1
222.5 228.8 232.4 236.4 231.6 227.7 232.3 228.1 229.9 226.3 100.0
Industry 87.2 87.1 86.3 85.1 82.5 81.6 83.2 79.1 77.0 78.1 34.5Transport 74.3 79.3 83.5 86.7 84.7 82.6 83.4 83.0 85.8 81.8 36.1Residential/Comercial 34.6 35.7 36.2 38.1 38.3 38.0 38.8 40.1 40.8 40.7 18.0
100.3 105.9 107.9 109.7 102.8 101.5 102.4 96.4 97.9 93.9 100.0
Industry 12.7 12.5 12.7 12.7 11.5 11.0 10.8 9.4 9.9 9.4 10.0Transport 59.6 65.3 67.4 69.3 64.3 63.9 64.4 60.9 61.4 58.6 62.4Residential/Comercial 7.2 7.1 7.2 7.3 7.2 7.3 7.3 7.2 7.2 7.4 7.9
12.8 12.6 12.4 12.2 12.3 11.3 11.6 12.0 10.9 10.3 100.0
Industry 9.7 9.6 9.5 9.4 9.7 8.6 8.8 9.0 8.1 7.9 76.1Transport 1.7 1.7 1.6 1.6 1.5 1.6 1.7 1.9 2.0 1.6 15.5Residential/Comercial 0.5 0.5 0.5 0.5 0.5 0.5 0.5 0.5 0.5 0.5 5.2
100.3 105.9 107.9 109.7 102.8 101.5 102.4 96.4 97.9 93.9 100.0
Gasoline 20.8 24.4 24.4 25.7 23.3 24.2 24.8 21.6 21.5 20.1 21.4Diesel 40.5 42.7 45.1 45.7 43.6 42.2 42.4 41.9 42.7 42.8 45.6Heating Oil 3.9 3.6 3.7 3.8 3.0 3.3 2.9 2.3 2.3 2.5 2.7Aviation Jet 3.6 3.8 3.6 3.7 3.6 3.3 3.3 3.4 3.3 1.7 1.8LPG 8.0 8.0 8.2 8.4 8.1 8.3 8.3 8.2 8.1 8.4 8.9
50.3 53.4 58.4 59.4 52.6 40.6 44.9 44.0 45.2 37.4 100.0
Oil 41.3 42.1 43.8 42.9 36.8 30.5 35.7 34.9 36.8 29.2 78.1Gas 9.0 11.3 14.5 16.5 15.8 10.0 9.2 9.1 8.4 8.2 21.9Gasoline 1.7 2.9 1.7 1.6 2.3 2.9 3.5 2.5 3.7 3.0 8.1Diesel 7.9 8.2 8.5 9.6 5.9 7.2 11.0 9.9 11.0 10.2 27.2Heating Oil 0.7 0.2 0.1 0.4 0.3 0.1 0.1 0.3 0.1 0.1 0.2Aviation Jet 1.5 1.5 1.5 1.2 1.1 0.8 0.5 0.7 0.9 0.3 0.7LPG 2.1 1.7 2.1 2.3 2.0 2.1 2.0 2.1 2.2 2.2 5.9
37.8 33.8 27.6 33.5 44.0 49.4 59.8 64.2 72.1 85.8 100.0
Oil 37.8 33.8 27.6 33.5 44.0 49.4 59.8 64.2 72.1 85.8 100.0Gas 0.0 0.0 0.0 0.0 0.0 0.0 0.0 0.0 0.0 0.0 0.0Gasoline 0.2 0.1 0.3 0.3 0.5 0.6 0.4 1.1 1.6 0.5 0.6Diesel 0.5 0.3 0.3 0.3 0.1 0.4 0.4 0.8 0.0 0.3 0.3Heating Oil 5.1 5.3 5.7 5.1 4.4 3.6 3.8 5.3 6.0 10.5 12.2Aviation Jet 0.0 0.0 0.1 0.0 0.0 0.0 0.0 0.3 0.0 0.0 0.0LPG 0.0 0.0 0.1 0.0 0.0 0.0 0.0 0.0 0.0 0.0 0.0
396.9 429.9 461.6 487.0 462.8 429.7 436.4 411.1 413.1 385.4 -
134.0 142.4 148.4 155.8 153.5 147.4 147.7 137.3 136.4 133.2 -
69.6 70.4 69.7 70.7 72.0 73.2 73.7 71.7 71.4 73.8 -
91.5 93.2 94.6 97.0 98.6 98.3 98.8 96.2 96.7 98.9 -
*Heat is included
Final energy intensity (toe/million $15ppp)
Total energy intensity (toe/million $15ppp)
Natural gas final consumption, by sector
Refined products consumption
Imports
Exports
CO2 Emissions (Million tons CO 2 )
CO2 Intensity (tCO 2 /million $15ppp)
Oil final consumption, by sector
Brazil(Million toe)
Total primary energy demand, by source
Total final consumption, by source
Electricity generation, by source
Total final consumption, by sector
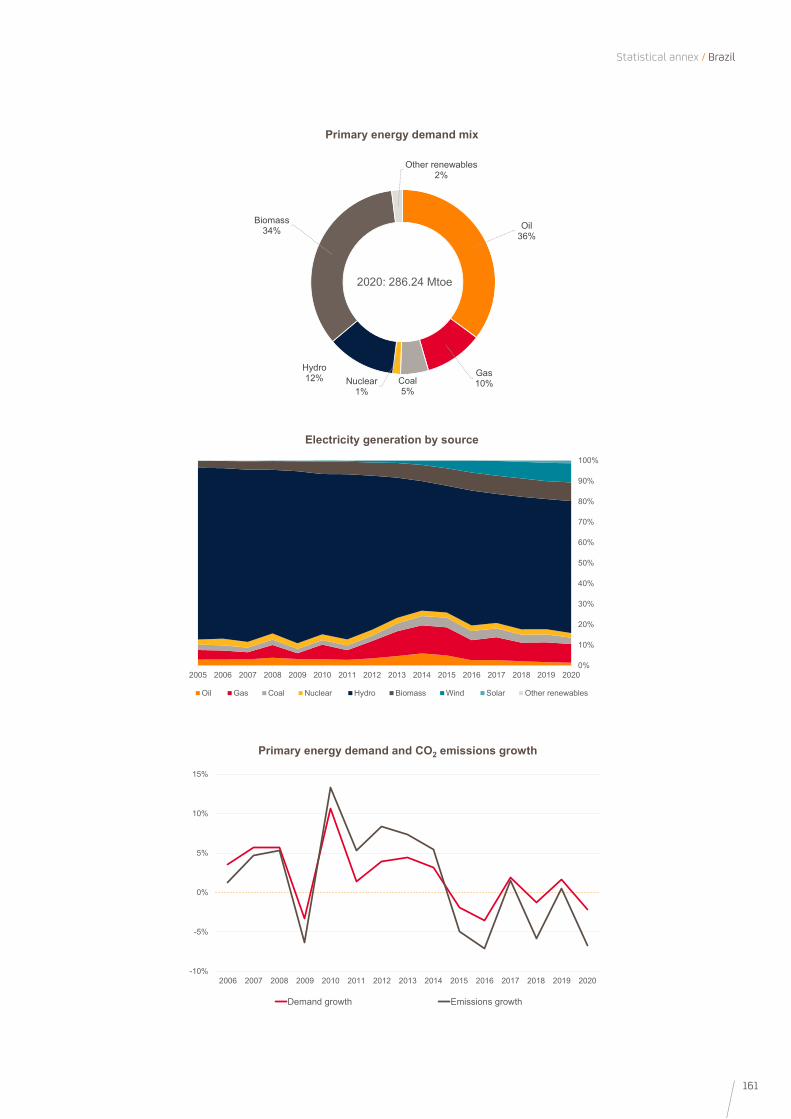
161
Statistical annex / Brazil
0%
10%
20%
30%
40%
50%
60%
70%
80%
90%
100%
2005 2006 2007 2008 2009 2010 2011 2012 2013 2014 2015 2016 2017 2018 2019 2020
Oil Gas Coal Nuclear Hydro Biomass Wind Solar Other renewables
Electricity generation by source
-10%
-5%
0%
5%
10%
15%
2006 2007 2008 2009 2010 2011 2012 2013 2014 2015 2016 2017 2018 2019 2020
Demand growth Emissions growth
Primary energy demand and CO2 emissions growth
Oil 36%
Gas10%Coal
5%Nuclear
1%
Hydro12%
Biomass34%
Other renewables2%
2020: 286.24 Mtoe
Primary energy demand mix
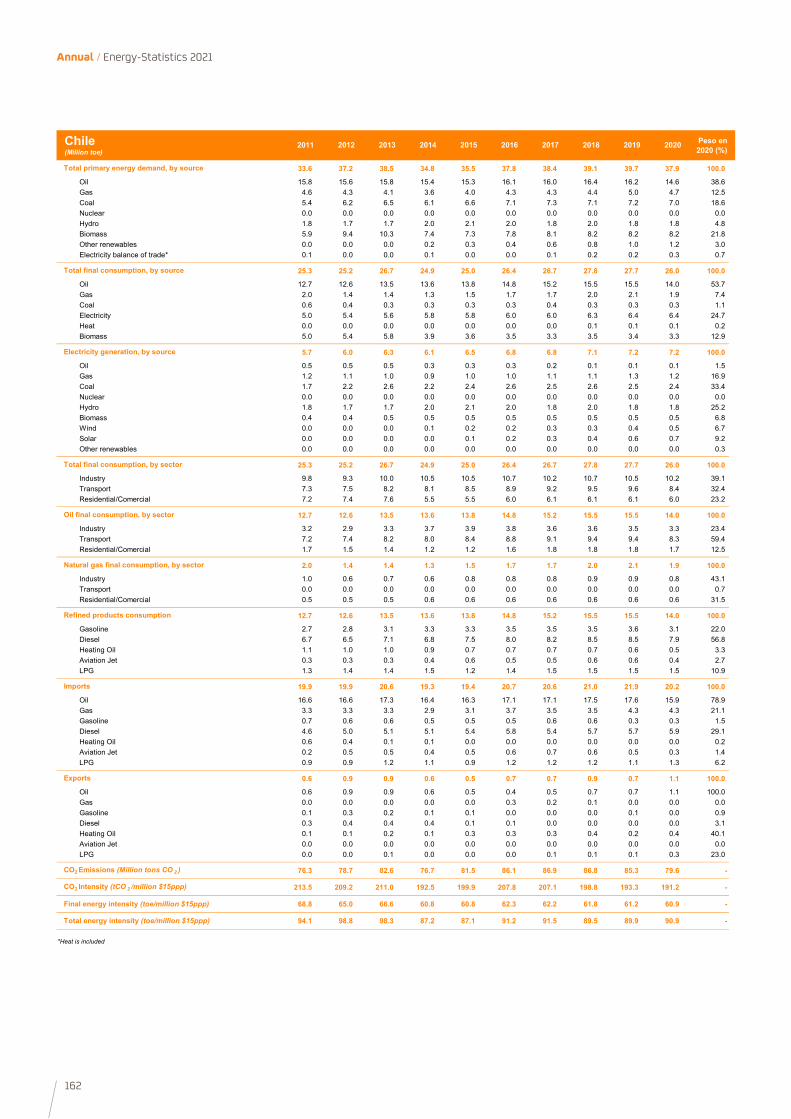
162
Annual / Energy-Statistics 2021
2011 2012 2013 2014 2015 2016 2017 2018 2019 2020 Peso en 2020 (%)
33.6 37.2 38.5 34.8 35.5 37.8 38.4 39.1 39.7 37.9 100.0
Oil 15.8 15.6 15.8 15.4 15.3 16.1 16.0 16.4 16.2 14.6 38.6Gas 4.6 4.3 4.1 3.6 4.0 4.3 4.3 4.4 5.0 4.7 12.5Coal 5.4 6.2 6.5 6.1 6.6 7.1 7.3 7.1 7.2 7.0 18.6Nuclear 0.0 0.0 0.0 0.0 0.0 0.0 0.0 0.0 0.0 0.0 0.0Hydro 1.8 1.7 1.7 2.0 2.1 2.0 1.8 2.0 1.8 1.8 4.8Biomass 5.9 9.4 10.3 7.4 7.3 7.8 8.1 8.2 8.2 8.2 21.8Other renewables 0.0 0.0 0.0 0.2 0.3 0.4 0.6 0.8 1.0 1.2 3.0Electricity balance of trade* 0.1 0.0 0.0 0.1 0.0 0.0 0.1 0.2 0.2 0.3 0.7
25.3 25.2 26.7 24.9 25.0 26.4 26.7 27.8 27.7 26.0 100.0
Oil 12.7 12.6 13.5 13.6 13.8 14.8 15.2 15.5 15.5 14.0 53.7Gas 2.0 1.4 1.4 1.3 1.5 1.7 1.7 2.0 2.1 1.9 7.4Coal 0.6 0.4 0.3 0.3 0.3 0.3 0.4 0.3 0.3 0.3 1.1Electricity 5.0 5.4 5.6 5.8 5.8 6.0 6.0 6.3 6.4 6.4 24.7Heat 0.0 0.0 0.0 0.0 0.0 0.0 0.0 0.1 0.1 0.1 0.2Biomass 5.0 5.4 5.8 3.9 3.6 3.5 3.3 3.5 3.4 3.3 12.9
5.7 6.0 6.3 6.1 6.5 6.8 6.8 7.1 7.2 7.2 100.0
Oil 0.5 0.5 0.5 0.3 0.3 0.3 0.2 0.1 0.1 0.1 1.5Gas 1.2 1.1 1.0 0.9 1.0 1.0 1.1 1.1 1.3 1.2 16.9Coal 1.7 2.2 2.6 2.2 2.4 2.6 2.5 2.6 2.5 2.4 33.4Nuclear 0.0 0.0 0.0 0.0 0.0 0.0 0.0 0.0 0.0 0.0 0.0Hydro 1.8 1.7 1.7 2.0 2.1 2.0 1.8 2.0 1.8 1.8 25.2Biomass 0.4 0.4 0.5 0.5 0.5 0.5 0.5 0.5 0.5 0.5 6.8Wind 0.0 0.0 0.0 0.1 0.2 0.2 0.3 0.3 0.4 0.5 6.7Solar 0.0 0.0 0.0 0.0 0.1 0.2 0.3 0.4 0.6 0.7 9.2Other renewables 0.0 0.0 0.0 0.0 0.0 0.0 0.0 0.0 0.0 0.0 0.3
25.3 25.2 26.7 24.9 25.0 26.4 26.7 27.8 27.7 26.0 100.0
Industry 9.8 9.3 10.0 10.5 10.5 10.7 10.2 10.7 10.5 10.2 39.1Transport 7.3 7.5 8.2 8.1 8.5 8.9 9.2 9.5 9.6 8.4 32.4Residential/Comercial 7.2 7.4 7.6 5.5 5.5 6.0 6.1 6.1 6.1 6.0 23.2
12.7 12.6 13.5 13.6 13.8 14.8 15.2 15.5 15.5 14.0 100.0
Industry 3.2 2.9 3.3 3.7 3.9 3.8 3.6 3.6 3.5 3.3 23.4Transport 7.2 7.4 8.2 8.0 8.4 8.8 9.1 9.4 9.4 8.3 59.4Residential/Comercial 1.7 1.5 1.4 1.2 1.2 1.6 1.8 1.8 1.8 1.7 12.5
2.0 1.4 1.4 1.3 1.5 1.7 1.7 2.0 2.1 1.9 100.0
Industry 1.0 0.6 0.7 0.6 0.8 0.8 0.8 0.9 0.9 0.8 43.1Transport 0.0 0.0 0.0 0.0 0.0 0.0 0.0 0.0 0.0 0.0 0.7Residential/Comercial 0.5 0.5 0.5 0.6 0.6 0.6 0.6 0.6 0.6 0.6 31.5
12.7 12.6 13.5 13.6 13.8 14.8 15.2 15.5 15.5 14.0 100.0
Gasoline 2.7 2.8 3.1 3.3 3.3 3.5 3.5 3.5 3.6 3.1 22.0Diesel 6.7 6.5 7.1 6.8 7.5 8.0 8.2 8.5 8.5 7.9 56.8Heating Oil 1.1 1.0 1.0 0.9 0.7 0.7 0.7 0.7 0.6 0.5 3.3Aviation Jet 0.3 0.3 0.3 0.4 0.6 0.5 0.5 0.6 0.6 0.4 2.7LPG 1.3 1.4 1.4 1.5 1.2 1.4 1.5 1.5 1.5 1.5 10.9
19.9 19.9 20.6 19.3 19.4 20.7 20.6 21.0 21.9 20.2 100.0
Oil 16.6 16.6 17.3 16.4 16.3 17.1 17.1 17.5 17.6 15.9 78.9Gas 3.3 3.3 3.3 2.9 3.1 3.7 3.5 3.5 4.3 4.3 21.1Gasoline 0.7 0.6 0.6 0.5 0.5 0.5 0.6 0.6 0.3 0.3 1.5Diesel 4.6 5.0 5.1 5.1 5.4 5.8 5.4 5.7 5.7 5.9 29.1Heating Oil 0.6 0.4 0.1 0.1 0.0 0.0 0.0 0.0 0.0 0.0 0.2Aviation Jet 0.2 0.5 0.5 0.4 0.5 0.6 0.7 0.6 0.5 0.3 1.4LPG 0.9 0.9 1.2 1.1 0.9 1.2 1.2 1.2 1.1 1.3 6.2
0.6 0.9 0.9 0.6 0.5 0.7 0.7 0.9 0.7 1.1 100.0
Oil 0.6 0.9 0.9 0.6 0.5 0.4 0.5 0.7 0.7 1.1 100.0Gas 0.0 0.0 0.0 0.0 0.0 0.3 0.2 0.1 0.0 0.0 0.0Gasoline 0.1 0.3 0.2 0.1 0.1 0.0 0.0 0.0 0.1 0.0 0.9Diesel 0.3 0.4 0.4 0.4 0.1 0.1 0.0 0.0 0.0 0.0 3.1Heating Oil 0.1 0.1 0.2 0.1 0.3 0.3 0.3 0.4 0.2 0.4 40.1Aviation Jet 0.0 0.0 0.0 0.0 0.0 0.0 0.0 0.0 0.0 0.0 0.0LPG 0.0 0.0 0.1 0.0 0.0 0.0 0.1 0.1 0.1 0.3 23.0
76.3 78.7 82.6 76.7 81.5 86.1 86.9 86.8 85.3 79.6 -
213.5 209.2 211.0 192.5 199.9 207.8 207.1 198.8 193.3 191.2 -
68.8 65.0 66.6 60.8 60.8 62.3 62.2 61.8 61.2 60.9 -
94.1 98.8 98.3 87.2 87.1 91.2 91.5 89.5 89.9 90.9 -
*Heat is included
Final energy intensity (toe/million $15ppp)
Total energy intensity (toe/million $15ppp)
Natural gas final consumption, by sector
Refined products consumption
Imports
Exports
CO2 Emissions (Million tons CO 2 )
CO2 Intensity (tCO 2 /million $15ppp)
Oil final consumption, by sector
Chile(Million toe)
Total primary energy demand, by source
Total final consumption, by source
Electricity generation, by source
Total final consumption, by sector
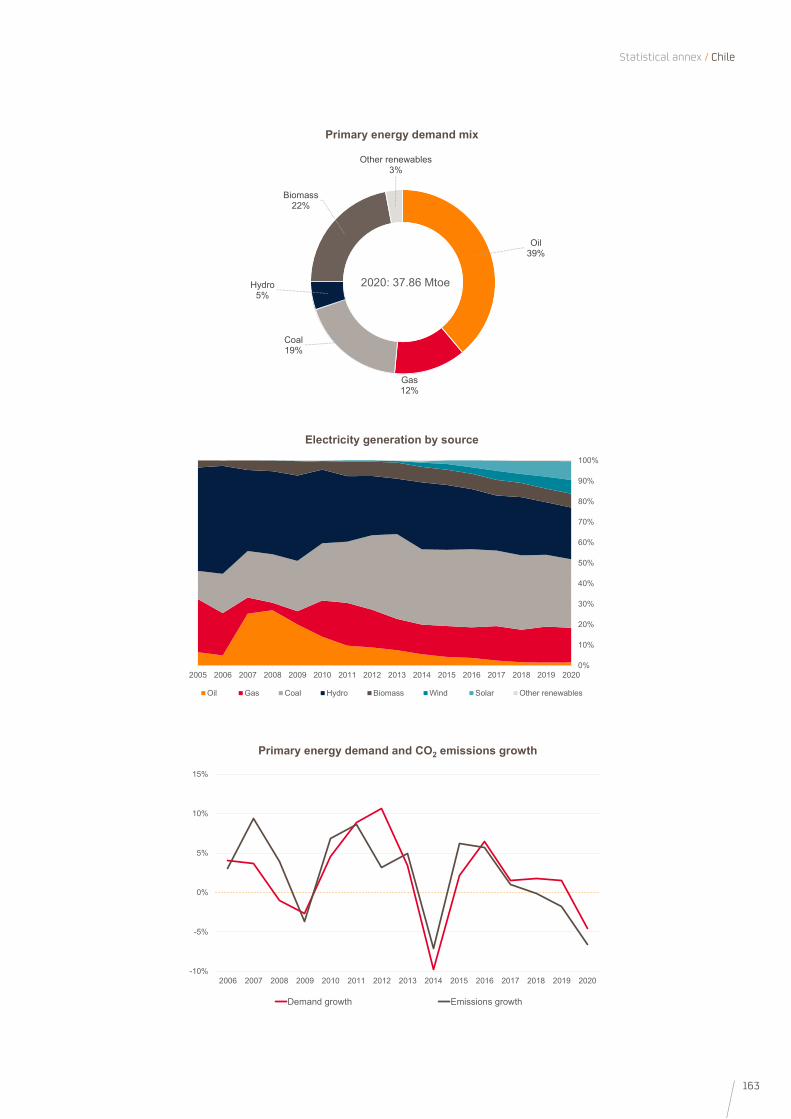
163
Statistical annex / Chile
0%
10%
20%
30%
40%
50%
60%
70%
80%
90%
100%
2005 2006 2007 2008 2009 2010 2011 2012 2013 2014 2015 2016 2017 2018 2019 2020
Oil Gas Coal Hydro Biomass Wind Solar Other renewables
Electricity generation by source
-10%
-5%
0%
5%
10%
15%
2006 2007 2008 2009 2010 2011 2012 2013 2014 2015 2016 2017 2018 2019 2020
Demand growth Emissions growth
Primary energy demand and CO2 emissions growth
Oil 39%
Gas12%
Coal19%
Hydro5%
Biomass22%
Other renewables3%
2020: 37.86 Mtoe
Primary energy demand mix
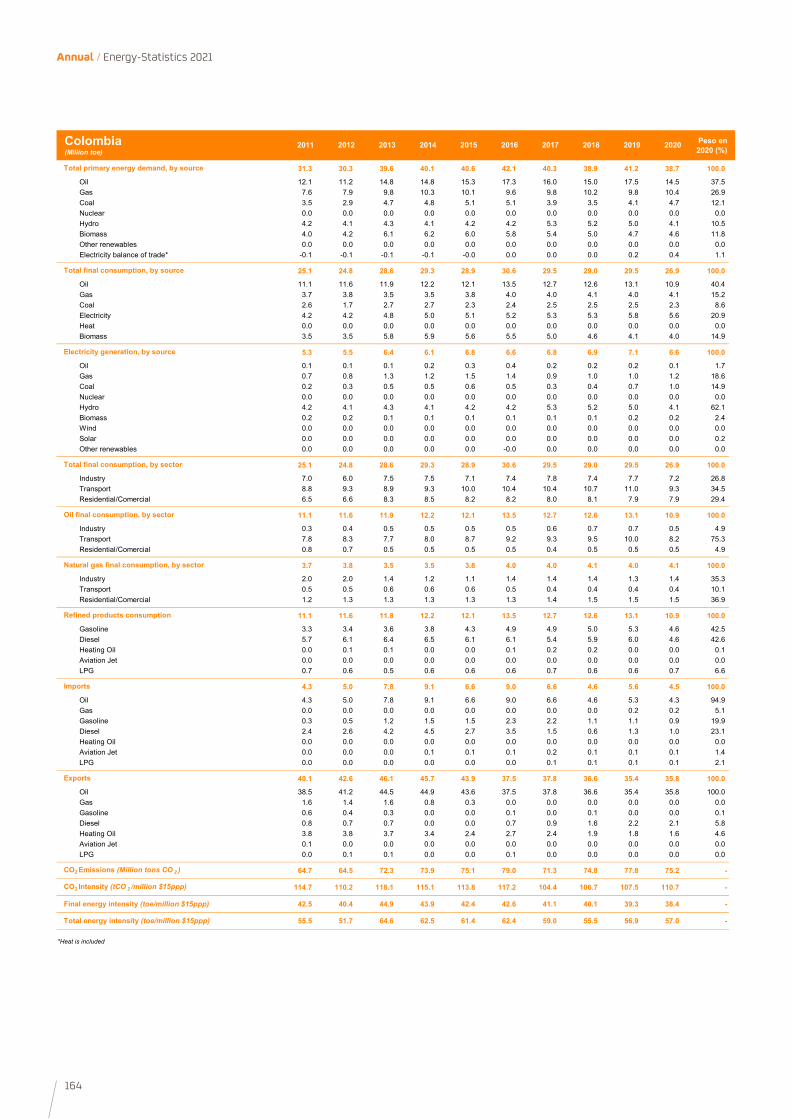
164
Annual / Energy-Statistics 2021
2011 2012 2013 2014 2015 2016 2017 2018 2019 2020 Peso en 2020 (%)
31.3 30.3 39.6 40.1 40.6 42.1 40.3 38.9 41.2 38.7 100.0
Oil 12.1 11.2 14.8 14.8 15.3 17.3 16.0 15.0 17.5 14.5 37.5Gas 7.6 7.9 9.8 10.3 10.1 9.6 9.8 10.2 9.8 10.4 26.9Coal 3.5 2.9 4.7 4.8 5.1 5.1 3.9 3.5 4.1 4.7 12.1Nuclear 0.0 0.0 0.0 0.0 0.0 0.0 0.0 0.0 0.0 0.0 0.0Hydro 4.2 4.1 4.3 4.1 4.2 4.2 5.3 5.2 5.0 4.1 10.5Biomass 4.0 4.2 6.1 6.2 6.0 5.8 5.4 5.0 4.7 4.6 11.8Other renewables 0.0 0.0 0.0 0.0 0.0 0.0 0.0 0.0 0.0 0.0 0.0Electricity balance of trade* -0.1 -0.1 -0.1 -0.1 -0.0 0.0 0.0 0.0 0.2 0.4 1.1
25.1 24.8 28.6 29.3 28.9 30.6 29.5 29.0 29.5 26.9 100.0
Oil 11.1 11.6 11.9 12.2 12.1 13.5 12.7 12.6 13.1 10.9 40.4Gas 3.7 3.8 3.5 3.5 3.8 4.0 4.0 4.1 4.0 4.1 15.2Coal 2.6 1.7 2.7 2.7 2.3 2.4 2.5 2.5 2.5 2.3 8.6Electricity 4.2 4.2 4.8 5.0 5.1 5.2 5.3 5.3 5.8 5.6 20.9Heat 0.0 0.0 0.0 0.0 0.0 0.0 0.0 0.0 0.0 0.0 0.0Biomass 3.5 3.5 5.8 5.9 5.6 5.5 5.0 4.6 4.1 4.0 14.9
5.3 5.5 6.4 6.1 6.8 6.6 6.8 6.9 7.1 6.6 100.0
Oil 0.1 0.1 0.1 0.2 0.3 0.4 0.2 0.2 0.2 0.1 1.7Gas 0.7 0.8 1.3 1.2 1.5 1.4 0.9 1.0 1.0 1.2 18.6Coal 0.2 0.3 0.5 0.5 0.6 0.5 0.3 0.4 0.7 1.0 14.9Nuclear 0.0 0.0 0.0 0.0 0.0 0.0 0.0 0.0 0.0 0.0 0.0Hydro 4.2 4.1 4.3 4.1 4.2 4.2 5.3 5.2 5.0 4.1 62.1Biomass 0.2 0.2 0.1 0.1 0.1 0.1 0.1 0.1 0.2 0.2 2.4Wind 0.0 0.0 0.0 0.0 0.0 0.0 0.0 0.0 0.0 0.0 0.0Solar 0.0 0.0 0.0 0.0 0.0 0.0 0.0 0.0 0.0 0.0 0.2Other renewables 0.0 0.0 0.0 0.0 0.0 -0.0 0.0 0.0 0.0 0.0 0.0
25.1 24.8 28.6 29.3 28.9 30.6 29.5 29.0 29.5 26.9 100.0
Industry 7.0 6.0 7.5 7.5 7.1 7.4 7.8 7.4 7.7 7.2 26.8Transport 8.8 9.3 8.9 9.3 10.0 10.4 10.4 10.7 11.0 9.3 34.5Residential/Comercial 6.5 6.6 8.3 8.5 8.2 8.2 8.0 8.1 7.9 7.9 29.4
11.1 11.6 11.9 12.2 12.1 13.5 12.7 12.6 13.1 10.9 100.0
Industry 0.3 0.4 0.5 0.5 0.5 0.5 0.6 0.7 0.7 0.5 4.9Transport 7.8 8.3 7.7 8.0 8.7 9.2 9.3 9.5 10.0 8.2 75.3Residential/Comercial 0.8 0.7 0.5 0.5 0.5 0.5 0.4 0.5 0.5 0.5 4.9
3.7 3.8 3.5 3.5 3.8 4.0 4.0 4.1 4.0 4.1 100.0
Industry 2.0 2.0 1.4 1.2 1.1 1.4 1.4 1.4 1.3 1.4 35.3Transport 0.5 0.5 0.6 0.6 0.6 0.5 0.4 0.4 0.4 0.4 10.1Residential/Comercial 1.2 1.3 1.3 1.3 1.3 1.3 1.4 1.5 1.5 1.5 36.9
11.1 11.6 11.8 12.2 12.1 13.5 12.7 12.6 13.1 10.9 100.0
Gasoline 3.3 3.4 3.6 3.8 4.3 4.9 4.9 5.0 5.3 4.6 42.5Diesel 5.7 6.1 6.4 6.5 6.1 6.1 5.4 5.9 6.0 4.6 42.6Heating Oil 0.0 0.1 0.1 0.0 0.0 0.1 0.2 0.2 0.0 0.0 0.1Aviation Jet 0.0 0.0 0.0 0.0 0.0 0.0 0.0 0.0 0.0 0.0 0.0LPG 0.7 0.6 0.5 0.6 0.6 0.6 0.7 0.6 0.6 0.7 6.6
4.3 5.0 7.8 9.1 6.6 9.0 6.6 4.6 5.6 4.5 100.0
Oil 4.3 5.0 7.8 9.1 6.6 9.0 6.6 4.6 5.3 4.3 94.9Gas 0.0 0.0 0.0 0.0 0.0 0.0 0.0 0.0 0.2 0.2 5.1Gasoline 0.3 0.5 1.2 1.5 1.5 2.3 2.2 1.1 1.1 0.9 19.9Diesel 2.4 2.6 4.2 4.5 2.7 3.5 1.5 0.6 1.3 1.0 23.1Heating Oil 0.0 0.0 0.0 0.0 0.0 0.0 0.0 0.0 0.0 0.0 0.0Aviation Jet 0.0 0.0 0.0 0.1 0.1 0.1 0.2 0.1 0.1 0.1 1.4LPG 0.0 0.0 0.0 0.0 0.0 0.0 0.1 0.1 0.1 0.1 2.1
40.1 42.6 46.1 45.7 43.9 37.5 37.8 36.6 35.4 35.8 100.0
Oil 38.5 41.2 44.5 44.9 43.6 37.5 37.8 36.6 35.4 35.8 100.0Gas 1.6 1.4 1.6 0.8 0.3 0.0 0.0 0.0 0.0 0.0 0.0Gasoline 0.6 0.4 0.3 0.0 0.0 0.1 0.0 0.1 0.0 0.0 0.1Diesel 0.8 0.7 0.7 0.0 0.0 0.7 0.9 1.6 2.2 2.1 5.8Heating Oil 3.8 3.8 3.7 3.4 2.4 2.7 2.4 1.9 1.8 1.6 4.6Aviation Jet 0.1 0.0 0.0 0.0 0.0 0.0 0.0 0.0 0.0 0.0 0.0LPG 0.0 0.1 0.1 0.0 0.0 0.1 0.0 0.0 0.0 0.0 0.0
64.7 64.5 72.3 73.9 75.1 79.0 71.3 74.8 77.8 75.2 -
114.7 110.2 118.1 115.1 113.8 117.2 104.4 106.7 107.5 110.7 -
42.5 40.4 44.9 43.9 42.4 42.6 41.1 40.1 39.3 38.4 -
55.5 51.7 64.6 62.5 61.4 62.4 59.0 55.5 56.9 57.0 -
*Heat is included
Final energy intensity (toe/million $15ppp)
Total energy intensity (toe/million $15ppp)
Natural gas final consumption, by sector
Refined products consumption
Imports
Exports
CO2 Emissions (Million tons CO 2 )
CO2 Intensity (tCO 2 /million $15ppp)
Oil final consumption, by sector
Colombia(Million toe)
Total primary energy demand, by source
Total final consumption, by source
Electricity generation, by source
Total final consumption, by sector
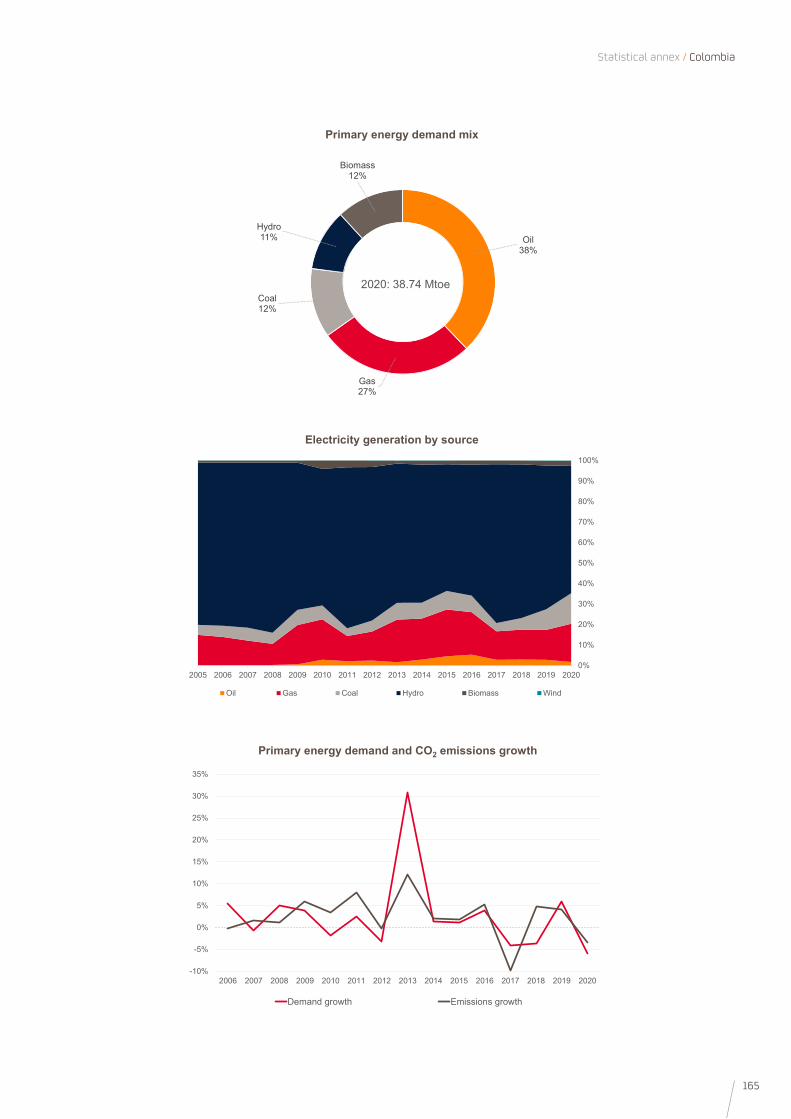
165
Statistical annex / Colombia
0%
10%
20%
30%
40%
50%
60%
70%
80%
90%
100%
2005 2006 2007 2008 2009 2010 2011 2012 2013 2014 2015 2016 2017 2018 2019 2020
Oil Gas Coal Hydro Biomass Wind
Electricity generation by source
-10%
-5%
0%
5%
10%
15%
20%
25%
30%
35%
2006 2007 2008 2009 2010 2011 2012 2013 2014 2015 2016 2017 2018 2019 2020
Demand growth Emissions growth
Primary energy demand and CO2 emissions growth
Oil 38%
Gas27%
Coal12%
Hydro11%
Biomass12%
2020: 38.74 Mtoe
Primary energy demand mix
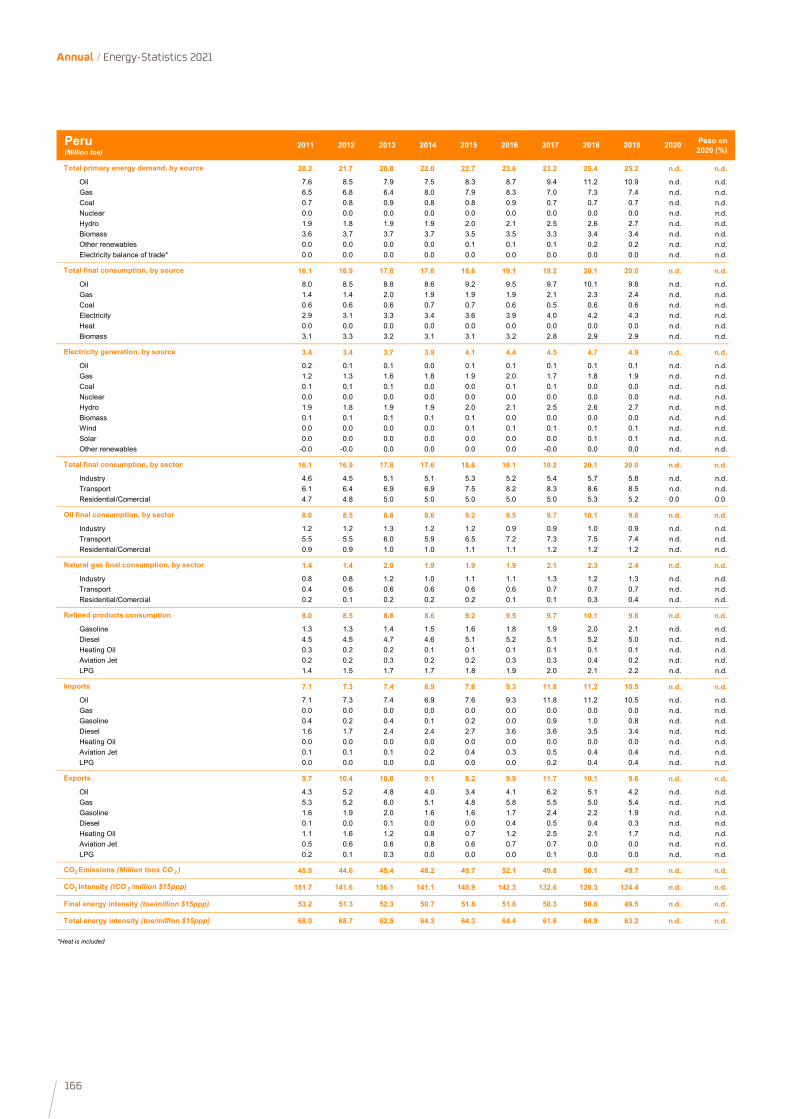
166
Annual / Energy-Statistics 2021
2011 2012 2013 2014 2015 2016 2017 2018 2019 2020 Peso en 2020 (%)
20.2 21.7 20.8 22.0 22.7 23.6 23.2 25.4 25.2 n.d. n.d.
Oil 7.6 8.5 7.9 7.5 8.3 8.7 9.4 11.2 10.9 n.d. n.d.Gas 6.5 6.8 6.4 8.0 7.9 8.3 7.0 7.3 7.4 n.d. n.d.Coal 0.7 0.8 0.9 0.8 0.8 0.9 0.7 0.7 0.7 n.d. n.d.Nuclear 0.0 0.0 0.0 0.0 0.0 0.0 0.0 0.0 0.0 n.d. n.d.Hydro 1.9 1.8 1.9 1.9 2.0 2.1 2.5 2.6 2.7 n.d. n.d.Biomass 3.6 3.7 3.7 3.7 3.5 3.5 3.3 3.4 3.4 n.d. n.d.Other renewables 0.0 0.0 0.0 0.0 0.1 0.1 0.1 0.2 0.2 n.d. n.d.Electricity balance of trade* 0.0 0.0 0.0 0.0 0.0 0.0 0.0 0.0 0.0 n.d. n.d.
16.1 16.9 17.8 17.6 18.6 19.1 19.2 20.1 20.0 n.d. n.d.
Oil 8.0 8.5 8.8 8.6 9.2 9.5 9.7 10.1 9.8 n.d. n.d.Gas 1.4 1.4 2.0 1.9 1.9 1.9 2.1 2.3 2.4 n.d. n.d.Coal 0.6 0.6 0.6 0.7 0.7 0.6 0.5 0.6 0.6 n.d. n.d.Electricity 2.9 3.1 3.3 3.4 3.6 3.9 4.0 4.2 4.3 n.d. n.d.Heat 0.0 0.0 0.0 0.0 0.0 0.0 0.0 0.0 0.0 n.d. n.d.Biomass 3.1 3.3 3.2 3.1 3.1 3.2 2.8 2.9 2.9 n.d. n.d.
3.4 3.4 3.7 3.9 4.1 4.4 4.5 4.7 4.9 n.d. n.d.
Oil 0.2 0.1 0.1 0.0 0.1 0.1 0.1 0.1 0.1 n.d. n.d.Gas 1.2 1.3 1.6 1.8 1.9 2.0 1.7 1.8 1.9 n.d. n.d.Coal 0.1 0.1 0.1 0.0 0.0 0.1 0.1 0.0 0.0 n.d. n.d.Nuclear 0.0 0.0 0.0 0.0 0.0 0.0 0.0 0.0 0.0 n.d. n.d.Hydro 1.9 1.8 1.9 1.9 2.0 2.1 2.5 2.6 2.7 n.d. n.d.Biomass 0.1 0.1 0.1 0.1 0.1 0.0 0.0 0.0 0.0 n.d. n.d.Wind 0.0 0.0 0.0 0.0 0.1 0.1 0.1 0.1 0.1 n.d. n.d.Solar 0.0 0.0 0.0 0.0 0.0 0.0 0.0 0.1 0.1 n.d. n.d.Other renewables -0.0 -0.0 0.0 0.0 0.0 0.0 -0.0 0.0 0.0 n.d. n.d.
16.1 16.9 17.8 17.6 18.6 19.1 19.2 20.1 20.0 n.d. n.d.
Industry 4.6 4.5 5.1 5.1 5.3 5.2 5.4 5.7 5.8 n.d. n.d.Transport 6.1 6.4 6.9 6.9 7.5 8.2 8.3 8.6 8.5 n.d. n.d.Residential/Comercial 4.7 4.8 5.0 5.0 5.0 5.0 5.0 5.3 5.2 0.0 0.0
8.0 8.5 8.8 8.6 9.2 9.5 9.7 10.1 9.8 n.d. n.d.
Industry 1.2 1.2 1.3 1.2 1.2 0.9 0.9 1.0 0.9 n.d. n.d.Transport 5.5 5.5 6.0 5.9 6.5 7.2 7.3 7.5 7.4 n.d. n.d.Residential/Comercial 0.9 0.9 1.0 1.0 1.1 1.1 1.2 1.2 1.2 n.d. n.d.
1.4 1.4 2.0 1.9 1.9 1.9 2.1 2.3 2.4 n.d. n.d.
Industry 0.8 0.8 1.2 1.0 1.1 1.1 1.3 1.2 1.3 n.d. n.d.Transport 0.4 0.6 0.6 0.6 0.6 0.6 0.7 0.7 0.7 n.d. n.d.Residential/Comercial 0.2 0.1 0.2 0.2 0.2 0.1 0.1 0.3 0.4 n.d. n.d.
8.0 8.5 8.8 8.6 9.2 9.5 9.7 10.1 9.8 n.d. n.d.
Gasoline 1.3 1.3 1.4 1.5 1.6 1.8 1.9 2.0 2.1 n.d. n.d.Diesel 4.5 4.5 4.7 4.6 5.1 5.2 5.1 5.2 5.0 n.d. n.d.Heating Oil 0.3 0.2 0.2 0.1 0.1 0.1 0.1 0.1 0.1 n.d. n.d.Aviation Jet 0.2 0.2 0.3 0.2 0.2 0.3 0.3 0.4 0.2 n.d. n.d.LPG 1.4 1.5 1.7 1.7 1.8 1.9 2.0 2.1 2.2 n.d. n.d.
7.1 7.3 7.4 6.9 7.6 9.3 11.8 11.2 10.5 n.d. n.d.
Oil 7.1 7.3 7.4 6.9 7.6 9.3 11.8 11.2 10.5 n.d. n.d.Gas 0.0 0.0 0.0 0.0 0.0 0.0 0.0 0.0 0.0 n.d. n.d.Gasoline 0.4 0.2 0.4 0.1 0.2 0.0 0.9 1.0 0.8 n.d. n.d.Diesel 1.6 1.7 2.4 2.4 2.7 3.6 3.6 3.5 3.4 n.d. n.d.Heating Oil 0.0 0.0 0.0 0.0 0.0 0.0 0.0 0.0 0.0 n.d. n.d.Aviation Jet 0.1 0.1 0.1 0.2 0.4 0.3 0.5 0.4 0.4 n.d. n.d.LPG 0.0 0.0 0.0 0.0 0.0 0.0 0.2 0.4 0.4 n.d. n.d.
9.7 10.4 10.8 9.1 8.2 9.9 11.7 10.1 9.6 n.d. n.d.
Oil 4.3 5.2 4.8 4.0 3.4 4.1 6.2 5.1 4.2 n.d. n.d.Gas 5.3 5.2 6.0 5.1 4.8 5.8 5.5 5.0 5.4 n.d. n.d.Gasoline 1.6 1.9 2.0 1.6 1.6 1.7 2.4 2.2 1.9 n.d. n.d.Diesel 0.1 0.0 0.1 0.0 0.0 0.4 0.5 0.4 0.3 n.d. n.d.Heating Oil 1.1 1.6 1.2 0.8 0.7 1.2 2.5 2.1 1.7 n.d. n.d.Aviation Jet 0.5 0.6 0.6 0.8 0.6 0.7 0.7 0.0 0.0 n.d. n.d.LPG 0.2 0.1 0.3 0.0 0.0 0.0 0.1 0.0 0.0 n.d. n.d.
45.0 44.6 45.4 48.2 49.7 52.1 49.8 50.1 49.7 n.d. n.d.
151.7 141.6 136.1 141.1 140.9 142.3 132.6 128.3 124.4 n.d. n.d.
53.2 51.3 52.3 50.7 51.8 51.6 50.3 50.6 49.5 n.d. n.d.
68.0 68.7 62.5 64.3 64.3 64.4 61.6 64.9 63.2 n.d. n.d.
*Heat is included
Final energy intensity (toe/million $15ppp)
Total energy intensity (toe/million $15ppp)
Natural gas final consumption, by sector
Refined products consumption
Imports
Exports
CO2 Emissions (Million tons CO 2 )
CO2 Intensity (tCO 2 /million $15ppp)
Oil final consumption, by sector
Peru(Million toe)
Total primary energy demand, by source
Total final consumption, by source
Electricity generation, by source
Total final consumption, by sector
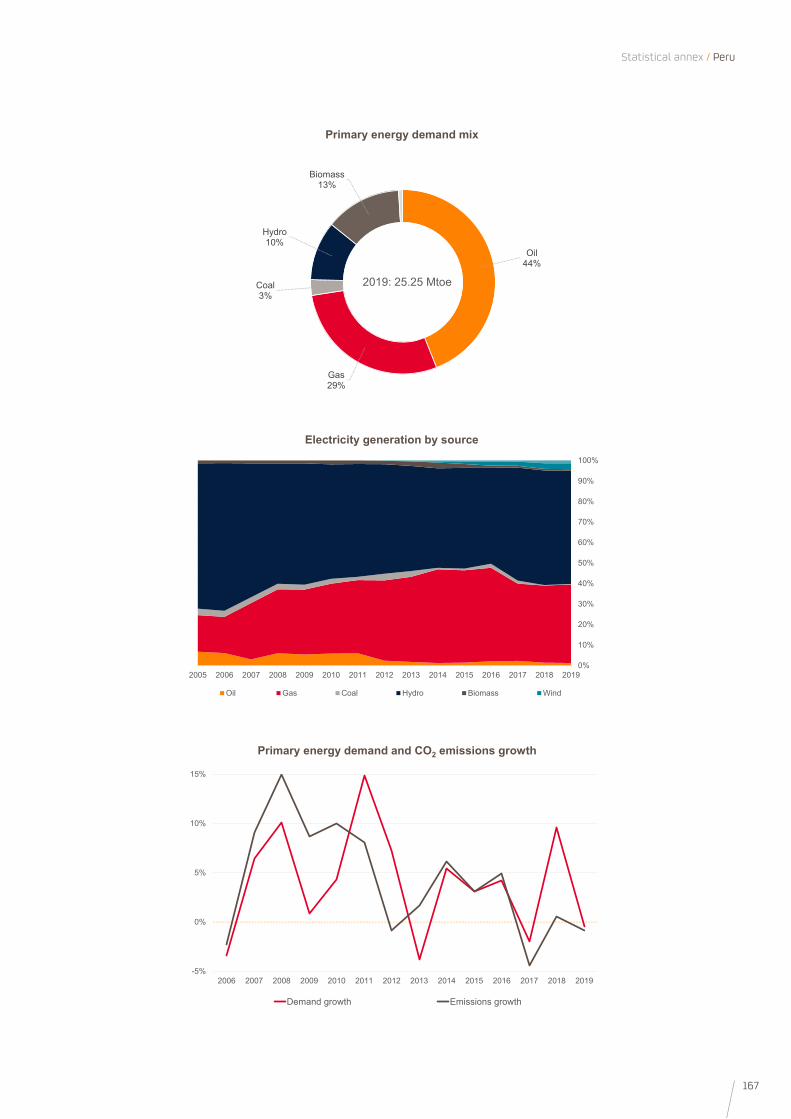
167
Statistical annex / Peru
0%
10%
20%
30%
40%
50%
60%
70%
80%
90%
100%
2005 2006 2007 2008 2009 2010 2011 2012 2013 2014 2015 2016 2017 2018 2019
Oil Gas Coal Hydro Biomass Wind
Electricity generation by source
-5%
0%
5%
10%
15%
2006 2007 2008 2009 2010 2011 2012 2013 2014 2015 2016 2017 2018 2019
Demand growth Emissions growth
Primary energy demand and CO2 emissions growth
Oil 44%
Gas29%
Coal3%
Hydro10%
Biomass13%
2019: 25.25 Mtoe
Primary energy demand mix
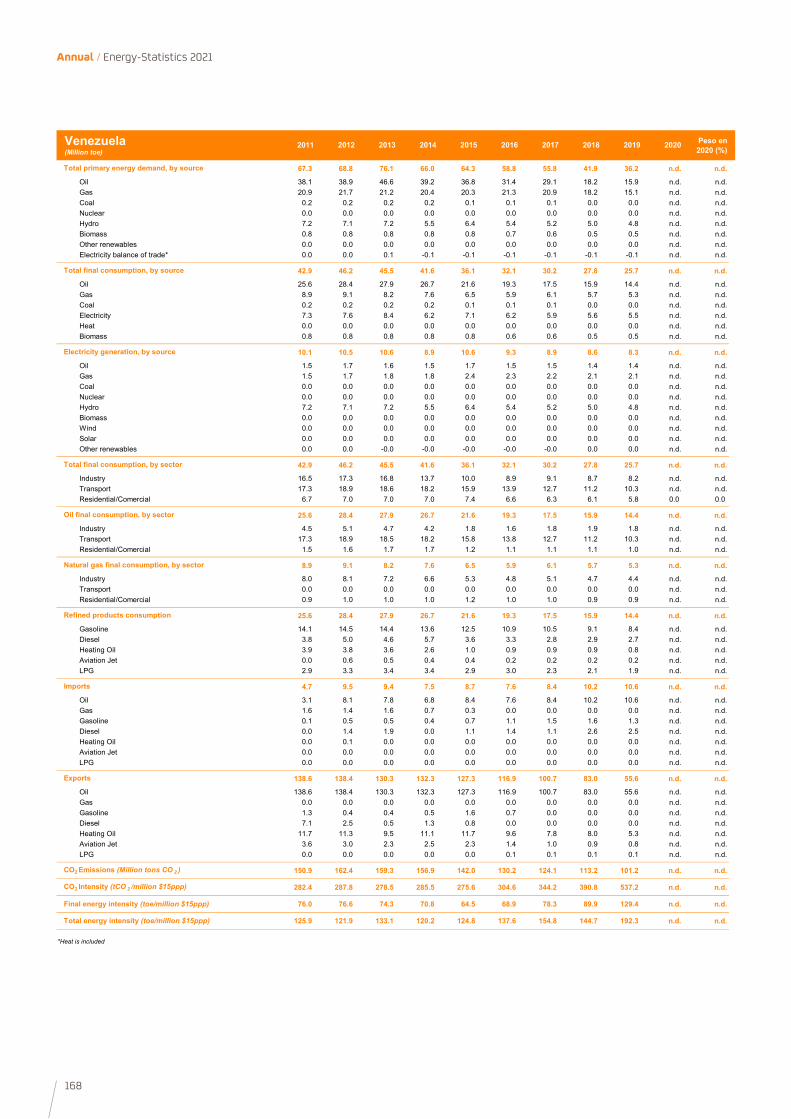
168
Annual / Energy-Statistics 2021
2011 2012 2013 2014 2015 2016 2017 2018 2019 2020 Peso en 2020 (%)
67.3 68.8 76.1 66.0 64.3 58.8 55.8 41.9 36.2 n.d. n.d.
Oil 38.1 38.9 46.6 39.2 36.8 31.4 29.1 18.2 15.9 n.d. n.d.Gas 20.9 21.7 21.2 20.4 20.3 21.3 20.9 18.2 15.1 n.d. n.d.Coal 0.2 0.2 0.2 0.2 0.1 0.1 0.1 0.0 0.0 n.d. n.d.Nuclear 0.0 0.0 0.0 0.0 0.0 0.0 0.0 0.0 0.0 n.d. n.d.Hydro 7.2 7.1 7.2 5.5 6.4 5.4 5.2 5.0 4.8 n.d. n.d.Biomass 0.8 0.8 0.8 0.8 0.8 0.7 0.6 0.5 0.5 n.d. n.d.Other renewables 0.0 0.0 0.0 0.0 0.0 0.0 0.0 0.0 0.0 n.d. n.d.Electricity balance of trade* 0.0 0.0 0.1 -0.1 -0.1 -0.1 -0.1 -0.1 -0.1 n.d. n.d.
42.9 46.2 45.5 41.6 36.1 32.1 30.2 27.8 25.7 n.d. n.d.
Oil 25.6 28.4 27.9 26.7 21.6 19.3 17.5 15.9 14.4 n.d. n.d.Gas 8.9 9.1 8.2 7.6 6.5 5.9 6.1 5.7 5.3 n.d. n.d.Coal 0.2 0.2 0.2 0.2 0.1 0.1 0.1 0.0 0.0 n.d. n.d.Electricity 7.3 7.6 8.4 6.2 7.1 6.2 5.9 5.6 5.5 n.d. n.d.Heat 0.0 0.0 0.0 0.0 0.0 0.0 0.0 0.0 0.0 n.d. n.d.Biomass 0.8 0.8 0.8 0.8 0.8 0.6 0.6 0.5 0.5 n.d. n.d.
10.1 10.5 10.6 8.9 10.6 9.3 8.9 8.6 8.3 n.d. n.d.
Oil 1.5 1.7 1.6 1.5 1.7 1.5 1.5 1.4 1.4 n.d. n.d.Gas 1.5 1.7 1.8 1.8 2.4 2.3 2.2 2.1 2.1 n.d. n.d.Coal 0.0 0.0 0.0 0.0 0.0 0.0 0.0 0.0 0.0 n.d. n.d.Nuclear 0.0 0.0 0.0 0.0 0.0 0.0 0.0 0.0 0.0 n.d. n.d.Hydro 7.2 7.1 7.2 5.5 6.4 5.4 5.2 5.0 4.8 n.d. n.d.Biomass 0.0 0.0 0.0 0.0 0.0 0.0 0.0 0.0 0.0 n.d. n.d.Wind 0.0 0.0 0.0 0.0 0.0 0.0 0.0 0.0 0.0 n.d. n.d.Solar 0.0 0.0 0.0 0.0 0.0 0.0 0.0 0.0 0.0 n.d. n.d.Other renewables 0.0 0.0 -0.0 -0.0 -0.0 -0.0 -0.0 0.0 0.0 n.d. n.d.
42.9 46.2 45.5 41.6 36.1 32.1 30.2 27.8 25.7 n.d. n.d.
Industry 16.5 17.3 16.8 13.7 10.0 8.9 9.1 8.7 8.2 n.d. n.d.Transport 17.3 18.9 18.6 18.2 15.9 13.9 12.7 11.2 10.3 n.d. n.d.Residential/Comercial 6.7 7.0 7.0 7.0 7.4 6.6 6.3 6.1 5.8 0.0 0.0
25.6 28.4 27.9 26.7 21.6 19.3 17.5 15.9 14.4 n.d. n.d.
Industry 4.5 5.1 4.7 4.2 1.8 1.6 1.8 1.9 1.8 n.d. n.d.Transport 17.3 18.9 18.5 18.2 15.8 13.8 12.7 11.2 10.3 n.d. n.d.Residential/Comercial 1.5 1.6 1.7 1.7 1.2 1.1 1.1 1.1 1.0 n.d. n.d.
8.9 9.1 8.2 7.6 6.5 5.9 6.1 5.7 5.3 n.d. n.d.
Industry 8.0 8.1 7.2 6.6 5.3 4.8 5.1 4.7 4.4 n.d. n.d.Transport 0.0 0.0 0.0 0.0 0.0 0.0 0.0 0.0 0.0 n.d. n.d.Residential/Comercial 0.9 1.0 1.0 1.0 1.2 1.0 1.0 0.9 0.9 n.d. n.d.
25.6 28.4 27.9 26.7 21.6 19.3 17.5 15.9 14.4 n.d. n.d.
Gasoline 14.1 14.5 14.4 13.6 12.5 10.9 10.5 9.1 8.4 n.d. n.d.Diesel 3.8 5.0 4.6 5.7 3.6 3.3 2.8 2.9 2.7 n.d. n.d.Heating Oil 3.9 3.8 3.6 2.6 1.0 0.9 0.9 0.9 0.8 n.d. n.d.Aviation Jet 0.0 0.6 0.5 0.4 0.4 0.2 0.2 0.2 0.2 n.d. n.d.LPG 2.9 3.3 3.4 3.4 2.9 3.0 2.3 2.1 1.9 n.d. n.d.
4.7 9.5 9.4 7.5 8.7 7.6 8.4 10.2 10.6 n.d. n.d.
Oil 3.1 8.1 7.8 6.8 8.4 7.6 8.4 10.2 10.6 n.d. n.d.Gas 1.6 1.4 1.6 0.7 0.3 0.0 0.0 0.0 0.0 n.d. n.d.Gasoline 0.1 0.5 0.5 0.4 0.7 1.1 1.5 1.6 1.3 n.d. n.d.Diesel 0.0 1.4 1.9 0.0 1.1 1.4 1.1 2.6 2.5 n.d. n.d.Heating Oil 0.0 0.1 0.0 0.0 0.0 0.0 0.0 0.0 0.0 n.d. n.d.Aviation Jet 0.0 0.0 0.0 0.0 0.0 0.0 0.0 0.0 0.0 n.d. n.d.LPG 0.0 0.0 0.0 0.0 0.0 0.0 0.0 0.0 0.0 n.d. n.d.
138.6 138.4 130.3 132.3 127.3 116.9 100.7 83.0 55.6 n.d. n.d.
Oil 138.6 138.4 130.3 132.3 127.3 116.9 100.7 83.0 55.6 n.d. n.d.Gas 0.0 0.0 0.0 0.0 0.0 0.0 0.0 0.0 0.0 n.d. n.d.Gasoline 1.3 0.4 0.4 0.5 1.6 0.7 0.0 0.0 0.0 n.d. n.d.Diesel 7.1 2.5 0.5 1.3 0.8 0.0 0.0 0.0 0.0 n.d. n.d.Heating Oil 11.7 11.3 9.5 11.1 11.7 9.6 7.8 8.0 5.3 n.d. n.d.Aviation Jet 3.6 3.0 2.3 2.5 2.3 1.4 1.0 0.9 0.8 n.d. n.d.LPG 0.0 0.0 0.0 0.0 0.0 0.1 0.1 0.1 0.1 n.d. n.d.
150.9 162.4 159.3 156.9 142.0 130.2 124.1 113.2 101.2 n.d. n.d.
282.4 287.8 278.5 285.5 275.6 304.6 344.2 390.8 537.2 n.d. n.d.
76.0 76.6 74.3 70.8 64.5 68.9 78.3 89.9 129.4 n.d. n.d.
125.9 121.9 133.1 120.2 124.8 137.6 154.8 144.7 192.3 n.d. n.d.
*Heat is included
Final energy intensity (toe/million $15ppp)
Total energy intensity (toe/million $15ppp)
Natural gas final consumption, by sector
Refined products consumption
Imports
Exports
CO2 Emissions (Million tons CO 2 )
CO2 Intensity (tCO 2 /million $15ppp)
Oil final consumption, by sector
Venezuela(Million toe)
Total primary energy demand, by source
Total final consumption, by source
Electricity generation, by source
Total final consumption, by sector
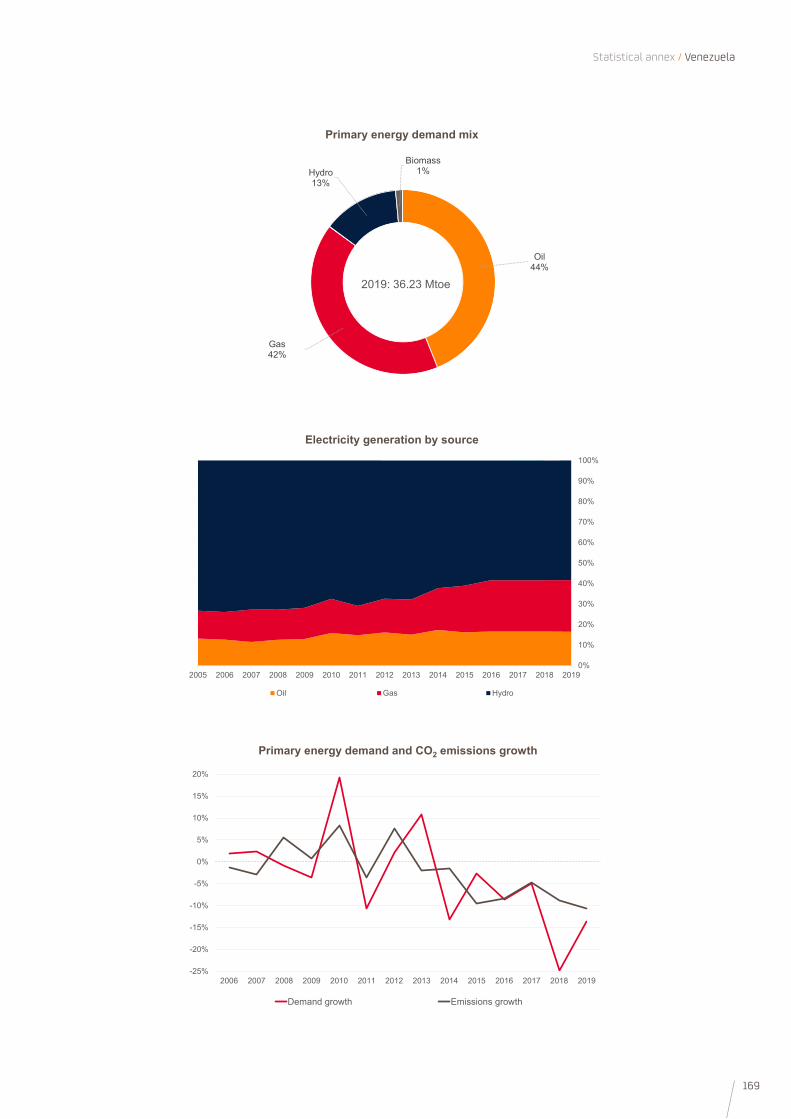
169
Statistical annex / Venezuela
0%
10%
20%
30%
40%
50%
60%
70%
80%
90%
100%
2005 2006 2007 2008 2009 2010 2011 2012 2013 2014 2015 2016 2017 2018 2019
Oil Gas Hydro
Electricity generation by source
-25%
-20%
-15%
-10%
-5%
0%
5%
10%
15%
20%
2006 2007 2008 2009 2010 2011 2012 2013 2014 2015 2016 2017 2018 2019
Demand growth Emissions growth
Primary energy demand and CO2 emissions growth
Oil 44%
Gas42%
Hydro13%
Biomass1%
2019: 36.23 Mtoe
Primary energy demand mix
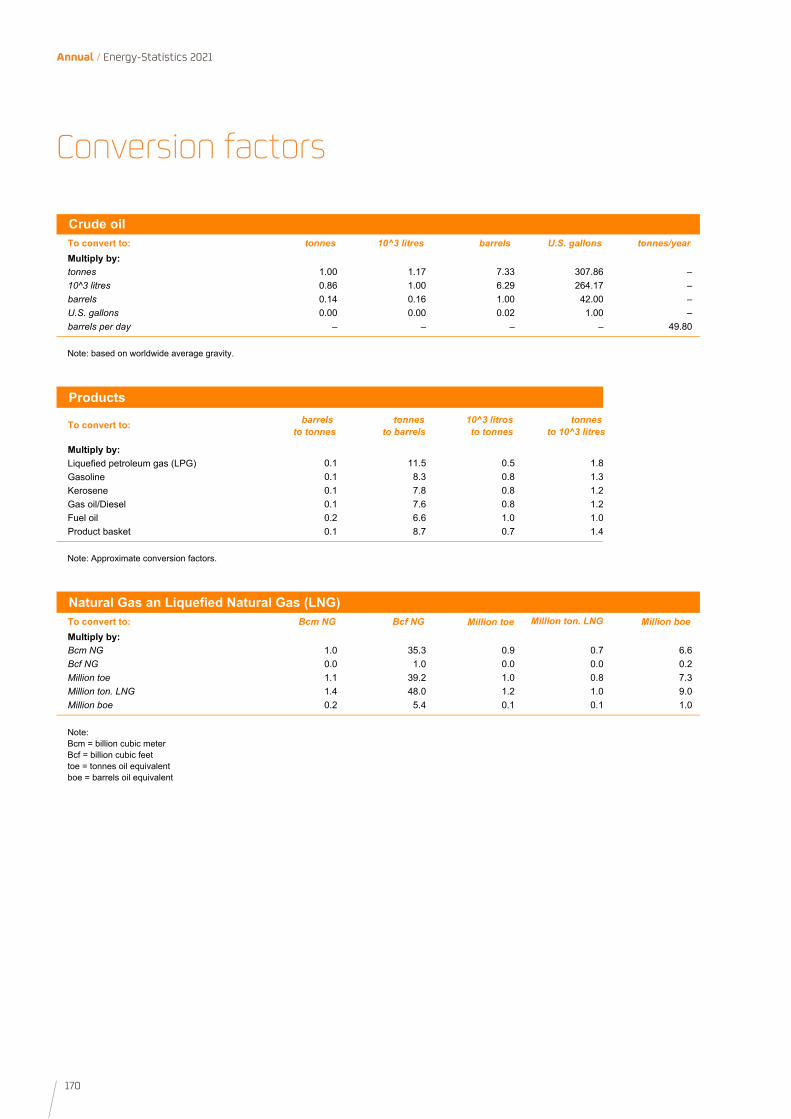
170
Annual / Energy-Statistics 2021
Conversion factors
Crude oilTo convert to: tonnes 10^3 litres barrels U.S. gallons tonnes/yearMultiply by:tonnes 1.00 1.17 7.33 307.86 –10^3 litres 0.86 1.00 6.29 264.17 –barrels 0.14 0.16 1.00 42.00 –U.S. gallons 0.00 0.00 0.02 1.00 –barrels per day – – – – 49.80
Note: based on worldwide average gravity.
Productsbarrels tonnes 10^3 litros tonnes
to tonnes to barrels to tonnes to 10^3 litres
0.1 11.5 0.5 1.80.1 8.3 0.8 1.30.1 7.8 0.8 1.20.1 7.6 0.8 1.20.2 6.6 1.0 1.00.1 8.7 0.7 1.4
Note: Approximate conversion factors.
Natural Gas an Liquefied Natural Gas (LNG)To convert to: Bcm NG Bcf NG Million boeMultiply by:Bcm NG 1.0 35.3 0.9 0.7 6.6Bcf NG 0.0 1.0 0.0 0.0 0.2Million toe 1.1 39.2 1.0 0.8 7.3Million ton. LNG 1.4 48.0 1.2 1.0 9.0Million boe 0.2 5.4 0.1 0.1 1.0
Note:Bcm = billion cubic meter Bcf = billion cubic feet toe = tonnes oil equivalent boe = barrels oil equivalent
To convert to:
Multiply by:Liquefied petroleum gas (LPG) GasolineKeroseneGas oil/DieselFuel oilProduct basket
Million toe Million ton. LNG
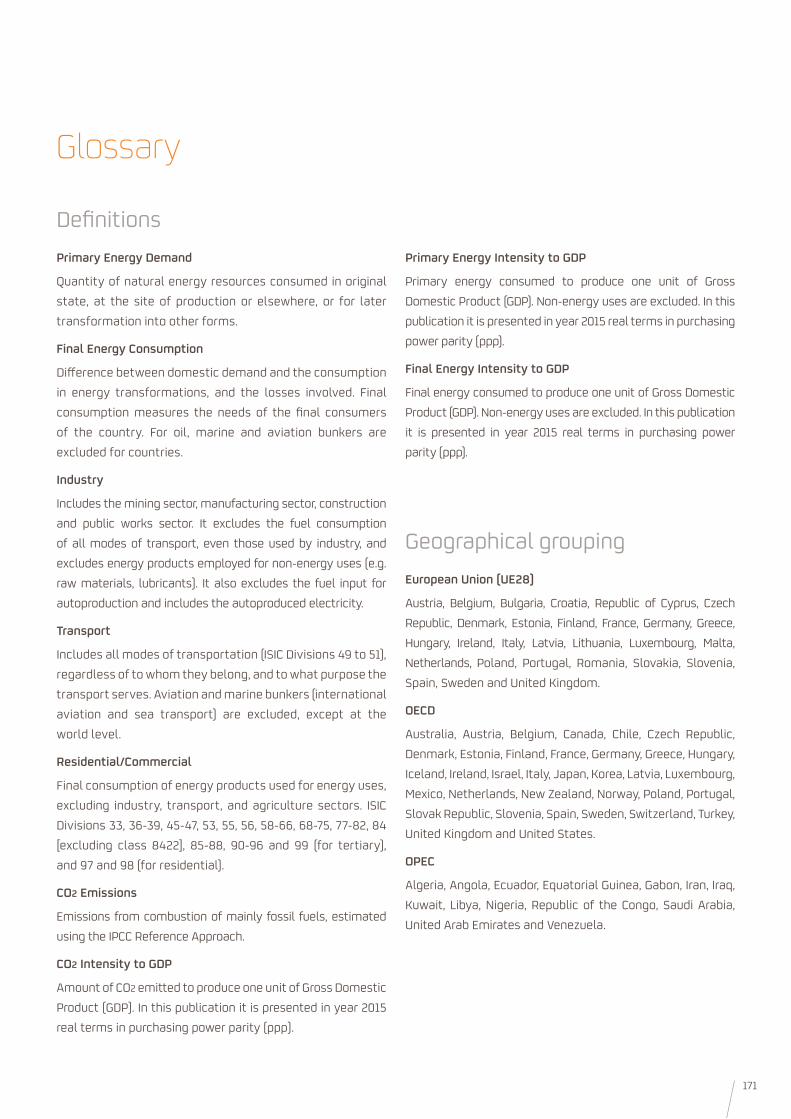
171
Glossary
Primary Energy Demand
Quantity of natural energy resources consumed in original state, at the site of production or elsewhere, or for later transformation into other forms.
Final Energy Consumption
Difference between domestic demand and the consumption in energy transformations, and the losses involved. Final consumption measures the needs of the final consumers of the country. For oil, marine and aviation bunkers are excluded for countries.
Industry
Includes the mining sector, manufacturing sector, construction and public works sector. It excludes the fuel consumption of all modes of transport, even those used by industry, and excludes energy products employed for non-energy uses (e.g. raw materials, lubricants). It also excludes the fuel input for autoproduction and includes the autoproduced electricity.
Transport
Includes all modes of transportation (ISIC Divisions 49 to 51), regardless of to whom they belong, and to what purpose the transport serves. Aviation and marine bunkers (international aviation and sea transport) are excluded, except at the world level.
Residential/Commercial
Final consumption of energy products used for energy uses, excluding industry, transport, and agriculture sectors. ISIC Divisions 33, 36-39, 45-47, 53, 55, 56, 58-66, 68-75, 77-82, 84 [excluding class 8422], 85-88, 90-96 and 99 (for tertiary), and 97 and 98 (for residential).
CO2 Emissions
Emissions from combustion of mainly fossil fuels, estimated using the IPCC Reference Approach.
CO2 Intensity to GDP
Amount of CO2 emitted to produce one unit of Gross Domestic Product (GDP). In this publication it is presented in year 2015 real terms in purchasing power parity (ppp).
Definitions
European Union (UE28)
Austria, Belgium, Bulgaria, Croatia, Republic of Cyprus, Czech Republic, Denmark, Estonia, Finland, France, Germany, Greece, Hungary, Ireland, Italy, Latvia, Lithuania, Luxembourg, Malta, Netherlands, Poland, Portugal, Romania, Slovakia, Slovenia, Spain, Sweden and United Kingdom.
OECD
Australia, Austria, Belgium, Canada, Chile, Czech Republic, Denmark, Estonia, Finland, France, Germany, Greece, Hungary, Iceland, Ireland, Israel, Italy, Japan, Korea, Latvia, Luxembourg, Mexico, Netherlands, New Zealand, Norway, Poland, Portugal, Slovak Republic, Slovenia, Spain, Sweden, Switzerland, Turkey, United Kingdom and United States.
OPEC
Algeria, Angola, Ecuador, Equatorial Guinea, Gabon, Iran, Iraq, Kuwait, Libya, Nigeria, Republic of the Congo, Saudi Arabia, United Arab Emirates and Venezuela.
Geographical grouping
Primary Energy Intensity to GDP
Primary energy consumed to produce one unit of Gross Domestic Product (GDP). Non-energy uses are excluded. In this publication it is presented in year 2015 real terms in purchasing power parity (ppp).
Final Energy Intensity to GDP
Final energy consumed to produce one unit of Gross Domestic Product (GDP). Non-energy uses are excluded. In this publication it is presented in year 2015 real terms in purchasing power parity (ppp).

MORE INFORMATION
Contact
For any query related to the content of this document, please contact Repsol’s Economic Research Department:
Acknowledgements
data compilation, aggregation and validation
ENERDATA, www.enerdata.net
editing and printing
Department of Communication of Repsol
digital visualization
Kabel, www.kabel.es