Embed Size (px)
Citation preview
Annual fleetstatistics
ISBN
: 2324-2116 (Online)
The New Zealand Vehicle Fleet TABLE OF CONTENTS
2013 FLEET REPORT HIGHLIGHTS ............................................................................................................... 2
Accessing the graphs and information in this report ......................................................................................... 4
Describing the vehicle fleet ................................................................................................................................ 4
1. SETTING THE SCENE – THE VEHICLE FLEET IN CONTEXT................................................................... 6
How much is the fleet growing? ................................................................................................................. 6 What are the trends in travel? .................................................................................................................... 7
How does the age of the New Zealand fleet compare internationally? ...................................................... 9
Light petrol fleet fuel economy ................................................................................................................. 10
Vehicle fleet CO2 emissions ..................................................................................................................... 10
2. COMPOSITION OF THE FLEET ................................................................................................................. 12
3. VEHICLE TRAVEL AND AGE ..................................................................................................................... 23 4. LIGHT FLEET ENGINE CAPACITY TRENDS ............................................................................................ 27
5. VEHICLES ENTERING AND EXITING THE FLEET ................................................................................... 31
6. VEHICLES ENTERING THE FLEET ........................................................................................................... 35
7. VEHICLES EXITING THE FLEET ............................................................................................................... 38
8. THE DIESEL FLEET, DIESEL AND PETROL TRAVEL, CNG/LPG/ ELECTRIC VEHICLES .................... 42
9. HOW FUEL-EFFICIENT IS THE LIGHT FLEET? ....................................................................................... 48 10. THE ENGINE SIZE AND AGE OF THE VEHICLES IN USE .................................................................... 54
11. ROAD FREIGHT ........................................................................................................................................ 55
APPENDIX A: COMPARABILITY WITH OTHER PUBLISHED DATA ............................................................ 56
Disclaimer: All reasonable endeavours are made to ensure the accuracy of the information in this report. However, the information is provided without warranties of any kind including accuracy, completeness, timeliness or fitness for any particular purpose.
The Ministry of Transport excludes liability for any loss, damage or expense, direct or indirect, and however caused, whether through negligence or otherwise, resulting from any person or organisation’s use of, or reliance on, the information provided in this report.
This document, and the information contained within it, can be copied, distributed, adapted and otherwise used provided that:
• the Ministry of Transport is attributed as the source of the material • the material is not misrepresented or distorted through selective use of the material • images contained in the material are not copied
Enquires relating to this data may be directed to the Ministry of Transport, PO Box 3175, Wellington, or by email on [email protected]
For more information about vehicles and travel check out the research section of the Ministry of Transport website
1
The New Zealand Vehicle Fleet
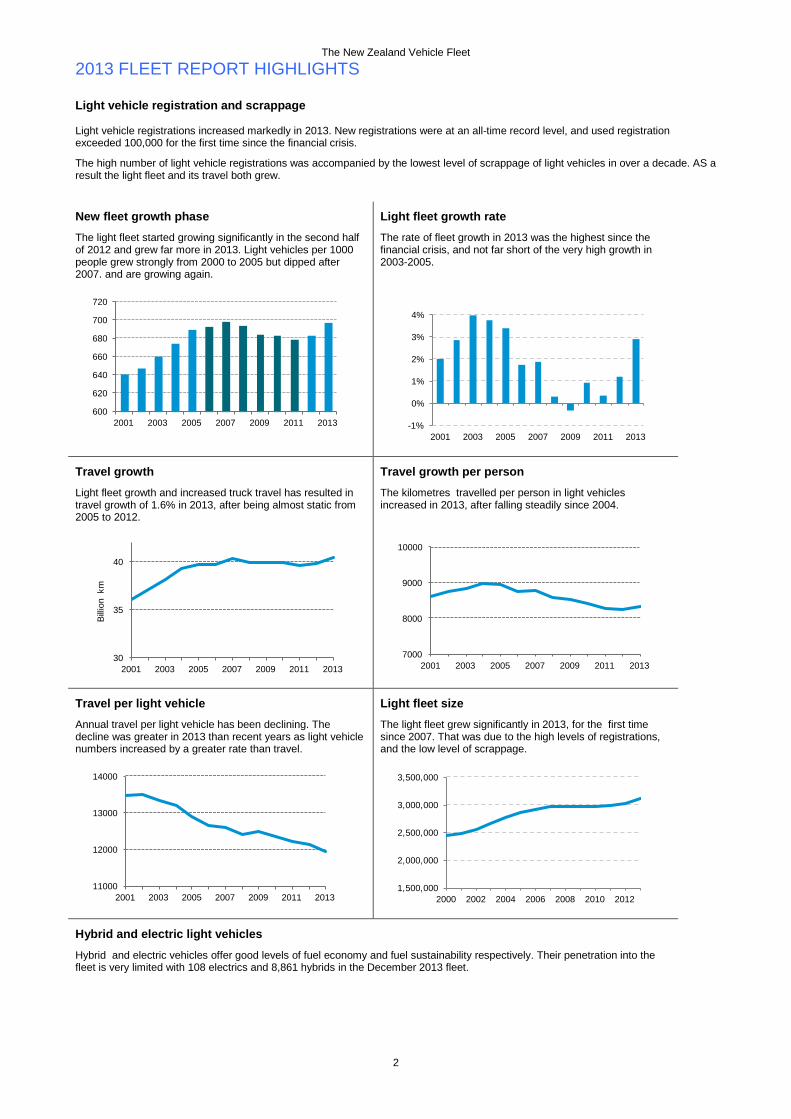
2013 FLEET REPORT HIGHLIGHTS Light vehicle registration and scrappage Light vehicle registrations increased markedly in 2013. New registrations were at an all-time record level, and used registration exceeded 100,000 for the first time since the financial crisis.
The high number of light vehicle registrations was accompanied by the lowest level of scrappage of light vehicles in over a decade. AS a result the light fleet and its travel both grew.
New fleet growth phase The light fleet started growing significantly in the second half of 2012 and grew far more in 2013. Light vehicles per 1000 people grew strongly from 2000 to 2005 but dipped after 2007. and are growing again.
Light fleet growth rate The rate of fleet growth in 2013 was the highest since the financial crisis, and not far short of the very high growth in 2003-2005.
Travel growth Light fleet growth and increased truck travel has resulted in travel growth of 1.6% in 2013, after being almost static from 2005 to 2012.
Travel growth per person The kilometres travelled per person in light vehicles increased in 2013, after falling steadily since 2004.
Travel per light vehicle Annual travel per light vehicle has been declining. The decline was greater in 2013 than recent years as light vehicle numbers increased by a greater rate than travel.
Light fleet size The light fleet grew significantly in 2013, for the first time since 2007. That was due to the high levels of registrations, and the low level of scrappage.
Hybrid and electric light vehicles Hybrid and electric vehicles offer good levels of fuel economy and fuel sustainability respectively. Their penetration into the fleet is very limited with 108 electrics and 8,861 hybrids in the December 2013 fleet.
600
620
640
660
680
700
720
2001 2003 2005 2007 2009 2011 2013 -1%
0%
1%
2%
3%
4%
2001 2003 2005 2007 2009 2011 2013
30
35
40
2001 2003 2005 2007 2009 2011 2013
Billio
n k
m
7000
8000
9000
10000
2001 2003 2005 2007 2009 2011 2013
11000
12000
13000
14000
2001 2003 2005 2007 2009 2011 20131,500,000
2,000,000
2,500,000
3,000,000
3,500,000
2000 2002 2004 2006 2008 2010 2012
2
The New Zealand Vehicle Fleet
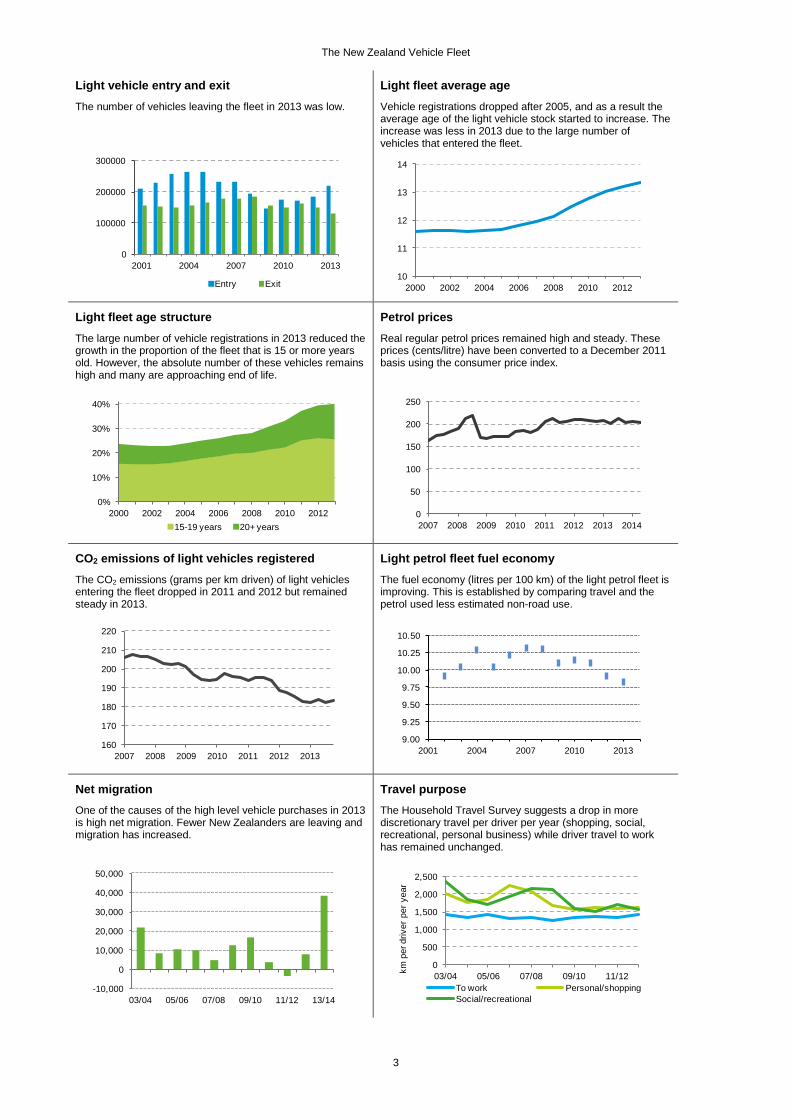
Light vehicle entry and exit The number of vehicles leaving the fleet in 2013 was low.
Light fleet average age Vehicle registrations dropped after 2005, and as a result the average age of the light vehicle stock started to increase. The increase was less in 2013 due to the large number of vehicles that entered the fleet.
Light fleet age structure The large number of vehicle registrations in 2013 reduced the growth in the proportion of the fleet that is 15 or more years old. However, the absolute number of these vehicles remains high and many are approaching end of life.
Petrol prices Real regular petrol prices remained high and steady. These prices (cents/litre) have been converted to a December 2011 basis using the consumer price index.
CO2 emissions of light vehicles registered The CO2 emissions (grams per km driven) of light vehicles entering the fleet dropped in 2011 and 2012 but remained steady in 2013.
Light petrol fleet fuel economy The fuel economy (litres per 100 km) of the light petrol fleet is improving. This is established by comparing travel and the petrol used less estimated non-road use.
Net migration One of the causes of the high level vehicle purchases in 2013 is high net migration. Fewer New Zealanders are leaving and migration has increased.
Travel purpose The Household Travel Survey suggests a drop in more discretionary travel per driver per year (shopping, social, recreational, personal business) while driver travel to work has remained unchanged.
0
100000
200000
300000
2001 2004 2007 2010 2013
Entry Exit10
11
12
13
14
2000 2002 2004 2006 2008 2010 2012
0%
10%
20%
30%
40%
2000 2002 2004 2006 2008 2010 201215-19 years 20+ years
0
50
100
150
200
250
2007 2008 2009 2010 2011 2012 2013 2014
160
170
180
190
200
210
220
2007 2008 2009 2010 2011 2012 2013
9.00
9.25
9.50
9.75
10.00
10.25
10.50
2001 2004 2007 2010 2013
-10,000
0
10,000
20,000
30,000
40,000
50,000
03/04 05/06 07/08 09/10 11/12 13/14
0
500
1,000
1,500
2,000
2,500
03/04 05/06 07/08 09/10 11/12km p
er d
river
per
yea
r
To work Personal/shoppingSocial/recreational
3
The New Zealand Vehicle Fleet
Accessing the graphs and information in this report
The graphs and information presented in this report, and the report itself, are available on the research tab of the Ministry of Transport website http://www.transport.govt.nz/research. A series of brief quarterly fleet reports are also available there. The Ministry has developed a set of Transport Indicators, which include further information on the vehicle fleet, including some regional breakdowns. The Transport Indicators are available at the top left of the Ministry of Transport’s homepage www.transport.govt.nz.
Describing the vehicle fleet
This report is based on data from the Motor Vehicle Register. The statistics presented in this publication have been categorised differently to the traditional motor vehicle statistics produced by the Transport Registry Centre of the New Zealand Transport Agency (NZTA)1. The objective was to produce a categorisation better suited to the estimation of fuel use and levels of emissions. There are two significant differences:
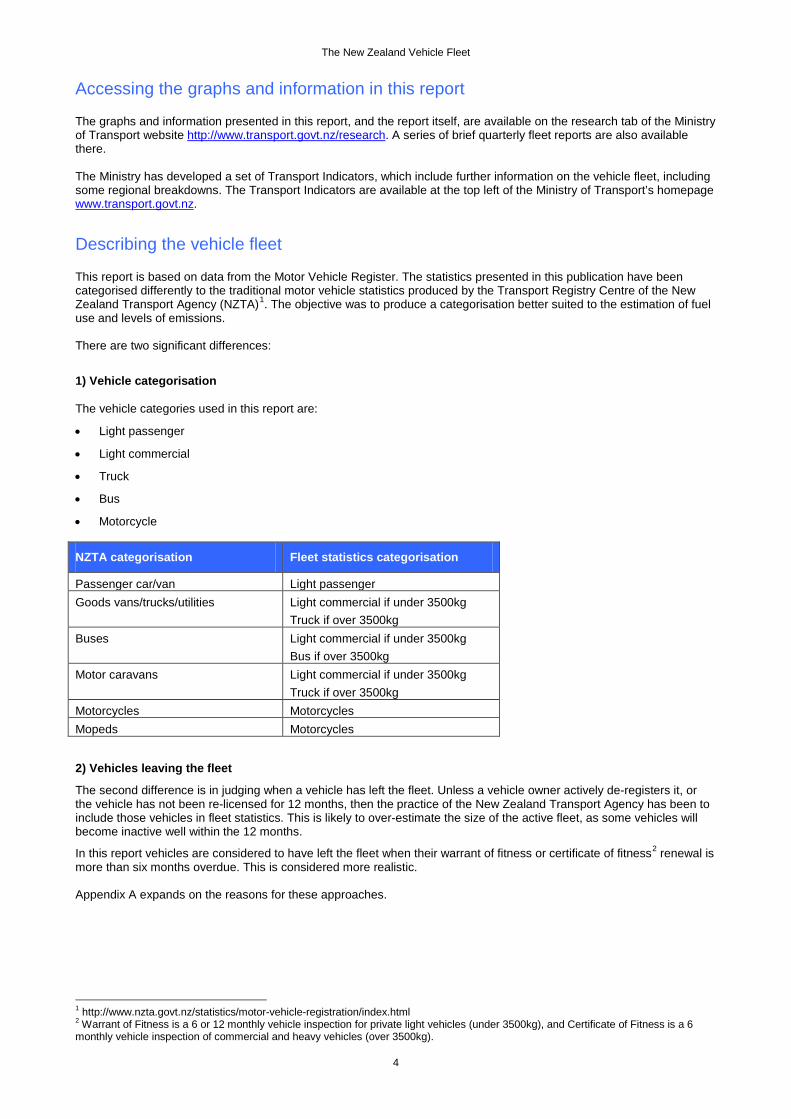
1) Vehicle categorisation The vehicle categories used in this report are:
• Light passenger
• Light commercial
• Truck
• Bus
• Motorcycle
NZTA categorisation Fleet statistics categorisation
Passenger car/van Light passenger Goods vans/trucks/utilities Light commercial if under 3500kg
Truck if over 3500kg Buses Light commercial if under 3500kg
Bus if over 3500kg Motor caravans Light commercial if under 3500kg
Truck if over 3500kg Motorcycles Motorcycles Mopeds Motorcycles 2) Vehicles leaving the fleet
The second difference is in judging when a vehicle has left the fleet. Unless a vehicle owner actively de-registers it, or the vehicle has not been re-licensed for 12 months, then the practice of the New Zealand Transport Agency has been to include those vehicles in fleet statistics. This is likely to over-estimate the size of the active fleet, as some vehicles will become inactive well within the 12 months.
In this report vehicles are considered to have left the fleet when their warrant of fitness or certificate of fitness2 renewal is more than six months overdue. This is considered more realistic. Appendix A expands on the reasons for these approaches.
1 http://www.nzta.govt.nz/statistics/motor-vehicle-registration/index.html 2 Warrant of Fitness is a 6 or 12 monthly vehicle inspection for private light vehicles (under 3500kg), and Certificate of Fitness is a 6 monthly vehicle inspection of commercial and heavy vehicles (over 3500kg).
4
The New Zealand Vehicle Fleet 3) Travel estimation
The vehicle travel estimates in this report are derived from the odometer readings recorded when vehicles undergo inspection (warrant of fitness and certificate of fitness). These readings were first recorded in this way in 2000 and the estimates derived from them become usable from 2001 onwards.
Although the current method of collecting data generally provides accurate data, a range of matters, discussed below, mean that all figures presented are estimates and may be revised in subsequent years in light of more complete data. The level of change is under one percent.
There was a major change to the data starting with the 2012 fleet report. Previous travel estimates did not include odometer data from vehicles that failed their warrant or certificate of inspection. While most vehicles pass their inspection on the day presented a percentage are not passed until some time later, while some never pass and leave the fleet. Data from vehicles which failed the inspection tests were first utilised in the 2012 report. That provides more odometer readings and better travel estimates.
The travel estimates for a year are calculated in August the following year, and make use of 6 months of inspections data after the end of that analysis period. This approach results in a high number of vehicles having an inspection after the end of the analysis period, but it is still a compromise.
One reason that travel estimates vary from year to year is some vehicles that have been in the fleet for less than one year. For instance, consider a vehicle that entered the fleet in August 2013. It will be on an annual inspection cycle so its first annual inspection will not have occurred before June 30th the following year (ie not within the 6 months of extra data used for the December analysis). An estimate of the vehicle’s travel between August and December 2013 cannot be made from its own inspection data. To address this omission, the travel is estimated based on travel by similar vehicles in the previous year.
Other vehicles that have had a series of inspections, may not have an inspection in the six months after the analysis period. That means their travel has to be projected to the end of the analysis period.
Eventually these vehicles are likely to undergo more inspections, and the estimated travel for the analysis period can firmed up. That is why there is a limited degree of change when estimates for previous years are republished.
It also means that similar overall annual travel estimates (for instance 39.9 billion and 40.1 billion) are best regarded as the same, as that level of difference may disappear when extra inspections lead to better estimates.
5
The New Zealand Vehicle Fleet
1. SETTING THE SCENE – THE VEHICLE FLEET IN CONTEXT
How much is the fleet growing?
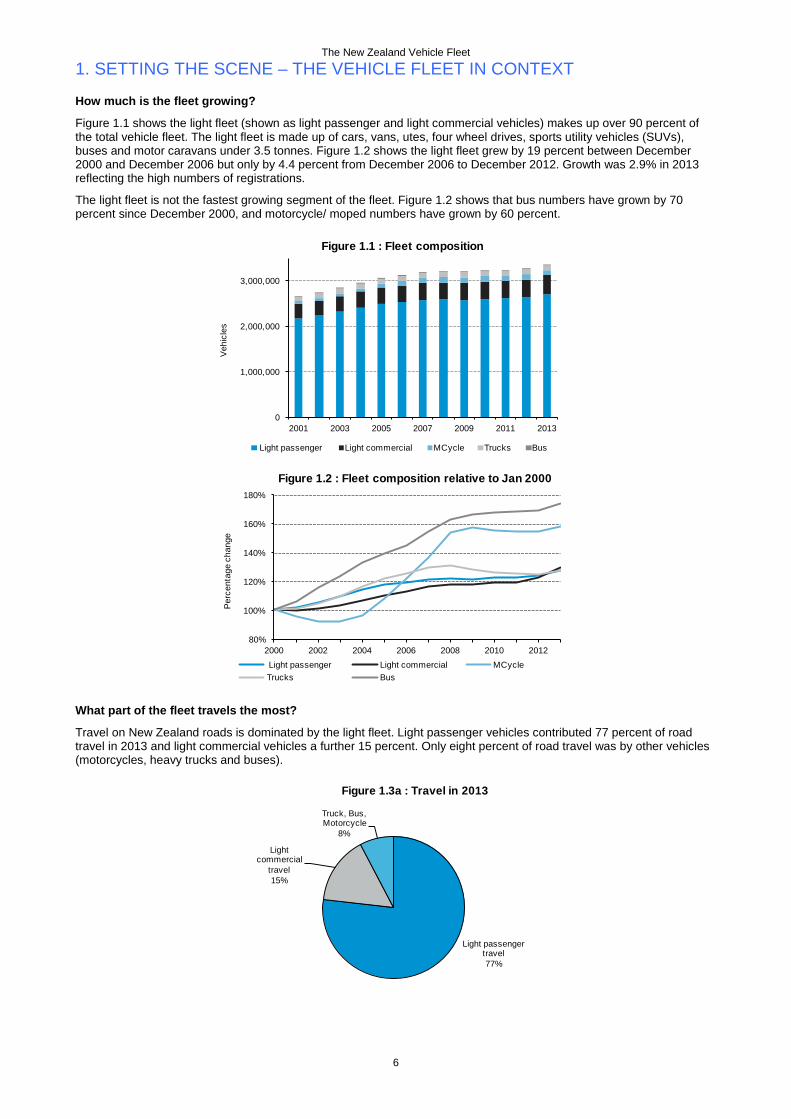
Figure 1.1 shows the light fleet (shown as light passenger and light commercial vehicles) makes up over 90 percent of the total vehicle fleet. The light fleet is made up of cars, vans, utes, four wheel drives, sports utility vehicles (SUVs), buses and motor caravans under 3.5 tonnes. Figure 1.2 shows the light fleet grew by 19 percent between December 2000 and December 2006 but only by 4.4 percent from December 2006 to December 2012. Growth was 2.9% in 2013 reflecting the high numbers of registrations.
The light fleet is not the fastest growing segment of the fleet. Figure 1.2 shows that bus numbers have grown by 70 percent since December 2000, and motorcycle/ moped numbers have grown by 60 percent.
What part of the fleet travels the most?
Travel on New Zealand roads is dominated by the light fleet. Light passenger vehicles contributed 77 percent of road travel in 2013 and light commercial vehicles a further 15 percent. Only eight percent of road travel was by other vehicles (motorcycles, heavy trucks and buses).
0
1,000,000
2,000,000
3,000,000
2001 2003 2005 2007 2009 2011 2013
Veh
icle
s
Figure 1.1 : Fleet composition
Light passenger Light commercial MCycle Trucks Bus
80%
100%
120%
140%
160%
180%
2000 2002 2004 2006 2008 2010 2012
Per
cent
age
chan
ge
Figure 1.2 : Fleet composition relative to Jan 2000
Light passenger Light commercial MCycleTrucks Bus
Light passenger travel77%
Light commercial
travel15%
Truck, Bus, Motorcycle
8%
Figure 1.3a : Travel in 2013
6
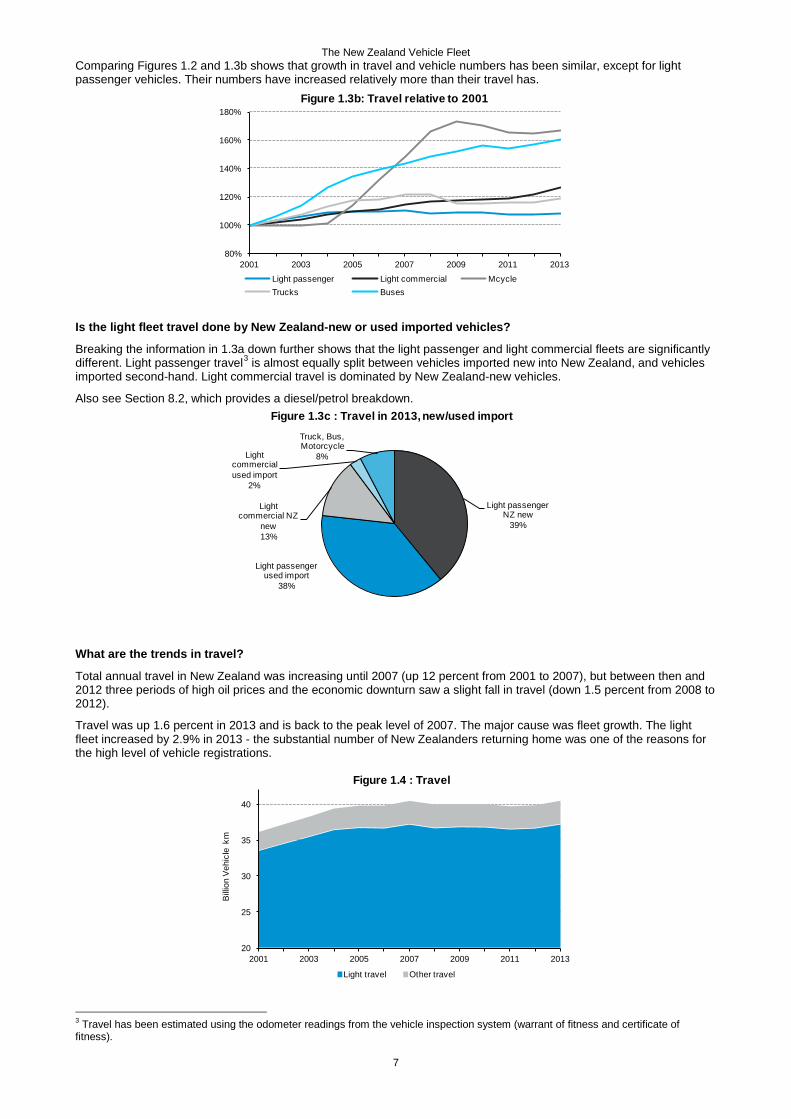
The New Zealand Vehicle Fleet Comparing Figures 1.2 and 1.3b shows that growth in travel and vehicle numbers has been similar, except for light passenger vehicles. Their numbers have increased relatively more than their travel has.
Is the light fleet travel done by New Zealand-new or used imported vehicles?
Breaking the information in 1.3a down further shows that the light passenger and light commercial fleets are significantly different. Light passenger travel3 is almost equally split between vehicles imported new into New Zealand, and vehicles imported second-hand. Light commercial travel is dominated by New Zealand-new vehicles.
Also see Section 8.2, which provides a diesel/petrol breakdown.
What are the trends in travel?
Total annual travel in New Zealand was increasing until 2007 (up 12 percent from 2001 to 2007), but between then and 2012 three periods of high oil prices and the economic downturn saw a slight fall in travel (down 1.5 percent from 2008 to 2012).
Travel was up 1.6 percent in 2013 and is back to the peak level of 2007. The major cause was fleet growth. The light fleet increased by 2.9% in 2013 - the substantial number of New Zealanders returning home was one of the reasons for the high level of vehicle registrations.
3 Travel has been estimated using the odometer readings from the vehicle inspection system (warrant of fitness and certificate of fitness).
80%
100%
120%
140%
160%
180%
2001 2003 2005 2007 2009 2011 2013
Figure 1.3b: Travel relative to 2001
Light passenger Light commercial McycleTrucks Buses
Light passenger NZ new
39%
Light passenger used import
38%
Light commercial NZ
new13%
Light commercial used import
2%
Truck, Bus, Motorcycle
8%
Figure 1.3c : Travel in 2013, new/used import
20
25
30
35
40
2001 2003 2005 2007 2009 2011 2013
Bill
ion
Veh
icle
km
Period
Figure 1.4 : Travel
Light travel Other travel
7
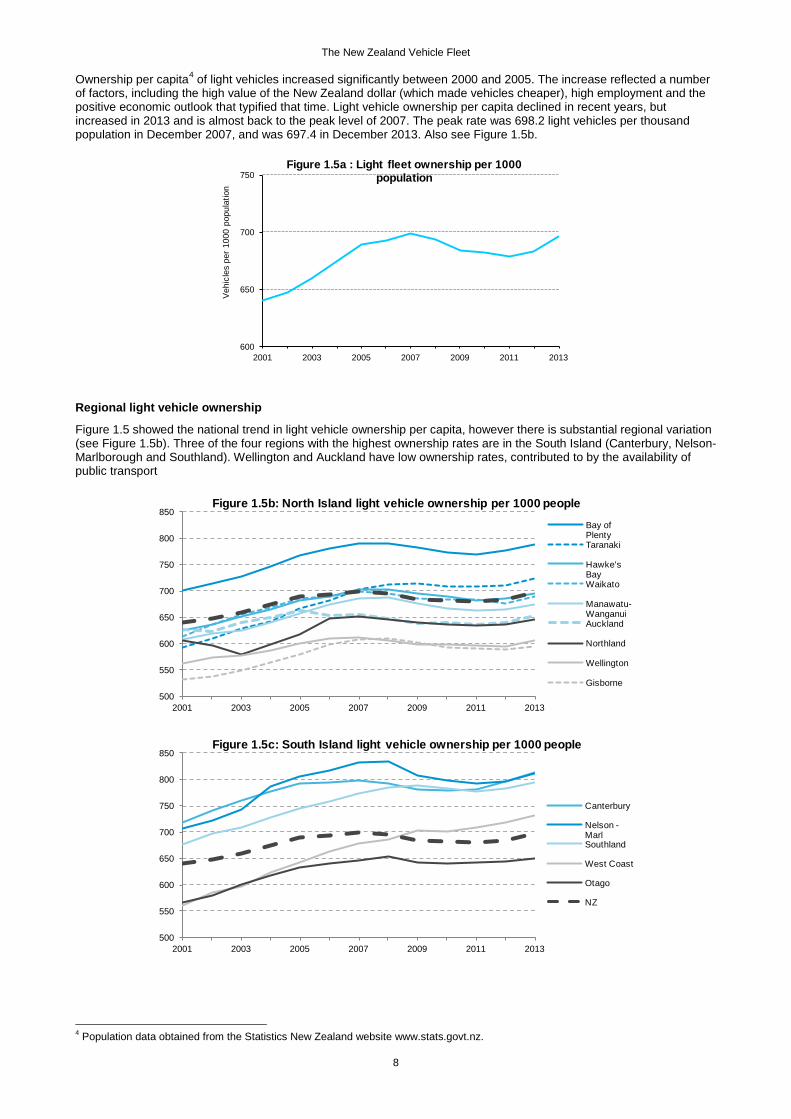
The New Zealand Vehicle Fleet Ownership per capita4 of light vehicles increased significantly between 2000 and 2005. The increase reflected a number of factors, including the high value of the New Zealand dollar (which made vehicles cheaper), high employment and the positive economic outlook that typified that time. Light vehicle ownership per capita declined in recent years, but increased in 2013 and is almost back to the peak level of 2007. The peak rate was 698.2 light vehicles per thousand population in December 2007, and was 697.4 in December 2013. Also see Figure 1.5b.
Regional light vehicle ownership
Figure 1.5 showed the national trend in light vehicle ownership per capita, however there is substantial regional variation (see Figure 1.5b). Three of the four regions with the highest ownership rates are in the South Island (Canterbury, Nelson-Marlborough and Southland). Wellington and Auckland have low ownership rates, contributed to by the availability of public transport
4 Population data obtained from the Statistics New Zealand website www.stats.govt.nz.
600
650
700
750
2001 2003 2005 2007 2009 2011 2013
Veh
icle
s pe
r 10
00 p
opul
atio
n
Figure 1.5a : Light fleet ownership per 1000 population
500
550
600
650
700
750
800
850
2001 2003 2005 2007 2009 2011 2013
Figure 1.5b: North Island light vehicle ownership per 1000 people
Bay of PlentyTaranaki
Hawke's BayWaikato
Manawatu-WanganuiAuckland
Northland
Wellington
Gisborne
500
550
600
650
700
750
800
850
2001 2003 2005 2007 2009 2011 2013
Figure 1.5c: South Island light vehicle ownership per 1000 people
Canterbury
Nelson -MarlSouthland
West Coast
Otago
NZ
8
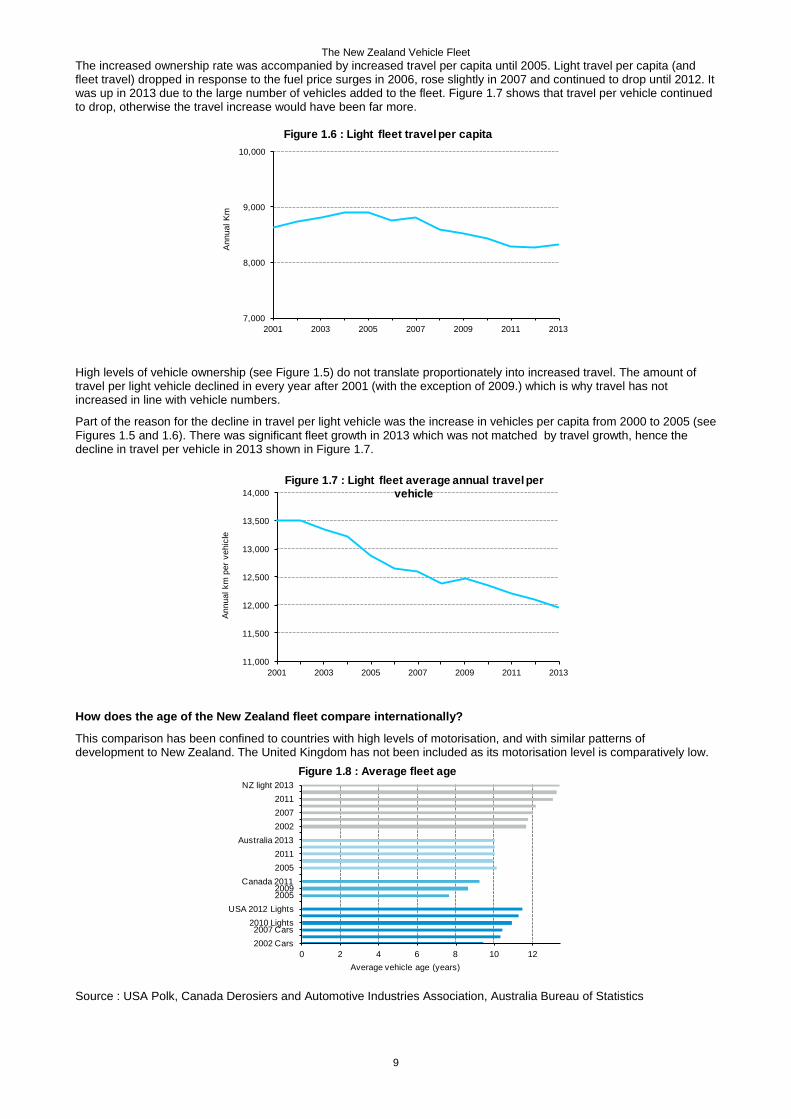
The New Zealand Vehicle Fleet The increased ownership rate was accompanied by increased travel per capita until 2005. Light travel per capita (and fleet travel) dropped in response to the fuel price surges in 2006, rose slightly in 2007 and continued to drop until 2012. It was up in 2013 due to the large number of vehicles added to the fleet. Figure 1.7 shows that travel per vehicle continued to drop, otherwise the travel increase would have been far more.
High levels of vehicle ownership (see Figure 1.5) do not translate proportionately into increased travel. The amount of travel per light vehicle declined in every year after 2001 (with the exception of 2009.) which is why travel has not increased in line with vehicle numbers.
Part of the reason for the decline in travel per light vehicle was the increase in vehicles per capita from 2000 to 2005 (see Figures 1.5 and 1.6). There was significant fleet growth in 2013 which was not matched by travel growth, hence the decline in travel per vehicle in 2013 shown in Figure 1.7.
How does the age of the New Zealand fleet compare internationally?
This comparison has been confined to countries with high levels of motorisation, and with similar patterns of development to New Zealand. The United Kingdom has not been included as its motorisation level is comparatively low.
Source : USA Polk, Canada Derosiers and Automotive Industries Association, Australia Bureau of Statistics
7,000
8,000
9,000
10,000
2001 2003 2005 2007 2009 2011 2013
Ann
ual K
m
Figure 1.6 : Light fleet travel per capita
11,000
11,500
12,000
12,500
13,000
13,500
14,000
2001 2003 2005 2007 2009 2011 2013
Ann
ual k
m p
er v
ehic
le
Figure 1.7 : Light fleet average annual travel per vehicle
0 2 4 6 8 10 122002 Cars2007 Cars
2010 LightsUSA 2012 Lights
20052009
Canada 201120052011
Australia 2013200220072011
NZ light 2013
Average vehicle age (years)
Figure 1.8 : Average fleet age
9
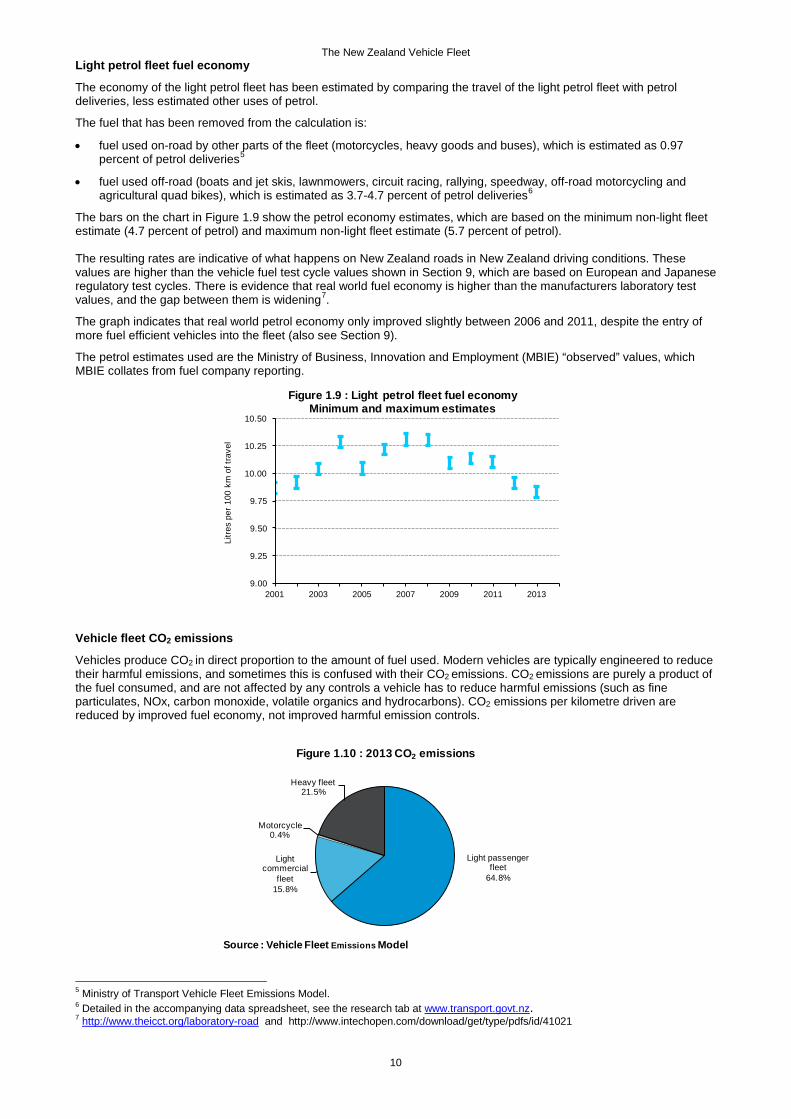
The New Zealand Vehicle Fleet Light petrol fleet fuel economy
The economy of the light petrol fleet has been estimated by comparing the travel of the light petrol fleet with petrol deliveries, less estimated other uses of petrol.
The fuel that has been removed from the calculation is:
• fuel used on-road by other parts of the fleet (motorcycles, heavy goods and buses), which is estimated as 0.97 percent of petrol deliveries5
• fuel used off-road (boats and jet skis, lawnmowers, circuit racing, rallying, speedway, off-road motorcycling and agricultural quad bikes), which is estimated as 3.7-4.7 percent of petrol deliveries6
The bars on the chart in Figure 1.9 show the petrol economy estimates, which are based on the minimum non-light fleet estimate (4.7 percent of petrol) and maximum non-light fleet estimate (5.7 percent of petrol). The resulting rates are indicative of what happens on New Zealand roads in New Zealand driving conditions. These values are higher than the vehicle fuel test cycle values shown in Section 9, which are based on European and Japanese regulatory test cycles. There is evidence that real world fuel economy is higher than the manufacturers laboratory test values, and the gap between them is widening7.
The graph indicates that real world petrol economy only improved slightly between 2006 and 2011, despite the entry of more fuel efficient vehicles into the fleet (also see Section 9).
The petrol estimates used are the Ministry of Business, Innovation and Employment (MBIE) “observed” values, which MBIE collates from fuel company reporting.
Vehicle fleet CO2 emissions
Vehicles produce CO2 in direct proportion to the amount of fuel used. Modern vehicles are typically engineered to reduce
their harmful emissions, and sometimes this is confused with their CO2 emissions. CO2 emissions are purely a product of the fuel consumed, and are not affected by any controls a vehicle has to reduce harmful emissions (such as fine particulates, NOx, carbon monoxide, volatile organics and hydrocarbons). CO2 emissions per kilometre driven are reduced by improved fuel economy, not improved harmful emission controls.
5 Ministry of Transport Vehicle Fleet Emissions Model. 6 Detailed in the accompanying data spreadsheet, see the research tab at www.transport.govt.nz. 7 http://www.theicct.org/laboratory-road and http://www.intechopen.com/download/get/type/pdfs/id/41021
9.00
9.25
9.50
9.75
10.00
10.25
10.50
2001 2003 2005 2007 2009 2011 2013
Litr
es p
er 1
00 k
m o
f tra
vel
Figure 1.9 : Light petrol fleet fuel economyMinimum and maximum estimates
Light passenger fleet
64.8%
Light commercial
fleet15.8%
Motorcycle0.4%
Heavy fleet21.5%
Figure 1.10 : 2013 CO2 emissions
Source : Vehicle Fleet Emissions Model
10
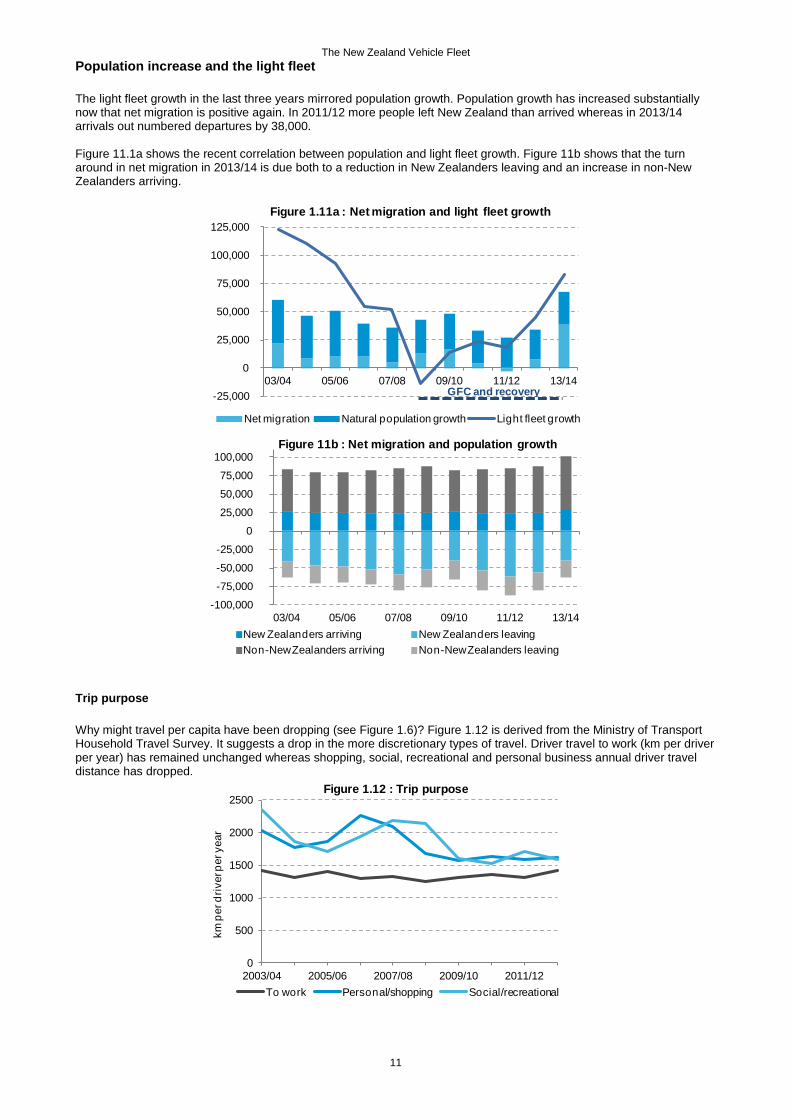
The New Zealand Vehicle Fleet Population increase and the light fleet The light fleet growth in the last three years mirrored population growth. Population growth has increased substantially now that net migration is positive again. In 2011/12 more people left New Zealand than arrived whereas in 2013/14 arrivals out numbered departures by 38,000. Figure 11.1a shows the recent correlation between population and light fleet growth. Figure 11b shows that the turn around in net migration in 2013/14 is due both to a reduction in New Zealanders leaving and an increase in non-New Zealanders arriving.
Trip purpose Why might travel per capita have been dropping (see Figure 1.6)? Figure 1.12 is derived from the Ministry of Transport Household Travel Survey. It suggests a drop in the more discretionary types of travel. Driver travel to work (km per driver per year) has remained unchanged whereas shopping, social, recreational and personal business annual driver travel distance has dropped.
-25,000
0
25,000
50,000
75,000
100,000
125,000
03/04 05/06 07/08 09/10 11/12 13/14
Figure 1.11a : Net migration and light fleet growth
Net migration Natural population growth Light fleet growth
GFC and recovery
-100,000
-75,000
-50,000
-25,000
0
25,000
50,000
75,000
100,000
03/04 05/06 07/08 09/10 11/12 13/14
Figure 11b : Net migration and population growth
New Zealanders arriving New Zealanders leavingNon-New Zealanders arriving Non-New Zealanders leaving
0
500
1000
1500
2000
2500
2003/04 2005/06 2007/08 2009/10 2011/12
km p
er d
river
per
yea
r
Figure 1.12 : Trip purpose
To work Personal/shopping Social/recreational
11
The New Zealand Vehicle Fleet
2. COMPOSITION OF THE FLEET
New Zealand new and used imported vehicles
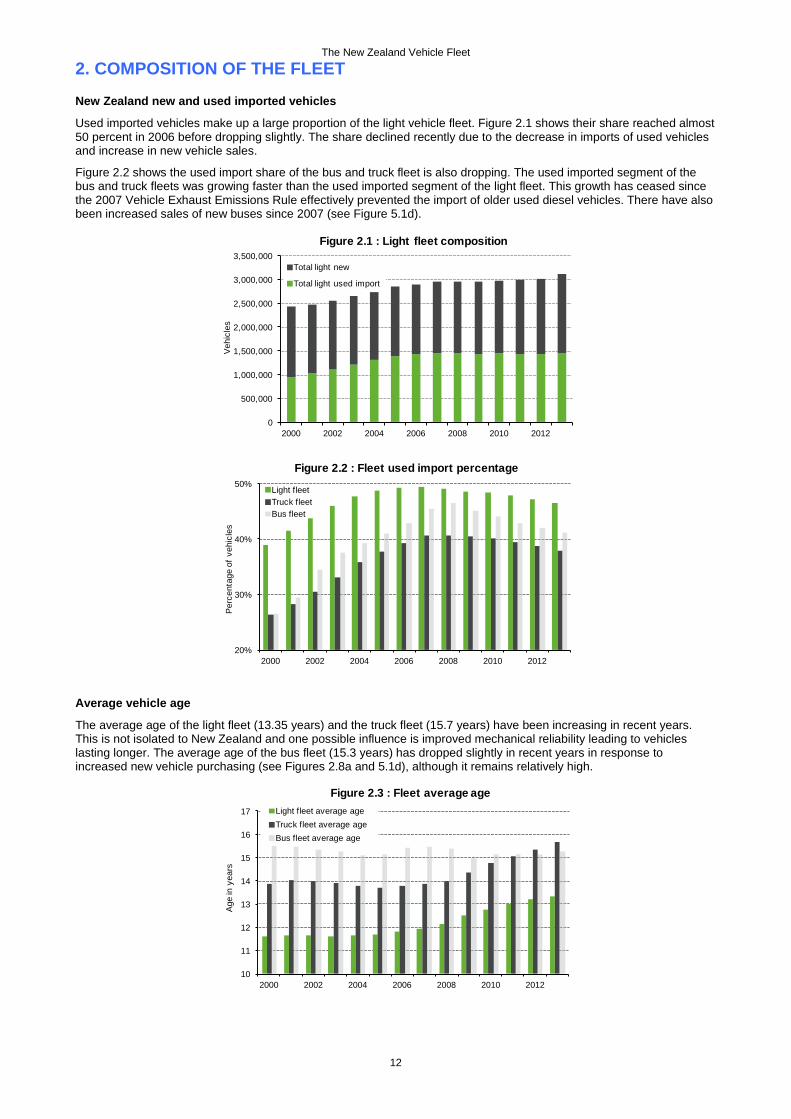
Used imported vehicles make up a large proportion of the light vehicle fleet. Figure 2.1 shows their share reached almost 50 percent in 2006 before dropping slightly. The share declined recently due to the decrease in imports of used vehicles and increase in new vehicle sales.
Figure 2.2 shows the used import share of the bus and truck fleet is also dropping. The used imported segment of the bus and truck fleets was growing faster than the used imported segment of the light fleet. This growth has ceased since the 2007 Vehicle Exhaust Emissions Rule effectively prevented the import of older used diesel vehicles. There have also been increased sales of new buses since 2007 (see Figure 5.1d).
Average vehicle age
The average age of the light fleet (13.35 years) and the truck fleet (15.7 years) have been increasing in recent years. This is not isolated to New Zealand and one possible influence is improved mechanical reliability leading to vehicles lasting longer. The average age of the bus fleet (15.3 years) has dropped slightly in recent years in response to increased new vehicle purchasing (see Figures 2.8a and 5.1d), although it remains relatively high.
0
500,000
1,000,000
1,500,000
2,000,000
2,500,000
3,000,000
3,500,000
2000 2002 2004 2006 2008 2010 2012
Veh
icle
s
Figure 2.1 : Light fleet composition
Total light new
Total light used import
20%
30%
40%
50%
2000 2002 2004 2006 2008 2010 2012
Per
cent
age
of v
ehic
les
Figure 2.2 : Fleet used import percentage
Light fleetTruck fleetBus fleet
10
11
12
13
14
15
16
17
2000 2002 2004 2006 2008 2010 2012
Age
in y
ears
Figure 2.3 : Fleet average ageLight fleet average ageTruck fleet average ageBus fleet average age
12
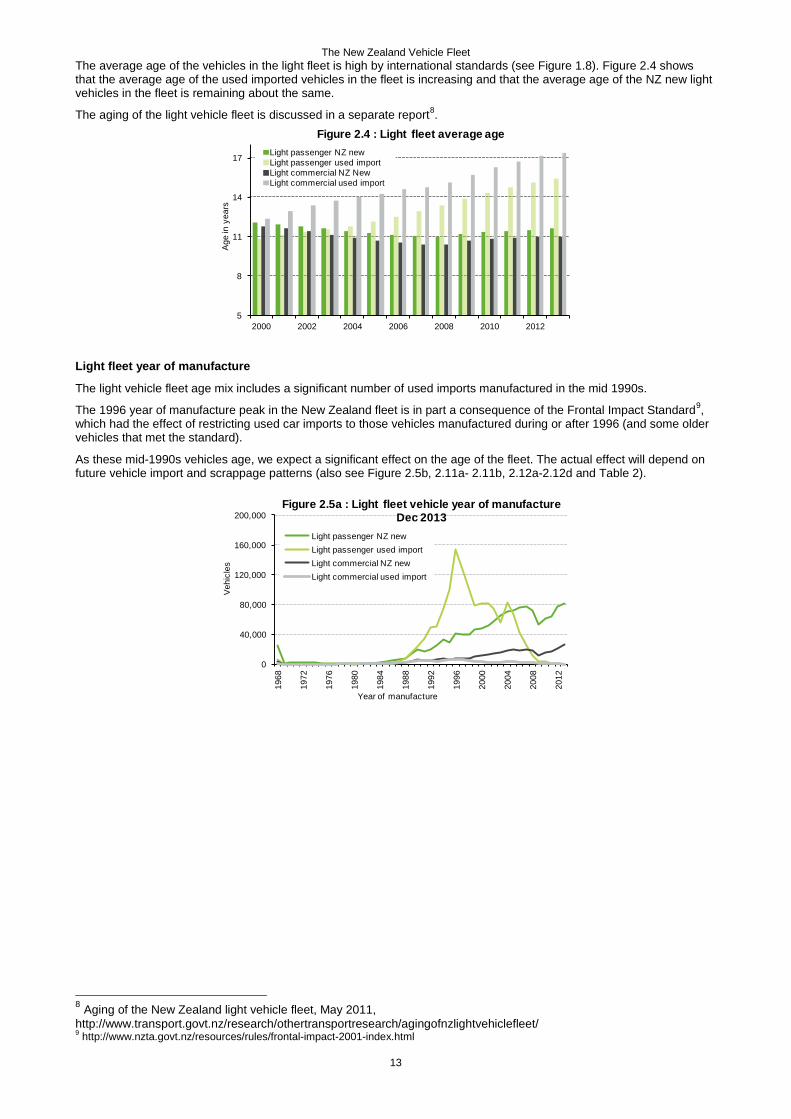
The New Zealand Vehicle Fleet The average age of the vehicles in the light fleet is high by international standards (see Figure 1.8). Figure 2.4 shows that the average age of the used imported vehicles in the fleet is increasing and that the average age of the NZ new light vehicles in the fleet is remaining about the same.
The aging of the light vehicle fleet is discussed in a separate report8.
Light fleet year of manufacture
The light vehicle fleet age mix includes a significant number of used imports manufactured in the mid 1990s.
The 1996 year of manufacture peak in the New Zealand fleet is in part a consequence of the Frontal Impact Standard9, which had the effect of restricting used car imports to those vehicles manufactured during or after 1996 (and some older vehicles that met the standard).
As these mid-1990s vehicles age, we expect a significant effect on the age of the fleet. The actual effect will depend on future vehicle import and scrappage patterns (also see Figure 2.5b, 2.11a- 2.11b, 2.12a-2.12d and Table 2).
8 Aging of the New Zealand light vehicle fleet, May 2011, http://www.transport.govt.nz/research/othertransportresearch/agingofnzlightvehiclefleet/ 9 http://www.nzta.govt.nz/resources/rules/frontal-impact-2001-index.html
5
8
11
14
17
2000 2002 2004 2006 2008 2010 2012
Age
in y
ears
Figure 2.4 : Light fleet average ageLight passenger NZ newLight passenger used importLight commercial NZ NewLight commercial used import
0
40,000
80,000
120,000
160,000
200,000
1968
1972
1976
1980
1984
1988
1992
1996
2000
2004
2008
2012
Veh
icle
s
Year of manufacture
Figure 2.5a : Light fleet vehicle year of manufacture Dec 2013
Light passenger NZ newLight passenger used importLight commercial NZ newLight commercial used import
13
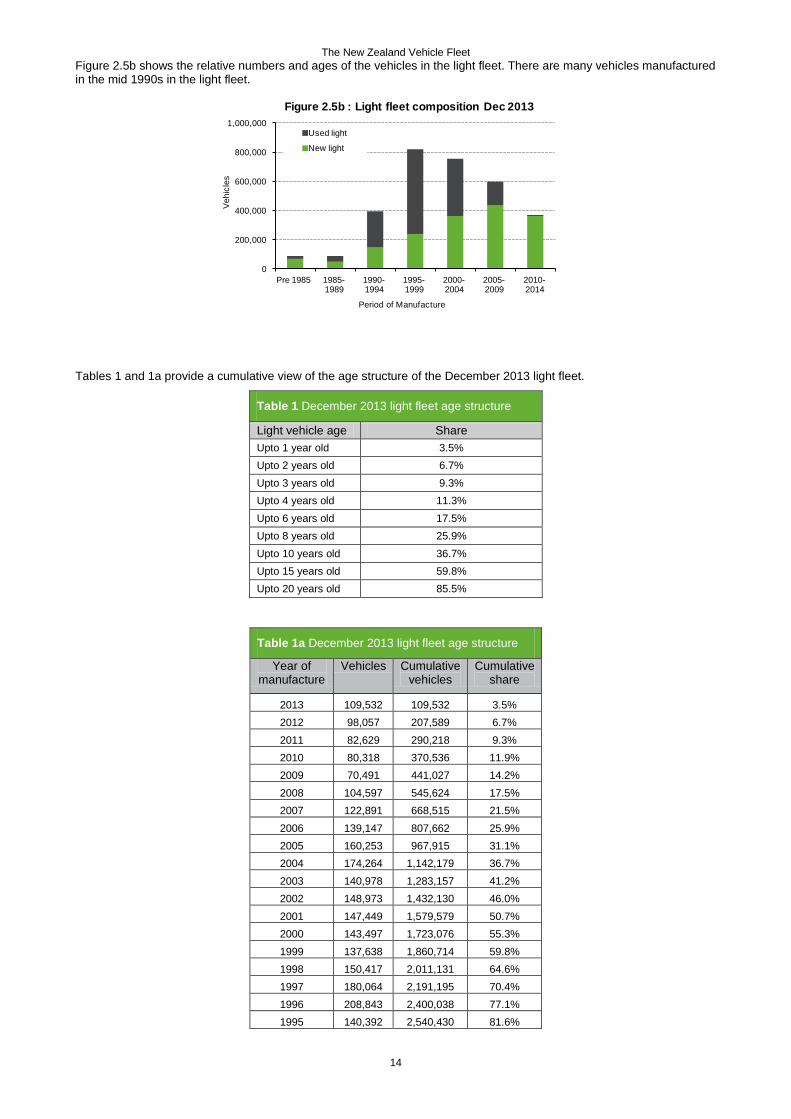
The New Zealand Vehicle Fleet Figure 2.5b shows the relative numbers and ages of the vehicles in the light fleet. There are many vehicles manufactured in the mid 1990s in the light fleet.
Tables 1 and 1a provide a cumulative view of the age structure of the December 2013 light fleet.
Table 1 December 2013 light fleet age structure
Light vehicle age Share Upto 1 year old 3.5% Upto 2 years old 6.7% Upto 3 years old 9.3% Upto 4 years old 11.3% Upto 6 years old 17.5% Upto 8 years old 25.9% Upto 10 years old 36.7% Upto 15 years old 59.8% Upto 20 years old 85.5%
Table 1a December 2013 light fleet age structure
Year of manufacture
Vehicles Cumulative vehicles
Cumulative share
2013 109,532 109,532 3.5% 2012 98,057 207,589 6.7% 2011 82,629 290,218 9.3% 2010 80,318 370,536 11.9% 2009 70,491 441,027 14.2% 2008 104,597 545,624 17.5% 2007 122,891 668,515 21.5% 2006 139,147 807,662 25.9% 2005 160,253 967,915 31.1% 2004 174,264 1,142,179 36.7% 2003 140,978 1,283,157 41.2% 2002 148,973 1,432,130 46.0% 2001 147,449 1,579,579 50.7% 2000 143,497 1,723,076 55.3% 1999 137,638 1,860,714 59.8% 1998 150,417 2,011,131 64.6% 1997 180,064 2,191,195 70.4% 1996 208,843 2,400,038 77.1% 1995 140,392 2,540,430 81.6%
0
200,000
400,000
600,000
800,000
1,000,000
Pre 1985 1985-1989
1990-1994
1995-1999
2000-2004
2005-2009
2010-2014
Veh
icle
s
Period of Manufacture
Figure 2.5b : Light fleet composition Dec 2013
Used light
New light
14
The New Zealand Vehicle Fleet 1994 119,932 2,660,362 85.5% 1993 84,290 2,744,652 88.2% 1992 78,815 2,823,467 90.7% 1991 61,162 2,884,629 92.7% 1990 53,414 2,938,043 94.4% 1989 35,589 2,973,632 95.5% 1988 21,013 2,994,645 96.2% 1987 13,490 3,008,135 96.6% 1986 10,077 3,018,212 97.0%
1985 8,101 3,026,313 97.2% 1984 5,784 3,032,097 97.4% 1983 3,648 3,035,745 97.5% 1982 3,357 3,039,102 97.6% 1981 2,901 3,042,003 97.7%
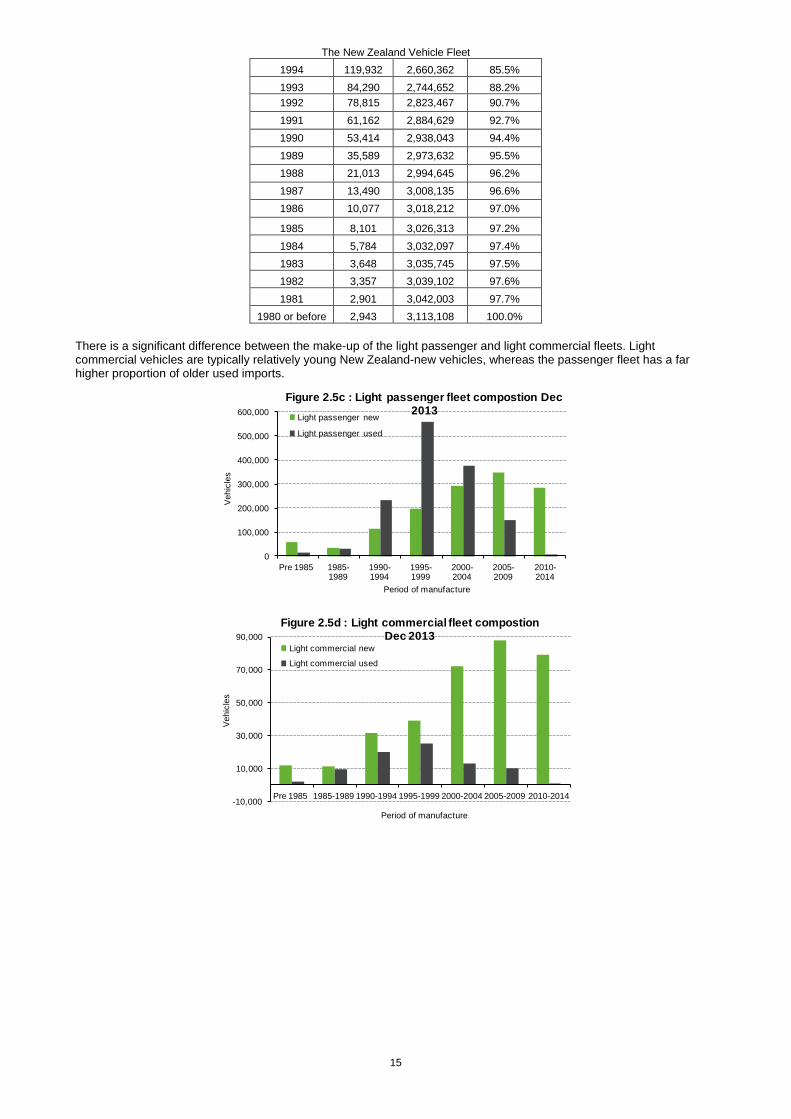
1980 or before 2,943 3,113,108 100.0% There is a significant difference between the make-up of the light passenger and light commercial fleets. Light commercial vehicles are typically relatively young New Zealand-new vehicles, whereas the passenger fleet has a far higher proportion of older used imports.
0
100,000
200,000
300,000
400,000
500,000
600,000
Pre 1985 1985-1989
1990-1994
1995-1999
2000-2004
2005-2009
2010-2014
Veh
icle
s
Period of manufacture
Figure 2.5c : Light passenger fleet compostion Dec 2013
Light passenger new
Light passenger used
-10,000
10,000
30,000
50,000
70,000
90,000
Pre 1985 1985-1989 1990-1994 1995-1999 2000-2004 2005-2009 2010-2014
Veh
icle
s
Period of manufacture
Figure 2.5d : Light commercial fleet compostion Dec 2013
Light commercial new
Light commercial used
15
The New Zealand Vehicle Fleet Motorcycle and moped year of manufacture
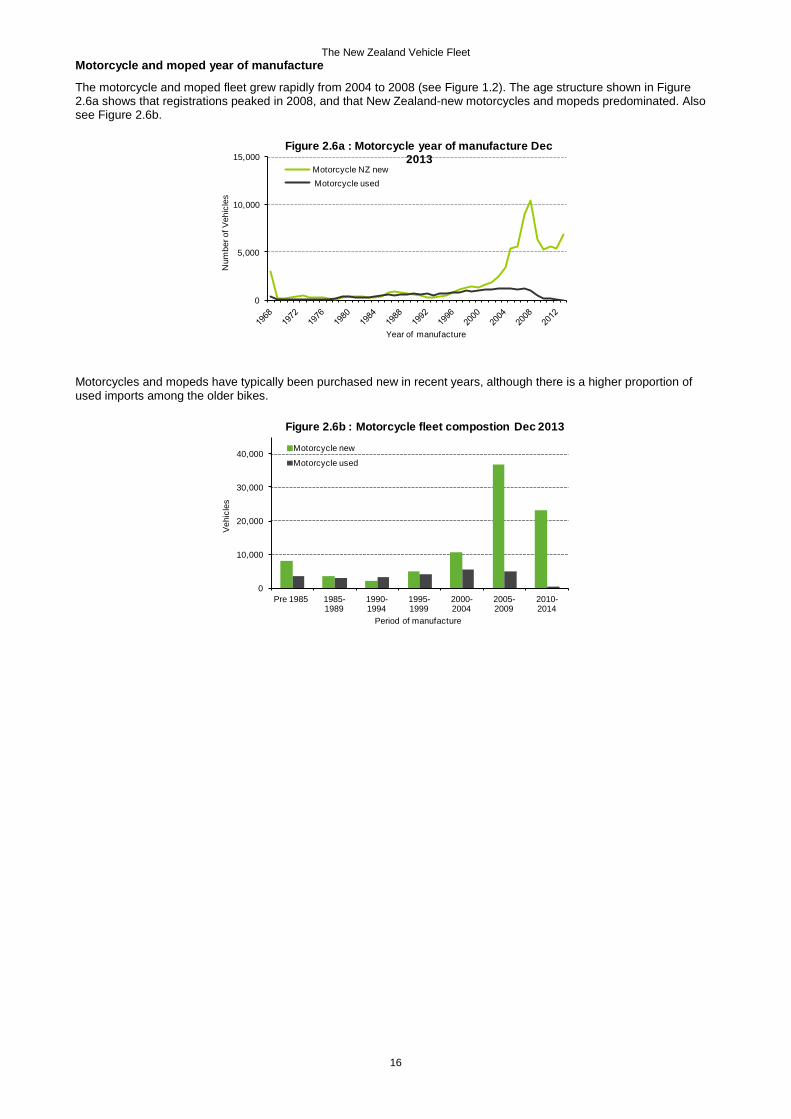
The motorcycle and moped fleet grew rapidly from 2004 to 2008 (see Figure 1.2). The age structure shown in Figure 2.6a shows that registrations peaked in 2008, and that New Zealand-new motorcycles and mopeds predominated. Also see Figure 2.6b.
Motorcycles and mopeds have typically been purchased new in recent years, although there is a higher proportion of used imports among the older bikes.
0
5,000
10,000
15,000
Num
ber o
f Veh
icle
s
Year of manufacture
Figure 2.6a : Motorcycle year of manufacture Dec 2013
Motorcycle NZ newMotorcycle used
0
10,000
20,000
30,000
40,000
Pre 1985 1985-1989
1990-1994
1995-1999
2000-2004
2005-2009
2010-2014
Veh
icle
s
Period of manufacture
Figure 2.6b : Motorcycle fleet compostion Dec 2013
Motorcycle new
Motorcycle used
16
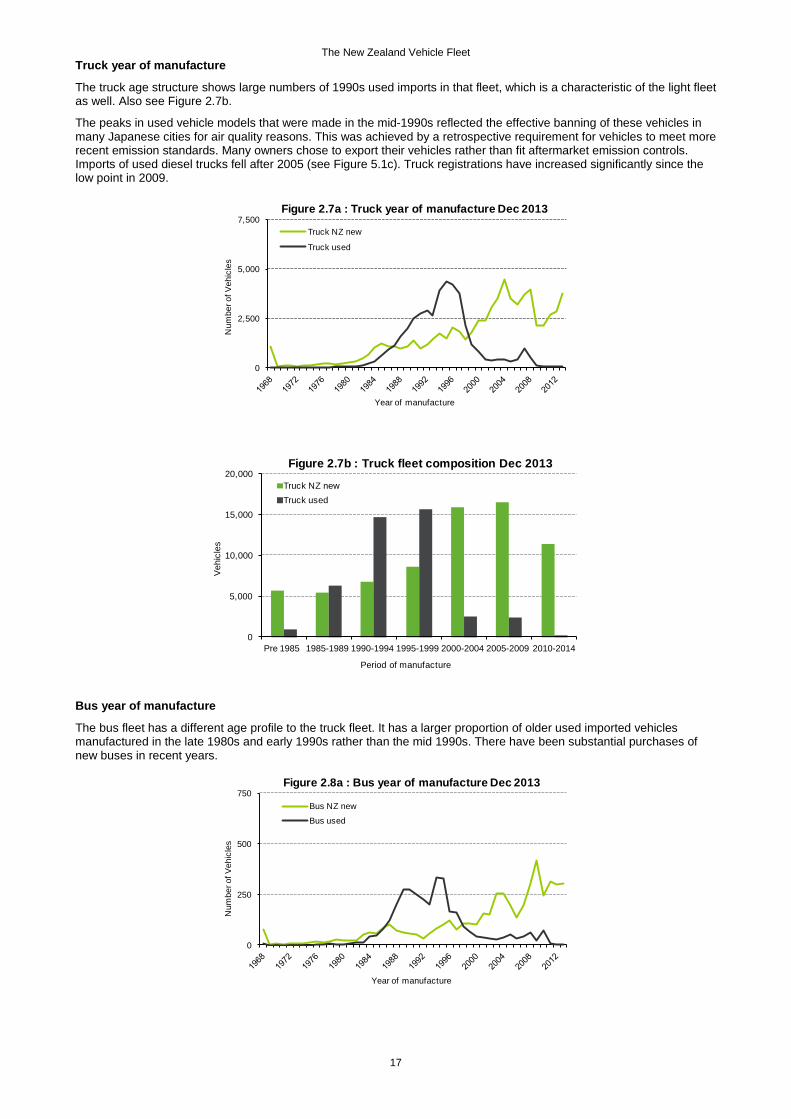
The New Zealand Vehicle Fleet Truck year of manufacture
The truck age structure shows large numbers of 1990s used imports in that fleet, which is a characteristic of the light fleet as well. Also see Figure 2.7b.
The peaks in used vehicle models that were made in the mid-1990s reflected the effective banning of these vehicles in many Japanese cities for air quality reasons. This was achieved by a retrospective requirement for vehicles to meet more recent emission standards. Many owners chose to export their vehicles rather than fit aftermarket emission controls. Imports of used diesel trucks fell after 2005 (see Figure 5.1c). Truck registrations have increased significantly since the low point in 2009.
Bus year of manufacture
The bus fleet has a different age profile to the truck fleet. It has a larger proportion of older used imported vehicles manufactured in the late 1980s and early 1990s rather than the mid 1990s. There have been substantial purchases of new buses in recent years.
0
2,500
5,000
7,500N
umbe
r of V
ehic
les
Year of manufacture
Figure 2.7a : Truck year of manufacture Dec 2013
Truck NZ new
Truck used
0
5,000
10,000
15,000
20,000
Pre 1985 1985-1989 1990-1994 1995-1999 2000-2004 2005-2009 2010-2014
Veh
icle
s
Period of manufacture
Figure 2.7b : Truck fleet composition Dec 2013
Truck NZ newTruck used
0
250
500
750
Num
ber o
f Veh
icle
s
Year of manufacture
Figure 2.8a : Bus year of manufacture Dec 2013
Bus NZ new
Bus used
17
The New Zealand Vehicle Fleet
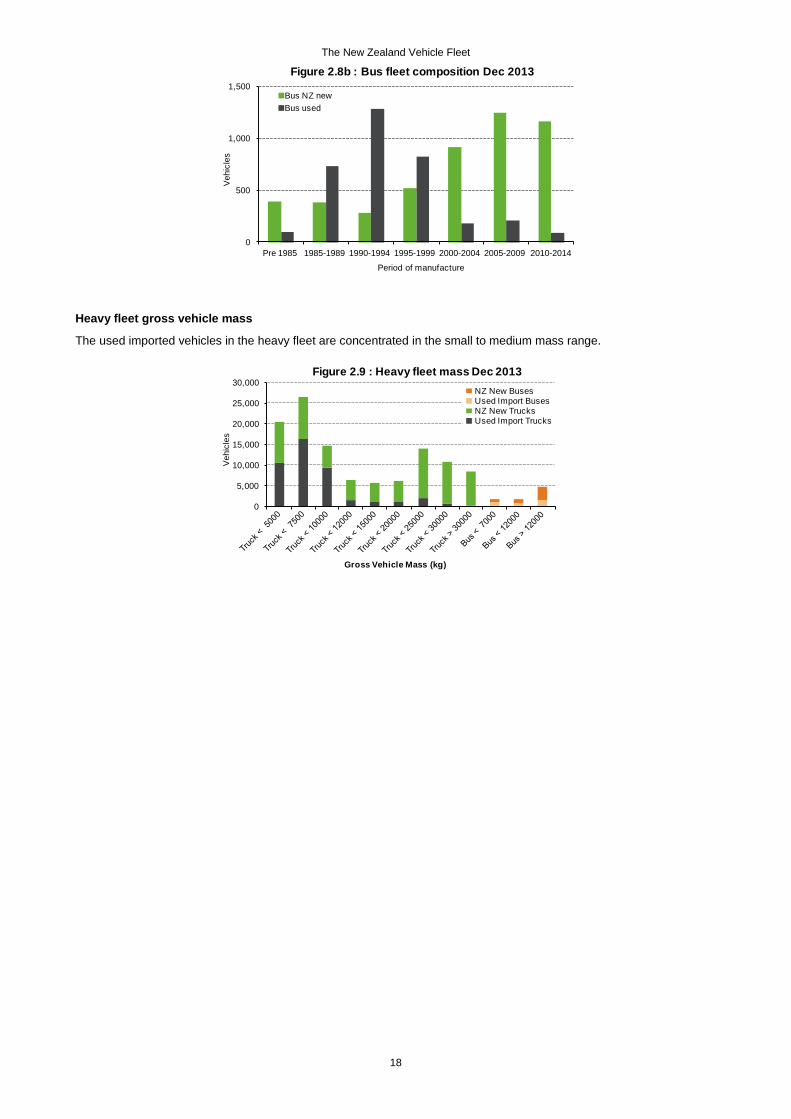
Heavy fleet gross vehicle mass
The used imported vehicles in the heavy fleet are concentrated in the small to medium mass range.
0
500
1,000
1,500
Pre 1985 1985-1989 1990-1994 1995-1999 2000-2004 2005-2009 2010-2014
Veh
icle
s
Period of manufacture
Figure 2.8b : Bus fleet composition Dec 2013
Bus NZ newBus used
0
5,000
10,000
15,000
20,000
25,000
30,000
Veh
icle
s
Gross Vehicle Mass (kg)
Figure 2.9 : Heavy fleet mass Dec 2013NZ New BusesUsed Import BusesNZ New TrucksUsed Import Trucks
18
The New Zealand Vehicle Fleet
Light fleet age structure
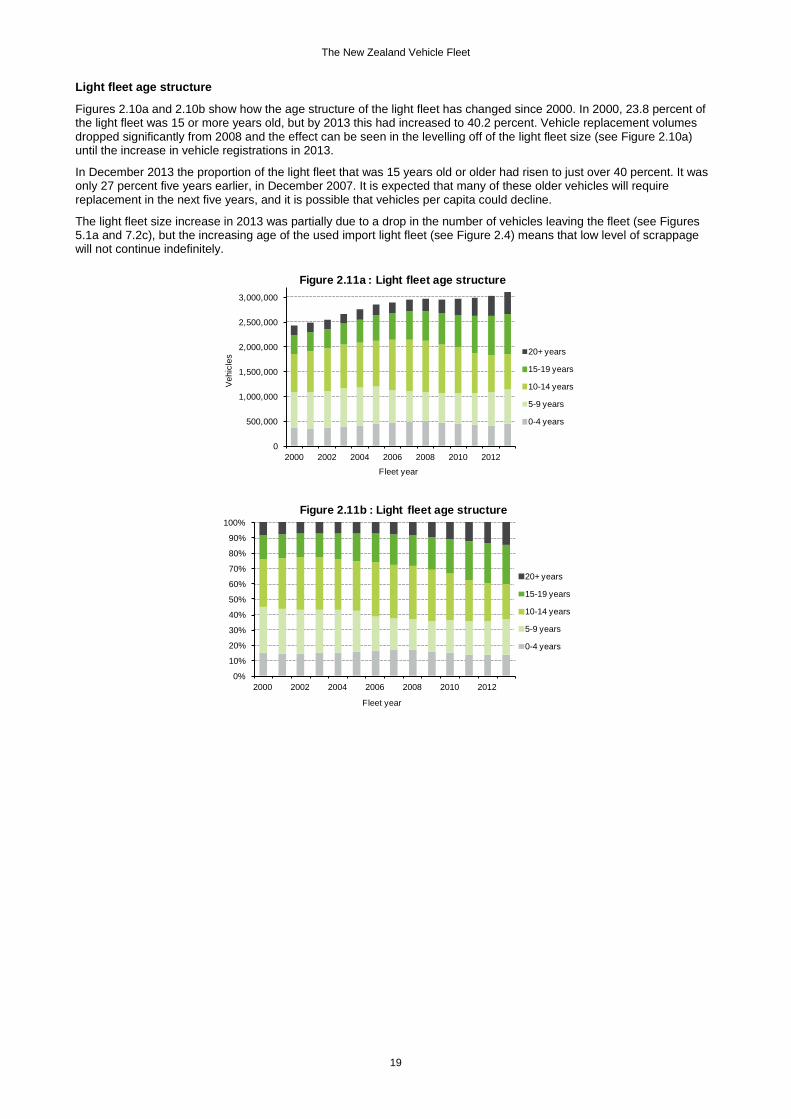
Figures 2.10a and 2.10b show how the age structure of the light fleet has changed since 2000. In 2000, 23.8 percent of the light fleet was 15 or more years old, but by 2013 this had increased to 40.2 percent. Vehicle replacement volumes dropped significantly from 2008 and the effect can be seen in the levelling off of the light fleet size (see Figure 2.10a) until the increase in vehicle registrations in 2013.
In December 2013 the proportion of the light fleet that was 15 years old or older had risen to just over 40 percent. It was only 27 percent five years earlier, in December 2007. It is expected that many of these older vehicles will require replacement in the next five years, and it is possible that vehicles per capita could decline.
The light fleet size increase in 2013 was partially due to a drop in the number of vehicles leaving the fleet (see Figures 5.1a and 7.2c), but the increasing age of the used import light fleet (see Figure 2.4) means that low level of scrappage will not continue indefinitely.
0
500,000
1,000,000
1,500,000
2,000,000
2,500,000
3,000,000
2000 2002 2004 2006 2008 2010 2012
Veh
icle
s
Fleet year
Figure 2.11a : Light fleet age structure
20+ years
15-19 years
10-14 years
5-9 years
0-4 years
0%
10%
20%
30%
40%
50%
60%
70%
80%
90%
100%
2000 2002 2004 2006 2008 2010 2012
Fleet year
Figure 2.11b : Light fleet age structure
20+ years
15-19 years
10-14 years
5-9 years
0-4 years
19
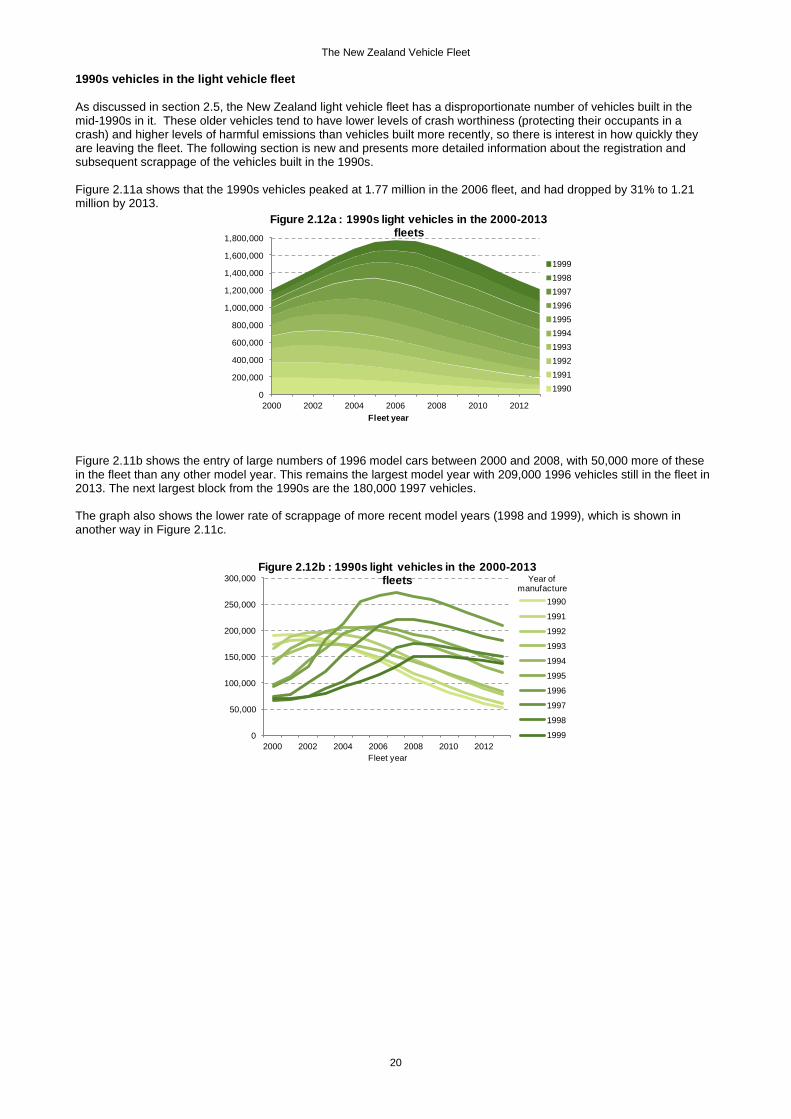
The New Zealand Vehicle Fleet 1990s vehicles in the light vehicle fleet As discussed in section 2.5, the New Zealand light vehicle fleet has a disproportionate number of vehicles built in the mid-1990s in it. These older vehicles tend to have lower levels of crash worthiness (protecting their occupants in a crash) and higher levels of harmful emissions than vehicles built more recently, so there is interest in how quickly they are leaving the fleet. The following section is new and presents more detailed information about the registration and subsequent scrappage of the vehicles built in the 1990s. Figure 2.11a shows that the 1990s vehicles peaked at 1.77 million in the 2006 fleet, and had dropped by 31% to 1.21 million by 2013.
Figure 2.11b shows the entry of large numbers of 1996 model cars between 2000 and 2008, with 50,000 more of these in the fleet than any other model year. This remains the largest model year with 209,000 1996 vehicles still in the fleet in 2013. The next largest block from the 1990s are the 180,000 1997 vehicles. The graph also shows the lower rate of scrappage of more recent model years (1998 and 1999), which is shown in another way in Figure 2.11c.
0
200,000
400,000
600,000
800,000
1,000,000
1,200,000
1,400,000
1,600,000
1,800,000
2000 2002 2004 2006 2008 2010 2012Fleet year
Figure 2.12a : 1990s light vehicles in the 2000-2013 fleets
1999199819971996199519941993199219911990
0
50,000
100,000
150,000
200,000
250,000
300,000
2000 2002 2004 2006 2008 2010 2012Fleet year
Figure 2.12b : 1990s light vehicles in the 2000-2013 fleets
1990
1991
1992
1993
1994
1995
1996
1997
1998
1999
Year of manufacture
20
The New Zealand Vehicle Fleet Table 2 shows the rates of entry and exit of 1990s vehicles in the 2001-2013 fleets. Green shaded cells show when vehicle numbers were increasing (positive growth rates shown in the cells) and the red cells show when vehicle numbers were dropping (negative growth rates):
• the average scrappage rate of all 1990s vehicles in 2013 was 7.2% ie 7.2% of those vehicles in the fleet at the start of 2013 left during the year
• the scrappage rate for 1990-1993 vehicles was above 10% in 2013. That has been the pattern for several years
• the scrappage rate for 1996 and 1997 vehicles, while increasing, was lower at 6% and 5.1% respectively
• large numbers of 1994-1997 vehicles will be in the fleet for some time (currently 649,000 vehicles, down from 696,000 a year ago or 6.7%)
TABLE 2 Change in 1990s vehicles in the fleet
Vehicle year
Fleet year 1990 1991 1992 1993 1994 1995 1996 1997 1998 1999 Total 2001 0.4% 4.2% 14.1% 11.3% 21.2% 15.3% 16.2% 6.0% 4.5% 0.9%
9.5%
2002 -2.0% 0.4% 3.8% 7.1% 10.0% 28.3% 21.5% 26.3% 8.1% 6.1%
8.9% 2003 -3.8% -2.1% 0.2% 1.7% 9.5% 16.7% 37.7% 20.8% 21.3% 8.1%
8.7%
2004 -5.5% -3.8% -2.1% 0.1% 3.1% 16.9% 17.5% 28.5% 15.0% 15.6%
6.8% 2005 -7.6% -5.7% -4.0% -2.2% 0.8% 5.8% 19.3% 15.1% 22.6% 9.7%
4.5%
2006 -
10.1% -8.0% -6.3% -4.7% -2.7% 0.7% 4.8% 16.2% 13.1% 14.9%
1.2%
2007 -
11.6% -9.5% -7.7% -6.1% -4.2% -2.3% 2.0% 5.7% 17.5% 12.0%
-0.6%
2008 -
14.0% -
11.7% -9.7% -7.9% -5.9% -4.2% -2.0% -0.4% 4.3% 13.6%
-3.5%
2009 -
12.7% -
11.2% -9.5% -7.9% -6.0% -4.4% -3.2% -2.4% -1.1% 2.0%
-5.0%
2010 -
12.7% -
11.4% -
10.4% -8.4% -6.7% -5.2% -3.8% -3.1% -2.4% -1.5%
-5.7%
2011 -
14.4% -
13.4% -
12.2% -
10.5% -8.6% -6.6% -5.1% -4.2% -3.3% -2.3%
-7.0%
2012 -
14.1% -
13.7% -
12.8% -
10.9% -9.0% -7.5% -5.7% -4.7% -3.5% -2.8%
-7.3%
2013 -
12.3% -
12.3% -
12.2% -
10.6% -9.3% -7.6% -6.0% -5.1% -4.1% -3.2%
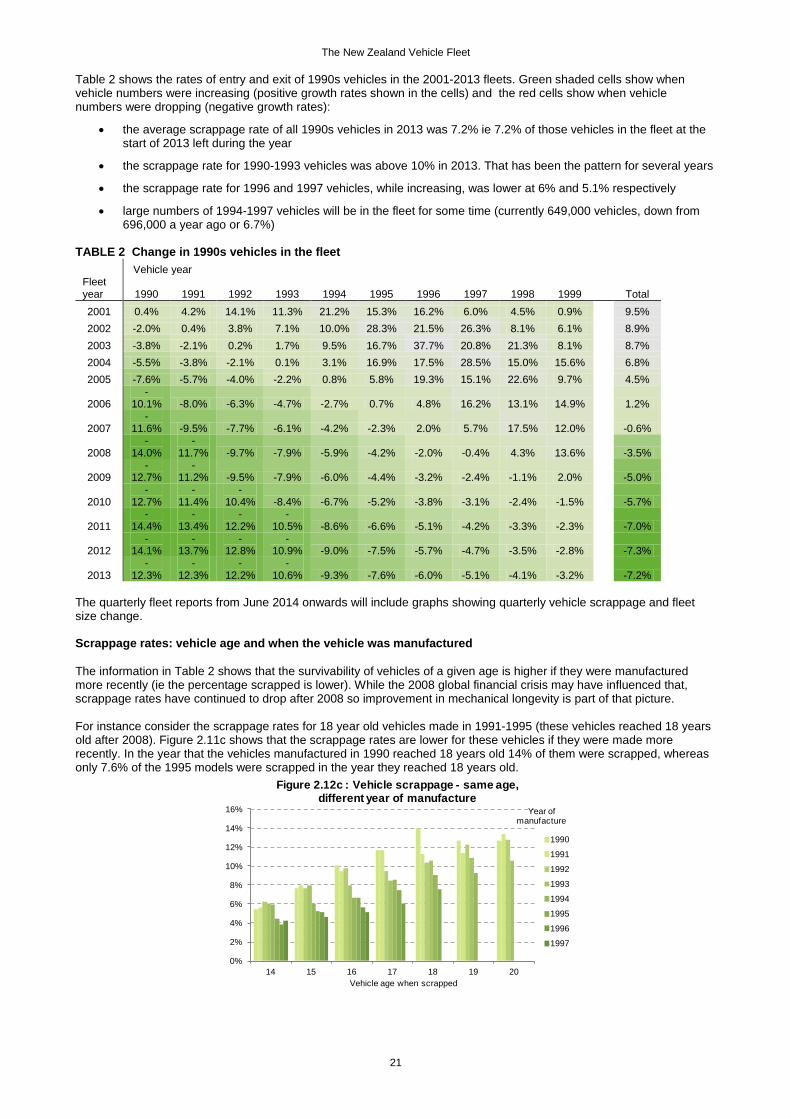
-7.2% The quarterly fleet reports from June 2014 onwards will include graphs showing quarterly vehicle scrappage and fleet size change. Scrappage rates: vehicle age and when the vehicle was manufactured The information in Table 2 shows that the survivability of vehicles of a given age is higher if they were manufactured more recently (ie the percentage scrapped is lower). While the 2008 global financial crisis may have influenced that, scrappage rates have continued to drop after 2008 so improvement in mechanical longevity is part of that picture. For instance consider the scrappage rates for 18 year old vehicles made in 1991-1995 (these vehicles reached 18 years old after 2008). Figure 2.11c shows that the scrappage rates are lower for these vehicles if they were made more recently. In the year that the vehicles manufactured in 1990 reached 18 years old 14% of them were scrapped, whereas only 7.6% of the 1995 models were scrapped in the year they reached 18 years old.
0%
2%
4%
6%
8%
10%
12%
14%
16%
14 15 16 17 18 19 20Vehicle age when scrapped
Figure 2.12c : Vehicle scrappage - same age, different year of manufacture
1990
1991
1992
1993
1994
1995
1996
1997
Year of manufacture
21
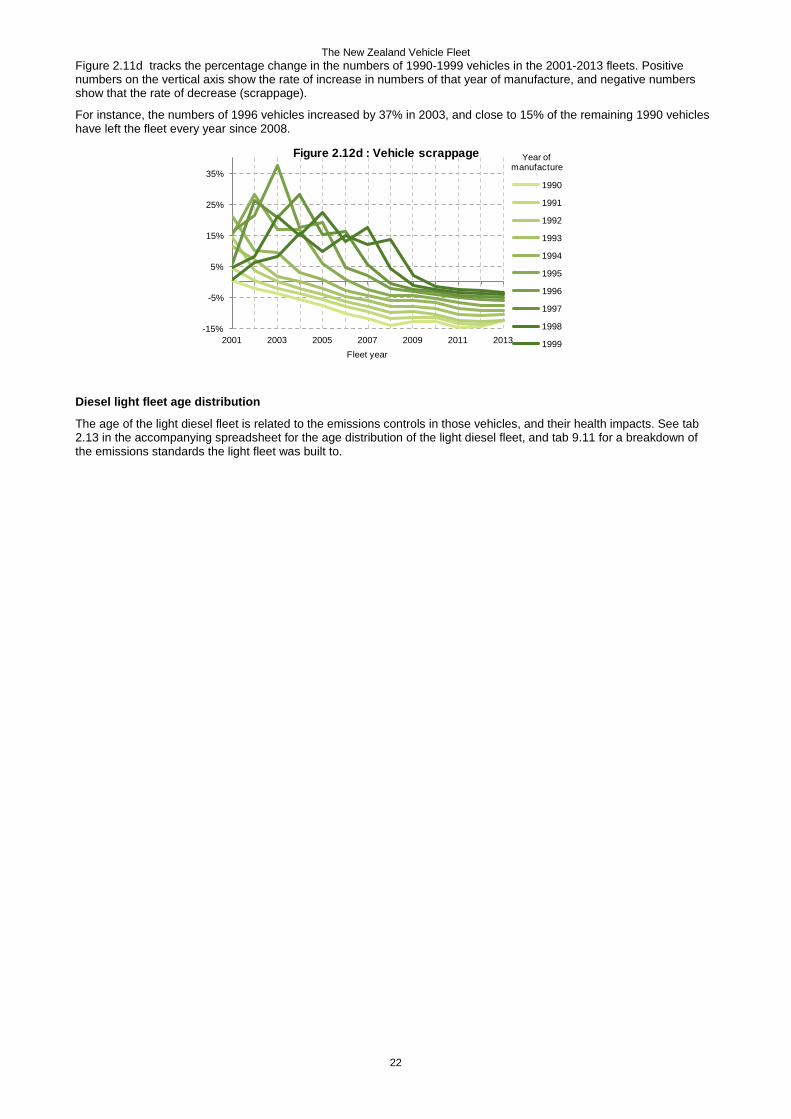
The New Zealand Vehicle Fleet Figure 2.11d tracks the percentage change in the numbers of 1990-1999 vehicles in the 2001-2013 fleets. Positive numbers on the vertical axis show the rate of increase in numbers of that year of manufacture, and negative numbers show that the rate of decrease (scrappage).
For instance, the numbers of 1996 vehicles increased by 37% in 2003, and close to 15% of the remaining 1990 vehicles have left the fleet every year since 2008.
Diesel light fleet age distribution
The age of the light diesel fleet is related to the emissions controls in those vehicles, and their health impacts. See tab 2.13 in the accompanying spreadsheet for the age distribution of the light diesel fleet, and tab 9.11 for a breakdown of the emissions standards the light fleet was built to.
-15%
-5%
5%
15%
25%
35%
2001 2003 2005 2007 2009 2011 2013Fleet year
Figure 2.12d : Vehicle scrappage
1990
1991
1992
1993
1994
1995
1996
1997
1998
1999
Year of manufacture
22
The New Zealand Vehicle Fleet
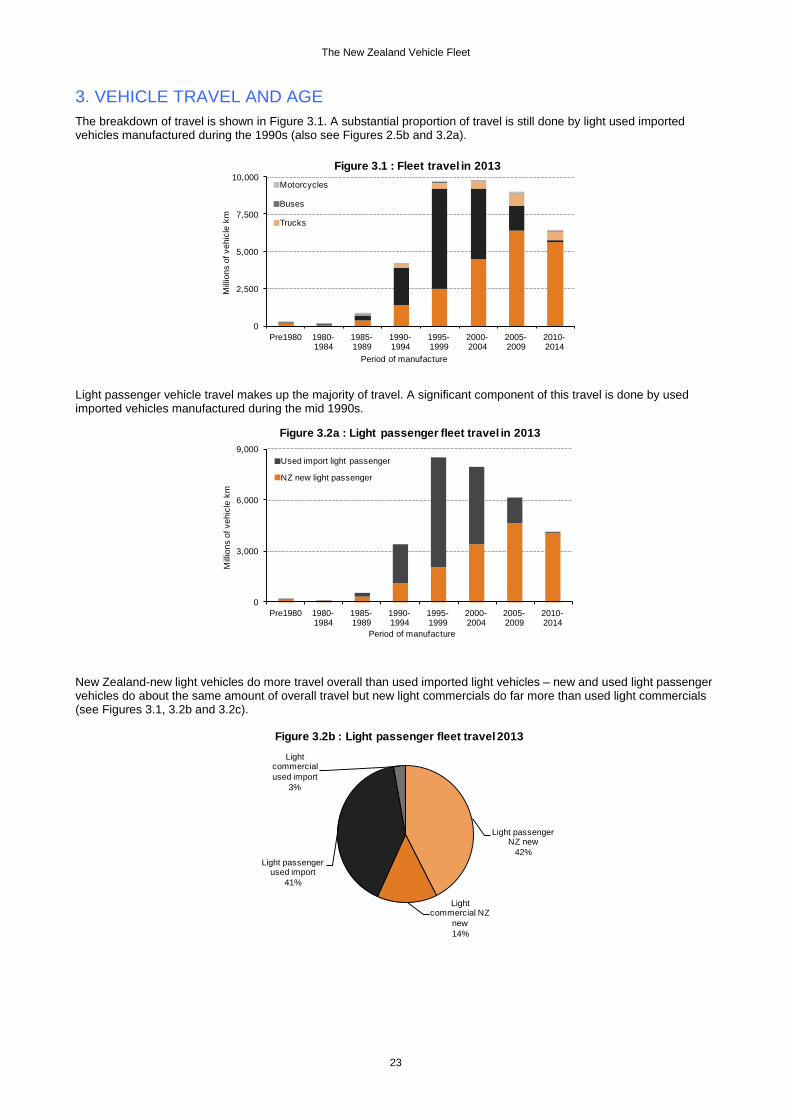
3. VEHICLE TRAVEL AND AGE The breakdown of travel is shown in Figure 3.1. A substantial proportion of travel is still done by light used imported vehicles manufactured during the 1990s (also see Figures 2.5b and 3.2a).
Light passenger vehicle travel makes up the majority of travel. A significant component of this travel is done by used imported vehicles manufactured during the mid 1990s.
New Zealand-new light vehicles do more travel overall than used imported light vehicles – new and used light passenger vehicles do about the same amount of overall travel but new light commercials do far more than used light commercials (see Figures 3.1, 3.2b and 3.2c).
0
2,500
5,000
7,500
10,000
Pre1980 1980-1984
1985-1989
1990-1994
1995-1999
2000-2004
2005-2009
2010-2014
Mill
ions
of v
ehic
le k
m
Period of manufacture
Figure 3.1 : Fleet travel in 2013 Motorcycles
Buses
Trucks
0
3,000
6,000
9,000
Pre1980 1980-1984
1985-1989
1990-1994
1995-1999
2000-2004
2005-2009
2010-2014
Mill
ions
of v
ehic
le k
m
Period of manufacture
Figure 3.2a : Light passenger fleet travel in 2013
Used import light passenger
NZ new light passenger
Light passenger NZ new
42%
Light commercial NZ
new14%
Light passenger used import
41%
Light commercial used import
3%
Figure 3.2b : Light passenger fleet travel 2013
23
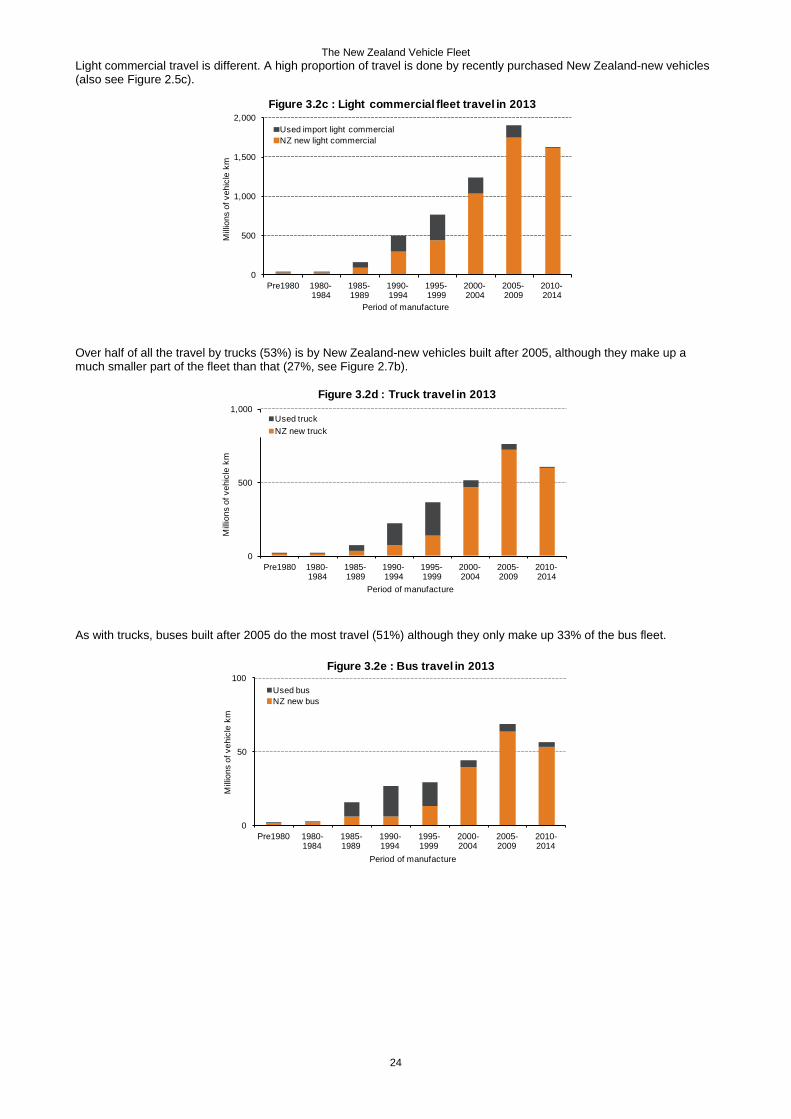
The New Zealand Vehicle Fleet Light commercial travel is different. A high proportion of travel is done by recently purchased New Zealand-new vehicles (also see Figure 2.5c).
Over half of all the travel by trucks (53%) is by New Zealand-new vehicles built after 2005, although they make up a much smaller part of the fleet than that (27%, see Figure 2.7b).
As with trucks, buses built after 2005 do the most travel (51%) although they only make up 33% of the bus fleet.
0
500
1,000
1,500
2,000
Pre1980 1980-1984
1985-1989
1990-1994
1995-1999
2000-2004
2005-2009
2010-2014
Milli
ons
of v
ehic
le k
m
Period of manufacture
Figure 3.2c : Light commercial fleet travel in 2013
Used import light commercialNZ new light commercial
0
500
1,000
Pre1980 1980-1984
1985-1989
1990-1994
1995-1999
2000-2004
2005-2009
2010-2014
Mill
ions
of v
ehic
le k
m
Period of manufacture
Figure 3.2d : Truck travel in 2013
Used truckNZ new truck
0
50
100
Pre1980 1980-1984
1985-1989
1990-1994
1995-1999
2000-2004
2005-2009
2010-2014
Mill
ions
of v
ehic
le k
m
Period of manufacture
Figure 3.2e : Bus travel in 2013
Used busNZ new bus
24
The New Zealand Vehicle Fleet
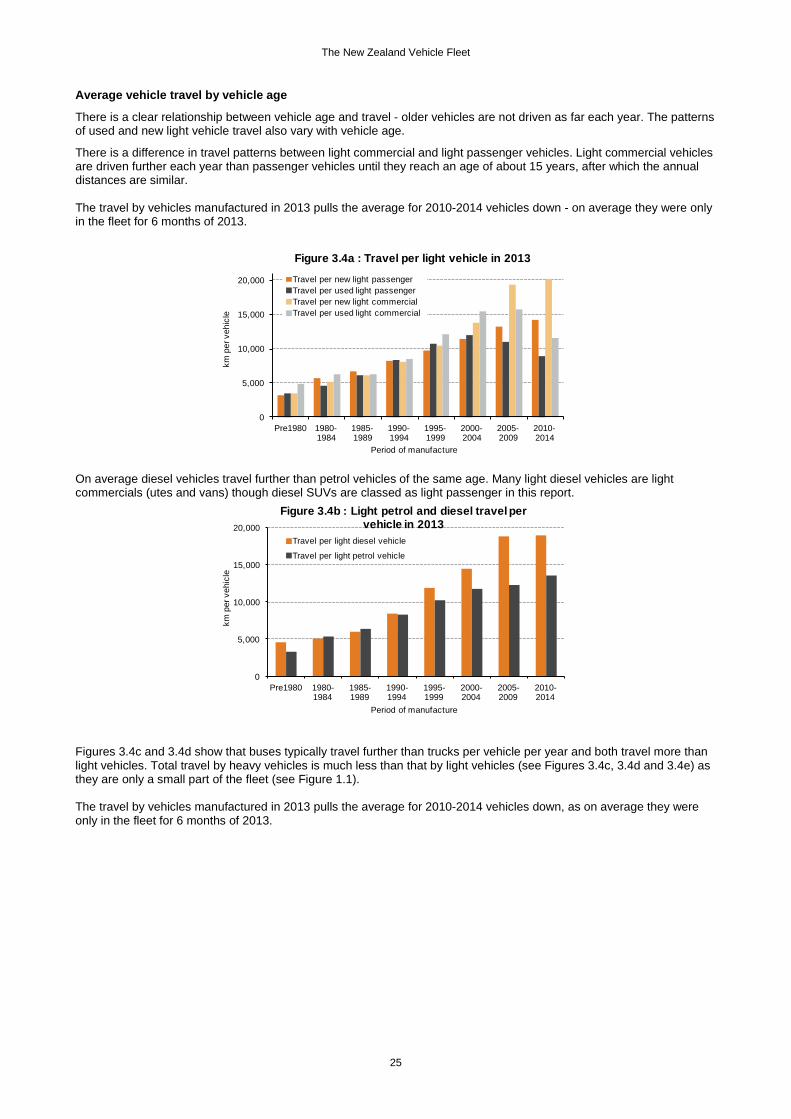
Average vehicle travel by vehicle age
There is a clear relationship between vehicle age and travel - older vehicles are not driven as far each year. The patterns of used and new light vehicle travel also vary with vehicle age.
There is a difference in travel patterns between light commercial and light passenger vehicles. Light commercial vehicles are driven further each year than passenger vehicles until they reach an age of about 15 years, after which the annual distances are similar. The travel by vehicles manufactured in 2013 pulls the average for 2010-2014 vehicles down - on average they were only in the fleet for 6 months of 2013.
On average diesel vehicles travel further than petrol vehicles of the same age. Many light diesel vehicles are light commercials (utes and vans) though diesel SUVs are classed as light passenger in this report.
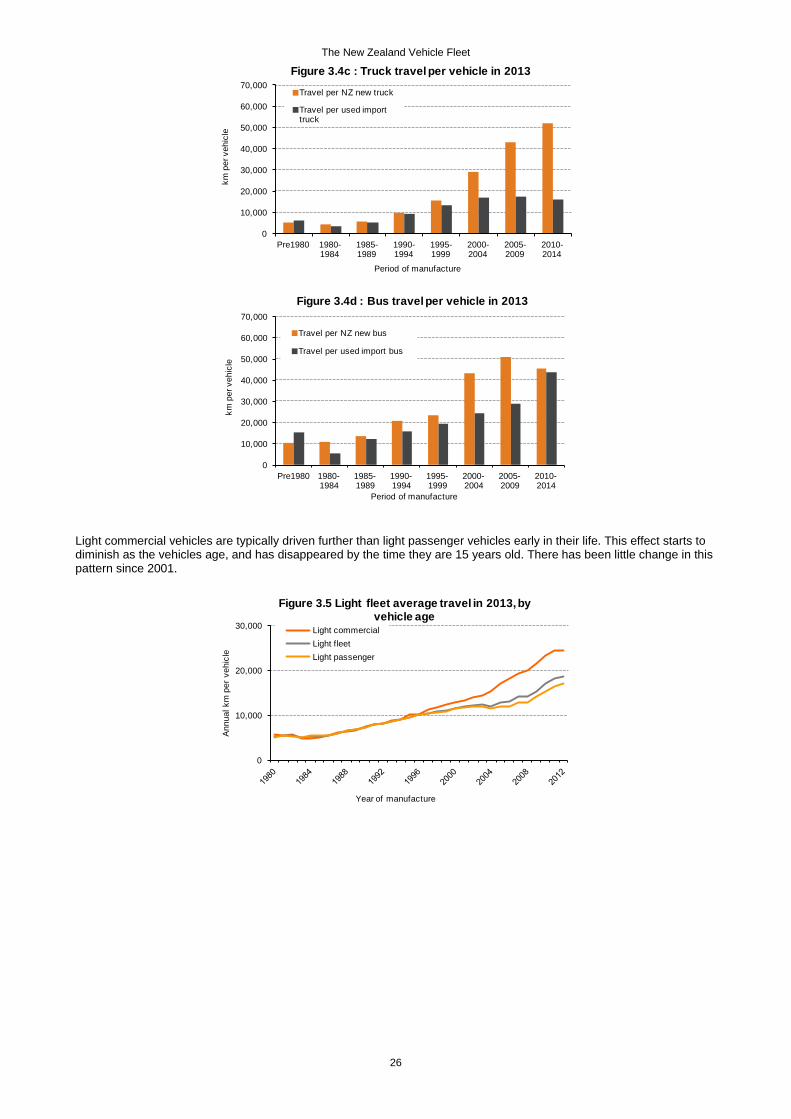
Figures 3.4c and 3.4d show that buses typically travel further than trucks per vehicle per year and both travel more than light vehicles. Total travel by heavy vehicles is much less than that by light vehicles (see Figures 3.4c, 3.4d and 3.4e) as they are only a small part of the fleet (see Figure 1.1). The travel by vehicles manufactured in 2013 pulls the average for 2010-2014 vehicles down, as on average they were only in the fleet for 6 months of 2013.
0
5,000
10,000
15,000
20,000
Pre1980 1980-1984
1985-1989
1990-1994
1995-1999
2000-2004
2005-2009
2010-2014
km p
er v
ehic
le
Period of manufacture
Figure 3.4a : Travel per light vehicle in 2013
Travel per new light passengerTravel per used light passengerTravel per new light commercialTravel per used light commercial
0
5,000
10,000
15,000
20,000
Pre1980 1980-1984
1985-1989
1990-1994
1995-1999
2000-2004
2005-2009
2010-2014
km p
er v
ehic
le
Period of manufacture
Figure 3.4b : Light petrol and diesel travel per vehicle in 2013
Travel per light diesel vehicle
Travel per light petrol vehicle
25
The New Zealand Vehicle Fleet
Light commercial vehicles are typically driven further than light passenger vehicles early in their life. This effect starts to diminish as the vehicles age, and has disappeared by the time they are 15 years old. There has been little change in this pattern since 2001.
0
10,000
20,000
30,000
40,000
50,000
60,000
70,000
Pre1980 1980-1984
1985-1989
1990-1994
1995-1999
2000-2004
2005-2009
2010-2014
km p
er v
ehic
le
Period of manufacture
Figure 3.4c : Truck travel per vehicle in 2013
Travel per NZ new truck
Travel per used import truck
0
10,000
20,000
30,000
40,000
50,000
60,000
70,000
Pre1980 1980-1984
1985-1989
1990-1994
1995-1999
2000-2004
2005-2009
2010-2014
km p
er v
ehic
le
Period of manufacture
Figure 3.4d : Bus travel per vehicle in 2013
Travel per NZ new bus
Travel per used import bus
0
10,000
20,000
30,000
Ann
ual k
m p
er v
ehic
le
Year of manufacture
Figure 3.5 Light fleet average travel in 2013, by vehicle age
Light commercialLight fleetLight passenger
26
The New Zealand Vehicle Fleet
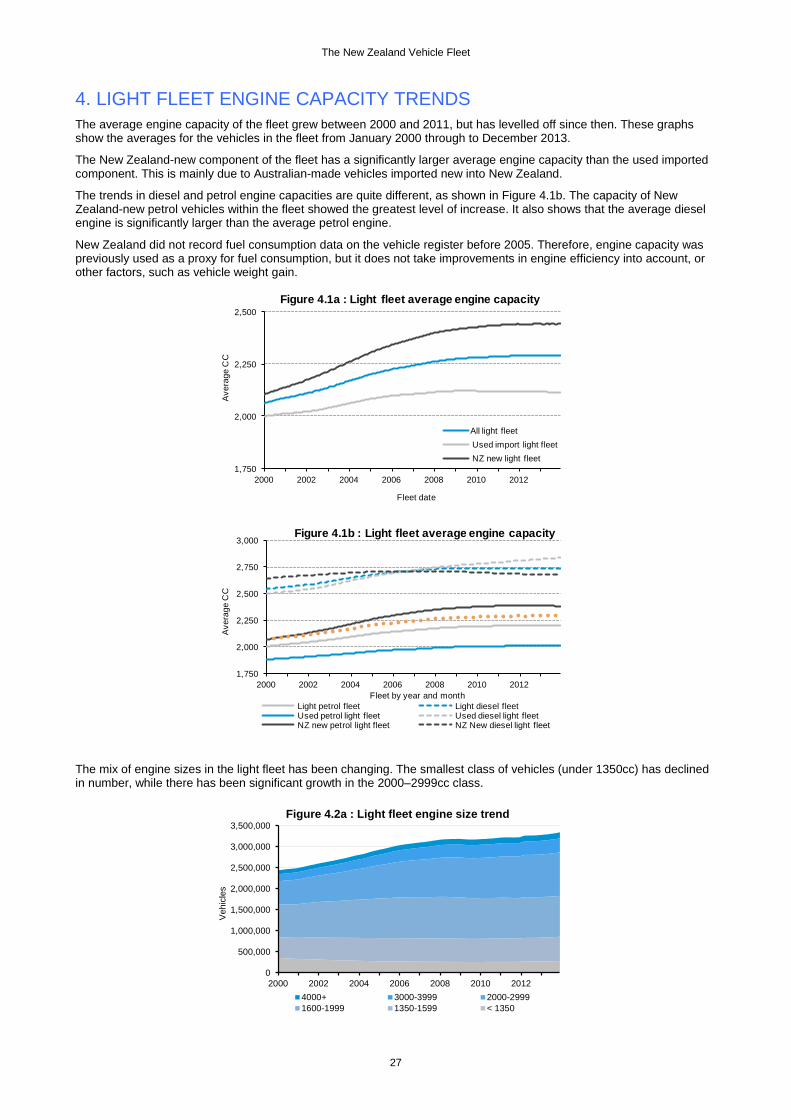
4. LIGHT FLEET ENGINE CAPACITY TRENDS The average engine capacity of the fleet grew between 2000 and 2011, but has levelled off since then. These graphs show the averages for the vehicles in the fleet from January 2000 through to December 2013.
The New Zealand-new component of the fleet has a significantly larger average engine capacity than the used imported component. This is mainly due to Australian-made vehicles imported new into New Zealand.
The trends in diesel and petrol engine capacities are quite different, as shown in Figure 4.1b. The capacity of New Zealand-new petrol vehicles within the fleet showed the greatest level of increase. It also shows that the average diesel engine is significantly larger than the average petrol engine.
New Zealand did not record fuel consumption data on the vehicle register before 2005. Therefore, engine capacity was previously used as a proxy for fuel consumption, but it does not take improvements in engine efficiency into account, or other factors, such as vehicle weight gain.
The mix of engine sizes in the light fleet has been changing. The smallest class of vehicles (under 1350cc) has declined in number, while there has been significant growth in the 2000–2999cc class.
1,750
2,000
2,250
2,500
2000 2002 2004 2006 2008 2010 2012
Ave
rage
CC
Fleet date
Figure 4.1a : Light fleet average engine capacity
All light fleetUsed import light fleetNZ new light fleet
1,750
2,000
2,250
2,500
2,750
3,000
2000 2002 2004 2006 2008 2010 2012
Ave
rage
CC
Fleet by year and month
Figure 4.1b : Light fleet average engine capacity
Light petrol fleet Light diesel fleetUsed petrol light fleet Used diesel light fleetNZ new petrol light fleet NZ New diesel light fleet
0
500,000
1,000,000
1,500,000
2,000,000
2,500,000
3,000,000
3,500,000
2000 2002 2004 2006 2008 2010 2012
Veh
icle
s
Figure 4.2a : Light fleet engine size trend
4000+ 3000-3999 2000-29991600-1999 1350-1599 < 1350
27
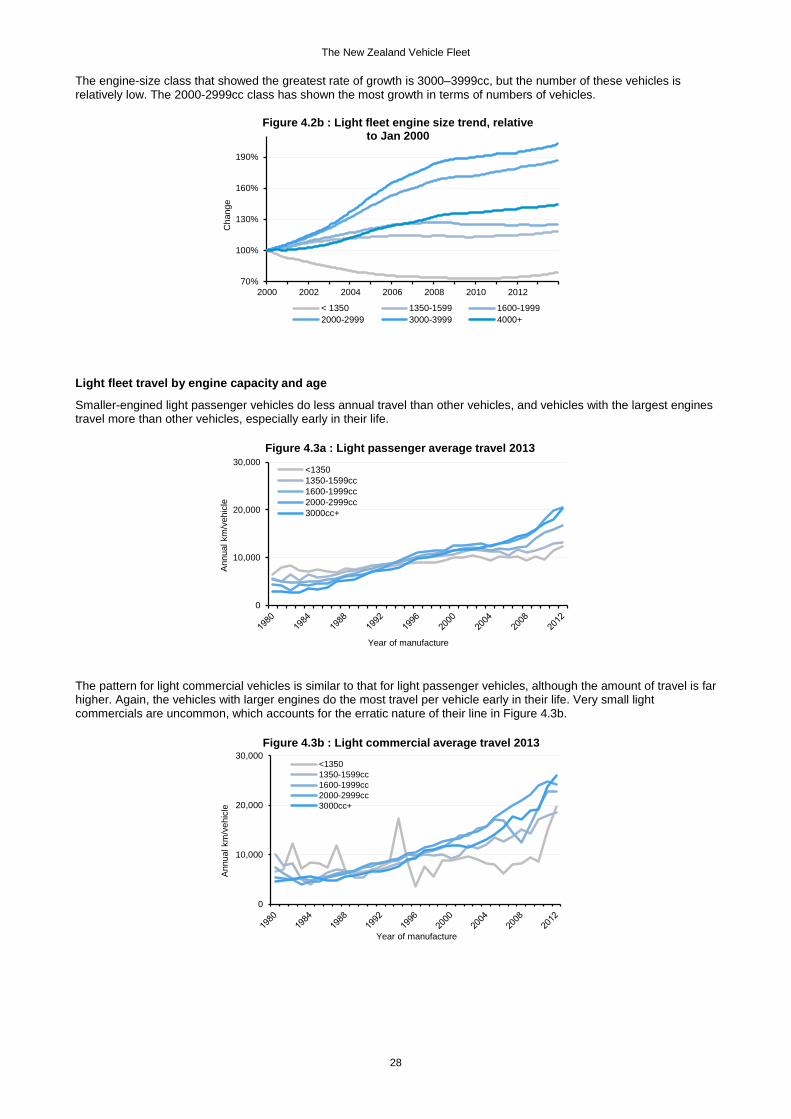
The New Zealand Vehicle Fleet The engine-size class that showed the greatest rate of growth is 3000–3999cc, but the number of these vehicles is relatively low. The 2000-2999cc class has shown the most growth in terms of numbers of vehicles.
Light fleet travel by engine capacity and age
Smaller-engined light passenger vehicles do less annual travel than other vehicles, and vehicles with the largest engines travel more than other vehicles, especially early in their life.
The pattern for light commercial vehicles is similar to that for light passenger vehicles, although the amount of travel is far higher. Again, the vehicles with larger engines do the most travel per vehicle early in their life. Very small light commercials are uncommon, which accounts for the erratic nature of their line in Figure 4.3b.
70%
100%
130%
160%
190%
2000 2002 2004 2006 2008 2010 2012
Cha
nge
Figure 4.2b : Light fleet engine size trend, relative to Jan 2000
< 1350 1350-1599 1600-19992000-2999 3000-3999 4000+
0
10,000
20,000
30,000
Ann
ual k
m/v
ehic
le
Year of manufacture
Figure 4.3a : Light passenger average travel 2013
<13501350-1599cc1600-1999cc2000-2999cc3000cc+
0
10,000
20,000
30,000
Ann
ual k
m/v
ehic
le
Year of manufacture
Figure 4.3b : Light commercial average travel 2013
<13501350-1599cc1600-1999cc2000-2999cc3000cc+
28
The New Zealand Vehicle Fleet
Light fleet travel trend by engine capacity
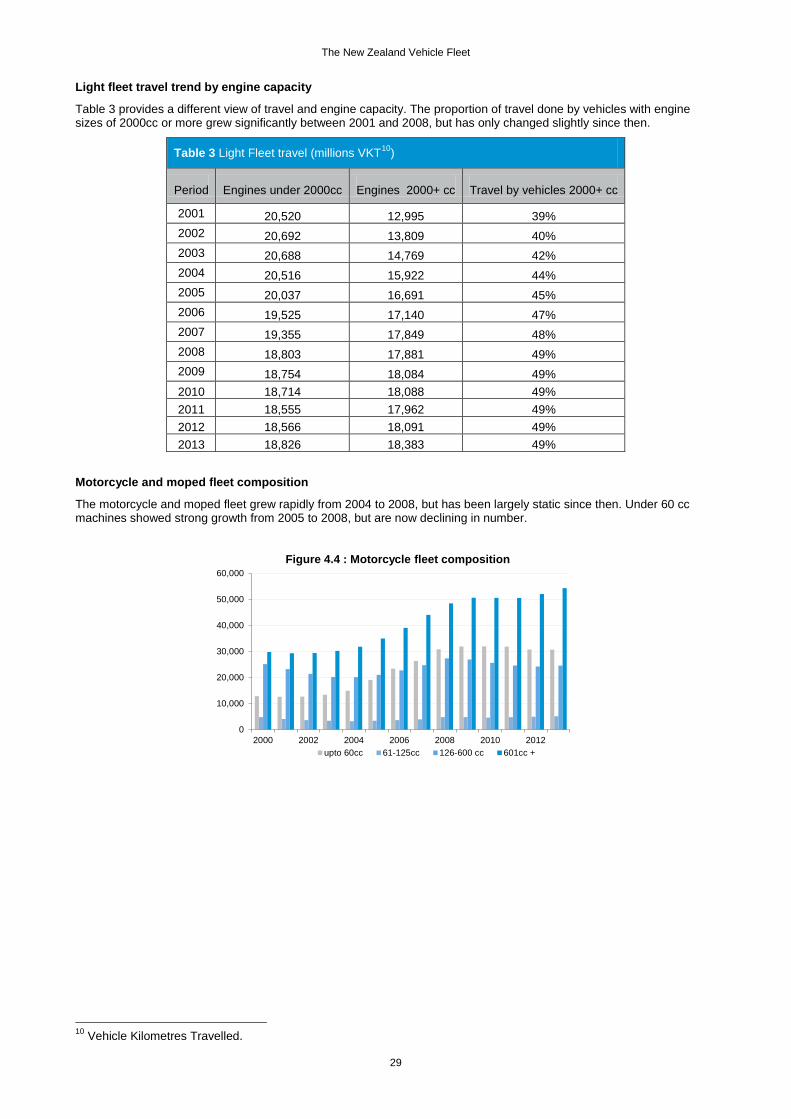
Table 3 provides a different view of travel and engine capacity. The proportion of travel done by vehicles with engine sizes of 2000cc or more grew significantly between 2001 and 2008, but has only changed slightly since then.
Table 3 Light Fleet travel (millions VKT10)
Period Engines under 2000cc Engines 2000+ cc Travel by vehicles 2000+ cc
2001 20,520 12,995 39% 2002 20,692 13,809 40% 2003 20,688 14,769 42% 2004 20,516 15,922 44% 2005 20,037 16,691 45% 2006 19,525 17,140 47% 2007 19,355 17,849 48% 2008 18,803 17,881 49% 2009 18,754 18,084 49% 2010 18,714 18,088 49% 2011 18,555 17,962 49% 2012 18,566 18,091 49% 2013 18,826 18,383 49%
Motorcycle and moped fleet composition
The motorcycle and moped fleet grew rapidly from 2004 to 2008, but has been largely static since then. Under 60 cc machines showed strong growth from 2005 to 2008, but are now declining in number.
10 Vehicle Kilometres Travelled.
0
10,000
20,000
30,000
40,000
50,000
60,000
2000 2002 2004 2006 2008 2010 2012
Figure 4.4 : Motorcycle fleet composition
upto 60cc 61-125cc 126-600 cc 601cc +
29
The New Zealand Vehicle Fleet
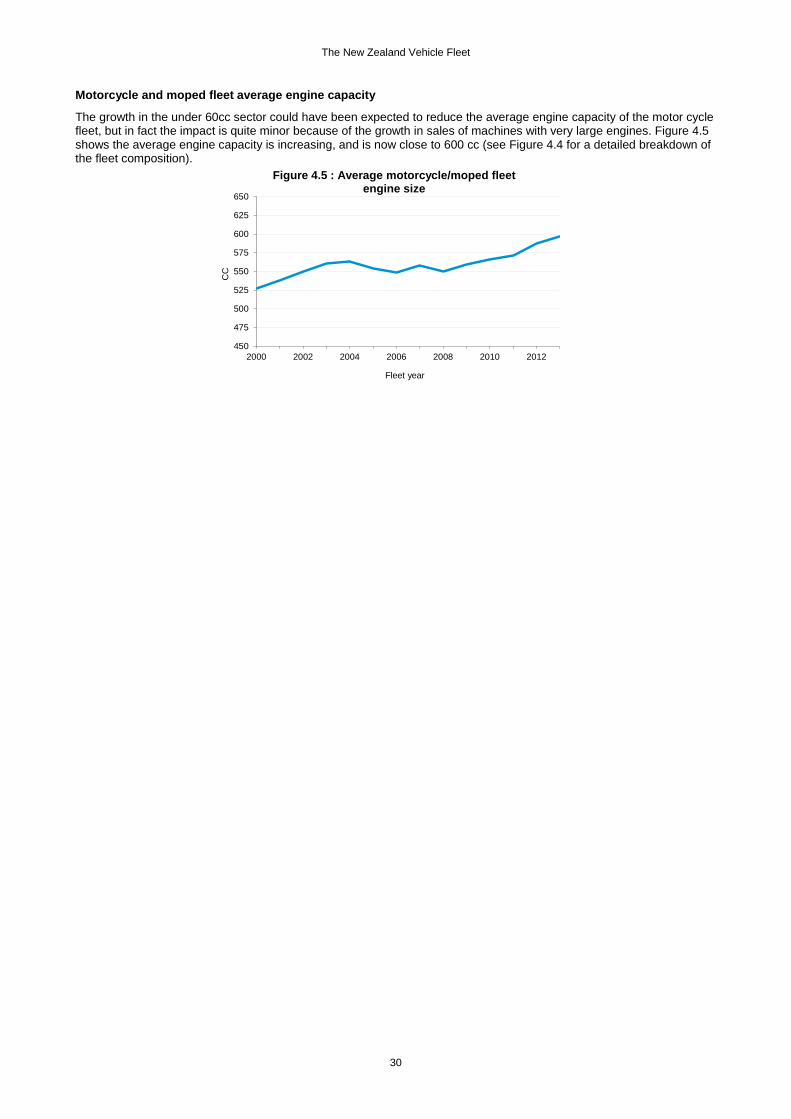
Motorcycle and moped fleet average engine capacity
The growth in the under 60cc sector could have been expected to reduce the average engine capacity of the motor cycle fleet, but in fact the impact is quite minor because of the growth in sales of machines with very large engines. Figure 4.5 shows the average engine capacity is increasing, and is now close to 600 cc (see Figure 4.4 for a detailed breakdown of the fleet composition).
450
475
500
525
550
575
600
625
650
2000 2002 2004 2006 2008 2010 2012
CC
Fleet year
Figure 4.5 : Average motorcycle/moped fleet engine size
30
The New Zealand Vehicle Fleet
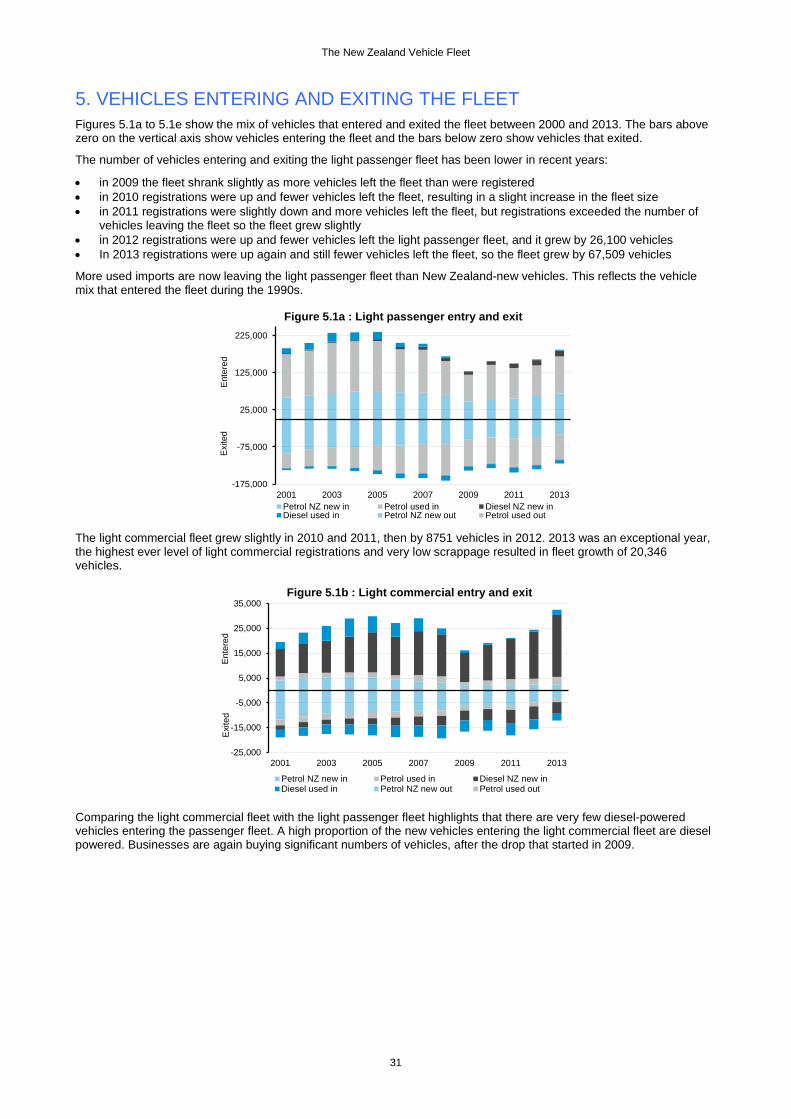
5. VEHICLES ENTERING AND EXITING THE FLEET Figures 5.1a to 5.1e show the mix of vehicles that entered and exited the fleet between 2000 and 2013. The bars above zero on the vertical axis show vehicles entering the fleet and the bars below zero show vehicles that exited.
The number of vehicles entering and exiting the light passenger fleet has been lower in recent years:
• in 2009 the fleet shrank slightly as more vehicles left the fleet than were registered • in 2010 registrations were up and fewer vehicles left the fleet, resulting in a slight increase in the fleet size • in 2011 registrations were slightly down and more vehicles left the fleet, but registrations exceeded the number of
vehicles leaving the fleet so the fleet grew slightly • in 2012 registrations were up and fewer vehicles left the light passenger fleet, and it grew by 26,100 vehicles • In 2013 registrations were up again and still fewer vehicles left the fleet, so the fleet grew by 67,509 vehicles
More used imports are now leaving the light passenger fleet than New Zealand-new vehicles. This reflects the vehicle mix that entered the fleet during the 1990s.
The light commercial fleet grew slightly in 2010 and 2011, then by 8751 vehicles in 2012. 2013 was an exceptional year, the highest ever level of light commercial registrations and very low scrappage resulted in fleet growth of 20,346 vehicles.
Comparing the light commercial fleet with the light passenger fleet highlights that there are very few diesel-powered vehicles entering the passenger fleet. A high proportion of the new vehicles entering the light commercial fleet are diesel powered. Businesses are again buying significant numbers of vehicles, after the drop that started in 2009.
-175,000
-75,000
25,000
125,000
225,000
2001 2003 2005 2007 2009 2011 2013
Figure 5.1a : Light passenger entry and exit
Petrol NZ new in Petrol used in Diesel NZ new inDiesel used in Petrol NZ new out Petrol used out
Ent
ered
Exi
ted
-25,000
-15,000
-5,000
5,000
15,000
25,000
35,000
2001 2003 2005 2007 2009 2011 2013
Figure 5.1b : Light commercial entry and exit
Petrol NZ new in Petrol used in Diesel NZ new inDiesel used in Petrol NZ new out Petrol used out
Ent
ered
Exi
ted
31
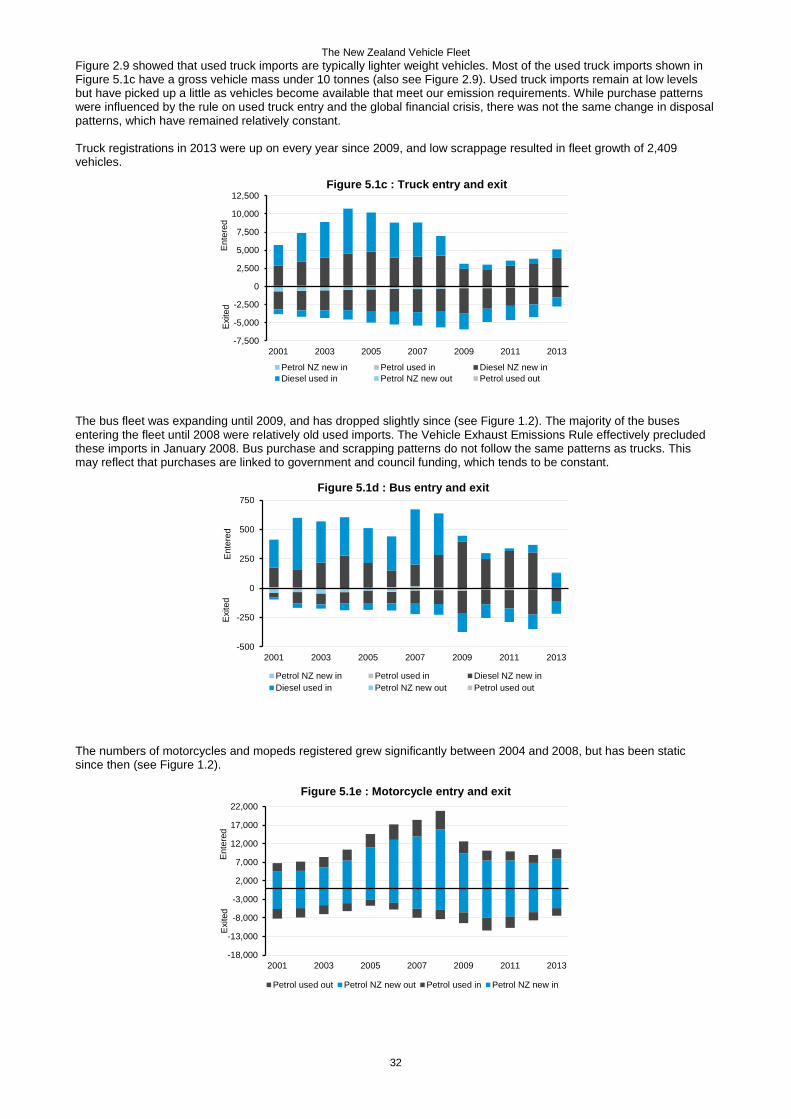
The New Zealand Vehicle Fleet Figure 2.9 showed that used truck imports are typically lighter weight vehicles. Most of the used truck imports shown in Figure 5.1c have a gross vehicle mass under 10 tonnes (also see Figure 2.9). Used truck imports remain at low levels but have picked up a little as vehicles become available that meet our emission requirements. While purchase patterns were influenced by the rule on used truck entry and the global financial crisis, there was not the same change in disposal patterns, which have remained relatively constant. Truck registrations in 2013 were up on every year since 2009, and low scrappage resulted in fleet growth of 2,409 vehicles.
The bus fleet was expanding until 2009, and has dropped slightly since (see Figure 1.2). The majority of the buses entering the fleet until 2008 were relatively old used imports. The Vehicle Exhaust Emissions Rule effectively precluded these imports in January 2008. Bus purchase and scrapping patterns do not follow the same patterns as trucks. This may reflect that purchases are linked to government and council funding, which tends to be constant.
The numbers of motorcycles and mopeds registered grew significantly between 2004 and 2008, but has been static since then (see Figure 1.2).
-7,500
-5,000
-2,500
0
2,500
5,000
7,500
10,000
12,500
2001 2003 2005 2007 2009 2011 2013
Figure 5.1c : Truck entry and exit
Petrol NZ new in Petrol used in Diesel NZ new inDiesel used in Petrol NZ new out Petrol used out
Ent
ered
Exi
ted
-500
-250
0
250
500
750
2001 2003 2005 2007 2009 2011 2013
Figure 5.1d : Bus entry and exit
Petrol NZ new in Petrol used in Diesel NZ new inDiesel used in Petrol NZ new out Petrol used out
Ent
ered
Exi
ted
-18,000
-13,000
-8,000
-3,000
2,000
7,000
12,000
17,000
22,000
2001 2003 2005 2007 2009 2011 2013
Figure 5.1e : Motorcycle entry and exit
Petrol used out Petrol NZ new out Petrol used in Petrol NZ new in
Ent
ered
Exi
ted
32
The New Zealand Vehicle Fleet
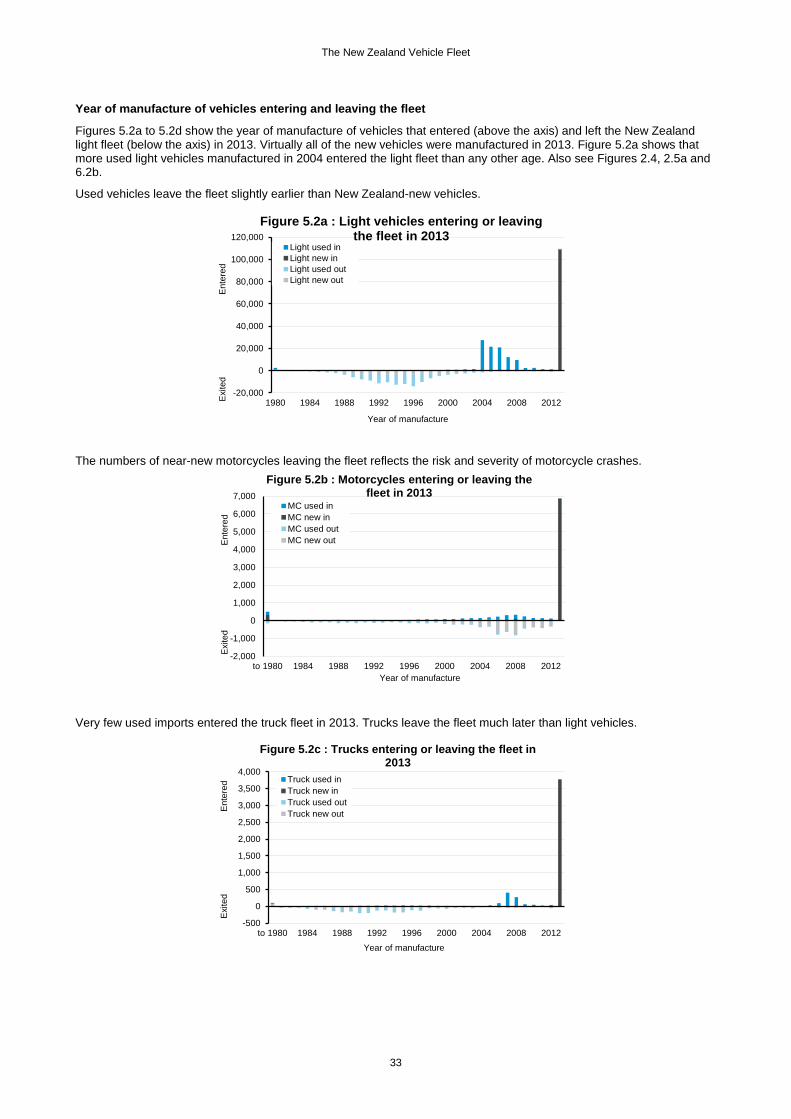
Year of manufacture of vehicles entering and leaving the fleet
Figures 5.2a to 5.2d show the year of manufacture of vehicles that entered (above the axis) and left the New Zealand light fleet (below the axis) in 2013. Virtually all of the new vehicles were manufactured in 2013. Figure 5.2a shows that more used light vehicles manufactured in 2004 entered the light fleet than any other age. Also see Figures 2.4, 2.5a and 6.2b.
Used vehicles leave the fleet slightly earlier than New Zealand-new vehicles.
The numbers of near-new motorcycles leaving the fleet reflects the risk and severity of motorcycle crashes.
Very few used imports entered the truck fleet in 2013. Trucks leave the fleet much later than light vehicles.
-20,000
0
20,000
40,000
60,000
80,000
100,000
120,000
1980 1984 1988 1992 1996 2000 2004 2008 2012Exi
ted
Ent
ered
Year of manufacture
Figure 5.2a : Light vehicles entering or leaving the fleet in 2013
Light used inLight new inLight used outLight new out
-2,000
-1,000
0
1,000
2,000
3,000
4,000
5,000
6,000
7,000
to 1980 1984 1988 1992 1996 2000 2004 2008 2012
Exi
ted
E
nter
ed
Year of manufacture
Figure 5.2b : Motorcycles entering or leaving the fleet in 2013
MC used inMC new inMC used outMC new out
-500
0
500
1,000
1,500
2,000
2,500
3,000
3,500
4,000
to 1980 1984 1988 1992 1996 2000 2004 2008 2012
Exi
ted
Ent
ered
Year of manufacture
Figure 5.2c : Trucks entering or leaving the fleet in 2013
Truck used inTruck new inTruck used outTruck new out
33
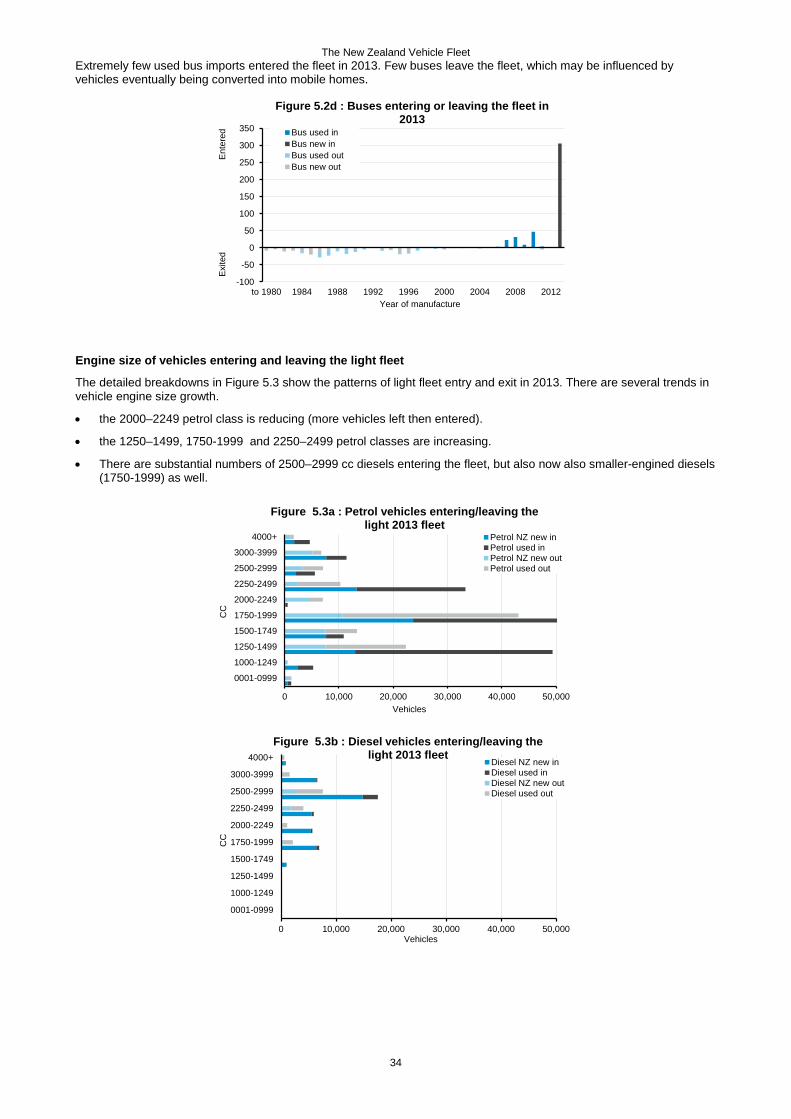
The New Zealand Vehicle Fleet Extremely few used bus imports entered the fleet in 2013. Few buses leave the fleet, which may be influenced by vehicles eventually being converted into mobile homes.
Engine size of vehicles entering and leaving the light fleet
The detailed breakdowns in Figure 5.3 show the patterns of light fleet entry and exit in 2013. There are several trends in vehicle engine size growth.
• the 2000–2249 petrol class is reducing (more vehicles left then entered).
• the 1250–1499, 1750-1999 and 2250–2499 petrol classes are increasing.
• There are substantial numbers of 2500–2999 cc diesels entering the fleet, but also now also smaller-engined diesels (1750-1999) as well.
-100
-50
0
50
100
150
200
250
300
350
to 1980 1984 1988 1992 1996 2000 2004 2008 2012
Exi
ted
Ent
ered
Year of manufacture
Figure 5.2d : Buses entering or leaving the fleet in 2013
Bus used inBus new inBus used outBus new out
0 10,000 20,000 30,000 40,000 50,000
0001-0999
1000-1249
1250-1499
1500-1749
1750-1999
2000-2249
2250-2499
2500-2999
3000-3999
4000+
Vehicles
CC
Figure 5.3a : Petrol vehicles entering/leaving the light 2013 fleet
Petrol NZ new inPetrol used inPetrol NZ new outPetrol used out
0 10,000 20,000 30,000 40,000 50,000
0001-0999
1000-1249
1250-1499
1500-1749
1750-1999
2000-2249
2250-2499
2500-2999
3000-3999
4000+
Vehicles
CC
Figure 5.3b : Diesel vehicles entering/leaving the light 2013 fleet
Diesel NZ new inDiesel used inDiesel NZ new outDiesel used out
34
The New Zealand Vehicle Fleet
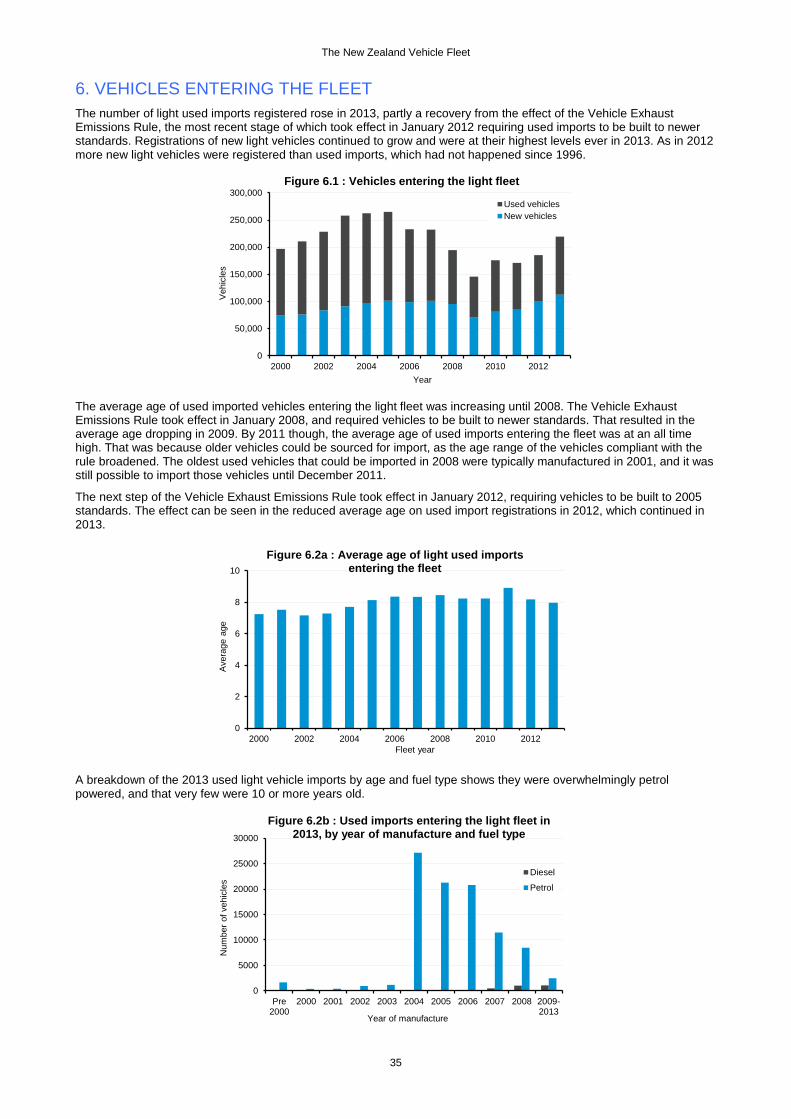
6. VEHICLES ENTERING THE FLEET The number of light used imports registered rose in 2013, partly a recovery from the effect of the Vehicle Exhaust Emissions Rule, the most recent stage of which took effect in January 2012 requiring used imports to be built to newer standards. Registrations of new light vehicles continued to grow and were at their highest levels ever in 2013. As in 2012 more new light vehicles were registered than used imports, which had not happened since 1996.
The average age of used imported vehicles entering the light fleet was increasing until 2008. The Vehicle Exhaust Emissions Rule took effect in January 2008, and required vehicles to be built to newer standards. That resulted in the average age dropping in 2009. By 2011 though, the average age of used imports entering the fleet was at an all time high. That was because older vehicles could be sourced for import, as the age range of the vehicles compliant with the rule broadened. The oldest used vehicles that could be imported in 2008 were typically manufactured in 2001, and it was still possible to import those vehicles until December 2011.
The next step of the Vehicle Exhaust Emissions Rule took effect in January 2012, requiring vehicles to be built to 2005 standards. The effect can be seen in the reduced average age on used import registrations in 2012, which continued in 2013.
A breakdown of the 2013 used light vehicle imports by age and fuel type shows they were overwhelmingly petrol powered, and that very few were 10 or more years old.
0
50,000
100,000
150,000
200,000
250,000
300,000
2000 2002 2004 2006 2008 2010 2012
Veh
icle
s
Year
Figure 6.1 : Vehicles entering the light fleet
Used vehiclesNew vehicles
0
2
4
6
8
10
2000 2002 2004 2006 2008 2010 2012
Ave
rage
age
Fleet year
Figure 6.2a : Average age of light used imports entering the fleet
0
5000
10000
15000
20000
25000
30000
Pre2000
2000 2001 2002 2003 2004 2005 2006 2007 2008 2009-2013
Num
ber o
f veh
icle
s
Year of manufacture
Figure 6.2b : Used imports entering the light fleet in 2013, by year of manufacture and fuel type
Diesel
Petrol
35
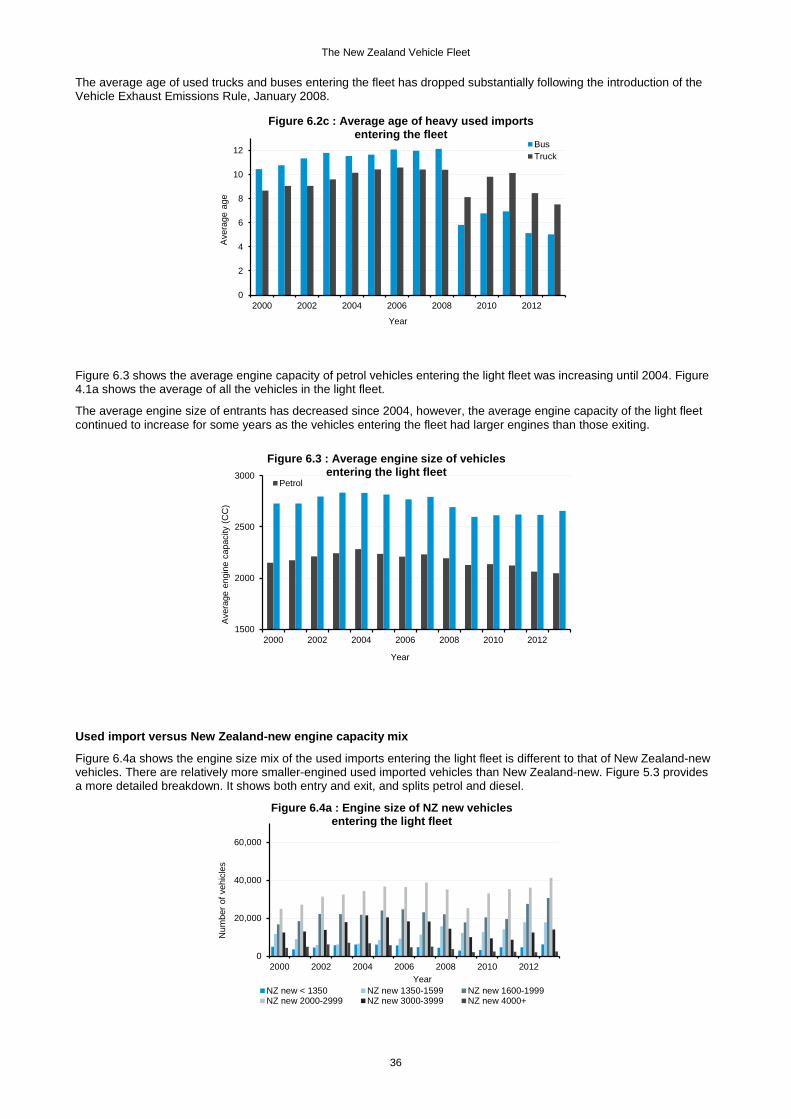
The New Zealand Vehicle Fleet The average age of used trucks and buses entering the fleet has dropped substantially following the introduction of the Vehicle Exhaust Emissions Rule, January 2008.
Figure 6.3 shows the average engine capacity of petrol vehicles entering the light fleet was increasing until 2004. Figure 4.1a shows the average of all the vehicles in the light fleet.
The average engine size of entrants has decreased since 2004, however, the average engine capacity of the light fleet continued to increase for some years as the vehicles entering the fleet had larger engines than those exiting.
Used import versus New Zealand-new engine capacity mix
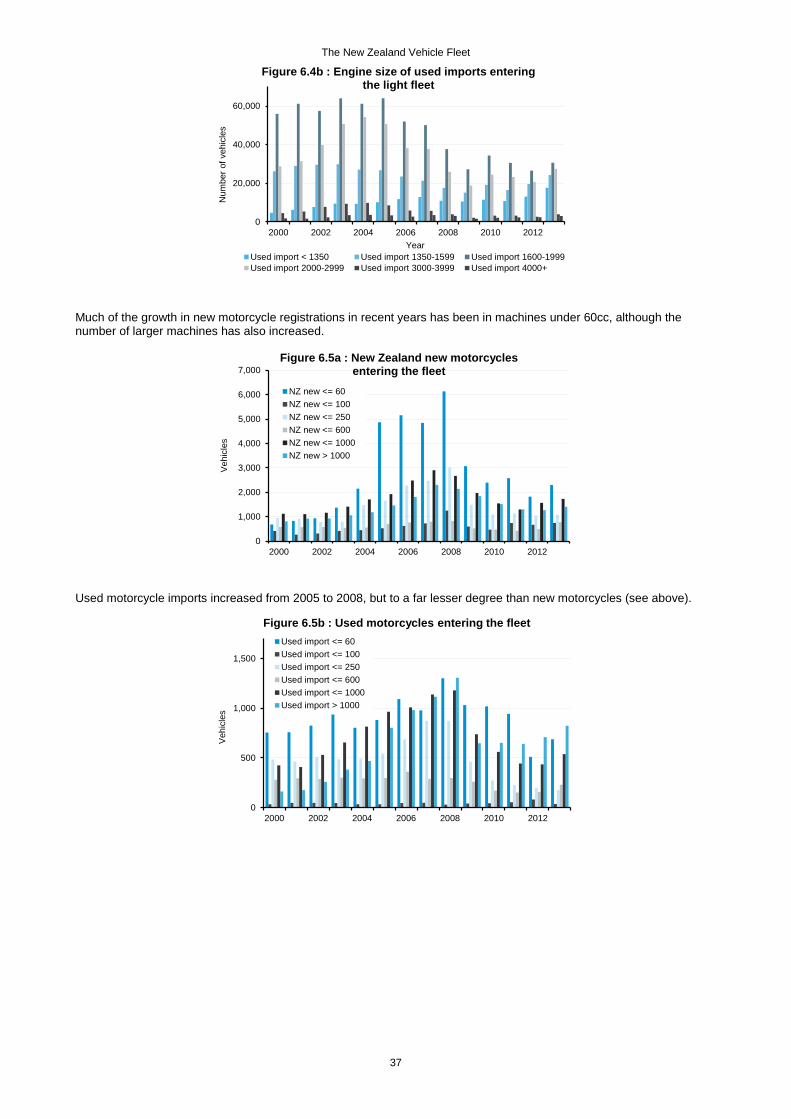
Figure 6.4a shows the engine size mix of the used imports entering the light fleet is different to that of New Zealand-new vehicles. There are relatively more smaller-engined used imported vehicles than New Zealand-new. Figure 5.3 provides a more detailed breakdown. It shows both entry and exit, and splits petrol and diesel.
0
2
4
6
8
10
12
2000 2002 2004 2006 2008 2010 2012
Ave
rage
age
Year
Figure 6.2c : Average age of heavy used imports entering the fleet
BusTruck
1500
2000
2500
3000
2000 2002 2004 2006 2008 2010 2012
Ave
rage
eng
ine
capa
city
(C
C)
Year
Figure 6.3 : Average engine size of vehicles entering the light fleet
Petrol
0
20,000
40,000
60,000
2000 2002 2004 2006 2008 2010 2012
Num
ber o
f veh
icle
s
Year
Figure 6.4a : Engine size of NZ new vehicles entering the light fleet
NZ new < 1350 NZ new 1350-1599 NZ new 1600-1999NZ new 2000-2999 NZ new 3000-3999 NZ new 4000+
36
The New Zealand Vehicle Fleet
Much of the growth in new motorcycle registrations in recent years has been in machines under 60cc, although the number of larger machines has also increased.
Used motorcycle imports increased from 2005 to 2008, but to a far lesser degree than new motorcycles (see above).
0
20,000
40,000
60,000
2000 2002 2004 2006 2008 2010 2012N
umbe
r of v
ehic
les
Year
Figure 6.4b : Engine size of used imports entering the light fleet
Used import < 1350 Used import 1350-1599 Used import 1600-1999Used import 2000-2999 Used import 3000-3999 Used import 4000+
0
1,000
2,000
3,000
4,000
5,000
6,000
7,000
2000 2002 2004 2006 2008 2010 2012
Veh
icle
s
Figure 6.5a : New Zealand new motorcycles entering the fleet
NZ new <= 60NZ new <= 100NZ new <= 250NZ new <= 600NZ new <= 1000NZ new > 1000
0
500
1,000
1,500
2000 2002 2004 2006 2008 2010 2012
Veh
icle
s
Figure 6.5b : Used motorcycles entering the fleetUsed import <= 60Used import <= 100Used import <= 250Used import <= 600Used import <= 1000Used import > 1000
37
The New Zealand Vehicle Fleet
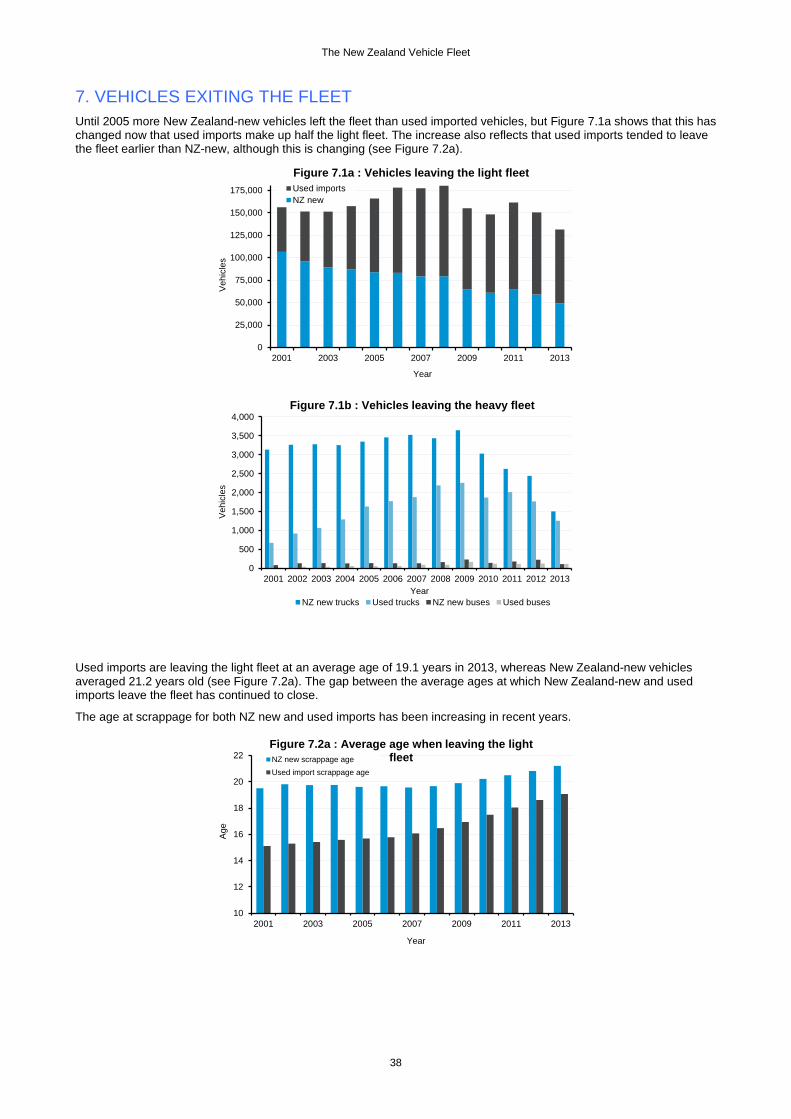
7. VEHICLES EXITING THE FLEET Until 2005 more New Zealand-new vehicles left the fleet than used imported vehicles, but Figure 7.1a shows that this has changed now that used imports make up half the light fleet. The increase also reflects that used imports tended to leave the fleet earlier than NZ-new, although this is changing (see Figure 7.2a).
Used imports are leaving the light fleet at an average age of 19.1 years in 2013, whereas New Zealand-new vehicles averaged 21.2 years old (see Figure 7.2a). The gap between the average ages at which New Zealand-new and used imports leave the fleet has continued to close.
The age at scrappage for both NZ new and used imports has been increasing in recent years.
0
25,000
50,000
75,000
100,000
125,000
150,000
175,000
2001 2003 2005 2007 2009 2011 2013
Veh
icle
s
Year
Figure 7.1a : Vehicles leaving the light fleetUsed importsNZ new
0
500
1,000
1,500
2,000
2,500
3,000
3,500
4,000
2001 2002 2003 2004 2005 2006 2007 2008 2009 2010 2011 2012 2013
Veh
icle
s
Year
Figure 7.1b : Vehicles leaving the heavy fleet
NZ new trucks Used trucks NZ new buses Used buses
10
12
14
16
18
20
22
2001 2003 2005 2007 2009 2011 2013
Age
Year
Figure 7.2a : Average age when leaving the light fleetNZ new scrappage age
Used import scrappage age
38
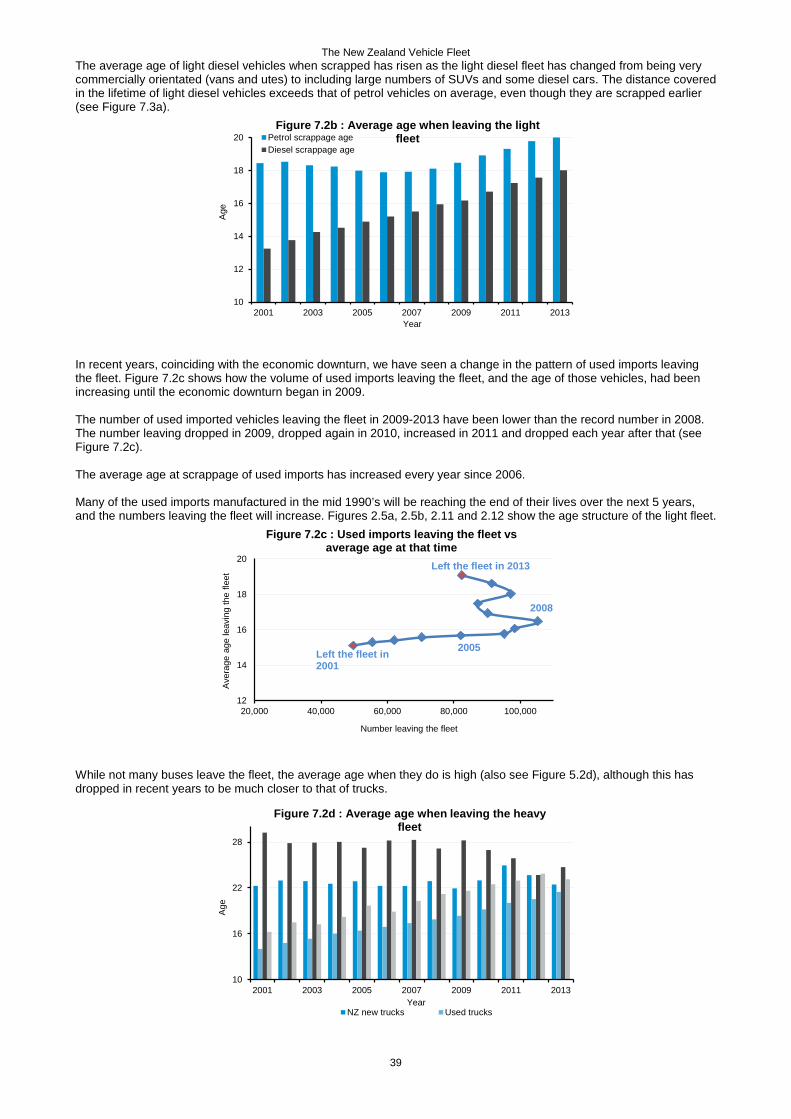
The New Zealand Vehicle Fleet The average age of light diesel vehicles when scrapped has risen as the light diesel fleet has changed from being very commercially orientated (vans and utes) to including large numbers of SUVs and some diesel cars. The distance covered in the lifetime of light diesel vehicles exceeds that of petrol vehicles on average, even though they are scrapped earlier (see Figure 7.3a).
In recent years, coinciding with the economic downturn, we have seen a change in the pattern of used imports leaving the fleet. Figure 7.2c shows how the volume of used imports leaving the fleet, and the age of those vehicles, had been increasing until the economic downturn began in 2009. The number of used imported vehicles leaving the fleet in 2009-2013 have been lower than the record number in 2008. The number leaving dropped in 2009, dropped again in 2010, increased in 2011 and dropped each year after that (see Figure 7.2c). The average age at scrappage of used imports has increased every year since 2006. Many of the used imports manufactured in the mid 1990’s will be reaching the end of their lives over the next 5 years, and the numbers leaving the fleet will increase. Figures 2.5a, 2.5b, 2.11 and 2.12 show the age structure of the light fleet.
While not many buses leave the fleet, the average age when they do is high (also see Figure 5.2d), although this has dropped in recent years to be much closer to that of trucks.
10
12
14
16
18
20
2001 2003 2005 2007 2009 2011 2013
Age
Year
Figure 7.2b : Average age when leaving the light fleetPetrol scrappage age
Diesel scrappage age
12
14
16
18
20
20,000 40,000 60,000 80,000 100,000
Ave
rage
age
leav
ing
the
fleet
Number leaving the fleet
Figure 7.2c : Used imports leaving the fleet vs average age at that time
Left the fleet in 2013
Left the fleet in 2001
2008
2005
10
16
22
28
2001 2003 2005 2007 2009 2011 2013
Age
Year
Figure 7.2d : Average age when leaving the heavy fleet
NZ new trucks Used trucks
39
The New Zealand Vehicle Fleet How far have vehicles travelled before they leave the fleet?
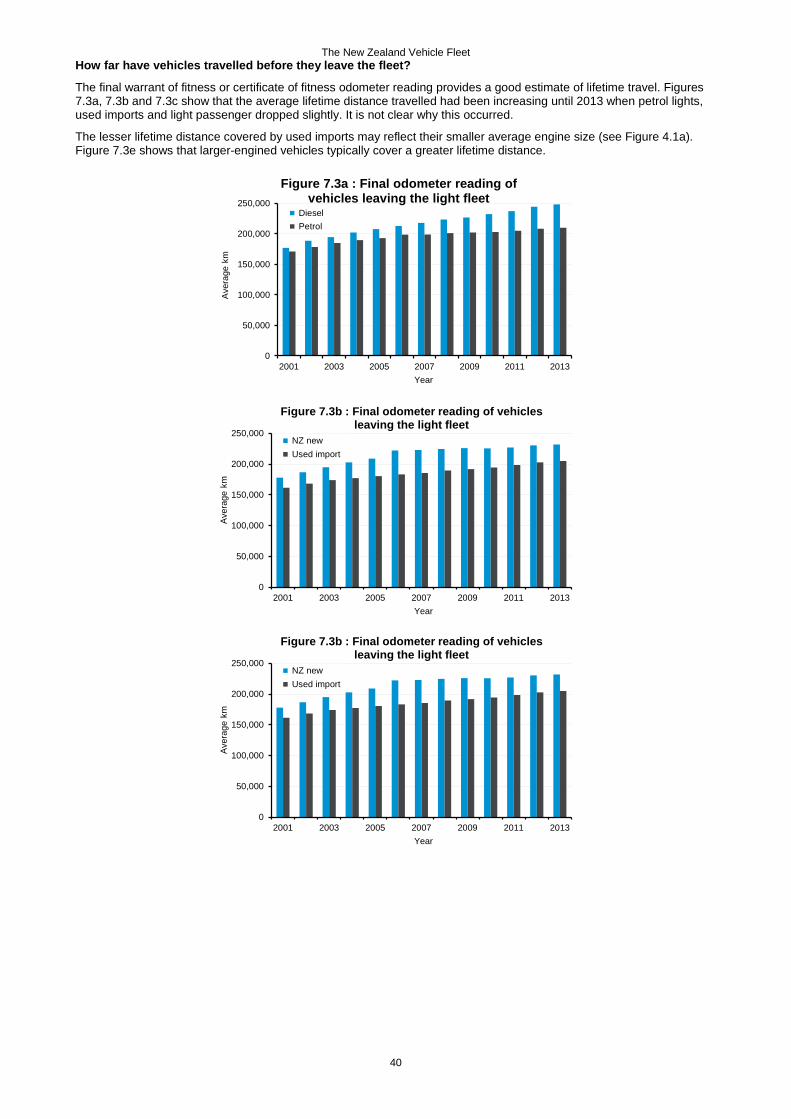
The final warrant of fitness or certificate of fitness odometer reading provides a good estimate of lifetime travel. Figures 7.3a, 7.3b and 7.3c show that the average lifetime distance travelled had been increasing until 2013 when petrol lights, used imports and light passenger dropped slightly. It is not clear why this occurred.
The lesser lifetime distance covered by used imports may reflect their smaller average engine size (see Figure 4.1a). Figure 7.3e shows that larger-engined vehicles typically cover a greater lifetime distance.
0
50,000
100,000
150,000
200,000
250,000
2001 2003 2005 2007 2009 2011 2013
Ave
rage
km
Year
Figure 7.3a : Final odometer reading of vehicles leaving the light fleet
Diesel Petrol
0
50,000
100,000
150,000
200,000
250,000
2001 2003 2005 2007 2009 2011 2013
Ave
rage
km
Year
Figure 7.3b : Final odometer reading of vehicles leaving the light fleet
NZ new Used import
0
50,000
100,000
150,000
200,000
250,000
2001 2003 2005 2007 2009 2011 2013
Ave
rage
km
Year
Figure 7.3b : Final odometer reading of vehicles leaving the light fleet
NZ new Used import
40
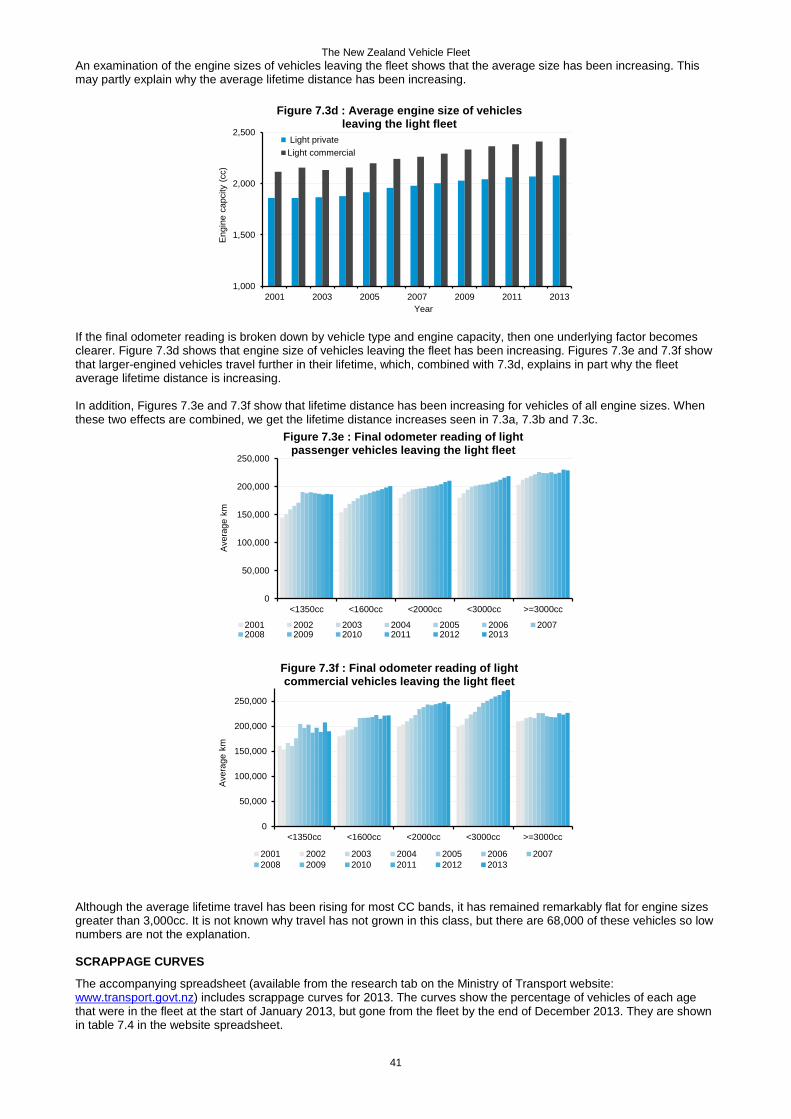
The New Zealand Vehicle Fleet An examination of the engine sizes of vehicles leaving the fleet shows that the average size has been increasing. This may partly explain why the average lifetime distance has been increasing.
If the final odometer reading is broken down by vehicle type and engine capacity, then one underlying factor becomes clearer. Figure 7.3d shows that engine size of vehicles leaving the fleet has been increasing. Figures 7.3e and 7.3f show that larger-engined vehicles travel further in their lifetime, which, combined with 7.3d, explains in part why the fleet average lifetime distance is increasing. In addition, Figures 7.3e and 7.3f show that lifetime distance has been increasing for vehicles of all engine sizes. When these two effects are combined, we get the lifetime distance increases seen in 7.3a, 7.3b and 7.3c.
Although the average lifetime travel has been rising for most CC bands, it has remained remarkably flat for engine sizes greater than 3,000cc. It is not known why travel has not grown in this class, but there are 68,000 of these vehicles so low numbers are not the explanation. SCRAPPAGE CURVES
The accompanying spreadsheet (available from the research tab on the Ministry of Transport website: www.transport.govt.nz) includes scrappage curves for 2013. The curves show the percentage of vehicles of each age that were in the fleet at the start of January 2013, but gone from the fleet by the end of December 2013. They are shown in table 7.4 in the website spreadsheet.
1,000
1,500
2,000
2,500
2001 2003 2005 2007 2009 2011 2013
Eng
ine
capc
ity (
cc)
Year
Figure 7.3d : Average engine size of vehicles leaving the light fleet
Light privateLight commercial
0
50,000
100,000
150,000
200,000
250,000
<1350cc <1600cc <2000cc <3000cc >=3000cc
Ave
rage
km
Figure 7.3e : Final odometer reading of light passenger vehicles leaving the light fleet
2001 2002 2003 2004 2005 2006 20072008 2009 2010 2011 2012 2013
0
50,000
100,000
150,000
200,000
250,000
<1350cc <1600cc <2000cc <3000cc >=3000cc
Ave
rage
km
Figure 7.3f : Final odometer reading of light commercial vehicles leaving the light fleet
2001 2002 2003 2004 2005 2006 20072008 2009 2010 2011 2012 2013
41
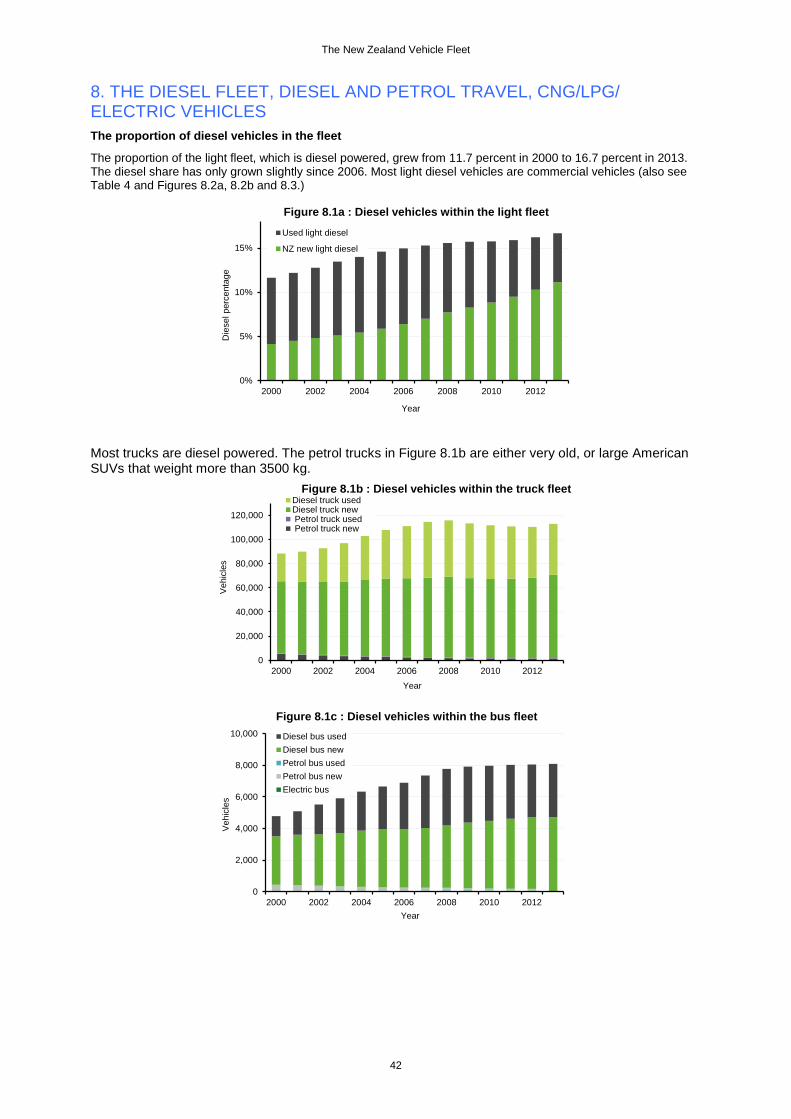
The New Zealand Vehicle Fleet
8. THE DIESEL FLEET, DIESEL AND PETROL TRAVEL, CNG/LPG/ ELECTRIC VEHICLES The proportion of diesel vehicles in the fleet
The proportion of the light fleet, which is diesel powered, grew from 11.7 percent in 2000 to 16.7 percent in 2013. The diesel share has only grown slightly since 2006. Most light diesel vehicles are commercial vehicles (also see Table 4 and Figures 8.2a, 8.2b and 8.3.)
Most trucks are diesel powered. The petrol trucks in Figure 8.1b are either very old, or large American SUVs that weight more than 3500 kg.
0%
5%
10%
15%
2000 2002 2004 2006 2008 2010 2012
Die
sel p
erce
ntag
e
Year
Figure 8.1a : Diesel vehicles within the light fleetUsed light diesel
NZ new light diesel
0
20,000
40,000
60,000
80,000
100,000
120,000
2000 2002 2004 2006 2008 2010 2012
Veh
icle
s
Year
Figure 8.1b : Diesel vehicles within the truck fleetDiesel truck usedDiesel truck new Petrol truck used Petrol truck new
0
2,000
4,000
6,000
8,000
10,000
2000 2002 2004 2006 2008 2010 2012
Veh
icle
s
Year
Figure 8.1c : Diesel vehicles within the bus fleetDiesel bus usedDiesel bus newPetrol bus usedPetrol bus newElectric bus
42
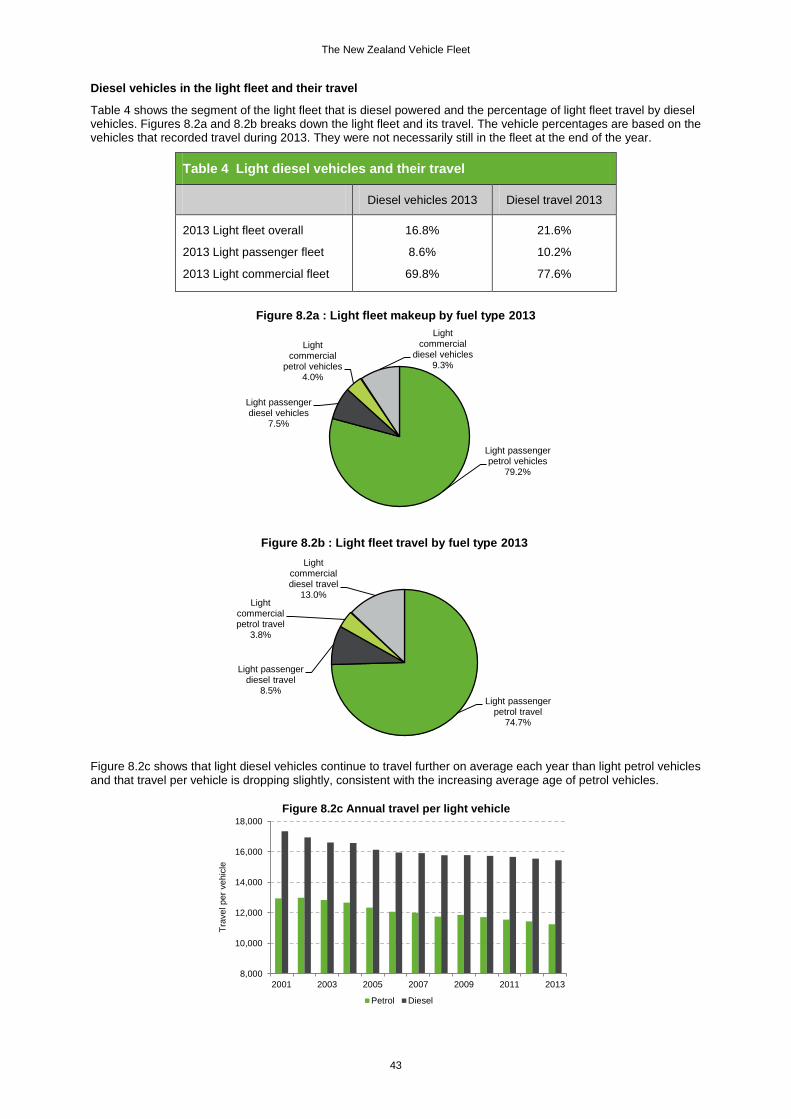
The New Zealand Vehicle Fleet
Diesel vehicles in the light fleet and their travel
Table 4 shows the segment of the light fleet that is diesel powered and the percentage of light fleet travel by diesel vehicles. Figures 8.2a and 8.2b breaks down the light fleet and its travel. The vehicle percentages are based on the vehicles that recorded travel during 2013. They were not necessarily still in the fleet at the end of the year.
Table 4 Light diesel vehicles and their travel
Diesel vehicles 2013 Diesel travel 2013
2013 Light fleet overall
2013 Light passenger fleet
2013 Light commercial fleet
16.8%
8.6%
69.8%
21.6%
10.2%
77.6%
Figure 8.2c shows that light diesel vehicles continue to travel further on average each year than light petrol vehicles and that travel per vehicle is dropping slightly, consistent with the increasing average age of petrol vehicles.
Light passenger petrol vehicles
79.2%
Light passenger diesel vehicles
7.5%
Light commercial
petrol vehicles4.0%
Light commercial
diesel vehicles9.3%
Figure 8.2a : Light fleet makeup by fuel type 2013
Light passenger petrol travel
74.7%
Light passenger diesel travel
8.5%
Light commercial petrol travel
3.8%
Light commercial diesel travel
13.0%
Figure 8.2b : Light fleet travel by fuel type 2013
8,000
10,000
12,000
14,000
16,000
18,000
2001 2003 2005 2007 2009 2011 2013
Trav
el p
er v
ehic
le
Figure 8.2c Annual travel per light vehicle
Petrol Diesel
43
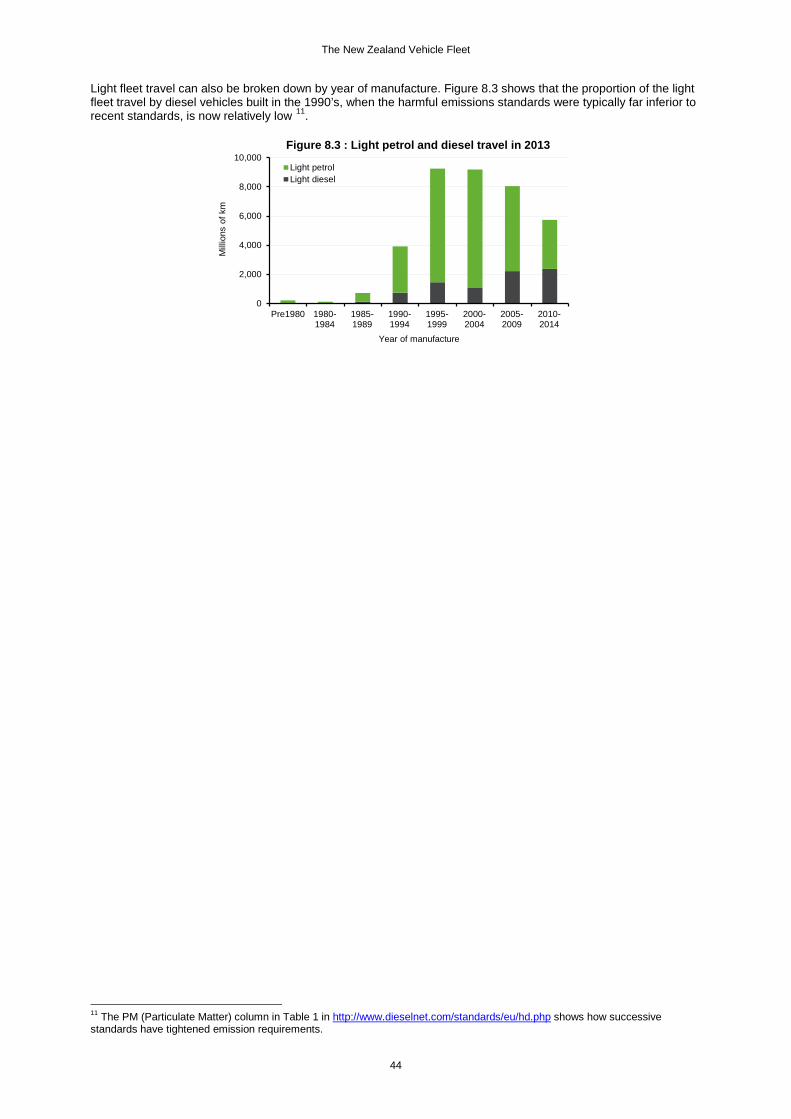
The New Zealand Vehicle Fleet
Light fleet travel can also be broken down by year of manufacture. Figure 8.3 shows that the proportion of the light fleet travel by diesel vehicles built in the 1990’s, when the harmful emissions standards were typically far inferior to recent standards, is now relatively low 11.
11 The PM (Particulate Matter) column in Table 1 in http://www.dieselnet.com/standards/eu/hd.php shows how successive standards have tightened emission requirements.
0
2,000
4,000
6,000
8,000
10,000
Pre1980 1980-1984
1985-1989
1990-1994
1995-1999
2000-2004
2005-2009
2010-2014
Mill
ions
of k
m
Year of manufacture
Figure 8.3 : Light petrol and diesel travel in 2013
Light petrolLight diesel
44
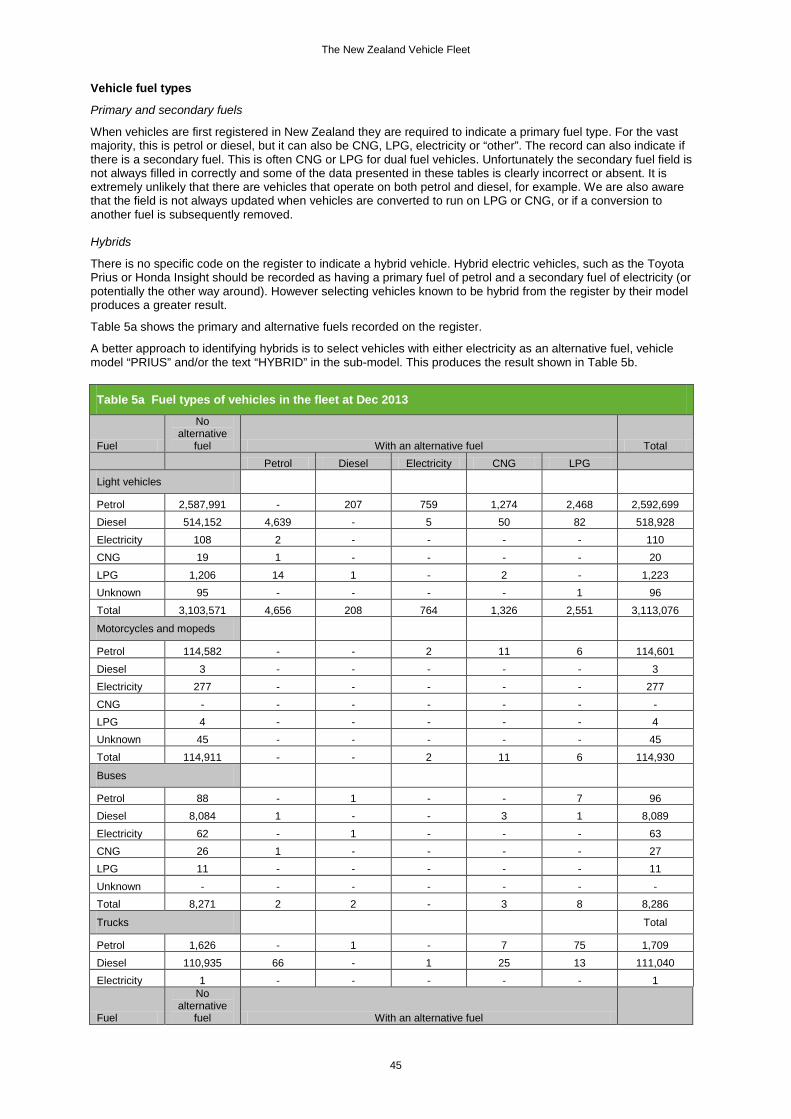
The New Zealand Vehicle Fleet
Vehicle fuel types
Primary and secondary fuels
When vehicles are first registered in New Zealand they are required to indicate a primary fuel type. For the vast majority, this is petrol or diesel, but it can also be CNG, LPG, electricity or “other”. The record can also indicate if there is a secondary fuel. This is often CNG or LPG for dual fuel vehicles. Unfortunately the secondary fuel field is not always filled in correctly and some of the data presented in these tables is clearly incorrect or absent. It is extremely unlikely that there are vehicles that operate on both petrol and diesel, for example. We are also aware that the field is not always updated when vehicles are converted to run on LPG or CNG, or if a conversion to another fuel is subsequently removed. Hybrids
There is no specific code on the register to indicate a hybrid vehicle. Hybrid electric vehicles, such as the Toyota Prius or Honda Insight should be recorded as having a primary fuel of petrol and a secondary fuel of electricity (or potentially the other way around). However selecting vehicles known to be hybrid from the register by their model produces a greater result.
Table 5a shows the primary and alternative fuels recorded on the register.
A better approach to identifying hybrids is to select vehicles with either electricity as an alternative fuel, vehicle model “PRIUS” and/or the text “HYBRID” in the sub-model. This produces the result shown in Table 5b. Table 5a Fuel types of vehicles in the fleet at Dec 2013
Fuel
No alternative
fuel With an alternative fuel Total
Petrol Diesel Electricity CNG LPG
Light vehicles
Petrol 2,587,991 - 207 759 1,274 2,468 2,592,699 Diesel 514,152 4,639 - 5 50 82 518,928 Electricity 108 2 - - - - 110 CNG 19 1 - - - - 20 LPG 1,206 14 1 - 2 - 1,223 Unknown 95 - - - - 1 96 Total 3,103,571 4,656 208 764 1,326 2,551 3,113,076
Motorcycles and mopeds
Petrol 114,582 - - 2 11 6 114,601 Diesel 3 - - - - - 3 Electricity 277 - - - - - 277 CNG - - - - - - - LPG 4 - - - - - 4 Unknown 45 - - - - - 45 Total 114,911 - - 2 11 6 114,930
Buses
Petrol 88 - 1 - - 7 96 Diesel 8,084 1 - - 3 1 8,089 Electricity 62 - 1 - - - 63 CNG 26 1 - - - - 27 LPG 11 - - - - - 11 Unknown - - - - - - - Total 8,271 2 2 - 3 8 8,286
Trucks
Total
Petrol 1,626 - 1 - 7 75 1,709 Diesel 110,935 66 - 1 25 13 111,040 Electricity 1 - - - - - 1
Fuel
No alternative
fuel With an alternative fuel
45
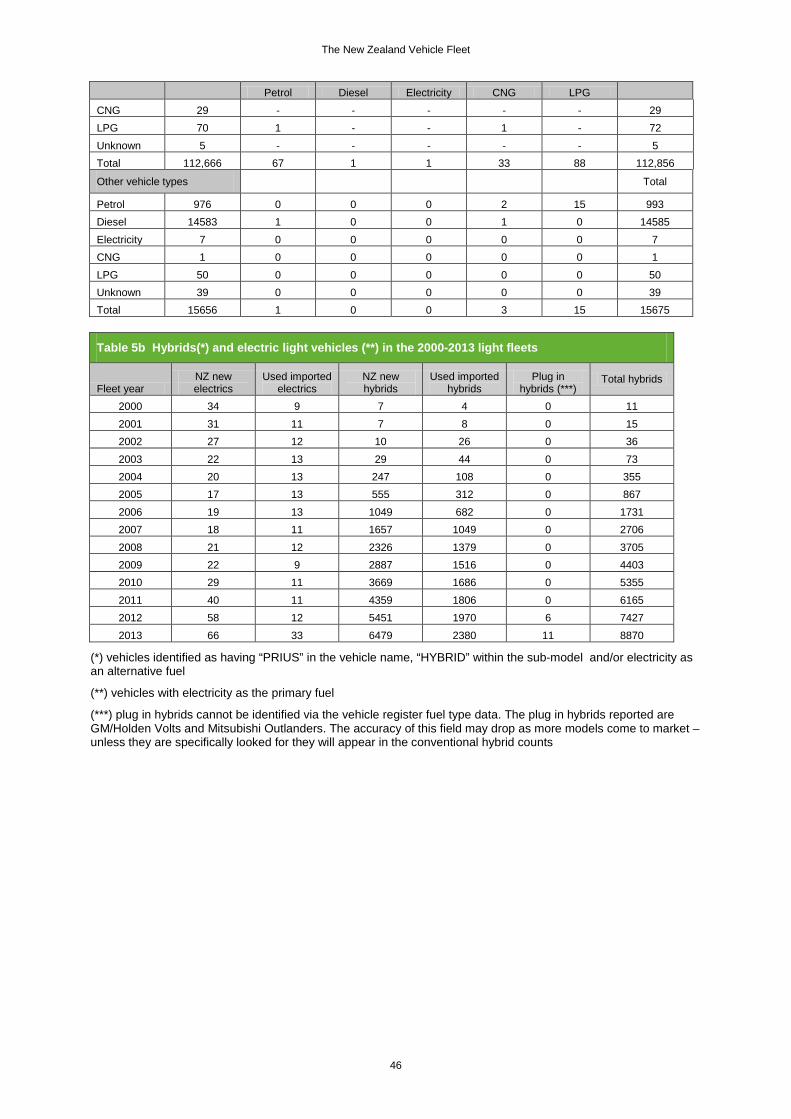
The New Zealand Vehicle Fleet
Petrol Diesel Electricity CNG LPG
CNG 29 - - - - - 29 LPG 70 1 - - 1 - 72 Unknown 5 - - - - - 5 Total 112,666 67 1 1 33 88 112,856
Other vehicle types
Total
Petrol 976 0 0 0 2 15 993 Diesel 14583 1 0 0 1 0 14585 Electricity 7 0 0 0 0 0 7 CNG 1 0 0 0 0 0 1 LPG 50 0 0 0 0 0 50 Unknown 39 0 0 0 0 0 39 Total 15656 1 0 0 3 15 15675
Table 5b Hybrids(*) and electric light vehicles (**) in the 2000-2013 light fleets
Fleet year NZ new electrics
Used imported electrics
NZ new hybrids
Used imported hybrids
Plug in hybrids (***)
Total hybrids
2000 34 9 7 4 0 11 2001 31 11 7 8 0 15 2002 27 12 10 26 0 36 2003 22 13 29 44 0 73 2004 20 13 247 108 0 355 2005 17 13 555 312 0 867 2006 19 13 1049 682 0 1731 2007 18 11 1657 1049 0 2706 2008 21 12 2326 1379 0 3705 2009 22 9 2887 1516 0 4403 2010 29 11 3669 1686 0 5355 2011 40 11 4359 1806 0 6165 2012 58 12 5451 1970 6 7427 2013 66 33 6479 2380 11 8870
(*) vehicles identified as having “PRIUS” in the vehicle name, “HYBRID” within the sub-model and/or electricity as an alternative fuel
(**) vehicles with electricity as the primary fuel
(***) plug in hybrids cannot be identified via the vehicle register fuel type data. The plug in hybrids reported are GM/Holden Volts and Mitsubishi Outlanders. The accuracy of this field may drop as more models come to market – unless they are specifically looked for they will appear in the conventional hybrid counts
46
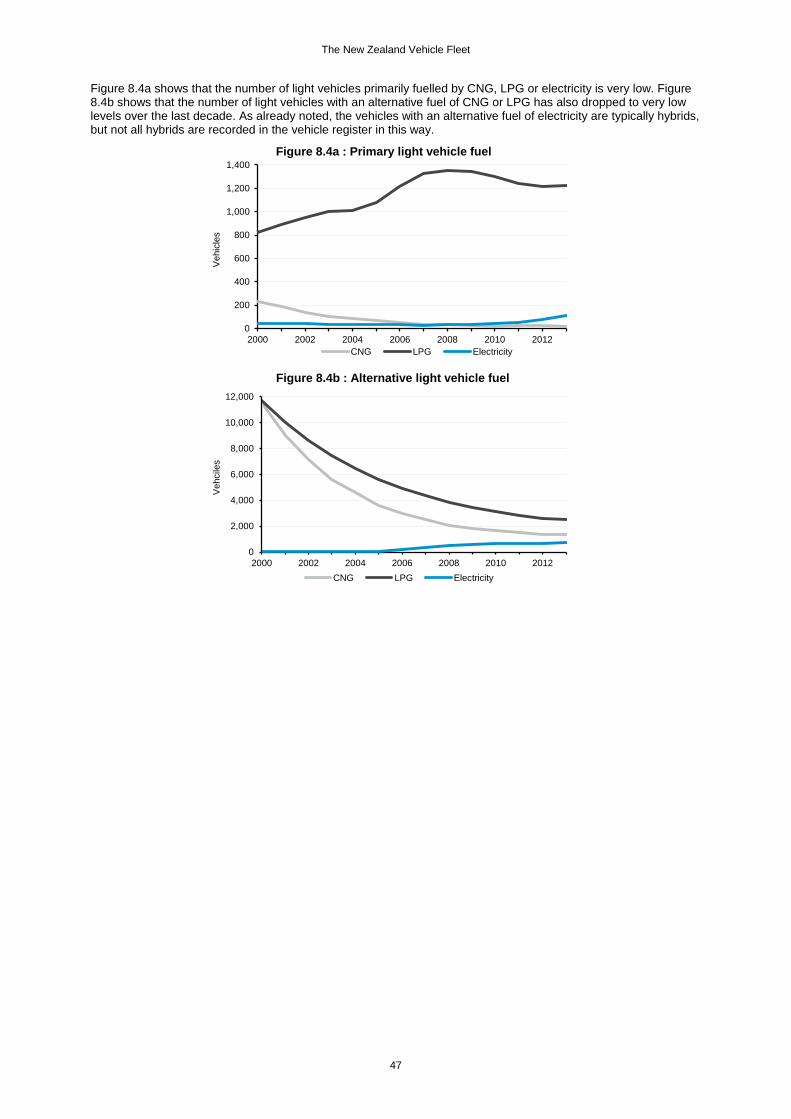
The New Zealand Vehicle Fleet
Figure 8.4a shows that the number of light vehicles primarily fuelled by CNG, LPG or electricity is very low. Figure 8.4b shows that the number of light vehicles with an alternative fuel of CNG or LPG has also dropped to very low levels over the last decade. As already noted, the vehicles with an alternative fuel of electricity are typically hybrids, but not all hybrids are recorded in the vehicle register in this way.
0
200
400
600
800
1,000
1,200
1,400
2000 2002 2004 2006 2008 2010 2012
Veh
icle
s
Figure 8.4a : Primary light vehicle fuel
CNG LPG Electricity
0
2,000
4,000
6,000
8,000
10,000
12,000
2000 2002 2004 2006 2008 2010 2012
Veh
cile
s
Figure 8.4b : Alternative light vehicle fuel
CNG LPG Electricity
47
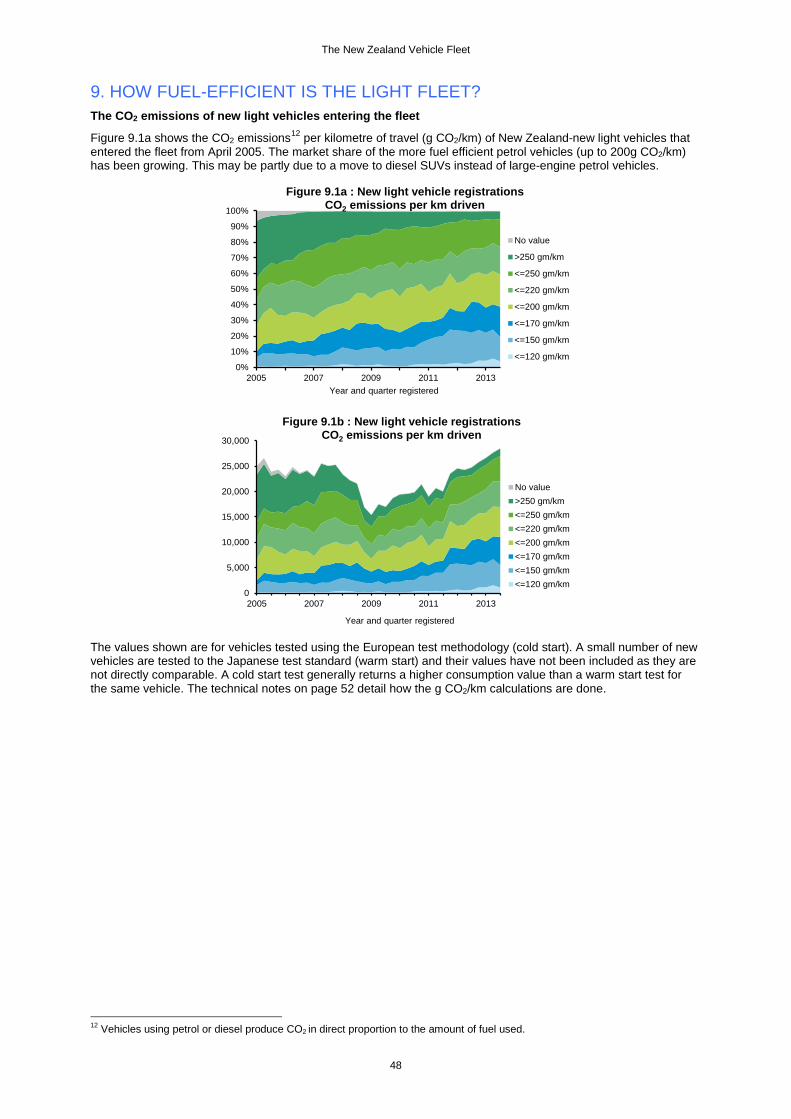
The New Zealand Vehicle Fleet
9. HOW FUEL-EFFICIENT IS THE LIGHT FLEET? The CO2 emissions of new light vehicles entering the fleet
Figure 9.1a shows the CO2 emissions12 per kilometre of travel (g CO2/km) of New Zealand-new light vehicles that entered the fleet from April 2005. The market share of the more fuel efficient petrol vehicles (up to 200g CO2/km) has been growing. This may be partly due to a move to diesel SUVs instead of large-engine petrol vehicles.
The values shown are for vehicles tested using the European test methodology (cold start). A small number of new vehicles are tested to the Japanese test standard (warm start) and their values have not been included as they are not directly comparable. A cold start test generally returns a higher consumption value than a warm start test for the same vehicle. The technical notes on page 52 detail how the g CO2/km calculations are done.
12 Vehicles using petrol or diesel produce CO2 in direct proportion to the amount of fuel used.
0%
10%
20%
30%
40%
50%
60%
70%
80%
90%
100%
2005 2007 2009 2011 2013Year and quarter registered
Figure 9.1a : New light vehicle registrationsCO2 emissions per km driven
No value
>250 gm/km
<=250 gm/km
<=220 gm/km
<=200 gm/km
<=170 gm/km
<=150 gm/km
<=120 gm/km
0
5,000
10,000
15,000
20,000
25,000
30,000
2005 2007 2009 2011 2013
Year and quarter registered
Figure 9.1b : New light vehicle registrationsCO2 emissions per km driven
No value>250 gm/km<=250 gm/km<=220 gm/km<=200 gm/km<=170 gm/km<=150 gm/km<=120 gm/km
48
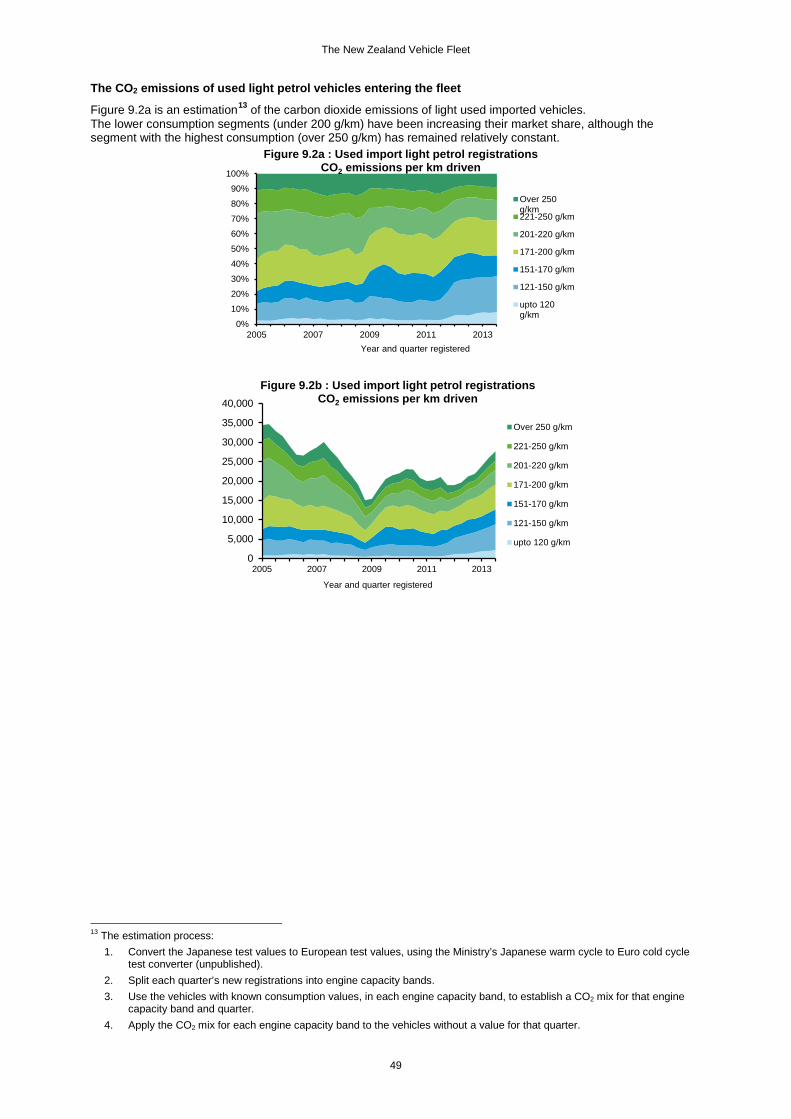
The New Zealand Vehicle Fleet
The CO2 emissions of used light petrol vehicles entering the fleet
Figure 9.2a is an estimation13 of the carbon dioxide emissions of light used imported vehicles. The lower consumption segments (under 200 g/km) have been increasing their market share, although the segment with the highest consumption (over 250 g/km) has remained relatively constant.
13 The estimation process: 1. Convert the Japanese test values to European test values, using the Ministry’s Japanese warm cycle to Euro cold cycle
test converter (unpublished). 2. Split each quarter’s new registrations into engine capacity bands. 3. Use the vehicles with known consumption values, in each engine capacity band, to establish a CO2 mix for that engine
capacity band and quarter. 4. Apply the CO2 mix for each engine capacity band to the vehicles without a value for that quarter.
0%
10%
20%
30%
40%
50%
60%
70%
80%
90%
100%
2005 2007 2009 2011 2013Year and quarter registered
Figure 9.2a : Used import light petrol registrationsCO2 emissions per km driven
Over 250g/km221-250 g/km
201-220 g/km
171-200 g/km
151-170 g/km
121-150 g/km
upto 120g/km
0
5,000
10,000
15,000
20,000
25,000
30,000
35,000
40,000
2005 2007 2009 2011 2013
Year and quarter registered
Figure 9.2b : Used import light petrol registrationsCO2 emissions per km driven
Over 250 g/km
221-250 g/km
201-220 g/km
171-200 g/km
151-170 g/km
121-150 g/km
upto 120 g/km
49
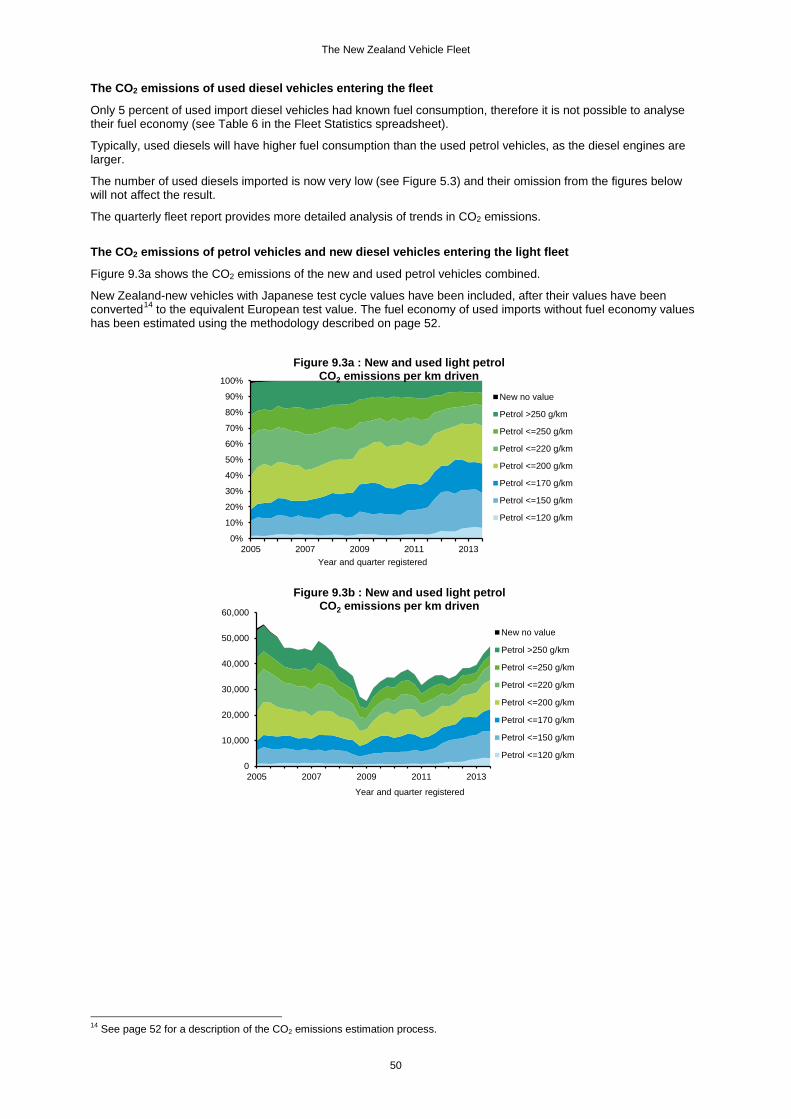
The New Zealand Vehicle Fleet
The CO2 emissions of used diesel vehicles entering the fleet
Only 5 percent of used import diesel vehicles had known fuel consumption, therefore it is not possible to analyse their fuel economy (see Table 6 in the Fleet Statistics spreadsheet).
Typically, used diesels will have higher fuel consumption than the used petrol vehicles, as the diesel engines are larger.
The number of used diesels imported is now very low (see Figure 5.3) and their omission from the figures below will not affect the result.
The quarterly fleet report provides more detailed analysis of trends in CO2 emissions.
The CO2 emissions of petrol vehicles and new diesel vehicles entering the light fleet
Figure 9.3a shows the CO2 emissions of the new and used petrol vehicles combined.
New Zealand-new vehicles with Japanese test cycle values have been included, after their values have been converted14 to the equivalent European test value. The fuel economy of used imports without fuel economy values has been estimated using the methodology described on page 52.
14 See page 52 for a description of the CO2 emissions estimation process.
0%
10%
20%
30%
40%
50%
60%
70%
80%
90%
100%
2005 2007 2009 2011 2013Year and quarter registered
Figure 9.3a : New and used light petrol CO2 emissions per km driven
New no value
Petrol >250 g/km
Petrol <=250 g/km
Petrol <=220 g/km
Petrol <=200 g/km
Petrol <=170 g/km
Petrol <=150 g/km
Petrol <=120 g/km
0
10,000
20,000
30,000
40,000
50,000
60,000
2005 2007 2009 2011 2013
Year and quarter registered
Figure 9.3b : New and used light petrol CO2 emissions per km driven
New no value
Petrol >250 g/km
Petrol <=250 g/km
Petrol <=220 g/km
Petrol <=200 g/km
Petrol <=170 g/km
Petrol <=150 g/km
Petrol <=120 g/km
50
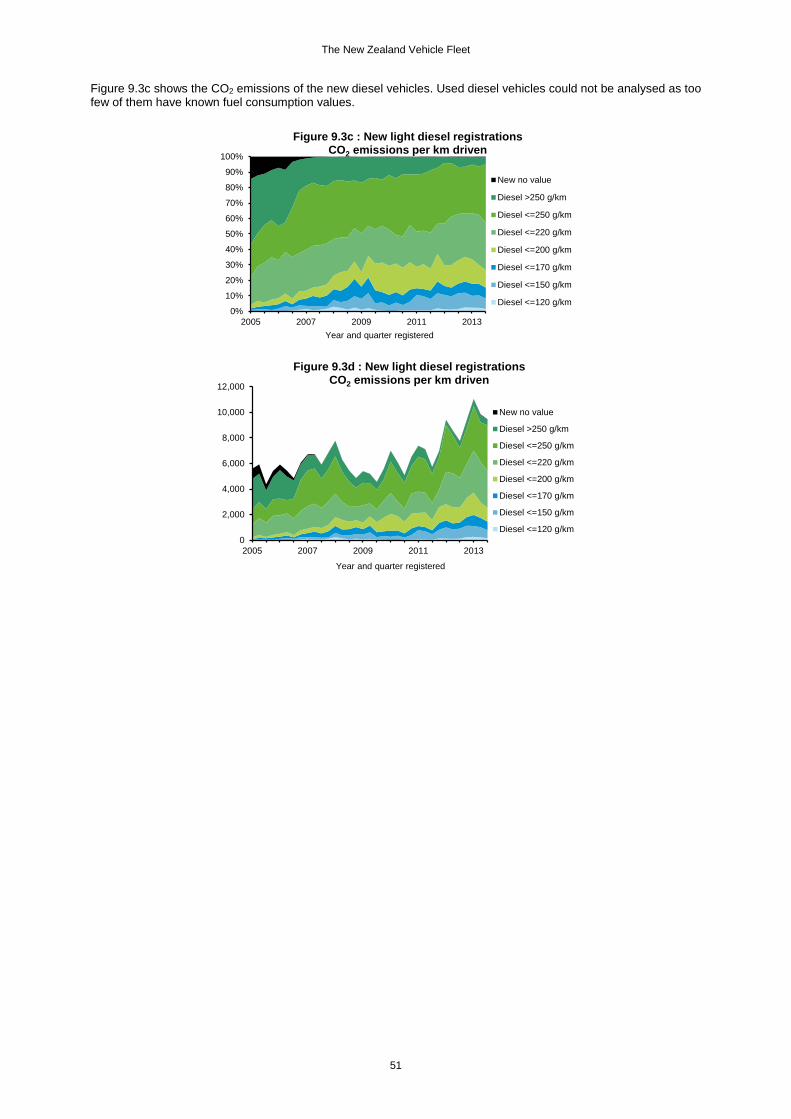
The New Zealand Vehicle Fleet
Figure 9.3c shows the CO2 emissions of the new diesel vehicles. Used diesel vehicles could not be analysed as too few of them have known fuel consumption values.
0%
10%
20%
30%
40%
50%
60%
70%
80%
90%
100%
2005 2007 2009 2011 2013Year and quarter registered
Figure 9.3c : New light diesel registrationsCO2 emissions per km driven
New no value
Diesel >250 g/km
Diesel <=250 g/km
Diesel <=220 g/km
Diesel <=200 g/km
Diesel <=170 g/km
Diesel <=150 g/km
Diesel <=120 g/km
0
2,000
4,000
6,000
8,000
10,000
12,000
2005 2007 2009 2011 2013
Year and quarter registered
Figure 9.3d : New light diesel registrationsCO2 emissions per km driven
New no value
Diesel >250 g/km
Diesel <=250 g/km
Diesel <=220 g/km
Diesel <=200 g/km
Diesel <=170 g/km
Diesel <=150 g/km
Diesel <=120 g/km
51
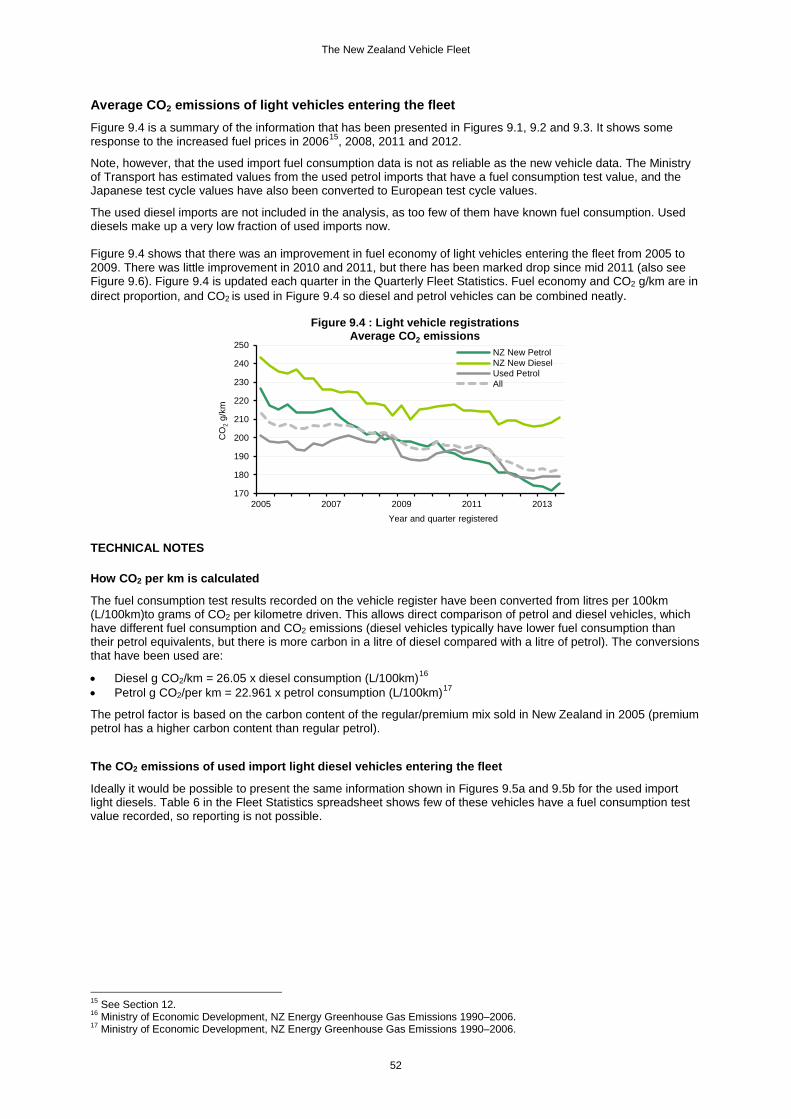
The New Zealand Vehicle Fleet
Average CO2 emissions of light vehicles entering the fleet Figure 9.4 is a summary of the information that has been presented in Figures 9.1, 9.2 and 9.3. It shows some response to the increased fuel prices in 200615, 2008, 2011 and 2012.
Note, however, that the used import fuel consumption data is not as reliable as the new vehicle data. The Ministry of Transport has estimated values from the used petrol imports that have a fuel consumption test value, and the Japanese test cycle values have also been converted to European test cycle values.
The used diesel imports are not included in the analysis, as too few of them have known fuel consumption. Used diesels make up a very low fraction of used imports now. Figure 9.4 shows that there was an improvement in fuel economy of light vehicles entering the fleet from 2005 to 2009. There was little improvement in 2010 and 2011, but there has been marked drop since mid 2011 (also see Figure 9.6). Figure 9.4 is updated each quarter in the Quarterly Fleet Statistics. Fuel economy and CO2 g/km are in direct proportion, and CO2 is used in Figure 9.4 so diesel and petrol vehicles can be combined neatly.
TECHNICAL NOTES How CO2 per km is calculated
The fuel consumption test results recorded on the vehicle register have been converted from litres per 100km (L/100km)to grams of CO2 per kilometre driven. This allows direct comparison of petrol and diesel vehicles, which have different fuel consumption and CO2 emissions (diesel vehicles typically have lower fuel consumption than their petrol equivalents, but there is more carbon in a litre of diesel compared with a litre of petrol). The conversions that have been used are:
• Diesel g CO2/km = 26.05 x diesel consumption (L/100km)16 • Petrol g CO2/per km = 22.961 x petrol consumption (L/100km)17
The petrol factor is based on the carbon content of the regular/premium mix sold in New Zealand in 2005 (premium petrol has a higher carbon content than regular petrol).
The CO2 emissions of used import light diesel vehicles entering the fleet
Ideally it would be possible to present the same information shown in Figures 9.5a and 9.5b for the used import light diesels. Table 6 in the Fleet Statistics spreadsheet shows few of these vehicles have a fuel consumption test value recorded, so reporting is not possible.
15 See Section 12. 16 Ministry of Economic Development, NZ Energy Greenhouse Gas Emissions 1990–2006. 17 Ministry of Economic Development, NZ Energy Greenhouse Gas Emissions 1990–2006.
170
180
190
200
210
220
230
240
250
2005 2007 2009 2011 2013
CO
2g/
km
Year and quarter registered
Figure 9.4 : Light vehicle registrations Average CO2 emissions
NZ New PetrolNZ New DieselUsed PetrolAll
52
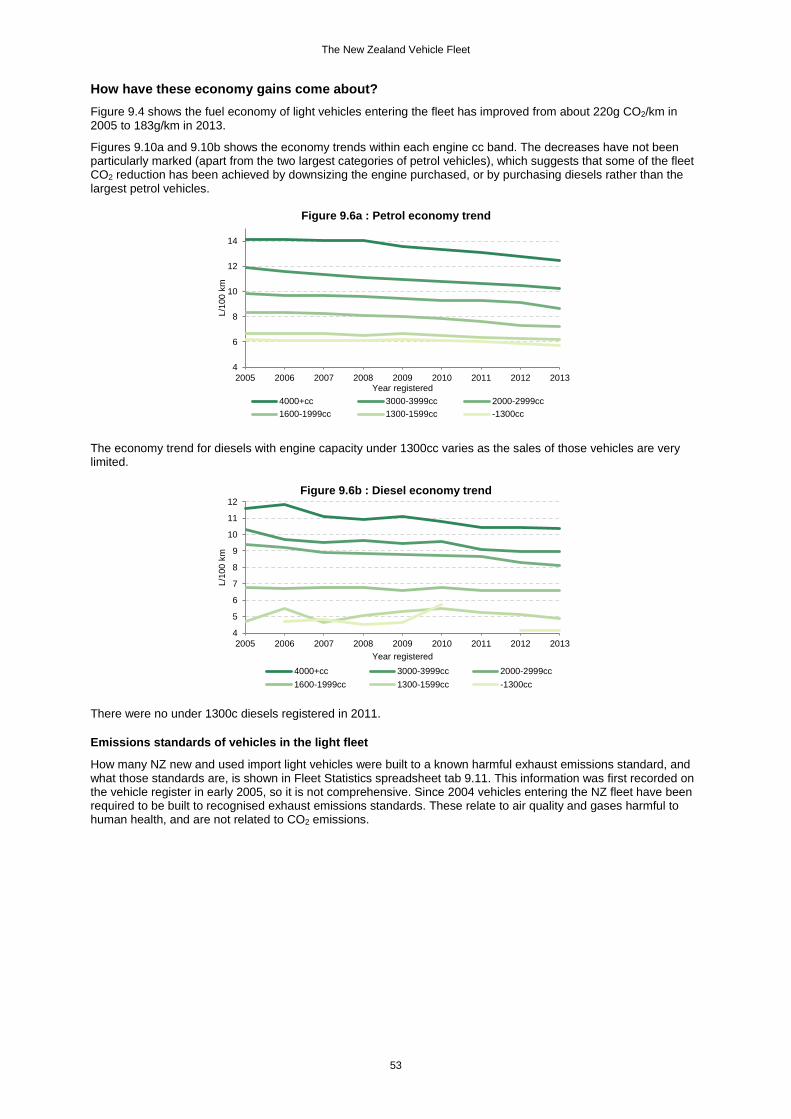
The New Zealand Vehicle Fleet
How have these economy gains come about? Figure 9.4 shows the fuel economy of light vehicles entering the fleet has improved from about 220g CO2/km in 2005 to 183g/km in 2013.
Figures 9.10a and 9.10b shows the economy trends within each engine cc band. The decreases have not been particularly marked (apart from the two largest categories of petrol vehicles), which suggests that some of the fleet CO2 reduction has been achieved by downsizing the engine purchased, or by purchasing diesels rather than the largest petrol vehicles.
The economy trend for diesels with engine capacity under 1300cc varies as the sales of those vehicles are very limited.
There were no under 1300c diesels registered in 2011. Emissions standards of vehicles in the light fleet
How many NZ new and used import light vehicles were built to a known harmful exhaust emissions standard, and what those standards are, is shown in Fleet Statistics spreadsheet tab 9.11. This information was first recorded on the vehicle register in early 2005, so it is not comprehensive. Since 2004 vehicles entering the NZ fleet have been required to be built to recognised exhaust emissions standards. These relate to air quality and gases harmful to human health, and are not related to CO2 emissions.
4
6
8
10
12
14
2005 2006 2007 2008 2009 2010 2011 2012 2013
L/10
0 km
Year registered
Figure 9.6a : Petrol economy trend
4000+cc 3000-3999cc 2000-2999cc1600-1999cc 1300-1599cc -1300cc
4
5
6
7
8
9
10
11
12
2005 2006 2007 2008 2009 2010 2011 2012 2013
L/10
0 km
Year registered
Figure 9.6b : Diesel economy trend
4000+cc 3000-3999cc 2000-2999cc1600-1999cc 1300-1599cc -1300cc
53
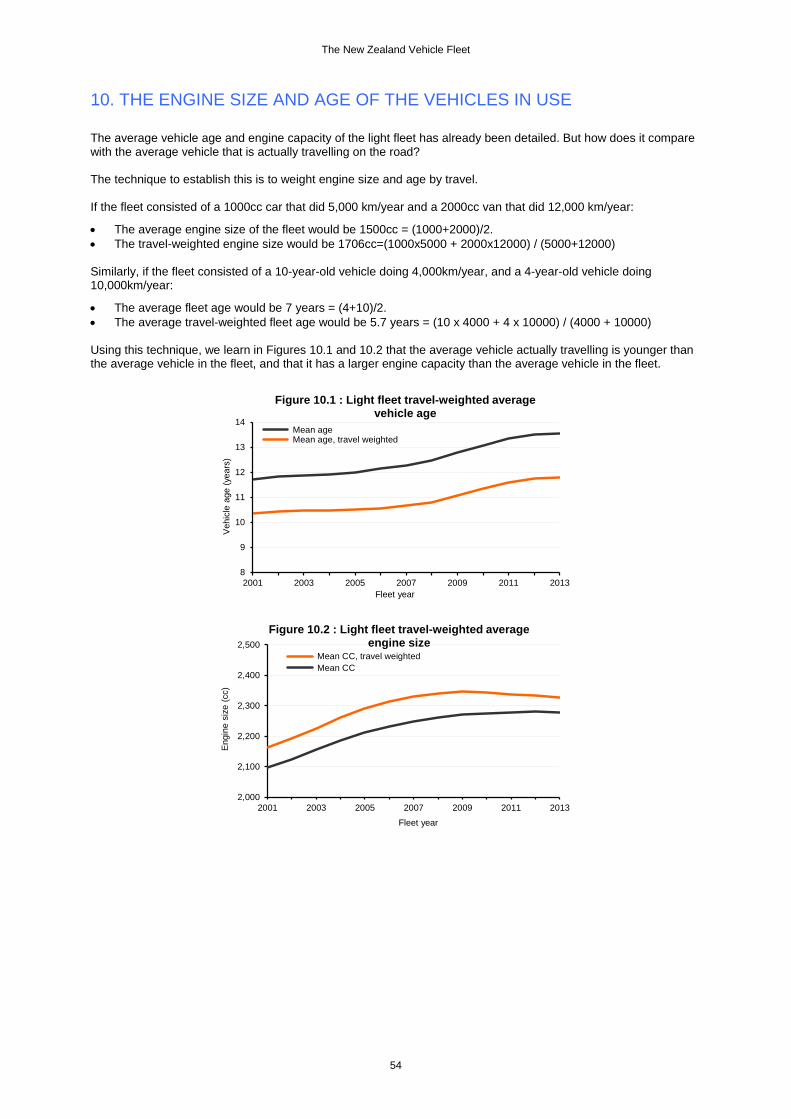
The New Zealand Vehicle Fleet
10. THE ENGINE SIZE AND AGE OF THE VEHICLES IN USE The average vehicle age and engine capacity of the light fleet has already been detailed. But how does it compare with the average vehicle that is actually travelling on the road? The technique to establish this is to weight engine size and age by travel. If the fleet consisted of a 1000cc car that did 5,000 km/year and a 2000cc van that did 12,000 km/year:
• The average engine size of the fleet would be 1500cc = (1000+2000)/2. • The travel-weighted engine size would be 1706cc=(1000x5000 + 2000x12000) / (5000+12000) Similarly, if the fleet consisted of a 10-year-old vehicle doing 4,000km/year, and a 4-year-old vehicle doing 10,000km/year:
• The average fleet age would be 7 years = (4+10)/2. • The average travel-weighted fleet age would be 5.7 years = (10 x 4000 + 4 x 10000) / (4000 + 10000) Using this technique, we learn in Figures 10.1 and 10.2 that the average vehicle actually travelling is younger than the average vehicle in the fleet, and that it has a larger engine capacity than the average vehicle in the fleet.
8
9
10
11
12
13
14
2001 2003 2005 2007 2009 2011 2013
Veh
icle
age
(yea
rs)
Fleet year
Figure 10.1 : Light fleet travel-weighted average vehicle age
Mean age Mean age, travel weighted
2,000
2,100
2,200
2,300
2,400
2,500
2001 2003 2005 2007 2009 2011 2013
Eng
ine
size
(cc)
Fleet year
Figure 10.2 : Light fleet travel-weighted average engine size
Mean CC, travel weighted Mean CC
54
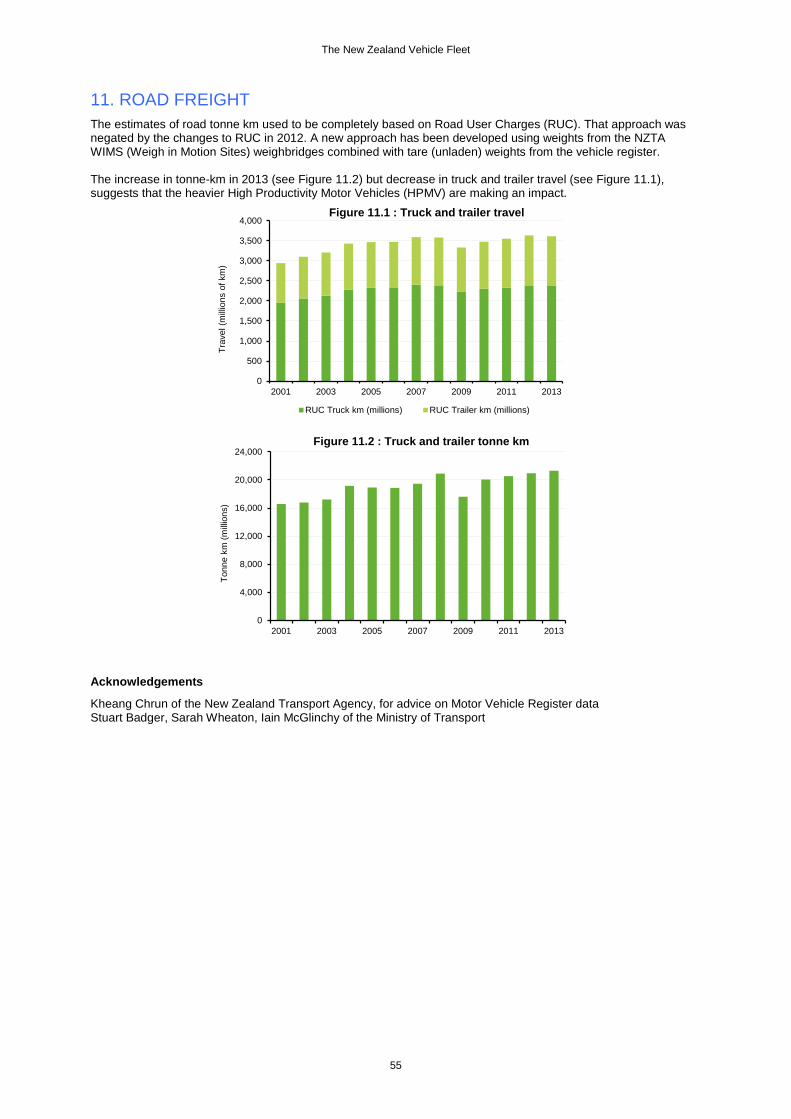
The New Zealand Vehicle Fleet
11. ROAD FREIGHT The estimates of road tonne km used to be completely based on Road User Charges (RUC). That approach was negated by the changes to RUC in 2012. A new approach has been developed using weights from the NZTA WIMS (Weigh in Motion Sites) weighbridges combined with tare (unladen) weights from the vehicle register. The increase in tonne-km in 2013 (see Figure 11.2) but decrease in truck and trailer travel (see Figure 11.1), suggests that the heavier High Productivity Motor Vehicles (HPMV) are making an impact.
Acknowledgements
Kheang Chrun of the New Zealand Transport Agency, for advice on Motor Vehicle Register data Stuart Badger, Sarah Wheaton, Iain McGlinchy of the Ministry of Transport
0
500
1,000
1,500
2,000
2,500
3,000
3,500
4,000
2001 2003 2005 2007 2009 2011 2013
Trav
el (m
illio
ns o
f km
)Figure 11.1 : Truck and trailer travel
RUC Truck km (millions) RUC Trailer km (millions)
0
4,000
8,000
12,000
16,000
20,000
24,000
2001 2003 2005 2007 2009 2011 2013
Tonn
e km
(mill
ions
)
Figure 11.2 : Truck and trailer tonne km
55
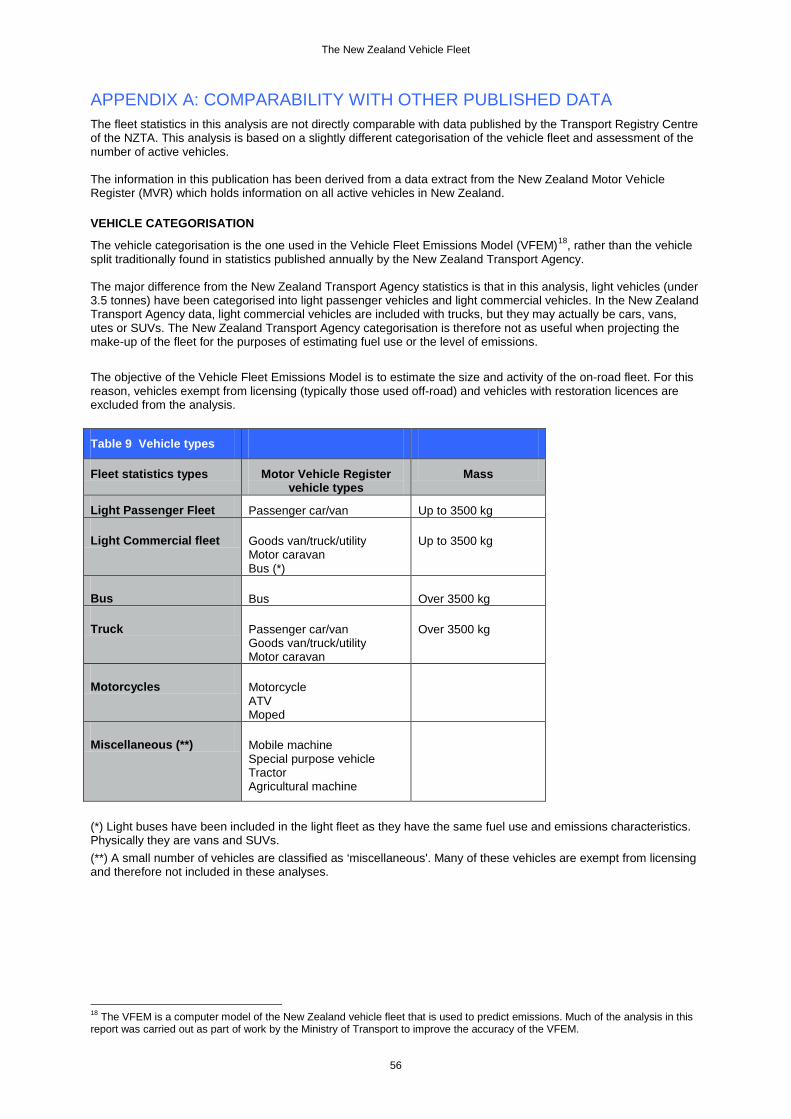
The New Zealand Vehicle Fleet
APPENDIX A: COMPARABILITY WITH OTHER PUBLISHED DATA The fleet statistics in this analysis are not directly comparable with data published by the Transport Registry Centre of the NZTA. This analysis is based on a slightly different categorisation of the vehicle fleet and assessment of the number of active vehicles. The information in this publication has been derived from a data extract from the New Zealand Motor Vehicle Register (MVR) which holds information on all active vehicles in New Zealand. VEHICLE CATEGORISATION
The vehicle categorisation is the one used in the Vehicle Fleet Emissions Model (VFEM)18, rather than the vehicle split traditionally found in statistics published annually by the New Zealand Transport Agency. The major difference from the New Zealand Transport Agency statistics is that in this analysis, light vehicles (under 3.5 tonnes) have been categorised into light passenger vehicles and light commercial vehicles. In the New Zealand Transport Agency data, light commercial vehicles are included with trucks, but they may actually be cars, vans, utes or SUVs. The New Zealand Transport Agency categorisation is therefore not as useful when projecting the make-up of the fleet for the purposes of estimating fuel use or the level of emissions.
The objective of the Vehicle Fleet Emissions Model is to estimate the size and activity of the on-road fleet. For this reason, vehicles exempt from licensing (typically those used off-road) and vehicles with restoration licences are excluded from the analysis. Table 9 Vehicle types
Fleet statistics types Motor Vehicle Register vehicle types
Mass
Light Passenger Fleet Passenger car/van Up to 3500 kg
Light Commercial fleet Goods van/truck/utility Motor caravan Bus (*)
Up to 3500 kg
Bus Bus Over 3500 kg
Truck Passenger car/van Goods van/truck/utility Motor caravan
Over 3500 kg
Motorcycles Motorcycle ATV Moped
Miscellaneous (**) Mobile machine Special purpose vehicle Tractor Agricultural machine
(*) Light buses have been included in the light fleet as they have the same fuel use and emissions characteristics. Physically they are vans and SUVs. (**) A small number of vehicles are classified as ‘miscellaneous'. Many of these vehicles are exempt from licensing and therefore not included in these analyses.
18 The VFEM is a computer model of the New Zealand vehicle fleet that is used to predict emissions. Much of the analysis in this report was carried out as part of work by the Ministry of Transport to improve the accuracy of the VFEM.
56
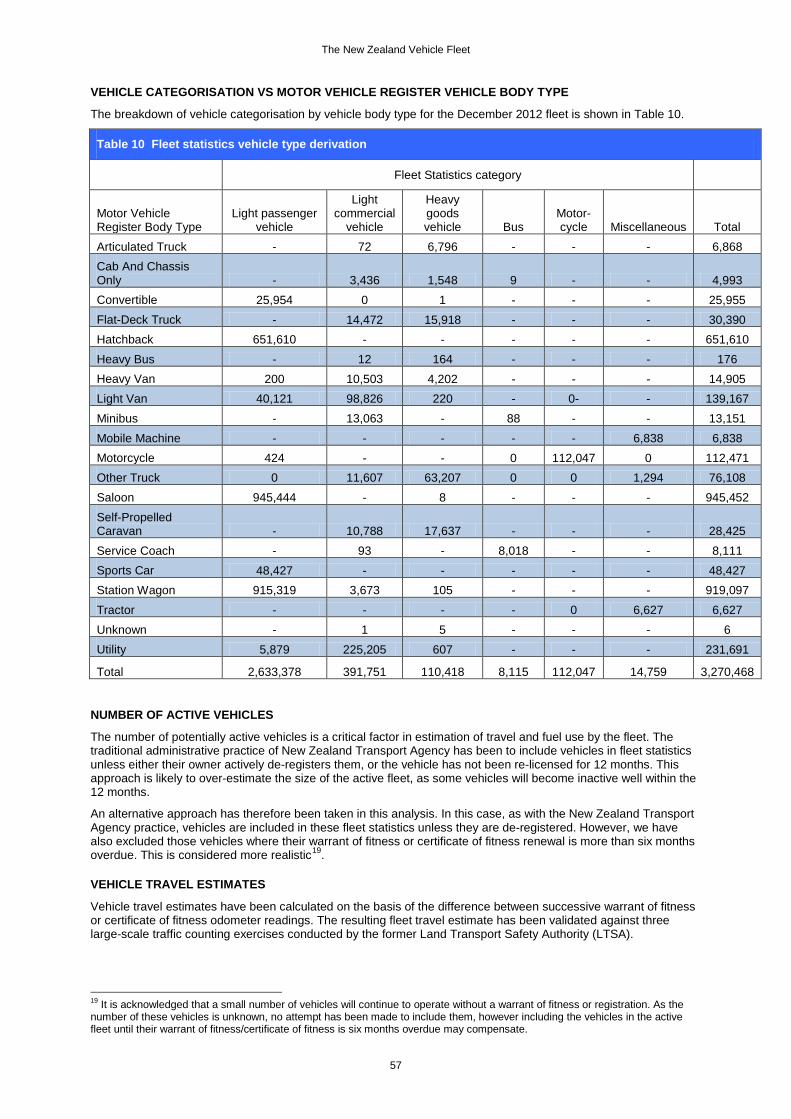
The New Zealand Vehicle Fleet
VEHICLE CATEGORISATION VS MOTOR VEHICLE REGISTER VEHICLE BODY TYPE
The breakdown of vehicle categorisation by vehicle body type for the December 2012 fleet is shown in Table 10.
Table 10 Fleet statistics vehicle type derivation
Fleet Statistics category
Motor Vehicle Register Body Type
Light passenger vehicle
Light commercial
vehicle
Heavy goods vehicle Bus
Motor-cycle Miscellaneous Total
Articulated Truck - 72 6,796 - - - 6,868 Cab And Chassis Only - 3,436 1,548 9 - - 4,993 Convertible 25,954 0 1 - - - 25,955 Flat-Deck Truck - 14,472 15,918 - - - 30,390 Hatchback 651,610 - - - - - 651,610 Heavy Bus - 12 164 - - - 176 Heavy Van 200 10,503 4,202 - - - 14,905 Light Van 40,121 98,826 220 - 0- - 139,167 Minibus - 13,063 - 88 - - 13,151 Mobile Machine - - - - - 6,838 6,838 Motorcycle 424 - - 0 112,047 0 112,471 Other Truck 0 11,607 63,207 0 0 1,294 76,108 Saloon 945,444 - 8 - - - 945,452 Self-Propelled Caravan - 10,788 17,637 - - - 28,425 Service Coach - 93 - 8,018 - - 8,111 Sports Car 48,427 - - - - - 48,427 Station Wagon 915,319 3,673 105 - - - 919,097 Tractor - - - - 0 6,627 6,627 Unknown - 1 5 - - - 6 Utility 5,879 225,205 607 - - - 231,691
Total 2,633,378 391,751 110,418 8,115 112,047 14,759 3,270,468
NUMBER OF ACTIVE VEHICLES
The number of potentially active vehicles is a critical factor in estimation of travel and fuel use by the fleet. The traditional administrative practice of New Zealand Transport Agency has been to include vehicles in fleet statistics unless either their owner actively de-registers them, or the vehicle has not been re-licensed for 12 months. This approach is likely to over-estimate the size of the active fleet, as some vehicles will become inactive well within the 12 months.
An alternative approach has therefore been taken in this analysis. In this case, as with the New Zealand Transport Agency practice, vehicles are included in these fleet statistics unless they are de-registered. However, we have also excluded those vehicles where their warrant of fitness or certificate of fitness renewal is more than six months overdue. This is considered more realistic19.
VEHICLE TRAVEL ESTIMATES
Vehicle travel estimates have been calculated on the basis of the difference between successive warrant of fitness or certificate of fitness odometer readings. The resulting fleet travel estimate has been validated against three large-scale traffic counting exercises conducted by the former Land Transport Safety Authority (LTSA).
19 It is acknowledged that a small number of vehicles will continue to operate without a warrant of fitness or registration. As the number of these vehicles is unknown, no attempt has been made to include them, however including the vehicles in the active fleet until their warrant of fitness/certificate of fitness is six months overdue may compensate.
57