Embed Size (px)
Citation preview

Annual General Meeting23 November 2018

Forward-Looking Statements
This presentation contains forward-looking statements. These statements have been made by the Directors in good faith based on the information available to them up to the time of the preparation of this presentation. Due to the inherent uncertainties, including both economic and business risk factors underlying such forward-looking information, actual results may differ materially from those expressed or implied by these forward-looking statements. The Directors undertake no obligation to update any forward-looking statements contained in this presentation, whether as a result of new information, future events or otherwise.
2

2018 Highlights
3

2018 Financial Highlights
Dividend
Results ahead
of guidance
Strong contribution
from associates
and joint venture
Strong cash
performance
All percentage movements quoted above are in constant currency4
Operating Profit: +4.6% to €71.2 million
Adjusted EPS: +7.6% to 48.8 cent
Share of PAT: +70% to €7.2 million
Free Cashflow: +74.1% to €56.6 million
Year end debt: €38.4 million
Year end leverage: 0.54x
Final dividend: 17.85 cent
Total dividend: 21.00 cent
Payout ratio: 43%

2018 Operational Highlights
New seed processing and
input formulation facility in Poland
Investment in new operating
capacity for Feed business
Strong businessperformance in
highly challengingseason
Integration of acquisitions completed
in 2018
Agri-Services Digital roll out well advanced
in period
5

2018 Strategic Highlights
Creating the
building blocks for
future growth
First time entry
in Latin AmericaBrazil
Paraná
New and devolved capability organisedon a geographical profit centre basis
Enhanced Group services and functional leadership
Geographical diversification
Seasonality balance
Building international scale
Appointment of new CFO
Appointment of CEO Continental Europe
Appointment of CEO Latin America
6

Business Overview & Strategy
7
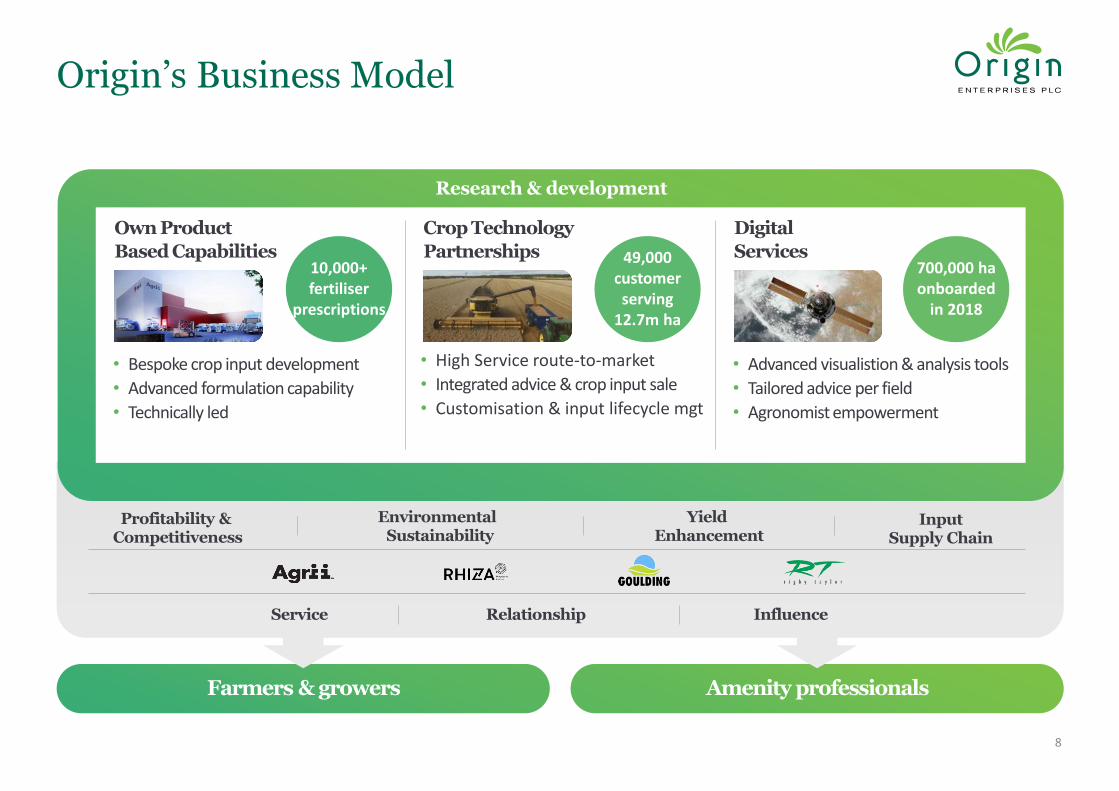
Research & development
Origin’s Business Model
8
Crop Technology
Partnerships
Digital
Services
Own Product
Based Capabilities 49,000customerserving
12.7m ha
700,000 haonboarded
in 2018
10,000+fertiliser
prescriptions
• Advanced visualistion & analysis tools
• Tailored advice per field
• Agronomist empowerment
• Bespoke crop input development
• Advanced formulation capability
• Technically led
• High Service route-to-market
• Integrated advice & crop input sale
• Customisation & input lifecycle mgt
Amenity professionalsFarmers & growers
EnvironmentalSustainability
Profitability &Competitiveness
Input Supply Chain
Yield Enhancement
InfluenceService Relationship

The Strategic Context for Farming & FoodMacro Trends
9
Productivity and Yield Gaps
Regulation and Escalating Cost of Innovation
Increasing Farm Professionalisation
Consolidation
Climate Change and Environmental
Stewardship
Digital Agriculture and Greater Technology
Enablement
Populationgrowth
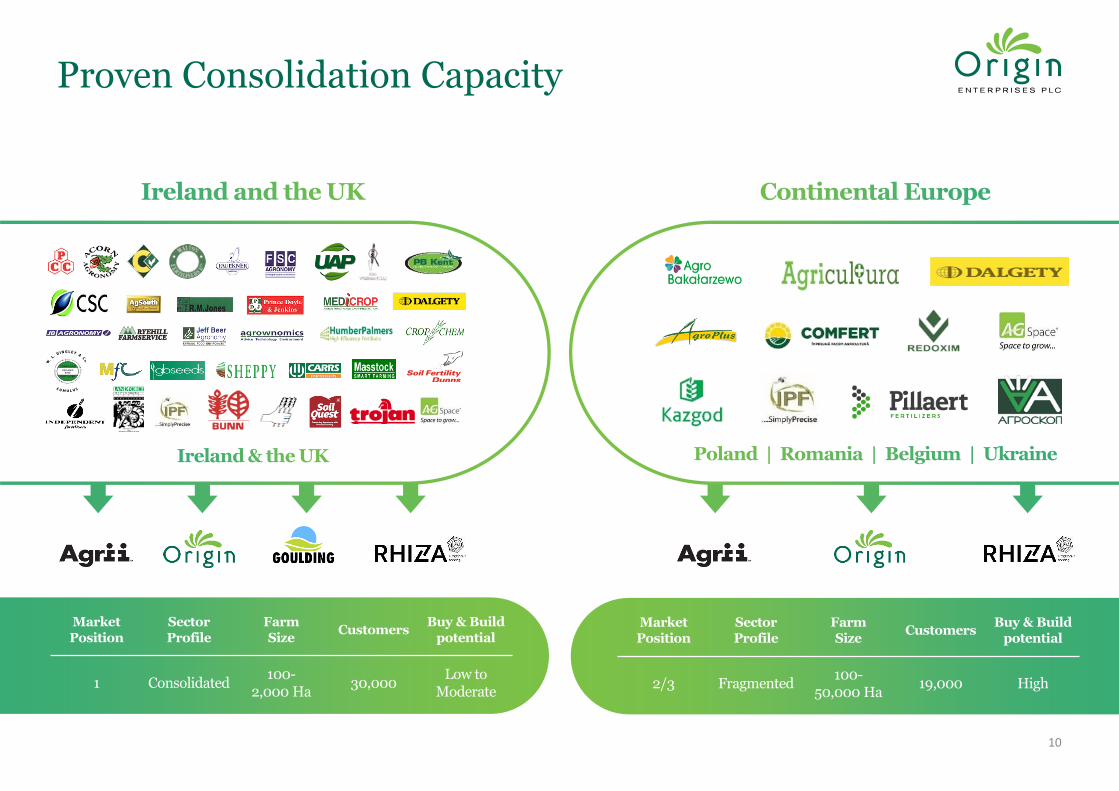
Proven Consolidation Capacity
10
MarketPosition
SectorProfile
FarmSize
CustomersBuy & Build
potential
1 Consolidated100-
2,000 Ha30,000
Low to Moderate
MarketPosition
SectorProfile
FarmSize
CustomersBuy & Build
potential
2/3 Fragmented100-
50,000 Ha19,000 High

Latin America
Primary producers
• Increasing professionalisation• Increasing intensification and farm consolidation
Speciality nutrition
• Second stage application dedicated to professional holdings
Speciality inputs – growing market
• US$1.7bn in 2016• US$2.2bn in 2021
Brazil – Market Overview
Global Player
0
5
10
15
20
25
30
35
40
0
50
100
150
200
250
20
01
/02
20
03
/04
20
05
/06
20
07
/08
20
09
/10
20
11
/12
20
13
/14
20
15
/16
20
17
/18
E
Production (million t)
Planted area (million ha)
Fertiliser (million t)
Grain Production, planted area and fertiliser consumption
2.42.5 2.6
3.0 3.13.3
3.4 3.23.7
Yield (t/ha)
> 2x Total area of UK
+22% from 2015/2016
Available to be converted into crop land
+30% from 15 years ago
Croplandarea (m ha)
Grain production (m tons)
Pasture land (m ha)
Soya yield(1,000 t/ha)
59
228
198
3.3
% Global Trade
21%
44%
31%
75%
Corn
Sugar
Coffee
FCOJ
Source: CONAB, Rabobank, IBGE
39%Soy
Fertiliser(million t)(millions)
11
#2Export
#1Export
#1Export
#1Export
#2Export
#3Production
#1Production
#1Production
#1Production
#2Production

Latin America
Crop input development
• Leading developer and manufacturer of high value nutrition and speciality inputs
• Paraná state based
• Supplies Brazil and export market
Crop services
• Leading provider of agronomy services, inputs and crop handling / marketing services
• Paraná state based
Main crops
• Soy beans• Corn
Customers
1,200Turnover
€28.4mEBITDA
€9.3mSales Force
60
Customers
4,000EBITDA
€4.3m
Turnover
€88.2mSales Force
65Market: Branded Retail Market: Direct Farm Distribution
• Sugar Cane• Wheat
• Farm size – 100 – 1,000 ha2
• Two crops per year• Fragmented market• Well capitalised primary producers• Favourable logistics to export
19,5
86
17,8
38
3,4
11
24
,83
5
20
,94
2
4,1
34
SoybeanCornWheat
2016/17
2026/27
+ 17%+ 21%
+ 27%
Paraná State
200,000km2
> 2x total areaof Ireland
Source: CONAB, Rabobank, IBGE
Brazil Investment
12
Paraná Production Forecast – Million tns

Group StrategyBuilding Sustainable Value
13
Our VisionTo be the leading and trusted
partner of choice to the farmers,
growers and amenity professionals we serve
Our PurposeTo deliver innovative crop manage-
ment systems to enhance the profitability
and sustainability of our customers’ enterprises
People & Organisation
Development of new and
evolved leadership teams
Improved accountabilities
and autonomy to execute
growth agenda
Scale
Concentrate on target
geographies with long term
growth potential
Build complementary
product based &
distribution capabilities
Market Focus
Prioritise customisation &
localisation of service
Leverage operating model
through investments in
digital & agronomic
capabilities
Portfolio Positioning
Maintain differentiated
position as specialist
route-to-market for crop
technologies
Optimise Group portfolio
through balanced business
and geographical
diversification

Investment Proposition
Market leading
positions with developed routes-to-
market
Consistent & maintainable
cash generation
Favourable long term
market fundamentals
Long term customer & supplier
partnerships
Industryleading R&D and technical
excellence
Strongbalance
sheet with flexibility for
M&A
Diversified geographic & business portfolio
Balanced organic growth,
international expansionand M&A potential
Well positioned to embrace Digitisation
of Agri-Services
974 531 82 6
14

Summary
15

Summary
16
Improving on-farm sentiment may be challenged in the UK by the uncertain nature of Brexit and its timing
Favourable start to FY 2019 with good demand and positive contribution from Latin America
Well positioned to capitalise on scalable and diversified business platform
Resilient 2018 business performance in challenging trading conditions

www.originenterprises.com
4-6 Riverwalk, Citywest Business Campus, Dublin 24, IrelandT: +353 1 5634900 F: +353 1 5634916