Embed Size (px)
Citation preview

ANNUAL REPORT
2005
MID-COLUMBIA FISH DISTRICT OREGON DEPARTMENT OF FISH AND WILDLIFE
ROD FRENCH DISTRICT FISH BIOLOGIST
JASON SEALS ASSISTANT DISTRICT FISH BIOLOGIST

Fish Liberations Spring Chinook Deschutes River: The 2005 release of 312, 928 spring Chinook smolts into the Deschutes River was completed during April, 2005 (Table 1). This year’s release is more than the 2004 release of 251,674 and represents the seventh consecutive year that the entire spring Chinook production was reared in the Pelton Ladder. As in past years, the entire production was marked ADCWT and was released immediately downstream from the Pelton Reregulation Dam at river mile 100. Hood River: A total of 128,971 Deschutes stock spring Chinook smolts were released into the Hood River Subbasin from three acclimation locations (Table 1). The spring Chinook juveniles released into the Hood River in 2005 was less than the 2004 release of 160,033 smolts, but close to the target of 125,000. The CTWS continued acclimating smolts at various sites which included Jones Creek, Blackberry, and the Parkdale Facility. Summer Steelhead Deschutes River: Round Butte Hatchery raised and successfully released 156,939 Deschutes stock summer steelhead smolts into the Deschutes River at river mile 100 in early April, 2005 (Table 1). This release into the Deschutes is similar to the release in 2004. The 2004 summer steelhead release was fin marked ADLM. Hood River: A total of 50,121 Hood River stock summer steelhead were transfered from Oaksprings Hatchery to the Blackberry Creek Acclimation site on the Hood River in 2005 (Table 1). Of the release group, 44,080 were volitionally released from the Blackberry Creek Acclimation site, and 4,911 non-migrants were released near the mouth of Hood River after failing to leave the acclimation ponds. Transfers from Oaksprings to Blackberry Creek occurred from late March until late April. Non-migrants releases near the mouth of Hood River occurred in early May. All fish were marked with an ADRM fin mark. Additionally, a total of 31,269 lot 24 (Foster/Skamania stock) smolts were direct released into the main stem Hood River below Powerdale Dam on the 1st of March. This group was fin marked AD only and continued to represent a declining number of Skamania stock releases into the Hood River (Table 1). Winter Steelhead Hood River: A total 60,971 of winter steelhead smolts were transferred from Oaksprings Hatchery to East Fork Sand Trap and Parkdale Fish Facility acclimation sites on the Hood River in 2005 (Table 1). All smolts were marked ADRV fin mark. The East Fork Irrigation District sand trap facility received and acclimated a total of 39,971 winter steelhead smolts. Non-migrants were trucked from this site and not force released, similar to last year. Additionally,
two groups totaling 20,000 smolts were acclimated and released from the Parkdale Fish Facility. The average size of the non-migrants was substantially smaller than fish that migrated from the acclimation ponds. Standing Water Bodies Sixteen district lakes or reservoirs were stocked with rainbow trout during the calendar year (Table 2). We stocked a total of 211,733 rainbow legals in standing water bodies throughout the district in 2005.
Fingerling Releases: Four district lakes or reservoirs were stocked with rainbow fingerling this year which included Baker Pond, Pinehollow Reservoir, Rock Creek Reservoir, and Taylor Lake that totaled 73,042.
Legal Releases: Legal rainbow trout were released in all sixteen of the stocked district
lakes of 2005. A total of 111,528 were released. Brood Trout: Eleven district lakes or reservoirs were stocked with a total of 265 brood
trout that were excess to the needs of Oak Springs Hatchery.
Air Stock Lakes: We stocked about 20,825 triploid brook trout in high lakes within the District in 2005 (Table 2). District Streams: No fingerling or legal trout were stocked into district streams in 2004.
Warm water Game Fish No warm water game fish were released into district waters during 2004.
FISH INVENTORY SPRING CHINOOK Deschutes River: The 2005 Deschutes River spring Chinook salmon run year was completed at Round Butte Hatchery (RBH) in September, 2005. A total of 1,498 adult spring Chinook returned to the Pelton Trap during the 2005 run year, which was dramatically higher than 2004 but below the five year average (Table 3). Jack spring Chinook returns to the Pelton Trap in 2005 were comparable to recent years (Table 4). The 2005 return of hatchery origin adults to WSNFH was less than recent years and was weak compared to recent years(Table 5). A total of 1,035 adult and 128 jack hatchery origin spring Chinook were captured during the run year (Table 5). A total of 677 wild adult spring Chinook were captured at the WSNFH barrier dam in 2005. This represents a weak run of wild adults and was well below the escapement goat of 1,300 wild

adults (Table 5). The capture of wild jack spring Chinook at WSNFH continued to decrease from recent run years (Table 5). Wild spring Chinook redd counts in the Warm Springs River system were conducted by the Confederated Tribes of Warm Springs (CTWS) Department of Natural Resources during 2005. Surveyors counted 52 redds, which was the lowest redd count in the Warm Springs River on record (Table 6). The adult per redd ratio was very high which is likely a result of high pre-spawning mortality. The annual pre-season prediction for spring Chinook run strength is calculated jointly by ODFW, CTWS and the US Fish and Wildlife Service. The pre-season prediction for 2005 was 1,800 wild spring Chinook. This prediction for the 2005 return indicated that the wild escapement goal of 1,300 adults across the barrier dam at WSNFH should be met or exceeded and that both WSNFH and RBH would return more hatchery origin adults than was needed for broodstock. The Lower Deschutes Subbasin Fish Management Plan goals and objectives for spring Chinook allow a sport fishery to proceed if the pre-season prediction suggests that the wild escapement goal will be met. The decision to allow a sport season for hatchery only, mandatory wild release and seven days per week was made in cooperation with CTWS although as a measure to allow for increased wild escapement. The 2005 sport fishery for spring Chinook was originally set to occur from April 15 to July 31, however, due to unexpected low returns to Bonneville Dam and WSNFH in April and early May, we declared an emergency closure to the sport fishery on May 15. The Sherars Falls sport fishery was sampled using the traditional statistically expandable sampling schedule. Due to the emergency closure of the fishery on May 15, low numbers of anglers and angler hours resulted in the harvest of an estimated 417 spring Chinook adults (Table 7). Sport angler compliance with the wild spring Chinook release regulation was excellent. The CTWS allowed tribal fishers unlimited harvest of hatchery and wild origin spring Chinook throughout the spring season. The fishery began April 15, 2005. The tribal dip net and hook and line fisheries were jointly sampled by ODFW and CTWS. Tribal fishers harvested a total of 504 adult hatchery and 133 wild spring Chinook (Table 8). Hood River: The Powerdale Trap, similar to the trap used in the late 1960’s and early 1970’s was reconstructed and put into operation in the Powerdale Dam fish ladder in December 1991, to collect information on anadromous fish populations in the Hood River system. Powerdale Dam, a PacifiCorp dam used to divert water downstream three miles for power generation, is located at river mile 4 on the Hood River. This trap was operated continuously from December, 1991 until December, 1996 when the Bonneville Power Administration (BPA) funded Powerdale Dam adult salmon and steelhead trapping facility was completed. Data on Hood River anadromous species reported here were collected at these two trap facilities. Initial spring Chinook captures at the Powerdale Trap are reported in Table 9. These data are reported on a provisional basis as the run progresses and are presented in monthly reports prior to the availability of final scale analysis data. Final run total summaries used by the BPA funded Hood River Production Project reported here and in annual reports for that project are calculated

from scale analysis for origin and age. Preliminary data may not correspond to the more detailed, age specific capture data presented by the BPA Hood River Production Project annual report. The preliminary total number of 796 adult and jack, hatchery and wild spring Chinook returning to the Hood River in 2005 was higher than most years on record (Table 9). Table 10 presents the more detailed bi-weekly spring Chinook returns to Powerdale Dam. A total of 111 naturally produced spring Chinook was the second highest number on record. The number of subbasin hatchery origin returns increased from the past two years was also one of the highest returns on record. The age structure of 2005 adult returning natural spring Chinook and hatchery spring Chinook appeared to be different in the number of years spent in saltwater (Table 11). The most common ages for natural spring Chinook in 2005 was age four and five with two years spent in freshwater, which resulted in near equal numbers of two salt and three salt fish. In contrast, age four adult Deschutes stock hatchery returns made up 87% of the total adult Deschutes stock captured. We continued to see high rates of mini-jacks in the Deschutes stock returns. The anticipated good return of adult spring Chinook to the Hood River allowed a sport harvest opportunity in 2005. An estimated 46 hatchery adult and 8 jack Chinook were harvested (Table 12). The Warm Springs Tribe also enacted a spring Chinook harvest opportunity for tribal members on the Hood River in 2004. FALL CHINOOK Deschutes River: A cumulative total of 258 adult fall Chinook were captured at the Pelton Trap during the 2005 run year (Table 13). This was a very high capture year for fall Chinook adults at the Pelton Trap and was well above the 5 year average of 142 adults. The 2005 run year capture of 188 jack fall Chinook was also high and above the 5 year average of 153 (Table 14). Based on a pre-season prediction of an adult fall Chinook return considerably greater than the target escapement figures of 4,000 adults to the mouth of the Deschutes and 2,000 adults upstream from Sherars Falls, a sport harvest of unmarked fall Chinook was allowed by temporary rule from August 1, 2005 to October 31, 2005. Sport anglers and tribal fishers were sampled by ODFW on the standard statistical harvest schedule. Effort and catch for adult fall Chinook by sport anglers was comparable to recent years with an estimated 285 adults harvested (Table 15). Tribal dip net fishers were jointly sampled by CTWS and ODFW, an arrangement that allows for greater coverage of the fishery. The joint sampling arrangement worked out very well this year. Tribal fishers harvested an estimated 542 adult and 2 jack fall Chinook during their harvest season. Although this was a decrease from the previous three years, harvest was still relatively high (Table 16).
The Sherars Falls adult migrant fish trap was operated from June 20 to October 30, 2005. Adult and jack fall Chinook were trapped and tagged at this facility and standard biosampling was conducted. Tags are placed to facilitate later Peterson mark-recapture population estimates of the number of adult and jack fall Chinook passing Sherars Falls. All fall Chinook sampled at the trap were biosampled, tagged with two Floy tags and released to continue their journey. A total of 615 adult fall Chinook were captured at an average rate of 0.80 fish per hour (Tables 17 and 18). We also captured a total of 152 jack fall Chinook at an average rate of 0.32 fish per hour, (Tables 19 and 20). It is important to note that catch per hour data from the Sherars Falls trap for both adult and jack fall Chinook are not good predictors of the final mark-recapture population estimates. Peterson mark-recapture population estimates for both adult and jack fall Chinook passing Sherars Falls are made each year by tagging fall Chinook at the Sherars Falls trap and making later recoveries of both tagged and untagged fish at the Pelton Trap and from spawned out carcasses recovered by survey crews from the Pelton Reregulation Dam downstream to Trout Creek. An estimated 4,278 adult fall Chinook passed above Sherars Falls in 2005 (Table 21). This estimate is one of the highest on record and is well above the target escapement of 2,000 adults contained in the Lower Deschutes River Fish Management Plan. An estimated 1,463 jack fall Chinook also passed Sherars Falls in 2005, a slight increase from the past few years and well within the range of previous estimates (Table 21). Two aerial, helicopter conducted, fall Chinook redd counts were made in 2005. Fair counting conditions were experienced on the first flight from Trout Creek to the mouth on November 30, fog prohibited counting from Round Butte to Trout Creek. Water visibility was marginal on the second count, conducted on the 6th of December, for the entire 100 miles of river. As described in previous report, two independent counters are used to count redds in each reach on each of the flights. The largest of the four independent counts is used as the final figure for the year for each section and reach under the philosophy that it is easier to miss counting redds rather than mistaking something for a redd. A total of 738 redds were counted for the entire 100 mile reach (Table 22). It is important to note that the redd count is not a good indicator of run strength. The redd counts are necessary to determine the ratio of redds above Sherars to the redds below Sherars to expand the total spawner escapement. The proportion of redds counted downstream from Sherars Falls decreased from the previous two years (Table 23). Total run size and escapement estimates for adult fall Chinook were made for the 2005 run based on the estimated escapement of adults above Sherars Falls and redd count data both above and below Sherars Falls and harvest in the Deschutes River. An estimated 14,385 adult fall Chinook returned to the Deschutes during the 2005 run year, the largest estimated return for the period of record (Table 24). Since 2001, the number of fall Chinook estimated in the Deschutes has maintained greater than 11,100 adults which is unprecedented compared to previous years on

record. Both run to the river and escapement figures for 2005 are likely minimum values due to the incomplete nature of the redd counts. Total run size estimates (fish to the mouth of the Deschutes) and escapement estimates for jack fall Chinook were made for the 2005 run based on estimated escapement of adult fall Chinook below Sherars Falls, the ratio of estimated jacks to adults above Sherars Falls and harvest in the Deschutes River. An estimated 4,769 jack fall Chinook returned to the Deschutes during the 2005 run resulting in escapement to the spawning grounds of 4,634 (Table 25). Both figures are comparable to recent years.
Hood River: Classification of spring and fall races is made based on a combination of factors including date of capture, body condition and confirmation, brightness, scale tightness and erosion, degree of ripeness relative to the time of year, and external parasite load. All fall Chinook captured at the Powerdale Trap are biosampled, tagged, and passed above the dam to continue their journey.
A total of 49 Chinook classified as fall Chinook were captured at the Powerdale Trap during 2005 (Table 26). In contrast to previous years and based upon scale analysis and fin mark, the majority of these fish appear to be of unnatural origin with a small percentage composed of natural origin fish. The natural origin fish appear to be primarily four years old with one year being spent in freshwater (Table 27). Three year old and five year old fish with one freshwater year are also common.

COHO
Deschutes River: We captured 10 coho at the Sherars Trap in 2005. This continues a recent unusual trend of capturing Coho in the Deschutes. There are no historical records that indicate they historically occurred. We captured a total of 35 unmarked and 1 marked hatchery Coho in 2004 and 48 unmarked and 1 marked Coho in 2003. Between 1995 and 2002 we only captured a total of 26 marked and unmarked Coho. Although the origin of these fish has not been documented, we believe most are likely unmarked hatchery origin strays. In fall 2004, an ODFW employee noticed numerous Coho staging at the mouth of Buckhollow Creek. Although undocumented, it is possible that natural production may be occurring. Hood River: A total of 27 unmarked origin, 263 hatchery origin and 30 coho of unknown origin (as determined by scale analysis) entered the Powerdale Trap during 2005 (Table 28). All unmarked coho were passed upstream after biosampling and tagging. We believe many of the unmarked coho are strays from other Columbia Basin hatchery programs. Similar to past years, stray hatchery origin coho as determined by hatchery fin mark were not allowed to pass upstream into the spawning grounds. Hatchery origin coho were recycled back to the mouth of the Hood River. Coho escapement to Powerdale Trap by age and origin is presented in Table 29. Analysis of freshwater growth scale patterns suggest these stray and natural coho possess a typical hatchery pattern common for a variety of Columbia Basin hatchery coho programs. SUMMER STEELHEAD Deschutes River 2004-05 Run Year: A total of 3,125 summer steelhead entered the Pelton Trap during the run year (June 1, 2004 to May 31, 2005). This total of all steelhead captured is less than the 5-year average of 4,715 (Table 30). A total of 501 Round Butte Hatchery origin fish were collected for broodstock. Round Butte Hatchery origin returns made up 68.9% of steelhead captures at the trap, a larger percentage than most of the recent run years (Table 31). The percentage of stray hatchery origin summer steelhead captured at the Pelton Trap, while lower than usual, was still high (Table 31). The percentage of wild fish captured remained about 3% of the total capture at Pelton Trap (Table 31). Peterson mark-recapture population estimates for the various components of the 2004-05 summer steelhead run passing Sherars Falls were made after the completion of the run year on May 31, 2005. All summer steelhead captured at the Sherars Falls Trap during operation from June 21, 2004 to October 29, 2004 were biosampled, tagged with a Floy tag and released to continue their journey. Subsequent captures of both tagged and untagged individuals were made at both RBH and WSNFH and were used to calculate the estimated number of each component of the run passing Sherars Falls. The estimated number of 4,354 RBH origin summer steelhead passing Sherars Falls decreased from the 03-04 run year and was lower than the five year average of 6,105 (Table 32). The estimated number of 4,972 stray hatchery origin summer steelhead was a continued decrease

from the previous nine years (Table 32). The estimated number of 3,161 wild summer steelhead was well below the management goal of 6,575 wild steelhead above Sherars Falls (Table 32). Summer steelhead spawning ground surveys were conducted on Bakeoven and Buckhollow creeks in March and April of 2005. Flows were unusually low throughout much of the spawning period, therefore, most of the spawning activity was located in the lower reaches of these streams. In Bakeoven Creek, we counted 58 redds which was the lowest count in several years (Table 33). We counted a total of 114 redds in Buckhollow Creek which was also lower than most previous years (Table 34). Summer steelhead spawning ground counts were not conducted on the Trout Creek system during March, April and May of 2005 due to low flow conditions early that was followed by extremely high flows (Table 35).
Deschutes River 2005-06 Run Year: The 2005-06 summer steelhead run year started at the Pelton Trap on August 2, 2005 but final results will not be available until May 31, 2006 when the run year accounting is complete. Wild and hatchery origin summer steelhead were trapped and tagged at the Sherars Falls Trap from to facilitate later Peterson mark-recapture population estimates. All captured summer steelhead were biosampled, tagged with a Floy tag and released to the river. The mark-recapture population estimates for the 2005-06 run year will not be available until June 1, 2006 when the run year is complete and all captures of previously tagged fish are made at the Pelton Trap, WSNFH, and other upstream collection sites. Catch rate, as measured in fish per hour, of wild and hatchery summer steelhead at the Sherars Trap provides an early suggestion of run strength, but does not always correlate well with the final Peterson mark-recapture population estimates for the run year. However, direction of trend between trap catch and population estimate are usually correlated. Raw catch of wild summer steelhead during the 2005 trapping season was the lowest since 1997 and catch rates remained relatively low (Tables 36 and 37). The low catch and catch rate for hatchery origin summer steelhead followed a similar pattern as the wild steelhead (Tables 38 and 39). A list of hatchery origin steelhead fin marks observed at the Sherars Falls Trap for the 2005 trapping season shows that stray hatchery origin steelhead, particularly adipose only marked fish, continue to make up a large percentage of all hatchery fish captured there (Table 40). In 2005, based upon fin marks 46% of the hatchery steelhead captured at the trap were out of basin hatchery strays, which was the lowest proportion since 1992 (Table 41). Statistical harvest census of steelhead anglers was conducted in 2005 at the Heritage Landing (mouth west bank), and Macks Canyon Road site (river mile 0 and 42, respectively) from July 1 to October 31. The traditional statistically expandable collection procedure of stratifying the period into two-week blocks and further stratifying those periods into weekday and weekend

classifications was followed. Sample rate was targeted to not exceed an expansion rate of 3.0 for any stratification. We estimated a total of 1,967 wild summer steelhead were released and 1,001 hatchery summer steelhead harvested at Heritage Landing (mouth west bank) (Table 42). Expanded effort and catch data suggests lower effort and total catch of both wild and hatchery origin summer steelhead than most years on record. Angler effort and catch of both wild and hatchery origin summer steelhead at the Macks Canyon Road site was also relatively lower than the past few years. Both effort and catch were generally higher than the past two years. We estimated a total of 478 hatchery steelhead harvested in 2005 and 1,082 wild steelhead released (Table 43). The expanded catch and effort data are more valuable for comparison purposes when converted to catch rate, in this case, fish per 100 angler hours. Both wild and hatchery origin steelhead were caught at comparable rates at Heritage Landing and Macks Canyon to the past several years with an average of 4.9 wild and 2.4 hatchery steelhead per 100 angler hours, respectively (Table 44). The reach below Sherars Falls was open for both summer steelhead and fall Chinook during 2005 and the standard statistical harvest sampling of sport anglers and tribal fishers was conducted. Effort and steelhead catch by sport anglers was greater than 2003 and 2004 while angler success was also slightly higher (Table 45). Tribal hook and line and dip net fishers at Sherars Falls, expended considerably more effort but kept fewer wild and hatchery steelhead than in recent years (Table 46).
Columbia River Anadromous: Anglers fishing for anadromous species in the Columbia River are sampled when they return to the Heritage Landing boat ramp. Angler effort continued to decline, and was the lowest on record but success for both fall Chinook and steelhead was good (Table 47). Angler effort off the mouth of the Deschutes has been declining since 2001.
Hood River 2004-05 Run Year: The Powerdale Trap, was operated throughout the entire report period, and represents total run size to the trap because all fish are sampled. All summer steelhead captured at the Powerdale Trap were scale sampled, examined for marks, measured to the nearest 0.5 cm fork length, and tagged with an individually numbered Floy tag. Following biosampling, fish are released above the dam, recycled to the mouth of the river, or collected for broodstock. All wild fish captured were released above the dam, with the exception of fish that were collected for broodstock. Hood River stock hatchery fish captured were released above dam in a ratio equal to that of wild fish, and hatchery fish in excess of the number allowed over the dam were recycled to the mouth of the Hood River. Stock discrimination between winter and summer steelhead was made using a combination of phenotypic characteristics such as external coloration, degree of scale tightness and scale

erosion, state of sexual maturity relative to the time of year, external parasite load, and general appearance. Total run year 2004-05 summer steelhead escapement to Powerdale dam by origin and stock were: 205 wild origin, 987 Hood River stock, 1,698 Skamania stock, and 26 stray hatchery steelhead. Numbers of wild summer steelhead continued to decline substantially from the previous years return (Table 48). Origin and age were determined by scale analysis and fin mark. Final run year data summaries are calculated from scale analysis data for origin and age and may not be comparable to results reported earlier. Wild summer steelhead adults returning during the 2004-05 run year left the Hood River primarily as freshwater age 2 and 3 smolts and returned principally as 2-salt adults although both 1-salt and 3-salt adults are well represented in returns (Table 49). Subbasin hatchery adults returning during the 2004-05 run year were nearly all from smolts that migrated in the year they were released (freshwater age 1) (Table 49). Relatively high proportions of repeat spawners continued for wild fish. Scale verified wild summer steelhead were collected for broodstock at the Powerdale Trap during the 2004-05 run year (2005 brood year) and delivered to the Parkdale Fish Facility for holding and spawning. Broodstock was collected throughout the entire temporal distribution of the run, using similar methodology as that has been used in past years. All fish were live spawned and released back to the Hood River following spawning. A total of 30 females and 10 males were collected as broodstock, of which 13 females and 7 males were utilized for spawning, resulting in a collection of 48,214 green eggs (Tables 50 and 51). A total of 34,096 fry were hatched from the egg take at the Oak Springs Fish Hatchery. WINTER STEELHEAD
Hood River 2004-05 Run Year: The Powerdale Trap, was operated throughout the report period, and represents total escapement to the trap. All winter steelhead handled at the Powerdale Trap, follow the same methodologies described for Hood River summer steelhead. A total of 333 wild, 452 Hood River stock hatchery origin, and 17 stray origin winter steelhead escaped to the Powerdale Trap for the 2004-05 run year. The 2004-05 run of wild fish continued a recent decline from the previous several years (Table 52). Age analysis suggested that most wild fish were four years of age with two years spent in saltwater, while three and five year old fish were also well represented in the age distribution (Table 53). Using similar methodologies to those described for summer steelhead broodstock, scale verified wild winter steelhead were collected from the 2004-05 run year (2005 brood year) and delivered to the Parkdale Fish Facility for holding and spawning. A total of 12 females and 13 males were utilized for spawning, which resulted in a collection of 43,910 green eggs (Table 54). A total of 34,875 winter steelhead fry were hatched from the egg take. There were 35 females and 37 males that were originally collected for broodstock (Table 55).

Fifteen Mile Creek: Fifteenmile Creek steelhead spawning surveys were modified from the previous format in 2003. The primary purpose of modification was to improve the accuracy and precision of the surveys, in order to better monitor the actual abundance of spawners throughout the entire subbasin. Additionally, surveys were designed to monitor redd longevity, and gather additional run timing information. Primary changes to the traditional survey methodology included abandoning the index reaches, and adopting a comprehensive survey approach that represented the entire known steelhead spawning distribution of the subbasin. Representative index reaches of the former survey design were maintained at two miles in length in both Fifteenmile and Eightmile Creek, while a one-mile index reach was maintained in Fivemile Creek. Survey design for 2005 consisted of stratifying the entire known steelhead spawning distribution of each stream in the Fifteenmile subbasin into various reaches. This stratification resulted in identifying 11 reaches in Fifteenmile Creek, 3 in Ramsey Creek, 7 in Eightmile Creek, and 4 in Fivemile Creek. A one-mile reach was selected randomly from within each of the five-mile reaches for survey. Next year, a different one-mile reach will be selected at random (drawn without replacement) for survey. Redds were individually marked with painted rocks, and flagged, so they would not be counted on subsequent surveys. Three independent redd counts were conducted in each random one mile reach which resulted in counting a total of 51 redds (Table 56). Not all of the one-mile random reaches were counted once during each of the count periods in 2005. RESIDENT FISH Deschutes River: Expanded effort and harvest of rainbow trout by trout anglers in the Deschutes was collected in conjunction with summer steelhead harvest census at both the Heritage Landing (Table 57) and Macks Canyon Road (Table 58) sites. Combined angler effort (number of anglers) from river mile 0 to 42 was about the same as 2004 with a slightly higher catch rate (Table 59). As noted in past years, the vast majority of trout landed in the Deschutes fisheries sampled by this work continue to be released. Hood River: Bull trout were captured at the Powerdale Trap during the early 1960’s and 1970’s (Table 61). Bull trout have been captured each year since 1992 with the current trapping efforts at the Powerdale Fish Trap on Hood River. We captured a total of six bull trout ranging in size from 50 to 61 cm in 2005 (Table 62). Three of the six bull trout captured were recaptures from fish tagged in 2004 at Powerdale. One bull trout captured was reported to have hook scars which appears to be a perennial problem with the bull trout we capture at Powerdale Trap. All captured bull trout were biosampled and released upstream.

Table 1. Mid-Columbia District Anadromous Fish Liberations. Reporting Period: ANNUAL, 2005
Lake or Stream Species Number Released No/lb Date Released
Mark / Miscellaneous
Deschutes River StS 23,181 3.7 4/4/2005 100% ADLM 27,540 3.6 4/4/2005 100% ADLM 23,920 3.2 4/4/2005 100% ADLM 27,380 3.7 4/4/2005 100% ADLM 27,075 3.9 4/5/2005 100% ADLM 27,843 3.7 4/5/2005 100% ADLM Total StS 156,939 Deschutes River ChS 80,467 8.3 4/4/2005 96.6% AD 78,945 9.6 4/5/2005 96.7% AD 79,404 8.9 4/11/2005 92.9% AD 74,112 9.7 4/11/2005 97.7% AD Total ChS 312,928 Hood River StS 11,092 5.9 3/2/2005 99.1% AD 11,847 5.9 3/1/2005 99.1% AD 28,330 5.7 3/2/2005 99.1% AD 15,341 5.8 3/24/2005 100% ADRM 16,992 5.2 4/8/2005 100% ADRM 11,747 4.8 4/26/2005 100% ADRM 4,911 4.8 5/5/2005 100% ADRM Total StS 100,260
Table continues.

Table 1 (continued). Mid-Columbia District Anadromous Fish Liberations
Lake or Stream Species Number Released No/lb Date Released
Mark / Miscellaneous
Hood River ChS 20,060 13.6 3/17/2005 97.1% ADRM 20,045 13.6 3/27/2005 100% ADRM 20,130 12.2 4/7/2005 100% ADRM 18,778 12.2 4/15/2005 100% ADRM 20,115 12.2 4/15/2005 100% ADRM 37 13.7 4/22/2005 100% ADLV 29,650 13.7 4/22/2005 100% ADLV 65 10.6 5/3/2005 100% ADRM 91 14.0 5/3/2005 100% ADRM Total ChS 128,971 Hood River StW 13,000 7.7 3/29/2005 98% ADRV 13,000 7.7 3/29/2005 98% ADRV 1,971 8.9 3/29/2005 98% ADRV 13,000 7.3 3/30/2005 98% ADRV 10,000 7.6 3/30/2005 100% ADRV 10,000 7.7 3/31/2005 100% ADRV Total StW 60,971

Table 2. Mid-Columbia District Standing Water Body Fish Liberations. Reporting Period: ANNUAL, 2005
Lake or Stream Species Number Released Date Released
Mark / Miscellaneous
Baker Pond RB Legal 989 3/11/2005 Badger Lake RB Legal 886 5/27/2005 840 6/28/2005 750 7/12/2005 750 7/26/2005 845 8/3/2005 682 8/9/2005 483 8/24/2005 RB Legal Total 5,236 Bikini Pond RB Legal 700 5/18/2005 102 5/26/2005 RB Legal Total 802 RB Broodstock 5 5/18/2005 Clear Lake RB Legal 3,200 4/26/2005 5,900 5/19/2005 5,913 5/31/2005 RB Legal Total 15,013 RB Broodstock 50 4/26/2005 25 5/19/2005 75 Frog Lake RB Legal 2,760 5/5/2005 2,760 6/1/2005 RB Legal Total 5,520 Horseshoe Lake RB Legal 1,760 6/27/2005
Table continues.

Table 2 (continued). Mid-Columbia District Standing Water Body Fish Liberations.
Lake or Stream Species Number Released Date Released
Mark / Miscellaneous
Kingsley Reservoir RB Legal 4,600 5/3/2005 5,500 6/3/2005 RB Legal Total 10,100 Laurance Reservoir RB Legal 3,500 5/6/2005 3,507 6/2/2005 RB Legal Total 7,007 AD Lost Lake RB Legal 4,900 5/4/2005 4,700 6/7/2005 4,690 6/28/2005 RB Legal Total 14,290 Olallie Lake RB Legal 3,100 6/10/2005 3,100 6/14/2005 3,080 6/29/2005 3,080 7/6/2005 2,186 8/10/2005 RB Legal Total 14,546 RB Broodstock 75 6/10/2005 StS Fingerling 26,898 8/10/2005 Pine Hollow Reservoir RB Legal 3,500 3/11/2005 3,550 4/5/2005 3,500 4/12/2005 3,220 5/3/2005 RB Legal Total 13,770 RB Fingerling 9,046 4/13/2005 8,008 4/22/2005 10,988 7/7/2005 28,042
Table continues.

Table 2 (continued). Mid-Columbia District Standing Water Body Fish Liberations.
Lake or Stream Species Number Released Date Released
Mark / Miscellaneous
RB Broodstock 50 4/12/2005 Rock Creek Reservoir RB Legal 4,170 3/10/2005 4,000 4/12/2005 3,800 5/2/2005 3,680 5/10/2005 RB Legal Total 15,650 RB Fingerling 6,000 4/22/2005 14,000 4/22/2005 20,000 RB Broodstock 50 4/12/2005 Smock Prairie Reservoir RB Legal 790 5/25/2005 210 5/25/2005 RB Legal Total 1,000 RB Broodstock 10 5/25/2005 Taylor Lake RB Legal 250 3/1/2005 1,666 3/10/2005 1,666 4/13/2005 1,530 5/10/2005 1,722 10/14/2005 RB Legal Total 6,834 RB Fingerling 25,000 4/13/2005 Total Rb Legal 111,528
Total Broodstock 265
Total Rb Fingerling 73,042
Total StS Fingerling 26,898

Lake or Stream Species Number Released No/lb
Date Released
Mark / Miscellaneous
Breitenbush BT 3000 Gibson BT 750 Horseshoe BT 1500 View BT 1000 Upper BT 500 Timber BT 1500 Mangrif BT 275 Nup-te-pa BT 275 Russ BT 2000 Jude BT 0 Brook BT 275 Lower Twin BT 750 Upper Twin BT 1750 Catalpa BT 500 Little Boulder BT 500 Big Boulder BT 250 Jean BT 500 Warren BT 500 Bear BT 500 North BT 500 Rainey BT 500 Black BT 500 Scout BT 500 Wahtum BT 2000 Dublin BT 500 Total 20,825

Table 3. Pelton Trap adult spring Chinook capture, by month, by run year. Cumulative run year total (shown in parentheses). MONTH
Run Year Apr May Jun Jul Aug Sept Total
05 0 500 770 184 42 2 1,498 04 0 61 169 90 39 0 359 03 44 2,517 646 180 82 34 3,503 02 0 1,322 2,217 666 166 20 4,391 01 0 1,153 575 375 240 16 2,359 00 0 215 207 58 33 13 526
5-Year Average 9 1054 763 274 112 17 2,228
Cumulative disposition, current run year, adult and jack: Tribes or food bank = 1,119 Brood = 572 River = 29 DOA = 2

Table 4. Pelton Trap jack spring Chinook capture, by month, by run year. MONTH
Run Year Apr May Jun Jul Aug Sept Total
05 0 3 97 109 9 0 218 04 0 1 111 112 10 0 234 03 0 1 17 6 1 3 28 02 0 19 214 51 3 0 287 01 0 63 728 513 92 6 1,402 00 0 21 133 37 27 1 219
5-Year Average 0 21 241 144 27 2 434
Cumulative disposition, current run year, adult and jack: Tribes or food bank = 1,119 Brood = 572 River = 29 DOA = 2

Table 5. Hatchery and wild spring Chinook capture at the Pelton Trap (Round Butte Hatchery) and Warm Springs National Fish Hatchery Trap, by year.
Pelton Trap Warm Springs National Wild a/ Hatchery b/ Wild c/ Hatchery c/
Year Adult Jack Adult Jack Adult Jack Adult Jack Total 1977 17 3 22 5 1,505 101 0 0 1,6531978 9 1 11 3 2,584 76 0 0 2,6841979 23 1 22 4 1,322 73 0 0 1,4451980 12 6 42 42 968 34 0 0 1,1041981 41 5 334 73 1,525 50 0 85 2,1131982 23 2 347 91 1,408 46 895 21 2,8331983 9 0 567 47 1,523 18 355 16 2,5351984 15 6 257 326 1,192 98 789 203 2,8861985 70 37 1,318 224 1,099 56 1,090 19 3,9131986 40 4 1,509 311 1,656 55 161 188 3,9241987 137 20 1,077 271 1,697 86 512 230 4,0301988 50 5 1,101 371 1,578 69 483 341 3,9981989 43 7 1,564 677 1,344 65 2,407 131 6,2381990 40 5 2,043 168 1,821 46 1,252 59 5,4341991 30 3 1,553 342 777 40 579 65 3,3891992 39 3 1,887 137 1,050 15 785 6 3,9221993 53 0 1,343 55 532 6 307 2 2,2981994 49 2 542 61 425 10 44 8 1,1421995 28 1 678 200 162 75 94 146 1,3841996 45 0 684 35 1,261 26 624 83 2,7581997 89 1 784 32 861 9 1,072 66 2,9141998 16 1 290 52 248 23 536 118 1,2831999 21 0 926 83 366 127 1,881 889 4,2932000 57 19 469 200 2,623 82 6,567 207 10,1952001 87 7 2,272 1,395 2,155 97 3,659 807 10,4792002 50 0 4,300 287 1,440 52 5,020 321 11,4702003 37 3 3,432 24 1,400 119 5,469 551 11,0352004 19 0 359 234 2,351 78 3,263 125 6,4022005 21 2 1,465 215 677 30 1,035 128 3,573a/ Adult/jack determination by length. Adults are greater than 60 cm fork length. b/ Adult/jack determination by fin mark and length. c/ Adult/jack determination by scale analysis/CWT returns

Table 6. Wild spring Chinook redd counts in index areas Warm Springs River basin, by year. Adult and jack numbers determined by length frequency and scale analysis. This age breakdown may be different than the hatchery record of jack and adult numbers based solely on length.
Run to WSNFH Passed Upstream
Year Adults Jacks Adults Jacks Total Redds
Fish/ Redd
Adults/ Redd
1982 1408 46 1587 a/ 46 421 3.9 3.8 1983 1523 18 1251 34 433 3.0 2.9 1984 1192 98 1322 a/ 164 415 3.6 3.2 1985 1099 56 1264 a/ 56 377 3.5 3.4 1986 1656 55 1211 55 417 3.0 2.9 1987 1697 86 1550 86 478 3.4 3.2 1988 1578 69 1259 69 396 3.4 3.2 1989 1344 65 1254 65 407 3.2 3.1 1990 1821 46 1721 46 535 3.3 3.2 1991 777 40 777 40 242 3.4 3.2 1992 1050 15 959 14 161 6.0 6.0 1993 532 6 528 6 142 3.8 3.7 1994 425 10 425 10 157 2.8 2.7 1995 162 75 160 75 62 3.8 2.6 1996 1261 26 1222 23 303 4.1 4.0 1997 861 9 859 9 352 2.5 2.4 1998 248 23 262 b/ 29 c/ 122 d/ 2.4 2.1 1999 366 127 365 e/ 126 f/ 121 4.1 3.0 2000 g/ 2,623 82 2,551 79 658 4.0 3.9 2001 2,155 97 2,154 97 751 3.0 2.9 2002 1,440 52 1,440 52 221 6.8 6.5 2003 1,400 119 1,359 117 262 5.6 5.2 2004 2,351 78 2,320 65 428 5.6 5.4 2005 677 30 704 30 52 14.1 13.5 a/ Includes some hatchery origin spring Chinook passed upstream. b/ Includes 15 hatchery origin adults c/ Includes 6 hatchery origin jacks d/ Includes 2 redds below WSNFH e/ Includes 26 hatchery origin adults upstream f/ Includes 6 hatchery origin jacks upstream g/ Does not include 285 hatchery adults and jacks upstream

Table 7. Expanded statistical sport harvest estimates of spring Chinook (April 16 – June 15) at Sherars Falls, Deschutes River, by year. Data does not include released fish. In years where zeroes appear no sport fishery was allowed.
Wild Hatchery
Year Anglers/Fishers Hours Adult Jack Adult Jack
Fish Per
Hour 1980 2,481 13,845 298 39 8 52 0.03 1981 0 0 0 0 0 0 1982 4,093 20,894 445 57 429 106 0.05 1983 3,148 16,487 303 52 242 51 0.04 1984 0 0 0 0 0 0 1985 4,193 22,321 652 53 720 208 0.07 1986 1,184 7,705 113 9 111 73 0.04 1987 3,790 22,916 466 35 549 210 0.05 1988 4,087 19,603 566 63 975 336 0.10 1989 3,768 16,456 497 22 1,283 313 0.13 1990 6,046 30,861 725 50 1,169 113 0.07 1991 5,926 26,453 441 44 1,206 387 0.08 1992 5,458 24,429 548 16 1,472 80 0.09 1993 5,206 22,378 222 29 565 55 0.04 1994 0 0 0 0 0 0 1995 0 0 0 0 0 0 1996 2,495 14,128 2 0 304 39 0.02 1997 0 0 0 0 0 0 1998 0 0 0 0 0 0 1999 0 0 0 0 0 0 2000 6160 36,558 8 6 2,454 348 0.08 2001 4998 24,493 0 5 1,550 941 0.10 2002 6254 20,590 3 0 2,101 207 0.11 2003 3,912 20,857 0 0 1,339 72 0.07 2004 4,540 19,021 0 0 1,005 197 0.06
2005 1,589 7,879 0 0 417 0 0.05

Table 8. Expanded statistical Tribal harvest estimates of spring Chinook (April 16 – June 15) at Sherars Falls, Deschutes River, by year. The estimates include dip net, hook and line, and snagging (1987 snagging only). Does not include released fish. In years where zeroes appear no Tribal fishery was allowed.
Wild Hatchery
Year Anglers/Fishers Hours Adult Jack Adult Jack
Fish Per
Hour 1980 393 958 113 0 0 0 0.12 1981 0 0 0 0 0 0 1982 332 744 197 4 126 12 0.46 1983 585 1,599 188 2 106 19 0.20 1984 0 0 0 0 0 0 1985 320 1,862 126 5 125 29 0.15 1986 145 1,327 22 0 27 8 0.04 1987 441 2,524 397 11 321 52 0.31 1988 402 2,549 228 13 280 65 0.23 1989 309 1,579 240 25 457 32 0.48 1990 497 2,407 291 6 406 19 0.30 1991 399 2,092 99 12 216 69 0.19 1992 393 2,321 140 2 374 6 0.22 1993 211 1,023 122 4 191 4 0.31 1994 0 0 0 0 0 0 1995 95 442 3 1 35 0 0.09 1996 296 1,431 57 0 130 6 0.13 1997 0 0 0 0 0 0 1998 203 1,067 45 0 53 0 0.09 1999 30 252 0 0 8 11 0.08 2000 463 2,428 299 27 491 72 0.37 2001 323 1,498 169 1 352 31 0.37 2002 254 1,228 179 5 703 12 0.73 2003 342 1,707 7 0 316 4 0.19 2004 389 1573 202 8 156 10 0.24 2005 400 1,830 133 0 504 73 0.39

Table 9. Powerdale Dam adult fish trap unmarked and marked spring Chinook catch. Data may not coincide with final scale verified data summary. Cumulative counts (shown in parentheses). Mini-jacks not included in totals.
Month Run Run
Year March April May June July August Sept Oct Total 2005 0 11 580 167 29 6 3 0 796
2004 0 5 124 221 54 27 7 0 438
2003 0 1 279 117 17 3 5 0 422
2002 0 0 348 657 111 22 5 0 1143
2001 0 24 681 270 83 36 18 0 1112
2000 0 1 76 91 8 13 11 0 200
1999 0 0 20 46 23 18 14 0 121
1998 0 0 14 39 17 4 24 3 101
1997 0 0 49 227 59 31 0 0 366
1996 0 0 9 70 20 18 2 0 119
1995 0 0 8 50 24 4 6 0 92
1994 0 6 206 37 39 7 15 0 310
1993 0 1 240 153 87 22 7 0 510
1992 0 12 244 157 27 7 5 1 453
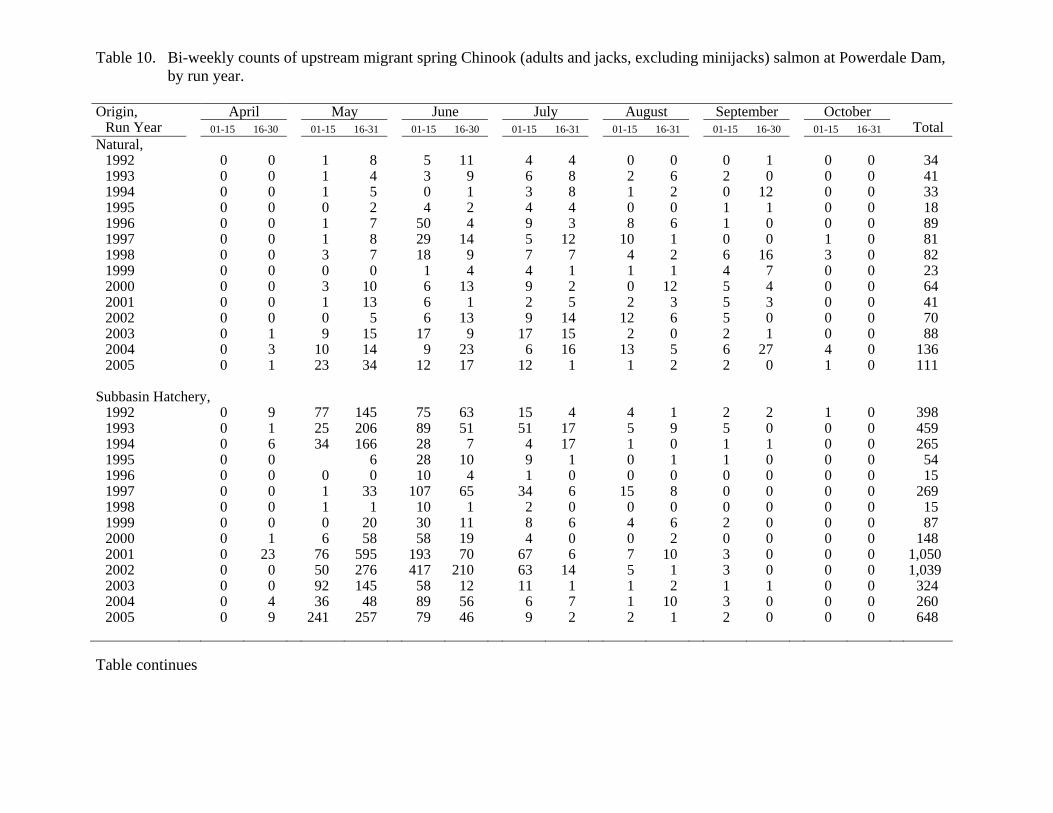
Table 10. Bi-weekly counts of upstream migrant spring Chinook (adults and jacks, excluding minijacks) salmon at Powerdale Dam, by run year.
April May June July August September October Origin,
Run Year 01-15 16-30 01-15 16-31 01-15 16-30 01-15 16-31 01-15 16-31 01-15 16-30 01-15 16-31 Total Natural,
1992 0 0 1 8 5 11 4 4 0 0 0 1 0 0 34 1993 0 0 1 4 3 9 6 8 2 6 2 0 0 0 41 1994 0 0 1 5 0 1 3 8 1 2 0 12 0 0 33 1995 0 0 0 2 4 2 4 4 0 0 1 1 0 0 18 1996 0 0 1 7 50 4 9 3 8 6 1 0 0 0 89 1997 0 0 1 8 29 14 5 12 10 1 0 0 1 0 81 1998 0 0 3 7 18 9 7 7 4 2 6 16 3 0 82 1999 0 0 0 0 1 4 4 1 1 1 4 7 0 0 23 2000 0 0 3 10 6 13 9 2 0 12 5 4 0 0 64 2001 0 0 1 13 6 1 2 5 2 3 5 3 0 0 41 2002 0 0 0 5 6 13 9 14 12 6 5 0 0 0 70 2003 0 1 9 15 17 9 17 15 2 0 2 1 0 0 88 2004 0 3 10 14 9 23 6 16 13 5 6 27 4 0 136 2005 0 1 23 34 12 17 12 1 1 2 2 0 1 0 111
Subbasin Hatchery, 1992 0 9 77 145 75 63 15 4 4 1 2 2 1 0 398 1993 0 1 25 206 89 51 51 17 5 9 5 0 0 0 459 1994 0 6 34 166 28 7 4 17 1 0 1 1 0 0 265 1995 0 0 6 28 10 9 1 0 1 1 0 0 0 54 1996 0 0 0 0 10 4 1 0 0 0 0 0 0 0 15 1997 0 0 1 33 107 65 34 6 15 8 0 0 0 0 269 1998 0 0 1 1 10 1 2 0 0 0 0 0 0 0 15 1999 0 0 0 20 30 11 8 6 4 6 2 0 0 0 87 2000 0 1 6 58 58 19 4 0 0 2 0 0 0 0 148 2001 0 23 76 595 193 70 67 6 7 10 3 0 0 0 1,050 2002 0 0 50 276 417 210 63 14 5 1 3 0 0 0 1,039 2003 0 0 92 145 58 12 11 1 1 2 1 1 0 0 324 2004 0 4 36 48 89 56 6 7 1 10 3 0 0 0 260 2005 0 9 241 257 79 46 9 2 2 1 2 0 0 0 648
Table continues

Table 10 (cont). Bi-monthly counts of upstream migrant spring Chinook salmon (adults and jacks, excluding minijacks) at Powerdale Dam, by run year.
April May June July August September October Origin,
Run Year 01-15 16-30 01-15 16-31 01-15 16-30 01-15 16-31 01-15 16-31 01-15 16-30 01-15 16-31 Total Stray Hatchery,
1992 0 0 0 0 0 0 0 0 1 0 0 0 0 0 1 1993 0 0 0 0 1 0 1 0 0 0 0 0 0 0 2 1994 0 0 0 0 0 0 0 0 0 0 0 0 0 0 0 1995 0 0 0 0 0 0 0 0 0 1 1 1 0 0 3 1996 0 0 0 0 1 0 0 0 0 0 0 0 0 0 1 1997 0 0 0 0 0 0 0 0 0 0 0 0 0 0 0 1998 0 0 0 0 1 0 0 1 0 0 0 0 0 0 2 1999 0 0 0 1 0 0 0 0 0 0 0 0 0 0 1 2000 0 0 0 1 0 2 0 0 0 0 0 0 0 0 3 2001 0 1 2 1 1 0 1 2 3 1 0 0 0 0 12 2002 0 0 0 0 8 0 2 2 1 0 0 0 0 0 13 2003 0 0 5 9 5 4 5 2 0 0 0 0 0 0 30 2004 0 0 2 3 5 0 0 0 0 0 0 0 0 0 10 2005 0 1 8 8 1 1 0 0 1 0 0 0 0 0 20
Unknown,
1992 0 3 5 8 3 1 0 0 1 0 0 0 0 0 21 1993 0 0 0 5 0 0 2 1 0 0 0 0 0 0 8 1994 0 0 1 1 0 1 0 0 0 0 0 1 0 0 4 1995 0 0 0 0 0 1 1 1 0 3 0 2 0 0 13 1996 0 0 0 1 8 5 5 1 1 3 1 0 0 0 25 1997 0 0 0 5 9 3 1 2 3 0 0 0 0 0 23 1998 0 0 0 1 0 1 0 2 0 0 0 2 1 0 7 1999 0 0 0 0 0 0 0 2 0 4 1 0 0 0 7 2000 0 0 0 0 0 0 0 0 0 0 1 1 0 0 2 2001 0 0 0 5 0 1 1 2 3 9 6 1 0 0 28 2002 0 0 0 3 3 0 3 3 1 3 0 0 0 0 16 2003 0 0 4 6 8 3 4 3 1 1 0 1 0 0 31 2004 0 0 5 9 17 22 12 3 3 6 2 3 0 1 83 2005 0 0 6 3 2 10 0 0 0 0 0 0 0 0 21

Table 11. Spring Chinook salmon escapements to the Powerdale Dam trap by origin, run year, and age category. Fish of unknown origin were allocated to origin categories based on scale analysis and the ratio of fish of known origin. Total escapement shown excludes minijacks (age 2.2).
Freshwater.Total Age Origin,
Stock, Run Year
Total Escapement 1.2 1.3 1.4 1.5 2.2 2.3 2.4 2.5 2.6 3.5
Natural, Hood River, a/ 1992 35 0 1 22 1 0 0 8 3 0 01993 42 0 1 15 10 1 0 8 8 0 01994 34 1 2 14 5 0 0 5 6 1 01995 20 0 4 1 4 0 0 2 9 0 01996 97 1 4 7 0 0 0 83 1 0 11997 73 0 0 6 1 13 1 24 41 0 01998 81 0 11 14 1 5 1 16 37 1 01999 24 0 2 5 3 1 3 9 2 0 02000 66 0 6 3 0 3 0 54 3 0 02001 45 1 6 3 0 1 2 21 12 0 02002 63 1 1 8 3 0 1 41 18 0 02003 97 0 2 4 0 2 11 31 49 0 02004 151 0 1 36 6 7 13 74 11 3 02005 110 1 4 4 0 0 6 53 47 2 0
Subbasin hatchery, Carson 1992 417 – – – – 0 3 396 18 0 –1993 461 – – – – – 15 213 233 0 –1994 261 – – – – – – 244 17 0 –1995 36 – – – – – – – 35 1 –
Deschutes, d/ 1993 0 – – – – 4 – – – 0 –1994 5 – – – – b/ 5 – – 0 –1995 31 – – – – 4 b/ 27 – 0 –1996 17 – – – – 0 15 b/ 2 0 –1997 281 – – – – 11 1 280 – 0 –1998 17 – – – – 14 1 12 3 0 –1999 93 – – – – 182 5 88 0 0 –2000 148 – – – – 916 128 18 2 0 –2001 1,056 – – – – 32 496 560 0 0 –2002 1,054 – – – – 2 24 1,009 19 0 --2003 346 – – – – 14 15 197 133 1 --2004 502 - - - - 168 182 138 14 0 --2005 587 - - - 71 76 578 8 1 --
Table continues

Table 11 (cont.). Spring Chinook salmon escapements to the Powerdale Dam trap by origin, run year, and age category, Fish of unknown origin were allocated to origin categories based on scale analysis and the ratio of fish of known origin. Total escapement shown excludes minijacks (age 2.2).
Freshwater.Total Age Origin,
Stock, Run Year
Total Escapement 1.2 1.3 1.4 1.5 2.2 2.3 2.4 2.5 2.6 3.5
Stray hatchery,
Unknown,
1992 1 – – 1 0 0 0 0 – – – 1993 2 – – 2 0 0 0 – – – – 1994 0 – – 0 0 10 0 – – – – 1995 5 – – 0 0 0 3 1 1 – – 1996 16 – – 2 1 0 0 13 0 – – 1997 6 – – 0 0 0 1 0 6 – – 1998 3 – 1 0 0 0 1 1 0 – – 1999 1 – – 0 0 6 0 0 1 – – 2000 3 – – 0 0 4 1 2 – – 2001 30 – – 0 0 52 5 21 4 – – 2002 23 – – 0 0 10 2 6 5 – – 2003 30 – – 0 0 0 5 21 4 - – 2004 28 - 1 0 0 17 5 5 0 0 - 2005 17 - 0 0 0 4 3 14 3 0 -
a/ Developed from Deschutes and Carson stock hatchery production releases. b/ Hatchery returns in this age category would be progeny of 1992 brood. No hatchery fish were released into the Hood River
subbasin from this brood. c/ Data analysis incomplete. d/ Hood River returns were used, at least in part, as broodstock some years.

Table 12. Estimated harvest of natural and Hood River hatchery origin (as determined by CWT analysis) adult and jack spring Chinook from April 1 to September 15, in the Hood River sport fishery, by year. Estimates from Hood River Production Project statistical harvest sample. Does not include released fish. In years where no spring Chinook fishery occurred zeroes are in place for anglers and angler hours.
Naturally Produced Hatchery Origin Year Hours/Fish Adult Jack Adults Jacks 1996 554 45 7 5 7 1997 176 40 0 25 3 1998 503 8 3 8 1999 0 0 0 0 0 2000 430 8 0 0 20 2001 198 0 4 23 31 2002 48 0 0 279 10 2003 0 0 0 0 0 2004 0 0 0 0 0 2005 115 0 0 46 8

Table 13. Pelton Trap adult wild fall Chinook capture, by month, by run year. Month
Run Year June July August September October November December January
Run Total
2005 0 6 3 1 47 133 55 13 258
2004 0 2 2 3 71 118 22 2 220
2003 0 14 7 2 40 45 46 16 170
2002 1 21 2 18 60 88 39 2 231
2001 -- 12 7 8 31 69 22 0 149
2000 -- 1 3 2 30 33 11 0 80
1999 -- 1 2 4 25 30 18 0 80
5-Year Average -- 10 4 7 37 53 27 4
142

Table 14. Pelton Trap wild jack fall Chinook capture, by month, by run year. Cumulative run year total (shown in parentheses).
Month Run Year June July August September October November December January
Run Total
2005 0 0 0 0 38 141 9 0 188
2004 0 0 0 1 26 54 10 1 92
2003 0 0 0 0 6 23 36 1 66
2002 1 21 2 18 60 88 39 2 231
2001 -- 0 0 6 37 139 36 0 218
2000 -- 0 0 1 45 102 11 0 159
1999 -- 2 0 1 17 47 24 0 91
5-Year Average
-- 5 0 5 33 80 29 1 153

Table 15. Deschutes River expanded sport harvest data on wild fall Chinook at Sherars Falls (June 16– October 31) by year. Does not include released fish or hatchery fish. In years where zeroes appear no sport fishery was allowed.
Anglers/
Year Fishers Hours Adult Jack Adult Per
Hour 1980 4,120 21,171 277 908 0.01 1981 4,869 22,837 355 684 0.02 1982 5,247 26,061 474 930 0.02 1983 3,906 19,411 264 290 0.01 1984 3,522 17,503 172 581 0.01 1985 4,423 20,262 145 638 0.01 1986 4,447 20,240 215 1,077 0.01 1987 4,607 20,528 408 186 0.02 1988 3,726 19,514 407 183 0.02 1989 4,152 17,737 292 82 0.02 1990 3,130 11,837 152 89 0.01 1991 890 3,833 66 41 0.02 1992 0 0 0 0 0.00 1993 0 0 0 0 0.00 1994 0 0 0 0 0.00 1995 0 0 0 0 0.00 1996 0 0 0 0 0.00 1997 0 0 0 0 0.00 1998 2,110 11,738 139 49 0.01 1999 1,592 11,139 127 56 0.01 2000 2,956 14,153 118 96 0.01 2001 0 0 0 0 0.00 2002 5,079 15,640 283 74 0.02 2003 2,439 10,943 175 57 0.02 2004 2,759 12,287 219 3 0.02 2005 2,010 8,638 285 117 0.03

Table 16. Deschutes River expanded Tribal harvest data on wild fall Chinook at Sherars Falls (June 16– October 31) by year. Does not include released fish, hatchery fish, snagged fish by tribal fishers, or tribal fishers leaving before sampling begins (0700 hours). Data is Tribal dip net and hook and line fishery combined.
Anglers/
Year Fishers Hours Adult Jack Adult ChF Per Hour
1981 605 5025 1,389 364 0.28 1982 516 4628 1,425 364 0.31 1983 953 5131 1,160 369 0.23 1984 714 6277 786 417 0.13 1985 710 6126 656 789 0.11 1986 523 5848 923 344 0.16 1987 724 4736 1,622 56 0.34 1988 744 5978 1,824 60 0.31 1989 973 6347 1,385 61 0.22 1990 548 3929 744 29 0.19 1991 174 931 88 7 0.09 1992 36 332 37 4 0.11 1993 64 246 11 0 0.04 1994 81 401 70 4 0.17 1995 114 425 33 16 0.08 1996 80 355 78 6 0.22 1997 238 1001 202 8 0.20 1998 303 1142 332 27 0.29
1999 275 1451 236 20 0.16
2000 303 1225 272 10 0.22
2001 261 1106 334 26 0.30
2002 345 1984 692 1 0.35 2003 411 1809 762 15 0.42 2004 478 1918 771 49 0.40 2005 271 1201 542 2 0.45

Table 17. Number of wild fall Chinook adults (> 54 cm) captured at the Sherars Falls Trap, by two week period, by year.
June July August September October Year 16-30 1-15 16-31 1-15 16-31 1-15 16-30 1-15 16-31 Total 1977 14 27 115 177 60 48 304 73 38 8561978 17 17 69 87 94 137 314 271 35 1,0411979 7 19 25 42 14 66 291 97 24 5891980 10 10 11 13 20 81 89 157 29 4201981 1 12 17 28 48 152 122 118 28 5261982 - 3 10 11 69 57 64 49 20 2831983 - - - 5 24 41 39 96 23 2281984 - - 1 3 14 4 9 7 2 401985 - - 10 13 23 23 20 28 0 1171986 - - 20 30 24 26 32 51 15 1981987 - - - 21 38 70 68 90 15 3021988 0 16 13 16 20 57 140 57 9 3281989 9 14 9 10 15 17 30 64 37 2051990 8 6 10 7 7 15 20 15 32 1201991 3 6 5 8 11 20 16 8 7 841992 8 2 5 4 11 15 61 32 22 1601993 1 8 8 5 7 8 18 56 12 1231994 - 0 0 7 2 6 27 20 22 821995 1 2 7 5 9 22 55 60 40 2011996 - - 14 15 22 75 50 196 16 3881997 - - 15 12 27 71 125 51 16 3171998 0 12 5 10 32 79 88 69 12 3071999 - - - 4 14 14 107 61 36 2362000 0 4 2 9 25 30 128 81 25 3042001 3 10 7 26 30 106 128 143 55 5082002 2 12 16 9 29 37 169 144 48 4592003 4 8 4 11 19 75 227 196 103 6472004 1 8 11 4 11 38 172 226 93 5642005 - 1 5 4 9 30 129 168 269 615

Table 18. Catch rate (fish/hour) of wild fall Chinook adults (>54 cm) at the Sherars Falls trap, by period, by year.
June July August September October Year 16-30 1-15 16-31 1-15 16-31 1-15 16-30 1-15 16-31 Average 1977 0.57 0.38 1.76 2.19 1.27 1.19 4.15 4.20 1.78 1.94 1978 0.30 0.34 0.82 0.69 0.66 0.75 2.65 2.49 0.58 1.28 1979 0.10 0.19 0.25 0.41 0.24 0.91 2.97 1.09 0.29 0.76 1980 0.12 0.16 0.10 0.15 0.27 0.96 0.87 1.74 0.36 0.54 1981 0.02 0.14 0.20 0.39 0.52 1.65 1.99 1.18 0.44 0.76 1982 - 0.09 0.24 0.21 0.81 0.78 0.93 0.59 0.30 0.56 1983 - - - 0.11 0.28 0.59 0.56 1.49 0.43 0.59 1984 - - 0.10 0.04 0.20 0.08 0.19 0.16 0.04 0.12 1985 - - 0.16 0.15 0.28 0.28 0.31 0.36 0.00 0.25 1986 - - 0.18 0.37 0.28 0.26 0.42 0.52 0.15 0.31 1987 - - - 0.38 0.56 0.97 0.89 1.38 0.33 0.79 1988 0.00 0.22 0.17 0.19 0.24 0.82 1.41 1.15 0.16 0.52 1989 0.12 0.22 0.11 0.15 0.17 0.20 0.36 0.93 0.42 0.29 1990 0.10 0.08 0.11 0.10 0.10 0.21 0.22 0.18 0.34 0.16 1991 0.05 0.08 0.06 0.12 0.15 0.27 0.17 0.10 0.08 0.12 1992 0.11 0.03 0.06 0.05 0.15 0.20 0.71 0.30 0.28 0.23 1993 0.01 0.11 0.11 0.07 0.07 0.11 0.21 0.84 0.20 0.18 1994 - 0.00 0.00 0.09 0.03 0.03 0.34 0.26 0.26 0.15 1995 0.02 0.05 0.08 0.06 0.10 0.31 0.60 0.81 0.51 0.30 1996 - - 0.16 0.20 0.29 0.84 0.87 2.20 0.23 0.72 1997 - - 0.17 0.18 0.38 0.85 1.53 0.70 0.26 0.60 1998 0.00 0.18 0.08 0.16 0.43 1.07 0.78 0.72 0.17 0.50 1999 - - - 0.09 0.17 0.17 0.91 1.01 0.36 0.49 2000 0.00 0.10 0.03 0.11 0.29 0.46 1.77 1.17 0.31 0.53 2001 0.12 0.13 0.11 0.37 0.36 1.47 1.66 2.18 0.87 0.85 2002 0.28 0.23 0.26 0.09 0.38 0.52 1.81 1.96 0.67 0.77 2003 0.07 0.19 0.06 0.14 0.34 0.85 2.79 2.83 1.14 1.03 2004 0.02 0.12 0.14 0.04 0.06 0.50 1.40 2.71 1.17 0.68 2005 - 0.01 0.05 0.04 0.08 0.29 1.42 2.03 2.51 0.80

Table 19. Number of wild fall Chinook jacks (< 54 cm) captured at the Sherars Falls Trap, by two-week period, by year.
June July August September October Year 16-30 1-15 16-31 1-15 16-31 1-15 16-30 1-15 16-31 Total 1977 1 4 9 22 19 48 150 17 11 2811978 1 0 3 9 12 18 101 135 16 2951979 1 1 14 28 8 67 277 122 5 5231980 0 1 10 9 17 60 110 173 9 3891981 1 4 11 14 32 116 171 79 19 4771982 - 0 0 1 19 22 31 28 9 1101983 - - - 0 5 5 14 30 4 581984 - - 0 0 2 5 1 4 2 141985 - - 1 4 7 15 14 45 1 871986 - - 6 5 5 16 13 20 3 681987 - - - 15 19 47 37 36 3 1571988 0 2 3 6 22 49 92 42 6 2221989 1 1 8 4 12 5 16 38 35 1201990 0 1 1 7 2 12 14 15 19 711991 0 2 0 3 12 27 38 26 16 1241992 2 0 3 1 2 5 18 30 20 811993 0 0 0 0 1 8 15 11 3 381994 - 0 0 4 3 17 16 18 12 701995 0 1 1 3 5 15 37 48 39 1491996 - - 1 2 2 5 9 23 0 421997 - - 0 0 1 4 12 4 2 231998 0 0 0 2 1 13 42 18 4 801999 - - - 1 8 6 25 29 22 912000 0 0 0 5 7 15 59 40 8 1342001 0 3 0 8 19 29 76 70 33 2382002 0 0 1 2 1 6 35 27 12 842003 0 0 0 3 1 12 35 62 66 1772004 1 0 3 1 2 5 31 46 9 98
2005 - - - - 3 14 34 45 56 152

Table 20. Catch rate (fish/hour) of wild fall Chinook jacks (< 54 cm) at the Sherars Falls Trap, by two-week period, by year.
June July August September October Year 16-30 1-15 16-31 1-15 16-31 1-15 16-30 1-15 16-31 Average 1977 0.04 0.06 0.14 0.27 0.40 1.19 2.05 0.98 0.52 0.64 1978 0.02 0.04 0.04 0.07 0.08 0.17 1.25 1.24 0.15 0.36 1979 0.01 0.01 0.14 0.27 0.14 0.93 2.83 1.37 0.06 0.68 1980 0.00 0.02 0.09 0.11 0.23 0.71 1.08 1.92 0.11 0.50 1981 0.02 0.05 0.13 0.20 0.34 1.26 2.79 0.76 0.30 0.64 1982 - 0.00 0.00 0.02 0.22 0.30 0.45 0.34 0.14 0.22 1983 - - - 0.00 0.06 0.07 0.20 0.47 0.07 0.15 1984 - - 0.00 0.00 0.03 0.09 0.02 0.09 0.04 0.04 1985 - - 0.02 0.07 0.08 0.19 0.22 0.58 0.05 0.18 1986 - - 0.06 0.06 0.06 0.16 0.17 0.20 0.03 0.11 1987 - - - 0.27 0.28 0.65 0.48 0.55 0.07 0.41 1988 0.00 0.03 0.04 0.07 0.26 0.71 0.93 0.85 0.11 0.35 1989 0.01 0.02 0.10 0.06 0.13 0.06 0.19 0.55 0.40 0.17 1990 0.00 0.01 0.01 0.10 0.03 0.17 0.15 0.18 0.20 0.10 1991 0.00 0.01 0.00 0.04 0.16 0.37 0.41 0.31 0.19 0.18 1992 0.03 0.00 0.04 0.01 0.03 0.07 0.21 0.28 0.26 0.12 1993 0.00 0.00 0.00 0.00 0.01 0.11 0.17 0.17 0.05 0.06 1994 - 0.00 0.00 0.05 0.04 0.28 0.20 0.23 0.16 0.13 1995 0.00 0.02 0.01 0.04 0.06 0.21 0.41 0.65 0.50 0.22 1996 - - 0.01 0.03 0.03 0.06 0.16 0.26 0.00 0.08 1997 - - 0.00 0.00 0.01 0.05 0.16 0.06 0.03 0.04 1998 0.00 0.00 0.00 0.03 0.01 0.18 0.37 0.19 0.06 0.13 1999 - - - 0.02 0.10 0.07 0.21 0.48 0.22 0.19 2000 0.00 0.00 0.00 0.06 0.08 0.23 0.81 0.58 0.10 0.23 2001 0.00 0.04 0.00 0.12 0.23 0.40 0.99 1.07 0.52 0.40 2002 0.00 0.00 0.02 0.02 0.01 0.10 0.41 0.37 0.21 0.14 2003 0.00 0.00 0.00 0.04 0.02 0.14 0.39 0.90 0.73 0.28 2004 0.02 0.00 0.04 0.01 0.02 0.07 0.25 0.55 0.11 0.12 2005 - - - - 0.03 0.13 0.37 0.54 0.52 0.32

Table 21. Estimated escapement of adult (>54 cm) and jack (<54 cm) fall Chinook salmon in the Deschutes River above Sherars Falls, by year.
Year Age Population estimate
( 95% C.I.) Tagged Examined For Tags Recaptured
Adults 3,927 (3,277-4,705) 811 560 115 1977 Jacks 1,482 (890-2,626) 272 75 13
Adults 3,564 (3,177-4,706) 992 760 211 1978 Jacks 2,323 (1,462-3,871) 320 122 16
Adults 2,308 (1,919-2,774) 567 454 111 1979 Jacks 3,042 (2,062-4,680) 489 148 23
Adults 2,009 (1,640-2,461) 427 431 91 1980 Jacks 1,505 (1,003-2,366) 398 82 21
Adults 2,495 (2,104-2,959) 542 601 130 1981 Jacks 2,922 (1,812-4,973) 440 105 15
Adults 3,820 (2,940-4,957) 286 731 54 1982 Jacks 2,625 (1,071-6,563) 99 104 3
Adults 3,152 (2,265-4,522) 228 467 33 1983 Jacks 738 (301-1,844) 58 49 3
Adults 1,582 (785-3,460) 48 225 6 1984 Jacks 966 a/ 14 43 0
Adults 1,576 (1,060-2,449) 113 317 23 1985 Jacks 3,208 a/ 82 120 2
Adults 3,137 (2,231-4,563) 197 506 31 1986 Jacks 4,846 a/ 66 178 2
Adults 3,201 (2,406-4,357) 302 485 45 1987 Jacks 1,184 (634-3,133) 158 66 8
Adults 2,477 (1,735-3,487) 324 220 28 1988 Jacks 1,305 b/ 218 12 2
Adults 1,252 (911-1,782) 204 225 36 1989 c/ Jacks 375 (244-570) 120 61 19
Adults 1,101 (674-1,771) 117 139 14 1990 c/ Jacks 360 (199-670) 71 39 7
Adults 983 (542-1,718) 83 116 9 1991 c/ Jacks 486 (277-1,082) 114 37 8
Adults 670 (441-1,010) 159 87 20 1992 c/ Jacks 599 (265-1,180) 80 36 4 Table continues

Table 21 (cont). Estimated escapement of adult (>54 cm) and jack (<54 cm) fall Chinook salmon in the Deschutes River above Sherars Falls, by year.
Year Age Population estimate
( 95% C.I.) Tagged Examined For Tags Recaptured
Adults 1,035 (600-1,742) 122 100 11 1993 c/ Jacks d/ -- 38 5 0
Adults 410 (261-637) 82 88 17 1994 c/ Jacks 1,073 (515-1,913) 69 137 8
Adults 1,072 (574-1,914) 200 47 8 1995 c/ Jacks 1,006 (409-2,012) 148 26 3
Adults 2,328 (1,466-3,651) 387 101 16 1996 c/ Jacks 453 (164-889) 39 33 2
Adults 3,764 (2,338-5,975) 316 189 15 1997 c/ Jacks 183 (66-362) 24 21 2
Adults 4,094 (2,972-4,659) 303 201 14 1998 c/ Jacks 2,608 (1,884-4,025) 79 162 4
Adults 1,888 (1,265-2,798) 230 187 22 1999 c/ Jacks 1,185 (576-1,761) 91 102 7
Adults 1,875 (1,473-2,385) 300 404 64 2000 c/ Jacks 3,954 (1,961-7,420) 134 204 6
Adults 4,278 (3,391-5,377) 467 648 70 2001 c/ Jacks 4,043 (2,791-5,828) 382 284 26
Adults 3,940 (3,160-4,908) 459 667 77 2002 c/ Jacks 1,169 (647-2,135) 84 109 7
Adults 3,884 (3,300-4,569) 647 862 143 2003 Jacks 1,007 (650-1,547) 173 109 18
Adults 2,991 (2,449-3,651) 555 510 94 2004 Jacks 999 (591-1,664) 111 115 12
Adults 4,278 (3,517-5,201) 668 632 98 2005 Jacks 1,463 (963-2,205) 196 155 20
a/ Estimated by relationship between number of carcasses examined for tags and escapement, 1977-83. Insufficient number recaptured to use Petersen estimate.
b/ Estimated by relationship between Pelton trap count, July-December, and escapement of jack fall Chinook salmon above Sherars Falls, 1977-86. Insufficient number of recaptures to use Petersen estimate. 95% CI not possible.
c/ Calculated using combined Pelton Trap and carcass recovery examined for tags and recaptured.
d/ No jack estimate possible due to insufficient recaptures of tagged fish

Table 22. Deschutes River helicopter fall Chinook redd counts by year.
Redds / Mile Year Remarks Miles Surveyed Redds Year Average 1974 A 25.5 716 28.1 1975 B 25.5 926 36.3 1976 A 25.5 1,139 44.7 1978 B 25.5 366 14.4 1979 C 25.5 650 25.5 1980 C 25.5 787 30.9 1981 C 25.5 538 21.1 1982 1983 A 25.5 229 9.0 1984 1985 A 25.5 285 11.2 1986 B 25.5 229 9.0 1987 1988 A 25.5 236 9.3
1989 D 100.0 682 1989 A 25.5 324 12.7
1990 C 100.0 204 1990 D 25.5 101 4.0
1991 A 100.0 194 1991 A 25.5 98 3.8
1992 A 100.0 431 1992 A 25.5 242 9.5
1993 A 100.0 732 1993 A 25.5 332 13.0
1994 A 100.0 785 1994 A 25.5 302 11.8
1995 A 100.0 453 1995 A 25.5 179 7.0
1996 B 100.0 399 1996 B 25.5 190 7.5
(Table continues)

Table 22 (cont.). Deschutes River helicopter fall Chinook redd counts by year.
Redds / Mile Year Remarks Miles Surveyed Redds Year Average
1997 A 100.0 1,725 1997 A 25.5 728 28.6
1998 B 100.0 443 1998 B 25.5 212 8.3
1999 A 100.0 318 1999 A 25.5 126 4.9
2000 A 100.0 499 2000 A 25.5 274 10.8
2001 A 100.0 1,194 2001 A 25.5 697 27.3
2002 A 100.0 1,418 2002 A 25.5 798 31.3
2003 B 100.0 1,047 2003 B 25.5 451 17.7
2004 C 100 1,672
2005 E 100 738
A = October – November counts combined, B = October counts only, C = November counts only, D = Total count – November only E = November-December counts

Table 23. The number of fall Chinook redds counted above Sherars Falls, below Sherars Falls,
and total in the Deschutes River, by year.
Redds Ratio Above Sherars Below Sherars Total Below/Above
1990 101 103 204 1.02:1 1991 54 140 194 2.59:1 1992 104 327 431 3.14:1 1993 92 640 732 6.96:1 1994 59 726 785 12.31:1 1995 64 389 453 6.08:1 1996 106 293 399 2.76:1 1997 314 1411 1725 4.49:1 1998 166 277 443 1.67:1 1999 92 216 318 2.35:1 2000 235 264 499 1.12:1 2001 457 737 1194 1.61:1 2002 456 962 1418 2.11:1 2003 323 724 1047 2.24:1 2004 421 1251 1672 2.97:1 2005 233 505 738 2.17:1

Table 24. Run size of adult fall Chinook salmon in the Deschutes River, by year.
Year Harvest Escapement Run 1977 1,861 5,631 7,492 1978 1,971 4,154 6,125 1979 1,592 3,291 4,883 1980 1,951 2,542 4,493 1981 1,837 3,183 5,020 1982 2,016 4,890 6,906 1983 1,496 3,669 5,165 1984 970 2,025 2,995 1985 807 2,645 3,452 1986 1,153 3,801 4,954 1987 2,057 4,097 6,154 1988 2,391 3,520 5,911 1989 1,730 4,770 6,500 1990 970 2,224 3,194 1991 154 3,532 3,686 1992 37 3,776 3,813 1993 11 8,239 8,250 1994 69 5,455 5,524 1995 36 7,588 7,624 1996 78 8,763 8,841 1997 133 20,678 20,811 1998 507 10,925 11,432 1999 373 6,527 6,900 2000 407 3,981 4,388 2001 334 11,177 11,511 2002 992 12,252 13,244 2003 1,078 12,590 13,668 2004 1,224 11,879 13,102 2005 835 13,550 14,385

Table 25. Run size of jack fall Chinook salmon in the Deschutes River, by year.
Year Harvest Escapement Run 1977 1,672 2,125 3,797 1978 1,597 2,708 4,305 1979 2,000 4,338 6,338 1980 1,507 1,904 3,411 1981 1,294 3,728 5,022 1982 1,506 3,360 4,866 1983 678 859 1,537 1984 987 1,237 2,224 1985 1,454 5,384 6,838 1986 1,428 5,872 7,300 1987 242 1,515 1,757 1988 245 1,859 2,104 1989 150 1,486 1,636 1990 140 727 867 1991 59 1,746 1,805 1992 4 2,483 2,486 1993 0 NO ESTIMATE 1994 8 14,276 14,284 1995 19 7,121 7,138 1996 6 1,705 1,711 1997 7 1,005 1,012 1998 78 6,960 7,038 1999 76 4,097 4,173 2000 127 8,395 8,522 2001 27 10,563 10,590 2002 72 3,635 3,707 2003 78 3,264 3,342 2004 153 3,968 4,121 2005 135 4,634 4,769

Table 26. Bimonthly counts of upstream migrant jack and adult fall Chinook salmon captured at the Powerdale Dam trap, by origin and run year.
July August September October November December Origin,
Run Year 01-15 16-31 01-15 16-31 01-15 16-30 01-15 16-31 01-15 16-30 01-15 16-31 Total Natural,
1992 0 0 4 1 2 7 1 1 0 0 0 0 16 1993 0 0 3 1 2 0 0 0 0 0 0 0 6 1994 0 6 2 0 0 13 3 1 0 0 0 0 25 1995 0 4 0 1 3 0 0 1 0 0 0 0 8 1996 1 1 0 7 3 0 0 1 0 0 0 0 13 1997 0 4 7 2 9 2 0 0 0 0 0 0 24 1998 0 0 9 3 9 9 4 0 0 0 0 0 34 1999 0 0 3 4 3 1 3 1 1 0 0 0 16 2000 2 2 2 2 13 10 1 0 0 0 0 0 32 2001 2 3 3 5 3 3 9 1 0 0 0 0 29 2002 0 0 1 1 9 14 6 1 1 0 0 0 33 2003 0 1 5 9 6 16 14 19 0 0 0 0 70 2004 0 2 1 1 4 6 7 10 0 0 0 0 31 2005 0 0 1 1 2 2 1 0 0 0 0 0 7
Stray Hatchery,
1992 0 0 0 0 2 1 2 1 0 0 0 0 6 1993 0 0 0 0 2 1 1 0 0 0 0 0 4 1994 0 0 0 0 0 6 1 0 0 0 0 0 7 1995 0 0 0 0 2 2 0 0 0 0 0 0 4 1996 0 0 0 0 1 0 1 0 0 0 0 0 2 1997 0 0 0 0 2 0 0 0 0 0 0 0 2 1998 0 0 0 0 1 1 2 0 0 0 0 0 4 1999 0 0 0 0 0 0 0 0 0 0 0 0 0 2000 0 0 0 0 0 2 0 0 0 0 0 0 2 2001 1 2 2 0 1 0 2 1 1 0 0 0 10 2002 0 0 2 0 1 0 1 0 0 0 0 0 4 2003 0 0 0 3 0 0 1 2 0 0 0 0 6 2004 0 0 0 0 0 1 1 1 0 0 0 0 3 2005 0 0 1 3 1 5 3 23 1 0 0 0 39

Table 26 (cont.). Bimonthly counts of upstream migrant jack and adult fall Chinook salmon captured at the Powerdale Dam trap, by origin and run year.
July August September October November December Origin, Run Year 01-15 16-31 01-15 16-31 01-15 16-30 01-15 16-31 01-15 16-30 01-15 16-31 Total
Unknown,
1992 -- -- -- -- -- -- -- -- -- -- -- -- 0 1993 -- -- -- -- -- -- -- -- -- -- -- -- 0 1994 0 0 0 0 0 3 2 1 1 0 0 0 7 1995 -- -- -- -- -- -- -- -- -- -- -- -- 0 1996 0 0 0 0 1 0 0 0 0 0 0 0 1 1997 0 0 1 2 2 1 0 0 0 0 0 4 1998 0 0 0 0 0 2 0 0 0 0 0 0 2 1999 0 0 0 1 0 0 1 0 1 0 0 0 3 2000 0 0 0 0 0 0 0 0 0 0 0 0 0 2001 0 0 0 0 0 0 0 0 0 0 0 0 0 2002 0 0 0 0 0 1 0 0 0 0 0 0 1 2003 0 0 0 1 0 3 0 1 0 0 0 0 5 2004 0 0 0 0 0 1 0 0 0 0 0 0 1 2005 0 0 0 0 0 0 1 2 0 0 0 0 3

Table 27. Jack and adult fall Chinook escapements to the Powerdale Dam trap by origin, run year, and age category, by year. Fish of unknown origin were allocated to origin categories based on scale analysis and the ratio of fish of known origin.
Freshwater.Total Age Origin,
Stock, Run Year
Total Escapement 1.2 1.3 1.4 1.5 1.6 2.3 2.4 2.5
Natural,
1992 16 2 2 10 1 1 0 0 01993 6 0 1 3 2 0 0 0 01994 32 2 4 19 2 0 1 2 21995 8 1 0 1 1 0 1 2 21996 14 0 1 10 0 0 1 2 01997 28 0 7 9 0 0 2 7 31998 36 4 11 4 10 0 0 4 31999 19 1 5 4 1 0 0 6 22000 32 1 10 12 5 0 1 3 02001 29 1 11 14 0 0 0 3 0
2002 34 4 12 17 0 0 0 1 0 2003 75 4 11 40 11 0 0 7 2 2004 32 1 8 11 7 0 0 5 0 2005 8 1 1 4 0 0 0 0 2
Stray Hatchery,
1992 6 1 3 2 0 -- 0 01993 4 0 1 2 1 -- 0 0 01994 7 0 0 5 0 -- 0 2 01995 4 0 0 1 0 -- 0 3 01996 2 0 0 0 0 -- 1 1 01997 2 0 0 1 0 -- 0 1 01998 4 0 1 1 1 -- 0 1 01999 0 0 0 0 0 -- 0 0 02000 2 0 1 1 0 -- 0 0 02001 10 0 3 1 0 -- 0 6 0
2002 4 1 0 1 0 -- 0 1 1 2003 6 0 0 2 0 -- 0 2 1 2004 3 1 0 0 0 -- 0 1 12005 42 1 11 21 6 1 0 0 2

Table 28. Bi-monthly counts of upstream migrant coho salmon at Powerdale Dam, by run year.
August September October November December Origin, Run Year 01-15 16-31 01-15 16-30 01-15 16-31 01-15 16-30 01-15 16-31 Total
Unmarked, 1992 0 0 1 11 5 4 1 0 0 0 22 1993 0 0 0 0 0 0 0 0 0 0 0 1994 0 0 0 0 1 0 0 0 0 0 1 1995 0 0 3 1 4 3 0 0 0 0 11 1996 0 0 0 1 4 1 0 0 0 0 6 1997 0 0 0 3 2 1 0 0 0 0 6 1998 0 0 0 1 3 0 0 1 0 0 5 1999 0 0 0 1 4 1 3 0 1 0 10 2000 0 0 2 1 0 4 1 0 0 0 9 2001 0 0 0 3 5 5 7 0 0 0 20 2002 0 0 1 3 3 2 2 4 2 10 27 2003 0 0 0 13 10 12 2 1 3 0 41 2004 0 0 6 39 32 32 9 5 3 0 126 2005 0 0 2 0 11 11 3 0 0 0 27
Marked Stray Hatchery, 1992 0 1 6 37 12 12 11 0 0 0 79 1993 0 0 0 3 10 10 0 3 2 0 28 1994 0 0 3 15 11 23 0 0 0 0 52 1995 0 1 0 12 15 11 0 0 0 0 39 1996 0 0 0 3 12 5 0 0 0 0 20 1997 0 0 0 1 2 3 0 0 0 0 6 1998 0 0 0 10 10 9 8 7 0 0 44 1999 0 0 0 7 6 3 0 0 3 0 19 2000 0 0 5 14 4 8 2 0 0 0 33 2001 0 0 2 18 208 475 173 101 0 0 977 2002 0 0 0 3 7 16 22 18 0 0 66 2003 0 0 4 24 36 74 2 10 3 0 153 2004 0 1 9 31 68 225 105 22 5 0 466 2005 0 0 6 19 91 99 41 7 0 0 263

Table 28 (cont.). Bi-monthly counts of upstream migrant coho salmon at Powerdale Dam, by run year.
August September October November December Origin, Run Year 01-15 16-31 01-15 16-30 01-15 16-31 01-15 16-30 01-15 16-31 Total
Unknown, 1992 0 0 0 1 0 1 0 0 0 0 2 1993 0 1 1 1 0 0 0 0 1 0 5 1994 0 0 1 0 0 2 0 0 0 0 3 1995 0 0 0 0 1 0 0 0 0 0 1 1996 0 0 0 0 1 0 0 0 0 0 1 1997 0 0 1 0 0 0 0 0 0 0 1 1998 0 0 0 0 1 2 3 4 0 0 10 1999 0 0 0 0 1 0 0 1 0 0 2 2000 0 0 0 0 0 0 0 0 0 0 0 2001 0 0 0 1 7 6 6 3 0 0 23 2002 0 0 0 0 1 1 1 1 0 0 4 2003 0 0 1 7 3 2 0 0 0 0 13 2004 0 0 0 2 5 12 7 1 0 0 27 2005 0 0 0 1 15 8 4 2 0 0 30
a Trap was inoperable from 27 October, 1994 through 7 November, 1994 because of flood damage. b Trap was inoperable from 11-13 November, 1995 and 20-24 November, 1995 because of flood damage and from 28 November, 1995 through 27 February, 1996
for modifications to the adult fish ladder.

Table 29. Coho salmon escapements to the Powerdale Dam trap by origin, run year, and age category. Fish of unknown origin were allocated to origin categories based on scale analysis and the ratio of fish of known origin.
Freshwater.Total Age Origin,
Run year Total
Escapement 1.2 1.3 2.2 2.3 2.4 Unmarked,
1992 23 -- -- 0 23 0 1993 0 -- -- 0 0 0 1994 1 -- -- 0 1 0 1995 11 -- -- 0 10 1 1996 6 -- -- 0 6 0 1997 6 -- -- 0 6 0 1998 12 -- -- 0 12 0 1999 11 -- -- 0 11 0 2000 9 -- -- 1 8 0 2001 24 -- -- 4 20 0 2002 30 -- -- 3 27 0 2003 43 -- -- 12 31 0 2004 133 -- -- 5 128 0 2005 30 -- -- 6 24 0
Stray Hatchery, 1992 80 0 0 13 67 -- 1993 33 0 0 0 33 -- 1994 55 0 0 3 52 -- 1995 40 0 0 4 36 -- 1996 10 0 0 1 20 -- 1997 7 0 0 0 7 -- 1998 47 0 0 1 46 -- 1999 20 0 0 1 19 -- 2000 33 1 8 13 20 -- 2001 996 0 0 7 989 -- 2002 67 0 1 8 58 -- 2003 164 1 0 22 141 -- 2004 486 0 0 18 468 -- 2005 290 0 0 17 273 --

Table 30. Pelton trap summer steelhead capture, by month, by run year.
Month
Run Year June July Aug Sept Oct Nov Dec Jan Feb Mar April May
Total Run
04 - 05 0 3 5 103 670 257 565 565 410 502 45 0 3,125
03 – 04 0 0 0 3 530 397 1054 685 704 225 57 1 3,656
02 – 03 0 2 1 41 822 983 1423 1181 1270 486 106 7 6,322
01 – 02 0 1 2 135 1975 2084 1444 1475 848 481 435 8 8,888
00 – 01 0 1 1 58 479 395 247 529 436 499 136 29 2,810
99 – 00 0 0 0 66 337 371 533 245 225 95 19 10 1,901
5-Year Average 0 1 1 61 829 846 940 823 697 357 151 11 4,715
Cumulative disposition for captured steelhead for the current year. Includes recaptures: Given Away = 1,759 Broodstock = 501 Released into river = 79 Dead or killed = 786

Table 31. Number and percent of wild, stray, and Round Butte Hatchery origin summer steelhead returning to the Pelton Trap, by run year. Includes 3-salts from Round Butte Hatchery.
Wild Origin Stray Hatchery Round Butte Hatchery
Run Year Number % Number % Number % 81-82 245 11.3 156 7.4 1,760 81.3 82-83 344 16.7 167 8.8 1,547 74.6 83-84 814 17.3 1,452 33.0 2,439 49.7 84-85 603 12.9 795 17.0 3,278 71.1 85-86 686 14.4 943 19.7 3,153 65.9 86-87 467 10.7 1,538 33.4 2,640 57.6 87-88 160 6.6 796 32.1 1,484 61.3 88-89 123 7.4 300 17.7 1,247 74.9 89-90 136 9.1 524 35.2 829 55.7 90-91 82 7.4 428 35.8 606 56.8 91-92 101 4.4 849 36.7 1,365 58.9 92-93 59 3.6 427 26.0 1,157 70.4 93-94 65 12.0 288 53.0 190 35.0 94-95 27 2.0 642 53.0 753 45.0 95-96 32 1.6 976 48.6 1,000 49.8 96-97 126 2.2 2,001 34.9 3,605 62.9 97-98 194 3.8 2,459 48.3 2,440 47.9 98-99 155 6.0 1,284 49.9 1,135 44.1 99-00 83 4.4 768 40.4 1,050 55.2 00-01 114 4.1 1,103 39.2 1,593 56.7 01-02 282 3.2 3,674 41.3 4,942 55.5 02-03 207 3.3 1,787 28.5 4,284 68.2 03-04 104 2.8 967 26.3 2,605 70.9 04-05 79 2.5 903 28.9 2,143 68.9


Table 32. Population estimates of summer steelhead escapement over Sherars Falls, Deschutes River by run year.
Hatchery Component
Run Year Wild Total Hatchery Round Butte Strays 82-83 6,567 4,773 3,524 -- 83-84 8,228 15,443 7,250 7,684 84-85 7,721 11,770 7,563 3,824 85-86 9,624 12,106 7,382 5,056 86-87 6,207 18,358 9,064 9,803 87-88 5,367 17,623 9,209 8,367 88-89 3,546 6,336 3,849 2,909 89-90 4,278 6,504 2,758 3,659 90-91 3,653 4,876 1,990 2,852 91-92 4,862 11,859 3,778 8,409 92-93 904 6,088 2,539 4,261 93-94 1,487 5,476 1,159 4,293 94-95 482 6,126 1,781 4,391 95-96 1,662 12,828 2,708 11,855 96-97 3,458 28,416 5,932 23,618 97-98 1,820 22,511 5,042 17,703 98-99 3,800 15,120 3,527 11,110 99-00 4,790 15,219 2,628 13,785 00-01 8,985 19,310 4,380 15,072 01-02 8,749 31,784 9,373 25,263 02-03 9,363 23,004 8,880 15,203 03-04 5,524 11,511 5,265 6,542 04-05 3,161 9,356 4,354 4,972

Table 33. Summer steelhead redd counts, Bakeoven Creek, by section, by year.
Date Section Redds 03/14/90 Cottonwood/Sugarloaf 2 Sugarloaf/Powerline 1 Powerline/mouth 21 Total 24 03/08/91 Sugarloaf/Powerline 0 Powerline/Mouth 8 Total 8 03/24/92 Powerline/Mouth 9 Total 9 04/08/93 Sugarloaf/Powerline 2 Powerline/Mouth 19 21 04/08/94 Powerline/Mouth a/ 13 Total 13 03/03/95 Sugarloaf/Powerline 7 Powerline/Mouth 13 Total 20 03-29-96 Sugarloaf/Powerline 14 Powerline/Mouth 21 Total 35 04-02-97 Sugarloaf/Powerline 18 Powerline/Mouth 39 Total 57 03-30-98 Sugarloaf/Powerline 11 Powerline/Mouth 57 Total 68 Table continues

Table 33. (cont.). Summer steelhead redd counts, Bakeoven Creek, by section, by year. Date Section Redds 03/19/99 Sugarloaf/Powerline 33 Powerline/Mouth 56 Total 89 03/21/00 Sugarloaf/Powerline 22 Powerline/Mouth 61 Total 83 03/22/01 Sugarloaf/Powerline 154 Powerline/Mouth 326 Total 480 03/20/02 Sugarloaf/Powerline 23 Powerline/Mouth 191 Total 214 03/20/03 Sugarloaf/Powerline 18 Powerline/Mouth 99 Total 117 04/01/04 Sugarloaf/Powerline 29 Powerline/Mouth 58 Total 87 04/11/05 Sugarloaf/Powerline 9 Powerline/Mouth 49 Total 58

Table 34. Summer steelhead redd counts, Buckhollow Creek, by section, by year.
Date Section Redds 03/16/90 Macken/Bronx 0 Bronx/Mays 5 Mays/Powerline* 7 Powerline/Mouth 73 Total 85 03/15/91 Powerline/Mouth* 72 03/24/92 Powerline/Mouth * ** 34 04/07/93 Bronx/Mays 3 Mays/Powerline* 5 Powerline/Mouth** 40 Total 48 03/30/94 Mays/Powerline* 1 Powerline/Mouth 7 Total 8 03/29/95 Bronx/Mays 0 Mays/Powerline 5 Powerline/Mouth 64 Total 69 04/05/96 Spears/Bronx 5 Bronx/Mays 3 Mays/Powerline 9 Powerline/Mouth 48 Total 65 04/04/97 Hauser/Bronx* 4 Bronx/Mays 7 Mays/Powerline 63 Powerline/Mouth 62 Total 136 Table continues

Table 34 (cont.). Summer steelhead redd counts, Buckhollow Creek, by section, by year. Date Section Redds 03/26/98 Hauser/Bronx* 0 Bronx/Mays 10 Mays/Powerline 36 Powerline/Mouth 133 Total 179 03/26/99 Hauser/Bronx* 2 Bronx/Finnegan 1 Finnegan/Mays 5 Mays/Powerline 37 Powerline/Mouth 107 Total 152 03/27/00 Hauser/Bronx* 5 Bronx/Finnegan 2 Finnegan/Mays 5 Mays/Powerline 64 03/21/00 Powerline/Mouth 34 Total 110 Hauser/Bronx 03-26-01 Bronx/Finnegan 1 03-26-01 Finnegan/Mays 39 03-23-01 Mays/Powerline 164 04-12-01 Powerline/Mouth 241 Total 445 Hauser/Bronx 03-25-02 Bronx/Finnegan 3 03-25-02 Finnegan/Mays 1 03-25-02 Mays/Powerline 78 04-05-02 Powerline/Webb fence 139 Webb fence/mouth Total 221

Table 34 (cont.). Summer steelhead redd counts, Buckhollow Creek, by section, by year. Date Section Redds Hauser/Bronx 03-24-03 Bronx/Finnegan 5 03-24-03 Finnegan/Mays 22 03-24-03 Mays/Powerline 63 04-04-03 Powerline/Webb fence 89 04-04-03 Webb fence/mouth 43 Total 222 Hauser/Bronx 03-30-04 Bronx/Finnegan 11 03-30-04 Finnegan/Mays 15 03-30-04 Mays/Powerline 44 03-30-04 Powerline/Webb fence 69 03-30-04 Webb fence/mouth 75 Total 211 Hauser/Bronx Not surveyed 04-04-05 Bronx/Finnegan 0 04-04-05 Finnegan/Mays 6 04-04-05 Mays/Powerline 26 04-04-05 Powerline/Webb fence 40 04-04-05 Webb fence/mouth 42 Total 114

Table 35. Summer steelhead redd surveys in the Trout Creek drainage, by year. Data should not be compared before and after 1993 due to differences in methodology and location.
Year Miles Surveyed Live Fish Redds Fish/Mile Redds/Mile 1988 9.4 17 23 1.8 2.5 1989 10.5 24 23 2.8 2.2 1990 14.4 22 42 1.5 2.9 1991 16.9 3 16 0.2 1.1 1992 16.4 6 6 0.4 0.4 1993 28.2 4 15 0.1 0.5 1994 16.25 0 0 0.0 0.0 1995 18.25 0 8 0.0 0.4 1996 21.75 4 5 0.2 0.2 1997 23.6 21 50 0.9 2.1 1998 28 13 44 0.5 1.6 1999 28.65 12 59 0.4 2.1
2000 a/ 54.1 39 461 0.7 8.5 2001 36.6 56 595 1.5 16.3 2002 65.2 95 866 1.5 13.3 2003 65.4 48 789 0.7 12.1 2004 64.1 11 277 0.2 4.3 2005 No Surveys Due To High Water
a/ Starting in 2000, redd counts were conducted generally later in the season and timed to
capture peak count. Succeeding years utilized the same methodology.

Table 36. Number of wild summer steelhead captured at the Sherars Falls Trap, by two-week
period, by year.
June July August September October Year 16-30 1-15 16-31 1-15 16-31 1-15 16-30 1-15 16-31 Total 1977 4 30 125 158 29 66 163 63 35 6731978 12 23 83 59 32 37 81 74 36 4371979 14 16 26 25 23 44 134 67 37 3861980 0 4 41 17 20 88 124 135 32 4611981 0 8 43 42 54 155 171 159 54 6861982 1 2 8 13 26 31 84 45 42 3621983 - - - 6 33 97 84 161 36 4171984 - - 1 19 24 47 76 29 12 2381985 - - 10 11 27 66 104 138 8 3641986 - - 16 17 9 64 108 167 31 4121987 - - - 25 27 51 83 137 49 3721988 1 5 7 11 21 31 188 83 27 3741989 0 3 11 7 11 24 103 139 157 4551990 1 1 13 12 6 38 58 65 100 2941991 2 0 13 13 21 53 109 36 46 2931992 3 2 9 1 20 27 67 38 29 1961993 1 1 3 4 6 26 65 60 24 1901994 - 0 3 7 3 6 12 7 17 551995 0 0 6 5 12 18 31 73 39 1841996 - - 5 6 12 54 70 145 7 2991997 - - 9 2 7 37 78 22 11 1661998 0 1 5 1 10 75 209 81 9 3911999 - - - 5 41 73 307 161 108 6952000 1 5 16 23 39 73 396 326 52 9312001 1 9 13 33 29 131 346 228 167 9572002 0 10 19 19 28 54 313 274 150 8672003 1 2 7 11 11 65 151 151 165 5902004 0 1 5 7 1 146 81 38 293 5722005 1 3 6 10 18 43 114 115 62 372

Table 37. Catch rate (fish/hour) of wild summer steelhead at the Sherars Falls Trap, by two week period, by year.
June July August September October Year 16-30 1-15 16-31 1-15 16-31 1-15 16-30 1-15 16-31 Average 1977 0.16 0.44 1.90 1.89 0.57 1.60 2.05 3.56 1.85 1.56 1978 0.21 0.26 1.00 0.47 0.22 0.36 0.99 0.68 0.58 0.55 1979 0.21 0.15 0.26 0.24 0.39 0.29 1.36 0.75 0.44 0.49 1980 - 0.06 0.39 0.20 0.26 1.00 1.20 1.14 0.45 0.62 1981 - 0.10 0.51 0.56 0.58 1.68 2.69 1.60 0.85 1.07 1982 0.03 0.06 0.19 0.24 0.31 0.42 1.22 0.54 0.64 0.41 1983 - - - 0.13 0.38 1.39 1.21 2.51 0.67 1.05 1984 - - 0.10 0.26 0.35 0.88 1.64 0.67 0.23 0.59 1985 - - 0.16 0.13 0.32 0.81 1.64 1.77 0.38 0.74 1986 - - 0.14 0.21 0.11 0.68 1.43 1.67 0.34 0.65 1987 - - - 0.45 0.40 0.71 1.08 2.11 1.08 0.97 1988 0.02 0.07 0.09 0.13 0.25 0.45 1.90 1.68 0.49 0.62 1989 0.00 0.05 0.14 0.10 0.12 0.28 1.23 2.01 1.78 0.65 1990 0.01 0.01 0.14 0.16 0.09 0.53 0.64 0.80 1.07 0.40 1991 0.03 0.00 0.06 0.19 0.28 0.73 1.17 0.44 0.55 0.43 1992 0.04 0.03 0.11 0.01 0.28 0.36 0.78 0.36 0.37 0.28 1993 0.01 0.01 0.04 0.05 0.06 0.34 0.76 0.90 0.40 0.28 1994 - 0.00 0.04 0.09 0.04 0.10 0.15 0.09 0.22 0.10 1995 0.00 0.00 0.06 0.06 0.14 0.25 0.34 0.98 0.50 0.27 1996 - - 0.06 0.08 0.16 0.61 1.21 1.63 0.10 0.55 1997 - - 0.10 0.03 0.10 0.44 0.95 0.30 0.18 0.32 1998 0.00 0.02 0.08 0.02 0.13 1.02 1.84 0.85 0.13 0.64 1999 - - - 0.12 0.50 0.87 2.63 2.66 1.08 1.43 2000 0.10 0.13 0.23 0.29 0.46 1.12 5.46 4.70 0.65 1.63 2001 0.04 0.12 0.20 0.48 0.35 1.81 4.49 3.48 2.63 1.61 2002 0.00 0.19 0.31 0.19 0.36 0.94 3.35 3.72 2.09 1.46 2003 0.02 0.05 0.11 0.14 0.19 0.73 1.85 2.18 1.82 0.94 2004 0.00 0.02 0.06 0.07 0.01 0.18 1.19 0.97 0.48 0.33 2005 0.01 0.02 0.06 0.11 0.16 0.41 1.25 1.39 0.57 0.44

Table 38. Number of hatchery summer steelhead captured at the Sherars Falls Trap, by period, by year.
June July August September October Year 16-30 1-15 16-31 1-15 16-31 1-15 16-30 1-15 16-31 Total 1977 3 11 66 146 38 137 245 67 31 7441978 11 19 97 101 69 102 190 140 43 7721979 1 22 98 87 63 211 430 195 44 1,1421980 3 12 80 60 45 273 313 257 59 1,1021981 7 19 35 43 75 232 210 139 27 7781982 2 3 8 8 52 56 103 60 28 3201983 - - - 11 84 253 270 268 48 9341984 - - 1 44 59 131 76 24 14 4221985 - - 10 18 73 174 237 223 32 7671986 - - 42 57 49 314 430 450 82 1,4241987 - - - 35 26 133 285 248 58 7851988 6 12 19 18 37 138 527 154 79 9921989 2 3 14 5 22 137 379 414 311 1,2871990 0 14 21 19 15 99 191 204 238 8011991 1 4 20 34 50 151 592 251 175 1,2781992 6 12 32 31 55 161 398 316 109 1,1201993 0 9 4 16 18 103 393 313 135 9911994 - 0 6 4 10 44 115 119 100 3981995 2 1 8 13 45 134 576 697 290 1,7661996 - - 14 16 45 379 669 1136 52 2,3111997 - - 13 10 43 359 606 140 47 1,2181998 - 1 5 12 21 237 997 331 41 1,6451999 - - - 6 72 206 1041 426 188 1,9392000 0 0 13 20 50 221 859 400 72 1,6352001 2 14 18 61 76 642 1828 883 380 3,9042002 0 16 20 50 92 344 1609 851 354 3,3362003 1 8 20 33 35 354 646 389 269 1,7552004 3 3 7 11 24 59 500 231 78 9162005 - 2 14 24 59 226 590 406 241 1,562

Table 39. Catch rate (fish/hour) of hatchery summer steelhead at the Sherars Falls Trap, by two-week period, by year.
June July August September October Year 16-30 1-15 16-31 1-15 16-31 1-15 16-30 1-15 16-31 Average 1977 0.12 0.14 1.55 1.77 0.79 3.27 3.27 3.16 1.64 1.75 1978 0.19 0.38 1.15 0.79 0.49 0.99 2.33 1.31 0.72 0.93 1979 0.01 0.23 0.88 0.85 1.24 2.89 4.40 2.19 0.56 1.47 1980 0.04 0.21 0.84 0.70 0.61 3.25 3.07 2.59 0.82 1.35 1981 0.17 0.22 0.42 0.56 0.81 2.48 3.05 1.14 0.42 1.03 1982 0.05 0.09 0.19 0.14 0.46 0.75 0.93 0.73 0.43 0.42 1983 - - - 0.24 0.98 3.61 3.90 4.17 0.89 2.30 1984 - - 0.10 0.60 0.85 2.46 1.64 0.56 0.27 0.93 1985 - - 0.16 0.21 0.88 2.15 3.73 2.86 1.52 1.64 1986 - - 0.36 0.69 0.57 3.34 5.70 4.56 0.90 2.30 1987 - - - 0.63 0.38 1.84 3.71 3.82 1.27 1.94 1988 0.14 0.17 0.25 0.22 0.44 1.99 5.32 3.11 1.44 1.45 1989 0.03 0.05 0.19 0.07 0.25 1.62 4.52 6.00 3.52 1.84 1990 0.00 0.08 0.23 0.26 0.21 1.38 2.11 2.51 2.55 1.09 1991 0.02 0.05 0.25 0.51 0.66 2.07 6.37 3.04 2.11 1.86 1992 0.08 0.16 0.40 0.42 0.77 2.14 5.54 2.98 1.41 1.59 1993 0.00 0.12 0.05 0.22 0.18 1.36 4.56 4.71 2.22 1.45 1994 - 0.00 0.08 0.05 0.14 0.71 1.44 1.54 1.31 0.74 1995 0.03 0.02 0.09 0.17 0.52 1.87 6.31 9.38 3.69 2.62 1996 - - 0.16 0.22 0.60 4.23 11.57 12.78 0.75 4.26 1997 - - 0.15 0.15 0.61 4.28 7.41 1.91 0.76 2.32 1998 - 0.02 0.08 0.20 0.28 3.22 8.78 3.48 0.58 2.69 1999 - - - 0.14 0.87 2.47 6.24 7.03 1.87 3.99 2000 0.00 0.00 0.18 0.25 0.59 3.38 11.85 5.76 0.91 2.86 2001 0.08 0.19 0.28 0.88 0.91 8.89 23.71 13.48 5.98 6.55 2002 0.00 0.30 0.33 0.49 1.19 6.00 17.23 11.56 4.92 5.32 2003 0.02 0.19 0.31 0.42 0.62 4.00 7.93 5.62 2.97 2.80 2004 0.05 0.04 0.10 0.12 0.22 0.78 4.08 2.77 0.98 1.02 2005 - 0.03 0.15 0.27 0.53 2.16 6.49 4.91 2.25 2.10
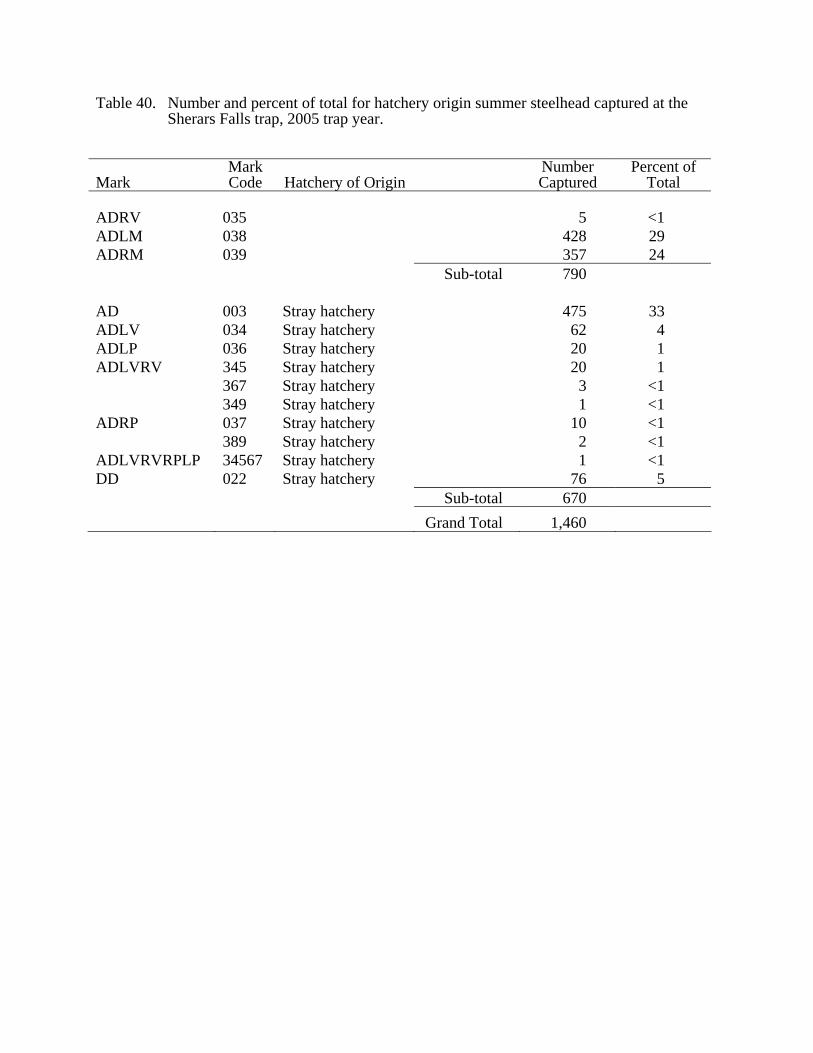
Table 40. Number and percent of total for hatchery origin summer steelhead captured at the Sherars Falls trap, 2005 trap year.
Mark Mark Code Hatchery of Origin
Number Captured
Percent of Total
ADRV 035 5 <1 ADLM 038 428 29 ADRM 039 357 24 Sub-total 790 AD 003 Stray hatchery 475 33 ADLV 034 Stray hatchery 62 4 ADLP 036 Stray hatchery 20 1 ADLVRV 345 Stray hatchery 20 1 367 Stray hatchery 3 <1 349 Stray hatchery 1 <1 ADRP 037 Stray hatchery 10 <1 389 Stray hatchery 2 <1 ADLVRVRPLP 34567 Stray hatchery 1 <1 DD 022 Stray hatchery 76 5 Sub-total 670 Grand Total 1,460

Table 41. Number and percent of Round Butte Hatchery origin and stray hatchery origin summer steelhead as determined by fin mark captured at the Sherars Falls trap, by year.
Round Butte Hatchery Stray Hatchery Origin Trap Year Number % Total Catch Number % Total Catch 1988 665 67.2 324 32.8 1989 521 40.5 776 59.5 1990 352 44.0 448 56.0 1991 417 32.6 861 67.4 1992 506 45.2 614 54.8 1993 196 19.8 795 80.2 1994 118 29.7 280 70.3 1995 458 25.9 1,308 74.1 1996 649 28.1 1,662 71.9 1997 280 23.0 936 77.0 1998 423 25.8 1,220 74.3 1999 465 24.0 1,474 76.0 2000 483 29.6 1,147 70.4 2001 1,262 32.3 2,642 a/ 67.7 2002 1,354 40.6 1,982 a/ 59.4 2003 812 46.6 940 a/ 53.4 2004 440 44.8 543 55.2 2005 790 54.1 670 45.9 a/ Includes deformed dorsal, adipose present hatchery origin steelhead

Table 42. Deschutes River expanded hatchery summer steelhead harvest and wild summer steelhead release data from the mouth, west bank, July 1 – October 31, by year. Does not include voluntarily released hatchery fish.
Bank Boat Total Year Anglers Hours Wild Hatchery Wild Hatchery Wild Hatchery
1977 10,571 54,724 933 225 1,643 478 2,576 703 1978 Season Closed 1979 No Sample 1980 6,984 42,819 1,322 435 1,946 600 3,268 1,035 1981 7,435 56,537 704 215 3,300 686 4,004 901 1982 6,937 47,622 691 142 2,751 629 3,442 771 1983 8,752 60,353 932 308 4,716 1,315 5,648 1,623 1984a/ No Sample 1985a/ No Sample 1986a/ No Sample 1987 11,856 87,799 922 314 7,416 1,536 8,338 1,850 1988a/ No Sample 1989 10,407 73,841 407 305 3,600 1,833 4,007 2,138 1990 6,568 44,300 205 200 1,185 939 1,386 1,139 1991 8,855 61,362 667 465 3,121 1,568 3,788 2,033 1992 6,837 44,265 153 281 1,352 1,097 1,505 1,378 1993 6,604 45,505 264 243 1,520 1,044 1,788 1,287 1994 5,980 36,488 103 209 758 1,166 861 1,375 1995 6,447 40,080 180 381 1,126 1,639 1,306 2,020 1996 6,813 46,080 208 558 1,785 3,099 1,993 3,657 1997 7,491 51,283 289 399 1,926 1,980 2,215 2,379 1998 4,877 27,909 77 115 867 470 944 585 1999 6,905 44,262 373 232 2,360 1,359 2,733 1,591 2000 7,318 53,208 259 186 3,157 1,485 3,146 1,671 2001 8,097 62,240 484 361 4,213 2,532 4,697 2,893 2002 7,926 56,327 340 310 3,219 2,546 3,559 2,856 2003 4,561 38,301 158 121 1,799 833 1,957 954 2004 5,198 41,164 203 226 2,205 1,067 2,408 1,293 2005 4,265 34,061 118 96 1,849 905 1,967 1,001 c/ No sample.
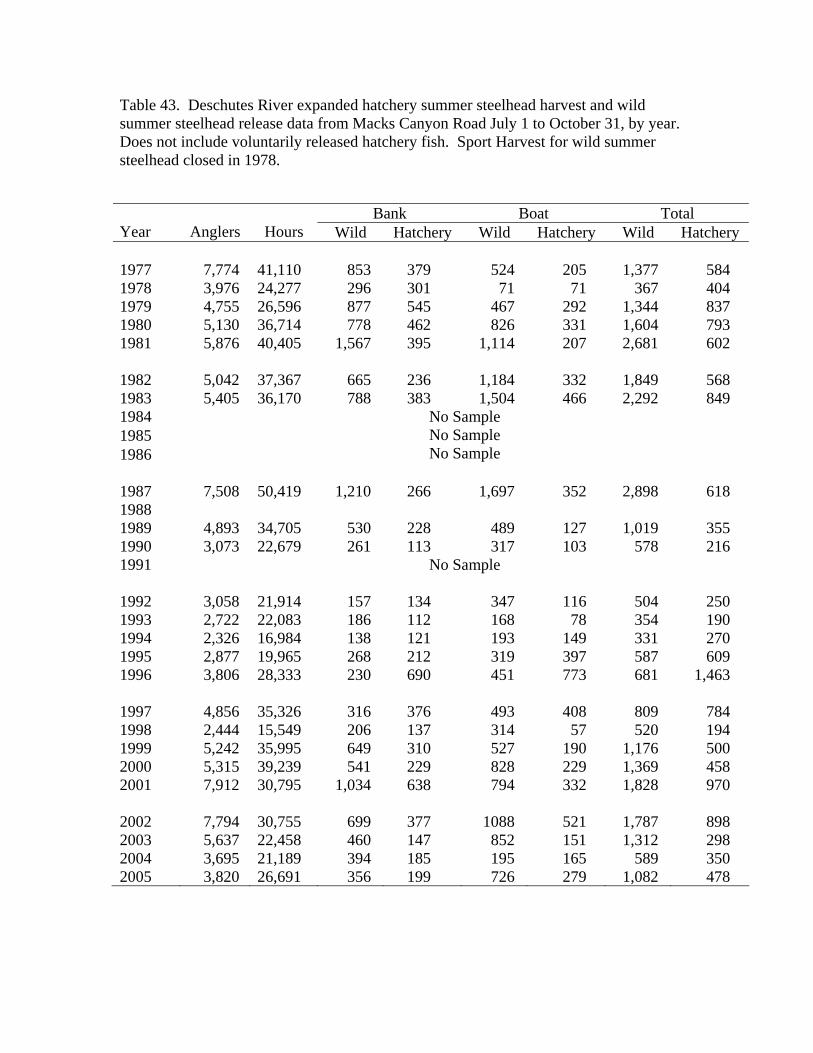
Table 43. Deschutes River expanded hatchery summer steelhead harvest and wild summer steelhead release data from Macks Canyon Road July 1 to October 31, by year. Does not include voluntarily released hatchery fish. Sport Harvest for wild summer steelhead closed in 1978.
Bank Boat Total Year Anglers Hours Wild Hatchery Wild Hatchery Wild Hatchery 1977 7,774 41,110 853 379 524 205 1,377 584 1978 3,976 24,277 296 301 71 71 367 404 1979 4,755 26,596 877 545 467 292 1,344 837 1980 5,130 36,714 778 462 826 331 1,604 793 1981 5,876 40,405 1,567 395 1,114 207 2,681 602 1982 5,042 37,367 665 236 1,184 332 1,849 568 1983 5,405 36,170 788 383 1,504 466 2,292 849 1984 1985 1986
No Sample No Sample No Sample
1987 7,508 50,419 1,210 266 1,697 352 2,898 618 1988 1989 4,893 34,705 530 228 489 127 1,019 355 1990 3,073 22,679 261 113 317 103 578 216 1991 No Sample 1992 3,058 21,914 157 134 347 116 504 250 1993 2,722 22,083 186 112 168 78 354 190 1994 2,326 16,984 138 121 193 149 331 270 1995 2,877 19,965 268 212 319 397 587 609 1996 3,806 28,333 230 690 451 773 681 1,463 1997 4,856 35,326 316 376 493 408 809 784 1998 2,444 15,549 206 137 314 57 520 194 1999 5,242 35,995 649 310 527 190 1,176 500 2000 5,315 39,239 541 229 828 229 1,369 458 2001 7,912 30,795 1,034 638 794 332 1,828 970 2002 7,794 30,755 699 377 1088 521 1,787 898 2003 5,637 22,458 460 147 852 151 1,312 298 2004 3,695 21,189 394 185 195 165 589 350 2005 3,820 26,691 356 199 726 279 1,082 478

Table 44. Number of wild and hatchery summer steelhead captured per 100 angler hours, by year. Does not include hatchery steelhead voluntarily released. Weekday and weekend data expansions are combined.
Fish per 100 Angler Hours Mouth Macks Canyon Total
Year Wild Hatchery Wild Hatchery W : H
1977 4.71 1.28 3.35 1.42 N/A 1978 No Sample 1.51 1.66 N/A 1979 No Sample 5.05 3.15 N/A 1980 7.63 2.42 4.37 2.16 N/A 1981 7.08 1.59 6.64 1.49 N/A N/A 1982 7.23 1.62 4.95 1.52 N/A 1983* 9.36 2.69 6.34 2.35 N/A 1984 No Sample No Sample N/A 1985 No Sample No Sample N/A 1986 No Sample No Sample 1.94 : 1 1987 9.50 2.28 5.75 1.23 4.08 : 1 1988* Incomplete Sample No Sample 3.30 : 1 1989 6.01 3.69 2.94 1.02 1.93 : 1 1990 3.13 2.60 2.55 0.95 1.31 : 1 1991 6.17 3.31 No Sample 1.68 : 1 1992 3.40 3.11 2.30 1.32 1.02 : 1 1993 3.93 2.83 1.60 0.86 1.45 : 1 1994 2.36 2.96 1.95 0.94 0.96 : 1 1995 3.30 3.96 2.62 2.27 0.91 : 1 1996 4.33 8.00 2.40 5.16 0.52 : 1 1997 4.29 4.61 2.29 2.22 0.96 : 1 1998 3.38 2.10 2.02 0.37 1.88 : 1 1999 6.17 3.60 3.43 1.52 1.85 : 1 2000 5.91 3.14 3.49 1.17 2.12 : 1 2001 7.55 4.65 5.93 3.15 1.69 : 1 2002 6.32 5.07 5.81 2.92 1.15 : 1 2003 5.11 2.49 3.43 0.78 2.61 : 1 2004 5.85 3.14 2.78 1.65 1.82 : 1 2005 5.77 2.94 4.05 1.79 2.06 : 1
* Not all statistically expanded creel.

Table 45. Deschutes River expanded hatchery summer steelhead sport harvest and wild summer steelhead sport release data for Sherars Falls, by year (June 16 – October 31). Sport harvest of wild steelhead prohibited after 1978.
Year Anglers Hours Wild Hatchery1980 4,120 21,171 446 3641981 4,869 22,837 473 2541982 5,247 26,061 538 3121983 3,906 19,411 434 8051984 3,522 17,503 528 4541985 4,423 20,262 515 5591986 4,447 20,240 274 4711987 4,607 20,528 402 2261988 3,726 19,514 196 2401989 4,152 17,737 135 1771990 3,165 12,059 79 1851991 890 3,833 59 2161992 0 0 0 01993 0 0 0 01994 0 0 0 01995 0 0 0 01996 0 0 0 01997 0 0 0 01998 2,110 11,738 3 1101999 1,592 11,139 127 562000 2,956 14,154 237 2242001 2,531 11,883 206 2552002 5,079 15,640 227 3462003 2,439 10,943 111 882004 2,759 12,288 78 1142005 3,599 16,847 127 131

Table 46. Deschutes River expanded summer steelhead tribal harvest data for Sherars Falls, by year (June 16 – October 31). Harvest estimates are the dip net and hook and line fisheries combined.
Anglers/ Tribal* Year
Fishers Hours
Wild Hatchery1980 944 7,357 981 1,3091981 605 5,025 688 7721982 516 4,628 549 1,0661983 954 5,131 903 3,2861984 576 5,553 1,600 2,7301985 710 6,126 1,463 2,7281986 523 5,848 1,225 3,7291987 724 4,736 972 1,8001988 744 5,978 339 9391989 973 6,347 529 1,2941990 602 4,232 301 1,3001991 175 930 75 5651992 36 332 10 651993 64 246 15 791994 82 400 12 1301995 114 417 1 851996 80 355 1 1551997 238 1,001 27 4281998 304 1,123 135 7601999 275 1,451 0 4192000 303 1,225 42 6162001 261 1,106 65 7002002 345 1,984 17 5852003 411 1,809 22 2872004 478 1,919 69 5462005 671 3,031 23 505

Table 47. Expanded harvest data from Columbia River anglers sampled at Heritage Landing (Deschutes River), July 1 – October 31, by year. Chinook seasons vary among years. Wild steelhead releases all years.
Chinook Wild Hatchery Steelhead
Year Anglers Hours Adult Jack Adult Jack Wild Hatchery 1987 4,765 23,059 234 30 11 0 157 123 1988 1989 8,594 42,054 601 24 23 0 238 486 1990 4,627 25,736 389 121 21 0 92 451 1991 4,983 32,854 398 37 31 0 529 807 1992 5,059 28,405 226 11 7 0 378 1,217 1993 6,923 42,948 532 17 11 0 434 1,250 1994 4,296 24,955 53 15 4 2 198 699 1995 6,189 40,035 366 54 19 0 280 1,300 1996 4,871 31,258 220 2 11 2 228 752 1997 5,388 34,014 371 13 9 0 216 727 1998 5,560 32,725 509 6 42 6 161 374 1999 6,590 31,640 191 2 0 0 440 604 2000 6,229 32,490 182 33 12 0 686 744 2001 8,946 45,609 478 33 81 2 1,530 1,393 2002 6600 32,472 337 15 6 0 746 684 2003 5,456 27,117 614 4 46 0 429 286 2004 4,608 20,477 396 2 37 1 236 186 2005 4,002 18,458 518 10 12.7 0 546 384

Table 48. Migration timing of summer steelhead captured at the Powerdale Dam trap by origin and run year. Bi-monthly counts are reported from March through December.
March April May June July August September October November December Jan-May Origin,
Run Year 01-15 16-31 01-15 16-30 01-15 16-31 01-15 16-30 01-15 16-31 01-15 16-31 01-15 16-30 01-15 16-31 01-15 16-30 01-15 16-31 Total Wild,
1992-93 0 1 12 6 7 21 31 68 49 49 37 18 17 55 25 24 38 12 2 1 4 477 1993-94 0 1 10 5 8 21 13 21 25 26 14 10 8 5 11 8 1 1 10 0 30 228 1994-95 0 1 3 4 9 7 22 25 32 33 11 1 4 8 2 7 5 0 0 0 9 183 1995-96 0 0 0 0 2 1 4 6 37 19 16 2 5 5 2 8 0 8 0 0 7 122 1996-97 0 0 0 1 3 3 12 17 31 32 14 6 6 5 17 10 7 0 0 1 5 170 1997-98 0 0 0 0 1 1 1 4 6 6 14 2 4 7 9 2 8 0 0 0 0 65 1998-99 0 0 0 1 3 2 5 13 15 17 7 5 5 7 7 4 3 13 1 0 10 118 1999-00 0 0 1 0 1 5 7 6 19 28 11 5 0 8 8 2 35 8 6 0 24 175 2000-01 0 0 1 3 2 12 13 39 20 22 14 9 10 23 3 26 1 0 0 0 4 202 2001-02 1 0 8 19 10 43 37 27 51 35 23 16 11 11 15 48 52 28 7 6 34 447 2002-03 0 2 2 2 10 18 34 38 74 61 27 18 16 23 42 15 28 65 0 13 158 650 2003-04 1 3 5 4 4 15 31 9 24 21 9 21 17 23 10 32 2 8 2 5 9 245 2004-05 1 0 0 1 6 2 8 19 15 17 14 12 12 25 21 23 5 3 2 5 14 205
Subbasin Hatchery, Foster 1992-93 0 8 48 82 131 190 136 279 253 220 136 28 26 55 24 10 15 4 1 4 19 1,669 1993-94 0 1 13 38 83 120 75 151 188 166 113 33 23 8 16 10 0 1 11 0 19 1,069 1994-95 0 4 13 79 124 164 269 299 324 166 26 10 13 17 17 12 12 4 0 0 20 1,573 1995-96 0 0 4 0 5 12 30 31 211 101 52 13 15 5 9 4 1 10 0 2 6 511 1996-97 0 2 39 29 123 153 305 188 259 120 26 15 3 3 9 7 4 0 0 1 7 1,293 1997-98 0 0 0 11 36 59 23 66 109 68 112 21 17 25 9 3 2 0 0 0 3 564 1998-99 0 1 2 21 20 25 88 60 111 103 16 12 19 15 5 7 2 10 0 0 7 524 1999-00 0 0 3 9 2 31 20 64 75 121 65 20 3 3 7 2 10 1 3 0 21 460 2000-01 2 11 43 68 77 179 155 228 170 111 41 22 19 8 0 9 2 0 0 0 5 1,151
2001-02 3 22 48 238 192 323 226 205 162 102 48 16 4 7 14 32 29 54 3 7 29 1,735 2002-03 0 5 21 42 114 142 272 296 298 154 48 27 15 5 27 7 5 16 0 8 68 1,565 2003-04 1 10 54 95 113 170 224 169 137 83 25 17 15 28 29 14 2 2 1 2 33 1,225 2004-05 0 3 37 92 188 161 286 383 215 125 40 28 17 37 22 9 9 4 1 4 37 1,698
Hood River
2000-01 0 0 0 0 0 0 0 0 0 0 1 1 3 1 0 1 0 0 0 0 0 7 2001-02 0 0 0 3 2 10 16 17 30 25 31 9 8 29 35 72 80 26 0 3 29 396 2002-03 0 0 0 3 10 11 36 64 109 90 46 52 43 41 75 20 51 113 2 27 111 904 2003-04 2 0 1 1 10 14 49 38 79 49 22 17 25 52 67 62 5 16 11 9 111 638 2004-05 0 0 0 4 10 5 33 140 122 86 50 40 39 145 99 91 37 13 7 23 43 987

Table 48 (cont). Migration timing of summer steelhead captured at the Powerdale Dam trap by origin and run year. Bi-monthly counts are reported from March through December.
March April May June July August September October November December Jan-May Origin,
Run Year 01-15 16-31 01-15 16-30 01-15 16-31 01-15 16-30 01-15 16-31 01-15 16-31 01-15 16-30 01-15 16-31 01-15 16-30 01-15 16-31 Total Stray Hatchery,
1992-93 0 0 0 0 0 0 0 0 0 1 0 0 0 0 0 0 0 0 0 0 4 51993-94 0 0 0 1 0 0 2 2 3 0 1 2 0 0 1 0 1 0 1 0 1 131994-95 0 0 0 0 0 2 0 1 0 0 0 0 0 0 0 0 0 0 0 0 1 41995-96 0 0 0 0 0 0 0 1 0 2 0 0 0 0 0 0 0 0 0 0 0 51996-97 0 0 0 0 0 0 2 1 2 0 0 2 0 0 1 4 0 0 0 0 2 151997-98 0 0 0 0 0 0 0 0 0 0 1 0 0 0 2 2 0 1 0 0 0 61998-99 0 0 0 0 0 0 0 0 0 1 0 0 2 5 1 0 0 0 0 0 1 111999-00 0 0 0 0 0 0 0 0 0 1 0 0 0 0 0 0 0 0 0 0 0 22000-01 0 0 0 1 1 0 0 0 0 0 0 0 0 5 0 2 0 0 0 0 0 49
2001-02 0 0 0 0 0 0 3 3 1 3 2 0 1 1 1 16 11 0 0 0 2 242002-03 0 0 0 0 0 0 1 0 1 4 0 0 1 2 2 1 3 7 0 6 6 262003-04 0 0 1 0 2 3 3 0 0 1 1 0 0 0 1 1 0 0 0 0 0 132004-05 0 0 1 1 0 1 1 1 2 1 2 0 0 1 1 1 0 0 1 0 12 26
Unknown,
1992-93 1 2 1 0 3 4 1 3 8 4 4 1 4 17 2 4 7 0 0 1 3 701993-94 0 0 0 0 1 0 0 8 16 3 3 4 1 1 0 0 0 0 2 7 461994-95 0 0 1 5 6 11 17 16 16 10 1 0 11 0 1 1 2 0 0 0 1 991995-96 0 0 0 0 0 0 1 4 15 6 13 0 0 1 1 1 0 5 0 0 1 471996-97 0 0 1 0 2 6 14 5 14 17 5 1 3 2 0 3 0 0 0 0 1 751997-98 0 0 1 0 4 4 2 5 7 4 9 1 2 1 1 0 2 0 1 0 0 441998-99 0 0 0 4 5 3 3 3 4 6 2 0 0 1 1 2 2 3 1 1 3 451999-00 0 0 0 0 0 1 2 2 12 8 2 0 0 1 2 0 3 1 1 0 3 362000-01 0 0 0 2 3 2 1 9 3 3 0 3 1 3 1 1 2 0 0 0 4 412001-02 0 0 3 9 7 15 13 10 7 4 2 0 1 0 0 4 0 0 0 0 11 792002-03 0 0 1 1 3 4 12 15 12 6 5 9 1 1 7 6 4 19 0 4 44 1542003-04 1 1 5 3 9 13 29 10 18 9 4 3 5 3 4 10 1 2 0 2 10 1422004-05 0 0 6 24 25 11 36 25 5 2 2 1 0 9 3 5 2 1 0 2 16 175

Table 49. Summer steelhead escapements to the Powerdale Dam trap by origin, run year, and age category. Fish of unknown origin were allocated to origin categories based on scale analysis and the ratio of fish of known origin.
Freshwater/Ocean Age Repeat
Spawners Origin,
Run Year Total Escapement 1/1 2/1 3/1 4/1 1/2 2/2 3/2 4/2 5/2 1/3 2/3 3/3 1/4 2/4
Wild
1992-93 490 0 26 6 0 5 309 77 1 0 0 48 0 0 0 18 1993-94 245 0 11 5 0 1 109 44 0 0 2 53 7 0 3 10 1994-95 218 0 5 2 0 0 81 70 0 0 0 33 12 0 0 15 1995-96 132 0 14 3 0 0 82 11 0 0 0 18 1 0 0 3 1996-97 184 0 6 2 0 2 129 22 0 0 0 14 2 0 0 7 1997-98 81 0 8 1 0 1 44 13 0 0 0 7 0 0 0 7 1998-99 132 0 13 1 0 2 75 15 0 0 0 14 0 0 0 12 1999-00 188 2 26 6 0 1 107 16 0 0 0 19 1 0 0 10 2000-01 221 0 23 6 0 4 101 59 1 0 2 6 2 0 0 17 2001-02 495 4 72 36 0 1 314 33 0 0 1 12 4 0 1 17 2002-03 707 2 52 17 0 24 320 180 4 1 3 49 14 0 0 41 2003-04 266 0 41 12 0 3 111 58 0 0 1 13 4 0 0 23 2004-05 233 0 13 8 0 3 120 50 0 0 0 16 2 0 0 21
Subbasin Hatchery, Foster
1992-93 1,726 48 0 0 0 1,513
0 0 0 0 150 1 0 1 0 13
1993-94 1,098 35 0 0 0 818 0 0 0 0 235 0 0 3 0 7 1994-95 1,624 12 0 0 0 1,34
31 0 0 0 256 0 0 0 0 12
1995-96 546 59 0 0 0 419 1 0 0 0 57 0 0 0 0 10 1996-97 1,344 8 0 0 0 1,24
06 0 0 0 76 0 0 0 0 14
1997-98 594 10 0 0 0 543 0 0 0 0 36 0 0 0 0 5 1998-99 556 25 0 0 0 374 0 0 0 0 140 0 0 0 0 17 1999-00 a/ 485 33 3 0 0 360 0 0 0 0 76 0 0 1 0 12 2000-01 a/ 1,176 34 0 0 0 1,07
72 0 0 0 49 0 0 0 0 14
2001-02 1,879 77 9 0 0 1,442
135 0 0 0 188 5 0 0 0 23
2002-03 1,655 116 5 0 0 1,408
21 0 0 0 75 1 0 0 0 29
2003-04 1,327 65 1 0 0 1,123
5 0 0 0 103 0 0 0 0 30
2004-05 1,835 26 1 0 0 1,680
8 0 0 0 95 1 0 1 0 23
Hood River

2000-01 7 7 0 0 0 0 0 0 0 0 0 0 0 0 0 0 2001-02 417 110 19 0 0 288 0 0 0 0 0 0 0 0 0 0 2002-03 910 31 1 0 0 626 128 0 0 0 100 0 0 0 0 24 2003-04 656 191 2 0 0 368 0 0 0 0 80 0 0 0 0 15 2004-05 996 52 0 0 0 861 1 0 0 0 66 0 0 0 0 16
Table continues

Table 49 (cont). Summer steelhead escapements to the Powerdale Dam trap by origin, run year, and age category. Fish of unknown origin were allocated to origin categories based on scale analysis and the ratio of fish of known origin.
Freshwater/Ocean Age Repeat
Spawners Origin,
Run Year Total Escapement 1/1 2/1 3/1 4/1 1/2 2/2 3/2 4/2 5/2 1/3 2/3 3/3 1/4 2/4
Stray Hatchery, Unknown
1992-93 5 3 0 0 0 2 0 0 0 0 0 0 0 0 0 0 1993-94 13 1 0 0 0 10 0 0 0 0 2 0 0 0 0 0 1994-95 4 0 0 0 0 1 0 0 0 0 3 0 0 0 0 0 1995-96 5 2 0 0 0 0 0 0 0 0 2 0 0 0 0 1 1996-97 18 1 0 0 0 16 0 0 0 0 1 0 0 0 0 0 1997-98 6 2 0 0 0 4 0 0 0 0 0 0 0 0 0 0 1998-99 11 1 0 0 0 8 0 0 0 0 2 0 0 0 0 0 1999-00 a/ 2 0 0 0 0 2 0 0 0 0 0 0 0 0 0 0 2000-01 a/ 11 0 0 0 0 9 1 0 0 0 1 0 0 0 0 0 2001-02 29 0 0 2 0 0 8 0 0 0 14 0 0 0 0 5 2002-03 25 3 0 0 0 9 1 1 0 0 0 4 0 0 0 7 2003-04 12 1 0 0 0 6 1 0 0 0 3 0 0 0 0 1 2004-05 27 6 0 0 0 19 0 0 0 0 1 0 0 0 0 1

Table 50. Number of wild summer steelhead at collected at Powerdale Dam on the Hood River for brood, spawned, and those that were pre-spawning mortalities, by sex, by brood year.
FEMALES MALES Brood Year Taken Died Spawned Taken Died Spawned
1998 11 3 8 5 3 2 1999 21 7 14 13 2 11 2000 21 0 21 12 0 12 2001 16 3 13 11 0 11 2002 33 10 23 33 8 25 2003 44 22 22 37 13 24 2004 26 8 18 15 6 9 2005* 30 3 13 10 2 7 * 14 0f the 40 brood collected were either unacceptable dna, hatchery fish or StW

Table 51. Summary of summer steelhead spawning, Hood River by brood year. Number of smolts represents number transferred to acclimation rather than release.
Year Number Females
Number Males
Family Groups
Number Spawnings
Total Green Eggs
Number Smolts a/
Egg to Smolt %
1998 7 2 10 5 30,218 19,532 64.6% 1999 16 11 22 8 39,727 33,899 85.3% 2000 13 10 26 9 49,789 37,688 75.7% 2001 13 10 27 8 55,145 45,767 83.0% 2002 16 22 32 7 56,936 47,621 83.6% 2003 15 19 29 9 61,828 40,429 65.4% 2004 13 7 36 8 81,214 62,405 76.8% 2005 13 7 26 6 48,820 34,096 69.8% a/ Egg to smolt survival calculated on transfer number not liberated from acclimation. Number
of smolts shown is number delivered to acclimation, not number liberated from acclimation.

Table 52. Bi-monthly counts of upstream migrant adult winter steelhead at Powerdale Dam, Hood River, by run year.
November December January February March April May June Total Origin,
Run Year 01-15 16-31 01-15 16-31 01-15 16-29 01-15 16-31 01-15 16-30 01-15 16-30 01-15 16-31 01-15 16-30 Wild,
1991-92 0 0 0 0 0 24 28 32 75 98 153 149 88 29 2 0 678 1992-93 0 0 0 4 0 2 3 0 28 61 99 78 86 30 3 2 396 1993-94 0 0 0 0 4 7 0 6 23 25 77 128 76 21 11 0 378 1994-95 0 0 0 0 0 0 9 0 6 2 55 15 52 44 10 1 194 1995-96 0 0 0 0 0 0 0 0 17 4 93 40 69 36 11 0 270 1996-97 0 0 0 2 1 0 3 13 5 22 52 72 68 33 3 0 274 1997-98 1 0 1 0 1 1 6 0 7 12 23 107 36 8 5 1 208 1998-99 0 0 0 0 13 0 4 2 8 32 47 121 22 33 7 2 291 1999-00 0 0 8 1 0 2 15 16 69 111 320 225 115 26 1 0 909 2000-01 0 0 0 0 0 0 1 7 50 143 314 381 86 19 0 1 1,002 2001-02 1 2 3 0 9 3 13 63 71 198 282 267 104 21 7 0 1,041 2002-03 0 0 0 1 3 3 9 14 68 228 250 88 43 10 0 0 717 2003-04 0 1 0 7 0 2 8 41 69 115 154 126 49 5 1 0 578 2004-05 0 5 0 8 0 15 2 0 36 51 81 88 36 9 2 0 333
Subbasin Hatchery, a/
1991-92 0 0 0 5 11 94 54 42 30 5 2 2 0 0 0 0 245 1992-93 0 0 2 13 0 31 44 0 39 31 17 13 3 0 0 0 194 1993-94 0 0 0 0 25 31 8 36 32 6 3 2 0 0 0 0 143 1994-95 0 0 0 0 0 6 28 18 11 4 22 3 7 1 0 0 100 1995-96 0 2 2 0 0 0 0 0 0 19 8 93 47 66 21 3 0 259 1996-97 0 0 0 0 0 1 2 38 20 54 128 171 141 54 8 0 671 1997-98 5 1 6 0 1 0 6 5 26 55 85 146 27 5 1 0 363 1998-99 3 5 18 0 1 10 0 4 0 6 65 75 88 12 23 1 2 304 1999-00 5 1 8 0 2 1 12 13 35 45 83 53 228 10 0 0 290 2000-01 0 0 0 0 2 0 2 10 71 224 308 217 51 11 1 0 895 2001-02b/ 0 3 3 0 27 22 40 70 102 178 243 172 42 3 2 0 904 2002-03 0 1 1 0 1 8 14 13 47 163 133 64 19 6 0 0 469 2003-04 0 1 2 20 0 14 22 52 103 206 186 183 101 26 5 1 922 2004-05 1 9 5 28 1 55 2 0 31 67 95 97 49 10 1 1 452
Table continues

Table 52 (cont). Bi-monthly counts of upstream migrant adult winter steelhead at Powerdale Dam, Hood River, by run year.
November December January February March April May June Origin, Run Year 01-15 16-31 01-15 16-31 01-15 16-29 01-15 16-31 01-15 16-30 01-15 16-30 01-15 16-31 01-15 16-30 Total
Stray Hatchery,
1991-92 0 0 0 0 0 2 2 1 5 4 7 1 0 0 0 0 22 1992-93 0 0 0 0 0 1 2 0 2 9 7 1 0 0 0 0 22 1993-94 0 0 0 0 1 0 0 0 1 1 11 6 0 0 0 0 20 1994-95 0 0 0 0 0 0 0 1 1 1 0 0 0 0 0 0 3 1995-96 0 0 0 0 0 0 0 0 3 1 2 0 0 0 0 0 6 1996-97 0 0 0 0 0 0 0 0 0 0 0 1 0 0 1 0 2 1997-98 0 0 0 0 0 0 1 0 0 1 0 0 1 0 0 0 3 1998-99 0 0 0 0 1 0 0 0 0 2 1 2 0 0 0 0 6 1999-00 0 0 0 0 0 0 0 0 1 0 0 0 0 0 0 0 1 2000-01 0 0 0 0 0 0 0 3 3 15 7 8 2 0 0 0 38 2001-02 0 0 0 1 8 3 7 12 11 17 25 10 2 1 0 0 97 2002-03 0 0 0 0 0 3 2 4 6 18 23 9 1 0 0 0 66 2003-04 0 0 0 2 0 0 1 1 7 10 7 7 2 0 0 0 37 2004-05 1 0 0 0 0 2 0 0 0 2 5 4 3 0 0 0 17
Unknown 1991-92 0 0 1 4 4 22 9 7 6 5 3 9 4 2 0 0 71 1992-93 0 0 0 0 0 7 7 0 6 5 4 2 3 0 0 0 39 1993-94 0 0 0 1 6 3 0 1 6 8 5 5 3 2 0 0 39 1994-95 0 0 0 0 0 0 5 3 0 0 4 1 2 2 2 0 20 1995-96 0 0 0 0 0 0 0 0 2 1 9 5 5 3 0 0 25 1996-97 0 0 0 0 0 0 0 5 1 6 8 8 7 4 1 0 40 1997-98 0 0 0 0 0 0 0 4 9 5 11 11 5 1 0 0 46 1998-99 0 0 1 0 1 1 0 0 1 2 7 7 1 2 0 0 23 1999-00 0 1 1 0 0 0 0 3 0 2 5 5 6 0 0 0 27 2000-01 0 0 0 0 0 0 0 0 4 6 15 9 1 0 0 0 35 2001-02 0 0 0 0 2 0 6 4 6 11 19 13 2 0 0 0 63 2002-03 0 0 0 0 1 1 0 5 10 10 20 14 3 3 0 0 67 2003-04 0 0 0 1 0 2 2 9 13 20 25 18 2 4 1 0 97 2004-05 0 0 0 3 0 4 0 0 3 8 10 12 3 0 0 0 43
a/ Subbasin hatchery includes Big Creek stock 1991-92 through 1994-95, mixed Big Creek x Hood River stock 1992-93 through 1995 and Hood River stock 1993-94 through present run.
b/ Includes steelhead with winter fin marks classified as summer steelhead.

Table 53. Winter steelhead escapements to the Powerdale Dam trap by origin, stock, run year, and age category. Fish of unknown origin were allocated to origin categories based on scale analysis and the ratio of fish of known origin.
Freshwater/Ocean Age
Origin, Stock,
Run Year Total
Escapement 1/1 1/2 1/3 1/4 2/1 2/2 2/3 2/4 3/1 3/2 3/3 3/4 4/2 Repeat
Spawners
Wild, Hood River,
1991-92 698 -- 3 4 0 9 424 76 0 1 111 17 0 1 52 1992-93 412 -- 2 6 0 36 174 123 1 1 20 17 0 0 32 1993-94 405 -- 2 6 0 9 274 79 0 1 17 4 0 0 13 1994-95 206 -- 1 1 0 28 107 34 1 3 9 3 1 0 18 1995-96 278 -- 12 1 1 18 183 29 0 1 22 6 0 0 7 1996-97 280 -- 1 1 0 12 199 34 0 1 24 7 0 1 7 1997-98 227 -- 1 0 0 13 134 42 0 3 20 4 0 0 11 1998-99 300 -- 8 0 0 55 156 38 0 2 23 10 0 0 8 1999-00 927 -- 4 1 0 6 795 45 1 1 41 2 0 0 31 2000-01 1,017 -- 3 1 0 21 587 128 1 16 111 13 0 1 134 2001-02 1,061 -- 12 5 0 23 609 139 0 9 204 24 0 0 36 2002-03 711 -- 12 5 0 12 411 171 0 3 69 31 0 0 39 2003-04 599 -- 18 4 0 7 359 88 1 0 73 21 0 0 28 2004-05 344 -- 4 12 0 8 196 59 0 2 47 7 0 0 9
Subbasin hatchery, Big Creek,
1991-92 296 -- 279 5 -- -- 5 1 -- -- -- -- -- -- 5 1992-93 201 -- 63 138 -- -- 0 0 -- -- -- -- -- -- 8 1993-94 137 -- 0 65 -- -- 66 0 -- -- -- -- -- -- 4 1994-95 10 -- 0 0 -- -- 0 7 -- -- -- -- -- -- 3
Mixed, a/ 1992-93 6 6 0 0 -- -- 0 -- -- -- -- -- -- -- -- 1993-94 14 0 14 0 -- -- 0 -- -- -- -- -- -- -- -- 1994-95 8 0 0 2 -- -- 6 -- -- -- -- -- -- -- --
Table continues

Table 53 (cont). Winter steelhead escapements to the Powerdale Dam trap by origin, stock, run year, and age category. Fish of unknown origin were allocated to origin categories based on scale analysis and the ratio of fish of known origin.
Freshwater/Ocean Age
Origin, Stock,
Run Year Total
Escapement 1/1 1/2 1/3 1/4 2/1 2/2 2/3 2/4 3/1 3/2 3/3 3/4 4/2 Repeat
SpawnersHood River, b/
1993-94 1 1 0 0 0 0 0 0 -- -- -- -- -- -- 0 1994-95 90 12 77 0 0 0 0 0 -- -- -- -- -- -- 1 1995-96 274 10 246 17 0 0 0 0 -- -- -- -- -- -- 0 1996-97 637 6 524 100 0 0 4 0 -- -- -- -- -- -- 4 1997-98 390 4 242 128 0 0 3 1 -- -- -- -- -- -- 12 1998-99 311 12 165 120 1 1 8 0 -- -- -- -- -- -- 11 1999-00 299 6 218 51 1 0 8 5 1 -- -- -- -- -- 15 2000-01 915 7 704 159 0 2 6 0 -- -- -- -- -- -- 36 2001-02 936 3 715 196 0 3 7 0 -- -- -- -- -- -- 12 2002-03 503 11 285 185 0 1 8 3 -- -- -- -- -- -- 10 2003-04 998 3 857 119 1 1 5 0 -- -- -- -- -- -- 12 2004-05 482 16 236 207 1 0 3 0 0 -- -- -- -- -- 19
Stray hatchery,
Unknown,
1991-92 22 0 8 13 0 -- 0 -- -- -- -- -- -- -- 1 1992-93 22 0 15 5 0 -- 0 -- -- -- -- -- -- -- 2 1993-94 24 1 2 21 1 -- 1 -- -- -- -- -- -- -- 1 1994-95 3 1 1 2 0 -- 0 -- -- -- -- -- -- -- 0 1995-96 6 0 5 0 0 -- 0 -- -- -- -- -- -- -- 1 1996-97 3 0 3 0 0 -- 0 -- -- -- -- -- -- -- 0 1997-98 3 1 2 0 -- 1 -- -- -- -- -- -- -- 0 1998-99 6 0 2 4 0 -- 0 -- -- -- -- -- -- -- 0 1999-00 1 0 0 0 1 0 0 2000-01 38 0 16 10 0 1 9 1 -- -- -- -- -- -- 1 2001-02c/ 103 0 39 51 0 0 36 6 -- -- -- -- -- -- 8 2002-03 68 0 39 19 0 0 1 3 -- -- -- -- -- -- 6 2003-04 37 0 12 13 1 0 2 1 -- -- -- -- -- -- 8 2004-05 17 2 4 8 0 0 0 0 -- -- -- -- -- -- 3
a/ Returns from the 1991 brood are progeny of wild x Big Creek stock hatchery crosses. b/ The 1993-94 run year is the first run year in which the native Hood River stock (1992 brood) would have had the potential for
returning as adults to Powerdale Dam. These fish would have returned as age category 1/1 adults. None were sampled at the trapping facility.
c/ Includes steelhead with winter fin marks classified as summer steelhead.

Table 54. Summary of winter steelhead spawning, Hood River by brood year. Number of smolts represents number transferred to acclimation rather than release.
Year Number Females
Number Males
Family Groups
Number Spawning
Total Green Eggs
Number Smolts b/
Egg to Smolt %
1991 a/ 3 1 3 2 11,858 4,600 38.8% 1992 18 21 57 6 53,308 48,985 91.9% 1993 16 18 78 6 62,150 38,034 61.2% 1994 26 28 70 8 95,043 42,898 45.1% 1995 18 19 47 8 63,793 51,022 80.0% 1996 25 29 60 10 85,497 60,318 70.6% 1997 c/ 26 28 51 8 91,000 62,136 68.2% 1998 21 20 37 8 80,620 50,915 63.2% 1999 d/ 28 33 55 9 96,525 66,056 68.4% 2000 20 20 21 8 83,510 56,586 61.8% 2001 24 35 38 e/ 10 89,756 f/ 50,948 56.8% 2002 21 25 43 8 83,992 51,569 61.4% 2003 22 22 34 8 87,339 -- -- 2004 22 24 43 8 89,759 79,486 88.6% 2005 12 13 23 6 43,910 34,875 79.4% a/ Angler captured brood stock. b/ Egg to smolt survival calculated on transfer number not liberated from acclimation. Number of smolts
shown is number delivered to acclimation, not number liberated from acclimation. c/ 102,465 green eggs transferred to Umatilla Hatchery. INH positives and scale read hatchery eggs culled
down to 91,000 eyed eggs. d/ Total egg take was 112,302. Culled down to 96,525 and that number was used to calculate egg to smolt
survival. e/ Started with 50 family groups but culled 6 family groups (3 females) that were 100% non-fertile and 6
family groups from 2 females determined to be hatchery origin and 1 female determined to be a summer steelhead.

Table 55. Number of winter steelhead collected for brood, spawned, and those that were prespawning mortalities, by sex, by brood year. Number in parentheses ( ) is the number of wild winter steelhead in the total.
FEMALES MALES Taken Spawned Died Taken Spawned Died Brood
Year 1991 13 (7) 3 (1) 10 (7) 5 (5) 1 (1) 4 (4) 1992 52 (52) 18 (18) 0 (0) 51 (51) 21 (21) 0 (0) 1993 28 (28) 16 (16) 2 (2) 29 (29) 18 (18) 7 (7) 1994 45 (45) 26 (26) 3 (3) 34 (34) 28 (28) 1 (1) 1995 20 (20) 18 (18) 2 (2) 22 (22) 19 (19) 0 (0) 1996 43 (34) 24 (19) 2 (2) 46 (34) 29 (17) 5 (5) 1997 41 (26) 27 (17) 5 (4) 41 (22) 28 (15) 8 (5) 1998 45 (23) 21 (11) 13 (7) 34 (19) 20 (12) 10 (4) 1999 42 (21) 29 (14) 0 (0) 33 (20) 33 (20) 0 (0) 2000 53 (27) 20 (10) 1 (0) 30 (20) 20 (15) 0 (0) 2001 65 (65) 24 (24) 0a/ (0a/) 69 (69) 35 (35) 0 (0) 2002 39 (39) 21 (21) 7a/ (7a/) 35 (35) 25 (25) 1b/ (1b/)2003 35 (33) 22 (21) 1 (1) 31 (30) 22 (22) 9 (8) 2004 42 (36) 22 (36) 0 (0) 41 (39) 24 (40) 0 (0) 2005 35 (29) 14 (12) 2 (2/d) 37 (30) 16 (13) 2 (2c) a/ Three additional females were post spawn mortality. b/ Three additional males were post spawn mortality. c/ 1 pre-spawn and 1 post spawn mortality d/ 1 pre-spawn and 1 post spawn female mortality

Table 56. Winter steelhead redd counts in the Fifteenmile Creek sub basin, by stream, reach, and random section length, 2005. Number of Redds
Stream Sub Reaches Length (mi.) Pass 1 Pass 2 Pass 3 Total Redds/mi.
Eightmile Creek 8 1-5 0.49 0 0 0 0 8 2-1 0.71 3 1 0 4 8 3-3 1.19 0 0 0 0 8 3-4 1.24 0 2 0 2 8 4-1 0.44 0 0 0 0 8 4-2 0.88 0 0 1 1 8 5-3 0.99 2 3 0 5
Subtotal 5.95 12 2.0 Fivemile Creek 5 1-5 1.17 1 0 0 1 5 2-5 0.75 0 0 1 1 5 3-1 1.08 0 0 0 0 5 4-4 0.82 0 0 0 0
Subtotal 3.81 2 0.5 Fifteenmile Creek 15 1-1 1.00 0 0 0 0 15 2-5 1.38 0 2 0 2 15 3-1 0.85 0 0 0 0 15 4-3 1.02 0 0 0 0 15 5-2 1.02 1 0 0 1 15 6-2 0.98 1 1 0 2 15 7-1 0.77 2 0 0 2 15 7-3 1.46 2 0 1 3 15 8-3 1.24 7 0 10 17 15 8-4 0.77 0 7 3 10 15 9-5 1.30 0 0 0
Subtotal 11.78 37 3.1 Ramsey Creek R 1-2 1.06 0 0 0 0 R 1-5 1.00 0 0 0 0 R 2-3 1.00 0 0 0 0
Subtotal 3.06 0 0.0 Total 24.60 51 2.1

Table 57. Deschutes River rainbow angler effort and harvest data sampled at the mouth, west bank (Heritage Landing), July 1 – October 31, by year.
Rainbow Trout Year Anglers Hours Kept Released Total Fish/Hour 1989 234 1,398 65 1,319 1,384 0.99 1990 95 1,079 21 470 491 0.46 1991 214 1,690 33 1,359 1,392 0.82 1992 188 1,578 13 1,453 1,466 0.93
1993 392 3,071 34 1,453 1,487 0.47 1994 355 2,207 13 1,055 1,068 0.48 1995 354 1,790 6 1,142 1,148 0.64 1996 272 1,343 6 603 609 0.45
1997 223 1,162 2 478 481 0.41 1998 250 973 3 634 637 0.65 1999 220 1,475 0 1,727 1,727 1.17 2000 291 1,671 19 1,573 1,592 0.95
2001 410 2,149 33 2,116 2,149 1.00 2002 323 967 14 1,146 1,160 1.20 2003 149 2,289 7 694 701 0.31 2004 150 950 0 982 982 1.03 2005 250 824 3 552 555 1.48

Table 58. Deschutes River expanded rainbow trout angler effort and harvest data from Macks Canyon Road sample, July 1 to October 31, by year.
Rainbow Trout
Year Anglers Hours Kept Released Total Fish/Hour 1989 2,198 10,601 515 6,909 7,424 0.70 1990 1,941 9,180 443 6,037 6,480 0.71 1991 1992 1,246 7,188 153 3,160 3,313 0.46
1993 1,772 8,781 98 3,887 3,985 0.45 1994 2,268 10,456 151 6,538 6,690 0.64 1995 2,985 15,225 172 7,189 7,361 0.48 1996 2,431 12,591 106 5,800 5,906 0.46
1997 2,466 11,647 84 5,147 5,231 0.45 1998 1,790 7,395 55 4,555 4,610 0.62 1999 2,609 9,910 102 5,785 5,887 0.59 2000 2,936 12,523 71 7,879 7,950 0.64
2001 2,844 7,794 152 7,490 7,642 0.98 2002 2,870 8,375 135 8,098 8,233 0.98 2003 2,279 7,568 130 6,406 6,536 0.86 2004 1,476 8,022 26 3,920 3,946 0.49
2005 1,493 7,367 35 4,708 4,743 0.64
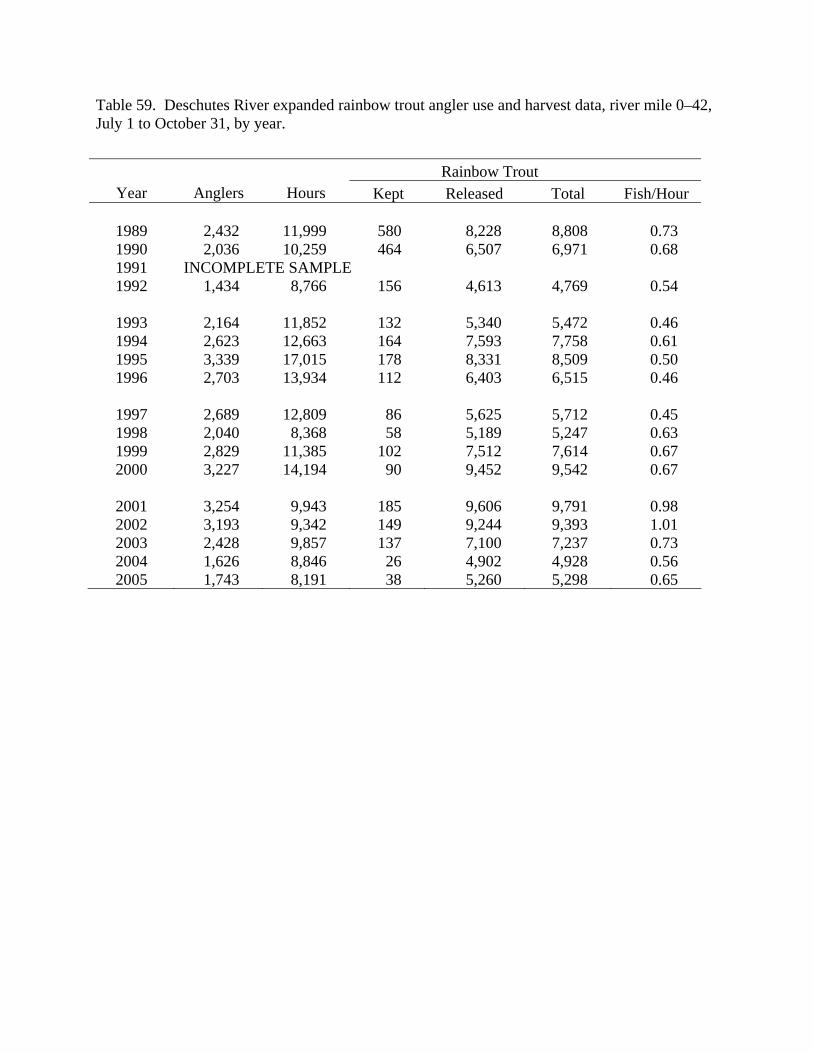
Table 59. Deschutes River expanded rainbow trout angler use and harvest data, river mile 0–42, July 1 to October 31, by year.
Rainbow Trout
Year Anglers Hours Kept Released Total Fish/Hour
1989 2,432 11,999 580 8,228 8,808 0.73 1990 2,036 10,259 464 6,507 6,971 0.68 1991 INCOMPLETE SAMPLE 1992 1,434 8,766 156 4,613 4,769 0.54
1993 2,164 11,852 132 5,340 5,472 0.46 1994 2,623 12,663 164 7,593 7,758 0.61 1995 3,339 17,015 178 8,331 8,509 0.50 1996 2,703 13,934 112 6,403 6,515 0.46
1997 2,689 12,809 86 5,625 5,712 0.45 1998 2,040 8,368 58 5,189 5,247 0.63 1999 2,829 11,385 102 7,512 7,614 0.67 2000 3,227 14,194 90 9,452 9,542 0.67
2001 3,254 9,943 185 9,606 9,791 0.98 2002 3,193 9,342 149 9,244 9,393 1.01 2003 2,428 9,857 137 7,100 7,237 0.73 2004 1,626 8,846 26 4,902 4,928 0.56 2005 1,743 8,191 38 5,260 5,298 0.65

Table 60. Bull trout capture at the Powerdale Trap, 1963 through 1971. Data does not represent continuous trapping efforts.
Year Period Number 1963 April-May 3 May-June 2 June-July 1 1964 May-June 5 Unknown 4 1965 June-July 1 Unknown 2 1966 Unknown 1 1967 May-June 1 June 2 July 1 September 1 October-November 1 Unknown 6 1968 May-June 6 June-July 3 1969 May-June 5 1970 0 1971 May-June 1

Table 62. Number of bull trout captured, range length and mean in centimeters at the Powerdale Fish Trap, by year.
Length Year Captured Range Mean1992 6 40-56.5 49.0 1993 2 48-55.5 51.8 1994 11 24.3-55.5 39.9 1995 11 39.0-51.5 47.3 1996 18 48.5-55.5 51.5 1997 6 42.0-61.5 49.2 1998 18 35.5-60.0 42.5 1999 28 38.0-55.5 49.4 2000 27 38.0-63.0 51.3 2001 12 35.0-55.0 46.7 2002 6 33.5-59.0 50.6 2003 4 43.0-61.0 50.0 2004 4 50.0-56.0 52.5 2005 6 50.0-60.5 55.1