Embed Size (px)
Citation preview
Annual Report 2009 I 2010
KWS Saat aG
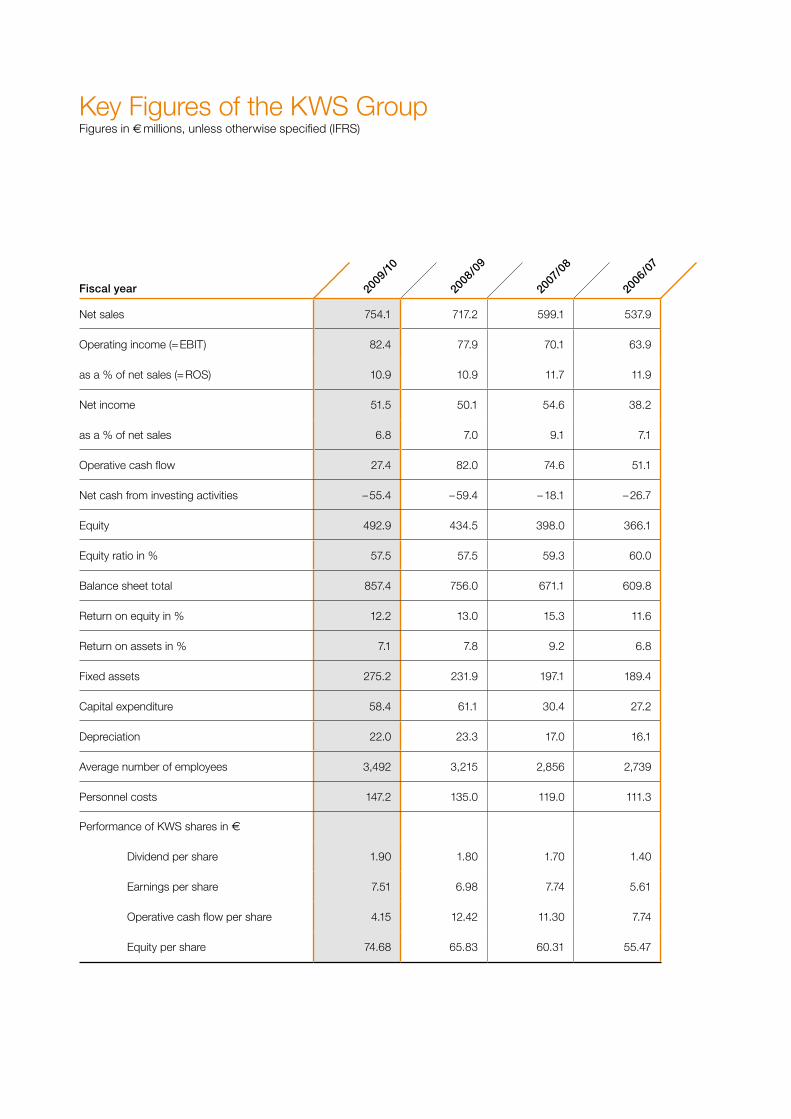
Key Figures of the KWS Group Figures in € millions, unless otherwise specified (IFRS)
2009
/10
2008
/09
2007
/08
2006
/07
Fiscal year
Net sales 754.1 717.2 599.1 537.9
Operating income (= EBIT) 82.4 77.9 70.1 63.9
as a % of net sales (= ROS) 10.9 10.9 11.7 11.9
Net income 51.5 50.1 54.6 38.2
as a % of net sales 6.8 7.0 9.1 7.1
Operative cash flow 27.4 82.0 74.6 51.1
Net cash from investing activities – 55.4 – 59.4 – 18.1 – 26.7
Equity 492.9 434.5 398.0 366.1
Equity ratio in % 57.5 57.5 59.3 60.0
Balance sheet total 857.4 756.0 671.1 609.8
Return on equity in % 12.2 13.0 15.3 11.6
Return on assets in % 7.1 7.8 9.2 6.8
Fixed assets 275.2 231.9 197.1 189.4
Capital expenditure 58.4 61.1 30.4 27.2
Depreciation 22.0 23.3 17.0 16.1
Average number of employees 3,492 3,215 2,856 2,739
Personnel costs 147.2 135.0 119.0 111.3
Performance of KWS shares in €
Dividend per share 1.90 1.80 1.70 1.40
Earnings per share 7.51 6.98 7.74 5.61
Operative cash flow per share 4.15 12.42 11.30 7.74
Equity per share 74.68 65.83 60.31 55.47
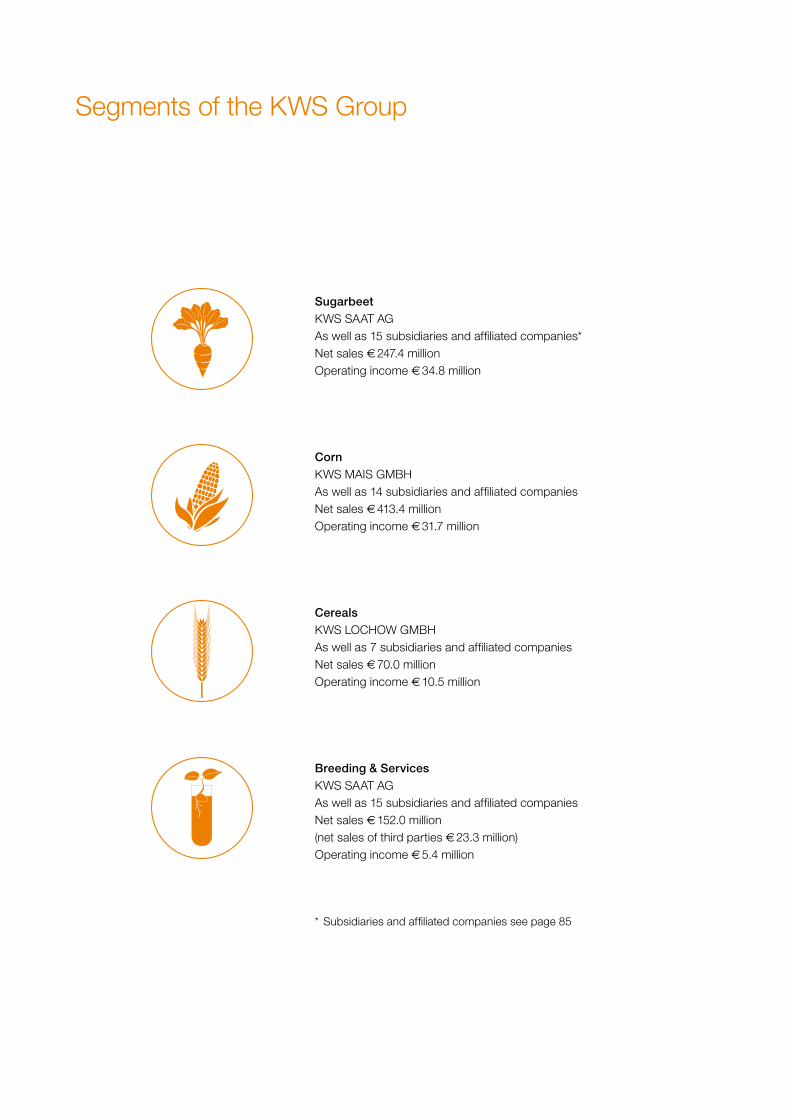
Segments of the KWS Group
Sugarbeet KWS SAAT AG As well as 15 subsidiaries and affiliated companies* Net sales € 247.4 million Operating income € 34.8 million
Corn KWS MAIS GMBH As well as 14 subsidiaries and affiliated companies Net sales € 413.4 millionOperating income € 31.7 million
Cereals KWS LOCHOW GMBH As well as 7 subsidiaries and affiliated companies Net sales € 70.0 million Operating income € 10.5 million
Breeding & Services KWS SAAT AG As well as 15 subsidiaries and affiliated companies Net sales € 152.0 million (net sales of third parties € 23.3 million) Operating income € 5.4 million
* Subsidiaries and affiliated companies see page 85
Table of contents
A tribute to Carl-Ernst Büchting 6
Foreword of the Executive Board 9
Spotlight topic: China – a growing giant 10
Report of the Supervisory Board 14
Corporate Governance Report 17
Compliance declaration in accordance with Section 161 AktG(German Stock Corporation Act) 18
Compensation Report 19
The KWS share 22
Agenda of the Annual Shareholders’ Meeting/Financial calendar 23
Management Report of the KWS Group 26
• Sugarbeet Segment 32
• Corn Segment 34
• Cereals Segment 36
• Breeding & Services Segment 40
• Outlook for the fiscal year 2010/2011 43
• Employees 46
• Risks and chances for future development 49
• Disclosures in accordance with Section 315 (4) HGB (German Commercial Code) 52
Annual Financial Statements of the KWS Group 53
Auditors’ Report 87
Table of contents I 5
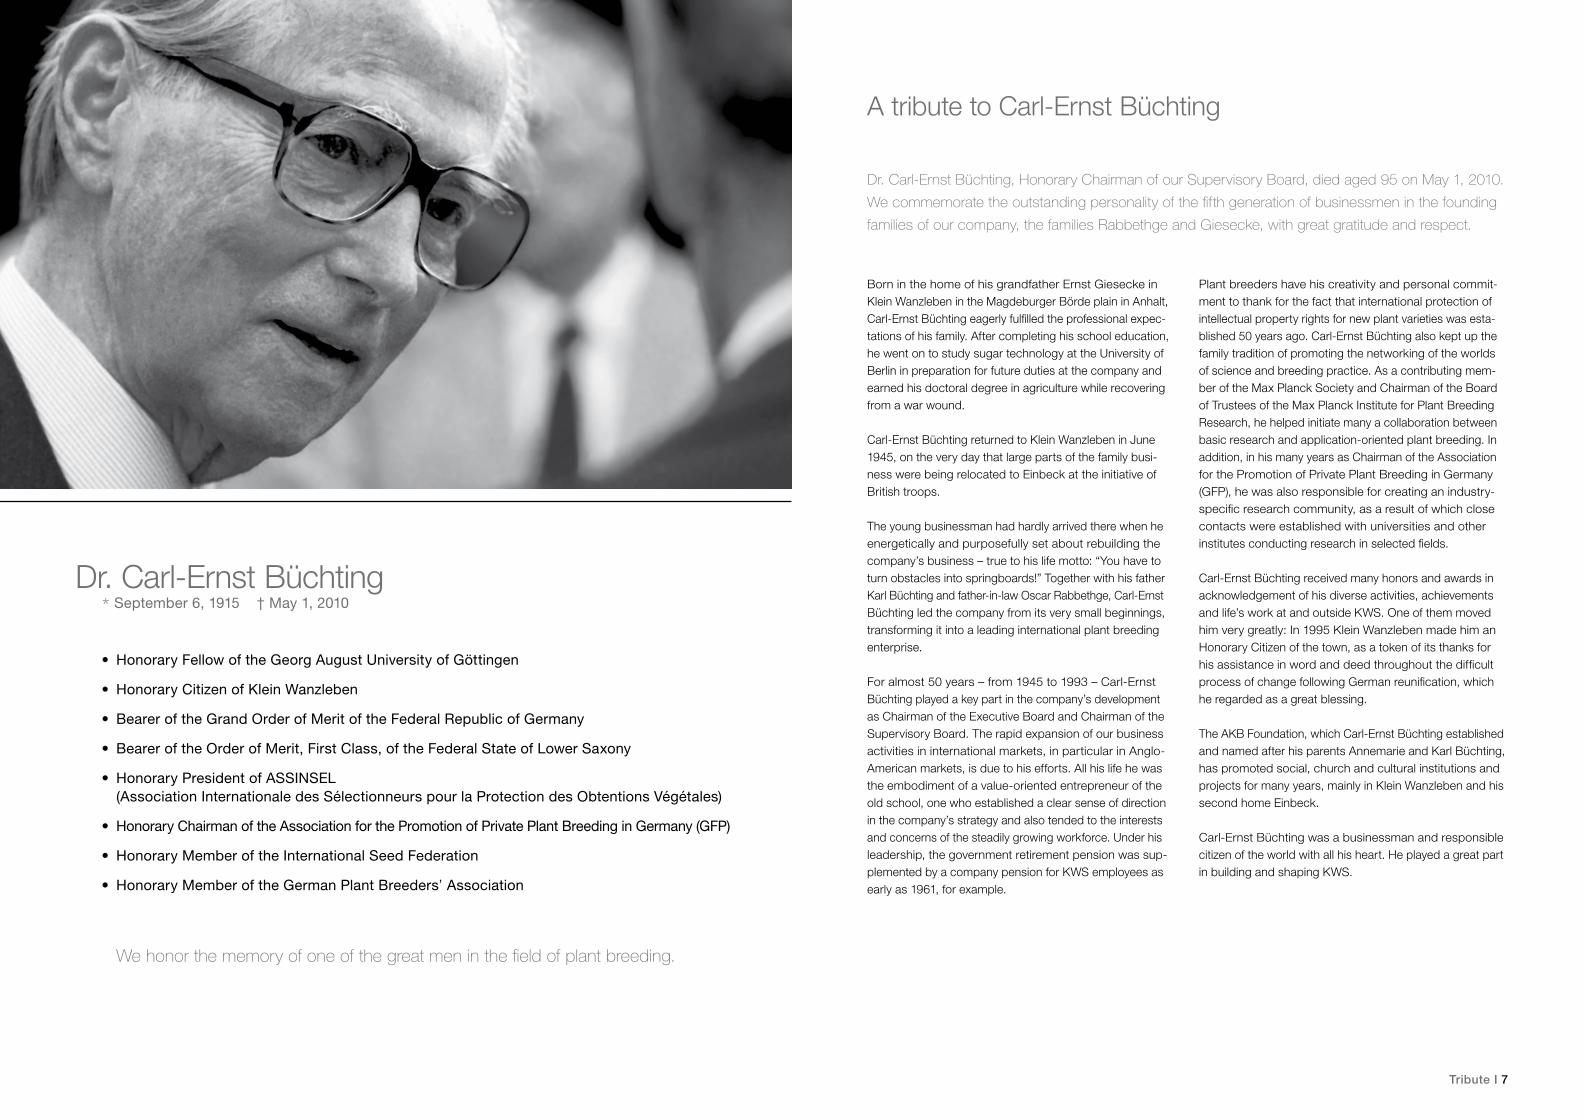
We honor the memory of one of the great men in the field of plant breeding.
Dr. Carl-Ernst Büchting* September 6, 1915 † May 1, 2010
• Honorary Fellow of the Georg August University of Göttingen
• Honorary Citizen of Klein Wanzleben
• Bearer of the Grand Order of Merit of the Federal Republic of Germany
• Bearer of the Order of Merit, First Class, of the Federal State of Lower Saxony
• Honorary President of ASSINSEL (Association Internationale des Sélectionneurs pour la Protection des Obtentions Végétales)
• Honorary Chairman of the Association for the Promotion of Private Plant Breeding in Germany (GFP)
• Honorary Member of the International Seed Federation
• Honorary Member of the German Plant Breeders’ Association
Tribute I 7
A tribute to Carl-Ernst Büchting
Born in the home of his grandfather Ernst Giesecke in Klein Wanzleben in the Magdeburger Börde plain in Anhalt, Carl-Ernst Büchting eagerly fulfilled the professional expec-tations of his family. After completing his school education, he went on to study sugar technology at the University of Berlin in preparation for future duties at the company and earned his doctoral degree in agriculture while recovering from a war wound.
Carl-Ernst Büchting returned to Klein Wanzleben in June 1945, on the very day that large parts of the family busi-ness were being relocated to Einbeck at the initiative of British troops.
The young businessman had hardly arrived there when he energetically and purposefully set about rebuilding the company’s business – true to his life motto: “You have to turn obstacles into springboards!” Together with his father Karl Büchting and father-in-law Oscar Rabbethge, Carl-Ernst Büchting led the company from its very small beginnings, transforming it into a leading international plant breeding enterprise.
For almost 50 years – from 1945 to 1993 – Carl-Ernst Büchting played a key part in the company’s development as Chairman of the Executive Board and Chairman of the Supervisory Board. The rapid expansion of our business activities in international markets, in particular in Anglo-American markets, is due to his efforts. All his life he was the embodiment of a value-oriented entrepreneur of the old school, one who established a clear sense of direction in the company’s strategy and also tended to the interests and concerns of the steadily growing workforce. Under his leadership, the government retirement pension was sup-plemented by a company pension for KWS employees as early as 1961, for example.
Plant breeders have his creativity and personal commit-ment to thank for the fact that international protection of intellectual property rights for new plant varieties was esta-blished 50 years ago. Carl-Ernst Büchting also kept up the family tradition of promoting the networking of the worlds of science and breeding practice. As a contributing mem-ber of the Max Planck Society and Chairman of the Board of Trustees of the Max Planck Institute for Plant Breeding Research, he helped initiate many a collaboration between basic research and application-oriented plant breeding. In addition, in his many years as Chairman of the Association for the Promotion of Private Plant Breeding in Germany (GFP), he was also responsible for creating an industry-specific research community, as a result of which close contacts were established with universities and other institutes conducting research in selected fields.
Carl-Ernst Büchting received many honors and awards in acknowledgement of his diverse activities, achievements and life’s work at and outside KWS. One of them moved him very greatly: In 1995 Klein Wanzleben made him an Honorary Citizen of the town, as a token of its thanks for his assistance in word and deed throughout the difficult process of change following German reunification, which he regarded as a great blessing.
The AKB Foundation, which Carl-Ernst Büchting established and named after his parents Annemarie and Karl Büchting, has promoted social, church and cultural institutions and projects for many years, mainly in Klein Wanzleben and his second home Einbeck.
Carl-Ernst Büchting was a businessman and responsible citizen of the world with all his heart. He played a great part in building and shaping KWS.
Dr. Carl-Ernst Büchting, Honorary Chairman of our Supervisory Board, died aged 95 on May 1, 2010.
We commemorate the outstanding personality of the fifth generation of businessmen in the founding
families of our company, the families Rabbethge and Giesecke, with great gratitude and respect.
Foreword of the Executive Board I 9
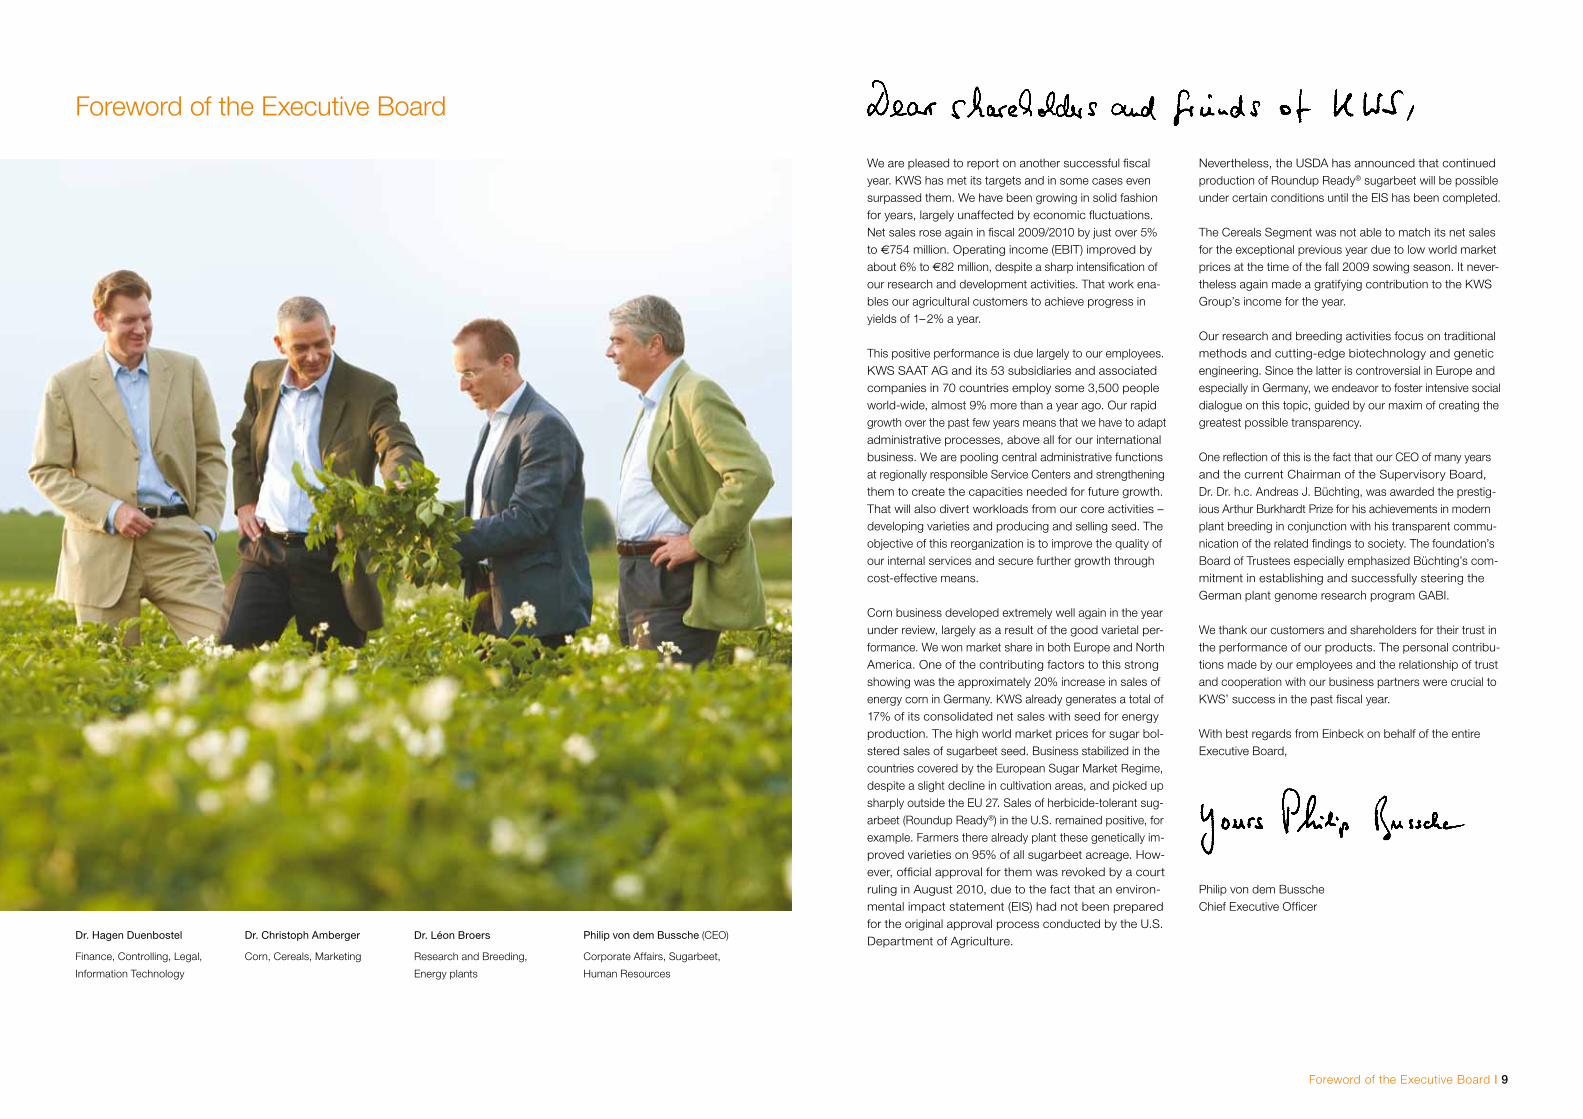
Philip von dem Bussche Chief Executive Officer
We are pleased to report on another successful fiscalyear. KWS has met its targets and in some cases evensurpassed them. We have been growing in solid fashionfor years, largely unaffected by economic fluctuations.Net sales rose again in fiscal 2009/2010 by just over 5% to €754 million. Operating income (EBIT) improved by about 6% to €82 million, despite a sharp intensification of our research and development activities. That work ena-bles our agricultural customers to achieve progress in yields of 1– 2% a year.
This positive performance is due largely to our employees. KWS SAAT AG and its 53 subsidiaries and associated companies in 70 countries employ some 3,500 people world-wide, almost 9% more than a year ago. Our rapid growth over the past few years means that we have to adapt administrative processes, above all for our international business. We are pooling central administrative functions at regionally responsible Service Centers and strengthening them to create the capacities needed for future growth. That will also divert workloads from our core activities – developing varieties and producing and selling seed. The objective of this reorganization is to improve the quality of our internal services and secure further growth through cost-effective means.
Corn business developed extremely well again in the year under review, largely as a result of the good varietal per-formance. We won market share in both Europe and North America. One of the contributing factors to this strong showing was the approximately 20% increase in sales of energy corn in Germany. KWS already generates a total of 17% of its consolidated net sales with seed for energy production. The high world market prices for sugar bol-stered sales of sugarbeet seed. Business stabilized in the countries covered by the European Sugar Market Regime, despite a slight decline in cultivation areas, and picked up sharply outside the EU 27. Sales of herbicide-tolerant sug-arbeet (Roundup Ready®) in the U.S. remained positive, for example. Farmers there already plant these genetically im-proved varieties on 95% of all sugarbeet acreage. How-ever, official approval for them was revoked by a court ruling in August 2010, due to the fact that an environ-mental impact statement (EIS) had not been prepared for the original approval process conducted by the U.S. Department of Agriculture.
Nevertheless, the USDA has announced that continued production of Roundup Ready® sugarbeet will be possible under certain conditions until the EIS has been completed.
The Cereals Segment was not able to match its net sales for the exceptional previous year due to low world market prices at the time of the fall 2009 sowing season. It never-theless again made a gratifying contribution to the KWS Group’s income for the year.
Our research and breeding activities focus on traditional methods and cutting-edge biotechnology and genetic engineering. Since the latter is controversial in Europe and especially in Germany, we endeavor to foster intensive social dialogue on this topic, guided by our maxim of creating the greatest possible transparency.
One reflection of this is the fact that our CEO of many years and the current Chairman of the Supervisory Board, Dr. Dr. h.c. Andreas J. Büchting, was awarded the prestig-ious Arthur Burkhardt Prize for his achievements in modern plant breeding in conjunction with his transparent commu-nication of the related findings to society. The foundation’s Board of Trustees especially emphasized Büchting’s com-mitment in establishing and successfully steering the German plant genome research program GABI.
We thank our customers and shareholders for their trust in the performance of our products. The personal contribu-tions made by our employees and the relationship of trust and cooperation with our business partners were crucial to KWS’ success in the past fiscal year.
With best regards from Einbeck on behalf of the entire Executive Board,
Dr. Hagen Duenbostel
Finance, Controlling, Legal,
Information Technology
Dr. Christoph Amberger
Corn, Cereals, Marketing
Dr. Léon Broers
Research and Breeding,
Energy plants
Philip von dem Bussche (CEO)
Corporate Affairs, Sugarbeet,
Human Resources
Foreword of the Executive Board
10
That means that labor-intensive crops such as fruit and vegetables can be produced at a very low cost, resulting in a competitive advantage on the world market.
Cereals, corn and oil seed are gaining ground in China.According to the Food and Agriculture Organization of the United Nations (FAO), the country’s meat produc- tion has more than doubled in the past 20 years. That trend is accompanied by growing demand for corn, the country’s most important fodder crop. In addition, the Chinese government has declared corn, rice and cereals to be “strategic crops” and has since promoted cultivation of them more intensively in order to secure the food supply for its people.
Thanks to the large labor force engaged in agriculture, China achieves yields in excess of the global average. Nevertheless, there is huge potential to increase them: According to the FAO, the 2009 corn harvest in China was just 5 tons per hectare, while yields twice as high have been achieved in highly productive corn cultivation countries in recent years.
A growing market for high-yield seedPlant breeding can make a major contribution to increasing productivity in agriculture in China. Farmers there are still trying to counter their seed’s lower yield potential with higher sowing densities. However, demand for high-quality, certified seed is growing gradually. Consequently, all plant breeding technologies are now in use in China. “Green genetic engineering” is also used, especially in cotton. Genetically modified plants are cultivated on over 3.7 million ha, making China one of the world’s largest growers of these crops.
China – since 2010 the world’s second-largest economy The Chinese economy is growing dynamically – and with it China’s prosperity. The standards of living in the major cities of this vast country are catching up with those in the Western world. One key indicator of this is the growing demand for secondary food commodities and processed food, such as meat and sugar. The German Sugar Asso-ciation (WVZ) notes that per-capita sugar consumption in China has increased from 9 kg to 11 kg per annum in the space of three years – and there is still enormous potential for growth. The figure for Germany has been constant at an annual 39 kg per person for years. China thus faces an immense challenge in satisfying its population of 1.3 billion: It has around 10 percent of the globally available agricul-tural land but has to feed some 20 percent of the world’s population. Given that the development of further culti- vation areas is possible to a very limited extent, the only solution is to increase the yield per unit area. Since China laid the foundation for a freer market economy by joining the WTO in 2001, foreign companies can operate in the agricultural sector with an eye to a longer-term future.
With its more than 30 years of experience in China, KWS already has crucial know-how in the market there. As a plant breeder that focuses on the moderate climatic zone, we can help strengthen the country’s agriculture with our high-yielding varieties.
Great potential for increasing yields: China’s agricultural sectorApart from various types of vegetables, corn and rice are the most important crops grown in China. Production conditions there are unique worldwide: Although there is an extreme shortage of land, there is a vast pool of labor – some 44% of the workforce is employed in agriculture.
KWS in China – many years of market experience, reliable partnershipsChina’s seed market has not yet undergone consolidation. In particular, no single player in the corn market has a share of more than three percent. Breeding companies usually sell their products through wholesalers or directly to private “seed shops” – very small dealers with their own farming operations and local demonstrations. KWS’ first contacts with China were at the end of the 1970s. Together with the local firms we now partner with, we have estab-lished ourselves in the sugarbeet sector and now have a market share of 40% in that field.
China is a key market of the future for KWS. The People’s Republic has a corn cultivation area of 30 million ha, second only to the U.S., and that figure is on the rise. More than 80% of the area is in the moderate climatic zone and thus a potential target for corn varieties from KWS’ portfolio. Some of our varieties have already been awarded sales approval and are distributed through our longstanding partners.
In order to adapt our corn varieties even better to conditions in China, in 2009 we founded a service company charged with conducting research in Lower Saxony’s partner province of Anhui. There are good conditions there for establishing research partnerships with local universities and creating the basis for KWS to advise Chinese farmers. In addition, work has been started on setting up a trial location for corn in Anhui.
We also aim to establish the KWS brand permanently in China. Consequently, we will begin selling corn under the typical KWS name and logo in fiscal 2010/2011.
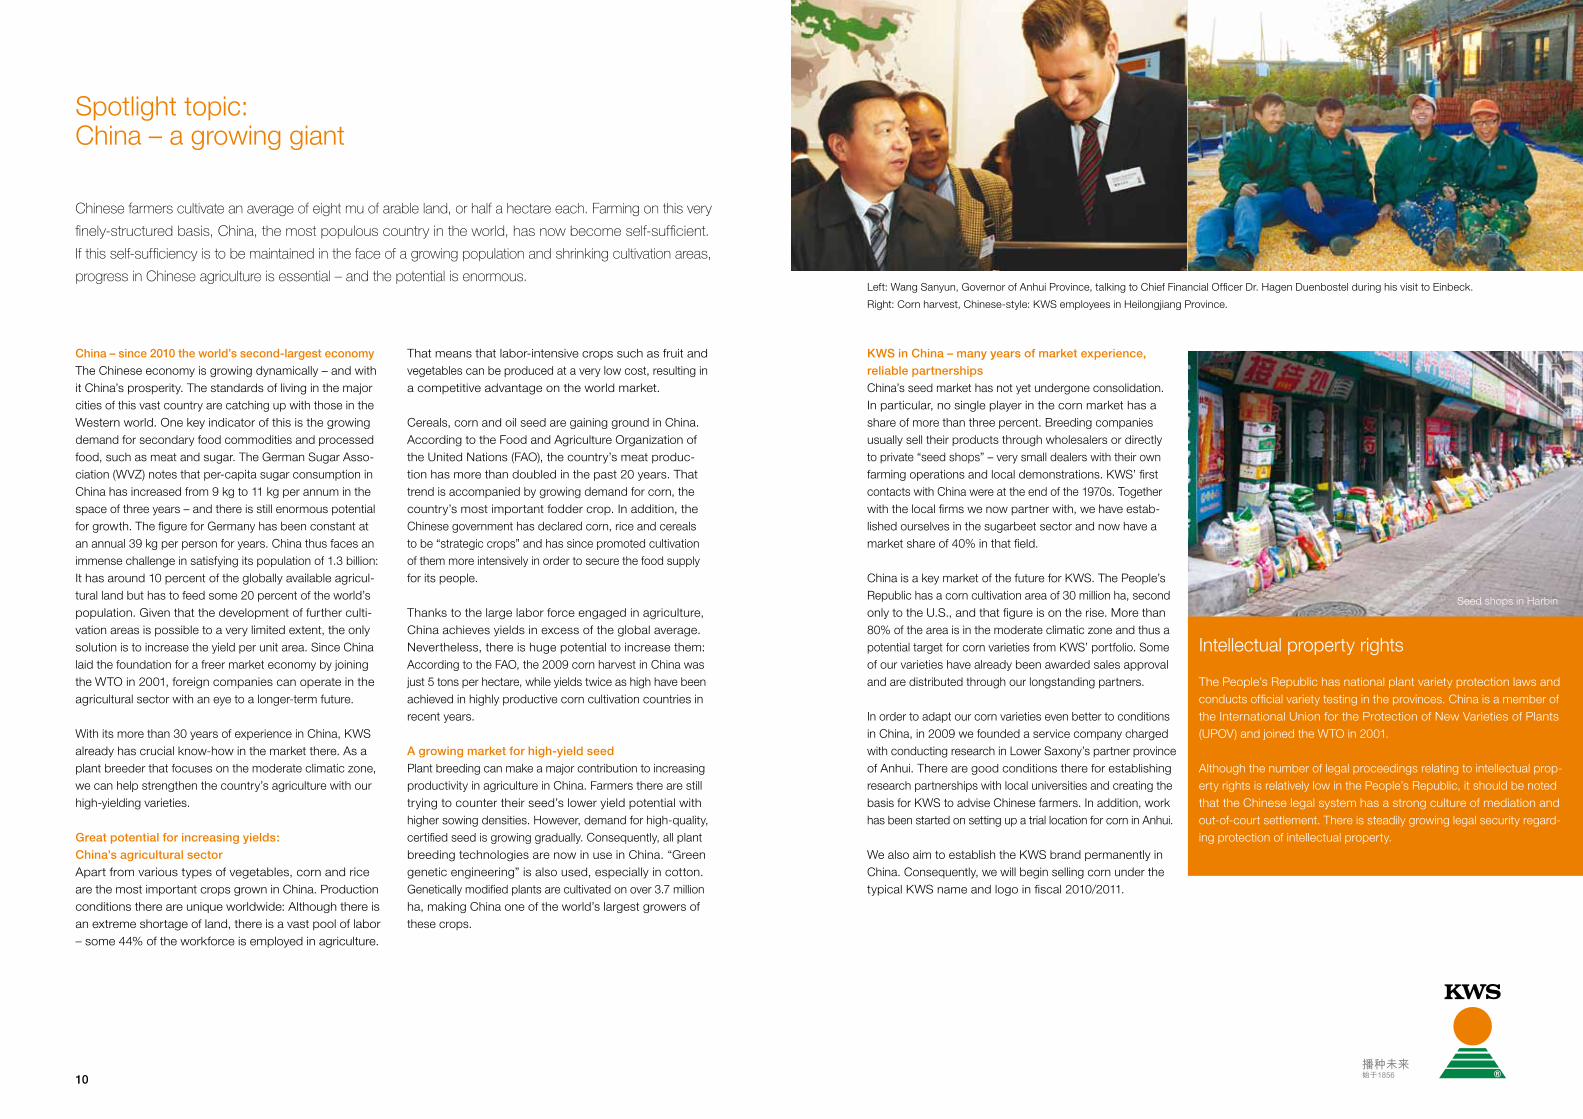
Chinese farmers cultivate an average of eight mu of arable land, or half a hectare each. Farming on this very
finely-structured basis, China, the most populous country in the world, has now become self-sufficient.
If this self-sufficiency is to be maintained in the face of a growing population and shrinking cultivation areas,
progress in Chinese agriculture is essential – and the potential is enormous. Left: Wang Sanyun, Governor of Anhui Province, talking to Chief Financial Officer Dr. Hagen Duenbostel during his visit to Einbeck.
Right: Corn harvest, Chinese-style: KWS employees in Heilongjiang Province.
Seed shops in Harbin
Intellectual property rights
The People’s Republic has national plant variety protection laws and conducts official variety testing in the provinces. China is a member of the International Union for the Protection of New Varieties of Plants (UPOV) and joined the WTO in 2001.
Although the number of legal proceedings relating to intellectual prop-erty rights is relatively low in the People’s Republic, it should be noted that the Chinese legal system has a strong culture of mediation and out-of-court settlement. There is steadily growing legal security regard-ing protection of intellectual property.
Spotlight topic: China – a growing giant
It’s not enough to want something. You also have to be able to do it.«
Paul Gauselmann, inventor and entrepreneur
Before you can reap the harvest you need seed – and that means the development of high-
yielding varieties. Over the last ten years, we have increased our investments in research
and development by about 6% per year to the current level of about 98 million euros.
Report of the Supervisory Board I 15
The focus of the final meeting in fiscal 2009/2010 on June 23, 2010, was corporate planning and approval of the budgets for fiscal 2010/2011, as well as further options for developing our cereals business. At this meeting, the Supervisory Board also adopted the new compensation system for the Executive Board, which had been presented by the Committee for Executive Board Affairs at the March meeting, and the resultant specific modifications to all con-tracts with Executive Board members effective July 1, 2010.
Annual and consolidated financial statements and auditingDeloitte & Touche GmbH Wirtschaftsprüfungsgesellschaft, Hanover, the independent auditor chosen at the Sharehold-ers’ Meeting on December 17, 2009, and commissioned by the Audit Committee, has audited the financial statements of KWS SAAT AG that were presented by the Executive Board and prepared in accordance with the provisions of the German Commercial Code (HGB) for fiscal 2009/2010 and the financial statements of the KWS Group (IFRS consoli-dated financial statements), as well as the Management Report of KWS SAAT AG and the KWS Group Management Report, including the accounting reports, and awarded them its unqualified audit certificate. In addition, the auditor con-cluded that the audit of the financial statements did not reveal any facts that might indicate a misstatement in the declara-tion of compliance with the German Corporate Governance Code issued by the Executive Board and Supervisory Board (cf. Clause 7.2.3 of the German Corporate Governance Code).
The Supervisory Board received and discussed the finan-cial statements and Management Reports of KWS SAAT AG and the KWS Group, along with the report by the in-dependent auditor of KWS SAAT AG and the KWS Group and the proposal on utilization of the net profit for the year made by KWS SAAT AG, in due time. The financial state-ments, Management Reports and audit reports by the in-dependent auditors were submitted to all members of the Supervisory Board. It also held detailed discussions of ques-tions on the agenda at its meeting to discuss the financial statements on October 27, 2010. The auditor took part in the meeting and reported on the main results of the audit and was also available to answer additional questions and provide further information for the Supervisory Board. Ac-cording to the report of the independent auditor, there were no material weaknesses in the internal control and risk management system in relation to the accounting process. There were also no circumstances that might indicate a lack of impartiality on the part of the independent auditor. The small extent of services additionally provided by the independent auditor can be seen from the Notes.
In accordance with the final results of its own examination, the Supervisory Board endorsed the results of the audit with no objections, among other things as a result of the vote by the Audit Committee. It approved the annual finan-cial statements of KWS SAAT AG and the consolidated financial statements of the KWS Group, as well as the Man-agement Report of KWS SAAT AG and the KWS Group Management Report. It also endorses the proposal by the Executive Board to the Annual Shareholders’ Meeting on the appropriation of the profits of KWS SAAT AG after hav-ing examined it.
Corporate GovernanceOne focal issue in further development of the Corporate Governance Standards was implementation of the recom-mendations in the German Corporate Governance Code on remuneration of the Supervisory Board and Executive Board. While the new compensation system for the Super-visory Board was adopted by the Annual Shareholders’ Meeting on December 17, 2009, the new system for Exec- utive Board compensation is to be submitted to the Share-holders’ Meeting on December 16, 2010, for approval. The system is described in detail in this year’s Compensation Report (page 20).
The Supervisory Board conducted its efficiency review for fiscal 2009/2010 with external assistance from the Deut-sche Agentur für Aufsichtsräte, a company that advises supervisory boards. As part of this, individual meetings were held with all members of the Supervisory Board and two members of the Executive Board. The results of these interviews were incorporated in a report on the efficiency review, which the Supervisory Board discussed at its meet-ing on October 27, 2010.
At their meeting on October 27, 2010, the Executive Board and Supervisory Board discussed updating the declaration of compliance with the German Corporate Governance Code and issued a new declaration in accordance with Section 161 AktG (German Stock Corporation Act). It is permanently available to the public on KWS SAAT AG’s Website, www.kws.com. There were no conflicts of interest on the part of Supervisory Board members in the period under review.
Supervisory Board CommitteesIn order to ensure that it discharges its duties efficiently, the Supervisory Board has established a Committee for Ex-ecutive Board Affairs, an Audit Committee and a Nominat-ing Committee.
14
Report of the Supervisory Board
The gratifying annual financial statements of the KWS Group prove once again that KWS is able to achieve sustainable operational growth despite increasing volatility in global agricultural markets. This can be explained by the fact that the quality of seed is a key factor with a major impact on yields and thus on farmers’ potential income. The success of the farmer and that of the plant breeder are closely inter-twined. Steady increases in yield require long-term and future-oriented measures. Consequently, in view of the good annual financial statements in the past, the Supervisory Board sees its role not just in exercising its control function, but also and especially in constantly accompanying the Executive Board in strategic affairs.
This constructive relationship of trust means that one of the main tasks of the Supervisory Board is to provide stimuli and fresh ideas to the Executive Board. Moreover, it exten-sively discusses the Executive Board’s corporate strategy. In this spirit, the Supervisory Board carefully accompanied, advised and monitored the management of KWS SAAT AG in accordance with the law and the company’s Articles of Association throughout fiscal 2009/2010. It was involved at an early stage of all key decisions of strategic and funda-mental importance for the company and was provided by the Executive Board with regular, prompt and extensive information in written and oral form. The reports by the Executive Board to the Supervisory Board contained all
relevant information on planning, the business perform-ance and situation of the company and the KWS Group, including the risk situation, risk management and compli-ance. Following thorough deliberations, the Supervisory Board approved the submitted measures and business transactions requiring its consent. Its detailed discussions focused on corporate policy, corporate and financial plan-ning, large individual projects, the competitive situation, product development, risk management, the general de-velopment of the various businesses and profitability. The Chairman of the Supervisory Board was also in close bilat-eral contact with the CEO and the individual members of the Executive Board outside of the meetings of the Super-visory Board. In addition, there were monthly meetings between the Chairman of the Supervisory Board and the Executive Board as a whole, where special occurrences and developments and the general development of the various businesses were discussed.
The full Supervisory Board held five regular meetings in fiscal 2009/2010. Its members participated in all of the meetings, with the exception of one member who was unable to attend two meetings due to illness.
Focal areas of deliberationsThe focus of the meeting of the Supervisory Board to dis-cuss the financial statements on October 28, 2009, was to examine and approve the financial statements of KWS SAAT AG and the consolidated financial statements as of June 30, 2009. The Supervisory Board also discussed measures to expand our activities in China. It adopted the resolution proposing an adjustment to the Supervisory Board’s compensation to the Annual Shareholders’ Meet-ing and discussed the results of its efficiency review, which was conducted for fiscal 2008/2009 using a questionnaire. At this meeting, the Supervisory Board also extended the contract of employment of Dr. Hagen Duenbostel for a term of five years as of July 1, 2010, at the proposal of the Com-mittee for Executive Board Affairs.
At its meeting on December 16, 2009, the Supervisory Board dealt with the key strategic question of identifying, acquiring, encouraging and retaining qualified employees. The Supervisory Board also heard reports on the current performance of our cereals and rapeseed breeding work. It was then given an overview of sugarbeet and corn breed-ing on March 10, 2010. In addition, the March meeting is regularly used to discuss research and development issues and, every second year, the KWS Group’s strategic plan-ning, which covers a timescale of ten years.
Dr. Dr. h. c. Andreas J. Büchting, Chairman of the Supervisory Board
Report of the Supervisory Board I Corporate Governance Report I 17
Corporate Governance Report
vote on important company matters. Each share entitles its holder to one vote. To make it easier for shareholders to cast their votes, they can choose to be represented by a proxy who is named by the company and who votes in accordance with the shareholders’ instructions. KWS also publishes the Notice of the Annual Shareholders’ Meeting, the power of attorney and voting instruction forms for prox-ies and the annual financial statements in the Internet.
Executive and Supervisory Boards – value-oriented collaborationThe Executive Board develops the company’s strategy, coordinates it with the Supervisory Board and ensures that it is implemented (the company’s Articles of Association and the bylaws of the Executive Board, Supervisory Board and Audit Committee are published on our homepage at www.kws.de). The members of the Executive Board bear joint responsibility for managing the company.
Compliance with statutory regulations and the company’s ethical principles are governed at KWS by the Code of Business Ethics, an abridged version of which is likewise published on the homepage. It offers employees a clear guideline as to what they are allowed to do in all their busi-ness activities. The issue of compliance has increased in complexity as a result of KWS’ strong international growth and greater statutory requirements. That is why we have established a separate corporate function in Einbeck to pro-vide legal advice for the operating units throughout the KWS Group. For example, a Compliance Officer assists the Executive Board and all the company’s units in apply-ing laws and regulations and implementing suitable moni-toring and control instruments.
Career – men and women have equal opportunities The Executive Board is careful to ensure diversity in filling management posts. Teams are made up of persons with a wide range of different skills, talents and inclinations. At the KWS Group, women have the same career opportunities as men and hold important functions, for example in Corpo-rate Controlling, Corporate Law, Human Resources, Corpo-rate Marketing and Compliance Management. In addition, many female scientists occupy key positions in Product Development. By contrast, few women choose to work in seed production and sales.
The focus of good corporate governance and control at KWS SAAT AG is respect for people’s interests: for that of our customers, business partners, shareholders, employees and fellow human beings in general. Our actions are guided by the values of an international agricultural company with a tradition of family ownership. Reliability, team spirit, sus-tainability, foresight and independence are vital elements of this. We comply with, among other things, the relevant legal requirements regarding managing and supervising German stock corporations and the internationally and nationally acknowledged standards of good and responsible corpo-rate governance (German Corporate Governance Code).
The complete declaration on corporate governance in ac-cordance with Section 289 a of the German Commercial Code (HGB), which also contains the compliance declara-tion in accordance with Section 161 AktG (German Stock Corporation Act), has been published in the Internet at www.kws.com > Investor Relations > Corporate Governance.
The following principles of corporate governance are of es-pecial importance to the Executive and Supervisory Boards: • A relationship of trust and cooperation between the Executive Board and the Supervisory Board • Observance of all statutory and internal regulations, policies and guidelines (compliance) • The greatest possible transparency in our business activities – from research and development to account- ing as well as risk management • Open, regular and consistent communication with all stakeholders • Performance-related compensation• Responsibility for the environment and society
The Executive and Supervisory Boards have complied in the past with nationally and internationally acknowledged standards of value-oriented corporate governance and control. The development of important new content and tasks was discussed as part of corporate governance, in particular in the wake of the German Accounting Law Modernization Act (BilMoG).
The Annual Shareholders’ Meeting – the top decision-making bodyThe Annual Shareholders’ Meeting is the highest-level decision-making body of KWS SAAT AG. All shareholders are given a written invitation at least once a year through their depositary bank. It is traditionally held at the company’s headquarters in Einbeck. Shareholders can exercise their rights to speak and obtain information there, as well as
16
Dr. Dr. h. c. Andreas J. Büchting Chairman of the Supervisory Board
The Committee for Executive Board Affairs convened on September 14, 2010, and also corresponded in writing on several occasions. The various options for adjusting the Executive Board’s compensation in accordance with the German Appropriateness of Management Board Compen-sation Act (VorstAG) were discussed at the meeting and the full Supervisory Board adopted a proposed resolution. The meeting also discussed renewing the contract of em-ployment with Dr. Hagen Duenbostel and recommended to the Supervisory Board that it be extended from July 1, 2010, until June 30, 2015.
The Audit Committee held three meetings and three tele-phone conferences in fiscal year 2009 / 2010, in which it discussed the interim reports to be published, among other things. The Audit Committee also initiated extensive meas-ures to expand the risk and compliance management sys-tems in fiscal 2009/2010. These systems now comply with the more stringent requirements of the German Accounting Law Modernization Act (BilMoG) and are presented in this year’s Management Report beginning on page 49. In its meeting in the new fiscal year on October 7, 2010, the fi- nancial statements and accounting were discussed in the presence of the independent auditor. The independent au-ditor reported in detail on all findings and occurrences that were of importance to the Supervisory Board in discharg-ing its duties and that had arisen in the course of its audit of the financial statements; the auditor was also available to answer additional questions and provide further informa-tion for the Supervisory Board. The independent auditor also presented the results of this year’s special audits to the Audit Committee. According to the report of the inde-pendent auditor, there were no material weaknesses of the internal control and risk management system with regard to the accounting process.
In addition, the Audit Committee obtained the statement of independence from the auditor in accordance with Clause 7.2.1 of the German Corporate Governance Code and monitored the auditor’s independence. The Audit Committee also satisfied itself that the regulations on internal rotation
pursuant to Section 319 a (1) No. 4 HGB were observed by the independent auditor.
Composition of the Supervisory BoardThe composition of the Supervisory Board did not change in fiscal year 2009/2010. Its composition and that of the Audit Committee already comply with the requirements of the amended Sections 100 (5) and 107 (4) of the AktG (German Stock Corporation Act), under which at least one independent member must have expertise in the fields of accounting and auditing of financial statements.
The Supervisory Board expresses its thanks to the Execu-tive Board and all employees of KWS SAAT AG and its subsidiaries once more for their successful contributions and their commitment in fiscal 2009/2010.
Dr. Carl-Ernst BüchtingDr. Carl-Ernst Büchting, the Honorary Chairman of our Su-pervisory Board, passed away at the age of 94 on May 1, 2010. As a representative of the fifth generation of the found-ing families of the “Zuckerfabrik Kleinwanzleben, vormals Rabbethge & Giesecke AG”, Carl-Ernst Büchting joined the Executive Board of what is now KWS SAAT AG in 1951. In his capacity as Chief Executive Officer from 1952 to 1978 and as Chairman of the Supervisory Board from 1978 to 1994, he played a major role at the helm of the company. Our company is largely what it is today thanks to his achieve-ments, to which we pay tribute on pages 6-7.
We will honor and cherish his memory with deep gratitude.
Einbeck, October 27, 2010 KWS SAAT AG
Supervisory Board
Dr. Dr. h. c. Andreas J. BüchtingEinbeckChairman
Dr. Arend OetkerBerlinDeputy Chairman
Hubertus von BaumbachIngelheim
Jürgen BolduanEinbeckChairman of the Central Works Committee of KWS SAAT AG
Cathrina Claas-MühlhäuserFrankfurt am Main
Dr. Dietmar StahlEinbeckEmployee Representative
18
The Supervisory Board – a blend of diverse skills and experienceThe Supervisory Board appoints, supervises and advises the Executive Board and is directly involved in decisions that are of fundamental importance for the company. This body, which was elected for five years in December 2007, consists of six members: two employee representatives, who are elected by the workforce, and four shareholder representatives chosen by the Annual Shareholders’ Meet-ing. The composition of the Supervisory Board aims to reflect as broad a range of skills and experience as possi-ble. At least one quarter of the members of the Supervisory Board elected by the Annual Shareholders’ Meeting should be female. The current board fulfills these objectives.
Strengthening trust – transparent communicationWe aim to strengthen the trust of our shareholders, busi-ness partners, employees and the public through open-ness and transparency. We provide regular information on KWS’ business situation in the form of quarterly reports. We present the company to domestic and foreign investors at many roadshows. We regularly publish the latest presen-tations on our homepage so that all shareholders receive the same information at the same time. The financial calen-dar gives information on the most important dates in the year. In addition, all legally prescribed notifications and press releases are published immediately in the Internet. Manage-ment regularly takes part in various information events in order to inform the public about KWS’ responsible use of modern plant breeding methods and biotechnology.
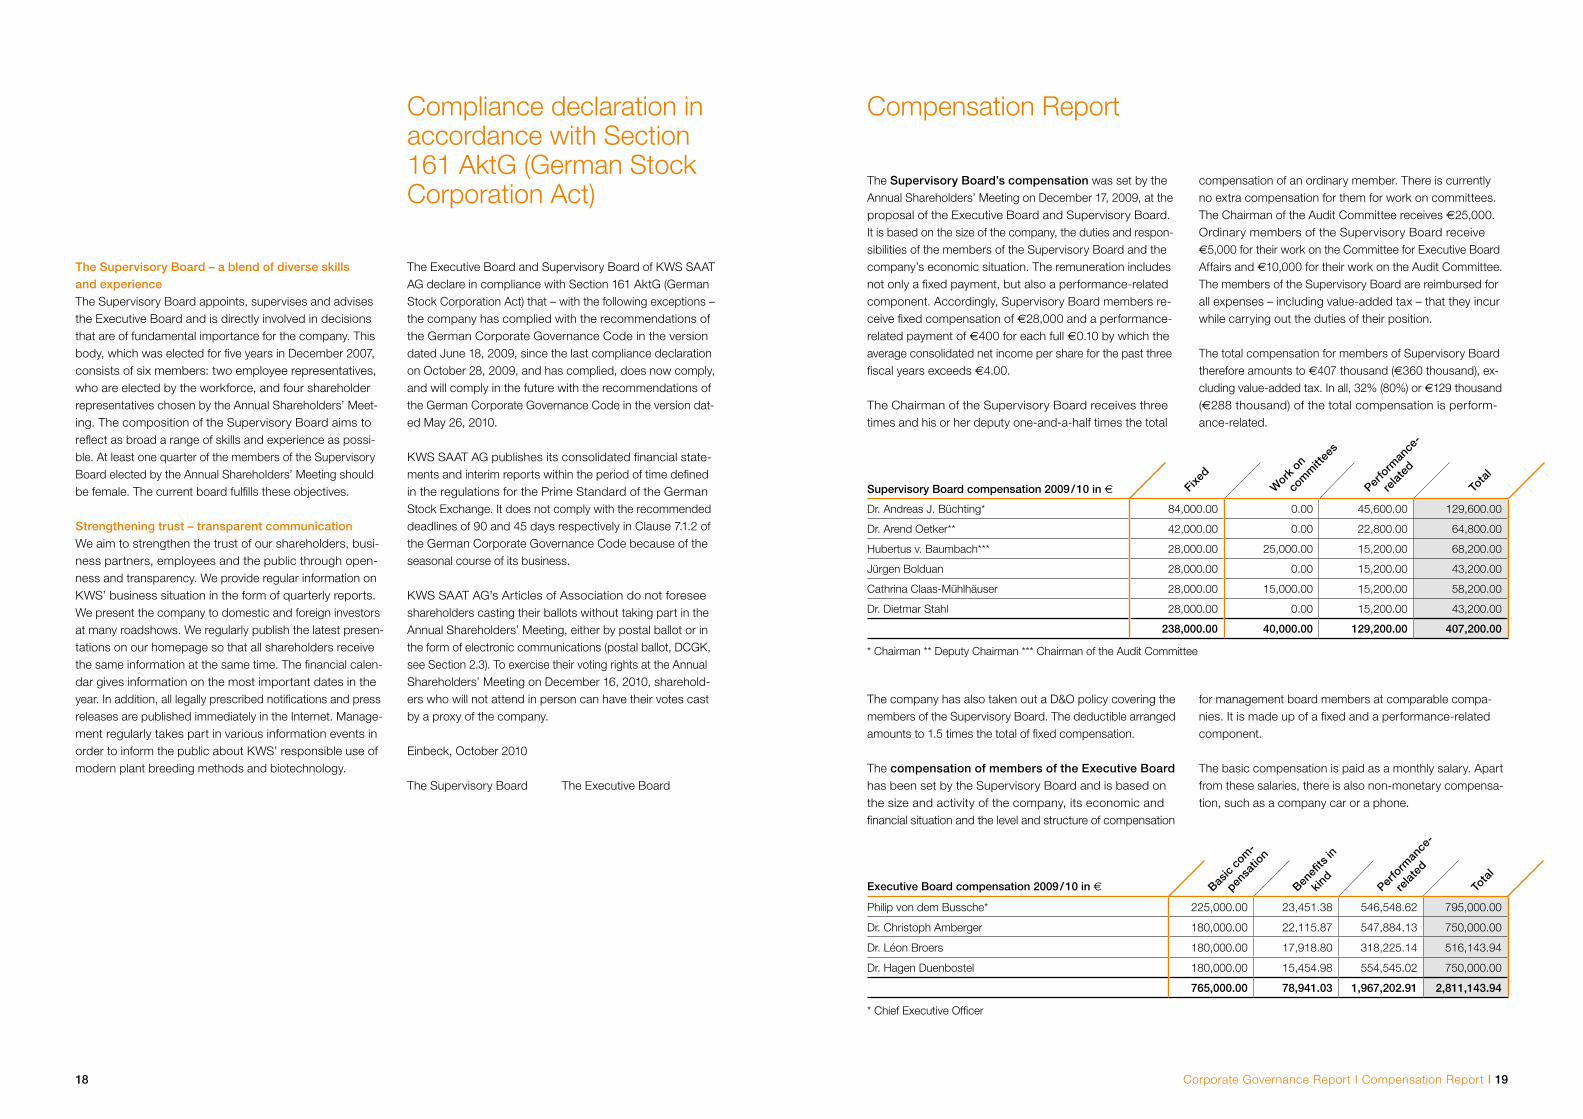
The Supervisory Board’s compensation was set by the Annual Shareholders’ Meeting on December 17, 2009, at the proposal of the Executive Board and Supervisory Board. It is based on the size of the company, the duties and respon-sibilities of the members of the Supervisory Board and the company’s economic situation. The remuneration includes not only a fixed payment, but also a performance-related component. Accordingly, Supervisory Board members re-ceive fixed compensation of €28,000 and a performance-related payment of €400 for each full €0.10 by which the average consolidated net income per share for the past three fiscal years exceeds €4.00.
The Chairman of the Supervisory Board receives three times and his or her deputy one-and-a-half times the total
The company has also taken out a D&O policy covering the members of the Supervisory Board. The deductible arranged amounts to 1.5 times the total of fixed compensation.
The compensation of members of the Executive Board has been set by the Supervisory Board and is based on the size and activity of the company, its economic and financial situation and the level and structure of compensation
Compensation Report
Work
on
com
mitt
ees
Perfo
rman
ce-
relat
ed
Tota
lFixe
dSupervisory Board compensation 2009 / 10 in €
Dr. Andreas J. Büchting* 84,000.00 0.00 45,600.00 129,600.00
Dr. Arend Oetker** 42,000.00 0.00 22,800.00 64,800.00
Hubertus v. Baumbach*** 28,000.00 25,000.00 15,200.00 68,200.00
Jürgen Bolduan 28,000.00 0.00 15,200.00 43,200.00
Cathrina Claas-Mühlhäuser 28,000.00 15,000.00 15,200.00 58,200.00
Dr. Dietmar Stahl 28,000.00 0.00 15,200.00 43,200.00
238,000.00 40,000.00 129,200.00 407,200.00
* Chairman ** Deputy Chairman *** Chairman of the Audit Committee
Corporate Governance Report I Compensation Report I 19
compensation of an ordinary member. There is currently no extra compensation for them for work on committees. The Chairman of the Audit Committee receives €25,000. Ordinary members of the Supervisory Board receive €5,000 for their work on the Committee for Executive Board Affairs and €10,000 for their work on the Audit Committee. The members of the Supervisory Board are reimbursed for all expenses – including value-added tax – that they incur while carrying out the duties of their position.
The total compensation for members of Supervisory Board therefore amounts to €407 thousand (€360 thousand), ex-cluding value-added tax. In all, 32% (80%) or €129 thousand (€288 thousand) of the total compensation is perform-ance-related.
for management board members at comparable compa-nies. It is made up of a fixed and a performance-related component.
The basic compensation is paid as a monthly salary. Apart from these salaries, there is also non-monetary compensa-tion, such as a company car or a phone.
Executive Board compensation 2009 / 10 in € Basic
com
-
pensa
tion
Benefi
ts in
kind
Perfo
rman
ce-
relat
ed
Tota
l
Philip von dem Bussche* 225,000.00 23,451.38 546,548.62 795,000.00
Dr. Christoph Amberger 180,000.00 22,115.87 547,884.13 750,000.00
Dr. Léon Broers 180,000.00 17,918.80 318,225.14 516,143.94
Dr. Hagen Duenbostel 180,000.00 15,454.98 554,545.02 750,000.00
765,000.00 78,941.03 1,967,202.91 2,811,143.94
* Chief Executive Officer
Compliance declaration in accordance with Section 161 AktG (German Stock Corporation Act)
The Executive Board and Supervisory Board of KWS SAAT AG declare in compliance with Section 161 AktG (German Stock Corporation Act) that – with the following exceptions – the company has complied with the recommendations of the German Corporate Governance Code in the version dated June 18, 2009, since the last compliance declaration on October 28, 2009, and has complied, does now comply, and will comply in the future with the recommendations of the German Corporate Governance Code in the version dat-ed May 26, 2010.
KWS SAAT AG publishes its consolidated financial state-ments and interim reports within the period of time defined in the regulations for the Prime Standard of the German Stock Exchange. It does not comply with the recommended deadlines of 90 and 45 days respectively in Clause 7.1.2 of the German Corporate Governance Code because of the seasonal course of its business.
KWS SAAT AG’s Articles of Association do not foresee shareholders casting their ballots without taking part in the Annual Shareholders’ Meeting, either by postal ballot or in the form of electronic communications (postal ballot, DCGK, see Section 2.3). To exercise their voting rights at the Annual Shareholders’ Meeting on December 16, 2010, sharehold-ers who will not attend in person can have their votes cast by a proxy of the company.
Einbeck, October 2010
The Supervisory Board The Executive Board
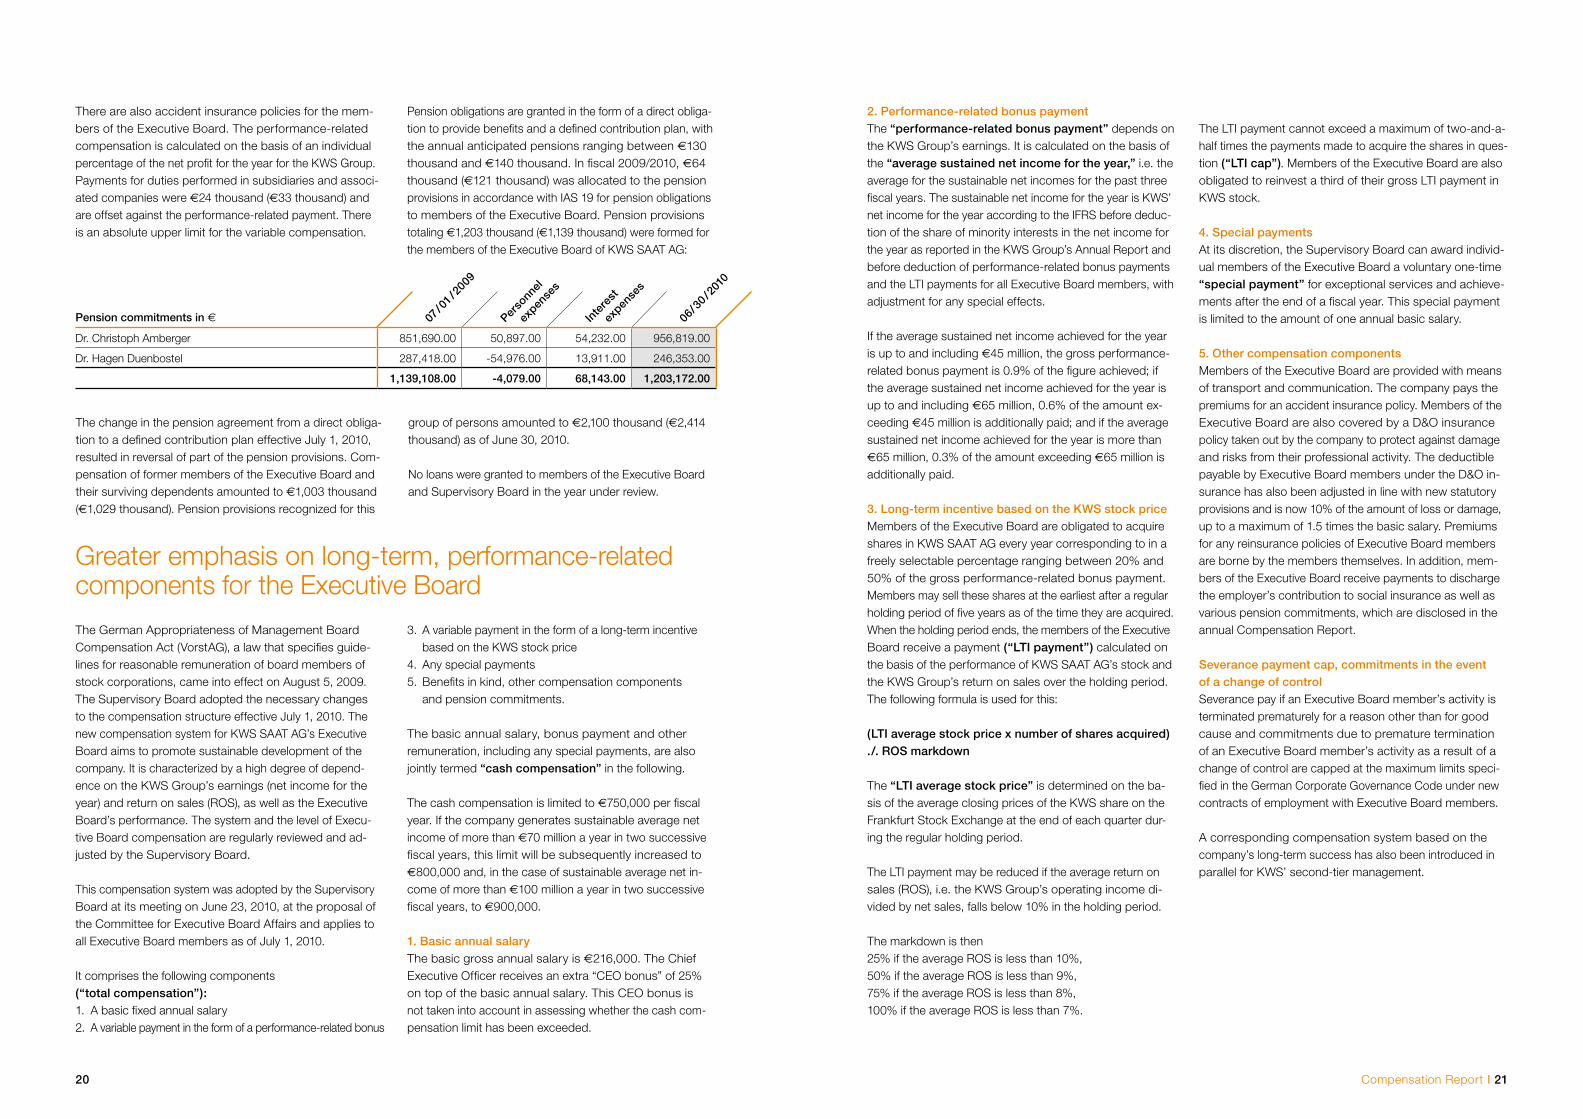
There are also accident insurance policies for the mem- bers of the Executive Board. The performance-related compensation is calculated on the basis of an individual percentage of the net profit for the year for the KWS Group. Payments for duties performed in subsidiaries and associ-ated companies were €24 thousand (€33 thousand) and are offset against the performance-related payment. There is an absolute upper limit for the variable compensation.
07 / 0
1 / 20
09
Perso
nnel
expen
ses
Inte
rest
expen
ses
06/ 3
0 / 20
10
Pension commitments in €
Dr. Christoph Amberger 851,690.00 50,897.00 54,232.00 956,819.00
Dr. Hagen Duenbostel 287,418.00 -54,976.00 13,911.00 246,353.00
1,139,108.00 -4,079.00 68,143.00 1,203,172.00
The German Appropriateness of Management Board Compensation Act (VorstAG), a law that specifies guide-lines for reasonable remuneration of board members of stock corporations, came into effect on August 5, 2009. The Supervisory Board adopted the necessary changes to the compensation structure effective July 1, 2010. The new compensation system for KWS SAAT AG’s Executive Board aims to promote sustainable development of the company. It is characterized by a high degree of depend-ence on the KWS Group’s earnings (net income for the year) and return on sales (ROS), as well as the Executive Board’s performance. The system and the level of Execu-tive Board compensation are regularly reviewed and ad-justed by the Supervisory Board.
This compensation system was adopted by the Supervisory Board at its meeting on June 23, 2010, at the proposal of the Committee for Executive Board Affairs and applies to all Executive Board members as of July 1, 2010.
It comprises the following components (“total compensation”):1. A basic fixed annual salary2. A variable payment in the form of a performance-related bonus
3. A variable payment in the form of a long-term incentive based on the KWS stock price4. Any special payments5. Benefits in kind, other compensation components and pension commitments.
The basic annual salary, bonus payment and other remuneration, including any special payments, are also jointly termed “cash compensation” in the following.
The cash compensation is limited to €750,000 per fiscal year. If the company generates sustainable average net income of more than €70 million a year in two successive fiscal years, this limit will be subsequently increased to €800,000 and, in the case of sustainable average net in-come of more than €100 million a year in two successive fiscal years, to €900,000.
1. Basic annual salaryThe basic gross annual salary is €216,000. The Chief Executive Officer receives an extra “CEO bonus” of 25% on top of the basic annual salary. This CEO bonus is not taken into account in assessing whether the cash com-pensation limit has been exceeded.
Pension obligations are granted in the form of a direct obliga-tion to provide benefits and a defined contribution plan, with the annual anticipated pensions ranging between €130 thousand and €140 thousand. In fiscal 2009/2010, €64 thousand (€121 thousand) was allocated to the pension provisions in accordance with IAS 19 for pension obligations to members of the Executive Board. Pension provisions totaling €1,203 thousand (€1,139 thousand) were formed for the members of the Executive Board of KWS SAAT AG:
20 Compensation Report I 21
Greater emphasis on long-term, performance-related components for the Executive Board
2. Performance-related bonus paymentThe “performance-related bonus payment” depends on the KWS Group’s earnings. It is calculated on the basis of the “average sustained net income for the year,” i.e. the average for the sustainable net incomes for the past three fiscal years. The sustainable net income for the year is KWS’ net income for the year according to the IFRS before deduc-tion of the share of minority interests in the net income for the year as reported in the KWS Group’s Annual Report and before deduction of performance-related bonus payments and the LTI payments for all Executive Board members, with adjustment for any special effects.
If the average sustained net income achieved for the year is up to and including €45 million, the gross performance-related bonus payment is 0.9% of the figure achieved; if the average sustained net income achieved for the year is up to and including €65 million, 0.6% of the amount ex-ceeding €45 million is additionally paid; and if the average sustained net income achieved for the year is more than €65 million, 0.3% of the amount exceeding €65 million is additionally paid.
3. Long-term incentive based on the KWS stock price Members of the Executive Board are obligated to acquire shares in KWS SAAT AG every year corresponding to in a freely selectable percentage ranging between 20% and 50% of the gross performance-related bonus payment. Members may sell these shares at the earliest after a regular holding period of five years as of the time they are acquired. When the holding period ends, the members of the Executive Board receive a payment (“LTI payment”) calculated on the basis of the performance of KWS SAAT AG’s stock and the KWS Group’s return on sales over the holding period. The following formula is used for this:
(LTI average stock price x number of shares acquired) ./. ROS markdown
The “LTI average stock price” is determined on the ba-sis of the average closing prices of the KWS share on the Frankfurt Stock Exchange at the end of each quarter dur-ing the regular holding period.
The LTI payment may be reduced if the average return on sales (ROS), i.e. the KWS Group’s operating income di-vided by net sales, falls below 10% in the holding period.
The markdown is then25% if the average ROS is less than 10%,50% if the average ROS is less than 9%,75% if the average ROS is less than 8%,100% if the average ROS is less than 7%.
The LTI payment cannot exceed a maximum of two-and-a-half times the payments made to acquire the shares in ques-tion (“LTI cap”). Members of the Executive Board are also obligated to reinvest a third of their gross LTI payment in KWS stock.
4. Special paymentsAt its discretion, the Supervisory Board can award individ-ual members of the Executive Board a voluntary one-time “special payment” for exceptional services and achieve-ments after the end of a fiscal year. This special payment is limited to the amount of one annual basic salary.
5. Other compensation componentsMembers of the Executive Board are provided with means of transport and communication. The company pays the premiums for an accident insurance policy. Members of the Executive Board are also covered by a D&O insurance policy taken out by the company to protect against damage and risks from their professional activity. The deductible payable by Executive Board members under the D&O in-surance has also been adjusted in line with new statutory provisions and is now 10% of the amount of loss or damage, up to a maximum of 1.5 times the basic salary. Premiums for any reinsurance policies of Executive Board members are borne by the members themselves. In addition, mem-bers of the Executive Board receive payments to discharge the employer’s contribution to social insurance as well as various pension commitments, which are disclosed in the annual Compensation Report.
Severance payment cap, commitments in the event of a change of controlSeverance pay if an Executive Board member’s activity is terminated prematurely for a reason other than for good cause and commitments due to premature termination of an Executive Board member’s activity as a result of a change of control are capped at the maximum limits speci-fied in the German Corporate Governance Code under new contracts of employment with Executive Board members.
A corresponding compensation system based on the company’s long-term success has also been introduced in parallel for KWS’ second-tier management.
The change in the pension agreement from a direct obliga-tion to a defined contribution plan effective July 1, 2010, resulted in reversal of part of the pension provisions. Com-pensation of former members of the Executive Board and their surviving dependents amounted to €1,003 thousand (€1,029 thousand). Pension provisions recognized for this
group of persons amounted to €2,100 thousand (€2,414 thousand) as of June 30, 2010.
No loans were granted to members of the Executive Board and Supervisory Board in the year under review.
22 KWS share I Agenda I Financial calendar I 23
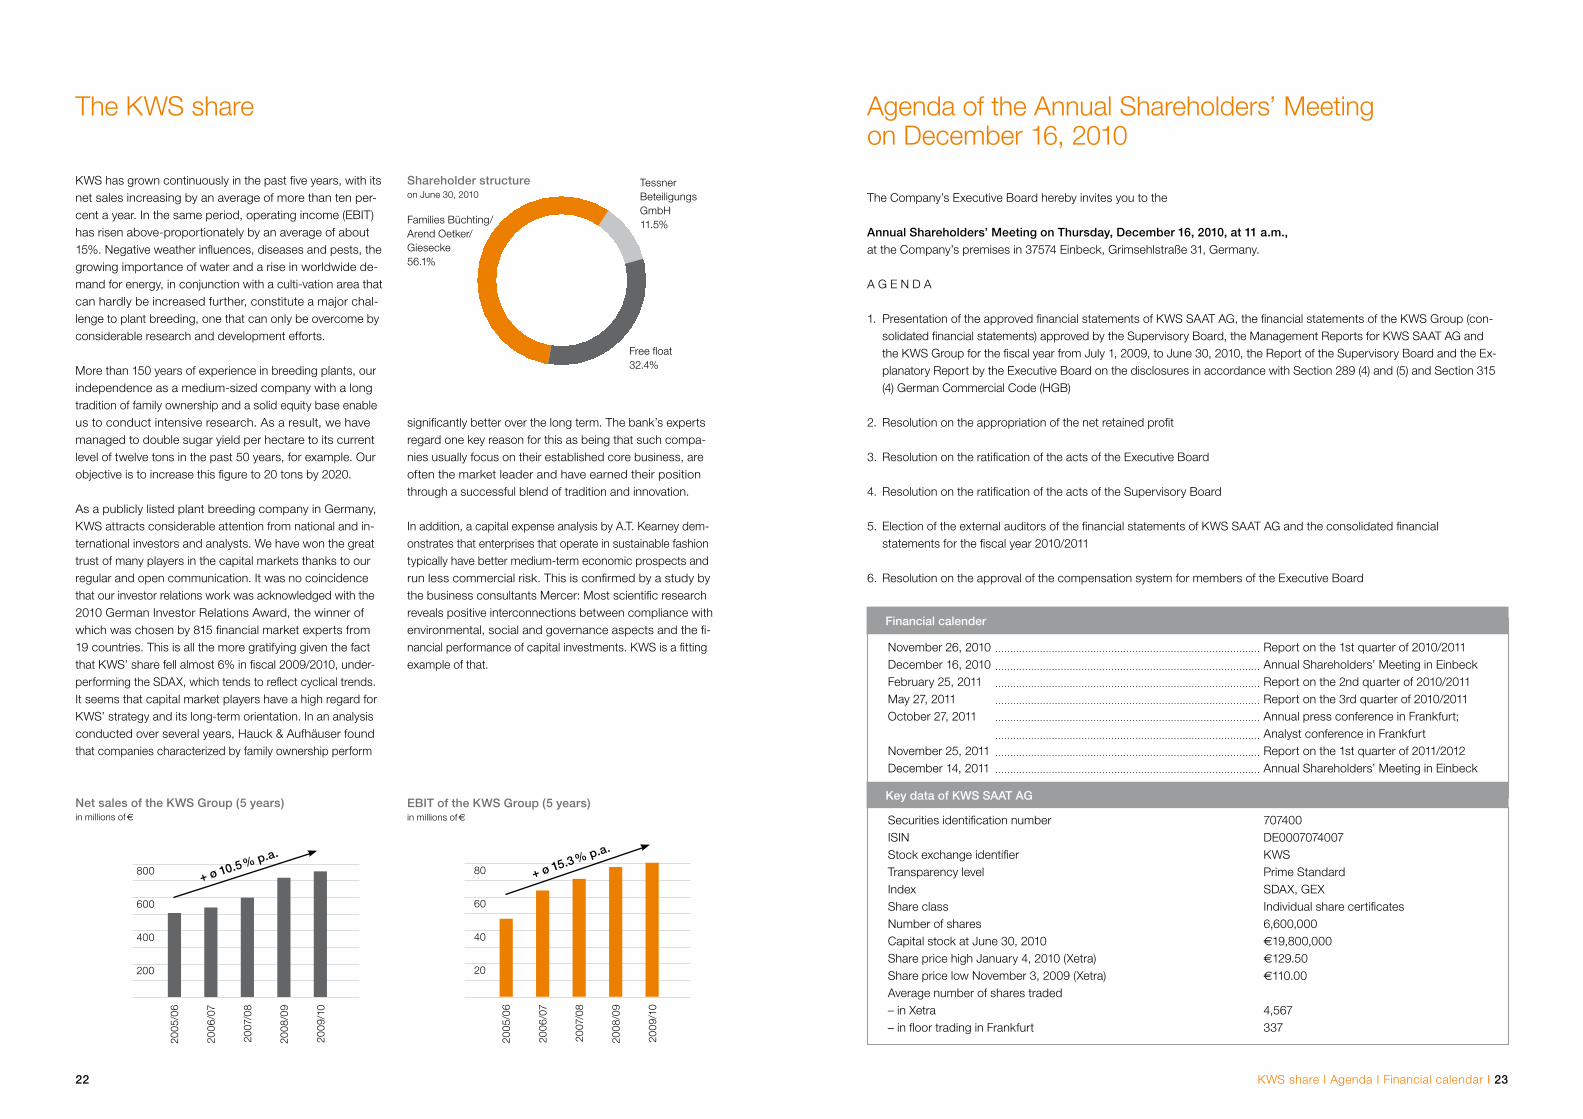
KWS has grown continuously in the past five years, with its net sales increasing by an average of more than ten per-cent a year. In the same period, operating income (EBIT) has risen above-proportionately by an average of about 15%. Negative weather influences, diseases and pests, the growing importance of water and a rise in worldwide de-mand for energy, in conjunction with a culti-vation area that can hardly be increased further, constitute a major chal-lenge to plant breeding, one that can only be overcome by considerable research and development efforts.
More than 150 years of experience in breeding plants, our independence as a medium-sized company with a long tradition of family ownership and a solid equity base enable us to conduct intensive research. As a result, we have managed to double sugar yield per hectare to its current level of twelve tons in the past 50 years, for example. Our objective is to increase this figure to 20 tons by 2020.
As a publicly listed plant breeding company in Germany, KWS attracts considerable attention from national and in-ternational investors and analysts. We have won the great trust of many players in the capital markets thanks to our regular and open communication. It was no coincidence that our investor relations work was acknowledged with the 2010 German Investor Relations Award, the winner of which was chosen by 815 financial market experts from 19 countries. This is all the more gratifying given the fact that KWS’ share fell almost 6% in fiscal 2009/2010, under-performing the SDAX, which tends to reflect cyclical trends. It seems that capital market players have a high regard for KWS’ strategy and its long-term orientation. In an analysis conducted over several years, Hauck & Aufhäuser found that companies characterized by family ownership perform
significantly better over the long term. The bank’s experts regard one key reason for this as being that such compa-nies usually focus on their established core business, are often the market leader and have earned their position through a successful blend of tradition and innovation.
In addition, a capital expense analysis by A.T. Kearney dem-onstrates that enterprises that operate in sustainable fashion typically have better medium-term economic prospects and run less commercial risk. This is confirmed by a study by the business consultants Mercer: Most scientific research reveals positive interconnections between compliance with environmental, social and governance aspects and the fi- nancial performance of capital investments. KWS is a fitting example of that.
The KWS share
Tessner Beteiligungs GmbH11.5%
Free float32.4%
Families Büchting/Arend Oetker/Giesecke56.1%
Shareholder structure on June 30, 2010
November 26, 2010 Report on the 1st quarter of 2010/2011 December 16, 2010 Annual Shareholders’ Meeting in Einbeck February 25, 2011 Report on the 2nd quarter of 2010/2011 May 27, 2011 Report on the 3rd quarter of 2010/2011 October 27, 2011 Annual press conference in Frankfurt; Analyst conference in Frankfurt November 25, 2011 Report on the 1st quarter of 2011/2012 December 14, 2011 Annual Shareholders’ Meeting in Einbeck
Financial calender
Securities identification number 707400 ISIN DE0007074007 Stock exchange identifier KWS Transparency level Prime Standard Index SDAX, GEX Share class Individual share certificates Number of shares 6,600,000 Capital stock at June 30, 2010 €19,800,000 Share price high January 4, 2010 (Xetra) €129.50 Share price low November 3, 2009 (Xetra) €110.00 Average number of shares traded – in Xetra 4,567 – in floor trading in Frankfurt 337
Key data of KWS SAAT AG
Agenda of the Annual Shareholders’ Meeting on December 16, 2010
The Company’s Executive Board hereby invites you to the
Annual Shareholders’ Meeting on Thursday, December 16, 2010, at 11 a.m.,at the Company’s premises in 37574 Einbeck, Grimsehlstraße 31, Germany.
A G E N D A
1. Presentation of the approved financial statements of KWS SAAT AG, the financial statements of the KWS Group (con-solidated financial statements) approved by the Supervisory Board, the Management Reports for KWS SAAT AG and the KWS Group for the fiscal year from July 1, 2009, to June 30, 2010, the Report of the Supervisory Board and the Ex-planatory Report by the Executive Board on the disclosures in accordance with Section 289 (4) and (5) and Section 315 (4) German Commercial Code (HGB)
2. Resolution on the appropriation of the net retained profit
3. Resolution on the ratification of the acts of the Executive Board
4. Resolution on the ratification of the acts of the Supervisory Board
5. Election of the external auditors of the financial statements of KWS SAAT AG and the consolidated financial statements for the fiscal year 2010/2011
6. Resolution on the approval of the compensation system for members of the Executive Board
Net sales of the KWS Group (5 years)in millions of €
800
600
400
200
2005
/06
2006
/07
2007
/08
2008
/09
2009
/10
+ ø 10.5 % p.a.
EBIT of the KWS Group (5 years)in millions of €
80
60
40
20
2005
/06
2006
/07
2007
/08
2008
/09
2009
/10
+ ø 15.3 % p.a.
12
7
8
6
2
53
411
10
1
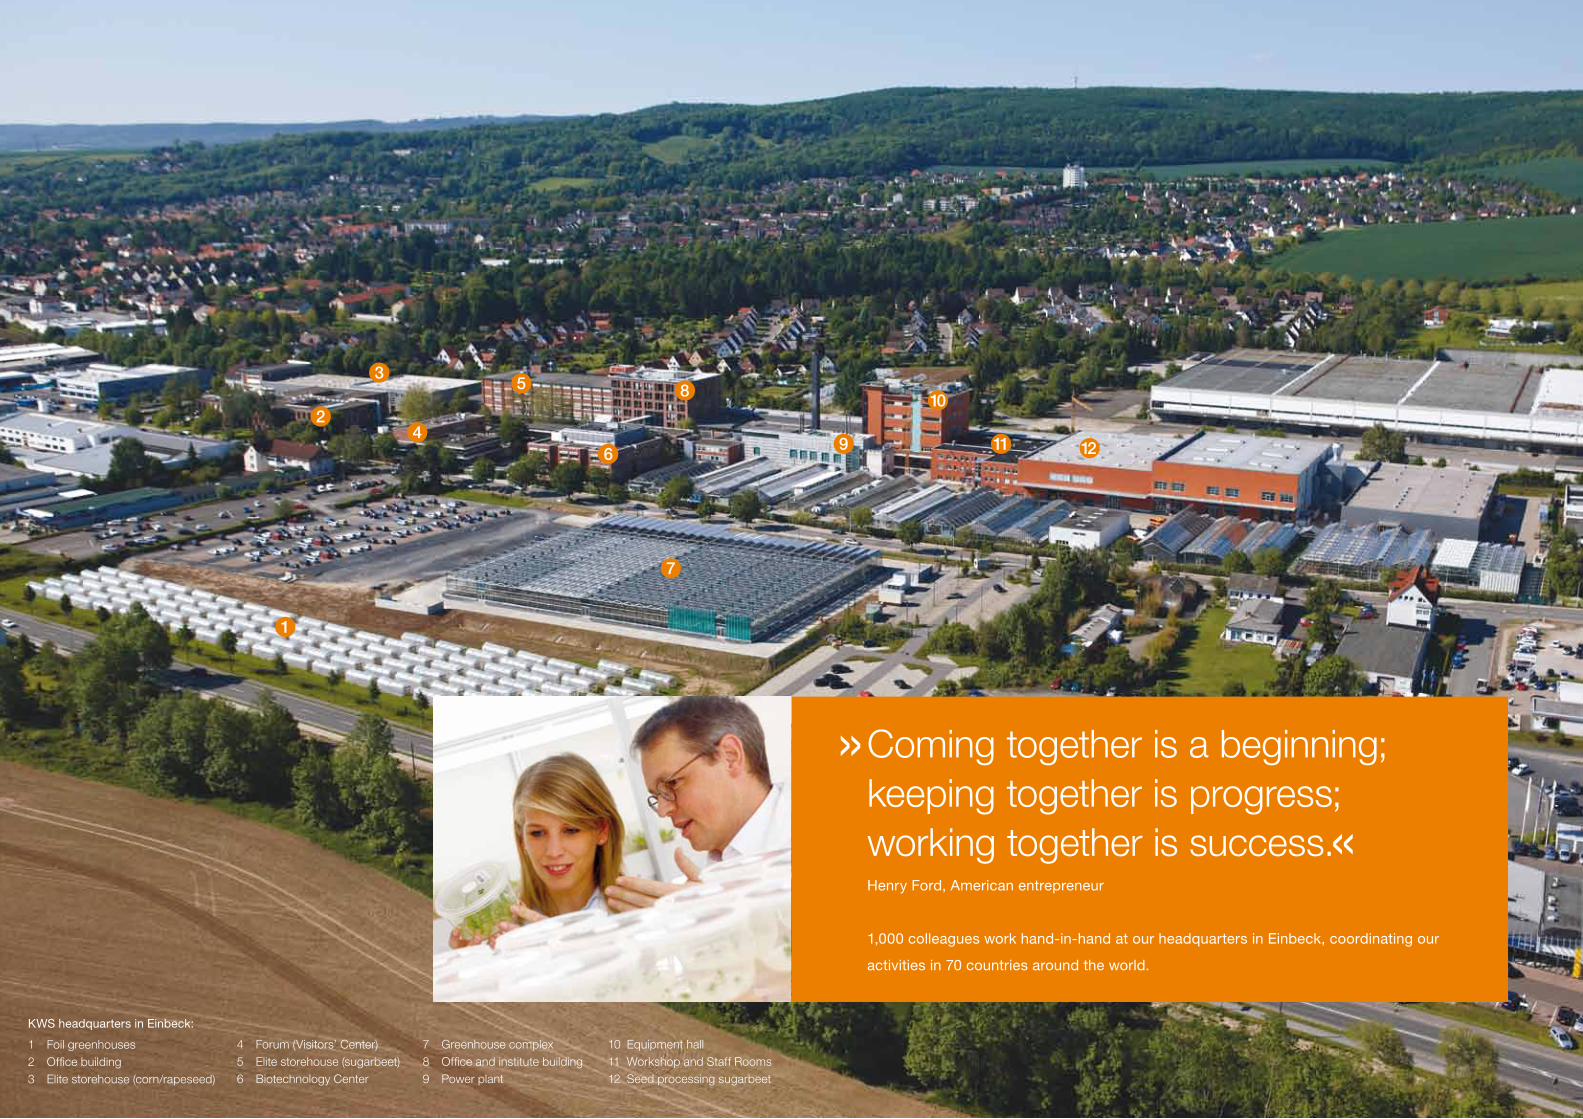
Coming together is a beginning; keeping together is progress; working together is success.«Henry Ford, American entrepreneur
1,000 colleagues work hand-in-hand at our headquarters in Einbeck, coordinating our
activities in 70 countries around the world.
KWS headquarters in Einbeck:
1 Foil greenhouses 2 Office building 3 Elite storehouse (corn/rapeseed)
4 Forum (Visitors’ Center)5 Elite storehouse (sugarbeet) 6 Biotechnology Center
7 Greenhouse complex 8 Office and institute building 9 Power plant
10 Equipment hall 11 Workshop and Staff Rooms 12 Seed processing sugarbeet
9
consequently fell to €10.5 (12.0) million, accounting for 12.7% (15.4%) of consolidated income. Our Breeding & Services Segment posted virtually constant net sales, but had to shoulder all the costs involved in expanding our R&D activities and was also impacted by a decline in internal royalties. The segment’s income therefore fell to €5.4 (17.5) million and now accounts for 6.6% (22.5%) of group income.
Net income remains constantNet financial income/expense fell by €2.2 million to € – 4.9 (– 2.7) million. This was attributable to the sharp decline in interest income as a result of the low level of interest rates for financial assets and higher interest expense for the greater funding required for
investments in expanding our capacities. The result from ordinary activities rose to €77.5 (75.2) million. Total tax ex-penditures were slightly higher at €26.0 (25.1) million, mean-ing that the tax rate for the Group increased from 33.3% in the previous year to 33.6%. Net income was €51.5 million, slightly up over the previous year (€50.1 million). The return on net sales after tax was 6.8% (7.0%).
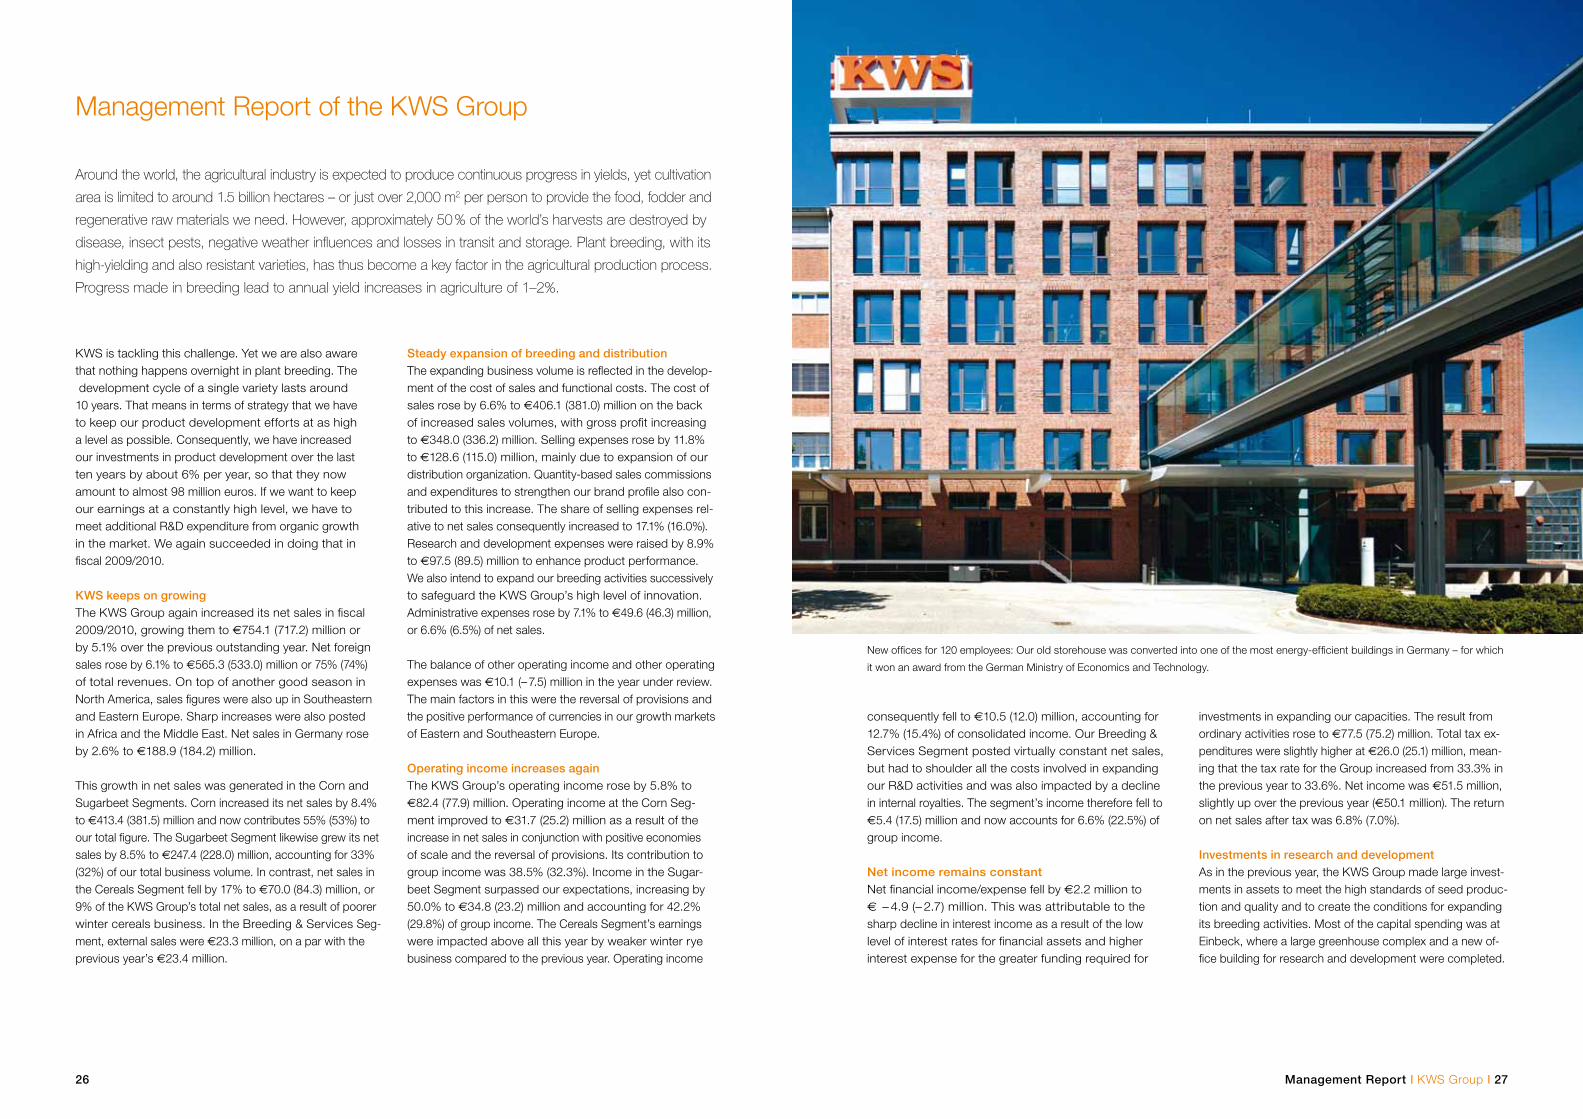
Investments in research and development As in the previous year, the KWS Group made large invest-ments in assets to meet the high standards of seed produc-tion and quality and to create the conditions for expanding its breeding activities. Most of the capital spending was at Einbeck, where a large greenhouse complex and a new of-fice building for research and development were completed.
Management Report I KWS Group I 27
New offices for 120 employees: Our old storehouse was converted into one of the most energy-efficient buildings in Germany – for which
it won an award from the German Ministry of Economics and Technology.
26
Management Report of the KWS Group
Around the world, the agricultural industry is expected to produce continuous progress in yields, yet cultivation
area is limited to around 1.5 billion hectares – or just over 2,000 m2 per person to provide the food, fodder and
regenerative raw materials we need. However, approximately 50 % of the world’s harvests are destroyed by
disease, insect pests, negative weather influences and losses in transit and storage. Plant breeding, with its
high-yielding and also resistant varieties, has thus become a key factor in the agricultural production process.
Progress made in breeding lead to annual yield increases in agriculture of 1–2%.
KWS is tackling this challenge. Yet we are also aware that nothing happens overnight in plant breeding. The development cycle of a single variety lasts around 10 years. That means in terms of strategy that we have to keep our product development efforts at as high a level as possible. Consequently, we have increased our investments in product development over the last ten years by about 6% per year, so that they now amount to almost 98 million euros. If we want to keep our earnings at a constantly high level, we have to meet additional R&D expenditure from organic growth in the market. We again succeeded in doing that in fiscal 2009/2010.
KWS keeps on growingThe KWS Group again increased its net sales in fiscal 2009/2010, growing them to €754.1 (717.2) million or by 5.1% over the previous outstanding year. Net foreign sales rose by 6.1% to €565.3 (533.0) million or 75% (74%) of total revenues. On top of another good season in North America, sales figures were also up in Southeastern and Eastern Europe. Sharp increases were also posted in Africa and the Middle East. Net sales in Germany rose by 2.6% to €188.9 (184.2) million.
This growth in net sales was generated in the Corn and Sugarbeet Segments. Corn increased its net sales by 8.4% to €413.4 (381.5) million and now contributes 55% (53%) to our total figure. The Sugarbeet Segment likewise grew its net sales by 8.5% to €247.4 (228.0) million, accounting for 33% (32%) of our total business volume. In contrast, net sales in the Cereals Segment fell by 17% to €70.0 (84.3) million, or 9% of the KWS Group’s total net sales, as a result of poorer winter cereals business. In the Breeding & Services Seg-ment, external sales were €23.3 million, on a par with the previous year’s €23.4 million.
Steady expansion of breeding and distributionThe expanding business volume is reflected in the develop-ment of the cost of sales and functional costs. The cost of sales rose by 6.6% to €406.1 (381.0) million on the back of increased sales volumes, with gross profit increasing to €348.0 (336.2) million. Selling expenses rose by 11.8% to €128.6 (115.0) million, mainly due to expansion of our distribution organization. Quantity-based sales commissions and expenditures to strengthen our brand profile also con-tributed to this increase. The share of selling expenses rel-ative to net sales consequently increased to 17.1% (16.0%). Research and development expenses were raised by 8.9% to €97.5 (89.5) million to enhance product performance. We also intend to expand our breeding activities successively to safeguard the KWS Group’s high level of innovation. Administrative expenses rose by 7.1% to €49.6 (46.3) million, or 6.6% (6.5%) of net sales.
The balance of other operating income and other operating expenses was €10.1 (– 7.5) million in the year under review. The main factors in this were the reversal of provisions and the positive performance of currencies in our growth markets of Eastern and Southeastern Europe.
Operating income increases againThe KWS Group’s operating income rose by 5.8% to €82.4 (77.9) million. Operating income at the Corn Seg-ment improved to €31.7 (25.2) million as a result of the increase in net sales in conjunction with positive economies of scale and the reversal of provisions. Its contribution to group income was 38.5% (32.3%). Income in the Sugar-beet Segment surpassed our expectations, increasing by 50.0% to €34.8 (23.2) million and accounting for 42.2% (29.8%) of group income. The Cereals Segment’s earnings were impacted above all this year by weaker winter rye business compared to the previous year. Operating income
Management Report I KWS Group I 29
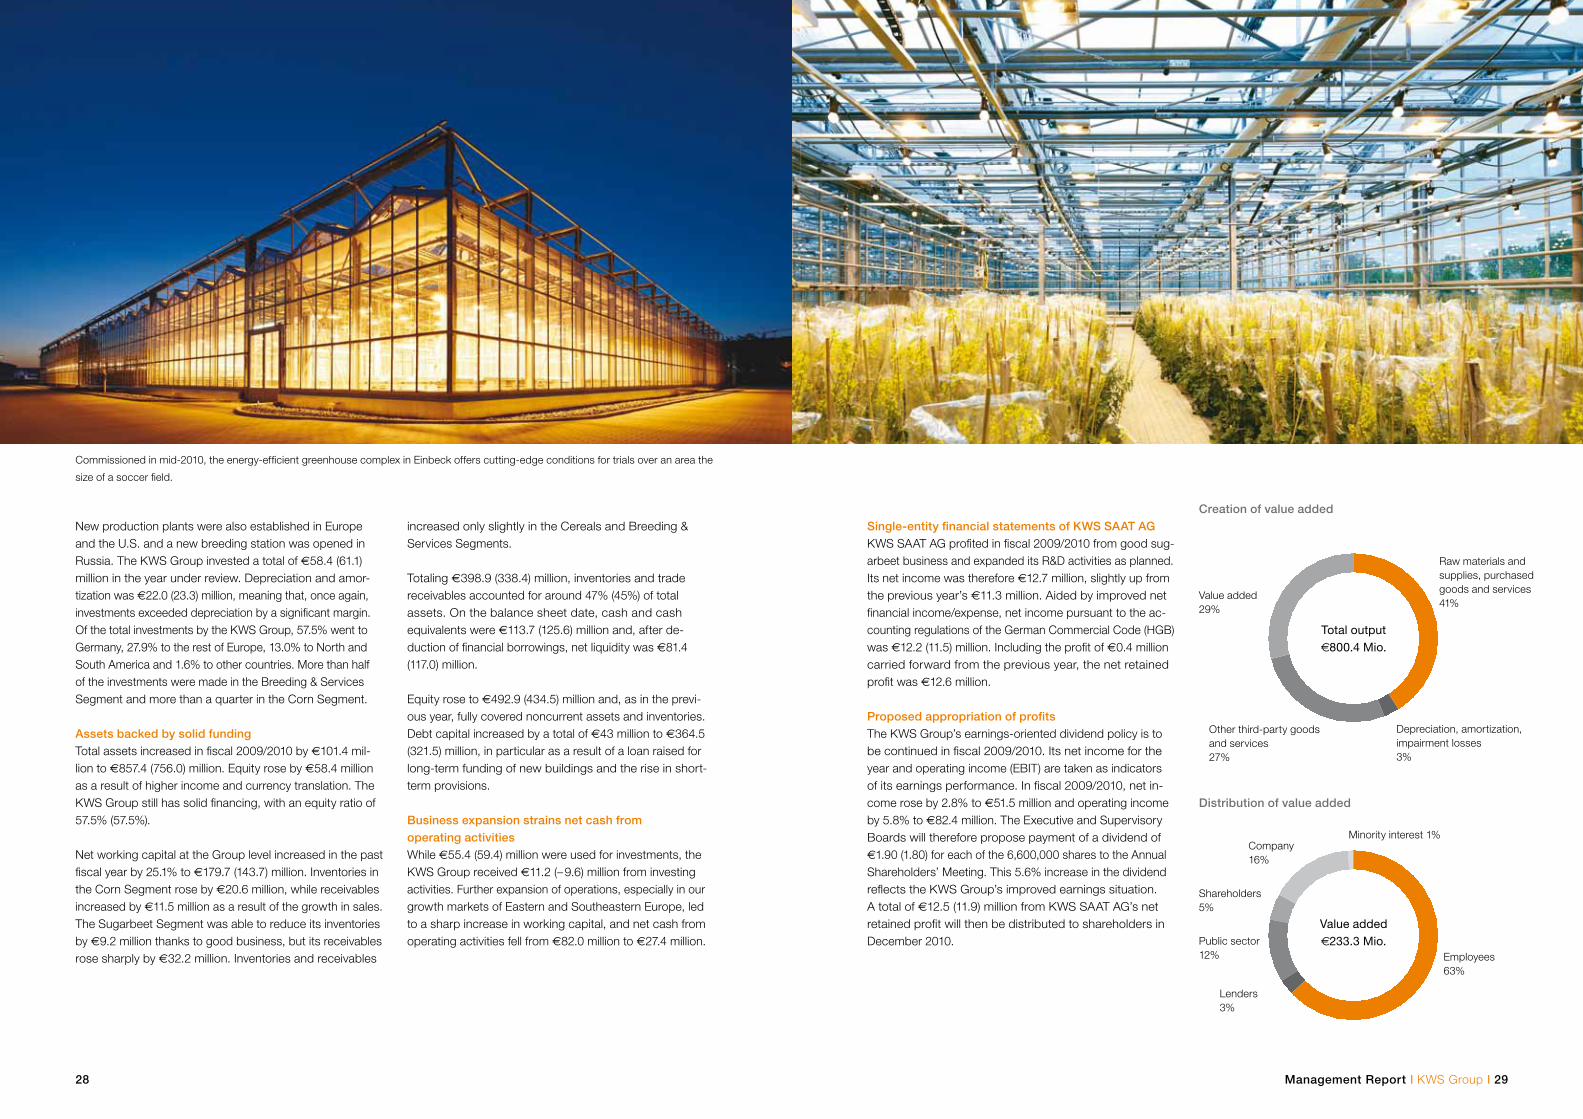
increased only slightly in the Cereals and Breeding & Services Segments.
Totaling €398.9 (338.4) million, inventories and trade receivables accounted for around 47% (45%) of total assets. On the balance sheet date, cash and cash equivalents were €113.7 (125.6) million and, after de-duction of financial borrowings, net liquidity was €81.4 (117.0) million.
Equity rose to €492.9 (434.5) million and, as in the previ-ous year, fully covered noncurrent assets and inventories. Debt capital increased by a total of €43 million to €364.5 (321.5) million, in particular as a result of a loan raised for long-term funding of new buildings and the rise in short-term provisions.
Business expansion strains net cash from operating activitiesWhile €55.4 (59.4) million were used for investments, the KWS Group received €11.2 (– 9.6) million from investing activities. Further expansion of operations, especially in our growth markets of Eastern and Southeastern Europe, led to a sharp increase in working capital, and net cash from operating activities fell from €82.0 million to €27.4 million.
28
New production plants were also established in Europe and the U.S. and a new breeding station was opened in Russia. The KWS Group invested a total of €58.4 (61.1) million in the year under review. Depreciation and amor-tization was €22.0 (23.3) million, meaning that, once again, investments exceeded depreciation by a significant margin. Of the total investments by the KWS Group, 57.5% went to Germany, 27.9% to the rest of Europe, 13.0% to North and South America and 1.6% to other countries. More than half of the investments were made in the Breeding & Services Segment and more than a quarter in the Corn Segment.
Assets backed by solid fundingTotal assets increased in fiscal 2009/2010 by €101.4 mil-lion to €857.4 (756.0) million. Equity rose by €58.4 million as a result of higher income and currency translation. The KWS Group still has solid financing, with an equity ratio of 57.5% (57.5%).
Net working capital at the Group level increased in the past fiscal year by 25.1% to €179.7 (143.7) million. Inventories in the Corn Segment rose by €20.6 million, while receivables increased by €11.5 million as a result of the growth in sales. The Sugarbeet Segment was able to reduce its inventories by €9.2 million thanks to good business, but its receivables rose sharply by €32.2 million. Inventories and receivables
Commissioned in mid-2010, the energy-efficient greenhouse complex in Einbeck offers cutting-edge conditions for trials over an area the
size of a soccer field.
Raw materials and supplies, purchased goods and services41%
Depreciation, amortization, impairment losses3%
Total output€800.4 Mio.
Value added29%
Other third-party goods and services27%
Creation of value added
Distribution of value added
Minority interest 1%
Employees63%
Value added€233.3 Mio.
Company 16%
Lenders3%
Public sector 12%
Shareholders 5%
Single-entity financial statements of KWS SAAT AG KWS SAAT AG profited in fiscal 2009/2010 from good sug-arbeet business and expanded its R&D activities as planned. Its net income was therefore €12.7 million, slightly up from the previous year’s €11.3 million. Aided by improved net financial income/expense, net income pursuant to the ac-counting regulations of the German Commercial Code (HGB) was €12.2 (11.5) million. Including the profit of €0.4 million carried forward from the previous year, the net retained profit was €12.6 million.
Proposed appropriation of profitsThe KWS Group’s earnings-oriented dividend policy is to be continued in fiscal 2009/2010. Its net income for the year and operating income (EBIT) are taken as indicators of its earnings performance. In fiscal 2009/2010, net in-come rose by 2.8% to €51.5 million and operating income by 5.8% to €82.4 million. The Executive and Supervisory Boards will therefore propose payment of a dividend of €1.90 (1.80) for each of the 6,600,000 shares to the Annual Shareholders’ Meeting. This 5.6% increase in the dividend reflects the KWS Group’s improved earnings situation. A total of €12.5 (11.9) million from KWS SAAT AG’s net retained profit will then be distributed to shareholders in December 2010.
Experience is the seed from which wisdom sprouts.«Konrad Adenauer, first German Chancellor
And our experience has taught us that there is more potential hidden in plants than we
suspect. That is the reason for our unflagging research work.
Management Report I Sugarbeet Segment I 33
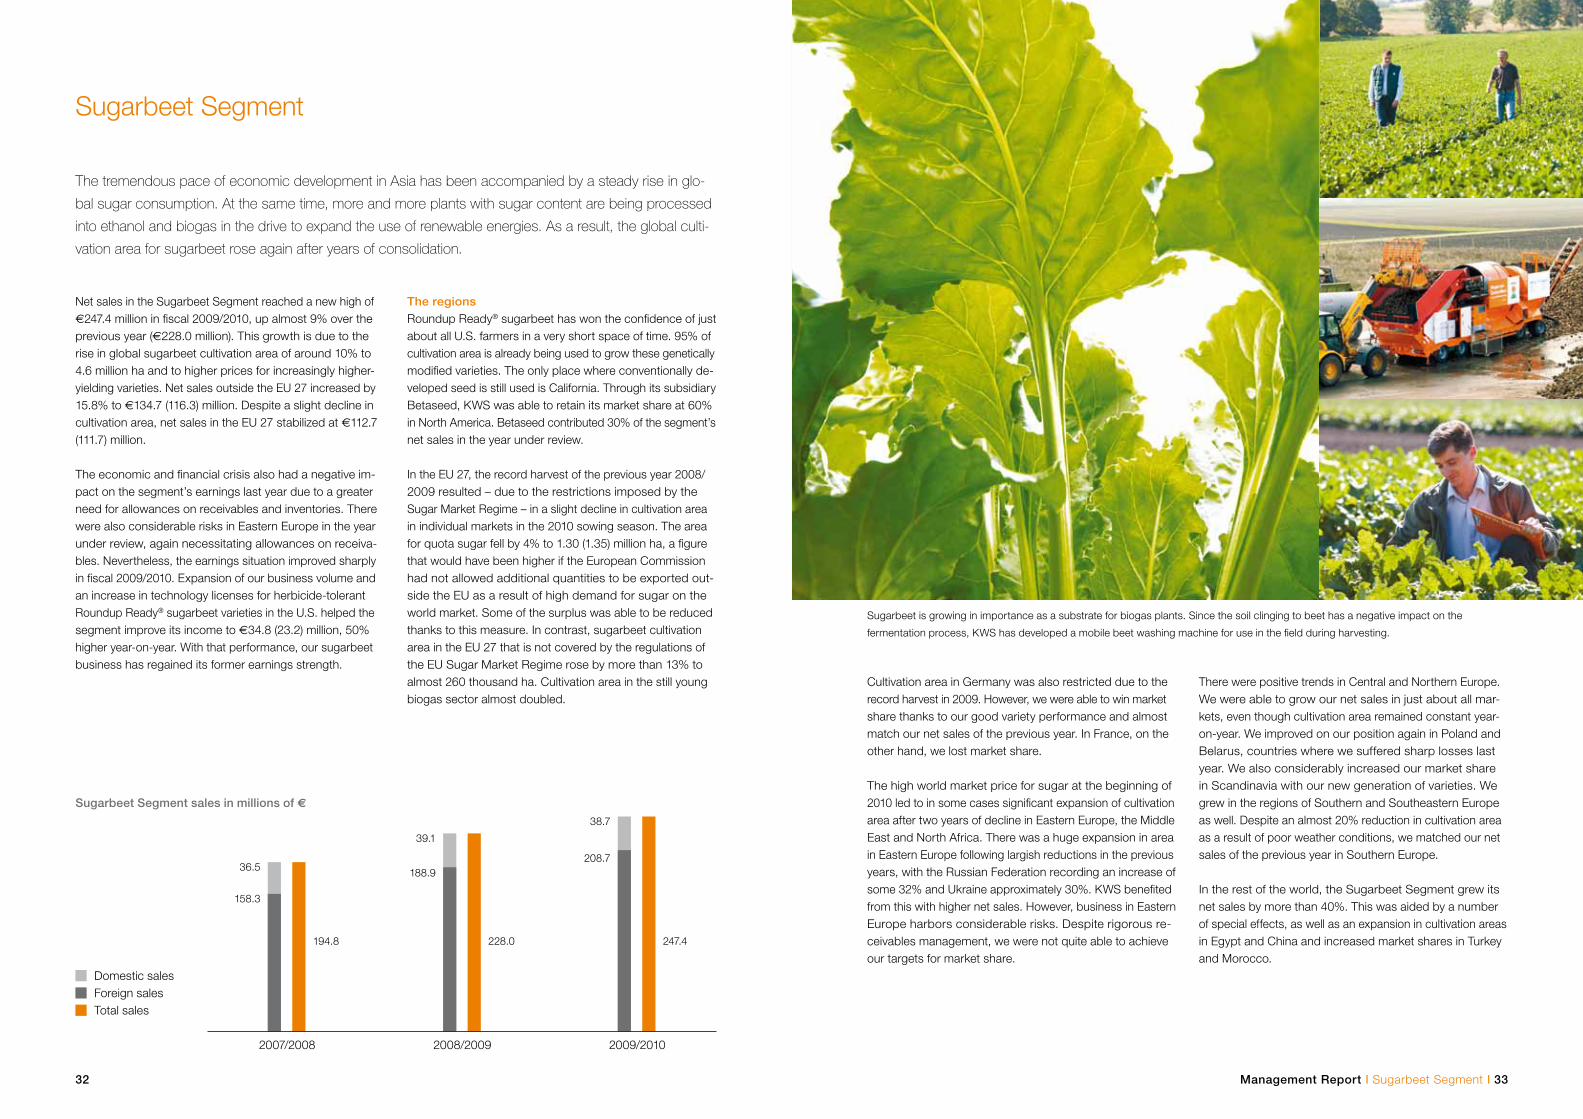
Sugarbeet is growing in importance as a substrate for biogas plants. Since the soil clinging to beet has a negative impact on the
fermentation process, KWS has developed a mobile beet washing machine for use in the field during harvesting.
Cultivation area in Germany was also restricted due to the record harvest in 2009. However, we were able to win market share thanks to our good variety performance and almost match our net sales of the previous year. In France, on the other hand, we lost market share.
The high world market price for sugar at the beginning of 2010 led to in some cases significant expansion of cultivation area after two years of decline in Eastern Europe, the Middle East and North Africa. There was a huge expansion in area in Eastern Europe following largish reductions in the previous years, with the Russian Federation recording an increase of some 32% and Ukraine approximately 30%. KWS benefited from this with higher net sales. However, business in Eastern Europe harbors considerable risks. Despite rigorous re-ceivables management, we were not quite able to achieve our targets for market share.
There were positive trends in Central and Northern Europe. We were able to grow our net sales in just about all mar-kets, even though cultivation area remained constant year-on-year. We improved on our position again in Poland and Belarus, countries where we suffered sharp losses last year. We also considerably increased our market share in Scandinavia with our new generation of varieties. We grew in the regions of Southern and Southeastern Europe as well. Despite an almost 20% reduction in cultivation area as a result of poor weather conditions, we matched our net sales of the previous year in Southern Europe.
In the rest of the world, the Sugarbeet Segment grew its net sales by more than 40%. This was aided by a number of special effects, as well as an expansion in cultivation areas in Egypt and China and increased market shares in Turkey and Morocco.
32
Sugarbeet Segment
The tremendous pace of economic development in Asia has been accompanied by a steady rise in glo-
bal sugar consumption. At the same time, more and more plants with sugar content are being processed
into ethanol and biogas in the drive to expand the use of renewable energies. As a result, the global culti-
vation area for sugarbeet rose again after years of consolidation.
Net sales in the Sugarbeet Segment reached a new high of €247.4 million in fiscal 2009/2010, up almost 9% over the previous year (€228.0 million). This growth is due to the rise in global sugarbeet cultivation area of around 10% to 4.6 million ha and to higher prices for increasingly higher-yielding varieties. Net sales outside the EU 27 increased by 15.8% to €134.7 (116.3) million. Despite a slight decline in cultivation area, net sales in the EU 27 stabilized at €112.7 (111.7) million.
The economic and financial crisis also had a negative im-pact on the segment’s earnings last year due to a greater need for allowances on receivables and inventories. There were also considerable risks in Eastern Europe in the year under review, again necessitating allowances on receiva-bles. Nevertheless, the earnings situation improved sharply in fiscal 2009/2010. Expansion of our business volume and an increase in technology licenses for herbicide-tolerant Roundup Ready® sugarbeet varieties in the U.S. helped the segment improve its income to €34.8 (23.2) million, 50% higher year-on-year. With that performance, our sugarbeet business has regained its former earnings strength.
The regionsRoundup Ready® sugarbeet has won the confidence of just about all U.S. farmers in a very short space of time. 95% of cultivation area is already being used to grow these genetically modified varieties. The only place where conventionally de-veloped seed is still used is California. Through its subsidiary Betaseed, KWS was able to retain its market share at 60% in North America. Betaseed contributed 30% of the segment’s net sales in the year under review.
In the EU 27, the record harvest of the previous year 2008/ 2009 resulted – due to the restrictions imposed by the Sugar Market Regime – in a slight decline in cultivation area in individual markets in the 2010 sowing season. The area for quota sugar fell by 4% to 1.30 (1.35) million ha, a figure that would have been higher if the European Commission had not allowed additional quantities to be exported out-side the EU as a result of high demand for sugar on the world market. Some of the surplus was able to be reduced thanks to this measure. In contrast, sugarbeet cultivation area in the EU 27 that is not covered by the regulations of the EU Sugar Market Regime rose by more than 13% to almost 260 thousand ha. Cultivation area in the still young biogas sector almost doubled.
Sugarbeet Segment sales in millions of €
38.7
36.5
2007/2008 2008/2009 2009/2010
Domestic salesForeign salesTotal sales
39.1
208.7
158.3
188.9
247.4194.8 228.0
34
However, seed availability is a particular problem in the EU. Supposed traces of genetic modifications in conventional seed repeatedly demonstrate that threshold values for seed are urgently needed. As a matter of principle, corn breeders have their seed examined for genetic changes by certified laboratories before shipping it. Affected seed stocks are immediately withdrawn. However, zero tolerance or 100% purity is not feasible in an open production proc-ess – nor is it necessary, given that the genetic modifica-tions in question are approved as food and fodder in the EU and millions of tons of such food and feed are import-ed, processed and consumed. Only the introduction of thresholds above the technical detection limit can ensure meaningful information and legal certainty at all levels of the production chain.
The value of corn seed for farmers is also determined by extensive dressing. However, sufficiently effective insecticidal seed dressings have been available to corn breeders only in few countries up to now. The national approval authorities have adopted a very restrictive policy toward new active substances. Farmers in many regions have suffered yield loss as a result of pests. KWS backs all official measures that help improve the use of dressings. Among other things, KWS promotes certification of all seed dressers.
Oil seed accounted for 12.2% of the Corn Segment’s net sales, down slightly from the previous year (13.6%). The main contributors were soybean in the U.S. and rapeseed and sunflower in Europe.
Management Report I Corn Segment I 35
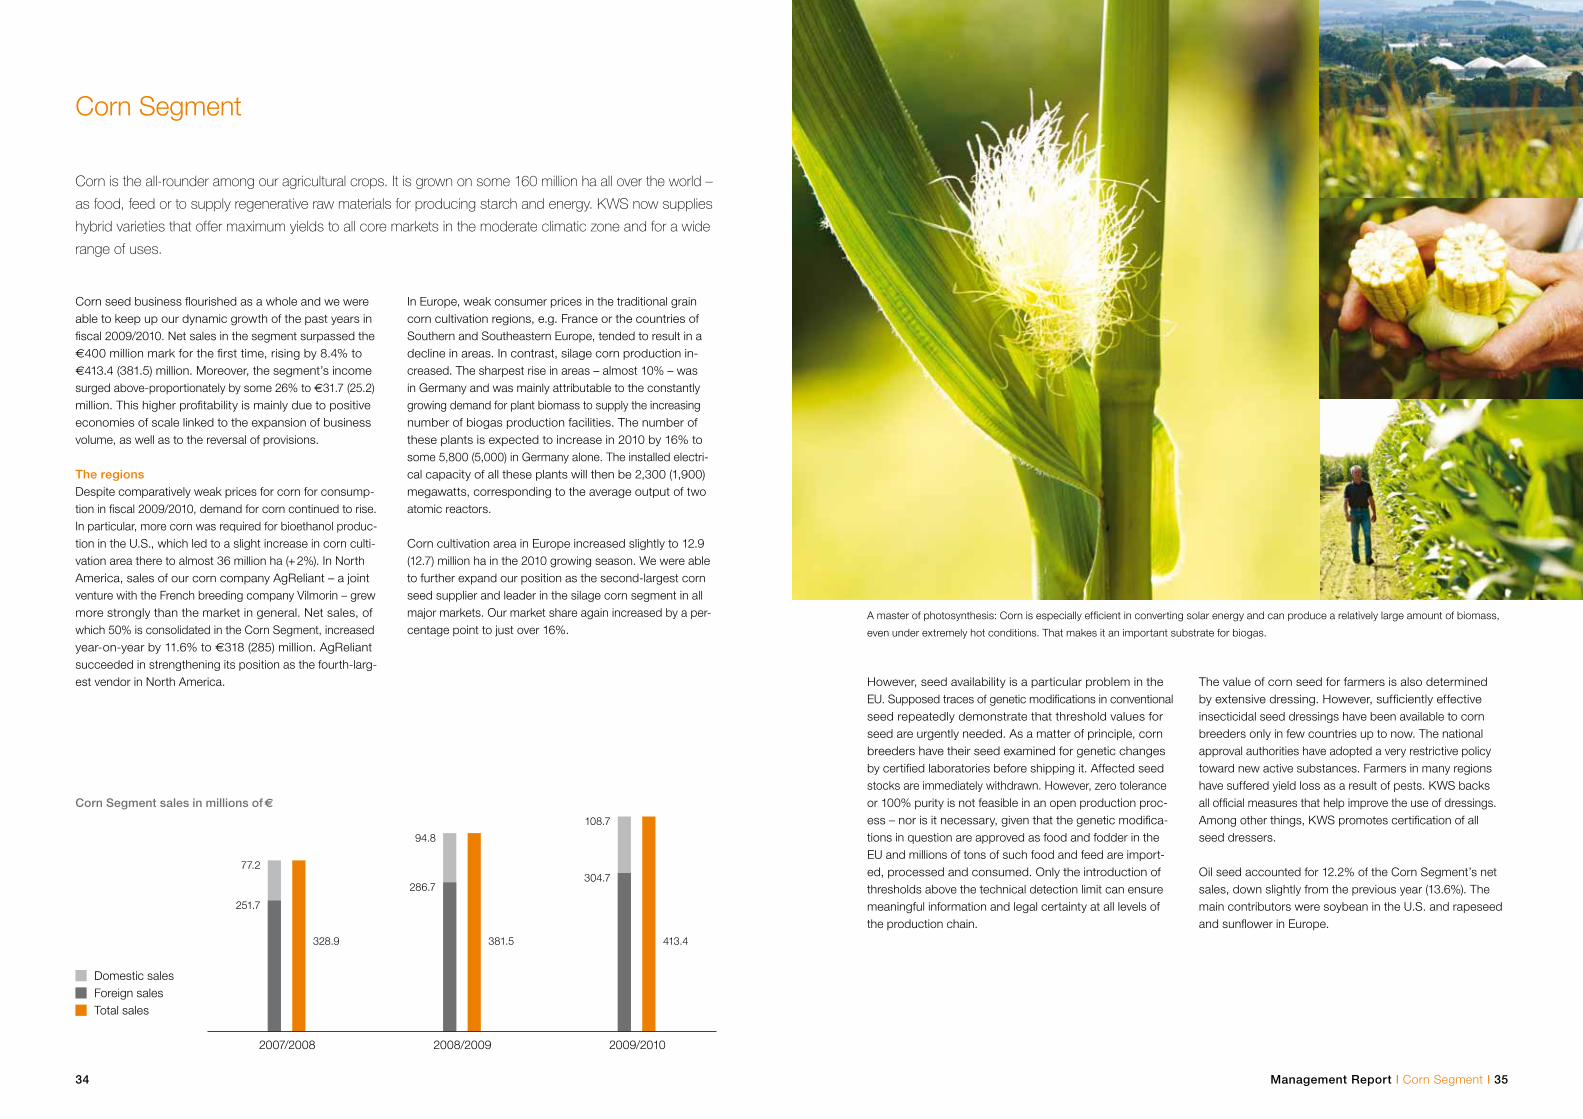
A master of photosynthesis: Corn is especially efficient in converting solar energy and can produce a relatively large amount of biomass,
even under extremely hot conditions. That makes it an important substrate for biogas.
Corn Segment
Corn is the all-rounder among our agricultural crops. It is grown on some 160 million ha all over the world –
as food, feed or to supply regenerative raw materials for producing starch and energy. KWS now supplies
hybrid varieties that offer maximum yields to all core markets in the moderate climatic zone and for a wide
range of uses.
Corn seed business flourished as a whole and we were able to keep up our dynamic growth of the past years in fiscal 2009/2010. Net sales in the segment surpassed the €400 million mark for the first time, rising by 8.4% to €413.4 (381.5) million. Moreover, the segment’s income surged above-proportionately by some 26% to €31.7 (25.2) million. This higher profitability is mainly due to positive economies of scale linked to the expansion of business volume, as well as to the reversal of provisions.
The regionsDespite comparatively weak prices for corn for consump-tion in fiscal 2009/2010, demand for corn continued to rise. In particular, more corn was required for bioethanol produc-tion in the U.S., which led to a slight increase in corn culti-vation area there to almost 36 million ha (+ 2%). In North America, sales of our corn company AgReliant – a joint venture with the French breeding company Vilmorin – grew more strongly than the market in general. Net sales, of which 50% is consolidated in the Corn Segment, increased year-on-year by 11.6% to €318 (285) million. AgReliant succeeded in strengthening its position as the fourth-larg-est vendor in North America.
In Europe, weak consumer prices in the traditional grain corn cultivation regions, e.g. France or the countries of Southern and Southeastern Europe, tended to result in a decline in areas. In contrast, silage corn production in-creased. The sharpest rise in areas – almost 10% – was in Germany and was mainly attributable to the constantly growing demand for plant biomass to supply the increasing number of biogas production facilities. The number of these plants is expected to increase in 2010 by 16% to some 5,800 (5,000) in Germany alone. The installed electri-cal capacity of all these plants will then be 2,300 (1,900) megawatts, corresponding to the average output of two atomic reactors.
Corn cultivation area in Europe increased slightly to 12.9 (12.7) million ha in the 2010 growing season. We were able to further expand our position as the second-largest corn seed supplier and leader in the silage corn segment in all major markets. Our market share again increased by a per-centage point to just over 16%.
Corn Segment sales in millions of €
108.7
77.2
2007/2008 2008/2009 2009/2010
Domestic salesForeign salesTotal sales
94.8
304.7
251.7
286.7
413.4328.9 381.5
Management Report I Cereals Segment I 37
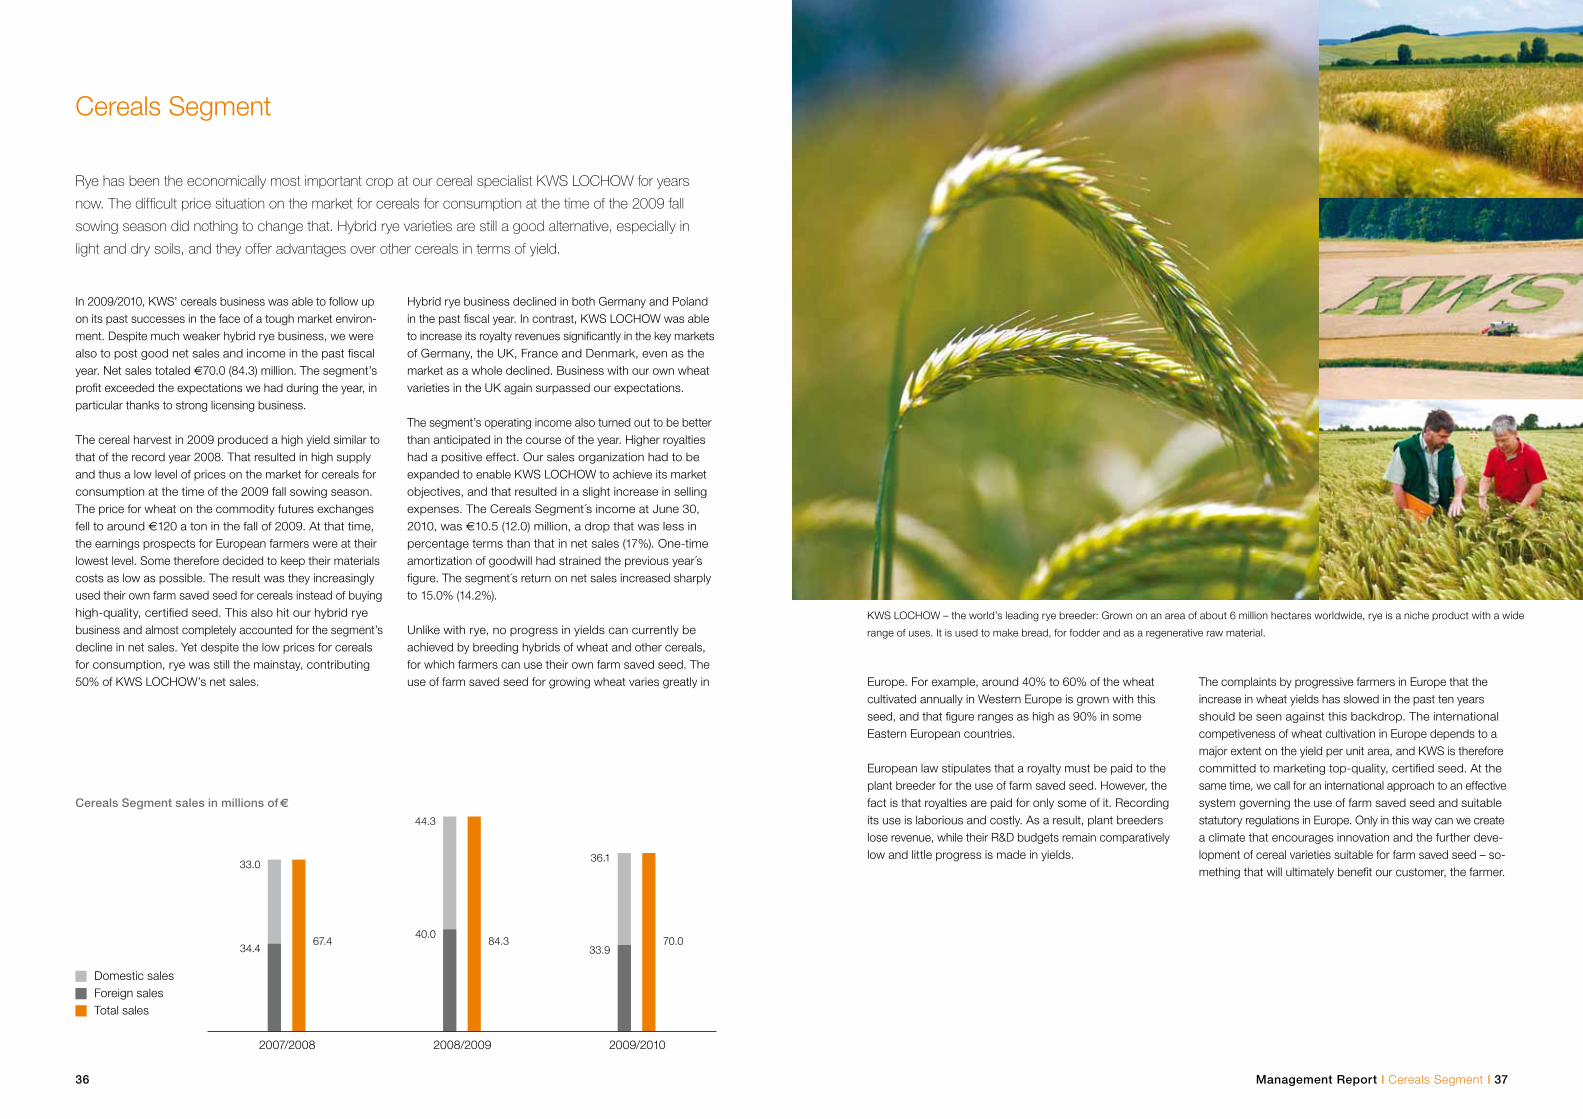
KWS LOCHOW – the world’s leading rye breeder: Grown on an area of about 6 million hectares worldwide, rye is a niche product with a wide
range of uses. It is used to make bread, for fodder and as a regenerative raw material.
36
Cereals Segment
Rye has been the economically most important crop at our cereal specialist KWS LOCHOW for years
now. The difficult price situation on the market for cereals for consumption at the time of the 2009 fall
sowing season did nothing to change that. Hybrid rye varieties are still a good alternative, especially in
light and dry soils, and they offer advantages over other cereals in terms of yield.
In 2009/2010, KWS’ cereals business was able to follow up on its past successes in the face of a tough market environ-ment. Despite much weaker hybrid rye business, we were also to post good net sales and income in the past fiscal year. Net sales totaled €70.0 (84.3) million. The segment’s profit exceeded the expectations we had during the year, in particular thanks to strong licensing business.
The cereal harvest in 2009 produced a high yield similar to that of the record year 2008. That resulted in high supply and thus a low level of prices on the market for cereals for consumption at the time of the 2009 fall sowing season. The price for wheat on the commodity futures exchanges fell to around €120 a ton in the fall of 2009. At that time, the earnings prospects for European farmers were at their lowest level. Some therefore decided to keep their materials costs as low as possible. The result was they increasingly used their own farm saved seed for cereals instead of buying high-quality, certified seed. This also hit our hybrid rye business and almost completely accounted for the segment’s decline in net sales. Yet despite the low prices for cereals for consumption, rye was still the mainstay, contributing 50% of KWS LOCHOW’s net sales.
Hybrid rye business declined in both Germany and Poland in the past fiscal year. In contrast, KWS LOCHOW was able to increase its royalty revenues significantly in the key markets of Germany, the UK, France and Denmark, even as the market as a whole declined. Business with our own wheat varieties in the UK again surpassed our expectations.
The segment’s operating income also turned out to be better than anticipated in the course of the year. Higher royalties had a positive effect. Our sales organization had to be expanded to enable KWS LOCHOW to achieve its market objectives, and that resulted in a slight increase in selling expenses. The Cereals Segment´s income at June 30, 2010, was €10.5 (12.0) million, a drop that was less in percentage terms than that in net sales (17%). One-time amortization of goodwill had strained the previous year´s figure. The segment´s return on net sales increased sharply to 15.0% (14.2%).
Unlike with rye, no progress in yields can currently be achieved by breeding hybrids of wheat and other cereals, for which farmers can use their own farm saved seed. The use of farm saved seed for growing wheat varies greatly in
Cereals Segment sales in millions of €
36.133.0
2007/2008 2008/2009 2009/2010
Domestic salesForeign salesTotal sales
44.3
33.934.440.0
70.067.4 84.3
Europe. For example, around 40% to 60% of the wheat cultivated annually in Western Europe is grown with this seed, and that figure ranges as high as 90% in some Eastern European countries.
European law stipulates that a royalty must be paid to the plant breeder for the use of farm saved seed. However, the fact is that royalties are paid for only some of it. Recording its use is laborious and costly. As a result, plant breeders lose revenue, while their R&D budgets remain comparatively low and little progress is made in yields.
The complaints by progressive farmers in Europe that the increase in wheat yields has slowed in the past ten years should be seen against this backdrop. The international competiveness of wheat cultivation in Europe depends to a major extent on the yield per unit area, and KWS is therefore committed to marketing top-quality, certified seed. At the same time, we call for an international approach to an effective system governing the use of farm saved seed and suitable statutory regulations in Europe. Only in this way can we create a climate that encourages innovation and the further deve-lopment of cereal varieties suitable for farm saved seed – so-mething that will ultimately benefit our customer, the farmer.
A journey of a thousand miles begins with a single step.«Lao Tze, Chinese philosopher
We have already taken the first step on the journey into the world of the plant genome
– and we’re sure we’ll make many discoveries.
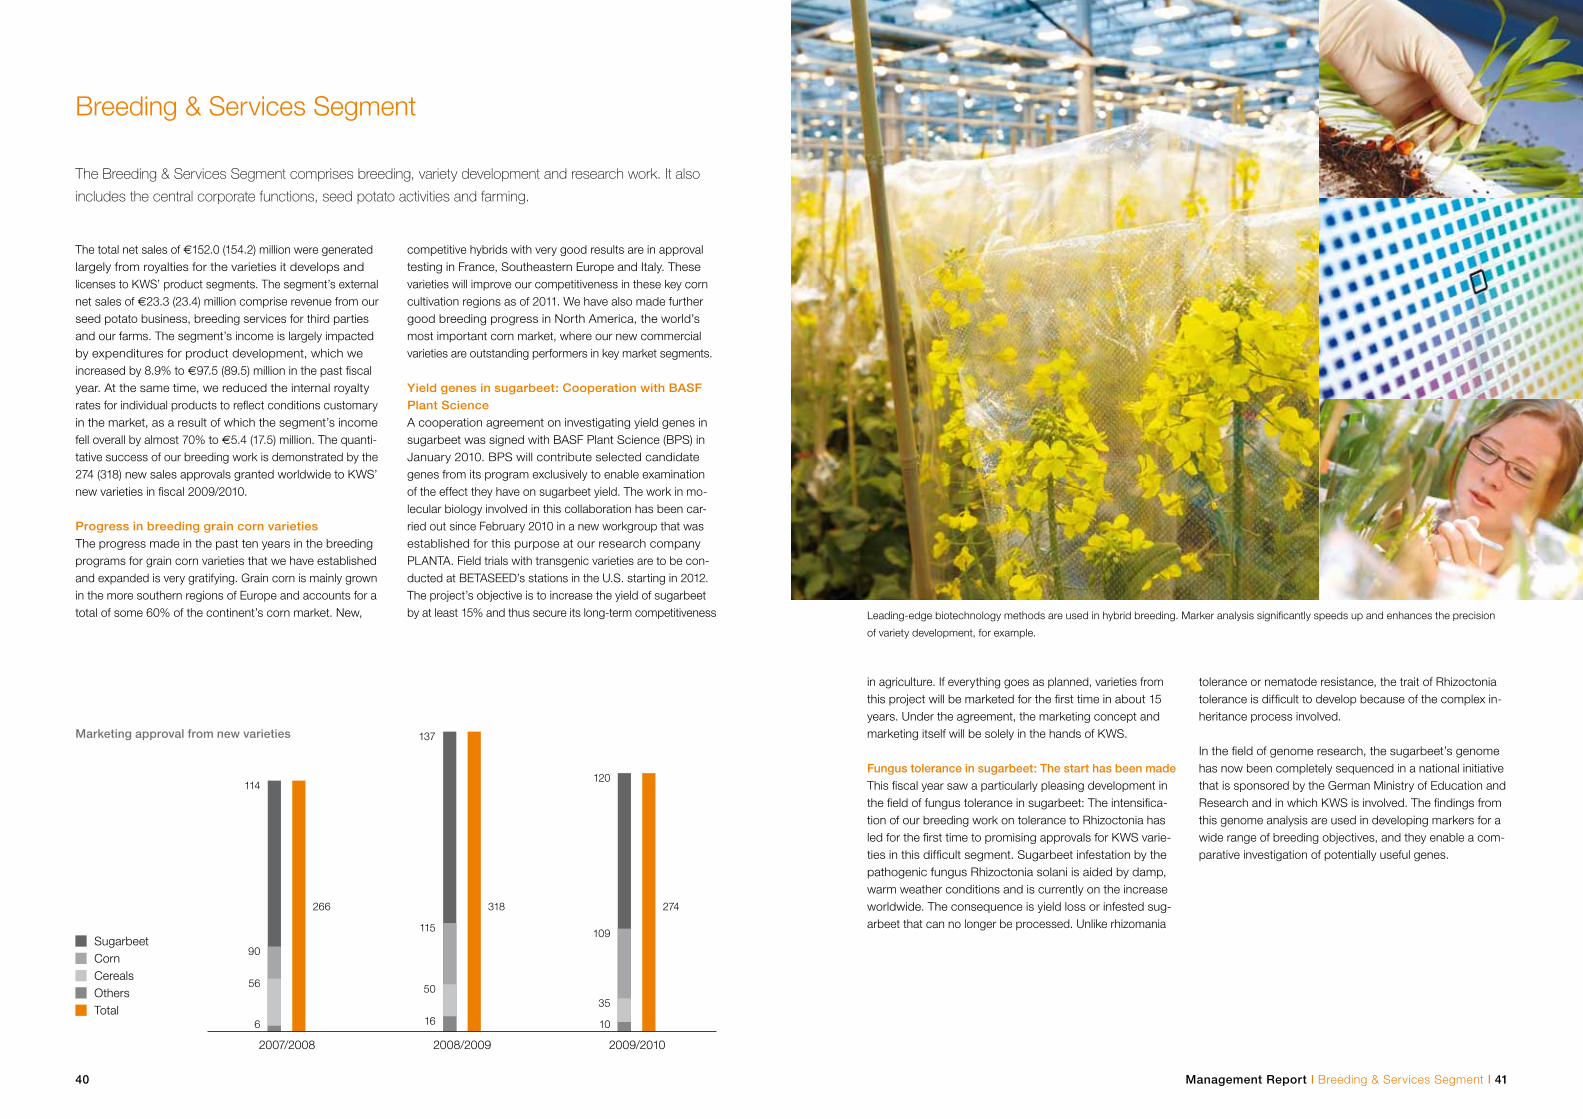
Management Report I Breeding & Services Segment I 41
Leading-edge biotechnology methods are used in hybrid breeding. Marker analysis significantly speeds up and enhances the precision
of variety development, for example.
40
Breeding & Services Segment
The Breeding & Services Segment comprises breeding, variety development and research work. It also
includes the central corporate functions, seed potato activities and farming.
120114
2007/2008 2008/2009 2009/2010
SugarbeetCornCerealsOthersTotal
137
109
35
10
90
56
6
115
50
16
274266 318
Marketing approval from new varieties
competitive hybrids with very good results are in approval testing in France, Southeastern Europe and Italy. These varieties will improve our competitiveness in these key corn cultivation regions as of 2011. We have also made further good breeding progress in North America, the world’s most important corn market, where our new commercial varieties are outstanding performers in key market segments.
Yield genes in sugarbeet: Cooperation with BASF Plant ScienceA cooperation agreement on investigating yield genes in sugarbeet was signed with BASF Plant Science (BPS) in January 2010. BPS will contribute selected candidate genes from its program exclusively to enable examination of the effect they have on sugarbeet yield. The work in mo-lecular biology involved in this collaboration has been car-ried out since February 2010 in a new workgroup that was established for this purpose at our research company PLANTA. Field trials with transgenic varieties are to be con-ducted at BETASEED’s stations in the U.S. starting in 2012. The project’s objective is to increase the yield of sugarbeet by at least 15% and thus secure its long-term competitiveness
The total net sales of €152.0 (154.2) million were generated largely from royalties for the varieties it develops and licenses to KWS’ product segments. The segment’s external net sales of €23.3 (23.4) million comprise revenue from our seed potato business, breeding services for third parties and our farms. The segment’s income is largely impacted by expenditures for product development, which we increased by 8.9% to €97.5 (89.5) million in the past fiscal year. At the same time, we reduced the internal royalty rates for individual products to reflect conditions customary in the market, as a result of which the segment’s income fell overall by almost 70% to €5.4 (17.5) million. The quanti-tative success of our breeding work is demonstrated by the 274 (318) new sales approvals granted worldwide to KWS’ new varieties in fiscal 2009/2010.
Progress in breeding grain corn varieties The progress made in the past ten years in the breeding programs for grain corn varieties that we have established and expanded is very gratifying. Grain corn is mainly grown in the more southern regions of Europe and accounts for a total of some 60% of the continent’s corn market. New,
in agriculture. If everything goes as planned, varieties from this project will be marketed for the first time in about 15 years. Under the agreement, the marketing concept and marketing itself will be solely in the hands of KWS.
Fungus tolerance in sugarbeet: The start has been madeThis fiscal year saw a particularly pleasing development in the field of fungus tolerance in sugarbeet: The intensifica-tion of our breeding work on tolerance to Rhizoctonia has led for the first time to promising approvals for KWS varie-ties in this difficult segment. Sugarbeet infestation by the pathogenic fungus Rhizoctonia solani is aided by damp, warm weather conditions and is currently on the increase worldwide. The consequence is yield loss or infested sug-arbeet that can no longer be processed. Unlike rhizomania
tolerance or nematode resistance, the trait of Rhizoctonia tolerance is difficult to develop because of the complex in-heritance process involved.
In the field of genome research, the sugarbeet’s genome has now been completely sequenced in a national initiative that is sponsored by the German Ministry of Education and Research and in which KWS is involved. The findings from this genome analysis are used in developing markers for a wide range of breeding objectives, and they enable a com-parative investigation of potentially useful genes.
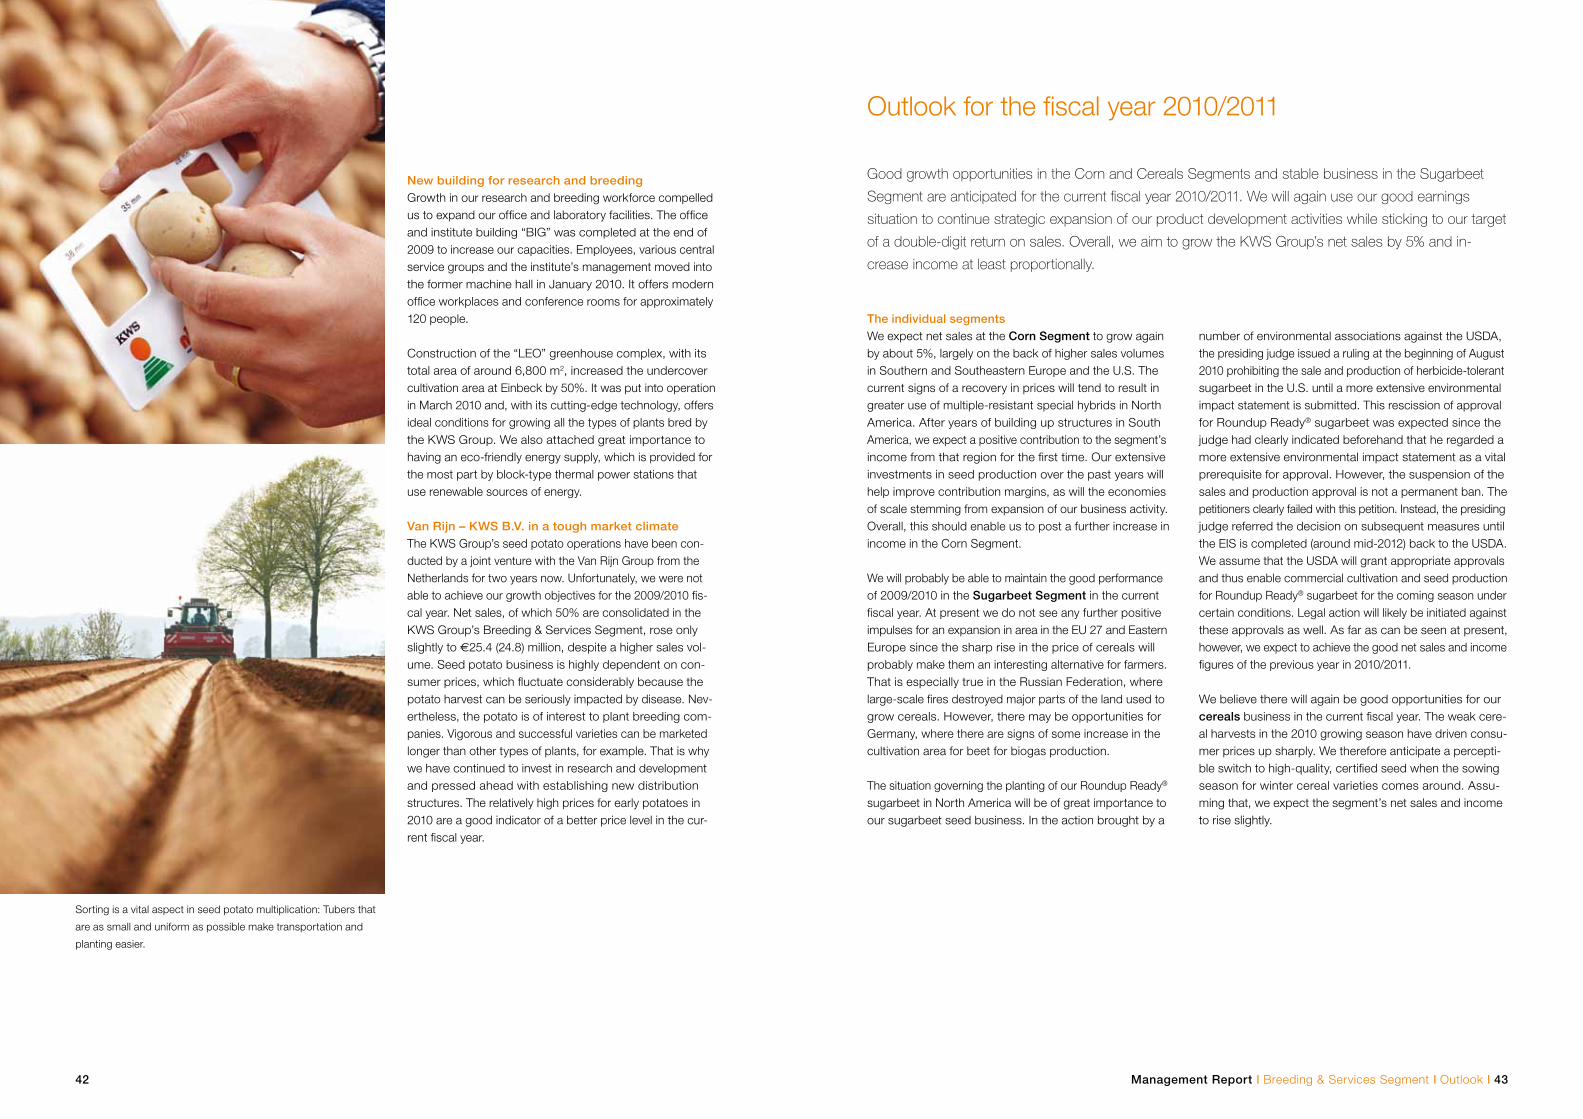
Outlook for the fiscal year 2010/2011
Good growth opportunities in the Corn and Cereals Segments and stable business in the Sugarbeet
Segment are anticipated for the current fiscal year 2010/2011. We will again use our good earnings
situation to continue strategic expansion of our product development activities while sticking to our target
of a double-digit return on sales. Overall, we aim to grow the KWS Group’s net sales by 5% and in-
crease income at least proportionally.
The individual segmentsWe expect net sales at the Corn Segment to grow again by about 5%, largely on the back of higher sales volumes in Southern and Southeastern Europe and the U.S. The current signs of a recovery in prices will tend to result in greater use of multiple-resistant special hybrids in North America. After years of building up structures in South America, we expect a positive contribution to the segment’s income from that region for the first time. Our extensive investments in seed production over the past years will help improve contribution margins, as will the economies of scale stemming from expansion of our business activity. Overall, this should enable us to post a further increase in income in the Corn Segment.
We will probably be able to maintain the good performance of 2009/2010 in the Sugarbeet Segment in the current fiscal year. At present we do not see any further positive impulses for an expansion in area in the EU 27 and Eastern Europe since the sharp rise in the price of cereals will probably make them an interesting alternative for farmers. That is especially true in the Russian Federation, where large-scale fires destroyed major parts of the land used to grow cereals. However, there may be opportunities for Germany, where there are signs of some increase in the cultivation area for beet for biogas production.
The situation governing the planting of our Roundup Ready® sugarbeet in North America will be of great importance to our sugarbeet seed business. In the action brought by a
number of environmental associations against the USDA, the presiding judge issued a ruling at the beginning of August 2010 prohibiting the sale and production of herbicide-tolerant sugarbeet in the U.S. until a more extensive environmental impact statement is submitted. This rescission of approval for Roundup Ready® sugarbeet was expected since the judge had clearly indicated beforehand that he regarded a more extensive environmental impact statement as a vital prerequisite for approval. However, the suspension of the sales and production approval is not a permanent ban. The petitioners clearly failed with this petition. Instead, the presiding judge referred the decision on subsequent measures until the EIS is completed (around mid-2012) back to the USDA. We assume that the USDA will grant appropriate approvals and thus enable commercial cultivation and seed production for Roundup Ready® sugarbeet for the coming season under certain conditions. Legal action will likely be initiated against these approvals as well. As far as can be seen at present, however, we expect to achieve the good net sales and income figures of the previous year in 2010/2011.
We believe there will again be good opportunities for our cereals business in the current fiscal year. The weak cere-al harvests in the 2010 growing season have driven consu-mer prices up sharply. We therefore anticipate a percepti-ble switch to high-quality, certified seed when the sowing season for winter cereal varieties comes around. Assu-ming that, we expect the segment’s net sales and income to rise slightly.
Management Report I Breeding & Services Segment I Outlook I 4342
Sorting is a vital aspect in seed potato multiplication: Tubers that
are as small and uniform as possible make transportation and
planting easier.
New building for research and breedingGrowth in our research and breeding workforce compelled us to expand our office and laboratory facilities. The office and institute building “BIG” was completed at the end of 2009 to increase our capacities. Employees, various central service groups and the institute’s management moved into the former machine hall in January 2010. It offers modern office workplaces and conference rooms for approximately 120 people.
Construction of the “LEO” greenhouse complex, with its total area of around 6,800 m2, increased the undercover cultivation area at Einbeck by 50%. It was put into operation in March 2010 and, with its cutting-edge technology, offers ideal conditions for growing all the types of plants bred by the KWS Group. We also attached great importance to having an eco-friendly energy supply, which is provided for the most part by block-type thermal power stations that use renewable sources of energy.
Van Rijn – KWS B.V. in a tough market climateThe KWS Group’s seed potato operations have been con-ducted by a joint venture with the Van Rijn Group from the Netherlands for two years now. Unfortunately, we were not able to achieve our growth objectives for the 2009/2010 fis-cal year. Net sales, of which 50% are consolidated in the KWS Group’s Breeding & Services Segment, rose only slightly to €25.4 (24.8) million, despite a higher sales vol-ume. Seed potato business is highly dependent on con-sumer prices, which fluctuate considerably because the potato harvest can be seriously impacted by disease. Nev-ertheless, the potato is of interest to plant breeding com-panies. Vigorous and successful varieties can be marketed longer than other types of plants, for example. That is why we have continued to invest in research and development and pressed ahead with establishing new distribution structures. The relatively high prices for early potatoes in 2010 are a good indicator of a better price level in the cur-rent fiscal year.
Pleasure in the job puts perfection in the work.”«Aristotle, Greek philosopher
It is precisely the pleasure they derive from agriculture and working with nature that
attracts many talented employees to KWS.
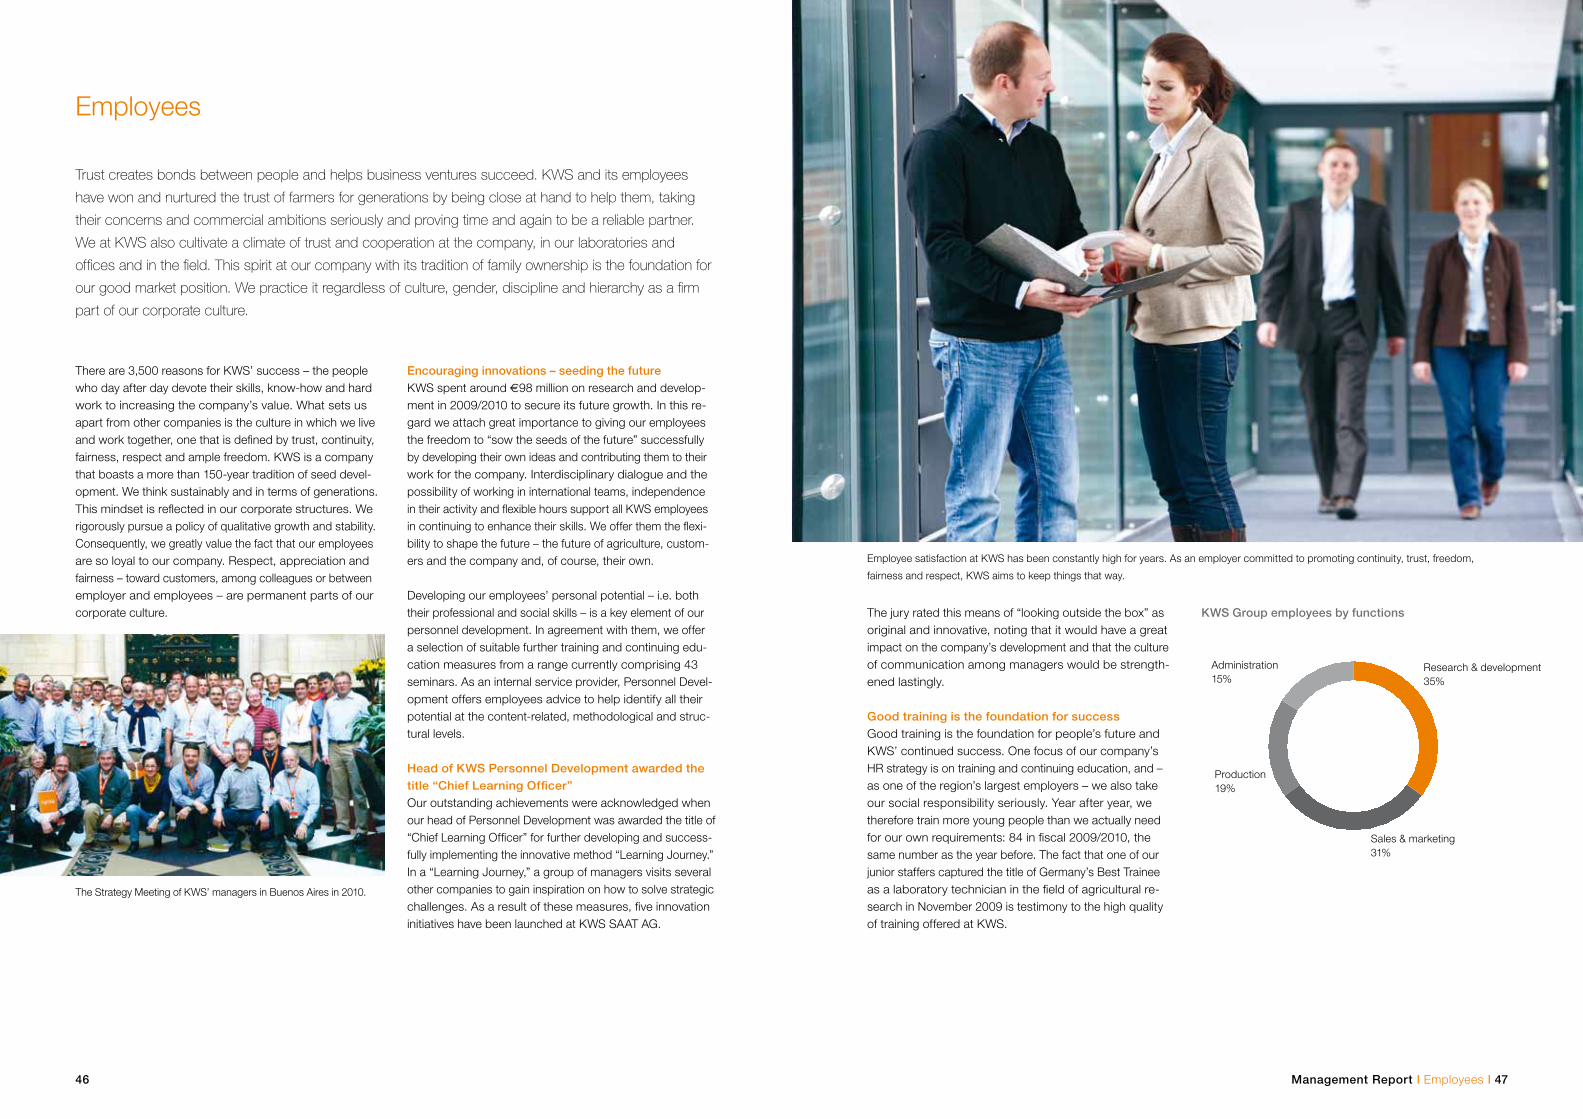
Management Report I Employees I 4746
The jury rated this means of “looking outside the box” as original and innovative, noting that it would have a great impact on the company’s development and that the culture of communication among managers would be strength-ened lastingly.
Good training is the foundation for successGood training is the foundation for people’s future and KWS’ continued success. One focus of our company’s HR strategy is on training and continuing education, and – as one of the region’s largest employers – we also take our social responsibility seriously. Year after year, we therefore train more young people than we actually need for our own requirements: 84 in fiscal 2009/2010, the same number as the year before. The fact that one of our junior staffers captured the title of Germany’s Best Trainee as a laboratory technician in the field of agricultural re-search in November 2009 is testimony to the high quality of training offered at KWS.
Employee satisfaction at KWS has been constantly high for years. As an employer committed to promoting continuity, trust, freedom,
fairness and respect, KWS aims to keep things that way.
Employees
Trust creates bonds between people and helps business ventures succeed. KWS and its employees
have won and nurtured the trust of farmers for generations by being close at hand to help them, taking
their concerns and commercial ambitions seriously and proving time and again to be a reliable partner.
We at KWS also cultivate a climate of trust and cooperation at the company, in our laboratories and
offices and in the field. This spirit at our company with its tradition of family ownership is the foundation for
our good market position. We practice it regardless of culture, gender, discipline and hierarchy as a firm
part of our corporate culture.
There are 3,500 reasons for KWS’ success – the people who day after day devote their skills, know-how and hard work to increasing the company’s value. What sets us apart from other companies is the culture in which we live and work together, one that is defined by trust, continuity, fairness, respect and ample freedom. KWS is a company that boasts a more than 150-year tradition of seed devel-opment. We think sustainably and in terms of generations. This mindset is reflected in our corporate structures. We rigorously pursue a policy of qualitative growth and stability. Consequently, we greatly value the fact that our employees are so loyal to our company. Respect, appreciation and fairness – toward customers, among colleagues or between employer and employees – are permanent parts of our corporate culture.
Encouraging innovations – seeding the futureKWS spent around €98 million on research and develop-ment in 2009/2010 to secure its future growth. In this re-gard we attach great importance to giving our employees the freedom to “sow the seeds of the future” successfully by developing their own ideas and contributing them to their work for the company. Interdisciplinary dialogue and the possibility of working in international teams, independence in their activity and flexible hours support all KWS employees in continuing to enhance their skills. We offer them the flexi-bility to shape the future – the future of agriculture, custom-ers and the company and, of course, their own.
Developing our employees’ personal potential – i.e. both their professional and social skills – is a key element of our personnel development. In agreement with them, we offer a selection of suitable further training and continuing edu-cation measures from a range currently comprising 43 seminars. As an internal service provider, Personnel Devel-opment offers employees advice to help identify all their potential at the content-related, methodological and struc-tural levels.
Head of KWS Personnel Development awarded the title “Chief Learning Officer”Our outstanding achievements were acknowledged when our head of Personnel Development was awarded the title of “Chief Learning Officer” for further developing and success-fully implementing the innovative method “Learning Journey.” In a “Learning Journey,” a group of managers visits several other companies to gain inspiration on how to solve strategic challenges. As a result of these measures, five innovation initiatives have been launched at KWS SAAT AG.
KWS Group employees by functions
Research & development 35%
Sales & marketing31%
Administration15%
Production19%
The Strategy Meeting of KWS’ managers in Buenos Aires in 2010.
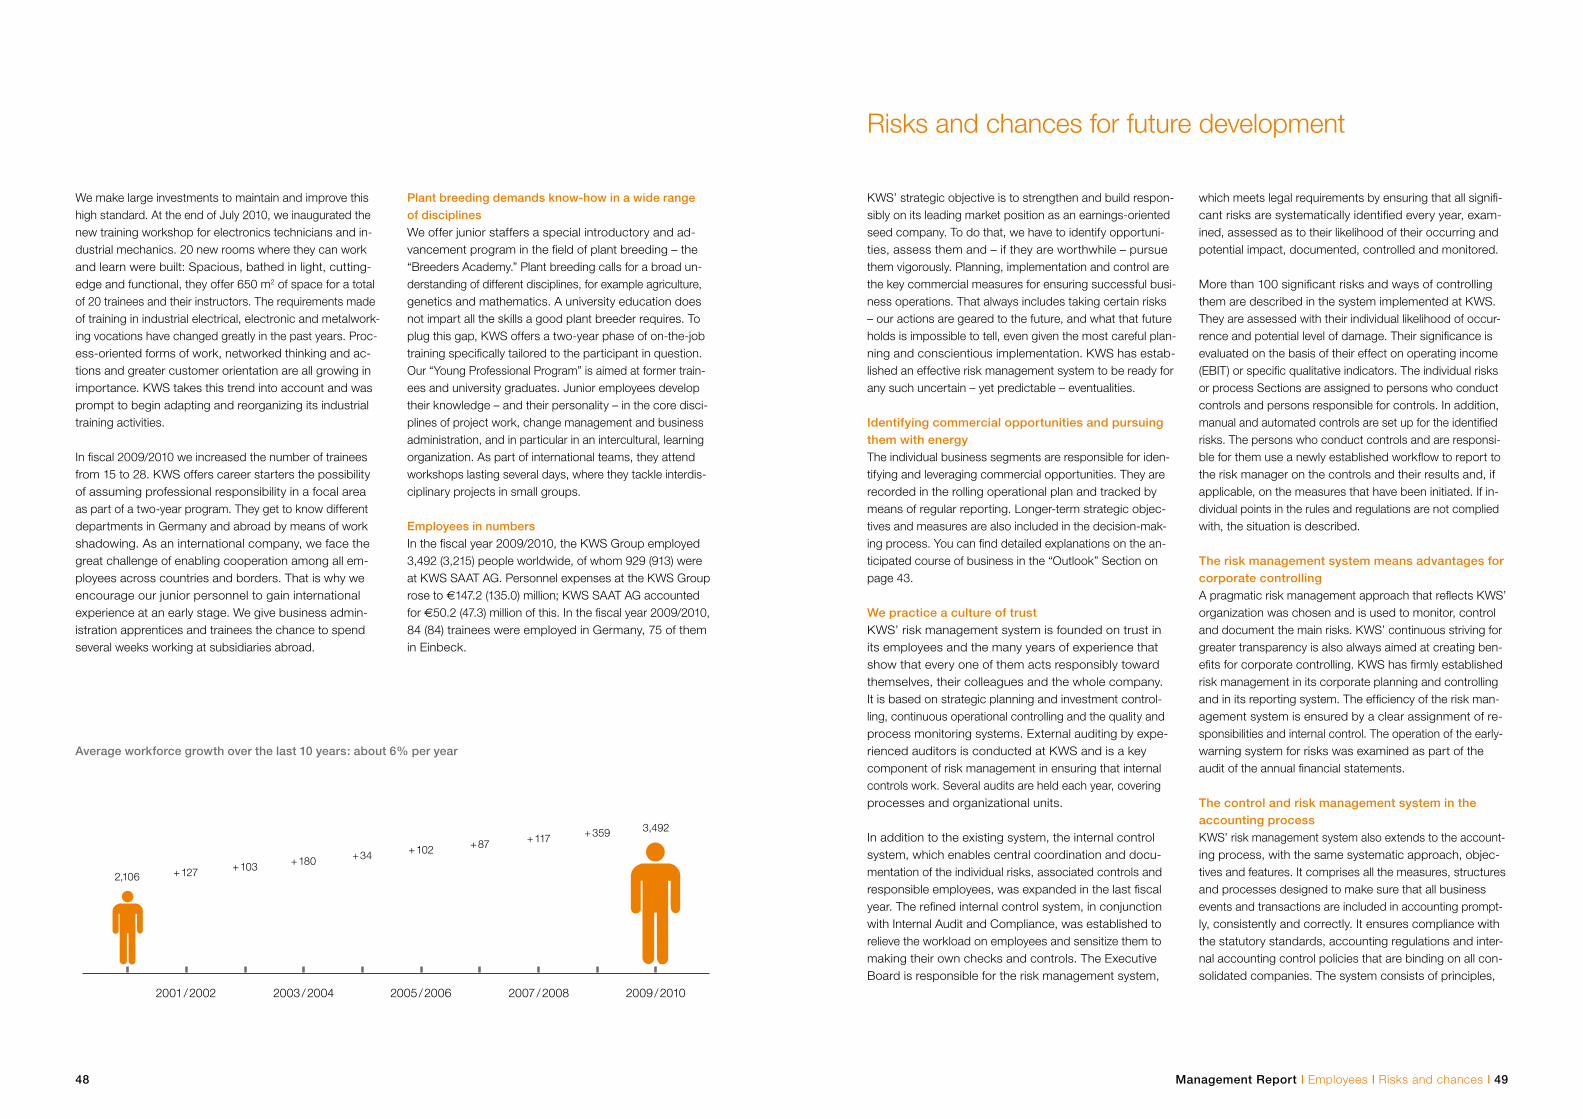
Management Report I Employees I Risks and chances I 4948
We make large investments to maintain and improve this high standard. At the end of July 2010, we inaugurated the new training workshop for electronics technicians and in-dustrial mechanics. 20 new rooms where they can work and learn were built: Spacious, bathed in light, cutting-edge and functional, they offer 650 m2 of space for a total of 20 trainees and their instructors. The requirements made of training in industrial electrical, electronic and metalwork-ing vocations have changed greatly in the past years. Proc-ess-oriented forms of work, networked thinking and ac-tions and greater customer orientation are all growing in importance. KWS takes this trend into account and was prompt to begin adapting and reorganizing its industrial training activities.
In fiscal 2009/2010 we increased the number of trainees from 15 to 28. KWS offers career starters the possibility of assuming professional responsibility in a focal area as part of a two-year program. They get to know different departments in Germany and abroad by means of work shadowing. As an international company, we face the great challenge of enabling cooperation among all em-ployees across countries and borders. That is why we encourage our junior personnel to gain international experience at an early stage. We give business admin-istration apprentices and trainees the chance to spend several weeks working at subsidiaries abroad.
Plant breeding demands know-how in a wide range of disciplinesWe offer junior staffers a special introductory and ad-vancement program in the field of plant breeding – the “Breeders Academy.” Plant breeding calls for a broad un-derstanding of different disciplines, for example agriculture, genetics and mathematics. A university education does not impart all the skills a good plant breeder requires. To plug this gap, KWS offers a two-year phase of on-the-job training specifically tailored to the participant in question. Our “Young Professional Program” is aimed at former train-ees and university graduates. Junior employees develop their knowledge – and their personality – in the core disci-plines of project work, change management and business administration, and in particular in an intercultural, learning organization. As part of international teams, they attend workshops lasting several days, where they tackle interdis-ciplinary projects in small groups.
Employees in numbersIn the fiscal year 2009/2010, the KWS Group employed 3,492 (3,215) people worldwide, of whom 929 (913) were at KWS SAAT AG. Personnel expenses at the KWS Group rose to €147.2 (135.0) million; KWS SAAT AG accounted for €50.2 (47.3) million of this. In the fiscal year 2009/2010, 84 (84) trainees were employed in Germany, 75 of them in Einbeck.
Risks and chances for future development
KWS’ strategic objective is to strengthen and build respon-sibly on its leading market position as an earnings-oriented seed company. To do that, we have to identify opportuni-ties, assess them and – if they are worthwhile – pursue them vigorously. Planning, implementation and control are the key commercial measures for ensuring successful busi-ness operations. That always includes taking certain risks – our actions are geared to the future, and what that future holds is impossible to tell, even given the most careful plan-ning and conscientious implementation. KWS has estab-lished an effective risk management system to be ready for any such uncertain – yet predictable – eventualities.
Identifying commercial opportunities and pursuing them with energyThe individual business segments are responsible for iden-tifying and leveraging commercial opportunities. They are recorded in the rolling operational plan and tracked by means of regular reporting. Longer-term strategic objec-tives and measures are also included in the decision-mak-ing process. You can find detailed explanations on the an-ticipated course of business in the “Outlook” Section on page 43.
We practice a culture of trustKWS’ risk management system is founded on trust in its employees and the many years of experience that show that every one of them acts responsibly toward themselves, their colleagues and the whole company. It is based on strategic planning and investment control-ling, continuous operational controlling and the quality and process monitoring systems. External auditing by expe-rienced auditors is conducted at KWS and is a key component of risk management in ensuring that internal controls work. Several audits are held each year, covering processes and organizational units.
In addition to the existing system, the internal control system, which enables central coordination and docu-mentation of the individual risks, associated controls and responsible employees, was expanded in the last fiscal year. The refined internal control system, in conjunction with Internal Audit and Compliance, was established to relieve the workload on employees and sensitize them to making their own checks and controls. The Executive Board is responsible for the risk management system,
which meets legal requirements by ensuring that all signifi-cant risks are systematically identified every year, exam-ined, assessed as to their likelihood of their occurring and potential impact, documented, controlled and monitored.
More than 100 significant risks and ways of controlling them are described in the system implemented at KWS. They are assessed with their individual likelihood of occur-rence and potential level of damage. Their significance is evaluated on the basis of their effect on operating income (EBIT) or specific qualitative indicators. The individual risks or process Sections are assigned to persons who conduct controls and persons responsible for controls. In addition, manual and automated controls are set up for the identified risks. The persons who conduct controls and are responsi-ble for them use a newly established workflow to report to the risk manager on the controls and their results and, if applicable, on the measures that have been initiated. If in-dividual points in the rules and regulations are not complied with, the situation is described.
The risk management system means advantages for corporate controllingA pragmatic risk management approach that reflects KWS’ organization was chosen and is used to monitor, control and document the main risks. KWS’ continuous striving for greater transparency is also always aimed at creating ben-efits for corporate controlling. KWS has firmly established risk management in its corporate planning and controlling and in its reporting system. The efficiency of the risk man-agement system is ensured by a clear assignment of re-sponsibilities and internal control. The operation of the early-warning system for risks was examined as part of the audit of the annual financial statements.
The control and risk management system in the accounting processKWS’ risk management system also extends to the account-ing process, with the same systematic approach, objec-tives and features. It comprises all the measures, structures and processes designed to make sure that all business events and transactions are included in accounting prompt-ly, consistently and correctly. It ensures compliance with the statutory standards, accounting regulations and inter-nal accounting control policies that are binding on all con-solidated companies. The system consists of principles,
2,106
2001 / 2002
+ 127 + 103
2003 / 2004
+ 180 + 34
2005 / 2006
+ 102 + 87
2007 / 2008
+ 117 + 359
2009 / 2010
3,492
Average workforce growth over the last 10 years: about 6% per year
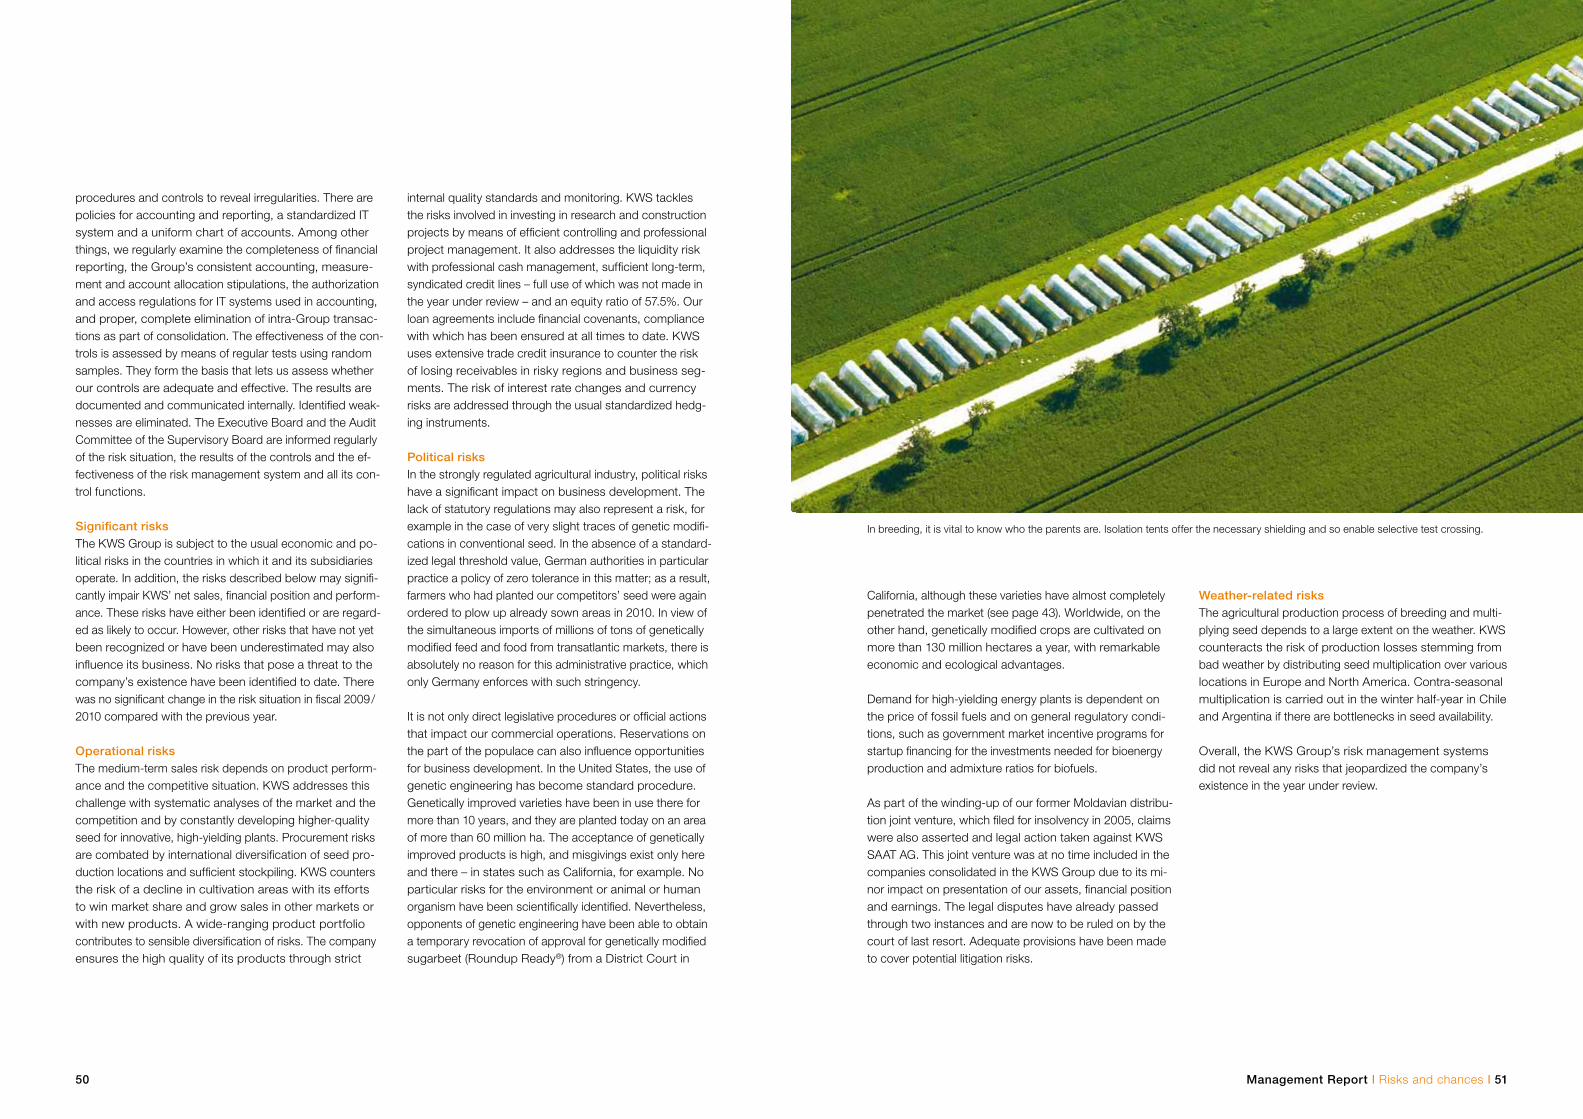
50
procedures and controls to reveal irregularities. There are policies for accounting and reporting, a standardized IT system and a uniform chart of accounts. Among other things, we regularly examine the completeness of financial reporting, the Group’s consistent accounting, measure-ment and account allocation stipulations, the authorization and access regulations for IT systems used in accounting, and proper, complete elimination of intra-Group transac-tions as part of consolidation. The effectiveness of the con-trols is assessed by means of regular tests using random samples. They form the basis that lets us assess whether our controls are adequate and effective. The results are documented and communicated internally. Identified weak-nesses are eliminated. The Executive Board and the Audit Committee of the Supervisory Board are informed regularly of the risk situation, the results of the controls and the ef-fectiveness of the risk management system and all its con-trol functions.
Significant risksThe KWS Group is subject to the usual economic and po-litical risks in the countries in which it and its subsidiaries operate. In addition, the risks described below may signifi-cantly impair KWS’ net sales, financial position and perform-ance. These risks have either been identified or are regard-ed as likely to occur. However, other risks that have not yet been recognized or have been underestimated may also influence its business. No risks that pose a threat to the company’s existence have been identified to date. There was no significant change in the risk situation in fiscal 2009 / 2010 compared with the previous year.
Operational risksThe medium-term sales risk depends on product perform-ance and the competitive situation. KWS addresses this challenge with systematic analyses of the market and the competition and by constantly developing higher-quality seed for innovative, high-yielding plants. Procurement risks are combated by international diversification of seed pro-duction locations and sufficient stockpiling. KWS counters the risk of a decline in cultivation areas with its efforts to win market share and grow sales in other markets or with new products. A wide-ranging product portfolio contributes to sensible diversification of risks. The company ensures the high quality of its products through strict
Management Report I Risks and chances I 51
internal quality standards and monitoring. KWS tackles the risks involved in investing in research and construction projects by means of efficient controlling and professional project management. It also addresses the liquidity risk with professional cash management, sufficient long-term, syndicated credit lines – full use of which was not made in the year under review – and an equity ratio of 57.5%. Our loan agreements include financial covenants, compliance with which has been ensured at all times to date. KWS uses extensive trade credit insurance to counter the risk of losing receivables in risky regions and business seg-ments. The risk of interest rate changes and currency risks are addressed through the usual standardized hedg-ing instruments.
Political risksIn the strongly regulated agricultural industry, political risks have a significant impact on business development. The lack of statutory regulations may also represent a risk, for example in the case of very slight traces of genetic modifi-cations in conventional seed. In the absence of a standard-ized legal threshold value, German authorities in particular practice a policy of zero tolerance in this matter; as a result, farmers who had planted our competitors’ seed were again ordered to plow up already sown areas in 2010. In view of the simultaneous imports of millions of tons of genetically modified feed and food from transatlantic markets, there is absolutely no reason for this administrative practice, which only Germany enforces with such stringency.
It is not only direct legislative procedures or official actions that impact our commercial operations. Reservations on the part of the populace can also influence opportunities for business development. In the United States, the use of genetic engineering has become standard procedure. Genetically improved varieties have been in use there for more than 10 years, and they are planted today on an area of more than 60 million ha. The acceptance of genetically improved products is high, and misgivings exist only here and there – in states such as California, for example. No particular risks for the environment or animal or human organism have been scientifically identified. Nevertheless, opponents of genetic engineering have been able to obtain a temporary revocation of approval for genetically modified sugarbeet (Roundup Ready®) from a District Court in
In breeding, it is vital to know who the parents are. Isolation tents offer the necessary shielding and so enable selective test crossing.
California, although these varieties have almost completely penetrated the market (see page 43). Worldwide, on the other hand, genetically modified crops are cultivated on more than 130 million hectares a year, with remarkable economic and ecological advantages.
Demand for high-yielding energy plants is dependent on the price of fossil fuels and on general regulatory condi-tions, such as government market incentive programs for startup financing for the investments needed for bioenergy production and admixture ratios for biofuels.
As part of the winding-up of our former Moldavian distribu-tion joint venture, which filed for insolvency in 2005, claims were also asserted and legal action taken against KWS SAAT AG. This joint venture was at no time included in the companies consolidated in the KWS Group due to its mi-nor impact on presentation of our assets, financial position and earnings. The legal disputes have already passed through two instances and are now to be ruled on by the court of last resort. Adequate provisions have been made to cover potential litigation risks.
Weather-related risksThe agricultural production process of breeding and multi-plying seed depends to a large extent on the weather. KWS counteracts the risk of production losses stemming from bad weather by distributing seed multiplication over various locations in Europe and North America. Contra-seasonal multiplication is carried out in the winter half-year in Chile and Argentina if there are bottlenecks in seed availability.
Overall, the KWS Group’s risk management systems did not reveal any risks that jeopardized the company’s existence in the year under review.
Annual Financial Statements of the KWS Group 2009 / 2010
52
The Executive Board provides the following explanations of the information in accordance with Section 315 (4) HGB (German Commercial Code) in the Group Manage-ment Report:
The subscribed capital of KWS SAAT AG is €19,800,000. It is divided into 6,600,000 no-par bearer shares. Each share grants the holder one vote at the Annual Share-holders’ Meeting.
There may be limitations on the voting rights for the shares under the provisions of the German Stock Corporation Act (AktG). For example, shareholders are barred from voting under certain conditions (Section 136 AktG). In addition, no voting rights accrue to the company on the basis of the shares it holds (Section 71b AktG). The Executive Board is not aware of any contractual restrictions relating to voting rights or transfer of shares.
The following direct or indirect participating interests in the capital of KWS SAAT AG in excess of 10 % of the voting rights have been reported to the company in keeping with Sections 21 and 22 of the German Securities Trading Law (WpHG):
• The voting shares, including mutual allocations, of the members, foundations and companies of the families Büchting/Giesecke and Arend Oetker listed below each exceed 10% and total 56.1%.
Dr. Dr. h.c. Andreas J. Büchting, EinbeckChristiane Stratmann, MeerbuschDorothea Schuppert, BerlinMichael C.-E. Büchting, EinbeckAnnette Büchting, BremenStephan O. Büchting-Hansing, Ammerbuch-EntringenElke Giesecke, AltenbergeChrista Nagel, HanoverAKB Stiftung, HanoverZukunftsstiftung Jugend, Umwelt und Kultur, EinbeckBüchting Beteiligungsgesellschaft mbH, HanoverDr. Arend Oetker, BerlinKommanditgesellschaft Dr. Arend Oetker Vermögens- verwaltungsgesellschaft mbH & Co., Berlin
• The voting shares, including mutual allocations, of the shareholders stated below each exceed 10% and total 11.5%.
Hans-Joachim Tessner, GoslarTessner Holding KG, GoslarTessner Beteiligungs GmbH, Goslar
Shares with special rights that grant powers of control have not been issued by the company.
There is no special type of voting control for the participating interests of employees. Employees who have an interest in the company’s capital exercise their control rights in the same way as other shareholders.
At KWS SAAT AG, members of the Executive Board are appointed and removed as provided for in Section 84 AktG; analogously to Section 84 AktG, the company’s Articles of Association also stipulate that members of the Executive Board are appointed by the Supervisory Board. In compli-ance with Sections 179 ff. AktG, amendments to the Articles of Association of KWS SAAT AG require a resolution to be adopted by the Annual Shareholders’ Meeting, by a majority of at least three quarters of the capital stock represented in adopting the resolution. The power to make amendments to the Articles of Association that only affect the wording (Section 179 (1) Sentence 2 AktG), has been conferred on the Supervisory Board in accordance with Section 22 of the Articles of Association of KWS SAAT AG.
The Executive Board is not now authorized to issue or buy back shares.
Significant agreements subject to the condition of a change in control pursuant to a takeover bid have not been conclud-ed. The compensation agreements between the company and members of the Executive Board and governing the case of a change in control stipulate that any such compen-sation will be limited to the applicable maximum amounts specified by the German Corporate Governance Code.
Einbeck, October 8, 2010
KWS SAAT AGTHE EXECUTIVE BOARD
Disclosures in accordance with Section 315 (4) HGB (German Commercial Code)
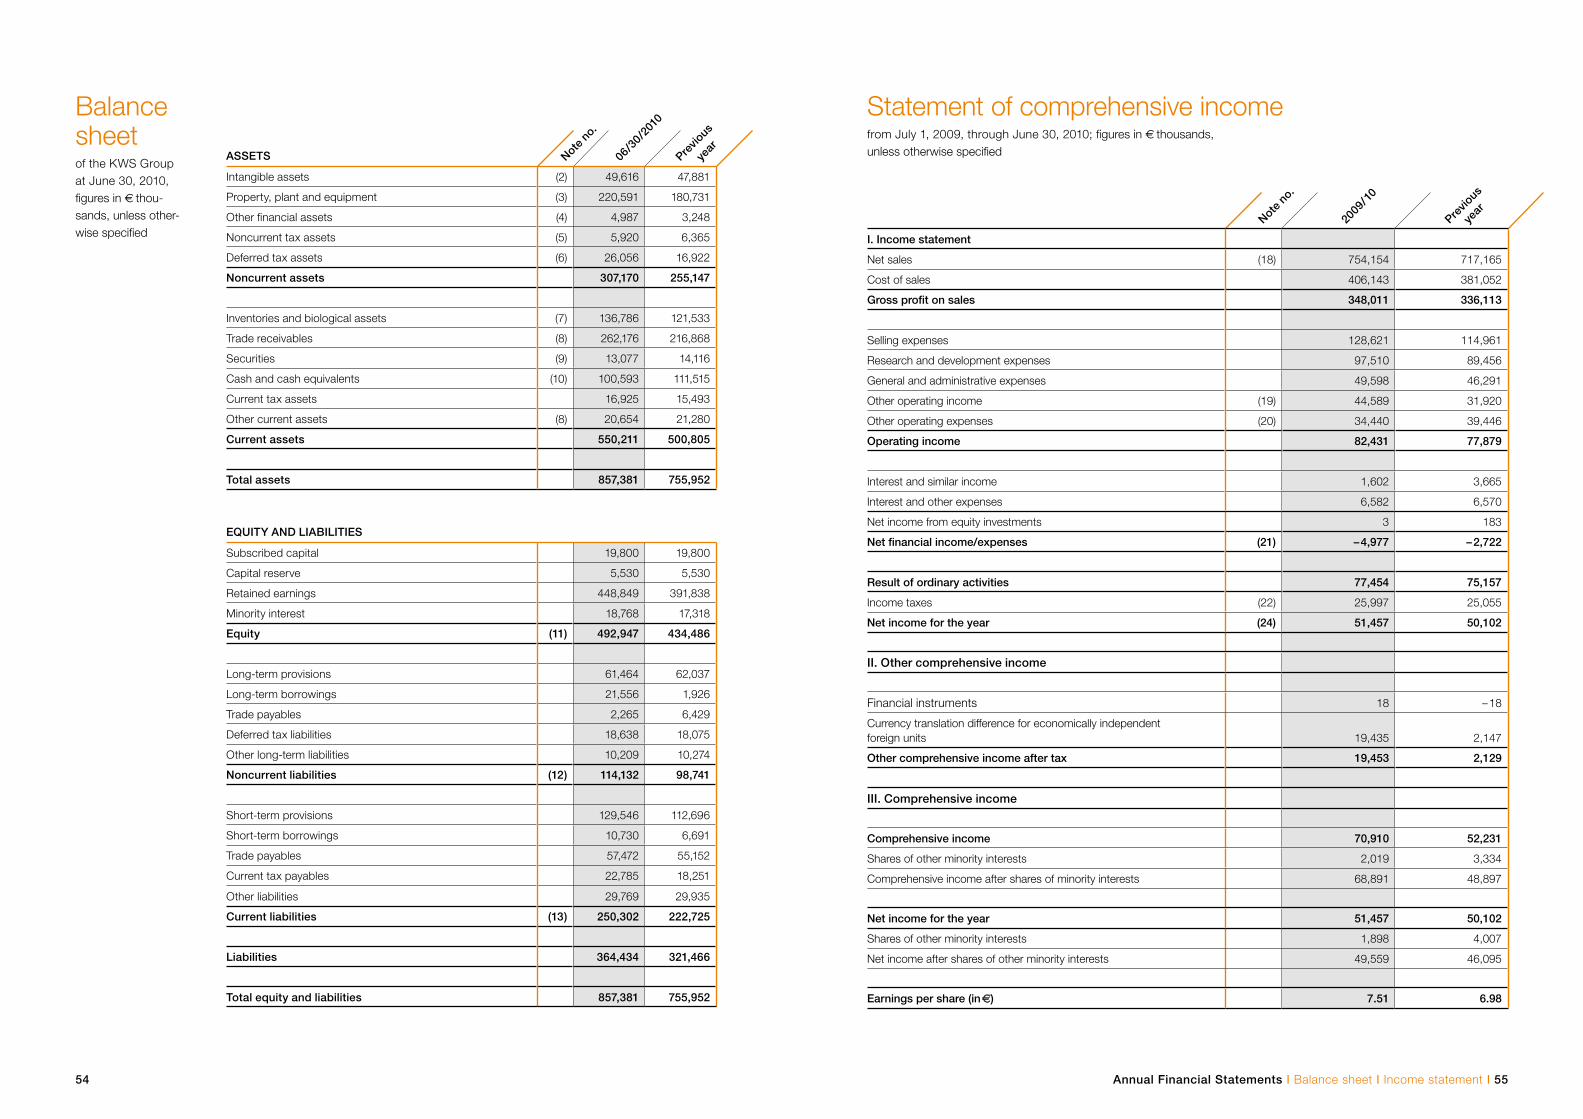
54 Annual Financial Statements I Balance sheet I Income statement I 55
Statement of comprehensive incomefrom July 1, 2009, through June 30, 2010; figures in € thousands,unless otherwise specified
Note n
o.
2009
/ 10
Previo
us
year
I. Income statement
Net sales (18) 754,154 717,165
Cost of sales 406,143 381,052
Gross profit on sales 348,011 336,113
Selling expenses 128,621 114,961
Research and development expenses 97,510 89,456
General and administrative expenses 49,598 46,291
Other operating income (19) 44,589 31,920
Other operating expenses (20) 34,440 39,446
Operating income 82,431 77,879
Interest and similar income 1,602 3,665
Interest and other expenses 6,582 6,570
Net income from equity investments 3 183
Net financial income/expenses (21) – 4,977 – 2,722
Result of ordinary activities 77,454 75,157
Income taxes (22) 25,997 25,055
Net income for the year (24) 51,457 50,102
II. Other comprehensive income
Financial instruments 18 – 18
Currency translation difference for economically independent foreign units 19,435 2,147
Other comprehensive income after tax 19,453 2,129
III. Comprehensive income
Comprehensive income 70,910 52,231
Shares of other minority interests 2,019 3,334
Comprehensive income after shares of minority interests 68,891 48,897
Net income for the year 51,457 50,102
Shares of other minority interests 1,898 4,007
Net income after shares of other minority interests 49,559 46,095
Earnings per share (in €) 7.51 6.98
Balance sheet of the KWS Group at June 30, 2010, figures in € thou-sands, unless other-wise specified
Subscribed capital 19,800 19,800
Capital reserve 5,530 5,530
Retained earnings 448,849 391,838
Minority interest 18,768 17,318
Equity (11) 492,947 434,486
Long-term provisions 61,464 62,037
Long-term borrowings 21,556 1,926
Trade payables 2,265 6,429
Deferred tax liabilities 18,638 18,075
Other long-term liabilities 10,209 10,274
Noncurrent liabilities (12) 114,132 98,741
Short-term provisions 129,546 112,696
Short-term borrowings 10,730 6,691
Trade payables 57,472 55,152
Current tax payables 22,785 18,251
Other liabilities 29,769 29,935
Current liabilities (13) 250,302 222,725
Liabilities 364,434 321,466
Total equity and liabilities 857,381 755,952
EQUITY AND LIABILITIES
ASSETS Note n
o.
06/3
0/201
0
Previo
us
year
Intangible assets (2) 49,616 47,881
Property, plant and equipment (3) 220,591 180,731
Other financial assets (4) 4,987 3,248
Noncurrent tax assets (5) 5,920 6,365
Deferred tax assets (6) 26,056 16,922
Noncurrent assets 307,170 255,147
Inventories and biological assets (7) 136,786 121,533
Trade receivables (8) 262,176 216,868
Securities (9) 13,077 14,116
Cash and cash equivalents (10) 100,593 111,515
Current tax assets 16,925 15,493
Other current assets (8) 20,654 21,280
Current assets 550,211 500,805
Total assets 857,381 755,952
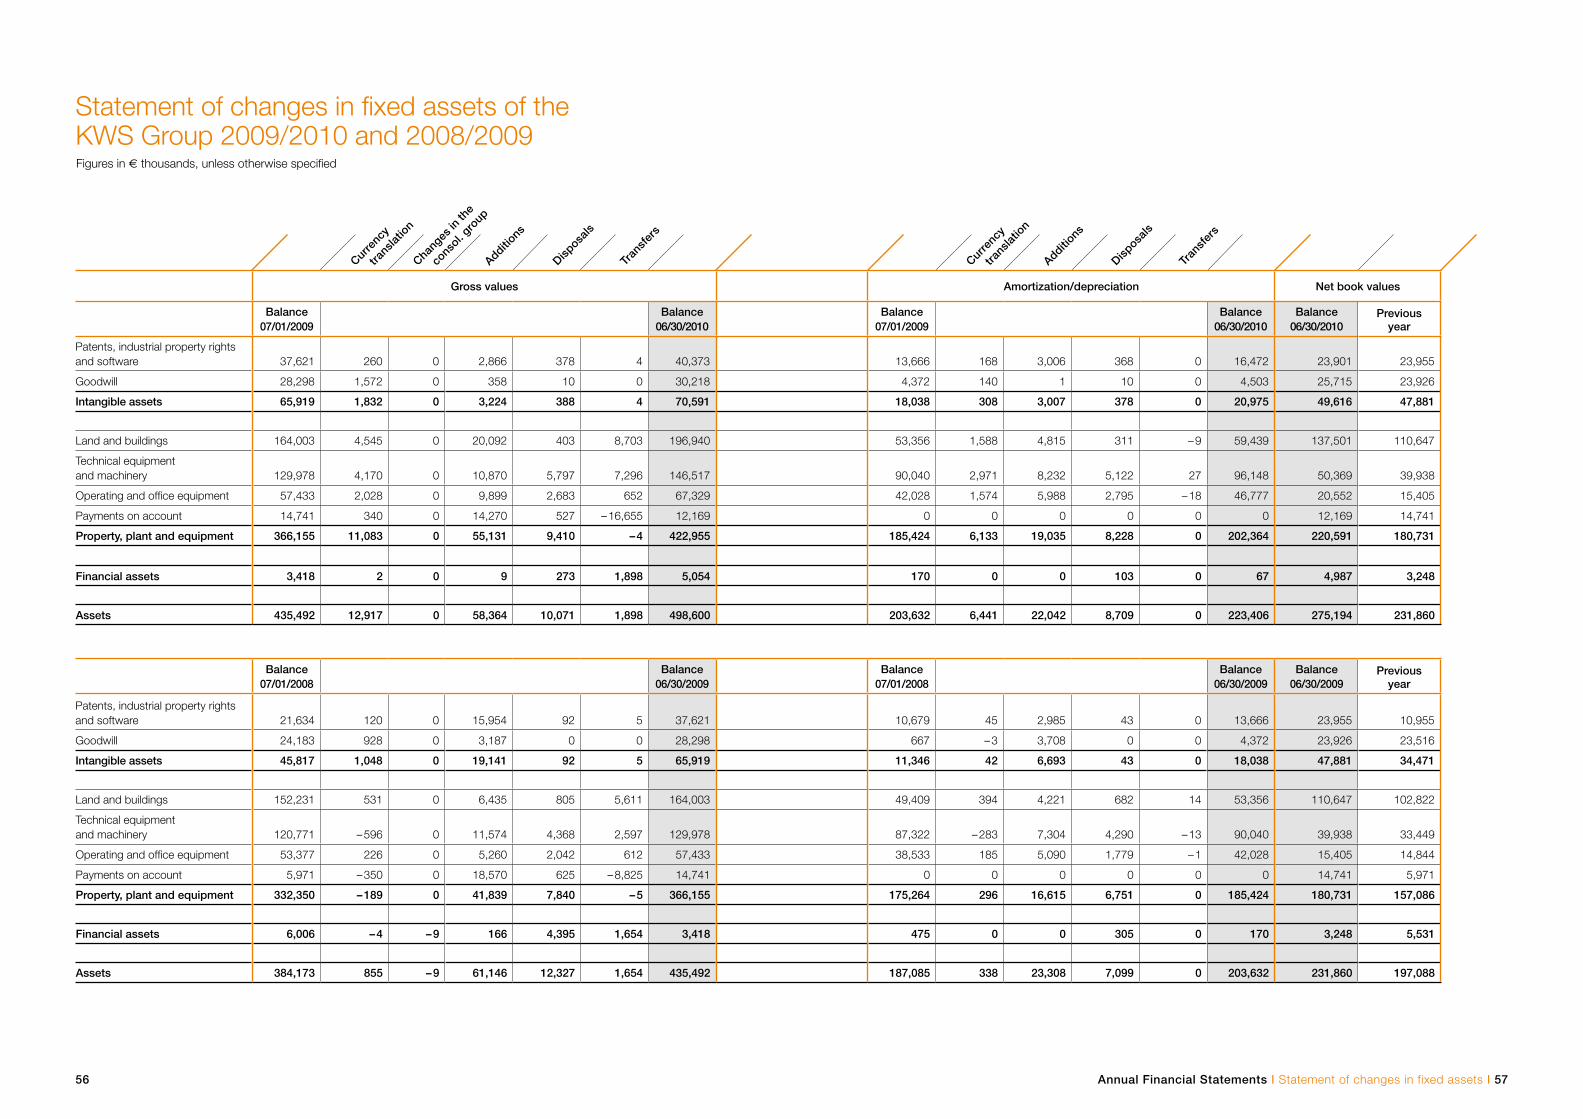
56 Annual Financial Statements I Statement of changes in fixed assets I 57
Curre
ncy
trans
latio
n
Chang
es in
the
cons
ol. gro
up
Additions
Disposa
ls
Tran
sfer
s
Curre
ncy
trans
latio
n
Additions
Disposa
ls
Tran
sfer
s
Gross values Amortization/depreciation Net book values
Balance 07/01/2009
Balance 06/30/2010
Balance 07/01/2009
Balance 06/30/2010
Balance 06/30/2010
Previousyear
Patents, industrial property rights and software 37,621 260 0 2,866 378 4 40,373 13,666 168 3,006 368 0 16,472 23,901 23,955
Goodwill 28,298 1,572 0 358 10 0 30,218 4,372 140 1 10 0 4,503 25,715 23,926
Intangible assets 65,919 1,832 0 3,224 388 4 70,591 18,038 308 3,007 378 0 20,975 49,616 47,881
Land and buildings 164,003 4,545 0 20,092 403 8,703 196,940 53,356 1,588 4,815 311 – 9 59,439 137,501 110,647
Technical equipment and machinery 129,978 4,170 0 10,870 5,797 7,296 146,517 90,040 2,971 8,232 5,122 27 96,148 50,369 39,938
Operating and office equipment 57,433 2,028 0 9,899 2,683 652 67,329 42,028 1,574 5,988 2,795 – 18 46,777 20,552 15,405
Payments on account 14,741 340 0 14,270 527 – 16,655 12,169 0 0 0 0 0 0 12,169 14,741
Property, plant and equipment 366,155 11,083 0 55,131 9,410 – 4 422,955 185,424 6,133 19,035 8,228 0 202,364 220,591 180,731
Financial assets 3,418 2 0 9 273 1,898 5,054 170 0 0 103 0 67 4,987 3,248
Assets 435,492 12,917 0 58,364 10,071 1,898 498,600 203,632 6,441 22,042 8,709 0 223,406 275,194 231,860
Balance 07/01/2008
Balance 06/30/2009
Balance 07/01/2008
Balance 06/30/2009
Balance 06/30/2009
Previousyear
Patents, industrial property rights and software 21,634 120 0 15,954 92 5 37,621 10,679 45 2,985 43 0 13,666 23,955 10,955
Goodwill 24,183 928 0 3,187 0 0 28,298 667 – 3 3,708 0 0 4,372 23,926 23,516
Intangible assets 45,817 1,048 0 19,141 92 5 65,919 11,346 42 6,693 43 0 18,038 47,881 34,471
Land and buildings 152,231 531 0 6,435 805 5,611 164,003 49,409 394 4,221 682 14 53,356 110,647 102,822
Technical equipment and machinery 120,771 – 596 0 11,574 4,368 2,597 129,978 87,322 – 283 7,304 4,290 – 13 90,040 39,938 33,449
Operating and office equipment 53,377 226 0 5,260 2,042 612 57,433 38,533 185 5,090 1,779 – 1 42,028 15,405 14,844
Payments on account 5,971 – 350 0 18,570 625 – 8,825 14,741 0 0 0 0 0 0 14,741 5,971
Property, plant and equipment 332,350 – 189 0 41,839 7,840 – 5 366,155 175,264 296 16,615 6,751 0 185,424 180,731 157,086
Financial assets 6,006 – 4 – 9 166 4,395 1,654 3,418 475 0 0 305 0 170 3,248 5,531
Assets 384,173 855 – 9 61,146 12,327 1,654 435,492 187,085 338 23,308 7,099 0 203,632 231,860 197,088
Statement of changes in fixed assets of the KWS Group 2009/2010 and 2008/2009Figures in € thousands, unless otherwise specified
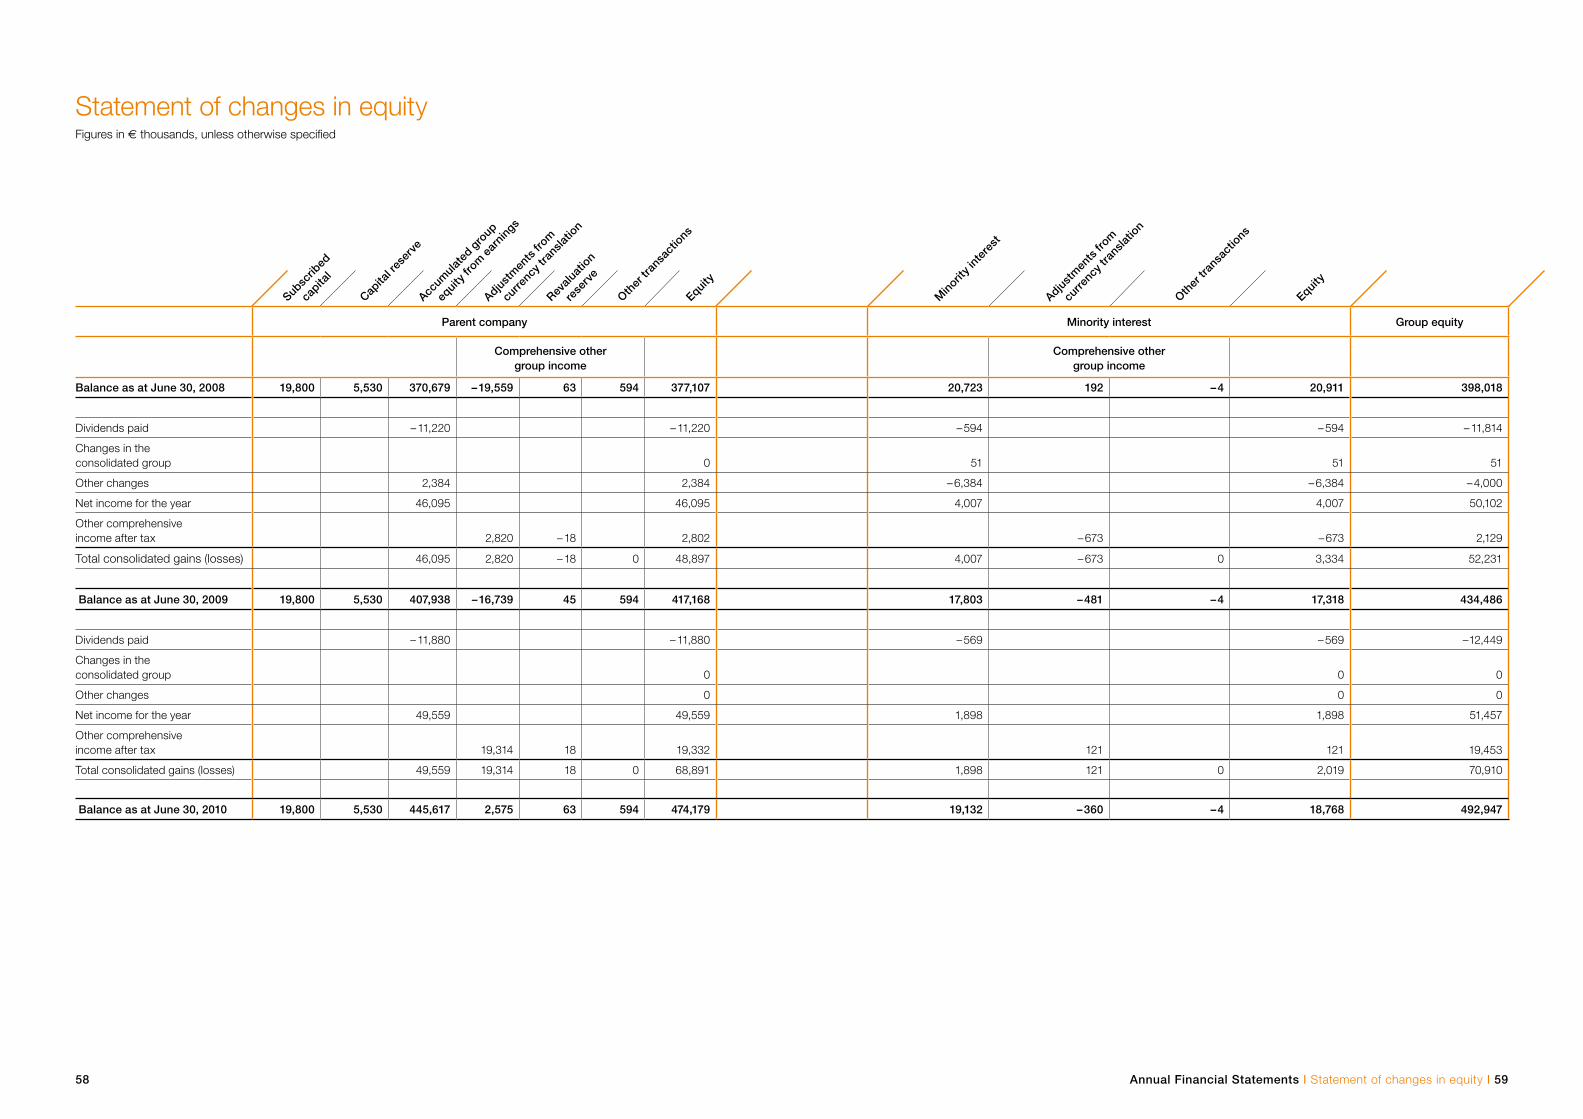
58 Annual Financial Statements I Statement of changes in equity I 59
Subsc
ribed
capita
l
Capita
l res
erve
Accum
ulat
ed g
roup
equi
ty fr
om e
arni
ngs
Adjust
men
ts fr
om
curre
ncy t
rans
latio
n
Revalu
atio
n
rese
rve
Other
tran
sact
ions
Equity
Min
ority i
nter
est
Adjust
men
ts fr
om
curre
ncy t
rans
latio
n
Other
tran
sact
ions
Equity
Parent company Minority interest Group equity
Comprehensive other group income
Comprehensive other group income
Balance as at June 30, 2008 19,800 5,530 370,679 – 19,559 63 594 377,107 20,723 192 – 4 20,911 398,018
Dividends paid – 11,220 – 11,220 – 594 – 594 – 11,814
Changes in the consolidated group 0 51 51 51
Other changes 2,384 2,384 – 6,384 – 6,384 – 4,000
Net income for the year 46,095 46,095 4,007 4,007 50,102
Other comprehensive income after tax 2,820 – 18 2,802 – 673 – 673 2,129
Total consolidated gains (losses) 46,095 2,820 – 18 0 48,897 4,007 – 673 0 3,334 52,231
Balance as at June 30, 2009 19,800 5,530 407,938 – 16,739 45 594 417,168 17,803 – 481 – 4 17,318 434,486
Dividends paid – 11,880 – 11,880 – 569 – 569 – 12,449
Changes in the consolidated group 0 0 0
Other changes 0 0 0
Net income for the year 49,559 49,559 1,898 1,898 51,457
Other comprehensive income after tax 19,314 18 19,332 121 121 19,453
Total consolidated gains (losses) 49,559 19,314 18 0 68,891 1,898 121 0 2,019 70,910
Balance as at June 30, 2010 19,800 5,530 445,617 2,575 63 594 474,179 19,132 – 360 – 4 18,768 492,947
Statement of changes in equity Figures in € thousands, unless otherwise specified
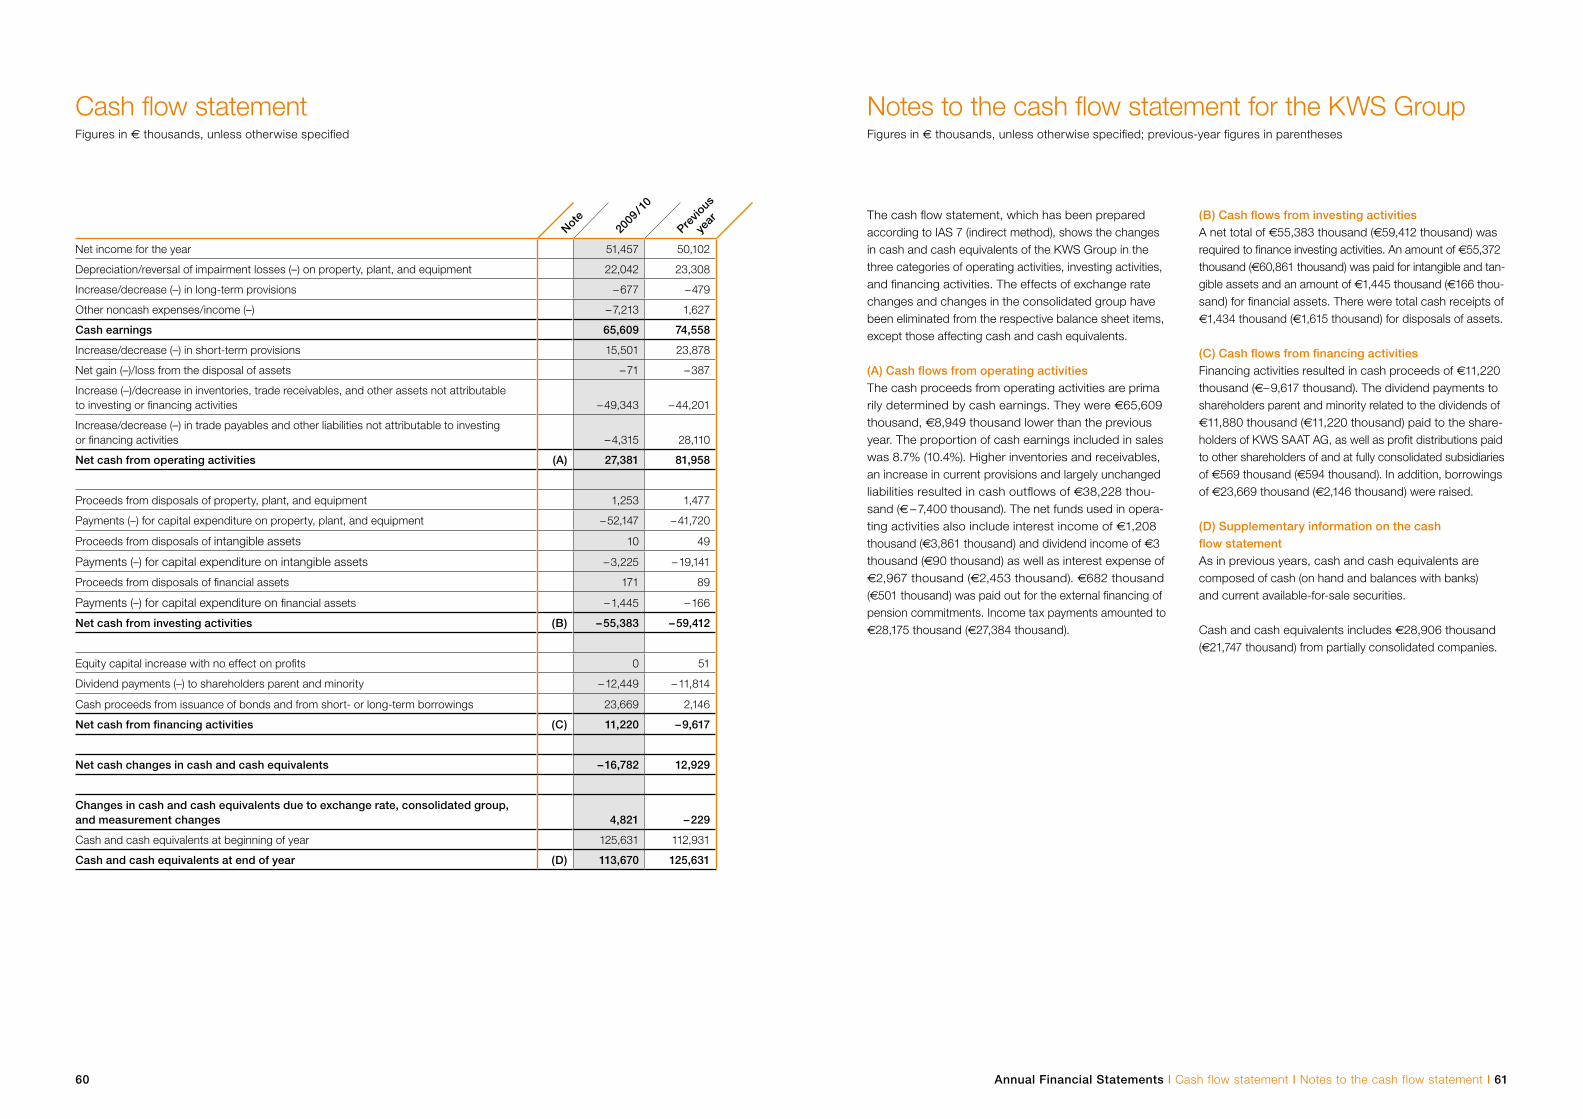
Annual Financial Statements I Cash flow statement I Notes to the cash flow statement I 6160
Notes to the cash flow statement for the KWS Group Figures in € thousands, unless otherwise specified; previous-year figures in parentheses
The cash flow statement, which has been prepared according to IAS 7 (indirect method), shows the changes in cash and cash equivalents of the KWS Group in the three categories of operating activities, investing activities, and financing activities. The effects of exchange rate changes and changes in the consolidated group have been eliminated from the respective balance sheet items, except those affecting cash and cash equivalents.
(A) Cash flows from operating activitiesThe cash proceeds from operating activities are prima rily determined by cash earnings. They were €65,609 thousand, €8,949 thousand lower than the previous year. The proportion of cash earnings included in sales was 8.7% (10.4%). Higher inventories and receivables, an increase in current provisions and largely unchanged liabilities resulted in cash outflows of €38,228 thou-sand (€ – 7,400 thousand). The net funds used in opera-ting activities also include interest income of €1,208 thousand (€3,861 thousand) and dividend income of €3 thousand (€90 thousand) as well as interest expense of €2,967 thousand (€2,453 thousand). €682 thousand (€501 thousand) was paid out for the external financing of pension commitments. Income tax payments amounted to €28,175 thousand (€27,384 thousand).
(B) Cash flows from investing activitiesA net total of €55,383 thousand (€59,412 thousand) was required to finance investing activities. An amount of €55,372 thousand (€60,861 thousand) was paid for intangible and tan-gible assets and an amount of €1,445 thousand (€166 thou-sand) for financial assets. There were total cash receipts of €1,434 thousand (€1,615 thousand) for disposals of assets.
(C) Cash flows from financing activitiesFinancing activities resulted in cash proceeds of €11,220 thousand (€– 9,617 thousand). The dividend payments to shareholders parent and minority related to the dividends of €11,880 thousand (€11,220 thousand) paid to the share-holders of KWS SAAT AG, as well as profit distributions paid to other shareholders of and at fully consolidated subsidiaries of €569 thousand (€594 thousand). In addition, borrowings of €23,669 thousand (€2,146 thousand) were raised.
(D) Supplementary information on the cash flow statementAs in previous years, cash and cash equivalents are composed of cash (on hand and balances with banks) and current available-for-sale securities.
Cash and cash equivalents includes €28,906 thousand (€21,747 thousand) from partially consolidated companies.
Cash flow statement Figures in € thousands, unless otherwise specified
Note20
09 / 1
0
Previo
us
year
Net income for the year 51,457 50,102
Depreciation/reversal of impairment losses (–) on property, plant, and equipment 22,042 23,308
Increase/decrease (–) in long-term provisions – 677 – 479
Other noncash expenses/income (–) – 7,213 1,627
Cash earnings 65,609 74,558
Increase/decrease (–) in short-term provisions 15,501 23,878
Net gain (–)/loss from the disposal of assets – 71 – 387
Increase (–)/decrease in inventories, trade receivables, and other assets not attributable to investing or financing activities – 49,343 – 44,201
Increase/decrease (–) in trade payables and other liabilities not attributable to investing or financing activities – 4,315 28,110
Net cash from operating activities (A) 27,381 81,958
Proceeds from disposals of property, plant, and equipment 1,253 1,477
Payments (–) for capital expenditure on property, plant, and equipment – 52,147 – 41,720
Proceeds from disposals of intangible assets 10 49
Payments (–) for capital expenditure on intangible assets – 3,225 – 19,141
Proceeds from disposals of financial assets 171 89
Payments (–) for capital expenditure on financial assets – 1,445 – 166
Net cash from investing activities (B) – 55,383 – 59,412
Equity capital increase with no effect on profits 0 51
Dividend payments (–) to shareholders parent and minority – 12,449 – 11,814
Cash proceeds from issuance of bonds and from short- or long-term borrowings 23,669 2,146
Net cash from financing activities (C) 11,220 – 9,617
Net cash changes in cash and cash equivalents – 16,782 12,929
Changes in cash and cash equivalents due to exchange rate, consolidated group, and measurement changes 4,821 – 229
Cash and cash equivalents at beginning of year 125,631 112,931
Cash and cash equivalents at end of year (D) 113,670 125,631
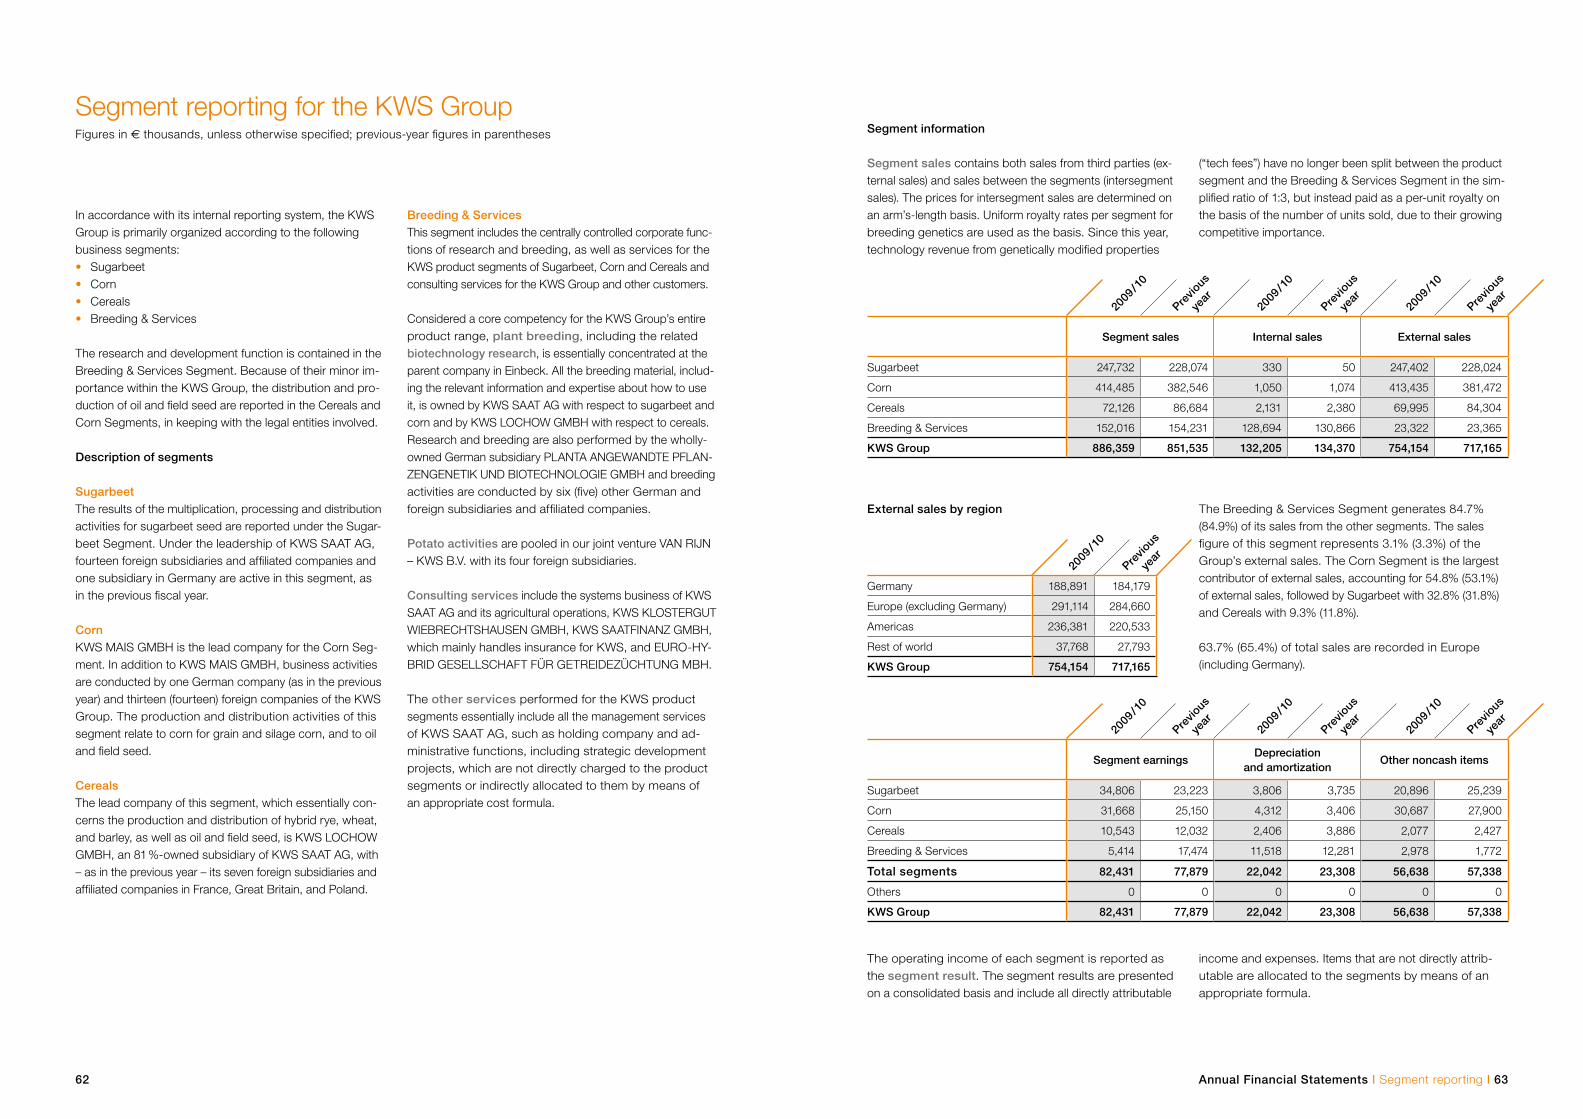
62 Annual Financial Statements I Segment reporting I 63
Segment reporting for the KWS Group Figures in € thousands, unless otherwise specified; previous-year figures in parentheses
In accordance with its internal reporting system, the KWS Group is primarily organized according to the following business segments: • Sugarbeet• Corn• Cereals • Breeding & Services
The research and development function is contained in the Breeding & Services Segment. Because of their minor im-portance within the KWS Group, the distribution and pro-duction of oil and field seed are reported in the Cereals and Corn Segments, in keeping with the legal entities involved.
Description of segments
Sugarbeet The results of the multiplication, processing and distribution activities for sugarbeet seed are reported under the Sugar-beet Segment. Under the leadership of KWS SAAT AG, fourteen foreign subsidiaries and affiliated companies and one subsidiary in Germany are active in this segment, as in the previous fiscal year.
CornKWS MAIS GMBH is the lead company for the Corn Seg-ment. In addition to KWS MAIS GMBH, business activities are conducted by one German company (as in the previous year) and thirteen (fourteen) foreign companies of the KWS Group. The production and distribution activities of this segment relate to corn for grain and silage corn, and to oil and field seed.
Cereals The lead company of this segment, which essentially con-cerns the production and distribution of hybrid rye, wheat, and barley, as well as oil and field seed, is KWS LOCHOW GMBH, an 81 %-owned subsidiary of KWS SAAT AG, with – as in the previous year – its seven foreign subsidiaries and affiliated companies in France, Great Britain, and Poland.
Segment information
Segment sales contains both sales from third parties (ex-ternal sales) and sales between the segments (intersegment sales). The prices for intersegment sales are determined on an arm’s-length basis. Uniform royalty rates per segment for breeding genetics are used as the basis. Since this year, technology revenue from genetically modified properties
The operating income of each segment is reported as the segment result. The segment results are presented on a consolidated basis and include all directly attributable
Breeding & Services This segment includes the centrally controlled corporate func-tions of research and breeding, as well as services for the KWS product segments of Sugarbeet, Corn and Cereals and consulting services for the KWS Group and other customers.
Considered a core competency for the KWS Group’s entire product range, plant breeding, including the related biotechnology research, is essentially concentrated at the parent company in Einbeck. All the breeding material, includ-ing the relevant information and expertise about how to use it, is owned by KWS SAAT AG with respect to sugarbeet and corn and by KWS LOCHOW GMBH with respect to cereals. Research and breeding are also performed by the wholly-owned German subsidiary PLANTA ANGEWANDTE PFLAN-ZENGENETIK UND BIOTECHNOLOGIE GMBH and breeding activities are conducted by six (five) other German and foreign subsidiaries and affiliated companies.
Potato activities are pooled in our joint venture VAN RIJN – KWS B.V. with its four foreign subsidiaries.
Consulting services include the systems business of KWS SAAT AG and its agricultural operations, KWS KLOSTERGUT WIEBRECHTSHAUSEN GMBH, KWS SAATFINANZ GMBH, which mainly handles insurance for KWS, and EURO-HY-BRID GESELLSCHAFT FÜR GETREIDEZÜCHTUNG MBH.
The other services performed for the KWS product segments essentially include all the management services of KWS SAAT AG, such as holding company and ad-ministrative functions, including strategic development projects, which are not directly charged to the product segments or indirectly allocated to them by means of an appropriate cost formula.
(“tech fees”) have no longer been split between the product segment and the Breeding & Services Segment in the sim-plified ratio of 1:3, but instead paid as a per-unit royalty on the basis of the number of units sold, due to their growing competitive importance.
income and expenses. Items that are not directly attrib-utable are allocated to the segments by means of an appropriate formula.
External sales by region The Breeding & Services Segment generates 84.7% (84.9%) of its sales from the other segments. The sales figure of this segment represents 3.1% (3.3%) of the Group’s external sales. The Corn Segment is the largest contributor of external sales, accounting for 54.8% (53.1%) of external sales, followed by Sugarbeet with 32.8% (31.8%) and Cereals with 9.3% (11.8%).
63.7% (65.4%) of total sales are recorded in Europe (including Germany).
Segment sales Internal sales External sales
Sugarbeet 247,732 228,074 330 50 247,402 228,024
Corn 414,485 382,546 1,050 1,074 413,435 381,472
Cereals 72,126 86,684 2,131 2,380 69,995 84,304
Breeding & Services 152,016 154,231 128,694 130,866 23,322 23,365
KWS Group 886,359 851,535 132,205 134,370 754,154 717,165
2009
/ 10
2009
/ 10
2009
/ 10
Previo
us
year
Previo
us
year
Previo
us
year
2009
/ 10
Previo
us
year
Germany 188,891 184,179
Europe (excluding Germany) 291,114 284,660
Americas 236,381 220,533
Rest of world 37,768 27,793
KWS Group 754,154 717,165
Segment earningsDepreciation
and amortizationOther noncash items
Sugarbeet 34,806 23,223 3,806 3,735 20,896 25,239
Corn 31,668 25,150 4,312 3,406 30,687 27,900
Cereals 10,543 12,032 2,406 3,886 2,077 2,427
Breeding & Services 5,414 17,474 11,518 12,281 2,978 1,772
Total segments 82,431 77,879 22,042 23,308 56,638 57,338
Others 0 0 0 0 0 0
KWS Group 82,431 77,879 22,042 23,308 56,638 57,338
2009
/ 10
2009
/ 10
2009
/ 10
Previo
us
year
Previo
us
year
Previo
us
year
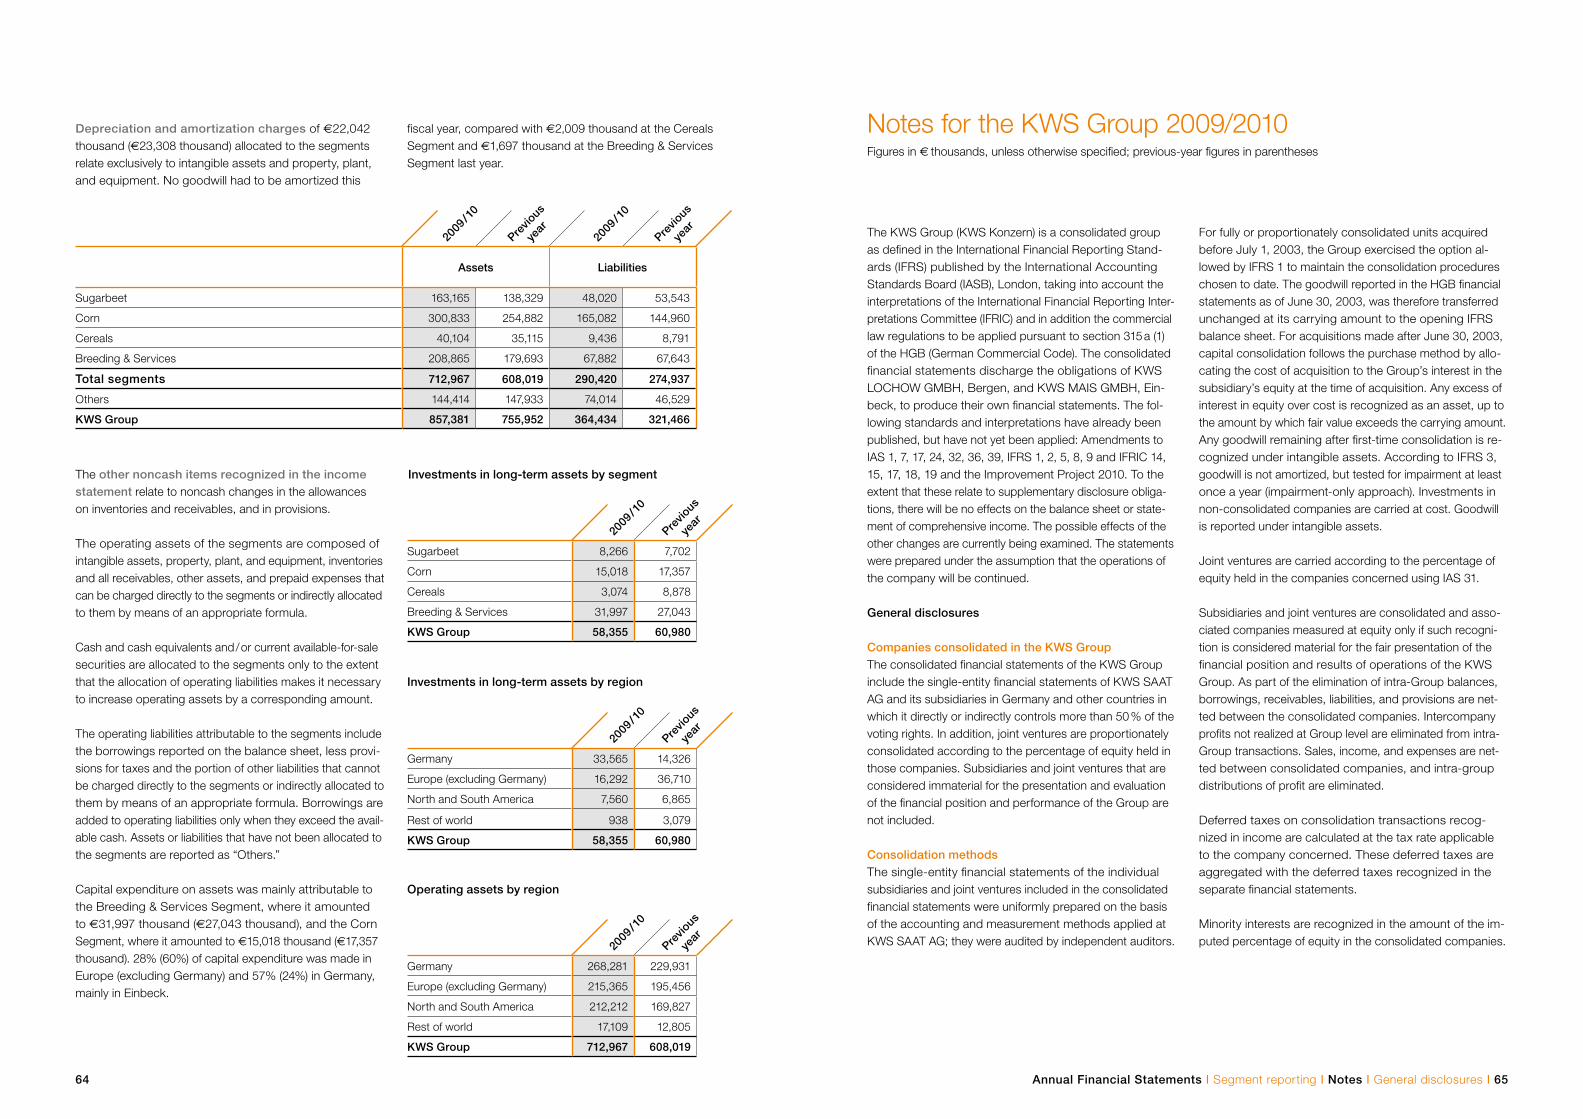
64 Annual Financial Statements I Segment reporting I Notes I General disclosures I 65
The other noncash items recognized in the income statement relate to noncash changes in the allowances on inventories and receivables, and in provisions.
The operating assets of the segments are composed of intangible assets, property, plant, and equipment, inventories and all receivables, other assets, and prepaid expenses that can be charged directly to the segments or indirectly allocated to them by means of an appropriate formula.
Cash and cash equivalents and / or current available-for-sale securities are allocated to the segments only to the extent that the allocation of operating liabilities makes it necessary to increase operating assets by a corresponding amount.
The operating liabilities attributable to the segments include the borrowings reported on the balance sheet, less provi-sions for taxes and the portion of other liabilities that cannot be charged directly to the segments or indirectly allocated to them by means of an appropriate formula. Borrowings are added to operating liabilities only when they exceed the avail-able cash. Assets or liabilities that have not been allocated to the segments are reported as “Others.”
Capital expenditure on assets was mainly attributable to the Breeding & Services Segment, where it amounted to €31,997 thousand (€27,043 thousand), and the Corn Segment, where it amounted to €15,018 thousand (€17,357 thousand). 28% (60%) of capital expenditure was made in Europe (excluding Germany) and 57% (24%) in Germany, mainly in Einbeck.
Notes for the KWS Group 2009/2010Figures in € thousands, unless otherwise specified; previous-year figures in parentheses
The KWS Group (KWS Konzern) is a consolidated group as defined in the International Financial Reporting Stand-ards (IFRS) published by the International Accounting Standards Board (IASB), London, taking into account the interpretations of the International Financial Reporting Inter-pretations Committee (IFRIC) and in addition the commercial law regulations to be applied pursuant to section 315 a (1) of the HGB (German Commercial Code). The consolidated financial statements discharge the obligations of KWS LOCHOW GMBH, Bergen, and KWS MAIS GMBH, Ein-beck, to produce their own financial statements. The fol-lowing standards and interpretations have already been published, but have not yet been applied: Amendments to IAS 1, 7, 17, 24, 32, 36, 39, IFRS 1, 2, 5, 8, 9 and IFRIC 14, 15, 17, 18, 19 and the Improvement Project 2010. To the extent that these relate to supplementary disclosure obliga-tions, there will be no effects on the balance sheet or state-ment of comprehensive income. The possible effects of the other changes are currently being examined. The statements were prepared under the assumption that the operations of the company will be continued.
General disclosures
Companies consolidated in the KWS GroupThe consolidated financial statements of the KWS Group include the single-entity financial statements of KWS SAAT AG and its subsidiaries in Germany and other countries in which it directly or indirectly controls more than 50 % of the voting rights. In addition, joint ventures are proportionately consolidated according to the percentage of equity held in those companies. Subsidiaries and joint ventures that are considered immaterial for the presentation and evaluation of the financial position and performance of the Group are not included.
Consolidation methodsThe single-entity financial statements of the individual subsidiaries and joint ventures included in the consolidated financial statements were uniformly prepared on the basis of the accounting and measurement methods applied at KWS SAAT AG; they were audited by independent auditors.
For fully or proportionately consolidated units acquired before July 1, 2003, the Group exercised the option al-lowed by IFRS 1 to maintain the consolidation procedures chosen to date. The goodwill reported in the HGB financial statements as of June 30, 2003, was therefore transferred unchanged at its carrying amount to the opening IFRS balance sheet. For acquisitions made after June 30, 2003, capital consolidation follows the purchase method by allo-cating the cost of acquisition to the Group’s interest in the subsidiary’s equity at the time of acquisition. Any excess of interest in equity over cost is recognized as an asset, up to the amount by which fair value exceeds the carrying amount. Any goodwill remaining after first-time consolidation is re-cognized under intangible assets. According to IFRS 3, goodwill is not amortized, but tested for impairment at least once a year (impairment-only approach). Investments in non-consolidated companies are carried at cost. Goodwill is reported under intangible assets.
Joint ventures are carried according to the percentage of equity held in the companies concerned using IAS 31.
Subsidiaries and joint ventures are consolidated and asso-ciated companies measured at equity only if such recogni-tion is considered material for the fair presentation of the financial position and results of operations of the KWS Group. As part of the elimination of intra-Group balances, borrowings, receivables, liabilities, and provisions are net-ted between the consolidated companies. Intercompany profits not realized at Group level are eliminated from intra-Group transactions. Sales, income, and expenses are net-ted between consolidated companies, and intra-group distributions of profit are eliminated.
Deferred taxes on consolidation transactions recog-nized in income are calculated at the tax rate applicable to the company concerned. These deferred taxes are aggregated with the deferred taxes recognized in the separate financial statements.
Minority interests are recognized in the amount of the im-puted percentage of equity in the consolidated companies.
Investments in long-term assets by segment
Investments in long-term assets by region
Depreciation and amortization charges of €22,042 thousand (€23,308 thousand) allocated to the segments relate exclusively to intangible assets and property, plant, and equipment. No goodwill had to be amortized this
fiscal year, compared with €2,009 thousand at the Cereals Segment and €1,697 thousand at the Breeding & Services Segment last year.
Operating assets by region
2009
/ 10
2009
/ 10
Previo
us
year
Previo
us
year
Assets Liabilities
Sugarbeet 163,165 138,329 48,020 53,543
Corn 300,833 254,882 165,082 144,960
Cereals 40,104 35,115 9,436 8,791
Breeding & Services 208,865 179,693 67,882 67,643
Total segments 712,967 608,019 290,420 274,937
Others 144,414 147,933 74,014 46,529
KWS Group 857,381 755,952 364,434 321,466
2009
/ 10
Previo
us
year
Sugarbeet 8,266 7,702
Corn 15,018 17,357
Cereals 3,074 8,878
Breeding & Services 31,997 27,043
KWS Group 58,355 60,980
2009
/ 10
Previo
us
year
Germany 33,565 14,326
Europe (excluding Germany) 16,292 36,710
North and South America 7,560 6,865
Rest of world 938 3,079
KWS Group 58,355 60,980
2009
/ 10
Previo
us
year
Germany 268,281 229,931
Europe (excluding Germany) 215,365 195,456
North and South America 212,212 169,827
Rest of world 17,109 12,805
KWS Group 712,967 608,019
66 Annual Financial Statements I Notes I General disclosures I 67
Currency translationUnder IAS 21, the financial statements of the consolidated foreign subsidiaries and joint ventures that conduct their business as financially, economically, and organizationally independent entities are translated into euros using the functional currency method as follows:
• Income statement items at the average exchange rate for the year.
• Balance sheet items at the exchange rate on the balance sheet date.
The difference resulting from the application of annual average rates to the net profit for the period in the income statement is taken directly to equity.
Classification of the balance sheet and the income statementThe costs for the functions include all directly attributable costs, including other taxes. Research and development ex-penses are reported separately for reasons of transparency. Research grants are not deducted from the costs to which they relate, but reported gross under other operating income.
Accounting policies
Consistency of accounting policies The accounting policies are largely unchanged from the previous year. All estimates and assessments as part of accounting and measurement are continually reviewed; they are based on historical patterns and expectations about the future regarded as reasonable in the particular circumstances.
Intangible assets Purchased intangible assets are carried at cost less straight-line amortization over a useful life of three to twenty years. Impairment losses on intangible assets with finite useful lives are recognized according to IAS 36. Goodwill with an indefinite useful life is not amortized, but tested for
impairment at least once a year. The procedure for the im-pairment test is explained in the notes to the balance sheet. Intangible assets acquired as part of business combinations are carried separately from goodwill if they are separable according to the definition in IAS 38 or result from a con-tractual or legal right, and fair value can be reliably meas-ured. Straight-line amortization of these separated intangi-ble assets is applied over their individual useful life.
Property, plant, and equipmentProperty, plant, and equipment is measured at cost less straight-line depreciation. A loss is recognized for an impairment expected to be permanent. In addition to directly attributable costs, the cost of self-produced plant or equipment also includes a proportion of the overheads and depreciation/amortization. Depreciation of buildings is based on a useful life of 50 years. The useful lives of technical equipment and machinery range from five to 15 years, and for operating and office equipment from three to ten years. Low-value assets are fully expensed in the year of purchase; they are reported as additions and disposals in the year of purchase in the statement of changes in noncurrent assets. Impairment losses on property, plant, and equipment are recognized according to IAS 36 whenever the recoverable amount of the asset is less than its carrying amount. The recov-erable amount is the higher of the asset’s net realizable value and its value in use (value of future cash flows expected to be derived from the asset).
Financial instrumentsFinancial instruments are in particular financial assets and financial liabilities. The financial assets consist primarily of bank balances and cash on hand, trade receivables, other receivables, and securities. The credit risk mainly com-prises trade receivables. The amount recognized in the balance sheet is net of allowances for receivables expec-ted to be uncollectible, estimated on the basis of historical patterns and the current economic environment. The credit risk on cash and derivative financial instruments is limited because they are kept with banks that have been given a good credit rating by international rating agencies.
There is no significant concentration of credit risks, be-cause the risks are spread over a large number of contract partners and customers. The entire credit risk is limited to the respective carrying amount. Comments on the risk ma-nagement system can be found in the Management Report.
Investments are measured at cost. The cost of equity-accounted investments is increased or decreased by proportionate changes in equity. Assets available for sale are carried at market value if this can be reliably measured. Unrealized gains and losses, including de-ferred taxes, are recognized directly in the revaluation reserve under equity. Permanent impairment losses are recognized immediately through the income statement. Borrowings are carried at amortized cost.
The financial liabilities comprise in particular trade payables, borrowings and other liabilities.
The fair value of financial instruments is determined on the basis of the market information available on the balance sheet date and in accordance with the measurement methods applied.
The other noncurrent financial assets are essentially available for sale and are carried at market value where possible. If a market value cannot be determined, the amortized costs are carried as an alternative.
The carrying amount of receivables, fixed-income securities and cash is assumed as the fair value due to their short term and the fixed-interest structure of the investments.
Derivative instruments are carried at market values in ac-cordance with IAS 39 and may have a positive or negative value. This relates essentially to common derivative financial instruments that are used to hedge interest rate and foreign currency risks. In particular, the derivative financial instruments are measured using recognized mathematical models, such as present value or Black-Scholes, to calculate option values, taking their volatility, remaining maturity, and capital market interest rates into account.
The fair value of financial liabilities with a long-term fixed in-terest rate is determined as present values of the payments related to the liabilities, using a yield curve applicable on the balance sheet date.
The fair values of the financial instruments are generally determined on the basis of the market information avail-able on the balance sheet date and must be assigned to a level in the fair value hierarchy.
Financial instruments in level 1 are measured using quoted prices in active markets for identical assets or liabilities. In level 2, they are measured by directly observable market inputs or derived indirectly on the basis of prices for similar instruments. Finally, input factors not based on observable market data are used to calculate the value of level 3 financial instruments.
Subsequent measurement of the financial instruments depends on their classification in one of the following categories defined in IAS 39:
• Loans and receivablesThis category mainly comprises trade receivables, other receivables, loans and cash, including fixed-income short-term securities. Loans are measured at cost. Loans that carry no interest or only low interest are measured at their present value. Discernable risks are taken into account by recognition of an impairment loss. After their initial recognition, the other financial assets in this category are measured at amortized cost using the effective interest method, minus impairments. Receivables that carry no interest or only low interest and with a term of more than twelve months are discounted. Necessary value impairments are based on the expected credit risk and are carried in separate impairment accounts. Receivables are derecognized if they are settled or uncollectible. Other assets are derecognized at the time they are disposed of or if they have no value.
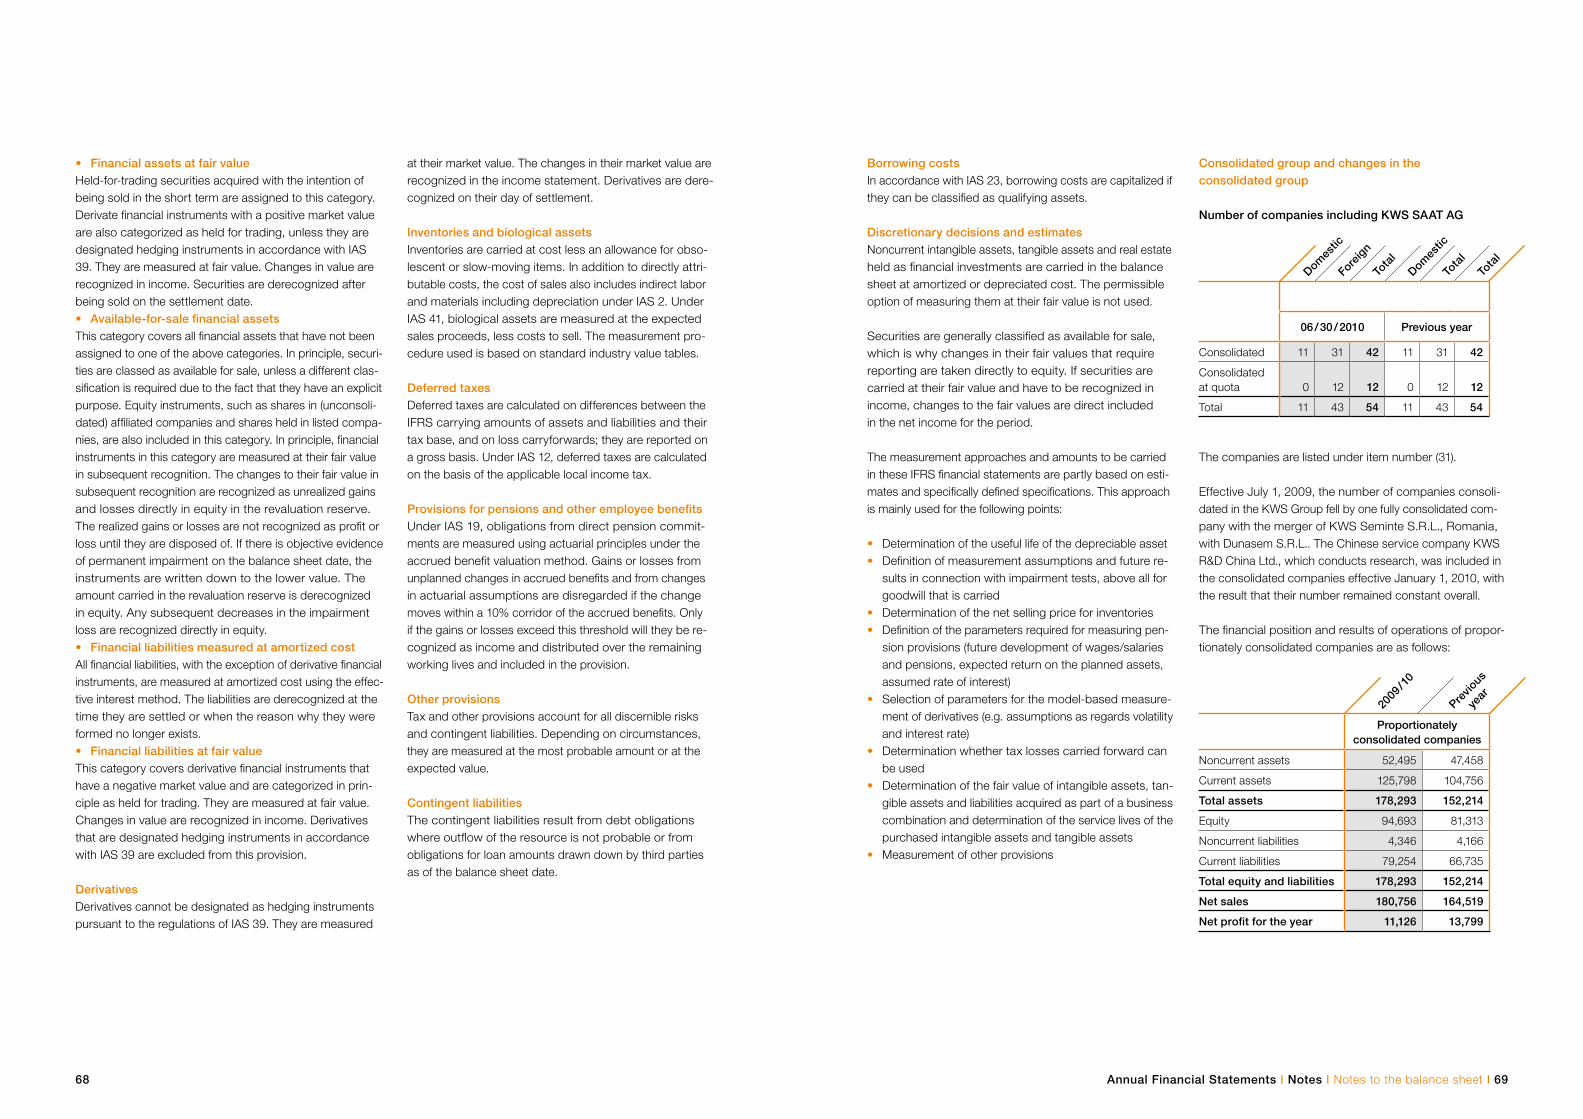
68 Annual Financial Statements I Notes I Notes to the balance sheet I 69
• Financial assets at fair valueHeld-for-trading securities acquired with the intention of being sold in the short term are assigned to this category. Derivate financial instruments with a positive market value are also categorized as held for trading, unless they are designated hedging instruments in accordance with IAS 39. They are measured at fair value. Changes in value are recognized in income. Securities are derecognized after being sold on the settlement date.• Available-for-sale financial assets This category covers all financial assets that have not been assigned to one of the above categories. In principle, securi-ties are classed as available for sale, unless a different clas-sification is required due to the fact that they have an explicit purpose. Equity instruments, such as shares in (unconsoli-dated) affiliated companies and shares held in listed compa-nies, are also included in this category. In principle, financial instruments in this category are measured at their fair value in subsequent recognition. The changes to their fair value in subsequent recognition are recognized as unrealized gains and losses directly in equity in the revaluation reserve. The realized gains or losses are not recognized as profit or loss until they are disposed of. If there is objective evidence of permanent impairment on the balance sheet date, the instruments are written down to the lower value. The amount carried in the revaluation reserve is derecognized in equity. Any subsequent decreases in the impairment loss are recognized directly in equity.• Financial liabilities measured at amortized costAll financial liabilities, with the exception of derivative financial instruments, are measured at amortized cost using the effec-tive interest method. The liabilities are derecognized at the time they are settled or when the reason why they were formed no longer exists.• Financial liabilities at fair valueThis category covers derivative financial instruments that have a negative market value and are categorized in prin-ciple as held for trading. They are measured at fair value. Changes in value are recognized in income. Derivatives that are designated hedging instruments in accordance with IAS 39 are excluded from this provision.
DerivativesDerivatives cannot be designated as hedging instruments pursuant to the regulations of IAS 39. They are measured
at their market value. The changes in their market value are recognized in the income statement. Derivatives are dere-cognized on their day of settlement.
Inventories and biological assetsInventories are carried at cost less an allowance for obso-lescent or slow-moving items. In addition to directly attri-butable costs, the cost of sales also includes indirect labor and materials including depreciation under IAS 2. Under IAS 41, biological assets are measured at the expected sales proceeds, less costs to sell. The measurement pro-cedure used is based on standard industry value tables.
Deferred taxesDeferred taxes are calculated on differences between the IFRS carrying amounts of assets and liabilities and their tax base, and on loss carryforwards; they are reported on a gross basis. Under IAS 12, deferred taxes are calculated on the basis of the applicable local income tax.
Provisions for pensions and other employee benefitsUnder IAS 19, obligations from direct pension commit-ments are measured using actuarial principles under the accrued benefit valuation method. Gains or losses from unplanned changes in accrued benefits and from changes in actuarial assumptions are disregarded if the change moves within a 10% corridor of the accrued benefits. Only if the gains or losses exceed this threshold will they be re-cognized as income and distributed over the remaining working lives and included in the provision.
Other provisionsTax and other provisions account for all discernible risks and contingent liabilities. Depending on circumstances, they are measured at the most probable amount or at the expected value.
Contingent liabilitiesThe contingent liabilities result from debt obligations where outflow of the resource is not probable or from obligations for loan amounts drawn down by third parties as of the balance sheet date.
Borrowing costsIn accordance with IAS 23, borrowing costs are capitalized if they can be classified as qualifying assets.
Discretionary decisions and estimatesNoncurrent intangible assets, tangible assets and real estate held as financial investments are carried in the balance sheet at amortized or depreciated cost. The permissible option of measuring them at their fair value is not used.
Securities are generally classified as available for sale, which is why changes in their fair values that require reporting are taken directly to equity. If securities are carried at their fair value and have to be recognized in income, changes to the fair values are direct included in the net income for the period.
The measurement approaches and amounts to be carried in these IFRS financial statements are partly based on esti-mates and specifically defined specifications. This approach is mainly used for the following points:
• Determination of the useful life of the depreciable asset• Definition of measurement assumptions and future re- sults in connection with impairment tests, above all for goodwill that is carried• Determination of the net selling price for inventories• Definition of the parameters required for measuring pen- sion provisions (future development of wages/salaries and pensions, expected return on the planned assets, assumed rate of interest)• Selection of parameters for the model-based measure- ment of derivatives (e.g. assumptions as regards volatility and interest rate)• Determination whether tax losses carried forward can be used• Determination of the fair value of intangible assets, tan- gible assets and liabilities acquired as part of a business combination and determination of the service lives of the purchased intangible assets and tangible assets• Measurement of other provisions
Consolidated group and changes in the consolidated group
Number of companies including KWS SAAT AG
The companies are listed under item number (31).
Effective July 1, 2009, the number of companies consoli-dated in the KWS Group fell by one fully consolidated com-pany with the merger of KWS Seminte S.R.L., Romania, with Dunasem S.R.L.. The Chinese service company KWS R&D China Ltd., which conducts research, was included in the consolidated companies effective January 1, 2010, with the result that their number remained constant overall.
The financial position and results of operations of propor-tionately consolidated companies are as follows:
Domes
tic
Foreig
n
Tota
lDom
estic
Tota
lTo
tal
06 / 30 / 2010 Previous year
Consolidated 11 31 42 11 31 42
Consolidated at quota 0 12 12 0 12 12
Total 11 43 54 11 43 54
Proportionately consolidated companies
Noncurrent assets 52,495 47,458
Current assets 125,798 104,756
Total assets 178,293 152,214
Equity 94,693 81,313
Noncurrent liabilities 4,346 4,166
Current liabilities 79,254 66,735
Total equity and liabilities 178,293 152,214
Net sales 180,756 164,519
Net profit for the year 11,126 13,799
2009
/ 10
Previo
us
year
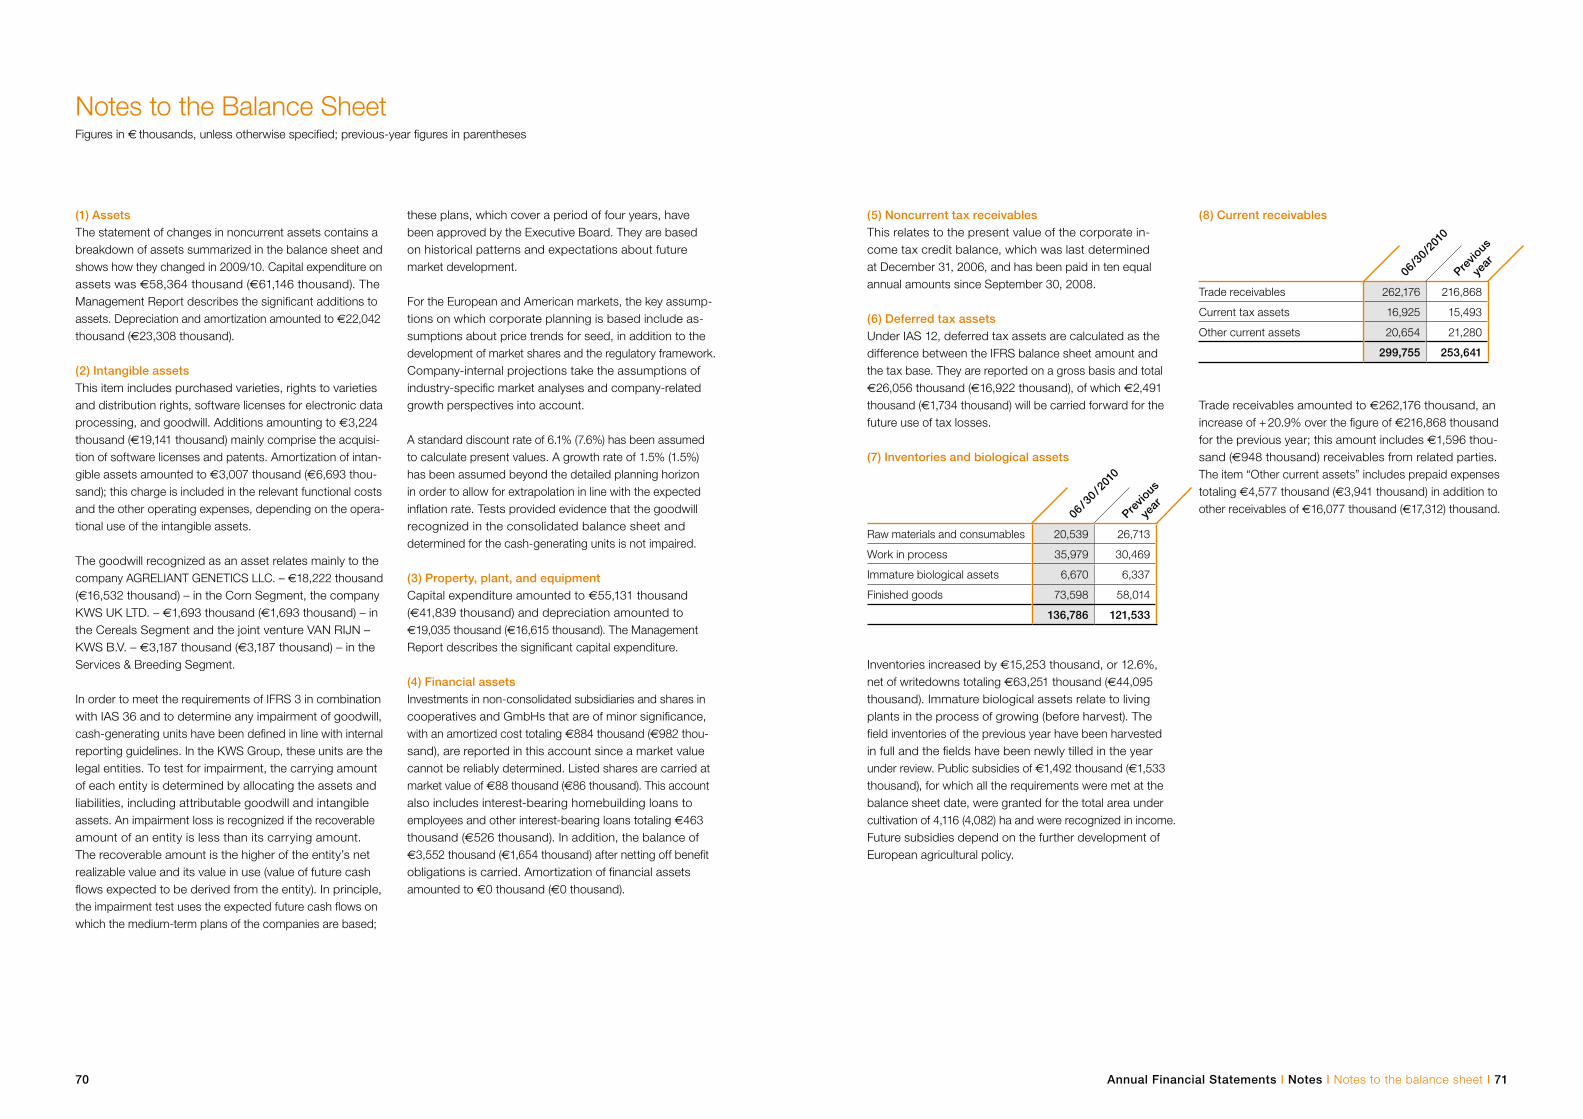
(1) AssetsThe statement of changes in noncurrent assets contains a breakdown of assets summarized in the balance sheet and shows how they changed in 2009/10. Capital expenditure on assets was €58,364 thousand (€61,146 thousand). The Management Report describes the significant additions to assets. Depreciation and amortization amounted to €22,042 thousand (€23,308 thousand).
(2) Intangible assetsThis item includes purchased varieties, rights to varieties and distribution rights, software licenses for electronic data processing, and goodwill. Additions amounting to €3,224 thousand (€19,141 thousand) mainly comprise the acquisi-tion of software licenses and patents. Amortization of intan-gible assets amounted to €3,007 thousand (€6,693 thou-sand); this charge is included in the relevant functional costs and the other operating expenses, depending on the opera-tional use of the intangible assets.
The goodwill recognized as an asset relates mainly to the company AGRELIANT GENETICS LLC. – €18,222 thousand (€16,532 thousand) – in the Corn Segment, the company KWS UK LTD. – €1,693 thousand (€1,693 thousand) – in the Cereals Segment and the joint venture VAN RIJN – KWS B.V. – €3,187 thousand (€3,187 thousand) – in the Services & Breeding Segment.
In order to meet the requirements of IFRS 3 in combination with IAS 36 and to determine any impairment of goodwill, cash-generating units have been defined in line with internal reporting guidelines. In the KWS Group, these units are the legal entities. To test for impairment, the carrying amount of each entity is determined by allocating the assets and liabilities, including attributable goodwill and intangible assets. An impairment loss is recognized if the recoverable amount of an entity is less than its carrying amount.The recoverable amount is the higher of the entity’s net realizable value and its value in use (value of future cash flows expected to be derived from the entity). In principle, the impairment test uses the expected future cash flows on which the medium-term plans of the companies are based;
these plans, which cover a period of four years, have been approved by the Executive Board. They are based on historical patterns and expectations about future market development.
For the European and American markets, the key assump-tions on which corporate planning is based include as-sumptions about price trends for seed, in addition to the development of market shares and the regulatory framework. Company-internal projections take the assumptions of industry-specific market analyses and company-related growth perspectives into account.
A standard discount rate of 6.1% (7.6%) has been assumed to calculate present values. A growth rate of 1.5% (1.5%) has been assumed beyond the detailed planning horizon in order to allow for extrapolation in line with the expected inflation rate. Tests provided evidence that the goodwill recognized in the consolidated balance sheet and determined for the cash-generating units is not impaired.
(3) Property, plant, and equipmentCapital expenditure amounted to €55,131 thousand (€41,839 thousand) and depreciation amounted to €19,035 thousand (€16,615 thousand). The Management Report describes the significant capital expenditure.
(4) Financial assetsInvestments in non-consolidated subsidiaries and shares in cooperatives and GmbHs that are of minor significance, with an amortized cost totaling €884 thousand (€982 thou-sand), are reported in this account since a market value cannot be reliably determined. Listed shares are carried at market value of €88 thousand (€86 thousand). This account also includes interest-bearing homebuilding loans to employees and other interest-bearing loans totaling €463 thousand (€526 thousand). In addition, the balance of €3,552 thousand (€1,654 thousand) after netting off benefit obligations is carried. Amortization of financial assets amounted to €0 thousand (€0 thousand).
Notes to the Balance Sheet Figures in € thousands, unless otherwise specified; previous-year figures in parentheses
(5) Noncurrent tax receivablesThis relates to the present value of the corporate in-come tax credit balance, which was last determined at December 31, 2006, and has been paid in ten equal annual amounts since September 30, 2008.
(6) Deferred tax assetsUnder IAS 12, deferred tax assets are calculated as the difference between the IFRS balance sheet amount and the tax base. They are reported on a gross basis and total €26,056 thousand (€16,922 thousand), of which €2,491 thousand (€1,734 thousand) will be carried forward for the future use of tax losses.
(7) Inventories and biological assets
(8) Current receivables
Inventories increased by €15,253 thousand, or 12.6%, net of writedowns totaling €63,251 thousand (€44,095 thousand). Immature biological assets relate to living plants in the process of growing (before harvest). The field inventories of the previous year have been harvested in full and the fields have been newly tilled in the year under review. Public subsidies of €1,492 thousand (€1,533 thousand), for which all the requirements were met at the balance sheet date, were granted for the total area under cultivation of 4,116 (4,082) ha and were recognized in income. Future subsidies depend on the further development of European agricultural policy.
Annual Financial Statements I Notes I Notes to the balance sheet I 7170
Trade receivables amounted to €262,176 thousand, an increase of + 20.9% over the figure of €216,868 thousand for the previous year; this amount includes €1,596 thou-sand (€948 thousand) receivables from related parties. The item “Other current assets” includes prepaid expenses totaling €4,577 thousand (€3,941 thousand) in addition to other receivables of €16,077 thousand (€17,312) thousand.06
/ 30 /
2010
Previo
us
year
Raw materials and consumables 20,539 26,713
Work in process 35,979 30,469
Immature biological assets 6,670 6,337
Finished goods 73,598 58,014
136,786 121,533
Trade receivables 262,176 216,868
Current tax assets 16,925 15,493
Other current assets 20,654 21,280
299,755 253,641
06/3
0/201
0
Previo
us
year
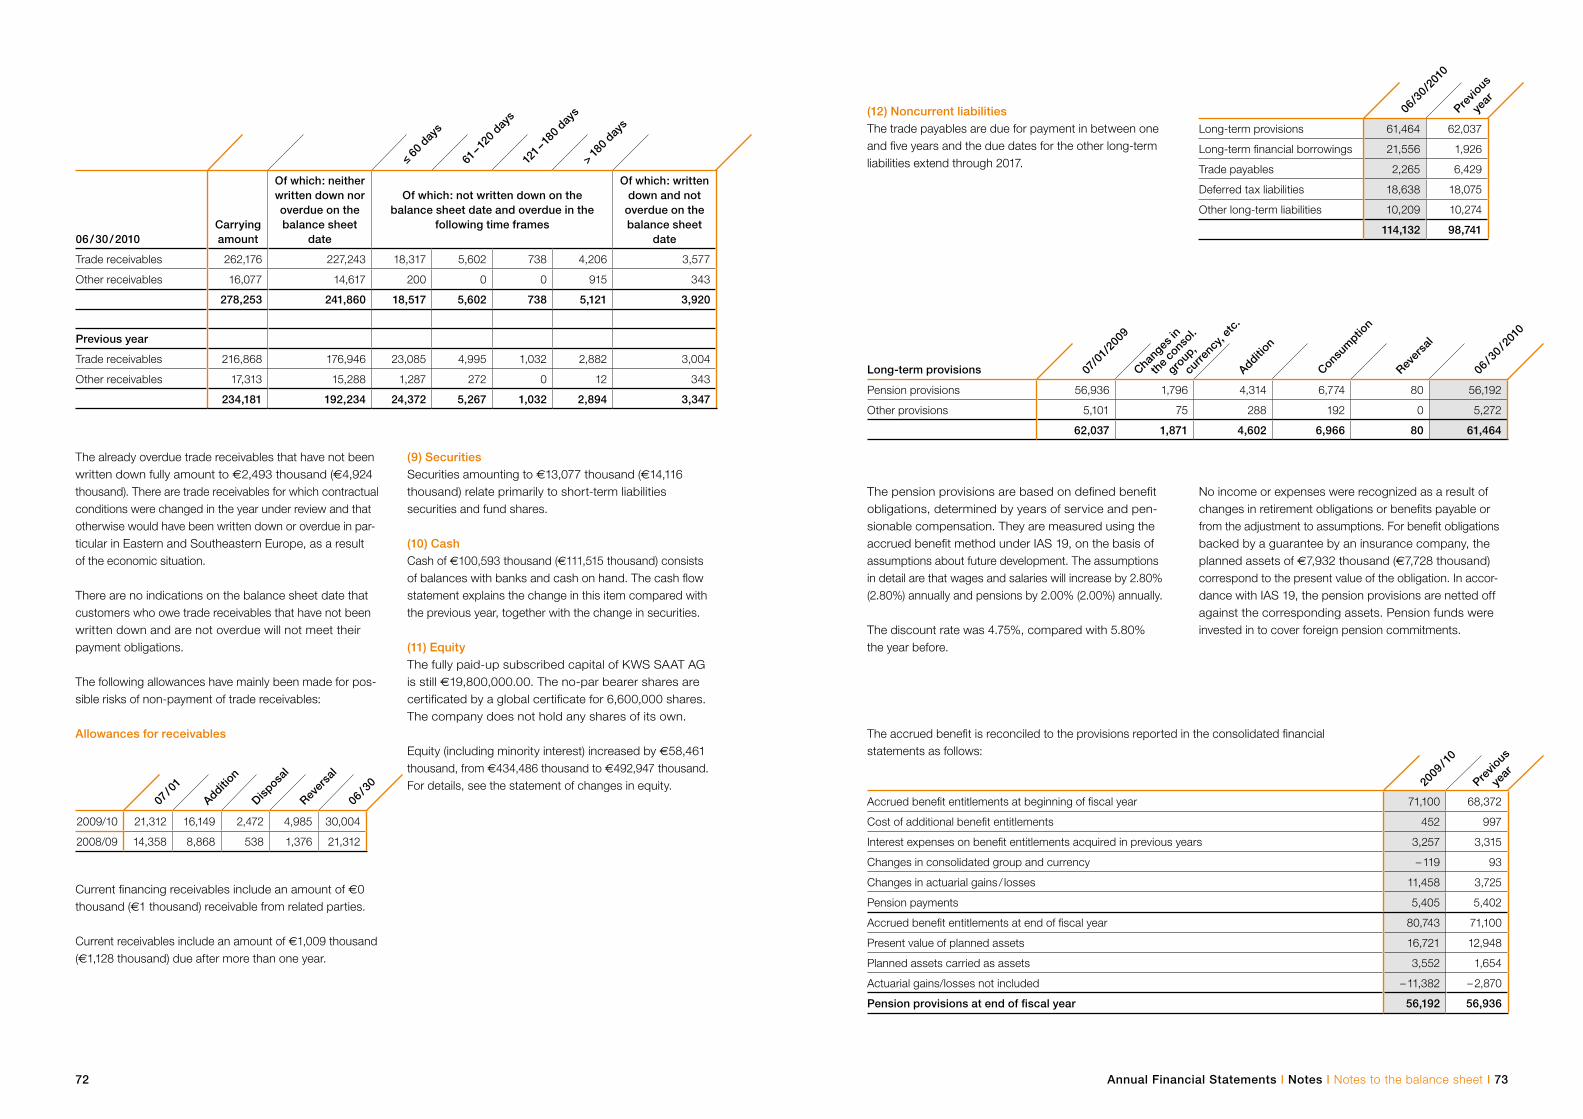
72
Current financing receivables include an amount of €0 thousand (€1 thousand) receivable from related parties.
Current receivables include an amount of €1,009 thousand (€1,128 thousand) due after more than one year.
The already overdue trade receivables that have not been written down fully amount to €2,493 thousand (€4,924 thousand). There are trade receivables for which contractual conditions were changed in the year under review and that otherwise would have been written down or overdue in par-ticular in Eastern and Southeastern Europe, as a result of the economic situation.
There are no indications on the balance sheet date that customers who owe trade receivables that have not been written down and are not overdue will not meet their payment obligations.
The following allowances have mainly been made for pos-sible risks of non-payment of trade receivables:
Allowances for receivables
(9) SecuritiesSecurities amounting to €13,077 thousand (€14,116 thousand) relate primarily to short-term liabilities securities and fund shares.
(10) CashCash of €100,593 thousand (€111,515 thousand) consists of balances with banks and cash on hand. The cash flow statement explains the change in this item compared with the previous year, together with the change in securities.
(11) EquityThe fully paid-up subscribed capital of KWS SAAT AG is still €19,800,000.00. The no-par bearer shares are certificated by a global certificate for 6,600,000 shares. The company does not hold any shares of its own.
Equity (including minority interest) increased by €58,461 thousand, from €434,486 thousand to €492,947 thousand. For details, see the statement of changes in equity.
(12) Noncurrent liabilitiesThe trade payables are due for payment in between one and five years and the due dates for the other long-term liabilities extend through 2017.
The pension provisions are based on defined benefit obligations, determined by years of service and pen- sionable compensation. They are measured using the accrued benefit method under IAS 19, on the basis of assumptions about future development. The assumptions in detail are that wages and salaries will increase by 2.80% (2.80%) annually and pensions by 2.00% (2.00%) annually.
The discount rate was 4.75%, compared with 5.80% the year before.
The accrued benefit is reconciled to the provisions reported in the consolidated financial statements as follows:
Annual Financial Statements I Notes I Notes to the balance sheet I 73
No income or expenses were recognized as a result of changes in retirement obligations or benefits payable or from the adjustment to assumptions. For benefit obligations backed by a guarantee by an insurance company, the planned assets of €7,932 thousand (€7,728 thousand) correspond to the present value of the obligation. In accor-dance with IAS 19, the pension provisions are netted off against the corresponding assets. Pension funds were invested in to cover foreign pension commitments.
≤ 60 d
ays
61 – 1
20 d
ays
121 –
180
days
> 180
days
06 / 30 / 2010Carrying amount
Of which: neither written down nor overdue on the balance sheet
date
Of which: not written down on thebalance sheet date and overdue in the
following time frames
Of which: written down and not
overdue on the balance sheet
date
Trade receivables 262,176 227,243 18,317 5,602 738 4,206 3,577
Other receivables 16,077 14,617 200 0 0 915 343
278,253 241,860 18,517 5,602 738 5,121 3,920
Previous year
Trade receivables 216,868 176,946 23,085 4,995 1,032 2,882 3,004
Other receivables 17,313 15,288 1,287 272 0 12 343
234,181 192,234 24,372 5,267 1,032 2,894 3,347
07 / 0
1
Addition
Disposa
l
Rever
sal
06 / 3
0
2009/10 21,312 16,149 2,472 4,985 30,004
2008/09 14,358 8,868 538 1,376 21,312
06/3
0/201
0
Previo
us
year
Long-term provisions 61,464 62,037
Long-term financial borrowings 21,556 1,926
Trade payables 2,265 6,429
Deferred tax liabilities 18,638 18,075
Other long-term liabilities 10,209 10,274
114,132 98,741
06 / 3
0 / 20
10
07/0
1/20
09
Chang
es in
the
cons
ol.
group
,
curre
ncy,
etc.
Addition
Consum
ption
Rever
sal
Long-term provisions
Pension provisions 56,936 1,796 4,314 6,774 80 56,192
Other provisions 5,101 75 288 192 0 5,272
62,037 1,871 4,602 6,966 80 61,464
2009
/ 10
Previo
us
year
Accrued benefit entitlements at beginning of fiscal year 71,100 68,372
Cost of additional benefit entitlements 452 997
Interest expenses on benefit entitlements acquired in previous years 3,257 3,315
Changes in consolidated group and currency – 119 93
Changes in actuarial gains / losses 11,458 3,725
Pension payments 5,405 5,402
Accrued benefit entitlements at end of fiscal year 80,743 71,100
Present value of planned assets 16,721 12,948
Planned assets carried as assets 3,552 1,654
Actuarial gains/losses not included – 11,382 – 2,870
Pension provisions at end of fiscal year 56,192 56,936
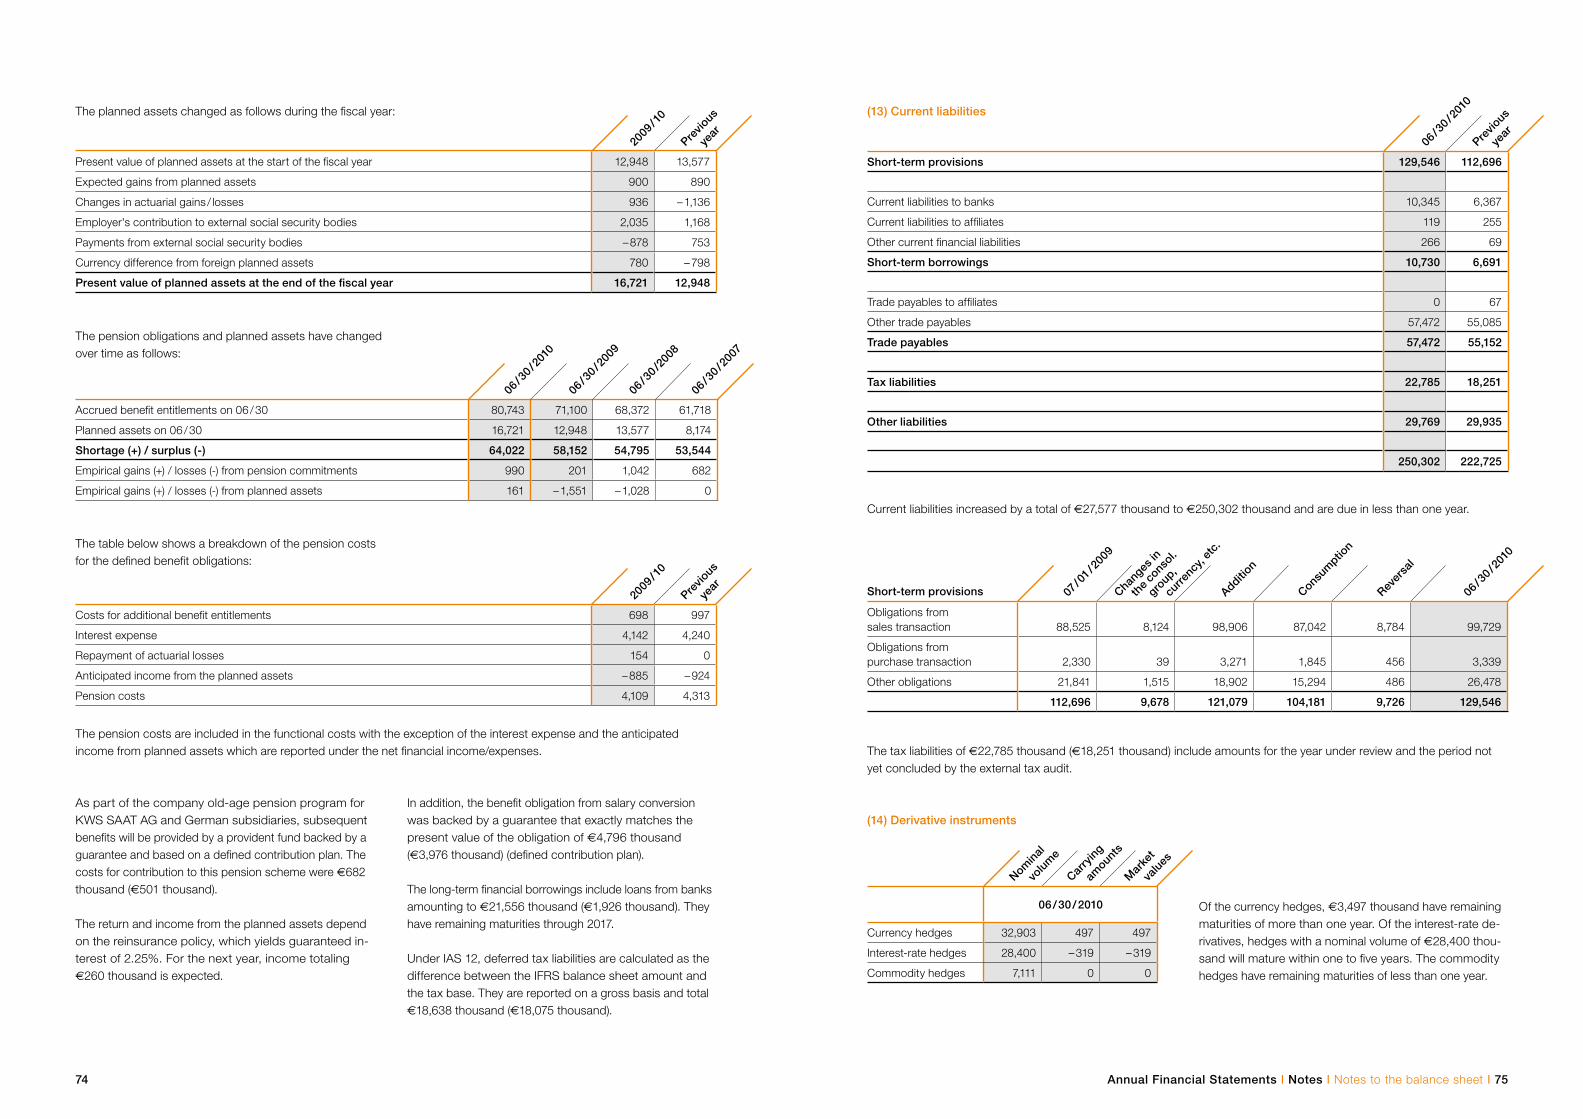
74
As part of the company old-age pension program for KWS SAAT AG and German subsidiaries, subsequent benefits will be provided by a provident fund backed by a guarantee and based on a defined contribution plan. The costs for contribution to this pension scheme were €682 thousand (€501 thousand).
The return and income from the planned assets depend on the reinsurance policy, which yields guaranteed in-terest of 2.25%. For the next year, income totaling €260 thousand is expected.
The planned assets changed as follows during the fiscal year:
The table below shows a breakdown of the pension costs for the defined benefit obligations:
The pension costs are included in the functional costs with the exception of the interest expense and the anticipated income from planned assets which are reported under the net financial income/expenses.
The pension obligations and planned assets have changed over time as follows:
(13) Current liabilities
Current liabilities increased by a total of €27,577 thousand to €250,302 thousand and are due in less than one year.
The tax liabilities of €22,785 thousand (€18,251 thousand) include amounts for the year under review and the period not yet concluded by the external tax audit.
(14) Derivative instruments
Of the currency hedges, €3,497 thousand have remaining maturities of more than one year. Of the interest-rate de-rivatives, hedges with a nominal volume of €28,400 thou-sand will mature within one to five years. The commodity hedges have remaining maturities of less than one year.
Annual Financial Statements I Notes I Notes to the balance sheet I 75
In addition, the benefit obligation from salary conversion was backed by a guarantee that exactly matches the present value of the obligation of €4,796 thousand (€3,976 thousand) (defined contribution plan).
The long-term financial borrowings include loans from banks amounting to €21,556 thousand (€1,926 thousand). They have remaining maturities through 2017.
Under IAS 12, deferred tax liabilities are calculated as the difference between the IFRS balance sheet amount and the tax base. They are reported on a gross basis and total €18,638 thousand (€18,075 thousand).
2009
/ 10
Previo
us
year
Present value of planned assets at the start of the fiscal year 12,948 13,577
Expected gains from planned assets 900 890
Changes in actuarial gains / losses 936 – 1,136
Employer's contribution to external social security bodies 2,035 1,168
Payments from external social security bodies – 878 753
Currency difference from foreign planned assets 780 – 798
Present value of planned assets at the end of the fiscal year 16,721 12,948
Accrued benefit entitlements on 06 / 30 80,743 71,100 68,372 61,718
Planned assets on 06 / 30 16,721 12,948 13,577 8,174
Shortage (+) / surplus (-) 64,022 58,152 54,795 53,544
Empirical gains (+) / losses (-) from pension commitments 990 201 1,042 682
Empirical gains (+) / losses (-) from planned assets 161 – 1,551 – 1,028 0
06 / 3
0 / 20
09
06 / 3
0 / 20
10
06 / 3
0 /20
08
06 / 3
0 / 20
07
2009
/ 10
Previo
us
year
Costs for additional benefit entitlements 698 997
Interest expense 4,142 4,240
Repayment of actuarial losses 154 0
Anticipated income from the planned assets – 885 – 924
Pension costs 4,109 4,313
06 / 3
0 / 20
10
Previo
us
year
Short-term provisions 129,546 112,696
Current liabilities to banks 10,345 6,367
Current liabilities to affiliates 119 255
Other current financial liabilities 266 69
Short-term borrowings 10,730 6,691
Trade payables to affiliates 0 67
Other trade payables 57,472 55,085
Trade payables 57,472 55,152
Tax liabilities 22,785 18,251
Other liabilities 29,769 29,935
250,302 222,725
Short-term provisions 07 / 0
1 / 20
09
Chang
es in
the
cons
ol.
group
,
curre
ncy,
etc.
Addition
Consum
ption
Rever
sal
06 / 3
0 / 20
10
Obligations from sales transaction 88,525 8,124 98,906 87,042 8,784 99,729
Obligations from purchase transaction 2,330 39 3,271 1,845 456 3,339
Other obligations 21,841 1,515 18,902 15,294 486 26,478
112,696 9,678 121,079 104,181 9,726 129,546
Nomin
al
volu
me
Carry
ing
amoun
ts
Mar
ket
valu
es
06 / 30 / 2010
Currency hedges 32,903 497 497
Interest-rate hedges 28,400 – 319 – 319
Commodity hedges 7,111 0 0
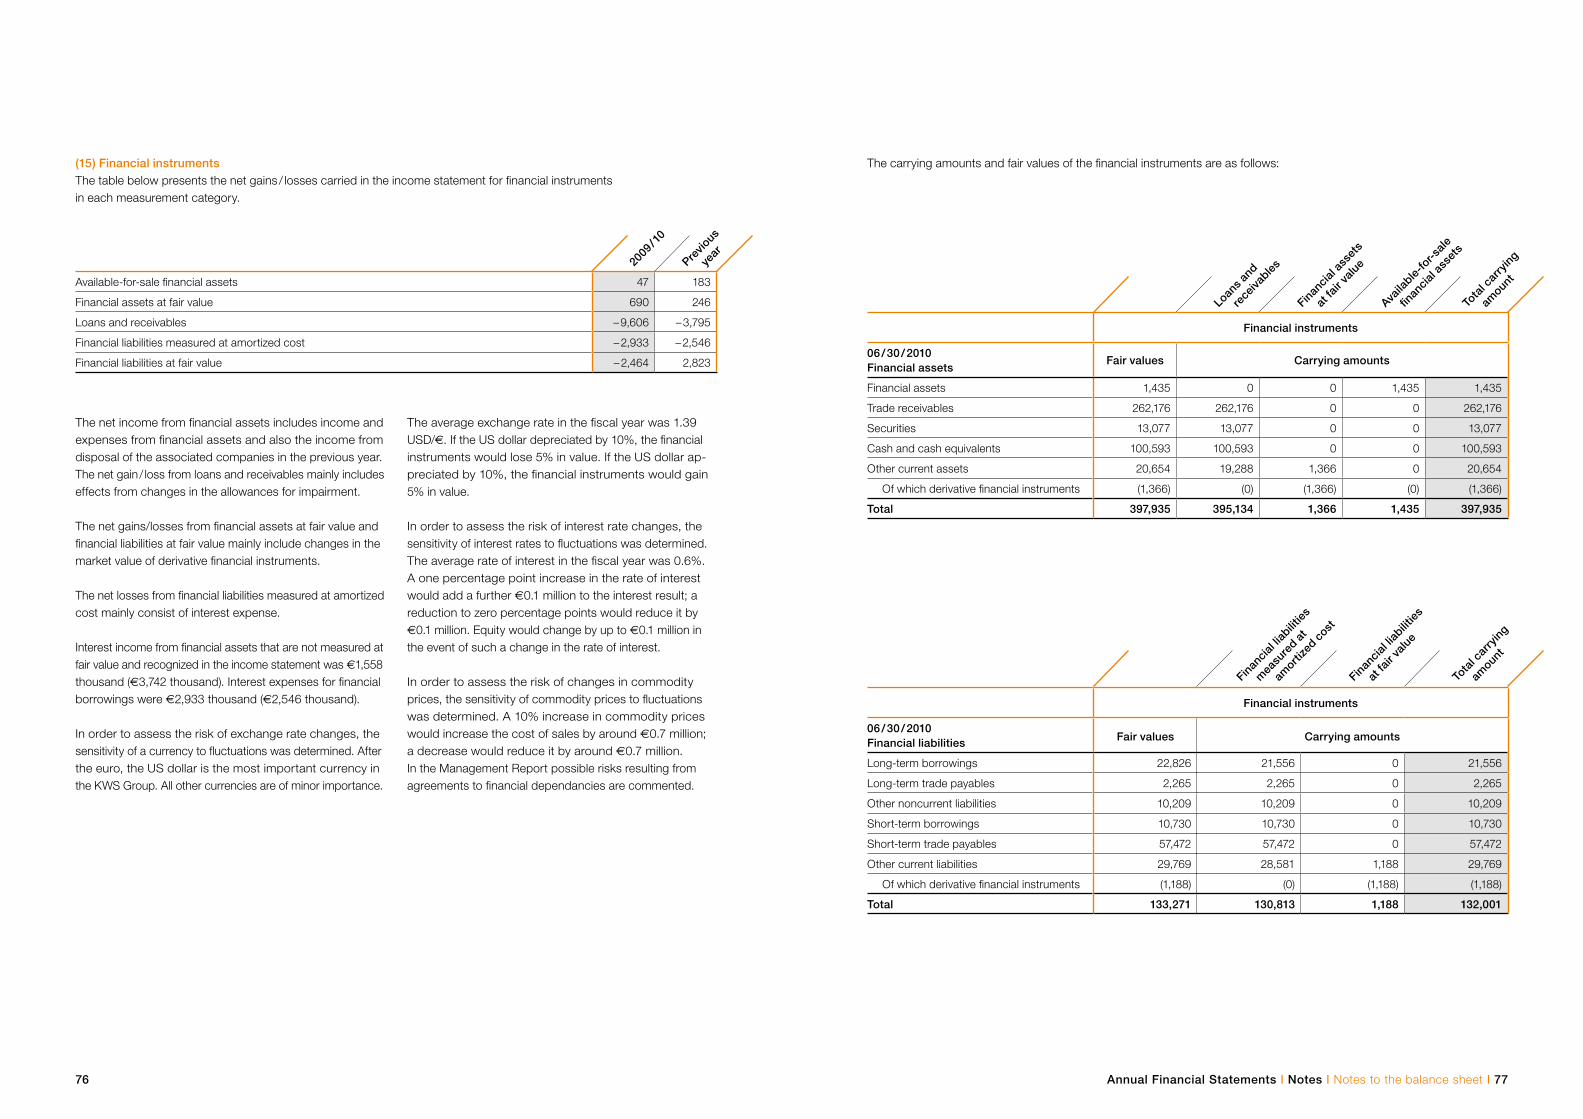
The net income from financial assets includes income and expenses from financial assets and also the income from disposal of the associated companies in the previous year. The net gain / loss from loans and receivables mainly includes effects from changes in the allowances for impairment.
The net gains/losses from financial assets at fair value and financial liabilities at fair value mainly include changes in the market value of derivative financial instruments.
The net losses from financial liabilities measured at amortized cost mainly consist of interest expense.
Interest income from financial assets that are not measured at fair value and recognized in the income statement was €1,558 thousand (€3,742 thousand). Interest expenses for financial borrowings were €2,933 thousand (€2,546 thousand).
In order to assess the risk of exchange rate changes, the sensitivity of a currency to fluctuations was determined. After the euro, the US dollar is the most important currency in the KWS Group. All other currencies are of minor importance.
The average exchange rate in the fiscal year was 1.39 USD/€. If the US dollar depreciated by 10%, the financial instruments would lose 5% in value. If the US dollar ap-preciated by 10%, the financial instruments would gain 5% in value.
In order to assess the risk of interest rate changes, the sensitivity of interest rates to fluctuations was determined. The average rate of interest in the fiscal year was 0.6%. A one percentage point increase in the rate of interest would add a further €0.1 million to the interest result; a reduction to zero percentage points would reduce it by €0.1 million. Equity would change by up to €0.1 million in the event of such a change in the rate of interest.
In order to assess the risk of changes in commodity prices, the sensitivity of commodity prices to fluctuations was determined. A 10% increase in commodity prices would increase the cost of sales by around €0.7 million; a decrease would reduce it by around €0.7 million. In the Management Report possible risks resulting from agreements to financial dependancies are commented.
(15) Financial instrumentsThe table below presents the net gains / losses carried in the income statement for financial instruments in each measurement category.
The carrying amounts and fair values of the financial instruments are as follows:
Available-for-sale financial assets 47 183
Financial assets at fair value 690 246
Loans and receivables – 9,606 – 3,795
Financial liabilities measured at amortized cost – 2,933 – 2,546
Financial liabilities at fair value – 2,464 2,823
2009
/ 10
Previo
us
year
Loan
s and
rece
ivables
Finan
cial a
sset
s
at fa
ir va
lue
Availa
ble-fo
r-sale
finan
cial a
sset
s
Tota
l car
ryin
g
amoun
t
Financial instruments
06 / 30 / 2010Financial assets
Fair values Carrying amounts
Financial assets 1,435 0 0 1,435 1,435
Trade receivables 262,176 262,176 0 0 262,176
Securities 13,077 13,077 0 0 13,077
Cash and cash equivalents 100,593 100,593 0 0 100,593
Other current assets 20,654 19,288 1,366 0 20,654
Of which derivative financial instruments (1,366) (0) (1,366) (0) (1,366)
Total 397,935 395,134 1,366 1,435 397,935
Finan
cial li
abilit
ies
mea
sure
d at
amorti
zed c
ost
Finan
cial li
abilit
ies
at fa
ir va
lue
Tota
l car
ryin
g
amoun
t
Financial instruments
06 / 30 / 2010Financial liabilities Fair values Carrying amounts
Long-term borrowings 22,826 21,556 0 21,556
Long-term trade payables 2,265 2,265 0 2,265
Other noncurrent liabilities 10,209 10,209 0 10,209
Short-term borrowings 10,730 10,730 0 10,730
Short-term trade payables 57,472 57,472 0 57,472
Other current liabilities 29,769 28,581 1,188 29,769
Of which derivative financial instruments (1,188) (0) (1,188) (1,188)
Total 133,271 130,813 1,188 132,001
Annual Financial Statements I Notes I Notes to the balance sheet I 7776
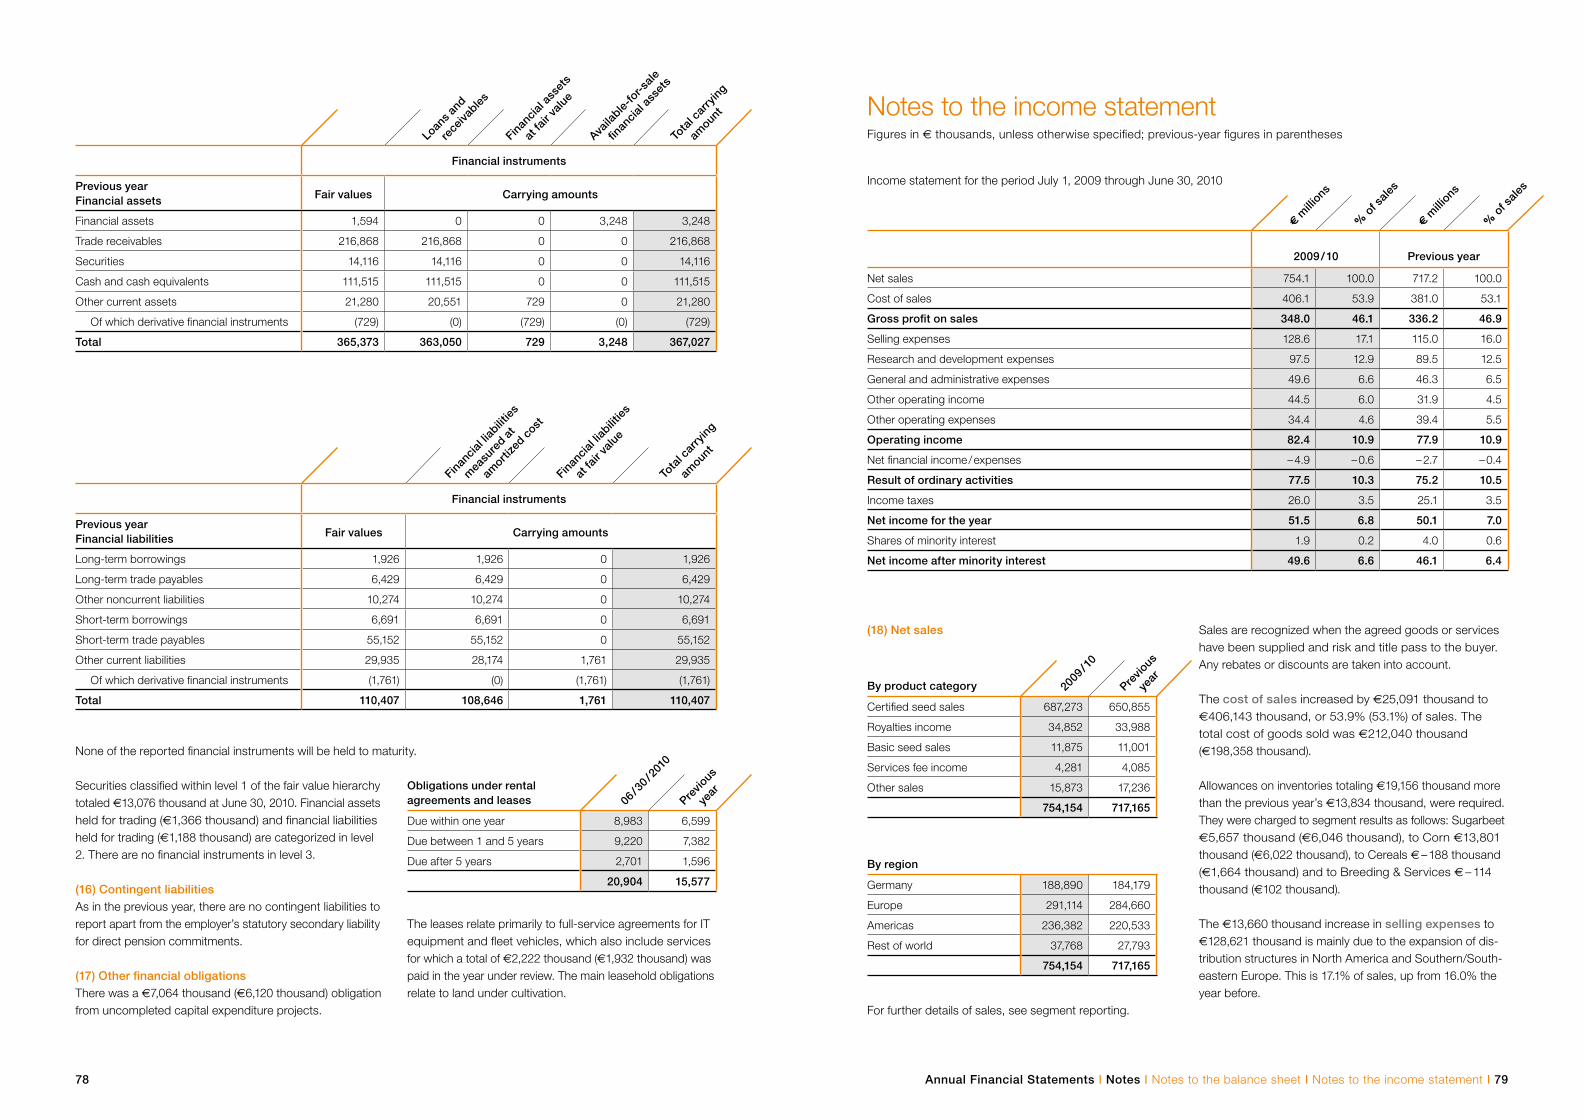
Securities classified within level 1 of the fair value hierarchy totaled €13,076 thousand at June 30, 2010. Financial assets held for trading (€1,366 thousand) and financial liabilities held for trading (€1,188 thousand) are categorized in level 2. There are no financial instruments in level 3.
(16) Contingent liabilitiesAs in the previous year, there are no contingent liabilities to report apart from the employer’s statutory secondary liability for direct pension commitments.
(17) Other financial obligationsThere was a €7,064 thousand (€6,120 thousand) obligation from uncompleted capital expenditure projects.
Notes to the income statement Figures in € thousands, unless otherwise specified; previous-year figures in parentheses
Income statement for the period July 1, 2009 through June 30, 2010
(18) Net sales
For further details of sales, see segment reporting.
Sales are recognized when the agreed goods or services have been supplied and risk and title pass to the buyer. Any rebates or discounts are taken into account.
The cost of sales increased by €25,091 thousand to €406,143 thousand, or 53.9% (53.1%) of sales. The total cost of goods sold was €212,040 thousand (€198,358 thousand).
Allowances on inventories totaling €19,156 thousand more than the previous year’s €13,834 thousand, were required. They were charged to segment results as follows: Sugarbeet €5,657 thousand (€6,046 thousand), to Corn €13,801 thousand (€6,022 thousand), to Cereals € – 188 thousand (€1,664 thousand) and to Breeding & Services € – 114 thousand (€102 thousand).
The €13,660 thousand increase in selling expenses to €128,621 thousand is mainly due to the expansion of dis-tribution structures in North America and Southern/South-eastern Europe. This is 17.1% of sales, up from 16.0% the year before.
Loan
s and
rece
ivables
Finan
cial a
sset
s
at fa
ir va
lue
Availa
ble-fo
r-sale
finan
cial a
sset
s
Tota
l car
ryin
g
amoun
t
Financial instruments
Previous yearFinancial assets Fair values Carrying amounts
Financial assets 1,594 0 0 3,248 3,248
Trade receivables 216,868 216,868 0 0 216,868
Securities 14,116 14,116 0 0 14,116
Cash and cash equivalents 111,515 111,515 0 0 111,515
Other current assets 21,280 20,551 729 0 21,280
Of which derivative financial instruments (729) (0) (729) (0) (729)
Total 365,373 363,050 729 3,248 367,027
Finan
cial li
abilit
ies
mea
sure
d at
amorti
zed c
ost
Finan
cial li
abilit
ies
at fa
ir va
lue
Tota
l car
ryin
g
amoun
t
Financial instruments
Previous yearFinancial liabilities Fair values Carrying amounts
Long-term borrowings 1,926 1,926 0 1,926
Long-term trade payables 6,429 6,429 0 6,429
Other noncurrent liabilities 10,274 10,274 0 10,274
Short-term borrowings 6,691 6,691 0 6,691
Short-term trade payables 55,152 55,152 0 55,152
Other current liabilities 29,935 28,174 1,761 29,935
Of which derivative financial instruments (1,761) (0) (1,761) (1,761)
Total 110,407 108,646 1,761 110,407
06 / 3
0 / 20
10
Previo
us
year
Obligations under rental agreements and leases
Due within one year 8,983 6,599
Due between 1 and 5 years 9,220 7,382
Due after 5 years 2,701 1,596
20,904 15,577
€ m
illions
% o
f sale
s
€ m
illions
% o
f sale
s
2009 / 10 Previous year
Net sales 754.1 100.0 717.2 100.0
Cost of sales 406.1 53.9 381.0 53.1
Gross profit on sales 348.0 46.1 336.2 46.9
Selling expenses 128.6 17.1 115.0 16.0
Research and development expenses 97.5 12.9 89.5 12.5
General and administrative expenses 49.6 6.6 46.3 6.5
Other operating income 44.5 6.0 31.9 4.5
Other operating expenses 34.4 4.6 39.4 5.5
Operating income 82.4 10.9 77.9 10.9
Net financial income / expenses – 4.9 – 0.6 – 2.7 – 0.4
Result of ordinary activities 77.5 10.3 75.2 10.5
Income taxes 26.0 3.5 25.1 3.5
Net income for the year 51.5 6.8 50.1 7.0
Shares of minority interest 1.9 0.2 4.0 0.6
Net income after minority interest 49.6 6.6 46.1 6.4
By product category 2009
/ 10
Previo
us
year
Certified seed sales 687,273 650,855
Royalties income 34,852 33,988
Basic seed sales 11,875 11,001
Services fee income 4,281 4,085
Other sales 15,873 17,236
754,154 717,165
By region
Germany 188,890 184,179
Europe 291,114 284,660
Americas 236,382 220,533
Rest of world 37,768 27,793
754,154 717,165
None of the reported financial instruments will be held to maturity.
The leases relate primarily to full-service agreements for IT equipment and fleet vehicles, which also include services for which a total of €2,222 thousand (€1,932 thousand) was paid in the year under review. The main leasehold obligations relate to land under cultivation.
Annual Financial Statements I Notes I Notes to the balance sheet I Notes to the income statement I 7978
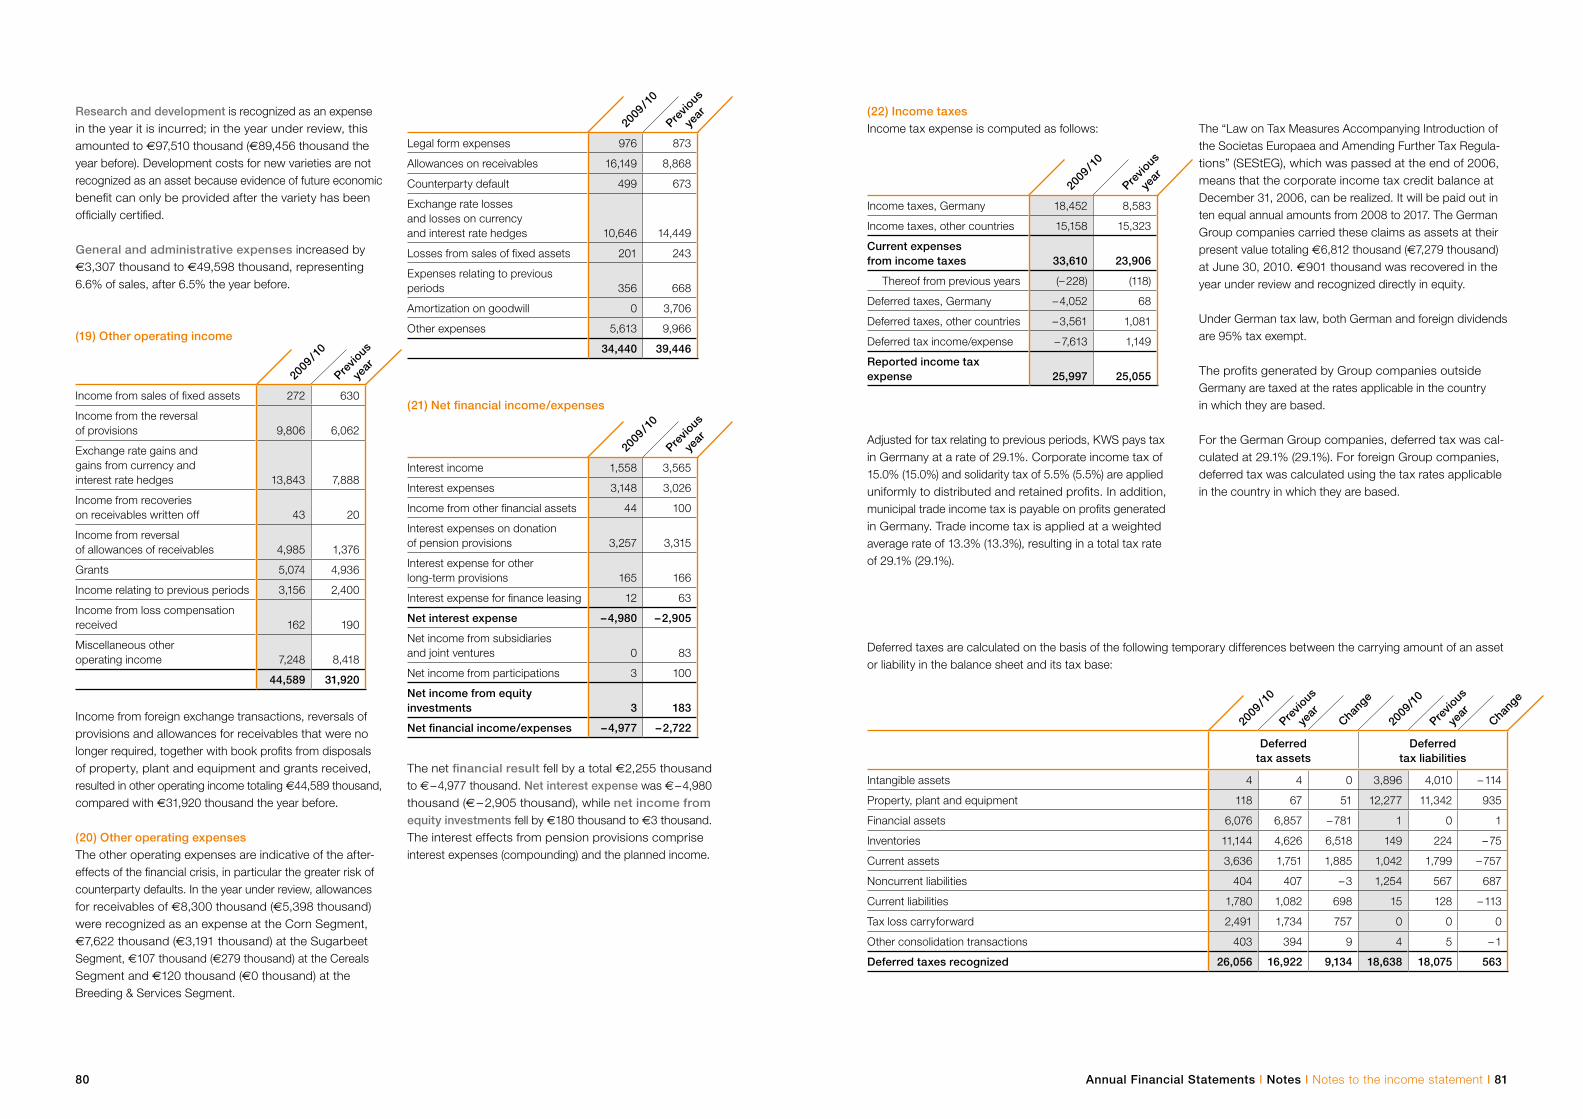
Research and development is recognized as an expensein the year it is incurred; in the year under review, this amounted to €97,510 thousand (€89,456 thousand the year before). Development costs for new varieties are not recognized as an asset because evidence of future economic benefit can only be provided after the variety has been officially certified.
General and administrative expenses increased by €3,307 thousand to €49,598 thousand, representing 6.6% of sales, after 6.5% the year before.
(19) Other operating income
Income from foreign exchange transactions, reversals of provisions and allowances for receivables that were no longer required, together with book profits from disposals of property, plant and equipment and grants received, resulted in other operating income totaling €44,589 thousand, compared with €31,920 thousand the year before.
(20) Other operating expensesThe other operating expenses are indicative of the after-effects of the financial crisis, in particular the greater risk of counterparty defaults. In the year under review, allowances for receivables of €8,300 thousand (€5,398 thousand) were recognized as an expense at the Corn Segment, €7,622 thousand (€3,191 thousand) at the Sugarbeet Segment, €107 thousand (€279 thousand) at the Cereals Segment and €120 thousand (€0 thousand) at the Breeding & Services Segment.
(21) Net financial income/expenses
The net financial result fell by a total €2,255 thousand to € – 4,977 thousand. Net interest expense was € – 4,980 thousand (€ – 2,905 thousand), while net income from equity investments fell by €180 thousand to €3 thousand. The interest effects from pension provisions comprise interest expenses (compounding) and the planned income.
Deferred taxes are calculated on the basis of the following temporary differences between the carrying amount of an asset or liability in the balance sheet and its tax base:
Adjusted for tax relating to previous periods, KWS pays tax in Germany at a rate of 29.1%. Corporate income tax of 15.0% (15.0%) and solidarity tax of 5.5% (5.5%) are applied uniformly to distributed and retained profits. In addition, municipal trade income tax is payable on profits generated in Germany. Trade income tax is applied at a weighted average rate of 13.3% (13.3%), resulting in a total tax rate of 29.1% (29.1%).
(22) Income taxesIncome tax expense is computed as follows: The “Law on Tax Measures Accompanying Introduction of
the Societas Europaea and Amending Further Tax Regula-tions” (SEStEG), which was passed at the end of 2006, means that the corporate income tax credit balance at December 31, 2006, can be realized. It will be paid out in ten equal annual amounts from 2008 to 2017. The German Group companies carried these claims as assets at their present value totaling €6,812 thousand (€7,279 thousand) at June 30, 2010. €901 thousand was recovered in the year under review and recognized directly in equity.
Under German tax law, both German and foreign dividends are 95% tax exempt.
The profits generated by Group companies outside Germany are taxed at the rates applicable in the country in which they are based.
For the German Group companies, deferred tax was cal-culated at 29.1% (29.1%). For foreign Group companies, deferred tax was calculated using the tax rates applicable in the country in which they are based.
2009
/ 10
Previo
us
year
Income from sales of fixed assets 272 630
Income from the reversal of provisions 9,806 6,062
Exchange rate gains and gains from currency and interest rate hedges 13,843 7,888
Income from recoveries on receivables written off 43 20
Income from reversal of allowances of receivables 4,985 1,376
Grants 5,074 4,936
Income relating to previous periods 3,156 2,400
Income from loss compensation received 162 190
Miscellaneous other operating income 7,248 8,418
44,589 31,920
2009
/ 10
Previo
us
year
Legal form expenses 976 873
Allowances on receivables 16,149 8,868
Counterparty default 499 673
Exchange rate losses and losses on currency and interest rate hedges 10,646 14,449
Losses from sales of fixed assets 201 243
Expenses relating to previous periods 356 668
Amortization on goodwill 0 3,706
Other expenses 5,613 9,966
34,440 39,446
2009
/ 10
Previo
us
year
Interest income 1,558 3,565
Interest expenses 3,148 3,026
Income from other financial assets 44 100
Interest expenses on donation of pension provisions 3,257 3,315
Interest expense for other long-term provisions 165 166
Interest expense for finance leasing 12 63
Net interest expense – 4,980 – 2,905
Net income from subsidiaries and joint ventures 0 83
Net income from participations 3 100
Net income from equity investments 3 183
Net financial income/expenses – 4,977 – 2,722
2009
/ 10
Previo
us
year
Income taxes, Germany 18,452 8,583
Income taxes, other countries 15,158 15,323
Current expenses from income taxes 33,610 23,906
Thereof from previous years (– 228) (118)
Deferred taxes, Germany – 4,052 68
Deferred taxes, other countries – 3,561 1,081
Deferred tax income/expense – 7,613 1,149
Reported income tax expense 25,997 25,055
2009
/ 10
Previo
us
year
Chang
e
Previo
us
year
2009
/10
Chang
e
Deferred tax assets
Deferred tax liabilities
Intangible assets 4 4 0 3,896 4,010 – 114
Property, plant and equipment 118 67 51 12,277 11,342 935
Financial assets 6,076 6,857 – 781 1 0 1
Inventories 11,144 4,626 6,518 149 224 – 75
Current assets 3,636 1,751 1,885 1,042 1,799 – 757
Noncurrent liabilities 404 407 – 3 1,254 567 687
Current liabilities 1,780 1,082 698 15 128 – 113
Tax loss carryforward 2,491 1,734 757 0 0 0
Other consolidation transactions 403 394 9 4 5 – 1
Deferred taxes recognized 26,056 16,922 9,134 18,638 18,075 563
Annual Financial Statements I Notes I Notes to the income statement I 8180
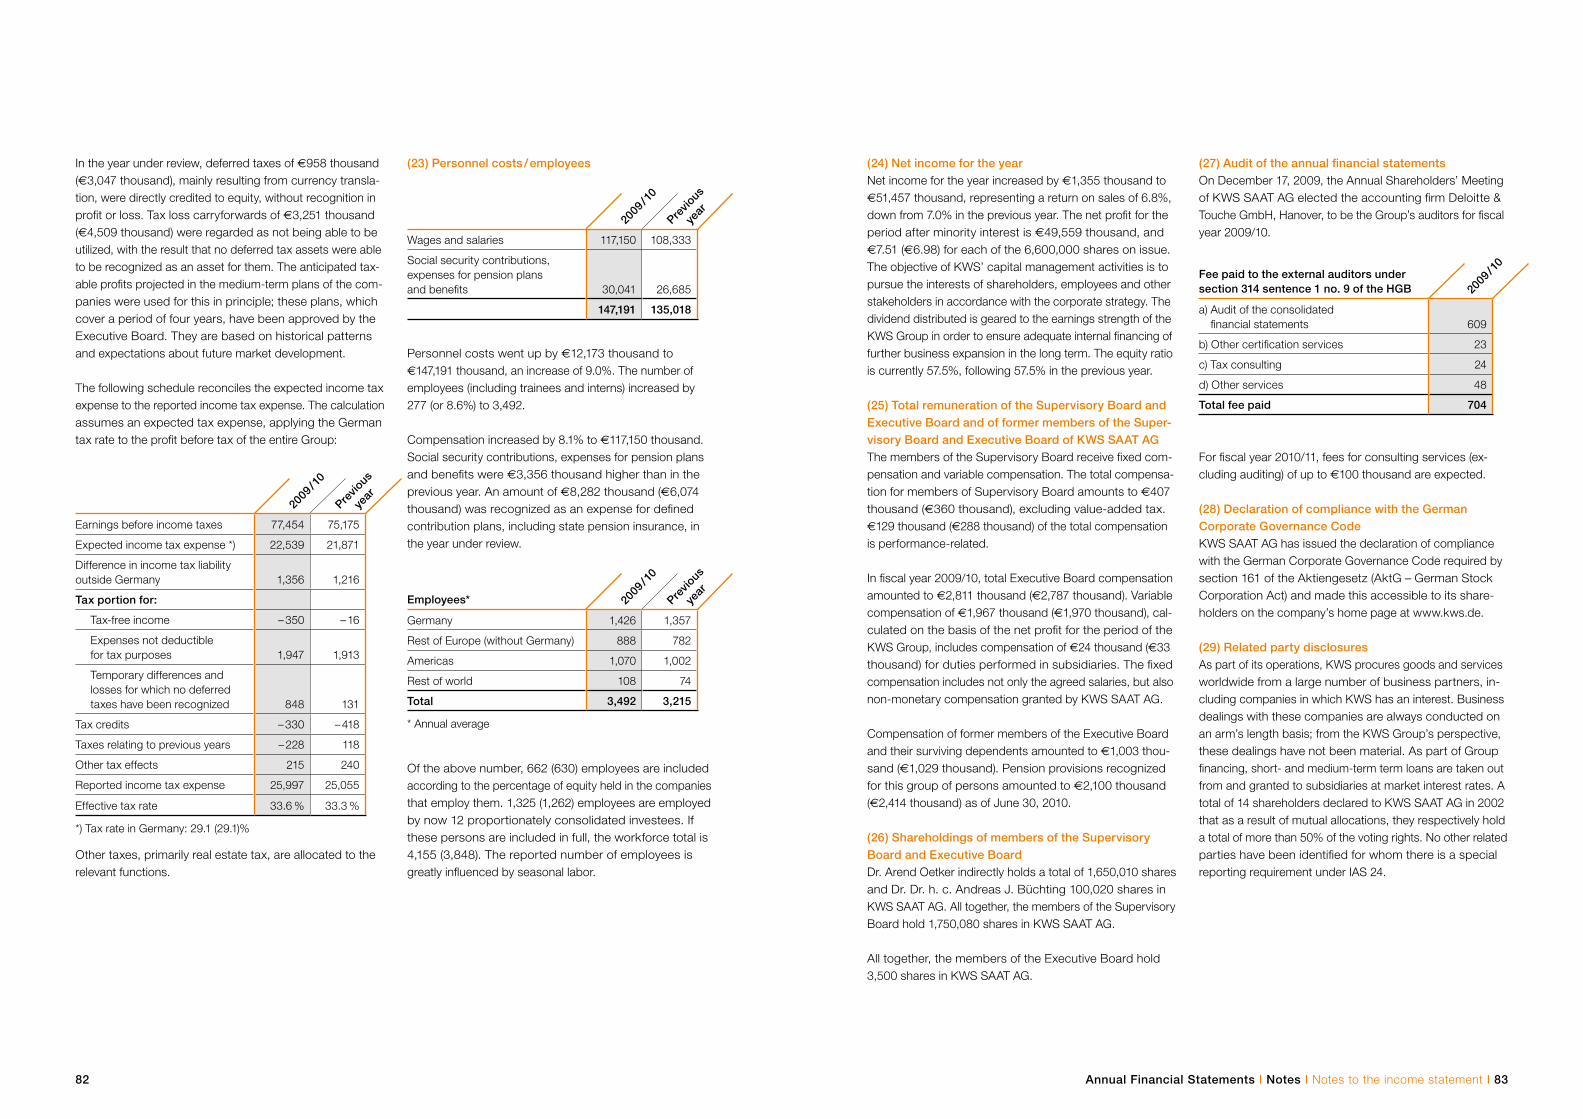
In the year under review, deferred taxes of €958 thousand (€3,047 thousand), mainly resulting from currency transla-tion, were directly credited to equity, without recognition in profit or loss. Tax loss carryforwards of €3,251 thousand (€4,509 thousand) were regarded as not being able to be utilized, with the result that no deferred tax assets were able to be recognized as an asset for them. The anticipated tax-able profits projected in the medium-term plans of the com-panies were used for this in principle; these plans, which cover a period of four years, have been approved by the Executive Board. They are based on historical patterns and expectations about future market development.
The following schedule reconciles the expected income tax expense to the reported income tax expense. The calculation assumes an expected tax expense, applying the German tax rate to the profit before tax of the entire Group:
Other taxes, primarily real estate tax, are allocated to the relevant functions.
(23) Personnel costs / employees
Personnel costs went up by €12,173 thousand to €147,191 thousand, an increase of 9.0%. The number of employees (including trainees and interns) increased by 277 (or 8.6%) to 3,492.
Compensation increased by 8.1% to €117,150 thousand. Social security contributions, expenses for pension plans and benefits were €3,356 thousand higher than in the previous year. An amount of €8,282 thousand (€6,074 thousand) was recognized as an expense for defined contribution plans, including state pension insurance, in the year under review.
Of the above number, 662 (630) employees are included according to the percentage of equity held in the companies that employ them. 1,325 (1,262) employees are employed by now 12 proportionately consolidated investees. If these persons are included in full, the workforce total is 4,155 (3,848). The reported number of employees is greatly influenced by seasonal labor.
(24) Net income for the yearNet income for the year increased by €1,355 thousand to €51,457 thousand, representing a return on sales of 6.8%, down from 7.0% in the previous year. The net profit for the period after minority interest is €49,559 thousand, and €7.51 (€6.98) for each of the 6,600,000 shares on issue. The objective of KWS’ capital management activities is to pursue the interests of shareholders, employees and other stakeholders in accordance with the corporate strategy. The dividend distributed is geared to the earnings strength of the KWS Group in order to ensure adequate internal financing of further business expansion in the long term. The equity ratio is currently 57.5%, following 57.5% in the previous year.
(25) Total remuneration of the Supervisory Board and Executive Board and of former members of the Super-visory Board and Executive Board of KWS SAAT AGThe members of the Supervisory Board receive fixed com-pensation and variable compensation. The total compensa-tion for members of Supervisory Board amounts to €407 thousand (€360 thousand), excluding value-added tax. €129 thousand (€288 thousand) of the total compensation is performance-related.
In fiscal year 2009/10, total Executive Board compensation amounted to €2,811 thousand (€2,787 thousand). Variable compensation of €1,967 thousand (€1,970 thousand), cal-culated on the basis of the net profit for the period of the KWS Group, includes compensation of €24 thousand (€33 thousand) for duties performed in subsidiaries. The fixed compensation includes not only the agreed salaries, but also non-monetary compensation granted by KWS SAAT AG.
Compensation of former members of the Executive Board and their surviving dependents amounted to €1,003 thou-sand (€1,029 thousand). Pension provisions recognized for this group of persons amounted to €2,100 thousand (€2,414 thousand) as of June 30, 2010.
(26) Shareholdings of members of the Supervisory Board and Executive BoardDr. Arend Oetker indirectly holds a total of 1,650,010 shares and Dr. Dr. h. c. Andreas J. Büchting 100,020 shares in KWS SAAT AG. All together, the members of the Supervisory Board hold 1,750,080 shares in KWS SAAT AG.
All together, the members of the Executive Board hold 3,500 shares in KWS SAAT AG.
(27) Audit of the annual financial statementsOn December 17, 2009, the Annual Shareholders’ Meeting of KWS SAAT AG elected the accounting firm Deloitte & Touche GmbH, Hanover, to be the Group’s auditors for fiscal year 2009/10.
For fiscal year 2010/11, fees for consulting services (ex-cluding auditing) of up to €100 thousand are expected.
(28) Declaration of compliance with the German Corporate Governance CodeKWS SAAT AG has issued the declaration of compliance with the German Corporate Governance Code required by section 161 of the Aktiengesetz (AktG – German Stock Corporation Act) and made this accessible to its share-holders on the company’s home page at www.kws.de.
(29) Related party disclosuresAs part of its operations, KWS procures goods and services worldwide from a large number of business partners, in-cluding companies in which KWS has an interest. Business dealings with these companies are always conducted on an arm’s length basis; from the KWS Group’s perspective, these dealings have not been material. As part of Group financing, short- and medium-term term loans are taken out from and granted to subsidiaries at market interest rates. A total of 14 shareholders declared to KWS SAAT AG in 2002 that as a result of mutual allocations, they respectively hold a total of more than 50% of the voting rights. No other related parties have been identified for whom there is a special reporting requirement under IAS 24.
2009
/ 10
Previo
us
year
Earnings before income taxes 77,454 75,175
Expected income tax expense *) 22,539 21,871
Difference in income tax liability outside Germany 1,356 1,216
Tax portion for:
Tax-free income – 350 – 16
Expenses not deductible for tax purposes 1,947 1,913
Temporary differences and losses for which no deferred taxes have been recognized 848 131
Tax credits – 330 – 418
Taxes relating to previous years – 228 118
Other tax effects 215 240
Reported income tax expense 25,997 25,055
Effective tax rate 33.6 % 33.3 %
*) Tax rate in Germany: 29.1 (29.1)%
2009
/ 10
Previo
us
year
Wages and salaries 117,150 108,333
Social security contributions, expenses for pension plans and benefits 30,041 26,685
147,191 135,018
Employees* 2009
/ 10
Previo
us
year
Germany 1,426 1,357
Rest of Europe (without Germany) 888 782
Americas 1,070 1,002
Rest of world 108 74
Total 3,492 3,215
* Annual average
2009
/ 10
Fee paid to the external auditors under section 314 sentence 1 no. 9 of the HGB
a) Audit of the consolidated financial statements 609
b) Other certification services 23
c) Tax consulting 24
d) Other services 48
Total fee paid 704
Annual Financial Statements I Notes I Notes to the income statement I 8382
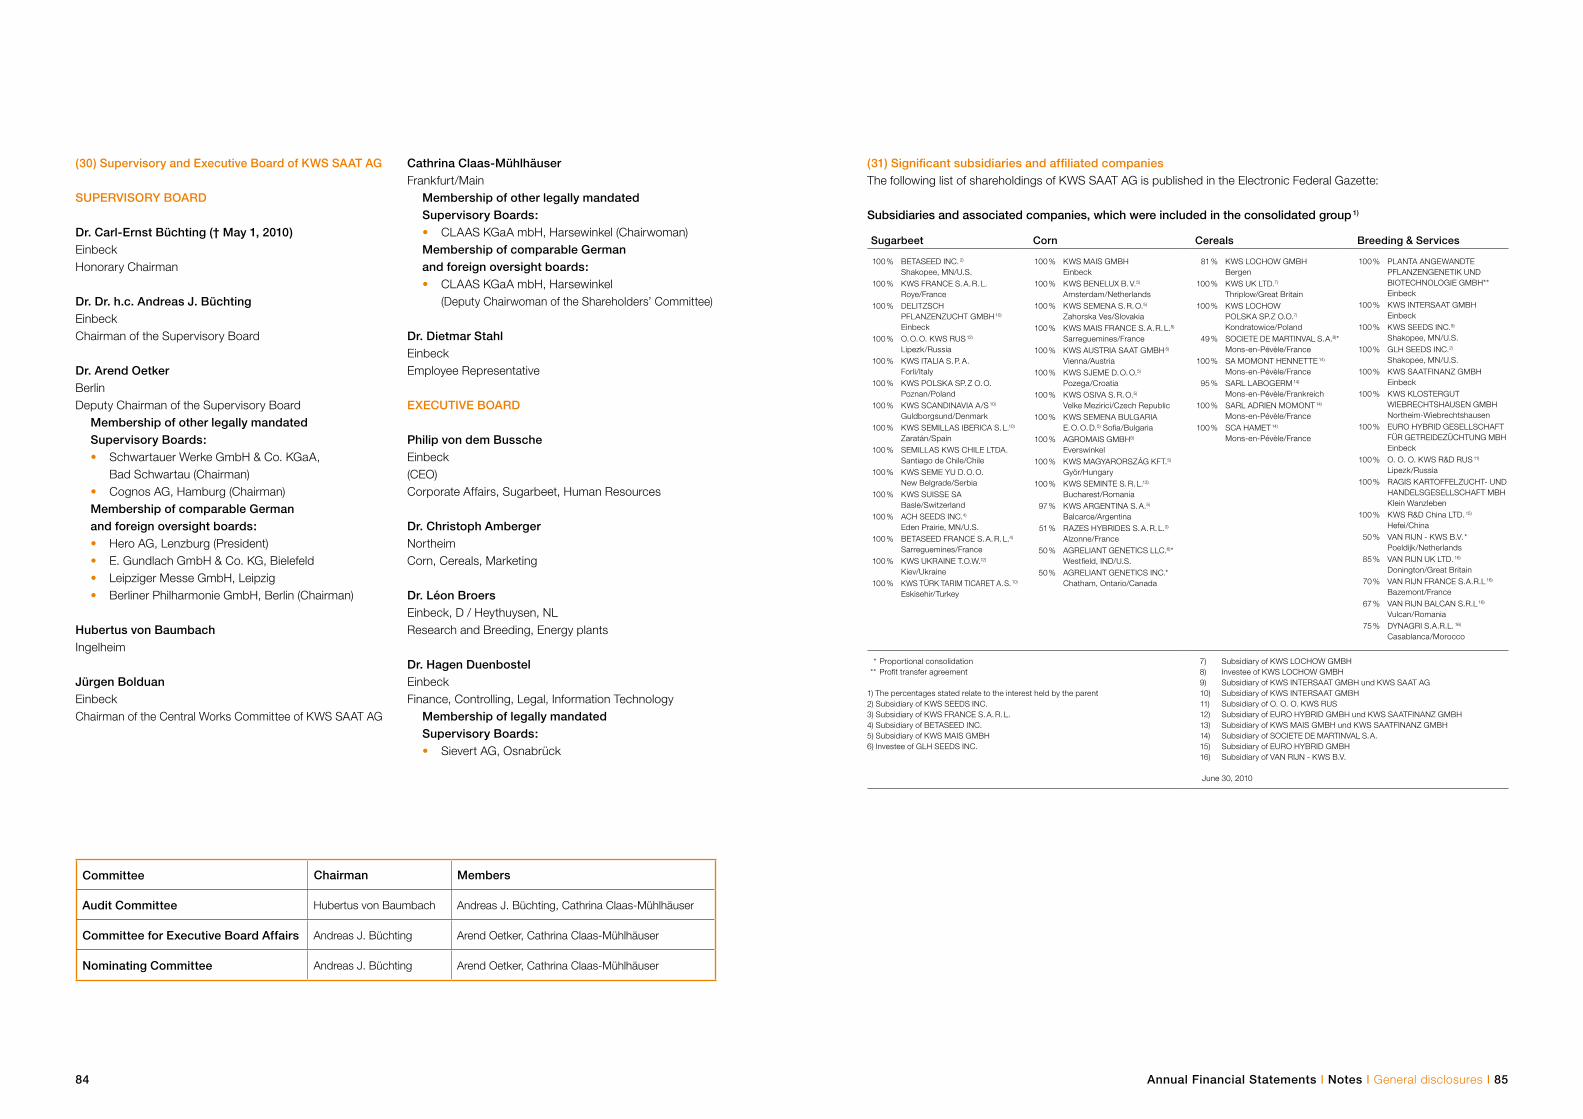
(30) Supervisory and Executive Board of KWS SAAT AG
SUPERVISORY BOARD
Dr. Carl-Ernst Büchting († May 1, 2010)Einbeck Honorary Chairman
Dr. Dr. h.c. Andreas J. Büchting Einbeck Chairman of the Supervisory Board
Dr. Arend Oetker BerlinDeputy Chairman of the Supervisory Board Membership of other legally mandated
Supervisory Boards: • Schwartauer Werke GmbH & Co. KGaA, Bad Schwartau (Chairman) • Cognos AG, Hamburg (Chairman) Membership of comparable German
and foreign oversight boards: • Hero AG, Lenzburg (President) • E. Gundlach GmbH & Co. KG, Bielefeld • Leipziger Messe GmbH, Leipzig • Berliner Philharmonie GmbH, Berlin (Chairman)
Hubertus von BaumbachIngelheim
Jürgen Bolduan Einbeck Chairman of the Central Works Committee of KWS SAAT AG
Cathrina Claas-MühlhäuserFrankfurt/Main Membership of other legally mandated Supervisory Boards: • CLAAS KGaA mbH, Harsewinkel (Chairwoman) Membership of comparable German
and foreign oversight boards: • CLAAS KGaA mbH, Harsewinkel
(Deputy Chairwoman of the Shareholders’ Committee)
Dr. Dietmar StahlEinbeck Employee Representative
EXECUTIVE BOARD
Philip von dem BusscheEinbeck(CEO)Corporate Affairs, Sugarbeet, Human Resources
Dr. Christoph Amberger NortheimCorn, Cereals, Marketing
Dr. Léon Broers Einbeck, D / Heythuysen, NLResearch and Breeding, Energy plants
Dr. Hagen Duenbostel EinbeckFinance, Controlling, Legal, Information Technology Membership of legally mandated
Supervisory Boards: • Sievert AG, Osnabrück
* Proportional consolidation ** Profit transfer agreement
1) The percentages stated relate to the interest held by the parent 2) Subsidiary of KWS SEEDS INC. 3) Subsidiary of KWS FRANCE S. A. R. L. 4) Subsidiary of BETASEED INC. 5) Subsidiary of KWS MAIS GMBH 6) Investee of GLH SEEDS INC.
7) Subsidiary of KWS LOCHOW GMBH 8) Investee of KWS LOCHOW GMBH 9) Subsidiary of KWS INTERSAAT GMBH und KWS SAAT AG 10) Subsidiary of KWS INTERSAAT GMBH 11) Subsidiary of O. O. O. KWS RUS 12) Subsidiary of EURO HYBRID GMBH und KWS SAATFINANZ GMBH 13) Subsidiary of KWS MAIS GMBH und KWS SAATFINANZ GMBH 14) Subsidiary of SOCIETE DE MARTINVAL S. A. 15) Subsidiary of EURO HYBRID GMBH 16) Subsidiary of VAN RIJN - KWS B.V.
June 30, 2010
Subsidiaries and associated companies, which were included in the consolidated group 1)
(31) Significant subsidiaries and affiliated companiesThe following list of shareholdings of KWS SAAT AG is published in the Electronic Federal Gazette:
Sugarbeet Corn Cereals Breeding & Services
Committee Chairman Members
Audit Committee Hubertus von Baumbach Andreas J. Büchting, Cathrina Claas-Mühlhäuser
Committee for Executive Board Affairs Andreas J. Büchting Arend Oetker, Cathrina Claas-Mühlhäuser
Nominating Committee Andreas J. Büchting Arend Oetker, Cathrina Claas-Mühlhäuser
100 % BETASEED INC. 2) Shakopee, MN/U.S.
100 % KWS FRANCE S. A. R. L. Roye/France
100 % DELITZSCH PFLANZENZUCHT GMBH 10)
Einbeck100 % O. O. O. KWS RUS 12)
Lipezk/Russia100 % KWS ITALIA S. P. A.
Forli/Italy 100 % KWS POLSKA SP. Z O. O.
Poznan/Poland 100 % KWS SCANDINAVIA A/S 10)
Guldborgsund/Denmark 100 % KWS SEMILLAS IBERICA S. L.10)
Zaratán/Spain100 % SEMILLAS KWS CHILE LTDA.
Santiago de Chile/Chile 100 % KWS SEME YU D. O. O.
New Belgrade/Serbia 100 % KWS SUISSE SA
Basle/Switzerland 100 % ACH SEEDS INC.4)
Eden Prairie, MN/U.S. 100 % BETASEED FRANCE S. A. R. L.4)
Sarreguemines/France 100 % KWS UKRAINE T.O.W.12)
Kiev/Ukraine 100 % KWS TÜRK TARIM TICARET A. S. 10)
Eskisehir/Turkey
100 % KWS MAIS GMBH Einbeck
100 % KWS BENELUX B. V.5) Amsterdam/Netherlands
100 % KWS SEMENA S. R. O.5) Zahorska Ves/Slovakia
100 % KWS MAIS FRANCE S. A. R. L.5) Sarreguemines/France
100 % KWS AUSTRIA SAAT GMBH 5) Vienna/Austria
100 % KWS SJEME D. O. O.5) Pozega/Croatia
100 % KWS OSIVA S. R. O.5) Velke Mezirici/Czech Republic
100 % KWS SEMENA BULGARIA E. O. O. D.5) Sofia/Bulgaria
100 % AGROMAIS GMBH5) Everswinkel
100 % KWS MAGYARORSZÁG KFT.5) Györ/Hungary
100 % KWS SEMINTE S. R. L.13) Bucharest/Romania
97 % KWS ARGENTINA S. A.5) Balcarce/Argentina
51 % RAZES HYBRIDES S. A. R. L.3) Alzonne/France
50 % AGRELIANT GENETICS LLC.6) * Westfield, IND/U.S.
50 % AGRELIANT GENETICS INC.* Chatham, Ontario/Canada
100 % PLANTA ANGEWANDTE PFLANZENGENETIK UND BIOTECHNOLOGIE GMBH** Einbeck
100 % KWS INTERSAAT GMBH Einbeck
100 % KWS SEEDS INC.9)
Shakopee, MN/U.S. 100 % GLH SEEDS INC.2)
Shakopee, MN/U.S. 100 % KWS SAATFINANZ GMBH
Einbeck 100 % KWS KLOSTERGUT
WIEBRECHTS HAUSEN GMBH Northeim-Wiebrechtshausen
100 % EURO HYBRID GESELLSCHAFT FÜR GETREIDEZÜCHTUNG MBH Einbeck
100 % O. O. O. KWS R&D RUS 11)
Lipezk/Russia100 % RAGIS KARTOFFELZUCHT- UND
HANDELSGESELLSCHAFT MBH Klein Wanzleben
100 % KWS R&D China LTD. 15)
Hefei/China50 % VAN RIJN - KWS B.V. *
Poeldijk/Netherlands 85 % VAN RIJN UK LTD. 16)
Donington/Great Britain 70 % VAN RIJN FRANCE S.A.R.L 16)
Bazemont/France67 % VAN RIJN BALCAN S.R.L 16)
Vulcan/Romania75 % DYNAGRI S.A.R.L. 16)
Casablanca/Morocco
81 % KWS LOCHOW GMBH Bergen
100 % KWS UK LTD.7) Thriplow/Great Britain
100 % KWS LOCHOW POLSKA SP.Z O.O.7) Kondratowice/Poland
49 % SOCIETE DE MARTINVAL S. A.8) * Mons-en-Pévèle/France
100 % SA MOMONT HENNETTE 14)
Mons-en-Pévèle/France95 % SARL LABOGERM 14)
Mons-en-Pévèle/Frankreich100 % SARL ADRIEN MOMONT 14)
Mons-en-Pévèle/France100 % SCA HAMET 14)
Mons-en-Pévèle/France
Annual Financial Statements I Notes I General disclosures I 8584
Einbeck, October 8, 2010 KWS SAAT AG
THE EXECUTIVE BOARD
P. von dem Bussche Ch. Amberger L. Broers H. Duenbostel
We have audited the annual financial statements of the KWS Group – consisting of the Balance Sheet, the State-ment of Comprehensive Income, the Notes, the Cash Flow Statement, Segment reporting and the Statement of Changes in Equity – and the Group Management Report for the fiscal year from July 1, 2009, to June 30, 2010, all of which were prepared by KWS SAAT AG, Einbeck. The preparation of the consoli-dated financial statements and Group Management Report according to the International Financial Reporting Standards (IFRS) as applicable in the EU, and in addition according to the commercial law regu-lations to be applied pursuant to Section 315a (1) of the HGB (German Commercial Code), is the responsibility of the Executive Board of the company. Our task is to give, on the basis of the audit we have conducted, an opinion on the consolidated financial statements and the Group Management Report.
We conducted our audit of the annual financial statements in accordance with Section 317 HGB and the generally ac-cepted standards for the audit of financial statements prom-ulgated by the Institut der Wirtschaftsprüfer (German Institute of Certified Public Accountants). According to these stan-dards, the audit must be planned and executed in such a way that misstatements and violations materially affecting the presentation of the view of the assets, financial position and earnings conveyed by the consolidated financial state-ments, taking into account the applicable regulations on orderly accounting, and by the Group Management Report are detected with reasonable certainty. Knowledge of the business activities and the economic and legal operating environment of the Group and evaluations of possible errors are taken into account. The effectiveness of the internal accounting control system and the evidence supporting the disclosures in the consolidated financial statements and the Group Management Report are evaluated mainly on the basis of test samples within the framework of the audit. The audit includes the assessment of the annual
financial statements of the companies included in the consol- idated financial statements, the definition of the companies consolidated, the accounting and consolidation principles used and any significant estimates made by the Executive Board, as well as the evaluation of the overall presentation of the consolidated financial statements and the Group Management Report. We believe that our audit provides a reasonable basis for our opinion.
On the basis of our audit, we have no reservations to note.
In our opinion pursuant to the findings gained during the audit, the consolidated financial statements of KWS SAAT AG, Einbeck, comply with the IFRS as applicable in the EU, and in addition with the commercial law regulations to be applied pursuant to Section 315a (1) of the HGB (German Commercial Code), and give a true and fair view of the as-sets, financial position and earnings of the Group, taking into account these regulations. The Group Management Report accords with the consolidated financial statements, conveys overall an accurate view of the Group’s position and accurately presents the opportunities and risks of future development.
Hanover, October 8, 2010
Deloitte & Touche GmbH Wirtschaftsprüfungsgesellschaft
(Kompenhans) (Bukowski) Auditor Auditor
(32) Proposal for the appropriation of net retained profitsKWS SAAT AG posted operating income of €12,671 thousand compared with €11,268 thousand for the previous year. Allowing for net financial income/expenses of €5,194 thousand and income taxes totaling €5,715 thousand, net income in accordance with the German commercial law regulations was €12,150 thousand (€11,450 thousand). Adding the net profit of €430 thousand brought forward from the previous year, a net retained profit of €12,580 thousand is available for distribution.
A proposal will be made to the Annual Shareholders’ Mee-ting that an amount of €12,540,000.00 of KWS SAAT AG’s net retained profit should be distributed as a dividend of €1.90 (1.80) for each of the 6,600,000 shares.
The balance of €40,000.00 is to be carried forward to the new account.
Declaration by legal representativesWe declare to the best of our knowledge that the consoli-dated financial statements give a true and fair view of the assets, financial position and earnings of the Group in compliance with the generally accepted standards of consolidated accounting, and that an accurate picture of the course of business, including business results, and the Group’s situation is conveyed by the Group Management Report, and that it describes the main opportunities and risks of the Group’s anticipated development.
Annual Financial Statements I Notes I General disclosures I Auditors’ Report I 8786
Auditors’ Report
KWS Saat aG
Grimsehlstrasse 31 • 37555 Einbeck • P.O. Box 1463 Phone + 49 (0) 5561/311-0 • Fax + 49 (0) 5561/311-322 www.kws.com • e-mail: [email protected]
This translation of the original German version of the Annual Report has been prepared for the convenience of our English-speaking shareholders. The German version is legally binding.
Photos / Illustrations: Eberhard Franke • KWS Group archive • Dominik Obertreis Dieter Sieg • Corinna Lerch
![BMW S 1000 RR (2010) - JAMparts1].pdf185,53 / 13120 189.4 / 13300 9.1 / 8200 noise measurements (dB / rpm) stock AKRAPOVIC 102 / 6000 102 / 6000 legal for street use YES ADDITIONAL](https://img.pdfslide.net/doc/110x75/610f4001a2697a22137f937e/bmw-s-1000-rr-2010-jamparts-1pdf-18553-13120-1894-13300-91-8200-noise.jpg)

![STAPSGEWIJS EEN AANGIFTE INDIENEN (RPB, …...[1] INGAVE VAN DE AANGIFTE - BNI/VEN •Tabblad 275.2.A.1 of 275.2.A.2 •Enkel bij “Belastingen Niet Inwoners” Het tabblad 275.2.A.1](https://img.pdfslide.net/doc/110x75/5f303a80eccb1c383835ca19/stapsgewijs-een-aangifte-indienen-rpb-1-ingave-van-de-aangifte-bniven.jpg)


![Déposer une déclaration étape par étape (IPM, ISoc et INR ...€¦ · [1] Introduction de la déclaration -INR/soc • Onglet 275.2.A.1 ou 275.2.A.2 • Uniquement pour “Impôt](https://img.pdfslide.net/doc/110x75/5f944cf75732435900550570/dposer-une-dclaration-tape-par-tape-ipm-isoc-et-inr-1-introduction.jpg)


