Embed Size (px)
Citation preview
Stichting Access to Medicine Foundation, Haarlem
Annual Report 2014
Access to Medicine FoundationScheepmakersdijk 5aNL-2011 AS HaarlemThe Netherlands
On behalf of the Access to Medicine Foundation,please contact Suzanne WolfE [email protected] + 31 (0)23 53 39 187W www.accesstomedicineindex.org

3Stichting Access to Medicine Foundation, HaarlemAnnual Report 2014
Table of contents
Executive Board Report Executive Board Report
Financial Statements Balance sheet as at 31 December 2014
Statement of income and expenses for the year ended 31 December 2014
Notes to the financial statements Appropriation of result
Independent auditor's report
Organisation
56
1112
13
14
24
25
26


5Stichting Access to Medicine Foundation, HaarlemAnnual Report 2014
Executive Board Report
6 Stichting Access to Medicine Foundation, HaarlemAnnual Report 2014
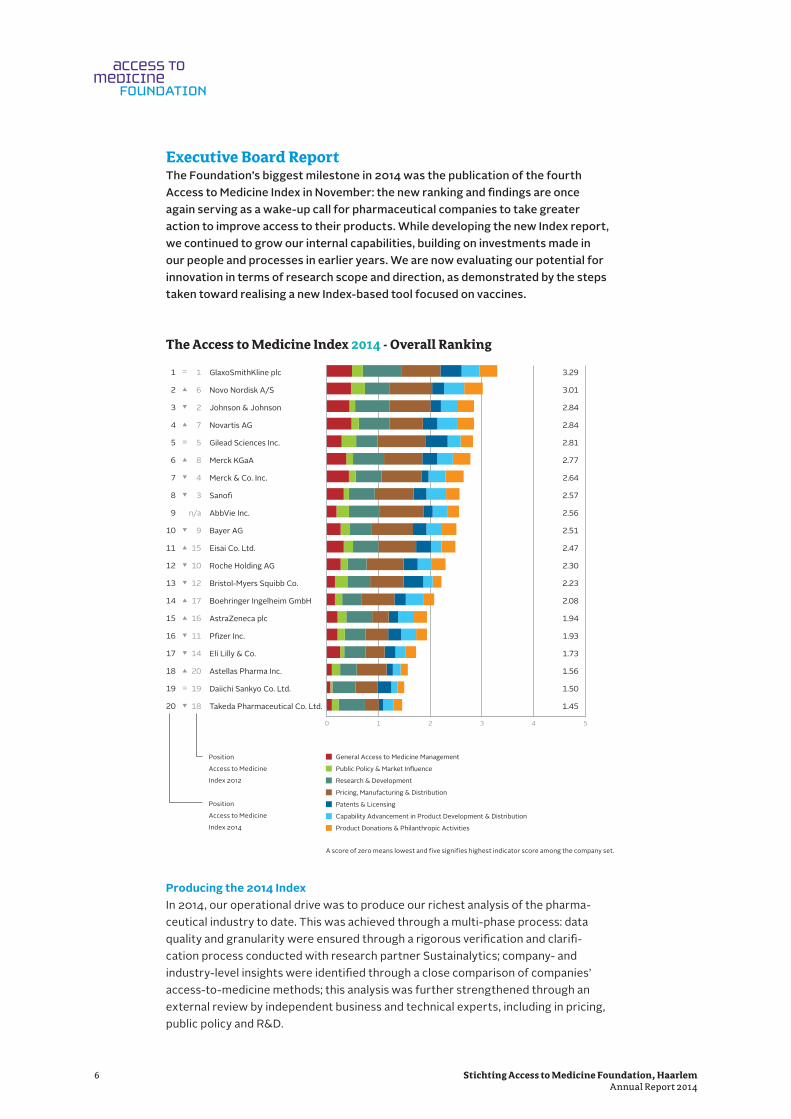
Executive Board ReportThe Foundation’s biggest milestone in 2014 was the publication of the fourth Access to Medicine Index in November: the new ranking and findings are once again serving as a wake-up call for pharmaceutical companies to take greater action to improve access to their products. While developing the new Index report, we continued to grow our internal capabilities, building on investments made in our people and processes in earlier years. We are now evaluating our potential for innovation in terms of research scope and direction, as demonstrated by the steps taken toward realising a new Index-based tool focused on vaccines.
The Access to Medicine Index 2014 - Overall Ranking
Producing the 2014 Index In 2014, our operational drive was to produce our richest analysis of the pharma-ceutical industry to date. This was achieved through a multi-phase process: data quality and granularity were ensured through a rigorous verification and clarifi-cation process conducted with research partner Sustainalytics; company- and industry-level insights were identified through a close comparison of companies’ access-to-medicine methods; this analysis was further strengthened through an external review by independent business and technical experts, including in pricing, public policy and R&D.
Access to Medicine Index 2014
26
0 1 2 3 4 5
1
2
3
4
5
6
7
8
9
10
11
12
13
14
15
16
17
18
19
20
1
6
2
7
5
8
4
3
n/a
9
15
10
12
17
16
11
14
20
19
18
3.29
3.01
2.84
2.84
2.81
2.77
2.64
2.57
2.56
2.51
2.47
2.30
2.23
2.08
1.94
1.93
1.73
1.56
1.50
1.45
GlaxoSmithKline plc
Novo Nordisk A/S
Johnson & Johnson
Novartis AG
Gilead Sciences Inc.
Merck KGaA
Merck & Co. Inc.
Sano�
AbbVie Inc.
Bayer AG
Eisai Co. Ltd.
Roche Holding AG
Bristol-Myers Squibb Co.
Boehringer Ingelheim GmbH
AstraZeneca plc
P�zer Inc.
Eli Lilly & Co.
Astellas Pharma Inc.
Daiichi Sankyo Co. Ltd.
Takeda Pharmaceutical Co. Ltd.
Overall Company Ranking
General Access to Medicine Management
Public Policy & Market In�uence
Research & Development
Pricing, Manufacturing & Distribution
Patents & Licensing
Capability Advancement in Product Development & Distribution
Product Donations & Philanthropic Activities
The Access to Medicine Index 2014 – Overall Ranking
Position
Access to Medicine
Index 2012
Position
Access to Medicine
Index 2014
Figure 10
A score of zero means lowest and five signifies highest indicator score among the company set.
141126ATMindex2014_binnenwerk_deel1_DEF.indd 26 26/11/14 14:00

7Stichting Access to Medicine Foundation, HaarlemAnnual Report 2014
As a result, in 2014, our reporting is considerably more comprehensive and in-depth than in previous years. Our overall industry analysis concluded that pharmaceutical companies are making progress on several fronts regarding access to medicine, with a raft of new initiatives, scale-ups and innovations over the last two years. Yet in two important areas – public policy and IP management – progress remains static. The R&D pipeline for developing countries in 2014 is remarkably concen-trated, with only five companies developing 54% of all relevant products. Half of the companies in the Index are developing products for children. Notably, compa-nies are increasingly tailoring their pricing practices to the needs of the poorest segments of national populations.
For the first time, the 2014 Access to Medicine Index includes a detailed analysis of the industry’s R&D pipeline and on-market product portfolio for people living in developing countries, including breakdowns by disease and by company. Also for the first time, the report includes topic-specific deep-dive analyses of companies’ ethical behaviour and licensing practices, and an overview of new access-oriented business models. The 2014 Index identifies 43 best and innovative practices, up from 10 in 2012. The expanded Company Report Cards newly include analyses of each company’s R&D pipeline and on-market portfolio, as well as company-specific opportunities for improving access to medicine.
Index findings on the agendaThe 2014 Index has succeeded in bringing new clarity to the role pharmaceu-tical companies are playing regarding access to medicine for the world’s poorest patients, and to shine a light on the path ahead. At publication, the ranking and find-ings were covered widely in global media outlets, including in the Financial Times, British Medical Journal, Wall Street Journal, Die Welt, Reuters and The Guardian, as well as in titles with industry-focused readerships, such as PharmaTimes, Scrip and the Pharmaceutical Journal. The Index was consistently quoted as a primary source of independent information on the pharmaceutical industry and access to medicine. Compared with 2012, visitors to the Foundation website grew by 21% at publication and downloads of the new report increased by 58%.
The report has been generally well received by the diverse groups active in the access-to-medicine landscape, helping to lay the foundations for broad-based stakeholder engagement in 2015. Following a targeted reach-out, the Index team has discussed the Index with key members of the global health community. Plus, just prior to the launch, the Foundation held one-on-one calls with each of the companies measured, briefing them on their individual opportunities for improving access to medicine.

8 Stichting Access to Medicine Foundation, HaarlemAnnual Report 2014
Events and publicationsDuring 2014, the Foundation deepened its contribution to the access-to-medicine debate, with team members speaking at a variety of events, including the Trilateral Symposium of the WHO, WTO & WIPO, the United Nations 3rd Annual Business & Human Rights Forum, the Annual Meeting of the American Society of Tropical Medicine and Hygiene, and the Annual FT Pharmaceutical and Biotechnology Conference. Pharmaceutical companies, including ones not included in the Index, approached the Foundation for guidance on improving access to medicine. Since publication, the 2014 Index has been on the agenda at meetings at the European Parliament in Brussels and World Economic Forum in Davos, among others, and has formed the basis of one-on-one discussions with the WHO, investors, governments, with Index companies themselves and with global health experts.
In 2014, the Foundation began exploring the potential for authoring topic-specific insights into specific areas of pharmaceutical company policy or practice, publishing insights on licensing practices for HIV/AIDS products and the application of equi-table pricing practices. The Lancet Global Health published an article by Professor Hans Hogerzeil and members of the Foundation's research team, which set out the method and findings of the first longitudinal analysis based on the Access to Medi-cine Index. We are currently evaluating these activities, with a view to deepening them in 2015.
At the end of 2014, the Foundation was invited to present the new 2014 Index at four global investor briefings, which drew together more than 100 attendees, including sell-side analysts, bankers, brokers and ESG analysts, as well as pharma-ceutical company representatives and other stakeholders. The Index ranking and findings formed a catalyst for discussions between people with diverse view-points, including on industry ethical behaviour and innovation. The briefings took place in London, Paris, Basel and New York City, and were hosted by signatories to the Access to Medicine Index investor statement Aviva Investors, Amundi Asset Management, Bank J. Safra Sarasin and Boston Common Asset Management, as well as Alliance Bernstein. Following the briefings, the Foundation has been consulted by various investors on specific companies and access topics, and invited to speak at events.

9Stichting Access to Medicine Foundation, HaarlemAnnual Report 2014
Investors viewThe value of the Index for pharma-focused investors has proven itself further in 2014. Mainstream investors and sell-side analysts report that they increasingly use the Index in their analyses of company performances in emerging markets, viewing it as the only source of such detailed information regarding the access-to-medicine policies and practices of the companies ranked. This is demonstrated by the publi-cation in 2014 of a Market Analysis Report by Deutsche Bank based on findings from the Access to Medicine Index. In 2014, the number of signatories to the Access to Medicine Foundation investor statement increased from 34 to 47. We also agreed terms for companies’ Index performances to be integrated into the Bloomberg Terminal for investors.
Strategic projects – draft methodologies readyIn 2014, the Foundation progressed with plans to extend its research scope into other sections of the pharmaceutical industry, namely the vaccine and generic medicine sectors. Following discussions with the Supervisory Board, preliminary investigations have been developed into draft methodologies for two new Indices. Proposals for rolling out these projects have been prepared and reviewed. A first funder for a new vaccines project has already been secured. During 2014, the Foun-dation also commissioned proposals for evaluating the impact of the Index on the companies we measure, with support from an independent reference group. The Foundation is currently seeking a suitable proposal, and is reviewing the project’s terms of reference.
Organisational developmentIn 2014, the Foundation continued to strengthen its in-house capabilities, bringing on-board specific additional expertise, including in the areas of strategy, research communication, global health and policy. With regard to oversight, the Founda-tion's Supervisory Board was strengthened with the addition of one member, John Schaetzl. During the production of the 2014 Index, the team adopted an increasingly agile approach to project management, which uncovered a natural proficiency for cross-functional teamwork.
Financials The Foundation ended 2014 with a net surplus of €24,964, slightly below the budgeted surplus of €30,000 and close to the 2013 surplus of €26,700. The Foundation's income in 2014 was €1.81 million, approximately €100,000 less than the budgeted income, while total expenses were €95,000 lower than expected.
10 Stichting Access to Medicine Foundation, HaarlemAnnual Report 2014
ContinuityIn 2014, the Foundation received funds from the Bill & Melinda Gates Foundation, the UK Department for International Development (DFID), the Dutch Ministry of Foreign Affairs and the Dutch Interchurch Organisation for Development Coopera-tion (ICCO). With the exception of ICCO, the Foundation will continue to receive funds from these organisations in 2015, including the final instalment of the current DFID grant. The Foundation will apply for renewal of this grant when the applica-tion process re-opens toward the end of 2015. A new funder, the Dutch National Postcode Lottery, was announced early in 2015, in connection with existing plans for a new Index-based tool focused on vaccines. Securing our long-term financial continuity will remain a priority in 2015. Opportunities are currently being devel-oped with inter-governmental bodies, private trusts and national governments.
Outlook2015 will be a year of interlinking engagement and research streams: we will be reviewing our methodology for the next Access to Medicine Index; seeking to grow the impact of our 2014 Index findings; and mining our 2014 data for new insights that advance the access-to-medicine discussion. This is planned to include a series of thematic studies focused on specific access topics, as well as an Index-based tool for stimulating change in the vaccine market. We see that pharmaceutical companies are willing to learn from each other and to share their experiences. We are now evaluating how the Index can increase its impact as a catalyst for change in the long-term and turn this willingness into significant improvements in access to medicine.
Haarlem, 19 March 2015Stichting Access to Medicine Foundation
The Executive Board
Wim Leereveld Chief Executive Officer
Former member of the Executive Board active during this financial reporting period:
Ed MonchenChief Operational Officer until 1 January 2015
11Stichting Access to Medicine Foundation, HaarlemAnnual Report 2014
Financial Statements
12 Stichting Access to Medicine Foundation, HaarlemAnnual Report 2014
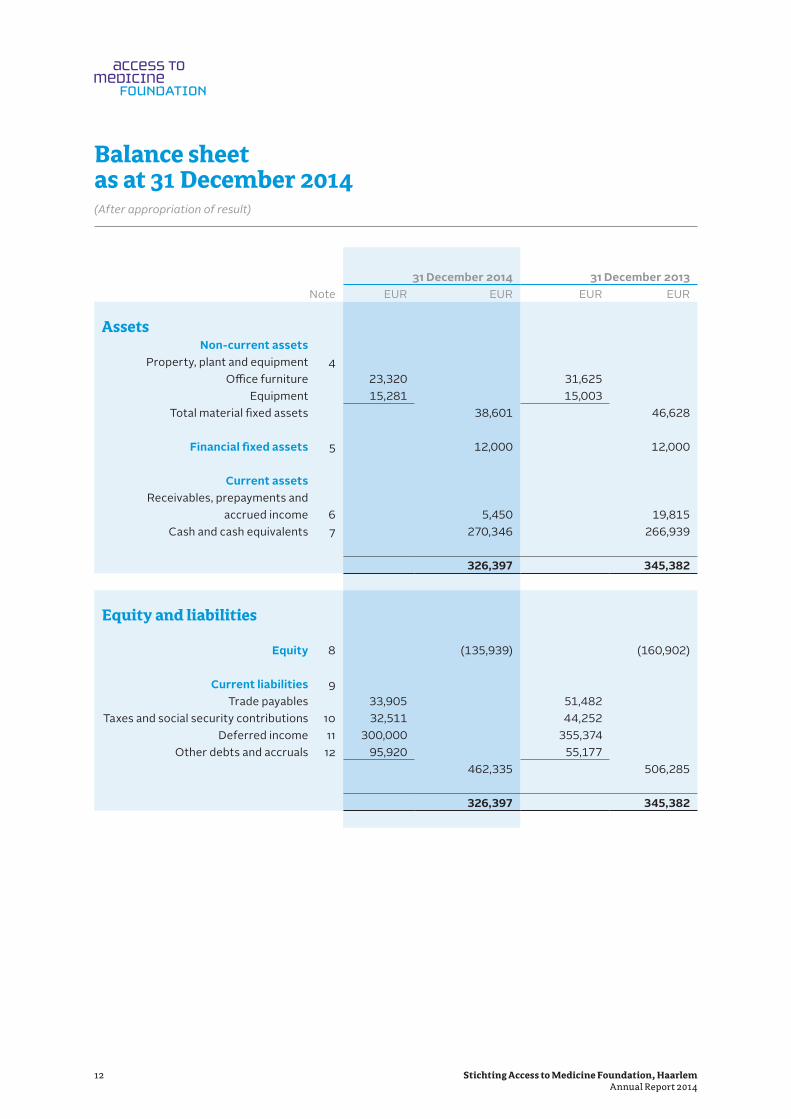
Balance sheet as at 31 December 2014 (After appropriation of result)
31 December 2014 31 December 2013Note EUR EUR EUR EUR
AssetsNon-current assets
Property, plant and equipment 4Office furniture 23,320 31,625
Equipment 15,281 15,003 Total material fixed assets 38,601 46,628
Financial fixed assets 5 12,000 12,000
Current assetsReceivables, prepayments and
accrued income 6 5,450 19,815 Cash and cash equivalents 7 270,346 266,939
326,397 345,382
Equity and liabilities
Equity 8 (135,939) (160,902)
Current liabilities 9Trade payables 33,905 51,482
Taxes and social security contributions 10 32,511 44,252 Deferred income 11 300,000 355,374
Other debts and accruals 12 95,920 55,177 462,335 506,285
326,397 345,382

13Stichting Access to Medicine Foundation, HaarlemAnnual Report 2014
Statement of income and expenses for the year ended 31 December 2014
Budget Results Results2014 2014 2013
Note EUR EUR EUR
IncomeGrants & subsidies 14 1,904,000 1,802,463 1,703,479
Donations 15 10,000 10,000 10,000 Financial income 16 - 1,714 2,579
Exchange difference 17 - 1,711 4,868
Total income 1,914,000 1,815,889 1,720,926
ExpensesSalaries and wages 18 922,000 863,963 761,686
Social security contributions 19 140,000 135,485 112,435 Other personnel expenses 20 50,000 74,785 153,802
Depreciation of plant, property and equipment 10,000 11,419 9,746 Travel expenses 20 70,000 84,534 49,250
Financial expenses 2,000 1,054 1,864 Housing expenses 21 70,000 69,595 61,426
Consultants and similar expenses 22 245,000 301,602 167,061 Sub-contracts and similar expenses 23 225,000 200,000 175,000
Supplies and similar expenses 24 50,000 48,489 61,375 Generics & Vaccines expenses - - 109,424
Effectiveness research expenses 100,000 - 31,158
Total expenses 1,884,000 1,790,925 1,694,226
Net result 30,000 24,964 26,700
Distribution of net result
Addition to general reserve 24,964 26,700
Net result 24,964 26,700

14 Stichting Access to Medicine Foundation, HaarlemAnnual Report 2014
Notes to the financial statements
General information Activities Stichting Access to Medicine Foundation (the “Foundation”), domiciled in Haarlem, the Netherlands, is a foundation (“stichting”) incorporated according to Dutch law.The registered office of the Foundation is: Scheepmakersdijk 5A, 2011 AS Haarlem.
The Access to Medicine Foundation is primarily involved in the promotion of access to health care (in the widest sense) in developing countries and, in particular, to encourage the pharmaceutical industry to accept a larger role regarding access to medicine in less developed countries. To achieve this the Foundation develops and publishes the Access to Medicine Index report every 2 years.
Financial reporting period The current reporting period concerns the period from 1 January to 31 December 2014. The previous financial year concerned the period from 1 January to 31 December 2013.
Estimates The preparation of financial statements in conformity with the relevant rules requires the use of certain critical accounting estimates. It also requires manage-ment to exercise its judgement in the process of applying the Foundation’s accounting policies.
Going concern The negative equity has decreased gradually over the last two years. It is the Foun-dation's goal to reach a positive equity position. The funding needs for the next two years are for a major part already covered by the commitments of the Dutch Ministry of Foreign Affairs and the Bill & Melinda Gates Foundation.
Accounting policies for the balance sheet General informationThe financial statements have been prepared in accordance with Dutch law and the general accepted accounting policies for non-profit organisations in the Nether-lands (also referred to as “Richtlijn voor de Jaarverslaggeving 640”).
In general assets and liabilities are stated at the amounts at which they were acquired or incurred, or current value. If not specifically stated otherwise, they are recognised at the amounts at which they were acquired or incurred. The balance sheet and income statement include references to the notes.
Prior-year comparison The accounting policies have been consistently applied to all the years presented.
Foreign currencies Functional currencyThe financial statements are presented in euros, which is the functional and presen-tation currency of the Foundation.
11.1
1.2
1.3
1.4
22.1
2.2
2.32.3.1

15Stichting Access to Medicine Foundation, HaarlemAnnual Report 2014
Transactions, assets and liabilitiesForeign currency transactions in the reporting period are translated into the func-tional currency using the exchange rates prevailing at the dates of the transactions.
Monetary assets and liabilities denominated in foreign currencies are translated into the functional currency at the rate of exchange prevailing at the balance sheet date. Foreign exchange gains and losses resulting from the settlement of such transactions and from the translation at year-end exchange rates are recognised in the income statement.
Translation differences on non-monetary assets held at cost are recognised using the exchange rates prevailing at the dates of the transactions.
Property, plant and equipmentProperty, plant and equipment are stated at historical cost plus expenditure that is directly attributable to the acquisition of the items, less straight-line deprecia-tion over their estimated future useful lives. Allowance is made for any impairment losses expected on the balance sheet date.
Financial fixed assetsFinancial fixed assets like deposits are valued at historical cost or manufacturing price. Impairment losses are deducted from amortised cost and expensed in the income statement.
ReceivablesTrade receivables are recognised initially at fair value and subsequently measured at amortised cost. If payment of the receivable is postponed under an extended payment deadline, fair value is measured on the basis of the discounted value of the expected revenues. Interest gains are recognised using the effective interest method. When a trade receivable is uncollectible, it is written off against the allow-ance account for trade receivables.
Cash and cash equivalentsCash and cash equivalents include cash in hand, bank balances and deposits held at call with maturities of less than 12 months. Bank overdrafts are shown within borrowings in current liabilities on the balance sheet. Cash and cash equivalents are stated at face value.
Current liabilities and deferred income Borrowings are initially recognised at fair value, net of transaction costs incurred. Borrowings are subsequently stated at amortised cost, being the amount received taking account of any premium or discount, less transaction costs.
Any difference between the proceeds (net of transaction costs) and the redemp-tion value is recognised as interest in the income statement over the period of the borrowings using the effective interest method.
All donor payments received by the Access to Medicine Foundation but not spent, are presented as ‘deferred income’ under current liabilities.
2.3.2
2.4
2.5
2.6
2.7
2.8

16 Stichting Access to Medicine Foundation, HaarlemAnnual Report 2014
Accounting policies for the income statement General information The result is determined as the difference between total income and total expenses. Income and expenses are recognised in the income statement in the period that they are realised.
Grants and subsidies Donations, grants and subsidies are recognised as income when there is reasonable assurance thay they will be received and that the Foundation will comply with the conditions associated with these contributions. Donations, grants and subsidies that compensate the Foundation for expenses incurred are recognised as income on a systematic basis in the same periods in which the expenses are recognised. Dona-tions, grants and subsidies that compensate the Foundation for the cost of an asset are recognised in income on a systematic basis over the useful life of the asset.
Financial income Interest income is recognised on a time-weighed basis, taking account of the effective interest rate of the assets concerned.
Other income Other income refers to other incoming amounts than donations, grants and subsidies and is recognised in income when there is a reasonable assurance that the contribution will be received.
Exchange differences Exchange differences arising upon the settlement or conversion of monetary items are recognised in the income statement in the period that they arise.
Expenses Development costs for the Access to Medicine index are recognised in income, since no future benefits are expected.
The Foundation is the owner of the intellectual property rights of the Access to Medicine index. These rights are internally developed and on that basis not capitalised (in accordance with Dutch law).
Employee benefits Salaries, wages and social security contributions are taken to the income statement based on the terms of employment, where they are due to employees.
Depreciation Property, plant and equipment are depreciated over their estimated useful lives as from the inception of their use. Future depreciation is adjusted if there is a change in estimated future useful life.
Financial expenses Interest paid is recognised on a time-weighed basis, taking account of the effective interest rate of the liabilities concerned. When recognising interest paid, allowance is made for transaction costs on loans received as part of the calculation of effec-tive interest.
TaxesThe Foundation is exempt from both income taxes and VAT.
33.1
3.2
3.3
3.4
3.5
3.6
3.7
3.8
3.9
3.10

17Stichting Access to Medicine Foundation, HaarlemAnnual Report 2014
Property, plant and equipment Movements in property, plant and equipment can be broken down as follows:
Furniture Equipment TotalEUR EUR EUR
Balance as at 31 December 2013Cost 34,419 36,995 71,414
Accumulated depreciation 2,794 21,992 24,786
Book value 31,625 15,003 46,628
Movements in book valueAdditions 3,073 6,171 9,244
Disposals (at cost) (6,475) - (6,475)Depreciation 6,918 5,893 12,811
Disposals (acc. depr.) (2,015) - (2,015)
Balance (8,305) 278 (8,027)
Balance as at 31 December 2014Cost 31,017 43,166 74,183
Accumulated depreciation 7,697 27,885 35,582
Book value 23,320 15,281 38,601
Depreciation rate 20% 20% - 33%
The depreciation amount in the table above deviates by €1,392 from the depreciation figure in the Statement of Income and Expense, due to the fact that it includes depreciation until the end of 2014 of assets disposed of earlier in the year. This deviation is compensated for by a gain in disposed assets, recorded under financial expenses.
Financial fixed assets 12/31/2014 12/31/2013EUR EUR
Security deposit for rental payments 12,000 12,000
Receivables, prepayments and accrued income
12/31/2014 12/31/2013EUR EUR
Prepayments 3,736 15,448 Interest to be received 1,714 2,579
Current account Access to Seeds Foundation - 645 Current account Sustainable Mining Index Foundation - 1,144
5,450 19,815
4
5
6

18 Stichting Access to Medicine Foundation, HaarlemAnnual Report 2014
Cash and cash equivalentsCash and cash equivalents are at the Foundation’s free disposal.
EquityMovements in the Foundation’s reserves can be broken down as follows:
General Reserve
EURBalance as at 31 December 2013 (160,902)
Movements:Result for the year 24,964
Balance as at 31 December 2014 (135,939)
Current liabilitiesAll current liabilities fall due in less than one year. The fair value of the current liabilities approximates the book value due to their short term character.
Taxes and social security contributions 12/31/2014 12/31/2013EUR EUR
Wage tax 32,511 44,252
Deferred grant incomeDeferred grant income amounts to EUR 300,000 (2013: EUR 355,374).These amounts were paid by the Ministry of Foreign Affairs (2014) and the Bill and Melinda Gates Foundation (2013). Their payment schedule was changed to match the calendar year from 2014.
Other debts and accruals 12/31/2014 12/31/2013EUR EUR
Accrued auditor's fees 9,000 14,520 Vacation allowance 31,184 26,594
Accrued vacation days 25,494 10,524 Current account Access to Seeds Foundation 1,794 -
Other liabilities 28,447 3,539 95,920 55,177
Contingencies and commitmentsFinancial obligationsThe Foundation has an office rent obligation of EUR 5,417 per month with Nexthing B.V., which is cancellable with a 6 months notice. Up to 31 December 2013 this obligation was EUR 3,000 per month.
Part of the building (top floor) is sublet to Access to Seeds Foundation for € 1,750 per month since April 2014.
7
8
9
10
11
12
1313.1

19Stichting Access to Medicine Foundation, HaarlemAnnual Report 2014
Grants and subsidiesResults
2014Results
2013EUR EUR
Bill & Melinda Gates Foundation (Index) 614.101 490.095 Bill & Melinda Gates Foundation (Generics & Vaccines) - 90.000
Subsidy DFID UK 588.362 523.384 Dutch Ministry of Foreign Affairs (Social Dev. Dept.) 600.000 600.000
1,802,463 1,703,479
DonationsResults
2014Results
2013EUR EUR
Contributions ICCO 10,000 10,000
Financial incomeResults
2014Results
2013EUR EUR
Interest received 1,714 2,579
Exchange differenceResults
2014Results
2013EUR EUR
Exchange rate differences 1,711 4,868
Salaries and wagesResults
2014Results
2013EUR EUR
Gross salaries and wages 788,071 704,744 Holiday allowance 60,794 53,808
Vacation days 15,099 3,134 863,963 761,686
Social security contributionsResults
2014Results
2013EUR EUR
Social security charges and pension costs 99,943 80,022 Compensation health care insurance 35,542 32,413
135,485 112,435
14
15
16
17
18
19
20 Stichting Access to Medicine Foundation, HaarlemAnnual Report 2014
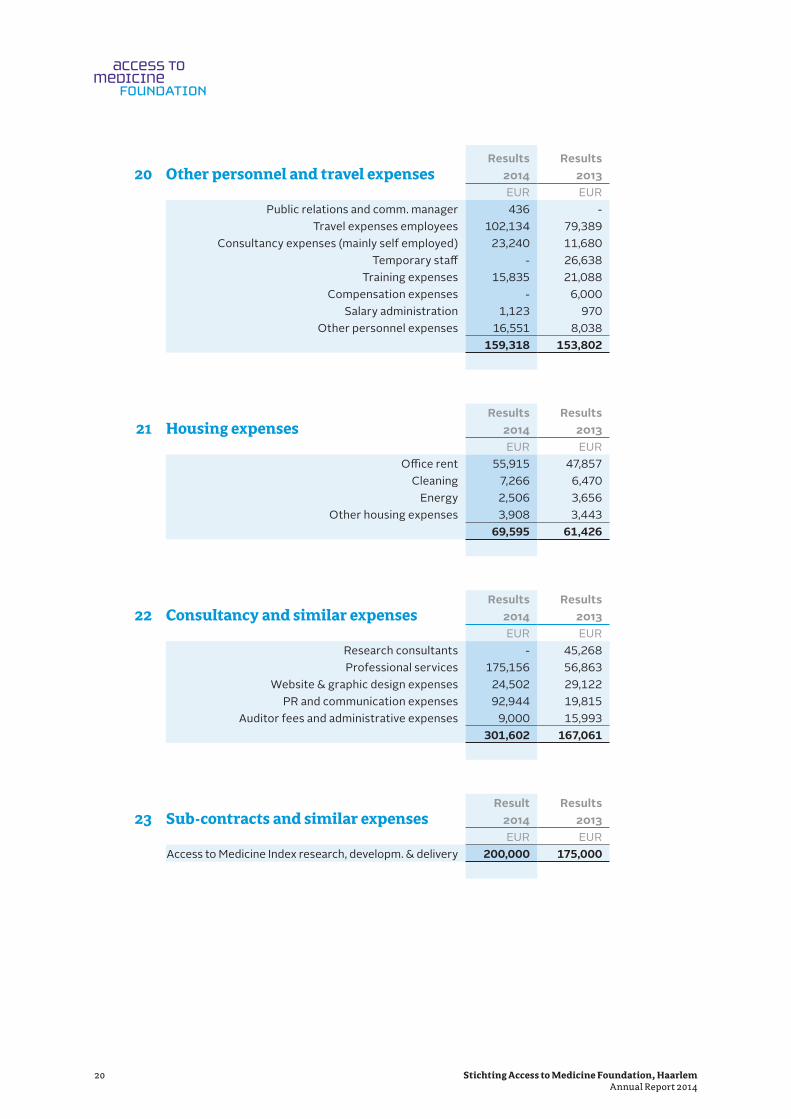
Other personnel and travel expensesResults
2014Results
2013EUR EUR
Public relations and comm. manager 436 - Travel expenses employees 102,134 79,389
Consultancy expenses (mainly self employed) 23,240 11,680 Temporary staff - 26,638
Training expenses 15,835 21,088 Compensation expenses - 6,000
Salary administration 1,123 970 Other personnel expenses 16,551 8,038
159,318 153,802
Housing expensesResults
2014Results
2013EUR EUR
Office rent 55,915 47,857 Cleaning 7,266 6,470
Energy 2,506 3,656 Other housing expenses 3,908 3,443
69,595 61,426
Consultancy and similar expensesResults
2014Results
2013EUR EUR
Research consultants - 45,268 Professional services 175,156 56,863
Website & graphic design expenses 24,502 29,122 PR and communication expenses 92,944 19,815
Auditor fees and administrative expenses 9,000 15,993 301,602 167,061
Sub-contracts and similar expensesResult
2014Results
2013EUR EUR
Access to Medicine Index research, developm. & delivery 200,000 175,000
20
21
22
23
21Stichting Access to Medicine Foundation, HaarlemAnnual Report 2014
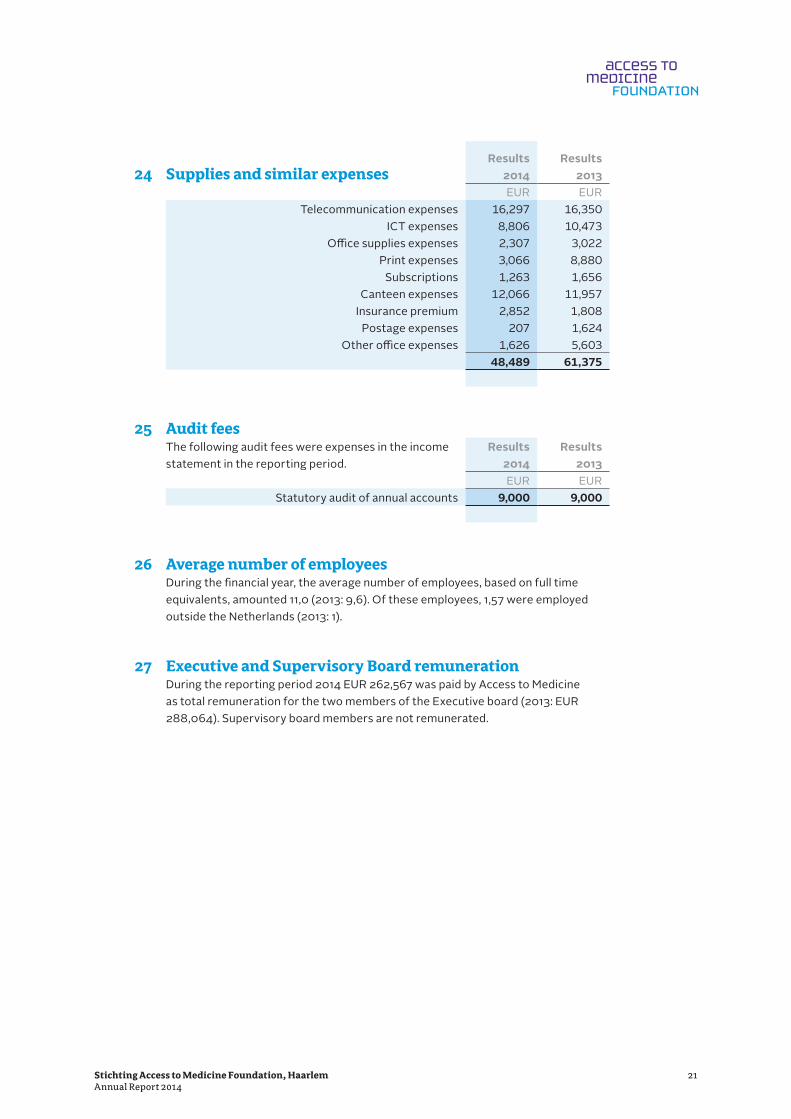
Supplies and similar expensesResults
2014Results
2013EUR EUR
Telecommunication expenses 16,297 16,350 ICT expenses 8,806 10,473
Office supplies expenses 2,307 3,022 Print expenses 3,066 8,880
Subscriptions 1,263 1,656 Canteen expenses 12,066 11,957
Insurance premium 2,852 1,808 Postage expenses 207 1,624
Other office expenses 1,626 5,603 48,489 61,375
Audit feesThe following audit fees were expenses in the income statement in the reporting period.
Results 2014
Results 2013
EUR EURStatutory audit of annual accounts 9,000 9,000
Average number of employeesDuring the financial year, the average number of employees, based on full timeequivalents, amounted 11,0 (2013: 9,6). Of these employees, 1,57 were employed outside the Netherlands (2013: 1).
Executive and Supervisory Board remunerationDuring the reporting period 2014 EUR 262,567 was paid by Access to Medicine as total remuneration for the two members of the Executive board (2013: EUR 288,064). Supervisory board members are not remunerated.
24
25
26
27

22 Stichting Access to Medicine Foundation, HaarlemAnnual Report 2014
Haarlem, 19 March 2015Stichting Access to Medicine Foundation
The Executive Board
Wim Leereveld Chief Executive Officer
Former member of the Executive Board active during this financial reporting period:
Ed MonchenChief Operational Officer until 1 January 2015

23Stichting Access to Medicine Foundation, HaarlemAnnual Report 2014
The Supervisory Board
Hans V. HogerzeilActing Chairman of the Supervisory Boardas of 7 February 2013
Knut Kjær Member of the Supervisory Board
John SchaetzlMember of the Supervisory BoardAs of 17 September 2014
Joelle TanguyMember of the Supervisory Board
Wilfred Griekspoor Member of the Supervisory Board
24 Stichting Access to Medicine Foundation, HaarlemAnnual Report 2014
Appropriation of resultThe profit for the reporting period (1 Jan. 2014 – 31 Dec. 2014) of EUR 24, 964 is added to equity.
25Stichting Access to Medicine Foundation, HaarlemAnnual Report 2014
26 Stichting Access to Medicine Foundation, HaarlemAnnual Report 2014
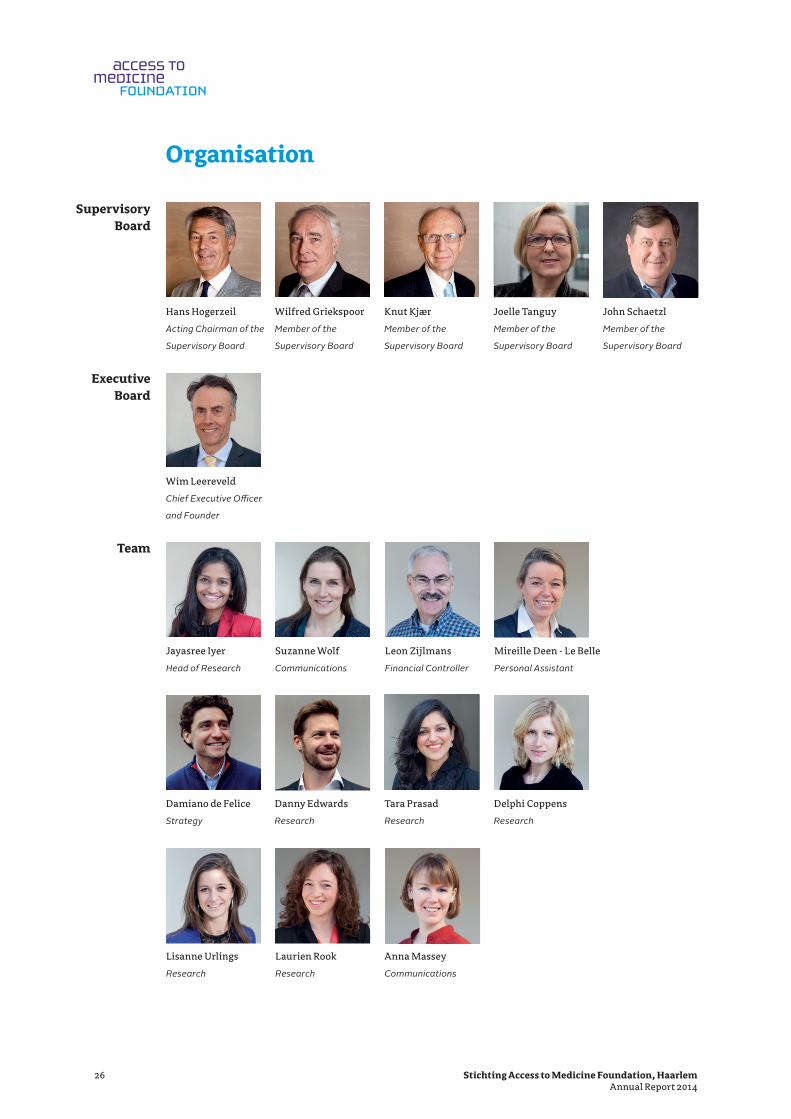
Supervisory Board
Executive Board
Team
Wim Leereveld
Chief Executive Officer
and Founder
Tara Prasad
Research
Danny Edwards
Research
Damiano de Felice
Strategy
Delphi Coppens
Research
Lisanne Urlings
Research
Laurien Rook
Research
Anna Massey
Communications
Knut Kjær
Member of the
Supervisory Board
Joelle Tanguy
Member of the
Supervisory Board
John Schaetzl
Member of the
Supervisory Board
Hans Hogerzeil
Acting Chairman of the
Supervisory Board
Wilfred Griekspoor
Member of the
Supervisory Board
Jayasree Iyer
Head of Research
Suzanne Wolf
Communications
Leon Zijlmans
Financial Controller
Mireille Deen - Le Belle
Personal Assistant
Organisation

Disclaimer
The report is intended to be for information purposes only and is not intended as promotional material in any respect. The material is not intended as an offer or solicitation for the purchase or sale of any financial instrument. The report is not intended to provide accounting, legal or tax advice or investment recommendations. Whilst based on information believed to be reliable, no guarantee can be given that it is accurate or complete.
Photo Disclaimer
The Access to Medicine Foundation gratefully respects the permission granted to reproduce the copyright material in this report. Every reasonable effort has been made to trace copyright holders and to obtain their permission for the use of copyright material. Should you believe that any content in this report does infringe any rights you may possess, please contact us at [email protected] or +31 (0)23 53 39 187.
Copyright
No part of this report may be reproduced in any manner without the written permission of the Access to Medicine Foundation. The information herein has been obtained from sources which we believe to be reliable, but we do not guarantee its accuracy or completeness. All opinions expressed herein are subject to change without notice.
© 2015 Access to Medicine Foundation - All rights reserved
Photo credits
Patricia Wolf (organisation photos)IntraHealth InternationalMark Tuschman for Novartis AG
Design
Explanation Design BV, NetherlandsOmdat Ontwerp, Netherlands Paper

Scheepmakersdijk 5aNL-2011 AS HaarlemThe Netherlands
W www.atmindex.orgE [email protected] +31 (0)23 533 91 87