Embed Size (px)
Citation preview

2014
National Electric Power Company
Annual Report
The Hashemite Kingdom of Jordan
NEPCO

2014National Electric Power Co.
Annual Report

National Electric Power Co.
2014Annual Report
Chairman and Board Members of the
National Electric Power Company are honoured
to submit the 48th Annual Report of the Year
2014 to His Majesty King Abdullah The SecondBin Al-Hussein..
His Majesty King Abdullah II Bin Al Hussein

2014National Electric Power Co.
Annual Report

National Electric Power Co.
2014Annual Report
H.R.H Crown PrinceHussein Bin Abdullah II

2014National Electric Power Co.
Annual Report

7
National Electric Power Co.
2014Annual Report
Members
Managing Director
Eng. Abde Al-Fattah Al-Daradkeh
Chairman Eng. Khaldoun Qutishat
Former Ministry of Energy
and Mineral Resources
Vice ChairmanDr. Ghaleb Ma'abreh
Secretary General Ministry of Energy &
Mineral Resources
Board of Directors
Eng. A. Al-RawashdehManaging Director
Samra Electric Power.Generating Co
Dr. Hamzah Jaradat Former General Director of
Jordan Post
Mr. Abdullah Kawaldah Former General Director ofAqaba Railway Corporation
Eng. Mouen Al-Sayegh General Director
Department of Land andSurvey
Eng. Ali Al-Bakhit Former Advisor of
Minister of Energy andMineral Resources

2014
8
National Electric Power Co.
Annual Report
Contents
Message from Managing Director 9National Electric Power Company (Short Brief, Vision, Mission & Organization Frame) 10Energy and Electricity in 2014 11
1- Energy Sector 111-1 Achievements in the year 2014 111-2 Demand for Primary Energy 111-3 The Cost of Primary Energy 12
2- Electricity Sector 122-1 Achievements in the year 2014 122-2 Statistics Figures for Electricity Sector In Jordan 13
NEPCO’s Achievement & Performance Indicators 221- NEPCO’s Statistical Data ( Significant Figures and Electrical Energy Purchases & Sales) 222- NEPCO’s Projects 24
First - Substation Projects (132,400) kV 24Second - Transmission Lines Projects (132,400) kV 25Third- The Telecommunication Projects 26Fourth- The Electrical Interconnection Projects 27
3- NEPCO’s Duties and Activities 29First) Operation of the Jordanian Electric Power System 29Second) Planning Studies 29
A– Forecast of Electrical Energy and Peak Loads: 29B – Implemented & under Construction Generation Projects 30C- Projects of Renewable Energy 31
Third) The Technical and Administrative Supporting Services 32A- Quality & Public Safety 32B- Electric Training Centre 32C- International Services and Investment 33D- Manpower & Training 34
4- Financial Performance 35National Grid in Jordan›s Power System 36Financial Statements 37
Abbreviations MeasuresNEPCO National Electric Power CompanyCEGCO Central Electricity Generating CompanyEDCO Electricity Distribution CompanyJEPCO Jordan Electric Power CompanyIDECO Irbid District Electricity CompanySEPGCO Samra Electric Power Generating CompanyAES Jordan Amman East Power PlantQEPCO Qatrana Electric Power CompanyAAEPCO Amman-Asia Electric Generating CompanyAES Levant AES Levant Holding BV Jordan pscHTPS Hussein Thermal Power StationQAIA Queen Alia International AirportSS SubstationG.D.P Gross Domestic ProductP.S Power StationATPS Aqaba Thermal Power StationT.T.O.E. Thousand Ton of Oil EquivalentG.T. Gas TurbineOHL Overhead Linep.a. per annumH.F.O Heavy Fuel OilKgoe Kilogram of oil equivalent
JD Jordan Dinar (10^3 Fils)kV Kilovolt (10^3 Volt)kVA Kilovolt Ampere (10^3 Volt Ampere)MVA Mega volt Ampere (10^3 kVA)kW Kilowatt (10^3 Watt)MW Megawatt (10^6 Watt)kWh Kilowatt-hour (10^3 Watt-hour)MWh Megawatt-hour (10^6 Watt-hour)km Kilometer (10^3 Meter)GWh Gegawatt-hour (10^9 Watt-hour)

9
National Electric Power Co.
2014Annual Report
A Message from Managing Director
Eng. Abde Al-Fattah Al-Daradkeh
Managing Director
The National Electric Power Company (NEPCO) is proud of its path of achievements and successes that are a direct result of the company’s long journey of continuous hard work, thanks be to Allah. This success is a true reflection of the outstanding level of performance reached by NEPCO, accompanied by high professionalism in implementing all its duties and responsibilities, efficiently and with full expertise.
In the year 2014, many vital projects in fields of developing and enhancing the electricity sector and its related infrastructure were completed. These projects supported the Jordanian power system by generating the required capacity needed for covering the electrical loads in the kingdom for this year as well as preparing for the future needs where the electrical loads are expected to grow. Moreover, these projects are designed to maintain security and stability of the power system aiming at providing the electrical energy to all customers in accordance with the best technical specifications and international standards while maintaining the lowest possible costs.
In this context, the third Independent Power Generation Project (IPP3) with a capacity of (570) MW, and the fourth Independent Power Generation Project (IPP4) with a capacity of (241) MW, sited in Al-Mankher area, were completed. By completing these two projects, the National Electric Power Company has supported the electric power system with about (800) MW during the year 2014, raising the total generating capacity to about (4000) MW by the end of that year, with a considerable growth rate of (26.0%).
In addition, the National Electric Power Company has also constructed and expanded several main substations 400/132/33 kV and related transmission lines of 400 and 132 kV which were required to link these main substations and the new generating plants with the electric power system.
NEPCO has also continued to manage and operate the electric power system effectively and efficiently by means of preparing and implementing the annual routine and preventive maintenance for all components of the national transmission grid. Its important aim again, as in past years, is to maintain the power system reliability and to provide the required electrical energy to consumers with high continuity and within the best technical specifications adopted for electrical loss percentage, number of outages and the average duration of each. By determining such indicators, NEPCO continues to achieve its vision and stated mission that aims at providing all current and future needs of electrical energy to all consumers safely and reliably, according to international standards and environmental requirements.
It is also worthy to note that the statistical technical indicators showed that the peak demand in the year 2014 had a negative growth rate of (2.5%) against a positive growth rate of (7.4%) in the year 2013, while the transmission losses amounted to (1.81%) in the year 2014 against (2.08%) in the year 2013. As for the number of outages, it reached (40) outages in 2014 compared with (37) outages in 2013, whereas the average duration of the outage during the years 2014 and 2013 was (28) and (14) minute per outage respectively. The results of these technical indicators are comparable and do comply with the best indicators adopted internationally. In this regard, these results reflected the high professionalism and efficiency in managing and operating the national grid coupled with the use of high quality equipment and devices in constructing and building all components of the Jordanian electric power system.
The comprehensive National Energy Strategy included the important concept of raising the contribution of the renewable energy in the energy mix to (7%) for the year 2015, and (10%) by the year 2020. To ensure this requirement, many agreements were signed during the year 2014 for the purpose of purchasing electrical energy generated by utilizing solar and wind energy plants with a generating capacity of (560) MW financed by international investments which amounted to about (850) million dollars. It is expected to complete some of these projects by the end of the year 2015.
In the field of utilizing local energy resources, an agreement has also been signed with the Estonian company(ENEFIT) in the year 2014 for constructing an electrical generating station with a capacity of (470) MW burning oil shale and with an estimated investment cost of two milliard dollars. The project should be completed by 2018, fully operating and generating electricity by utilizing the local oil shale.
The urgency and objective of completing such projects in Jordan within a timely manner and accelerated pace, is to help reduce the rising costs of generated electricity. This will include energy sector infrastructure projects of which the most prominent project is the liquefied natural gas port at Aqaba which is expected to be in operation by the year 2015. In fact these projects will not only help in reducing the cost of the generated electrical energy by about (30%) but also contribute to limiting NEPCO’s financial losses resulting from the increased dependence on using heavy fuel oil and diesel oil for electricity generation. Further aggravating this dependency is the fluctuations that occur in the supply mode of the natural gas imported from Egypt. Accordingly, the company’s priority is to focus its efforts to diversify various primary energy resources and to increase the dependency on local energy resources in order to enhance the security of the energy supply while contributing to reducing the primary energy bill.
The basis of the company’s success and efforts in accomplishing its works and goals, despite all of the difficulties and challenges that faced the company, is the outcome of wise policies adopted by the company’s management. In additions, the company’s consistent humane policies with respect to evolving and developing its human resources has allowed the company, in the best way possible, to continue to motivate staff for the hard work and achievements which are considered by all standards “successful”. NEPCO, therefore, has and always will be interested to prepare and implement programs and training courses for all its staff in order to build up the skills and the necessary experience needed to support and develop the company’s performance. This company priority again has helped it to maintain a distinguished level that is comparable to other leading companies in the region. In fact, the company was proudly recognized to be one of the leading companies in the fields of consultancy and training.
Finally, with all due respect and appreciation, I thank his Excellency the Chairman of the Board of Directors and the Board Members for their tireless efforts and important role in realizing all the company’s achievements.
I also thank all my colleagues, in all the different NEPCO’s locations throughout Jordan, for their indispensable efforts and continuous hard work which led to supporting and maintaining its goals, improving the company’s performance and efficiency, and promoting the company to be a model on the Arab and regional level.
Meanwhile, I continue to ask for the support of the Almighty Allah to help us achieve the company’s mission and its ambitious vision, and to guide us to serve our country and its citizens under the leadership of his Majesty King Abdullah the Second Bin Al-Hussein ( May Allah preserve and protect him ).

2014
10
National Electric Power Co.
Annual Report
National Electric Power Company (NEPCO)
Vision
A SHORT BRIEF
Mission
Organization Frame
To elevate the Company’s status in all aspects to world standards at the same class of the best regional and international electric utilities.
The National Electric Power Company (NEPCO) was established in the 1st of September 1996 in accordance with the General Electricity Law number (10) for the year 1996. In compliance with this Law, the Jordan Electricity Authority was transferred to a Public Shareholding Company named as the National Electric Power Shareholding Company which is considered as the actual public legal successor for Jordan Electricity Authority, where all its shares are completely owned by the Jordan Jordanian Government.In 1999, the modified Electricity Law number (13) of the year 1999 has been issued. In compliance with this modified Law, the National Electric Power Company (the mother) has been divided into three electric companies of administrative and financial dependence as from the beginning of the year 1999. These companies are: National Electric Power Company (NEPCO), Central Electricity Generation Company (CEGCO) and Electricity Distribution Company (EDCO).
Provision of secured electric energy; with high levels of reliability of the electric power system; and continuity of supply of electric energy demand at economical prices pursuant to international quality standards; meeting environmental requirements and good business practice in exchanging electric energy with neighboring countries; a consolidation of corporate governance at the company; achieving optimal investment in the infrastructure of the electric power transmission grid for the benefit of society; contribution in the technology transfer; attraction of national and international investments in electricity sector and creation of job opportunities for Jordanian professionals.
Board Of Directors
Managing Director
Financial Division
Purchasing Dept.
Financial Dept.
Funds Dept.
Accounts Dept.
Finance & Monetary Dept.
Transmission Division
Civil Engineering Dept.
Design & Projects Dept.
(Transmission lines)
Maintenance Dept. (Transmission)
ProtecAon & Metering Dept.
Projects Dept. (SubstaAons)
Design Dept. (SubstaAons)
Maintenance Dept. (SubstaAons)
Project AccounAng SecAon
OperaAon & Planning Division
TelecommunicaAon & Control Dept.
OperaAon Dept.
ProducAon Planning Dept.
OperaAonal Studies Dept.
Power System Planning Dept.
Experts
Technical Support Services Division
Quality & Public Safety Dept.
Warehouses Dept.
Computer Network & Database System
Dept.
SoLware ApplicaAons & Database Dept.
InternaAonal Services &
Investment Dept.
Experts
AdministraAve Support Services
Division
Admin Services Dept.
Human Resources Dept.
Electric Training Center Dept.
TransportaAon Dept.
Governance & Strategic Planning CommiQee Legal Dept.
Tender CommiQee & Secretariat Dept. Internal Audit Dept.

11
National Electric Power Co.
2014Annual Report
Energy and Electricity in 2014 (Reality and Achievements)
1- Energy Sector:Energy topic in Jordan is one of the most important topics undertaken in present time. This is due to the big burden on the Jordan national economy related to the high cost of the primary energy bill, which is caused by the continuous increase of Oil prices internationally, which in turn makes many challenges to Jordan due to the fact that its oil imports from abroad amount to about (97%) of its primary energy consumed locally. This situa-tion necessitated seeking proper solutions and more convenient alternatives so as to reduce the negative effect of the high cost of the energy bill imposed on the national economy.
The problem facing the energy sector in Jordan is presented by the limitation of the primary energy resources of Oil and gas, contributed in adopting a comprehensive strategy for energy in Jordan. This strategy aims at increasing the dependency on the available local energy resources such as Oil shale, supporting the renewable energy projects such as solar energy and wind energy projects, and in addition to the nuclear energy alternative used for electricity generation and water treatment, this strategy, at its completion, will reduce the financial bur-den on the state budget which was oppressed by the energy bill. It is expected to reduce the energy bill cost by about (30%) and to reduce the percentage of the imported primary energy from (97%) to (65%). This reduction will in turn resolve the energy crisis available in Jordan since many years.
1 -1 Achievements in the Year 2014Jordan continued its strenuous paces towards the completion of the energy infrastructure projects such as:• Implementation of the Liquefied Gas Port at Aqaba. It is expected to be ready to receive the Liquefied Gas
from ships in the beginning of May 2015.• Signing the agreement of interconnecting the Liquefied Natural Gas project with the Arab Gas Pipe Line by
the Ministry of Energy and Mineral Resources as well as the National Electric Power Company as one side and the Jordanian Al-Fajr Company as the other side. This link will be through a pipeline of a length of (800) m and diameter of (24) inch.
• Signing the agreement of transmitting the Liquefied Natural Gas through the Arab Gas Pipe Line in order to supply it to the generation power plants, pointing out that this Liquefied Natural Gas will be imported through the port of the liquefied Natural Gas.
• Following up the procedures of implementing the project of Crude Oil Pipeline extending from Iraq to Aqa-ba in Jordan. The exported capacity of this pipeline is about one million barrels per day in addition to Jordan needs from the Crude Oil. It is expected to complete this project in the year 2018.
1- 2 Demand for Primary Energy• The demand for primary energy in 2014 was about (8461) thousand tons of Oil equivalent, with a growth
rate of (3.7%) against a negative growth rate of (0.6%) in the year 2013.• The average per capita consumption of primary energy in the year 2014 was about (1261) Kg of Oil equiva-
lent (Kgoe) against (1243) Kg of oil equivalent (Kgoe) in the year 2013.
Table (1) : The Demand for Primary Energy in Jordan
YearTotal Primary Energy
Demand (T.T.O.E)*Growth Rate
(%)Primary Energy per Capita
(kgoe)
2009 7739 5.5 12942010 7357 (4.9) 12042011 7457 1.4 11942012 8206 10.0 12802013 8157 (0.6) 12432014 8461 3.7 1261
* It includes quantities of coal consumed by some industries since 2012

2014
12
National Electric Power Co.
Annual Report
1.3 The Cost of Primary EnergyTable (2) Cost of Consumed Primary Energy Relative to The National Economy
YearCost of consumed
Primary energy (million JD)
Cost of Consumed Primary Energy Relative toExports
(%)*Imports
(%)GDP (%)
2009 1916 49.6 19.0 11.32010 2603 58.5 23.6 13.92011 4019 79.3 29.9 19.62012 4640 92.7 31.5 21.12013 4074 80.7 26.2 17.12014 4480 83.0 27.7 17.3* Exports + (30%) Re-Export
2- Electricity Sector:2 -1 Achievements in the Year 2014The important achievements which were determined in the year 2014 were as follows:- • The Third Independent Power Producer Project (IPP3) was completed. This project consists of constructing a power
station in East of Amman area on the basis of Build, Own and Operate (B.O.O). It is implemented in three stages; the first stage included an addition of one generating diesel unit (241) MW, while the second and the third stages include an addition of two diesel units of capacity about (332) MW, thus the total capacity of the project is about (573) MW.
• The project commenced the official commercial operation in October 2014 by burning heavy fuel oil as base fuel and diesel oil and natural gas when available as an alternative fuel. This project was implemented by a consortium of Korean Company (KEPCO), Japanese Company (Mitsubishi) and Finnish Company (Wartsila). The cost of the project amounted to about (775) million dollar.
• The Fourth Independent Power Producer Project (IPP4) was also completed. It consists of constructing a power gen-eration plant sited at Amman East area on the basis of Build, Own and Operate (B.O.O). This project was operated offi-cially in July 2014 with a generating capacity of about (241) MW. The generating units of this project were designed to burn heavy fuel oil as a base fuel and diesel oil and natural gas when available as an alternative fuel. This project was implemented by a consortium of the American Company (AES) and the Japanese Company (Mitsue) and it will cover about (8%) of Jordan energy needs. The cost of the project amounted to about (360) million dollar.
• Signing an agreement of constructing a power generation plant using the technology of direct burning of oil shale. The agreement was signed by the National Electric Power Company (NEPCO) and the Estonian Company (ENEFIT) after the Jordan government approval was obtained on this project.
• It is expected to complete the stages of the project in the year 2018. The generating capacity of this project is about (470) MW and it might be expanded to (600) MW in future. The oil shale is considered one of the exposed alternatives that will help in reducing the burden of the energy bill on Jordan as adopted in the National Comprehensive Energy Strategy.
• In the scope of the Jordan nuclear plant project, the government approved to sign the agreement of implementing the first nuclear plant in Jordan with the Russian Company (ROSATOM) based on the submitted offer from this com-pany which costs (10) milliard dollar. This offer includes constructing two nuclear reactors with a capacity of (1000) MW each. This agreement includes also conducting detailed studies about the plant site, construction cost of the plant, cost of the generated energy and cost of energy sold to NEPCO. It is expected to complete the first reactor in the year 2023 whereas the second reactor is expected to be completed in the year 2025.
• As for the renewable energy projects, the National Electric Power Company (NEPCO) signed several agreements of constructing electrical energy generation plants utilizing the Solar energy in Ma’an development region within the first round of the direct offers related to the projects of electrical energy generation by utilizing the renewable energy (Solar Energy). These offers include (12) projects with a capacity of (200) MW.
• These projects, at their completion during the year 2015, along with some other renewable energy projects, will contribute in verifying the orientations of the comprehensive strategy for energy sector that aims at enhancing the contribution of these projects to total energy mix in Jordan so as to reach (10%) in the year 2020.

13
National Electric Power Co.
2014Annual Report
2- 2 Statistical Figures for Electricity Sector in Jordan2-2-1 Statistics and Performance Indicators for Electricity sector in Jordan
Table (3): Significant Figures for Electricity Sector in Jordan
2013 2014 ( % )
Peak load (MW)Generated 3120 3050 (2.2)Sent-out 2995 2930 (2.2)
Available Capacity (MW)Generated 3460 4350 25.7 Sent-out 3326 4189 25.9
Generated Energy (GWh) 17262 18269 5.8
Consumed Energy (GWh) 14564 15419 5.9
Exported Energy ( GWh) 59 64 8.5
Imported Energy (GWh) 381 435 14.2
Loss Percentage (%) * 14.12 14.33 -
Average (KWh) Consumed Per Capita 2220 2298 3.5
Electricity Fuel Consumption (T.T.O.E) 3716 3856 3.8
No. of Consumers (Thousands) 1744 1862 6.8
No. Of Employees in Electricity Companies 7878 6782 (13.9) *Dose not include power station internal consumption
Table (4): Performance Indicators for Electricity Sector in Jordan
2013 2014 ( % )
1.Manpower IndicatorsAnnual Productivity (MWh Generated / Employee) 2201 2698 22.6
Installed Capacity (MW / Employee) 0.40 0.59 47.5
No. of Consumers per Employee 221 275 24.4
2. Financial IndicatorsAverage Cost of kWh Sold (Fils/KWh)
Total 145.30 156.60 7.8
Fuel 128.81 139.54 8.3
Average price of Heavy Fuel Oil (JD/Ton) 478.5 453.7 (5.2)
Average price of Diesel Oil (JD/m³) 653.5 630.8 (3.5)
3. Technical IndicatorsThermal Efficiency of Generating plants (%) 41.3 40.7 --
Availability of Generating Plants (%) 95.78 94.68 --
Availability of Transmission Lines (%) 99.36 99.67 --

2014
14
National Electric Power Co.
Annual Report
2 -2- 2 Electrical Energy Generated and Generation Capacity The total generated and imported electrical energy in the Kingdom amounted to (18704) GWh in 2014 compared with (17643) GWh in 2013 representing an annual growth of (6.0%), whereas the total production of electrical energy in the kingdom was (18269) GWh, with a growth rate of (5.8%), while the imported electrical energy amounted to (435) GWh in 2014 against (381) GWh in 2013 with a growth rate of (14.2%).The Central Electricity Generating Company (CEGCO) contributed in 2014 by (43.6%) of the total electrical energy produc-tion in the kingdom, while Al-Samra Electric Power Generation Company (SEPGCO) contributed by (24.7%), Amman - East Generation Company in (Al-Manakher) area contributed by (10.9%), Qatrana Generation Company contributed by (8.3%), Amman Asia and AES LEVANT Generation Companies contributed by (6.2%), (4.0%) respectively, while the other corpora-tions contributed by (2.1%) of the total production.The total generation capacity of the Jordanian Power System amounted to (4000) MW in 2014 compared with (3186) MW in 2013 with a growth rate of (25.5%).
Table (5): Available Capacity of Generating Plants (MW)*
Year SteamGas Turbines Combined
Cycle Diesel / FuelOil + Diesel
HydroUnits
WindEnergy Biogas Total
Diesel N.Gas
2011 925 134 499 1737 -- 12 1.4 3.5 33122012 925 134 499 1737 -- 12 1.4 3.5 33122013 787 27 618 1737 -- 12 1.4 3.5 31862014 787 27 618 1737 814 12 1.4 3.5 4000
* Sent - Out
Table (6): Electrical Energy Generated and Imported in Jordan (GWh)
2011 2012 2013 2014 ( % )1. Electricity Sector 14390 16355 16976 17886 5.4
CEGCO 8051 7789 7381 7964 7.9 SEPGCO 3597 4595 4499 4521 0.5 AES Jordan PSC (IPP1) 2267 1596 2640 1988 (24.7)QEPCO (IPP2) 454 2353 2437 1520 (37.6)AAEPCO (IPP3) -- -- -- 1140 --AES Levant (IPP4) -- -- -- 730 --King Talal Dam 13 16 13 17 30.8 Jordan Biogas Company 8 6 6 6 --
2. Industrial Sector 257 241 286 383 33.9 Potash Co. 11 3 79 101 27.8 Indo-Jordan Chemicals Co. 66 62 64 71 10.9 Refinery 70 72 51 66 29.4 Fertilizer Co. 110 104 92 97 5.4 Qatranna Cement Co. -- -- -- 48 --
3. Imported Energy 1738 784 381 435 14.2 Imported Energy from Egypt 1458 784 381 435 14.2 Imported Energy from Syria 280 -- -- -- --Total 16385 17380 17643 18704 6.0

15
National Electric Power Co.
2014Annual Report
Table (7): Electrical Energy Production by type of Generation in Jordan (GWh)
2011 2012 2013 2014 ( % )1. Electricity Sector 14390 16355 16976 17886 5.4
Steam Units 5474 5256 5321 5491 3.2 Gas Turbines / Diesel 314 631 490 503 2.7 Gas Turbines / Natural Gas 574 551 474 320 (32.5)Diesel Engines / HFO -- -- -- 1866 --Diesel Engines / Diesel 1 1 1.5 15.6 940.0Hydro Units 55 61 55 58 5.5 Wind Energy 3 3 3 2.4 (20.0)Biogas 8 6 6 6 --Combined Cycle 7961 9846 10625 9624 (9.4)
2. Industrial Sector 257 241 286 383 33.9 Steam Units 247 235 274 382 39.4Diesel Engines / Diesel 10 6 12 1 (91.7)Total 14647 16596 17262 18269 5.8
Table (8): Electrical Energy Production by Type of Fuel in Jordan (GWh)
Heavy Fuel Oil N. Gas Diesel Coal
Other Energy
Resources*Total
CEGCO 5490.6 301.1 2128.6 -- 44.0 7964.3SEPGCO -- 157.6 4363.4 -- -- 4521.0AES Jordan PSC (IPP1) -- 563.0 1425.3 -- -- 1988.3QEPCO (IPP2) -- 274.6 1245.3 -- -- 1519.9AAEPCO (IPP3) 1139.8 -- -- -- -- 1139.8AES Levant (IPP4) 726.1 -- 4.1 -- -- 730.2Industrial Sector 333.2 -- 1.3 48.0 -- 382.5King Talal Dam -- -- -- -- 16.6 16.6Jordan Biogas Company -- -- -- -- 6 6.0Total 2014 7689.7 1296.3 9168.0 48.0 66.6 18268.62013 5595.6 4339.4 7263.1 -- 63.5 17261.62012 5490.9 3083.4 7951.7 -- 69.5 16595.52011 5637.8 3958.8 4984.3 -- 65.7 14646.62010 3653.5 10517.5 533.0 -- 72.8 14776.82009 1159.4 12985.7 57.9 -- 68.9 14271.92008 2128.0 11589.6 46.3 -- 74.2 13838.12007 2171.8 10714.7 40.5 -- 73.5 13000.5
* Wind + Biogas + Hydro

2014
16
National Electric Power Co.
Annual Report
2- 2- 3 Fuel ConsumptionTable (9): Fuel Consumption for Electricity Generation (T.T.O.E)
2011 2012 2013 2014 ( % )1. Electricity Sector 3093 3479 3599 3726 3.5
CEGCO 1857 1805 1732 1808 4.4 SEPGCO 690 884 883 875 (0.9)AES Jordan PSC (IPP1) 436 324 501 366 (26.9)QEPCO (IPP2) 110 466 483 310 (35.8)AAEPCO (IPP3) -- -- -- 225 --AES Levant (IPP4) -- -- -- 142 --
2.Industrial Companies with Self Generation 73 72 117 130 11.1 Total 3165 3551 3716 3856 3.8 All Jordan Fuel Consumption* 7457 8206 8157 8461 3.7Electricity Fuel Consumption to Total Fuel Consumption (%) 42.4 43.3 45.6 45.6 --
* It includes coal quantities consumed by some Industries since 2012.
Table (10): Electricity Fuel Consumption by Type of Fuel (T.T.O.E)
2011 2012 2013 2014 ( % )1. Electricity Sector 3092.7 3479.0 3598.8 3726.1 3.5
Heavy Fuel 1284.2 1270.5 1287.1 1665.6 29.4 Natural Gas 848.5 676.1 905.4 301.9 (66.7)Diesel 960.0 1532.4 1406.3 1758.6 25.1
2. Industrial Sector 72.6 71.6 116.7 129.6 11.1 Heavy Fuel 70.6 69.9 112.7 122.8 9.0 Diesel 2.0 1.7 4.0 0.3 (92.5)Coal -- -- -- 6.5 --Total 3165.3 3550.6 3715.5 3855.7 3.8

17
National Electric Power Co.
2014Annual Report
2 -2 -4 Demand for Electricity
The consumed electrical energy in the kingdom amounted (15419.1) GWh in 2014 compared with (14564.4) GWh in 2013, with an annual growth rate of (5.9%). The average consumption of electrical energy per capita amounted to (2298) kWh in 2014 against (2220) kWh in 2013 which represents a growth rate of (3.5%).
Table (11): Electrical Energy Consumption in Jordan (GWh)
2011 2012 2013 2014 ( % )1. EDCO’s Areas 2362.5 2491.7 2612.0 2777.0 6.3 2. JEPCO’s Areas 8008.4 8472.7 8510.7 8759.1 2.9 3. IDECO’s Areas 2138.3 2181.1 2306.3 2520.7 9.3 4. Industrial Companies 963.1 1054.4 1065.4 1294.6 21.5
Refinery 102.8 106.9 98.5 98.4 (0.1)Jordan Cement Company / Al-Fuheis plant 145.2 122.0 49.8 23.6 (52.6)Jordan Cement Co. / Al-Rashadieh plant 47.9 41.7 98.3 125.1 27.3 Al-Hadeetha Cement Company 0.1 34.6 86.0 111.3 29.4 Al-Rajhi Cement Company 17.8 169.2 122.4 138.5 13.2 Qatrana Cement Company - - 63.8 133.4 109.1 EL-Hasa Phosphate 50.6 42.4 43.2 39.6 (8.3)Sheidiyah Phosphate 69.5 65.4 49.0 42.9 (12.4)Potash Co. 390.7 337.1 326.5 378.6 16.0 Fertilizer Company* 102.1 96.8 85.9 90.2 5.0
Indo-Jordan Chemicals Company 36.4 38.3 42.0 46.3 10.2 Indo-Jordan Fertilizer Company -- -- -- 60.5 --AAEPCO (IPP3) -- -- -- 5.0 --AES Levant (IPP4) -- -- -- 1.2 --
5. Queen Alia Airport 61.9 76.2 69.7 66.8 (4.2)6. Haraneh B.Station 0.6 0.5 0.2 0.8 300.0 7. Others 0.1 0.1 0.1 0.2 100.0 Total Consumption 13534.9 14276.7 14564.4 15419.2 5.9
* EDCO’s sales to Fertilizer are not included to avoid duplication

2014
18
National Electric Power Co.
Annual Report
Table (12): Electrical Energy Consumption by Sector Type (GWh)
Domestic & Government
Buildings*Industrial Commercial &
HotelAgriculture
& Water Pumping
Street Lighting Total
EDCO 839.0 353.0 309.0 1206.0 70.0 2777.0
JEPCO 4376.2 1968.1 1742.9 533.1 138.8 8759.1
IDECO 1368.2 262.6 238.0 545.1 106.8 2520.7
Industrial Companies -- 1294.6 -- -- -- 1294.6
Other Companies -- -- 67.8 -- -- 67.8Total 2014 6583.4 3878.3 2357.7 2284.2 315.6 15419.22013 6265.4 3517.1 2414.9 2076.0 291.0 14564.42012 6126 3464 2427 1955 305 142772011 5667 3486 2173 1899 310 135352010 5225 3262 2187 1868 315 128572009 4888 3006 1980 1772 310 119562008 4459 3128 1925 1713 284 115092007 4017 2918 1757 1592 269 10553
* Include about (6%) Governmental + (1.5%) Others
Fig(1) Electrical Energy Consumption in the KingdomBy sector for the period (2009-2014)
Fig(2) Electrical Energy Consumption in the KingdomBy type for the year 2014
Industrial Commercial
0
2000
4000
6000
8000
10000
12000
14000
Domestic W.Pumping Street Lighting
Year
GW
h
2009 2010 2011 2012 2013 2014
42.70%
25.15%
16.29%
14.23%
2.00%
Domestic
Industrial
Commercial
W.Pumping
Str.Lighting
19
National Electric Power Co.
2014Annual Report
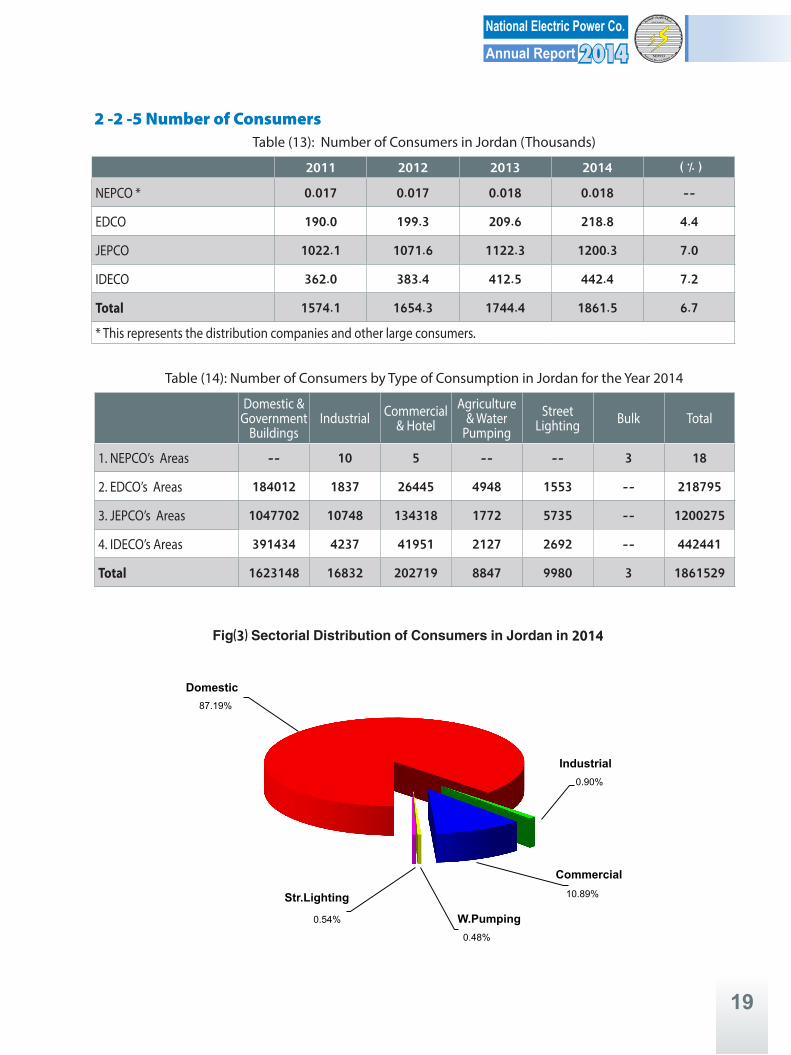
2 -2 -5 Number of ConsumersTable (13): Number of Consumers in Jordan (Thousands)
2011 2012 2013 2014 ( % )NEPCO * 0.017 0.017 0.018 0.018 --
EDCO 190.0 199.3 209.6 218.8 4.4
JEPCO 1022.1 1071.6 1122.3 1200.3 7.0
IDECO 362.0 383.4 412.5 442.4 7.2
Total 1574.1 1654.3 1744.4 1861.5 6.7 * This represents the distribution companies and other large consumers.
Table (14): Number of Consumers by Type of Consumption in Jordan for the Year 2014
Domestic & Government
BuildingsIndustrial Commercial
& HotelAgriculture
& Water Pumping
Street Lighting Bulk Total
1. NEPCO’s Areas -- 10 5 -- -- 3 18
2. EDCO’s Areas 184012 1837 26445 4948 1553 -- 218795
3. JEPCO’s Areas 1047702 10748 134318 1772 5735 -- 1200275
4. IDECO’s Areas 391434 4237 41951 2127 2692 -- 442441
Total 1623148 16832 202719 8847 9980 3 1861529
87.19%
0.90%
10.89%
0.48%
0.54%
Domestic
Industrial
Commercial
W.Pumping
Str.Lighting
Fig(3) Sectorial Distribution of Consumers in Jordan in 2014
2014
20
National Electric Power Co.
Annual Report
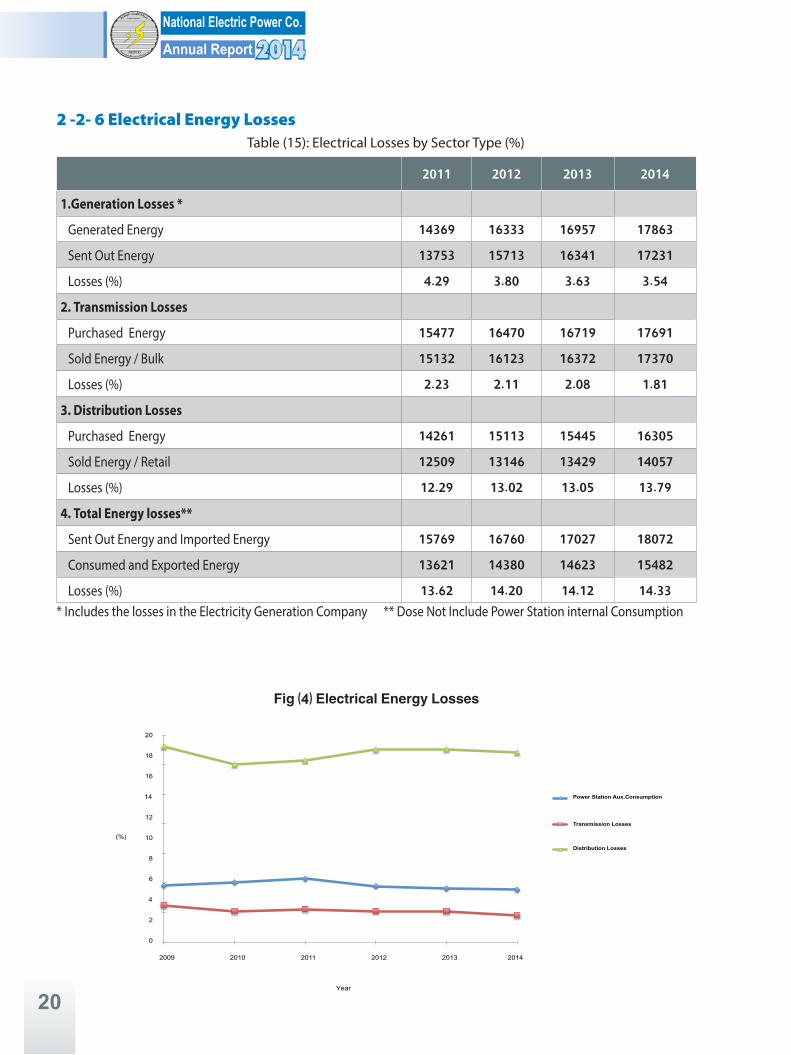
2 -2- 6 Electrical Energy Losses Table (15): Electrical Losses by Sector Type (%)
2011 2012 2013 2014
1.Generation Losses *
Generated Energy 14369 16333 16957 17863Sent Out Energy 13753 15713 16341 17231Losses (%) 4.29 3.80 3.63 3.54
2. Transmission Losses
Purchased Energy 15477 16470 16719 17691Sold Energy / Bulk 15132 16123 16372 17370Losses (%) 2.23 2.11 2.08 1.81
3. Distribution Losses
Purchased Energy 14261 15113 15445 16305Sold Energy / Retail 12509 13146 13429 14057Losses (%) 12.29 13.02 13.05 13.79
4. Total Energy losses**
Sent Out Energy and Imported Energy 15769 16760 17027 18072Consumed and Exported Energy 13621 14380 14623 15482Losses (%) 13.62 14.20 14.12 14.33
* Includes the losses in the Electricity Generation Company ** Dose Not Include Power Station internal Consumption
Fig (4) Electrical Energy Losses
Power Station Aux.Consumption
Transmission Losses
Distribution Losses
0
2
4
6
8
10
12
14
16
18
20
(%)
Year
2009 2010 2011 2012 2013 2014

21
National Electric Power Co.
2014Annual Report
2 -2 -7 Electricity Tariffs
1- Bulk Supply Tariff
A- JEPCO *
Peak Load (JD/kW/ Month) 2.98Day Energy (Fils/kWh) 75.81Night Energy (Fils/kWh) 65.76B- EDCO *
Peak Load (JD/kW/ Month) 2.98Day Energy (Fils/kWh) 76.62Night Energy (Fils/kWh) 66.55C- IDECO
Peak Load (JD/kW/ Month) 2.98Day Energy (Fils/kWh) 66.34Night Energy (Fils/kWh) 56.29D- Large Industries
1- Mining & Quarrying Industry
Peak Load (JD/kW/ Month) 2.98Day Energy (Fils/kWh) 264Night Energy (Fils/kWh) 1972- Others
Peak Load (JD/kW/ Month) 2.98Day Energy (Fils/kWh) 133Night Energy (Fils/kWh) 109
2. Retail Tariff
A- Household (Fils/kWh)
First Block : from 1-160 kWh/Month 33Second Block : from 161-300 kWh/Month 72Third Block : from 301-500 kWh/Month 86Fourth Block : from 501-600 kWh/Month 114Fifth Block : from 601-750 kWh/Month 158Sixth Block : from 751-1000 kWh/Month 188Seventh Block : more than 1000 kWh/Month 265
B- Domestic (Fils/kWh)
First Block : from 1-160 kWh/Month 42
Second Block : from 161-300 kWh/Month 92Third Block : from 301-500 kWh/Month 109Fourth Block : from 501-600 kWh/Month 145Fifth Block : from 601-750 kWh/Month 169
Sixth Block : from 751-1000 kWh/Month 190Seventh Block : more than 1000 kWh/Month 266C- Flat Rate Tariff for TV & Broadcasting Stations 173D- Commercial Sector (Fils/kWh)
First Block : from 1-2000 kWh/Month 129Second Block : more than 2000 kWh/Month 181E- Flat Rate Tariff for Banking Sector (Fils/kWh) 285F- Telecommunication Sector (Fils/kWh)
First Block : from 1-2000 kWh/Month 257Second Block : more than 2000 kWh/Month 300G- Small Industries (Fils/kWh)
First Block : from 1-10000 kWh/Month 71Second Block : more than 10000 kWh/Month 81H- Medium Industries (Fils/kWh)
Peak Load (JD/kW/ Month) 3.79Day Energy (Fils/kWh) 89Night Energy (Fils/kWh) 75I- Flat Rate Tariff for Agriculture (Fils/kWh) 60J- Agriculture (Fils/kWh)**
Peak Load (JD/kW/ Month) 3.79Day Energy (Fils/kWh) 59Night Energy (Fils/kWh) 49K- Flat Rate Tariff for Water Pumping (Fils/kWh) 94L- Flat Rate Tariff for Hotels (Fils/kWh) 181M- Hotels (Fils/kWh)***
Peak Load (JD/kW/ Month) 3.79Day Energy (Fils/kWh) 164Night Energy (Fils/kWh) 145N- Streets Lighting (Fils/kWh) 114O- Army Forces (Fils/kWh) 146P- Port Corporation (Fils/kWh) 159
Q- Agriculture / Commercial (Fils/kWh)60
129Notice Monthly Minimum ChargeA- Domestic (JD/Month) 1.0
B- Other Consumers (JD/Month 1.25
* From 1/6/2015** The three part tariff will applied compulsory on agricultural consumers whose connected to the network from
14/3/2008 and maximum load exceeding 100kVA *** The medium industrial tariff will applied on hotels sector from 1/5/2015
Table (16): Electricity Tariff in Jordan (from 16/2/2015)

2014
22
National Electric Power Co.
Annual Report
NEPCO’s Achievements and Performance Indicators:1- NEPCO’s Statistical Data1- 1 Significant Statistics and Performance Indicators The NEPCO’s statistical indicators in the year 2014 showed an increase in the transforming capacity of the main substations as well as in the lengths of the national grid. In this regard, NEPCO constructed new substations, expanded existing substa-tions, and implemented new transmission lines in order to face the rising demand for electricity in Jordan. Furthermore, the NEPCO’s technical performance indicators showed a reduction in the electrical loss percentage across the national transmission grid.
Table (17): NEPCO’s Significant Figures
2013 2014 ( % )Peak load for Interconnected System (MW) Generated 3100 3020 (2.6)
Sent-out 2975 2900 (2.5)
Available Capacity for Interconnected System (MW)Generated 3314 4165 25.7 Sent-out 3186 4000 25.5
Purchased Electrical energy (GWh) 16719 17691 5.8 Sold Electrical Energy (GWh) 16372 17370 6.1 Transmission Losses (%) 2.08 1.81 --National Grid Transmission Lines 132 kV and above (Km-Circuit) 4463 4520 1.3 Substations Installed Capacities 132/33kV (MVA) 7444 7865 5.7 Substations Installed Capacities 400/132/33kV (MVA) 3760 3760 --No. of Employees 1373 1410 2.7 NEPCO’s Fixed Assets (Million JD) 532 533 0.2
Table (18): NEPCO’s Performance Indicators
2013 2014 ( % )1. Manpower Indicators
Annual Productivity (GWh Sold/Employee) 11.9 12.3 3.4Transforming Installed Capacity (MVA/Employee) 8.4 8.5 1.2
2. Financial IndicatorTotal Cost of kWh sold (Fils/kWh) sold 137.86 149.14 8.2Cost of Energy Purchased (Fils/kWh) sold 127.40 139.59 9.6Other Costs (Fils/kWh) sold 10.46 9.55 (8.7)Revenues (Fils/kWh) sold 71.25 80.11 12.4Current Ratio (Times) 0.12 0.09 (25.0)Net Profit (Loss) Ratio (%) (83.96) (78.69) (6.3)Total Debt to Total Assets Ratio (%) 214.1 231.8 8.3
3. Technical IndicatorTransmission Losses (%) 2.08 1.81 --Availability of National Transmission Grid (%) 99.36 99.67 --Number of Interruptions 37 40 8.1Unsupplied Energy (MWh) 696 1703 144.7Average Interruption Duration (Min/ Interruption) 14 28 100.0Average Unsupplied Energy (MWh/ Interruption) 19 43 126.3Interruption Duration (Min) 480 1112 131.7

23
National Electric Power Co.
2014Annual Report
1 -2 Electrical Energy PurchasesTable (19): NEPCO’s Electric Power Purchases (GWh)
2011 2012 2013 2014 ( % )A- CEGCO 7561.4 7306.0 6910.1 7497.6 8.5B-SEPGCO 3503.7 4490.2 4426.2 4407.8 (0.4)C- AES Jordan PSC (IPP1) 2222.8 1561.3 2590.6 1945.7 (24.9)D- QEPCO (IPP2) 437.3 2311.7 2396.5 1483.9 (38.1)E-AAEPCO (IPP3) -- -- -- 1127.9 --F-AES Levant (IPP4) -- -- -- 774.0 --E-Others 1751.9 800.7 395.1 453.6 14.8King Talal Dam 13.1 16.1 13.4 16.6 23.9Indo-Jordan Chemicals Co. 0.7 0.3 0.6 2.1 250.0Imported Energy from Egypt 1457.6 784.3 381.1 434.9 14.1Imported Energy from Syria 280.5 -- -- -- --Total Energy Purchased 15477.1 16469.9 16718.5 17690.5 5.8
1- 3 Electrical Energy SalesTable (20): NEPCO’s Electrical Energy Sales (GWh)
2011 2012 2013 2014 ( % )A. Distribution Companies 14260.7 15113.1 15445.2 16304.9 5.6
JEPCO 9217.5 9813.3 9871.0 10304.5 4.4EDCO 2666.7 2845.8 2979.3 3160.0 6.1IDECO 2376.5 2454.0 2594.9 2840.4 9.5
B. Large Consumers 785.5 906.3 868.4 1000.8 15.2Refinery Co. 37.7 40.0 51.1 37.2 (27.2)Jordan Cement Co./Al Fuhies Plant 145.2 122.0 49.8 23.6 (52.6)Jordan Cement Co./Al Rashadiyeh Plant 47.9 41.7 98.3 125.1 27.3Al-Rajhi Cement Co. 17.8 169.2 122.4 138.5 13.2Al-Hadeetha Cement Co. 0.1 34.6 86.0 111.3 29.4Qatranna Cement Co. -- -- 63.8 88.7 39.0Potash Co. 380.2 334.4 253.2 284.5 12.4El-Hasa Phosphate Co. 50.6 42.4 43.2 39.6 (8.3)Sheidiyah Phosphate Co. 43.5 45.3 29.1 18.0 (38.1)QAIA 61.9 76.2 69.7 66.8 (4.2)Indo-Jordan Fertilizer Co. -- -- 1.6 60.5 3681.3Haraneh (New Broadcasting) 0.6 0.5 0.2 0.8 300.0AAEPCO (IPP3) -- -- -- 5.0 --AES Levant (IPP4) -- -- -- 1.2 --
C. Exported Energy 85.6 103.5 58.6 63.8 8.9Egypt 4.2 14.5 10.8 22.8 111.1Jerusalem Co. (Jericho) 75.7 82.3 41.4 34.3 (17.1)Iraqi Border (Trabeel) 5.7 6.7 6.4 6.7 4.7
D. Other 0.1 0.1 0.2 0.2 --Total 15131.9 16123.0 16372.4 17369.7 6.1

2014
24
National Electric Power Co.
Annual Report
2- NEPCO’s Projects In 2014, NEPCO was able to accomplish many projects which all aim at enhancing and developing the national grid, in addition to starting the execution of some other projects which shall be completed in the coming years. The company’s projects can be briefed as follows:-
First) Substations Projects:- A) 400 kV Substations Projects:-• Construction of Amman – East 400 kV Substation Project (IPP3) by adding twelve 400 kV transformer bays. The total
cost of the project is about (13.7) million JD. The project was electrified on 17/5/2014.• Construction of Amman – West 400 kV Substation Project by adding two 400 kV transformers with the capacity of
(800) MVA, nine 400 kV transformer bays and eleven 132 kV transformer bays. It is expected to complete the electrifi-cation of the project in the year 2015.
B) 132 kV Substations Projects:-Table (21): Projects of Expanding Existing Substations
SubstationAdded Capacity
(MVA)Operation Date
Al-Hashimiah 132/33 kV S/S 1x45 First Quarter / 2014Al-Qweirah 132/33 kV S/S 2x80 First Quarter / 2014Amman - East (IPP4) 132 kV S/S -- Second Quarter / 2014Al-Samra 132/33 kV S/S -- Fourth Quarter / 2014Ma›an 132/33 kV S/S 2x45 Fourth Quarter / 2014Al-Rashadiyeh 132/33 kV S/S 1x45 Fourth Quarter / 2014
Table (22): Projects of Constructing New Substations
Substation Capacity (MVA) Operation Date
New Karak 132/33 kV S/S 2x63 Fourth Quarter / 2014
Tafileh 132/33 kV S/S - First Quarter / 2015
Al-Hizam 132/33 kV S/S 3x80 Second Quarter / 2015
New Bayader 132/33 kV S/S 3x80 Second Quarter / 2015
Ma›an 132/33 kV S/S / Solar 3x80 Second Quarter / 2015
Al-Hussein S/S / Wind 2x80 Fourth Quarter / 2015
Al-Qweirah S/S / Solar 2x80 First Quarter / 2016
Table (23): Main Substations Installed Capacity (MVA):
Year 400/132/33 kV 230/132 kV 132/33 kV 132/6 kV 132/11 kV
2011 3760 100 6263 155 25
2012 3760 100 6909 155 25
2013 3760 100 7444 155 25
2014 3760 100 7865 155 25

25
National Electric Power Co.
2014Annual Report
Second) 400, 132 kV Transmission Lines Projects:-Table (24): The Completed and Under-construction Projects
Project Circuit kVLength of the
Added line (Km.Circuit)
Completion Date
Connection of Al-Fujaije wind plant Quadratic Circuit 132 7.2 Second Quarter / 2014
Connection of (Amman South – Al-Bayader) – (Al-Salt - Al-Fuheis line) Quadratic Circuit 132 7 Second Quarter / 2014
Connection of Tafileh Wind Plant Double Circuit 132 1.6 First Quarter / 2015Connection of Al-Hussein University Wind Plant Double Circuit 132 5 First Quarter / 2015Connection of Ma›an Solar Plant Double Circuit 132 2 First Quarter / 2015Connection of Al-Qweirah Solar Plant Double Circuit 132 3.7 First Quarter / 2015Connection of New Zarqa Substation Double Circuit 132 0.7 Second Quarter / 2015Connection of Al-Hizam Plant S/S Quadratic Circuit 132 0.82 Second Quarter / 2015Connection of Al-Qatranah Plant with Amman West Plant Double Circuit 400 100 --Connection of Amman West Plant with Al-Samra Plant Double Circuit 400 72 --
Table (25): Transmission Line Length (km - Circuit)
Year 400 kV 230 kV132 kV
66 kV*Overhead Lines Underground Cables
2011 904 17 3103 97 17
2012 904 17 3184 97 17
2013 924 17 3425 97 17
2014 924 17 3482 97 17
* Converted to Work on 33 kV
2014
26
National Electric Power Co.
Annual Report
Third) The Telecommunication Projects:-NEPCO implemented many communication projects during the year 2014, the most significant projects are the following:• Preparing the technical specifications required for issuing a tender for telephone switchboards to be used in NEPCO’s
different sites in addition to supporting the current system.• Preparing the technical specifications required for issuing a tender for the transmitted Optical Fibres (SDH-STM-16)
in order to use it in the new substations and the company’s other sites in addition to supporting the current system. • Installing communication equipment: Digital Carrier (OPD-1) and (SDH-TEJAS-STM-16) at the new Al-Karak substation
so as to use them within the private communication network related to the substations. • Installing the communication equipment (SDH-SAGEM-STM-16) at the in Al-Hizam new substation so as to use them
within the communication network related to the substations. • Installing power supply equipment with direct voltage (VDC 48) in addition to interconnecting the control and pro-
tection channels and the metering equipment of the new substations at: The New Al-Karak and Al-Hizam. • Installing communication equipment (Digital Carrier OPU) at Rehab, Irbid and Irbid-East substations in order to
strengthen the control system and the interchangeable protection with the new channels.• Connecting channels for the metering system in each of Al-Disi, Al-Dhlail, Al- Muwaqar industrial, Al-Muwaqar and
the broadcasting substations.• Preparing a general maintenance plan for all communication equipment in all substations as well as preparing to
perform data bank for all the systems of the communication equipment in all the sites of the company.• Following up the maintenance works for the fibre optic network related to the official Jordan universities such as
Al-Balqa (Al-Salt), Mua’tah, Al-Hussein, Al-Bayt, universities in addition to the fibre optic network related to schools network (Ministry of Communication).
• Providing communication services to Electricity Distribution Company through a link between Al-University substa-tion and Al-Disi site, and other link between Al-Disi site and (A2) substation.
• Activating the fibre optic cable related to the Ministry of communication, and following up the maintenance of the equipment belonging to this Ministry in different substations.

27
National Electric Power Co.
2014Annual Report
Fourth) The Electrical Interconnection Projects:-Table (26): Electrical Interconnection Projects
Project Project Status
Technical Specifications Total Electrical Energy Exchange During the Year 2014 (Gwh) Voltage
(kV)Length
(km)Capacity
(MW)The Eigth Electrical Interconnection:- Imported ExportedThe Jordanian-Egyptian Electrical Intercon-nection (Sub-marine cable) Existing 400 13 550 Jordan 435 23The Jordanian-Syrian Electrical Interconnection Existing 400 147 (300-800) -- --The Egyptian-Syrian Electrical Interconnec-tion (Across the Jordanian network) Existing 400 - (250-300) -- --
The Syrian-Lebanese Electrical Interconnection Existing 400 43 (150-300) -- --The Egyptian-Libyan Electrical Interconnection Existing 220 163 (170-500) Libyan (1) 64 0.5The Syrian-Turkish Electrical Interconnection Isolated 400 124 500 -- --The Iraqi-Turkish Electrical Interconnection Isolated 400 * 28 408 -- --The Syrian-Iraqi Electrical Interconnection Stopped 400 165 300 -- --The Jordanian-Palestinian Electrical Inter-connection (JERICO) Existing 132** 30 20 Palestinian 34 --
The Jordanian-Palestinian Electrical Inter-connection (West Bank) Planned 400 101 -- --
The Egyptian-Palestinian Electrical Inter-connection (Gaza) Planned 220 70 (70-150) -- --
Pan Arab Electrical Interconnection:- Existing -- --
The Saudi-Egyptian Electrical Interconnection Under con-struction 500
1370 HVDC +
25 SubmarineCable
3000 -- --
The Jordanian-Saudi Electrical Interconnection Planned 400 127 - -- --* It operates at 154 kV ** It operates at 33 kV (1) 2013 Data
Table (27): Projects of New Interconnection Lines and enhancement of existing lines
ProjectCommencement
of the Project Implementation
Operation Date Voltage (kV)
Grid Length
(km)Enhancing single circuit interconnection line / Tunis – Libya 2015 2020 400 280Enhancing single circuit interconnection line / Egypt – Libya 2015 2019 500 165Enhancing double circuit interconnection line / Egypt – Sudan 2015 2025 500 775Constructing double circuit interconnection line / Saudi Arabia – Jordan 2015 2020 400 127Constructing a DC interconnection line / Egypt - Saudi Arabia 2015 2020 500 1370
JORDAN
K.S.A
LEBANON
PALESTINE
ETHIOPIA
TURKEYSYRIAITALYSPAIN
IRAQ
EGYPT
ALGERIAMOROCCO
SUDAN
KUWAIT BAHRAIN
QATARU.A .E
OMAN
YAMENJIBOUTI
CONGO
LIBYA
TUNISIA

2014
28
National Electric Power Co.
Annual Report

29
National Electric Power Co.
2014Annual Report
3- NEPCO’s Duties and Activities:First) Operation of the Jordanian Electric Power System:-• NEPCO, through its National Control Centre, manages and operates the electrical power system in Jordan through
implementing the daily operation activities in accordance with the power system requirements aiming at providing electricity for all consumers with the best specifications and international standards as well as a possible lowest cost by utilizing the available energy resources.
• Among the most essential procedures taken by NEPCO in this context are:• Maintaining the continuity of the electrical power supply along with the safety and security of the electrical system
itself as well as its staff. • Working continuously throughout the day’s hours to reduce the cost of purchasing the electrical energy by following
an appropriate operational mode in all circumstances. • Utilizing the electrical interconnection lines with the neighbouring countries in an optimal way in order to reduce the
cost of energy production. • Monitoring and controlling the power system frequency to be in accordance with the technical standards related to
the national transmission grid. • The electrical power system in Jordan consists of the main generating stations, transmission networks of 400, 132 kV
which interconnect these stations with the load centres in the kingdom, in addition to the 400 kV interconnection line with Syria and the 400 kV submarine cable which connects the Jordanian network with the Egyptian network as well as the national control centre and distribution networks which provide electricity to about (99.9%) of the population.
• The electricity power system in Jordan includes also some private power stations which could be synchronized with the rest of power stations in the interconnected power system, while other private power stations serve their owners only and they are not connected to the interconnected power system.
Second) Planning Studies:-A) Forecast of Electrical Energy and Peak Loads:
• NEPCO updated in 2014 the study of the demand for electrical energy for the period (2014-2040), taking into consid-eration the technical developments and economical variables which affect the electrical energy demand especially the growth rates of the Gross Domestic Product (GDP), whereas the GDP growth rate in the year 2014 amounted to (3.1%) in fixed costs against (2.8%) in the year 2013.
• The peak load in the kingdom amounted to (2930) MW in 2014 compared with (2995) MW in December 2013 repre-senting a negative annual growth of (2.2%), while the peak load of the electric power system amounted to (2900) MW in December 2014 against (2975) MW in December 2013 with a percent reduction amounted to about (2.5%).
• The average annual growth rate of the power system peak load for the last five years was about (5.6%), while it is ex-pected that the electrical loads will grow annually by a percentage of (6.0%) to (6.5%) during the period (2015-2030) as denoted in the demand forecast study.
• The average annual growth rate of the electrical energy generated in the kingdom for the last five years was about (5.1%), while it was about (5.2%) for the consumed electrical energy for the same period. As for the production of the electrical energy in the kingdom in the future years is expected to grow annually by a percentage of (6.7%) for the pe-riod (2015-2030) which is supposed to face the expected increase of the electricity demand in the coming years which is based on various variables such as the expected growth rate of population, and economy as well as consumption patterns of the electrical energy.

2014
30
National Electric Power Co.
Annual Report
Table (28): System Peak Loads (MW)
Year Interconnected System* Interconnections IndustrialSector
All JordanGenerated** Sent-out Imported Exported Generated** Sent-out
2011 2770 2660 49 -- 20 2790 2680 2012 2880 2770 -- 40 20 2900 27902013 3100 2975 -- 18 20 3120 29952014 3020 2900 29 -- 30 3050 2930
* Included the imported loads from Interconnected Lines.**(4.1% x Exported Load) (2013,2014) Winter Load/December
Table (29): Electricity Demand Forecast in the Interconnected System
YearMax. Demand* Electrical Energy Generated
MW Growth (%) GWh Growth (%)
2015 3200 6.2 18600 4.02016 3390 5.9 19640 5.62017 3596 6.1 20800 5.92018 3810 6.0 22090 6.22019 4045 6.2 23510 6.42020 4300 6.3 25060 6.62030 8130 6.6 49290 7.0
* Summer Loads.
B) Implemented and Under Construction Generation Projects:The company prepared a generation expansion plan for the period (2014-2040) to secure the generating capacity required for facing the expected demand for the electrical energy and securing a safe operation of the electric power system taking into consideration the utilization of fuel local resources especially the oil shale and nuclear energy in addition to the renew-able energy resources. The following projects are scheduled in this expansion plan: • The Third Independent Power Generation Project (IPP3):This project consists of constructing a generating station in Amman – East area on the basis of Build, Own and Operate (B.O.O) with a total capacity of (573) MW. This station burns heavy fuel oil as a base fuel and diesel oil and natural gas when available as an alternative fuel. This project was implemented by a consortium of a Korean Company (KEPCO), Japanese Company (Mitsubishi) and a Finnish Company (Wartsila). This project was completed and commenced generating electric-ity in October/2014.• The Fourth Independent Power Generation Project (IPP4):This project consists of constructing a generating station in Amman – East area on the basis of Build, Own and Operate System (B.O.O) with a total capacity of (241) MW. This station burns heavy fuel oil as a base fuel and diesel oil and natural gas when available as an alternative fuel. This project was implemented by a consortium of an American Company (AES) and Japanese Company (Mitsue). This project was commenced officially in July/2014.• Construction Project of an Electrical Energy Generating Station by Utilizing the Technology of Direct Burning
the Oil Shale in El- Atarat Area in Jordan: The Jordanian Government represented by the Ministry of Energy and Mineral Resources and El- Atarat Energy Company (EPCO) which is owned by the Estonian Company (ENEFIT) have signed an agreement of constructing a first electricity gen-erating station burning oil shale with a total capacity of (450) MW. This project consists of two steam units utilizing the technology of direct burning oil shale fuel (FCB) with a generating

31
National Electric Power Co.
2014Annual Report
capacity of about (235) MW for each. The project will be operated in two stages: the first stage will be during the second half of the year 2018, and the second stage will be during the first half of the year 2019. • Construction Project of an Electrical Energy Generating Station by Utilizing the Technology of Direct Burning
the Oil Shale in El-Lajjun Area in Jordan: This project consists of constructing an electricity generating station in El-Lajjun area with a capacity of (600) MW with a possible future expansion. This station works by the technology of direct burning the oil shale. It is expected to operate the project as planned during the first half of the year 2019. • Project of Constructing the First Nuclear Plant in Jordan: The Jordanian government approved the agreement of constructing and developing the Jordanian nuclear plant with the Russian Company (Atom Stroy Export). The Russian technology for constructing this station was chosen based on technical, financial and economical bases which were considered the best choice for implementing such a station. This project will be implemented in two stages: the first stage extends to two years and it includes conducting the site detailed studies, studying the construction of the necessary utilities for the plant such as cooling water, transmission grid in addition to the plant cost, cost of electricity production and selling price to the national grid. The second stage includes signing the agreement and commencing the project implementation and construction. The project consists of two main nuclear reactors of (1000) MW each. It is expected to operate the first reactor in 2023 and the second reactor in 2025.
C) Projects of Renewable Energy: • The regional and international interest in developing and using various kinds of alternative energy resources forced
Jordan to seek for utilizing the local renewable energy resources especially solar and wind energy as they are consid-ered one of the most important alternatives exposed to face the energy crisis in Jordan especially when the case is related to the solar energy utilization as Jordan enjoys a high percentage of sun radiation since it is considered one of the Sunbelt countries.
• In this context, the year 2014 witnessed signing several agreements for constructing power generation projects by uti-lizing the renewable energy resources that may support the generating capacity in Jordan with about (200) MW (Table No. 30). Furthermore, the share of the renewable energy projects in the generated energy mix in Jordan is expected to be about (10%) in the year 2020 as denoted in the Comprehensive National Strategy of the energy sector.
Table (30): Future Expansion Projects of the Generating Capacity
Project/StationCapacity
(MW)Expected Date of the addition
Al-Samra Electric Power Generation Company / Stage 3 140 First Quarter / 2015
Al-Samrah Electric Power Generation Company / Stage 4 75 First Quarter / 2018
Oil Shale Project I 235 December / 2018
Oil Shale Project II 235 April / 2019
Al-Fujaije wind Project 90 2015
Al-Tafileh Wind Project 117 May / 2015
Solar energy Projects (Direct offers) / Ma’an Development 200 Fourth Quarter / 2015
Al-Hussein University Wind Project 65 Fourth Quarter / 2015
Al-Qweirah Solar Project 70 Fourth Quarter / 2015
Al-Rajef Wind Project 83 Second Half / 2017
Wind Project Xnel + Kospo / Tafilah 100 Second Half / 2017

2014
32
National Electric Power Co.
Annual Report
Third) The Technical and Administrative Supporting Services:-
A) Quality and Public Safety• NEPCO took various procedures which aim to develop the work, improve performance and determine conditions of
public safety, occupational health and environment. • In the field of quality and technical audit, NEPCO follows up the actual work progress of its all projects and annual
maintenance program application to secure the projects implementation in line with the time schedule, technical specifications, and required conditions in order to clarify the divergences if any, and to tackling them in suitable means in coordination with the concerned technical departments, so as to attain continuously the scheme of the technical audit as it is a supervisory, directive and improving performance tool for all NEPCO’s activities.
• As for the field of public safety, occupational health and environment, NEPCO continued its efforts to secure higher possible safety for its staff and customers and equipment safety through the awareness and education of its staff by taking the necessary procedures to commit with the laws, public safety and environment instructions.
• This can be achieved by making rounds to all sites of the company, preparing an emergency plan for the company and updating it continuously, assuring the availability of public safety and extinguishing equipment and personal protection equipment for the staff in compliance with the international standards. Moreover, it is necessary to con-ducting the required studies for detecting the reasons of accidents and work injuries to avoid them in the future, in or-der to improve the preventive awareness level of NEPCO’s employees in fields of public safety aspects and protection from accidents by adopting all available means including awareness and educative films prepared for this purpose.
• NEPCO formed and applied the quality management system in accordance with the requirements of (ISO). So, the com-pany achieved a certificate of the quality management system ISO9001 from the Granting International Organization SGS. Therefore, NEPCO is considered the first one of the electricity sector companies, on the national level, that was able to develop all the activities and procedures to comply with the last issue of the ISO specifications ISO9001:2008. Additionally, the quality and public safety department is currently working to adopt the environmental management system ISO14001, occupational health and safety management OHSAS 18001. The quality and public safety depart-ment is also working on automation of the quality management system and computerizing the documents definition and internal audit in cooperation with data and programs department in order to ease the work procedures.
B) Electric Training Centre The electric training centre was established in the year 1986, it includes various laboratories and workshops in addition to training squares. Objectives of the Centre:• Prequalification the new technical cadres of NEPCO, local corporations and companies. • Training technical staff (Efficiency upgrading courses) of NEPCO, local corporations and companies. • Training students of local and external universities and institutions.• Training technical cadres in Sisterly Arab states and the other friendly states.• Maintaining and manufacturing spare parts for devices and equipments used in the company.
Fields of Training Programs:• Operation and maintenance of the generating stations.• Programmed Logic Control PLC and SCADA system. • Design, installation, operation, maintenance, testing transmission networks• Design, installation, operation, maintenance, testing distribution networks, consumer›s services and Metering testing.• Testing and checking the domestic electrical installations.• Operating, testing and calibrating the electrical protection systems.

33
National Electric Power Co.
2014Annual Report
The number of Trainees benefited from the activities of the Electric Training Centre during the year 2014
Program Name No. Of Participants
Long-term training program (regular) 41
Short-term local and internal training programs 103
Private training programs for universities 489
External training programs in cooperation with JICA 139
External training programs in cooperation with Local corporations 433
C) International Services and InvestmentTo achieve the company’s objectives extracted from its mission which aim at the investing the infrastructure of the elec-tric transmission grid and utilizing the technical ability and practical experience of the company’s staff in various techni-cal fields and administrative, financial and computer consultancies on local, regional and international levels, NEPCO through its International services and investment department have executed various services, consultancies and training courses inside and outside Jordan. Out of the most prominent accomplishments are the following:
Inside Jordan• Leasing a number of NEPCO’s dark optical fibre filaments to local companies and governmental entities. • Providing engineering and consultancy services in fields of technical, administrative, financial and computer fields
for a number of local corporations and companies as well as for sisterly electricity companies. • Implementing training courses in NEPCO’s electric training centre on behalf of a number of corporations, industrial
companies, electricity companies and universities students in the kingdom.• Implementing works of testing and refining transformers oil on behalf of local companies and sisterly electricity
companies. • Completing the regular training for group No. (16) which includes (77) trainees on behalf of Electricity Distribution
Company. • Leasing strands of optical fibre network related to NEPCO on behalf of Electricity Distribution Company (EDCO) in
order to connect Al-Disi plant with EDCO’s main offices in Khalda. • Implementing the project of expanding the airport substation branch (QL-2) on behalf of the International airport
group.• Implementing a number of training programs on behalf of Libyan and Oman cadres of which: Installation and main-
tenance of low and medium voltage conductors in the distribution networks, as well as the maintenance programs for the network and electro-mechanical equipment. In this regard, (25) programs were implemented for (329) train-ees.
Outside Jordan• Work continues in the agreement of the consultancy services and engineering works included in the project of
SAFER – MAREB 400/132 kV substations and 132 kV transmission line of the length (50) km on behalf of the Yemeni Public Electricity Corporation. This agreement was extended to July 2015.
• Signing a Memorandum of Understanding with the Palestinian National Electricity Transmission Company concern-ing with the combined cooperation in the fields of technical consultancy, operation, maintenance, training and del-egating experts.
• Work continues in analysing the technical and financial offers submitted by the tendering companies in regard of expanding Ma’areb substation of 400 kV on behalf of the Public Electricity Corporation of Yemen.
• Signing a Memorandum of Understanding for implementing eleven training programs on behalf of cadres from Ministry of Electricity in Iraq and in Kurdistan region in cooperation with Japanese International Agency Cooperation (JICA) through the third country training program in both technical and administrative fields. The total number of trainees was (127) trainees in the year 2014.

2014
34
National Electric Power Co.
Annual Report
• Work continues within the memorandum of understanding signed with the Japanese International Agency for co-operation (JICA) on implementing technical and administrative training programs within the third country training program on behalf of cadres from electricity distribution companies subordinated to the Palestinian Authority for energy.
• The total number of trainees was (56) trainee in the year 2013, moreover six training programs were held for (84) trainees in the year 2014.
• Work continues within the memorandum of understanding signed with the Japanese International Agency for co-operation on implementing technical and administrative training programs within the third country training pro-gram on behalf of the Public Electricity Corporation of Yemen. Therefore, six training programs were implemented or held for (69) trainees in the year 2014.
• Implementing a two week training program titled “Domestic Joints Installation” for (6) trainees from the Qatar Gen-eral Electricity & Water Corporation “KAHRAMAA” which was held in the electric training centre.
• A secondment of an electrical engineer to the Standards (Magayeece) Consulting House for engineering in the Kingdom of Saudi Arabia was extended so that the engineer will continue to work as a consultant up to May 2015.
D) Man Power and Training • At the end of the year 2014, the number of NEPCOs employees was (1410) employee, of which the engineers con-
stituted (21.1%), the technicians constituted (35.2%), the financers (6.1%), the administrators (17.3%) and the sup-porting services constituted (20.3%).
• The training has an active and big role in developing the individuals and increasing their productivity as it provides them with the information that helps them in achieving their goals and improves their skills and capacities. Moreo-ver, it has a main role in adjusting their behaviour and trends towards the employees. This can be related to what was learnt by the individual himself from information and thoughts that could change his behaviour towards the best. Accordingly, his capacities and actual skills might be realized in certain positions.
• As for the field of improving skills and building capacities of the employees at their different administrative levels, the Human Resources Department through its Management Development and Training Section made strenuous efforts in upgrading the efficiency of the employees.
• In this regard, various training programs were carried out especially those training courses which were held for employees in a collectively form in order to achieve a bigger benefit in the light of the limited training allocations in the company’s budget which are considered low when compared with other companies.
• Furthermore, many employees were delegated in training courses or in official business outside Jordan. This has been reflected positively on the development of employees’ skills and their knowledge at all administrative levels and for all employees’ categories.
• In the field of the community service in which the company contributes, training opportunities for students of universities and institutions in different specialists were made available. Accordingly, (220) students were trained at field and in summer training together with the students of the electrical engineering,
• Furthermore, the field was opened to newly graduated engineers to be involved in the labour market. In this scope, (70) engineers were trained within the engineers training program in cooperation with the Jordanian Engineers As-sociation and Ministry of Public Works and Housing, in addition to training one student from Tunis and one student from Poland within the training program for the foreign students through Al AISTA Organization.

35
National Electric Power Co.
2014Annual Report
4) Financial Performance:-
Fig (5) Total Revenues 2014 (1411.5) Million
Fig (6) Total Expenses 2014 (2585.4) Million
Sale of Energy Revenues 98.60%
Previous Years Settlements of Account
0.09% Other Revenues
1.03%
Gains on Foreign Currency Differences,
Net 0.28%
Purchase of Energy 93.78%
Depreciation 1.02%
Maintenance Expenses 0.09%
Administrative and Operating Expenses
1.09% Financce Cost
4.02%
Other Expenses 0.01%
Total Expenses 2014

2014
36
National Electric Power Co.
Annual Report
National Grid in Jordan's Power System

37
National Electric Power Co.
2014Annual Report
Financial Statements
National Electric Power CompanyThe Hashemite Kingdom of Jordan
NEPCO

2014
38
National Electric Power Co.
Annual Report
Report on Financial Statements
We have audited the accompanying financial statements of National Electric Power Company (Public Shareholding Company), which comprise the statement of financial position as at December 31, 2014, and the statement of comprehensive income, statement of changes in equity and statement of cash flows for the year then ended, and a summary of significant accounting policies and other explanatory information.
Management’s Responsibility for the Financial StatementsManagement is responsible for the preparation and fair presentation of these financial statements in accordance with International Financial Reporting Standards, and for such internal control as management determines is necessary to enable the preparation of financial statements that are free from material misstatement, whether due to fraud or error.
Auditor’s ResponsibilityOur responsibility is to express an opinion on these financial statements based on our audit. We conducted our audit in accordance with International Standards on Auditing. Those standards require that we comply with ethical requirements and plan and perform the audit to obtain reasonable assurance whether the financial statements are free from material misstatement.An audit involves performing procedures to obtain audit evidence about the amounts and disclosures in the financial statements. The procedures selected depend on the auditor›s judgment, including the assessment of the risks of material misstatement of the financial statements, whether due to fraud or error. In making those risk assessments, the auditor considers internal control relevant to the entity›s preparation and fair presentation of the financial statements in order to design audit procedures that are appropriate in the circumstances, but not for the purpose of expressing an opinion on the effectiveness of the entity›s internal control. An audit also includes evaluating the appropriateness of accounting policies used and the reasonableness of accounting estimates made by management, as well as evaluating the overall presentation of the financial statements.We believe that the audit evidence we have obtained is sufficient and appropriate to provide a basis for our audit opinion.
OpinionIn our opinion, the financial statements present fairly, in all material respects, the financial position of National Electric Power Company (Public Shareholding Company) as at December 31, 2014, and its financial performance and its cash flows for the year then ended in accordance with International Financial Reporting Standards.
Emphasis of a MatterWithout qualifying our opinion, the Company’s accumulated losses reached nearly 20 times its subscribed capital. According to Companies Law No. 22 for year 1997, the court may decide to compulsory liquidate if accumulated losses of a public shareholding company exceeded 75% of its capital unless the General Assembly decides to increase its capital.
Legal RequirementsThe Company maintains proper accounting records, and the audited financial statements and the financial information stated in the report of the board of directors are in agreement with those records, and we recommend the general assembly to approve them.
Talal Abu-Ghazaleh & Co. International
Aziz Abdelkader(License # 867)
Amman, April 21, 2015

39
National Electric Power Co.
2014Annual Report
Statement of financial position as at December 31, 2014
ASSETSNotes 2014 2013
JD JD
Non-current Assets
Property, plant and equipment, net 3 465,495,325 460,753,830
Subscribers› contributions assets, net 3 67,681,584 71,611,884
Investment in subsidiaries 4 100,000 100,000 Investment in financial assets at fair valuethrough other comprehensive income 5 1,681,284 1,834,325
Company›s contribution in employees› housing fund 6 2,518,060 2,237,060
Total Non-current Assets 537,476,253 536,537,099
Current Assets
Inventory 7 25,566,476 25,072,611
Other debit balances 8 10,553,984 12,499,620
Accounts receivable 9 345,726,942 311,421,432
Cash and cash equivalents 10 359,457 617,565
Total Current Assets 382,206,859 349,611,228
TOTAL ASSETS 919,683,112 886,148,327

2014
40
National Electric Power Co.
Annual Report
Statement of financial position as at December 31, 2014
EQUITY AND LIABILITIES Notes2014 2013
JD JDEquityCapital 230,000,000 230,000,000
Statutory reserve 6,384,000 6,384,000 Voluntary reserve 4,730,371 4,730,371 Special reserve 4,730,371 4,730,371 Treasury rights 11 22,006,775 22,260,282 Accumulated change in fair value of investment in financial assets at fair value through other comprehensive income 1,372,712 1,525,753
Accumulated losses (4,638,824,101) (3,459,560,494)Net Equity (4,369,599,872) (3,189,929,717)Non-current Liabilities
Subscribers› contributions, net 3 67,681,584 71,611,884 Loans - non-current portion 12 623,056,073 856,616,210 Bonds payable - non-current portion 13 300,000,000 300,000,000 Provision for end of service indemnity 14 6,897,349 6,435,255 Subscribers› contributions received on projects under construction 15 16,772,371 12,590,000
Deferred revenues 16 214,136 277,109 Total Non-current Liabilities 1,014,621,513 1,247,530,458 Current Liabilities
Income tax provision 17 3,971,473 3,971,473 Other credit balances 18 60,927,084 59,468,522 Accounts payable 19 3,394,548,929 1,972,354,510 loans - accrued portion 12 239,641,999 - Loans - current portion 12 548,411,637 541,748,949 Bonds payable - current portion 13 - 198,600,673 Banks overdrafts 20 27,160,349 52,403,459 Total Current Liabilities 4,274,661,471 2,828,547,586 Total Liabilities 5,289,282,984 4,076,078,044 TOTAL EQUITY AND LIABILITIES 919,683,112 886,148,327

41
National Electric Power Co.
2014Annual Report
Statement of comprehensive income for the year ended December 31, 2014
Notes2014 2013
JD JDOperating Revenues
Sale of energy revenues 21 1,391,489,583 1,166,516,359 Other energy revenues 52,343 708,957 Total Operating Revenues 1,391,541,926 1,167,225,316 Operating Expenses
Purchase of energy 22 2,424,676,883 2,085,890,234 Gas delivery cost to Al-Qatrana, Al-Samra stations, IPP3 and IPP4 5,076,807 -
Maintenance expenses 2,307,448 2,440,899 Administrative and operating expenses 23 28,110,001 31,513,253 Depreciation 26,320,694 26,790,053 Total Operating Expenses 2,486,491,833 2,146,634,439 Operating Loss (1,094,949,907) (979,409,123)Previous years settlements of accounts 24 1,312,240 1,424,549 Gains on foreign curency differences, net 3,890,629 548,100 Other revenues 25 14,522,605 2,009,165 Other expenses 26 (131,543) (161,046)Finance cost (103,907,631) (110,281,684)Loss (1,179,263,607) (1,085,870,039)Other Comprehensive Income
Change in fair value of investment in financial assets at fair value through other comprehensive income (153,041) (31,640)
Comprehensive Income (1,179,416,648) (1,085,901,679)Loss per share 27 (5/ 127) JD (4/721) JD

2014
42
National Electric Power Co.
Annual ReportSt
atem
ent o
f cha
nges
in e
quity
for t
he y
ear e
nded
Dec
embe
r 31,
201
4
Capi
tal
Stat
utor
y re
serve
Volun
tary
re
serve
Spec
ial
rese
rveTr
easu
ry
right
s
Accu
mula
ted
chan
ge in
fair v
alue o
f fin
ancia
las
sets
at fa
ir va
lue th
roug
hot
her
com
preh
ensiv
e inc
ome
Accu
mula
ted
losse
sTo
tal
JDJD
JDJD
JDJD
JDJD
Balan
ce as
at Ja
nuar
y 1,
2013
230,
000,
000
6,38
4,00
0 4,
730,
371
4,73
0,37
1 21
,517
,989
1,
557,
393
(2,3
73,6
90,4
55)
(2,1
04,7
70,3
31)
Com
preh
ensiv
e inc
ome
- -
- -
- (3
1,64
0)(1
,085
,870
,039
)(1
,085
,901
,679
)
Trea
suy r
ights
- -
- -
742,
293
- -
742,
293
Bala
nce
as a
t Dec
emer
31,
20
1323
0,00
0,00
0 6,
384,
000
4,73
0,37
1 4,
730,
371
22,2
60,2
82
1,52
5,75
3 (3
,459
,560
,494
)(3
,189
,929
,717
)
Com
preh
ensiv
e inc
ome
- -
- -
- (1
53,0
41)
(1,1
79,2
63,6
07)
(1,1
79,4
16,6
48)
Trea
suy r
ights
- -
- -
(253
,507
)-
- (2
53,5
07)
Bala
nce
as a
t Dec
emer
31,
20
1423
0,00
0,00
0 6,
384,
000
4,73
0,37
1 4,
730,
371
22,0
06,7
75
1,37
2,71
2 (4
,638
,824
,101
)(4
,369
,599
,872
)

43
National Electric Power Co.
2014Annual Report
Statement of cash flows for the year ended December 31, 2014
2014 2013JD JD
CASH FLOWS FROM OPERATING ACTIVITIESLoss (1,179,263,607) (1,085,870,039)Adjustments for :Depreciation 26,320,694 26,790,053 Impairment of slow moving inventory 683,267 325,954 Allowance for doubtful receivables 44,597 3,397,200 Recovery of allowance - (200,000)Gain on disposal of property, plant and equipment (15,998) (12,770)Provision for end of service indemnity 994,610 636,446 Previous years settlements of accounts (1,312,240) (1,424,549)Changes in operating assets and liabilities:Inventory (1,177,132) (598,650)Other debit balances 1,945,636 (8,479,171)Accounts receivable (34,350,107) (98,786,226)Provision for end of service indemnity (532,516) (626,144)Subscribers› contributions received on projects under construction 4,182,371 (9,423,601)Deferred revenues (62,973) 232,093 Other credit balances 1,458,562 22,932,745 Accounts payable 1,423,506,659 1,206,254,439 Net cash from operating activities 242,421,823 55,147,780 CASH FLOWS FROM INVESTING ACTIVITIESPurchase of property, plant and equipment (31,062,192) (21,843,998)Proceeds from sale of property, plant and equipment 16,001 12,822 Investment in subsidiaries - 50,000 Company›s contribution in employees› housing fund (281,000) (281,000)Net cash from investing activities (31,327,191) (22,062,176)CASH FLOWS FROM FINANCING ACTIVITIESTreasury rights (253,507) 742,293 Bonds payable (198,600,673) (194,300,000)Loans 12,744,550 157,522,255 Banks overdrafts (25,243,110) 3,237,804 Net cash from financing activities (211,352,740) (32,797,648)Net change in cash and cash equivalents (258,108) 287,956 Cash and cash equivalents - beginning of year 617,565 329,609 Cash and cash equivalents - end of year 359,457 617,565

2014
44
National Electric Power Co.
Annual Report
Notes to the financial statements
(1) Legal status and activity• National Electric Power Company was established
on August 29, 1996 and registered as a Public shareholding company under the number (316) pursuant to the Council of Ministers’ resolution to convert Jordan Electric Authority to a limited public shareholding company.
• Pursuant to the Council of Ministers’ decision in its meeting held on October 4, 1997 National Electric Power Company was restructured into three separate companies as of the beginning of January 1999, while maintaining electrical transmission and control, energy purchase and sale, and energy exchange with nearby countries within National Electric Power Company.
• The Company is wholly owned by the Government of Hashemite Kingdom of Jordan.
• The financial statements have been approved by the board of directors in its meeting held on April 21, 2015, and require approval of the Council of Prime Ministry.
(2) Basic for preparation of financial statements and significant accounting policies• FinancialstatementspreparationframeworkThe financial statements have been prepared in accordance with International Financial Reporting Standards.• Measurementbasesusedinpreparingthefinancial
statementsThe financial statements have been prepared on the historical cost basis except for measurement of certain items at bases other than historical cost. • FunctionalandpresentationcurrencyThe financial statements have been presented in Jordanian Dinar (JD) which is the functional currency of the entity.• Usingofestimates• When preparing of financial statements, management
uses judgments, assessments and assumptions that affect applying the accounting policies and carrying amounts of assets, liabilities, revenue and expenses. Actual result may differ from these estimates.
• Change in estimates shall be recognized in the period of the change, and future periods if the change affects them.
• For example, estimates may be required for doubtful and bad debts, inventory obsolescence, useful lives of depreciable assets, provisions, and any legal cases against the entity.
• FinancialinstrumentsA financial instrument is any contract that gives rise to a financial asset of one entity and financial liabilities or equity instrument of another entity.
• Financial assetsA financial asset is any asset that is:
A. Cash;B. An equity instrument of another entity;C. A contractual right to receive cash or another financial
asset from another entity, or to exchange financial assets or financial liabilities with another entity under conditions that are potentially favorable to the entity.
D. A contract that will or may be settled in the entity’s own equity instruments.
• Financial assets are initially measured at fair value plus, in the case of a financial asset not at fair value through profit or loss, transaction costs that are directly attributable to the acquisition of the financial asset.
• All recognized financial assets are subsequently measured either at amortized cost or fair value, on the basis of both:
A. The entity’s business model for managing the financial assets, and
B. The contractual cash flow characteristics of the financial assets.
• A financial asset is measured at amortized cost if both of the following conditions are met:
A. The asset is held within a business model whose objective is to hold assets in order to collect contractual cash flows.
B. The contractual terms of the financial asset give rise on specified dates to cash flows that are solely payments of principal and interest on the principal amount outstanding.
• All other financial assets are subsequently measured at fair value.
• A gain or loss on a financial asset that is measured of fair value and is not part of a hedging relationship

45
National Electric Power Co.
2014Annual Report
is recognized in profit or loss unless the financial asset is an investment in an equity instrument and the entity has elected to present gains and losses on that investment in other comprehensive income.
• Cash and cash equivalents
• Cash comprises cash on hand, current accounts and demand deposits with banks.
• Cash equivalents are short- term, highly liquid investments that are readily convertible to known amounts of cash and which are subject to an insignificant risk of changes in value.
• Trade receivables
• Trade receivables are non-derivative financial assets with fixed or determinable payments that are not quoted in an active market.
• Trade receivables are stated at invoices amount net of any allowance for doubtful receivables which represents the collective impairment of receivables.
• Investment in subsidiaries
• A subsidiary is an entity that is controlled by another entity. Control is presumed to exist when the investor is exposed, or has rights, to variable returns from its involvement with the investee and has the ability to affect those returns through its power over the investee.
• When no consolidation is prepared, investment in a subsidiary is accounted for at cost.
• Impairment of financial assets
• Financial assets, other than those at fair value through profit or loss, are assessed for indicators of impairment at the end of each year.
• For financial assets carried at amortized cost, the amount of impairment loss is the difference between the asset’s carrying amount and the present value of estimated future cash flows, discounted at the financial asset’s original effective interest rate. The carrying amount of the financial asset is reduced by the impairment loss directly for all financial assets. The amount of the impairment loss shall be recognized in losses.
• Financial liabilitiesA financial liability is any liability that is:
A. A contractual obligation to deliver cash or another financial asset to another entity, or to exchange financial assets or financial liabilities with another entity under conditions that are potentially unfavorable to the entity; or
B. A contract that will or may be settled in the entity’s own equity instruments.
• Financial liabilities are initially recognized at fair value plus transaction costs, directly attributable to the acquisition or issue of those liabilities, except for the financial liabilities classified as at fair value through profit or loss, which are initially measured at fair value.
• After initial recognition, the entity measures all financial liabilities at amortized cost using the effective interest method, except for financial liabilities at fair value through profit or loss which are measured at fair value and other determined financial liabilities which are not measured under amortized cost method.
• Financial liabilities at fair value through profit or loss are stated at fair value, with any resulting gain or loss from change in fair value is recognized through profit or loss.
• Trade payables and accruals
• Trade payables and accruals are liabilities to pay for goods or services that have been received or supplied and have been either invoiced or formally agreed with the suppliers or not.
• Inventory
• Inventory is measured at the lower of cost and net realizable value.
• Inventory costs comprise all costs of purchase, costs of conversion and other costs incurred in bringing the inventories to their present location and condition.
• The cost of inventory is assigned by using the weighted-average cost formula.
• Net realizable value is the estimated selling/usage price in the ordinary course of business less the estimated costs of completion and the estimated costs necessary to make the usage.
• Spare parts that didn’t move for more than 5 years are depreciated by 15% annually.

2014
46
National Electric Power Co.
Annual Report
• Fixed Assets (Property, plant and equipment and subscribers’ contributions assets)
• Property, plant and equipment are initially recognized at their cost being their purchase price plus any other costs directly attributable to bringing the assets to the location and condition necessary for them to be capable of operating in the manner intended by management.
• After initial recognition, property, plant and equipment are carried, in the statement of financial position, at their cost less any accumulated depreciation and any accumulated impairment losses. Lands are not depreciated.
• The depreciation charge for each year is recognized as expense. Depreciation is calculated on a straight line basis, which reflects the pattern in which the asset’s future economic benefits are expected to be consumed over the estimated useful lives of the assets using the following annual rates:
Category Depreciation rate
% Legal compensation assets (*) 10Buildings 2-3.3Transmission lines 2.5Transformation stations 3.3Land lines 2.8Transmission lines - sea cable 2.5Fiber optics communiction tools 10Furniture and office equipment 10Vehicles 20Tools and equipment 10Operators and communication devices 5
Control and monitoring devices 12.5Computers 20Other equipment 10Others 3-20
(*) According to the decision of the Electricity Regulatory Commission in its meeting held on October 18, 2003, compensations paid by electricity companies to lands owners whom electricity networks pass by their lands
are considered capital expenditures as they appear in the statement of financial position under legal compensation assets that are depreciated over 10 years, compensations paid during the year are capitalized at the end of the fiscal period starting from January 1, 2003.
• The estimated useful lives are reviewed at each year-end, with the effect of any changes in estimate accounted for on a prospective basis.
• The carrying values of property, plant and equipment are reviewed for impairment when events or changes in the circumstances indicate the carrying value may not be recoverable. If any such indication of impairment exists, impairments losses are calculated in accordance with impairment of assets policy.
• On the subsequent derecognition of the property, plant and equipment, the resulting gain or loss, being the difference between the net disposals proceeded, if any, and the carrying amount, is included in profit or loss.
• Impairment of assets
• At each statement of financial position date, management reviews the carrying amounts of its assets to determine whether there is any indication that those assets have been impaired.
• If any such indication exists, the recoverable amount of the asset is estimated in order to determine the extent of the impairment loss, if any, being the amount by which the carrying amount of the asset exceeds its recoverable amount. The recoverable amount is the higher of asset’s fair value less costs to sell and the value in use. The asset’s fair value is the amount for which that asset could be exchanged between knowledgeable, willing parties in arm’s length transaction. The value in use is the present value of the future cash flows expected to be derived from the asset.
• An impairment loss is recognized immediately as a loss.
• Where an impairment loss subsequently reverses, the carrying amount of the asset is increased to the revised estimate of its recoverable amount, but the increased carrying amount due to reversal should not be more than what the depreciated historical cost

47
National Electric Power Co.
2014Annual Report
would have been if the impairment had not been recognized in prior years. A reversal of an impairment loss is recognized immediately as income.
• Provisions
• Provisions are present obligations (legal or constructive) resulted from past events, the settlement of the obligations is probable and the amount of those obligations can be estimated reliably. The amount recognized as a provision is the best estimate of the expenditure required to settle the present obligation at the statement of financial position date.
• Provisions reviewed and adjusted at each statement of financial position date. If outflows, to settle the provisions, are no longer probable, reverse of the provision is recorded as income.
• End of service indemnity
• End of service indemnity is computed according to Jordanian Laws and Regulations.
• Reserves• StatutoryreserveStatutory reserve is allocated according to the Jordanian Companies Law by deducting 10% of the annual net profit until the reserve equals one quarter of the Company’s subscribed capital. However, the Company may, with the approval of the General Assembly, continue to deduct this annual ratio until this reserve equals the subscribed capital of the Company in full. Such reserve is not available for dividends distribution.
• Voluntary reserve
This reserve is determined in accordance with the Jordanian Companies Law by allocating not more than 20% annually of the profit to this reserve.
• Special reserve
The General Assembly of a public shareholding company can allocate not more than 20% annually of the profit as special reserve based on a proposition by its board of directors to use it for contingencies, expansion, or strengthening the company’s financial position and facing potential risks to agree with the requirements of the Jordanian Companies Law.
• Basic earnings per share
Basic earnings per share is calculated by dividing profit or loss, attributable to ordinary shareholders, by the weighted average number of ordinary shares outstanding during the year.• RevenuerecognitionRevenue is measured at the fair value of the consideration received or receivable.• RevenuesofenergysaleRevenues resulting from energy sale are recognized when the invoice is issued to the customer with the amount of energy sold and the tariff identified by the government, and when the following conditions are met:• The entity transfers the significant risks and benefits
of goods ownership to the buyer.• The entity does not maintain a continuous
management relationship to the extent associated with the presence of ownership nor effective control over the sold goods.
• The amount of revenue can be measured reliably.• Economic benefits associated with the process will
flow to the entity.• The possibility of measuring the costs incurred or to
be incurred in the process reliably.
• Dividend and interest revenue
• Dividend revenue from investments is recognized when the shareholder’s right to receive payment is established.
• Interest revenue is accrued on a time basis, by reference to the principal outstanding and at the effective interest rate applicable.
• Grants
• Unrestricted grants that are receivable as compensation for expenses or losses already incurred or for the purpose of giving immediate financial support to the entity with no future related costs are recognized in profit or loss in the period in which they become receivable.
• Restricted grants are recognized as income on a systematic basis over the periods in which the entity recognizes as expenses the related costs for which the grants are intended to compensate.

2014
48
National Electric Power Co.
Annual Report
• Grants whose primary condition is that the entity should purchase, construct or otherwise acquire non-current assets are recognized as deferred income in the statement of financial position and transferred to profit and loss on a systematic and rational basis over the useful lives of the related assets.
• Borrowing costs
• Borrowing costs are interest and other costs that an entity incurs in connection with the borrowing of funds.
• Borrowing costs are expensed in the period in which they are incurred.
• Interestof latepayment/ collectionof energyandfuelprices
Revenues/expenses interest of late payment/ collection of energy and fuel prices and recognized when received/paid.• IncometaxIncome tax is calculated in accordance with Jordanian laws and regulations.
• Foreign currencies
• In preparing the financial statements, transactions in currencies other than the functional currency (foreign
currencies) are recorded at the rates of exchange prevailing at the dates of the transactions. At each statement of financial position date, monetary items denominated in foreign currencies are retranslated at the rates prevailing at the statement date (closing rate). Non-monetary items that are measured in terms of historical cost in a foreign currency are translated using the exchange rate at the date of the transaction. Non-monetary items that are measured at fair value in foreign currency are translated using the exchange rates at the date when the fair value was determined.
• Exchange differences arising on the settlement of monetary items or on translating monetary items at rates different from those at which they were translated on initial recognition during the year or in previous financial statements shall be recognized in profit or loss in the year in which they arise.
• Contingent liabilities
• Contingent liabilities are possible obligations depending on whether some uncertain future events occur, or they are present obligations but payments are not probable or the amounts cannot be measured reliably.
• Contingent liabilities are not recognized in the financial statements.

49
National Electric Power Co.
2014Annual Report
(3) Pro
perty, p
lant an
d eq
uip
men
t and
Sub
scribers’ C
on
tribu
tion
s
2014C
ostA
ccumulated D
epreciation (Am
ortization)
Net BookV
alue
Beginning ofyear
balanceA
dditionsTransfers
Disposals
End of yearbalance
Beginning ofyear
balanceA
dditionsD
isposalsEnd of year
balanceEnd of year
balanceD
escription
JDJD
JDJD
JDJD
JDJD
JDJD
Projects under construction18,178,153
24,452,183 (22,198,078)
- 20,432,258
- -
- -
20,432,258
Lands33,418,112
991,558 -
- 34,409,670
- -
- -
34,409,670
Legal compensation assets
68,963,007 4,652,460
- -
73,615,467 44,952,465
5,547,237 -
50,499,702 23,115,765
Buildings64,212,970
- 3,089,235
- 67,302,205
21,257,386 2,165,836
- 23,423,222
43,878,983
Transmission lines
222,540,712 -
5,127,322 -
227,668,034 76,127,368
7,861,856 -
83,989,224 143,678,810
Transformation stations
366,097,370 -
13,934,490 -
380,031,860 145,484,529
11,616,405 -
157,100,934 222,930,926
Land lines28,340,961
- 21,833
- 28,362,794
4,295,594 689,199
- 4,984,793
23,378,001
Transmission lines - sea cable
25,231,064 -
- -
25,231,064 9,545,451
630,687 -
10,176,138 15,054,926
Fiber optics comm
uniction tools
3,751,722 -
25,198 -
3,776,920 2,971,938
213,476 -
3,185,414 591,506
Furniture and office equipment
1,814,442 54,113
- -
1,868,555 1,625,632
69,943 -
1,695,575 172,980
Vehicles7,772,622
518,104 -
(26,400)8,264,326
6,515,245 380,299
(26,398)6,869,146
1,395,180
Tools and equipment
2,454,062 134,056
- -
2,588,118 2,002,905
195,663 -
2,198,568 389,550
Operators and com
munication
devices2,604,526
12,025 -
- 2,616,551
2,277,148 108,935
- 2,386,083
230,468 Control and m
onitoring devices
7,470,824 346
- -
7,471,170 4,894,637
369,109 -
5,263,746 2,207,424
Computers
4,692,592 61,317
- -
4,753,909 4,389,693
105,728 -
4,495,421 258,488
Other equipm
ent2,056,632
161,595 -
- 2,218,227
1,815,881 107,515
- 1,923,396
294,831
Others
2,878,315 24,435
- (520)
2,902,230 1,956,500
189,106 (519)
2,145,087 757,143
Total - divided into:862,478,086
31,062,192 -
(26,920)893,513,358
330,112,372 30,250,994
(26,917)360,336,449
533,176,909
Poperty, plant and equipment
764,220,586 31,062,192
- (26,920)
795,255,858 303,466,756
26,320,694 (26,917)
329,760,533 465,495,325
Subscribers› contributions assets (*)98,257,500
- -
- 98,257,500
26,645,616 3,930,300
- 30,575,916
67,681,584
Total862,478,086
31,062,192 -
(26,920)893,513,358
330,112,372 30,250,994
(26,917)360,336,449
533,176,909

2014
50
National Electric Power Co.
Annual Report
2013
Cos
tA
ccum
ulat
ed D
epre
ciat
ion
(A
mor
tizat
ion)
Net
Boo
k V
alue
Begi
nnin
g of
ye
arba
lanc
eA
dditi
ons
Tran
sfer
sD
ispos
als
End
of y
ear
bala
nce
Begi
nnin
g of
ye
arba
lanc
eA
dditi
ons
Disp
osal
sEn
d of
yea
rba
lanc
eEn
d of
yea
rba
lanc
eD
escr
iptio
n
JDJD
JDJD
JDJD
JDJD
JDJD
Proj
ects
und
er c
onst
ruct
ion
35,05
1,335
15
,160,3
82
(32,03
3,564
)-
18,17
8,153
-
-
-
- 18
,178,1
53
Land
s29
,874,7
54
3,543
,358
-
-
33,41
8,112
-
-
-
- 33
,418,1
12
Lega
l com
pens
atio
n as
sets
61,29
8,132
7,6
64,87
5 -
- 68
,963,0
07
38
,710,2
54
6,242
,211
- 44
,952,4
65
24,01
0,542
Build
ings
61,04
0,560
-
3,172
,410
- 64
,212,9
70
19,14
1,652
2,1
15,73
4 -
21,25
7,386
42
,955,5
84
Tran
smiss
ion
lines
202,9
76,92
5 -
19,56
3,787
-
222,5
40,71
2 68
,628,0
95
7,499
,273
- 76
,127,3
68
146,4
13,34
4
Tran
sfor
mat
ion
stat
ions
356,8
27,63
0 -
9,269
,740
- 36
6,097
,370
133,9
63,86
1
11,52
0,668
-
145,4
84,52
9 22
0,612
,841
Land
line
s28
,349,8
19
- (8,
858)
- 28
,340,9
61
3,563
,189
732,4
05
- 4,2
95,59
4 24
,045,3
67
Tran
smiss
ion
lines
- se
a ca
ble
25,23
1,064
-
- -
25,23
1,064
8,9
14,76
4 63
0,687
-
9,545
,451
15,68
5,613
Fi
ber o
ptic
s com
mun
ictio
n to
ols
3,715
,237
- 36
,485
- 3,7
51,72
2 2,7
54,91
6 21
7,022
-
2,971
,938
779,7
84
Furn
iture
and
offi
ce e
quip
men
t1,7
53,57
6 60
,866
- -
1,814
,442
1,550
,676
74,95
6 -
1,625
,632
188,8
10
Vehi
cles
7,100
,439
686,3
08
- (14
,125)
7,772
,622
5,990
,483
538,8
86
(14,12
4)6,5
15,24
5 1,2
57,37
7
Tool
s and
equ
ipm
ent
2,306
,956
147,1
06
- -
2,454
,062
1,724
,887
278,0
18
- 2,0
02,90
5 45
1,157
O
pera
tors
and
com
mun
icat
ion
devi
ces
2,571
,797
32,7
29
- -
2,604
,526
2,168
,320
108,8
28
- 2,2
77,14
8 32
7,378
Co
ntro
l and
mon
itorin
g de
vice
s7,4
67,76
2 3,0
62
- -
7,470
,824
4,519
,227
375,4
10
- 4,8
94,63
7 2,5
76,18
7
Com
pute
rs4,5
44,17
5 15
1,784
-
(3,36
7)4,6
92,59
2 4,2
90,22
8 10
2,781
(3,
316)
4,389
,693
302,8
99
Oth
er e
quip
men
t2,0
15,03
5 41
,597
- -
2,056
,632
1,716
,555
99,32
6 -
1,815
,881
240,7
51
Oth
ers
2,660
,678
217,6
37
- -
2,878
,315
1,772
,352
184,1
48
- 1,9
56,50
0 92
1,815
Tota
l - d
ivid
ed in
to:
834,
785,
874
27,7
09,7
04
- (1
7,49
2)86
2,47
8,08
6 29
9,40
9,45
9 30
,720
,353
(1
7,44
0)33
0,11
2,37
2 53
2,36
5,71
4
Pope
rty,
plan
t and
equ
ipm
ent
742,3
94,08
0 21
,843,9
98
- (17
,492)
764,2
20,58
6 27
6,694
,143
26,79
0,053
(17
,440)
303,4
66,75
6 46
0,753
,830
Subs
cribe
rs› co
ntrib
ution
s ass
ets (
*)92
,391,7
94
5,865
,706
- -
98,25
7,500
22
,715,3
16
3,930
,300
- 26
,645,6
16
71,61
1,884
Tota
l83
4,78
5,87
4 27
,709
,704
-
(17,
492)
862,
478,
086
299,
409,
459
30,7
20,3
53
(17,
440)
330,
112,
372
532,
365,
714

51
National Electric Power Co.
2014Annual Report
(*) Subscribers’ contributions assetsThese assets are displayed is a separate class according to the ministerial instructions referred to in the Prime Ministry’s letter number 336189/11/ dated June 4, 1985 that provided (to appear in its true name “subscribers’ Contributions” on other liabilities side, and their assets to appear as a separate class on assets side under the name Subscribers’ Contributions Assets where these assets are depreciated over 25 years by 4% annually the liabilities against them to be amortized by the same rate as of the Company’s financial statements for the year 1985 this rule is applied on accumulated contributions with the Company at the time and on future contributions.
(4) Investment in subsidiaries
Description Legal status Country of incorporation
Owneship share
%
Balance
JD
Energized Maintenance Engineering Company Limited liability Jordan 50 50,000 National Company for Optic Fibers Investments Private shareholding Jordan 100 50,000 Total 100,000
• (*) The following is a summary of the financial information related to each company for the year ended December 31, 2014 according to the financial statements prepared by management:
Optic Fibers Investments
Engineering Company
JD JDTotal assets 59,587 75,296 Total liabilities 171 20,322 Net equity 59,416 54,974 Revenues 1,170 14,376 Profit (loss) for the year 1,126 (27,686)Parent Company›s share of profit and loss 1,126 (13,843)
• (**) Consolidated financial statements with subsidiaries have not been prepared due to the immateriality of investments in subsidiaries.
(5) Investment in financial assets at fair value through other comprehensive income
Investee2014 2013
JD JDJordan Electric Power Company 1,638,735 1,792,710
Irbid District Electricity Company 42,549 41,615 Total 1,681,284 1,834,325

2014
52
National Electric Power Co.
Annual Report
(*) Movement on investment in financial assets at fair value through other comprehensive income during the year was as follows:
2014 2013JD JD
Beginning of year balance 1,834,325 1,865,965 Change in fair value (153,041) (31,640)End of year balance 1,681,284 1,834,325
(6) Company’s contribution in employees’ housing fundThis item represents amounts transferred to the employees’ housing fund as contributions in the fund.
(7) Inventory
2014 2013JD JD
Spare parts, transformation stations› materials, and transmission network 21,466,949 21,020,181
Control and monitoring center materials 4,080,602 4,008,271 Stationery and office supplies 18,925 22,612 Training materials - 21,547 Total 25,566,476 25,072,611
(8) Other debit balances
2014 2013JD JD
Prepayments to suppliers 5,017,142 1,024,859 Fuel consumption and supply differences, net (*) 3,828,713 8,355,659 Projects and studies for others 902,421 801,630 Employees› receivables 388,436 511,690 Letters of credit 245,304 725,691 Prepaid expenses 89,547 1,032,802 Other 82,421 47,289 Total 10,553,984 12,499,620
(*) This item represents the difference between fuel amounts supplied to generation companies and paid by National Electric Power Company and quantities consumed by generation companies during the year.

53
National Electric Power Co.
2014Annual Report
(9) Accounts receivable
2014 2013JD JD
Sale of energy receivables (*) 341,111,199 306,616,451 Joint chiefs of staff (**) 3,201,000 5,000,000 Insurance companies receivables - Aqaba and Rehab accidents 4,465,763 4,463,521
Others 4,883,716 3,231,599 Total 353,661,678 319,311,571 Allowance for doubtful receivables (***) (7,934,736) (7,890,139)Net 345,726,942 311,421,432
(*) Sale of energy receivables details are as following:
2014 2013JD JD
Jordan Electric Power Company 187,744,324 165,922,270 Electricity Distribution Company 65,124,951 64,627,988 Irbid District Electricity Company 57,423,596 52,777,176 Wholesale subscribers receivables 25,490,135 18,607,761 Traibeel Borders Centre 4,612,519 3,857,010 Roadway lighting subscribers receivales 443,699 -Jerusalem District Electricity Company 271,975 824,246 Total 341,111,199 306,616,451
(**) This item represents a receivable against subscribers’ contributions received on projects under construction shown in Note (15).(***) Movement on allowance for doubtful receivables during the year was as follows:
2014 2013JD JD
Beginning of year balance 7,890,139 4,692,939 Provided during the year 44,597 3,397,200 Recovery of allowance - (200,000)End of year balance 7,934,736 7,890,139

2014
54
National Electric Power Co.
Annual Report
(10) Cash and cash equivalents
2014 2013JD JD
Current accounts at banks 265,784 488,277 Cash on hand 93,673 129,288 Total 359,457 617,565
(11) Treasury rightsThis item represents the balance of installments and interests on certain loans that are credited on treasury rights account shown under owner’s equity as stated in the loans agreements plus the value of appropriated Ameri lands. The balance of this item does not represent any liability on the company.
(12) Loans
2014 2013JD JD
Local loans (*) 945,860,788 1,302,417,575 Foreign loans (**) 465,248,921 95,947,584 Total - divided to: 1,411,109,709 1,398,365,159 Non-current portion 623,056,073 856,616,210 Current portion 548,411,637 541,748,949 Accrued portion 239,641,999 -
(*) Interest rates on local loans range between 3.25% and 8.6%.(**) Interest rates on foreign loans varies because of different financing sources and terms.(***) All the loans above are guaranteed by the Government of the Hashemite Kingdom of Jordan.
(13) Bonds payableThis item represents bonds payable with maturity dates extending until April 26, 2017 with interest rates ranging from 7.25% to 7.75% during the year ended December 31, 2014. All bonds are issued by the Government of the Hashemite Kingdom of Jordan using the National Electric Power Company name, and they are guaranteed by the Government of the Hashemite Kingdom of Jordan.
(14) End of service indemnity
2014 2013JD JD
Beginning of year balance 6,435,255 6,424,953 Provided 994,610 636,446 Paid (532,516) (626,144)End of year balance 6,897,349 6,435,255

55
National Electric Power Co.
2014Annual Report
(15) Subscribers’ contributions received on projects under construction
2014 2013JD JD
Adjustment of 400 K.V line poject - special forces 5,000,000 5,000,000 Expansion of Al-Qwireh station 4,083,333 4,083,333 Al-Shedeyeh station expansion project (Gamma and Indo-Jordan) 3,506,667 3,506,667
Maan station expansion project (Al-shamsyah) 4,182,371 - Total 16,772,371 12,590,000
(16) Deferred revenues
2014 2013JD JD
Beginning of year balance 277,109 45,016 Received during the year - 295,166 Accumulated amortization (62,973) (63,073)End of year balance 214,136 277,109
(17) Income tax provisionAmman• The tax status of the Company has been settled until 2011.• The income tax returns for the years 2012 and 2013 were submitted within legal time limit.
Aqaba• The tax status of the Company has been settled until 2009.• The income tax returns for the years 2010, 2011, and 2012 were submitted within legal time limit.As per the Company’s tax consultant’s opinion, the provided provision is sufficient for potential tax liabilities.
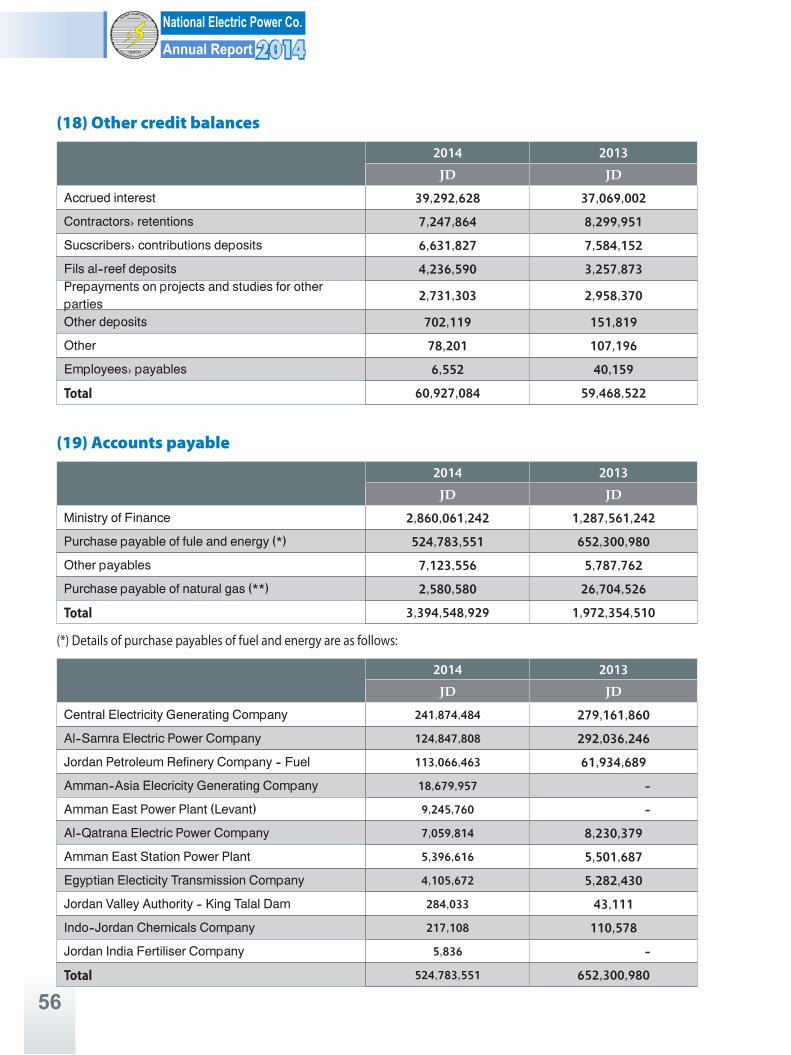
2014
56
National Electric Power Co.
Annual Report
(18) Other credit balances
2014 2013JD JD
Accrued interest 39,292,628 37,069,002 Contractors› retentions 7,247,864 8,299,951 Sucscribers› contributions deposits 6,631,827 7,584,152 Fils al-reef deposits 4,236,590 3,257,873 Prepayments on projects and studies for other parties 2,731,303 2,958,370
Other deposits 702,119 151,819 Other 78,201 107,196 Employees› payables 6,552 40,159 Total 60,927,084 59,468,522
(19) Accounts payable
2014 2013JD JD
Ministry of Finance 2,860,061,242 1,287,561,242Purchase payable of fule and energy (*) 524,783,551 652,300,980 Other payables 7,123,556 5,787,762 Purchase payable of natural gas (**) 2,580,580 26,704,526 Total 3,394,548,929 1,972,354,510
(*) Details of purchase payables of fuel and energy are as follows:
2014 2013JD JD
Central Electricity Generating Company 241,874,484 279,161,860 Al-Samra Electric Power Company 124,847,808 292,036,246 Jordan Petroleum Refinery Company - Fuel 113,066,463 61,934,689 Amman-Asia Elecricity Generating Company 18,679,957 - Amman East Power Plant (Levant) 9,245,760 - Al-Qatrana Electric Power Company 7,059,814 8,230,379 Amman East Station Power Plant 5,396,616 5,501,687 Egyptian Electicity Transmission Company 4,105,672 5,282,430 Jordan Valley Authority - King Talal Dam 284,033 43,111 Indo-Jordan Chemicals Company 217,108 110,578 Jordan India Fertiliser Company 5,836 - Total 524,783,551 652,300,980

57
National Electric Power Co.
2014Annual Report
(**) Details of purchase payables of natural gas are as follows:
2014 2013JD JD
Jordanian Egyptian Fajr for Natural Gas Transmission and Supply 1,532,676 25,656,622
Ministry of Finance - Gas prices share 1,047,904 1,047,904 Total 2,580,580 26,704,526
(20) Banks overdrafts
CeilingInterest rate 2014 2013
% JD JD
Bank al Etihad - JD 7.5 Millions 7.25 7,500,000 7,500,000
Cairo Amman Bank - USD Non 3.5 6,840,374 1,767,022
Housing Bank for Trade & Finance - JD 5 Millions 7 4,997,071 5,001,292
Bank al Etihad - USD 10 Millions 3.75 4,248,000 7,886,451
Bank of Jordan - USD 5 Millions 4 3,532,920 3,540,000
Cairo Amman Bank - JD 5 Millions 7 41,984 119,041
Bank of Jordan - JD 10 Millions 7.5 - 19,593,522
Arab Bank - JD 5 Millions 8.63 - 3,696,131
City Bank - JD 3.4 Millions 7.25 - 3,300,000
Total 27,160,349 52,403,459 (*) All the above bank facilities are guaranteed by the Company’s assets.

2014
58
National Electric Power Co.
Annual Report
(21) Sale of energy revenues
2014 2013
Quantity of energy sold
Average price Total Quantity of
energy soldAverage
price Total
Megawatt/hour Fils/kilowatt JD Megawatt/
hourFils/
kilowatt JD
Jordan Electric Power Company 10,304,458 79/108 815,169,802 9,870,992 71/152 702,336,827
Electricity Distribution Company 3,159,990 70/772 223,638,473 2,979,323 62/202 185,318,547
Irbid District Electricity Company 2,840,381 65/515 186,087,386 2,594,948 58/022 150,565,073
Wholesale subscribers 1,001,710 159/214 159,485,806 868,453 140/333 121,872,586
Jerusalem District Electricity Company 34,301 104/136 3,571,947 41,399 103/581 4,288,135
Egyptian Electicity Transmission Company 22,785 122/039 2,780,660 10,821 129/625 1,402,675
Traibeel Borders Center 6,651 113/600 755,509 6,448 113/604 732,516
Total 17,370,276 80/108 1,391,489,583 16,372,384 71/249 1,166,516,359
(22) Purchase of energy
2014 2013Quantity of energy
purchased
Average price Total
Quantity of energy
purchased
Average price Total
Megawatt/hour
Fils/kilowatt JD Megawatt/
hourFils/
kilowatt JD
Cental Electricity Generating Company 7,497,565 134/037 1,004,949,528 6,910,093 142/501 984,696,661
Al-Samra Electic Power Company 4,407,803 157/473 694,111,285 4,426,243 134/963 597,379,535
Amman East Power Plant 1,945,734 126/993 247,093,667 2,590,630 87/832 227,540,111 Al-Qatrana Electric Power Company 1,483,862 153/591 227,908,557 2,396,465 98/220 235,381,751 Amman-Asia Electricity Generating Company 1,127,859 112/253 126,605,854 - - - Amman East Power Plant (Levant) 774,012 109/422 84,693,692 - - - Egyptian Electicity Transmission Company 434,880 88/992 38,700,825 381,080 106/278 40,500,524
King Talal Dam and Indo-Jordan Chemicals Company 18,683 32/837 613,475 13,970 28/035 391,652
Total 17,690,398 137/062 2,424,676,883 16,718,481 124/765 2,085,890,234

59
National Electric Power Co.
2014Annual Report
(23) Administrative and operating expenses
2014 2013JD JD
Salaries and wages 16,349,886 15,727,372 Company›s contriutions (social security, saving, health and life insurance) 3,995,207 3,769,185
Assets insurance 2,338,537 3,600,271
Licensing fees - electricity regulatory commission 1,302,620 1,227,929
End of service indemnity 994,610 636,446
Impairment of slow moving inventoy 683,267 325,954
Professional and consultancy fees 634,022 636,287
Security 553,349 676,687
Utilities 220,472 229,422
Stamps and university fees 186,227 503,734
Miscellaneous 152,190 145,608
Cleaning 137,608 106,774
Travel and per-diems 130,622 140,473
Communication 66,618 73,537
Advertising and marketing services 51,905 78,077
Stationery and printings 51,365 50,295
Board of directors› transportation and representation 48,513 40,035
Doubtful receivables 44,597 3,397,200
Entertainment 42,196 22,915
Training 39,012 30,353
Subscriptions 36,815 41,524
Vehicles registration and licensing 30,836 29,161
Seminars and conferences 19,527 24,014
Total 28,110,001 31,513,253
(24) Previous years settlements of accountsThis item represents compensations of rehab accident consequential losses plus the amounts transferred to the comprehensive income statement from Jordanian Egyptian Fajr for Natural Gas Transmission and Supply payable, Al-Qatrana Electric Power Company payable, Central Electricity Generating Company payable, and Al-Samra Electric Power Company payable as a result of reaching settlements between the Company and these companies.

2014
60
National Electric Power Co.
Annual Report
(25) Other revenues
2014 2013JD JD
Amman-Asia penalties revenue 11,537,500 -
International services revenues, net 1,766,966 1,146,489
Interest income 702,668 180,873
Compensations from insurance companies 134,838 67,985
Others 160,624 33,884
Amortization of deferred revenues 62,973 63,073
Lands rentals 53,750 132,040
Dividend income 44,288 72,866
Sale of tenders copies 43,000 99,185
Gain on disposal of property, plant and equipment 15,998 12,770
Recovery of allowance - 200,000
Total 14,522,605 2,009,165
(26) Other expenses
2014 2013JD JD
Housing and rest area expenses, net 73,888 53,005
Others 48,739 69,263
Company›s contribution in roadway lighting 8,916 38,778
Total 131,543 161,046
(27) Loss per share
2014 2013JD/Share JD/Share
Loss for the year (1,179,263,607) (1,085,870,039)
Weighted average number of shares 230,000,000 230,000,000
Loss per share (5/127) (4/721)
(28) Contingent liabilitiesThe Company has contingent liabilities on the statement of financial position date for guarantees amounting to JD 258,710 without cash deposit
(29) Legal casesAs mentioned in the Company’s lawyer letter, there are legal cases raised by the Company against others amounting to JD 89,471 while legal cases raised by others against the Company amounting to JD 20 millions and other cases with undetermined amounts, These cases are still outstanding in related courts.

61
National Electric Power Co.
2014Annual Report
(30) Risk managementA. Capital risk:
• Regularly, the capital structure is reviewed and the cost of capital and the risks associated with capital are considered. In addition, capital is managed properly to ensure continuing as a going concern while maximizing the return through the optimization of the debt and equity balance.
• The Company’s accumulated losses reached nearly 20 times its subscribed capital. According to Companies Law No. 22 and its amendments for year 1997, the court may decide to compulsory liquidate if accumulated losses of a public shareholding company exceeded 75% of its capital unless the General Assembly decides to increase its capital.
B. Currency risk:• Currency risk is the risk that the fair value or future cash flows of a financial instrument will fluctuate because of
changes in foreign exchange rates.• The risk arises on certain transactions denominated in foreign currencies, which imposes sort of risk due to fluctuations
in exchange rates during the year.• Certain procedures to manage the exchange rate risk exposure are maintained.• The following is details of foreign currencies accounts as at December 31, 2014:
Description Exchange risk Exchange priceAmount Amount
in foreign currency in local currencyCurrent accounts USD 0.708 46,005 32,571 Accounts receivable USD 0.708 2,336,402 1,654,172 Accounts payable USD 0.71 464,507,996 329,800,677 Loans USD 0.71 790,000,000 560,900,000 Loans Islamic dinar 1.04 31,741,700 33,011,368 Loans Kuwaity dinar 2.439 19,934,885 48,621,185 Loans Euro 0.86407 2,284,963 1,974,368 Banks overdrafts USD 0.708 10,990,000 7,780,920
C. Interest rate risk:• Interest rate risk is the risk that the fair value or future cash flows of a financial instrument will fluctuate because of
changes in market interest rates.• The risk arises on exposure to a fluctuation in market interest rates resulting from borrowings and depositing in banks. • The risk is managed by maintaining an appropriate mix between fixed and floating interest rates balances during the
financial year.• The following schedule illustrates the sensitivity of profit or loss and owner’s equity for the change in interest prices
that the entity pays for borrowing from banks:
As at December 31, 2014 Change in interest rate
Effect on the statement of comprehensive
income and equityLoans 0.5 ± 7,055,549 ±
Banks overdrafts 0.5 ± 135,802 ±

2014
62
National Electric Power Co.
Annual Report
D. Other price risk:• Other price risk is the risk that the fair value or future cash flows of a financial instrument will fluctuate because of
changes in market prices (other than those arising from interest rate risk or currency risk), whether those changes are caused by factors specific to the individual financial instrument or its issuer, or factors affecting all similar financial instruments traded in the market.
• The following table shows the sensitivity to profit or loss and equity to the changes in the listed prices of investments in equity instruments, assuming no changes to the rest of other variables:
As at December 31, 2014 Change in priceEffect on the statement of
comprehensive income
Investment in financial assets at fair value through other comprehensive income 5 ± 84,064 ±
E. Credit risk:• Credit risk is the risk that one party to a financial instrument will cause a financial loss for the other party by failing to
discharge an obligation.• Regularly, the credit ratings of debtors and the volume of transactions with those debtors during the year are
monitored. • Ongoing credit evaluation is performed on the financial condition of debtors.• The carrying amount of financial assets recorded in the financial statements represents the maximum exposure to
credit risk without taking into account the value of any collateral obtained.F. Liquidity risk:• Liquidity risk is the risk of encountering difficulty in meeting obligations associated with financial liabilities that are
settled by delivering cash or another financial assets.• Liquidity risk is managed through monitoring cash flows and matching with maturity dates of the financial assets and
liabilities.• The following table shows the maturity dates of financial assets and liabilities as of December 31:
Description
Less than one year One year and more
2014 2013 2014 2013
JD JD JD JDFinancial Assets:Investment in subsidiaries - - 100,000 100,000 Investment in financial assets at fair value though other comprehensive income - - 1,681,284 1,834,325
Company›s contribution in employees› housing fund - - 2,518,060 2,237,060 Other debit balances 1,373,278 1,360,609 - - Accounts receivable 345,726,942 311,421,432 - - Cash and cash equivalents 359,457 617,565 - - Total 347,459,677 313,399,606 4,299,344 4,171,385Financial Liabilities:Loans 788,053,636 541,748,949 623,056,073 856,616,210 Bonds payable - 198,600,673 300,000,000 300,000,000 Other credit balances 58,195,781 56,510,152 - - Accounts payable 3,394,548,929 1,972,354,510 - - Banks overdrafts 27,160,349 52,403,459 - - Total 4,267,958,695 2,821,617,743 923,056,073 1,156,616,210

63
National Electric Power Co.
2014Annual Report
(31) Segment reporting2014 2013
Amman Aqaba Total Amman Aqaba TotalOperating Revenues JD JD JD JD JD JDSale of energy revenues 1,345,705,138 45,784,445 1,391,489,583 1,131,565,682 34,950,677 1,166,516,359
Other energy revenues 50,616 1,727 52,343 687,688 21,269 708,957
Total Operating Revenues 1,345,755,754 45,786,172 1,391,541,926 1,132,253,370 34,971,946 1,167,225,316
Operating ExpensesPurchase of energy 2,344,662,547 80,014,336 2,424,676,883 2,023,313,528 62,576,706 2,085,890,234 Gas delivery cost to Al-Qatrana, Al-Samra stations, IPP3 and IPP4 4,909,272 167,535 5,076,807 - - -
Maintenance expenses 2,231,302 76,146 2,307,448 2,367,672 73,227 2,440,899 Administrative and operating expenses 27,183,843 926,158 28,110,001 30,670,228 843,025 31,513,253
Depreciation 25,452,111 868,583 26,320,694 25,986,351 803,702 26,790,053
Total Operating Expenses 2,404,439,075 82,052,758 2,486,491,833 2,082,337,779 64,296,660 2,146,634,439
Operating Loss (1,058,683,321) (36,266,586) (1,094,949,907) (950,084,409) (29,324,714) (979,409,123)Previous years settlements of accounts 1,268,936 43,304 1,312,240 1,381,812 42,737 1,424,549 Gains on foreign curency differences, net 3,864,638 25,991 3,890,629 530,846 17,254 548,100
Other revenues 14,522,605 - 14,522,605 2,009,165 - 2,009,165
Other expenses (131,543) - (131,543) (161,046) - (161,046)
Board of directors remuneration - - - - - -
Finance cost (100,478,679) (3,428,952) (103,907,631) (106,973,234) (3,308,450) (110,281,684)
Loss (1,139,637,364) (39,626,243) (1,179,263,607) (1,053,296,866) (32,573,173) (1,085,870,039)
Other Comprehensive IncomeChange in fair value of investment in financial assets at fair value through other comprehensive income
(153,041) - (153,041) (31,640) - (31,640)
Comprehensive Income (1,139,790,405) (39,626,243) (1,179,416,648) (1,053,328,506) (32,573,173) (1,085,901,679)
(32) Standards and Interpretations issued but not yet effectiveUp to the date of these financial statements, the following Standards and Interpretations were issued by the International Accounting Standards Board but not yet effective:
Standard or Interpretation No. Description Effective date
IAS (16 and 38) - Amendments Clarification of acceptable methods of depreciation and amortisation. Jan. 1, 2016 or after
IAS (16 and 41) - Amendments Bearer plants Jan.1, 2016 or afterIAS (27) – Amendments Accounting equity method in separate financial statements. Jan. 1, 2016 or afterIFRS (11) – Amendments Accounting for acquisition of interests in joint operation. Jan. 1, 2016 or afterIFRS (14) – New Regulatory deferral accounts - subject to rate regulator –
First time adopter Jan. 1, 2016 or afterIFRS (15) – New Revenue from contracts with customers Jan. 1, 2017 or after
Management anticipates that the adoption of these Standards and Interpretations in current or future periods may not have material impact on the financial statements.
(33) ReclassificationCertain 2013balances have been reclassified to conform to the classification used in 2014.

2014
64
National Electric Power Co.
Annual Report
National Electric Power Company
P.O.Box 2310-Amman-11181-JordanTel. 5858615 --6 +962
5804000 --6 +962FAX. 5818336 --6 +962
5856421 --6 +962e-mail [email protected] SITE www.nepco.com.jo
Preparation & Follow-up:Power System Planning Dept - Statistic Division
Design & Print: AD-Dustour Commercial Press