Embed Size (px)
Citation preview
Content
Annual Report 2014/15
Report of the Board of Directors 2
Consolidated Financial Statements 10
Notes 20
Auditor’s Report 39
Board of Directors and Auditors 40
Management 41
Financial Performance in Summary 42
The Share 44
Addresses 46
2w w w. l a g e r c r a n t z . c o m
L a g e r c r a n t z G r o u p A B ( p u b l ) A n n u a l R e p o r t 2 014 / 15
Report of the Board of Directors
The legal annual accounts consist of the Report of the Board of Directors, including the Corporate Governance Report, with proposed appropriation of profits, and the financial statements.
OPERATIONSLagercrantz Group AB (publ) and its subsidiaries is a technology group that offers valueadding technology, either with proprietary products or with products from leading suppliers. The Group is active in a number of product segments in several geographical markets. The Group consists of about 40 companies, each with a niche focus on a specific submarket – a niche. Each subsidiary is a separate profit centre with responsibility for its chosen strategy. Strong value creation is common for all companies as well as a high degree of customisation, support and other services.
The subsidiaries during 2014/15 were organised in the four divisions Electronics, Mechatronics, Communications and Niche Products.
NET REVENUE AND PROFITDuring the 2014/15 financial year, the market was characterised by continued stability and a gradual but slow improvement. Consoli dated net revenue for the 2014/15 financial year increased by 12 percent to MSEK 2,846 (2,546). Acquired businesses contributed MSEK 110, which generated organic growth of 5 percent for comparable units, measured in local currency. The currency effect in net revenue was MSEK 64 ( 3).
A stable sales trend during the financial year resulted in steady organic growth of between 4 – 6 percent per quarter. The markets in Sweden and Denmark performed well for most of the Group’s businesses, while the Norwegian and Finnish markets displayed a weaker performance due to prevailing domestic circumstances. Acquired business volume also contributed to the positive development of the Group.
Operating profit for the financial year increased by 14 percent to MSEK 276 (242), equivalent to an operating margin of 9.7 percent (9.5). Currency effects on operating profit amounted to MSEK 5 (1) during the financial year. Earnings were strengthened by the good performance in the Niche Products division with organic and acquisitiondriven growth and by a strong performance in the Group’s product companies in a number of markets. The sales mix has continued to shift towards a larger proportion of proprietary products, which constituted 38 percent (33) of sales and where the margins are higher.
Profit after net financial items increased by 15 percent to MSEK 265 (230), which is an alltime high for a twelvemonth period. Net financial items were impacted by currency effects of MSEK 0 (0).
Profit after tax for the financial year amounted to MSEK 203 (177). Earnings per share after dilution for the 2014/15 financial year increased by 15 percent and amounted to SEK 8.96, compared to SEK 7.81 for the 2013/14 financial year.
PROFITABILITY AND FINANCIAL POSITIONThe return on equity for the latest 12month period amounted to 24 percent (24) and the return on capital employed was 22 percent (22).
The Group’s metric for return on working capital (P/WC) was 58 percent (55). This metric is measured over a 12month period as operating profit divided by average working capital, where working capital consists of inventories, trade receivables and trade payables.
Equity per share totalled SEK 40.59 at the end of the period, compared to SEK 35.70 at the beginning of the financial year. Aside from profit, this metric was affected by dividend paid, redemption of options and currencyrelated translation effects. The equity ratio amounted to 44 percent, compared to 43 percent at the be ginning of the financial year.
At the end of the period, the financial net indebtedness amounted to MSEK 302, not including the pension liability, compared to MSEK 285 at the beginning of the year. The increase was primarily attributable to acquisition of businesses. The net debt equity ratio was 0.3 (0.4). The pension liability amounted to MSEK 68 at the end of the period, compared to MSEK 56 at the start of the year.
CASH FLOW AND CAPITAL EXPENDITURECash flow from operating activities during the financial year amounted to MSEK 268 (231). The difference compared to the previous year was mainly explained by higher earnings and decreased operating receivables. Gross investments in noncurrent assets amounted to MSEK 38 (45) during the financial year.
In conjunction with redemption of options, Class B shares were sold during the financial year for MSEK 4 in total. In addition, outstanding options were repurchased for a total of MSEK 10 and MSEK 2 was received in connection with subscription for new call options.
During the financial year, MSEK 20 was paid as contingent consider ation for previous acquisitions.
NET REVENUE AND PROFIT BY DIVISION
ElectronicsNet revenue for the 2014/15 financial year amounted to MSEK 803 (691). Continued strong sales of equipment to the marine sector and an increase in valueadding electronics distribution generated growth. During the year, the investment in RFID solutions also showed a positive development, among other ways, through exports outside the Nordic region.
Operating profit for the financial year amounted to MSEK 66 (56), equivalent to an operating margin of 8.2 percent (8.1). The operations in Denmark and Finland displayed a strong performance, while the development in the Norwegian business was weaker due to the domestic trend in the construction industry, for example.
MechatronicsNet revenue for the Mechatronics division for the 2014/15 financial year amounted to MSEK 784 (750). The strong sales performance was mainly due to increased sales of customised cabling to the wind power industry in Denmark, as well as a positive development in electrical enclosures and electrical connection systems.
Operating profit for the financial year amounted to MSEK 118 (108), equivalent to an operating margin of 15.1 percent (14.4). The stronger earnings and margins were primarily due to good sales of customised cabling to the wind power industry in Denmark, and of electrical connection systems and safety switches, but the Finnish operations also showed good results in valueadding distribution of electrical components. CommunicationsNet revenue for the 2014/15 financial year amounted to MSEK 870 (802). Lower distribution volume of software was largely offset by the business volume acquired during the financial year in control
The Board of Directors and the President of Lagercrantz Group AB (publ), corporate identity number 5562824556, hereby submit the annual accounts and consolidated financial statements for the 2014/15 financial year. The Report of the Board of Directors also includes the Corporate Governance Report.
3w w w. l a g e r c r a n t z . c o m
L a g e r c r a n t z G r o u p A B ( p u b l ) A n n u a l R e p o r t 2 014 / 15
technology. Good sales volume was also noted in digital imaging and technical security.
Operating profit for the financial year amounted to MSEK 55 (51), equivalent to an operating margin of 6.3 percent (6.4). Lower margins in solutions for digital image processing were compensated by the acquired business volume in control engineering. The division’s companies in technical security reported increased profitability.
During the second quarter, the operations in LIAB Load Indicator AB were acquired. During the third quarter, the operations in Precimeter Control AB were acquired and finally during the fourth quarter, the operations in Excidor AB were acquired. For a more detailed de scription of these companies, see Acquisitions below.
Niche ProductsNet revenue for the 2014/15 financial year amounted to MSEK 389 (303). Revenue was positively impacted by acquisitions and by strong sales of storage and exposure solutions, spiral conveyors as well as packaging and dispenser solutions for the food processing industry.
Operating profit amounted to MSEK 61 (45), equivalent to an operating margin of 15.7 percent (14.9). The stronger earnings and margins were primarily due to the increased sales as mentioned above and the acquired businesses. During the fourth quarter, Svenska Industriborstar i Västerås AB and Dooman Teknik AB were acquired, which are described under Acquisitions below.
PARENT COMPANYThe Parent Company’s internal net revenue for the financial year amounted to MSEK 34 (34) and profit after net financial items was MSEK 234 (162). The result includes exchange rate adjustments on intraGroup lending of MSEK 1 (3) and dividends from subsidiaries of MSEK 218 (149). Investments in noncurrent assets amounted to MSEK 0 (1).
MSEK 372 of the total credit facility of MSEK 700 was utilised at the end of the period (308). The Parent Company’s equity ratio was 56 percent (54).
EMPLOYEESAt the end of the period, the number of employees in the Group was 1,139, compared to 1,010 at the beginning of the financial year. During the financial year, 78 employees were added via acquisitions.
SHARES, REPURCHASES AND MAJOR SHAREHOLDERSThe share capital amounted to MSEK 48.9 at the end of the period. As of 31 March 2015, the distribution into classes of shares was 1,087,934 Class A shares and 22,085,375 Class B shares, for a total of 23,173,309 shares. The Class A share is not listed. The quota value per share is SEK 2.11. The Articles of Association allow for conversion of Class A shares to Class B shares. 4,032 shares were converted during the year.
The 2014 Annual General Meeting (AGM) authorised the Board of Directors to repurchase up to 10 percent of the total number of shares in the company. Repurchases shall be made via the stock exchange. Among other things, the mandate included the possibility of covering the company’s obligations under incentive programmes, where call options on repurchased shares have been acquired by managers and key persons in the Group. However, no own Class B shares were repurchased during the financial year. A total of 66,600 repurchased Class B shares were sold for a total of MSEK 4 during the financial year in connection with redemption of options. In addition, 137,600 outstanding options were repurchased for a total of MSEK 10 and MSEK 2 was received in connection with subscription for new call options.
At the end of the period, Lagercrantz Group held 582,450 Class B shares, equivalent to 2.5 percent of the total number of shares and 1.8 percent of the votes in the Lagercrantz Group. The average cost of the repurchased shares amounts to SEK 43.17 per share. Repurchased shares cover, inter alia, the company’s obligation under outstand ing call option programmes for repurchased shares, where a total of 566,300 options have been acquired by senior executives.
This refers to awards in 2012, 2013 and 2014 of options still outstanding. The redemption price for each programme is SEK 69.40, SEK 125.40, and SEK 161.80 per share.
During the 2014/15 financial year, 225,000 options with a redemption price of SEK 161.80 were issued in accordance with the resolution of the 2014 AGM. These options were acquired by senior executives in the Group for a total of MSEK 2.
During the first six months of the year, incentive programmes were redeemed based on options on repurchased Class B shares acquired by managers and senior executives in the Group during 2011. In connection with the redemption of options, a total of 52,350 Class B shares were sold for a total of MSEK 3. In addition, 43,150 outstanding options were repurchased for a total of MSEK 3. No outstanding options remain under this programme.
During the third quarter, parts of the incentive programmes based on options on repurchased Class B shares acquired by senior executives in the Group during 2012 were redeemed. In connection with the redemption of options, a total of 14,250 repurchased own Class B shares were sold for a total of MSEK 1. For this, 94,450 outstanding options were repurchased for a total of MSEK 7.
Two shareholders held more than ten percent of the votes as of 31 March 2015: Anders Börjesson and family with 16.4 percent and Tom Hedelius with 14.8 percent. Lannebo Fonder, with 13.2 percent of the capital, was the largest owner in terms of the number of shares owned.
The above holdings are calculated based on the number of shares and votes, not including the shares held by the Lagercrantz Group.
AGREEMENTSThere are no significant agreements to which the company is a party that enter into effect or are amended or terminated if control of the company changes due to a public takeover bid.
ACQUISITIONSA total of five businesses were acquired during the financial year.
During the second quarter, the operations in LIAB Load Indicator AB were acquired. Load Indicator is a niche company that designs and manufactures high quality load cells, force sensors and torque sensors for measurement applications to Swedish manufacturing in dustry. The company generates total annual sales of about MSEK 30 with good profitability. The company has been part of the Communications division since August 2014.
During the third quarter, the operations in Precimeter Control AB were acquired. Precimeter is a niche product company that develops and sells solutions based on laser and induction technology. Precimeter’s solutions measure levels and flows of metals and most of its customer base consists of aluminium foundries and their suppliers. The company, including its subsidiaries in Germany and the US, generates total annual sales of about MSEK 30 with good profitability. The company has been part of the Communications division since October 2014.
During the fourth quarter, the operations were acquired in Excidor AB, Svenska Industriborstar i Västerås AB and Dooman Teknik AB.
Excidor has a strong market position in control systems for mobile operator environments. The company’s solutions are primarily found in forest machinery, excavators and wheel loaders and it generates total annual sales of just over MSEK 30 with good profitability. The company has been part of the Lagercrantz Communications division since February 2015.
Svenska Industriborstar i Västerås AB (SIB) develops, sells and manufactures speciallydesigned steel and plastic brushes for snow clearance of airport runways and for industrial applications in manufacturing industry. SIB’s cassette brush system is market leading at North European airports and has a strong position in North America. Exports represent a large part of sales. SIB generates total annual sales of about MSEK 45 with good profitability. The company has been part of the Lagercrantz Niche Products division since February 2015.
4w w w. l a g e r c r a n t z . c o m
L a g e r c r a n t z G r o u p A B ( p u b l ) A n n u a l R e p o r t 2 014 / 15
Dooman Teknik AB offers products in the field of home adaptations for disabled people with garage modules for disability vehicles as a main product. The customers mainly consist of Swedish municipalities. Dooman generates annual sales of about MSEK 25 with good profitability. The company has been part of the Lagercrantz Niche Products division since February 2015.
After the end of the period, the operations in Cue Dee AB were acquired. Cue Dee primarily develops and sells brackets that meet strict requirements in terms of endurance and flexibility. The brackets are used for mounting of telecommunications and other equipment in masts, on roofs or in other exposed areas. The company manufactures speciallyadapted masts and related peripheral equipment for various applications such as wind measurement. The customers are global and are mainly found in the telecommunications sector and consist of internet providers, operators and installation engineers. The company, including its subsidiary in China, generates annual sales of about MSEK 180 with good profitability. Cue Dee has been part of Lagercrantz’s Mechatronics division since April 2015.
Estimated consideration for the six businesses acquired during the financial year amounted to MSEK 462. This amount includes estimated contingent consideration of MSEK 108 for the companies, which represents 82 percent of the maximum outcome. The outcome depends on the profit achieved by the companies.
Transactions costs for the five acquisitions made during the financial year amounted to MSEK 2, and are included in Administrative expenses in the income statement.
Goodwill in the Group increased by MSEK 63 as a result of the five acquisitions during the financial year and other intangible assets increased by MSEK 71, mostly related to trademarks, patents and products. In addition, property, plant and equipment of MSEK 6 was added. The deferred tax liability related to the acquisitions amounted to MSEK 17.
The effect of the completed acquisitions on consolidated revenue during the financial year was MSEK 56 and the effect on profit before tax was MSEK 7 after acquisition costs. Had the acquired operations been consolidated as of 1 April 2014, the effect on revenue and profit before tax would have been MSEK 164 and MSEK 26, respectively, after acquisition costs.
During the financial year, contingent consideration reserved but not paid of MSEK 24 was taken up as revenue as other operating income. The annual impairment testing resulted in impairment losses of MSEK 24 in respect of goodwill, which are recognised as other operating expenses in the consolidated income statement. These items are of a nonrecurring character and are recognised under Group items.
The acquisition analysis for the acquired businesses is presented in Note 38.
TRANSACTIONS WITH RELATED PARTIESTransactions between Lagercrantz and related parties with a signi ficant impact on the company’s financial position and results have not occurred, aside from the issuance of options described under Distribution of Shares above.
SOCIAL RESPONSIBILITYLagercrantz Group’s operations are based on longterm relationships with customers and suppliers, as well as strong ethics and great respect for all individuals in the company and in connection with external contacts.
Much like in other parts of the Group’s business, the concrete work with social responsibility is highly decentralised within the framework of the guidelines adopted by Lagercrantz Group. The Group has adopted guidelines for business ethics (Code of Conduct) for how employees, suppliers and other stakeholders should be treated in a lawful, fair and ethical manner.
Lagercrantz Group supports the philosophy of the UN Global Compact (www.globalcompact.org), the ILO’s core conventions (www.ilo.org), and the OECD’s guidelines for multinational companies (www.oecd.org), and the Code of Conduct is inspired by these principles.
The Group’s longterm goal is that all customers and suppliers to the Group’s companies should comply with the Code of Conduct. Lagercrantz Group complies with the Swedish Business Code issued by the Swedish Institute Against Bribes (IMM), which aims to guide companies in questions regarding how gifts, rewards and other benefits may be used in the business sector to promote the company’s operations. All selling and marketing of products and services must also be in accordance with relevant laws and regulations in each country.
Lagercrantz Group’s work relating to social issues (Corporate Social Responsibility – CSR) is coordinated by the Group’s CFO. Examples of activities carried out during the financial year 2014/15 include information about and training in the Group’s Code of Conduct for all employees. This has involved producing information and training material at head office that each subsidiary’s president can use locally. The material is published in all of the home languages of the Group’s subsidiaries. In the annual internal followup of the internal control and governance that occurs in each company, these activities have been followed up to ensure that local personnel are reached.
During the year, the Group has also focused on ensuring that companies follow the Group’s guidelines on how gifts, rewards and other benefits may be used so that they are not regarded as bribes.
In line with the Group’s Code of Conduct, Lagercrantz has created models for evaluation of suppliers that each subsidiary can use in its procurement of goods for resale and input goods.
Lagercrantz requires that suppliers shall share and meet the current requirements in the Group’s Code of Conduct. To ensure compliance, visits are made to the more important suppliers.
ENVIRONMENTAL IMPACTResponsibility for improving the environment and participating in sustainable development is a key point of departure for the Group’s business. The business operations consist of trading and distribution and own manufacturing operations in some companies. The Group’s impact on the environment is limited and is mainly connected to transportation of input goods, finished products, business trips and waste management. In addition, some of the Group’s companies are large consumers of electric power in their production operations. The Group’s companies are continually working to reduce the environ mental impact of their operations. Environmental work is conducted locally, based on the specific conditions for each individual company. In certain instances, e.g. in procurement of transport services and electric power, some coordination among companies occurs.
All the Group’s companies strive for high efficiency in their use of energy and natural resources, promote systems for reuse and recycling of materials and energy, and also prevent and limit environmental pollution. The ambition is to be sensitive to the wishes of customers and suppliers, thereby meeting market demands for proactive environmental work. Several of the companies in the Group work with quantitative goals in their environmental efforts. The Group conducts business in four of its subsidiaries that require a permit under the Swedish Environmental Code, relating to waste water treatment. There are no known threats from an environmental viewpoint that could jeopardise these operations.
RESEARCH AND DEVELOPMENTWith the aim of strengthening and developing Lagercrantz Group’s position in its areas of operation, the Group allocates resources primarily to the creation of different solutions for customers and partners, products, and development of proprietary trademarks. Activities carried out during 2014/15 included product development in particular. Development occurs in close cooperation with the customer and always based on identified customer needs. Pure research operations are not conducted.
Development expenditure consists of ongoing costs for product development under own management and in collaboration with customers and suppliers as well as amortisation of investments in new products and acquired intangible assets.
5w w w. l a g e r c r a n t z . c o m
L a g e r c r a n t z G r o u p A B ( p u b l ) A n n u a l R e p o r t 2 014 / 15
RISKS AND UNCERTAINTY FACTORSLagercrantz Group’s profit, financial position and future development are affected by internal factors which are controlled by the Group, as well as by external factors, where opportunities to affect the course of events are limited. The focus instead is on managing the consequences of these. The most important risk factors are the economic situation, structural changes in the Group’s markets, supplier and customer dependence, the competitive situation, seasonal variations and financial risks, as described below.
Financial and political uncertainties are the most obvious uncertainty factors for Lagercrantz Group. After the severe and general economic downturn during 2008 – 2009, a number of measures were taken in the Group in relation to costs, working capital and investments, among other things. When demand subsequently grew stronger in early 2010/11, the Group had a favourable situation, with a reduced cost base and a strong financial position, all of which had a positive effect on the Group during the following years.
During the 2014/15 financial year, the market was characterised by continued stability and a gradual, but slow improvement. Of our most important markets, Sweden and Denmark performed well while the weak performance in Finland continued. In Norway, the market turned downwards due to the lower oil price, which we estimate has affected the construction market, for example. The underlying organic growth for the Group was positive in all quarters during the year with total growth of 5 percent for the year. With a rising share of international expanding product companies in the portfolio, the risks for larger shifts in demand and growth can be offset.
Economic situationLagercrantz is affected by the overall economic trend, which is usually measured in terms of GDP growth. Since Lagercrantz Group almost exclusively sells its products and services to companies and public authorities, it is primarily these entities’ buying decisions that affect the Group’s operations. Lagercrantz Group tries to meet the risks that result from changes in market conditions by sector diversification, niche focus and its decentralised structure. Sector diversification means that, seen across the entire Group, customers are in different phases of an economic cycle. As a consequence of the Group’s niche focus, Lagercrantz is less dependent on one or a few end markets for its growth and profitability. This means that a change in market conditions in one sector or one country may have an impact on an individual company with a niche towards parts of this sector or geographical area, but it will have less effect on the Group’s overall performance. The decentralised structure means that it is the responsibility of the individual profit centres to keep on top of their respective markets and take swift action when they start to detect changes in market conditions.
Structural changesLagercrantz Group works actively on increasing the value of its offer, irrespective of customer group. This has clearly contributed to the Group’s improved profitability, and the fact that the Group continues to be a prioritised supplier to many customers. An important part of this work has been to be more selective in choosing customers and market segments where the Group has an opportunity to create a strong market position, which makes it more difficult to replace us with another supplier.
Another structural change that affects our business is the increasingly fast pace of technological development, and the generally shorter product life cycles. This imposes more stringent demands on the companies to stay close to the customers in order to identify new trends, and to know when it is commercially warranted to enter a new technology area, or to phase out an existing one. Overall, the product areas in Lagercrantz Group have relatively long product life cycles.
To further offset the risks in any structural changes, the Group’s product companies work with a diversified structure as regards manufacturing, where certain products are produced by subcontractors, while certain other products are manufactured in own facilities.
Supplier and customer dependenceDependency on individual suppliers is one of the most significant operational risks for an individual subsidiary to manage. Some of the companies in the Group have developed their business based on one or a few strong supplier relationships. If one of these were to disappear, it would affect the company, especially in the short term, before alternatives have been found. In order to minimise this risk, the subsidiaries work closely with their suppliers in order to create strong relationships on several levels. All subsidiaries also work on identifying alternative suppliers before they are actually needed. The Group also increasingly works on analysing supplier and customer relationships based on contract structure, product liability issues and insurable risks to minimise the consequences of the loss of a supplier or customer. In recent years, the Group has also worked successfully to reduce the risks associated with late payment, or nonpayment, by customers. Measures have included credit assessment and followup of new and existing customers, as well as active management of late payments.
Overall in the Group, there is a large number of suppliers and distribution agreements and of these only a few are of such major economic importance that special action would be required if one of them were lost. A number of supplier agreements expire and are added each year in the normal course of business, however. Only one supplier represents more than about five percent of the Group’s combined sales.
Lagercrantz Group has a broad customer structure, spread over a number of industrial segments and geographical markets. No customer represents more than 5 percent of the Group’s overall sales.
Competitive situationLagercrantz operates in an environment of global competition. New technological solutions and efficiency improvements result in constant price pressure and requirements for innovation. To compete successfully, Lagercrantz Group operates in niches with a focus on developing and maintaining a strong market position. A niche is defined internally as a welldefined technology area or customer segment with a total market value of approximately MSEK 200 – 1,000.In each niche, Lagercrantz Group attempts to capture a unique po sition through great value creation for customers and suppliers. With strong customer relationships, a welladapted product offering, high quality, service, support and other additional services we become a soughtafter supplier. This limits the competition from global players and Lagercrantz Group’s businesses can continue their positive de velopment in the short and long term.
Seasonal variationsLagercrantz Group’s business is only affected to a limited extent by seasonal variations. Operations normally follow the seasonal pattern of manufacturing industry, which means lower sales during holiday periods. Based on a historical pattern, just under half of the profit is generated during the first two quarters, i.e. the period April to September, and just over half during the last two quarters of the financial year, in other words, the period October to March. In line with the change in the Group’s structure prompted by a growing share of exportrelated business, the seasonal pattern has been evened out to a large extent.
Financial risks and sensitivity analysisFor an account of the Group’s and the Parent Company’s financial risks and sensitivity analysis, refer to Note 41.
CORPORATE GOVERNANCE REPORTSince the 2009/10 financial year, the Board of Directors of Lagercrantz Group has prepared a statutory corporate governance report in accordance with the Swedish Annual Accounts Act (1995:1554), chapter 6, sections 6 – 9, which is subject to review by the company’s auditor. In addition to this, Lagercrantz Group applies the Swedish Code of Corporate Governance in accordance with the revised code that entered into force on 1 February 2010. Since the legislation and the code partially overlap, Lagercrantz Group submits the following
6w w w. l a g e r c r a n t z . c o m
L a g e r c r a n t z G r o u p A B ( p u b l ) A n n u a l R e p o r t 2 014 / 15
corporate governance report, which takes account of the Swedish Annual Accounts Act as well as the Swedish Code of Corporate Governance. The company complies with the Code in all essential aspects. In four respects (two of which are found in the section on the Nomination Committee, one in the section on the Audit Committee, and one in the section on incentive programmes) an explanation is offered for the deviations. The report also contains an account of the work of the Nomination Committee ahead of the 2015 AGM.
Corporate governance structureLagercrantz Group is a Swedish public limited liability company with its registered office in Stockholm. The company, through its subsidiaries, conducts technology trading and has been listed on the Nasdaq Stockholm exchange since 2001, and on its Mid Cap list since January 2014. Governance and control of the company is exercised through a combination of written rules and established practice. In the first instance, the regulatory framework consists of the Swedish Companies Act and the Swedish Annual Accounts Act, but also includes the Swedish Code of Corporate Governance and the rules that apply to the regulated market where the company’s shares are listed for trading.
The Swedish Companies Act contains basic rules for the company’s organisation. The Swedish Companies Act stipulates that there should be three decisionmaking bodies: the General Meeting of Shareholders, the Board of Directors and the President & Chief Executive Officer, in a hierarchical relationship with each other. There must also be a monitoring body, the auditor, who is appointed by the General Meeting of Shareholders.
ShareholdersAs of 31 March 2015, the number of shareholders was 3,494, compared to 3,347 at the beginning of the financial year. Private individuals owned 31 percent (32) of the number of shares outstanding and 51 percent (51) of the votes in the company. The remaining shares were owned by legal entities, primarily mutual funds, insurance companies and pension funds. Foreign shareholders owned 20 percent (19) of the shares outstanding and 14 percent (13) of the votes. The combined holding of the ten largest shareholders was 58 percent (59) of the shares outstanding and 68 percent (68) of the votes.
The above calculations are based on the number of shares outstanding, not including repurchased shares held by Lagercrantz Group.
General Meeting of Shareholders and Articles of AssociationThe General Meeting of Shareholders is the highest decision making body in Lagercrantz Group. Here, shareholders exercise their influence through discussions and resolutions. The General Meeting decides on all issues that do not expressly fall under the jurisdiction of another corporate body. Every shareholder has the right to participate in the proceedings of and to vote for their shares at the General Meeting in accordance with the provisions of the Articles of Association.
Lagercrantz Group’s Annual General Meeting (AGM) shall be held in Stockholm within six months of the end of the financial year. The AGM appoints the Board of Directors and the auditors and determines their fees. The AGM also adopts the financial statements, decides on the appropriation of profits and on discharge from liability for the Board of Directors and the President, and decides on other matters that according to the Articles of Association or legislation should be brought before the General Meeting.
The Articles of Association have been adopted by the General Meeting. This document prescribes that the company’s shares are issued in two classes, where Class A shares carry 10 votes and Class B shares carry one vote per share. The company’s share capital shall be a minimum of SEK 25,000,000 and a maximum of SEK 100,000,000. The minimum number of shares outstanding shall be 12,500,000 and the maximum number of shares outstanding shall be 50,000,000. Both classes of shares carry the same rights to share in the company’s assets and profits. The Articles of Association allow for conversion of Class A shares into Class B shares. The Articles of Association also stipulate that the company’s Board of Directors shall consist of not less
than three and not more than nine members, and regulates the forms of notice for General Meetings.
Notice for Annual General Meetings, and notice for Extraordinary General Meetings, where an amendment of the Articles of Association will be on the agenda, shall be issued not more than six weeks and not less than four weeks before the Meeting. Notice for other Extraordinary General Meetings shall be issued not more than six weeks and not less than two weeks before the Meeting. Notice convening a General Meeting shall take the form of an announcement in Post och Inrikes Tidningar and on the company’s website. It shall also be concurrently announced in Dagens Industri that notice has been given.
Shareholders who wish to participate in the proceedings of the General Meeting shall (i) be entered in a transcript or other version of the entire share register showing the state of affairs five weekdays before the General Meeting and (ii) give notice to the company for himself/herself and up to two assistants not later than at 3:00 p.m. on the date specified in the notice for the General Meeting.
Since 2005, the AGM has also determined the form for how a Election Committee should be appointed.
Annual General Meeting 2014The 2014 AGM was held on 26 August in Stockholm. Notice for the Meeting was given on 18 July 2014 in Dagens Industri and Post och Inrikes Tidningar, and was announced on the same day in a press release. At the AGM, shareholders representing 11.0 million shares and 20.0 million votes, respectively, were present. This is equivalent to 49 percent of the number of shares outstanding and 62 percent of the shares in the company.
Resolutions passed by the AGM included the following: A dividend of SEK 4.00 per share was declared in accordance with the proposal of the Board of Directors.
Discharge from liability was granted to the Board of Directors and the President for their administration during 2013/14.
All Board members and the Chairman of the Board of Directors were reelected in accordance with the proposal of the Election Committee.
Fees for the Board of Directors and the auditors were determined. Routines were established for appointment of a Nomination Committee ahead of the next AGM.
Principles for remuneration and other terms of employment for senior executives were approved.
In accordance with the proposal of the Board of Directors, the AGM resolved that the company – in a departure from the preemptive rights of shareholders – invite managers and senior executives to acquire up to 225,000 call options on repurchased Class B shares.
The Board of Directors was authorised during the period until the next AGM to acquire and sell shares, on one or more occasions, representing up to 10 percent of the shares in the company.
Board of DirectorsIt is the duty of the Board of Directors to manage the affairs of the company in the best possible way and to look after the interests of the shareholders. Lagercrantz Group AB’s Board of Directors consisted during 2014/15 of seven ordinary members who together have broad commercial, technical and public experience:
Anders Börjesson, Chairman Tom Hedelius, Vice Chairman Pirkko Alitalo Marika Rindborg Holmgren Lennart Sjölund Roger Bergqvist Jörgen Wigh, President and CEO
A detailed presentation of the members of the Board of Directors, including information about other assignments may be found under Board of Directors and Auditors on page 40. Other officers in the Group can participate in Board meetings as a reporting member or secretary.
7w w w. l a g e r c r a n t z . c o m
L a g e r c r a n t z G r o u p A B ( p u b l ) A n n u a l R e p o r t 2 014 / 15
Chairman of the Board of DirectorsThe Chairman of the Board of Directors leads the work of the Board and has a special responsibility to follow the company’s development between Board meetings, and to ensure that the members of the Board are continually provided with the information necessary to perform satisfactory work. The Chairman maintains regular contact with members of the management team and holds meetings with them as required. The Chairman is also responsible for evaluating of the work of the Board for ensuring that the Election Committee is informed of the result of the evaluation.
The Board’s workThe Board of Directors held ten recorded meetings during the 2014/15 financial year, one of which was the statutory meeting in conjunction with the AGM. The work of the Board follows rules of procedure that are adopted on an annual basis. These rules of pro cedure establish the division of labour between the Board of Directors and the President, the Chairman’s and the President’s responsibility, and the forms for the financial reporting.
The President is a member of the Board of Directors and presents reports at Board meetings. The Board has appointed the Group’s CFO to serve as secretary. The Board of Directors forms a quorum when at least four members are present and, where possible, de cisions are made after a discussion that leads to consensus. The Board was in full attendance at all meetings during the year, aside from one meeting when one member was absent due to illness.
During regularly scheduled Board meetings, the company’s economic and financial position are dealt with as well as risks facing the company and internal control. One item on the agenda relates to acquisitions. The Board is kept continually informed by way of information in writing about the company’s business and other relevant information.
During 2014/15, the work of the Board was dominated by questions relating to acquisitions, market development and the business model. One Board meeting was devoted solely to discussing the Group’s position and strategy.
The work of the Board is evaluated annually following an established procedure, which includes discussions around:
Agenda and material for the Board of Directors Number of meetings Strategic plan and direction Review of Auditing Overall responsibility Competence Work of the Chairman
The Board of Directors dealt with the most recent evaluation during a meeting in January 2015. In accordance with the Code, the Board of Directors evaluated the work of the President & CEO at a meeting without the presence of the President or other senior executives.
Total fees to the Board of Directors of Lagercrantz Group for 2014/15 amounted to SEK 1,650,000 (1,558,000). In accordance with an AGM resolution, the Chairman of the Board received SEK 440,000 (440,000), the Vice Chairman SEK 330,000 (330,000) and the other ordinary members who are not employees of the company received SEK 220,000 (220,000) each. See also Note 6.
Remuneration CommitteeThe Board has appointed a Remuneration Committee from among its members with the task of preparing the Board’s proposal to the AGM on guidelines for remuneration to the President and CEO, and other senior executives. The Committee also has the task of following up and implementing the AGM’s resolutions with respect to principles of remuneration for senior executives. During 2014/15, the Remuneration Committee consisted of Anders Börjesson, Chairman of the Board, and Tom Hedelius, Vice Chairman of the Board. The President & CEO presents reports but does not participate in matters concerning him. The Committee held one meeting during the year. All members of the Committee attended this meeting.
Audit CommitteeThe Board has appointed an Audit Committee, which has the duty of analysing and discussing the company’s risk management, governance and internal control. During 2014/15, the Committee consisted of all Board members with the exception of the President & CEO. In the opinion of the Board of Directors, this is most appropriate in view of Lagercrantz Group’s size and business. The Audit Committee maintains contact with the company’s auditors to discuss the direction and scope of the audit work. In connection with the adoption of the annual accounts, the company’s auditors report on their observations during the course of their audit and their assessment of the internal control. The Committee also has the result of the annual review of the internal control at its disposal. The Committee held one meeting during the year. All members of the committee were present at this meeting.
Because of the structure with an annual selfassessment of the internal control, performed by each company during the third quarter and which in turn is reviewed by the company’s auditors, and the extensive work that a traditional examination by the company’s auditors would entail, the Board of Directors has chosen to deviate from the recommendation of the Swedish Code of Corporate Governance calling for a review of the halfyearly report or the interim report for the third quarter.
AuditorsRegistered Audit Company KPMG AB was elected to serve as auditor at the 2014 AGM. The audit firm has appointed Joakim Thilstedt, Authorised Public Accountant, to serve as auditor in charge.
In order to ensure insight and control by the Board of Directors, each year the Board is given an opportunity to provide its opinion on the auditors’ planning of the audit’s scope and focus. After completing its review of the internal control and accounting records, the auditors report on their findings at the Board meeting in May. In addition to this, the auditors are invited to attend Board meetings when the Board of Directors or the auditors feel that there is a need. The independence of the auditors is ensured by the audit firm’s internal guidelines. Their independence has been confirmed to the Audit Committee.
ManagementThe Chief Executive Officer and Group management draw up and implement Lagercrantz Group’s overall strategies and deal with issues such as acquisitions, disposals and major capital investments. Such issues are prepared by Group management for decision by the Parent Company’s Board of Directors. The President & CEO is responsible for daytoday management of the Company in accordance with the decisions and guidelines of the Board of Directors.
Lagercrantz Group’s Group management consists of the President & CEO, Executive Vice President and the Group’s Chief Financial Officer. The management team consists of Group management and division heads /business area managers – in total eight persons who constitute the Group’s senior executives. A detailed presentation of the management team can be found under Management on page 41. The management team meets on a monthly basis to discuss the Group’s and the subsidiaries’ results and financial position, as well as issues pertaining to strategy, budget followup, forecasts and the performance of the business. The Group Controller is also present at these meetings. Other issues discussed include acquisitions, joint projects, consolidated financial reporting, communication with the stock market, internal and external communication, and coordination and followup of security, environment and quality.
Remuneration to senior executives Lagercrantz Group’s principles for remuneration of senior executives mean that compensation to the President & CEO and other persons in the management team may consist of basic salary, variable remuneration, pension, other benefits and financial instruments.
Guidelines for remuneration of senior executives as resolved by the 2014 AGM and information about existing incentive programmes are
8w w w. l a g e r c r a n t z . c o m
L a g e r c r a n t z G r o u p A B ( p u b l ) A n n u a l R e p o r t 2 014 / 15
described in Note 6 of this Annual Report and are summarised below.The overall remuneration must be marketrelated and competitive,
and should be commensurate with responsibility and authority. The annual variable salary component should be maximised to about 40 percent of the fixed salary. The variable salary component should also be based on outcome relative to set goals and individual performance.
The retirement age shall be 60 – 65 years and in addition to an ITP plan, only defined contribution pension plans will normally be offered. In the case of termination of employment, termination benefits equivalent to a maximum of one annual salary may be offered, in addition to salary during the period of notice. In addition to existing incentive programmes and the programme proposed to the AGM, no other sharebased or sharepricerelated programmes will be offered.
In individual cases and if special circumstances exist, the Board may depart from the above guidelines.
The proposal of the Board of Directors to the 2015 AGM for guidelines for remuneration to senior executives is that the principles for remuneration of the President & CEO and other senior executives should be unchanged compared to the principles described above.
Operational controlThe Group’s operating activities are carried on in subsidiaries of the Lagercrantz Group. Active Board work is conducted in all subsidiaries under the management of division heads. The subsidiaries’ Boards follow the daytoday operations and establish business plans. Operations are conducted in accordance with the rules, guidelines and policies adopted by the Group management, and by guidelines established by each subsidiary’s Board of Directors. Subsidiary presidents have profit responsibility for their respective companies, as well as responsibility to secure growth and development in their companies. Allocation of investment capital in the Group is determined following a decision by the Parent Company Lagercrantz Group’s Board of Directors in accordance with an annually updated capital expenditure policy.
Operational control in the Lagercrantz Group is defined by clear demands from the Group management and freedom of action for each subsidiary to make decisions and to reach established goals.
Internal controlThe purpose of the internal control is to ensure that the company’s strategies and goals are followed up and that shareholder investments are protected. A secondary purpose is to ensure Groupwide accurate and relevant information to the stock market in accordance with generally accepted accounting principles in Sweden and that laws, regulations and other requirements on listed companies are complied with in the whole Group. The Board of Directors of Lagercrantz Group has delegated the practical responsibility to the President & CEO, who in turn has allocated the responsibility to the other members of the management team and to subsidiary presidents.
Control activities take place in the entire organisation at all levels. Followup is included as an integrated element of the management’s daytoday work.
For the financial reporting there are policies and guidelines, and also automatic control in systems as well as reasonability assessment of flows and amounts.
Management makes regular assessments of any new financial risks that may arise and the risk for errors in the existing financial reporting. The Group’s financial department under the management of the Group’s CFO conducts an annual evaluation of the internal control in the companies. This is performed by each company as a selfassessment based on predefined questions which are drawn up by the financial department in consultation with the Group’s auditors. This evaluation aims to examine the Group’s internal control routines and compliance with them. The result is reviewed by the Group’s auditors, who in turn report their observations and recommendations to the Audit Committee.
Controls are made taking transaction flows, staffing and control mechanisms into account. The focus is on significant income
statement and balance sheet items and areas where there is a risk that the consequences of any errors would be considerable.
The Board of Directors is of the opinion that a business of Lagercrantz Group’s scope, in a decentralised organisation, in a well defined geographical market, does not require a more extensive audit function in the form of an internal audit department. The Board of Directors reviews this issue on an annual basis.
To ensure good communication with the capital market, the Board of Directors has adopted a communications policy. This policy determines what should be communicated, by whom and how. The basic premise is that regular financial information is provided in the form of:
Press releases about significant or pricesensitive events Interim reports, yearend report and press release in conjunction with the Annual General Meeting
Annual Report
Through openness and transparency, the Board of Directors and man agement of Lagercrantz Group work to provide the company’s owners and the stock market with relevant and accurate information.
Election CommitteeThe principal task of the Election Committee is to propose Board members, the Chairman of the Board of Directors and auditors and to propose fees for Board members, the Chairman and auditors, so that the AGM can make wellfounded decisions. At the AGM 2012, the principles for the Election Committee’s mandate were determined, and how the Committee shall be appointed. This shall be valid until the AGM decides to change these principles. This means that the Chairman of the Board was tasked with contacting the largest shareholders in terms of votes as of 31 December 2014, requesting them to appoint members, to form an Election Committee together with the Chairman of the Board. In accordance with this, an Election Committee was formed consisting of:
Anders Börjesson, Chairman of the Board Tom Hedelius, Vice Chairman of the Board Martin Wallin (representing Lannebo Fonder) Johan Strandberg (representing SEB Fonder) Jens Barnevik (representing Didner & Gerge Fonder)
The Election Committee has access to the evaluation made by the Board of Directors of its work, and information about the company’s operations and strategic direction. The proposals of the Election Committee as well as its motives will be published in connection with the notice convening the AGM and will also be made available on the company’s website. The mandate period of the Election Committee lasts until a new nomination committee has been appointed. No fees are payable for Nomination Committee work.
In a deviation from the Swedish Code of Corporate Governance, the Chairman of the Board of Directors, Anders Börjesson, has also held the position of Chairman of the Election Committee. Tom Hedelius, Vice Chairman of the Board, has also been a member of the Election Committee. The explanation for this deviation is that Anders Börjesson and Tom Hedelius also are the company’s largest owners in terms of votes. Lagercrantz Group’s strategic direction, as well as its business and governance model, is based on aspects such as a strong commitment from the company’s principal owners. This approach pervades Lagercrantz Group’s corporate culture and has proved to be vital for the Group’s successful development.
The Board of Directors and the Election Committee are of the opinion that a majority of the Board members are independent in relation to the company and corporate management, and that at least three of these members are also independent in relation to the company’s major shareholders.
Incentive programmeA longterm incentive programme has been in place since 2006 for managers and senior executives in the Group in accordance with an AGM resolution. The purpose of the programme is to raise motivation and create participation for managers and senior executives in
9w w w. l a g e r c r a n t z . c o m
L a g e r c r a n t z G r o u p A B ( p u b l ) A n n u a l R e p o r t 2 014 / 15
PROPOSED APPROPRIATION OF PROFITSThe Board of Directors proposes that the following profits, SEK 842,686 thousand, at the disposal of the Annual General Meeting shall be allocated as follows:
Dividend to the shareholders, SEK 4.50 × 22,590,859 shares* 101,659To be carried forward 741,027
Total 842,686
* Based on the total number of shares outstanding as of 31 March 2015. The total dividend amount is subject to change until the record day, depending on share repurchases and transfer of shares to participants in long-term incentive programmes.
In making the proposal for dividend, the company’s dividend policy, equity ratio and financial position in other respects were taken into account, and due consideration was given to the company’s ability to fulfil present and anticipated payment obligations in a timely manner and to carry out necessary investments.
BOARD ASSURANCEThe consolidated and Parent Company income statements and the consolidated statement of financial position and the Parent Company balance sheet will be subject to approval at the Annual General Meeting on 25 August 2015. We consider that the consolidated financial statements have been prepared in accordance with the international financial reporting standards referred to in regulation (EG) No.1606/2002 of 19 July 2002 of the European Parliament and the Council on the application of international financial reporting standards and provide a true and fair view of the financial position and results of operations of the Group. The annual accounts have been prepared in accordance with generally accepted accounting principles in Sweden and provide a true and fair view of the financial position and results of operations of the Parent Company. The Report of the Board of Directors for the Group and the Parent Company provides a true and fair overview of the business activities, financial position and results of operations of the Group and the Parent Company and describes the significant risks and uncertainty factors facing the Group and the Parent Company.
Stockholm 24 June 2015
Anders Börjesson Tom Hedelius Chairman of the Board Vice Chairman of the Board
Pirkko Alitalo Roger Bergqvist Lennart Sjölund Board member Board member Board member
Marika Rindborg Holmgren Jörgen Wigh Board member President and Board member
Our audit report was submitted on 24 June 2015
KPMG AB
Joakim ThilstedtAuthorised Public Accountant
relation to the opportunities for the company’s development. The programme also aims to motivate managers and senior executives to remain employed in the Group. The programme is a recurring programme based on call options on repurchased Class B shares. Options have been issued every year from 2006 – 2014, according to the resolution of the AGM each year. The 2012, 2013 and 2014 programmes are currently outstanding. Outstanding programmes mean that shares can be acquired on three different occasions, two of which fall within three years from issuance and thus constitute a deviation from the Swedish Code of Corporate Governance. The purpose of this is to allow redemption on several occasions. A complete description of outstanding option programmes is provided in Note 6.
POST-BALANCE SHEET EVENTS Lagercrantz acquired Cue Dee AB on 8 April 2015, also see under Acquisitions above. No other significant events for the company have occurred after the balance sheet date on 31 March 2015. FUTURE DEVELOPMENTThe Group’s two most important tasks for the future are to continue developing existing businesses and to continue focusing on growth, both organic as well as growth through acquisitions.
Financial and political challenges exist in many parts of the world. It is unclear what will be the result of these challenges, which makes it difficult to identify the trends in these areas. However, Lagercrantz Group has its main exposure to Nordic industry, where the situation has been, and is expected to continue to be stable. Although Lagercrantz Group always has a cautious attitude and follows the changes in the surrounding world diligently, the Group is investing for growth.
Since the Group has been working on lowering its costs and increasing its added value, improved profitability has been created and the Group is now wellprepared for the future. In addition, the company is gaining additional revenue and profit from successful acquisitions. The Group’s ambition is to continue increasing the share of proprietary products, primarily through acquisitions.
DIVIDENDThe Board of Directors proposes a dividend of SEK 4.50 (4.00) per share. The dividend is equivalent to a total of MSEK 102 (90) and constitutes 50 percent (51) of the profit for the year. The size of the dividend is based on a balance between the Group’s capital structure and future opportunities for expansion. The Board of Directors is of the opinion that the proposed dividend leaves room for the Group to fulfil its obligations and to make necessary investments.
10w w w. l a g e r c r a n t z . c o m
L a g e r c r a n t z G r o u p A B ( p u b l ) A n n u a l R e p o r t 2 014 / 15
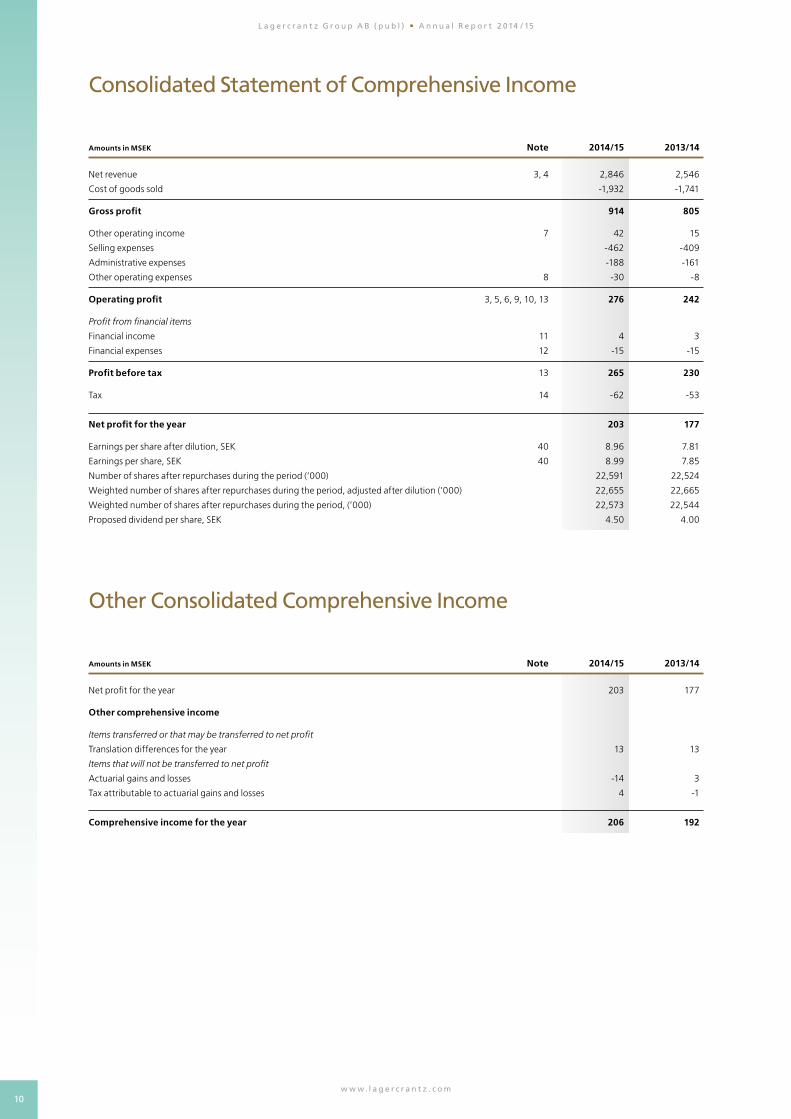
Consolidated Statement of Comprehensive Income
Amounts in MSEK Note 2014/15 2013/14
Net revenue 3, 4 2,846 2,546
Cost of goods sold -1,932 -1,741
Gross profit 914 805
Other operating income 7 42 15
Selling expenses -462 -409
Administrative expenses -188 -161
Other operating expenses 8 -30 -8
Operating profit 3, 5, 6, 9, 10, 13 276 242
Profit from financial items
Financial income 11 4 3
Financial expenses 12 -15 -15
Profit before tax 13 265 230
Tax 14 -62 -53
Net profit for the year 203 177
Earnings per share after dilution, SEK 40 8.96 7.81
Earnings per share, SEK 40 8.99 7.85
Number of shares after repurchases during the period (’000) 22,591 22,524
Weighted number of shares after repurchases during the period, adjusted after dilution (’000) 22,655 22,665
Weighted number of shares after repurchases during the period, (’000) 22,573 22,544
Proposed dividend per share, SEK 4.50 4.00
Other Consolidated Comprehensive Income
Amounts in MSEK Note 2014/15 2013/14
Net profit for the year 203 177
Other comprehensive income
Items transferred or that may be transferred to net profit
Translation differences for the year 13 13
Items that will not be transferred to net profit
Actuarial gains and losses -14 3
Tax attributable to actuarial gains and losses 4 -1
Comprehensive income for the year 206 192
11w w w. l a g e r c r a n t z . c o m
L a g e r c r a n t z G r o u p A B ( p u b l ) A n n u a l R e p o r t 2 014 / 15
Consolidated Statement of Financial Position
Amounts in MSEK Note 31 Mar 2015 31 Mar 2014
ASSETS 3
Non-current assets
Intangible assets
Goodwill 15 628 584
Trademarks 16 169 170
Other intangible assets 17 186 126
983 880
Property, plant and equipment
Buildings, land and land improvements 18 56 49
Costs incurred in leasehold property 19 2 1
Plant and machinery 20 73 58
Equipment, tools, fixtures and fittings 21 36 32
167 140
Financial assets
Other non-current receivables 24, 33 2 2
2 2
Deferred tax assets
Deferred tax assets 31 9 7
9 7
Total non-current assets 1,161 1,029
Current assets
Inventories etc 25
Raw materials and consumables 106 82
Work in progress 28 30
Finished goods and goods for resale 179 167
313 279
Current receivables 33
Trade receivables 26 437 439
Earned but not yet invoiced income 27 11 11
Tax assets 27 19
Other receivables 46 34
Prepaid expenses and accrued income 28 31 28
552 531
Cash and cash equivalents 33 80 38
Total current assets 945 848
TOTAL ASSETS 2,106 1,877
12w w w. l a g e r c r a n t z . c o m
L a g e r c r a n t z G r o u p A B ( p u b l ) A n n u a l R e p o r t 2 014 / 15
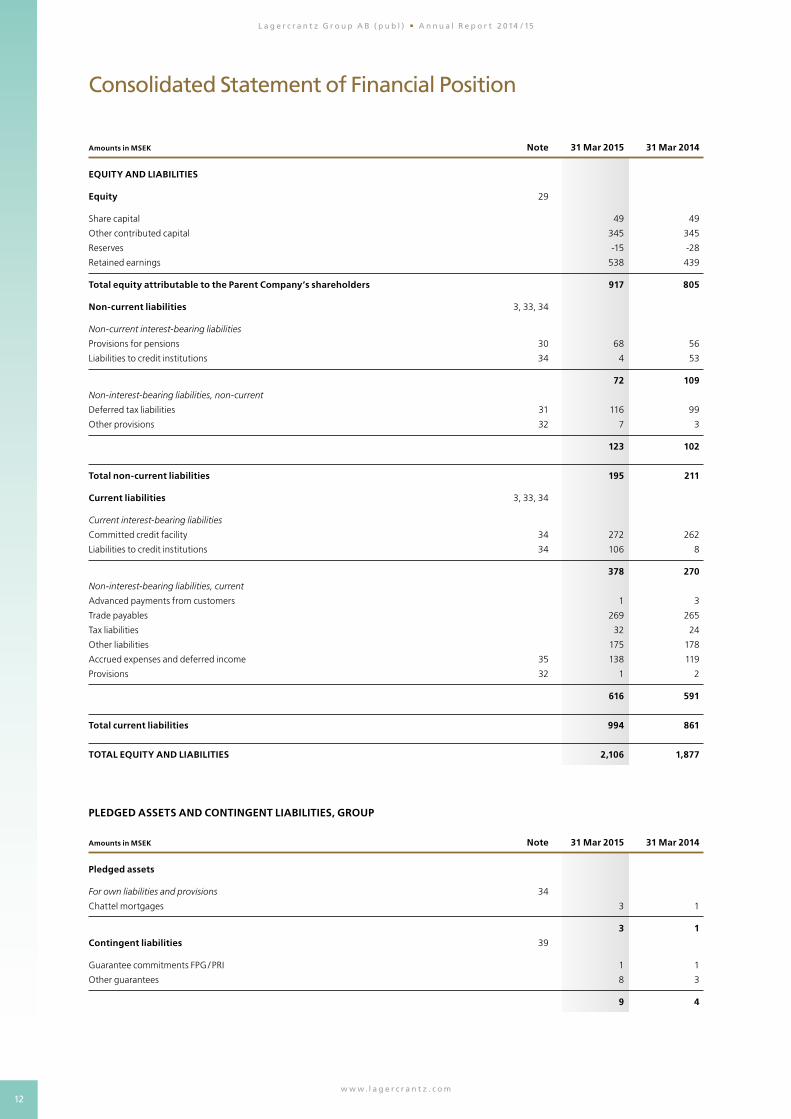
Consolidated Statement of Financial Position
Amounts in MSEK Note 31 Mar 2015 31 Mar 2014
EQUITY AND LIABILITIES
Equity 29
Share capital 49 49
Other contributed capital 345 345
Reserves -15 -28
Retained earnings 538 439
Total equity attributable to the Parent Company’s shareholders 917 805
Non-current liabilities 3, 33, 34
Non-current interest-bearing liabilities
Provisions for pensions 30 68 56
Liabilities to credit institutions 34 4 53
72 109
Non-interest-bearing liabilities, non-current
Deferred tax liabilities 31 116 99
Other provisions 32 7 3
123 102
Total non-current liabilities 195 211
Current liabilities 3, 33, 34
Current interest-bearing liabilities
Committed credit facility 34 272 262
Liabilities to credit institutions 34 106 8
378 270
Non-interest-bearing liabilities, current
Advanced payments from customers 1 3
Trade payables 269 265
Tax liabilities 32 24
Other liabilities 175 178
Accrued expenses and deferred income 35 138 119
Provisions 32 1 2
616 591
Total current liabilities 994 861
TOTAL EQUITY AND LIABILITIES 2,106 1,877
PLEDGED ASSETS AND CONTINGENT LIABILITIES, GROUP
Amounts in MSEK Note 31 Mar 2015 31 Mar 2014
Pledged assets
For own liabilities and provisions 34
Chattel mortgages 3 1
3 1
Contingent liabilities 39
Guarantee commitments FPG / PRI 1 1
Other guarantees 8 3
9 4
13w w w. l a g e r c r a n t z . c o m
L a g e r c r a n t z G r o u p A B ( p u b l ) A n n u a l R e p o r t 2 014 / 15
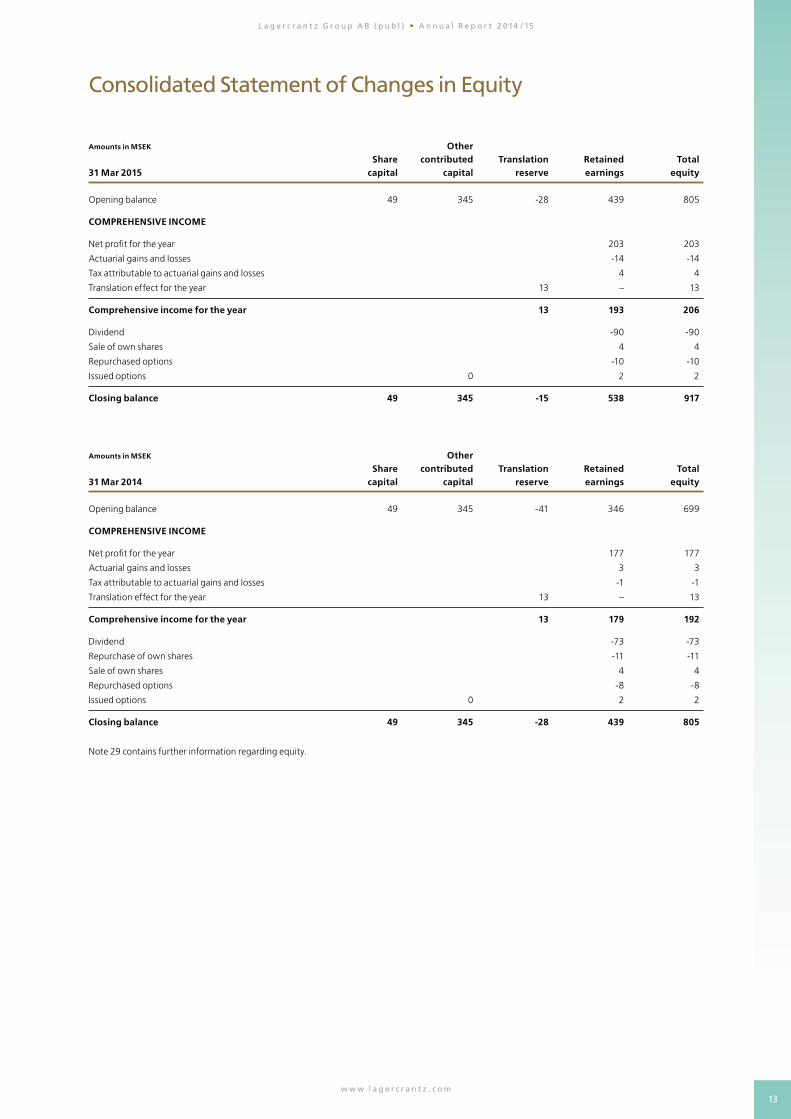
Consolidated Statement of Changes in Equity
Amounts in MSEK Other Share contributed Translation Retained Total 31 Mar 2015 capital capital reserve earnings equity
Opening balance 49 345 -28 439 805
COMPREHENSIVE INCOME
Net profit for the year 203 203
Actuarial gains and losses -14 -14
Tax attributable to actuarial gains and losses 4 4
Translation effect for the year 13 – 13
Comprehensive income for the year 13 193 206
Dividend -90 -90
Sale of own shares 4 4
Repurchased options -10 -10
Issued options 0 2 2
Closing balance 49 345 -15 538 917
Amounts in MSEK Other Share contributed Translation Retained Total31 Mar 2014 capital capital reserve earnings equity
Opening balance 49 345 -41 346 699
COMPREHENSIVE INCOME
Net profit for the year 177 177
Actuarial gains and losses 3 3
Tax attributable to actuarial gains and losses -1 -1
Translation effect for the year 13 – 13
Comprehensive income for the year 13 179 192
Dividend -73 -73
Repurchase of own shares -11 -11
Sale of own shares 4 4
Repurchased options -8 -8
Issued options 0 2 2
Closing balance 49 345 -28 439 805
Note 29 contains further information regarding equity.
14w w w. l a g e r c r a n t z . c o m
L a g e r c r a n t z G r o u p A B ( p u b l ) A n n u a l R e p o r t 2 014 / 15
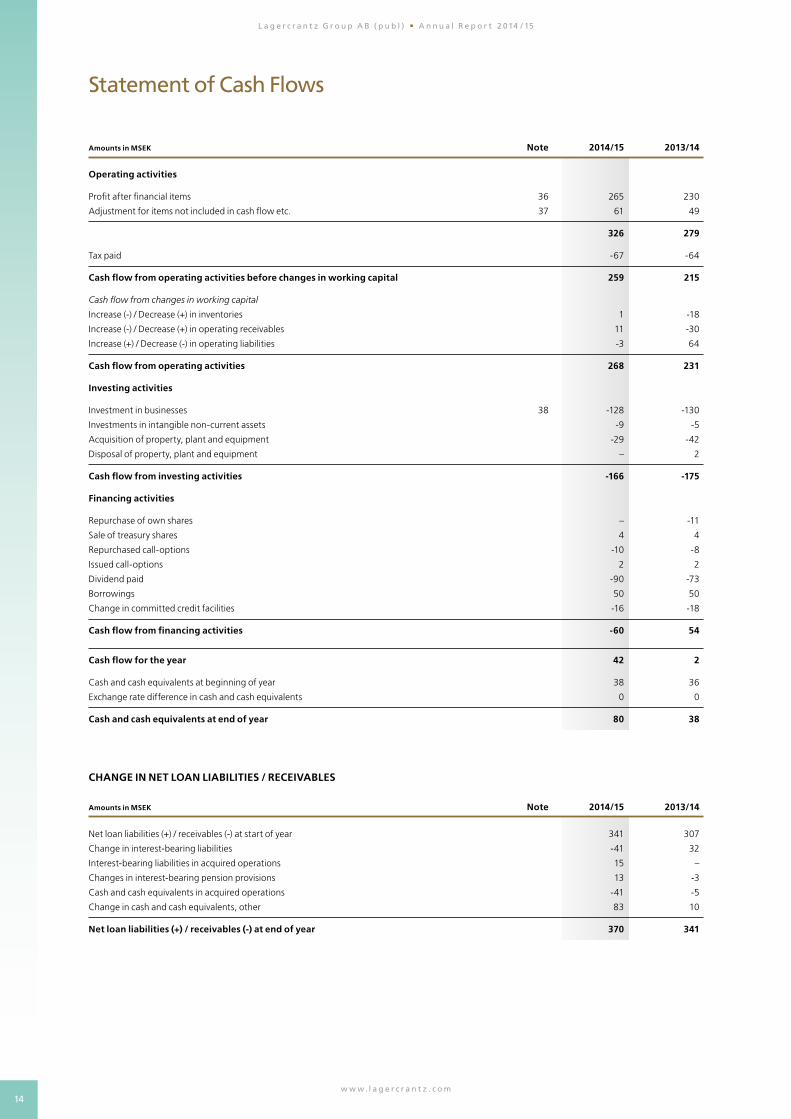
Statement of Cash Flows
Amounts in MSEK Note 2014/15 2013/14
Operating activities
Profit after financial items 36 265 230
Adjustment for items not included in cash flow etc. 37 61 49
326 279
Tax paid -67 -64
Cash flow from operating activities before changes in working capital 259 215
Cash flow from changes in working capital
Increase (-) / Decrease (+) in inventories 1 -18
Increase (-) / Decrease (+) in operating receivables 11 -30
Increase (+) / Decrease (-) in operating liabilities -3 64
Cash flow from operating activities 268 231
Investing activities
Investment in businesses 38 -128 -130
Investments in intangible non-current assets -9 -5
Acquisition of property, plant and equipment -29 -42
Disposal of property, plant and equipment – 2
Cash flow from investing activities -166 -175
Financing activities
Repurchase of own shares – -11
Sale of treasury shares 4 4
Repurchased call-options -10 -8
Issued call-options 2 2
Dividend paid -90 -73
Borrowings 50 50
Change in committed credit facilities -16 -18
Cash flow from financing activities -60 54
Cash flow for the year 42 2
Cash and cash equivalents at beginning of year 38 36
Exchange rate difference in cash and cash equivalents 0 0
Cash and cash equivalents at end of year 80 38
CHANGE IN NET LOAN LIABILITIES / RECEIVABLES
Amounts in MSEK Note 2014/15 2013/14
Net loan liabilities (+) / receivables (-) at start of year 341 307
Change in interest-bearing liabilities -41 32
Interest-bearing liabilities in acquired operations 15 –
Changes in interest-bearing pension provisions 13 -3
Cash and cash equivalents in acquired operations -41 -5
Change in cash and cash equivalents, other 83 10
Net loan liabilities (+) / receivables (-) at end of year 370 341

15w w w. l a g e r c r a n t z . c o m
L a g e r c r a n t z G r o u p A B ( p u b l ) A n n u a l R e p o r t 2 014 / 15
Parent Company Income Statement
Amounts in MSEK Note 2014/15 2013/14
Net revenue 3, 4 34 34
Gross profit 34 34
Administrative expenses -47 -48
Other operating income and operating expenses -1 -1
Operating profit 3, 6, 9, 10, 13 -14 -15
Profit from financial items
Financial income 11 258 215
Financial expenses 12 -10 -38
Profit after financial items 13 234 162
Appropriations
Change in untaxed reserves 0 –
Profit before tax 234 162
Tax 14 -4 -3
Net profit for the year 230 159
Other Comprehensive Income, Parent Company
Amounts in MSEK Note 2014/15 2013/14
Net profit for the year 230 159
Other comprehensive income – –
Comprehensive income for the year 230 159
16w w w. l a g e r c r a n t z . c o m
L a g e r c r a n t z G r o u p A B ( p u b l ) A n n u a l R e p o r t 2 014 / 15
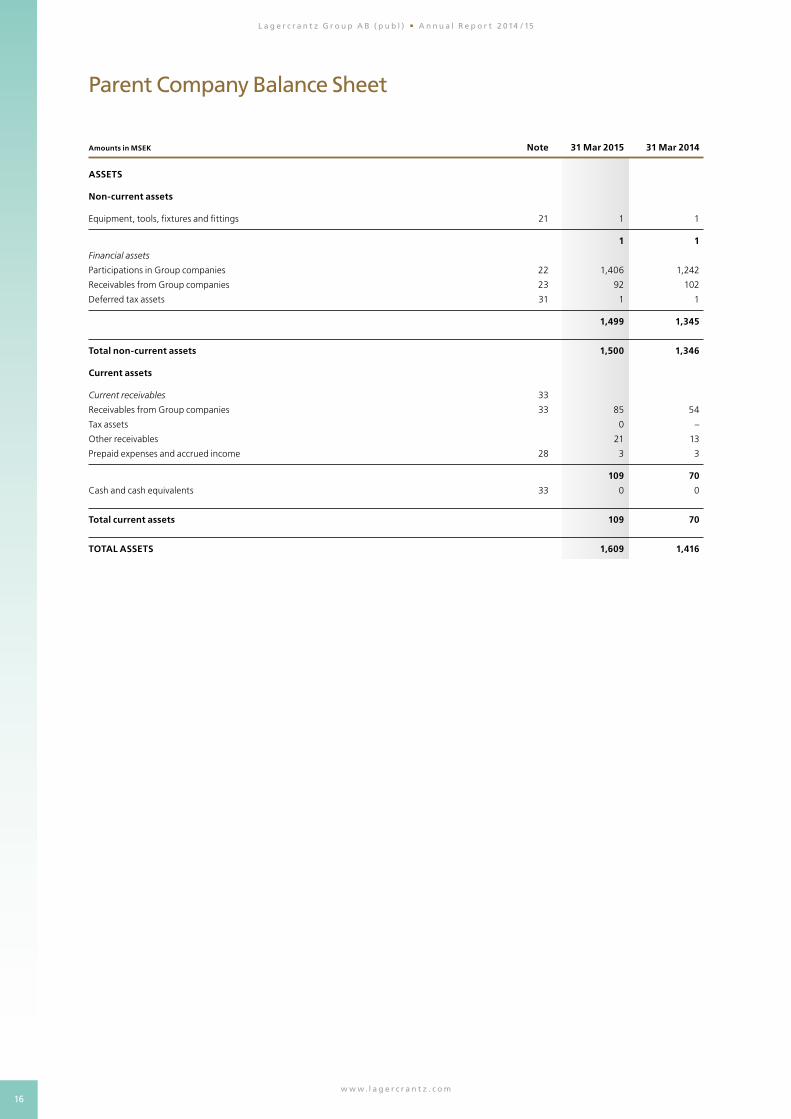
Parent Company Balance Sheet
Amounts in MSEK Note 31 Mar 2015 31 Mar 2014
ASSETS
Non-current assets
Equipment, tools, fixtures and fittings 21 1 1
1 1
Financial assets
Participations in Group companies 22 1,406 1,242
Receivables from Group companies 23 92 102
Deferred tax assets 31 1 1
1,499 1,345
Total non-current assets 1,500 1,346
Current assets
Current receivables 33
Receivables from Group companies 33 85 54
Tax assets 0 –
Other receivables 21 13
Prepaid expenses and accrued income 28 3 3
109 70
Cash and cash equivalents 33 0 0
Total current assets 109 70
TOTAL ASSETS 1,609 1,416
17w w w. l a g e r c r a n t z . c o m
L a g e r c r a n t z G r o u p A B ( p u b l ) A n n u a l R e p o r t 2 014 / 15
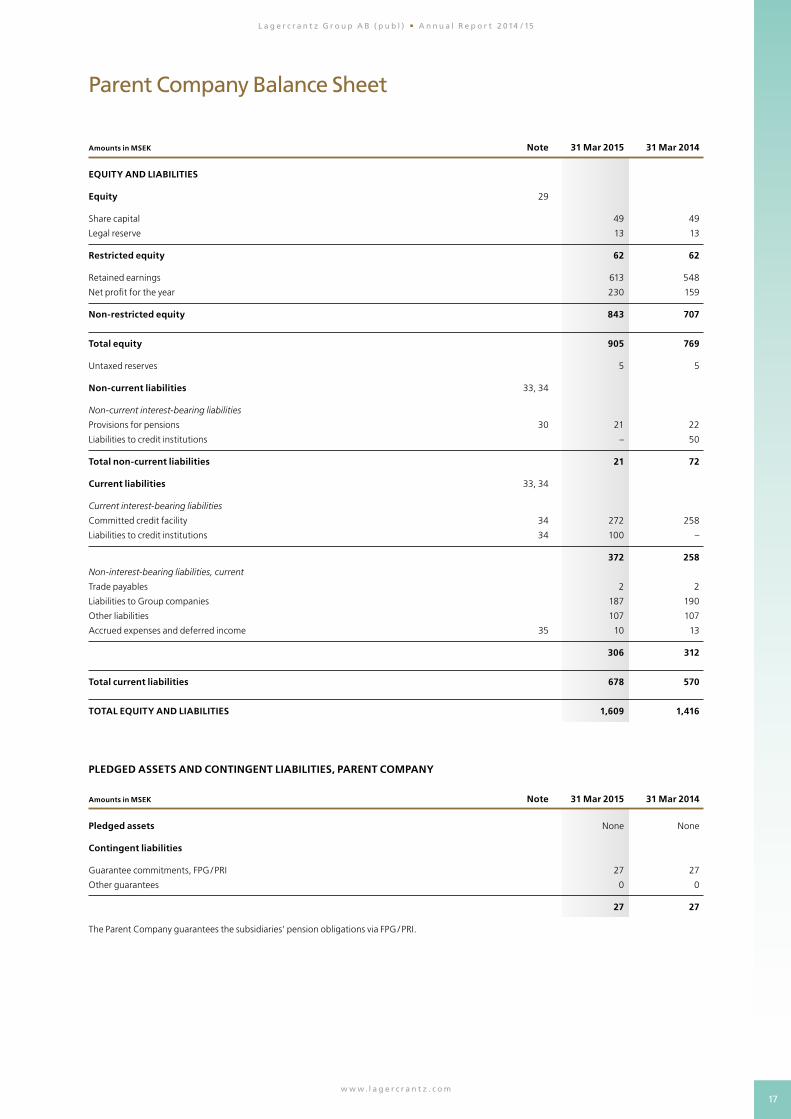
Parent Company Balance Sheet
Amounts in MSEK Note 31 Mar 2015 31 Mar 2014
EQUITY AND LIABILITIES
Equity 29
Share capital 49 49
Legal reserve 13 13
Restricted equity 62 62
Retained earnings 613 548
Net profit for the year 230 159
Non-restricted equity 843 707
Total equity 905 769
Untaxed reserves 5 5
Non-current liabilities 33, 34
Non-current interest-bearing liabilities
Provisions for pensions 30 21 22
Liabilities to credit institutions – 50
Total non-current liabilities 21 72
Current liabilities 33, 34
Current interest-bearing liabilities
Committed credit facility 34 272 258
Liabilities to credit institutions 34 100 –
372 258
Non-interest-bearing liabilities, current
Trade payables 2 2
Liabilities to Group companies 187 190
Other liabilities 107 107
Accrued expenses and deferred income 35 10 13
306 312
Total current liabilities 678 570
TOTAL EQUITY AND LIABILITIES 1,609 1,416
PLEDGED ASSETS AND CONTINGENT LIABILITIES, PARENT COMPANY
Amounts in MSEK Note 31 Mar 2015 31 Mar 2014
Pledged assets None None
Contingent liabilities
Guarantee commitments, FPG / PRI 27 27
Other guarantees 0 0
27 27
The Parent Company guarantees the subsidiaries’ pension obligations via FPG / PRI.
18w w w. l a g e r c r a n t z . c o m
L a g e r c r a n t z G r o u p A B ( p u b l ) A n n u a l R e p o r t 2 014 / 15
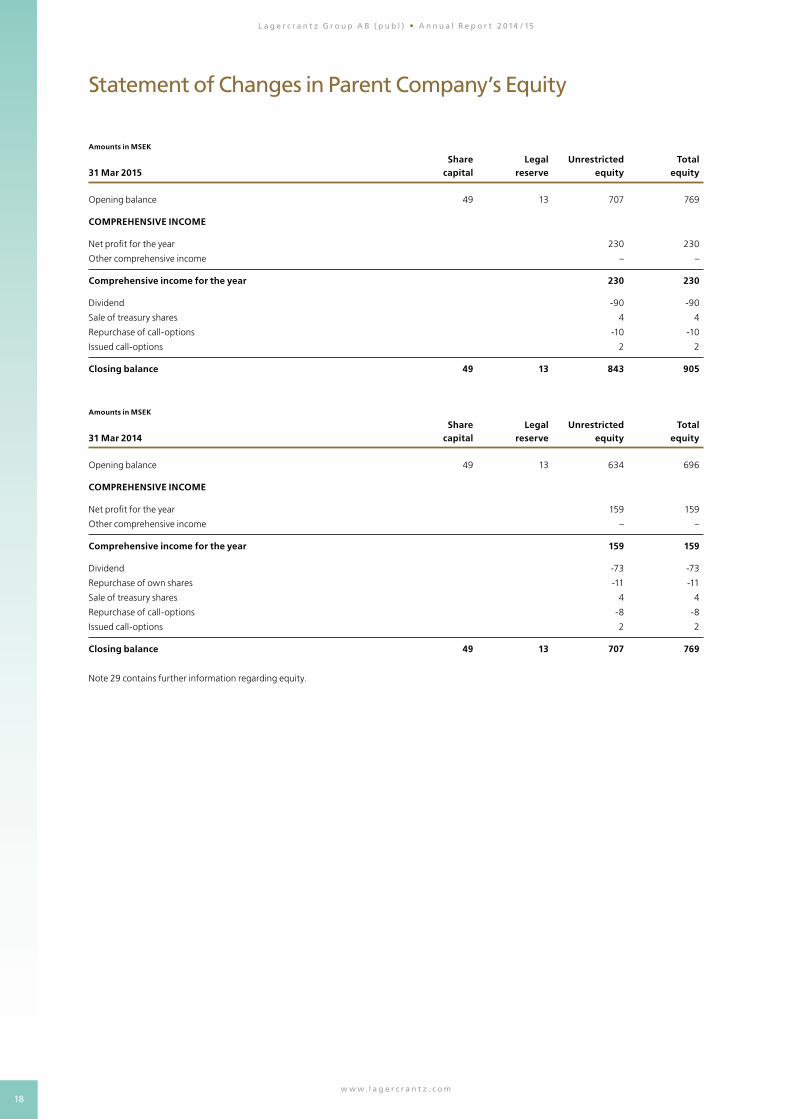
Statement of Changes in Parent Company’s Equity
Amounts in MSEK Share Legal Unrestricted Total31 Mar 2015 capital reserve equity equity
Opening balance 49 13 707 769
COMPREHENSIVE INCOME
Net profit for the year 230 230
Other comprehensive income – –
Comprehensive income for the year 230 230
Dividend -90 -90
Sale of treasury shares 4 4
Repurchase of call-options -10 -10
Issued call-options 2 2
Closing balance 49 13 843 905
Amounts in MSEK Share Legal Unrestricted Total31 Mar 2014 capital reserve equity equity
Opening balance 49 13 634 696
COMPREHENSIVE INCOME
Net profit for the year 159 159
Other comprehensive income – –
Comprehensive income for the year 159 159
Dividend -73 -73
Repurchase of own shares -11 -11
Sale of treasury shares 4 4
Repurchase of call-options -8 -8
Issued call-options 2 2
Closing balance 49 13 707 769
Note 29 contains further information regarding equity.
19w w w. l a g e r c r a n t z . c o m
L a g e r c r a n t z G r o u p A B ( p u b l ) A n n u a l R e p o r t 2 014 / 15
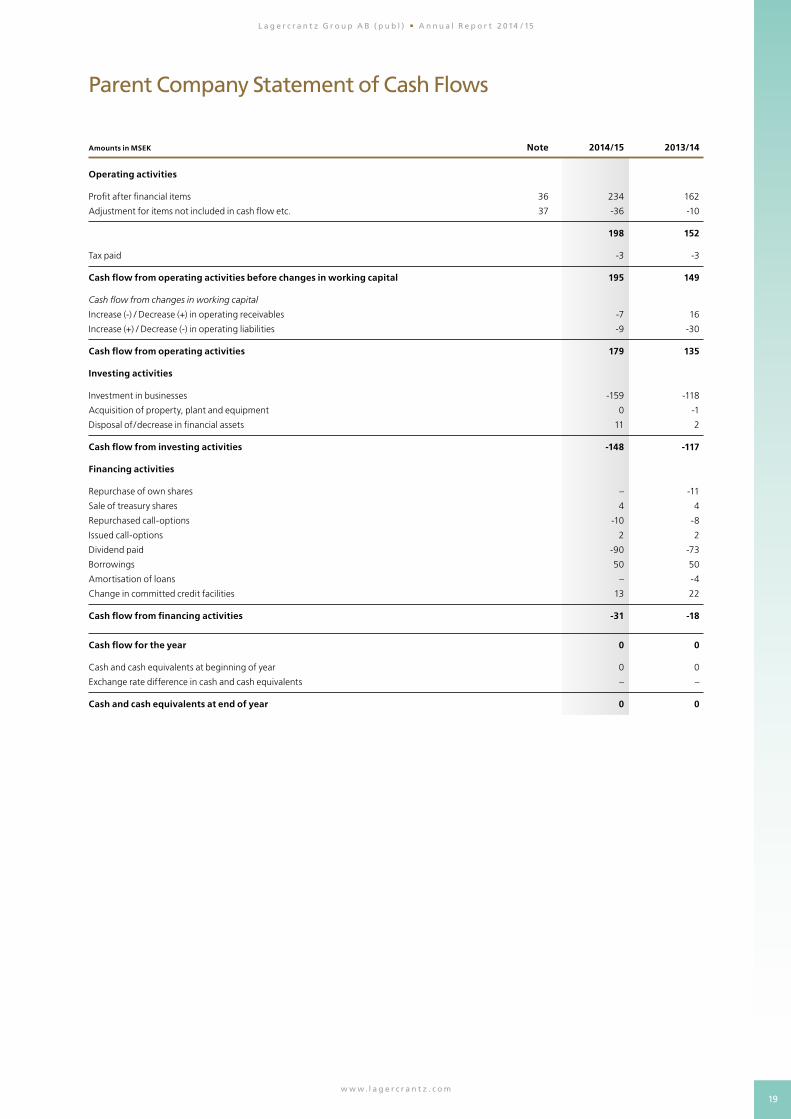
Parent Company Statement of Cash Flows
Amounts in MSEK Note 2014/15 2013/14
Operating activities
Profit after financial items 36 234 162
Adjustment for items not included in cash flow etc. 37 -36 -10
198 152
Tax paid -3 -3
Cash flow from operating activities before changes in working capital 195 149
Cash flow from changes in working capital
Increase (-) / Decrease (+) in operating receivables -7 16
Increase (+) / Decrease (-) in operating liabilities -9 -30
Cash flow from operating activities 179 135
Investing activities
Investment in businesses -159 -118
Acquisition of property, plant and equipment 0 -1
Disposal of /decrease in financial assets 11 2
Cash flow from investing activities -148 -117
Financing activities
Repurchase of own shares – -11
Sale of treasury shares 4 4
Repurchased call-options -10 -8
Issued call-options 2 2
Dividend paid -90 -73
Borrowings 50 50
Amortisation of loans – -4
Change in committed credit facilities 13 22
Cash flow from financing activities -31 -18
Cash flow for the year 0 0
Cash and cash equivalents at beginning of year 0 0
Exchange rate difference in cash and cash equivalents – –
Cash and cash equivalents at end of year 0 0
20w w w. l a g e r c r a n t z . c o m
L a g e r c r a n t z G r o u p A B ( p u b l ) A n n u a l R e p o r t 2 014 / 15
Notes
Note 1 Accounting policies
(a) Compliance with standards and law
The consolidated financial statements have been prepared in accordance with
International Financial Reporting Standards (IFRS) issued by the Accounting
Standards Board (IASB) and interpretations from the IFRS Interpretations Committee
as approved by the EU Commission for application in the EU. In addition, the Swedish
Financial Reporting Board’s recommendation RFR 1, Supplementary Accounting
Rules for Groups has been applied.
The Parent Company applies the same accounting policies as the Group except in
the instances described below in the section “Parent Company accounting policies”.
Discrepancies that exist between the Parent Company’s and the Group’s policies are
due to limitations in applying IFRS in the Parent Company as a result of the Swedish
Annual Accounts Act and the Pension Obligation Vesting Act and in certain cases for
tax reasons.
(b) Basis of preparation of financial statements for the Parent Company
and the Group
The Parent Company’s functional currency is SEK, which also constitutes the
presentation currency for the Parent Company and the Group. This means that the
financial statements are presented in Swedish kronor. All amounts, unless otherwise
stated, are rounded off to the nearest million. Assets and liabilities are recognised at
historical cost, except for certain financial assets and liabilities, which are measured at
fair value. Financial assets and liabilities recognised at fair value consist of derivative
instruments, financial assets classified as financial assets, which are measured at fair
value through profit or loss.
Non-current assets and available-for-sale disposal groups are recognised at the lower
of the previous carrying amount and fair value, after deduction of selling expenses.
Set-off of receivables and liabilities and of revenue and costs occurs only where
required or expressly permitted in an accounting recommendation.
The financial reports include the Report of the Board of Directors with proposed
appropriation of profits and the financial statements with notes. The consolidated
financial statements and the Parent Company’s annual accounts have been approved
for publication by the Board of Directors on 24 June 2015. The consolidated income
statement and statement of financial position and the Parent Company’s income
statements and balance sheets are subject to adoption by the Annual General
Meeting on 25 August 2015.
Preparing the financial reports in accordance with IFRS requires management to
make judgments and estimates and make assumptions that affect the application
of accounting policies and the recognised amounts of assets, liabilities, revenue and
costs. Estimates and assumptions are based on historical experience and a number of
other factors that are deemed reasonable under prevailing circumstances. The result
of these judgments and assumptions is then used to judge the carrying amounts of
assets and liabilities that would not be evident from other sources. The actual out-
come may differ from these estimates and judgments. Estimates and assumptions
are reviewed on a regular basis. Changes in estimates are recognised in the period
when the change is made, where the change affects that period only, or in the period
when the change is made, and in future periods where the change affects the current
period as well as future periods.
Judgments made by management in the application of IFRS, which have a
significant impact on the financial statements and estimates made that may lead to
significant adjustments in the financial statements of subsequent years are described
in greater detail in Note 2 and elsewhere.
Events after the end of the reporting period include favourable as well as unfavour-
able events that occur between the end of the reporting period and the date at the
start of the next financial year when the financial reports are signed by the members
of the Board of Directors. Information is provided in the annual report about sign-
ificant events after the end of the reporting period that are not accounted for when
the income statement and the statement of financial position are adopted. Only such
events that confirm circumstances that prevailed before the end of the reporting
period are taken into account at the time of adopting the financial statements.
The stated accounting policies for the Group have been consistently applied for all
periods presented in the consolidated financial statements, unless otherwise stated.
The Group’s accounting policies have been consistently applied in reporting and
consolidating the Parent Company and subsidiaries.
Amended accounting policies
The amended accounting policies applied by the Group from 1 April 2014 are
described below. No other IFRS amendments that are applicable from 2014 have had
any material effect on the Group’s accounting.
IFRS 3 Business Combinations has been amended and it is now clarified that an obli-
gation to pay contigent consideration, that meets the definition of a financial instru-
ment, should either be classified as a financial liability or an equity instrument based
on the criteria in IAS 32. The standard also makes clear that contingent consideration,
which is not paid in the form of an equity instrument should be recognised at fair
value on each reporting date with changes in value in the income statement.
The change in IFRS 3 has not had any effect on the consolidated results and
financial position.
IFRS 10 Consolidated Financial Statements has been updated and provides an amend-
ed definition of control. The standard also contains updated guidance for determining if
an entity exercises control over another entity. Also see under the heading Subsidiaries.
New and revised IFRS that have been early adopted
New IFRS standards and interpretations that will only become effective in future
financial years, have not had any effect on the Group and therefore have not been
early adopted in the preparation of these financial statements.
New and revised IFRS not yet applied
A number of new or revised standards and interpretations will enter into force during
the coming financial year.
IFRS 9 Financial Instruments which replaces IAS 39 has now been completed but
has not been adopted by the EU. IFRS 9 contains a package of changes relating to
classification and measurement of financial instruments, a substantially-reformed
approach to hedge accounting and a new impairment model.
The new standard introduces three models for recognition of financial assets;
Fair val ue through profit or loss, Fair value through other comprehensive income and
Amort ised cost. Measurement in these three categories is made at fair value or amort-
ised cost, in other words unchanged compared to the current standard. The choice of
measurement techniques for a financial asset is determined under IFRS 9 by the entity’s
business model and the characteristics of the contractual cash flows of the instrument.
The introduction of IFRS 9 is estimated at present to only have a marginal effect on
the consolidated results and financial position.
The new revenue standard IFRS 15 Revenue from Contracts with Customers, which
replaces IAS 18 Revenue and IAS 11 Construction Contracts, means that revenue is
only recognised when the customer has gained control over the good or service. The
customer obtains control when they gain control of and can benefit from the good or
service. Revenue for supplied goods and services is recognised at the amount that re-
flects the consideration that the company expects to receive for such goods and serv-
ices. The standard has not yet been adopted by the EU. IFRS 15 impacts some of the
Group’s companies but the effects of this standard are expected to be insignificant.
None of these new standards have been early adopted on the preparation of the
financial statements for the financial year.
(c) Operating segment reporting
An operating segment is a part of the Group that conducts business activities
from which it can generate income and incur costs and for which independent
financial information is available. Operating segments are recognised in a manner
that corresponds with the Group’s internal reporting, which is followed up by the
Group’s chief operating decision-maker. The Group’s chief operating decision- maker
is the function responsible for allocating resources and evaluating the operating
segments’ results. Refer to Note 3 for an additional description of the breakdown and
presentation of operating segments.
(d) Classification, etc.
Non-current assets and non-current liabilities in the Parent Company and the Group
essentially consist only of amounts that are expected to be recovered or paid after
more than twelve months from the end of the reporting period. Current assets and
current liabilities in the Parent Company and the Group essentially consist only of
amounts that are expected to be recovered or paid within twelve months of the end
of the reporting period.
(e) Basis of consolidation
(i) Subsidiaries
Subsidiaries are all entities over which Lagercrantz Group AB exercises a controlling
influence, i.e. where Lagercrantz Group AB controls the entity. For control to arise,
the possibility and ability to manage the entity are required and to be exposed to
variable returns from it.
Subsidiaries are recognised in accordance with the acquisition method. This
method means that the acquisition of a subsidiary is treated as a transaction where
the Group indirectly acquires the assets of the subsidiary and assumes its liabilities
and conting ent liabilities. The cost of acquisition for the Group is determined by an
acquisition analysis in conjunction with the acquisition. In this acquisition analysis, the
fair values of acquired identifiable assets, and assumed liabilities and contingent lia-
bilities, as well as any non-controlling interests are determined. Transaction expens es
incurred are recognised directly in profit or loss. The difference between the cost of
acquisition of the shares in a subsidiary and the fair value of acquired assets, assumed
liabilities and contingent liabilities is recognised as goodwill in the Group. When the
difference is negative, it is recognised directly in the income statement.
Contingent consideration is recognised at fair value on the date of acquisition and
is remeasured at each reporting date and any change in value is recognised in profit
or loss.
An acquisition that does not relate to 100 percent of the subsidiary gives rise to a
non-controlling interest. There are two alternatives for recognising non-controlling
interests. These two alternatives are to recognise non-controlling interests’ proport-
ionate share of net assets or alternatively to recognise non-controlling interests at
fair value, which means that non-controlling interests have a share in goodwill. The
choice of which of the two alternative methods to apply is made individually for each
acquisition. In those cases where there are minority stakes in the Group, they have
been recognised at 100 percent and the minority share has been entered as a liability.
The financial statements of subsidiaries are consolidated from the date of acqui-
sition until the date when control ceases.
(ii) Transactions eliminated on consolidation
Intra-group receivables and liabilities, revenue or costs and unrealised gains or losses
arising in intra-group transactions between Group companies are eliminated in their
entirety when preparing the consolidated financial statements.
21w w w. l a g e r c r a n t z . c o m
L a g e r c r a n t z G r o u p A B ( p u b l ) A n n u a l R e p o r t 2 014 / 15
(f) Foreign currency
(i) Transactions in foreign currency
Transactions in foreign currency are translated to the functional currency using the
rate of exchange that prevailed on the transaction date. Monetary assets and liabil-
ities in foreign currency are translated to the functional currency at the rate of ex-
change that prevailed at the end of the reporting period. Exchange rate differences
that arise during translation are recognised in the income statement. Non- monetary
assets and liabilities recognised at historical cost are translated at the rate of ex-
change that prevailed at the transaction date. Non-monetary assets and liabilities
recognised at fair value are translated to the functional currency at the rate of
exchange that prevailed at the time of fair value measurement. The exchange rate
fluctuation is then recognised in the same way as other changes in value.
(ii) Financial statements of foreign operations
Assets and liabilities in foreign operations, including goodwill and other surpluses
and deficits in the Group are translated to Swedish kronor at the rate of exchange
that prevailed at the end of the reporting period. Revenue and costs in a foreign
operation are converted to Swedish kronor at an average rate. Translation differences
that arise in connection with currency translation of a foreign operation and the
related effects of hedging of net investments, are recognised directly in other
compre hensive income and are accumulated as a separate component in equity, the
translation reserve. When foreign operations are sold, the accumulated translation
differences attributable are realised after deduction of any hedging and reclassified
from the translation reserve in equity to profit or loss.
(g) Revenue
(i) Sale of goods
Revenue from the sale of goods is recognised in the income statement when
significant risks and rewards associated with ownership of the goods have been
transferred to the buyer, i.e. typically in connection with delivery. If the product
requires installation at the buyer, and the installation constitutes a significant part of
the delivery, revenue is recognised when the installation is completed. Revenue is not
recognised if it is probable that the economic rewards will not accrue to the Group.
Revenue from the sale of property
Revenue from the sale of property is normally recognised on the closing date, unless
risks and rewards have been transferred to the buyer on an earlier date.
(ii) Service assignments
Revenue from service assignments is normally recognised when the service is
performed. Revenue from service assignments of the service and maintenance agree-
ment type is recognised in accordance with the principles of the so-called percentage
of completion method. The stage of completion is normally determined based on the
proportion of expenditure incurred at the end of the reporting period compared to
the estimated total expenditure. In certain companies, recorded time is used as the
basis for the stage of completion. An expected loss is immediately recognised in the
consolidated income statement.
(iii) Rental income
Rental income from properties is recognised on a straight-line basis in the income
statement based on the terms of the lease. The aggregate cost of benefits provided
is recognised as a reduction of rental income on a straight-line basis over the term of
the lease.
(iv) Government grants
Government grants are recognised in the statement of financial position as prepaid
income when there is reasonable assurance that the grant will be received and that
the Group will be able to fulfil the conditions associated with the grant. Grants are
systematically allocated to the correct periods in the same way and in the same per-
iods as the costs that the grants are intended to compensate for. Government grants
related to assets are recognised as a reduction in the carrying amount of the asset.
(h) Operating expenses and financial income and expenses
(i) Payments relating to operating leases
Payments related to operating leases are recognised on a straight-line basis in the in-
come statement over the term of lease. Benefits received in connection with signing a
lease are recognised as a part of the total leasing cost in the income statement.
(ii) Payments relating to finance leases
The minimum leasing fees are allocated to interest expense and repayment of the
outstanding liability. The interest expense is distributed over the lease term in such a
way that each accounting period is charged with an amount equivalent to a fixed rate
of interest for the liability recognised during each period. Variable fees are expensed
in the periods when they arise.
(iii) Financial income and expenses
Finance income and expenses consists of interest income on bank balances,
receivables and interest-bearing securities, interest expense on loans, dividend in-
come, exchange differences, changes in value of financial assets measured at fair
value through profit or loss, impairment losses on financial assets and gains and
losses on hedging instruments recognised in profit or loss.
Interest income on receivables and interest expense on liabilities are calculated using
the effective interest method. The effective rate is the rate that means that the present
value of all estimated future incoming and outgoing payments during the expected
fixed interest term equals the carrying amount of the receivable or the liability. The in-
terest component of financial lease payments is recognised in the income statement
using the effective interest method. Interest income includes allocated amounts of
transaction costs and any rebates, discounts, premiums and other differences between
the original value of the receivable and the amount received at maturity.
Interest expense includes allocated amounts of issue expenses and similar direct
transaction costs in connection with raising loans.
Borrowing costs are recognised in the income statement using the effective rate
method, except to the extent they are directly attributable to the purchase, design or
production of assets that take significant time to complete for their intended use or
for sale, in which case they are part of the acquisition cost of the assets in question.
Dividend income is recognised when the right to receive payment has been determined.
(i) Financial instruments
Financial instruments are measured and recognised in the Group in accordance with
the rules in IAS 39. Financial instruments recognised on the asset side in the state-
ment of financial position include cash and cash equivalents, trade receivables, ad-
vance payments to suppliers and derivatives.
Liabilities include trade payables, borrowings, advance payments from customers
and derivatives.
Recognition and derecognition in the statement of financial position
A financial asset or a financial liability is carried in the statement of financial position
when the company becomes party to the contractual terms of the instrument. A re-
ceivable is recognised when the company has performed and a contractual obligation
exists for the counterparty to pay, even if no invoice has yet been sent. Trade receiv-
ables are recognised in the statement of financial position when an invoice has been
sent. A liability is carried when the counterparty has performed and a contractual
obligation to pay exists, even if an invoice has not been received. Trade payables
are recognised when an invoice has been received. A financial asset is derecognised
when the rights in the contract are realised, fall due or the company loses control
over it. The same holds true for a part of a financial asset. A financial liability is dere-
cognised when the contractual liability is discharged or otherwise expires. The same
applies to a part of a financial liability. Acquisition and disposal of financial assets are
recognised on the transaction date.
Measurement
Financial instruments, which are not derivatives, are initially measured at cost, equiva-
lent to the fair value of the instrument. A financial instrument’s classification determ-
ines how it is measured after initial recognition. IAS 39 classifies financial instruments
in categories. The classification depends on the purpose for which the financial in-
strument was acquired. The relevant categories for the Group are as follows:
Financial assets measured at fair value through profit or loss, Loan receivables and
trade receivables, Financial liabilities measured at fair value through profit or loss,
Other financial liabilities and Derivatives used for hedge accounting.
Financial assets measured at fair value through profit or loss
This category consists of two sub-groups: financial assets held for trading and
other financial assets that the company has initially elected to place in this category
(in accord ance with the so-called Fair Value Option). Financial instruments in this
category are measured on a continual basis at fair value with changes in value
recognised through profit or loss. The first sub-group includes derivatives with
positive fair value, except for derivatives, which are identified and effective hedging
instruments (see below).
Loan receivables and trade receivables
Loan receivables and trade receivables are financial assets that are not derivative in-
struments, which have fixed or determinable payments and which are not quoted on
an active market. They are included in current assets, with the exception of items that
mature after more than 12 months from the end of the reporting period, which are
classified as non-current assets. Assets in this category are measured at amortised
cost. Amortised cost is determined on the basis of the effective interest rate that was
calculated on the date of acquisition.
Trade receivables are recognised at the amount that is expected to be received, i.e.
less doubtful receivables. Impairment losses are recognised in operating expenses.
Financial liabilities measured at fair value through profit or loss
This category consists of financial liabilities held for trading and derivatives not used
for hedge accounting and contingent consideration. Liabilities in this category are
measured on an ongoing basis at fair value with the change in value in the income
statement.
Other financial liabilities
Financial liabilities not held for trading are measured at amortised cost. The Group’s
borrowings, financial lease liabilities, trade payables and advance payments from
customers belong to this category.
Derivatives used for hedge accounting
All derivatives are recognised at fair value in the statement of financial position.
Changes in value are recognised in the income statement in the case of actual hedge
accounting. Hedge accounting is described in greater detail below, under Derivatives
and hedge accounting.
Note
1
2
3
4
5
6
7
8
9
10
11
12
13
14
15
16
17
18
19
20
21
22
23
24
25
26
27
28
29
30
31
32
33
34
35
36
37
38
39
40
41
42
43
44
22w w w. l a g e r c r a n t z . c o m
L a g e r c r a n t z G r o u p A B ( p u b l ) A n n u a l R e p o r t 2 014 / 15
Cash and cash equivalents
Cash and cash equivalents consist of cash and immediately available balances with
banks and equivalent institutions, and short-term liquid investments with a term to
maturity of less than three months, which are exposed to a minimal risk for fluctu-
ations in value.
Financial investments
Financial investments are classified as either non-current assets or investments in
securities depending on the purpose of the holding. If the term or the expected hold-
ing period is more than one year, they are classified as financial assets.
(j) Derivatives and hedge accounting
The Group’s derivative instruments are acquired to hedge the interest rate and
currency risks to which the Group is exposed. An embedded derivative is recognised
separately unless it is closely related to the host contract. Derivatives are initially mea-
sured at fair value, with the effect that transaction costs are charged to the period’s
results. After initial recognition, derivative instruments are measured at fair value and
changes in value are recognised as described below.
In order to meet the requirements for hedge accounting in accordance with IAS 39,
there must be an unambiguous link to the hedged item. It is further required that the
hedge protects the hedged item in an effective manner, that hedging documentation
has been drawn up and that such efficiency can be measured. Gains and losses are
recognised in the income statement at the same time as gains and losses are recog-
nised for the hedged items.
Hedging of forecast sales in foreign currency – cash flow hedges
Currency futures contracts used for hedging of highly likely forecast sales in foreign
currency are recognised in the statement of financial position at fair value. Changes
in value for the period are recognised in other comprehensive income and the accum-
ulated changes in value are recognised as a separate component of equity (hedging
reserve) until the hedged flow affects profit or loss, at which time the accumulated
changes in value of the hedging instrument are reclassified to net profit for the year
when the hedged item (sales revenue) affects the year’s result.
Hedging of fixed interest term – cash flow hedges
Interest rate swaps are used to hedge against the uncertainty of future interest flows
relating to loans with variable interest. Interest rate swaps are measured at fair value
in the statement of financial position. In the income statement, the interest coupon
portion is continually recognised as an adjustment to interest expense. Other changes
in the value of interest rate swaps are recognised in other comprehensive income and
are included as a part of the hedging reserve in equity until the hedged item affects
the income statement and as long as the criteria for hedge accounting and effective-
ness are fulfilled.
Receivables and liabilities in foreign currency
Currency futures contracts can be used for hedging an asset or a liability against
currency risk. For such hedging, no hedge accounting is required since the hedged
item as well as the hedging instrument are measured at fair value through the income
statement in respect of exchange differences. Changes in value of operations- related
receivables and liabilities are recognised in the operating result, while changes in
value of financial receivables and liabilities are recognised in net financial items.
Net investments
Investments in foreign subsidiaries (net assets including goodwill) have been partially
hedged by raising loans in the corresponding currency. Such loans are translated at
the closing day rate. The period’s translation differences relating to financial instru-
ments used as hedging instruments in hedging a net investment in a Group company
are recognised, to the extent the hedge is effective, in other comprehensive income
and the accumulated changes are recognised as a special component of equity (the
translation reserve). This procedure is used to offset the translation differences that
affect other comprehensive income when Group companies are consolidated.
(k) Property, plant and equipment
(i) Owned assets
Property, plant and equipment is recognised as an asset in the statement of financial
position if it is probable that future economic benefits will accrue to the company and
the cost of the asset can be reliably measured.
Items of property, plant and equipment are recognised in the Group at cost less
accumulated depreciation and any impairment losses. The purchase price is included
in the cost as well as expenditure directly attributable to bringing the asset to the lo-
cation and in the condition to be used in accordance with the aim of the acquisition.
Examples of directly attributable costs included in the cost of acquisition are costs for
delivery and handling, installation, registration of title, consulting services and legal
services. Borrowing costs directly attributable to the purchase, design or production
of assets that take a significant time to complete for their intended use or for sale are
included in the cost of acquisition.
Property, plant and equipment consisting of units with different useful lives are
treated as separate items of property, plant and equipment.
The carrying amount of an item of property, plant and equipment is derecognised
on retirement or disposal or when no future economic benefits can be expected from
use or retirement /disposal of the asset. Gains or losses arising from disposal or re tire-
ment of an asset consist of the difference between the selling price and the asset’s
carrying amount less directly related selling expenses. Gains and losses are recog-
nised as other operating income/expenses.
(ii) Leased assets
IAS 17 applies to leased assets. Leases are classified in the consolidated financial
statements either as financial or operating leases. Leases where substantially all of
the economic risks and rewards associated with ownership have been transferred to
the lessee are classified as financial leases. Where that is not the case, the lease is an
operating lease.
Assets rented under financial leases are recognised as assets in the consolidated
state ment of financial position. The obligation to pay future leasing fees is recognised
as non-current and current liabilities. The leased assets are depreciated according
to plan, whereas lease payments are recognised as interest and repayment of the
liabilities.
In the case of operating leases, the lease payment is expensed over the term of the
lease based on usage, which may differ from what has actually been paid in leasing
fees during the year.
(iii) Additional expenditure
Additional expenditure is added to the cost only if it is probable that the future
economic benefits associated with the asset will accrue to the company and the cost
can be measured in a reliable way. All other additional expenditure is recognised as
an expense in the period when it arises.
(iv) Depreciation methods
Assets are depreciated on a straight-line basis over their estimated useful life. Land is
not depreciated. The Group applies component depreciation, which means that the
components’ estimated useful life forms the basis for depreciation.
Estimated useful lives:
Buildings, commercial premises 15 – 50 years
Plant and machinery 3 –10 years
Equipment, tools, fixtures and fittings 3 – 5 years
Commercial premises consist of a number of components with varying useful lives.
The main classification is buildings and land. The land component is not depreciated
since its useful life is considered to be unlimited. Buildings, however, consist of a
number of components where the useful lives vary.
The useful lives have been deemed to vary between 15 and 50 years for these com-
ponents.
Assessment of the residual value and useful lives of assets is made on an annual basis.
(l) Intangible assets
(i) Goodwill
Goodwill represents the difference between the cost of a business combination and
the fair value of the assets acquired and liabilities and contingent liabilities assumed.
Goodwill is measured at cost less any accumulated impairment losses. Goodwill
is distributed to cash-generating units and tests are performed on an annual basis
or as soon as there are indications the asset in question has suffered an impairment
(refer to Accounting policies n).
In business combinations where the cost of acquisition is less than the net value
of acquired assets, and liabilities and contingent liabilities assumed, the difference is
recognised directly in the income statement.
(ii) Research and development
Research expenditure aimed at obtaining new scientific or technological knowledge
is recognised as a cost when it is incurred.
Development expenditure, where research results or other knowledge is applied
in order to produce new or improved products or processes, is carried as an asset in
the statement of financial position, if the product or process is technologically and
commercially useful and the company has sufficient resources to complete develop-
ment and subsequently use or sell the intangible asset. The carrying amount includes
expenditure for material, direct expenditure for salaries and indirect expenditure att-
ributable to the asset in a reasonable and consistent manner. Other expenditure for
development is recognised as a cost directly in the income statement when it is in-
curred. Recognised development expenditure in the statement of financial position is
carried at cost less accumulated amortisation and any impairment losses.
(iii) Other intangible assets
Other intangible assets, not including trademarks, acquired by the Group are
recognised at cost, less accumulated amortisation and impairment losses. This also
includes capitalised IT expenditure for development and purchase of software.
Acquired trademarks are recognised at cost, less any impairment losses. The
useful life of trademarks is indefinite. Their value is therefore tested annually for
impairment. Costs incurred for internally generated goodwill and internally gene-
rated trademarks are recognised in the income statement when the cost is incurred.
(iv) Additional expenditure
Additional costs for capitalised intangible assets are recognised as an asset in the
statement of financial position only when they increase the future economic benefits
of the specific asset to which they relate. All other costs are expensed as they arise.
Acquired trademarks are carried at cost.
(v) Amortisation
Amortisation is recognised in the income statement on a straight-line basis over
the estimated useful lives of the intangible assets, provided such useful lives are
determin able.
Goodwill, trademarks and intangible assets with an indeterminable useful life
23w w w. l a g e r c r a n t z . c o m
L a g e r c r a n t z G r o u p A B ( p u b l ) A n n u a l R e p o r t 2 014 / 15
Note
1
2
3
4
5
6
7
8
9
10
11
12
13
14
15
16
17
18
19
20
21
22
23
24
25
26
27
28
29
30
31
32
33
34
35
36
37
38
39
40
41
42
43
44
are tested for impairment on an annual basis and as soon as there are indications
suggest ing that the asset in question has decreased in value. Intangible assets that
may be amortised are amortised from the date on which they are available for use.
The estimated useful lives are:
Patents, innovations and customer relationships 5 – 20 years
Capitalised development expenditure and software 3 –7 years
(m) Inventories
Inventories are measured at the lower of cost and net realisable value. Net realisable
value is the estimated selling price in the ordinary course of business, less estimated
costs of completion and for bringing about a sale.
The cost of inventories is calculated by applying the first-in first out method (FIFO),
or weighted average acquisition cost and includes expenditure arising on the acqui-
sition of the inventory items and transporting them to their current location and
cond ition. For manufactured goods and work in progress, the cost of acquisition in-
cludes a reasonable portion of indirect costs based on normal capacity utilisation.
(n) Impairment losses
The carrying amounts of the Group’s assets are tested on each balance sheet date to
determine if any impairment has occurred. IAS 36 is applied for testing of any write-
down requirement for assets other than financial assets, which are tested in accord-
ance with IAS 39, assets held for sale and disposal groups recognised in accordance
with IFRS 5, inventories, plan assets used for financing of payments to employees
and deferred tax assets. For goodwill, other assets with indeterminable useful lives
and intangible assets that are still not ready for use, the recoverable amount is also
calculated annually.
For exempted assets, as above, the carrying amount is tested in accordance with
each standard.
If there is an indication that an asset may be impaired, the asset’s recoverable
amount is calculated. For goodwill, other intangible assets with indeterminable use-
ful lives and intangible assets that are still not ready for use, the recoverable amount
is calculated annually.
If it is impossible to determine significant independent cash flows to an individual
asset, the assets should be grouped, in conjunction with impairment testing, at the
lowest level at which it is possible to identify significant independent cash flows
– a so-called cash-generating unit. An impairment loss is recognised when the
carrying amount of the asset or cash-generating unit exceeds its recoverable amount.
An impairment loss is recognised in the income statement.
Impairment losses on assets attributable to a cash-generating unit are in the first
instance allocated to goodwill. A proportional impairment loss on other assets that
are part of the unit is subsequently recognised.
The recoverable amount is the higher of fair value less selling expenses and the
value in use. Future cash flows are discounted using a discount factor that reflects the
risk-free rate of interest and the risk associated with the specific asset for the purpose
of calculating the value in use.
(i) Impairment of financial assets
The recoverable amount of assets belonging to the categories, held-to-maturity in-
vestments, loan receivables and trade receivables, which are recognised at amortised
cost, is measured as the present value of future cash flows discounted by the effective
rate that applied upon initial recognition of the asset. Assets with a short remaining
terms are not discounted. An impairment loss is recognised as a cost in the income
statement.
(ii) Reversal of impairment losses
Impairment losses on held-to-maturity investments or loan receivables and trade
receivables recognised at amortised cost are reversed if a later increase in the re-
coverable amount can be objectively attributed to an event that occurred after the
impairment was made.
Impairment losses on other assets are reversed where there has been a change in
the assumptions on which the calculation of the recoverable amount was made.
An impairment loss is reversed only to the extent the carrying amount of the asset
after the reversal does not exceed the value the asset would have had if no impair-
ment loss had been recognised, taking into account the amortisation that would then
have occurred. Impairment losses on goodwill are not reversed.
(o) Equity
The Group’s equity can be divided into share capital, other paid-up capital, reserves,
retained earnings and non-controlling interests.
(i) Repurchase of own shares
Holdings of own shares and other equity instruments are recognised as a decrease in
equity. The acquisition of such instruments is recognised as a deduction from equity.
Proceeds from the sale of equity instruments are recognised as an increase in equity.
Any transaction costs are recognised directly against equity.
(ii) Dividends
Dividends are recognised as a liability after the general meeting has approved the
dividend.
(iii) Earnings per share
The calculation of earnings per share is based on the Group’s net profit for the
year attributable to the Parent Company’s shareholders and the weighted average
number of shares outstanding during the year. When calculating earnings per share
after dilution, the average number of shares is adjusted to take account of the effects
of dilutive potential ordinary shares, which during reported periods were attributable
to options issued to employees. Dilution from options affects the number of shares
and occurs only when the redemption price is lower than the market price.
(p) Employee benefits
(i) Defined contribution plans
Obligations in respect of charges for defined contribution plans are recognised as an
expense in the income statement as they arise.
(ii) Defined benefit plans
The Group’s net obligations relating to defined benefit plans are calculated separately
for each plan through an estimate of the future remuneration that the employee has
earned as a result of his /her employment in both the current and prior periods.
Calculations are performed by a qualified actuary using the so-called projected unit
credit method. Commitments are then valued at the present value of expected future
payments with due consideration to future pay increases. The discount rate used is
the interest rate at the end of the reporting period on an investment grade corporate
bond, including housing bonds, with a term equivalent to the Group’s pension
commitments. When there is no active market for such corporate or housing bonds,
the market rate for government bonds with an equivalent term is used instead. In the
cases of funded plans, the fair value of plan assets reduces the calculated value.
When the calculation leads to an asset for the Group, the carrying amount of
the asset is limited to the lowest surplus in the plan and the availability limitation
calculated using the discount rate. The availability limitation consists of the present
value of the future economic benefits in the form of lower future fees, or a cash re-
fund. When calculating the present value of future repayments or contributions, any
requirements for minimum funding will be taken into consideration.
When the benefits under a plan are improved, the proportion of the increase in
benefits pertaining to the employee’s service during prior periods is recognised as
a cost in the income statement, distributed on a straight-line basis over the average
period until the benefits are fully vested. Where the benefits are fully vested, the cost
is recognised in the income statement directly.
Actuarial gains and losses are recognised directly in equity under other compre-
hensive income in the period when they arise.
Obligations for retirement pension to salaried employees in Sweden in accordance
with the ITP plan are handled mainly within the so-called FPG/PRI system. Obligations
for family pensions are secured by insurance in Alecta, however. These obligations
are also of the defined benefit type, although the company has not had access to
the information necessary to recognise these obligations as a defined benefit plan.
These pensions secured by insurance in Alecta are therefore recognised as defined
contri bution plans. At the end of 2013, Alecta’s surplus in the form of the collect-
ive consolidation level amounted to 148 percent (2012: 129 percent). The collective
consolidation level consists of the market value of Alecta’s assets as a percentage of
the insurance commitments calculated according to Alecta’s actuarial calculation
assumptions, which do not correspond to IAS 19. Alecta’s surplus can be distributed
to the policyholders and /or the insured.
When there is a difference between how the pension cost is determined in a legal
entity and group, a provision or a receivable is recognised relating to special payroll
tax based on this difference. Such provision or receivable is not subject to present
value calculation. The net interest on pension liabilities and the anticipated return on
the relevant plan assets is recognised in net financial items. Other components are
recognised in operating income.
(iii) Remuneration upon termination of employment
In connection with termination of personnel a provision is only made when the
company is demonstrably obligated, without a realistic opportunity to reverse the
decision, by a formal detailed plan to terminate employment before the normal
point in time. When remuneration is offered to encourage voluntary redundancy, it
is recognised as a cost if it is likely that the offer will be accepted and the number of
employees accepting the offer can be reliably estimated.
(iv) Employee share option plan
The Group’s option plan enables senior executives to acquire shares in the company.
The employees have paid a market-related premium for this opportunity. Premiums
received are carried in equity as a transaction with the owners.
(q) Provisions
A provision is recognised in the statement of financial position when there is an ex-
isting legal or informal obligation as a result of past events, and it is probable that an
outflow of financial resources will be required to settle the obligation and the amount
can be reliably estimated. In cases where the effect of payment timing is significant,
provisions are calculated by discounting the expected future cash flow at an interest
rate before tax that reflects current market assessments of the time value of money,
and if applicable, the risks specific to the obligation.
(i) Warranties
A provision for warranties is recognised when the underlying products or services
are sold. The provision is based on historical data on warranties and an appraisal of
possible outcomes in relation to the associated probabilities.
(ii) Restructuring
A provision for restructuring is recognised when the Group has adopted a compre-
hensive and formal restructuring plan, and the restructuring has either begun, or has
been publicly announced. No provisions are set aside for future operating costs.
24w w w. l a g e r c r a n t z . c o m
L a g e r c r a n t z G r o u p A B ( p u b l ) A n n u a l R e p o r t 2 014 / 15
(iii) Onerous contracts
A provision for onerous contracts is recognised when the anticipated benefits that
the Group expects to receive from a contract are lower than the unavoidable costs to
fulfil the obligation or contract.
(r) Taxes
Income taxes consist of current taxes and deferred taxes. Income tax is recognised in
the income statement except when underlying transactions are recognised in other
comprehensive income or directly against equity, whereupon the associated tax
effect is recognised in other comprehensive income or in equity.
Current tax is tax that shall be paid or refunded in respect of the current year, using the
tax rates which are enacted or which in practice are enacted at the end of the reporting
period. Also included are adjustments of current taxes attributable to prior periods.
Deferred taxes are estimated in accordance with the liability method, based on
temporary differences between the tax bases of assets and liabilities and their
carrying amounts. Temporary differences not taken into consideration are; temporary
differences arising on the initial recognition of goodwill, the initial recognition of
assets and liabilities that are not business combinations and which on the transaction
date did not affect the recognised or taxable result. Furthermore, temporary
differences are not taken into consideration that are attributable to participations in
subsidiaries and associated companies and which are not expected to be reversed
within the foreseeable future. The measurement of deferred tax is based on how
the carrying amounts of assets or liabilities are expected to be realised or settled.
Deferred tax is measured using the tax rates and tax regulations which were enacted
or were in practice enacted on the balance sheet date.
Deferred tax assets relating to deductible temporary differences and loss carry-
forwards are only recognised to the extent that it is probable that they can be utilised.
The value of deferred tax assets is reduced when it is no longer considered probable
that they can be utilised.
(s) Contingent liabilities
A contingent liability is recognised when a possible obligation arises from past events
whose existence will only be confirmed by one or more uncertain future events or
when an obligation exists that is not recognised as a liability or provision, since it is
not probable that an outflow of resources will be required.
(t) Cash flow statement
Incoming and outgoing payments have been divided into categories: operating
activities, investing activities and financing activities. The indirect method is used for
flows from operating activities.
The year’s changes in operating assets and operating liabilities have been adjusted
for the effects of exchange rate fluctuations. Acquisitions and disposals are recog-
nised in investing activities. The assets and liabilities held by the acquired and sold
entities at the time of change are not included in the statement of changes in working
capital, nor are changes in balance sheet items recognised in investing and financing
activities. Apart from cash and bank flows, cash and cash equivalents also include
investments in securities, which may be converted to bank funds at an amount that
is essentially known in advance. Cash and cash equivalents include investments in
securities with a term of less than three months.
(u) Parent Company accounting policies
The Parent Company has prepared its annual accounts according to the Swedish
Annual Accounts Act (1995:1554) and the Swedish Financial Reporting Board’s re-
commendation RFR 2 Accounting for Legal Entities. Statements issued by the Swedish
Financial Reporting Board for listed companies are also applied. RFR 2 means that
the Parent Company in the annual accounts for the legal entity should apply all IFRS
and statements approved by the EU to the greatest extent possible within the frame-
work of the Swedish Annual Accounts Act and with due regard to the relationship
between accounting and taxation. The recommendation sets out which exceptions
and additions are to be made from IFRS.
Overall, this results in differences between the Group’s and the Parent Company’s
accounting in the areas indicated below.
Classification and presentation
The Parent Company’s income statement and balance sheet are presented in
accord ance with the format used in the Swedish Annual Accounts Act. Differences
compared to IAS 1 Presentation of Financial Statements applied in preparing the
consolidated financial statements are primarily in the recognition of financial income
and expenses, non-current assets and equity.
Subsidiaries
Participations in subsidiaries are recognised in the Parent Company in accordance
with the cost method. Dividends received from subsidiaries’ retained earnings are
recognised as revenue. Larger dividends can result in impairment losses and thereby
reduce the carrying amount of the participation.
Revenue
Anticipated dividends
Anticipated dividends from subsidiaries are recognised if the Parent Company has
the exclusive right to determine the size of the dividend and the Parent Company has
decided on the size of the dividend before publishing its financial statements.
Property, plant and equipment
Owned assets
Items of property, plant and equipment in the Parent Company are recognised at cost
less accumulated depreciation and any impairment losses in the same way as in the
Group but with the addition of any write-ups.
Borrowing costs
In the Parent Company, borrowing costs are charged to income during the period to
which they apply. No borrowing costs are capitalised among assets.
Leased assets
All lease agreements in the Parent Company are recognised in accordance with the
rules for operating leases.
Taxes
In the Parent Company, untaxed reserves are recognised including deferred tax
liabilit. In the consolidated financial statements, on the other hand, untaxed reserves
are divided into deferred tax liability and equity.
(v) Group contributions and shareholders’ contributions for legal entities
The company recognises group contributions in accordance with the recommend-
ation of the Swedish Financial Reporting Board. Shareholders’ contributions are
carried directly in equity in the case of the receiver and capitalised in shares and
participations by the grantor, to the extent that impairment is not required. Group
contributions received are recognised as dividends and group contributions paid
are recognised as investments in shares in subsidiaries, or where nothing of value is
added as an impairment loss on the shares via profit and loss. Group contributions
were previously recognised directly in equity.
(x) Mergers
Mergers are accounted for in accordance with BFNAR 1999:1.
(y) Financial guarantees
Lagercrantz Group has chosen not to apply the rules in IAS 39 regarding financial
guarantee agreements in favour of subsidiaries in accordance with RFR 2.
Note 2 Critical estimates and judgments
The Board of Directors and management have discussed the development, choice of
and disclosures relating to the Group’s significant accounting policies and estimates,
and the application of these policies and estimates. Certain critical accounting esti-
mates made in conjunction with application of the Group’s accounting policies are
described below.
Impairment testing of goodwill
Each year the Group tests if any impairment of goodwill has occurred. The recover-
able amount of the cash-generating units is determined through a calculation of the
value in use. This calculation is based on the strategic plan of the business in question
and expected future cash flows for the operation. The discount factor used for pre-
sent value calculations of expected future cash flows is the weighted average cost of
capital (WACC). The year’s review has demonstrated that there is no need to recog-
nised an impairment loss. For more information, refer to Note 15.
Deferred taxes
The value of tax loss carryforwards and other deferred tax assets / liabilities is taken
into consideration to the extent that it is deemed probable that it will be possible to
utilise them in the future.
Exposure to foreign currencies
An analysis of the exposure to foreign currencies and the risks associated with
changes in foreign exchange rates is provided in Note 41.
Pension assumptions
Pension assumptions are an important element of the actuarial methods used to
measure pension obligations and they can have an effect on the recognised pension
liability and the annual pension expense. One of the most critical assumptions is
the discount rate which is important for measuring the year’s pension expense as
well as the present value of the defined benefit pension obligations. The assumed
discount rate is reviewed at least once per year for each plan in each country. Other
assumptions may relate to demographic factors, such as retirement age, mortality
and employee turnover and are not reviewed as often. The current outcome often
differs from the actuarial assumptions for economic and other reasons. The discount
rate makes it possible to measure future cash flows at present value at the time of
measurement. This interest rate should correspond to the return on investment grade
corporate bonds (including housing bonds) or, if no functioning market for such
bonds exists, government bonds. A reduced discount rate increases the present value
of the pension liability and the annual cost.
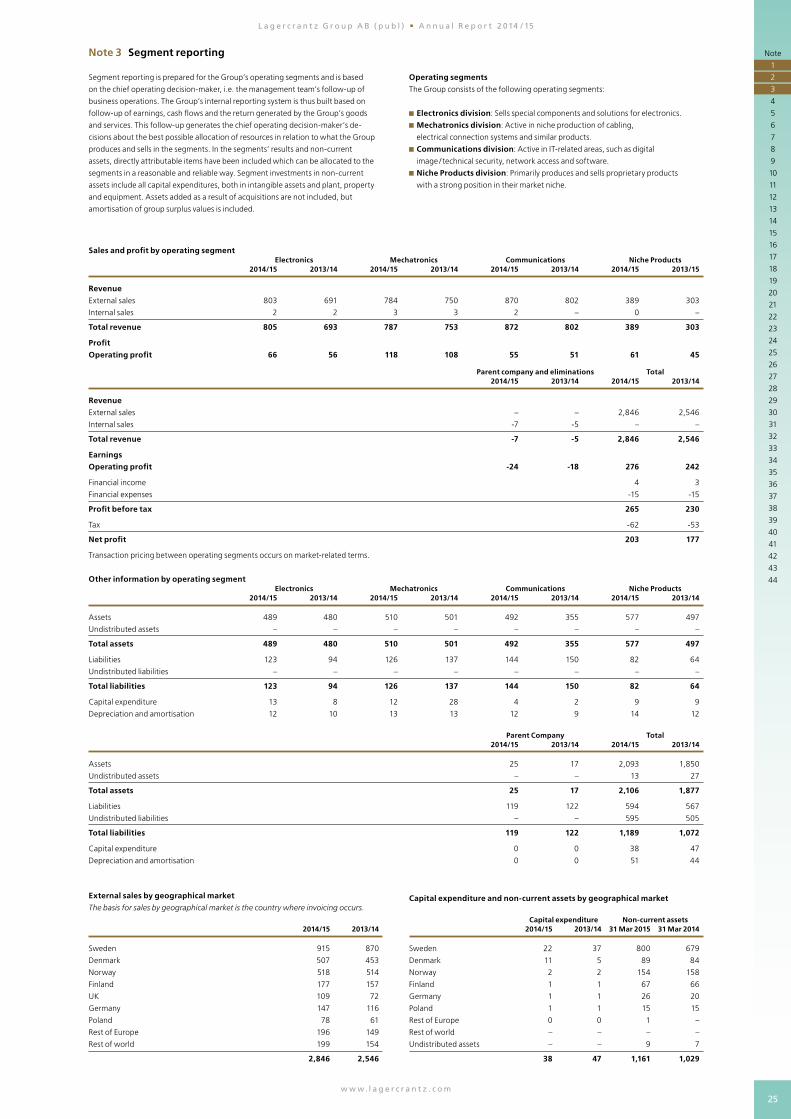
25w w w. l a g e r c r a n t z . c o m
L a g e r c r a n t z G r o u p A B ( p u b l ) A n n u a l R e p o r t 2 014 / 15
Note
1
2
3
4
5
6
7
8
9
10
11
12
13
14
15
16
17
18
19
20
21
22
23
24
25
26
27
28
29
30
31
32
33
34
35
36
37
38
39
40
41
42
43
44
Note 3 Segment reporting
Segment reporting is prepared for the Group’s operating segments and is based
on the chief operating decision-maker, i.e. the management team’s follow-up of
business operations. The Group’s internal reporting system is thus built based on
follow-up of earnings, cash flows and the return generated by the Group’s goods
and services. This follow-up generates the chief operating decision-maker’s de-
cisions about the best possible allocation of resources in relation to what the Group
pro duces and sells in the segments. In the segments’ results and non-current
assets, directly attributable items have been included which can be allocated to the
segments in a reasonable and reliable way. Segment investments in non- current
assets include all capital expenditures, both in intangible assets and plant, property
and equipment. Assets added as a result of acquisitions are not included, but
amortisation of group surplus values is included.
Sales and profit by operating segment Electronics Mechatronics Communications Niche Products 2014/15 2013/14 2014/15 2013/14 2014/15 2013/14 2014/15 2013/15
Revenue
External sales 803 691 784 750 870 802 389 303
Internal sales 2 2 3 3 2 – 0 –
Total revenue 805 693 787 753 872 802 389 303
Profit
Operating profit 66 56 118 108 55 51 61 45
Parent company and eliminations Total 2014/15 2013/14 2014/15 2013/14
Revenue
External sales – – 2,846 2,546
Internal sales -7 -5 – –
Total revenue -7 -5 2,846 2,546
Earnings
Operating profit -24 -18 276 242
Financial income 4 3
Financial expenses -15 -15
Profit before tax 265 230
Tax -62 -53
Net profit 203 177
Transaction pricing between operating segments occurs on market-related terms.
Other information by operating segment Electronics Mechatronics Communications Niche Products 2014/15 2013/14 2014/15 2013/14 2014/15 2013/14 2014/15 2013/14
Assets 489 480 510 501 492 355 577 497
Undistributed assets – – – – – – – –
Total assets 489 480 510 501 492 355 577 497
Liabilities 123 94 126 137 144 150 82 64
Undistributed liabilities – – – – – – – –
Total liabilities 123 94 126 137 144 150 82 64
Capital expenditure 13 8 12 28 4 2 9 9
Depreciation and amortisation 12 10 13 13 12 9 14 12
Parent Company Total 2014/15 2013/14 2014/15 2013/14
Assets 25 17 2,093 1,850
Undistributed assets – – 13 27
Total assets 25 17 2,106 1,877
Liabilities 119 122 594 567
Undistributed liabilities – – 595 505
Total liabilities 119 122 1,189 1,072
Capital expenditure 0 0 38 47
Depreciation and amortisation 0 0 51 44
Operating segments
The Group consists of the following operating segments:
Electronics division: Sells special components and solutions for electronics.
Mechatronics division: Active in niche production of cabling,
electrical connection systems and similar products.
Communications division: Active in IT-related areas, such as digital
image / technical security, network access and software.
Niche Products division: Primarily produces and sells proprietary products
with a strong position in their market niche.
External sales by geographical market
The basis for sales by geographical market is the country where invoicing occurs.
2014/15 2013/14
Sweden 915 870
Denmark 507 453
Norway 518 514
Finland 177 157
UK 109 72
Germany 147 116
Poland 78 61
Rest of Europe 196 149
Rest of world 199 154
2,846 2,546
Capital expenditure and non-current assets by geographical market
Capital expenditure Non-current assets 2014/15 2013/14 31 Mar 2015 31 Mar 2014
Sweden 22 37 800 679
Denmark 11 5 89 84
Norway 2 2 154 158
Finland 1 1 67 66
Germany 1 1 26 20
Poland 1 1 15 15
Rest of Europe 0 0 1 –
Rest of world – – – –
Undistributed assets – – 9 7
38 47 1,161 1,029
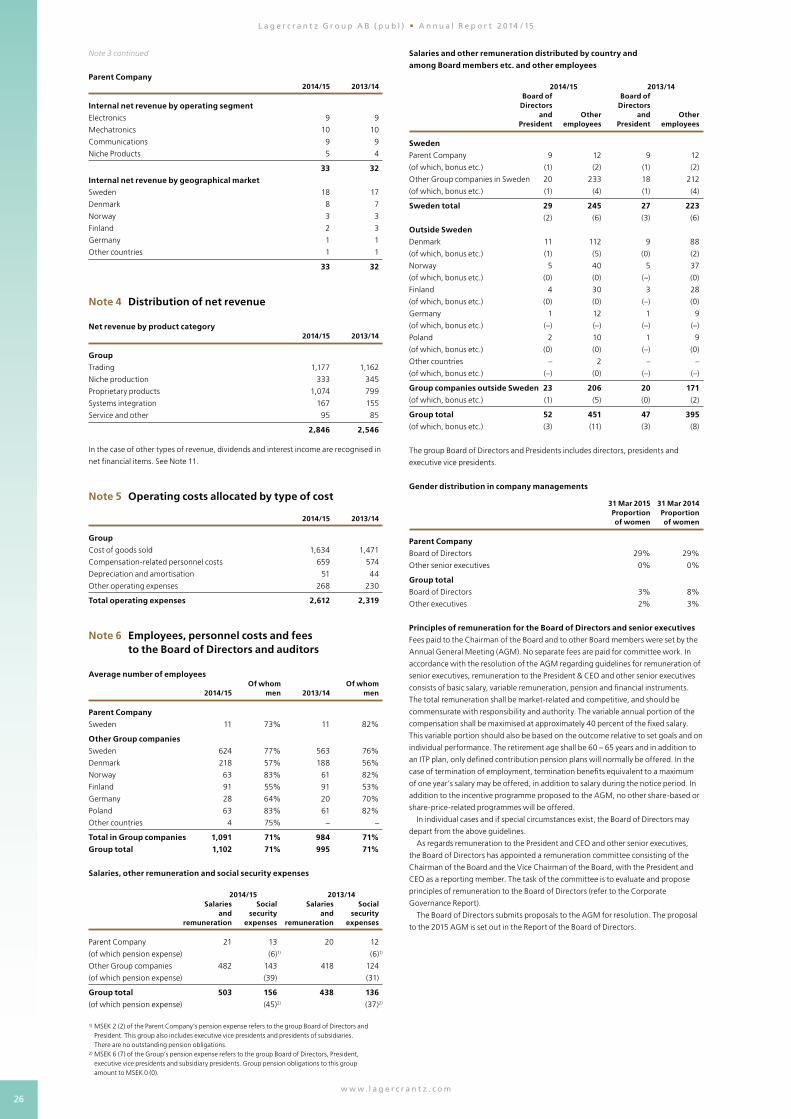
26w w w. l a g e r c r a n t z . c o m
L a g e r c r a n t z G r o u p A B ( p u b l ) A n n u a l R e p o r t 2 014 / 15
Parent Company 2014/15 2013/14
Internal net revenue by operating segment
Electronics 9 9
Mechatronics 10 10
Communications 9 9
Niche Products 5 4
33 32
Internal net revenue by geographical market
Sweden 18 17
Denmark 8 7
Norway 3 3
Finland 2 3
Germany 1 1
Other countries 1 1
33 32
Note 4 Distribution of net revenue
Net revenue by product category 2014/15 2013/14
Group
Trading 1,177 1,162
Niche production 333 345
Proprietary products 1,074 799
Systems integration 167 155
Service and other 95 85
2,846 2,546
In the case of other types of revenue, dividends and interest income are recognised in
net financial items. See Note 11.
Note 5 Operating costs allocated by type of cost
2014/15 2013/14
Group
Cost of goods sold 1,634 1,471
Compensation-related personnel costs 659 574
Depreciation and amortisation 51 44
Other operating expenses 268 230
Total operating expenses 2,612 2,319
Note 6 Employees, personnel costs and fees to the Board of Directors and auditors
Average number of employees Of whom Of whom 2014/15 men 2013/14 men
Parent Company
Sweden 11 73% 11 82%
Other Group companies
Sweden 624 77% 563 76%
Denmark 218 57% 188 56%
Norway 63 83% 61 82%
Finland 91 55% 91 53%
Germany 28 64% 20 70%
Poland 63 83% 61 82%
Other countries 4 75% – –
Total in Group companies 1,091 71% 984 71%
Group total 1,102 71% 995 71%
Salaries, other remuneration and social security expenses
2014/15 2013/14 Salaries Social Salaries Social and security and security remuneration expenses remuneration expenses
Parent Company 21 13 20 12
(of which pension expense) (6)1) (6)1)
Other Group companies 482 143 418 124
(of which pension expense) (39) (31)
Group total 503 156 438 136
(of which pension expense) (45)2) (37)2)
1) MSEK 2 (2) of the Parent Company’s pension expense refers to the group Board of Directors and President. This group also includes executive vice presidents and presidents of subsidiaries. There are no outstanding pension obligations. 2) MSEK 6 (7) of the Group’s pension expense refers to the group Board of Directors, President, executive vice presidents and subsidiary presidents. Group pension obligations to this group amount to MSEK 0 (0).
Salaries and other remuneration distributed by country and
among Board members etc. and other employees
2014/15 2013/14 Board of Board of Directors Directors and Other and Other President employees President employees
Sweden
Parent Company 9 12 9 12
(of which, bonus etc.) (1) (2) (1) (2)
Other Group companies in Sweden 20 233 18 212
(of which, bonus etc.) (1) (4) (1) (4)
Sweden total 29 245 27 223
(2) (6) (3) (6)
Outside Sweden
Denmark 11 112 9 88
(of which, bonus etc.) (1) (5) (0) (2)
Norway 5 40 5 37
(of which, bonus etc.) (0) (0) (–) (0)
Finland 4 30 3 28
(of which, bonus etc.) (0) (0) (–) (0)
Germany 1 12 1 9
(of which, bonus etc.) (–) (–) (–) (–)
Poland 2 10 1 9
(of which, bonus etc.) (0) (0) (–) (0)
Other countries – 2 – –
(of which, bonus etc.) (–) (0) (–) (–)
Group companies outside Sweden 23 206 20 171
(of which, bonus etc.) (1) (5) (0) (2)
Group total 52 451 47 395
(of which, bonus etc.) (3) (11) (3) (8)
The group Board of Directors and Presidents includes directors, presidents and
executive vice presidents.
Gender distribution in company managements
31 Mar 2015 31 Mar 2014 Proportion Proportion of women of women
Parent Company
Board of Directors 29% 29%
Other senior executives 0% 0%
Group total
Board of Directors 3% 8%
Other executives 2% 3%
Principles of remuneration for the Board of Directors and senior executives
Fees paid to the Chairman of the Board and to other Board members were set by the
Annual General Meeting (AGM). No separate fees are paid for committee work. In
accordance with the resolution of the AGM regarding guidelines for remuneration of
senior executives, remuneration to the President & CEO and other senior executives
consists of basic salary, variable remuneration, pension and financial instruments.
The total remuneration shall be market-related and competitive, and should be
commensurate with responsibility and authority. The variable annual portion of the
compensation shall be maximised at approximately 40 percent of the fixed salary.
This variable portion should also be based on the outcome relative to set goals and on
individual performance. The retirement age shall be 60 – 65 years and in addition to
an ITP plan, only defined contribution pension plans will normally be offered. In the
case of termination of employment, termination benefits equivalent to a maximum
of one year’s salary may be offered, in addition to salary during the notice period. In
addition to the incentive programme proposed to the AGM, no other share-based or
share-price-related programmes will be offered.
In individual cases and if special circumstances exist, the Board of Directors may
depart from the above guidelines.
As regards remuneration to the President and CEO and other senior executives,
the Board of Directors has appointed a remuneration committee consisting of the
Chairman of the Board and the Vice Chairman of the Board, with the President and
CEO as a reporting member. The task of the committee is to evaluate and propose
principles of remuneration to the Board of Directors (refer to the Corporate
Governance Report).
The Board of Directors submits proposals to the AGM for resolution. The proposal
to the 2015 AGM is set out in the Report of the Board of Directors.
Note 3 continued
27w w w. l a g e r c r a n t z . c o m
L a g e r c r a n t z G r o u p A B ( p u b l ) A n n u a l R e p o r t 2 014 / 15
Note
1
2
3
4
5
6
7
8
9
10
11
12
13
14
15
16
17
18
19
20
21
22
23
24
25
26
27
28
29
30
31
32
33
34
35
36
37
38
39
40
41
42
43
44
Remuneration and other benefits to the Board of Directors and senior executives 2014/2015
Basic salary, Variable Other Other Pension SEK ‘000 directors’ fees remuneration remuneration benefits expense Total
Chairman of the Board
Anders Börjesson 440 440
Board member
Tom Hedelius 330 330
Pirkko Alitalo 220 220
Lennart Sjölund 220 220
Marika Rindborg Holmberg 220 220
Roger Bergqvist 220 220
Chief Executive Officer
Jörgen Wigh 3,434 1,008 278 109 1,042 5,871
Executive Vice President
Magnus Söderlind 2,081 612 181 94 519 3,487
Other senior executives
6 persons 9,469 1,965 473 522 2,015 14,444
Total 16,634 3,585 932 725 3,576 25,452
Remuneration and other benefits to the Board of Directors and senior executives 2013/2014 Basic salary, Variable Other Other Pension SEK ‘000 directors’ fees remuneration remuneration benefits expense Total
Chairman of the Board
Anders Börjesson 440 440
Board member
Tom Hedelius 330 330
Pirkko Alitalo 220 220
Lennart Sjölund 220 220
Marika Rindborg Holmberg (7 months from Sep 2013) 128 128
Roger Bergqvist 220 220
Chief Executive Officer
Jörgen Wigh 3,267 889 161 111 968 5,396
Executive Vice President
Magnus Söderlind 2,078 564 103 92 503 3,340
Other senior executives
5 persons 7,180 1,364 137 331 1,763 10,775
Total 14,083 2,817 401 534 3,234 21,069
In addition to the President & CEO, senior executives refers to the management team
consisting of: executive vice presidents 1 person (1), other senior executives, including
business area heads 6 (5) persons. Remuneration to this group, a total of 9 (8) persons
in 2014/15, was covered by the resolution at the 2014 AGM regarding principles
of remuneration for senior executives. The Remuneration Committee has verified
compliance with the AGM’s resolution. Among other things, the Remuneration
Committee has verified conformity with market conditions by making a comparison
with the remuneration in other similar listed companies.
Pensions
The retirement age for the President & CEO is 60 years. The retirement age for other
senior executives is 65 years. Pension is paid equivalent to the ITP plan, which is a
defined contribution plan.
Termination benefits
The period of notice for the President is 12 months when termination is initiated by
the company and 6 months when termination is initiated by the President. In the
case of termination initiated by the company, the President is entitled to termination
benefits equivalent to one year’s salary in addition to salary during the notice period.
No termination benefits are payable in the case of termination initiated by the
President. The termination benefits are not set off against other income.
The period of notice for the other members of the group management is
6 – 12 months when termination is initiated by the company and up to 6 months
when termination is initiated by the employee. In the case of termination initiated
by the company, members of the group management are entitled to termination
benefits equivalent to up to one year’s salary, in addition to salary during the notice
period. No termination benefits are payable in the case of termination initiated by the
President. The termination benefits are not set off against other income.
Employee share option plan
The 2014 AGM resolved on an incentive programme for managers and senior
executiv es in the Lagercrantz Group. This programme consists of call options for
Lagercrantz Group repurchased shares, where each call option gives the holder a
right to acquire one repurchased share of Class B. Redemption can take place during
three time periods: (i) during a two week period from when the company publishes its
Interim Report for the period 1 April 2016 – 30 September 2016, (ii) during the period
15 May – 26 May 2017, and (iii) during the period 18 September 2017 – 29 September
2017.
Similar call option programmes for managers and senior executives were approved
by the 2013 and 2012 AGMs.
In all programmes, the share is acquired at a redemption price determined as a
percentage mark-up of an average share price after the AGM in accordance with the
quoted prices paid. The programmes cover senior executives and managers with a
direct possibility of affecting the Group’s results. The Board members have not been
entitled to acquire call options, with the exception of the company’s President & CEO.
In order to be allocated call options, the employee must have concluded a special
pre-emption agreement with the company. Pre-emption shall occur at the market
value at the time of termination of employment, an offer from a third party for all
shares in the company and in cases when the call options are to be transferred to a
third party. In all other respects the call options are freely transferable. The company
has utilised the pre-emption agreement during 2014/15 by repurchasing 4,500
options. The premium for the call options shall be equivalent to the market value of
the call options in accordance with external valuation applying the generally accepted
valuation method (the Black & Scholes model).
The allocation resolved by the 2012 AGM comprised 30 persons and a total of
225,000 call options. Allocations varied between 4,000 – 26,550 options per
person. The President & CEO acquired 26,550 options and other members of the
management team acquired 89,000. The measurement period to determine the
average share price, which was SEK 58.60, was 3 September – 14 September 2012.
The redemption price for the call options, which was resolved to be 120% of the
average price was set at SEK 70.30, and was later re-calculated to SEK 69.40 after
dilution. The market value of the call options was set at SEK 4.00 per option by an
independent valuation institution.
The allocation resolved by the 2013 AGM for 2013 comprised 32 persons and a
total of 225,000 call options. Allocations varied between 500 – 25,000 options
per person. The President & CEO acquired 25,000 options and other members of
management team acquired 98,500. The measurement period to determine the
average share price, which was SEK 104.48, was 2 September – 13 September 2013.
The redemption price for the call options, which was resolved to be 120 percent of
the average price, was set at SEK 125.40. The market value of the call options was set
at SEK 8.30 per option by an independent valuation institution.
The allocation resolved by the 2014 AGM for 2014 comprised 35 persons and a
total of 225,000 call options. Allocations varied between 2,000 – 28,600 options per
person. The President & CEO acquired 28,600 and other members of management
team acquired 86,650. The measurement period to determine the average share
price, which was SEK 134.85, was 1 September – 12 September 2014. The redemp-
tion price for the call options, which was resolved to be 120 percent of the average
price, was set at SEK 161.80. The market value of the call options was set at SEK 8.80
per option by an independent valuation institution.
In addition to this, redemption of options relating to the 2011 and 2012
programmes meant an increase in equity of MSEK 4, in connection with the Parent
Company’s sale of repurchased Class B shares to the option holders.
28w w w. l a g e r c r a n t z . c o m
L a g e r c r a n t z G r o u p A B ( p u b l ) A n n u a l R e p o r t 2 014 / 15
Audit fees and reimbursements
Group Parent Company 2014/15 2013/14 2014/15 2013/14
KPMG
Audit assignments 3 3 0.4 0.4
Tax advisory assignments 0 0 0.2 0.1
Other assignments 0 0 – –
Other auditors
Audit assignments 0 0 – –
Tax advisory assignments 0 0 – –
Other assignments 0 0 – –
Audit assignment refers to the review of the annual accounts and the administration
by the Board of Directors and the President, other tasks the company’s auditors are
obliged to perform, and advice or other assistance prompted by observations in the
course of such review.
Note 7 Other operating income
2014/15 2013/14
Group
Capital gains – 1
Rental income 1 0
Other remuneration and contributions 2 4
Exchange gains on receivables / liabilities of an operating character 10 4
Reversal of contingent consideration previous acquisitions 24 –
Other 5 6
42 15
Note 8 Other operating expenses
2014/15 2013/14
Group
Exchange losses on receivables / liabilities of an operating character -4 -5
Impairment and remeasurement of goodwill -24 –
Other expenses -2 -3
-30 -8
Note 9 Depreciation and amortisation of property, plant and equipment and intangible assets
2014/15 2013/14
Group
Depreciation and amortisation according to plan allocated by asset
Intangible assets -27 -21
Land and buildings -2 -2
Costs incurred in leasehold property 0 -1
Plant and machinery -14 -12
Equipment, tools, fixtures and fittings -8 -8
-51 -44
Depreciation and amortisation according to plan allocated by function
Cost of goods sold -14 -13
Selling expenses -32 -27
Administrative expenses -5 -4
-51 -44
Parent Company
Depreciation and amortisation according to plan allocated by asset
Equipment, tools, fixtures and fittings 0 0
0 0
Depreciation and amortisation according to plan allocated by function
Administrative expenses 0 0
0 0
Note 10 Leasing fees relating to operating leases and rental charges
2014/15 2013/14
Group
Expensed operating leasing fees and rents
during the financial year 51 46
Future payments due per year:
1 year after the current financial year 48 41
2 years after the current financial year 36 28
3 years after the current financial year 21 22
4 years after the current financial year 11 8
5 years after the current financial year 11 6
127 105
Parent Company
Expensed operating leasing fees and rents
during the financial year 2 2
Future payments due per year:
1 years after the current financial year 3 2
2 years after the current financial year 3 2
More than 3 years after the current financial year 2 2
8 6
Leasing fees and rents mainly relate to rent for premises.
Note 11 Financial income
2014/15 2013/14
Group
Interest income – 1
Exchange gains 4 2
4 3
Parent Company
Result from participations in Group companies
Interest income from Group companies 4 3
Group contributions received 35 35
Dividends 217 174
256 212
Other interest income and similar profit / loss items
Exchange gains 2 3
Other interest income – –
2 3
Total financial income 258 215
Note 12 Financial expenses
2014/15 2013/14
Group
Interest expenses pensions -2 -3
Other interest expenses -9 -9
Effect of interest hedge – –
Exchange losses -4 -3
Other 0 0
-15 -15
Parent Company
Result from participations in Group companies
Interest expenses to Group companies – -1
Group contributions paid -2 -2
Exchange losses – –
Impairment losses – -25
-2 -28
Other interest expenses and similar profit / loss items
Other interest expenses -8 -10
Effect of interest hedge – –
Other 0 0
-8 -10
Total financial expenses in the Parent Company -10 -38
Note 13 Exchange differences that affected profit
2014/15 2013/14
Group
Exchange differences affecting operating profit 6 -1
Financial exchange differences – -1
6 -2
Parent Company
Financial exchange differences 2 3
2 3
Note 6 continued
29w w w. l a g e r c r a n t z . c o m
L a g e r c r a n t z G r o u p A B ( p u b l ) A n n u a l R e p o r t 2 014 / 15
Note
1
2
3
4
5
6
7
8
9
10
11
12
13
14
15
16
17
18
19
20
21
22
23
24
25
26
27
28
29
30
31
32
33
34
35
36
37
38
39
40
41
42
43
44
Note 14 Tax on net profit for the year
2014/15 2013/14
Group
Current tax expense (–) / tax revenue (+)
Tax for the period -66 -57
Adjustment of tax pertaining to prior years 1 0
-65 -57
Deferred tax expense (–) / tax revenue (+)
Deferred tax related to temporary differences 3 4
Deferred tax related to change in capitalised
tax value of loss carryforwards 0 0
3 4
Total recognised tax expense/tax revenue in the Group -62 -53
The value of tax loss carryforwards is taken into account to the extent that they will
result in lower tax payments in the future.
Reconciliation of effective tax 2014/15 2013/14
Group
Profit before tax 265 230
Tax according to tax rate for the Parent Company, 22% -58 -51
Effect of other tax rates in Group companies outside Sweden -3 -2
Non-deductible expenses -9 -3
Other non-taxable income 7 3
Tax pertaining to prior years 1 0
Recognised effective tax -62 -53
2014/15 2013/14
Parent Company
Current tax expense (–) / tax revenue (+)
Tax expense for the period -4 -3
-4 -3
Deferred tax expense (–) / tax revenue (+)
Deferred tax related to temporary differences 0 0
0 0
Total recognised tax expense/tax revenue in
the Parent Company -4 -3
Reconciliation of effective tax 2014/15 2013/14
Parent Company
Profit before tax 234 162
Tax according to current tax rate, 22% -51 -36
Effect of impairment losses – -6
Dividends from Group companies 47 39
Non-deductible expenses 0 0
Recognised effective tax -4 -3
Note 15 Goodwill
31 Mar 2015 31 Mar 2014
Group
Accumulated cost
Opening balance 584 515
New acquisitions incl. remeasurements 63 63
Impairment losses -22 –
Exchange difference 3 6
Carrying amount at end of the period 628 584
Goodwill allocated by division and cluster
Electronics
Distribution 81 80
Proprietary products 48 47
Total Electronics 129 127
Mechatronics
Distribution – –
Proprietary products 114 115
Total Mechatronics 114 115
Communications
Distribution 113 121
Proprietary products 50 8
Total Communications 163 129
Niche Products
Distribution – –
Proprietary products 222 213
Total Niche Products 222 213
Total goodwill 628 584
Impairment testing of goodwill
The Group’s recognised goodwill amounts to MSEK 628 (584). Goodwill is not
amortised under IFRS. Instead the value of goodwill is tested annually in accordance
with IAS 36. The most recent test was performed during March 2015. Goodwill is
allocated to cash-generating units, that from accounting year 2014/15 consist of
clusters of companies in the categories Distribution and Proprietary Products for
each division. These clusters have been established by grouping companies that have
similar operations and business models and that have common market conditions.
The recoverable amount is calculated based on the value in use and a current
assessment of the cash flows for the next three-year period. Assumptions are made
based on previous experience for sales growth, gross margin, overhead levels,
working capital requirement and the need for capital expenditures. These para meters
are normally set to correspond to the forecast levels for the next financial year,
mainly based on the relevant entity’s business plan, equivalent to growth rates of
0 – 10 (0 – 10) percent annually. For subsequent years, growth has been based on an
estimated sustainable GDP growth rate of about 2 (2) percent. Cash flows have been
discounted using a weighted cost of capital equivalent to about 9 percent before tax
and 7 percent after tax (about 13 and 10 percent last year).
The calculation showed that the value in use exceeded the carrying amount in
the Group except in two cases where there are indications that the performance
did not really meet the level desired. In the Niche Products’ cluster Proprietary
Products, impairment losses of MSEK 11.5 were therefore recognised and in the
Communications’ cluster Distribution, impairment losses of MSEK 10.6 were
recognised as a result of a strategic decision and adjusted assumptions over time.
In other areas, the estimated value in use exceeded the carrying amount. The sens-
itivity of the calculations shows that the goodwill value in other areas can be defend-
ed going forward, even if the sustainable growth rate was 0 percent instead of 2
percent, or if the recoverable amount of each company was to decline by 10 percent.
Note 16 Trademarks
31 Mar 2015 31 Mar 2014
Group
Accumulated cost
Opening balance 170 129
New purchases – 40
Exchange difference -1 1
Carrying amount at end of the period 169 170
Trademarks allocated by division and cluster
Electronics
Distribution 18 18
Proprietary products 34 35
Total Electronics 52 53
Mechatronics
Distribution – –
Proprietary products 40 40
Total Mechatronics 40 40
Communications
Distribution 28 28
Proprietary products 3 3
Total Communications 31 31
Niche Products
Distribution – –
Proprietary products 46 46
Total Niche Products 46 46
Total trademarks 169 170
Every year impairment testing of trademarks is performed according to the same
principles used in the testing of goodwill.
30w w w. l a g e r c r a n t z . c o m
L a g e r c r a n t z G r o u p A B ( p u b l ) A n n u a l R e p o r t 2 014 / 15
Note 17 Other intangible assets
31 Mar 2015 31 Mar 2014
Group
Accumulated cost
Opening balance 233 183
New purchases 86 42
Reclassifications – 4
Exchange difference 2 -4
321 233
Accumulated amortisation according to plan
Opening balance -107 -84
Amortisation for the year according to plan -27 -21
Reclassifications – 0
Exchange difference -1 -2
-135 -107
Carrying amount at end of the period 186 126
Other intangible assets mainly consist of patents, customer relationships, capitalised
development costs and software. Of the total carrying amount, MSEK 22 (23) refers
to internally developed intangible assets.
Note 18 Buildings, land and land improvements
31 Mar 2015 31 Mar 2014
Group
Accumulated cost
Opening balance 59 56
New purchases 2 –
Transferred from construction in progress – 3
Purchases via new companies 12 –
1) 73 59
Accumulated depreciation according to plan
Opening balance -10 -8
Purchases via new companies -5 0
Depreciation for the year according to plan -2 -2
-17 -10
Carrying amount at end of the period 56 49
1) No capitalised interest is included in the cost.
Note 19 Costs incurred in leasehold property
31 Mar 2015 31 Mar 2014
Group
Accumulated cost
Opening balance 8 7
New purchases 1 –
Exchange difference 0 1
9 8
Accumulated depreciation according to plan
Opening balance -7 -6
Depreciation for the year according to plan 0 -1
Exchange difference 0 0
-7 -7
Carrying amount at end of the period 2 1
Note 20 Plant and machinery
31 Mar 2015 31 Mar 2014
Group
Accumulated cost
Opening balance 203 163
New purchases 11 7
Purchases via new companies 20 23
Transferred from construction in progress 7 12
Reclassifications – –
Disposals and retirements -3 -4
Exchange difference 2 2
240 203
Accumulated depreciation according to plan
Opening balance -145 -116
Purchases via new companies -10 -20
Reclassifications – –
Disposals and retirements 3 4
Depreciation for the year according to plan -14 -12
Exchange difference -1 -1
-167 -145
Carrying amount at end of the period 73 58
Note 21 Equipment, tools, fixtures and fittings
31 Mar 2015 31 Mar 2014
Group
Accumulated cost
Opening balance (including construction in progress) 128 119
New purchases 19 31
Purchases via new companies 12 3
Disposals and retirements -5 -7
Reclassifications from construction in progress -7 -15
Other reclassifications – -4
Exchange difference 1 1
148 128
Accumulated depreciation according to plan
Opening balance -96 -90
Purchases via new companies -11 -3
Disposals and retirements 4 6
Reclassifications – 0
Depreciation for the year according to plan -8 -8
Exchange difference -1 -1
-112 -96
Carrying amount at end of the period 36 32
Parent Company
Accumulated cost
Opening balance 2 1
New purchases 0 1
2 2
Accumulated depreciation according to plan
Opening balance -1 -1
Depreciation for the year according to plan 0 0
-1 -1
Carrying amount at end of the period 1 1
Note 22 Participations in Group companies
31 Mar 2015 31 Mar 2014
Parent Company
Accumulated cost
Opening balance 1,378 1,230
External acquisitions 188 148
Adjustment of contingent consideration -24 –
1,542 1,378
Accumulated impairment losses
Opening balance -136 -111
Impairment losses for the year – -25
-136 -136
Carrying amount at end of the period 1,406 1,242
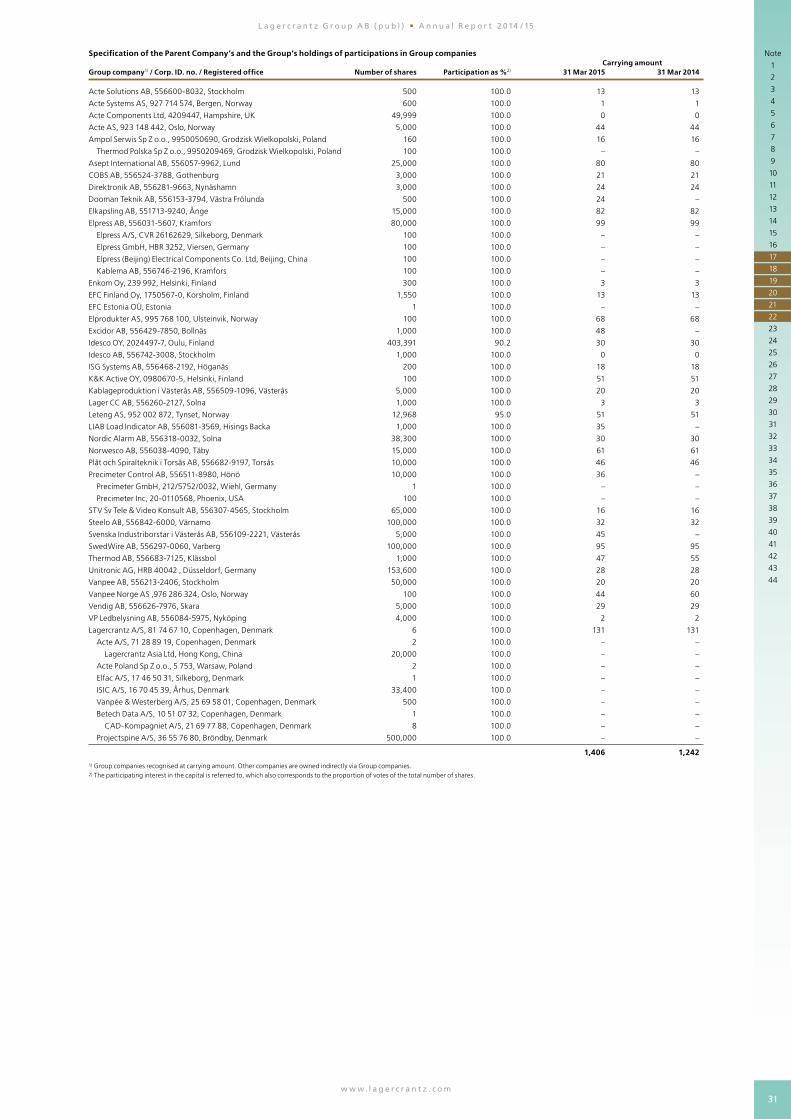
31w w w. l a g e r c r a n t z . c o m
L a g e r c r a n t z G r o u p A B ( p u b l ) A n n u a l R e p o r t 2 014 / 15
Note
1
2
3
4
5
6
7
8
9
10
11
12
13
14
15
16
17
18
19
20
21
22
23
24
25
26
27
28
29
30
31
32
33
34
35
36
37
38
39
40
41
42
43
44
Specification of the Parent Company’s and the Group’s holdings of participations in Group companies Carrying amount Group company1) / Corp. ID. no. / Registered office Number of shares Participation as %2) 31 Mar 2015 31 Mar 2014
Acte Solutions AB, 556600-8032, Stockholm 500 100.0 13 13
Acte Systems AS, 927 714 574, Bergen, Norway 600 100.0 1 1
Acte Components Ltd, 4209447, Hampshire, UK 49,999 100.0 0 0
Acte AS, 923 148 442, Oslo, Norway 5,000 100.0 44 44
Ampol Serwis Sp Z o.o., 9950050690, Grodzisk Wielkopolski, Poland 160 100.0 16 16
Thermod Polska Sp Z o.o., 9950209469, Grodzisk Wielkopolski, Poland 100 100.0 – –
Asept International AB, 556057-9962, Lund 25,000 100.0 80 80
COBS AB, 556524-3788, Gothenburg 3,000 100.0 21 21
Direktronik AB, 556281-9663, Nynäshamn 3,000 100.0 24 24
Dooman Teknik AB, 556153-3794, Västra Frölunda 500 100.0 24 –
Elkapsling AB, 551713-9240, Ånge 15,000 100.0 82 82
Elpress AB, 556031-5607, Kramfors 80,000 100.0 99 99
Elpress A/S, CVR 26162629, Silkeborg, Denmark 100 100.0 – –
Elpress GmbH, HBR 3252, Viersen, Germany 100 100.0 – –
Elpress (Beijing) Electrical Components Co. Ltd, Beijing, China 100 100.0 – –
Kablema AB, 556746-2196, Kramfors 100 100.0 – –
Enkom Oy, 239 992, Helsinki, Finland 300 100.0 3 3
EFC Finland Oy, 1750567-0, Korsholm, Finland 1,550 100.0 13 13
EFC Estonia OÜ, Estonia 1 100.0 – –
Elprodukter AS, 995 768 100, Ulsteinvik, Norway 100 100.0 68 68
Excidor AB, 556429-7850, Bollnäs 1,000 100.0 48 –
Idesco OY, 2024497-7, Oulu, Finland 403,391 90.2 30 30
Idesco AB, 556742-3008, Stockholm 1,000 100.0 0 0
ISG Systems AB, 556468-2192, Höganäs 200 100.0 18 18
K&K Active OY, 0980670-5, Helsinki, Finland 100 100.0 51 51
Kablageproduktion i Västerås AB, 556509-1096, Västerås 5,000 100.0 20 20
Lager CC AB, 556260-2127, Solna 1,000 100.0 3 3
Leteng AS, 952 002 872, Tynset, Norway 12,968 95.0 51 51
LIAB Load Indicator AB, 556081-3569, Hisings Backa 1,000 100.0 35 –
Nordic Alarm AB, 556318-0032, Solna 38,300 100.0 30 30
Norwesco AB, 556038-4090, Täby 15,000 100.0 61 61
Plåt och Spiralteknik i Torsås AB, 556682-9197, Torsås 10,000 100.0 46 46
Precimeter Control AB, 556511-8980, Hönö 10,000 100.0 36 –
Precimeter GmbH, 212/5752/0032, Wiehl, Germany 1 100.0 – –
Precimeter Inc, 20-0110568, Phoenix, USA 100 100.0 – –
STV Sv Tele & Video Konsult AB, 556307-4565, Stockholm 65,000 100.0 16 16
Steelo AB, 556842-6000, Värnamo 100,000 100.0 32 32
Svenska Industriborstar i Västerås AB, 556109-2221, Västerås 5,000 100.0 45 –
SwedWire AB, 556297-0060, Varberg 100,000 100.0 95 95
Thermod AB, 556683-7125, Klässbol 1,000 100.0 47 55
Unitronic AG, HRB 40042 , Düsseldorf, Germany 153,600 100.0 28 28
Vanpee AB, 556213-2406, Stockholm 50,000 100.0 20 20
Vanpee Norge AS ,976 286 324, Oslo, Norway 100 100.0 44 60
Vendig AB, 556626-7976, Skara 5,000 100.0 29 29
VP Ledbelysning AB, 556084-5975, Nyköping 4,000 100.0 2 2
Lagercrantz A/S, 81 74 67 10, Copenhagen, Denmark 6 100.0 131 131
Acte A/S, 71 28 89 19, Copenhagen, Denmark 2 100.0 – –
Lagercrantz Asia Ltd, Hong Kong, China 20,000 100.0 – –
Acte Poland Sp Z o.o., 5 753, Warsaw, Poland 2 100.0 – –
Elfac A/S, 17 46 50 31, Silkeborg, Denmark 1 100.0 – –
ISIC A/S, 16 70 45 39, Århus, Denmark 33,400 100.0 – –
Vanpée & Westerberg A/S, 25 69 58 01, Copenhagen, Denmark 500 100.0 – –
Betech Data A/S, 10 51 07 32, Copenhagen, Denmark 1 100.0 – –
CAD-Kompagniet A/S, 21 69 77 88, Copenhagen, Denmark 8 100.0 – –
Projectspine A/S, 36 55 76 80, Bröndby, Denmark 500,000 100.0 – –
1,406 1,2421) Group companies recognised at carrying amount. Other companies are owned indirectly via Group companies. 2) The participating interest in the capital is referred to, which also corresponds to the proportion of votes of the total number of shares.
32w w w. l a g e r c r a n t z . c o m
L a g e r c r a n t z G r o u p A B ( p u b l ) A n n u a l R e p o r t 2 014 / 15
Note 23 Receivables from Group companies
31 Mar 2015 31 Mar 2014
Parent Company
Accumulated cost
Opening balance 102 101
Additional receivables 89 42
Settled receivables -100 -44
Exchange difference 1 3
Carrying amount at end of the period 92 102
Note 24 Other non-current receivables
31 Mar 2015 31 Mar 2014
Group
Accumulated cost
Opening balance 2 2
Additional receivables 0 0
Settled receivables 0 0
Carrying amount at the end of the year 2 2
Note 25 Inventories
During the year, impairments losses of MSEK 3 on the inventory value (3) were
recognised.
Note 26 Trade receivables
Age analysis, not impaired trade receivables due 31 Mar 2015 31 Mar 2014
Group
Trade receivables not due 412 391
Trade receivables due 0 – 30 days 19 40
Trade receivables due > 30 – 90 days 4 7
Trade receivables due > 90 – 180 days 1 1
Trade receivables due > 180 days 1 –
Total 437 439
Provision account for bad debt losses 31 Mar 2015 31 Mar 2014
Group
Opening balance -2 3
Reversal of previously recognised impairment losses 0 -1
Impairment losses during the year 0 0
Exchange difference 0 0
Closing balance -2 2
Actual bad debt losses during the year of MSEK 0 (0) were charged to profit and loss.
Note 27 Earned but not yet invoiced revenue
31 Mar 2015 31 Mar 2014
Group
Work in progress
Accumulated recognised contract income 146 95
Invoicing -135 -84
Total claim on clients 11 11
Accumulated contract expenditure and recognised income
(after deduction of recognised loss) at the end of the period 146 95
Advanced payments received – –
Amounts held back by clients – –
Contract income from ongoing fixed price contracts is recognised using the
percentage of completion method. Calculations are made based on time spent
relative to the estimated time to complete the entire contract.
Note 28 Prepaid expenses and accrued income
31 Mar 2015 31 Mar 2014
Group
Prepaid rent 6 6
Prepaid insurance premiums 3 3
Other items 22 19
31 28
Parent Company
Prepaid rents 1 1
Prepaid insurance premiums 0 0
Other items 2 2
3 3
Note 29 Equity
Parent Company
Under Swedish law, equity shall be allocated between non-distributable (restricted)
and distributable (non-restricted) funds.
Restricted reserves
Restricted funds consist of share capital and the following reserves:
Legal reserve
The purpose of the legal reserve is to set aside the portion of net earnings not
required to cover a loss brought forward.
Non-restricted equity
Non-restricted funds consist of retained earnings:
Retained earnings
Consist of the preceding year’s non-restricted equity after any allocation to legal
reserve and after any dividends paid. Constitute the total non-restricted equity to-
gether with net profit for the year, i.e. the amount for payment as dividends to the
shareholders.
Share capital
Distribution and change of Class of share
Number of Number of Class of shares shares votes
A shares, 10 votes per share 1,087,934 10,879,340
B shares, 1 vote per share 22,085,375 22,085,375
The company’s repurchased shares -582,450 -582,450
Total 22,590,859 32,382,265
A shares B shares
Number of outstanding shares at start of period 1,091,966 22,081,343
Redemption of shares – –
Conversion of A shares -4,032 4,032
Number of outstanding shares at start of period 1,087,934 22,085,375
Number of repurchased shares
At start of period – 649,050
Shares used during redemption of options – -66,600
Repurchased shares during the period – –
At the end of the period – 582,450
The share capital amounted to MSEK 48.9 at the end of the period. The B share is
listed on Nasdaq Stockholm. According to the Articles of Association, the share
capital shall be not less than MSEK 25 and not more than MSEK 100. The share’s
quota value is SEK 2.11.
The proposed dividend for the year is SEK 4.50 (4.00) per share.
The employee share options programmes described in Note 6 are secured by shares
repurchased at an average cost of SEK 43.17.
When the call options are exercised at a redemption price of SEK 69.40, SEK
125.40 and SEK 161.80, respectively, per share, the number of outstanding shares
may increase by the number of call options redeemed, or a total of 566,300 shares.
The number of repurchased shares will then decline by an equivalent amount.

33w w w. l a g e r c r a n t z . c o m
L a g e r c r a n t z G r o u p A B ( p u b l ) A n n u a l R e p o r t 2 014 / 15
Group
The Group’s equity consists of share capital and the following items:
Other paid-up capital
Refers to equity contributed by the owners.
Reserves
Reserves refer to translation reserve and hedging reserve.
The translation reserve includes all exchange differences that arise when
translating the financial statements of foreign operations. These entities prepare
their financial statements in a different currency than the Group and the Parent
Company, which report in Swedish kronor (SEK). The translation reserve also consists
of exchange rate differences that arise upon remeasurement of net investments in a
foreign operation.
The hedging reserve includes the effective portion of the accumulated net change
in fair value of a cash flow hedging instrument attributable to hedging transactions
that have not yet occurred.
Retained earnings
Retained earnings include earned profit in the Parent Company and its subsidiaries.
Net profit for the year is reported separately in the statement of financial position.
Prior provisions to the legal reserve, excluding transferred share premium reserves,
are included in this equity item.
Capital management
The Group’s goal according to its finance policy, is to maintain a good capital
structure and financial stability in the interest of retaining the confidence of investors,
credit institutions and the market in general. In addition, this constitutes a foundation
for continued development of the business operations. Capital is defined as total
shareholders’ equity, not including non-controlling interests.
The ambition of the Board of Directors is to retain a balance between a high return
and the security of a large capital base. The Group’s goal is to achieve a return on
equity of at least 25 percent per year. During the 2014/15 financial year, the return
was 24 percent (24). Profit amounted to MSEK 203 (177) and average equity during
the year amounted to MSEK 861 (752). Profit increased more than the equity, among
other reasons due to this year’s dividend paid of about MSEK 90.
The Group’s policy is to pay a dividend of 30 – 50 percent of the net profit for the
year with cash flow and capital expenditure needs taken into account. Ahead of the
Annual General Meeting, the Board of Directors has proposed a dividend of SEK 4.50
(4.00) per share. The proposed dividend is equivalent to a dividend payout ratio of
50 percent (50). The dividend is also equivalent to 11 percent (11) of consolidated
equity on the balance sheet date.
The Group’s Board of Directors has a mandate from the 2014 AGM to repurchase
shares. No shares were repurchased during the year. The date of repurchases is
determ ined by the share price. The repurchased shares are, in part, intended to co-
ver the Group’s commitment under outstanding option programmes, where senior
executiv es and certain key persons have the opportunity to acquire Class B shares by
exercising acquired options. There is no formal repurchase plan. Decisions to buy and
sell shares in the Group are instead made by the Board of Directors within the frame-
work of the mandate given by the AGM. The Board of Directors is again proposing
that the 2015 AGM authorise the Board of Directors to repurchase the company’s
shares.
There was no change in the Group’s capital management during the year.
Note 30 Provisions for pensions and similar obligations
Defined benefit obligations
Lagercrantz Group has defined benefit pension plans in just a few countries. The
plans in Sweden cover certain Group companies. The plans provide benefits based on
the remuneration and length of service the employees have at or close to retirement.
The pension plan according to ITP, secured by insurance with Alecta, is recognised
as a defined contribution plan since the company has not had access to such inform-
ation to make it possible to recognise this plan as a defined benefit plan.
31 Mar 2015 31 Mar 2014
Group
The present value of unfunded defined benefit obligations 68 56
Net obligations including adjustments 68 56
Distribution of amount on plans in the following countries 31 Mar 2015 31 Mar 2014
Sweden 68 55
Germany – 1
Amount in statement of financial position 68 56
Actuarial gains and losses may arise when the present value of the commitments is
determined. They arise either when the actual outcome differs from the previously
made assumption, or when assumptions change.
Pension expense 2014/15 2013/14
Group
Defined benefit plans
Cost of pensions earned during the year 0 –
Change of liability for payroll tax -4 0
Interest expense -2 -3
Cost of defined benefit plans -6 -3
Cost of defined contribution plans -39 -34
Total cost of payments, post-employment -45 -37
The pension expense relating to the most important defined benefit pension plans
is recognised in the income statement in the lines Selling expenses, Administrative
expenses and Interest expense. Since virtually no new salaries are earned in this
category, the change in the liability for payroll tax and the interest portion of the
pension expense represent the main part of this. The change in the liability for payroll
tax is recognised as an administrative expense of MSEK 4 (0) and the interest expense
as a financial expense of MSEK 2 (3). The pension expense for defined contribution
plans amounted to MSEK 39 (34). The total pension expense for defined benefit and
defined contribution plans amounted to MSEK 45 (37).
The forecast for the period 2015/16 is that the pension expense will be in line with
2014/15, of which the financial expense for defined benefit plans is estimated at
MSEK 1.
Reconciliation of net amount of pensions in the statement of financial position
The following table shows how the net amount in the statement of financial position
has changed during the period:
2014/15 2013/14
Opening balance: Present value of obligation 56 59
Cost of defined benefit plans 2 2
Payments disbursed -4 -2
Change in actuarial gains/ losses 14 -3
Exchange differences – –
Closing balance: Present value of obligation 68 56
Net amount in statement of financial position
closing balance 68 56
Actuarial assumptions
The following significant actuarial assumptions have been applied when calculating
the obligations:
(weighted average values) 31 Mar 2015 31 Mar 2014
Discount rate 2.0% 3.7%
Expected inflation 1.5% 2.0%
Future salary increases 3.0% 3.0%
Employee turnover 5.0% 5.0%
Change in income amount 3.0% 3.0%
As in prior years, the basis for the discount interest rate in Sweden is the interest rate
on housing bonds. The Group estimates that MSEK 2 will be paid during 2014/15 to
funded and unfunded defined benefit plans.
Assumptions regarding life expectancy are the same as proposed by the Swedish
Financial Supervisory Authority, effective from 31 December 2007 (FFFS 2007:31).
Sensitivity analysis
Change of the unfunded defined benefit obligation, MSEK:
Discount rate, decrease of 0.5% 6.7
Discount rate, increase of 0.5% -5.9
Inflation, decrease of 0.5% -5.8
Inflation, increase of 0.5% 6.5
Life expectancy, increase of 1 year 3.2
Life expectancy, decrease of 1 year -3.2
31 Mar 2015 31 Mar 2014
Parent Company
Provision for pensions 21 21
21 21
Pledged assets for pension obligations
The Parent Company has guaranteed the PRI liabilities of Group companies.
Note
1
2
3
4
5
6
7
8
9
10
11
12
13
14
15
16
17
18
19
20
21
22
23
24
25
26
27
28
29
30
31
32
33
34
35
36
37
38
39
40
41
42
43
44
34w w w. l a g e r c r a n t z . c o m
L a g e r c r a n t z G r o u p A B ( p u b l ) A n n u a l R e p o r t 2 014 / 15
Note 31 Deferred tax
Deferred Deferred 31 Mar 2015 tax asset tax liability Net
Group
Other non-current assets 5 -82 -77
Other provisions 1 – 1
Untaxed reserves – -34 -34
Miscellaneous 2 0 2
Loss carryforwards 1 – 1
9 -116 -107
Deferred Deferred 31 Mar 2014 tax asset tax liability Net
Group
Other non-current assets 2 -69 -67
Other provisions 1 – 1
Untaxed reserves – -29 -29
Miscellaneous 3 -1 2
Loss carryforwards 1 1
7 -99 -92
Non-recognised deferred tax assets
Deferred tax assets relating to tax deficits of MSEK 1 (1) have not been recognised.
The value of tax loss carryforwards is taken into account to the extent it is deemed
possible that they will result in lower tax payments in the future.
Change of deferred tax in temporary
differences and loss carryforwards Recognised Opening via profit Closing balance or loss balance
Group
Other non-current assets -67 4 -77
Other provisions 1 0 1
Untaxed reserves -29 0 -34
Miscellaneous 2 – 2
Loss carryforwards 1 -1 1
-92 3 -107
The difference on the change by type of tax not carried via profit or loss is explained
by deferred taxes in connection with acquisitions and translation differences.
The company recognises no deferred taxes on temporary differences attributable
to investments in Group companies. Any effects in the future will be recognised
when the company can no longer control the reversal of such differences, or when
for other reasons it is no longer probable that a reversal will take place within the
foreseeable future.
The Parent Company has a deferred tax asset of MSEK 1 (1).
Note 32 Other provisions
31 Mar 2015 31 Mar 2014
Group
Other provisions such as non-current liabilities
Costs for restructuring measures – 0
Guarantee reserve 5 2
Miscellaneous 2 1
7 3
Other provisions such as current liabilities
Costs for restructuring measures 1 2
Miscellaneous 0 0
1 2
Carrying amount at start of the period 5 4
Provisions in acquired subsidiaries 2 –
Provisions made during the period 4 3
Amounts claimed during the period -3 -2
Unutilised amount reversed during the period 0 0
Carrying amount at end of the period 8 5
Restructuring
Reserved restructuring costs mainly consist of measures related to structural and
personnel changes.
Note 33 Financial assets and liabilities
Financial instruments by category
Fair values of financial assets and liabilities essentially correspond to the carrying
amounts. Fair value of contingent consideration is measured using the fair value
option contained in IAS 39, category 3. Derivatives are measured at fair value based
on observable market inputs and are included in IAS 39, category 2. As per 31 March
2015 and 2014 there were no outstanding derivatives.
Group Loan Derivates and trade for hedge 31 Mar 2015 receivables accounting Total
Assets in the statement of financial position
Non-current receivables 2 2
Trade receivables 437 437
Cash and cash equivalents 80 80
Total 519 – 519
All financial assets of MSEK 519 (479) are measured at amortised cost. The consolid-
ated statement of financial position shows other receivables of MSEK 46. All items
are non-financial.
Derivatives Financial for hedge 31 Mar 2015 liabilities accounting Total
Liabilities in the statement of financial position
Current liabilities to credit institutions 378 378
Trade payables 269 269
Other current liabilities 95 95
Total 742 – 742
The consolidated statement of financial position shows other liabilities of MSEK 175.
There are no derivatives as of the balance sheet date. Contingent consideration
payments are recognised of MSEK 95 measured at fair value via profit or loss. Other
financial liabilities of MSEK 647 (535) are measured at amortised cost. Financial
liabilities are mostly payable within 12 months. Other items are non-financial.
Loan Derivates and trade for hedge 31 Mar 2014 receivables accounting Total
Assets in the statement of financial position
Non-current receivables 2 2
Trade receivables 439 439
Cash and cash equivalents 38 38
Total 479 – 479
The consolidated statement of financial position shows other receivables of MSEK 34.
All items are non-financial. Derivatives Financial for hedge 31 Mar 2014 liabilities accounting Total
Liabilities in the statement of financial position
Current liabilities to credit institutions 270 270
Trade payables 265 265
Other current liabilities 97 97
Total 632 – 632
The consolidated statement of financial position shows other liabilities of MSEK 178.
There are no derivatives as of the balance sheet date. Contingent consideration pay-
ments are recognised of MSEK 97 measured at fair value via profit or loss. Financial
liabilities are mostly payable within 12 months. Other items are non-financial.
Change in contingent consideration (category 3) 2014/15 2013/14
Opening balance 97 72
Additional liabilities during the year 51 31
Settled liabilities -30 -2
Remeasured liabilities -24 -4
Exchange difference 1 0
Carrying amount at end of the period 95 97
Parent Company Loan Derivates and trade for hedge 31 Mar 2015 receivables accounting Total
Assets in the balance sheet
Non-current receivables from Group companies 92 92
Other current receivables 85 85
Cash and cash equivalents 0 0
Total 177 – 177

35w w w. l a g e r c r a n t z . c o m
L a g e r c r a n t z G r o u p A B ( p u b l ) A n n u a l R e p o r t 2 014 / 15
Derivatives Financial for hedge 31 Mar 2015 liabilities accounting Total
Liabilities in the balance sheet
Non-current liabilities to Group companies – –
Current liabilities to credit institutions 272 272
Trade payables 2 2
Others current liabilities 277 277
Total 551 – 551
Contingent consideration represents MSEK 90 of other liabilities and is measured at
fair value.
Loan Derivates and trade for hedge 31 Mar 2014 receivables accounting Total
Assets in the balance sheet
Non-current receivables from Group companies 102 102
Other current receivables 54 54
Cash and cash equivalents 0 0
Total 156 – 156
Derivatives Financial for hedge 31 Mar 2014 liabilities accounting Total
Liabilities in the balance sheet
Non-current liabilities to Group companies – –
Current liabilities to credit institutions 258 258
Trade payables 2 2
Other current liabilities 287 287
Total 547 – 547
Contingent consideration represents MSEK 92 of other liabilities and is measured at
fair value.
Note 34 Interest-bearing liabilities and provisions
The Group’s interest-bearing liabilities are allocated in the statement of financial
position as follows: Provision for pensions MSEK 68 (56), Non-current liabilities
MSEK 4 (53), Current liabilities to credit institutions MSEK 378 (270) and Other
current liabilities MSEK 0 (0). Total MSEK 450 (379). The provision for pensions is
defined as an interest-bearing provision since the present value of defined benefit
pension obligations is calculated using a discount rate in accordance with IAS 19.
For details, refer to Note 30.
Credit terms on trade payables in the Group follow normal industry practice.
Nominal values of interest-bearing liabilities and provisions essentially correspond to
carrying amounts.
Liabilities to credit institutions 31 Mar 2015 31 Mar 2014
Group
Short-term portion 106 8
Maturity date, 1– 5 years from the balance sheet date 4 52
Maturity date, more than 5 years from the balance sheet date – 1
110 61
Parent Company
Short-term portion 100 –
Maturity date, 1– 5 years from the balance sheet date – 50
Maturity date, more than 5 years from the balance sheet date – –
100 50
Overdraft facilities 31 Mar 2015 31 Mar 2014
Group
Approved credit limit 400 409
Unutilised portion -128 -147
Utilised credit amount 272 262
Credit limits on overdraft facilities are extended annually.
Parent Company
Approved credit limit 400 400
Unutilised portion -128 -142
Utilised credit amount 272 258
The credit limit on overdraft facilities is extended annually.
Pledged assets for overdraft facilities 31 Mar 2015 31 Mar 2014
Group
Chattel mortgages 3 1
3 1
Note 35 Accrued expenses and deferred income
31 Mar 2015 31 Mar 2014
Group
Employee benefit expenses 89 80
Other items 49 39
138 119
Parent Company
Employee benefit expenses 4 7
Other items 6 6
10 13
Note 36 Interest paid and received 2014/15 2013/14
Group
Interest received 0 1
Interest paid -9 -9
Parent Company
Interest received 4 4
Interest paid -8 -10
Note 37 Adjustment for non-cash items
2014/15 2013/14
Group
Depreciation and amortisation 51 44
Other provisions 16 5
Impairment losses and retirements 22 0
Capital gain / loss on disposal of non-current assets 0 1
Change in interest accrual 0 1
Reversal contingent consideration -24 –
Other items -4 -2
61 49
Parent Company
Depreciation and amortisation 0 0
Impairment losses – 25
Group contribution not yet paid 2 2
Group contribution not yet received -35 -35
Other items -3 -2
-36 -10
Note
1
2
3
4
5
6
7
8
9
10
11
12
13
14
15
16
17
18
19
20
21
22
23
24
25
26
27
28
29
30
31
32
33
34
35
36
37
38
39
40
41
42
43
44
36w w w. l a g e r c r a n t z . c o m
L a g e r c r a n t z G r o u p A B ( p u b l ) A n n u a l R e p o r t 2 014 / 15
Note 38 Investments in operations
A total of five businesses were acquired during the financial year. The acquired
companies are LIAB Load Indicator AB i Hisings Backa, Precimeter Control AB with its
head office on Hönö, Svenska Industriborstar i Västerås AB, Excidor AB in Bollnäs and
Dooman Teknik AB in Västra Frölunda. After the end of the reporting period, Cue Dee
AB was also acquired with its head office in Robertsfors and a subsidiary in Suzhou,
China. All acquisitions were paid for in cash.
Specification of acquisitions
During the second quarter, the operations in LIAB Load Indicator AB were acquired.
Load Indicator is a niche company that designs and manufactures high quality load
cells, force sensors and torque sensors for measurement applications to Swedish
manufacturing industry. The company generates total annual sales of about MSEK 30
with good profitability. The company has been part of the Communications division
since August 2014.
During the third quarter, the operations in Precimeter Control AB were acquired.
Precimeter is a niche product company that develops and sells solutions based on
laser and induction technology. Precimeter’s solutions measure levels and flows
of metals and most of its customer base consists of aluminium foundries and their
suppliers. The company, including its subsidiaries in Germany and the US, generates
total annual sales of about MSEK 30 with good profitability. The company has been
part of the Communications division since October 2014.
During the fourth quarter, the operations were acquired in Excidor AB, Svenska
Industriborstar i Västerås AB and Dooman Teknik AB.
Excidor has a strong market position in control systems for mobile operator
environments. The company’s solutions are primarily found in forest machinery,
excavators and wheel loaders and its generates total annual sales of just over
MSEK 30 with good profitability. The company has been part of the Lagercrantz
Communications division since February 2015.
Svenska Industriborstar i Västerås AB (SIB) develops, sells and manufactures
specially-designed steel and plastic brushes for snow clearance of airport runways
and for industrial applications in manufacturing industry. SIB’s cassette brush
system is market-leading at North European airports and has a strong position in
North America. Exports represent a large part of sales. SIB generates total annual
sales of about MSEK 45 with good profitability. The company has been part of the
Lagercrantz Niche Products division since February 2015.
Dooman Teknik AB offers products in the field of home adaptations for disabled
people with garage modules for disability vehicles as a main product. The customers
mainly consist of Swedish municipalities. Dooman generates annual sales of about
MSEK 25 with good profitability. The company has been part of the Lagercrantz
Niche Products division since February 2015.
After the end of the period, the operations in Cue Dee AB and a subsidiary were
also acquired. Cue Dee primarily develops and sells brackets that meet strict require-
ments in terms of endurance and flexibility. The brackets are used for mounting of
telecommunications and other equipment in masts, on roofs or in other exposed
areas. The company manufactures specially-adapted masts and related peripheral
equipment for various applications such as wind measurement. The customers are
global and are mainly found in the telecommunications sector and consist of network
providers, operators and installers. The company, including its subsidiary in China,
generates annual sales of about MSEK 180 with good profitability. Cue Dee has been
part of Lagercrantz’s Mechatronics division since April 2015.
Since information about the companies on an individual basis is not essential, it
is provided here in aggregated form. Lagercrantz Group normally uses contingent
consideration as a complement to the basic purchase price. The estimated total
purchase price includes reserved contingent consideration of MSEK 33 for the
recently acquired companies. The calculation is based on probability-weighted
expected values. The absence of contingent consideration is the minimum outcome
that can occur. This is not probable, however. Of the as yet unpaid consideration,
estimated contingent consideration and the collateral held amounted to MSEK 95.
The outcome depends on the profit achieved by the companies. Intangible surplus
values refer primarily to strong product ranges and innovations that justify a good
price and a strong position in the market. Goodwill is justified by the value of the
technological expertise the companies have and good profitability. The acquisition
calculations are still preliminary and are subject to change.
Net assets of the acquired companies at the time of acquisition
2014/15 2013/14
Net identifiable assets / liabilities 125 101
Goodwill 63 63
Estimated consideration 188 164
Effect on cashflow
2014/15 2013/14
Group
Intangible assets -141 -139
Property, plant and equipment -18 -8
Inventories -29 -25
Other current assets -56 -39
Provisions 24 21
Non-current liabilities 15 –
Current liabilities 17 26
Total consideration -188 -164
Cash and cash equivalents in the acquired operations 40 5
Impact on the Group’s cash and cash equivalents
from acquisitions during the year -148 -159
Adjustment of estimated contingent consideration
in older acquisitions -30 3
Amortisation /repayment of liabilities relating to
acquired operations 50 26
Cash flow related to investments in operations -128 -130
Distribution of intangible assets in connection with acquisitions
2014/15 2013/14
Goodwill 63 63
Trademarks – 22
Other intangible assets 78 54
Total intangible assets via acquisitions 141 139
Contribution of the acquired entitles to Group revenue and earnings
2014/15 2013/14
Revenue 56 74
Profit contribution before acquisition costs 14 11
Transaction costs -2 -1
Amortisation of surplus values -3 -2
Profit contribution after acquisition costs 9 8
Financing costs -2 -3
Profit contribution after acquisition costs 7 5
Contribution of the acquired entitles to Group revenue and earnings
if they had been included for the entire year
2014/15 2013/14
Revenue 164 133
Profit contribution before acquisition costs 42 24
Transaction costs -2 -1
Amortisation of surplus value -8 -4
Profit contribution before acquisition costs 32 19
Financing costs -6 -6
Profit contribution after financing costs 26 13
Transaction costs relating to acquisitions during the year of MSEK 2 (1) are recognised
as administrative expenses.
Note 39 Contingent liabilities
31 Mar 2015 31 Mar 2014
Group
Guarantee commitments FPG / PRI 1 1
Other guarantees 8 3
9 4
Note 40 Earnings per share
2014/15 2013/14
Earnings per share, SEK 8.99 7.85
Earnings per share after dilution, SEK 8.96 7.81
The calculation of earnings per share for 2014/15 is based on profit for the year
attributable to the Parent Company’s shareholders amounting to MSEK 203 (177) and
a weighted average number of shares outstanding during 2014/15 of 22,543,569
37w w w. l a g e r c r a n t z . c o m
L a g e r c r a n t z G r o u p A B ( p u b l ) A n n u a l R e p o r t 2 014 / 15
(22,425,586). The weighted number of shares outstanding including dilution is
22,572,972 (22,644,579).
Instruments that may generate future dilution effects
During the 2014/15 financial year, the company had three call option programmes
outstanding, the redemption prices of which (SEK 69.40, SEK 125.40 and SEK 161.80
per share) in one case was below the average market price of the share during the
year (SEK 139.71 per share). These options give rise to a dilutive effect and have been
included in the estimated earnings per share after dilution. For a description of the
options programme refer to Note 6. Repurchased shares are used as a hedge for this
programme.
Note 41 Risk management
Financial risks
It is essential to Lagercrantz Group to have an efficient and systematic risk assess-
ment process for managing financial as well as business risks. Lagercrantz Group’s
risk management model does not mean that risks are avoided but is aimed at identi-
fying, managing and pricing these risks.
Lagercrantz Group’s Board of Directors is responsible for adopting a financial policy
that provides guidelines, goals and limits for financial management and handling of
financial risks in the Group. The financial policy governs the allocation of respons-
ibilities between Lagercrantz Group’s Board of Directors, group management and
the Group’s companies. In the Group, group management has the operative respons-
ibility to secure the Group’s financing and to manage the liquidity, financial assets
and liabilities efficiently.
Currency risk
Despite the fact that Lagercrantz Group has an international presence, its operations
are local in nature as far as currency risk is concerned. Incoming and outgoing
payments in the various local currencies are thus well balanced. Currency risk is the
greatest financial risk to which Lagercrantz Group is exposed. It is defined as the risk for
a negative effect on profit caused by exchange rate fluctuations. Exchange rate fluctu-
ations affect the company’s profit, equity and competitive situation in different ways:
The result is affected when sales and purchases are in different currencies
(transaction exposure).
The result is affected when assets and liabilities are in different currencies
(translation exposure).
The result is affected when subsidiaries’ results in different currencies are
translated to Swedish kronor (translation exposure).
Equity is affected when subsidiaries’ net assets in different currencies are translated
to Swedish kronor (translation exposure).
Transaction exposure
In an internationally active trading company such as Lagercrantz Group it is important
to offer customers and suppliers opportunities to pay in their own currency. This
means that the Group continually assumes currency risks, both in the form of trade
receivables and trade payables in foreign currency.
Since the largest part of sales is in the Nordic Region, Lagercrantz Group has a sur-
plus of foreign currency flows exposed to transaction risks in that region. The Group’s
purchases and sales in important foreign currencies amounted to MSEK 1,523 and
MSEK 1,965 respectively, during the year.
Purchasing/sales in important currencies
Amounts in MSEK Purchasing Sales
USD 311 195
EUR 986 911
GBP 10 78
DKK 120 473
NOK 19 221
JPY 25 11
PLN 52 76
Group total 1,523 1,965
Cash and cash equivalents per currency
Amounts in MSEK 31 Mar 2015 31 Mar 2014
SEK 22 1
USD 5 6
EUR 13 3
DKK 1 2
NOK 11 13
Other currencies 28 13
Group total 80 38
According to Lagercrantz Group’s guidelines, foreign currency exposure should be
limited in nature. Foreign currency exposure that arises is eliminated to the greatest
extent possible through foreign currency clauses and invoicing in the same currency
as the purchase currency. Hedging of current exposures in foreign currency is used
sparingly. The long-term benefit of hedging is deemed to be limited, combined with
increased complexity in the recognition of financial derivatives.
Translation exposure in the statement of financial position
An individual subsidiary should normally have no translation risk in its own balance
sheet. This means that a subsidiary’s receivables and liabilities in foreign currency
should be balanced. Subsidiaries also normally conduct their borrowing in their own
currency. In practice, this only comes into play when loans are raised in conjunction
with the acquisition and in the case of loans between subsidiary and parent company.
Equity in foreign Group companies is normally not hedged since investments in
subsidiaries are considered to be of a long-term character. There may be exceptions,
however. The translation exposure in consolidated equity can be substantial during
certain periods with sharp currency fluctuations. The largest exposures are in DKK,
USD, EUR and NOK. The effect of translation differences on equity is shown in the
summary of changes in equity.
Exchange rate sensitivity
As a rule of thumb it can be said that a change in the euro exchange rate (including
the Danish krone, the exchange rate of which is linked to EUR) relative to the Swedish
krona of plus or minus 5 percent is estimated to change Lagercrantz Group’s gross
profit by plus or minus MSEK 4, respectively, on an annual basis given the conditions
that prevailed during the financial year. The equivalent change in the Norwegian
exchange rate gives an effect of plus and minus MSEK 6, respectively.
A change in the US dollar exchange rate of plus or minus 5 percent, on the other
hand, would give an effect of minus and plus MSEK 6, respectively. The effects of
changes in exchange rates can also have other effects on results since measures are
continually taken to minimise the negative effects of changes in exchange rates. This
makes the ultimate effects on the result difficult to predict and analyse. The rule of
thumb should therefore be used with caution.
Interest rate risk
The financial policy states that maximum borrowing and fixed interest periods should
relate to the period where a borrowing need is expected to exist. The general rule is
that a maximum of 50 percent of borrowing can be fixed for one to five-year terms.
Interest rate risk arises in two ways:
The company may have invested in interest-bearing assets, the value of
which changes when interest rates change.
The cost of the company’s borrowing changes when the interest rate
scenario changes.
Lagercrantz Group has no long-term surplus liquidity and normally does not in-
vest funds in anything but short-term bank deposits /money market instruments with
maturities of less than 90 days. The interest rate risk in the Group’s investments in
securities is therefore minimal. Changes in interest rates therefore primarily affect the
company’s borrowing costs. A change in the weighted average interest rate of 1 per-
centage point is estimated to affect the Group’s interest expense before taxes by MSEK
4 on an annual basis, given the conditions that prevailed during the financial year.
The Group’s goal is to have an appropriate liquidity reserve available in the form of
cash liquidity and committed credit facilities.
Weighted average effective interest rates on loans
Group Parent Company 2014/15 2013/14 2014/15 2013/14
Non-current liabilities
to credit institutions 1.74% 2.57% 1.62% 2.47%
Current liabilities
to credit institutions 1.57% 2.22% 1.57% 2.22%
Credit risk
Lagercrantz Group’s credit risk with respect to trade receivables is highly diversified
through a large number of projects and other business agreements of varying size and
type, with a large number of customer categories in a multitude of geographical mark-
ets. The company therefore has no significant concentration of credit risks. Financial
credit and counterparty risk is identified, managed and reported in accordance with
the framework defined in the Group’s finance policy, risk policy and attestation rules.
In connection with financing of projects and other business agreements, Lagercrantz
may in certain cases assume responsibility for bank guarantees, in the form of Parent
Company guarantees towards a third party, for the purpose of securing financing
during a limited period of time. According to the finance policy, as few credit counter-
parties as possible shall be strived for and they should always be highly creditworthy.
No significant losses of a financial character occurred during the year.
Liquidity risk
Well-established relationships with the capital markets are essential for Lagercrantz
Group to be able to ensure the supply of capital on market terms on a long-term
basis. Thanks to negotiated credit facilities there is adequate preparedness for
temporary fluctuations in the Group’s liquidity requirements. For a maturity schedule,
refer to Note 34. Lagercrantz Group’s committed bank credit facilities consist of:
A committed credit facility of MSEK 400 in the Parent Company.
A revolving credit facility of MSEK 300, to be renewed in November 2015.
Capital risk
The Group’s goal with respect to its capital structure is to ensure the ability to continue
operations, allowing the company to continue generating a return to its shareholders
and benefits for other stakeholders, and to maintain a capital structure that provides
a low overall capital cost. The risk inherent in the Group’s level of capital is judged in
terms of the equity ratio and interest coverage ratio. The present levels of these metrics
adequately meet the requirements, so-called covenants, imposed by lenders.
Note
1
2
3
4
5
6
7
8
9
10
11
12
13
14
15
16
17
18
19
20
21
22
23
24
25
26
27
28
29
30
31
32
33
34
35
36
37
38
39
40
41
42
43
44
38w w w. l a g e r c r a n t z . c o m
L a g e r c r a n t z G r o u p A B ( p u b l ) A n n u a l R e p o r t 2 014 / 15
Note 42 Related parties
Related parties
The Parent Company has a related-party relationship with its Group companies and
with the members of the management team. The company’s directors and their close
family members control approximately 33 percent of the votes in the company.
Related party transactions
The Parent Company invoices Group companies for intra-Group services. Sales
among Group companies involving small amounts have taken place. Transactions are
based on market-related terms. No other related party transactions have occurred
within the Group. No other purchases or sales have occurred between the Parent
Company and the Group companies.
Note 43 Post-balance sheet events
Lagercrantz acquired Cue Dee AB on 8 April 2015, which develops and sells brackets
for mounting of telecommunications and other equipment in masts, on roofs and in
other exposed areas. The company also manufactures specially-adapted masts and
related peripheral equipment for various applications such as wind measurement.
The custom ers are global and are mainly found in the telecommunications sector
and consist of network providers, operators and installers. The company has its head
office in Robertsfors, north of Umeå and has a subsidiary in China. Cue Dee generates
annual sales of about MSEK 180 with good profitability. Also see Note 38 above.
Preliminary purchase price allocation Book Fair Fair Acquired net assets value in value value at time of acquisition companies adjustment consolidated
Intangible non-current assets – 100 100
Other non-current assets 3 2 5
Inventories and work in progress 10 – 10
Other current assets 103 – 103
Other liabilities -42 -22 -64
Net of identified assets/ liabilities 74 80 154
Goodwill 120
Estimated purchase price 274
No other significant events for the company have occurred after the balance sheet
date on 31 March 2015.
Note 44 Information about Lagercrantz Group AB
Lagercrantz Group AB (publ) with its registered office in Stockholm.
Box 3508, Torsgatan 2, SE-103 69 Stockholm, Sweden.
Corporate Identity Number 556282-4556.
The company’s primary object is to manufacture and deliver proprietary products
and as well as products and solutions made by others in the fields of electronic and
electro-mechanical components, equipment for communication and information
technology and other niche technology areas – in a value-adding manner – through
niche-oriented subsidiaries to corporate customers, and to conduct other business
activities compatible with this. The average number of employees during the year
was 11. The Parent Company’s shares are registered on Nasdaq Stockholm. The
Annual Accounts and the consolidated financial statements were approved for
publication by the Board of Directors and the President on 24 June 2015.
39w w w. l a g e r c r a n t z . c o m
L a g e r c r a n t z G r o u p A B ( p u b l ) A n n u a l R e p o r t 2 014 / 15
Report on the annual accounts and consolidated accounts
We have audited the annual accounts and consolidated accounts of Lagercrantz Group AB (publ) for the financial year 1 April 2014 – 31 March 2015. The annual accounts and con-solidated accounts of the company are included in the printed version of this document on pages 2 – 38.
Responsibilities of the Board of Directors and the Managing Director for the annual accounts and consolidated accounts The Board of Directors and the Managing Director are responsible for the preparation and fair presentation of these annual accounts in accordance with the Annual Accounts Act and of the consolidated accounts in accordance with International Financial Reporting Standards, as adopted by the EU, and the Annual Accounts Act, and for such internal control as the Board of Directors and the Managing Director determine is necessary to enable the preparation of annual accounts and consolidated accounts that are free from material misstatement, whether due to fraud or error.
Auditor’s responsibilityOur responsibility is to express an opinion on these annual accounts and consolidated accounts based on our audit. We conducted our audit in accordance with International Standards on Auditing and generally accepted auditing standards in Sweden. Those standards require that we comply with ethical requirements and plan and perform the audit to obtain reason-able assurance about whether the annual accounts and con- soli dated accounts are free from material misstatement.
An audit involves performing procedures to obtain audit evidence about the amounts and disclosures in the annual accounts and consolidated accounts. The procedures selected depend on the auditor’s judgment, including the assessment of the risks of material misstatement of the annual accounts and consolidated accounts, whether due to fraud or error. In making those risk assessments, the auditor considers internal control relevant to the company’s preparation and fair presen t-ation of the annual accounts and consolidated accounts in order to design audit procedures that are appropriate in the circum-stances, but not for the purpose of expressing an opinion on the effectiveness of the company’s internal control. An audit also includes evaluating the appropriateness of accounting policies used and the reasonableness of accounting estimates made by the Board of Directors and the Managing Director, as well as evaluating the overall presentation of the annual accounts and consolidated accounts.
We believe that the audit evidence we have obtained is sufficient and appropriate to provide a basis for our audit opinions.
OpinionsIn our opinion, the annual accounts have been prepared in accordance with the Annual Accounts Act and present fairly, in all material respects, the financial position of the parent company as of 31 March 2015 and of its financial performance and its cash flows for the year then ended in accordance with the Annual Accounts Act. The consolidated accounts have been pre-pared in accordance with the Annual Accounts Act and present fairly, in all material respects, the financial position of the group as of 31 March 2015 and of their financial performance and cash flows for the year then ended in accordance with International
Financial Reporting Standards, as adopted by the EU, and the Annual Accounts Act. A corporate governance Statement has been prepared. The statutory administration report and the corp orate governance statement are consistent with the other parts of the annual accounts and consolidated accounts.
We therefore recommend that the annual meeting of share-holders adopt the income statement and balance sheet for the parent company and the income statement and statement of financial position for the group.
Report on other legal and regulatory requirements
In addition to our audit of the annual accounts and consolidated accounts, we have also audited the proposed appropriations of the company’s profit or loss and the administration of the Board of Directors and the Managing Director of Lagercrantz Group AB (publ) for the financial year 1 April 2014 – 31 March 2015.
Responsibilities of the Board of Directors and the Managing Director The Board of Directors is responsible for the proposal for appropri ations of the company’s profit or loss, and the Board of Directors and the Managing Director are responsible for admin-istration under the Companies Act.
Auditor’s responsibilityOur responsibility is to express an opinion with reasonable assurance on the proposed appropriations of the company’s profit or loss and on the administration based on our audit. We conducted the audit in accordance with generally accepted auditing standards in Sweden.
As basis for our opinion on the Board of Directors proposed appropriations of the company’s profit or loss we examined the Board of Directors’ reasoned statement and a selection of supporting evidence in order to be able to assess whether the pro posal is in accordance with the Companies Act.
As basis for our opinion concerning discharge from liability, in addition to our audit of the annual accounts and consolidated accounts, we examined significant decisions, actions taken and circumstances of the company in order to determine whether any member of the Board of Directors or the Managing Director is liable to the company. We also examined whether any member of the Board of Directors or the Managing Director has, in any other way, acted in contravention of the Companies Act, the Annual Accounts Act or the Articles of Association.
We believe that the audit evidence we have obtained is sufficient and appropriate to provide a basis for our opinions.
OpinionsWe recommend to the annual meeting of shareholders that the profit be appropriated in accordance with the proposal in the statutory administration report and that the members of the Board of Directors and the Managing Director be discharged from liability for the financial year.
Stockholm 24 June 2015
KPMG AB
Joakim ThilstedtAuthorized Public Accountant
To the annual meeting of the shareholders of Lagercrantz Group AB (publ), corp. id. 556282-4556Auditor’s Report
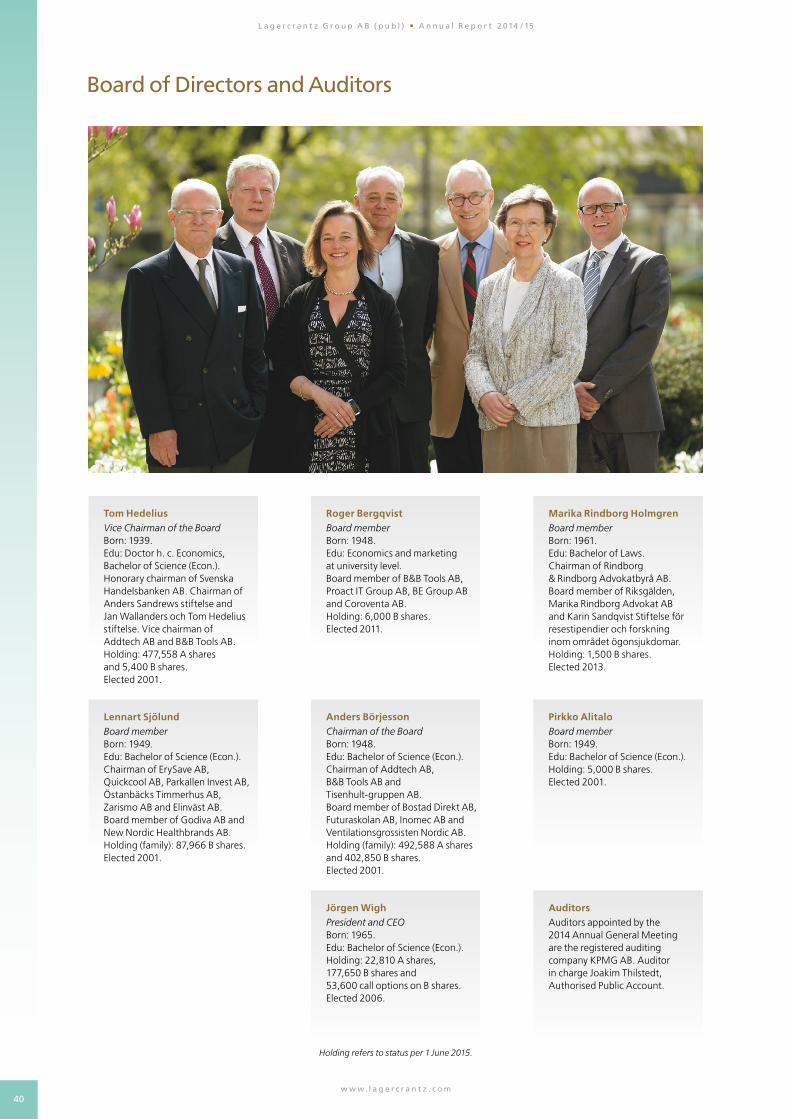
40w w w. l a g e r c r a n t z . c o m
L a g e r c r a n t z G r o u p A B ( p u b l ) A n n u a l R e p o r t 2 014 / 15
Board of Directors and Auditors
Anders BörjessonChairman of the BoardBorn: 1948.Edu: Bachelor of Science (Econ.).Chairman of Addtech AB, B&B Tools AB and Tisenhult-gruppen AB.Board member of Bostad Direkt AB, Futuraskolan AB, Inomec AB and Ventilationsgrossisten Nordic AB.Holding (family): 492,588 A shares and 402,850 B shares.Elected 2001.
Pirkko AlitaloBoard memberBorn: 1949.Edu: Bachelor of Science (Econ.).Holding: 5,000 B shares.Elected 2001.
Lennart SjölundBoard memberBorn: 1949.Edu: Bachelor of Science (Econ.).Chairman of ErySave AB, Quickcool AB, Parkallen Invest AB, Östanbäcks Timmerhus AB, Zarismo AB and Elinväst AB.Board member of Godiva AB and New Nordic Healthbrands AB.Holding (family): 87,966 B shares.Elected 2001.
Tom HedeliusVice Chairman of the BoardBorn: 1939.Edu: Doctor h. c. Economics, Bachelor of Science (Econ.).Honorary chairman of Svenska Handelsbanken AB. Chairman of Anders Sandrews stiftelse and Jan Wallanders och Tom Hedelius stiftelse. Vice chairman of Addtech AB and B&B Tools AB.Holding: 477,558 A shares and 5,400 B shares.Elected 2001.
Roger BergqvistBoard memberBorn: 1948.Edu: Economics and marketing at university level.Board member of B&B Tools AB, Proact IT Group AB, BE Group AB and Coroventa AB.Holding: 6,000 B shares.Elected 2011.
Marika Rindborg HolmgrenBoard memberBorn: 1961.Edu: Bachelor of Laws.Chairman of Rindborg & Rindborg Advokatbyrå AB. Board member of Riksgälden, Marika Rindborg Advokat AB and Karin Sandqvist Stiftelse för resestipendier och forskning inom området ögonsjukdomar. Holding: 1,500 B shares.Elected 2013.
Jörgen WighPresident and CEOBorn: 1965.Edu: Bachelor of Science (Econ.).Holding: 22,810 A shares, 177,650 B shares and 53,600 call options on B shares.Elected 2006.
AuditorsAuditors appointed by the 2014 Annual General Meeting are the registered auditing company KPMG AB. Auditor in charge Joakim Thilstedt, Authorised Public Account.
Holding refers to status per 1 June 2015.
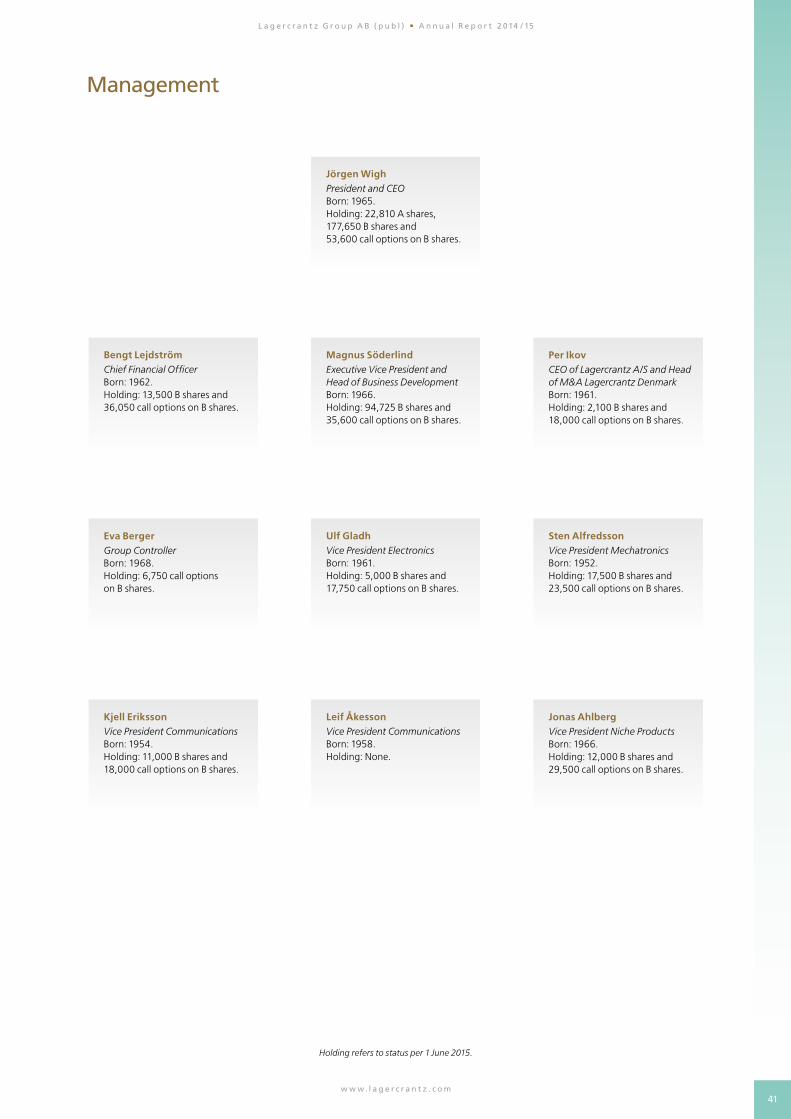
41w w w. l a g e r c r a n t z . c o m
L a g e r c r a n t z G r o u p A B ( p u b l ) A n n u a l R e p o r t 2 014 / 15
Management
Holding refers to status per 1 June 2015.
Bengt LejdströmChief Financial OfficerBorn: 1962.Holding: 13,500 B shares and 36,050 call options on B shares.
Magnus SöderlindExecutive Vice President and Head of Business DevelopmentBorn: 1966.Holding: 94,725 B shares and35,600 call options on B shares.
Ulf GladhVice President ElectronicsBorn: 1961.Holding: 5,000 B shares and 17,750 call options on B shares.
Sten AlfredssonVice President MechatronicsBorn: 1952.Holding: 17,500 B shares and23,500 call options on B shares.
Kjell ErikssonVice President CommunicationsBorn: 1954.Holding: 11,000 B shares and18,000 call options on B shares.
Per IkovCEO of Lagercrantz A/S and Head of M&A Lagercrantz DenmarkBorn: 1961.Holding: 2,100 B shares and18,000 call options on B shares.
Jonas AhlbergVice President Niche ProductsBorn: 1966.Holding: 12,000 B shares and29,500 call options on B shares.
Eva BergerGroup Controller Born: 1968.Holding: 6,750 call options on B shares.
Jörgen WighPresident and CEOBorn: 1965.Holding: 22,810 A shares, 177,650 B shares and53,600 call options on B shares.
Leif ÅkessonVice President CommunicationsBorn: 1958.Holding: None.
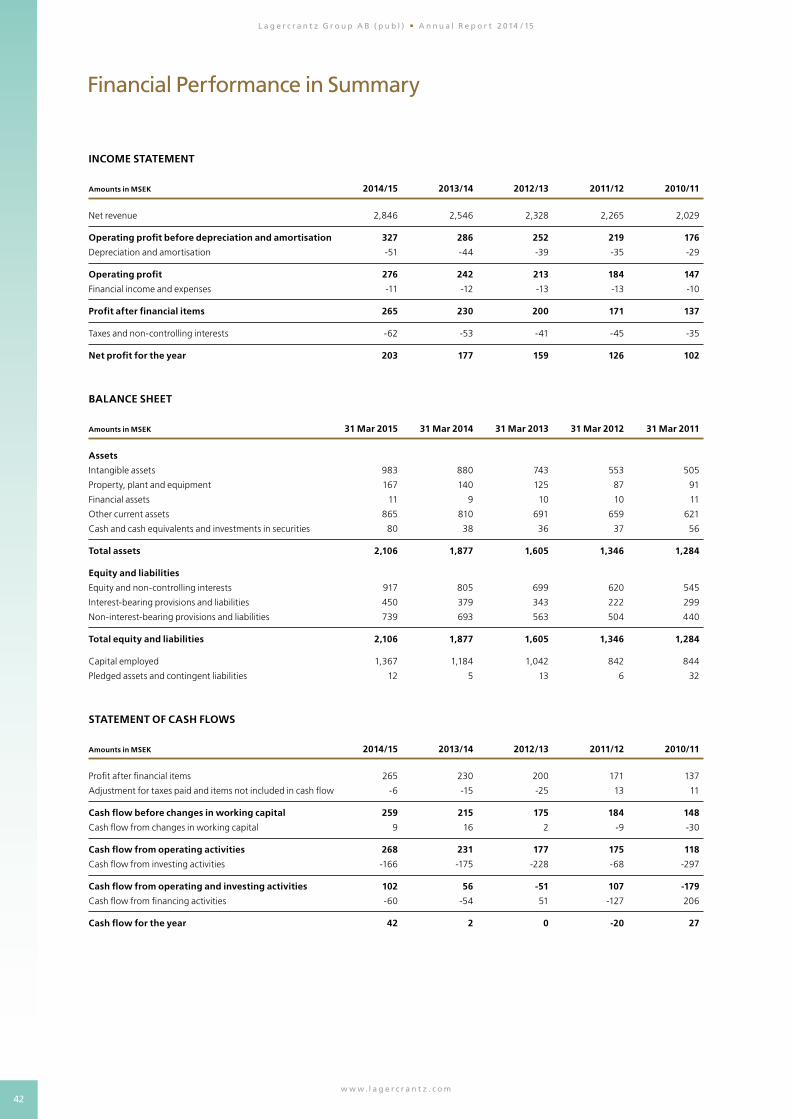
42w w w. l a g e r c r a n t z . c o m
L a g e r c r a n t z G r o u p A B ( p u b l ) A n n u a l R e p o r t 2 014 / 15
Financial Performance in Summary
INCOME STATEMENT
Amounts in MSEK 2014/15 2013/14 2012/13 2011/12 2010/11
Net revenue 2,846 2,546 2,328 2,265 2,029
Operating profit before depreciation and amortisation 327 286 252 219 176
Depreciation and amortisation -51 -44 -39 -35 -29
Operating profit 276 242 213 184 147
Financial income and expenses -11 -12 -13 -13 -10
Profit after financial items 265 230 200 171 137
Taxes and non-controlling interests -62 -53 -41 -45 -35
Net profit for the year 203 177 159 126 102
BALANCE SHEET
Amounts in MSEK 31 Mar 2015 31 Mar 2014 31 Mar 2013 31 Mar 2012 31 Mar 2011
Assets
Intangible assets 983 880 743 553 505
Property, plant and equipment 167 140 125 87 91
Financial assets 11 9 10 10 11
Other current assets 865 810 691 659 621
Cash and cash equivalents and investments in securities 80 38 36 37 56
Total assets 2,106 1,877 1,605 1,346 1,284
Equity and liabilities
Equity and non-controlling interests 917 805 699 620 545
Interest-bearing provisions and liabilities 450 379 343 222 299
Non-interest-bearing provisions and liabilities 739 693 563 504 440
Total equity and liabilities 2,106 1,877 1,605 1,346 1,284
Capital employed 1,367 1,184 1,042 842 844
Pledged assets and contingent liabilities 12 5 13 6 32
STATEMENT OF CASH FLOWS
Amounts in MSEK 2014/15 2013/14 2012/13 2011/12 2010/11
Profit after financial items 265 230 200 171 137
Adjustment for taxes paid and items not included in cash flow -6 -15 -25 13 11
Cash flow before changes in working capital 259 215 175 184 148
Cash flow from changes in working capital 9 16 2 -9 -30
Cash flow from operating activities 268 231 177 175 118
Cash flow from investing activities -166 -175 -228 -68 -297
Cash flow from operating and investing activities 102 56 -51 107 -179
Cash flow from financing activities -60 -54 51 -127 206
Cash flow for the year 42 2 0 -20 27
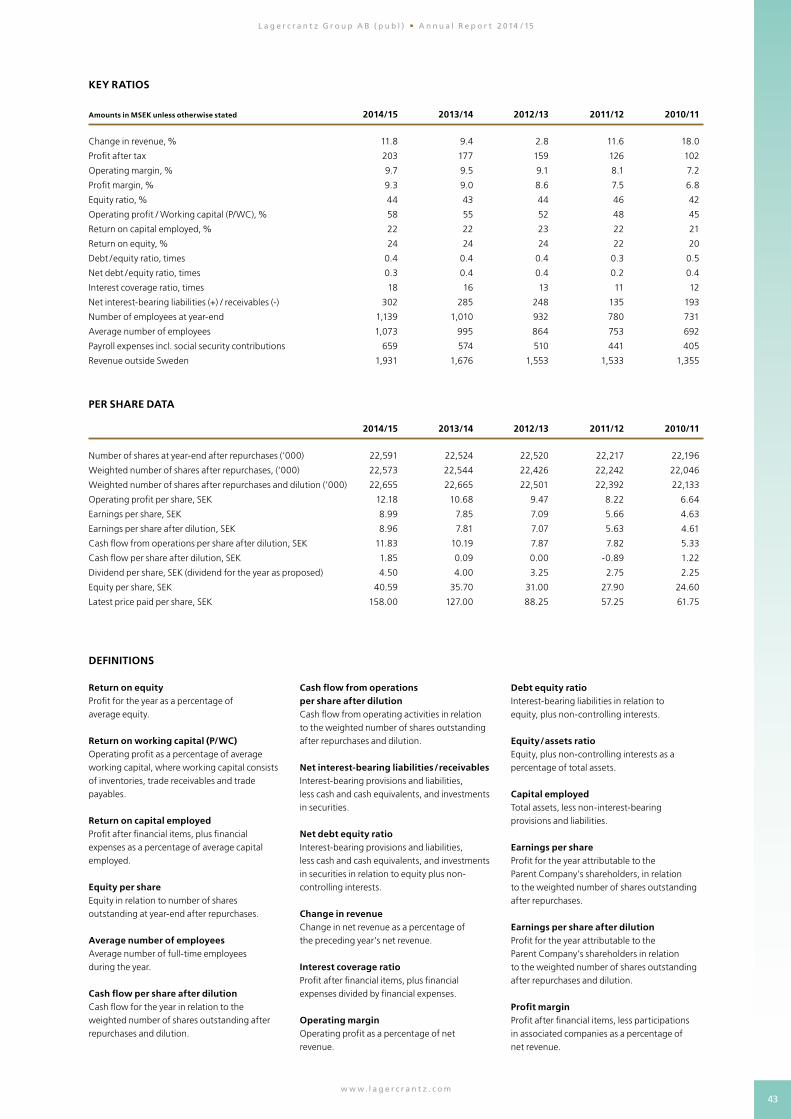
43w w w. l a g e r c r a n t z . c o m
L a g e r c r a n t z G r o u p A B ( p u b l ) A n n u a l R e p o r t 2 014 / 15
DEFINITIONS
Return on equityProfit for the year as a percentage of average equity.
Return on working capital (P/WC)Operating profit as a percentage of average working capital, where working capital consists of inventories, trade receivables and trade payables.
Return on capital employedProfit after financial items, plus financial expenses as a percentage of average capital employed.
Equity per share Equity in relation to number of shares outstanding at year-end after repurchases.
Average number of employeesAverage number of full-time employees during the year.
Cash flow per share after dilutionCash flow for the year in relation to the weighted number of shares outstanding after repurchases and dilution.
Cash flow from operations per share after dilutionCash flow from operating activities in relation to the weighted number of shares outstanding after repurchases and dilution.
Net interest-bearing liabilities/receivables Interest-bearing provisions and liabilities, less cash and cash equivalents, and investments in securities.
Net debt equity ratioInterest-bearing provisions and liabilities, less cash and cash equivalents, and investments in securities in relation to equity plus non- controlling interests.
Change in revenueChange in net revenue as a percentage of the preceding year’s net revenue.
Interest coverage ratioProfit after financial items, plus financial expenses divided by financial expenses.
Operating marginOperating profit as a percentage of net revenue.
Debt equity ratioInterest-bearing liabilities in relation toequity, plus non-controlling interests.
Equity/assets ratioEquity, plus non-controlling interests as a percentage of total assets.
Capital employedTotal assets, less non-interest-bearing provisions and liabilities.
Earnings per shareProfit for the year attributable to the Parent Company’s shareholders, in relation to the weighted number of shares outstanding after repurchases.
Earnings per share after dilutionProfit for the year attributable to the Parent Company’s shareholders in relation to the weighted number of shares outstanding after repurchases and dilution.
Profit marginProfit after financial items, less participations in associated companies as a percentage of net revenue.
KEY RATIOS
Amounts in MSEK unless otherwise stated 2014/15 2013/14 2012/13 2011/12 2010/11
Change in revenue, % 11.8 9.4 2.8 11.6 18.0
Profit after tax 203 177 159 126 102
Operating margin, % 9.7 9.5 9.1 8.1 7.2
Profit margin, % 9.3 9.0 8.6 7.5 6.8
Equity ratio, % 44 43 44 46 42
Operating profit / Working capital (P/WC), % 58 55 52 48 45
Return on capital employed, % 22 22 23 22 21
Return on equity, % 24 24 24 22 20
Debt /equity ratio, times 0.4 0.4 0.4 0.3 0.5
Net debt /equity ratio, times 0.3 0.4 0.4 0.2 0.4
Interest coverage ratio, times 18 16 13 11 12
Net interest-bearing liabilities (+) / receivables (-) 302 285 248 135 193
Number of employees at year-end 1,139 1,010 932 780 731
Average number of employees 1,073 995 864 753 692
Payroll expenses incl. social security contributions 659 574 510 441 405
Revenue outside Sweden 1,931 1,676 1,553 1,533 1,355
PER SHARE DATA
2014/15 2013/14 2012/13 2011/12 2010/11
Number of shares at year-end after repurchases (’000) 22,591 22,524 22,520 22,217 22,196
Weighted number of shares after repurchases, (’000) 22,573 22,544 22,426 22,242 22,046
Weighted number of shares after repurchases and dilution (’000) 22,655 22,665 22,501 22,392 22,133
Operating profit per share, SEK 12.18 10.68 9.47 8.22 6.64
Earnings per share, SEK 8.99 7.85 7.09 5.66 4.63
Earnings per share after dilution, SEK 8.96 7.81 7.07 5.63 4.61
Cash flow from operations per share after dilution, SEK 11.83 10.19 7.87 7.82 5.33
Cash flow per share after dilution, SEK 1.85 0.09 0.00 -0.89 1.22
Dividend per share, SEK (dividend for the year as proposed) 4.50 4.00 3.25 2.75 2.25
Equity per share, SEK 40.59 35.70 31.00 27.90 24.60
Latest price paid per share, SEK 158.00 127.00 88.25 57.25 61.75
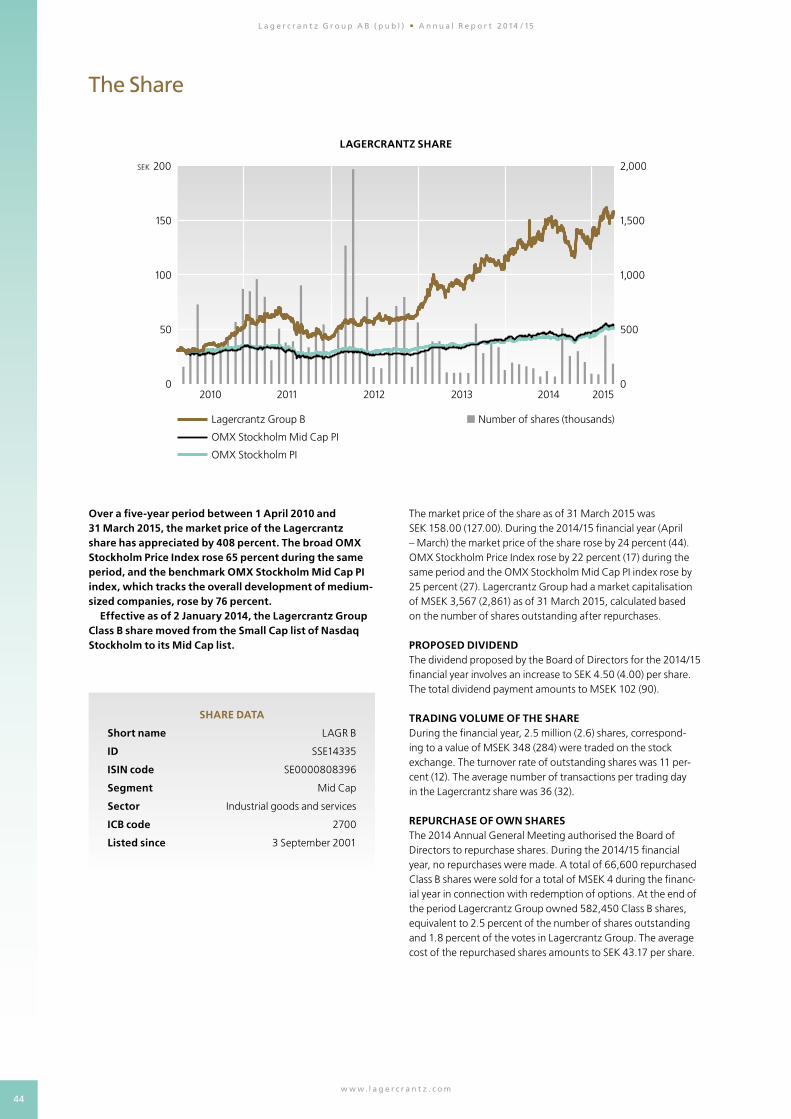
44w w w. l a g e r c r a n t z . c o m
L a g e r c r a n t z G r o u p A B ( p u b l ) A n n u a l R e p o r t 2 014 / 15
The Share
LAGERCRANTZ SHARE
The market price of the share as of 31 March 2015 was SEK 158.00 (127.00). During the 2014/15 financial year (April – March) the market price of the share rose by 24 percent (44). OMX Stockholm Price Index rose by 22 percent (17) during the same period and the OMX Stockholm Mid Cap PI index rose by 25 percent (27). Lagercrantz Group had a market capitalisation of MSEK 3,567 (2,861) as of 31 March 2015, calculated based on the number of shares outstanding after repurchases.
PROPOSED DIVIDENDThe dividend proposed by the Board of Directors for the 2014/15 financial year involves an increase to SEK 4.50 (4.00) per share. The total dividend payment amounts to MSEK 102 (90).
TRADING VOLUME OF THE SHARE During the financial year, 2.5 million (2.6) shares, corresponding to a value of MSEK 348 (284) were traded on the stock exchange. The turnover rate of outstanding shares was 11 percent (12). The average number of transactions per trading day in the Lagercrantz share was 36 (32).
REPURCHASE OF OWN SHARESThe 2014 Annual General Meeting authorised the Board of Directors to repurchase shares. During the 2014/15 financial year, no repurchases were made. A total of 66,600 repurchased Class B shares were sold for a total of MSEK 4 during the financial year in connection with redemption of options. At the end of the period Lagercrantz Group owned 582,450 Class B shares, equivalent to 2.5 percent of the number of shares outstanding and 1.8 percent of the votes in Lagercrantz Group. The average cost of the repurchased shares amounts to SEK 43.17 per share.
SHARE DATA
Short name LAGR B
ID SSE14335
ISIN code SE0000808396
Segment Mid Cap
Sector Industrial goods and services
ICB code 2700
Listed since 3 September 2001
Over a five-year period between 1 April 2010 and 31 March 2015, the market price of the Lagercrantz share has appreciated by 408 percent. The broad OMX Stockholm Price Index rose 65 percent during the same period, and the benchmark OMX Stockholm Mid Cap PI index, which tracks the overall development of medium-sized companies, rose by 76 percent.
Effective as of 2 January 2014, the Lagercrantz Group Class B share moved from the Small Cap list of Nasdaq Stockholm to its Mid Cap list.
SEK 200
150
100
50
0
Lagercrantz Group B
OMX Stockholm Mid Cap PI
OMX Stockholm PI
Number of shares (thousands)
2010 2011 2012 2013 2014 2015
2,000
1,500
1,000
500
0
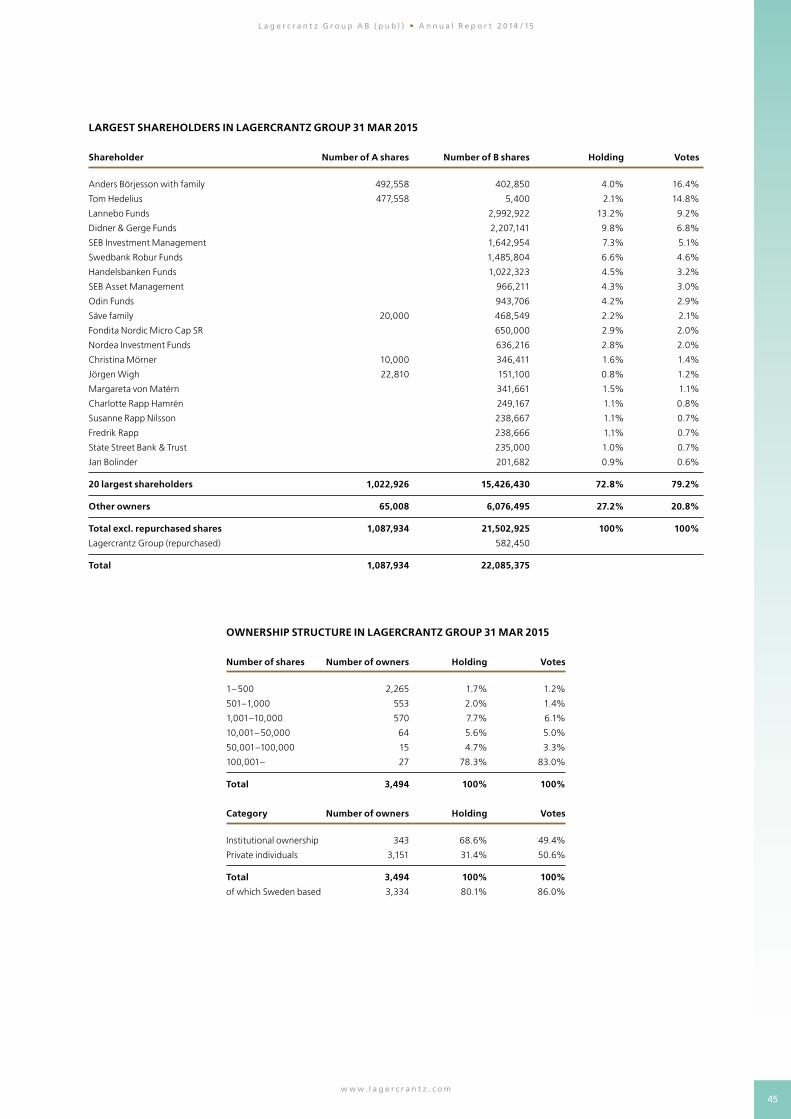
45w w w. l a g e r c r a n t z . c o m
L a g e r c r a n t z G r o u p A B ( p u b l ) A n n u a l R e p o r t 2 014 / 15
LARGEST SHAREHOLDERS IN LAGERCRANTZ GROUP 31 MAR 2015
Shareholder Number of A shares Number of B shares Holding Votes
Anders Börjesson with family 492,558 402,850 4.0% 16.4%
Tom Hedelius 477,558 5,400 2.1% 14.8%
Lannebo Funds 2,992,922 13.2% 9.2%
Didner & Gerge Funds 2,207,141 9.8% 6.8%
SEB Investment Management 1,642,954 7.3% 5.1%
Swedbank Robur Funds 1,485,804 6.6% 4.6%
Handelsbanken Funds 1,022,323 4.5% 3.2%
SEB Asset Management 966,211 4.3% 3.0%
Odin Funds 943,706 4.2% 2.9%
Säve family 20,000 468,549 2.2% 2.1%
Fondita Nordic Micro Cap SR 650,000 2.9% 2.0%
Nordea Investment Funds 636,216 2.8% 2.0%
Christina Mörner 10,000 346,411 1.6% 1.4%
Jörgen Wigh 22,810 151,100 0.8% 1.2%
Margareta von Matérn 341,661 1.5% 1.1%
Charlotte Rapp Hamrén 249,167 1.1% 0.8%
Susanne Rapp Nilsson 238,667 1.1% 0.7%
Fredrik Rapp 238,666 1.1% 0.7%
State Street Bank & Trust 235,000 1.0% 0.7%
Jan Bolinder 201,682 0.9% 0.6%
20 largest shareholders 1,022,926 15,426,430 72.8% 79.2%
Other owners 65,008 6,076,495 27.2% 20.8%
Total excl. repurchased shares 1,087,934 21,502,925 100% 100%
Lagercrantz Group (repurchased) 582,450
Total 1,087,934 22,085,375
OWNERSHIP STRUCTURE IN LAGERCRANTZ GROUP 31 MAR 2015
Number of shares Number of owners Holding Votes
1– 500 2,265 1.7% 1.2%
501–1,000 553 2.0% 1.4%
1,001–10,000 570 7.7% 6.1%
10,001– 50,000 64 5.6% 5.0%
50,001–100,000 15 4.7% 3.3%
100,001– 27 78.3% 83.0%
Total 3,494 100% 100%
Category Number of owners Holding Votes
Institutional ownership 343 68.6% 49.4%
Private individuals 3,151 31.4% 50.6%
Total 3,494 100% 100%
of which Sweden based 3,334 80.1% 86.0%
46w w w. l a g e r c r a n t z . c o m
L a g e r c r a n t z G r o u p A B ( p u b l ) A n n u a l R e p o r t 2 014 / 15
ELECTRONICS
ACTE A/SVallensbækvej 41 DK-2605 BrøndbyDENMARK Tel: + 45 46 900 400 www.acte.dk
ACTE AS Vestvollveien 34 BP.O. Box 190 NO-2021 SkedsmokorsetNORWAYTel: + 47 63 89 89 00www.acte.no
ACTE Solutions ABKarlsbodavägen 39, BrommaP.O. Box 4115SE-171 04 SolnaSWEDENTel: + 46 8 445 28 00www.acte.se
ACTE Sp. z o.o.ul Krancowa 49 PL-02-493 WarsawaPOLANDTel: + 48 22 336 02 00www.acte.pl
El-produkter ASBrendehaugen 4, SaunesmarkaP.O. Box 430NO-6067 UlsteinvikNORWAYTel: + 47 70 01 80 60www.el-produkter.no
Idesco OyTeknologiantie 9FI-90590 Uleåborg FINLANDTel: + 358 20 743 4175www.idesco.fi
ISIC A/SEdwin Rahrs Vej 54DK-8220 BrabrandDENMARKTel: + 45 70 20 70 77www.isic.dk
Unitronic AGMündelheimer Weg 9 DE-40472 DüsseldorfGERMANYTel: + 49 211 951 10www.unitronic.de
Vanpee ABKarlsbodavägen 39, BrommaP.O. Box 4115SE-171 04 SolnaSWEDENTel: + 46 8 445 28 28www.vanpee.se
Vanpee A/STransformervej 29DK-2730 HerlevDENMARKTel: + 45 44 85 90 00www.vanpee.dk
Vanpee ASVestvollveien 6 ENO-2019 SkedsmokorsetNORWAYTel: + 47 64 83 82 80www.vanpee.no
MECHATRONICS
Cue Dee ABSikeå 58SE-915 93 RobertsforsSWEDENTel: + 46 934 153 10www.cuedee.se
EFC Finland OyJärvvägen 6FI-65520 Helsingby FINLANDTel: + 358 6 322 6222 www.efc.fi
Elfac A/SPriorsvej 23 DK-8600 SilkeborgDENMARKTel: + 45 86 80 15 55www.elfac.dk
Elkapsling ABIndustrivägen 1, AlbyP.O. Box 18SE-841 21 ÅngeSWEDENTel: + 46 690 76 30 00www.elkapsling.se
Elpress ABIndustrivägen 15P.O. Box 186SE-872 24 KramforsSWEDENTel: + 46 612 71 71 00www.elpress.se
Enkom OyLarin Kyöstin tie 4P.O. Box 36FI-00641 HelsingforsFINLANDTel: + 358 9 752 761 www.enkom.fi
Kablageproduktion i Västerås ABOmformargatan 12 SE-721 37 VästeråsSWEDEN Tel: + 46 21 81 51 51www.kablageproduktion.com
Norwesco ABEnhagsslingan 19P.O. Box 603SE-187 26 TäbySWEDEN Tel: + 46 8 792 27 00www.norwesco.se
Lagercrantz Group AB (publ)Torsgatan 2P.O. Box 3508SE-103 69 StockholmSWEDENTel: + 46 8 700 66 70www.lagercrantz.comCorporate Identity Number: 556282-4556
Addresses
47w w w. l a g e r c r a n t z . c o m
L a g e r c r a n t z G r o u p A B ( p u b l ) A n n u a l R e p o r t 2 014 / 15
COMMUNICATIONS
Betech Data A/SStationsparken 37, 2 salDK-2600 Glostrup DENMARK Tel: + 45 43 48 74 70www.betechdata.dk
CAD-Kompagniet A/SStationsparken 37, 2 salDK-2600 Glostrup DENMARK Tel: + 45 70 22 22 17www.cad-komp.dk
COBS ABNorra Långebergsgatan 4P.O. Box 9242SE-400 95 GöteborgSWEDENTel: + 46 31 333 38 40www.cobs.se
Direktronik ABKonsul Johnsons väg 15P.O. Box 234SE-149 23 NynäshamnSWEDENTel: + 46 8 52 400 700www.direktronik.se
Excidor ABTegelbruksvägen 18SE-821 43 BollnäsSWEDENTel: + 46 278 136 70www.excidor.se
ISG Systems ABSporthallsvägen 10 SE-263 34 HöganäsSWEDENTel: + 46 42 36 21 40www.isg.se
K&K Active OyItälahdenkatu 22 B FI-00210 Helsingfors FINLANDTel: + 358 9 6855 0550www.kandk.fi
Leteng ASEnebakkveien 117NO-0680 OsloNORWAYTel: + 47 62 48 24 50 www.leteng.no
Load Indicator ABAröds Industriväg 58SE-422 43 Hisings BackaSWEDENTel: + 46 31 220 730www.loadindicator.se
Nordic Alarm ABKarlsbodavägen 39SE-168 67 BrommaSWEDENTel: + 46 8 27 27 27www.nordicalarm.se
Precimeter Control ABÖstra Hamnen 7SE-475 42 HönöSWEDENTel: + 46 31 764 5520www.precimeter.com
NICHE PRODUCTS
Asept International ABTraktorvägen 17SE-226 60 LundSWEDENTel: + 46 46 329 700www.asept.com
Dooman Teknik ABKlangfärgsgatan 8SE-426 52 Västra FrölundaSWEDENTel: + 46 31 69 68 50www.dooman.se
Plåt & Spiralteknik i Torsås ABRamsågsgatan 8SE-385 34 TorsåsSWEDENTel: + 46 486 456 50www.pst.se
Steelo ABIndustrivägen 31SE-330 10 BredarydSWEDENTel: + 46 370 37 41 00www.steelo.se
Svenska Industriborstar i Västerås ABÖdhumlagatan 4SE-723 55 VästeråsSWEDENTel: + 46 21 203 76www.sib.brushes.se
SwedWire ABBirger Svenssons väg 16P.O. Box 170SE-432 24 VarbergSWEDENTel: + 46 340 64 54 30www.swedwire.se
Thermod ABSöderborgsvägen 32SE-671 95 KlässbolSWEDENTel: + 46 570 72 74 70www.thermod.se
Vendig ABGöteborgsvägen 1P.O. Box 62SE-532 21 SkaraSWEDENTel: + 46 511 173 60www.vendig.se
Projectspine A/SVallensbækvej 41DK-2605 BrøndbyDENMARKTel: + 45 43 48 74 99www.projectspine.com
STV Video Data ABAnderstorpsvägen 12, 2 trSE-171 54 SolnaSWEDENTel: + 46 8 568 441 00www.stv.se

Gra
phic
des
ign:
Tin
tin
/ Isl
e of
Des
ign
· Pri
nt: D
igal
oo
· Pho
to: M
agnu
s Fo
nd ·
Tran
slat
ion:
Dav
id M
urph
y
Lagercrantz Group AB (publ)
Torsgatan 2
P.O. Box 3508
SE-103 69 Stockholm
Tel: + 46 8 700 66 70
www.lagercrantz.com