Embed Size (px)
Citation preview
A N N U A L R E P O R T 2 0 1 5
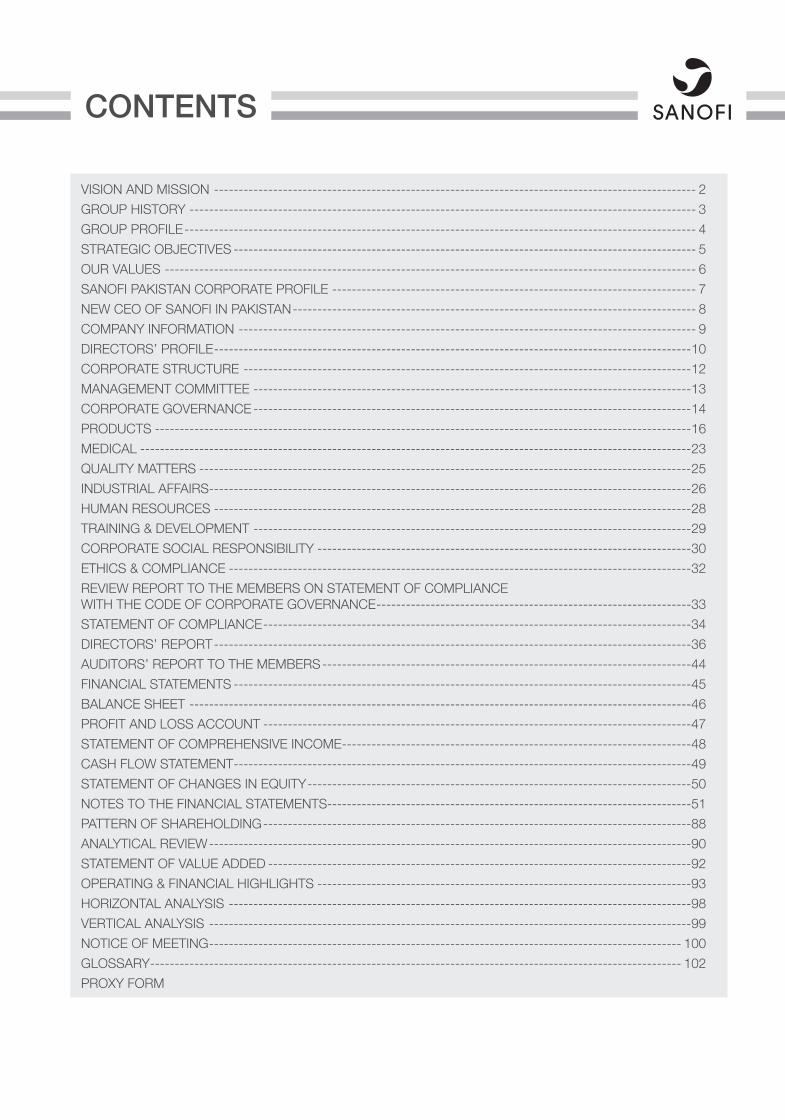
CONTENTS
VISION AND MISSION -------------------------------------------------------------------------------------------------- 2GROUP HISTORY ------------------------------------------------------------------------------------------------------- 3GROUP PROFILE -------------------------------------------------------------------------------------------------------- 4STRATEGIC OBJECTIVES ---------------------------------------------------------------------------------------------- 5OUR VALUES ------------------------------------------------------------------------------------------------------------ 6SANOFI PAKISTAN CORPORATE PROFILE -------------------------------------------------------------------------- 7NEW CEO OF SANOFI IN PAKISTAN ---------------------------------------------------------------------------------- 8COMPANY INFORMATION --------------------------------------------------------------------------------------------- 9DIRECTORS’ PROFILE -------------------------------------------------------------------------------------------------10CORPORATE STRUCTURE -------------------------------------------------------------------------------------------12MANAGEMENT COMMITTEE -----------------------------------------------------------------------------------------13CORPORATE GOVERNANCE -----------------------------------------------------------------------------------------14PRODUCTS -------------------------------------------------------------------------------------------------------------16MEDICAL ----------------------------------------------------------------------------------------------------------------23QUALITY MATTERS ----------------------------------------------------------------------------------------------------25INDUSTRIAL AFFAIRS --------------------------------------------------------------------------------------------------26HUMAN RESOURCES -------------------------------------------------------------------------------------------------28TRAINING & DEVELOPMENT -----------------------------------------------------------------------------------------29CORPORATE SOCIAL RESPONSIBILITY ----------------------------------------------------------------------------30ETHICS & COMPLIANCE ----------------------------------------------------------------------------------------------32REVIEW REPORT TO THE MEMBERS ON STATEMENT OF COMPLIANCE WITH THE CODE OF CORPORATE GOVERNANCE ----------------------------------------------------------------33STATEMENT OF COMPLIANCE ---------------------------------------------------------------------------------------34DIRECTORS’ REPORT -------------------------------------------------------------------------------------------------36AUDITORS’ REPORT TO THE MEMBERS ---------------------------------------------------------------------------44FINANCIAL STATEMENTS ---------------------------------------------------------------------------------------------45BALANCE SHEET ------------------------------------------------------------------------------------------------------46PROFIT AND LOSS ACCOUNT ---------------------------------------------------------------------------------------47STATEMENT OF COMPREHENSIVE INCOME -----------------------------------------------------------------------48CASH FLOW STATEMENT ---------------------------------------------------------------------------------------------49STATEMENT OF CHANGES IN EQUITY ------------------------------------------------------------------------------50NOTES TO THE FINANCIAL STATEMENTS--------------------------------------------------------------------------51PATTERN OF SHAREHOLDING ---------------------------------------------------------------------------------------88ANALYTICAL REVIEW --------------------------------------------------------------------------------------------------90STATEMENT OF VALUE ADDED --------------------------------------------------------------------------------------92OPERATING & FINANCIAL HIGHLIGHTS ----------------------------------------------------------------------------93HORIZONTAL ANALYSIS ----------------------------------------------------------------------------------------------98VERTICAL ANALYSIS --------------------------------------------------------------------------------------------------99NOTICE OF MEETING ------------------------------------------------------------------------------------------------ 100GLOSSARY ------------------------------------------------------------------------------------------------------------ 102PROXY FORM
2 Annual Report 2015
VISIONTo be a diversified healthcare leader, focused on patients’ needs.
MISSIONTo enhance the quality of life of the greatest number through providing a continuum of care by answering unmet medical needs of the community and promoting access to quality healthcare.

3
BMP Sunstone, Medley,Merial, Nepentes, Zentiva,
Kendricks, Oenobiol, Chattem, Acambis, Symbion, Shantha
Biotechnics, Fovea, Bipar Sciences, Targegen, Genfar,
Globalpharma2008-2015
Genzyme2011
Sanofi Pasteur 2004
Aventis1999
Marion1950
Roussel1911
Hoechst1863
Wittman & Poulenc
1860
HoechstMarion Roussel
1997
Rhône-Poulenc Rorer
1990
Sanofi-Synthélabo1999
Rorer1910
Rorer1910
Connaught1922
Institut Mérieux 1897
Chinoin1919
Sterling1901
Clin Midy1971
Sanofi1973
Midy1718
Sanofi-aventis2004
Delagrange1931
Delalande1924
Synthélabo1970
Robert & Carriére
1901
Dausse1834
GROUP HISTORY
4 Annual Report 2015
PRODUCTS
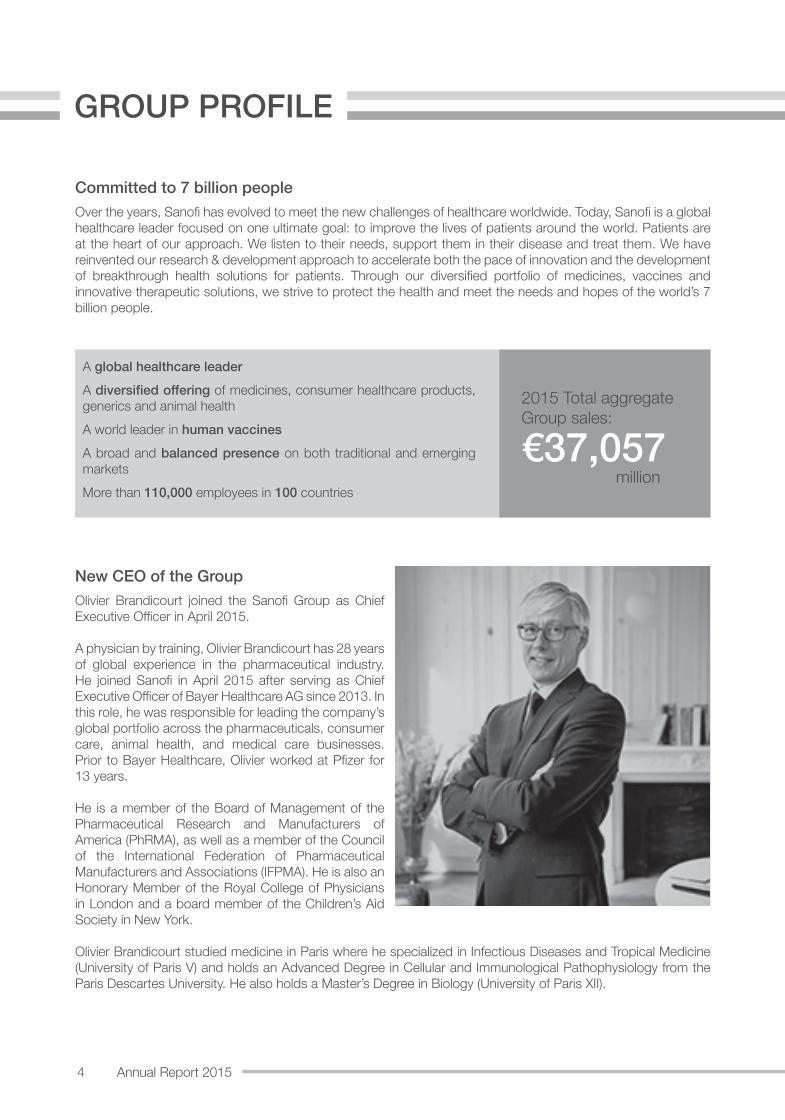
New CEO of the GroupOlivier Brandicourt joined the Sanofi Group as Chief Executive Officer in April 2015.
A physician by training, Olivier Brandicourt has 28 years of global experience in the pharmaceutical industry. He joined Sanofi in April 2015 after serving as Chief Executive Officer of Bayer Healthcare AG since 2013. In this role, he was responsible for leading the company’s global portfolio across the pharmaceuticals, consumer care, animal health, and medical care businesses. Prior to Bayer Healthcare, Olivier worked at Pfizer for 13 years.
He is a member of the Board of Management of the Pharmaceutical Research and Manufacturers of America (PhRMA), as well as a member of the Council of the International Federation of Pharmaceutical Manufacturers and Associations (IFPMA). He is also an Honorary Member of the Royal College of Physicians in London and a board member of the Children’s Aid Society in New York.
Olivier Brandicourt studied medicine in Paris where he specialized in Infectious Diseases and Tropical Medicine (University of Paris V) and holds an Advanced Degree in Cellular and Immunological Pathophysiology from the Paris Descartes University. He also holds a Master’s Degree in Biology (University of Paris XII).
GROUP PROFILE
Committed to 7 billion peopleOver the years, Sanofi has evolved to meet the new challenges of healthcare worldwide. Today, Sanofi is a global healthcare leader focused on one ultimate goal: to improve the lives of patients around the world. Patients are at the heart of our approach. We listen to their needs, support them in their disease and treat them. We have reinvented our research & development approach to accelerate both the pace of innovation and the development of breakthrough health solutions for patients. Through our diversified portfolio of medicines, vaccines and innovative therapeutic solutions, we strive to protect the health and meet the needs and hopes of the world’s 7 billion people.
2015 Total aggregate Group sales:
€37,057 million
A global healthcare leaderA diversified offering of medicines, consumer healthcare products, generics and animal healthA world leader in human vaccinesA broad and balanced presence on both traditional and emerging marketsMore than 110,000 employees in 100 countries
5
STRATEGIC OBJECTIVES
At the heart of everything we do are people. Through our vaccines and medicines, we help prevent and where needed, treat those in need. As economies and societies evolve, we need healthy populations to meet future challenges. Healthcare needs have changed and will continue to do so and as an industry we have to adapt to meet these needs.
To have a real impact, we have to build a sustainable business to invest in delivering innovative solutions. At the same time we need to improve access to medicines and improved healthcare. In order to move along in this ambition, we continue to push forward with our key strategic priorities: 1. Be a global healthcare leader with
synergistic platforms We have significantly transformed the Group to be
focused on the seven strategic growth platforms of diabetes, vaccines, consumer healthcare, rare diseases & multiple sclerosis, other innovative products, animal health and emerging markets. Not only will these enable us to improve access to quality healthcare and meet unmet needs, but they will also deliver the sustainable growth required to allow us to continue to invest in innovative research & development.
Our ambition is to offer an integrated set of businesses within the healthcare space with opportunities to create synergies across activities, both upstream and at an R&D level and downstream in the market place.
2. Bring innovative products to the market R&D has always been and will continue to be the
cornerstone of our company. The advancements in science mean that more targeted, more effective treatments are within reach and we are ready to take on this challenge. We have built a revitalized R&D organization centered on patients’ needs and delivering truly innovative solutions.
3. Seizing value-enhancing growth opportunities
The changing face of the industry, healthcare needs and scientific discovery led us to the realization that we need to diversify to grow the business. We need to look outside at partnerships and acquisitions to succeed in delivering future innovative solutions. We have been successful in searching out the best science and the best companies to acquire and partner with. We have strongly reinforced our business in particular areas such as diabetes, oncology, rare diseases and consumer healthcare. We will continue to look for opportunities and partner with the best, whomever and wherever they may be.
4. Adapt structure for future challenges and opportunities
The successful companies of tomorrow are those that go beyond delivering products to delivering real solutions and services. We have identified and delivered on our growth platforms and we have undergone a deep organizational transformation. We have evolved our R&D model and have expanded our footprint in biotechnology through the acquisition of Genzyme and refocused regional and global operations to be ready to meet the next challenge and opportunity around the corner.
6 Annual Report 2015
PRODUCTS
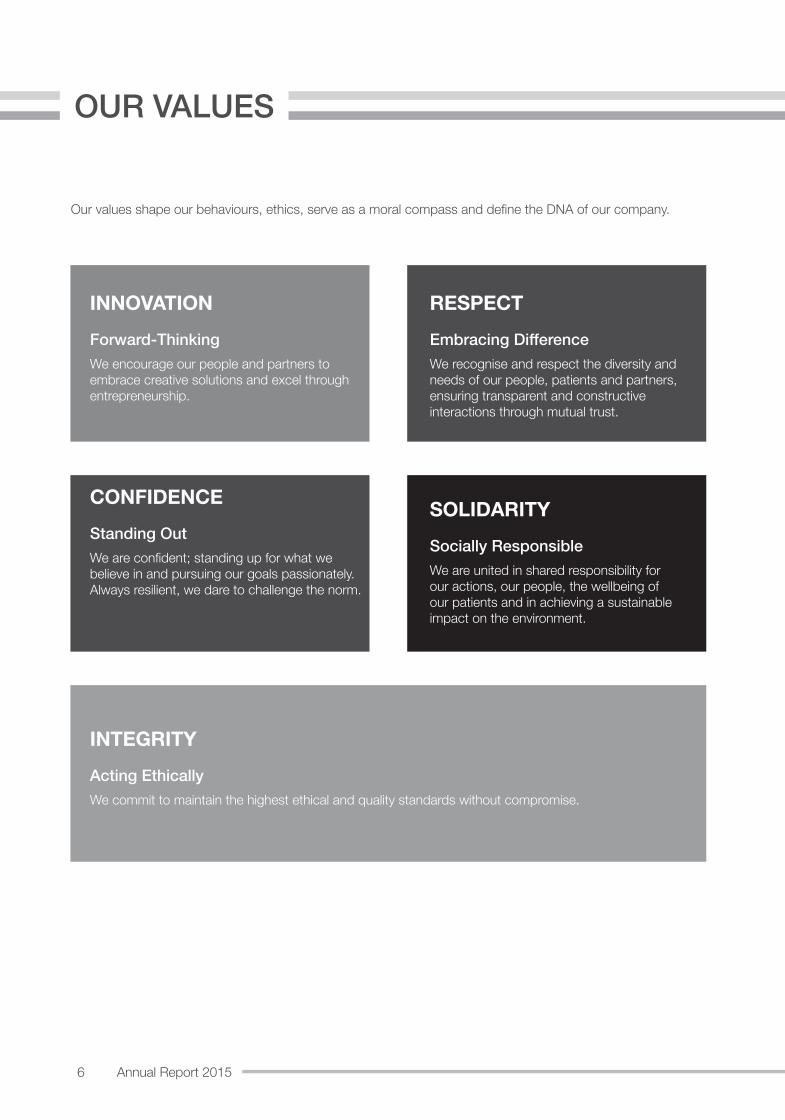
Our values shape our behaviours, ethics, serve as a moral compass and define the DNA of our company.
INNOVATIONForward-ThinkingWe encourage our people and partners to embrace creative solutions and excel through entrepreneurship.
CONFIDENCEStanding OutWe are confident; standing up for what we believe in and pursuing our goals passionately. Always resilient, we dare to challenge the norm.
RESPECTEmbracing DifferenceWe recognise and respect the diversity and needs of our people, patients and partners, ensuring transparent and constructive interactions through mutual trust.
SOLIDARITYSocially ResponsibleWe are united in shared responsibility for our actions, our people, the wellbeing of our patients and in achieving a sustainable impact on the environment.
INTEGRITYActing EthicallyWe commit to maintain the highest ethical and quality standards without compromise.
OUR VALUES
7
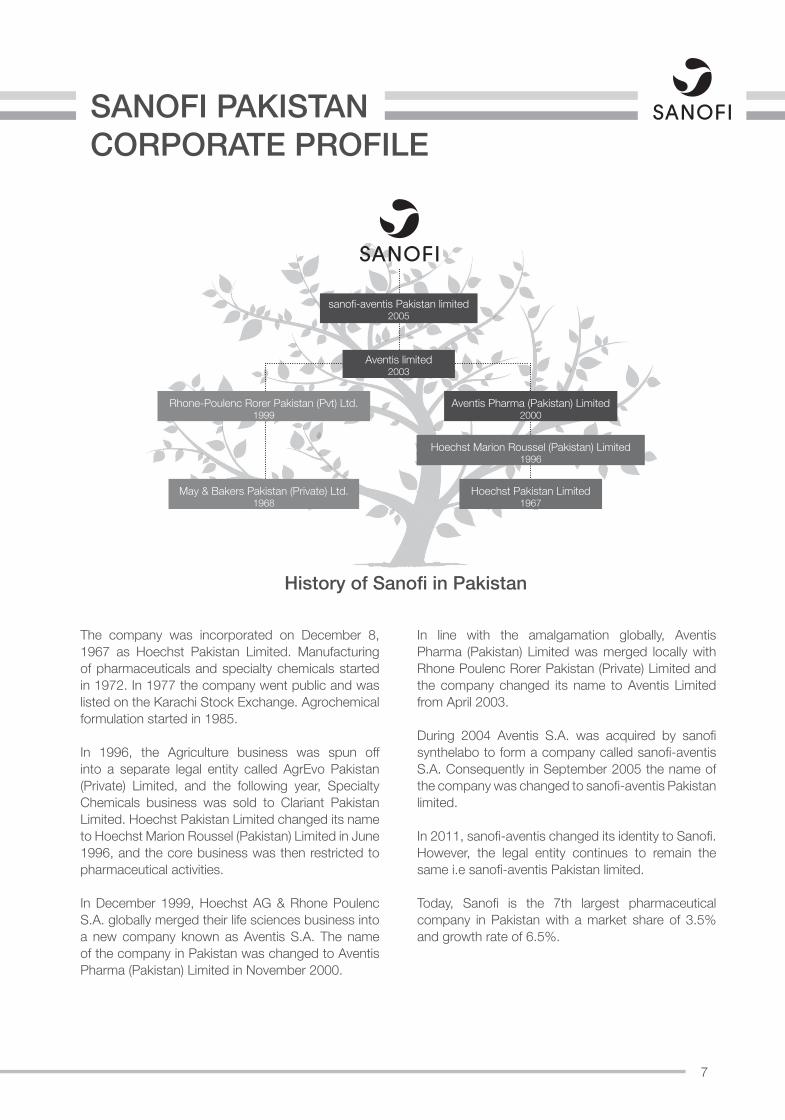
SANOFI PAKISTANCORPORATE PROFILE
The company was incorporated on December 8, 1967 as Hoechst Pakistan Limited. Manufacturing of pharmaceuticals and specialty chemicals started in 1972. In 1977 the company went public and was listed on the Karachi Stock Exchange. Agrochemical formulation started in 1985.
In 1996, the Agriculture business was spun off into a separate legal entity called AgrEvo Pakistan (Private) Limited, and the following year, Specialty Chemicals business was sold to Clariant Pakistan Limited. Hoechst Pakistan Limited changed its name to Hoechst Marion Roussel (Pakistan) Limited in June 1996, and the core business was then restricted to pharmaceutical activities.
In December 1999, Hoechst AG & Rhone Poulenc S.A. globally merged their life sciences business into a new company known as Aventis S.A. The name of the company in Pakistan was changed to Aventis Pharma (Pakistan) Limited in November 2000.
In line with the amalgamation globally, Aventis Pharma (Pakistan) Limited was merged locally with Rhone Poulenc Rorer Pakistan (Private) Limited and the company changed its name to Aventis Limited from April 2003.
During 2004 Aventis S.A. was acquired by sanofi synthelabo to form a company called sanofi-aventis S.A. Consequently in September 2005 the name of the company was changed to sanofi-aventis Pakistan limited.
In 2011, sanofi-aventis changed its identity to Sanofi. However, the legal entity continues to remain the same i.e sanofi-aventis Pakistan limited.
Today, Sanofi is the 7th largest pharmaceutical company in Pakistan with a market share of 3.5% and growth rate of 6.5%.
May & Bakers Pakistan (Private) Ltd.1968
Rhone-Poulenc Rorer Pakistan (Pvt) Ltd.1999
Aventis Pharma (Pakistan) Limited2000
Hoechst Marion Roussel (Pakistan) Limited1996
Hoechst Pakistan Limited1967
Aventis limited2003
sanofi-aventis Pakistan limited2005
History of Sanofi in Pakistan
8 Annual Report 2015
NEW CEO OF SANOFI IN PAKISTAN
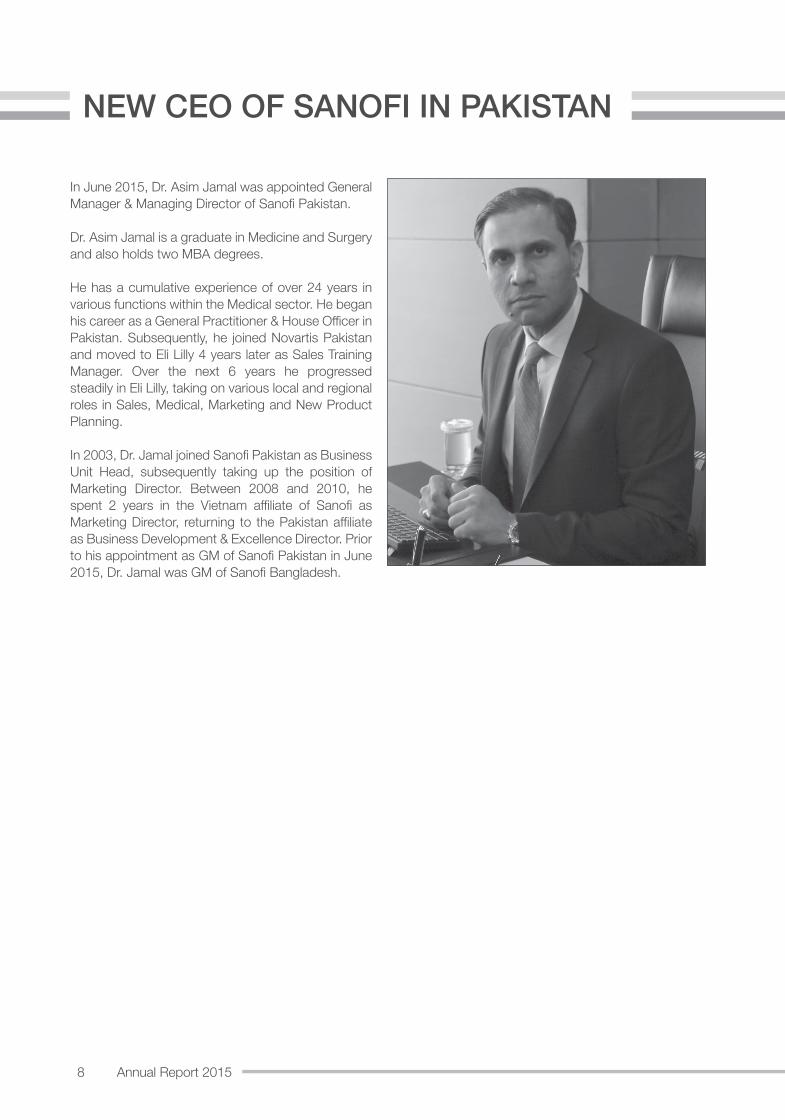
In June 2015, Dr. Asim Jamal was appointed General Manager & Managing Director of Sanofi Pakistan.
Dr. Asim Jamal is a graduate in Medicine and Surgery and also holds two MBA degrees.
He has a cumulative experience of over 24 years in various functions within the Medical sector. He began his career as a General Practitioner & House Officer in Pakistan. Subsequently, he joined Novartis Pakistan and moved to Eli Lilly 4 years later as Sales Training Manager. Over the next 6 years he progressed steadily in Eli Lilly, taking on various local and regional roles in Sales, Medical, Marketing and New Product Planning.
In 2003, Dr. Jamal joined Sanofi Pakistan as Business Unit Head, subsequently taking up the position of Marketing Director. Between 2008 and 2010, he spent 2 years in the Vietnam affiliate of Sanofi as Marketing Director, returning to the Pakistan affiliate as Business Development & Excellence Director. Prior to his appointment as GM of Sanofi Pakistan in June 2015, Dr. Jamal was GM of Sanofi Bangladesh.
9
COMPANY INFORMATION
Board of DirectorsSyed Babar Ali ChairmanDr. Asim Jamal Chief Executive & Managing DirectorArshad Ali GoharSyed Hyder AliPatrick Aghanian Franck VidorPatrick ChocatJaved IqbalYasser Pirmuhammad Chief Financial Officer
Company SecretarySaad Usman
AuditorsErnst & Young Ford Rhodes Sidat HyderChartered Accountants
Legal AdvisorsHashmi & HashmiGhani Law AssociatesSaadat Yar Khan & Co.
Registered OfficePlot 23, Sector 22, Korangi Industrial Area,Karachi - 74900
Postal AddressP.O. Box No. 4962, Karachi - 74000
ContactTel : +92 21 3506 [email protected]
URLwww.sanofi.com.pkwww.sanofidiabetes.com.pk
Share RegistrarsFAMCO Associates (Pvt.) Ltd.8-F, Next to Hotel Faran, Nursery,Block-6, P.E.C.H.S., Shahra-e-Faisal,KarachiTel : +92 21 34380101-5Fax : +92 21 34380106URL : www.famco.com.pk
BankersMCB Bank LimitedHabib Bank LimitedNational Bank of PakistanBank of Tokyo-Mitsubishi UFJ, LimitedCitibank, N.A.Deutsche Bank AGIndustrial & Commercial Bank of China LimitedStandard Chartered Bank (Pakistan) Limited
10 Annual Report 2015
PRODUCTSDIRECTORS’ PROFILE*
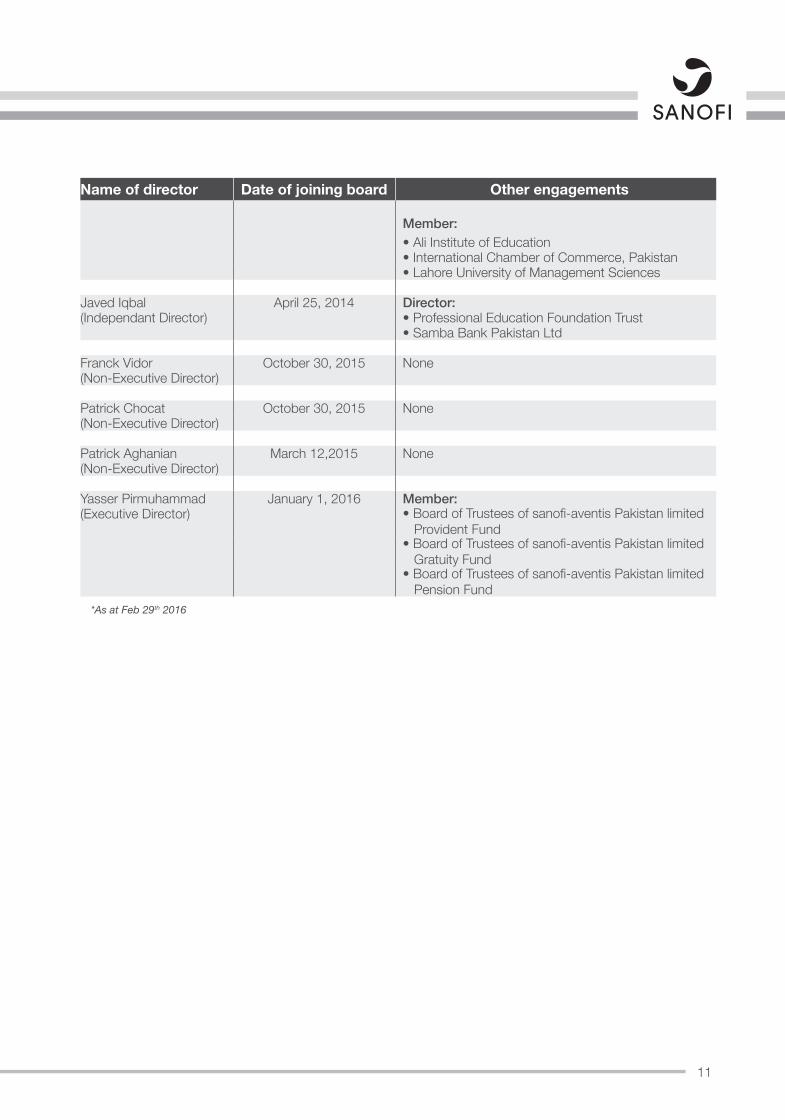
Name of director Date of joining board Other engagements
Syed Babar Ali Prior to the listing of the company in 1977Chairman Chairman:
(Non-Executive Director) • Ali Institute of Education• Babar Ali Foundation• Coca Cola Beverages Pakistan Limited• Gurmani Foundation• IGI Insurance Limited• IGI Investment Bank Limited• Industrial Technical & Educational Institute• National Management Foundation• Syed Maratib Ali Religious & Charitable Trust Society• Tetra Pak Pakistan Limited• Tri-Pack Films Limited
Director:• Nestle Pakistan Limited
Pro-Chancellor:• Lahore University of Management Sciences (LUMS)
Dr. Asim Jamal June 1, 2015 Member:Chief Executive • Board of Governors of National Management
Foundation (Governing body of LUMS)(Executive Director)• Pakistan Pharmaceuticals Manufacturers’ Association –
represents sanofi-aventis Pakistan limited• Pakistan France Business Alliance – represents sanofi-
aventis Pakistan limited• Co-Chairman: Pharma Bureau – represents sanofi-
aventis Pakistan limited
Arshad Ali Gohar February 11, 2011 Director:(Non-Executive Director) • Ali Gohar & Company (Private) Limited
• AGT Holdings (Private) Limited• AGC (Private) Limited
Syed Hyder Ali February 22, 1987 Director:(Non-Executive Director) • Babar Ali Foundation
• Bulleh Shah Packaging (Private) Limited• Flexible Packages Convertors (Pty) Limited • IGI Insurance Limited• IGI Life Insurance Limited• International Steels Limited• KSB Pumps Company Limited• National Management Foundation• Nestle Pakistan Limited• Packages Lanka (Pvt) Limited• Packages Limited• Pakistan Business Council• Pakistan Centre for Philanthropy• Syed Maratib Ali Religious & Charitable Trust Society• Tetra Pak Pakistan Limited• Tri-Pack Films Limited• World Wide Fund for Nature
11
Name of director Date of joining board Other engagements
Member:• Ali Institute of Education• International Chamber of Commerce, Pakistan• Lahore University of Management Sciences
Javed Iqbal April 25, 2014 Director:(Independant Director) • Professional Education Foundation Trust
• Samba Bank Pakistan Ltd
Franck Vidor October 30, 2015 None(Non-Executive Director)
Patrick Chocat October 30, 2015 None(Non-Executive Director)
Patrick Aghanian March 12,2015 None(Non-Executive Director)
Yasser Pirmuhammad January 1, 2016 Member:(Executive Director) • Board of Trustees of sanofi-aventis Pakistan limited
Provident Fund• Board of Trustees of sanofi-aventis Pakistan limited
Gratuity Fund• Board of Trustees of sanofi-aventis Pakistan limited
Pension Fund*As at Feb 29th 2016
12 Annual Report 2015
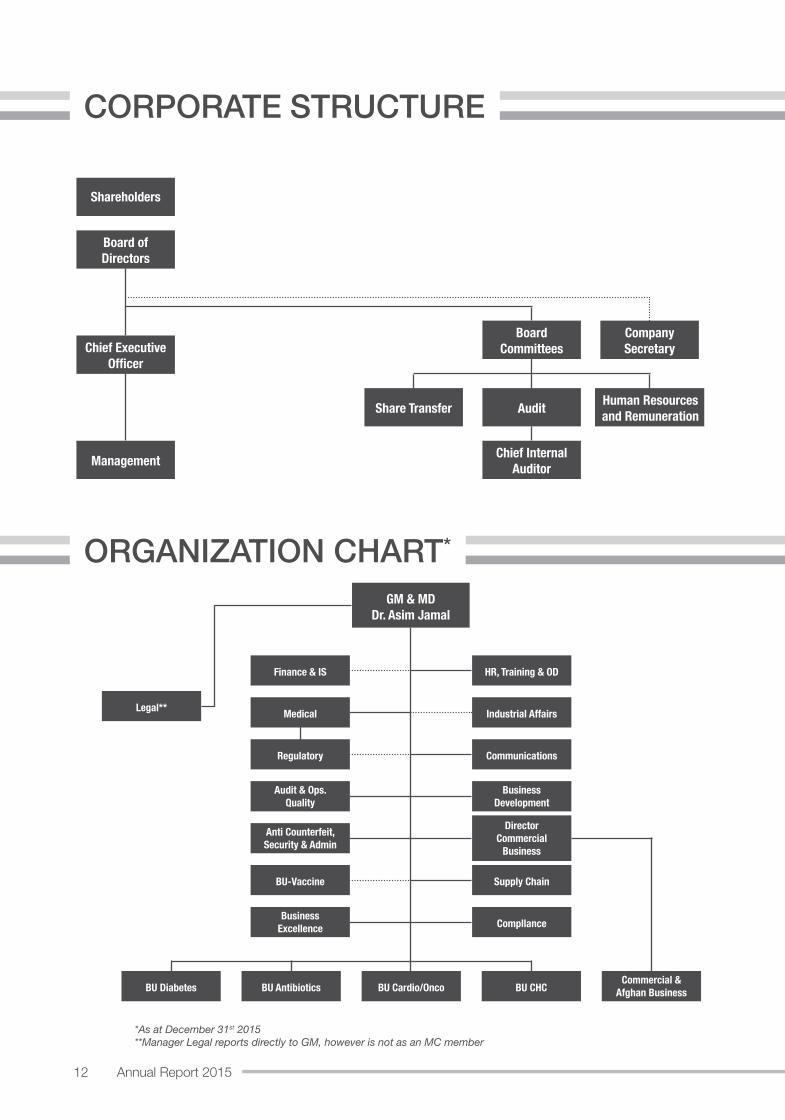
CORPORATE STRUCTURE
ORGANIZATION CHART*
Chief Executive Officer
Shareholders
Board ofDirectors
Management
BoardCommittees
Chief InternalAuditor
Audit Human Resourcesand RemunerationShare Transfer
CompanySecretary
GM & MDDr. Asim Jamal
Finance & IS HR, Training & OD
Medical Industrial AffairsLegal**
Regulatory Communications
Audit & Ops.Quality
BusinessDevelopment
Anti Counterfeit,Security & Admin
DirectorCommercial
Business
BU-Vaccine Supply Chain
BusinessExcellence
BU Diabetes BU Antibiotics BU Cardio/Onco BU CHC Commercial &
Afghan Business
Compllance
*As at December 31st 2015**Manager Legal reports directly to GM, however is not as an MC member
13
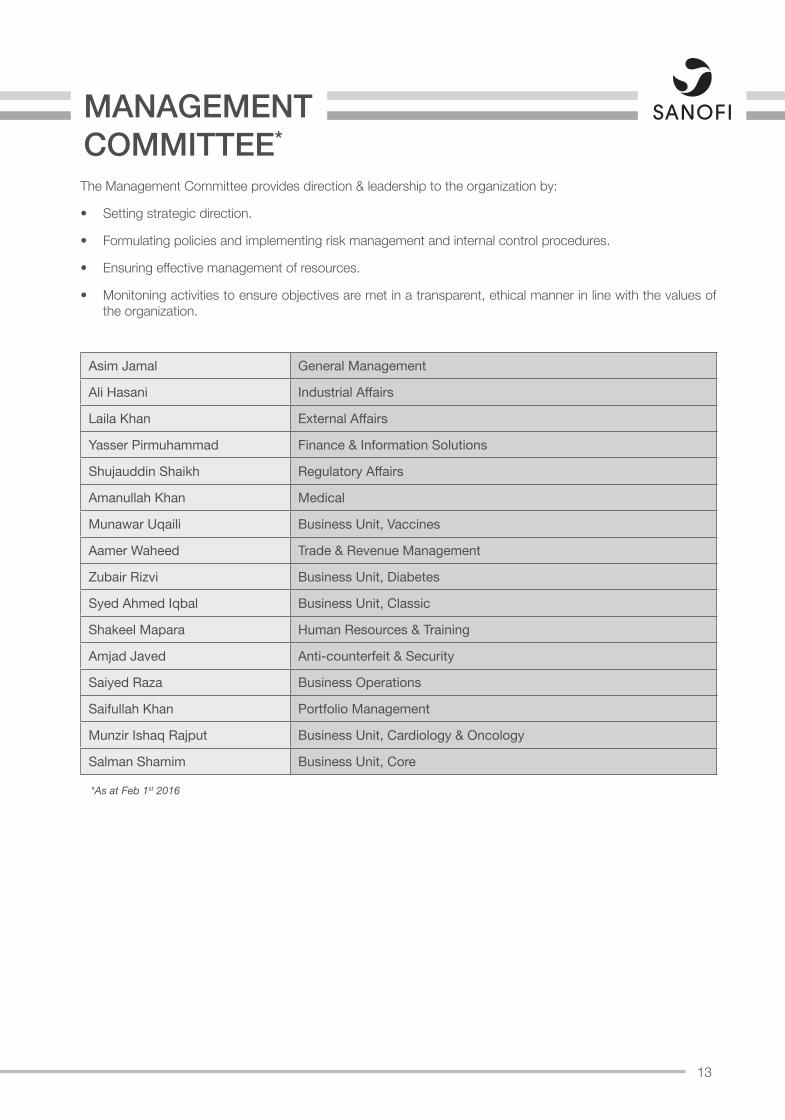
MANAGEMENT COMMITTEE*
Asim Jamal General Management
Ali Hasani Industrial Affairs
Laila Khan External Affairs
Yasser Pirmuhammad Finance & Information Solutions
Shujauddin Shaikh Regulatory Affairs
Amanullah Khan Medical
Munawar Uqaili Business Unit, Vaccines
Aamer Waheed Trade & Revenue Management
Zubair Rizvi Business Unit, Diabetes
Syed Ahmed Iqbal Business Unit, Classic
Shakeel Mapara Human Resources & Training
Amjad Javed Anti-counterfeit & Security
Saiyed Raza Business Operations
Saifullah Khan Portfolio Management
Munzir Ishaq Rajput Business Unit, Cardiology & Oncology
Salman Shamim Business Unit, Core
The Management Committee provides direction & leadership to the organization by:
• Setting strategic direction.
• Formulating policies and implementing risk management and internal control procedures.
• Ensuring effective management of resources.
• Monitoning activities to ensure objectives are met in a transparent, ethical manner in line with the values of the organization.
*As at Feb 1st 2016
14 Annual Report 2015
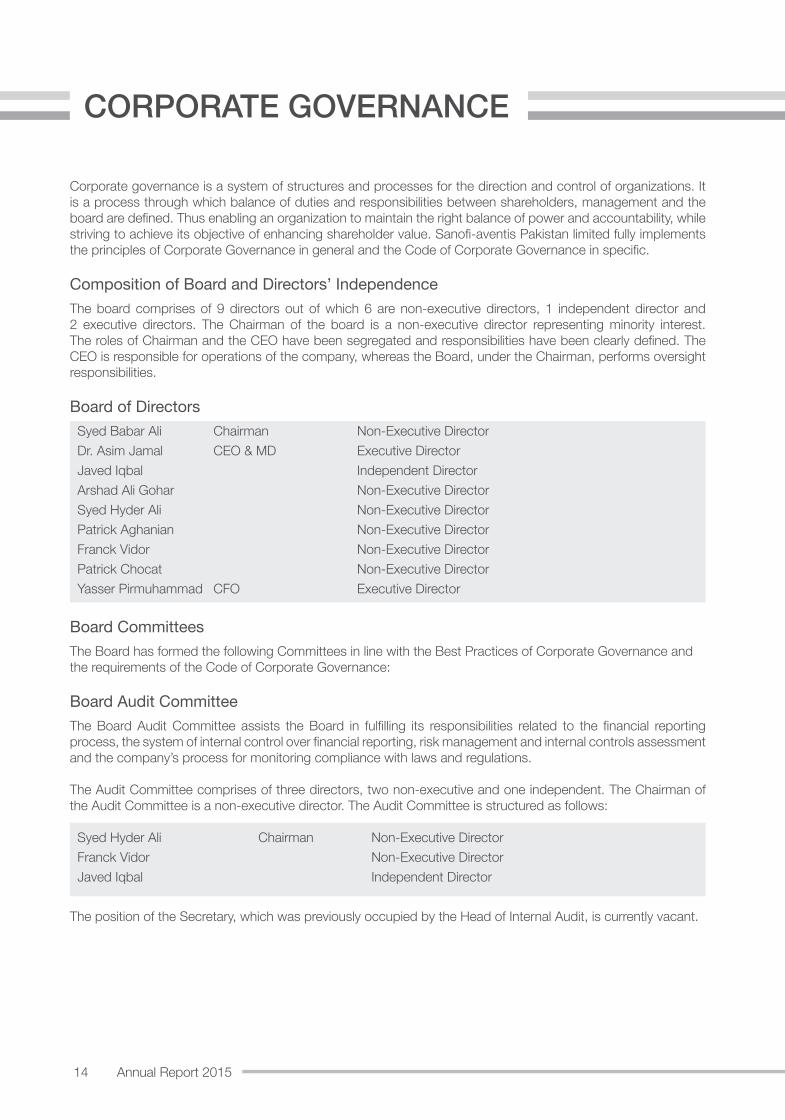
CORPORATE GOVERNANCE
Corporate governance is a system of structures and processes for the direction and control of organizations. It is a process through which balance of duties and responsibilities between shareholders, management and the board are defined. Thus enabling an organization to maintain the right balance of power and accountability, while striving to achieve its objective of enhancing shareholder value. Sanofi-aventis Pakistan limited fully implements the principles of Corporate Governance in general and the Code of Corporate Governance in specific.
Composition of Board and Directors’ IndependenceThe board comprises of 9 directors out of which 6 are non-executive directors, 1 independent director and 2 executive directors. The Chairman of the board is a non-executive director representing minority interest. The roles of Chairman and the CEO have been segregated and responsibilities have been clearly defined. The CEO is responsible for operations of the company, whereas the Board, under the Chairman, performs oversight responsibilities.
Board of DirectorsSyed Babar Ali Chairman Non-Executive DirectorDr. Asim Jamal CEO & MD Executive DirectorJaved Iqbal Independent DirectorArshad Ali Gohar Non-Executive DirectorSyed Hyder Ali Non-Executive DirectorPatrick Aghanian Non-Executive DirectorFranck Vidor Non-Executive DirectorPatrick Chocat Non-Executive DirectorYasser Pirmuhammad CFO Executive Director
Board CommitteesThe Board has formed the following Committees in line with the Best Practices of Corporate Governance and the requirements of the Code of Corporate Governance:
Board Audit CommitteeThe Board Audit Committee assists the Board in fulfilling its responsibilities related to the financial reporting process, the system of internal control over financial reporting, risk management and internal controls assessment and the company’s process for monitoring compliance with laws and regulations.
The Audit Committee comprises of three directors, two non-executive and one independent. The Chairman of the Audit Committee is a non-executive director. The Audit Committee is structured as follows:
Syed Hyder Ali Chairman Non-Executive DirectorFranck Vidor Non-Executive DirectorJaved Iqbal Independent Director
The position of the Secretary, which was previously occupied by the Head of Internal Audit, is currently vacant.
15
Human Resource and Remuneration CommitteeThis Committee assists the Board of Directors in fulfilling its responsibilities in the formulation and implementation of Human Resource Policies and in the appointment, remuneration and succession of CEO, CFO, Company Secretary, Chief Internal Auditor and other senior positions reporting directly to the CEO.
The Committee comprises of two non-executive and one executive director. The Chairman of the Committee is a non-executive director. The committee is structured as follows:
Arshad Ali Gohar Chairman Non-Executive DirectorSyed Hyder Ali Non-Executive DirectorDr. Asim Jamal CEO & MD Executive DirectorShakeel Mapara Secretary Director Human Resource
Board Share Transfer CommitteeThe Board Share Transfer Committee has been authorized by the Board to approve transfer of shares. All share transfer resolutions are ratified by the Board of Directors in subsequent meetings. The committee is structured as follows:
Dr. Asim Jamal CEO & MD Executive DirectorYasser Pirmuhammad CFO Executive Director
Board Performance EvaluationThe Code of Corporate Governance 2012 stipulates that the Board should put in place a mechanism for an annual evaluation of its own performance. In line with this requirement, the Board has set a well-defined criteria for the evaluation of its performance, which focuses on the following areas:
• Board’s Effectiveness• Role of Non-Executive Directors• Effectiveness of Board Committees• Role of the Chairman
Performance Evaluation of the Chief ExecutiveThe performance of the Chief Executive (CEO) is based on the criteria defined by the Sanofi group, which takes into account both qualitative as well as quantitative parameters. The Board is fully aware of the criteria and is involved in the performance assessment of the CEO.
16 Annual Report 2015
PRODUCTS
Oral Anti-DiabeticsAmaryl® and Amaryl M® Amaryl® (glimepiride) and Amaryl M® (glimepiride + metformin) are oral blood glucose-lowering drugs of the sulfonylurea class, administered once a day to treat Type 2 diabetes in combination with diet and exercise measures.
Daonil® and Daonil - M®
Daonil® (gilbenclamide) and Daonil – M® (glibenclamide + metformin) are oral hypoglycemic agents belonging to sulfonylurea class. Daonil® is used in the treatment of non-insulin dependent diabetes. Daonil® is used in conjunction with proper diet and exercise to decrease blood sugar levels.
Neodipar®
Neodipar® (metformin) is an oral diabetes medicine that helps control blood sugar levels. It is used for the management of type 2 diabetes. At times this is used in combination with insulin or other medications for more efficient blood glucose control.
Insulins Lantus® Sanofi improved significantly diabetes management with Lantus® (insulin glargine) – 24-hour, once-daily basal insulin injection. With clinical experience covering more than 100,000 patients, as well as post-marketing surveillance arising from over 30 million patient-years of experience, Lantus® has demonstrated a strong efficacy and safety profile over the past 10 years – and remains the subject of ongoing studies even now, to optimise its use for people with diabetes.
Apidra® Apidra® (insulin glulisine) is a fast-acting insulin for people with Type 1 and advanced Type 2 diabetes. It is usually combined with long-acting insulin or basal insulin analogues, such as Lantus®. Apidra® is more flexible than fast-acting human insulin because it is administered subcutaneously just before or immediately after meals.
SoloSTAR® SoloSTAR® (Insulin injection pen) is a pre-filled, disposable pen that enables patients to inject up to 80 units of insulin, if necessary in one shot. It was designed to meet the everyday needs of people with diabetes. They can easily see the insulin dose and the injection is almost painless, as slight pressure suffices to inject the right dose (30% less force than similar devices).
CancerJevtana®
Jevtana® (cabazitaxel) is a prescription anti-cancer medicine used with the steroid medicine prednisone. Jevtana® is used to treat people with prostate cancer that has worsened (progressed) after treatment with other anti-cancer medicines, including docetexal (Taxotere®).
Taxotere®
Taxotere® (docetaxel) is a drug in the taxoid class, which inhibits cancer cell division by essentially “freezing” the cell’s internal skeleton, comprised of microtubules which assemble and disassemble during a cell cycle. Taxotere® promotes assembly and blocks disassembly, thereby preventing cancer cells from dividing and resulting in their death.
Eloxatin® Eloxatin® (oxaliplatin) is a new-generation platinum salt that has brought major progress in the treatment of metastatic colorectal cancer by making surgery possible for a significant proportion of patients with isolated hepatic metastases by rapidly and significantly reducing metastasis size. Eloxatin® holds out the hope of an extended lifespan and possible recovery for these patients.
Fludara®
Fludara (fludarabine) is a chemotherapy drug used in the treatment of hematological malignancies (cancers of blood cells such as leukemias and lymphomas). It causes the death of cancer cells by interfering with their growth and reproduction. Fludara® is used to treat a type of cancer known as chronic lymphocytic leukemia (CLL) in people for whom other treatments have not worked. The injectable form of this medication may also be used to treat low-grade non-
17
Hodgkin’s lymphoma (Lg-NHL) in people for whom other treatments have not worked.
Pain Management
No-Spa®
This is used as an antispasmodic in the management of biliary-tract, urinary-tract, and gastrointestinal spasm. No-Spa® (drotaverine HCI) is indicated in the management of irritable bowel syndrome, renal colic, biliary colic, and the management of severe pain during menstruation.
Gardan®
Gardan® (mefanamic acid) is used to relieve mild to moderate pain including soft tissue injuries, other painful musculoskeletal conditions, headache, dental pain, post-operative pain & dysmenorrhea.
Muscoril®
Muscoril® (thiochochicoside) is a muscle relaxant drug with anti-inflammatory and analgesic properties. It is used for treating muscular spasms, and rheumatologic, orthopedic, and traumatologic disorders.
Profenid®
An anti-inflammatory analgesic and antipyretic. Profenid® (ketoprofen) is used in the treatment of rheumatoid arthritis, osteoarthritis and to alleviate moderate pain.
Allergy Management
Telfast®
Telfast®(fexofenadine) is an effective and potent antihistaminic agent, devoid of sedative effects and with a prolonged duration of action allowing administration once every 12 or 24 hours. It is indicated for the treatment of hay fever and chronic idiopathic urticaria. The Telfast-D® formulation combines this antihistaminic with a prolonged-release decongestion agent.
Avil®
One of the oldest and most trusted antihistamine. Avil® (pheniramine maleate) is used to treat allergic conditions such as hay fever or urticaria.
Nasacort®
Nasacort® (triamcinolone acetonide)- Allergy Nasal Spray is a once-a-day treatment for hay fever. Nasacort® prevents the body from releasing the chemicals that cause the symptoms of hay fever (sneezing, itching and a runny or blocked nose) and controls symptoms.
Phenergan®
Phenergan® (promethazine) is one of the most established antihistamines in the local market. It is useful in perennial and seasonal allergic rhinitis, allergic conjunctivitis, urticaria and pruritis. Phenergan® also prevents motion sickness, and treats nausea and vomiting after surgery and is effective in the relief of apprehension and inducing light sleep from which a patient can easily be aroused.
Avomine®
Avomine® (promethazine theoclate) is an antihistamine. It works by preventing the action of histamine. Avomine® is an active, anti-emetic for the use in the prevention and treatment of nausea and motion sickness.
Cough & Cold Rhinathiol®
Rhinathiol® (carbocisteine) is a mucolytic agent for the adjunctive therapy of respiratory tract disorders characterized by excessive, viscous mucus, including otitis media with effusion (glue ear) and chronic obstructive airway disease.
Tixylix®
Tixylix® is a cough syrup for children containing promethazine hydrochloride and pholcodine in a pleasant blackcurrant flavor. Tixylix® is indicated for the symptomatic relief of cough and as an adjuvant in the treatment of upper respiratory tract infections in children. It is also useful for the relief of irritating night cough and spasm of whooping cough in children.
Sleep DisordersStilnox®
Stilnox® (zolpidem) is the leading hypnotic worldwide and is indicated in the short-term treatment of
18 Annual Report 2015
PRODUCTS
insomnia. It rapidly induces sleep that is qualitatively close to natural sleep and devoid of certain side effects that are characteristic of the benzodiazepine class as a whole. Its action lasts for a minimum of six hours, and it is generally well tolerated, allowing the patient to awake with a reduced risk of impaired attention, decreased alertness or memory lapses throughout the day.
Emergency CareHaemaccel®
Haemaccel® (polygeline) is an emergency care / life-saving product. It is a plasma substitute for volume replacement used to correct or avert circulatory insufficiency due to plasma / blood volume deficiency, resulting from bleeding or from a shift in plasma volume between the circulatory compartments. It is a ready-for-use solution for intravenous infusion and can also be used as a carrier solution for various medicines. Haemaccel® is recommended by the World Health Organization (WHO) on its list of ‘Essential Medicines’.
CardiologyPlavix®
Millions of patients all over the world are being treated with Plavix® (clopidogrel bisulphate) for the prevention of ischemic events caused by atherothrombosis, confirming the favourable benefit-to-risk ratio of long-term management of atherothrombosis. In Pakistan, Plavix® is rapidly consolidating its position as the foremost platelet antiaggregate agent for the secondary prevention of stroke.
CoPlavix®
Co-Plavix® (clopidogrel acetylsalicylic acid) is a fixed-dose combination of clopidogrel and acetylsalicylic acid. CoPlavix® is used to prevent blood clots forming in hardened blood vessels (a process known as atherothrombosis) which can lead to events such as stroke, heart attack or death.. CoPlavix® was launched earlier in 2014 in Pakistan at a very economical price. Physicians have warmly welcomed this combination and have already started transferring its benefits to patients.
Aprovel®
Aprovel® (irbesartan)is indicated for the treatment of hypertension and diabetic nephropathy in patients with Type 2 diabetes. It acts by blocking the effect of angiotensin, the hormone responsible for the contraction of blood vessels, thereby permitting the normalization of arterial blood pressure.
Co Aprovel®
CoAprovel® (irbesartan and hydrochlorothiazide) is indicated for treatment of hypertension (essential hypertension). It may be used either alone or in combination with other antihypertensive agents. CoAprovel® may also be used as initial therapy in patients who are likely to need multiple drugs to achieve their blood pressure goals.
Clexane®
Clexane® (enoxaparin sodium) is the most widely studied and used low molecular weight heparin (LMWH) in the world & is approved for more clinical indications than any other LMWH. Clexane® is an anti-coagulant used to inhibit the formation of clots in veins and arteries, thereby preventing possible acute or chronic complications associated with deep vein or arterial thrombosis.
Tritace®
Tritace® contains the active ingredient ramipril, which is an ACE inhibitor. It is used to lower blood pressure and control hypertension (high blood pressure). It may also be used as treatment following a heart attack (myocardial infarction) complicated with heart failure or to reduce the risk of heart attack or stroke.
Co Tritace®
Co Tritace® is a combination product with two active ingredients: ramipril and hydrochlorothiazide. Ramipril relaxes blood vessels and makes the heart pump more efficiently. Hydrochlorothiazide belongs to the class of medications known as diuretics and helps control blood pressure by eliminating excess salt and water from the body.
Winstor®
Winstor® (atorvastatin) is a member of the drug class known as statins, used for lowering blood cholesterol. It also stabilizes plaque and prevents strokes through anti-inflammatory and other mechanisms. This drug
19
is indicated to prevent heart attacks, strokes, to lower cholesterol and other harmful types of cholesterol in the body and to slow the progress of heart disease.
AntibioticsTarivid®
Tarivid® (ofloxacin) is a fluroquinolone antibiotic with a broad anti-bacterial spectrum. Tarivid® is prescribed for acute, chronic or recurrent lower respiratory tract infections, skin and soft tissue infections, bone and joint infections, urinary tract infections and infections of the genital organs.
Claforan®
Claforan® is a third-generation cephalosporin injectable antibiotic for the treatment of a wide range of infections including those of the respiratory tract, skin and soft tissues, urinary tract, and meningitis due to susceptible pathogens in both adults and children. It is also indicated for surgical prophylaxis (i.e. prevention of surgical infections). Claforan® is manufactured in a state of the art facility located in Karachi.
Aventriax®
Aventriax® (ceftriaxone) is a third-generation cephalosporin antibiotic. Like other third-generation cephalosporins, it has broad spectrum activity against Gram-positive and Gram-negative bacteria. This drug is indicated for the treatment of lower respiratory tract infections, acute bacterial otitis media, skin infections, bone and joint infections, intra-abdominal and urinary tract infections, pelvic inflammatory disease (PID), uncomplicated gonorrhea, bacterial septicemia, and meningitis. Ceftriaxone injection is also given before certain types of surgery to prevent infections that may develop after the operation.
Rulid®
This antibiotic targets a wide range of bacterial infections and is commonly used to treat respiratory tract conditions such as acute bronchitis, tonsillitis and pneumonia. Rulid® (roxithromycin) also combats bacterial infections in the body’s genitals, gastrointestinal tract and soft tissues.
Orelox®
The active ingredient of Orelox® is cefpodoxime, an antibiotic used to treat bacterial infections. It is
a broad-spectrum antibiotic that kills a wide variety of bacteria that cause a wide variety of commonly-occurring infections of the upper and lower airways, skin and soft tissue. It may also be used to treat urinary tract infections.
Ciprozee®
Ciprozee® (ciprofloxacin), is an anti-infective that fights against multiple diseases, such as infectious diarrhea, urinary tract infections, typhoid and skin infections.
Tavanic®
Tavanic® (levofloxacin) is used to treat bacterial infections. Levofloxacin works by killing the bacteria that are causing an infection. As Levofloxacin is effective against a large number of bacteria, it is used to treat a range of infections, including infections of the chest, urinary tract and skin.
Targocid®
Targocid® (teicoplanin) injection is an antibiotic. It is used to kill bacteria responsible for infections which can occur in your blood (sepsis), bones or joints. This antibiotic is generally used when the bacteria causing the infection are not satisfactorily eliminated by other antibiotics or when patients may be allergic to other antibiotics.
Diarrhea Flagyl®
Today a household name and among the top-selling drugs in the country, Flagyl® (metronidazole) is effective for the treatment of parasitic infections caused by trichomonas vaginalis or entamoeba histolytica known to cause diarrhoeal disease.
Flagyl Plus®
Flagyl Plus® combines metronidazole (Flagyl®) and diloxanide furoate. This combination provides broad spectrum amoebicidal activity through the coverage of both tropozoites & cysts forms, providing not only cure in symptomatic Amoebiasis but also actively preventing the spread of the disease.
Secnidal®
Secnidal® (secnidazole) is an antibiotic that is
20 Annual Report 2015
PRODUCTS
effective against bacteria. It is used to treat certain infections caused by bacteria, such as infection of the intestines or vagina.
Enterogermina®
Enterogermina® (bacillus clausii) is an oral suspension probiotic offered in single doses. It restores the intestinal bacteria balance in case of an intestinal disorder. Enterogermina® can be used for preventive or curative treatment.
Gastric Disease Xerosec®
Proton pump inhibitors (PPI) block the production of acid by the stomach. Xerosec® (omeprazole) is used in the treatment of dyspepsia, peptic ulcer disease (PUD), gastroesophageal reflux disease (GORD/GERD) and Zollinger-Ellison syndrome, all caused by stomach acid. Omeprazole blocks the enzyme in the wall of the stomach that produces acid.
Meldere®
Meldere® (esomeprazole) also belongs to the PPI class and is used to treat the symptoms of gastroesophageal reflux disease (GERD), a condition in which backward flow of acid from the stomach causes heartburn and possible injury of the esophagus. It belongs to a class of medications called proton pump inhibitors and works by decreasing the amount of acid made in the stomach.
It may also be used to decrease the chance of development of ulcers in patients taking non-steroidal anti-inflammatory drugs (NSAIDs). It is also used with other medications to treat and prevent the return of stomach ulcers caused by a certain type of bacteria (H. pylori).
Anti-malaria
Nivaquine®
Nivaquine® contains the active ingredient chloroquine sulphate, which is an antimalarial medicine, available in tablets and suspension. Chloroquine works by attacking the parasites once they have entered the red blood cells. It kills the parasites and prevents them from multiplying further.
Consumer HealthcareSelsun Blue®
Initially owned globally by Abbott Laboratories, Selsun Blue® was introduced in Pakistan in the late 80’s. Chattem, a US based consumer healthcare company acquired by the Sanofi Group, acquired Selsun Blue® from Abbott globally in 2002 but the brand was licensed to Abbott for Manufacturing, Marketing and Sales.
In early 2012, Sanofi Pakistan acquired Selsun Blue® from Abbott locally and subsequently launched its first Consumer Healthcare brand, Selsun Blue® dandruff shampoo.
Seacod®
Seacod® is a health supplement. Packed with essential Omega- 3 Fatty Acids, Seacod® is a natural source of Vitamin A and Vitamin D, which builds immunity and offers protection from diseases. Seacod helps build immunity, prevent cough and cold, and maintains all-round health naturally.
Seacod ACTIVE®
Seacod Active® tablets contain 190mg of Omega-3 fatty acids. The power of Omega-3 helps keep the heart healthy and active. It reduces malfunctioning of the heart while also reducing body stiffness and ensuring wellness of the heart. Presence of Plus DHA in Seacod Active® helps maintain healthy brain function.
CollaFlex®
CollaFlex® improves joint flexibility, and helps keep joints healthy.
E-Cod Plus®
E-Cod Plus® comes with the added advantage of T3 (tocotrienol), which keeps the heart healthy by maintaining good cholesterol levels. It also contains Vitamin E which helps prevent leg cramps. The additional benefits of Cod liver oil in E-Cod Plus keeps muscles healthy.
21
Our vision is a world in which no one suffers or dies from a vaccine-preventable disease.
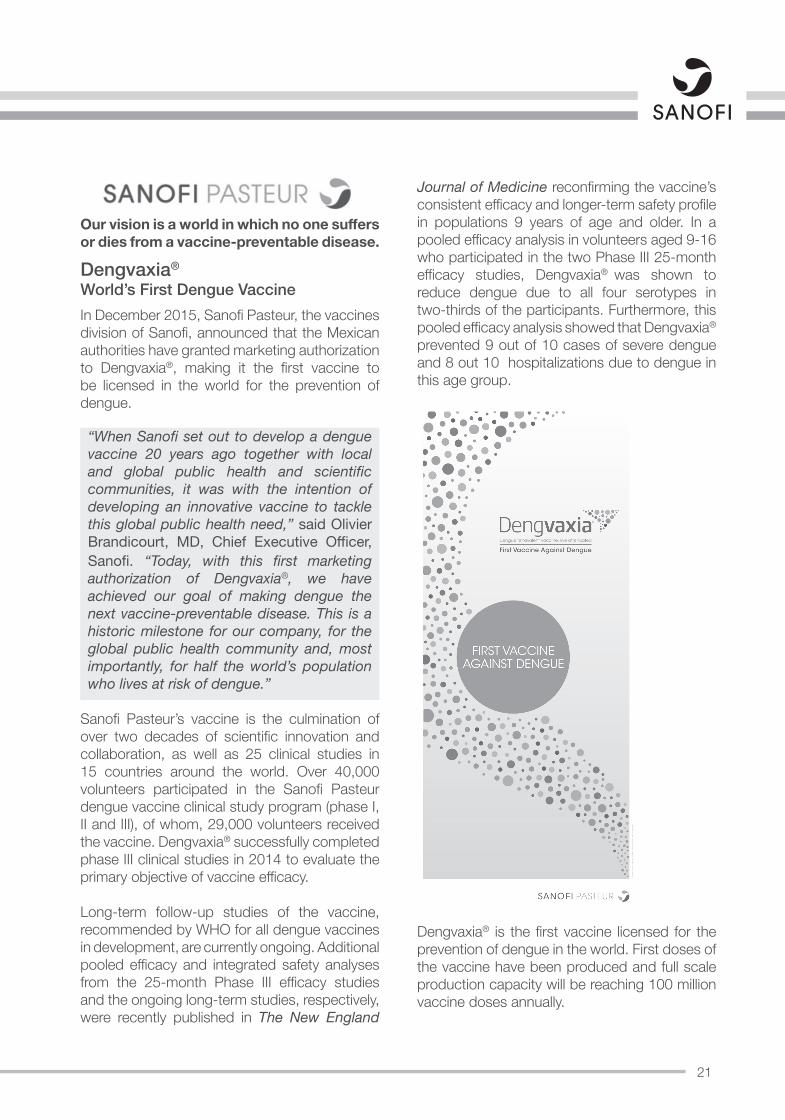
Dengvaxia®
World’s First Dengue Vaccine In December 2015, Sanofi Pasteur, the vaccines division of Sanofi, announced that the Mexican authorities have granted marketing authorization to Dengvaxia®, making it the first vaccine to be licensed in the world for the prevention of dengue.
“When Sanofi set out to develop a dengue vaccine 20 years ago together with local and global public health and scientific communities, it was with the intention of developing an innovative vaccine to tackle this global public health need,” said Olivier Brandicourt, MD, Chief Executive Officer, Sanofi. “Today, with this first marketing authorization of Dengvaxia®, we have achieved our goal of making dengue the next vaccine-preventable disease. This is a historic milestone for our company, for the global public health community and, most importantly, for half the world’s population who lives at risk of dengue.”
Sanofi Pasteur’s vaccine is the culmination of over two decades of scientific innovation and collaboration, as well as 25 clinical studies in 15 countries around the world. Over 40,000 volunteers participated in the Sanofi Pasteur dengue vaccine clinical study program (phase I, II and III), of whom, 29,000 volunteers received the vaccine. Dengvaxia® successfully completed phase III clinical studies in 2014 to evaluate the primary objective of vaccine efficacy.
Long-term follow-up studies of the vaccine, recommended by WHO for all dengue vaccines in development, are currently ongoing. Additional pooled efficacy and integrated safety analyses from the 25-month Phase III efficacy studies and the ongoing long-term studies, respectively, were recently published in The New England
Journal of Medicine reconfirming the vaccine’s consistent efficacy and longer-term safety profile in populations 9 years of age and older. In a pooled efficacy analysis in volunteers aged 9-16 who participated in the two Phase III 25-month efficacy studies, Dengvaxia® was shown to reduce dengue due to all four serotypes in two-thirds of the participants. Furthermore, this pooled efficacy analysis showed that Dengvaxia®
prevented 9 out of 10 cases of severe dengue and 8 out 10 hospitalizations due to dengue in this age group.
Dengvaxia® is the first vaccine licensed for the prevention of dengue in the world. First doses of the vaccine have been produced and full scale production capacity will be reaching 100 million vaccine doses annually.
22 Annual Report 2015
PRODUCTS
VaccinesMenactra®
Menactra® is Meningococcal (Groups A, C, Y, W-135) Polysaccharide Diphtheria Toxoid Conjugate Vaccine. Menactra is indicated for active immunization to prevent meningococcal diseases caused by Neisseria Meningitidis serogroups A, C, Y and W-135. Menactra is approved for use in individuals 9 months through 55 years of age.
VerorabVerorab is Inactivated Rabies vaccine for Human use, prepared on Cell Cultures. It is indicated for the prevention of rabies in children and adults. It can be used before or after exposure as a primary vaccination or as a booster dose. Rabies is a serious infection caused by a virus. The virus affects the brain. Verorab works by causing the body to protect itself against rabies.
PentaximPentaxim is a pentavalent (5 in 1) combination vaccine indicated for active immunization of infants from six weeks of age against Diphtheria, Tetanus, Pertussis, Poliomyelitis and invasive infections caused by Haemophilus influenzae type b (such as meningitis, septicaemia, cellulitis, arthritis, epiglottitis, pneumopathy and osteomyelitis). The vaccine contains acellular pertussis and inactivated polio vaccine, both of which have been found to be effective and have a better side effect profile. It is also indicated for booster in children who have previously received a primary vaccination with this vaccine or a diphtheria-tetanus-(whole cell or acellular) pertussis-poliomyelitis vaccine, whether mixed or not with the freeze-dried conjugate Haemophilus influenzae type b vaccine.
Typhim ViTyphim Vi (Typhoid Vi Polysaccharide Vaccine), for intramuscular use, is a sterile solution containing the cell surface Vi polysaccharide extracted from Salmonella Typhi, S typhi Ty2 strain. Typhim Vi works by preventing onset of typhoid fever in adults and children over 2 years of age, A single injection of Typhim provides protection for at least 3 years.
AvaximAvaxim is an inactivated Hepatitis A vaccine used for active immunization against infection caused by the
hepatitis A virus. Hepatitis A is an infection caused by a virus which is usually transmitted in unclean food or drink. It may also be transmitted by sharing needles and some sexual practices. Avaxim is available in 2 SKUs, Avaxim 80 U which is indicated for active immunization against infection caused by the hepatitis A virus in children aged from 12 months to 15 years inclusive & Avaxim 160 Adult vaccine which is indicated for active immunization against infection caused by the hepatitis A virus in adolescents from 16 years of age and above.
Imovax PolioIMOVAX Polio [Inactivated Poliomyelitis Vaccine (Vero Cell Origin)] is indicated for active immunization against poliomyelitis caused by poliovirus types 1, 2 and 3 in infants, children and adults both for primary immunization and for boosters. Imovax Polio is also indicated for subjects for whom oral vaccination is contraindicated. It is recommended that all infants, unimmunized children and adolescents not previously immunized be vaccinated routinely against paralytic poliomyelitis.
StamarilStamaril is a vaccine that provides protection againsta serious infectious disease called yellow fever. Yellow fever occurs in certain areas of the world and is spread to man through the bites of infected mosquitoes.Stamaril is given to people who: • Are travelling to, passing through or living in an
area where yellow fever occurs • Are travelling to any country that requires an
International Certificate of Vaccination for entry • May handle infectious materials such as
laboratory workers.Stamaril is given as a single dose to adults andchildren from 6 months of age.
VaxigripVaxigrip is a purified, inactivated, split virion vaccine for the prevention of influenza caused by Influenza Virus types A and B in adults and children aged 6 months and over. New types of influenza virus can appear each year hence vaccination is recommended every year
23
MEDICAL
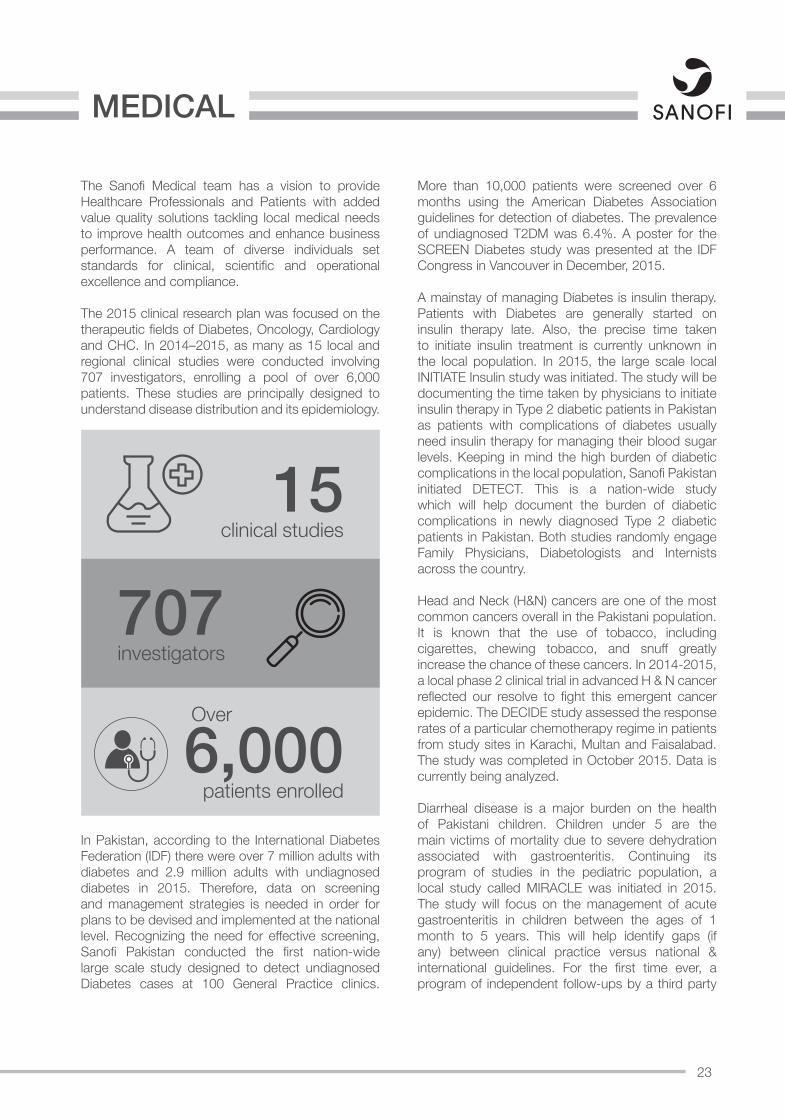
The Sanofi Medical team has a vision to provide Healthcare Professionals and Patients with added value quality solutions tackling local medical needs to improve health outcomes and enhance business performance. A team of diverse individuals set standards for clinical, scientific and operational excellence and compliance. The 2015 clinical research plan was focused on the therapeutic fields of Diabetes, Oncology, Cardiology and CHC. In 2014–2015, as many as 15 local and regional clinical studies were conducted involving 707 investigators, enrolling a pool of over 6,000 patients. These studies are principally designed to understand disease distribution and its epidemiology.
In Pakistan, according to the International Diabetes Federation (IDF) there were over 7 million adults with diabetes and 2.9 million adults with undiagnosed diabetes in 2015. Therefore, data on screening and management strategies is needed in order for plans to be devised and implemented at the national level. Recognizing the need for effective screening, Sanofi Pakistan conducted the first nation-wide large scale study designed to detect undiagnosed Diabetes cases at 100 General Practice clinics.
More than 10,000 patients were screened over 6 months using the American Diabetes Association guidelines for detection of diabetes. The prevalence of undiagnosed T2DM was 6.4%. A poster for the SCREEN Diabetes study was presented at the IDF Congress in Vancouver in December, 2015.
A mainstay of managing Diabetes is insulin therapy. Patients with Diabetes are generally started on insulin therapy late. Also, the precise time taken to initiate insulin treatment is currently unknown in the local population. In 2015, the large scale local INITIATE Insulin study was initiated. The study will be documenting the time taken by physicians to initiate insulin therapy in Type 2 diabetic patients in Pakistan as patients with complications of diabetes usually need insulin therapy for managing their blood sugar levels. Keeping in mind the high burden of diabetic complications in the local population, Sanofi Pakistan initiated DETECT. This is a nation-wide study which will help document the burden of diabetic complications in newly diagnosed Type 2 diabetic patients in Pakistan. Both studies randomly engage Family Physicians, Diabetologists and Internists across the country.
Head and Neck (H&N) cancers are one of the most common cancers overall in the Pakistani population. It is known that the use of tobacco, including cigarettes, chewing tobacco, and snuff greatly increase the chance of these cancers. In 2014-2015, a local phase 2 clinical trial in advanced H & N cancer reflected our resolve to fight this emergent cancer epidemic. The DECIDE study assessed the response rates of a particular chemotherapy regime in patients from study sites in Karachi, Multan and Faisalabad. The study was completed in October 2015. Data is currently being analyzed.
Diarrheal disease is a major burden on the health of Pakistani children. Children under 5 are the main victims of mortality due to severe dehydration associated with gastroenteritis. Continuing its program of studies in the pediatric population, a local study called MIRACLE was initiated in 2015. The study will focus on the management of acute gastroenteritis in children between the ages of 1 month to 5 years. This will help identify gaps (if any) between clinical practice versus national & international guidelines. For the first time ever, a program of independent follow-ups by a third party
15clinical studies
707investigators
Over
6,000patients enrolled
24 Annual Report 2015
MEDICAL
was initiated to assist investigators minimize loss to follow-up. This study is the second step after the MANDATE study in gathering information on, and understanding acute gastroenteritis in children under five.
An important problem in the hospital settings is that of surgical site infections. The NASPAK study to assess the patterns of surgical prophylaxis in Pakistan was published in the Pakistan Journal of Surgery (Journal of The Society of Surgeons of Pakistan) in the January-March 2015 issue. The study was well received by academia and has established Sanofi’s standing in the anti-infective arena. To further understand the burden of surgical site infections in surgeries in tertiary care hospitals in Pakistan, the SurgiPak study had been performed. After completion, the study manuscript has been accepted for publication in the Journal of Rawalpindi Medical College in 2016.
A significant population of Pakistan suffers from the silent killer of Hypertension. There is a need for data on cardiovascular risk factors as well. To address this, a local study was conducted across the country which estimated the number of newly diagnosed & established cases of hypertension in patients visiting
their Primary Care Physician. The study poster has been accepted for presentation in the World Heart Federation’s premier World Cardiology Congress to be held in May 2016.
The Medical Information Service (MIS) at Sanofi is a robust process which addresses the information needs of physicians all over Pakistan. Queries to address specific queries related to diseases or products are forwarded to MIS and a response is usually provided within 48 hours.
Sanofi is cognizant of and vigilant about the safety of its patients. Pharmacovigilance at Sanofi has evolved into an organized and well recognized system. All employees across the organization receive regular training so that they recognize with the importance of timely suspected adverse event reporting (24hrs).The Medical Department is conscious of forthcoming challenges and it has diversified into distinct entities related to clinical operations, pharmacovigilance, medical information, marketing support & medical governance.
25
QUALITY MATTERS
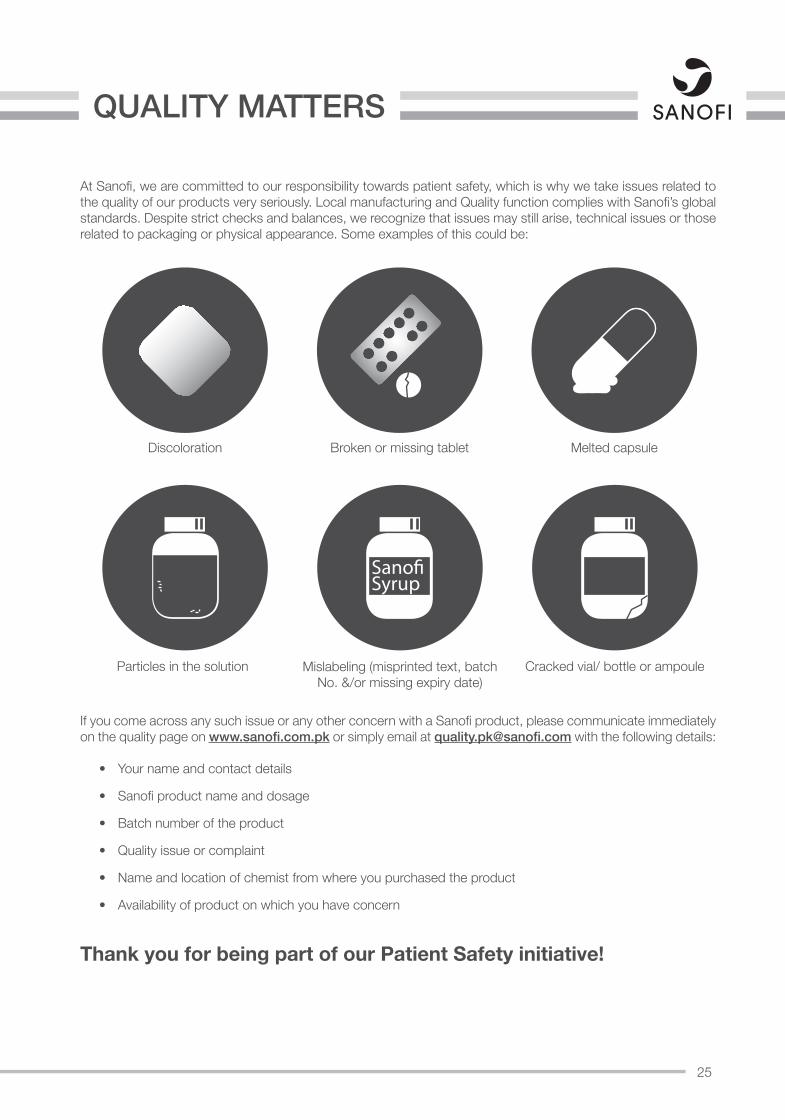
At Sanofi, we are committed to our responsibility towards patient safety, which is why we take issues related to the quality of our products very seriously. Local manufacturing and Quality function complies with Sanofi’s global standards. Despite strict checks and balances, we recognize that issues may still arise, technical issues or those related to packaging or physical appearance. Some examples of this could be:
If you come across any such issue or any other concern with a Sanofi product, please communicate immediately on the quality page on www.sanofi.com.pk or simply email at [email protected] with the following details:
• Your name and contact details
• Sanofi product name and dosage
• Batch number of the product
• Quality issue or complaint
• Name and location of chemist from where you purchased the product
• Availability of product on which you have concern
Thank you for being part of our Patient Safety initiative!
Discoloration Broken or missing tablet Melted capsule
Particles in the solution Mislabeling (misprinted text, batch No. &/or missing expiry date)
Cracked vial/ bottle or ampoule
SanofiSyrup
26 Annual Report 2015
PRODUCTSINDUSTRIAL AFFAIRS
The manufacturing facility that provides health solutions to patients The manufacturing site of Sanofi Pakistan is one of the most complex sites within the Africa, Middle East & South Asia Region. This is due to the diverse nature of products manufactured here, from single and double layer tablets, capsules, oral liquids, sterile ampoules, cephalosporin vials to an extremely sophisticated blood plasma substitute, Haemaccel®.
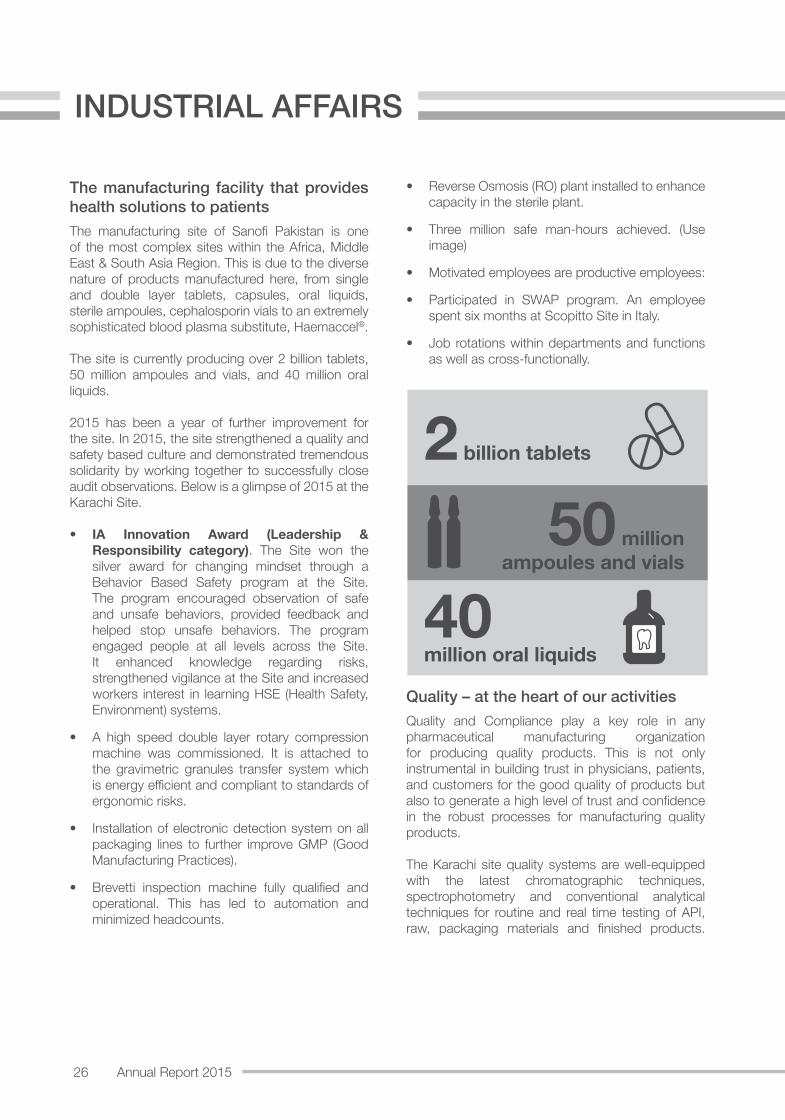
The site is currently producing over 2 billion tablets, 50 million ampoules and vials, and 40 million oral liquids.
2015 has been a year of further improvement for the site. In 2015, the site strengthened a quality and safety based culture and demonstrated tremendous solidarity by working together to successfully close audit observations. Below is a glimpse of 2015 at the Karachi Site.
• IA Innovation Award (Leadership & Responsibility category). The Site won the silver award for changing mindset through a Behavior Based Safety program at the Site. The program encouraged observation of safe and unsafe behaviors, provided feedback and helped stop unsafe behaviors. The program engaged people at all levels across the Site. It enhanced knowledge regarding risks, strengthened vigilance at the Site and increased workers interest in learning HSE (Health Safety, Environment) systems.
• A high speed double layer rotary compression machine was commissioned. It is attached to the gravimetric granules transfer system which is energy efficient and compliant to standards of ergonomic risks.
• Installation of electronic detection system on all packaging lines to further improve GMP (Good Manufacturing Practices).
• Brevetti inspection machine fully qualified and operational. This has led to automation and minimized headcounts.
• Reverse Osmosis (RO) plant installed to enhance capacity in the sterile plant.
• Three million safe man-hours achieved. (Use image)
• Motivated employees are productive employees:
• Participated in SWAP program. An employee spent six months at Scopitto Site in Italy.
• Job rotations within departments and functions as well as cross-functionally.
Quality – at the heart of our activities Quality and Compliance play a key role in any pharmaceutical manufacturing organization for producing quality products. This is not only instrumental in building trust in physicians, patients, and customers for the good quality of products but also to generate a high level of trust and confidence in the robust processes for manufacturing quality products.
The Karachi site quality systems are well-equipped with the latest chromatographic techniques, spectrophotometry and conventional analytical techniques for routine and real time testing of API, raw, packaging materials and finished products.
2 billion tablets
40 million oral liquids
50 million ampoules and vials
27
Near Infra-Red (NIR) spectroscopy technology is being used for 100% identification of materials, which has simplified the process of raw material testing by reducing lead time of end-to-end process of producing finished products.
In 2015, the Industrial Quality & Compliance (IQC) organization:
• Received GMP certificate from DRAP (Drug Regulatory Authority of Pakistan).
• Attained certification by Malaysian FDA as per PIC/S standards.
• Introduced GMP talks to reinforce GMP culture.
• Engaged employees across the Site by initiating GMP poster competition.
• Deployed PHENIX inspection management module at Site to monitor and manage local as well as international regulatory inspection.
• Implemented Pharmacopeia methods for all raw materials and finished goods.
In addition, the Site got approvals for supplies after successful audit by the international NGO, Marie Stopes Society.
28 Annual Report 2015
Creating Professionalism for Business Impact A Company’s true source of competitive advantage and sustainable growth lies in the quality of its human resource, i.e. its people. At Sanofi we take pride in the excellence of our human assets and our team’s continued commitment to organizational success. Our human resource policies, development programs and promotion / incentive activities are designed to create an exemplary team.
Talent AcquisitionA critical aspect of our corporate strategy is to identify, induct and engage diverse talent from across Pakistan. We not only recruit experienced talent but also provide opportunities to potential young university graduates eager to make their mark. The Company boasts of a robust Internship Program which helps students to familiarize themselves with the healthcare industry and corporate environment. Furthermore, our Internship Program also enables students to attain a stronger understanding of their specific area of interest.
We have been actively engaged in conducting Career Counseling workshops and participating at job fairs in the country’s leading educational institutes, reflecting our determination and enthusiasm to build a dynamic and highly competent team.
Our Internal Job Posting process provides existing employees the opportunity to apply for vacant positions across functions throughout the company, aiding their professional growth and enabling them to meet personal career aspirations. Our case studies, role plays and behavior-based interview guides are developed considering real life situations. This gives us a clear idea about the candidates’ thought process and ability, thereby enabling us to recruit the most suitable candidate for each position.
InductionIn order to accelerate the assimilation of new employees into the organization, they attend a comprehensive orientation program, called ‘Know Your Company’. This is designed to enhance their quick understanding of the Company, business and future outlook.
New inductees are also assigned a “Buddy” as a reference point, to help them understand processes and procedures specific to Sanofi. The “Buddy” program facilitates greater knowledge-sharing and fosters stronger connections by pairing people across disciplines and departments.
PRODUCTSHUMAN RESOURCES
29
TRAINING & DEVELOPMENT
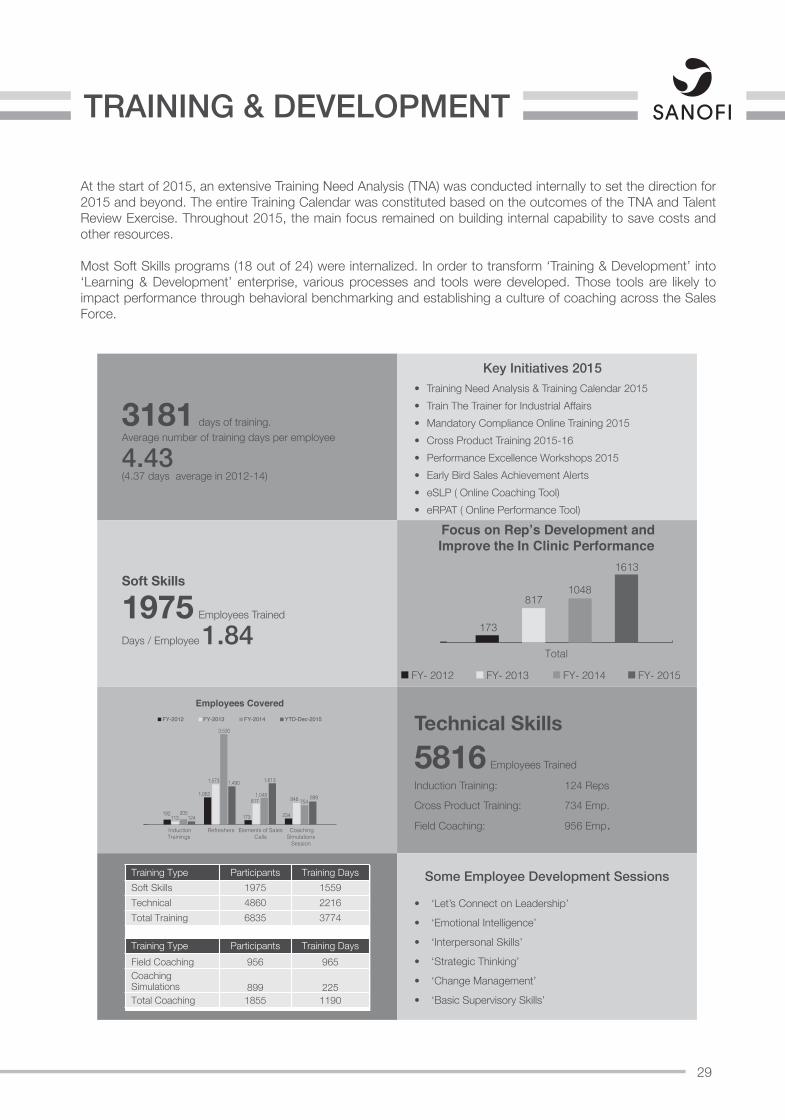
At the start of 2015, an extensive Training Need Analysis (TNA) was conducted internally to set the direction for 2015 and beyond. The entire Training Calendar was constituted based on the outcomes of the TNA and Talent Review Exercise. Throughout 2015, the main focus remained on building internal capability to save costs and other resources.
Most Soft Skills programs (18 out of 24) were internalized. In order to transform ‘Training & Development’ into ‘Learning & Development’ enterprise, various processes and tools were developed. Those tools are likely to impact performance through behavioral benchmarking and establishing a culture of coaching across the Sales Force.
3181 days of training.Average number of training days per employee 4.43(4.37 days average in 2012-14)
Soft Skills 1975 Employees Trained
Days / Employee 1.84
Technical Skills
5816 Employees Trained
Induction Training: 124 Reps
Cross Product Training: 734 Emp.
Field Coaching: 956 Emp.
Some Employee Development Sessions
• ‘Let’s Connect on Leadership’
• ‘Emotional Intelligence’
• ‘Interpersonal Skills’
• ‘Strategic Thinking’
• ‘Change Management’
• ‘Basic Supervisory Skills’
Key Initiatives 2015• Training Need Analysis & Training Calendar 2015• Train The Trainer for Industrial Affairs• Mandatory Compliance Online Training 2015• Cross Product Training 2015-16• Performance Excellence Workshops 2015• Early Bird Sales Achievement Alerts• eSLP ( Online Coaching Tool)• eRPAT ( Online Performance Tool)
InductionTrainings
Refreshers Elements of SalesCalls
CoachingSimulations
Session
Employees CoveredFY-2012 FY-2013 FY-2014 YTD-Dec-2015
192113
205124
1,062
1,573
3,530
1,490
173
8171,048
1,613
234
848 754899
Focus on Rep’s Development and Improve the In Clinic Performance
173
8171048
1613
Total
FY- 2012 FY- 2013 FY- 2014 FY- 2015
Training Type Participants Training DaysSoft Skills 1975 1559Technical 4860 2216Total Training 6835 3774
Training Type Participants Training DaysField Coaching 956 965Coaching Simulations 899 225Total Coaching 1855 1190
30 Annual Report 2015
PRODUCTSCORPORATE SOCIALRESPONSIBILITY
HUMAN RIGHTS
ETHICS IN R&D - BUSINESS ETHICS
THE FOUNDATION OF OUR CSR APPROACH
PEOPLE
PEOPLE DEVELOPMENT
ETHICS
PLANE
T
WASTE MANAGEMENT - W
ATER
MAN
AGEM
ENT
CARBON FOO
TRPI
NT
PATIENTACCESS
TO HEALTHCARE–
PATIENT SAFETY
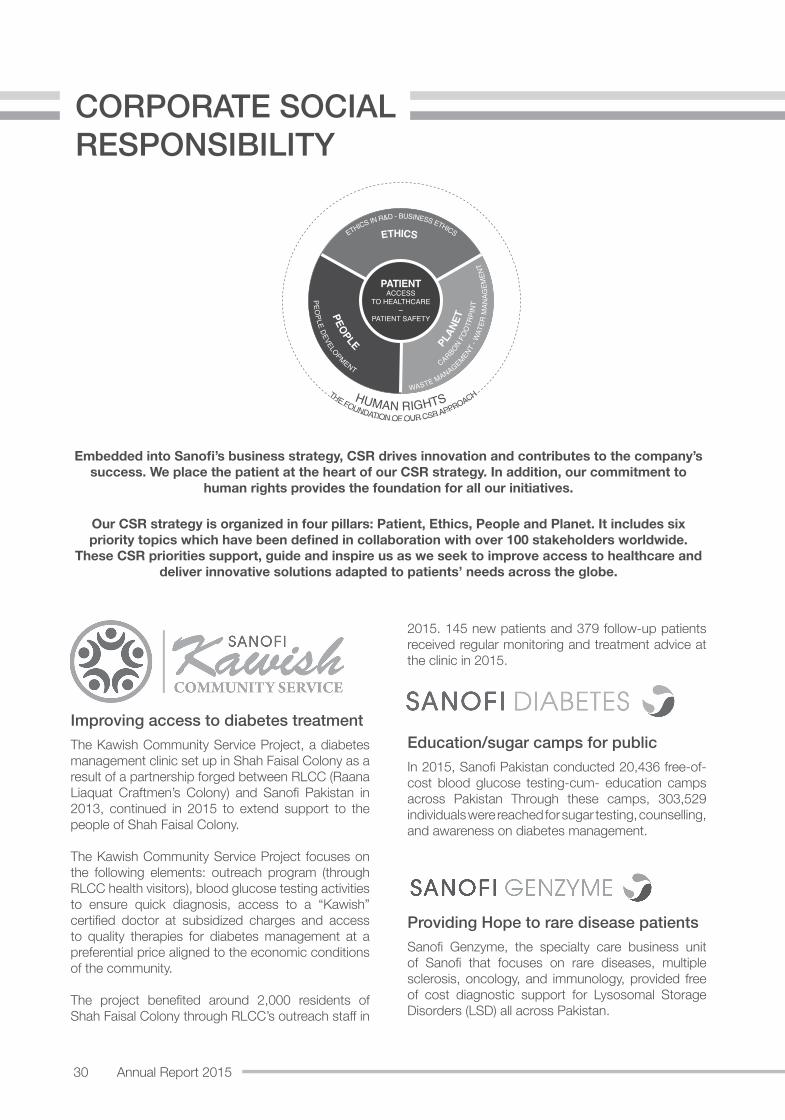
Embedded into Sanofi’s business strategy, CSR drives innovation and contributes to the company’s success. We place the patient at the heart of our CSR strategy. In addition, our commitment to
human rights provides the foundation for all our initiatives.
Our CSR strategy is organized in four pillars: Patient, Ethics, People and Planet. It includes six priority topics which have been defined in collaboration with over 100 stakeholders worldwide.
These CSR priorities support, guide and inspire us as we seek to improve access to healthcare and deliver innovative solutions adapted to patients’ needs across the globe.
Improving access to diabetes treatmentThe Kawish Community Service Project, a diabetes management clinic set up in Shah Faisal Colony as a result of a partnership forged between RLCC (Raana Liaquat Craftmen’s Colony) and Sanofi Pakistan in 2013, continued in 2015 to extend support to the people of Shah Faisal Colony.
The Kawish Community Service Project focuses on the following elements: outreach program (through RLCC health visitors), blood glucose testing activities to ensure quick diagnosis, access to a “Kawish” certified doctor at subsidized charges and access to quality therapies for diabetes management at a preferential price aligned to the economic conditions of the community.
The project benefited around 2,000 residents of Shah Faisal Colony through RLCC’s outreach staff in
2015. 145 new patients and 379 follow-up patients received regular monitoring and treatment advice at the clinic in 2015.
Education/sugar camps for publicIn 2015, Sanofi Pakistan conducted 20,436 free-of-cost blood glucose testing-cum- education camps across Pakistan Through these camps, 303,529 individuals were reached for sugar testing, counselling, and awareness on diabetes management.
Providing Hope to rare disease patientsSanofi Genzyme, the specialty care business unit of Sanofi that focuses on rare diseases, multiple sclerosis, oncology, and immunology, provided free of cost diagnostic support for Lysosomal Storage Disorders (LSD) all across Pakistan.
31
In Pakistan, Gaucher is the most prevalent disease amongst all LSDs (Lysosomal Storage Disorders). According to experts, a number of suspected cases of Gaucher disease in Pakistan is due to intermarriages/consanguinity.
Sanofi Genzyme launched a program in February 2015, in collaboration with the National LSD Core Committee. The Committee comprises of prominent Healthcare Practitioners in Pakistan dedicated towards highlighting the cause of children afflicted with LSDs.
Under the campaign- Darkness to Hope- a host of activities were launched to improve diagnosis, mobilize patient support groups, government & philanthropists to support patients in gaining access to therapy.
As a result of the campaign, 31% cases were declared positive after undergoing screening. Out of 22 patients identified for treatment, therapy cost for 10 patients was secured by virtue of this campaign. These patients have started receiving treatment with the help of philanthropists and state level funding.
Support for education Sanofi Pakistan was declared Bronze winner at the Annual Sanofi Global CSR Awards Ceremony in January 2015. The prize included a cash component of €5000.
Sanofi Pakistan donated the cash prize to Literate Pakistan Foundation to support its efforts towards promoting literacy in Pakistan.
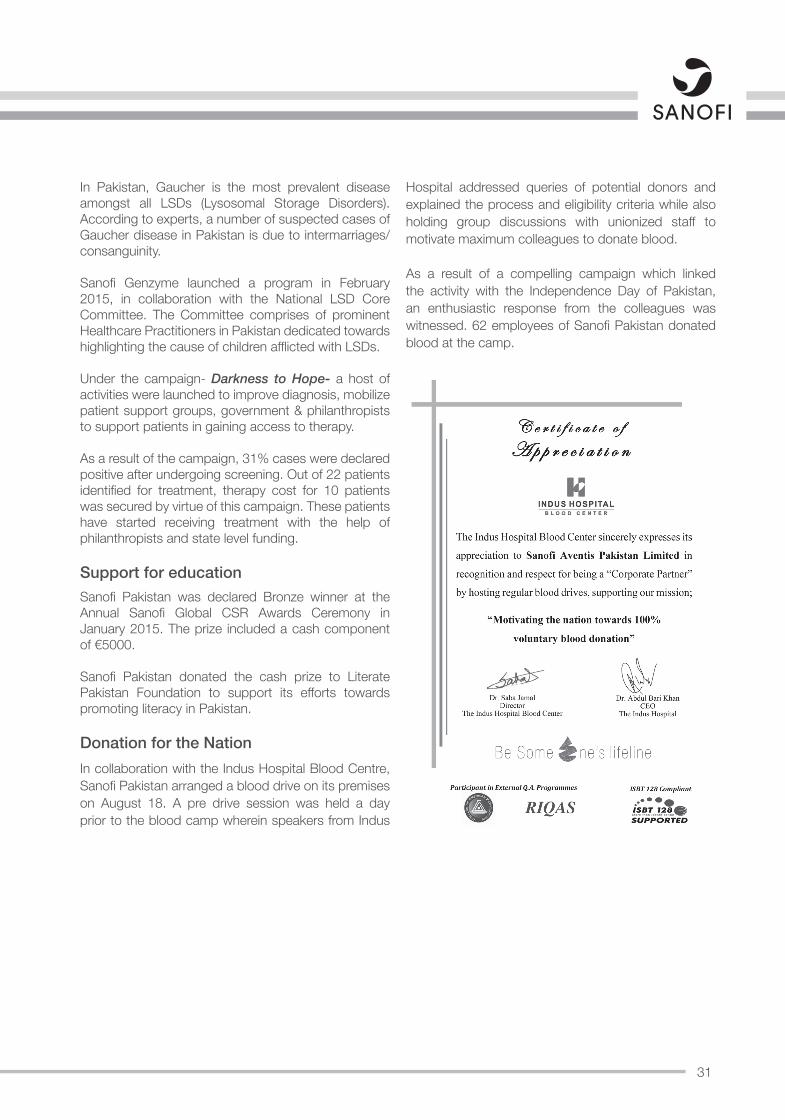
Donation for the NationIn collaboration with the Indus Hospital Blood Centre, Sanofi Pakistan arranged a blood drive on its premises on August 18. A pre drive session was held a day prior to the blood camp wherein speakers from Indus
Hospital addressed queries of potential donors and explained the process and eligibility criteria while also holding group discussions with unionized staff to motivate maximum colleagues to donate blood.
As a result of a compelling campaign which linked the activity with the Independence Day of Pakistan, an enthusiastic response from the colleagues was witnessed. 62 employees of Sanofi Pakistan donated blood at the camp.
32 Annual Report 2015
Compliance is an integral part of how we do business at Sanofi and how we behave in the normal course of our job. It is having a responsible behavior, being accountable and acting in accordance with laws, codes, policies and procedures. All this is implemented through a dedicated function, ‘Global Compliance & Business Integrity’.
Compliance as a function is not a regulator, but a partner to the business, and part of their mission is to support the achievements of business objectives within the frame of company values and standards. Compliance defines how we should interact with our customers, employees and our business partners. It defines how we should operate. Training on compliance and ethics principles is mandatory for all employees, with additional specialized trainings for certain categories of employees.
The Compliance function ensures that compliance policies are understood, implemented and monitors their implementation and handles the concerns that are communicated through the company’s whistle blowing channels.
Compliance policies are also communicated to business partners, so that their conduct is also aligned with the Sanofi way of doing business.
The company has set up adequate whistle blowing channels, which are communicated to all concerned stakeholders. Internal as well as external stakeholders can communicate their concerns on Compliance at: [email protected]
To ensure that compliance principles are fully understood at all levels in the organization, training programs have been implemented, which include Face-to-Face as well as eTrainings.
In addition to the Code of Ethics, Sanofi has implemented various policies to provide additional guidelines on specific areas.
ETHICS & COMPLIANCE
33
REVIEW REPORT TO THE MEMBERS ON STATEMENT OF COMPLIANCE WITH THE CODE OF CORPORATE GOVERNANCEWe have reviewed the enclosed Statement of Compliance with the best practices contained in the Code of Corporate Governance (the Code) prepared by the Board of Directors of sanofi-aventis Pakistan Limited (the Company) for the year ended 31 December 2015 to comply with the requirements of Listing Regulations of Pakistan Stock Exchange Limited, where the Company is listed.
The responsibility for compliance with the Code is that of the Board of Directors of the Company. Our responsibility is to review, to the extent where such compliance can be objectively verified, whether the Statement of Compliance reflects the status of the Company’s compliance with the provisions of the Code and report if it does not and to highlight any non-compliance with the requirements of the Code. A review is limited primarily to inquiries of the Company’s personnel and review of various documents prepared by the Company to comply with the Code.
As a part of our audit of the financial statements we are required to obtain an understanding of the accounting and internal control systems sufficient to plan the audit and develop an effective audit approach. We are not required to consider whether the Board of Directors’ statement on internal controls covers all risks and controls, or to form an opinion on the effectiveness of such internal controls, the Company’s corporate governance procedures and risks.
The Code requires the Company to place before the Audit Committee, and upon recommendation of the Audit Committee, place before the Board of Directors’ for their review and approval its related party transactions distinguishing between transactions carried out on terms equivalent to those that prevail in arm‘s length transactions and transactions which are not executed at arm’s length price and recording proper justification for using such alternate pricing mechanism. We are only required and have ensured compliance of this requirement to the extent of the approval of the related party transactions by the Board of Directors upon recommendation of the Audit Committee. We have not carried out any procedures to determine whether the related party transactions were undertaken at arm’s length price or not.
Based on our review, nothing has come to our attention which causes us to believe that the Statement of Compliance does not appropriately reflect the Company’s compliance, in all material respects, with the best practices contained in the Code, as applicable to the Company for the year ended 31 December 2015.
Chartered AccountantsAudit Engagement Partner: Riaz A. Rehman Chamdia Date: February 24, 2016 Place: Karachi
34 Annual Report 2015
STATEMENT OF COMPLIANCEWith the Code of Corporate Governance for the year ended December 31, 2015
This statement is being presented to comply with the Code of Corporate Governance (the Code) contained in listing regulations of Pakistan Stock Exchange (formerly Karachi, Lahore and Islamabad stock exchanges) for the purpose of establishing a framework of good governance, whereby a listed Company is managed in compliance with the best practices of corporate governance.
The Company has applied the principles contained in the Code in the following manner:-
The Company encourages representation of independent non-executive directors and directors representing minority interests on its Board. At present the Board composition is as follows:
Category NameNon-executive Syed Babar Ali (Chairman)Independent Javed IqbalExecutive Dr. Asim Jamal (Chief Executive & Managing Director)Non-executive Syed Hyder AliNon-executive Arshad Ali GoharNon-executive Patrick AghanianNon-executive Franck VidorNon-executive Patrick ChocatExecutive Yasser Pirmuhammad (CFO) – appointed subsequent to year end
The Independent director meets the criteria of independence under the Code.
The directors have confirmed that none of them is serving as a director on more than seven listed companies, including this Company.
All the resident directors of the Company are registered as taxpayers and none of them has defaulted in payment of any loan to a banking Company, a DFI or an NBFI or, being a member of a stock exchange, has been declared as a defaulter by that stock exchange.
Syed Babar Ali is a director of sanofi-aventis Pakistan limited, who also holds similar position in IGI Investment Bank Limited which is the holding company of IGI Finex Securities Limited, a company engaged in the business of stock brokerage. However, Syed Babar Ali undertakes that neither he nor his spouse is personally engaged in the business of stock brokerage.
Casual vacancies occurred in the Board during the year which were filled up by the directors within 90 days.
The Company has prepared a “Code of Conduct” and has ensured that appropriate steps have been taken to disseminate it throughout the Company along with its supporting policies and procedures.
The Board has developed a vision / mission statement, overall corporate strategy and significant policies of the Company. A complete record of particulars of significant policies along with the dates on which they were approved or amended has been maintained.
All the powers of the Board have been duly exercised and decisions on material transactions, including appointment and determination of remuneration and terms and conditions of employment of the CEO, other executive and non-executive directors, have been taken by the Board / shareholders.
The meetings of the Board were presided over by the Chairman and the Board met at least once in every quarter. Written notices of the Board meetings, along with agenda and working papers, were circulated within due time before the meetings. The minutes of the meetings were appropriately recorded and circulated.
The Directors are well aware of their duties and responsibilities under the Code. During the year, one of the Directors attended the directors’ training program. The independent Director and two of the Non-Executive Directors of the company meet the criteria of exemption under the Code, and accordingly are exempted from attending the director’s training program. The Director who was appointed subsequent to the year-end, is already certified under the directors’ training program, whereas the remaining Directors shall also obtain certification in due course.
35
The Board approves the appointment, remuneration and terms & conditions of employment of the Chief Financial Officer (CFO), Company Secretary and the Head of Internal Audit. However, during the year there was no new appointment or change in the above positions. The Board approved the appointment, as well as terms and conditions of employment of the CFO, who was appointed after the year-end.
The Directors’ Report for this year has been prepared in compliance with the requirements of the Code and fully describes the salient matters required to be disclosed.
The financial statements of the Company were duly endorsed by CEO and CFO before approval of the Board.
The directors, CEO and executives do not hold any interest in the shares of the Company other than that disclosed in the pattern of shareholding.
The Company has complied with the corporate and financial reporting requirements of the Code.
The Board has formed an Audit Committee. It comprises of three members, out of which one is independent and the remaining are non-executive directors including the Chairman of the Committee.
The meetings of the Audit Committee were held at least once every quarter prior to approval of interim and final results of the Company and as required by the Code. The terms of reference of the Committee have been formed and advised to the Committee for compliance.
The Board has formed a Human Resources and Remuneration Committee. It comprises of three members, out of which 2 are non-executive directors including the Chairman of the Committee.
The Board has set up an effective Internal Audit function which is considered suitably qualified and experienced for the purpose and is conversant with the policies and procedures of the Company.
The statutory auditors of the Company have confirmed that they have been given a satisfactory rating under the Quality Control Review program of the ICAP, that they or any of the partners of the firm, their spouses and minor children do not hold shares of the Company and that the firm and all its partners are in compliance with International Federation of Accountants (IFAC) guidelines on Code of Ethics as adopted by the ICAP.
The statutory auditors or the persons associated with them have not been appointed to provide other services except in accordance with the Listing Regulations and the auditors have confirmed that they have observed IFAC guidelines in this regard.
The ‘closed period’, prior to the announcement of interim / final results, and business decisions, which may materially affect the market price of Company’s securities, was determined and intimated to the directors, employees and stock exchanges.
Material / price sensitive information has been disseminated among all market participants at once through the stock exchanges.
We confirm that other material principles contained in the Code have been complied with.
Syed Babar Ali Dr. Asim Jamal Chairman Chief Executive Officer & Managing Director
Dated: February 24, 2016
36 Annual Report 2015
We would like to present the Annual Report and the Company’s audited financial statements for the year ended December 31, 2015. These financial statements have been prepared in accordance with the approved accounting standards as applicable in Pakistan and the requirements of the Companies Ordinance, 1984. The directors’ report is prepared under section 236 of the Companies Ordinance, 1984 and clause xvi of the Code of Corporate Governance, 2012.
Overview
The net sales for the year ended December 31, 2015 registered an overall growth of 8.41% over the last year, which includes sales attributable to pharmaceutical, vaccine and CHC products. The results for the pharmaceutical sales during the year were driven mainly by sales of major brands, Flagyl®, Lantus®, Amaryl®, Haemaccel® and Claforan®.
The vaccines sales of the Company during the year amounted to Rs.604 million, an increase of 51.4% over last year. Private vaccines business observed a healthy growth of 34.7% over last year despite acute stock shortages. The growth was mainly driven by Verorab®, Vaxigrip®, Trimovax® and Menectra®. The public vaccines business observed a strong growth of 109.3% because of higher Trivalent Oral Polio Vaccine (tOPV) sales in 2015.
Gross margin for the year ended December 31, 2015 has increased from Rs. 2,547 million to Rs. 2,806 million in absolute terms and from 25.6% to 26.0% as a percentage of Net Sales. The slight improvement is attributable to lower cost of imports after devaluation of import currency, increased operational efficiency and better product mix.
Distribution and marketing expenses have increased by 18.72% from last year in absolute terms and 1.7% as a percentage of net sales. The increase is attributable to higher personnel costs including certain restructuring costs on account of planned staff redundancies as well as higher freight and transportation expenses and rent and taxes.
The Company has improved controls on working capital needs and this coupled with lower interest rates led to a decrease in finance costs.
The Company, like the rest of the industry, continued to face challenges due to the absence of a viable, fair and transparent pricing policy. This, in addition to the
main factors described above, resulted in the decline of profit after tax by 72.1% from Rs. 238 million to Rs. 66 million Industry leadership
According to the latest IMS market report for the period MAT Dec 2015, sanofi-aventis maintains its 7th rank in the pharmaceutical industry of Pakistan, with a market share and growth rate of 3.5% and 6.5% respectively.
Capital expenditure
The Company continued to invest in plant and machinery. During the year under report, an amount of Rs. 347.6 million was incurred on capital expenditure in various areas of our manufacturing facilities for balancing, modernization and upgrading infrastructure.
Profit, finance & taxation
The Company’s total turnover has increased by 8.4% over the last year due to strategies adopted to ensure the overall sustainability as well as appropriate return for the shareholders.
The profit, taxation and proposed appropriations are stated below:
(Rs. in ‘000’)Profit for the year before taxation 176,251
Taxation : Current - for the year (132,362) Prior (12,211) Deferred 34,799 Total (109,774)Profit after taxation 66,477
Unappropriated profit brought forward 103,666
Actuarial gain recognized directly in equity– net of deferred taxation 1,144Profit available for appropriations 171,287
Appropriations :Proposed final dividend @ 30% out of profits for the year ended Dec 31, 2015 (28,934)
Transfer to reserve (100,000)(128,934)
Unappropriated profit carried forward 42,353
Considering the profitability for the year the directors
DIRECTORS’ REPORT
37
of the Company recommend a final dividend of Rs.3 per share (30%), for approval by the shareholders.
Cash flows
Total bank borrowings as at December 31, 2015 stood at Rs. 2,852.9 million and comprised of long term financing of Rs. 500 million and short term borrowings including bank overdrafts of Rs. 2,352.9 million. The decrease of Rs. 396 million is mainly due to lower import payments resulting from a favorable EUR to PKR exchange parity as well as improvement in management of working capital during the year.
Business risks and challenges
Important factors that could cause actual financial, business or operating results to differ materially from expectations are disclosed in the respective notes to the financial statements, including without limitation the following risk factors. In addition to the risks listed below, the Company may be subject to other material risks that, as of the date of this report, are not currently known to us or that are deemed immaterial at this time.
We face uncertainties over the pricing of pharmaceutical products
The commercial success of our products depends in part on the pricing mechanism of our product portfolio, in order to compensate for the local inflation and depreciation of Pak Rupee.
The Drug Regulatory Authority of Pakistan (DRAP) had announced a new pricing policy dated March 5, 2015 (namely the Drug Pricing Policy 2015 – DPP2015) wherein it recommended amongst other points, that the MRP of all drugs be frozen at the approved level of MRP as on 31st October 2013 and which would remain at this maintained price till 30th June 2016. In addition, the DPP2015 further proposed the reduction of originator drugs/brands prices to the extent of 10% every subsequent year. The pharma industry has strongly objected to salient provisions / clauses of this policy and has filed a Constitutional Petition in the Hon’able High Court of Sindh.
In addition to the above, DRAP had committed to the pharmaceutical industry that it would take decisions on applications pending with it with respect to price increase on specific, select products (“Hardship cases”) by December 5, 2015 as per the provisions
of the DPP2015. Following their failure to do so, and subsequent to informing DRAP, sanofi-aventis Pakistan limited (Sanofi Pakistan) approached the Sindh High Court and obtained an Order for increasing the prices of its pending Hardship cases only. This increase, when implemented, will apply to such specific products only (.i.e. thirteen SKUs). Sanofi Pakistan was compelled to exercise its constitutional right to seek legal redress in order to ensure continuity of supply of quality medicines to patients.
The Company is also closely monitoring the legal and business implications of the case and will take all necessary measures to ensure that the appropriate representations are made to the concerned authorities in support of a pricing policy acceptable to the industry.
A slowdown of economic growth could have negative consequences for our business
The future growth of the pharmaceutical market depends on the growth of national economy, any decline in which could negatively affect the pharmaceutical market and, as a result, adversely affect our business.
We rely on third parties for the manufacture and supply of a substantial portion of our raw materials and active ingredients
Third parties supply us with a substantial portion of our raw materials and active ingredients which exposes us to the risk of a supply shortage or interruption in the event that these suppliers are unable to manufacture products meeting group quality standards, experience financial difficulties. Even though we aim to have backup sources of supply whenever possible, however, we cannot be certain that they will be sufficient if our principal sources become unavailable. Any of these factors could adversely affect our business.
Counterfeit products harm our business
The prescription drugs supply has been increasingly challenged by vulnerability of distribution channels to illegal counterfeiting and the presence of counterfeit products in the market. Reports of adverse reactions to counterfeit drugs or increased levels of counterfeiting could materially affect patient confidence in the genuine product and could harm the business as well as the image of the company.
The Company has a dedicated anti-counterfeit function
38 Annual Report 2015
which aims to trace/identify fake drug manufacturing units across the country and dismantle the units in collaboration with law enforcement agencies.
Changes in mark-up rates could affect our profits before tax
Since the Company’s cash flow management is dependent on the committed financing facilities, accordingly, changes in mark-up rates could also significantly impact Company’s operating results. The Company’s management is taking initiatives as described in detail below (see “Future Outlook – Cash Flow Management”) to ensure effective management of this risk.
We are subject to the risk of non-payment by our customers
We run the risk of non-payment by our customers, which consist principally of distributors, hospitals and government institutions. In order to minimize the credit risk exposure, we sell our products either on cash basis or on credit to those customers with good credit standing. We also seek to manage our credit risk exposure as described in note 33.2 to the financial statements.
We rely on our patents and proprietary rights to provide exclusive rights to market certain of our products, and if such patents and other rights were limited or circumvented, our financial results could be materially and adversely affected
Through patent and other proprietary rights we hold exclusivity rights for a number of our products. Patent rights are limited in time and do not always provide effective protection for our products: competitors may successfully avoid patents through design innovation, we may not hold sufficient evidence of infringement to bring suit, manufacturers of generic products are also increasingly seeking to challenge patents before they expire, and our infringement claim may not result in a decision that our rights are valid, enforceable or infringed.
Product liability claims could adversely affect our business, results of operations and financial condition.
Product liability is a significant business risk for any pharmaceutical Company. Substantial damage awards and/or settlements have been handed down
in some countries against pharmaceutical companies based on claims for injuries allegedly caused by the use of their products. Often the side effect profile of pharmaceutical drugs cannot be fully established based on preapproval clinical studies involving only several hundred to several thousand patients. Routine review and analysis of the continually growing body of post-marketing safety surveillance and clinical trials provide additional information and may cause product labeling to evolve, including restrictions of therapeutic indications, new contra-indications, warnings or precautions, and occasionally even the suspension or withdrawal of a product marketing authorization.
Product liability claims, regardless of their merits or the ultimate success of our defense, are costly, divert management attention, may harm our reputation and can impact the demand for our products.
Claims and investigations relating to compliance, competition law, marketing practices, pricing, as well as other legal matters, could adversely affect our business, results of operations and financial condition.
The marketing of our products is heavily regulated. Our business covers an extremely wide range of activities and involves numerous partners. Any failure to comply directly or indirectly (including as a result of a business partners’ breach) with law could lead to substantial liabilities. The Company is taking all necessary measures to ensure that the Company, as well as its business partners, conduct their affairs in a compliant manner, including but not limited to insisting the counter parties to adhere to the Company’s code of ethics.
We may lose market share to competing remedies or generic brands.
We are faced with intense competition from generic products and biosimilars. Doctors or patients may choose these products over ours if they perceive them to be safer, more reliable, more effective, easier to administer or less expensive, which could cause our revenues to decline and affect our results of operations.
Our pension and gratuity liabilities are affected by factors such as the performance of plan assets, interest rates, actuarial data and experience and changes in laws and regulations
Our future funding obligations for our defined-benefit
39
pension and gratuity plan depend on changes in the future performance of assets held in trust for these plans, the interest rates used to determine funding levels (or Company liabilities), actuarial data and experience, inflation trends, the level of benefits provided for by the plans, as well as changes in laws and regulations. Adverse changes in those factors could increase our unfunded obligations under such plans, which would require more funds to be contributed and hence negatively affect our cash flows and results.
Risks relating to Financial Markets
Exchange rate fluctuations could affect our operating profits
Since significant parts of the Company’s operations are based on imported raw material, active ingredients and finished goods, exchange rate fluctuations can significantly impact the Company’s operations as well as cash flow management. We are particularly sensitive to movements in exchange rates for the Euro and the U.S. dollar. The management policy to manage the currency risk has been described in note 33.1.1 to the financial statements.
Related party transactions
All related party transactions, during the year 2015, were placed before the Audit Committee and the Board for their review and approval. These transactions were duly reviewed by the Audit Committee and approved by the Board in their respective meetings. All these transactions were in line with the transfer pricing methods and the policy with related parties approved by the Board previously. The Company also maintains a full record of all such transactions, along with the terms and conditions. For further details please refer note 31 to the financial statements.
Contribution to the national exchequer
During the year the Company paid around Rs. 810 million to the Government and its various agencies on account of various Government levies including Custom Duty, Income Tax, Sales Tax and Workers Welfare Fund.
Contribution to the country’s economy
At sanofi-aventis, our aim has always been to make
noteworthy contributions to the economy we operate in. One of the primary areas of focus has been the creation of employment opportunities. Supporting a large industrial and sales workforce, we have also been a prominent employment provider through third party contractors.
Our contribution to the corporate social responsibility program has been a cornerstone in the quest towards the improvement of the society at large and specifically to the improvement of healthcare standards. We also prefer buying goods / material from local vendors over imports provided these meet the requisite quality standards in order to support local industry and economy.
Corporate social responsibility
The Company operates in a socially responsible manner and is committed to the highest standards of corporate behavior. CSR is embedded into sanofi-aventis’ core business strategy, focused on the patient at the center of our activity.
The details of our participation in various community support initiatives are mentioned in detail on pages from 30 to 31 of the Annual Report. Information technology
In line with the Company’s continuous endeavors to regularly upgrade information systems we continued to increasingly invest in information technology (IT) and to upgrade related infrastructure along with incorporating automation to the processes. Thereby continuously improving and enhancing both qualitative and quantitative aspects of management reporting including decision making processes.
Product Quality
The Company is committed to and recognizes its responsibility towards patients and the community. Company’s products carry a promise of Quality and we take issues related to the quality of our products very seriously. In order to handle concerns on product quality, a “Quality” page is available on the sanofi-aventis corporate website. Users can use the form on the website or simply email their concerns to the attention of our Country Quality Head at [email protected]
40 Annual Report 2015
Website
All stakeholders and the general public can visit the sanofi-aventis Pakistan limited website, www.sanofi.com.pk, which has a dedicated section for investors containing information related to annual and quarterly financial statements. The website also has Urdu content, as required by the SECP
In addition, information pertaining to Company products, social responsibility initiatives, product quality as well as general health related issues is also given on the website. The Company also maintains a dedicated website on diabetes (www.sanofidiabetes.com.pk) which contains information for public awareness related to diabetes.
Health, Safety & Environment
The Company is committed to maintain the standards of health, safety and environment (HSE) at the highest level. The Company has a dedicated HSE department to oversee the implementation of HSE objectives and reports to the Executive Management. The level of Management’s commitment to HSE standards can be judged from the fact that no major accident was reported during the year.
Environment
The Company has a dedicated Waste Water Treatment Plant (WWTP) to treat effluent. An upgrade project was started in 2014 for improving the efficiency and enhancing the capacity of the existing WWTP. The project will be completed in 2016.
Directors
During and subsequent to the year end, following changes were made in the Board of Directors:
Resignations Effective Date In place ofDr. Pius Hornstein February 13, 2015Mr. Ayub Siddiqui March 24, 2015Mr. Shakeel Mapara June 1, 2015Mr. Mohammad Ibadullah October 7, 2015Mr. Francois Jean Louis Briens October 30, 2015Mr. Jean-Marc Georges October 30, 2015
AppointmentsMr. Patrick Aghanian March 12, 2015 Dr. Pius HornsteinMr. Shakeel Mapara March 25, 2015 Mr. Ayub SiddiquiDr. Asim Jamal June 1, 2015 Mr. Shakeel MaparaMr. Franck Vidor October 30, 2015 Mr. Francois Jean Louis BriensMr. Patrick Chocat October 30, 2015 Mr. Jean-Marc GeorgesMr. Yasser Pirmuhammad January 1, 2016 Mr. Mohammad Ibadullah
Compliance with the Code of Corporate Governance
The Pakistan Stock Exchange (formerly Karachi, Lahore and Islamabad Stock Exchanges) has included in the Listing Rules, the Code of Corporate Governance (‘the Code’) issued by the Securities & Exchange Commission of Pakistan. The Company has adopted the Code and is implementing the same in letter and spirit.
Code of Conduct
Compliance is an integral part of the way of doing business for the Company, which emanates from our Code of Ethics. The Code, which is approved by the Board, is communicated to employees and is available in both English and Urdu languages.
Training on compliance and ethics principles is mandatory for all employees, with additional specialized trainings for certain categories of employees. An e-learning platform is also available to ensure that trainings on code of ethics and other compliance policies are standardized across geographical boundaries.
41
The company has also set up adequate whistle blowing channels, which are communicated to all concerned stakeholders. Internal as well as external stakeholders can communicate their concerns on Compliance at [email protected]
Anti-Corruption Measures
In order to prevent corruption in business dealings by Company employees, an anti-bribery and corruption policy has been implemented. This policy supplements the Company’s Code of Conduct and applies to all employees and to third parties engaged in business with sanofi-aventis Pakistan, such as suppliers, distributors, consultants etc.
Audit committee
The Board Audit Committee comprises of following members:
• Syed Hyder Ali Chairman (Non-Executive Director)• Mr. Franck Vidor Member (Non-Executive Director)• Mr. Javed Iqbal Member (Independent Director)
The position of the secretary, which was occupied by the head of internal audit, is currently vacant.
Human Resource & Remuneration Committee
The Human Resource & Remuneration Committee comprises of the following members:
• Mr. Arshad Ali Gohar Chairman (Non-Executive Director)• Syed Hyder Ali Member (Non-Executive Director)• Dr. Asim Jamal Member (Executive Director - CEO)• Mr. Shakeel Mapara Secretary
Pattern of shareholding
A statement of the pattern of shareholding is given on page 88 to the financial statements.
Earnings per share
The earnings per share after tax was Rs.6.89.
Holding Company
The Company is a subsidiary of SECIPE, France, holding 5,099,469 (2014: 5,099,469) ordinary shares of Rs.10 each constituting 52.88% of the issued share capital of the Company. The ultimate parent of the Group is Sanofi S.A., France.
Auditors
The present external auditors, M/s Ernst & Young Ford Rhodes Sidat Hyder, Chartered Accountants have completed the annual audit for the year ended December 31, 2015 and have issued an unqualified report. The auditors shall retire at the conclusion of Annual General Meeting on April 25, 2016 and being eligible; have offered themselves for reappointment for the year 2016. As suggested by the Audit Committee, the Board recommends their reappointment for the year ending December 31, 2016.
Corporate and financial reporting framework
• The financial statements, prepared by the management of the Company, present fairly, its state of affairs, the result of its operations, cash flows and changes in equity.
• Proper books of account of the Company have been maintained
• Accounting policies have been consistently applied in the accounts in preparation of the financial statements and accounting estimates are based on reasonable and prudent judgment.
• International Financial Reporting Standards, as applicable in Pakistan, have been followed in the preparation of financial statements and any departure therefrom has been adequately disclosed.
• The system of internal control is sound in design and has been effectively implemented and monitored.
• There are no significant doubts regarding the Company’s ability to continue as a going concern.
• There has been no material departure from the best practices of corporate governance as detailed in the Listing Regulations.
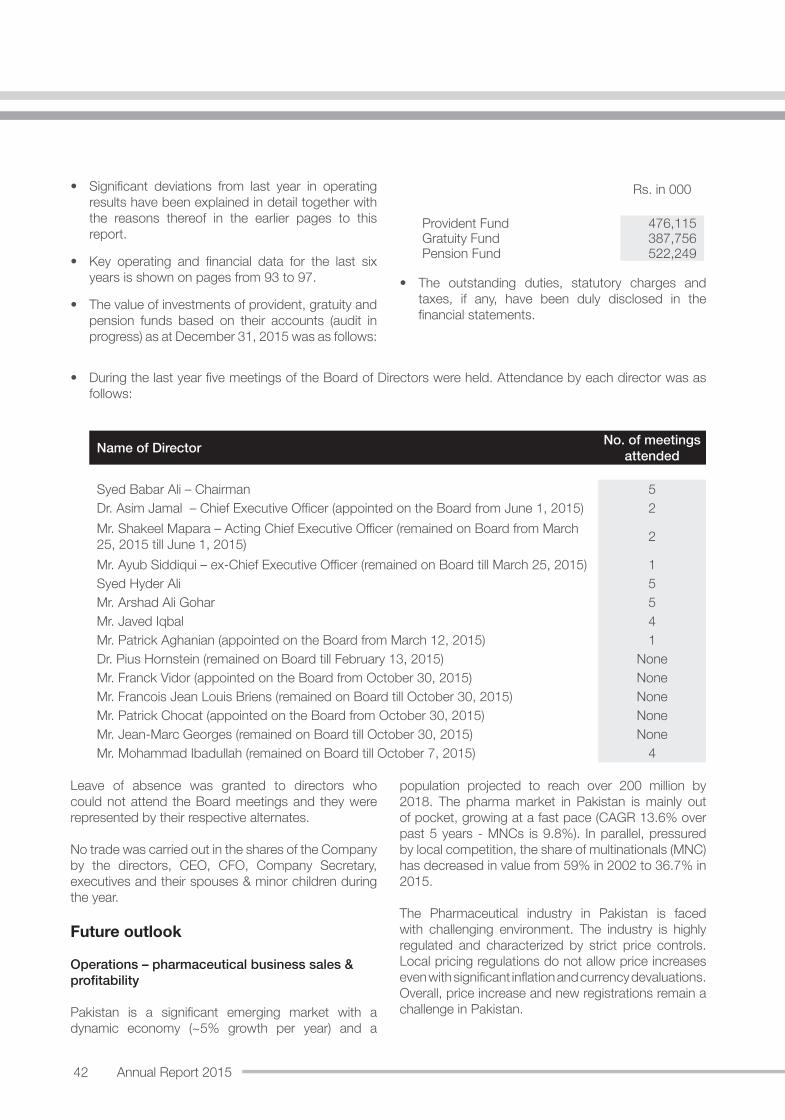
42 Annual Report 2015
• Significant deviations from last year in operating results have been explained in detail together with the reasons thereof in the earlier pages to this report.
• Key operating and financial data for the last six years is shown on pages from 93 to 97.
• The value of investments of provident, gratuity and pension funds based on their accounts (audit in progress) as at December 31, 2015 was as follows:
Rs. in 000
Provident Fund 476,115Gratuity Fund 387,756Pension Fund 522,249
• The outstanding duties, statutory charges and taxes, if any, have been duly disclosed in the financial statements.
• During the last year five meetings of the Board of Directors were held. Attendance by each director was as follows:
Name of Director No. of meetings attended
Syed Babar Ali – Chairman 5Dr. Asim Jamal – Chief Executive Officer (appointed on the Board from June 1, 2015) 2Mr. Shakeel Mapara – Acting Chief Executive Officer (remained on Board from March 25, 2015 till June 1, 2015) 2
Mr. Ayub Siddiqui – ex-Chief Executive Officer (remained on Board till March 25, 2015) 1Syed Hyder Ali 5Mr. Arshad Ali Gohar 5Mr. Javed Iqbal 4Mr. Patrick Aghanian (appointed on the Board from March 12, 2015) 1Dr. Pius Hornstein (remained on Board till February 13, 2015) NoneMr. Franck Vidor (appointed on the Board from October 30, 2015) NoneMr. Francois Jean Louis Briens (remained on Board till October 30, 2015) NoneMr. Patrick Chocat (appointed on the Board from October 30, 2015) NoneMr. Jean-Marc Georges (remained on Board till October 30, 2015) NoneMr. Mohammad Ibadullah (remained on Board till October 7, 2015) 4
Leave of absence was granted to directors who could not attend the Board meetings and they were represented by their respective alternates.
No trade was carried out in the shares of the Company by the directors, CEO, CFO, Company Secretary, executives and their spouses & minor children during the year.
Future outlook
Operations – pharmaceutical business sales & profitability
Pakistan is a significant emerging market with a dynamic economy (~5% growth per year) and a
population projected to reach over 200 million by 2018. The pharma market in Pakistan is mainly out of pocket, growing at a fast pace (CAGR 13.6% over past 5 years - MNCs is 9.8%). In parallel, pressured by local competition, the share of multinationals (MNC) has decreased in value from 59% in 2002 to 36.7% in 2015.
The Pharmaceutical industry in Pakistan is faced with challenging environment. The industry is highly regulated and characterized by strict price controls. Local pricing regulations do not allow price increases even with significant inflation and currency devaluations. Overall, price increase and new registrations remain a challenge in Pakistan.
43
Cash flow management
The Company devotes utmost importance to cash flow management and regularly monitors its day to day working capital requirements which are financed through cash flows from operating activities as well as externally committed funding facilities. The Company’s gearing ratio as of December 31, 2015 at 54% improved over last year mainly due to higher cash inflows from operations backed by decrease in working capital requirements as well as capital expenditure.
General
The Board looks forward to the forthcoming Annual General Meeting of the shareholders to discuss Company’s performance during the year 2015, and is thankful for the trust and confidence reposed in the Board by the shareholders.
The Board would like to take this opportunity to acknowledge and thank all the stakeholders, employees, customers, suppliers, shareholders, bankers and all others for their continued support and loyalty.
By order of the Board
Syed Babar Ali Dr. Asim Jamal Chairman Chief Executive Officer & Managing Director
Karachi: February 24, 2016
44 Annual Report 2015
AUDITORS’ REPORT TO THE MEMBERSWe have audited the annexed balance sheet of sanofi-aventis Pakistan Limited as at 31 December 2015 and the related profit and loss account, statement of comprehensive income, cash flow statement and statement of changes in equity together with the notes forming part thereof, for the year then ended and we state that we have obtained all the information and explanations which, to the best of our knowledge and belief, were necessary for the purposes of our audit.
It is the responsibility of the Company’s management to establish and maintain a system of internal control, and prepare and present the above said statements in conformity with the approved accounting standards and the requirements of the Companies Ordinance, 1984. Our responsibility is to express an opinion on these statements based on our audit.
We conducted our audit in accordance with the auditing standards as applicable in Pakistan. These standards require that we plan and perform the audit to obtain reasonable assurance about whether the above said statements are free of any material misstatement. An audit includes examining on a test basis, evidence supporting the amounts and disclosures in the above said statements. An audit also includes assessing the accounting policies and significant estimates made by management, as well as, evaluating the overall presentation of the above said statements. We believe that our audit provides a reasonable basis for our opinion and, after due verification, we report that: a) in our opinion, proper books of account have been kept by the Company as required by the Companies Ordinance,
1984;
b) in our opinion:
i) the balance sheet and profit and loss account, together with the notes thereon, have been drawn up in conformity with the Companies Ordinance, 1984, and are in agreement with the books of account and are further in accordance with accounting policies consistently applied except for the changes stated in note 2.3 to the accompanying financial statements with which we concur;
ii) the expenditure incurred during the year was for the purpose of the Company’s business; and
iii) the business conducted, investments made and the expenditure incurred during the year were in accordance with the objects of the Company;
c) in our opinion and to the best of our information and according to the explanations given to us, the balance sheet, profit and loss account, statement of comprehensive income, cash flow statement and statement of changes in equity together with the notes forming part thereof conform with approved accounting standards as applicable in Pakistan, and, gives the information required by the Companies Ordinance, 1984, in the manner so required and respectively give a true and fair view of the state of the Company’s affairs as at 31 December 2015 and of the profit, the comprehensive income, its cash flows and changes in equity for the year then ended; and
d) in our opinion, Zakat deductible at source under the Zakat and Ushr Ordinance, 1980 (XVIII of 1980), was deducted by the Company and deposited in the Central Zakat Fund established under Section 7 of that Ordinance.
Chartered AccountantsAudit Engagement Partner: Riaz A. Rehman ChamdiaDate: 24 February 2016Place: Karachi

FINANCIAL STATEMENTS
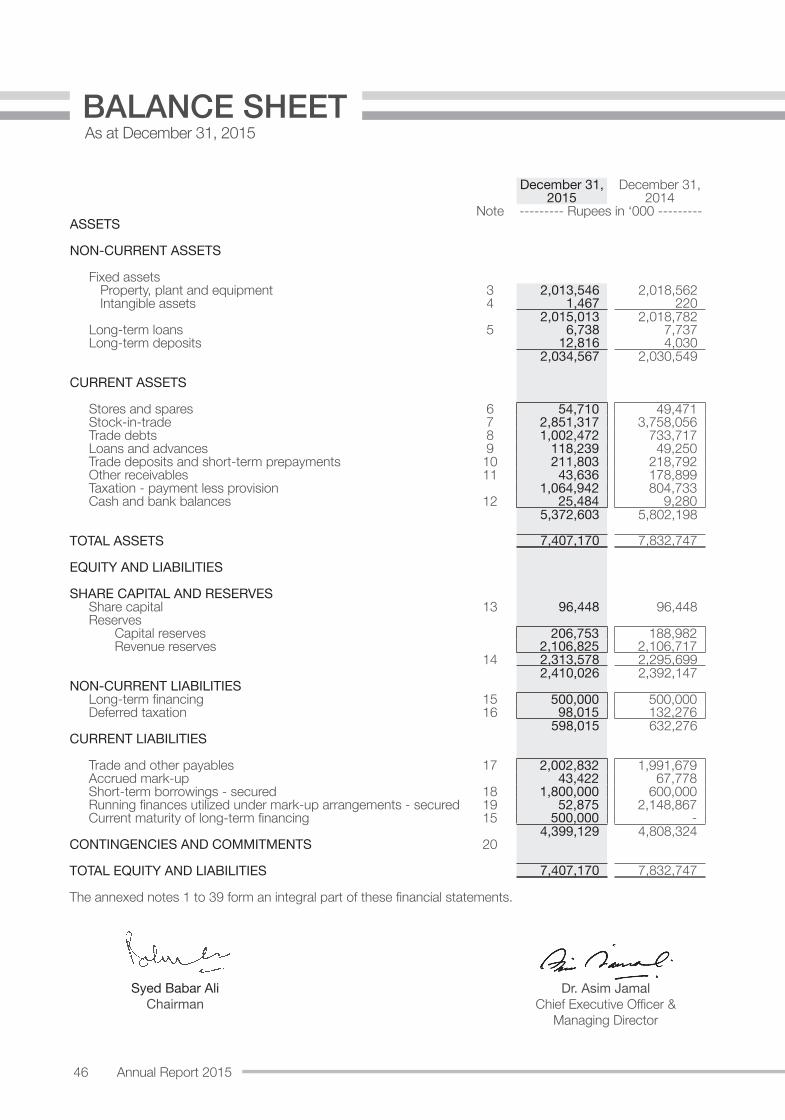
46 Annual Report 2015
BALANCE SHEETAs at December 31, 2015
December 31, December 31,2015 2014
Note --------- Rupees in ‘000 ---------ASSETS
NON-CURRENT ASSETS
Fixed assetsProperty, plant and equipment 3 2,013,546 2,018,562 Intangible assets 4 1,467 220
2,015,013 2,018,782 Long-term loans 5 6,738 7,737 Long-term deposits 12,816 4,030
2,034,567 2,030,549
CURRENT ASSETS
Stores and spares 6 54,710 49,471 Stock-in-trade 7 2,851,317 3,758,056 Trade debts 8 1,002,472 733,717 Loans and advances 9 118,239 49,250 Trade deposits and short-term prepayments 10 211,803 218,792 Other receivables 11 43,636 178,899 Taxation - payment less provision 1,064,942 804,733 Cash and bank balances 12 25,484 9,280
5,372,603 5,802,198
TOTAL ASSETS 7,407,170 7,832,747
EQUITY AND LIABILITIES
SHARE CAPITAL AND RESERVESShare capital 13 96,448 96,448 Reserves Capital reserves 206,753 188,982 Revenue reserves 2,106,825 2,106,717
14 2,313,578 2,295,699 2,410,026 2,392,147
NON-CURRENT LIABILITIESLong-term financing 15 500,000 500,000 Deferred taxation 16 98,015 132,276
598,015 632,276 CURRENT LIABILITIES
Trade and other payables 17 2,002,832 1,991,679 Accrued mark-up 43,422 67,778 Short-term borrowings - secured 18 1,800,000 600,000 Running finances utilized under mark-up arrangements - secured 19 52,875 2,148,867 Current maturity of long-term financing 15 500,000 -
4,399,129 4,808,324 CONTINGENCIES AND COMMITMENTS 20
TOTAL EQUITY AND LIABILITIES 7,407,170 7,832,747
The annexed notes 1 to 39 form an integral part of these financial statements.
Syed Babar AliChairman
Dr. Asim JamalChief Executive Officer &
Managing Director
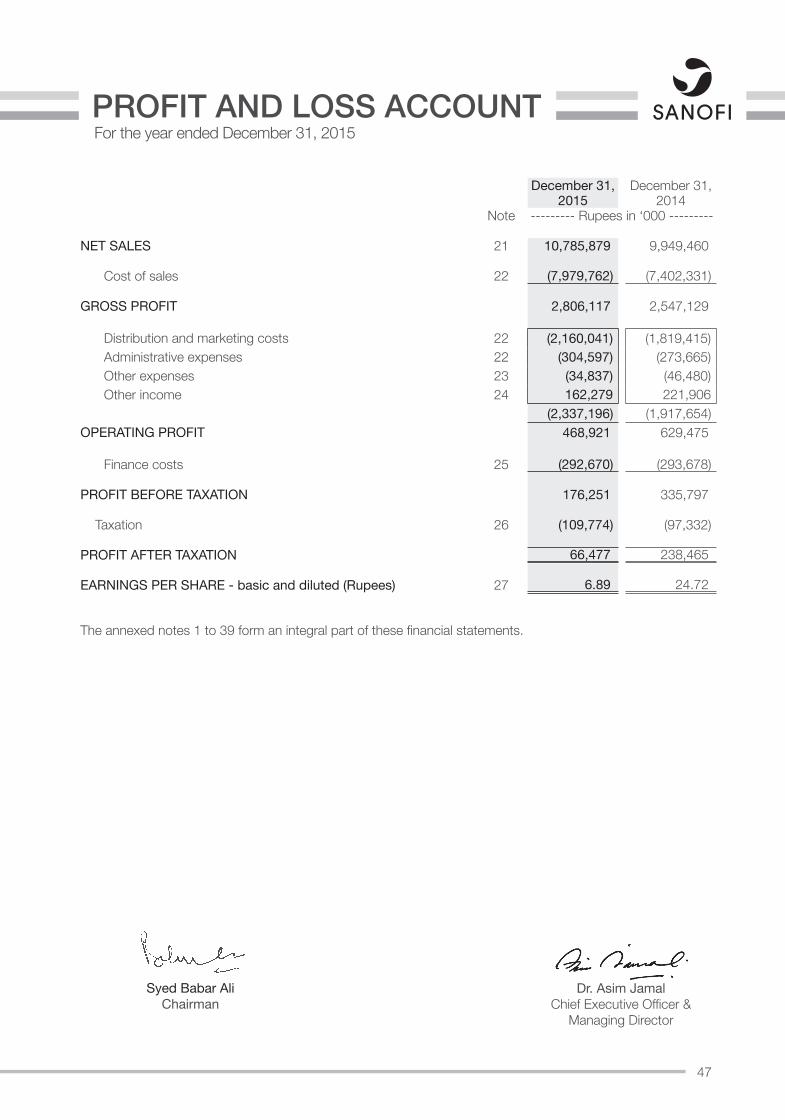
47
For the year ended December 31, 2015PROFIT AND LOSS ACCOUNT
December 31, December 31,2015 2014
Note --------- Rupees in ‘000 ---------
NET SALES 21 10,785,879 9,949,460
Cost of sales 22 (7,979,762) (7,402,331)
GROSS PROFIT 2,806,117 2,547,129
Distribution and marketing costs 22 (2,160,041) (1,819,415)Administrative expenses 22 (304,597) (273,665)Other expenses 23 (34,837) (46,480)Other income 24 162,279 221,906
(2,337,196) (1,917,654)OPERATING PROFIT 468,921 629,475
Finance costs 25 (292,670) (293,678)
PROFIT BEFORE TAXATION 176,251 335,797
Taxation 26 (109,774) (97,332)
PROFIT AFTER TAXATION 66,477 238,465
EARNINGS PER SHARE - basic and diluted (Rupees) 27 6.89 24.72
The annexed notes 1 to 39 form an integral part of these financial statements.
Syed Babar AliChairman
Dr. Asim JamalChief Executive Officer &
Managing Director
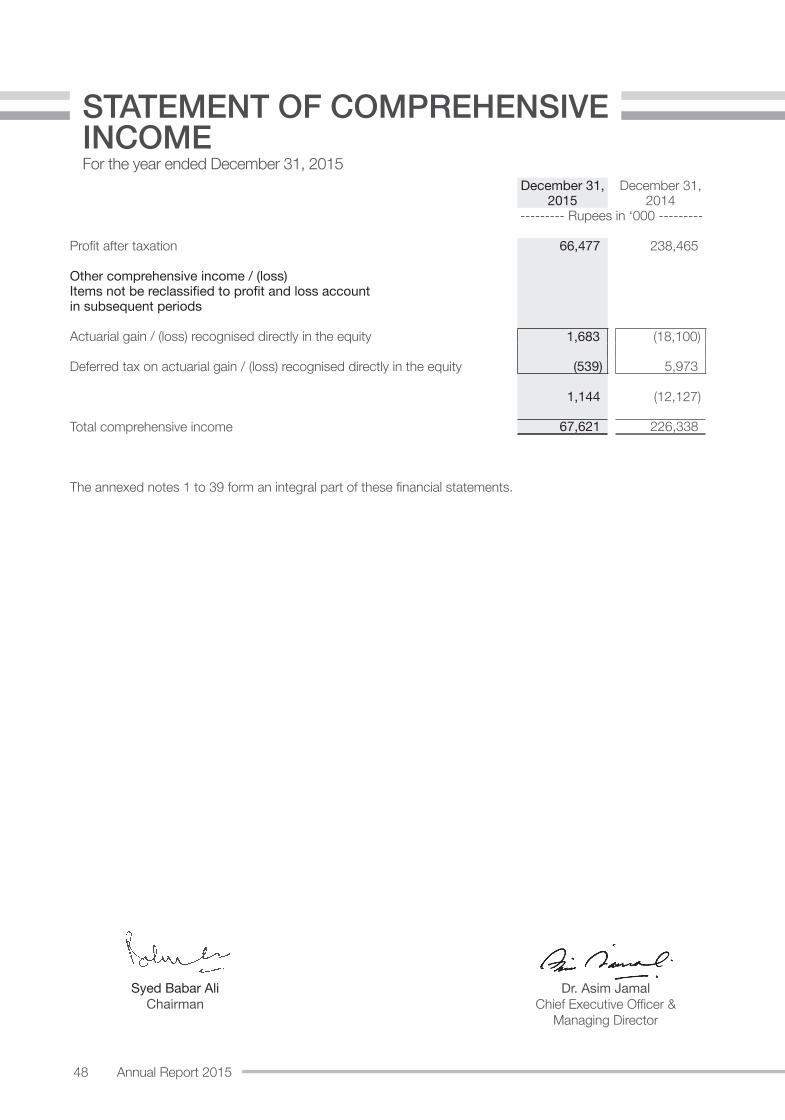
48 Annual Report 2015
STATEMENT OF COMPREHENSIVE INCOME For the year ended December 31, 2015
December 31, December 31,2015 2014
--------- Rupees in ‘000 ---------
Profit after taxation 66,477 238,465
Other comprehensive income / (loss)Items not be reclassified to profit and loss account in subsequent periods
Actuarial gain / (loss) recognised directly in the equity 1,683 (18,100)
Deferred tax on actuarial gain / (loss) recognised directly in the equity (539) 5,973
1,144 (12,127)
Total comprehensive income 67,621 226,338
The annexed notes 1 to 39 form an integral part of these financial statements.
Syed Babar AliChairman
Dr. Asim JamalChief Executive Officer &
Managing Director
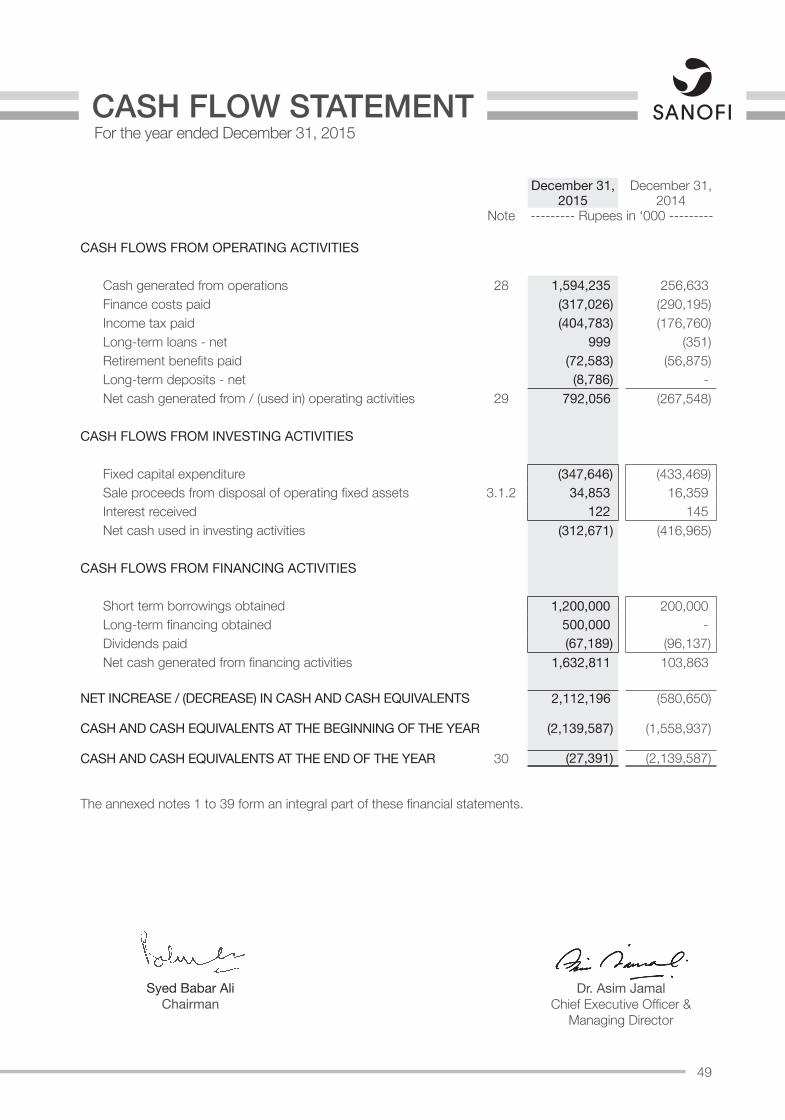
49
For the year ended December 31, 2015CASH FLOW STATEMENT
December 31, December 31,2015 2014
Note --------- Rupees in ‘000 ---------
CASH FLOWS FROM OPERATING ACTIVITIES
Cash generated from operations 28 1,594,235 256,633 Finance costs paid (317,026) (290,195)Income tax paid (404,783) (176,760)Long-term loans - net 999 (351)Retirement benefits paid (72,583) (56,875)Long-term deposits - net (8,786) - Net cash generated from / (used in) operating activities 29 792,056 (267,548)
CASH FLOWS FROM INVESTING ACTIVITIES
Fixed capital expenditure (347,646) (433,469)Sale proceeds from disposal of operating fixed assets 3.1.2 34,853 16,359 Interest received 122 145 Net cash used in investing activities (312,671) (416,965)
CASH FLOWS FROM FINANCING ACTIVITIES
Short term borrowings obtained 1,200,000 200,000 Long-term financing obtained 500,000 - Dividends paid (67,189) (96,137)Net cash generated from financing activities 1,632,811 103,863
NET INCREASE / (DECREASE) IN CASH AND CASH EQUIVALENTS 2,112,196 (580,650)
CASH AND CASH EQUIVALENTS AT THE BEGINNING OF THE YEAR (2,139,587) (1,558,937)
CASH AND CASH EQUIVALENTS AT THE END OF THE YEAR 30 (27,391) (2,139,587)
The annexed notes 1 to 39 form an integral part of these financial statements.
Syed Babar AliChairman
Dr. Asim JamalChief Executive Officer &
Managing Director
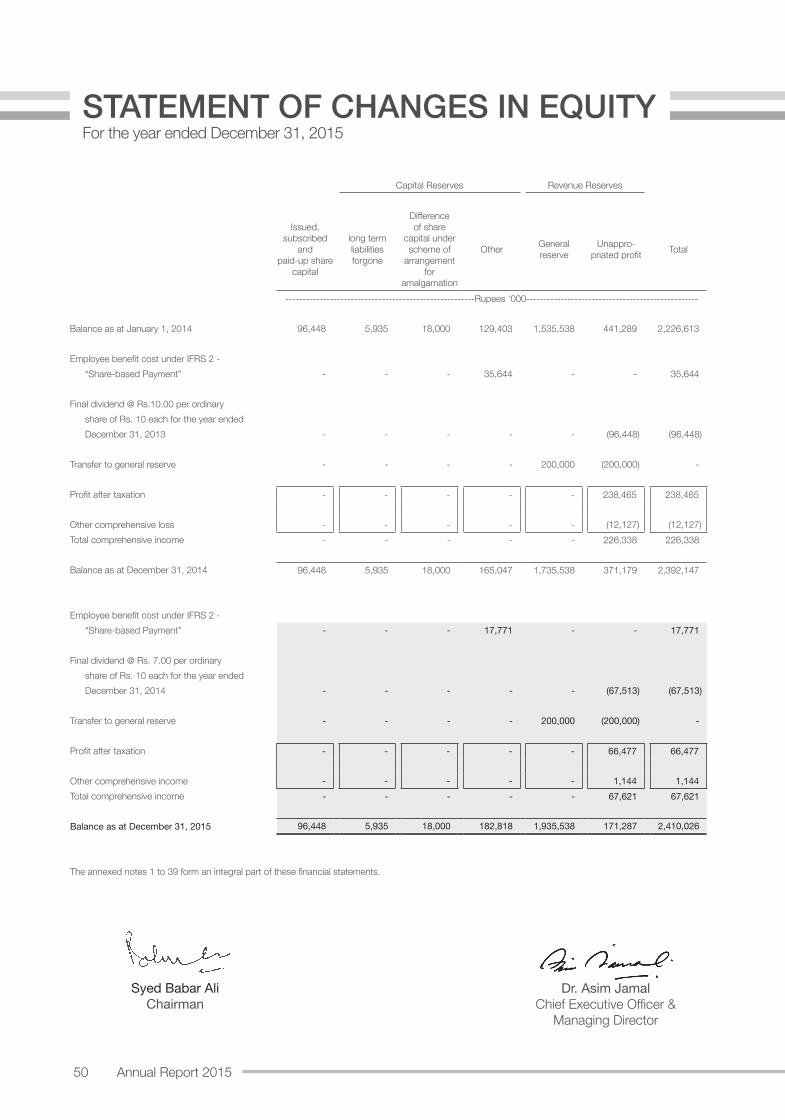
50 Annual Report 2015
STATEMENT OF CHANGES IN EQUITY For the year ended December 31, 2015
Capital Reserves Revenue Reserves
Issued, subscribed
and paid-up share
capital
long term liabilities forgone
Difference of share
capital under scheme of
arrangement for
amalgamation
Other General reserve
Unappro-priated profit Total
-------------------------------------------------------Rupees ‘000--------------------------------------------------
Balance as at January 1, 2014 96,448 5,935 18,000 129,403 1,535,538 441,289 2,226,613
Employee benefit cost under IFRS 2 -“Share-based Payment” - - - 35,644 - - 35,644
Final dividend @ Rs.10.00 per ordinary share of Rs. 10 each for the year endedDecember 31, 2013 - - - - - (96,448) (96,448)
Transfer to general reserve - - - - 200,000 (200,000) -
Profit after taxation - - - - - 238,465 238,465
Other comprehensive loss - - - - - (12,127) (12,127)Total comprehensive income - - - - - 226,338 226,338
Balance as at December 31, 2014 96,448 5,935 18,000 165,047 1,735,538 371,179 2,392,147
Employee benefit cost under IFRS 2 -“Share-based Payment” - - - 17,771 - - 17,771
Final dividend @ Rs. 7.00 per ordinary share of Rs. 10 each for the year endedDecember 31, 2014 - - - - - (67,513) (67,513)
Transfer to general reserve - - - - 200,000 (200,000) -
Profit after taxation - - - - - 66,477 66,477
Other comprehensive income - - - - - 1,144 1,144 Total comprehensive income - - - - - 67,621 67,621
Balance as at December 31, 2015 96,448 5,935 18,000 182,818 1,935,538 171,287 2,410,026
The annexed notes 1 to 39 form an integral part of these financial statements.
Syed Babar AliChairman
Dr. Asim JamalChief Executive Officer &
Managing Director
51
For the year ended December 31, 2015
NOTES TO THE FINANCIAL STATEMENTS
1. THE COMPANY AND ITS OPERATIONS
The Company was incorporated in Pakistan in 1967 under the Companies Act, VII of 1913 (now the Companies Ordinance, 1984), as a Public Limited Company. The shares of the Company are listed on Pakistan Stock Exchange (formerly Karachi, Lahore and Islamabad Stock Exchanges). It is engaged in the manufacturing and selling of pharmaceutical and consumer products. The registered office of the Company is located at Plot 23, Sector 22, Korangi Industrial Area, Karachi.
2. SUMMARY OF SIGNIFICANT ACCOUNTING POLICIES
2.1 Statement of compliance
These financial statements have been prepared in accordance with approved accounting standards as applicable in Pakistan. Approved accounting standards comprise of such International Financial Reporting Standards (IFRS) issued by the International Accounting Standards Board as are notified under the Companies Ordinance, 1984, provisions of and directives issued under the Companies Ordinance, 1984. In case requirements differ, the provisions or directives of the Companies Ordinance, 1984 shall prevail.
2.2 Basis of preparation
These financial statements have been prepared under the historical cost convention except as disclosed in the accounting policies herein below.
2.3 Adoption of ammended standards
The accounting policies adopted in the preparation of these financial statements are consistent with those of the previous financial year except as described below:
New Standards, Interpretations and Ammendments
The Company has adopted the following accounting standards and the amendments and interpretation of IFRSs which became effective for the current year:
IFRS 10 - Consolidated Financial StatementsIFRS 11 - Joint ArrangementsIFRS 12 - Disclosure of Interests in Other EntitiesIFRS 13 - Fair Value MeasurementIAS 19 - Employee Benefits – (Amendment) - Defined Benefit Plans: Employee Contributions
Improvements to Accounting Standards Issued by the IASB in December 2013
IFRS 2 - Share-based Payment - Definitions of vesting conditions
IFRS 3 - Business Combinations – Accounting for contingent consideration in a business combination
IFRS 3 - Business Combinations - Scope exceptions for joint ventures
IFRS 8 - Operating Segments – Aggregation of operating segments
IFRS 8 - Reconciliation of the total of the reportable segments’ assets to the entity’s assets
IFRS 13 - Fair Value Measurement - Scope of paragraph 52 (portfolio exception)
IAS 16 & - Property, Plant and Equipment & Intangible Assets – Revaluation method – proportionate restatement of accumulated depreciation / amortisationIAS 38
52 Annual Report 2015
IAS 24 - Related Party Disclosures - Key management personnel
IAS 40 - Investment Property - Interrelationship between IFRS 3 and IAS 40 (ancillary services)
The adoption of the above amendments, improvements to accounting standards and interpretations did not have any material effect on the financial statements.
2.4 Property, plant and equipment
(i) Operating fixed assets
These are stated at cost less accumulated depreciation, except for capital work-in-progress, which is stated at cost.
Cost of leasehold land is amortised over the period of the lease. Depreciation on all other assets is charged to profit and loss account applying the straight-line method whereby the cost of an asset less residual value, if not insignificant, is written off over its estimated useful life. The rates used are stated in note 3.1 to the financial statements.
In respect of additions, depreciation is charged from the month in which asset is put to use and on disposal up to the month the asset is in use. Additional depreciation at the rate of fifty percent of the normal rate is charged on such machinery which is operated on double shift during the year.
The assets’ residual values, useful lives and methods are reviewed, and adjusted if appropriate, at each financial year end. The effect of any adjustment to residual values, useful lives and methods is recognised prospectively as a change of accounting estimate.
The carrying values of property, plant and equipment are reviewed for impairment when events or changes in circumstances indicate that the carrying value may not be recoverable. The Company accounts for impairment by reducing its carrying value to the recoverable amount.
An item of property, plant and equipment is derecognised upon disposal or when no future economic benefits are expected from its use or disposal. Any gain or loss arising on derecognition of the asset is included in the profit and loss account in the year the asset is derecognised.
Subsequent costs are not recognised as assets unless it is probable that future economic benefits associated with these costs will flow to the Company and the cost can be measured reliably.
Maintenance and normal repairs are charged to profit and loss account as and when incurred.
(ii) Capital work-in-progress
Capital work-in-progress is stated at cost less impairment in value, if any. It consists of expenditure incurred and advances made in respect of tangible fixed assets in the course of their construction and installation.
2.5 Intangible asset – computer software and product license
Computer software licenses acquired by the Company are stated at cost less accumulated amortization. Cost represents the cost incurred to acquire the software licenses and bring them to use. The cost of computer software is amortised over the estimated useful life as disclosed in note 4 to the financial statements.
For the year ended December 31, 2015
NOTES TO THE FINANCIAL STATEMENTS
53
Cost associated with maintaining computer software are charged to profit and loss account.
Separately acquired product licenses are shown at historical cost. These have a finite useful life and are carried at cost less accumulated amortisation. Amortisation is calculated using the straight-line method to allocate the cost of product licenses over their estimated useful lives as disclosed in note 4 to the financial statements.
The useful lives of intangible assets are reviewed at each reporting date. The effect of any adjustment to useful lives is recognised prospectively as a change of accounting estimate.
2.6 Long-term loans and deposits
Long-term loans and deposits are stated at cost less an allowance for uncollectible amounts, if any.
2.7 Stores and spares
These are valued at cost less provision for slow moving and obsolete stores and spares. Cost is determined on moving average basis, except for the stores and spares in transit, which are stated at invoice price plus other charges incurred thereon up to the balance sheet date. Value of items are reviewed at each balance sheet date to record provision for any slow moving items, where necessary.
2.8 Stock-in-trade
These are valued at lower of cost and net realisable value. Goods in transit are valued at cost, comprising invoice price plus other charges incurred thereon up to the balance sheet date. Cost signifies standard costs adjusted by variances.
Cost in relation to work-in-process and finished goods represent direct cost of materials, direct wages and appropriate manufacturing overheads.
Net realisable value signifies the estimated selling price in the ordinary course of business less estimated costs necessarily to be incurred to make the sale. Provision is made for slow moving and expired stock where necessary.
2.9 Trade debts and other receivables
These are recognised and carried at original invoice amount, being the fair value, less an allowance for any uncollectible amounts, if any. An estimate for doubtful debts is made when collection is no longer probable. Bad debts are written-off when identified.
2.10 Employees benefits
Defined benefit plans
The Company operates an approved funded gratuity scheme and an approved funded non-contributory pension scheme in respect of all permanent employees and senior management staff respectively excluding expatriates. The schemes define the amounts of benefit that an employee will receive on or after retirement subject to a minimum qualifying period of service under the schemes.
The amounts of retirement benefits are usually dependent on one or more factors such as age, years of service and salary.
The liabilities recognised in respect of gratuity and pension schemes are the present values of the defined benefit obligations under each scheme at the balance sheet date less the fair value of respective plan assets.
54 Annual Report 2015
The gratuity and pension obligations are calculated annually by independent actuaries using the Projected Unit Credit Method. The most recent valuation in this regard was carried out as at December 31, 2015. The present values of the obligations are determined by discounting the estimated future cash outflows using interest rates of high quality government securities that have terms to maturity approximating to the terms of the related obligations.
Actuarial gains and losses arising from experience adjustments and changes in actuarial assumptions are recognised directly in equity in the statement of comprehensive income in the period in which they arise. All past service costs are recognised at the earlier of when the amendments or curtailment occurs and when the Company has recognised related retirement or termination benefits.
Defined contribution plan
The Company also operates a recognised provident fund scheme for all permanent employees excluding expatriates. Equal monthly contributions are made, both by the Company and the employees, to the fund at the rate of 10 percent of basic salary.
2.11 Taxation
Current
The charge for current taxation is based on taxable income at the current rates of taxation in accordance with Income Tax Ordinance, 2001.
Deferred
Deferred tax is recognised using the liability method, on all major temporary differences at the balance sheet date between the tax base of assets and liabilities and their carrying amounts for financial reporting purposes.
Deferred income tax assets are recognised for all deductible temporary differences and carry-forward of unused tax losses, to the extent that it is probable that taxable profit will be available against which the deductible temporary differences and / or carry-forward of unused tax losses can be utilized.
The carrying amount of all deferred tax assets is reviewed at each balance sheet date and reduced to the extent that it is no longer probable that sufficient taxable profits will be available to allow all or part of the deferred tax assets to be utilized.
Deferred income tax assets and liabilities are measured at the tax rates that are expected to apply to the period when the asset is realized or the liability is settled, based on tax rates (and tax laws) that have been enacted or substantively enacted at the balance sheet date.
Deferred tax is charged or credited in the profit and loss account except for deferred tax arising on recognition of actuarial loss or gain which is charged or directly credited to equity in the statement of comprehensive income.
2.12 Cash and cash equivalents
Cash and cash equivalents are carried in the balance sheet at cost. For the purpose of cash flow statement, cash and cash equivalents represent balances with banks net of outstanding balance of running finance facilities availed by the Company.
For the year ended December 31, 2015
NOTES TO THE FINANCIAL STATEMENTS
55
2.13 Impairment
Financial assets
A financial asset is assessed at each reporting date to determine whether there is any objective evidence that it is impaired. A financial asset is considered to be impaired if objective evidence indicates that one or more events have had a negative effect of the estimated future cash flows of that asset.
Non-Financial assets
Carrying value of non-financial assets other than inventories and deferred tax assets are assessed at each reporting date to determine whether there is any indication of impairment. If any such indications exist, then the recoverable amount is estimated. An impairment loss is recognised, as an expense in the profit and loss account, for the amount by which an asset’s carrying amount exceeds its recoverable amount. The recoverable amount is the higher of an asset’s fair value less cost to sell and value in use. Value in use is determined through discounting of the estimated future cash flows using a discount rate that reflects current market assessments of the time value of money and risks specific to the assets. For the purpose of assessing impairment, assets are grouped at the lowest levels for which there are separately identifiable cash flows (cash generating units).
2.14 Trade and other payables
Liabilities for trade and other amounts payable are carried at cost which is the fair value of the consideration to be paid in the future for goods and services received, whether or not billed to the Company.
2.15 Compensated absences
The Company accounts for the liability in respect of employees’ compensated absences in the year in which these are earned. Provisions to cover the obligations are made using the current salary levels of employees.
2.16 Provisions
Provisions are recognised when the Company has a present legal or constructive obligation as a result of a past event, it is probable that an outflow of resources embodying economic benefits will be required to settle the obligation and a reliable estimate can be made of the amount of obligation.
2.17 Foreign currency translation
The financial statements are presented in Pak Rupee, which is the Company’s functional and presentation currency. Foreign currency transactions during the year are recorded at the exchange rates approximating those ruling on the date of the transaction. Monetary assets and liabilities in foreign currencies are translated at the rates of exchange which approximate those prevailing on the balance sheet date. Gains and losses on translation are taken to income currently. Non-monetary items that are measured in terms of historical cost in a foreign currency are translated using the exchange rates as at the dates of the initial transactions. Non-monetary items measured at fair value in a foreign currency are translated using the exchange rates at the date when the fair value was determined.
2.18 Borrowings
Borrowings are recognised initially at fair value, net of transaction costs incurred and are subsequently measured at amortized cost using the effective interest method.
56 Annual Report 2015
Borrowings are classified as current liabilities unless the Company has an unconditional / contractual right to defer settlement of the liability for at least twelve months after the balance sheet date.
2.19 Revenue recognition
- Sales and toll manufacturing income are recorded on dispatch of goods;- Return on deposits is recognised on accrual basis; and- License fee is recognised on accrual basis.
2.20 Borrowing costs
Borrowing costs that are directly attributable to the acquisition, construction or production of an asset that necessarily takes a substantial period of time to get ready for its intended use or sale are capitalized as part of the cost of the respective assets. All other borrowing costs are expensed out in the period they occur. Borrowing costs consist of interest and other cost that an entity incurs in connection with the borrowing of funds.
2.21 Financial instruments
All the financial assets and financial liabilities are recognised at the time when the Company becomes a party to the contractual provisions of the instrument. Financial assets are derecognised at the time when the Company loses control of the contractual rights that comprise the financial assets. All financial liabilities are derecognised at the time when they are extinguished that is, when the obligation specified in the contract is discharged, cancelled, or expires. Any gains or losses on derecognition of financial assets and financial liabilities are taken to profit and loss account currently.
2.22 Derivative financial instruments and hedging activities
Derivatives are initially recognised at fair value on the date a derivative contract is entered into and are subsequently re-measured at their fair value at each reporting date. The Company enters into derivative transactions mainly to hedge foreign currency liabilities or firm commitments and these are designated as fair value hedge.
Changes in the fair value of derivatives that are designated and qualify as fair value hedges are recorded in the profit and loss account, together with any changes in fair value of the hedged liability that are attributable to the hedged risk.
2.23 Off-setting of financial instruments
A financial asset and a financial liability is offset and the net amount is reported in the balance sheet if the Company has a legally enforceable right to set-off the recognised amounts and intends either to settle on a net basis or to realise the asset and settle the liability simultaneously.
2.24 Share-based compensation
The economic cost of awarding shares of Group Companies to employees is reflected by recording a charge in the profit and loss account, equivalent to the fair value of shares on the grant date over the vesting period, with a corresponding reserve created to reflect the equity component.
2.25 Operating segments
For management purposes, the activities of the Company are organized into one operating segment i.e., manufacturing and selling of pharmaceutical and consumer products. The Company operates in the said reportable operating segment based on the nature of the products, risks and returns, organizational and management structure, and internal financial reporting systems. Accordingly, the figures reported in the financial statements are related to the Company’s only reportable segment.
For the year ended December 31, 2015
NOTES TO THE FINANCIAL STATEMENTS
57
2.26 Significant accounting judgments and estimates
The preparation of the Company’s financial statements requires management to make judgments, estimates and assumptions that affect the reported amounts of revenues, expenses, assets and liabilities, and the disclosure of contingent liabilities, at the end of the reporting period. However, uncertainty about these assumptions and estimates could result in outcomes that require a material adjustment to the carrying amount of the asset or liability affected in future periods.
In the process of applying the accounting policies, management has made the following judgments, estimates and assumption which are significant to the financial statements:
(i) Property, plant and equipment
The Company reviews appropriateness of the rate of depreciation, useful life and residual value used in the calculation of depreciation. Further, where applicable, an estimate of the recoverable amount of assets is made for possible impairment on an annual basis. In making these estimates, Company uses the technical resources available with the Company. Any change in the estimates in the future might affect the carrying amount of respective item of property, plant and equipment, with corresponding effects on the depreciation charge and impairment.
(ii) Stock-in-trade and stores and spares
The Company reviews the net realizable value of stock-in-trade and stores and spares to assess any diminution in the respective carrying values and also review the inventories for obsolescence.
(iii) Provision for doubtful debts and stocks
The Company has used judgements, based on the history of the transactions, for making provisions against doubtful debts whereas provision for stocks is based on the current market conditions.
(iv) Post retirement benefits
The Company has post retirement benefit obligations, which are determined through actuarial valuations using various assumptions as disclosed in note 17.1. Management believes that the changes in assumptions will not have significant effect on the financial statements.
(v) Share-based compensation plans
The Company has share-based transactions involving group companies shares accounted for using various assumptions as disclosed in note 14.1. Management believes that the changes in assumptions will not have significant effect on the financial statements.
(vi) Taxation
The Company takes into account the current income tax laws and decisions taken by appellate authorities while recognizing provision for income tax. The amounts have not been provided for matters, disclosed in note 20.1.2, where the Company’s view differs from the view taken by the income tax department at the assessment stage and where the Company considers that the matters in appeals will be decided in favour of the Company. Management believes that if the final outcome of the cases differs from the management’s assessment, such differences will impact the income tax provision in the period in which such determination is made.
58 Annual Report 2015
For the year ended December 31, 2015
NOTES TO THE FINANCIAL STATEMENTS
(vii) Contingencies
The assessment of the contingencies inherently involves the exercise of significant judgment as the outcome of the future events cannot be predicted with certainty. The Company, based on the availability of the latest information, estimates the value of contingent assets and liabilities, which may differ on the occurrence / non-occurrence of the uncertain future event(s).
Estimates and judgments are continually evaluated and are based on historical experience and other factors, including expectations of future event that are believed to be reasonable under the circumstances. Revisions to accounting estimates are recognised in the period in which the estimate is revised and in any future periods affected.
2.27 Standards, interpretations and amendments to approved accounting standards that are not yet effective
The following standards, amendments and interpretations with respect to the approved accounting standards as applicable in Pakistan would be effective from the dates mentioned below against the respective standard or interpretation:
Effective date (annual periods
beginning on or after)Standard or Interpretation
IFRS 10, 12 & IAS 27
- Consolidated Financial Statements, Disclosure of Interests in Other Entities and Separate Financial Statements – Investment Entities: Applying the Consolidation Exception (Amendment)
January 1, 2016
IFRS 10 & - Consolidated Financial Statements and Investment in Associates and Joint Ventures - Sale or Contribution of Assets between an Investor and its Associate or Joint Venture (Amendment)
IAS 28 Not yet finalized
IFRS 11 - Joint Arrangements- Accounting for Acquisition of Interest in Joint Operation
January 1, 2016
IFRS 1 - Presentation of Financial Statements - Disclosure Initiative (Amendment)
January 1, 2016
IAS 16 & 38 - Property, Plant and Equipment & intangible assets – Clarification of Acceptable Method of Depreciation and Amortisation (Amendment)
January 1, 2016
IAS 16 & 41 - Property, Plant and Equipment & Agriculture: Agriculture: Bearer Plants (Amendment)
January 1, 2016
IAS 27 - Separate Financial Statements – Equity Method in Separate Financial Statements (Amendment)
January 1, 2016
59
The above standards and amendments are not expected to have any material impact on the Company’s financial statements in the period of initial application.
In addition to the above standards and amendments, improvements to various accounting standards have also been issued by the IASB in September 2014. Such improvements are generally effective for accounting periods beginning on or after 01 January 2016. The Company expects that such improvements to the standards will not have any material impact on the Company’s financial statements in the period of initial application.
Further, following new standards have been issued by IASB which are yet to be notified by the SECP for the purpose of applicability in Pakistan.
IASB Effective date (annual periods
beginning on or after)Standard
IFRS 9 – Financial Instruments: Classification and Measurement January 1, 2018IFRS 14 – Regulatory Deferral Accounts January 1, 2016IFRS 15 – Revenue from Contracts with Customers January 1, 2018IFRS 16 – Leases January 1, 2019
December 31, December 31,2015 2014
Note --------- Rupees in ‘000 ---------3. PROPERTY, PLANT AND EQUIPMENT
Operating fixed assets 3.1 1,842,490 1,822,726 Capital work-in-progress 3.2 171,056 195,836
2,013,546 2,018,562
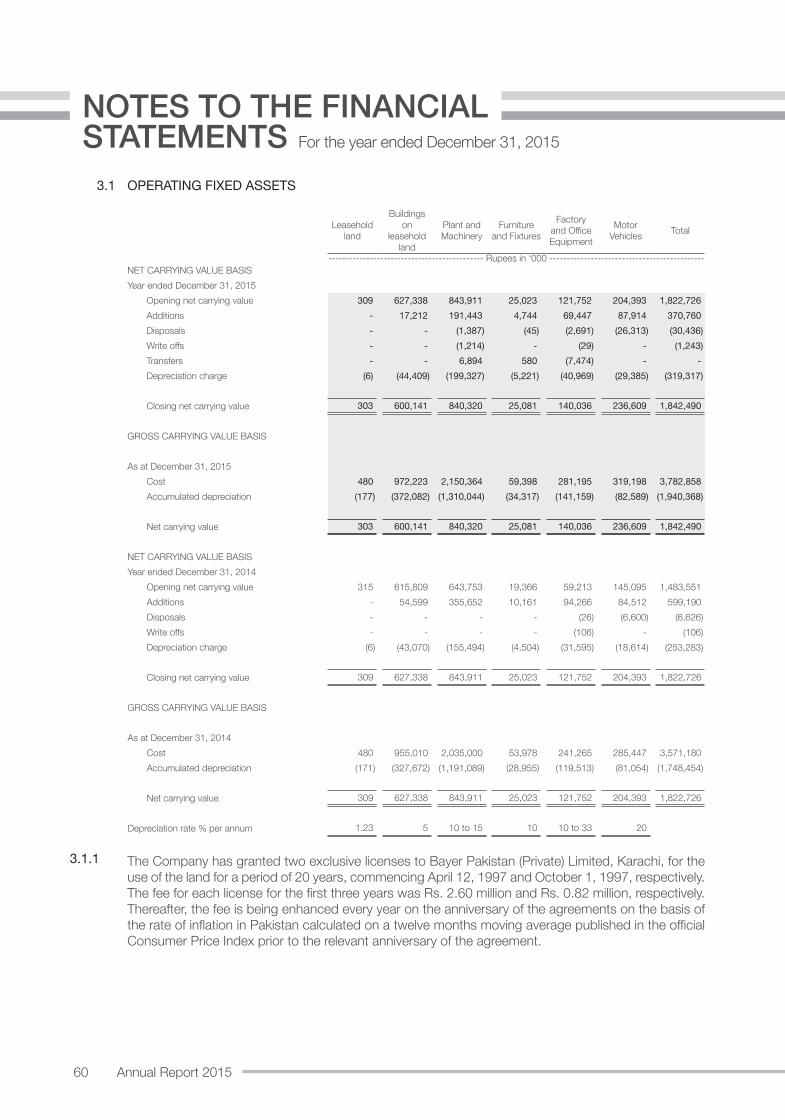
60 Annual Report 2015
For the year ended December 31, 2015
NOTES TO THE FINANCIAL STATEMENTS
3.1 OPERATING FIXED ASSETS
Leasehold land
Buildings on
leasehold land
Plant and Machinery
Furniture and Fixtures
Factory and Office Equipment
Motor Vehicles Total
--------------------------------------------- Rupees in ‘000 ---------------------------------------------NET CARRYING VALUE BASISYear ended December 31, 2015
Opening net carrying value 309 627,338 843,911 25,023 121,752 204,393 1,822,726 Additions - 17,212 191,443 4,744 69,447 87,914 370,760 Disposals - - (1,387) (45) (2,691) (26,313) (30,436)Write offs - - (1,214) - (29) - (1,243)Transfers - - 6,894 580 (7,474) - - Depreciation charge (6) (44,409) (199,327) (5,221) (40,969) (29,385) (319,317)
Closing net carrying value 303 600,141 840,320 25,081 140,036 236,609 1,842,490
GROSS CARRYING VALUE BASIS
As at December 31, 2015Cost 480 972,223 2,150,364 59,398 281,195 319,198 3,782,858 Accumulated depreciation (177) (372,082) (1,310,044) (34,317) (141,159) (82,589) (1,940,368)
Net carrying value 303 600,141 840,320 25,081 140,036 236,609 1,842,490
NET CARRYING VALUE BASISYear ended December 31, 2014
Opening net carrying value 315 615,809 643,753 19,366 59,213 145,095 1,483,551 Additions - 54,599 355,652 10,161 94,266 84,512 599,190 Disposals - - - - (26) (6,600) (6,626)Write offs - - - - (106) - (106)Depreciation charge (6) (43,070) (155,494) (4,504) (31,595) (18,614) (253,283)
Closing net carrying value 309 627,338 843,911 25,023 121,752 204,393 1,822,726
GROSS CARRYING VALUE BASIS
As at December 31, 2014Cost 480 955,010 2,035,000 53,978 241,265 285,447 3,571,180 Accumulated depreciation (171) (327,672) (1,191,089) (28,955) (119,513) (81,054) (1,748,454)
Net carrying value 309 627,338 843,911 25,023 121,752 204,393 1,822,726
Depreciation rate % per annum 1.23 5 10 to 15 10 10 to 33 20
3.1.1 The Company has granted two exclusive licenses to Bayer Pakistan (Private) Limited, Karachi, for the use of the land for a period of 20 years, commencing April 12, 1997 and October 1, 1997, respectively. The fee for each license for the first three years was Rs. 2.60 million and Rs. 0.82 million, respectively. Thereafter, the fee is being enhanced every year on the anniversary of the agreements on the basis of the rate of inflation in Pakistan calculated on a twelve months moving average published in the official Consumer Price Index prior to the relevant anniversary of the agreement.
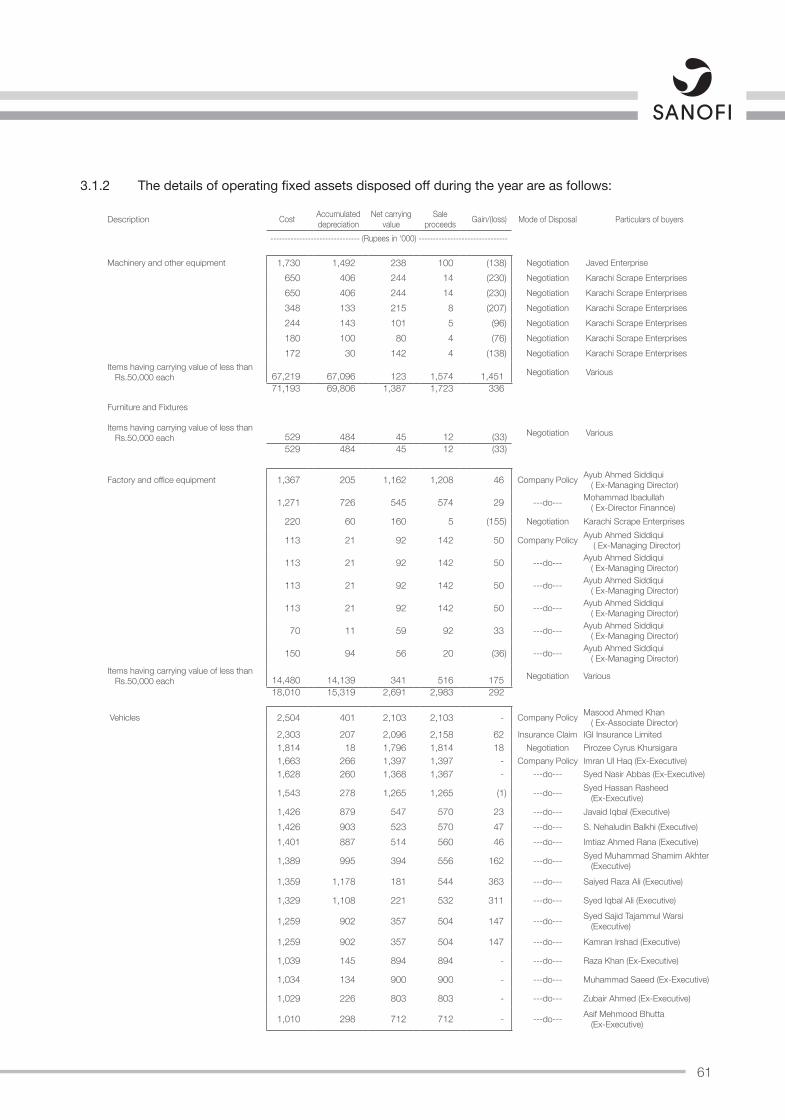
61
3.1.2 The details of operating fixed assets disposed off during the year are as follows:
Description Cost Accumulated depreciation
Net carrying value
Sale proceeds Gain/(loss) Mode of Disposal Particulars of buyers
------------------------------- (Rupees in ‘000) -------------------------------
Machinery and other equipment 1,730 1,492 238 100 (138) Negotiation Javed Enterprise 650 406 244 14 (230) Negotiation Karachi Scrape Enterprises 650 406 244 14 (230) Negotiation Karachi Scrape Enterprises 348 133 215 8 (207) Negotiation Karachi Scrape Enterprises 244 143 101 5 (96) Negotiation Karachi Scrape Enterprises 180 100 80 4 (76) Negotiation Karachi Scrape Enterprises 172 30 142 4 (138) Negotiation Karachi Scrape Enterprises
Items having carrying value of less than Rs.50,000 each 67,219 67,096 123 1,574 1,451 Negotiation Various
71,193 69,806 1,387 1,723 336
Furniture and Fixtures
Items having carrying value of less than Rs.50,000 each 529 484 45 12 (33) Negotiation Various
529 484 45 12 (33)
Factory and office equipment 1,367 205 1,162 1,208 46 Company Policy Ayub Ahmed Siddiqui ( Ex-Managing Director)
1,271 726 545 574 29 ---do--- Mohammad Ibadullah ( Ex-Director Finannce)
220 60 160 5 (155) Negotiation Karachi Scrape Enterprises
113 21 92 142 50 Company Policy Ayub Ahmed Siddiqui ( Ex-Managing Director)
113 21 92 142 50 ---do--- Ayub Ahmed Siddiqui ( Ex-Managing Director)
113 21 92 142 50 ---do--- Ayub Ahmed Siddiqui ( Ex-Managing Director)
113 21 92 142 50 ---do--- Ayub Ahmed Siddiqui ( Ex-Managing Director)
70 11 59 92 33 ---do--- Ayub Ahmed Siddiqui ( Ex-Managing Director)
150 94 56 20 (36) ---do--- Ayub Ahmed Siddiqui ( Ex-Managing Director)
Items having carrying value of less than Rs.50,000 each 14,480 14,139 341 516 175 Negotiation Various
18,010 15,319 2,691 2,983 292
Vehicles 2,504 401 2,103 2,103 - Company Policy Masood Ahmed Khan ( Ex-Associate Director)
2,303 207 2,096 2,158 62 Insurance Claim IGI Insurance Limited 1,814 18 1,796 1,814 18 Negotiation Pirozee Cyrus Khursigara 1,663 266 1,397 1,397 - Company Policy Imran Ul Haq (Ex-Executive) 1,628 260 1,368 1,367 - ---do--- Syed Nasir Abbas (Ex-Executive)
1,543 278 1,265 1,265 (1) ---do--- Syed Hassan Rasheed (Ex-Executive)
1,426 879 547 570 23 ---do--- Javaid Iqbal (Executive) 1,426 903 523 570 47 ---do--- S. Nehaludin Balkhi (Executive) 1,401 887 514 560 46 ---do--- Imtiaz Ahmed Rana (Executive)
1,389 995 394 556 162 ---do--- Syed Muhammad Shamim Akhter (Executive)
1,359 1,178 181 544 363 ---do--- Saiyed Raza Ali (Executive)
1,329 1,108 221 532 311 ---do--- Syed Iqbal Ali (Executive)
1,259 902 357 504 147 ---do--- Syed Sajid Tajammul Warsi (Executive)
1,259 902 357 504 147 ---do--- Kamran Irshad (Executive)
1,039 145 894 894 - ---do--- Raza Khan (Ex-Executive)
1,034 134 900 900 - ---do--- Muhammad Saeed (Ex-Executive)
1,029 226 803 803 - ---do--- Zubair Ahmed (Ex-Executive)
1,010 298 712 712 - ---do--- Asif Mehmood Bhutta (Ex-Executive)
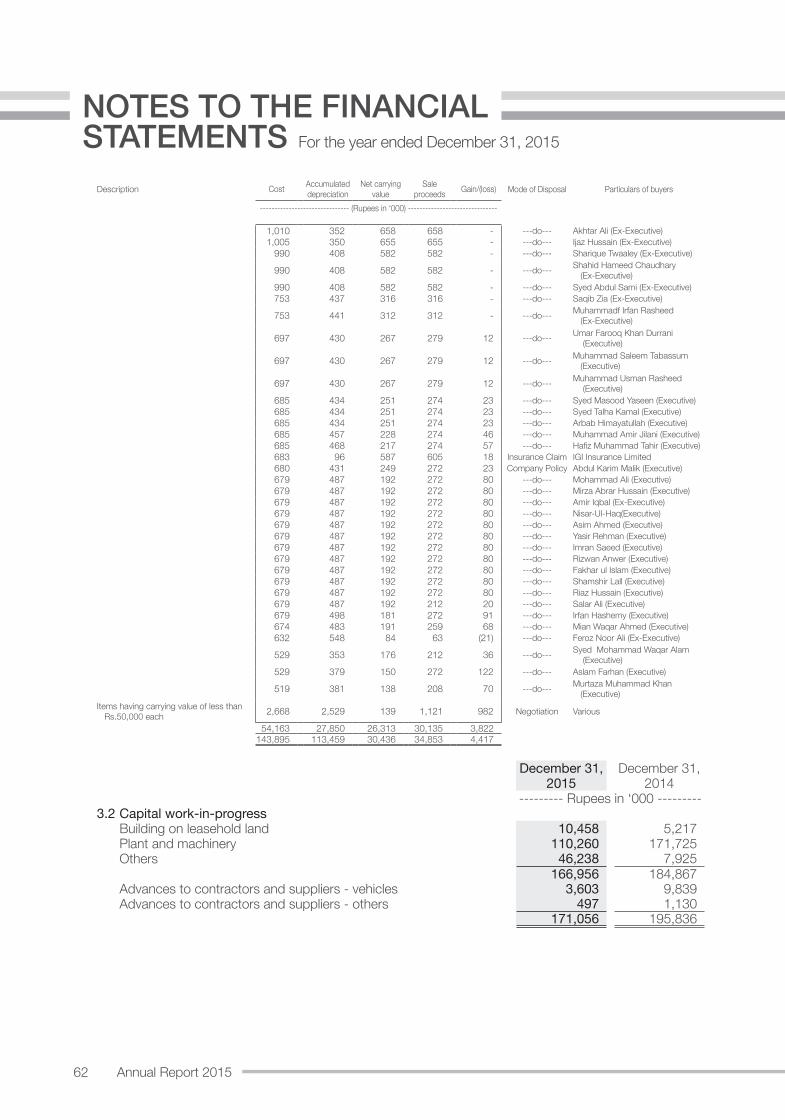
62 Annual Report 2015
For the year ended December 31, 2015
NOTES TO THE FINANCIAL STATEMENTS
Description Cost Accumulated depreciation
Net carrying value
Sale proceeds Gain/(loss) Mode of Disposal Particulars of buyers
------------------------------- (Rupees in ‘000) -------------------------------
1,010 352 658 658 - ---do--- Akhtar Ali (Ex-Executive) 1,005 350 655 655 - ---do--- Ijaz Hussain (Ex-Executive)
990 408 582 582 - ---do--- Sharique Twaaley (Ex-Executive)
990 408 582 582 - ---do--- Shahid Hameed Chaudhary (Ex-Executive)
990 408 582 582 - ---do--- Syed Abdul Sami (Ex-Executive) 753 437 316 316 - ---do--- Saqib Zia (Ex-Executive)
753 441 312 312 - ---do--- Muhammadf Irfan Rasheed (Ex-Executive)
697 430 267 279 12 ---do--- Umar Farooq Khan Durrani (Executive)
697 430 267 279 12 ---do--- Muhammad Saleem Tabassum (Executive)
697 430 267 279 12 ---do--- Muhammad Usman Rasheed (Executive)
685 434 251 274 23 ---do--- Syed Masood Yaseen (Executive) 685 434 251 274 23 ---do--- Syed Talha Kamal (Executive) 685 434 251 274 23 ---do--- Arbab Himayatullah (Executive) 685 457 228 274 46 ---do--- Muhammad Amir Jilani (Executive) 685 468 217 274 57 ---do--- Hafiz Muhammad Tahir (Executive) 683 96 587 605 18 Insurance Claim IGI Insurance Limited 680 431 249 272 23 Company Policy Abdul Karim Malik (Executive) 679 487 192 272 80 ---do--- Mohammad Ali (Executive) 679 487 192 272 80 ---do--- Mirza Abrar Hussain (Executive) 679 487 192 272 80 ---do--- Amir Iqbal (Ex-Executive) 679 487 192 272 80 ---do--- Nisar-Ul-Haq(Executive) 679 487 192 272 80 ---do--- Asim Ahmed (Executive) 679 487 192 272 80 ---do--- Yasir Rehman (Executive) 679 487 192 272 80 ---do--- Imran Saeed (Executive) 679 487 192 272 80 ---do--- Rizwan Anwer (Executive) 679 487 192 272 80 ---do--- Fakhar ul Islam (Executive) 679 487 192 272 80 ---do--- Shamshir Lall (Executive) 679 487 192 272 80 ---do--- Riaz Hussain (Executive) 679 487 192 212 20 ---do--- Salar Ali (Executive) 679 498 181 272 91 ---do--- Irfan Hashemy (Executive) 674 483 191 259 68 ---do--- Mian Waqar Ahmed (Executive) 632 548 84 63 (21) ---do--- Feroz Noor Ali (Ex-Executive)
529 353 176 212 36 ---do--- Syed Mohammad Waqar Alam (Executive)
529 379 150 272 122 ---do--- Aslam Farhan (Executive)
519 381 138 208 70 ---do--- Murtaza Muhammad Khan (Executive)
Items having carrying value of less than Rs.50,000 each 2,668 2,529 139 1,121 982 Negotiation Various
54,163 27,850 26,313 30,135 3,822 143,895 113,459 30,436 34,853 4,417
December 31, December 31,2015 2014
--------- Rupees in ‘000 ---------3.2 Capital work-in-progress
Building on leasehold land 10,458 5,217 Plant and machinery 110,260 171,725 Others 46,238 7,925
166,956 184,867 Advances to contractors and suppliers - vehicles 3,603 9,839 Advances to contractors and suppliers - others 497 1,130
171,056 195,836
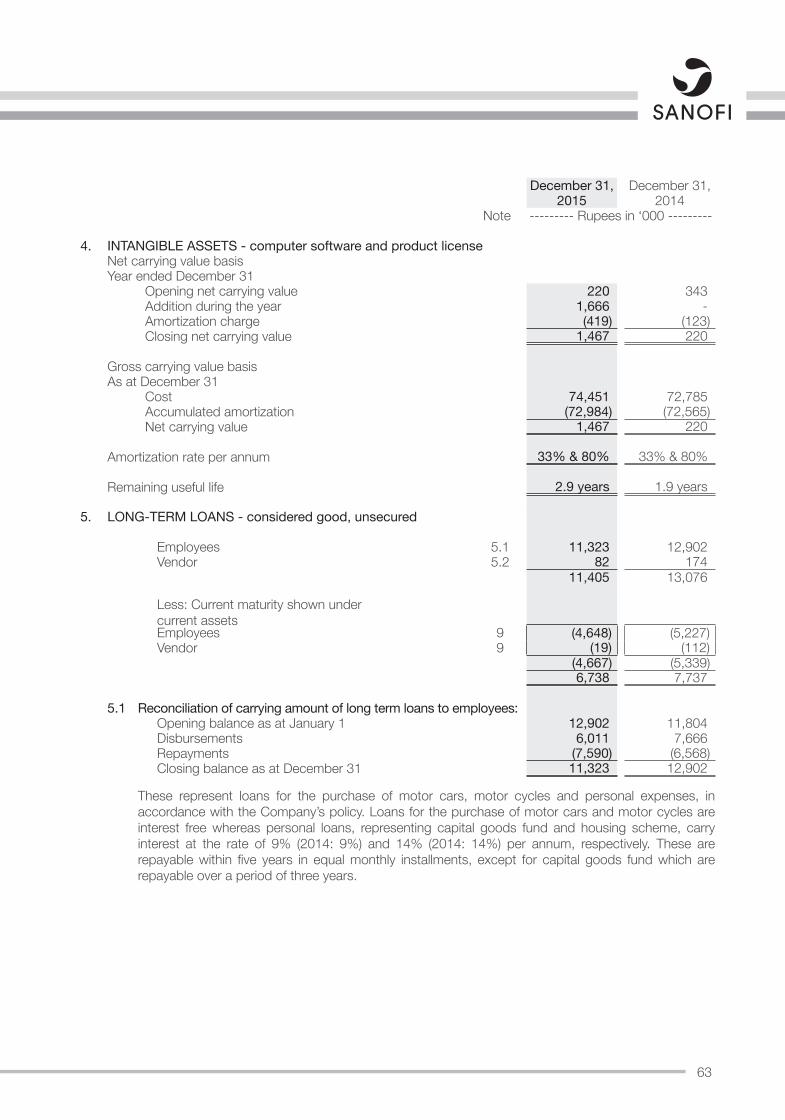
63
December 31, December 31,2015 2014
Note --------- Rupees in ‘000 ---------
4. INTANGIBLE ASSETS - computer software and product licenseNet carrying value basisYear ended December 31
Opening net carrying value 220 343 Addition during the year 1,666 - Amortization charge (419) (123)Closing net carrying value 1,467 220
Gross carrying value basisAs at December 31
Cost 74,451 72,785 Accumulated amortization (72,984) (72,565)Net carrying value 1,467 220
Amortization rate per annum 33% & 80% 33% & 80%
Remaining useful life 2.9 years 1.9 years
5. LONG-TERM LOANS - considered good, unsecured
Employees 5.1 11,323 12,902 Vendor 5.2 82 174
11,405 13,076
Less: Current maturity shown under current assetsEmployees 9 (4,648) (5,227)Vendor 9 (19) (112)
(4,667) (5,339) 6,738 7,737
5.1 Reconciliation of carrying amount of long term loans to employees:Opening balance as at January 1 12,902 11,804 Disbursements 6,011 7,666 Repayments (7,590) (6,568)Closing balance as at December 31 11,323 12,902
These represent loans for the purchase of motor cars, motor cycles and personal expenses, in accordance with the Company’s policy. Loans for the purchase of motor cars and motor cycles are interest free whereas personal loans, representing capital goods fund and housing scheme, carry interest at the rate of 9% (2014: 9%) and 14% (2014: 14%) per annum, respectively. These are repayable within five years in equal monthly installments, except for capital goods fund which are repayable over a period of three years.
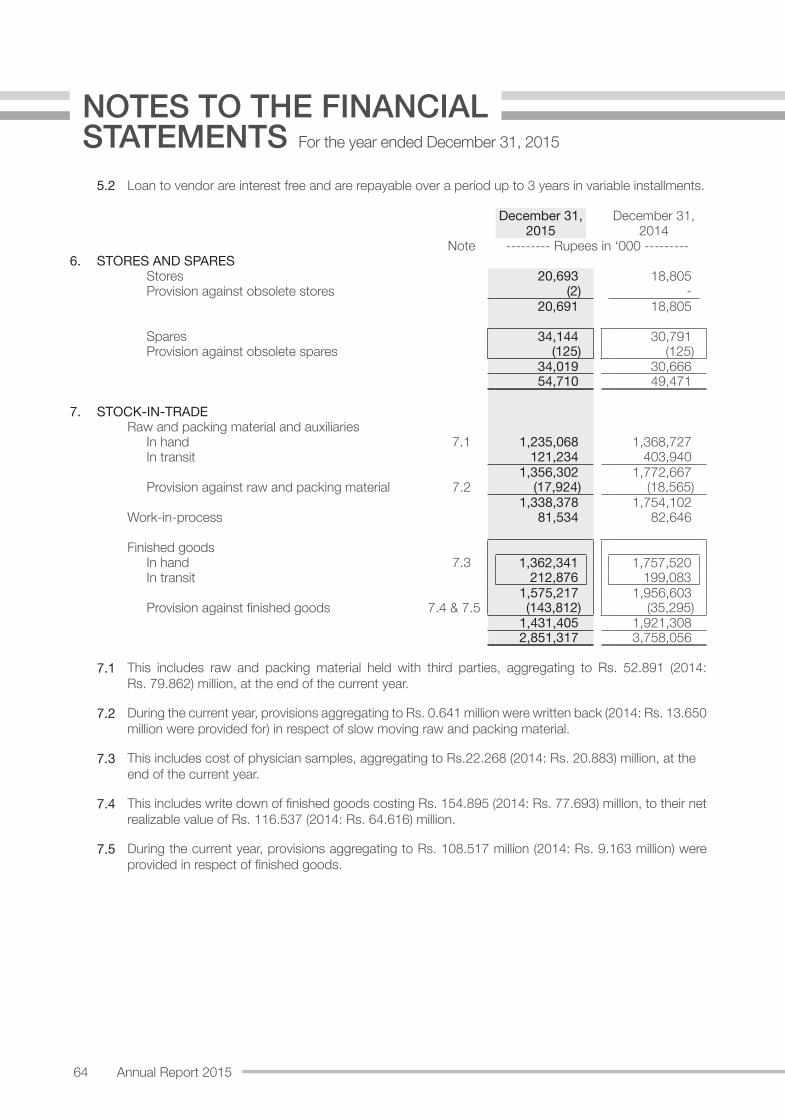
64 Annual Report 2015
For the year ended December 31, 2015
NOTES TO THE FINANCIAL STATEMENTS
5.2 Loan to vendor are interest free and are repayable over a period up to 3 years in variable installments.
December 31, December 31,2015 2014
Note --------- Rupees in ‘000 ---------6. STORES AND SPARES
Stores 20,693 18,805 Provision against obsolete stores (2) -
20,691 18,805
Spares 34,144 30,791 Provision against obsolete spares (125) (125)
34,019 30,666 54,710 49,471
7. STOCK-IN-TRADE Raw and packing material and auxiliaries
In hand 7.1 1,235,068 1,368,727 In transit 121,234 403,940
1,356,302 1,772,667 Provision against raw and packing material 7.2 (17,924) (18,565)
1,338,378 1,754,102 Work-in-process 81,534 82,646
Finished goodsIn hand 7.3 1,362,341 1,757,520 In transit 212,876 199,083
1,575,217 1,956,603 Provision against finished goods 7.4 & 7.5 (143,812) (35,295)
1,431,405 1,921,308 2,851,317 3,758,056
7.1 This includes raw and packing material held with third parties, aggregating to Rs. 52.891 (2014: Rs. 79.862) million, at the end of the current year.
7.2 During the current year, provisions aggregating to Rs. 0.641 million were written back (2014: Rs. 13.650 million were provided for) in respect of slow moving raw and packing material.
7.3 This includes cost of physician samples, aggregating to Rs.22.268 (2014: Rs. 20.883) million, at the end of the current year.
7.4 This includes write down of finished goods costing Rs. 154.895 (2014: Rs. 77.693) million, to their net realizable value of Rs. 116.537 (2014: Rs. 64.616) million.
7.5 During the current year, provisions aggregating to Rs. 108.517 million (2014: Rs. 9.163 million) were provided in respect of finished goods.
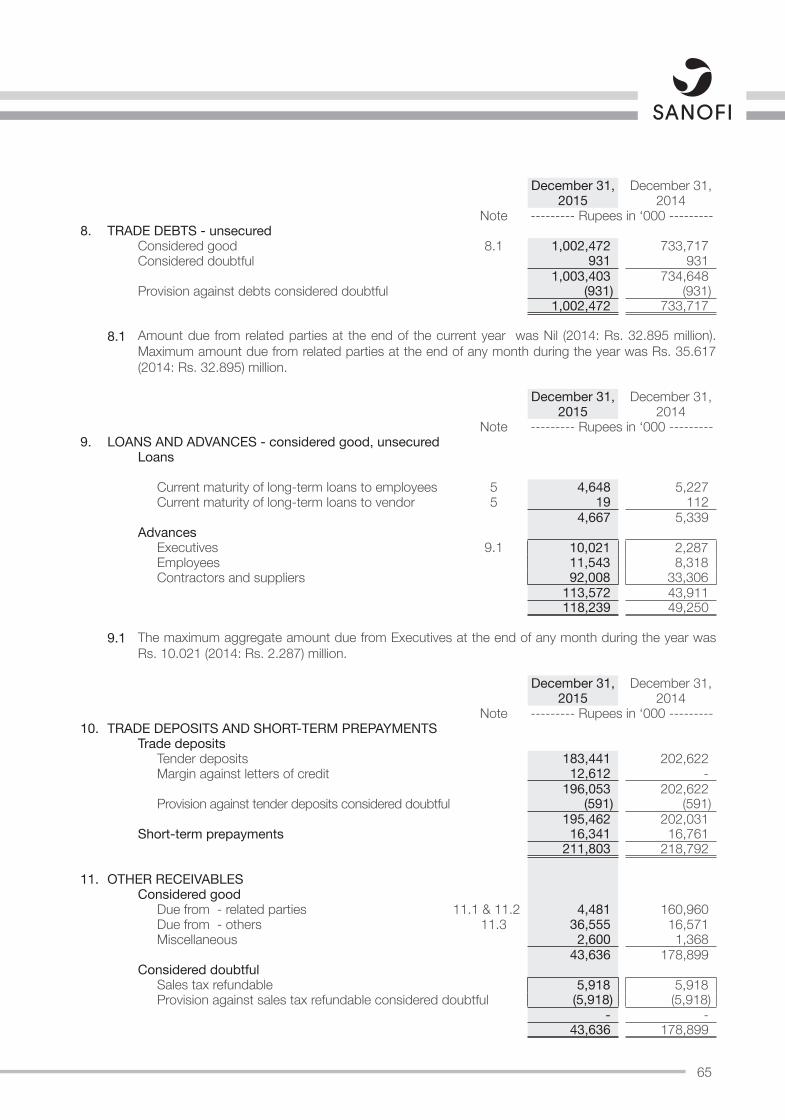
65
December 31, December 31,2015 2014
Note --------- Rupees in ‘000 ---------8. TRADE DEBTS - unsecured
Considered good 8.1 1,002,472 733,717 Considered doubtful 931 931
1,003,403 734,648 Provision against debts considered doubtful (931) (931)
1,002,472 733,717
8.1 Amount due from related parties at the end of the current year was Nil (2014: Rs. 32.895 million). Maximum amount due from related parties at the end of any month during the year was Rs. 35.617 (2014: Rs. 32.895) million.
December 31, December 31,2015 2014
Note --------- Rupees in ‘000 ---------9. LOANS AND ADVANCES - considered good, unsecured
Loans
Current maturity of long-term loans to employees 5 4,648 5,227 Current maturity of long-term loans to vendor 5 19 112
4,667 5,339 Advances
Executives 9.1 10,021 2,287 Employees 11,543 8,318 Contractors and suppliers 92,008 33,306
113,572 43,911 118,239 49,250
9.1 The maximum aggregate amount due from Executives at the end of any month during the year was Rs. 10.021 (2014: Rs. 2.287) million.
December 31, December 31,2015 2014
Note --------- Rupees in ‘000 ---------10. TRADE DEPOSITS AND SHORT-TERM PREPAYMENTS
Trade depositsTender deposits 183,441 202,622 Margin against letters of credit 12,612 -
196,053 202,622 Provision against tender deposits considered doubtful (591) (591)
195,462 202,031 Short-term prepayments 16,341 16,761
211,803 218,792
11. OTHER RECEIVABLESConsidered good
Due from - related parties 11.1 & 11.2 4,481 160,960 Due from - others 11.3 36,555 16,571 Miscellaneous 2,600 1,368
43,636 178,899 Considered doubtful
Sales tax refundable 5,918 5,918 Provision against sales tax refundable considered doubtful (5,918) (5,918)
- - 43,636 178,899
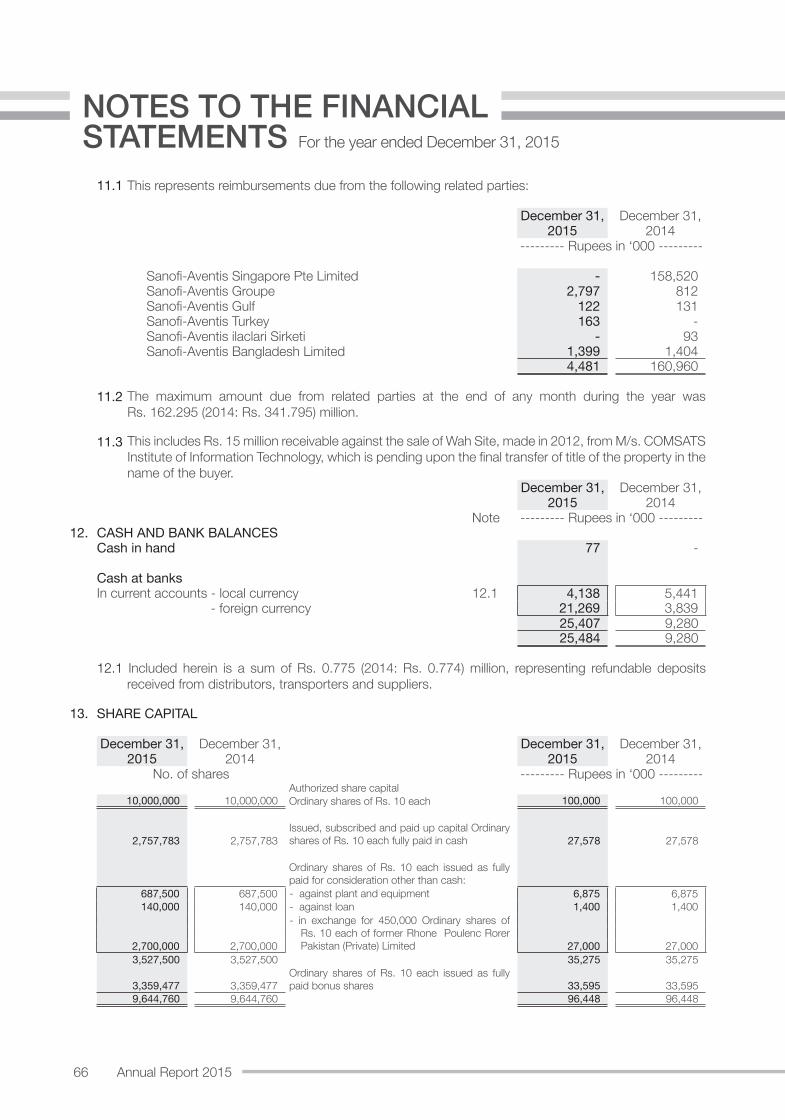
66 Annual Report 2015
For the year ended December 31, 2015
NOTES TO THE FINANCIAL STATEMENTS
11.1 This represents reimbursements due from the following related parties:
December 31, December 31,2015 2014
--------- Rupees in ‘000 ---------
Sanofi-Aventis Singapore Pte Limited - 158,520 Sanofi-Aventis Groupe 2,797 812 Sanofi-Aventis Gulf 122 131 Sanofi-Aventis Turkey 163 - Sanofi-Aventis ilaclari Sirketi - 93 Sanofi-Aventis Bangladesh Limited 1,399 1,404
4,481 160,960
11.2 The maximum amount due from related parties at the end of any month during the year was Rs. 162.295 (2014: Rs. 341.795) million.
11.3 This includes Rs. 15 million receivable against the sale of Wah Site, made in 2012, from M/s. COMSATS Institute of Information Technology, which is pending upon the final transfer of title of the property in the name of the buyer.
December 31, December 31,2015 2014
Note --------- Rupees in ‘000 ---------12. CASH AND BANK BALANCES
Cash in hand 77 -
Cash at banksIn current accounts - local currency 12.1 4,138 5,441
- foreign currency 21,269 3,839 25,407 9,280 25,484 9,280
12.1 Included herein is a sum of Rs. 0.775 (2014: Rs. 0.774) million, representing refundable deposits received from distributors, transporters and suppliers.
13. SHARE CAPITAL
December 31, December 31, December 31, December 31,2015 2014 2015 2014
No. of shares --------- Rupees in ‘000 ---------Authorized share capital
10,000,000 10,000,000 Ordinary shares of Rs. 10 each 100,000 100,000
Issued, subscribed and paid up capital Ordinary shares of Rs. 10 each fully paid in cash2,757,783 2,757,783 27,578 27,578
Ordinary shares of Rs. 10 each issued as fully paid for consideration other than cash:
687,500 687,500 - against plant and equipment 6,875 6,875 140,000 140,000 - against loan 1,400 1,400
- in exchange for 450,000 Ordinary shares of Rs. 10 each of former Rhone Poulenc Rorer Pakistan (Private) Limited 2,700,000 2,700,000 27,000 27,000
3,527,500 3,527,500 35,275 35,275 Ordinary shares of Rs. 10 each issued as fully paid bonus shares 3,359,477 3,359,477 33,595 33,595
9,644,760 9,644,760 96,448 96,448
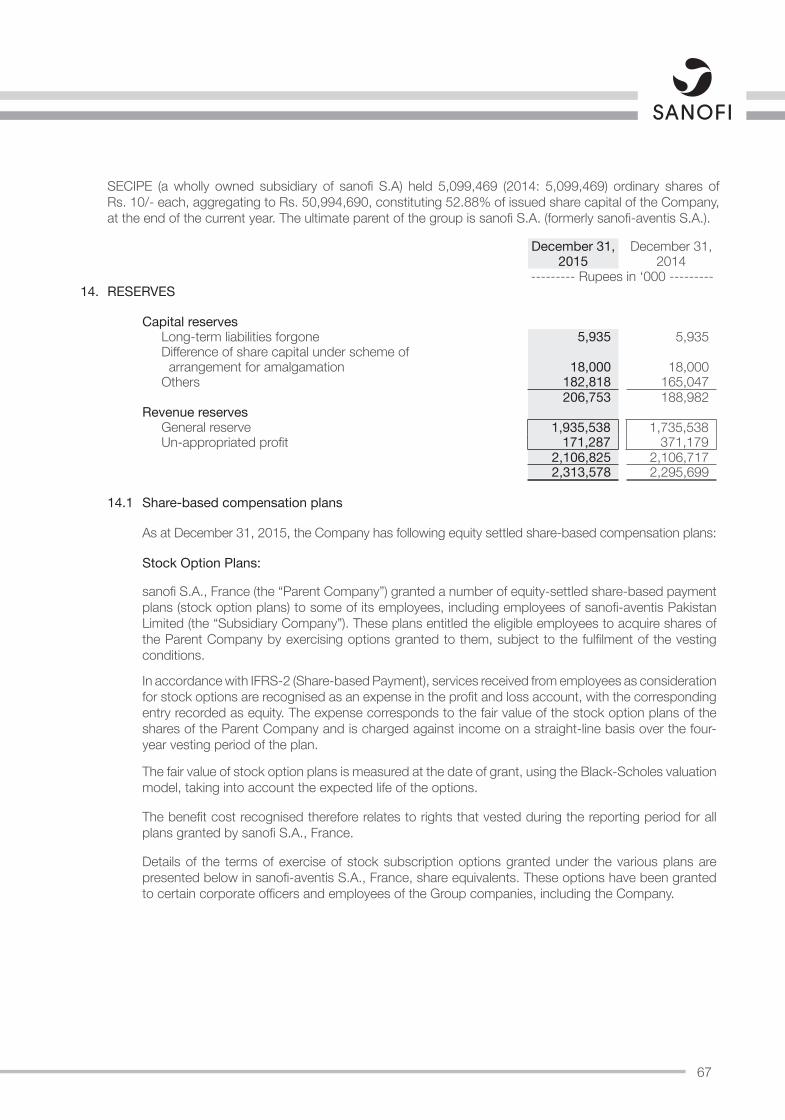
67
December 31, December 31,2015 2014
--------- Rupees in ‘000 ---------14. RESERVES
Capital reservesLong-term liabilities forgone 5,935 5,935 Difference of share capital under scheme of arrangement for amalgamation 18,000 18,000 Others 182,818 165,047
206,753 188,982 Revenue reserves
General reserve 1,935,538 1,735,538 Un-appropriated profit 171,287 371,179
2,106,825 2,106,717 2,313,578 2,295,699
14.1 Share-based compensation plans
As at December 31, 2015, the Company has following equity settled share-based compensation plans:
Stock Option Plans:
sanofi S.A., France (the “Parent Company”) granted a number of equity-settled share-based payment plans (stock option plans) to some of its employees, including employees of sanofi-aventis Pakistan Limited (the “Subsidiary Company”). These plans entitled the eligible employees to acquire shares of the Parent Company by exercising options granted to them, subject to the fulfilment of the vesting conditions.
In accordance with IFRS-2 (Share-based Payment), services received from employees as consideration for stock options are recognised as an expense in the profit and loss account, with the corresponding entry recorded as equity. The expense corresponds to the fair value of the stock option plans of the shares of the Parent Company and is charged against income on a straight-line basis over the four-year vesting period of the plan.
The fair value of stock option plans is measured at the date of grant, using the Black-Scholes valuation model, taking into account the expected life of the options.
The benefit cost recognised therefore relates to rights that vested during the reporting period for all plans granted by sanofi S.A., France.
Details of the terms of exercise of stock subscription options granted under the various plans are presented below in sanofi-aventis S.A., France, share equivalents. These options have been granted to certain corporate officers and employees of the Group companies, including the Company.
SECIPE (a wholly owned subsidiary of sanofi S.A) held 5,099,469 (2014: 5,099,469) ordinary shares of Rs. 10/- each, aggregating to Rs. 50,994,690, constituting 52.88% of issued share capital of the Company, at the end of the current year. The ultimate parent of the group is sanofi S.A. (formerly sanofi-aventis S.A.).
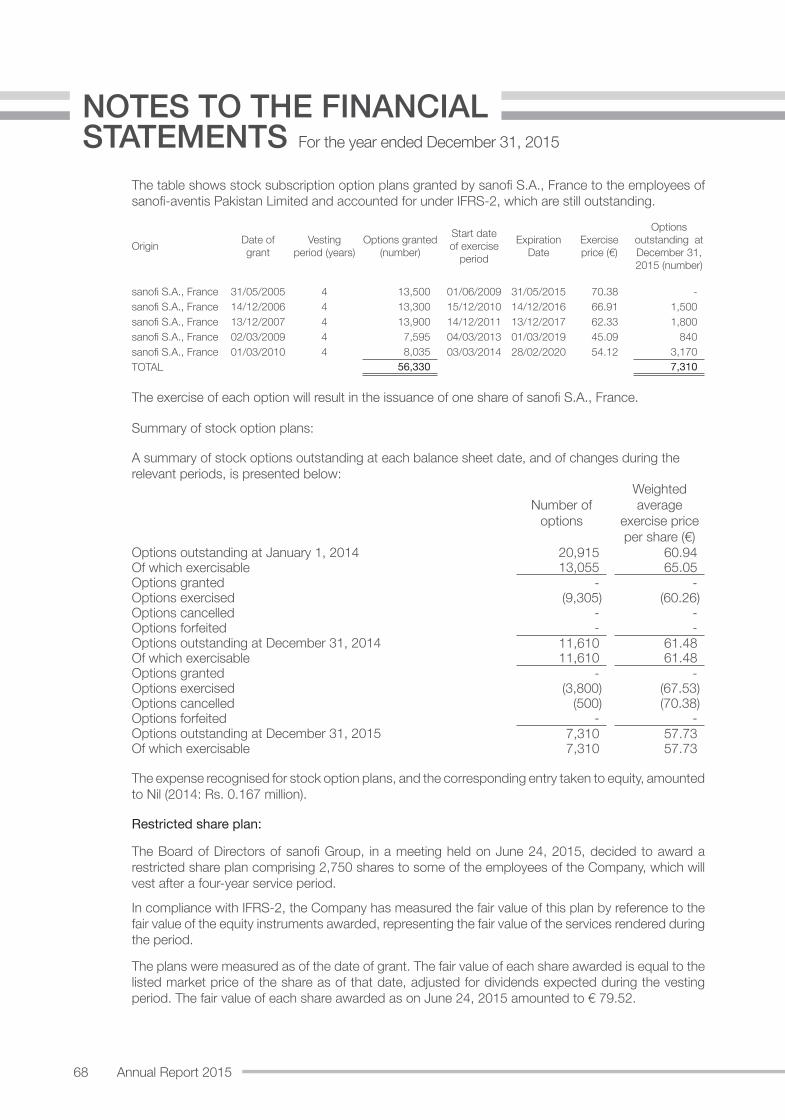
68 Annual Report 2015
For the year ended December 31, 2015
NOTES TO THE FINANCIAL STATEMENTS
The table shows stock subscription option plans granted by sanofi S.A., France to the employees of sanofi-aventis Pakistan Limited and accounted for under IFRS-2, which are still outstanding.
Origin Date of grant
Vesting period (years)
Options granted (number)
Start date of exercise
period
Expiration Date
Exercise price (€)
Options outstanding at December 31, 2015 (number)
sanofi S.A., France 31/05/2005 4 13,500 01/06/2009 31/05/2015 70.38 - sanofi S.A., France 14/12/2006 4 13,300 15/12/2010 14/12/2016 66.91 1,500 sanofi S.A., France 13/12/2007 4 13,900 14/12/2011 13/12/2017 62.33 1,800 sanofi S.A., France 02/03/2009 4 7,595 04/03/2013 01/03/2019 45.09 840 sanofi S.A., France 01/03/2010 4 8,035 03/03/2014 28/02/2020 54.12 3,170 TOTAL 56,330 7,310
The exercise of each option will result in the issuance of one share of sanofi S.A., France.
Summary of stock option plans:
A summary of stock options outstanding at each balance sheet date, and of changes during the relevant periods, is presented below:
Number of options
Weighted average
exercise price per share (€)
Options outstanding at January 1, 2014 20,915 60.94 Of which exercisable 13,055 65.05 Options granted - - Options exercised (9,305) (60.26)Options cancelled - - Options forfeited - - Options outstanding at December 31, 2014 11,610 61.48 Of which exercisable 11,610 61.48 Options granted - - Options exercised (3,800) (67.53)Options cancelled (500) (70.38)Options forfeited - - Options outstanding at December 31, 2015 7,310 57.73 Of which exercisable 7,310 57.73
The expense recognised for stock option plans, and the corresponding entry taken to equity, amounted to Nil (2014: Rs. 0.167 million).
Restricted share plan:
The Board of Directors of sanofi Group, in a meeting held on June 24, 2015, decided to award a restricted share plan comprising 2,750 shares to some of the employees of the Company, which will vest after a four-year service period.
In compliance with IFRS-2, the Company has measured the fair value of this plan by reference to the fair value of the equity instruments awarded, representing the fair value of the services rendered during the period.
The plans were measured as of the date of grant. The fair value of each share awarded is equal to the listed market price of the share as of that date, adjusted for dividends expected during the vesting period. The fair value of each share awarded as on June 24, 2015 amounted to € 79.52.
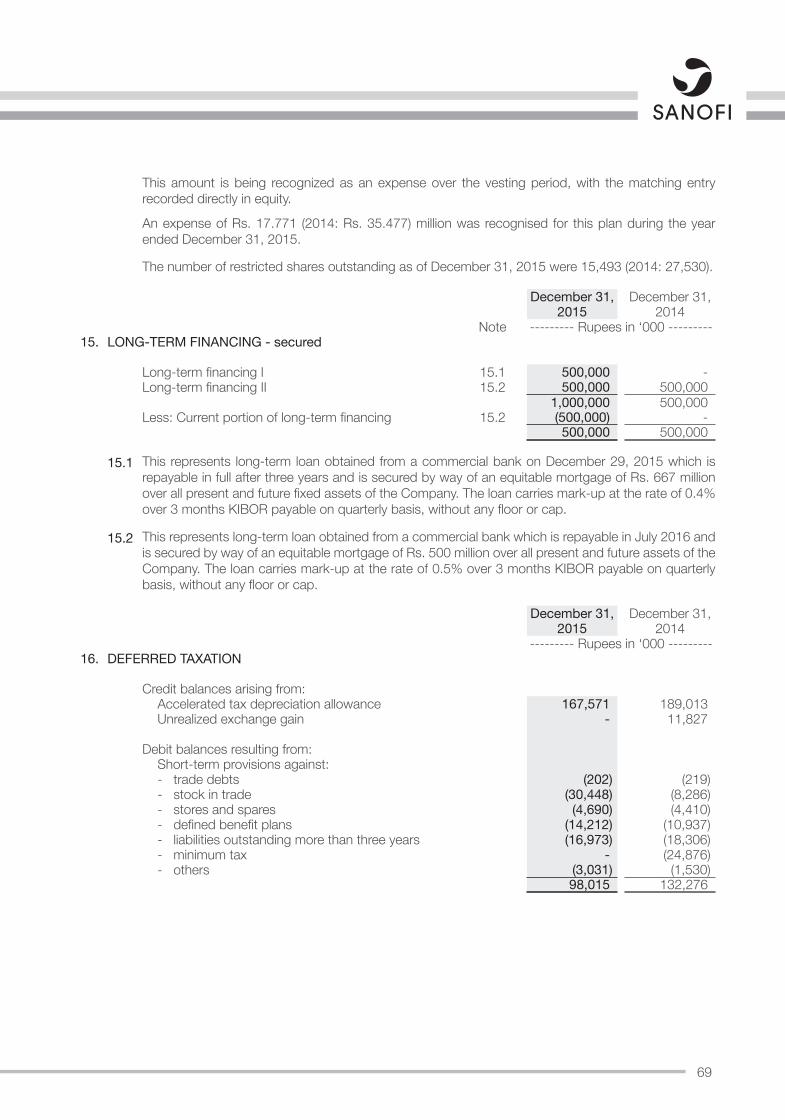
69
This amount is being recognized as an expense over the vesting period, with the matching entry recorded directly in equity.
An expense of Rs. 17.771 (2014: Rs. 35.477) million was recognised for this plan during the year ended December 31, 2015.
The number of restricted shares outstanding as of December 31, 2015 were 15,493 (2014: 27,530).
December 31, December 31,2015 2014
Note --------- Rupees in ‘000 ---------15. LONG-TERM FINANCING - secured
Long-term financing I 15.1 500,000 - Long-term financing II 15.2 500,000 500,000
1,000,000 500,000 Less: Current portion of long-term financing 15.2 (500,000) -
500,000 500,000
15.1 This represents long-term loan obtained from a commercial bank on December 29, 2015 which is repayable in full after three years and is secured by way of an equitable mortgage of Rs. 667 million over all present and future fixed assets of the Company. The loan carries mark-up at the rate of 0.4% over 3 months KIBOR payable on quarterly basis, without any floor or cap.
15.2 This represents long-term loan obtained from a commercial bank which is repayable in July 2016 and is secured by way of an equitable mortgage of Rs. 500 million over all present and future assets of the Company. The loan carries mark-up at the rate of 0.5% over 3 months KIBOR payable on quarterly basis, without any floor or cap.
December 31, December 31,2015 2014
--------- Rupees in ‘000 ---------16. DEFERRED TAXATION
Credit balances arising from:Accelerated tax depreciation allowance 167,571 189,013 Unrealized exchange gain - 11,827
Debit balances resulting from:Short-term provisions against:- trade debts (202) (219)- stock in trade (30,448) (8,286)- stores and spares (4,690) (4,410)- defined benefit plans (14,212) (10,937)- liabilities outstanding more than three years (16,973) (18,306)- minimum tax - (24,876)- others (3,031) (1,530)
98,015 132,276
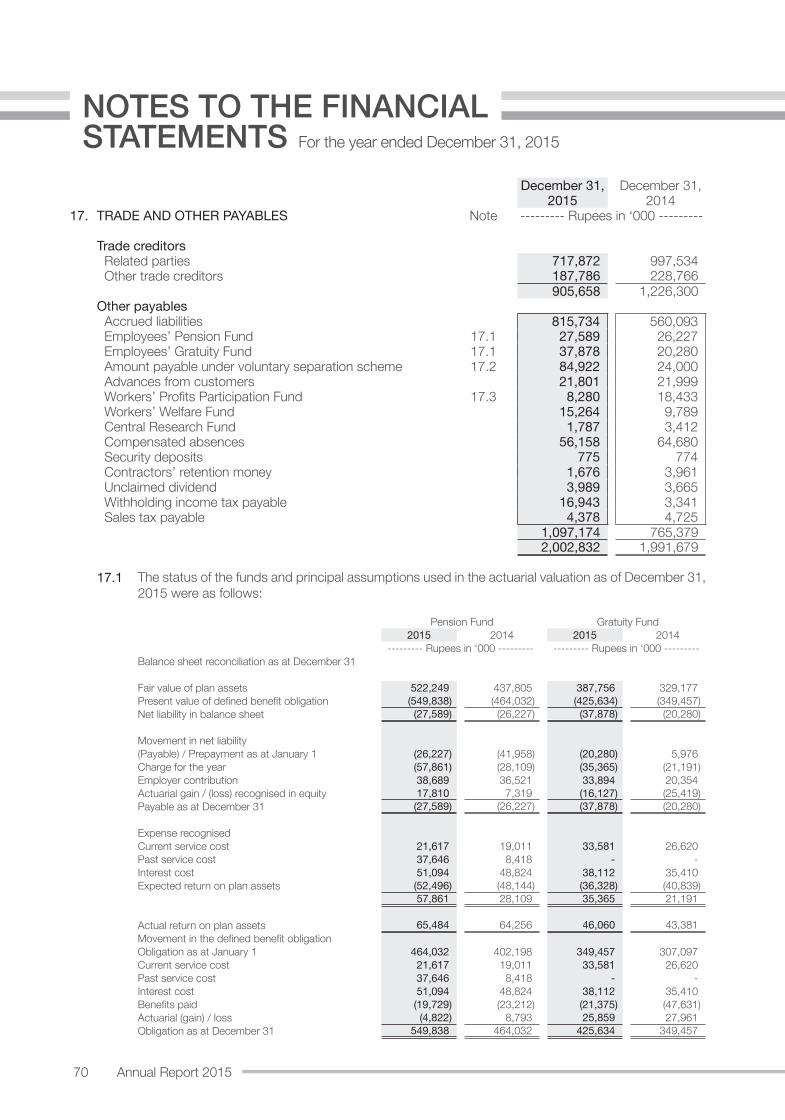
70 Annual Report 2015
For the year ended December 31, 2015
NOTES TO THE FINANCIAL STATEMENTS
December 31, December 31,2015 2014
17. TRADE AND OTHER PAYABLES Note --------- Rupees in ‘000 ---------
Trade creditorsRelated parties 717,872 997,534 Other trade creditors 187,786 228,766
905,658 1,226,300 Other payables
Accrued liabilities 815,734 560,093 Employees’ Pension Fund 17.1 27,589 26,227 Employees’ Gratuity Fund 17.1 37,878 20,280 Amount payable under voluntary separation scheme 17.2 84,922 24,000 Advances from customers 21,801 21,999 Workers’ Profits Participation Fund 17.3 8,280 18,433 Workers’ Welfare Fund 15,264 9,789 Central Research Fund 1,787 3,412 Compensated absences 56,158 64,680 Security deposits 775 774 Contractors’ retention money 1,676 3,961 Unclaimed dividend 3,989 3,665 Withholding income tax payable 16,943 3,341 Sales tax payable 4,378 4,725
1,097,174 765,379 2,002,832 1,991,679
17.1 The status of the funds and principal assumptions used in the actuarial valuation as of December 31, 2015 were as follows:
Pension Fund Gratuity Fund 2015 2014 2015 2014
--------- Rupees in ‘000 --------- --------- Rupees in ‘000 ---------Balance sheet reconciliation as at December 31
Fair value of plan assets 522,249 437,805 387,756 329,177 Present value of defined benefit obligation (549,838) (464,032) (425,634) (349,457)Net liability in balance sheet (27,589) (26,227) (37,878) (20,280)
Movement in net liability(Payable) / Prepayment as at January 1 (26,227) (41,958) (20,280) 5,976 Charge for the year (57,861) (28,109) (35,365) (21,191)Employer contribution 38,689 36,521 33,894 20,354 Actuarial gain / (loss) recognised in equity 17,810 7,319 (16,127) (25,419)Payable as at December 31 (27,589) (26,227) (37,878) (20,280)
Expense recognisedCurrent service cost 21,617 19,011 33,581 26,620 Past service cost 37,646 8,418 - - Interest cost 51,094 48,824 38,112 35,410 Expected return on plan assets (52,496) (48,144) (36,328) (40,839)
57,861 28,109 35,365 21,191
Actual return on plan assets 65,484 64,256 46,060 43,381 Movement in the defined benefit obligationObligation as at January 1 464,032 402,198 349,457 307,097 Current service cost 21,617 19,011 33,581 26,620 Past service cost 37,646 8,418 - - Interest cost 51,094 48,824 38,112 35,410 Benefits paid (19,729) (23,212) (21,375) (47,631)Actuarial (gain) / loss (4,822) 8,793 25,859 27,961 Obligation as at December 31 549,838 464,032 425,634 349,457
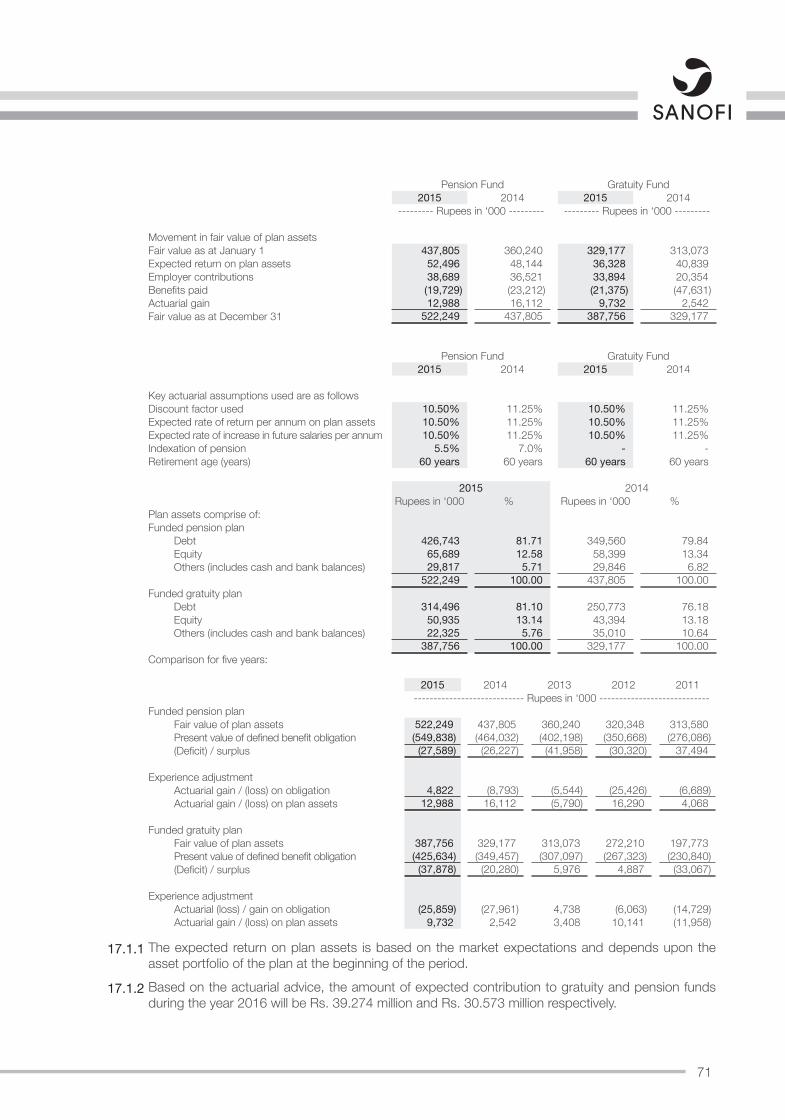
71
Pension Fund Gratuity Fund 2015 2014 2015 2014
--------- Rupees in ‘000 --------- --------- Rupees in ‘000 ---------
Movement in fair value of plan assetsFair value as at January 1 437,805 360,240 329,177 313,073 Expected return on plan assets 52,496 48,144 36,328 40,839 Employer contributions 38,689 36,521 33,894 20,354 Benefits paid (19,729) (23,212) (21,375) (47,631)Actuarial gain 12,988 16,112 9,732 2,542 Fair value as at December 31 522,249 437,805 387,756 329,177
Pension Fund Gratuity Fund2015 2014 2015 2014
Key actuarial assumptions used are as followsDiscount factor used 10.50% 11.25% 10.50% 11.25%Expected rate of return per annum on plan assets 10.50% 11.25% 10.50% 11.25%Expected rate of increase in future salaries per annum 10.50% 11.25% 10.50% 11.25%Indexation of pension 5.5% 7.0% - - Retirement age (years) 60 years 60 years 60 years 60 years
2015 2014Rupees in ‘000 % Rupees in ‘000 %
Plan assets comprise of:Funded pension plan
Debt 426,743 81.71 349,560 79.84 Equity 65,689 12.58 58,399 13.34 Others (includes cash and bank balances) 29,817 5.71 29,846 6.82
522,249 100.00 437,805 100.00 Funded gratuity plan
Debt 314,496 81.10 250,773 76.18 Equity 50,935 13.14 43,394 13.18 Others (includes cash and bank balances) 22,325 5.76 35,010 10.64
387,756 100.00 329,177 100.00 Comparison for five years:
2015 2014 2013 2012 2011 ---------------------------- Rupees in ‘000 ----------------------------
Funded pension planFair value of plan assets 522,249 437,805 360,240 320,348 313,580 Present value of defined benefit obligation (549,838) (464,032) (402,198) (350,668) (276,086)(Deficit) / surplus (27,589) (26,227) (41,958) (30,320) 37,494
Experience adjustmentActuarial gain / (loss) on obligation 4,822 (8,793) (5,544) (25,426) (6,689)Actuarial gain / (loss) on plan assets 12,988 16,112 (5,790) 16,290 4,068
Funded gratuity planFair value of plan assets 387,756 329,177 313,073 272,210 197,773 Present value of defined benefit obligation (425,634) (349,457) (307,097) (267,323) (230,840)(Deficit) / surplus (37,878) (20,280) 5,976 4,887 (33,067)
Experience adjustmentActuarial (loss) / gain on obligation (25,859) (27,961) 4,738 (6,063) (14,729)Actuarial gain / (loss) on plan assets 9,732 2,542 3,408 10,141 (11,958)
17.1.1 The expected return on plan assets is based on the market expectations and depends upon the asset portfolio of the plan at the beginning of the period.
17.1.2 Based on the actuarial advice, the amount of expected contribution to gratuity and pension funds during the year 2016 will be Rs. 39.274 million and Rs. 30.573 million respectively.

72 Annual Report 2015
For the year ended December 31, 2015
NOTES TO THE FINANCIAL STATEMENTS
17.2 The Company initiated a plan to achieve rationalisation and restructuring. Under this plan, a provision of Rs. 84.922 (2014: Rs. 24) million is made on account of voluntary separation scheme for planned redundancy in respect of its employees. The provision amounting to Rs. 74.652 million (2014: Nil), Rs. 6 million (2014: Rs. 24 million) and Rs. 4.270 million (2014: Nil) pertains to management, unionised and other employees, respectively. The amount is expected to be utilised during the year 2016.
December 31, December 31,Note 2015 2014
17.3 Workers’ Profit Participation Fund --------- Rupees in ‘000 ---------
Balance at the beginning of the year 18,433 29,566 Allocation for the year 23 9,657 18,238
28,090 47,804 Interest on funds utilised in Company’s business 25 190 432
28,280 48,236 Amount paid to the Trustees of the Fund (20,000) (29,803)
8,280 18,433
18. SHORT-TERM BORROWINGS – secured
This represent short term money market loan obtained from commercial banks which are either paid on maturity or rolled over with only the mark-up payment. The average term is one month to six months and average mark-up rate ranges between 0.15% to 0.30% over KIBOR, secured by way of pari passu charge on stock-in-trade and book debts of the Company.
19. RUNNING FINANCE UTILIZED UNDER MARK-UP ARRANGEMENTS – secured
The facilities for running finances available from various banks under mark-up arrangements aggregated to Rs. 4,550 (2014: Rs. 3,030) million. These facilities expire on various dates, latest by December 31, 2016. The mark-up rate is KIBOR + 0.4% (2014: KIBOR + 0.4% to KIBOR + 1.75%). The facilities are secured against first pari passu charge on stock-in-trade and book debts of the Company.
Out of the facilities of Rs. 904 (2014: Rs.904) million for opening the letters of credit, guarantees and bill discounting, the unutilised amount was Rs. 606 (2014: Rs. 560) million as at the end of the year.
20. CONTINGENCIES AND COMMITMENTS
20.1 Contingencies
20.1.1 Claims not acknowledged as debt amounted to Rs. 6.2 (2014: Rs. 6.2) million at the end of the current year.
20.1.2 Inland Revenue, Enforcement & Collection has framed the assessment for the tax year 2009 on the alleged contention that the Company had short deducted income tax from payments made to vendors in respect of sales promotion and advertisement expenditure and raised a demand of Rs. 11.6 million. On the appeal filed by the Company, the Commissioner Inland Revenue (Appeals) remanded back the order to the tax officer with the directions to pass order afresh. The Company has filed an appeal before the Appellate Tribunal Inland Revenue as well as filed a Constitutional Petition before the High Court of Sindh against the said order, which is pending adjudication.
73
Further, Inland Revenue, Enforcement & Collection has framed the order wherein it has been alleged that the Company had not deducted Federal Excise Duty amounting to Rs. 5.2 million at applicable rates from payments made to non-resident persons or permanent establishment of non-resident persons on account of franchise services of Rs. 52.06 million. The Company has filed appeals before the Commissioner Inland Revenue (Appeals) as well as filed a Constitutional Petition before High Court of Sindh against the said order, which is pending adjudication.
During the year ended December 31, 2015, the Deputy Commissioner Inland Revenue, Enforcement & Collection has passed an order under section 122(5) of the Income Tax Ordinance, 2001 for the Tax Year 2013, whereby the liability of the Company for the said tax year has been increased by Rs. 179.153 million on the alleged contention that the Company understated the gain on sale of WAH Site and disallowance of certain expenses related to sales promotion and advertisement. Against the above order, the Company has filed an appeal before the Commissioner Inland Revenue (Appeals), which is pending for hearing.
The management and its tax advisor are of the view that the final outcome of the above referred matters will be in favour of the Company, hence, provisions for the aforementioned amounts have not been made in these financial statements, pending a final decision in this matter.
20.1.3 During the year ended December 31, 2012, the Company disposed off its Wah Site to M/s COMSATS for an amount of Rs. 240 million and the possession of property was transferred to the buyer subsequent to the signing of an Agreement to Sell. The Company also obtained a ‘No Tax Demand’ Certificate from the Wah Cantonment Board before the sale was finalised. However, thereafter, the Wah Cantonment Board revised its assessment of the rental value of the property retrospectively from July 1, 2011 resulting in the levy of an additional amount of house tax on the Company amounting to Rs. 28.7 million. Additionally, the Wah Cantonment also levied composition tax (composition fee), TIP tax, building drawings fee and miscellaneous charges amounting to Rs. 71.2 million on grounds that the construction / upgrading of buildings that took place in 1991 had been undertaken without prior approval from the cantonment authorities.
The Company has challenged this unjustified revision in the rental value at the Director Military Lands and Cantonments (DMLC), Rawalpindi Region. The DMLC directed the Wah Cantonment Board assessment committee to decide the matter afresh and provide convincing reasons for change in the rental value.
The Company has been pursuing this matter in the court as well as endeavoring to settle out of court. The management based on legal advisor’s view is of the opinion that the demand raised by Wah Cantonment Board is unjustified and unlawful and is hopeful that the matter will be decided in favor of the Company by the appellate forums.
Subsequent to the year end, the Wah Cantonment Board has filed application at the Civil Courts Taxila for the recovery of the Composition Fee. The Company will appear in the hearing through external counsel to challenge the same.
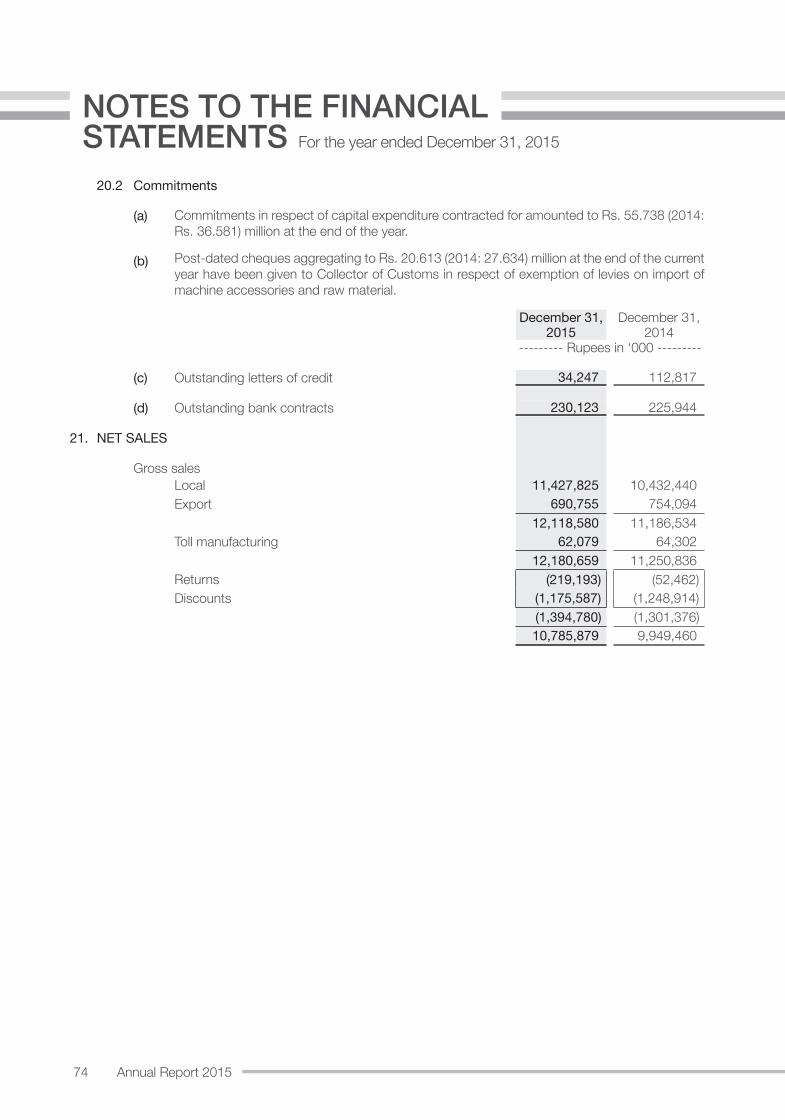
74 Annual Report 2015
For the year ended December 31, 2015
NOTES TO THE FINANCIAL STATEMENTS
20.2 Commitments
(a) Commitments in respect of capital expenditure contracted for amounted to Rs. 55.738 (2014: Rs. 36.581) million at the end of the year.
(b) Post-dated cheques aggregating to Rs. 20.613 (2014: 27.634) million at the end of the current year have been given to Collector of Customs in respect of exemption of levies on import of machine accessories and raw material.
December 31, December 31,2015 2014
--------- Rupees in ‘000 ---------
(c) Outstanding letters of credit 34,247 112,817
(d) Outstanding bank contracts 230,123 225,944
21. NET SALES
Gross salesLocal 11,427,825 10,432,440 Export 690,755 754,094
12,118,580 11,186,534 Toll manufacturing 62,079 64,302
12,180,659 11,250,836 Returns (219,193) (52,462)Discounts (1,175,587) (1,248,914)
(1,394,780) (1,301,376) 10,785,879 9,949,460
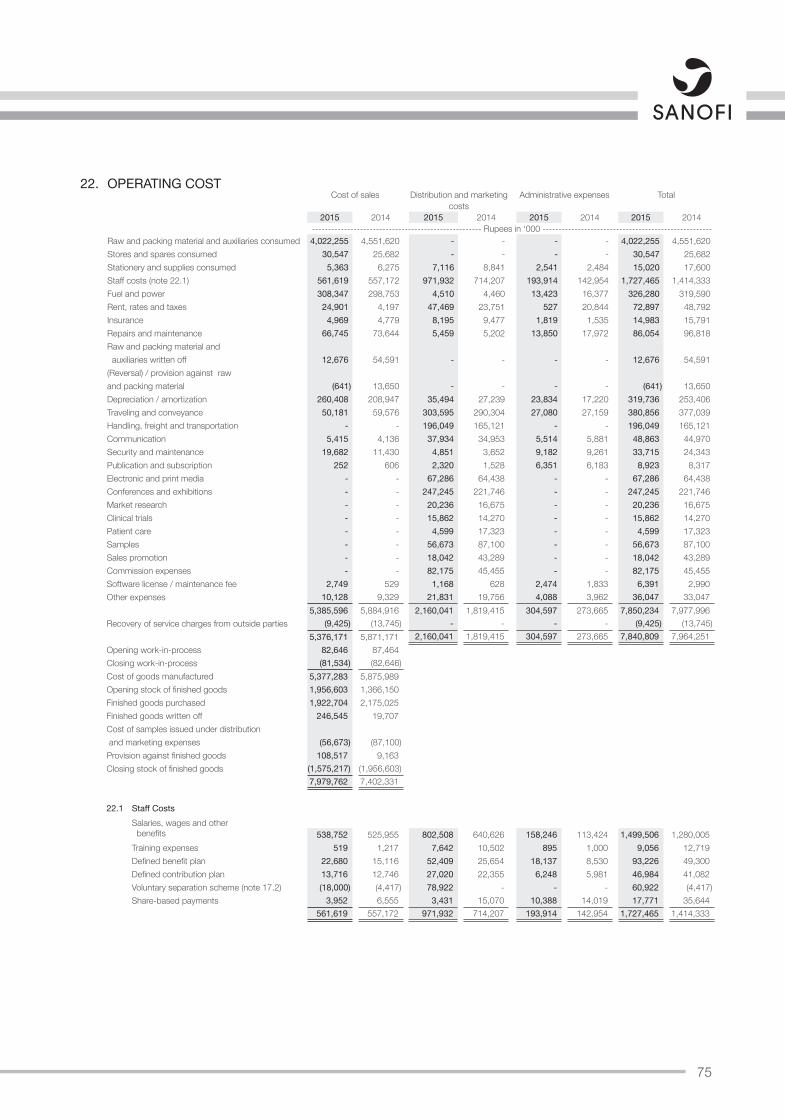
75
22. OPERATING COSTCost of sales Distribution and marketing Administrative expenses Total
costs2015 2014 2015 2014 2015 2014 2015 2014
----------------------------------------------------- Rupees in ‘000 -----------------------------------------------------Raw and packing material and auxiliaries consumed 4,022,255 4,551,620 - - - - 4,022,255 4,551,620 Stores and spares consumed 30,547 25,682 - - - - 30,547 25,682 Stationery and supplies consumed 5,363 6,275 7,116 8,841 2,541 2,484 15,020 17,600 Staff costs (note 22.1) 561,619 557,172 971,932 714,207 193,914 142,954 1,727,465 1,414,333 Fuel and power 308,347 298,753 4,510 4,460 13,423 16,377 326,280 319,590 Rent, rates and taxes 24,901 4,197 47,469 23,751 527 20,844 72,897 48,792 Insurance 4,969 4,779 8,195 9,477 1,819 1,535 14,983 15,791 Repairs and maintenance 66,745 73,644 5,459 5,202 13,850 17,972 86,054 96,818 Raw and packing material and auxiliaries written off 12,676 54,591 - - - - 12,676 54,591 (Reversal) / provision against raw and packing material (641) 13,650 - - - - (641) 13,650 Depreciation / amortization 260,408 208,947 35,494 27,239 23,834 17,220 319,736 253,406 Traveling and conveyance 50,181 59,576 303,595 290,304 27,080 27,159 380,856 377,039 Handling, freight and transportation - - 196,049 165,121 - - 196,049 165,121 Communication 5,415 4,136 37,934 34,953 5,514 5,881 48,863 44,970 Security and maintenance 19,682 11,430 4,851 3,652 9,182 9,261 33,715 24,343 Publication and subscription 252 606 2,320 1,528 6,351 6,183 8,923 8,317 Electronic and print media - - 67,286 64,438 - - 67,286 64,438 Conferences and exhibitions - - 247,245 221,746 - - 247,245 221,746 Market research - - 20,236 16,675 - - 20,236 16,675 Clinical trials - - 15,862 14,270 - - 15,862 14,270 Patient care - - 4,599 17,323 - - 4,599 17,323 Samples - - 56,673 87,100 - - 56,673 87,100 Sales promotion - - 18,042 43,289 - - 18,042 43,289 Commission expenses - - 82,175 45,455 - - 82,175 45,455 Software license / maintenance fee 2,749 529 1,168 628 2,474 1,833 6,391 2,990 Other expenses 10,128 9,329 21,831 19,756 4,088 3,962 36,047 33,047
5,385,596 5,884,916 2,160,041 1,819,415 304,597 273,665 7,850,234 7,977,996 Recovery of service charges from outside parties (9,425) (13,745) - - - - (9,425) (13,745)
5,376,171 5,871,171 2,160,041 1,819,415 304,597 273,665 7,840,809 7,964,251 Opening work-in-process 82,646 87,464 Closing work-in-process (81,534) (82,646)Cost of goods manufactured 5,377,283 5,875,989 Opening stock of finished goods 1,956,603 1,366,150 Finished goods purchased 1,922,704 2,175,025 Finished goods written off 246,545 19,707 Cost of samples issued under distribution and marketing expenses (56,673) (87,100)Provision against finished goods 108,517 9,163 Closing stock of finished goods (1,575,217) (1,956,603)
7,979,762 7,402,331
22.1 Staff CostsSalaries, wages and other benefits 538,752 525,955 802,508 640,626 158,246 113,424 1,499,506 1,280,005 Training expenses 519 1,217 7,642 10,502 895 1,000 9,056 12,719 Defined benefit plan 22,680 15,116 52,409 25,654 18,137 8,530 93,226 49,300 Defined contribution plan 13,716 12,746 27,020 22,355 6,248 5,981 46,984 41,082 Voluntary separation scheme (note 17.2) (18,000) (4,417) 78,922 - - - 60,922 (4,417)Share-based payments 3,952 6,555 3,431 15,070 10,388 14,019 17,771 35,644
561,619 557,172 971,932 714,207 193,914 142,954 1,727,465 1,414,333
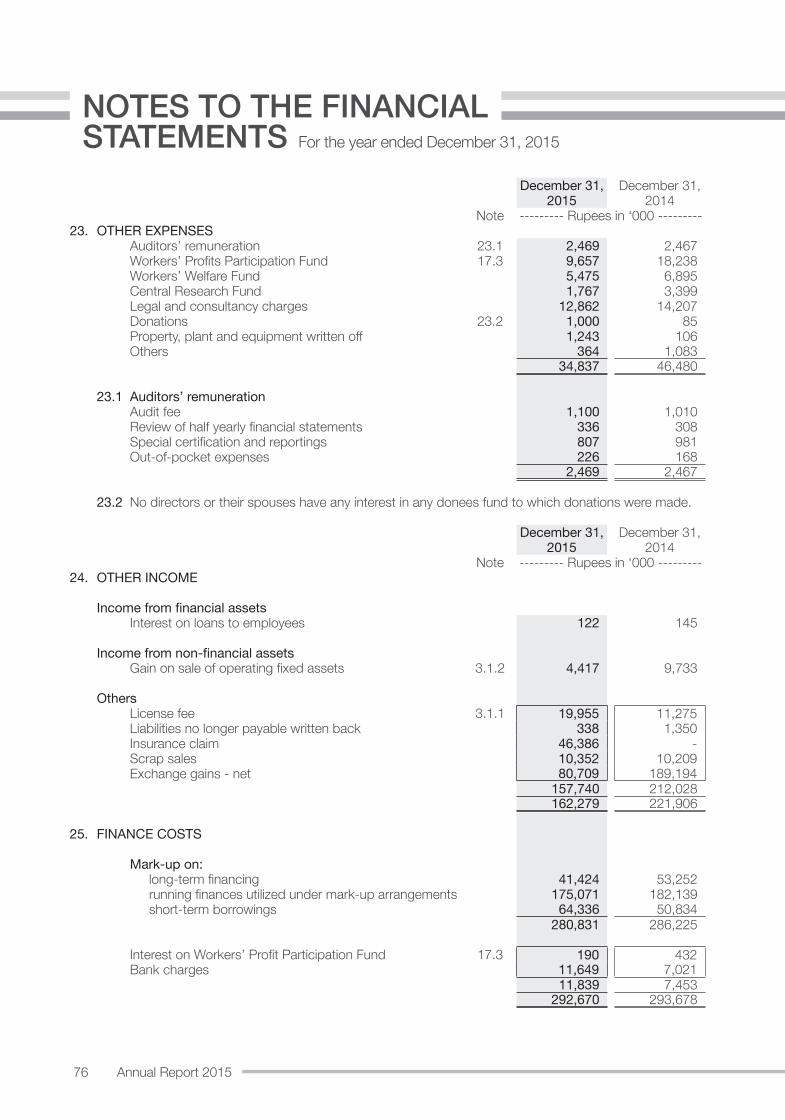
76 Annual Report 2015
For the year ended December 31, 2015
NOTES TO THE FINANCIAL STATEMENTS
December 31, December 31,2015 2014
Note --------- Rupees in ‘000 ---------23. OTHER EXPENSES
Auditors’ remuneration 23.1 2,469 2,467 Workers’ Profits Participation Fund 17.3 9,657 18,238 Workers’ Welfare Fund 5,475 6,895 Central Research Fund 1,767 3,399 Legal and consultancy charges 12,862 14,207 Donations 23.2 1,000 85 Property, plant and equipment written off 1,243 106 Others 364 1,083
34,837 46,480
23.1 Auditors’ remunerationAudit fee 1,100 1,010 Review of half yearly financial statements 336 308 Special certification and reportings 807 981 Out-of-pocket expenses 226 168
2,469 2,467
23.2 No directors or their spouses have any interest in any donees fund to which donations were made.
December 31, December 31,2015 2014
Note --------- Rupees in ‘000 ---------24. OTHER INCOME
Income from financial assetsInterest on loans to employees 122 145
Income from non-financial assetsGain on sale of operating fixed assets 3.1.2 4,417 9,733
OthersLicense fee 3.1.1 19,955 11,275 Liabilities no longer payable written back 338 1,350 Insurance claim 46,386 - Scrap sales 10,352 10,209 Exchange gains - net 80,709 189,194
157,740 212,028 162,279 221,906
25. FINANCE COSTS
Mark-up on:long-term financing 41,424 53,252 running finances utilized under mark-up arrangements 175,071 182,139 short-term borrowings 64,336 50,834
280,831 286,225
Interest on Workers’ Profit Participation Fund 17.3 190 432 Bank charges 11,649 7,021
11,839 7,453 292,670 293,678
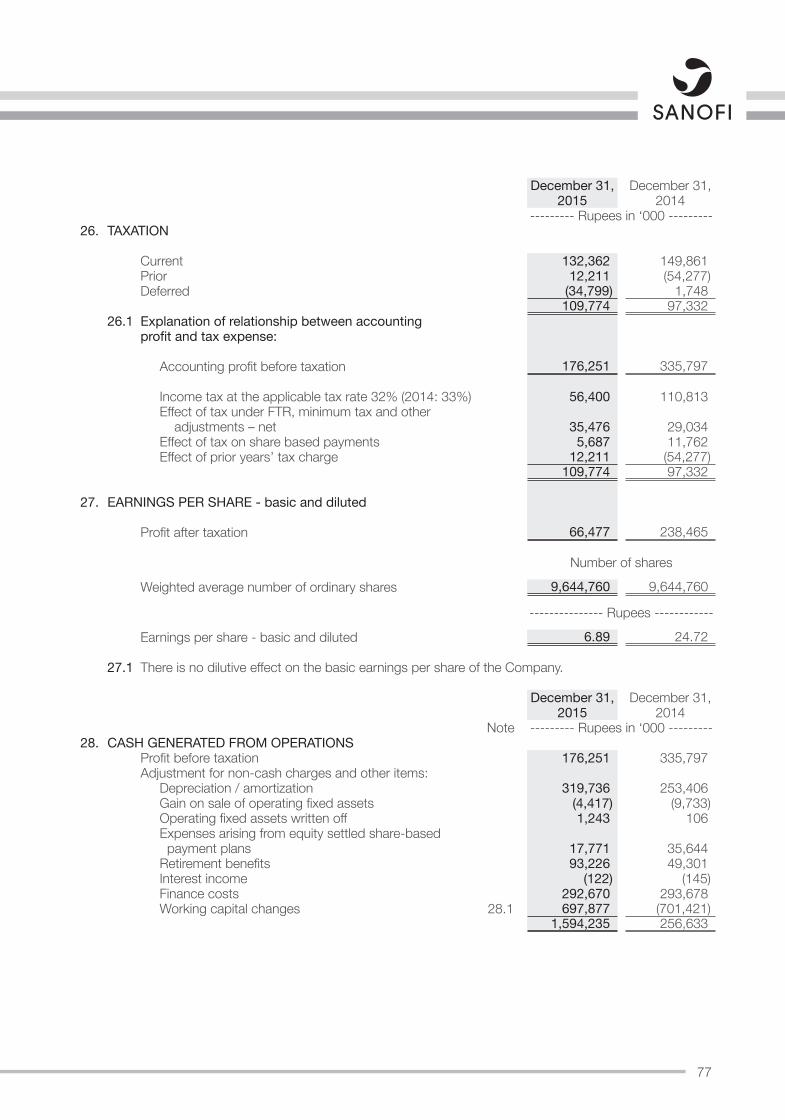
77
December 31, December 31,2015 2014
--------- Rupees in ‘000 ---------26. TAXATION
Current 132,362 149,861 Prior 12,211 (54,277)Deferred (34,799) 1,748
109,774 97,332 26.1 Explanation of relationship between accounting
profit and tax expense:
Accounting profit before taxation 176,251 335,797
Income tax at the applicable tax rate 32% (2014: 33%) 56,400 110,813 Effect of tax under FTR, minimum tax and other adjustments – net 35,476 29,034 Effect of tax on share based payments 5,687 11,762 Effect of prior years’ tax charge 12,211 (54,277)
109,774 97,332
27. EARNINGS PER SHARE - basic and diluted
Profit after taxation 66,477 238,465
Number of shares
Weighted average number of ordinary shares 9,644,760 9,644,760
--------------- Rupees ------------
Earnings per share - basic and diluted 6.89 24.72
27.1 There is no dilutive effect on the basic earnings per share of the Company.
December 31, December 31,2015 2014
Note --------- Rupees in ‘000 ---------28. CASH GENERATED FROM OPERATIONS
Profit before taxation 176,251 335,797 Adjustment for non-cash charges and other items:
Depreciation / amortization 319,736 253,406 Gain on sale of operating fixed assets (4,417) (9,733)Operating fixed assets written off 1,243 106 Expenses arising from equity settled share-based payment plans 17,771 35,644 Retirement benefits 93,226 49,301 Interest income (122) (145)Finance costs 292,670 293,678 Working capital changes 28.1 697,877 (701,421)
1,594,235 256,633
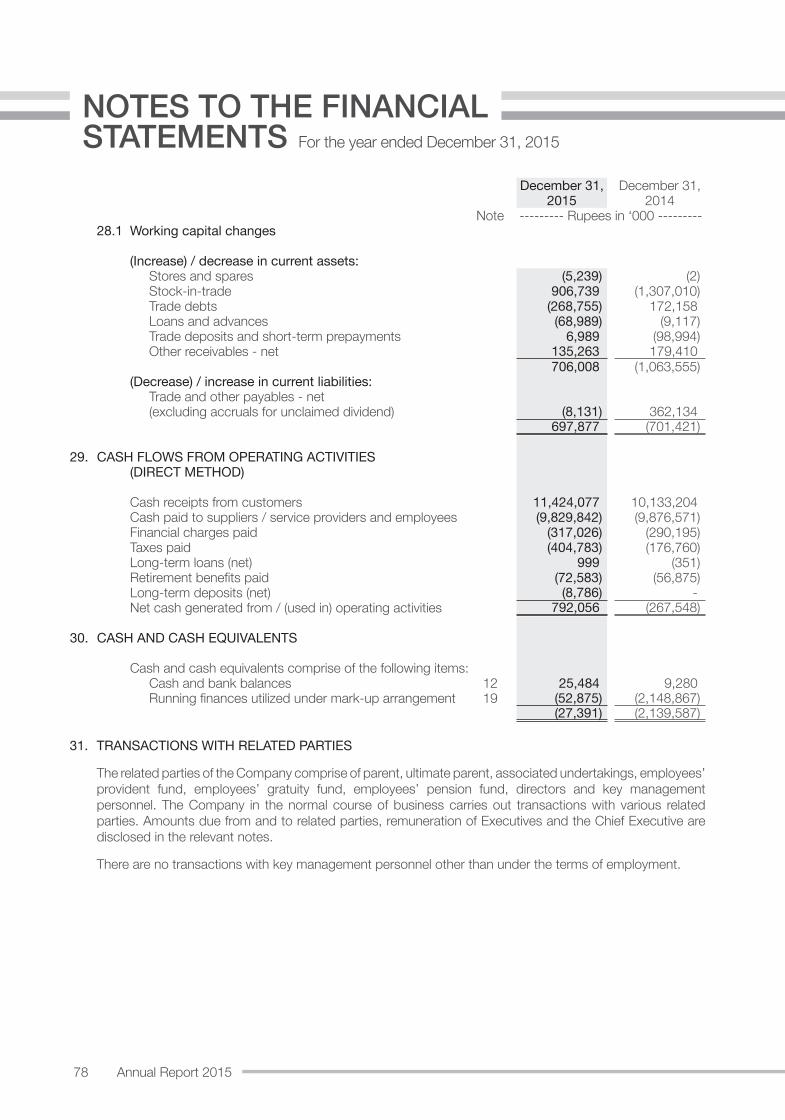
78 Annual Report 2015
For the year ended December 31, 2015
NOTES TO THE FINANCIAL STATEMENTS
December 31, December 31,2015 2014
Note --------- Rupees in ‘000 ---------28.1 Working capital changes
(Increase) / decrease in current assets:Stores and spares (5,239) (2)Stock-in-trade 906,739 (1,307,010)Trade debts (268,755) 172,158 Loans and advances (68,989) (9,117)Trade deposits and short-term prepayments 6,989 (98,994)Other receivables - net 135,263 179,410
706,008 (1,063,555)(Decrease) / increase in current liabilities:
Trade and other payables - net(excluding accruals for unclaimed dividend) (8,131) 362,134
697,877 (701,421)
29. CASH FLOWS FROM OPERATING ACTIVITIES(DIRECT METHOD)
Cash receipts from customers 11,424,077 10,133,204 Cash paid to suppliers / service providers and employees (9,829,842) (9,876,571)Financial charges paid (317,026) (290,195)Taxes paid (404,783) (176,760)Long-term loans (net) 999 (351)Retirement benefits paid (72,583) (56,875)Long-term deposits (net) (8,786) - Net cash generated from / (used in) operating activities 792,056 (267,548)
30. CASH AND CASH EQUIVALENTS
Cash and cash equivalents comprise of the following items:Cash and bank balances 12 25,484 9,280 Running finances utilized under mark-up arrangement 19 (52,875) (2,148,867)
(27,391) (2,139,587)
31. TRANSACTIONS WITH RELATED PARTIES
The related parties of the Company comprise of parent, ultimate parent, associated undertakings, employees’ provident fund, employees’ gratuity fund, employees’ pension fund, directors and key management personnel. The Company in the normal course of business carries out transactions with various related parties. Amounts due from and to related parties, remuneration of Executives and the Chief Executive are disclosed in the relevant notes.
There are no transactions with key management personnel other than under the terms of employment.
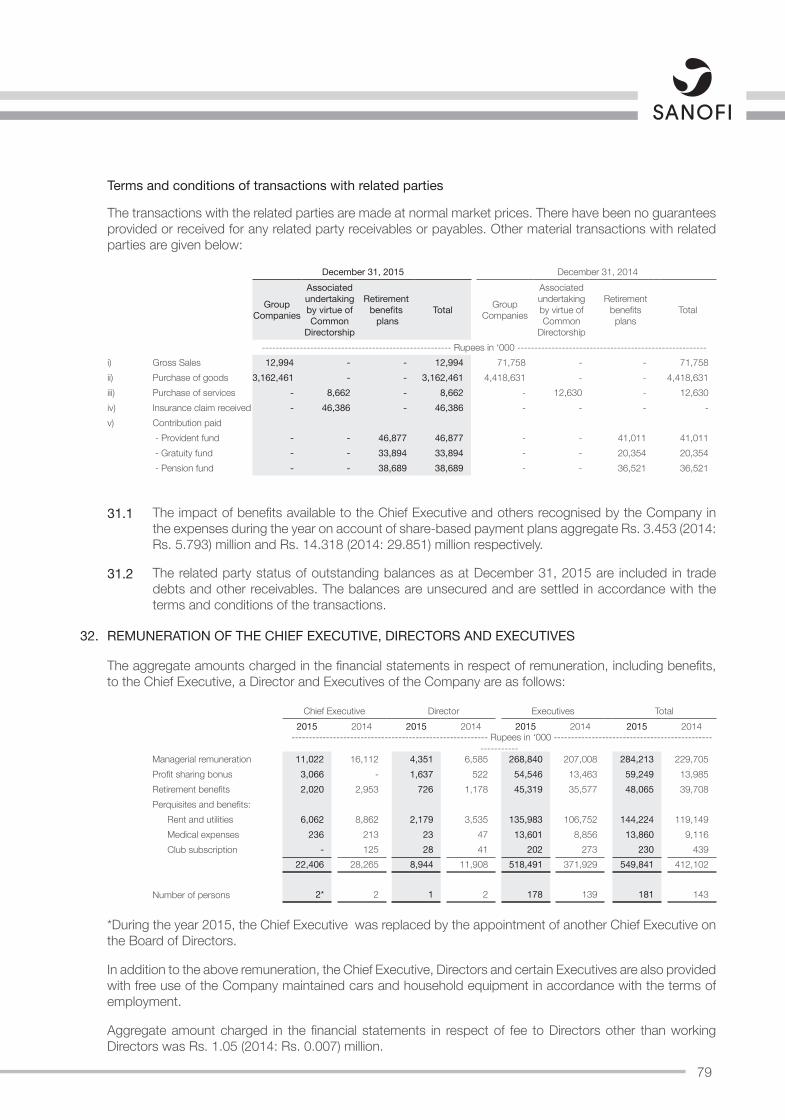
79
Terms and conditions of transactions with related parties
The transactions with the related parties are made at normal market prices. There have been no guarantees provided or received for any related party receivables or payables. Other material transactions with related parties are given below:
December 31, 2015 December 31, 2014
Group Companies
Associated undertaking by virtue of Common
Directorship
Retirement benefits plans
Total Group Companies
Associated undertaking by virtue of Common
Directorship
Retirement benefits plans
Total
------------------------------------------------------- Rupees in ‘000 -------------------------------------------------------i) Gross Sales 12,994 - - 12,994 71,758 - - 71,758 ii) Purchase of goods 3,162,461 - - 3,162,461 4,418,631 - - 4,418,631 iii) Purchase of services - 8,662 - 8,662 - 12,630 - 12,630 iv) Insurance claim received - 46,386 - 46,386 - - - - v) Contribution paid
- Provident fund - - 46,877 46,877 - - 41,011 41,011 - Gratuity fund - - 33,894 33,894 - - 20,354 20,354 - Pension fund - - 38,689 38,689 - - 36,521 36,521
31.1 The impact of benefits available to the Chief Executive and others recognised by the Company in the expenses during the year on account of share-based payment plans aggregate Rs. 3.453 (2014: Rs. 5.793) million and Rs. 14.318 (2014: 29.851) million respectively.
31.2 The related party status of outstanding balances as at December 31, 2015 are included in trade debts and other receivables. The balances are unsecured and are settled in accordance with the terms and conditions of the transactions.
32. REMUNERATION OF THE CHIEF EXECUTIVE, DIRECTORS AND EXECUTIVES
The aggregate amounts charged in the financial statements in respect of remuneration, including benefits, to the Chief Executive, a Director and Executives of the Company are as follows:
Chief Executive Director Executives Total2015 2014 2015 2014 2015 2014 2015 2014
--------------------------------------------------------- Rupees in ‘000 ---------------------------------------------------------
Managerial remuneration 11,022 16,112 4,351 6,585 268,840 207,008 284,213 229,705 Profit sharing bonus 3,066 - 1,637 522 54,546 13,463 59,249 13,985 Retirement benefits 2,020 2,953 726 1,178 45,319 35,577 48,065 39,708 Perquisites and benefits:
Rent and utilities 6,062 8,862 2,179 3,535 135,983 106,752 144,224 119,149 Medical expenses 236 213 23 47 13,601 8,856 13,860 9,116 Club subscription - 125 28 41 202 273 230 439
22,406 28,265 8,944 11,908 518,491 371,929 549,841 412,102
Number of persons 2* 2 1 2 178 139 181 143
*During the year 2015, the Chief Executive was replaced by the appointment of another Chief Executive on the Board of Directors.
In addition to the above remuneration, the Chief Executive, Directors and certain Executives are also provided with free use of the Company maintained cars and household equipment in accordance with the terms of employment.
Aggregate amount charged in the financial statements in respect of fee to Directors other than working Directors was Rs. 1.05 (2014: Rs. 0.007) million.
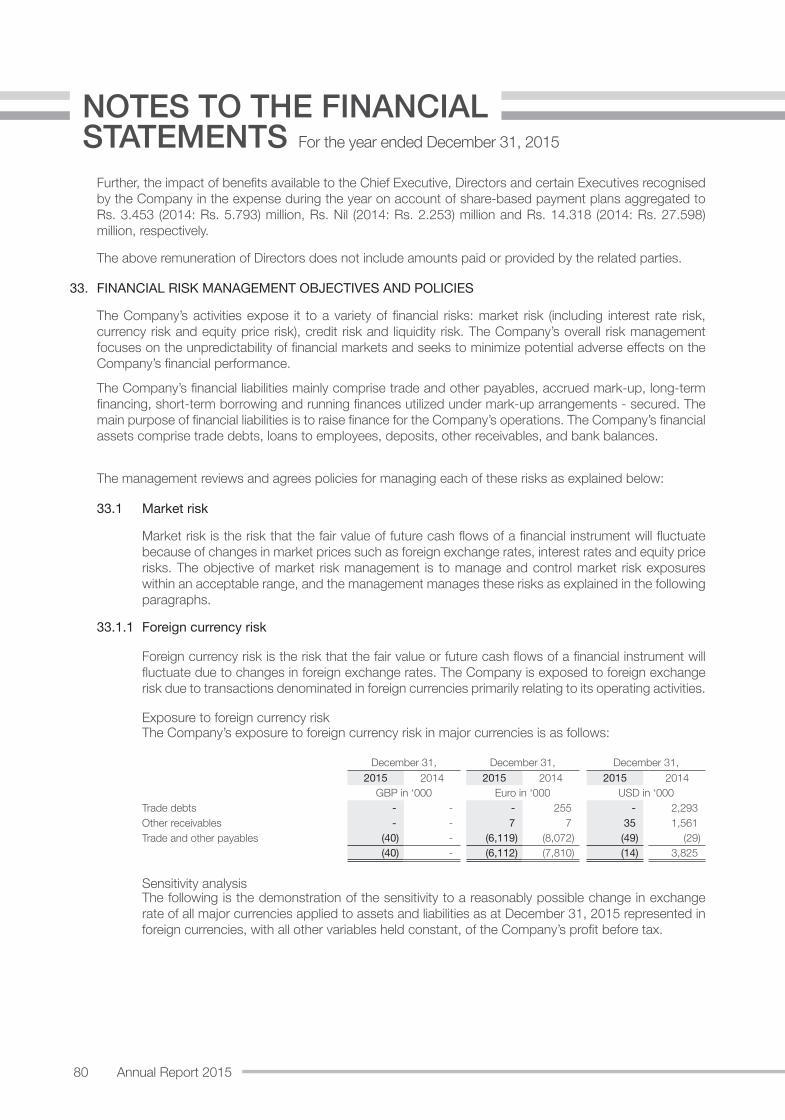
80 Annual Report 2015
For the year ended December 31, 2015
NOTES TO THE FINANCIAL STATEMENTS
Further, the impact of benefits available to the Chief Executive, Directors and certain Executives recognised by the Company in the expense during the year on account of share-based payment plans aggregated to Rs. 3.453 (2014: Rs. 5.793) million, Rs. Nil (2014: Rs. 2.253) million and Rs. 14.318 (2014: Rs. 27.598) million, respectively.
The above remuneration of Directors does not include amounts paid or provided by the related parties.
33. FINANCIAL RISK MANAGEMENT OBJECTIVES AND POLICIES
The Company’s activities expose it to a variety of financial risks: market risk (including interest rate risk, currency risk and equity price risk), credit risk and liquidity risk. The Company’s overall risk management focuses on the unpredictability of financial markets and seeks to minimize potential adverse effects on the Company’s financial performance.
The Company’s financial liabilities mainly comprise trade and other payables, accrued mark-up, long-term financing, short-term borrowing and running finances utilized under mark-up arrangements - secured. The main purpose of financial liabilities is to raise finance for the Company’s operations. The Company’s financial assets comprise trade debts, loans to employees, deposits, other receivables, and bank balances.
The management reviews and agrees policies for managing each of these risks as explained below:
33.1 Market risk
Market risk is the risk that the fair value of future cash flows of a financial instrument will fluctuate because of changes in market prices such as foreign exchange rates, interest rates and equity price risks. The objective of market risk management is to manage and control market risk exposures within an acceptable range, and the management manages these risks as explained in the following paragraphs.
33.1.1 Foreign currency risk
Foreign currency risk is the risk that the fair value or future cash flows of a financial instrument will fluctuate due to changes in foreign exchange rates. The Company is exposed to foreign exchange risk due to transactions denominated in foreign currencies primarily relating to its operating activities.
Exposure to foreign currency riskThe Company’s exposure to foreign currency risk in major currencies is as follows:
December 31, December 31, December 31,2015 2014 2015 2014 2015 2014
GBP in ‘000 Euro in ‘000 USD in ‘000Trade debts - - - 255 - 2,293 Other receivables - - 7 7 35 1,561 Trade and other payables (40) - (6,119) (8,072) (49) (29)
(40) - (6,112) (7,810) (14) 3,825
Sensitivity analysisThe following is the demonstration of the sensitivity to a reasonably possible change in exchange rate of all major currencies applied to assets and liabilities as at December 31, 2015 represented in foreign currencies, with all other variables held constant, of the Company’s profit before tax.
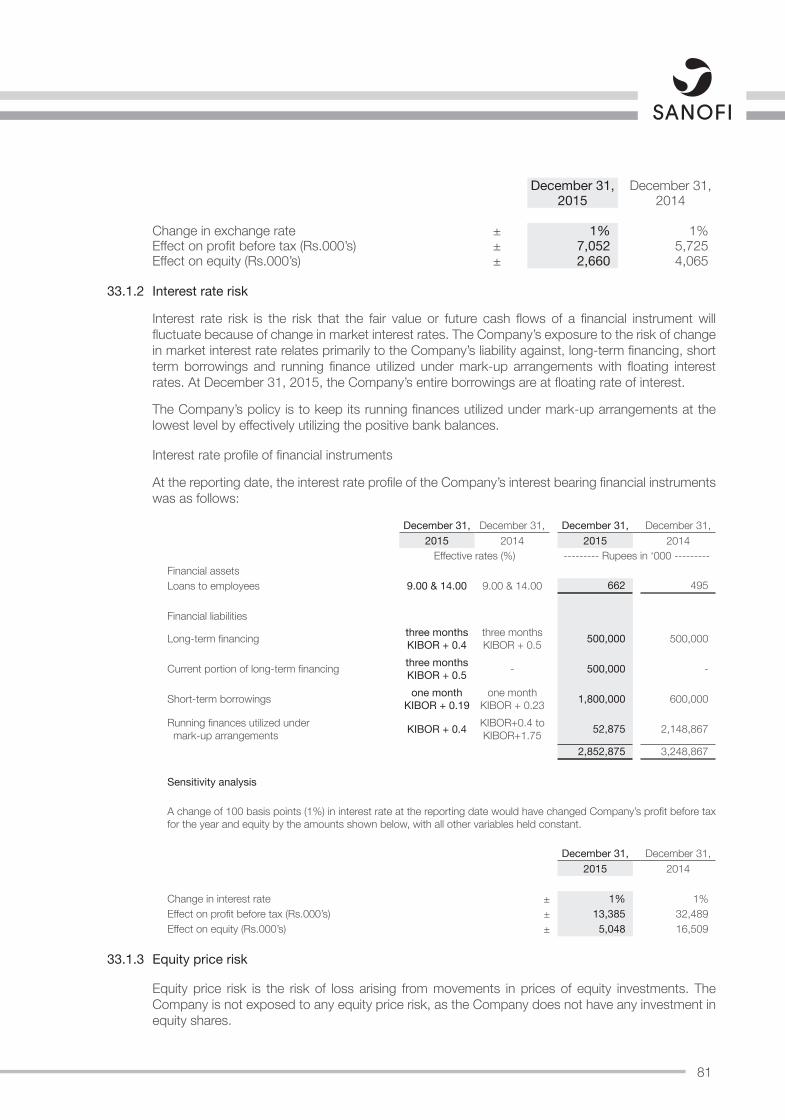
81
December 31, December 31,2015 2014
Change in exchange rate ± 1% 1%Effect on profit before tax (Rs.000’s) ± 7,052 5,725 Effect on equity (Rs.000’s) ± 2,660 4,065
33.1.2 Interest rate risk
Interest rate risk is the risk that the fair value or future cash flows of a financial instrument will fluctuate because of change in market interest rates. The Company’s exposure to the risk of change in market interest rate relates primarily to the Company’s liability against, long-term financing, short term borrowings and running finance utilized under mark-up arrangements with floating interest rates. At December 31, 2015, the Company’s entire borrowings are at floating rate of interest.
The Company’s policy is to keep its running finances utilized under mark-up arrangements at the lowest level by effectively utilizing the positive bank balances.
Interest rate profile of financial instruments
At the reporting date, the interest rate profile of the Company’s interest bearing financial instruments was as follows:
December 31, December 31, December 31, December 31,2015 2014 2015 2014
Effective rates (%) --------- Rupees in ‘000 ---------Financial assetsLoans to employees 9.00 & 14.00 9.00 & 14.00 662 495
Financial liabilities
Long-term financing three months KIBOR + 0.4
three months KIBOR + 0.5 500,000 500,000
Current portion of long-term financing three months KIBOR + 0.5 - 500,000 -
Short-term borrowings one month KIBOR + 0.19
one month KIBOR + 0.23 1,800,000 600,000
Running finances utilized under mark-up arrangements KIBOR + 0.4 KIBOR+0.4 to
KIBOR+1.75 52,875 2,148,867
2,852,875 3,248,867
Sensitivity analysis
A change of 100 basis points (1%) in interest rate at the reporting date would have changed Company’s profit before tax for the year and equity by the amounts shown below, with all other variables held constant.
December 31, December 31,2015 2014
Change in interest rate ± 1% 1%Effect on profit before tax (Rs.000’s) ± 13,385 32,489 Effect on equity (Rs.000’s) ± 5,048 16,509
33.1.3 Equity price risk
Equity price risk is the risk of loss arising from movements in prices of equity investments. The Company is not exposed to any equity price risk, as the Company does not have any investment in equity shares.
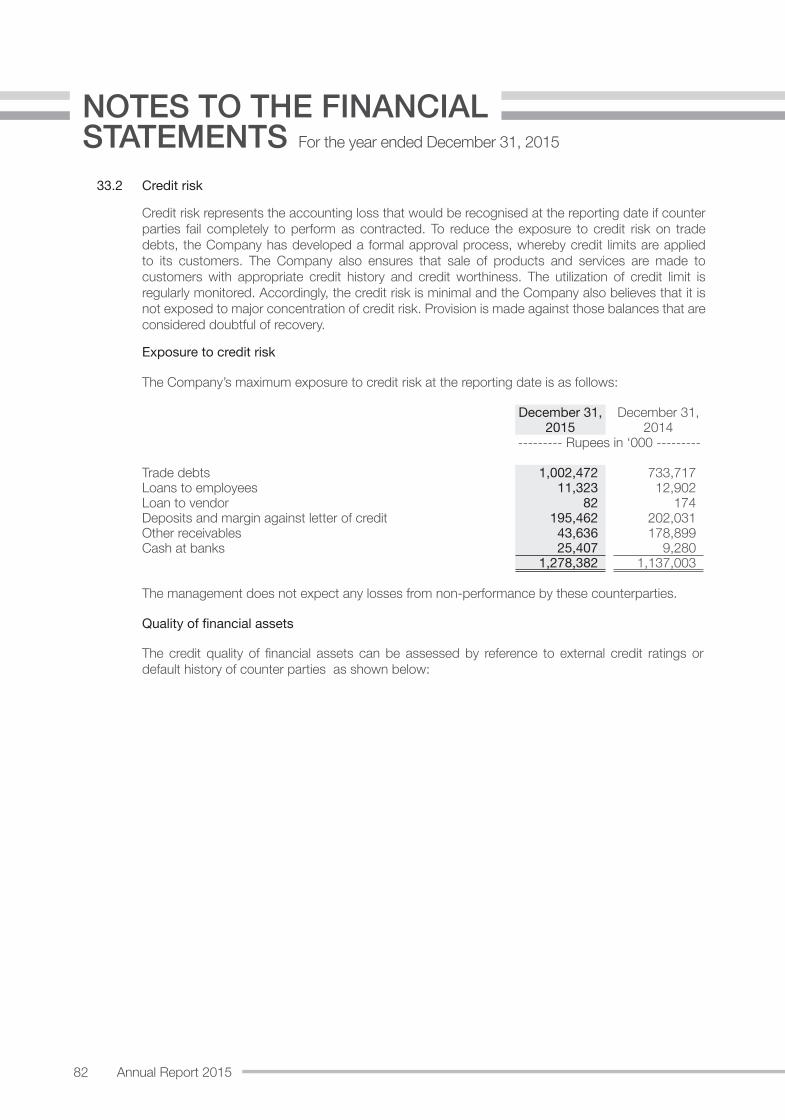
82 Annual Report 2015
For the year ended December 31, 2015
NOTES TO THE FINANCIAL STATEMENTS
33.2 Credit risk
Credit risk represents the accounting loss that would be recognised at the reporting date if counter parties fail completely to perform as contracted. To reduce the exposure to credit risk on trade debts, the Company has developed a formal approval process, whereby credit limits are applied to its customers. The Company also ensures that sale of products and services are made to customers with appropriate credit history and credit worthiness. The utilization of credit limit is regularly monitored. Accordingly, the credit risk is minimal and the Company also believes that it is not exposed to major concentration of credit risk. Provision is made against those balances that are considered doubtful of recovery.
Exposure to credit risk
The Company’s maximum exposure to credit risk at the reporting date is as follows:
December 31, December 31,2015 2014
--------- Rupees in ‘000 ---------
Trade debts 1,002,472 733,717 Loans to employees 11,323 12,902 Loan to vendor 82 174 Deposits and margin against letter of credit 195,462 202,031 Other receivables 43,636 178,899 Cash at banks 25,407 9,280
1,278,382 1,137,003
The management does not expect any losses from non-performance by these counterparties.
Quality of financial assets
The credit quality of financial assets can be assessed by reference to external credit ratings or default history of counter parties as shown below:
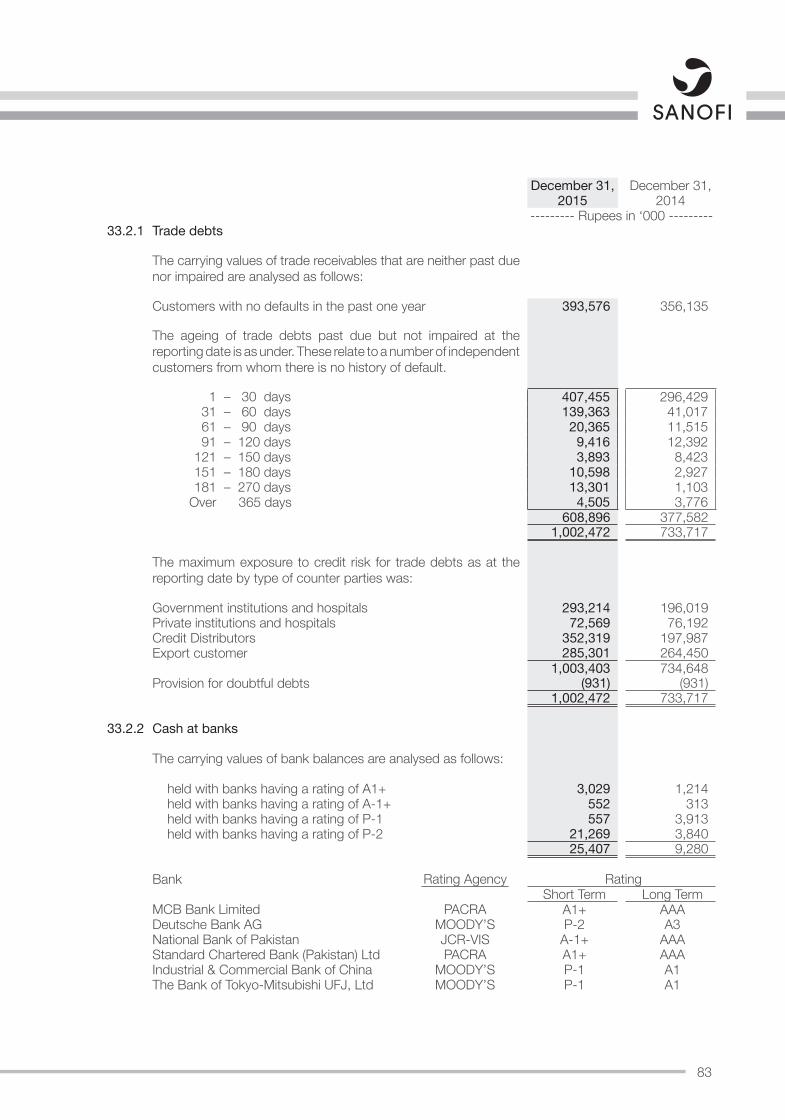
83
December 31, December 31,2015 2014
--------- Rupees in ‘000 ---------33.2.1 Trade debts
The carrying values of trade receivables that are neither past due nor impaired are analysed as follows:
Customers with no defaults in the past one year 393,576 356,135
The ageing of trade debts past due but not impaired at the reporting date is as under. These relate to a number of independent customers from whom there is no history of default.
1 – 30 days 407,455 296,429 31 – 60 days 139,363 41,017 61 – 90 days 20,365 11,515 91 – 120 days 9,416 12,392
121 – 150 days 3,893 8,423 151 – 180 days 10,598 2,927 181 – 270 days 13,301 1,103
Over 365 days 4,505 3,776 608,896 377,582
1,002,472 733,717
The maximum exposure to credit risk for trade debts as at the reporting date by type of counter parties was:
Government institutions and hospitals 293,214 196,019 Private institutions and hospitals 72,569 76,192 Credit Distributors 352,319 197,987 Export customer 285,301 264,450
1,003,403 734,648 Provision for doubtful debts (931) (931)
1,002,472 733,717
33.2.2 Cash at banks
The carrying values of bank balances are analysed as follows:
held with banks having a rating of A1+ 3,029 1,214 held with banks having a rating of A-1+ 552 313 held with banks having a rating of P-1 557 3,913 held with banks having a rating of P-2 21,269 3,840
25,407 9,280
Bank Rating Agency Rating Short Term Long Term
MCB Bank Limited PACRA A1+ AAA Deutsche Bank AG MOODY’S P-2 A3 National Bank of Pakistan JCR-VIS A-1+ AAA Standard Chartered Bank (Pakistan) Ltd PACRA A1+ AAA Industrial & Commercial Bank of China MOODY’S P-1 A1 The Bank of Tokyo-Mitsubishi UFJ, Ltd MOODY’S P-1 A1
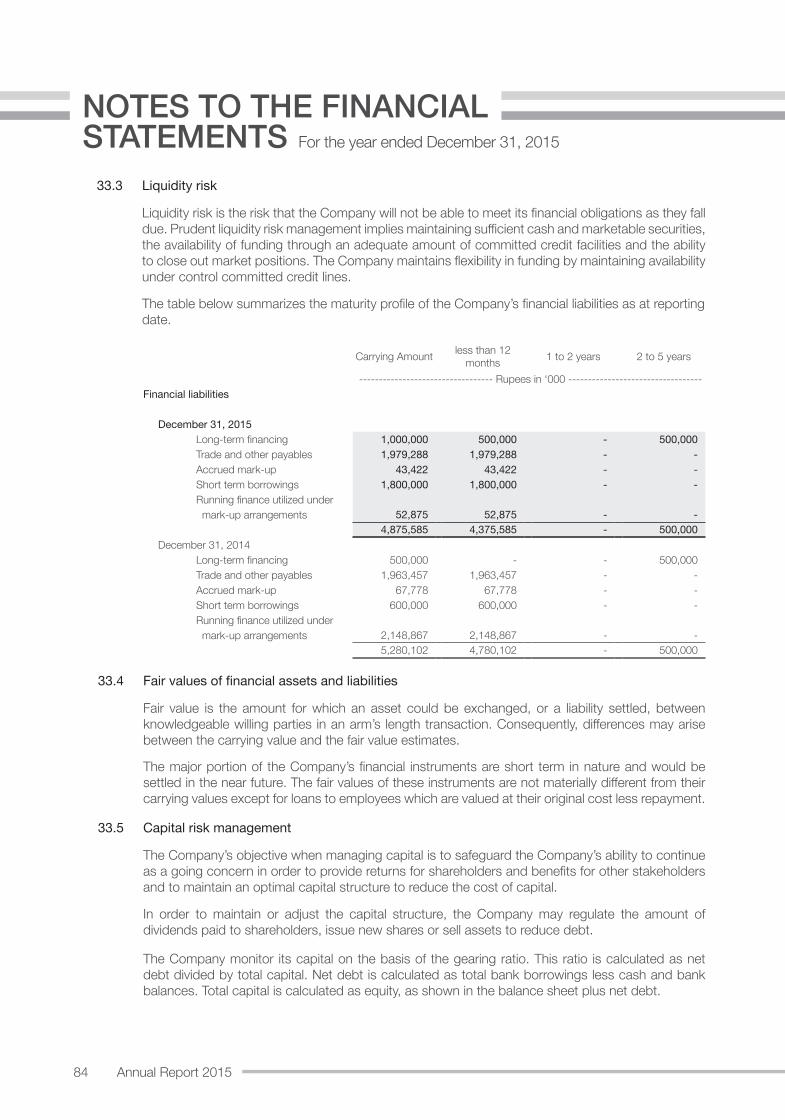
84 Annual Report 2015
For the year ended December 31, 2015
NOTES TO THE FINANCIAL STATEMENTS
33.3 Liquidity risk
Liquidity risk is the risk that the Company will not be able to meet its financial obligations as they fall due. Prudent liquidity risk management implies maintaining sufficient cash and marketable securities, the availability of funding through an adequate amount of committed credit facilities and the ability to close out market positions. The Company maintains flexibility in funding by maintaining availability under control committed credit lines.
The table below summarizes the maturity profile of the Company’s financial liabilities as at reporting date.
Carrying Amount less than 12 months 1 to 2 years 2 to 5 years
---------------------------------- Rupees in ‘000 ----------------------------------Financial liabilities
December 31, 2015Long-term financing 1,000,000 500,000 - 500,000 Trade and other payables 1,979,288 1,979,288 - - Accrued mark-up 43,422 43,422 - - Short term borrowings 1,800,000 1,800,000 - - Running finance utilized under mark-up arrangements 52,875 52,875 - -
4,875,585 4,375,585 - 500,000 December 31, 2014
Long-term financing 500,000 - - 500,000 Trade and other payables 1,963,457 1,963,457 - - Accrued mark-up 67,778 67,778 - - Short term borrowings 600,000 600,000 - - Running finance utilized under mark-up arrangements 2,148,867 2,148,867 - -
5,280,102 4,780,102 - 500,000
33.4 Fair values of financial assets and liabilities
Fair value is the amount for which an asset could be exchanged, or a liability settled, between knowledgeable willing parties in an arm’s length transaction. Consequently, differences may arise between the carrying value and the fair value estimates.
The major portion of the Company’s financial instruments are short term in nature and would be settled in the near future. The fair values of these instruments are not materially different from their carrying values except for loans to employees which are valued at their original cost less repayment.
33.5 Capital risk management
The Company’s objective when managing capital is to safeguard the Company’s ability to continue as a going concern in order to provide returns for shareholders and benefits for other stakeholders and to maintain an optimal capital structure to reduce the cost of capital.
In order to maintain or adjust the capital structure, the Company may regulate the amount of dividends paid to shareholders, issue new shares or sell assets to reduce debt.
The Company monitor its capital on the basis of the gearing ratio. This ratio is calculated as net debt divided by total capital. Net debt is calculated as total bank borrowings less cash and bank balances. Total capital is calculated as equity, as shown in the balance sheet plus net debt.
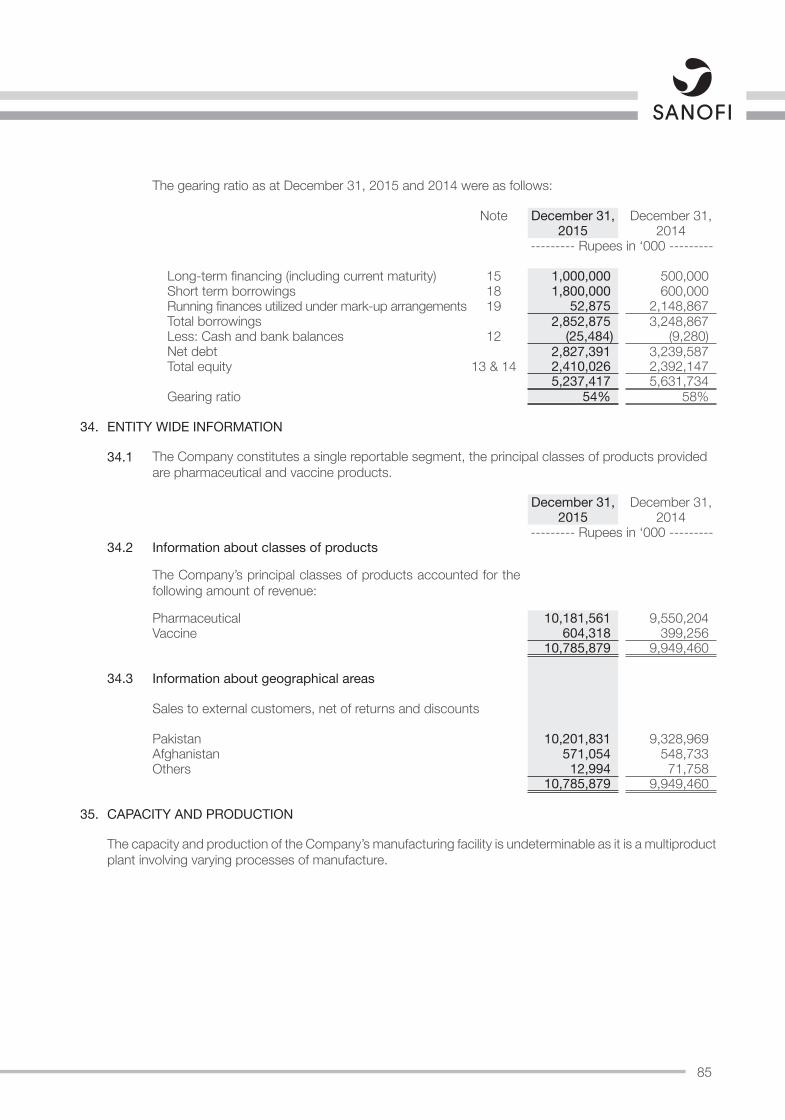
85
The gearing ratio as at December 31, 2015 and 2014 were as follows:
Note December 31, December 31,2015 2014
--------- Rupees in ‘000 ---------
Long-term financing (including current maturity) 15 1,000,000 500,000 Short term borrowings 18 1,800,000 600,000 Running finances utilized under mark-up arrangements 19 52,875 2,148,867 Total borrowings 2,852,875 3,248,867 Less: Cash and bank balances 12 (25,484) (9,280)Net debt 2,827,391 3,239,587 Total equity 13 & 14 2,410,026 2,392,147
5,237,417 5,631,734 Gearing ratio 54% 58%
34. ENTITY WIDE INFORMATION
34.1 The Company constitutes a single reportable segment, the principal classes of products provided are pharmaceutical and vaccine products.
December 31, December 31,2015 2014
--------- Rupees in ‘000 ---------34.2 Information about classes of products
The Company’s principal classes of products accounted for the following amount of revenue:
Pharmaceutical 10,181,561 9,550,204 Vaccine 604,318 399,256
10,785,879 9,949,460
34.3 Information about geographical areas
Sales to external customers, net of returns and discounts
Pakistan 10,201,831 9,328,969 Afghanistan 571,054 548,733 Others 12,994 71,758
10,785,879 9,949,460
35. CAPACITY AND PRODUCTION
The capacity and production of the Company’s manufacturing facility is undeterminable as it is a multiproduct plant involving varying processes of manufacture.
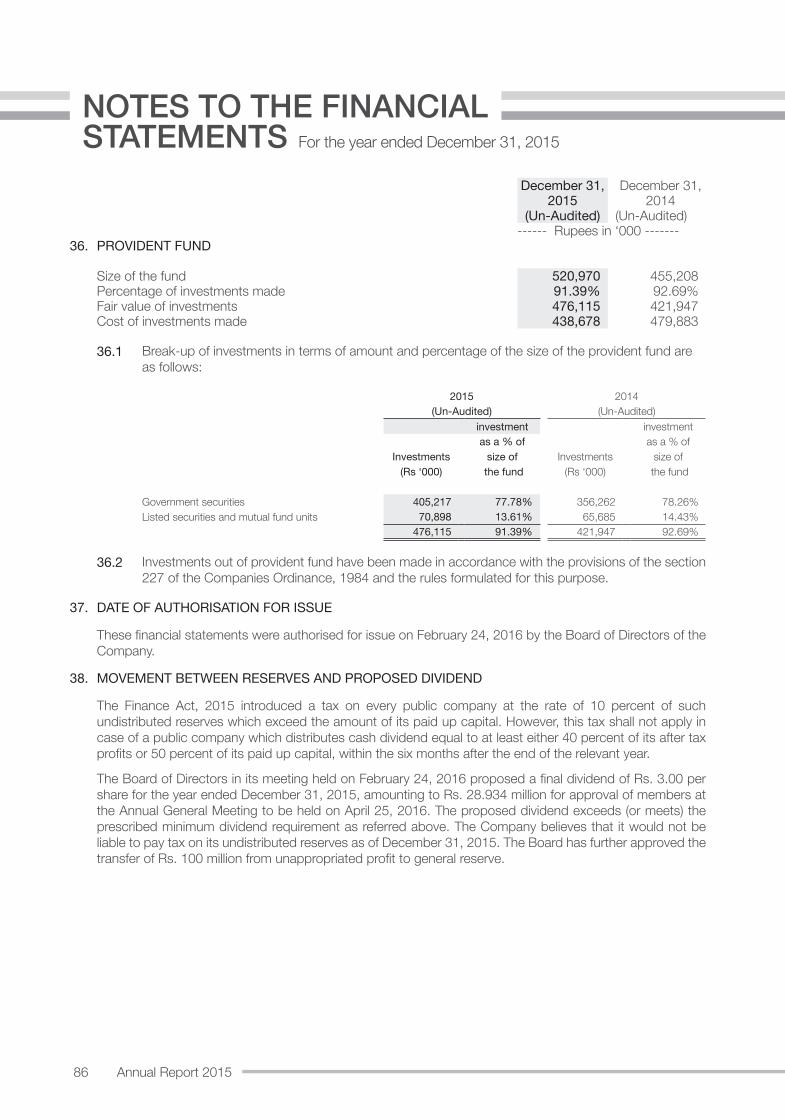
86 Annual Report 2015
For the year ended December 31, 2015
NOTES TO THE FINANCIAL STATEMENTS
December 31, December 31,2015 2014
(Un-Audited) (Un-Audited)------ Rupees in ‘000 -------
36. PROVIDENT FUND
Size of the fund 520,970 455,208 Percentage of investments made 91.39% 92.69%Fair value of investments 476,115 421,947 Cost of investments made 438,678 479,883
36.1 Break-up of investments in terms of amount and percentage of the size of the provident fund are as follows:
2015 2014(Un-Audited) (Un-Audited)
investment investmentas a % of as a % of
Investments size of Investments size of (Rs ‘000) the fund (Rs ‘000) the fund
Government securities 405,217 77.78% 356,262 78.26%Listed securities and mutual fund units 70,898 13.61% 65,685 14.43%
476,115 91.39% 421,947 92.69%
36.2 Investments out of provident fund have been made in accordance with the provisions of the section 227 of the Companies Ordinance, 1984 and the rules formulated for this purpose.
37. DATE OF AUTHORISATION FOR ISSUE
These financial statements were authorised for issue on February 24, 2016 by the Board of Directors of the Company.
38. MOVEMENT BETWEEN RESERVES AND PROPOSED DIVIDEND
The Finance Act, 2015 introduced a tax on every public company at the rate of 10 percent of such undistributed reserves which exceed the amount of its paid up capital. However, this tax shall not apply in case of a public company which distributes cash dividend equal to at least either 40 percent of its after tax profits or 50 percent of its paid up capital, within the six months after the end of the relevant year.
The Board of Directors in its meeting held on February 24, 2016 proposed a final dividend of Rs. 3.00 per share for the year ended December 31, 2015, amounting to Rs. 28.934 million for approval of members at the Annual General Meeting to be held on April 25, 2016. The proposed dividend exceeds (or meets) the prescribed minimum dividend requirement as referred above. The Company believes that it would not be liable to pay tax on its undistributed reserves as of December 31, 2015. The Board has further approved the transfer of Rs. 100 million from unappropriated profit to general reserve.
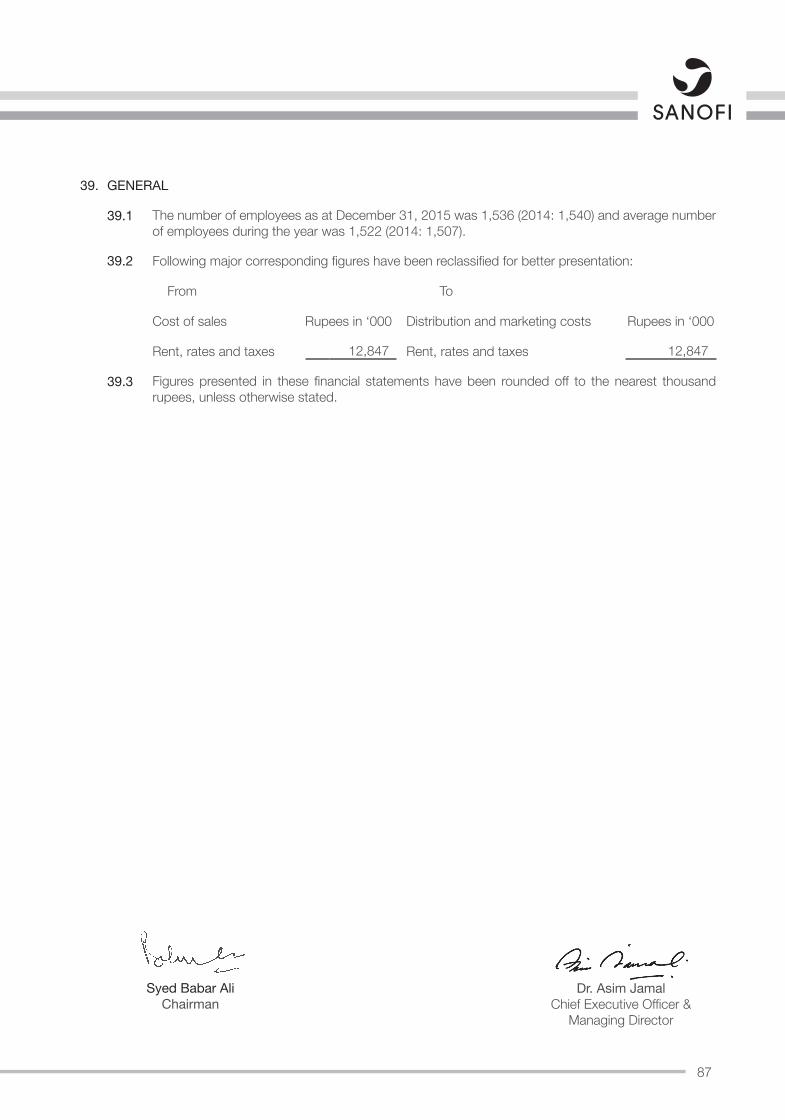
87
39. GENERAL
39.1 The number of employees as at December 31, 2015 was 1,536 (2014: 1,540) and average number of employees during the year was 1,522 (2014: 1,507).
39.2 Following major corresponding figures have been reclassified for better presentation:
From To
Cost of sales Rupees in ‘000 Distribution and marketing costs Rupees in ‘000
Rent, rates and taxes 12,847 Rent, rates and taxes 12,847
39.3 Figures presented in these financial statements have been rounded off to the nearest thousand rupees, unless otherwise stated.
Syed Babar AliChairman
Dr. Asim JamalChief Executive Officer &
Managing Director
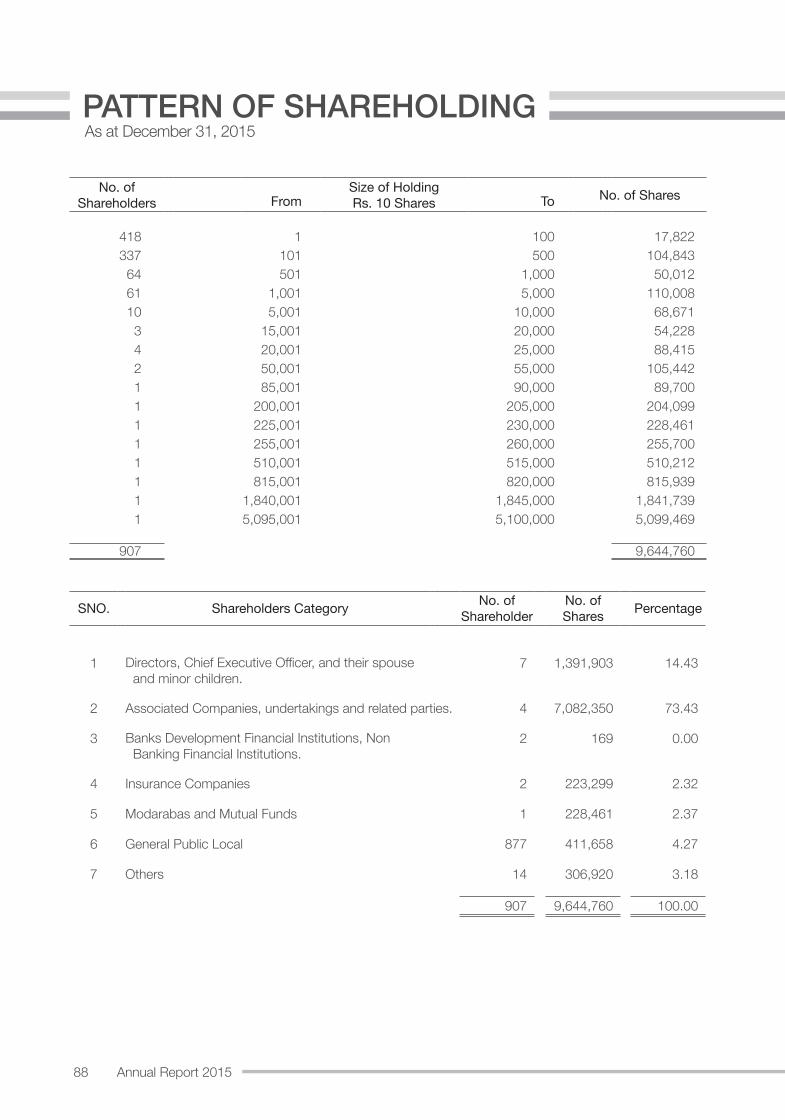
88 Annual Report 2015
As at December 31, 2015PATTERN OF SHAREHOLDING
No. of Shareholders
Size of HoldingRs. 10 Shares No. of SharesFrom To
418 1 100 17,822337 101 500 104,84364 501 1,000 50,01261 1,001 5,000 110,00810 5,001 10,000 68,6713 15,001 20,000 54,2284 20,001 25,000 88,4152 50,001 55,000 105,4421 85,001 90,000 89,7001 200,001 205,000 204,0991 225,001 230,000 228,4611 255,001 260,000 255,7001 510,001 515,000 510,2121 815,001 820,000 815,9391 1,840,001 1,845,000 1,841,7391 5,095,001 5,100,000 5,099,469
907 9,644,760
SNO. Shareholders Category No. of Shareholder
No. of Shares Percentage
1 Directors, Chief Executive Officer, and their spouse and minor children.
7 1,391,903 14.43
2 Associated Companies, undertakings and related parties. 4 7,082,350 73.43
3 Banks Development Financial Institutions, Non Banking Financial Institutions.
2 169 0.00
4 Insurance Companies 2 223,299 2.32
5 Modarabas and Mutual Funds 1 228,461 2.37
6 General Public Local 877 411,658 4.27
7 Others 14 306,920 3.18
907 9,644,760 100.00
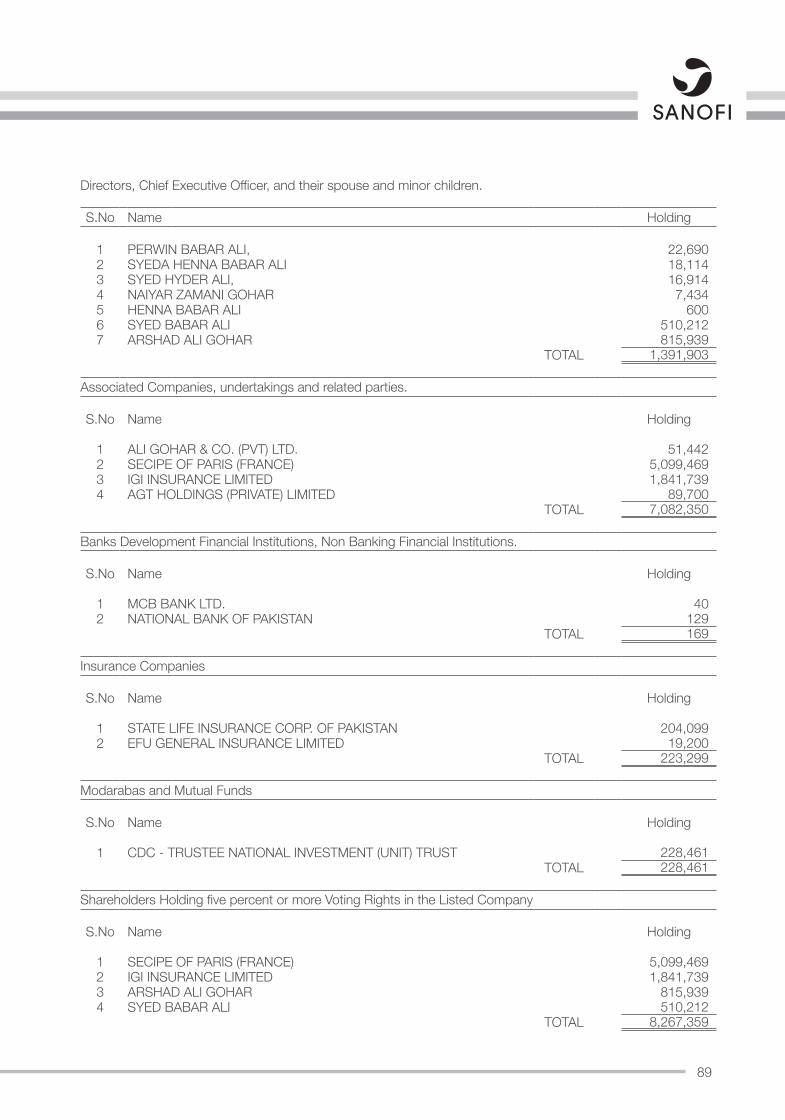
89
Directors, Chief Executive Officer, and their spouse and minor children.
S.No Name Holding
1 PERWIN BABAR ALI, 22,6902 SYEDA HENNA BABAR ALI 18,1143 SYED HYDER ALI, 16,9144 NAIYAR ZAMANI GOHAR 7,4345 HENNA BABAR ALI 6006 SYED BABAR ALI 510,2127 ARSHAD ALI GOHAR 815,939
TOTAL 1,391,903
Associated Companies, undertakings and related parties.
S.No Name Holding
1 ALI GOHAR & CO. (PVT) LTD. 51,4422 SECIPE OF PARIS (FRANCE) 5,099,4693 IGI INSURANCE LIMITED 1,841,7394 AGT HOLDINGS (PRIVATE) LIMITED 89,700
TOTAL 7,082,350
Banks Development Financial Institutions, Non Banking Financial Institutions.
S.No Name Holding
1 MCB BANK LTD. 402 NATIONAL BANK OF PAKISTAN 129
TOTAL 169
Insurance Companies
S.No Name Holding
1 STATE LIFE INSURANCE CORP. OF PAKISTAN 204,0992 EFU GENERAL INSURANCE LIMITED 19,200
TOTAL 223,299
Modarabas and Mutual Funds
S.No Name Holding
1 CDC - TRUSTEE NATIONAL INVESTMENT (UNIT) TRUST 228,461TOTAL 228,461
Shareholders Holding five percent or more Voting Rights in the Listed Company
S.No Name Holding
1 SECIPE OF PARIS (FRANCE) 5,099,4692 IGI INSURANCE LIMITED 1,841,7393 ARSHAD ALI GOHAR 815,9394 SYED BABAR ALI 510,212
TOTAL 8,267,359
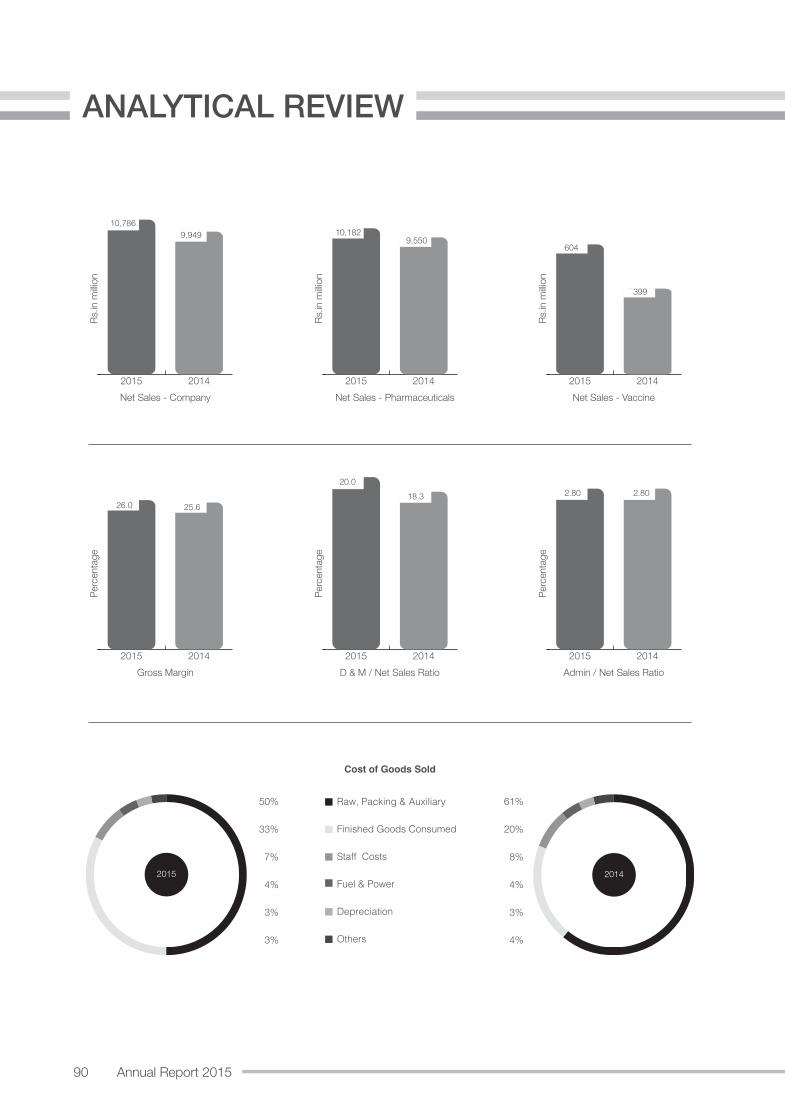
90 Annual Report 2015
ANALYTICAL REVIEW
20142015Net Sales - Company
9,949 10,786
Rs.in
milli
on
20142015Net Sales - Pharmaceuticals
Rs.in
milli
on
20142015Net Sales - Vaccine
Rs.in
milli
on
10,182
9,550
604
399
20142015Gross Margin
25.626.0
Perc
enta
ge
20142015D & M / Net Sales Ratio
Perc
enta
ge
20142015Admin / Net Sales Ratio
Perc
enta
ge
20.018.3 2.80 2.80
Raw, Packing & Auxiliary
Finished Goods Consumed
Staff Costs
Fuel & Power
Depreciation
Others
50%
33%
7%
4%
3%
3%
61%
20%
8%
4%
3%
4%
2015 2014
Cost of Goods Sold
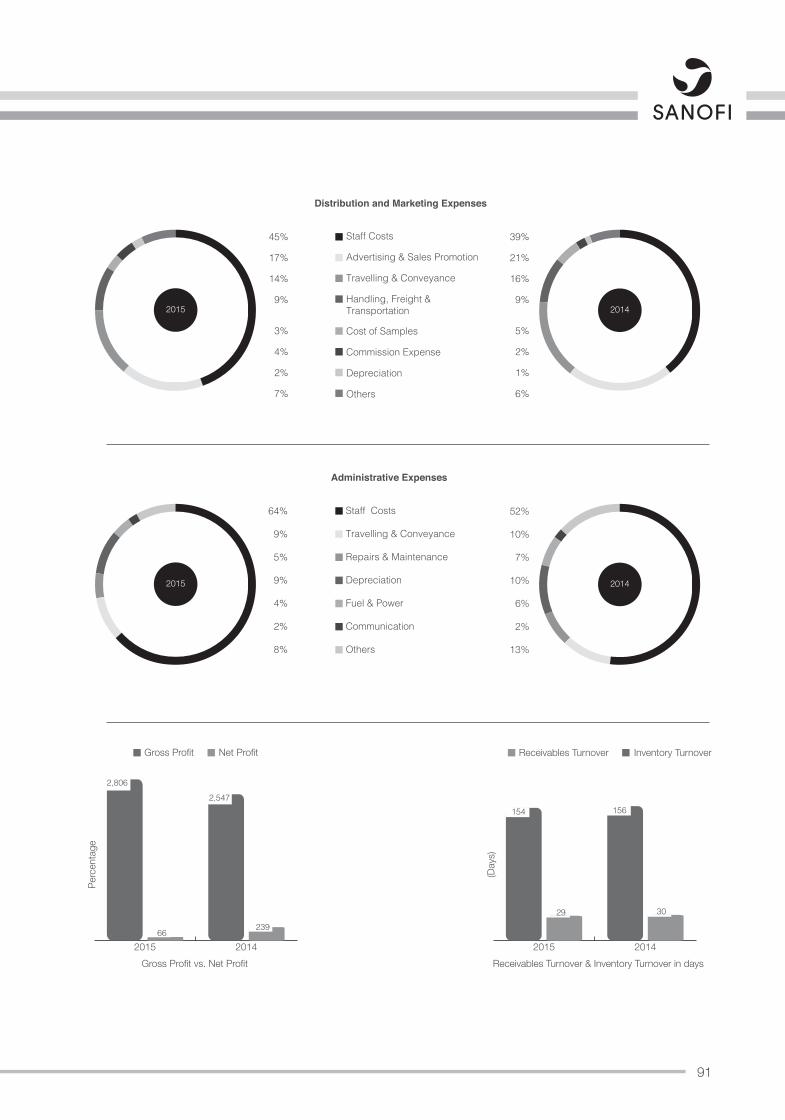
91
20142015Gross Profit vs. Net Profit
2,547
23966
2,806
Perc
enta
ge
20152015 2014
Gross Profit Net Profit
20142015Receivables Turnover & Inventory Turnover in days
3029
154 156
(Day
s)
Receivables Turnover Inventory Turnover
Administrative Expenses
Staff Costs
Travelling & Conveyance
Repairs & Maintenance
Depreciation
Fuel & Power
Communication
Others
64%
9%
5%
9%
4%
2%
8%
52%
10%
7%
10%
6%
2%
13%
20152015 2014
Distribution and Marketing Expenses
Staff Costs
Advertising & Sales Promotion
Travelling & Conveyance
Handling, Freight & Transportation
Cost of Samples
Commission Expense
Depreciation
Others
45% 39%
17% 21%
14% 16%
9% 9%
3%
4%
2%
7%
5%
2%
1%
6%
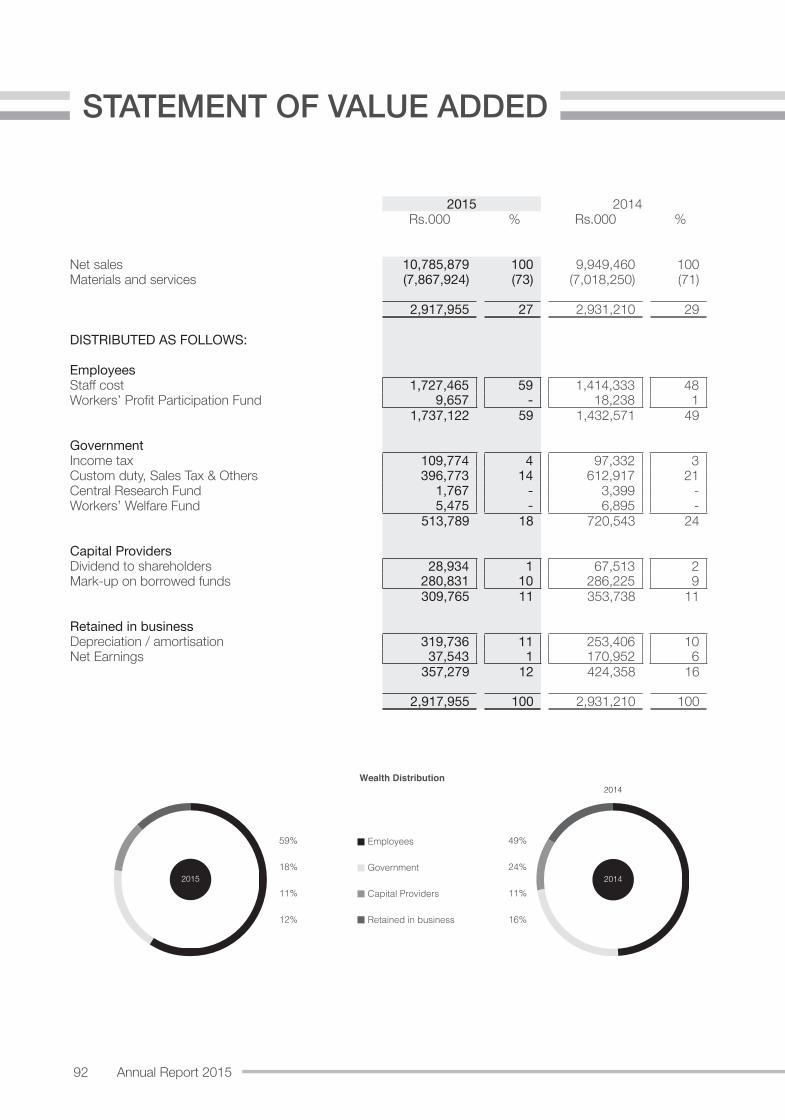
92 Annual Report 2015
STATEMENT OF VALUE ADDED
2015 2014Rs.000 % Rs.000 %
Net sales 10,785,879 100 9,949,460 100 Materials and services (7,867,924) (73) (7,018,250) (71)
2,917,955 27 2,931,210 29
DISTRIBUTED AS FOLLOWS:
EmployeesStaff cost 1,727,465 59 1,414,333 48 Workers’ Profit Participation Fund 9,657 - 18,238 1
1,737,122 59 1,432,571 49
GovernmentIncome tax 109,774 4 97,332 3 Custom duty, Sales Tax & Others 396,773 14 612,917 21 Central Research Fund 1,767 - 3,399 - Workers’ Welfare Fund 5,475 - 6,895 -
513,789 18 720,543 24
Capital ProvidersDividend to shareholders 28,934 1 67,513 2 Mark-up on borrowed funds 280,831 10 286,225 9
309,765 11 353,738 11
Retained in businessDepreciation / amortisation 319,736 11 253,406 10 Net Earnings 37,543 1 170,952 6
357,279 12 424,358 16
2,917,955 100 2,931,210 100
2014
2015 2014
Wealth Distribution
59%
18%
11%
12%
49%
24%
11%
16%
Employees
Government
Capital Providers
Retained in business
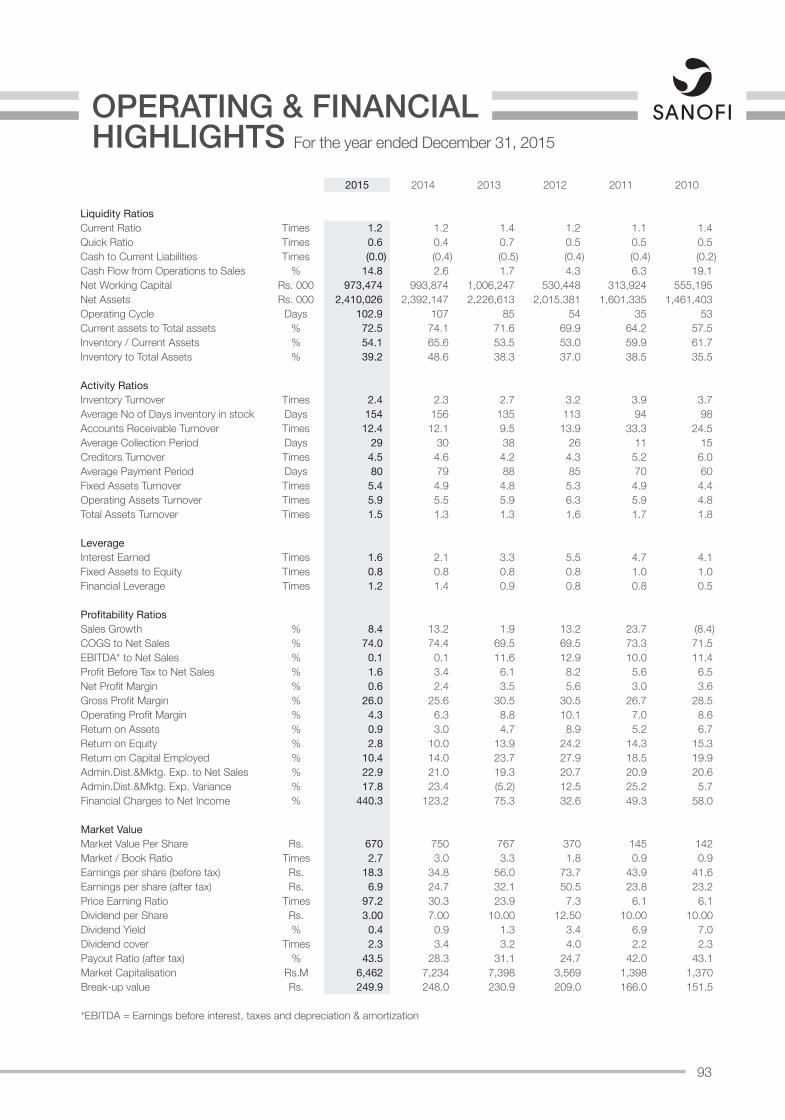
93
For the year ended December 31, 2015
OPERATING & FINANCIAL HIGHLIGHTS
2015 2014 2013 2012 2011 2010
Liquidity RatiosCurrent Ratio Times 1.2 1.2 1.4 1.2 1.1 1.4Quick Ratio Times 0.6 0.4 0.7 0.5 0.5 0.5Cash to Current Liabilities Times (0.0) (0.4) (0.5) (0.4) (0.4) (0.2)Cash Flow from Operations to Sales % 14.8 2.6 1.7 4.3 6.3 19.1Net Working Capital Rs. 000 973,474 993,874 1,006,247 530,448 313,924 555,195 Net Assets Rs. 000 2,410,026 2,392,147 2,226,613 2,015,381 1,601,335 1,461,403 Operating Cycle Days 102.9 107 85 54 35 53Current assets to Total assets % 72.5 74.1 71.6 69.9 64.2 57.5Inventory / Current Assets % 54.1 65.6 53.5 53.0 59.9 61.7Inventory to Total Assets % 39.2 48.6 38.3 37.0 38.5 35.5
Activity RatiosInventory Turnover Times 2.4 2.3 2.7 3.2 3.9 3.7Average No of Days inventory in stock Days 154 156 135 113 94 98Accounts Receivable Turnover Times 12.4 12.1 9.5 13.9 33.3 24.5Average Collection Period Days 29 30 38 26 11 15Creditors Turnover Times 4.5 4.6 4.2 4.3 5.2 6.0Average Payment Period Days 80 79 88 85 70 60Fixed Assets Turnover Times 5.4 4.9 4.8 5.3 4.9 4.4Operating Assets Turnover Times 5.9 5.5 5.9 6.3 5.9 4.8Total Assets Turnover Times 1.5 1.3 1.3 1.6 1.7 1.8
LeverageInterest Earned Times 1.6 2.1 3.3 5.5 4.7 4.1Fixed Assets to Equity Times 0.8 0.8 0.8 0.8 1.0 1.0Financial Leverage Times 1.2 1.4 0.9 0.8 0.8 0.5
Profitability RatiosSales Growth % 8.4 13.2 1.9 13.2 23.7 (8.4)COGS to Net Sales % 74.0 74.4 69.5 69.5 73.3 71.5EBITDA* to Net Sales % 0.1 0.1 11.6 12.9 10.0 11.4Profit Before Tax to Net Sales % 1.6 3.4 6.1 8.2 5.6 6.5Net Profit Margin % 0.6 2.4 3.5 5.6 3.0 3.6Gross Profit Margin % 26.0 25.6 30.5 30.5 26.7 28.5Operating Profit Margin % 4.3 6.3 8.8 10.1 7.0 8.6Return on Assets % 0.9 3.0 4.7 8.9 5.2 6.7Return on Equity % 2.8 10.0 13.9 24.2 14.3 15.3Return on Capital Employed % 10.4 14.0 23.7 27.9 18.5 19.9Admin.Dist.&Mktg. Exp. to Net Sales % 22.9 21.0 19.3 20.7 20.9 20.6Admin.Dist.&Mktg. Exp. Variance % 17.8 23.4 (5.2) 12.5 25.2 5.7Financial Charges to Net Income % 440.3 123.2 75.3 32.6 49.3 58.0
Market ValueMarket Value Per Share Rs. 670 750 767 370 145 142Market / Book Ratio Times 2.7 3.0 3.3 1.8 0.9 0.9Earnings per share (before tax) Rs. 18.3 34.8 56.0 73.7 43.9 41.6Earnings per share (after tax) Rs. 6.9 24.7 32.1 50.5 23.8 23.2Price Earning Ratio Times 97.2 30.3 23.9 7.3 6.1 6.1Dividend per Share Rs. 3.00 7.00 10.00 12.50 10.00 10.00Dividend Yield % 0.4 0.9 1.3 3.4 6.9 7.0Dividend cover Times 2.3 3.4 3.2 4.0 2.2 2.3Payout Ratio (after tax) % 43.5 28.3 31.1 24.7 42.0 43.1Market Capitalisation Rs.M 6,462 7,234 7,398 3,569 1,398 1,370 Break-up value Rs. 249.9 248.0 230.9 209.0 166.0 151.5
*EBITDA = Earnings before interest, taxes and depreciation & amortization
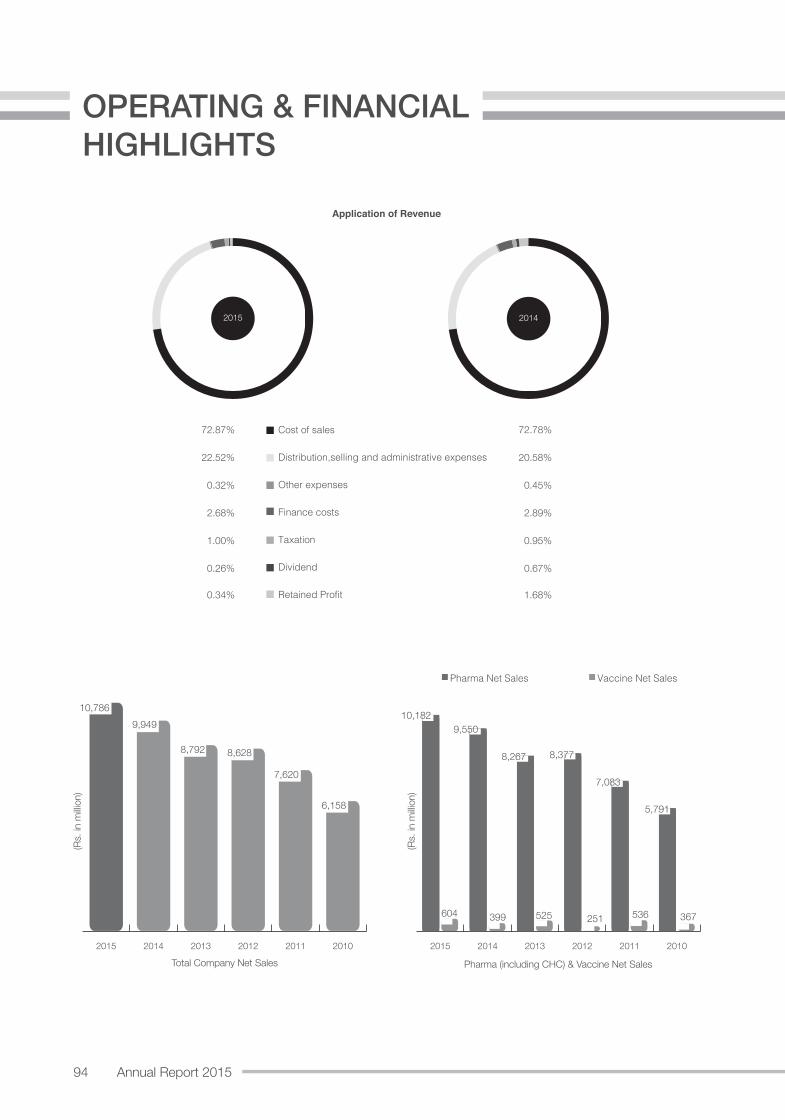
94 Annual Report 2015
OPERATING & FINANCIAL HIGHLIGHTS
2015
72.87%
22.52%
0.32%
2.68%
1.00%
0.26%
0.34%
72.78%
20.58%
0.45%
2.89%
0.95%
0.67%
1.68%
2015 2014
Total Company Net Sales
Application of Revenue
Cost of sales
Distribution,selling and administrative expenses
Other expenses
Finance costs
Taxation
Dividend
Retained Profit
201020112012201320142015
10,786 9,949
8,792 8,628
7,620
6,158
(Rs.
in m
illion
)
Pharma (including CHC) & Vaccine Net Sales
201020112012201320142015
10,182
604 399 525 251 536 367
9,550
8,267 8,377
7,083
5,791
(Rs.
in m
illion
)
Pharma Net Sales Vaccine Net Sales
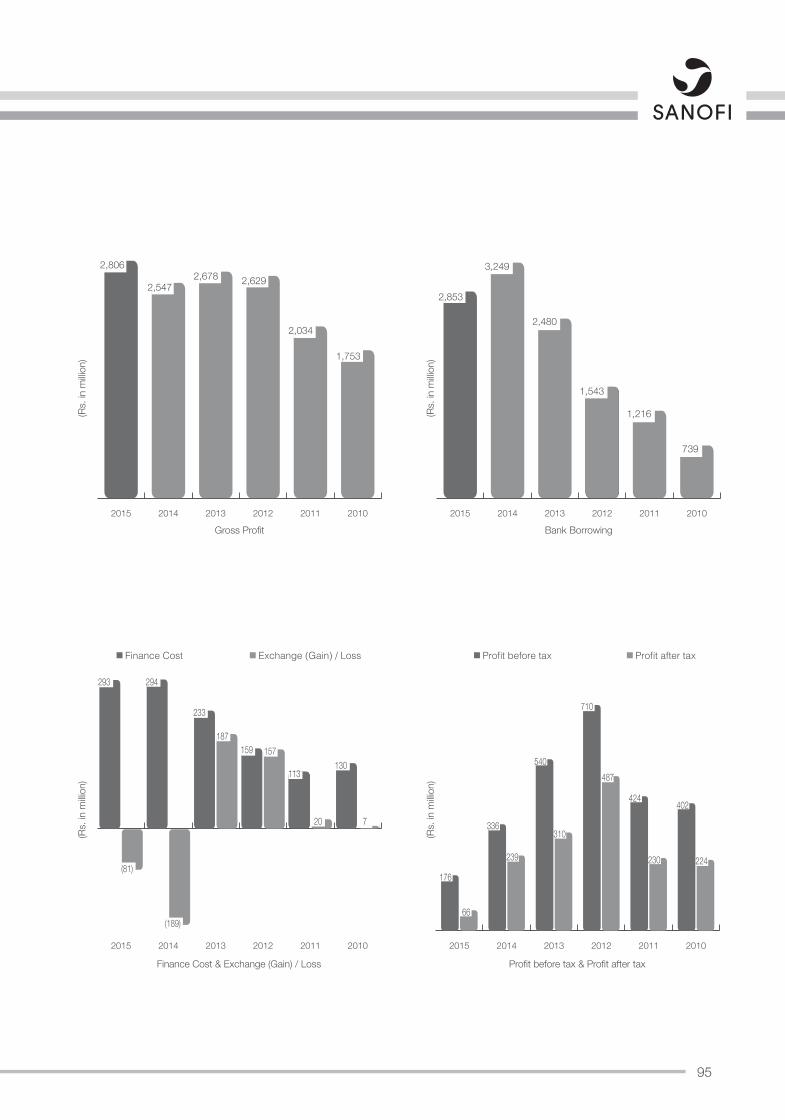
95
Gross Profit201020112012201320142015
2,806
2,547 2,678 2,629
2,034
1,753
Bank Borrowing201020112012201320142015
2,853
3,249
2,480
1,543
1,216
739
Profit before tax & Profit after tax
201020112012201320142015
176
66
239
310
487
230 224
336
540
710
424 402
(Rs.
in m
illion
)
Profit before tax Profit after tax
Finance Cost & Exchange (Gain) / Loss
201020112012201320142015
293
(81)
(189)
187157
20 7
294
233
159
113130
(Rs.
in m
illion
)(R
s. in
milli
on)
(Rs.
in m
illion
)
Finance Cost Exchange (Gain) / Loss
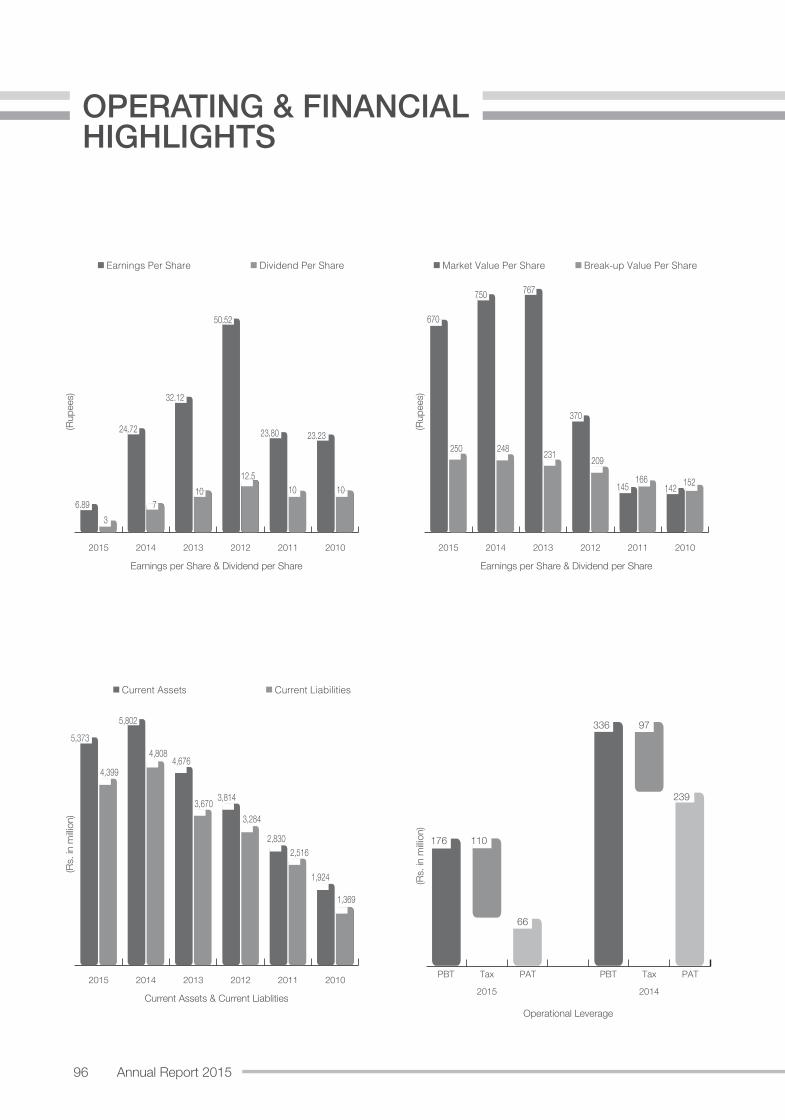
96 Annual Report 2015
OPERATING & FINANCIAL HIGHLIGHTS
Operational Leverage
20142015
176
336 97
239
110
66
(Rs.
in m
illion
)
Current Assets & Current Liablities
201020112012201320142015
5,373
5,802
4,676
3,814
2,830
1,924
1,369
2,516
3,2843,670
4,808
4,399
(Rs.
in m
illion
)
Current Assets Current Liabilities
Earnings per Share & Dividend per Share
201020112012201320142015
6.893
710
12.510 10
24.72
32.12
50.52
23.80 23.23
(Rup
ees)
Earnings Per Share Dividend Per Share
Earnings per Share & Dividend per Share
201020112012201320142015
670
250 248 231 209
166 152
750 767
370
145 142
(Rup
ees)
Market Value Per Share Break-up Value Per Share
PBT Tax PAT PBT Tax PAT
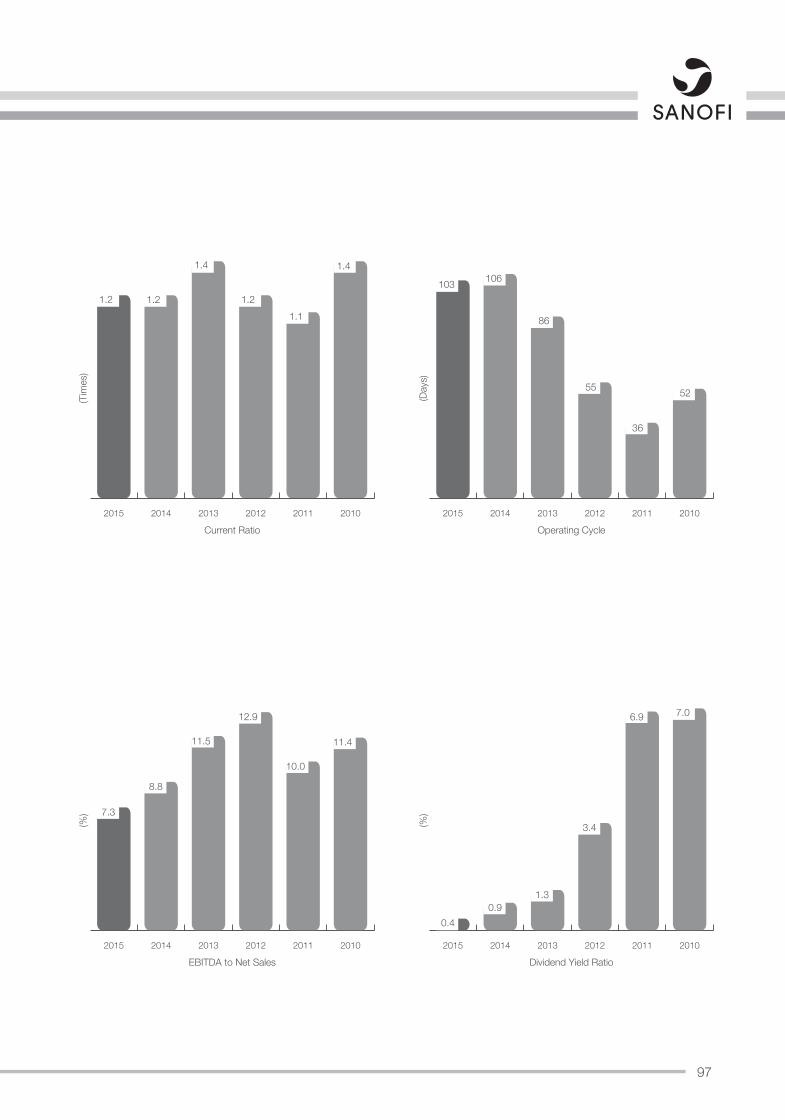
97
Current Ratio201020112012201320142015
1.2 1.2
1.4
1.2 1.1
1.4
Operating Cycle201020112012201320142015
103 106
86
55
36
52
(Tim
es)
(Day
s)
EBITDA to Net Sales 201020112012201320142015
7.3
8.8
11.5
12.9
10.0
11.4
Dividend Yield Ratio201020112012201320142015
0.40.9
1.3
3.4
6.9 7.0
(%)
(%)
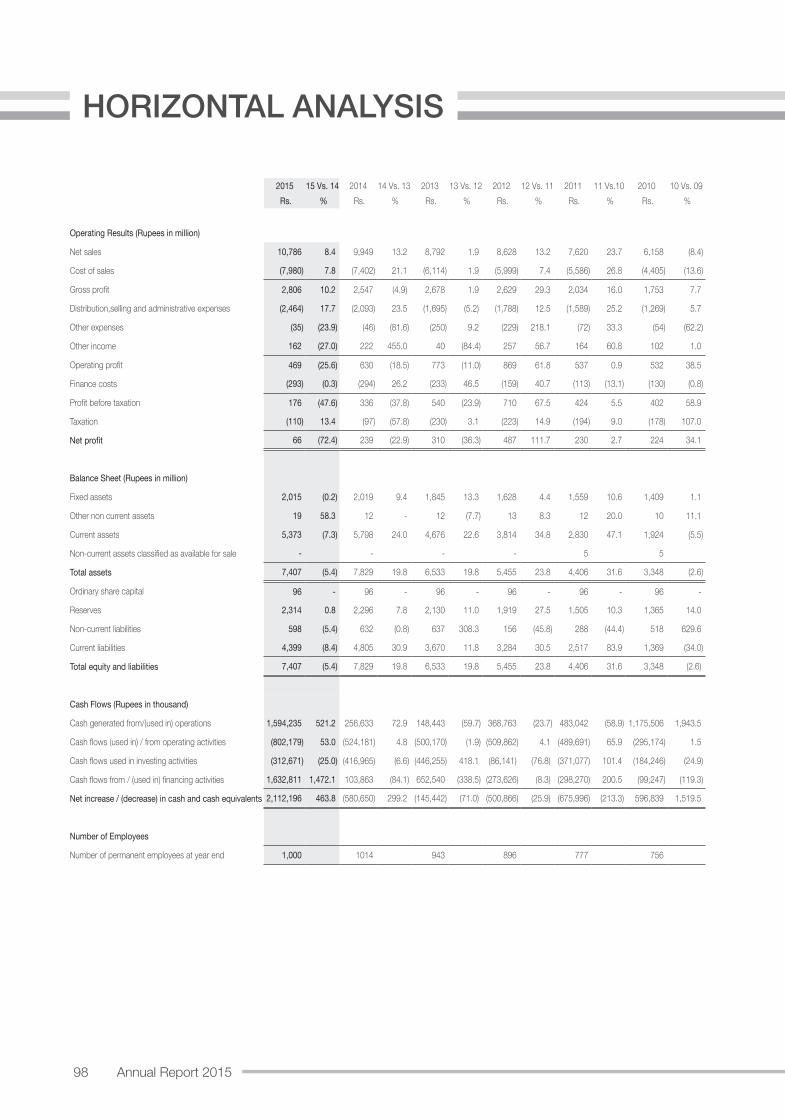
98 Annual Report 2015
HORIZONTAL ANALYSIS
2015 15 Vs. 14 2014 14 Vs. 13 2013 13 Vs. 12 2012 12 Vs. 11 2011 11 Vs.10 2010 10 Vs. 09 Rs. % Rs. % Rs. % Rs. % Rs. % Rs. %
Operating Results (Rupees in million)
Net sales 10,786 8.4 9,949 13.2 8,792 1.9 8,628 13.2 7,620 23.7 6,158 (8.4)
Cost of sales (7,980) 7.8 (7,402) 21.1 (6,114) 1.9 (5,999) 7.4 (5,586) 26.8 (4,405) (13.6)
Gross profit 2,806 10.2 2,547 (4.9) 2,678 1.9 2,629 29.3 2,034 16.0 1,753 7.7
Distribution,selling and administrative expenses (2,464) 17.7 (2,093) 23.5 (1,695) (5.2) (1,788) 12.5 (1,589) 25.2 (1,269) 5.7
Other expenses (35) (23.9) (46) (81.6) (250) 9.2 (229) 218.1 (72) 33.3 (54) (62.2)
Other income 162 (27.0) 222 455.0 40 (84.4) 257 56.7 164 60.8 102 1.0
Operating profit 469 (25.6) 630 (18.5) 773 (11.0) 869 61.8 537 0.9 532 38.5
Finance costs (293) (0.3) (294) 26.2 (233) 46.5 (159) 40.7 (113) (13.1) (130) (0.8)
Profit before taxation 176 (47.6) 336 (37.8) 540 (23.9) 710 67.5 424 5.5 402 58.9
Taxation (110) 13.4 (97) (57.8) (230) 3.1 (223) 14.9 (194) 9.0 (178) 107.0
Net profit 66 (72.4) 239 (22.9) 310 (36.3) 487 111.7 230 2.7 224 34.1
Balance Sheet (Rupees in million)
Fixed assets 2,015 (0.2) 2,019 9.4 1,845 13.3 1,628 4.4 1,559 10.6 1,409 1.1
Other non current assets 19 58.3 12 - 12 (7.7) 13 8.3 12 20.0 10 11.1
Current assets 5,373 (7.3) 5,798 24.0 4,676 22.6 3,814 34.8 2,830 47.1 1,924 (5.5)
Non-current assets classified as available for sale - - - - 5 5
Total assets 7,407 (5.4) 7,829 19.8 6,533 19.8 5,455 23.8 4,406 31.6 3,348 (2.6)
Ordinary share capital 96 - 96 - 96 - 96 - 96 - 96 -
Reserves 2,314 0.8 2,296 7.8 2,130 11.0 1,919 27.5 1,505 10.3 1,365 14.0
Non-current liabilities 598 (5.4) 632 (0.8) 637 308.3 156 (45.8) 288 (44.4) 518 629.6
Current liabilities 4,399 (8.4) 4,805 30.9 3,670 11.8 3,284 30.5 2,517 83.9 1,369 (34.0)
Total equity and liabilities 7,407 (5.4) 7,829 19.8 6,533 19.8 5,455 23.8 4,406 31.6 3,348 (2.6)
Cash Flows (Rupees in thousand)
Cash generated from/(used in) operations 1,594,235 521.2 256,633 72.9 148,443 (59.7) 368,763 (23.7) 483,042 (58.9) 1,175,506 1,943.5
Cash flows (used in) / from operating activities (802,179) 53.0 (524,181) 4.8 (500,170) (1.9) (509,862) 4.1 (489,691) 65.9 (295,174) 1.5
Cash flows used in investing activities (312,671) (25.0) (416,965) (6.6) (446,255) 418.1 (86,141) (76.8) (371,077) 101.4 (184,246) (24.9)
Cash flows from / (used in) financing activities 1,632,811 1,472.1 103,863 (84.1) 652,540 (338.5) (273,626) (8.3) (298,270) 200.5 (99,247) (119.3)
Net increase / (decrease) in cash and cash equivalents 2,112,196 463.8 (580,650) 299.2 (145,442) (71.0) (500,866) (25.9) (675,996) (213.3) 596,839 1,519.5
Number of Employees
Number of permanent employees at year end 1,000 1014 943 896 777 756
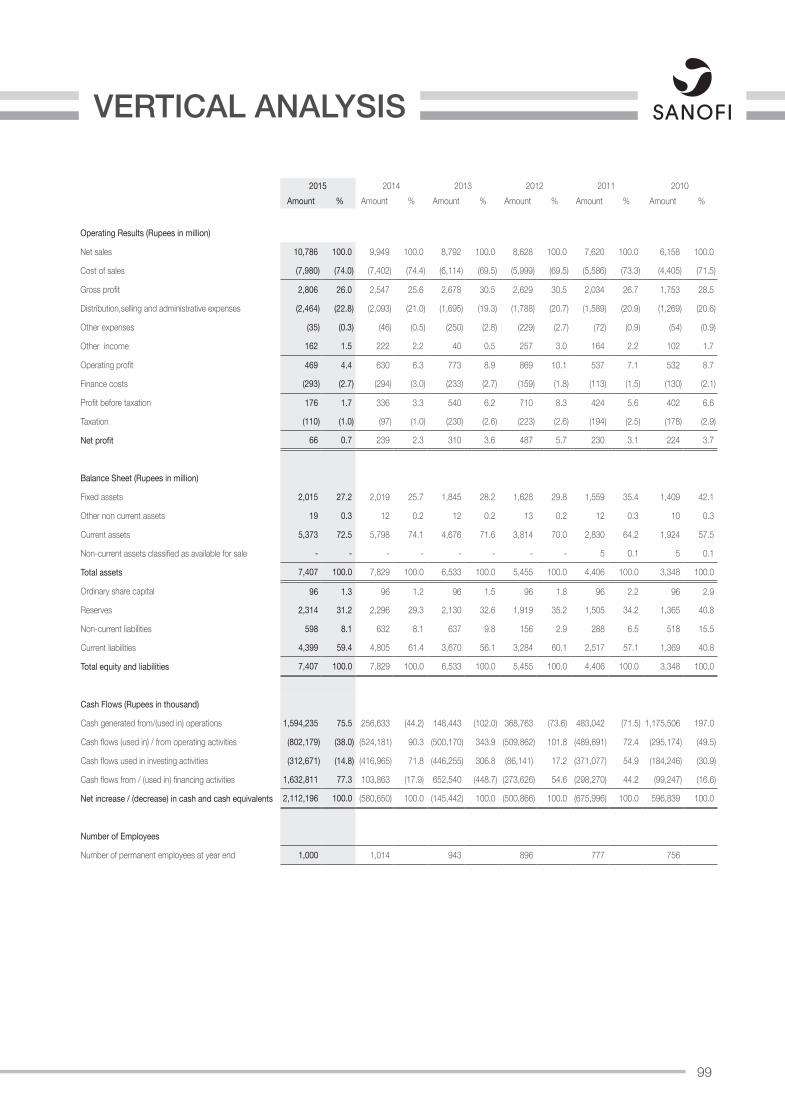
99
VERTICAL ANALYSIS
2015 2014 2013 2012 2011 2010Amount % Amount % Amount % Amount % Amount % Amount %
Operating Results (Rupees in million)
Net sales 10,786 100.0 9,949 100.0 8,792 100.0 8,628 100.0 7,620 100.0 6,158 100.0
Cost of sales (7,980) (74.0) (7,402) (74.4) (6,114) (69.5) (5,999) (69.5) (5,586) (73.3) (4,405) (71.5)
Gross profit 2,806 26.0 2,547 25.6 2,678 30.5 2,629 30.5 2,034 26.7 1,753 28.5
Distribution,selling and administrative expenses (2,464) (22.8) (2,093) (21.0) (1,695) (19.3) (1,788) (20.7) (1,589) (20.9) (1,269) (20.6)
Other expenses (35) (0.3) (46) (0.5) (250) (2.8) (229) (2.7) (72) (0.9) (54) (0.9)
Other income 162 1.5 222 2.2 40 0.5 257 3.0 164 2.2 102 1.7
Operating profit 469 4.4 630 6.3 773 8.9 869 10.1 537 7.1 532 8.7
Finance costs (293) (2.7) (294) (3.0) (233) (2.7) (159) (1.8) (113) (1.5) (130) (2.1)
Profit before taxation 176 1.7 336 3.3 540 6.2 710 8.3 424 5.6 402 6.6
Taxation (110) (1.0) (97) (1.0) (230) (2.6) (223) (2.6) (194) (2.5) (178) (2.9)
Net profit 66 0.7 239 2.3 310 3.6 487 5.7 230 3.1 224 3.7
Balance Sheet (Rupees in million)
Fixed assets 2,015 27.2 2,019 25.7 1,845 28.2 1,628 29.8 1,559 35.4 1,409 42.1
Other non current assets 19 0.3 12 0.2 12 0.2 13 0.2 12 0.3 10 0.3
Current assets 5,373 72.5 5,798 74.1 4,676 71.6 3,814 70.0 2,830 64.2 1,924 57.5
Non-current assets classified as available for sale - - - - - - - - 5 0.1 5 0.1
Total assets 7,407 100.0 7,829 100.0 6,533 100.0 5,455 100.0 4,406 100.0 3,348 100.0
Ordinary share capital 96 1.3 96 1.2 96 1.5 96 1.8 96 2.2 96 2.9
Reserves 2,314 31.2 2,296 29.3 2,130 32.6 1,919 35.2 1,505 34.2 1,365 40.8
Non-current liabilities 598 8.1 632 8.1 637 9.8 156 2.9 288 6.5 518 15.5
Current liabilities 4,399 59.4 4,805 61.4 3,670 56.1 3,284 60.1 2,517 57.1 1,369 40.8
Total equity and liabilities 7,407 100.0 7,829 100.0 6,533 100.0 5,455 100.0 4,406 100.0 3,348 100.0
Cash Flows (Rupees in thousand)
Cash generated from/(used in) operations 1,594,235 75.5 256,633 (44.2) 148,443 (102.0) 368,763 (73.6) 483,042 (71.5) 1,175,506 197.0
Cash flows (used in) / from operating activities (802,179) (38.0) (524,181) 90.3 (500,170) 343.9 (509,862) 101.8 (489,691) 72.4 (295,174) (49.5)
Cash flows used in investing activities (312,671) (14.8) (416,965) 71.8 (446,255) 306.8 (86,141) 17.2 (371,077) 54.9 (184,246) (30.9)
Cash flows from / (used in) financing activities 1,632,811 77.3 103,863 (17.9) 652,540 (448.7) (273,626) 54.6 (298,270) 44.2 (99,247) (16.6)
Net increase / (decrease) in cash and cash equivalents 2,112,196 100.0 (580,650) 100.0 (145,442) 100.0 (500,866) 100.0 (675,996) 100.0 596,839 100.0
Number of Employees
Number of permanent employees at year end 1,000 1,014 943 896 777 756
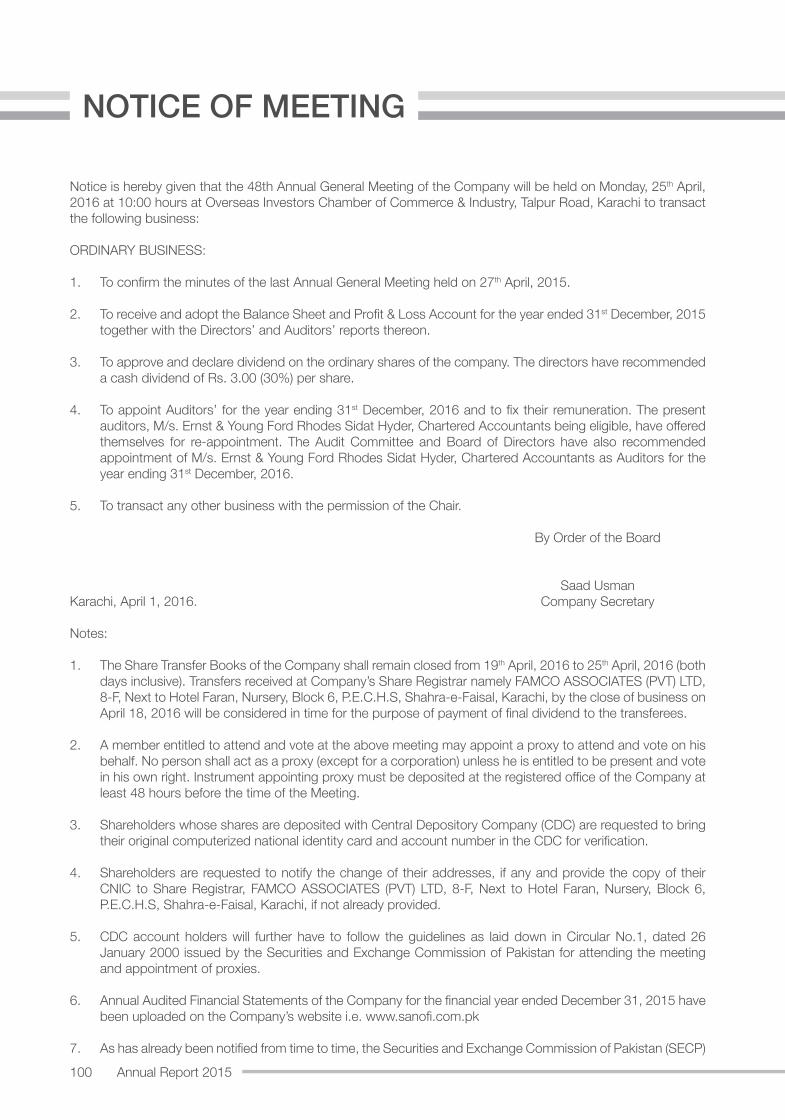
100 Annual Report 2015
NOTICE OF MEETING
Notice is hereby given that the 48th Annual General Meeting of the Company will be held on Monday, 25th April, 2016 at 10:00 hours at Overseas Investors Chamber of Commerce & Industry, Talpur Road, Karachi to transact the following business:
ORDINARY BUSINESS:
1. To confirm the minutes of the last Annual General Meeting held on 27th April, 2015.
2. To receive and adopt the Balance Sheet and Profit & Loss Account for the year ended 31st December, 2015 together with the Directors’ and Auditors’ reports thereon.
3. To approve and declare dividend on the ordinary shares of the company. The directors have recommended a cash dividend of Rs. 3.00 (30%) per share.
4. To appoint Auditors’ for the year ending 31st December, 2016 and to fix their remuneration. The present auditors, M/s. Ernst & Young Ford Rhodes Sidat Hyder, Chartered Accountants being eligible, have offered themselves for re-appointment. The Audit Committee and Board of Directors have also recommended appointment of M/s. Ernst & Young Ford Rhodes Sidat Hyder, Chartered Accountants as Auditors for the year ending 31st December, 2016.
5. To transact any other business with the permission of the Chair.
By Order of the Board
Saad UsmanKarachi, April 1, 2016. Company Secretary
Notes:
1. The Share Transfer Books of the Company shall remain closed from 19th April, 2016 to 25th April, 2016 (both days inclusive). Transfers received at Company’s Share Registrar namely FAMCO ASSOCIATES (PVT) LTD, 8-F, Next to Hotel Faran, Nursery, Block 6, P.E.C.H.S, Shahra-e-Faisal, Karachi, by the close of business on April 18, 2016 will be considered in time for the purpose of payment of final dividend to the transferees.
2. A member entitled to attend and vote at the above meeting may appoint a proxy to attend and vote on his behalf. No person shall act as a proxy (except for a corporation) unless he is entitled to be present and vote in his own right. Instrument appointing proxy must be deposited at the registered office of the Company at least 48 hours before the time of the Meeting.
3. Shareholders whose shares are deposited with Central Depository Company (CDC) are requested to bring their original computerized national identity card and account number in the CDC for verification.
4. Shareholders are requested to notify the change of their addresses, if any and provide the copy of their CNIC to Share Registrar, FAMCO ASSOCIATES (PVT) LTD, 8-F, Next to Hotel Faran, Nursery, Block 6, P.E.C.H.S, Shahra-e-Faisal, Karachi, if not already provided.
5. CDC account holders will further have to follow the guidelines as laid down in Circular No.1, dated 26 January 2000 issued by the Securities and Exchange Commission of Pakistan for attending the meeting and appointment of proxies.
6. Annual Audited Financial Statements of the Company for the financial year ended December 31, 2015 have been uploaded on the Company’s website i.e. www.sanofi.com.pk
7. As has already been notified from time to time, the Securities and Exchange Commission of Pakistan (SECP)
101
vide Notification S.R.O. 19(I)/2014 dated 10th January 2014 read with Notification S.R.O. 831(1)/2012 dated July 5, 2012 require that the Dividend Warrant(s) should also bear the Computerized National Identity Card (CNIC) Number of the registered shareholder or the authorized person, except in case of minor(s) and corporate shareholder(s).
Henceforth, issuance of dividend warrant(s) will be subject to submission of CNIC (individuals) / NTN
(corporate entities) by shareholders.
8. Deduction of Income Tax from Dividend under Section 150 of the Income Tax Ordinance, 2001:
i) The Government of Pakistan through Finance Act, 2015 has made certain amendments in Section 150 of the Income Tax Ordinance, 2001 whereby different rates are prescribed for deduction of withholding tax on the account of withholding tax on the amount of dividend paid by the companies. These tax rates are as under:
a) For filers of income tax returns: 12.50%b) For non-filers of income tax returns: 17.50%
To enable the company to make tax deduction on the amount of cash dividend @ 12.50% instead of 17.50% all the shareholders whose names are not entered into the Active Tax-payers List (ATL) provided on the website of FBR despite the fact that they are filers, are advised to make sure that their names are entered into ATL well before the date for payment of the above cash dividend, otherwise tax on their cash dividend will be deducted @ 17.50% instead of 12.50%.
ii) Withholding Tax exemption from the dividend income, shall only be allowed if copy of valid tax exemption certificate is made available to FAMCO ASSOCIATES (PVT) LTD., by the first day of Book Closure.
iii) Further, according to clarification received from Federal Board of Revenue (FBR), with-holding tax will be determined separately on ‘Filer/Non-Filer’ status of Principal shareholder as well as joint-holder (s) based on their shareholding proportions, in case of joint accounts.
In this regard all shareholders who hold shares jointly are requested to provide shareholding proportions of Principal shareholder and Joint-holder(s) in respect of shares held by them (only if not already provided) to our Share Registrar, in writing as follows:
Company Name
Folio/CDS Account #
Total Shares
Principal Shareholder Joint Shareholder
Name and CNIC #
Shareholding Proportion
(No. of Shares)
Name and CNIC #
Shareholding Proportion
(No. of Shares)
The required information must reach our Share Registrar within 10 days of this notice; otherwise it will be assumed that the shares are equally held by Principal shareholder and Joint Holder(s).
iv) For any query/problem/information, the investors may contact the Company Secretary at phone: 92 21 35060221 and email address [email protected] and/or FAMCO Associates (Pvt.) Ltd. at phone 021-34380101-5 and email address: [email protected]
v) The corporate shareholders having CDC accounts are required to have their National Tax Number (NTN) updated with their respective participants, whereas corporate physical shareholders should send a copy of their NTN certificate to the company or FAMCO Associates (Pvt.) Ltd. The shareholders while sending NTN or NTN certificates, as the case may be, must quote company name and their respective folio numbers.
102 Annual Report 2015
GLOSSARY
Adverse Drug Reaction ADRBritish Medical Journal BMJChronic Lymphocytic Leukemia CLLCode of Corporate Governance CCGConsumer Healthcare CHCCorporate Governance Leadership Skill CGLSCorporate Social Responsibility CSRDividend Per Share DPSEarnings Per Share EPSEnterprise Resource Planning ERPFactory Acceptance Test FATFinal Tax Regime FTRFreight on Board FOBGeneral Sales Tax GSTGovernment of Pakistan GOPHealth, Safety And Environment HSEHealthcare Provider HCPInstitute of Business Administration IBAInstitute of Chartered Accountants of Pakistan ICAPInstitute of Cost And Management Accountants of Pakistan ICMAPIntegrated Management System IMSInternational Accounting Standards IASInternational Accounting Standards Board IASBInternational Financial Reporting Interpretation Committee IFRICInternational Financial Reporting Standards IFRSInternational Union Against Cancer UICCKarachi Inter Bank Offer Rate KIBORKey Opinion Leader KOLMedical Information System MISNational Environmental Quality Standards NEQSNon-Government Organization NGOReturn on Asset ROAReturn on Equity ROESecurities And Exchange Commission of Pakistan SECPState Bank of Pakistan SBPThe Citizen Foundation TCFTotal Shareholder Return TSRType 2 Diabetes Mellitus T2DM
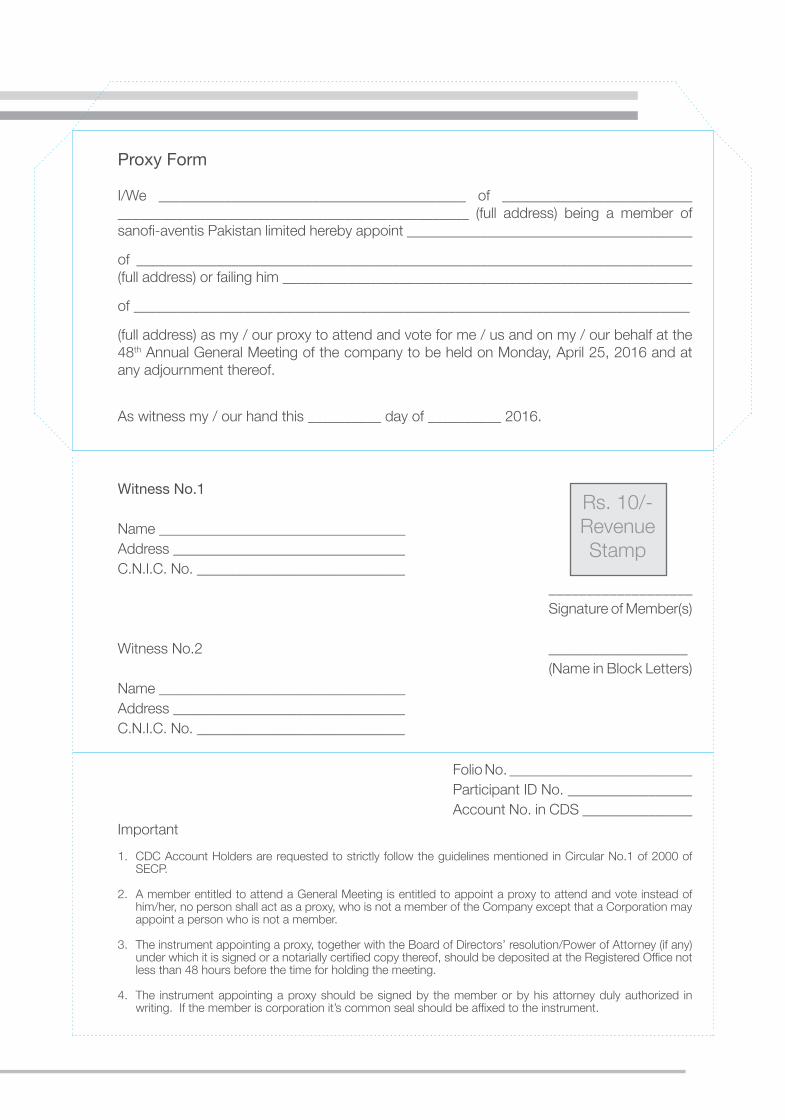
Proxy Form
I/We __________________________________________ of __________________________________________________________________________ (full address) being a member of sanofi-aventis Pakistan limited hereby appoint _______________________________________
of ____________________________________________________________________________ (full address) or failing him ________________________________________________________
of ____________________________________________________________________________
(full address) as my / our proxy to attend and vote for me / us and on my / our behalf at the 48th Annual General Meeting of the company to be held on Monday, April 25, 2016 and at any adjournment thereof.
As witness my / our hand this __________ day of __________ 2016.
Witness No.1
Name __________________________________Address ________________________________C.N.I.C. No. _____________________________ ___________________ Signature of Member(s)
Witness No.2 ___________________ (Name in Block Letters)Name __________________________________Address ________________________________C.N.I.C. No. _____________________________
Folio No. _________________________ Participant ID No. _________________ Account No. in CDS _______________Important1. CDC Account Holders are requested to strictly follow the guidelines mentioned in Circular No.1 of 2000 of
SECP.
2. A member entitled to attend a General Meeting is entitled to appoint a proxy to attend and vote instead of him/her, no person shall act as a proxy, who is not a member of the Company except that a Corporation may appoint a person who is not a member.
3. The instrument appointing a proxy, together with the Board of Directors’ resolution/Power of Attorney (if any) under which it is signed or a notarially certified copy thereof, should be deposited at the Registered Office not less than 48 hours before the time for holding the meeting.
4. The instrument appointing a proxy should be signed by the member or by his attorney duly authorized in writing. If the member is corporation it’s common seal should be affixed to the instrument.
Rs. 10/-Revenue Stamp
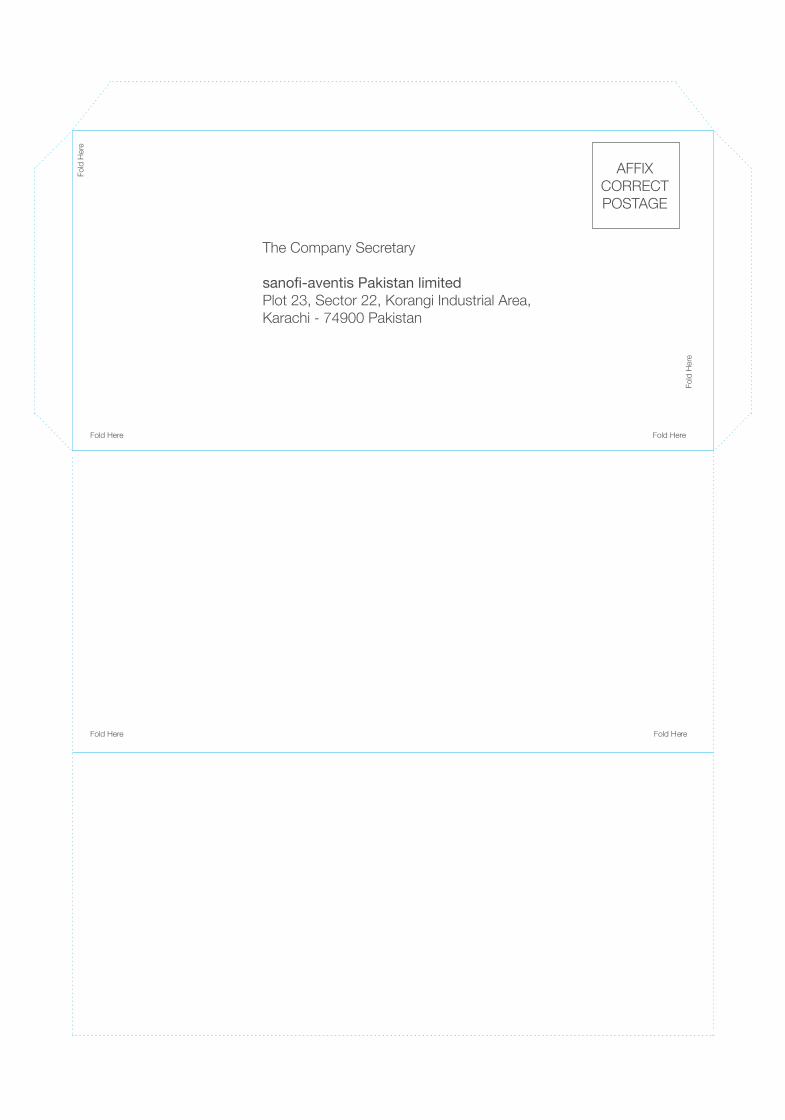
The Company Secretary
sanofi-aventis Pakistan limitedPlot 23, Sector 22, Korangi Industrial Area,Karachi - 74900 Pakistan
AFFIXCORRECTPOSTAGE
�رم �ا�
�ّ���/�ّ����ة --------------------------------------------------------------------------- ��
� �� �ں/ �� ���ں/�� �ر � �ں � �� � �
��
�� � ر� � �� �
�� ��ن �� ا�� �) ��۔ �) ----------------------------------------------------------------------------------------------------
-------------------------------------------------------------- �� ��د� � ��
� � اس � �� (� �)
--------------------------------------------------------------------------------------
� � � �� �ے/ �رى �� وہ �� � �� � �� �ں/ �� �ر���ں/�� �ر� � �ا� �ے / �رے �� � (� �) �� ا�ا � � د�� اور � دے ووٹ � �� �ى/ �رى �� �� ��� �� ٢٠١٦ ، �، ٢٥ ا��� � �� ا�ِس �م، �ہ ��� ٤٨و��
��۔ �� �
�۔ � د� ��-------�وز ------- ٢٠١٦� �ے /�رے ��
١ � �اہ --------------------- �م --------------------- �--------------------- ---------------------
--------------------- � � آ� � ا�� �
٢ � �اہ --------------------- �م --------------------- �
------- � � ��� --------------------- ------- � ڈى آ� � وا� �� ��� ---------------------
------- � ا�ؤ� �� �� ا ڈى � --------------------- � � آ� � ا�� �
�ورى
�وى � �� � � ا��ں� ر� � 1 آف ٢٠٠٠� �� � � � اى �� ا � � در�ا� � ��رز ا�ؤ� � ڈى � 1۔ ۔ ���
ر��/� � �ا� �� �
د�� ووٹ اور �� �� ا�س � ا� وہ � �ر� �� �
ا� � ر� وا� �� �� �� ا�سِ �م 2۔ ر �� � ا�� � �
��ر�ر�� �� ،�� � �
�� ر � �
���
�� � ا� � � � �� �وہ � ر� � � ،� ��۔ � �
�� ر� � � �� ��
� د� � اس � � � (� �� ا�ر� (ا� آف �ارداد/ �ور � �ز � ڈا��� آف �رڈ �� � �
�د�و�� � �� �ر �ا� 3۔
��۔ �ا� � �� آ� ر�ڈ � �٤٨ � �� �وع ��، ا�س �ہ ���� � � ��ى � ��� � �� �
�� �ں � � ��د�و�� � � �
��ر�ر�� ر� ا� ۔ �
� ��� �� د� �ى ��� � ا�ر� � �� ر� � �
�د�و�� � ر�� � � �ا� 4۔
�۔������ �
١٠ رو� � �
��� ر�� � ا��
د� ر�(ار�ن) �
( �� �وف � (�م

The Company Secretary
sanofi-aventis Pakistan limitedPlot 23, Sector 22, Korangi Industrial Area,Karachi - 74900 Pakistan
AFFIXCORRECTPOSTAGE

Plot 23, Sector 22, Korangi Industrial Area, Karachi-74900 Pakistan,P.O.Box 4962, Karachi-74000 PABX: +92-21-3506 0221-35, Fax: +92-21-3506 0358