Embed Size (px)
Citation preview
Annual Report 2015
Elizabeth East Primary School
Annual Report 2015
Annual Report 2015
Page 1
1. CONTEXT
School Name: Elizabeth East Primary School Number: 0943
Principal: Helen Tunney Partnership Elizabeth
Our total enrolment at the end of the year was 237 students. This included 16 students in our 2 special classes. 52 students in the mainstream are verified with a disability (22%). Including those in the special classes 29% of our students are verified with a disability. 45 students speak English as an additional dialect (20%). This has increased from 10% in 2014. 20 students identify as Aboriginal (9%). 63% of students are eligible for school card while 35% were approved. This represents a financial gap of 28% for the School. At any one time at least 20% of our students have an attendance rate ≤ 80%. This includes 5% ≤ 50% attendance rate. 2. REPORT FROM GOVERNING COUNCIL
The Governing Council has 10 members, including the staff representative and the Principal. The 8 family representatives are hard-working, dedicated volunteers who also make up a range of Committees that undertake improvement initiatives in the School. There are Committees for OSHC, Canteen, Finance, Uniform, Kitchen Garden/Nature Play, and Fundraising. In 2015 achievements by the Governing Council include: • The completion of our re-designed kitchen garden
• The development of our Nature Play area
• The setting up of our new OSHC program through Camp Australia
• Many successful fundraising events ($4000 raised)
• The introduction of our new school polo top
• The continuing viability of our School Canteen ($3,500 net profit which is used to subsidize the new school polo top for families)
3. 2015 HIGHLIGHTS
In addition to the above achievements the School also: • Successfully established a Junior Primary Special Class
• Ran an artist-in-residence dance program that culminated in a wonderful End of Year Dance Concert
• Significantly improved our ICT resourcing and resourced all students with 1: 2 portable devices
• Trialed a new model for the teaching of Chinese in a year 3/4 class (in collaboration with Open Access College), a model which was so successful it will be implemented across the whole school in 2016
• Have successfully transitioned to full implementation of the Australian Curriculum in 2016
• Collaboratively developed an observational rubric of evidence of quality student learning in a classroom
Annual Report 2015
Page 2
4. SITE IMPROVEMENT PLANNING AND TARGETS
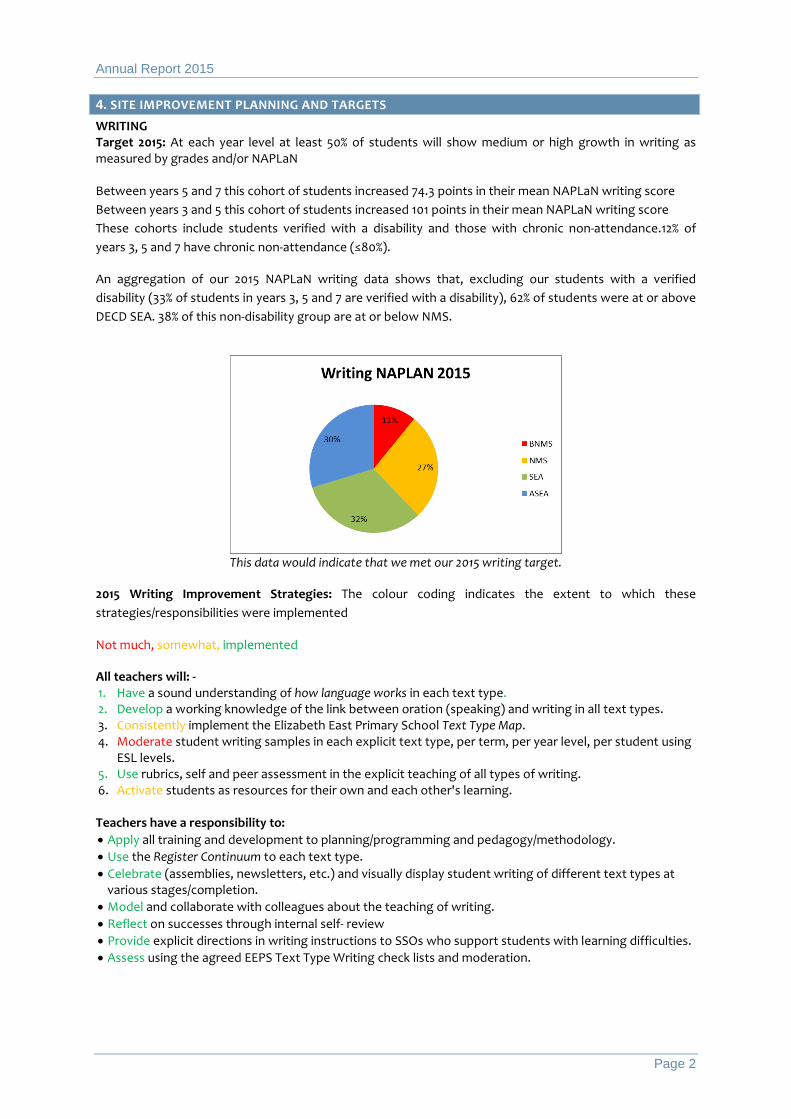
WRITING Target 2015: At each year level at least 50% of students will show medium or high growth in writing as measured by grades and/or NAPLaN Between years 5 and 7 this cohort of students increased 74.3 points in their mean NAPLaN writing score Between years 3 and 5 this cohort of students increased 101 points in their mean NAPLaN writing score These cohorts include students verified with a disability and those with chronic non-attendance.12% of years 3, 5 and 7 have chronic non-attendance (≤80%).
An aggregation of our 2015 NAPLaN writing data shows that, excluding our students with a verified disability (33% of students in years 3, 5 and 7 are verified with a disability), 62% of students were at or above DECD SEA. 38% of this non-disability group are at or below NMS.
This data would indicate that we met our 2015 writing target.
2015 Writing Improvement Strategies: The colour coding indicates the extent to which these strategies/responsibilities were implemented
Not much, somewhat, implemented
All teachers will: - 1. Have a sound understanding of how language works in each text type. 2. Develop a working knowledge of the link between oration (speaking) and writing in all text types. 3. Consistently implement the Elizabeth East Primary School Text Type Map. 4. Moderate student writing samples in each explicit text type, per term, per year level, per student using
ESL levels. 5. Use rubrics, self and peer assessment in the explicit teaching of all types of writing. 6. Activate students as resources for their own and each other's learning. Teachers have a responsibility to: • Apply all training and development to planning/programming and pedagogy/methodology. • Use the Register Continuum to each text type. • Celebrate (assemblies, newsletters, etc.) and visually display student writing of different text types at
various stages/completion. • Model and collaborate with colleagues about the teaching of writing. • Reflect on successes through internal self- review • Provide explicit directions in writing instructions to SSOs who support students with learning difficulties. • Assess using the agreed EEPS Text Type Writing check lists and moderation.
Annual Report 2015
Page 3
SSOs have a responsibility to: • Seek assistance when working with students is proving problematic.
Leadership have a responsibility to: • Support the continuous improvement of teachers planning/programming and pedagogy/methodology in
the interest of improved student writing outcomes PAT Reading Comprehension Data This data indicates that in years 2-7of our non-disabled, attending students: 14% are well below average, 33% are below average, 33% are average, 14% are above average and 4% are well above average. It seems that although our running recod data shows much higher levels of reading fluency, stduents are failing to comprehend at the same levels. It is apparent from this analysis that the considerable targeted effort that was put in by the School in 2015 to improving writing pedagogy has improved student writing outcomes. The challenge now is to build on and sustain this improvement. Writing will remain a priority for site improvement in 2016. The following issues have been noted:
• We must consistently implement the Elizabeth East Primary School Text Type Map. • We must moderate student writing samples in each explicit text type, per term, per year level, per
student using EALD levels. • We must activate students as resources for their own and each other's learning. • We must induct new teachers with the knowledge, skills and abilities in the explicit teaching of
writing at EEPS • We must increase our expectations of students to use writing and reading as tools for powerful
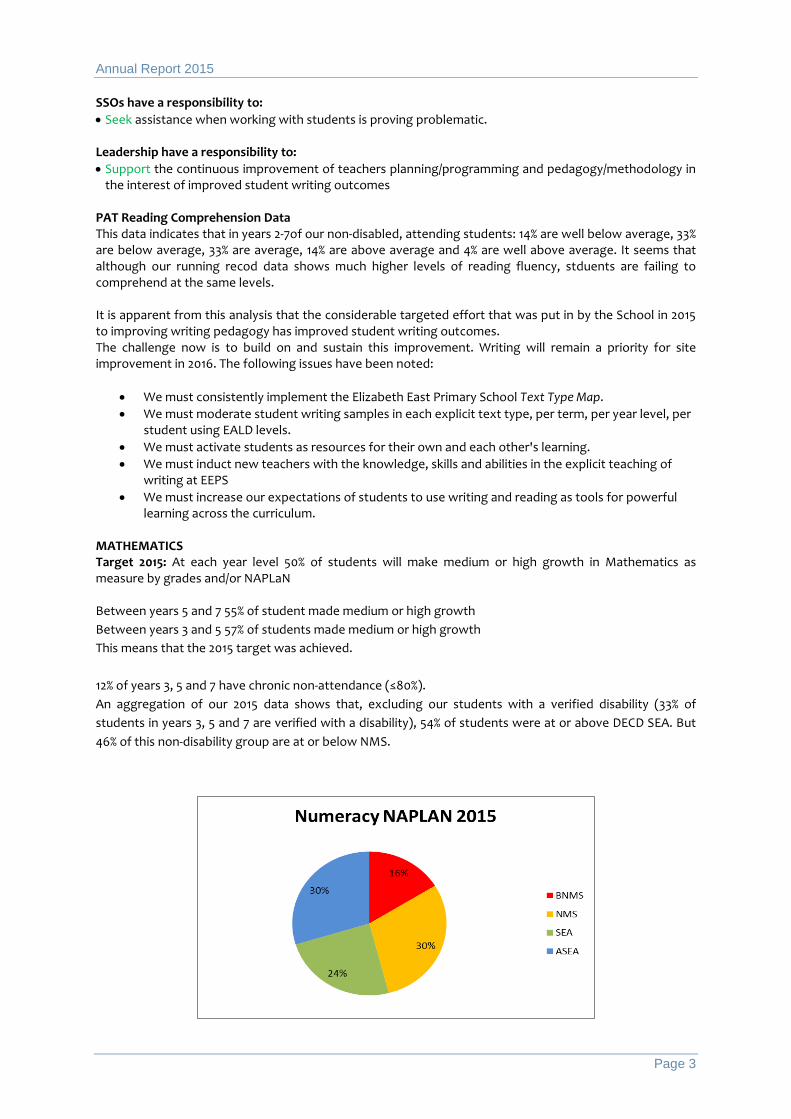
learning across the curriculum. MATHEMATICS Target 2015: At each year level 50% of students will make medium or high growth in Mathematics as measure by grades and/or NAPLaN Between years 5 and 7 55% of student made medium or high growth Between years 3 and 5 57% of students made medium or high growth This means that the 2015 target was achieved. 12% of years 3, 5 and 7 have chronic non-attendance (≤80%). An aggregation of our 2015 data shows that, excluding our students with a verified disability (33% of students in years 3, 5 and 7 are verified with a disability), 54% of students were at or above DECD SEA. But 46% of this non-disability group are at or below NMS.
Annual Report 2015
Page 4
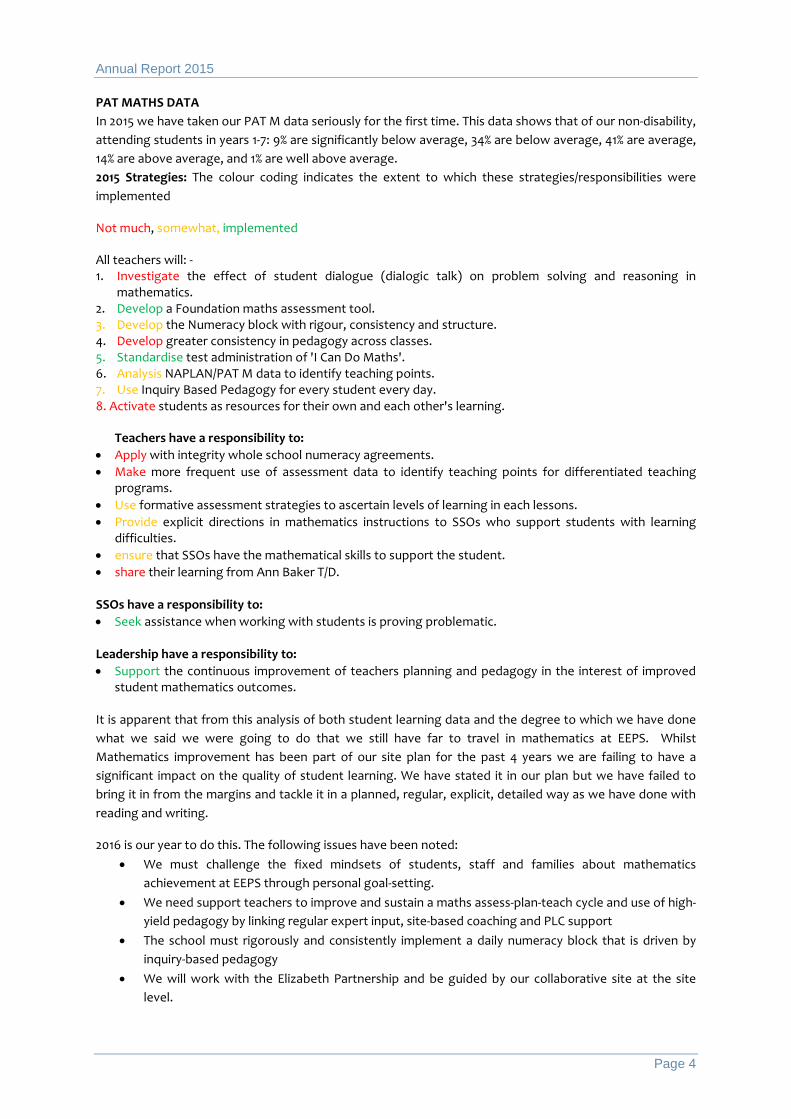
PAT MATHS DATA In 2015 we have taken our PAT M data seriously for the first time. This data shows that of our non-disability, attending students in years 1-7: 9% are significantly below average, 34% are below average, 41% are average, 14% are above average, and 1% are well above average. 2015 Strategies: The colour coding indicates the extent to which these strategies/responsibilities were implemented
Not much, somewhat, implemented
All teachers will: - 1. Investigate the effect of student dialogue (dialogic talk) on problem solving and reasoning in
mathematics. 2. Develop a Foundation maths assessment tool. 3. Develop the Numeracy block with rigour, consistency and structure. 4. Develop greater consistency in pedagogy across classes. 5. Standardise test administration of 'I Can Do Maths'. 6. Analysis NAPLAN/PAT M data to identify teaching points. 7. Use Inquiry Based Pedagogy for every student every day. 8. Activate students as resources for their own and each other's learning.
Teachers have a responsibility to: • Apply with integrity whole school numeracy agreements. • Make more frequent use of assessment data to identify teaching points for differentiated teaching
programs. • Use formative assessment strategies to ascertain levels of learning in each lessons. • Provide explicit directions in mathematics instructions to SSOs who support students with learning
difficulties. • ensure that SSOs have the mathematical skills to support the student. • share their learning from Ann Baker T/D. SSOs have a responsibility to: • Seek assistance when working with students is proving problematic.
Leadership have a responsibility to: • Support the continuous improvement of teachers planning and pedagogy in the interest of improved
student mathematics outcomes. It is apparent that from this analysis of both student learning data and the degree to which we have done what we said we were going to do that we still have far to travel in mathematics at EEPS. Whilst Mathematics improvement has been part of our site plan for the past 4 years we are failing to have a significant impact on the quality of student learning. We have stated it in our plan but we have failed to bring it in from the margins and tackle it in a planned, regular, explicit, detailed way as we have done with reading and writing.
2016 is our year to do this. The following issues have been noted: • We must challenge the fixed mindsets of students, staff and families about mathematics
achievement at EEPS through personal goal-setting. • We need support teachers to improve and sustain a maths assess-plan-teach cycle and use of high-
yield pedagogy by linking regular expert input, site-based coaching and PLC support • The school must rigorously and consistently implement a daily numeracy block that is driven by
inquiry-based pedagogy • We will work with the Elizabeth Partnership and be guided by our collaborative site at the site
level.
Annual Report 2015
Page 5
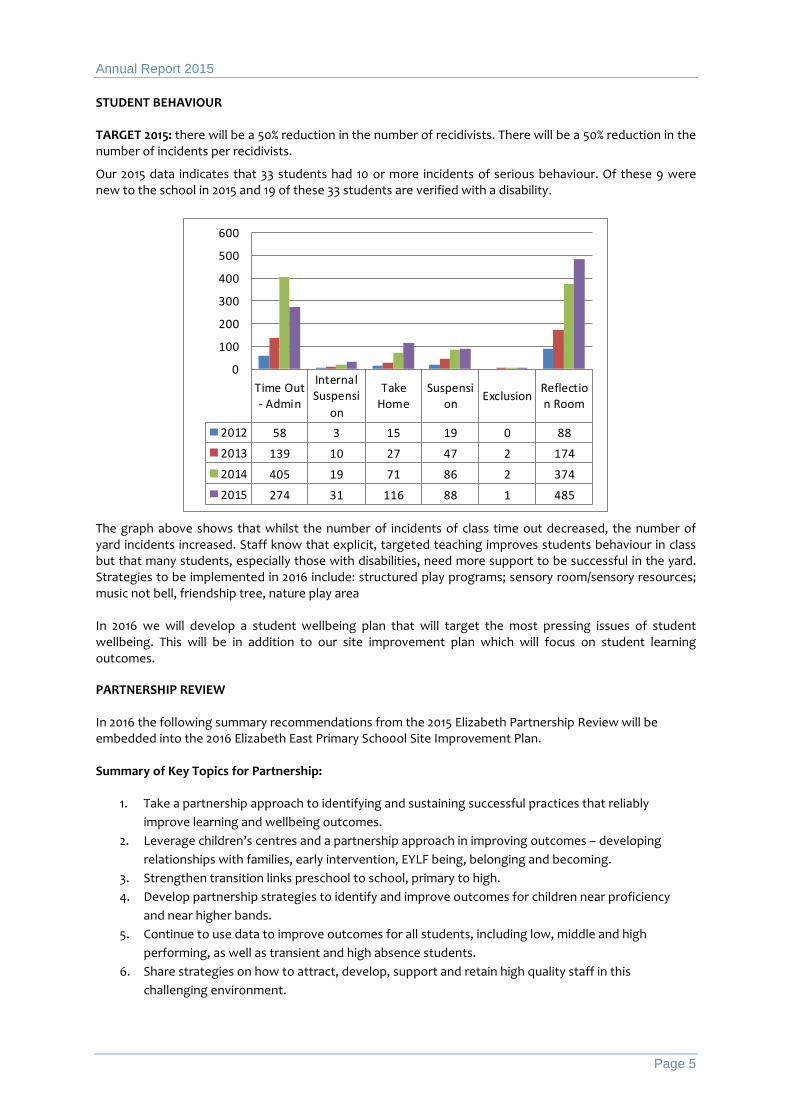
STUDENT BEHAVIOUR TARGET 2015: there will be a 50% reduction in the number of recidivists. There will be a 50% reduction in the number of incidents per recidivists.
Our 2015 data indicates that 33 students had 10 or more incidents of serious behaviour. Of these 9 were new to the school in 2015 and 19 of these 33 students are verified with a disability.
The graph above shows that whilst the number of incidents of class time out decreased, the number of yard incidents increased. Staff know that explicit, targeted teaching improves students behaviour in class but that many students, especially those with disabilities, need more support to be successful in the yard. Strategies to be implemented in 2016 include: structured play programs; sensory room/sensory resources; music not bell, friendship tree, nature play area In 2016 we will develop a student wellbeing plan that will target the most pressing issues of student wellbeing. This will be in addition to our site improvement plan which will focus on student learning outcomes. PARTNERSHIP REVIEW
In 2016 the following summary recommendations from the 2015 Elizabeth Partnership Review will be embedded into the 2016 Elizabeth East Primary Scho0ol Site Improvement Plan.
Summary of Key Topics for Partnership:
1. Take a partnership approach to identifying and sustaining successful practices that reliably improve learning and wellbeing outcomes.
2. Leverage children’s centres and a partnership approach in improving outcomes – developing relationships with families, early intervention, EYLF being, belonging and becoming.
3. Strengthen transition links preschool to school, primary to high. 4. Develop partnership strategies to identify and improve outcomes for children near proficiency
and near higher bands. 5. Continue to use data to improve outcomes for all students, including low, middle and high
performing, as well as transient and high absence students. 6. Share strategies on how to attract, develop, support and retain high quality staff in this
challenging environment.
Time Out- Admin
InternalSuspensi
on
TakeHome
Suspension Exclusion Reflectio
n Room
2012 58 3 15 19 0 882013 139 10 27 47 2 1742014 405 19 71 86 2 3742015 274 31 116 88 1 485
0
100
200
300
400
500
600
Annual Report 2015
Page 6
4.1 Junior Primary and Early Years Scheme Funding
Our junior primary and early years funding was used to keep our JP class sizes down. In 2015 our receptions students learned in classes of no more than 18, our year 1 and 2 students learned in classes of an average of 20 and year 3 students learned in classes of an average of 22. 4.2 Better Schools Funding
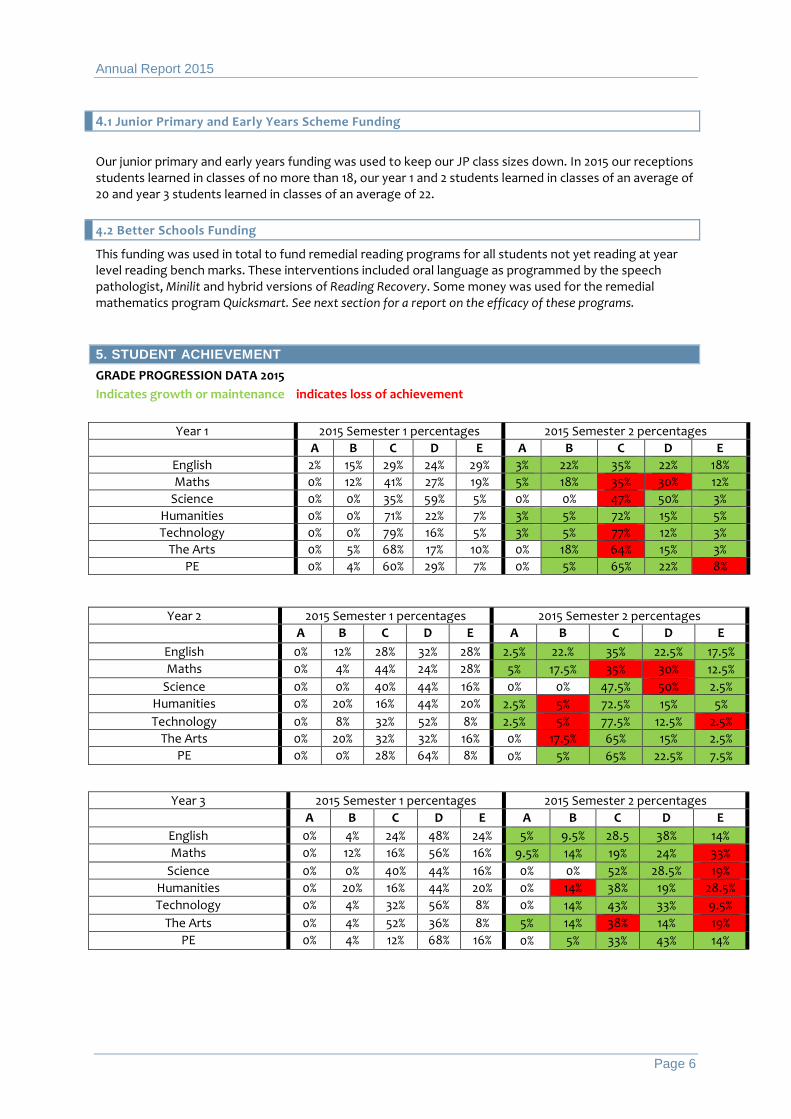
This funding was used in total to fund remedial reading programs for all students not yet reading at year level reading bench marks. These interventions included oral language as programmed by the speech pathologist, Minilit and hybrid versions of Reading Recovery. Some money was used for the remedial mathematics program Quicksmart. See next section for a report on the efficacy of these programs. 5. STUDENT ACHIEVEMENT GRADE PROGRESSION DATA 2015 Indicates growth or maintenance indicates loss of achievement
Year 1 2015 Semester 1 percentages 2015 Semester 2 percentages
A B C D E A B C D E English 2% 15% 29% 24% 29% 3% 22% 35% 22% 18% Maths 0% 12% 41% 27% 19% 5% 18% 35% 30% 12%
Science 0% 0% 35% 59% 5% 0% 0% 47% 50% 3% Humanities 0% 0% 71% 22% 7% 3% 5% 72% 15% 5% Technology 0% 0% 79% 16% 5% 3% 5% 77% 12% 3%
The Arts 0% 5% 68% 17% 10% 0% 18% 64% 15% 3% PE 0% 4% 60% 29% 7% 0% 5% 65% 22% 8%
Year 2 2015 Semester 1 percentages 2015 Semester 2 percentages A B C D E A B C D E
English 0% 12% 28% 32% 28% 2.5% 22.% 35% 22.5% 17.5% Maths 0% 4% 44% 24% 28% 5% 17.5% 35% 30% 12.5%
Science 0% 0% 40% 44% 16% 0% 0% 47.5% 50% 2.5% Humanities 0% 20% 16% 44% 20% 2.5% 5% 72.5% 15% 5% Technology 0% 8% 32% 52% 8% 2.5% 5% 77.5% 12.5% 2.5%
The Arts 0% 20% 32% 32% 16% 0% 17.5% 65% 15% 2.5% PE 0% 0% 28% 64% 8% 0% 5% 65% 22.5% 7.5%
Year 3 2015 Semester 1 percentages 2015 Semester 2 percentages A B C D E A B C D E
English 0% 4% 24% 48% 24% 5% 9.5% 28.5 38% 14% Maths 0% 12% 16% 56% 16% 9.5% 14% 19% 24% 33%
Science 0% 0% 40% 44% 16% 0% 0% 52% 28.5% 19% Humanities 0% 20% 16% 44% 20% 0% 14% 38% 19% 28.5% Technology 0% 4% 32% 56% 8% 0% 14% 43% 33% 9.5%
The Arts 0% 4% 52% 36% 8% 5% 14% 38% 14% 19% PE 0% 4% 12% 68% 16% 0% 5% 33% 43% 14%
Annual Report 2015
Page 7
Year 4 2015 Semester 1 percentages 2015 Semester 2 percentages A B C D E A B C D E
English 0% 3% 31% 56% 10% 0% 4% 31% 50% 15% Maths 0% 10% 24% 59% 7% 8% 8% 11.5% 65% 8%
Science 0% 0% 3% 66% 31% 0% 4% 50% 35% 11.5% Humanities 0% 4% 54% 38% 4% 0% 15% 31% 46% 8% Technology 0% 4% 45% 44% 7% 0% 27% 35% 31% 8%
The Arts 0% 4% 54% 38% 7% 0% 19% 35% 42% 4% PE 0% 0% 7% 79% 14% 4% 4% 42% 38% 11.5%
Year 5 2015 Semester 1 percentages 2015 Semester 2 percentages A B C D E A B C D E
English 0% 0% 35% 50% 15% 6% 6% 35% 53% 0% Maths 0% 14% 43% 36% 7% 0% 12% 53% 35% 0%
Science 0% 0% 0% 80% 20% 0% 0% 24% 76% 0% Humanities 0% 0% 65% 30% 5% 0% 18% 53% 23% 6% Technology 0% 5% 50% 25% 20% 0% 6% 53% 35% 6%
The Arts 0% 14% 57% 14% 15% 6% 12% 53% 24% 6% PE 0% 0% 39% 50% 11% 0% 6% 47% 47% 0%
Year 6 2015 Semester 1 percentages 2015 Semester 2 percentages A B C D E A B C D E
English 0% 9% 39% 35% 17% 0% 21% 14% 53% 11% Maths 0% 9% 39% 39% 13% 0% 18% 36% 39% 7%
Science 0% 0% 17% 66% 17% 0% 0% 29% 64% 7% Humanities 0% 4% 57% 30% 9% 4% 29% 43% 14% 11% Technology 0% 17% 55% 30% 4% 7% 29% 53% 7% 4%
The Arts 0% 9% 65% 26% 0% 7% 29% 43% 14% 7% PE 0% 4% 53% 26% 17% 0% 11% 64% 21% 4%
Year 7 2015 Semester 1 percentages 2015 Semester 2 percentages A B C D E A B C D E
English 0% 0% 24% 41% 35% 0% 17% 22% 50% 11% Maths 0% 0% 24% 65% 11% 0% 22% 28% 39% 11%
Science 0% 0% 11% 71% 18% 0% 11% 11% 66% 11% Humanities 0% 6% 35% 35% 24% 11% 5.5% 33% 39% 11% Technology 6% 18% 18% 52% 6% 33% 11% 44% 11% 0%
The Arts 0% 6% 41% 29% 24% 11% 28% 44% 16% 0% PE 24% 0% 58% 18% 0% 28% 5.5% 51% 16% 0%
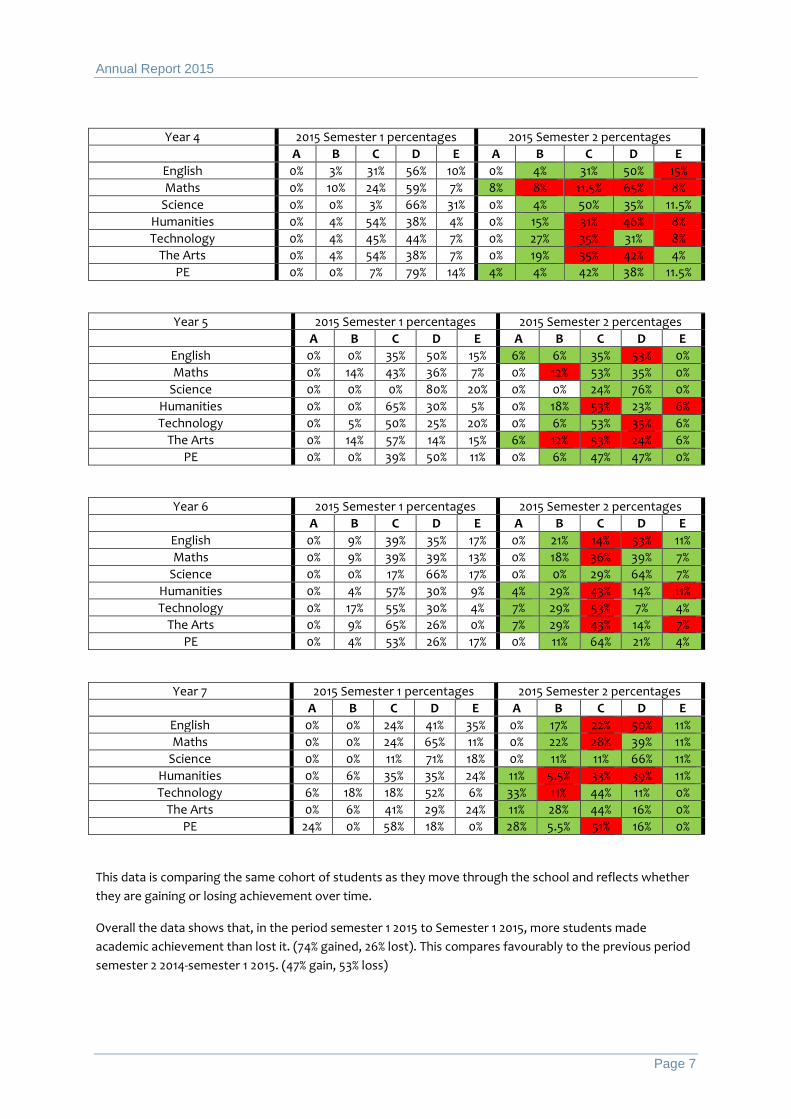
This data is comparing the same cohort of students as they move through the school and reflects whether they are gaining or losing achievement over time.
Overall the data shows that, in the period semester 1 2015 to Semester 1 2015, more students made academic achievement than lost it. (74% gained, 26% lost). This compares favourably to the previous period semester 2 2014-semester 1 2015. (47% gain, 53% loss)
Annual Report 2015
Page 8
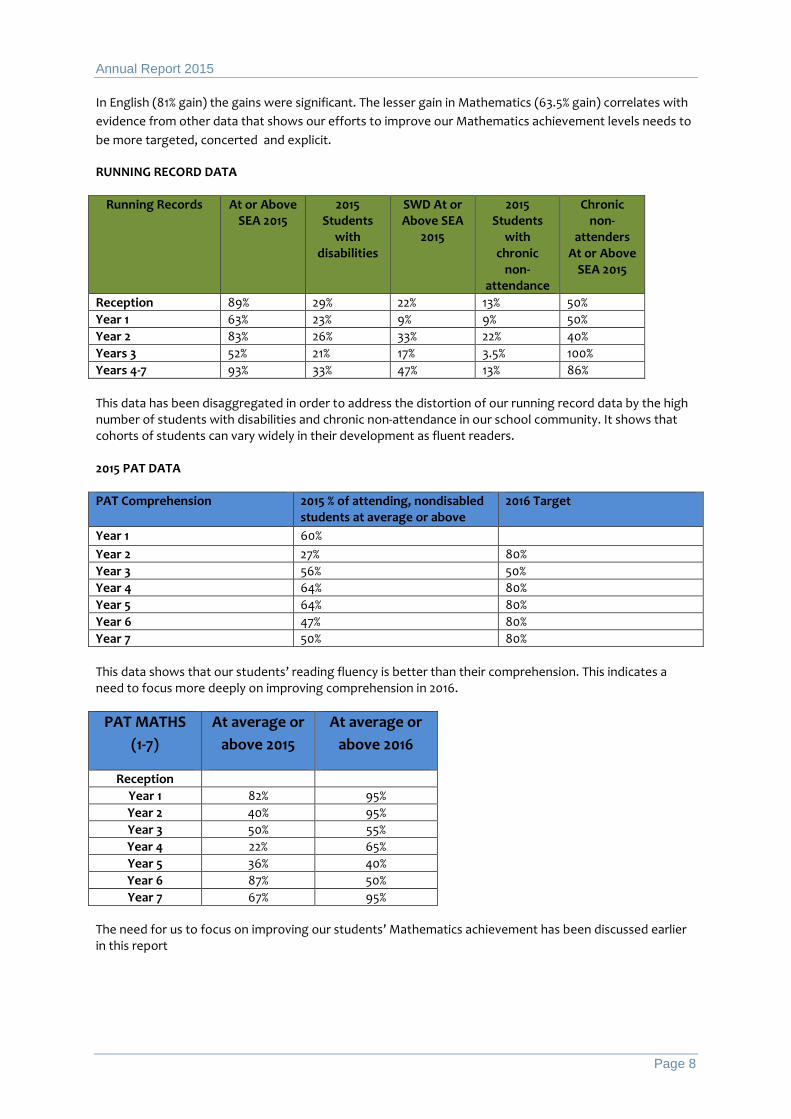
In English (81% gain) the gains were significant. The lesser gain in Mathematics (63.5% gain) correlates with evidence from other data that shows our efforts to improve our Mathematics achievement levels needs to be more targeted, concerted and explicit.
RUNNING RECORD DATA
Running Records At or Above SEA 2015
2015 Students
with disabilities
SWD At or Above SEA
2015
2015 Students
with chronic
non-attendance
Chronic non-
attenders At or Above
SEA 2015
Reception 89% 29% 22% 13% 50% Year 1 63% 23% 9% 9% 50% Year 2 83% 26% 33% 22% 40% Years 3 52% 21% 17% 3.5% 100% Years 4-7 93% 33% 47% 13% 86% This data has been disaggregated in order to address the distortion of our running record data by the high number of students with disabilities and chronic non-attendance in our school community. It shows that cohorts of students can vary widely in their development as fluent readers. 2015 PAT DATA
PAT Comprehension
2015 % of attending, nondisabled students at average or above
2016 Target
Year 1 60% Year 2 27% 80% Year 3 56% 50% Year 4 64% 80% Year 5 64% 80% Year 6 47% 80% Year 7 50% 80% This data shows that our students’ reading fluency is better than their comprehension. This indicates a need to focus more deeply on improving comprehension in 2016.
PAT MATHS (1-7)
At average or above 2015
At average or above 2016
Reception Year 1 82% 95% Year 2 40% 95% Year 3 50% 55% Year 4 22% 65% Year 5 36% 40% Year 6 87% 50% Year 7 67% 95%
The need for us to focus on improving our students’ Mathematics achievement has been discussed earlier in this report
Annual Report 2015
Page 9
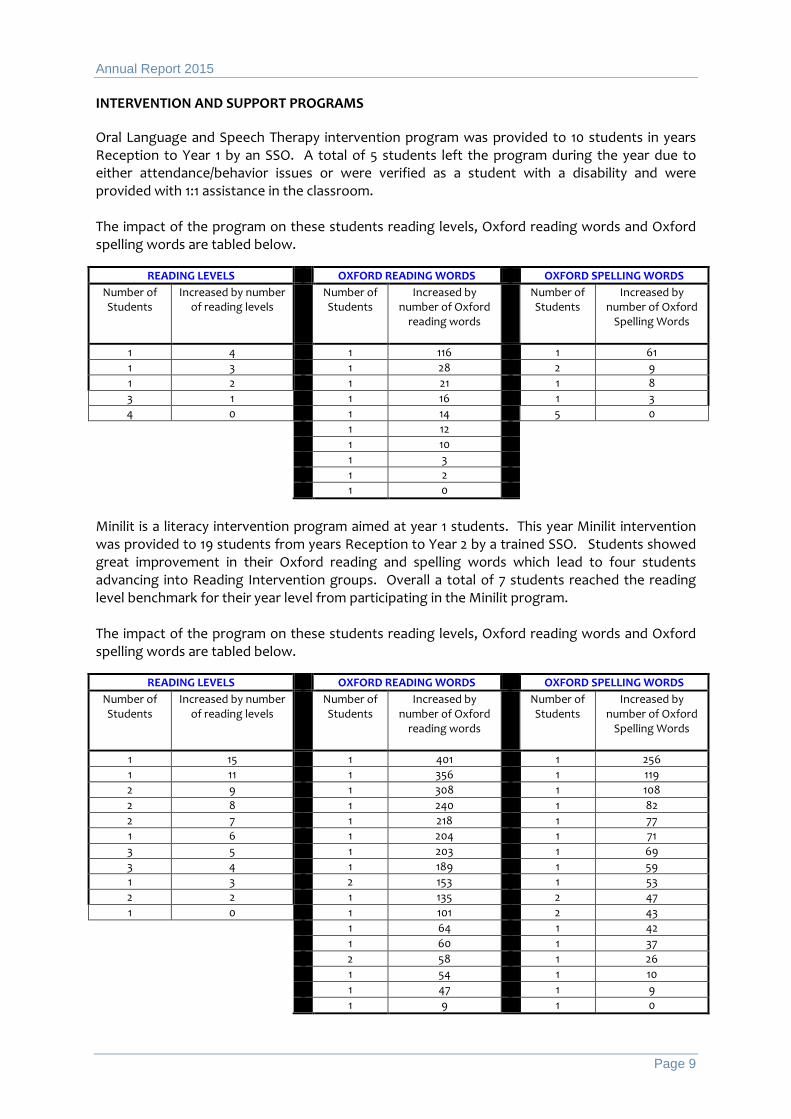
INTERVENTION AND SUPPORT PROGRAMS Oral Language and Speech Therapy intervention program was provided to 10 students in years Reception to Year 1 by an SSO. A total of 5 students left the program during the year due to either attendance/behavior issues or were verified as a student with a disability and were provided with 1:1 assistance in the classroom. The impact of the program on these students reading levels, Oxford reading words and Oxford spelling words are tabled below.
READING LEVELS OXFORD READING WORDS OXFORD SPELLING WORDS Number of Students
Increased by number of reading levels
Number of Students
Increased by number of Oxford
reading words
Number of Students
Increased by number of Oxford
Spelling Words
1 4 1 116 1 61 1 3 1 28 2 9 1 2 1 21 1 8 3 1 1 16 1 3 4 0 1 14 5 0 1 12 1 10 1 3 1 2 1 0
Minilit is a literacy intervention program aimed at year 1 students. This year Minilit intervention was provided to 19 students from years Reception to Year 2 by a trained SSO. Students showed great improvement in their Oxford reading and spelling words which lead to four students advancing into Reading Intervention groups. Overall a total of 7 students reached the reading level benchmark for their year level from participating in the Minilit program. The impact of the program on these students reading levels, Oxford reading words and Oxford spelling words are tabled below.
READING LEVELS OXFORD READING WORDS OXFORD SPELLING WORDS Number of Students
Increased by number of reading levels
Number of Students
Increased by number of Oxford
reading words
Number of Students
Increased by number of Oxford
Spelling Words
1 15 1 401 1 256 1 11 1 356 1 119 2 9 1 308 1 108 2 8 1 240 1 82 2 7 1 218 1 77 1 6 1 204 1 71 3 5 1 203 1 69 3 4 1 189 1 59 1 3 2 153 1 53 2 2 1 135 2 47 1 0 1 101 2 43 1 64 1 42 1 60 1 37 2 58 1 26 1 54 1 10 1 47 1 9 1 9 1 0
Annual Report 2015
Page 10
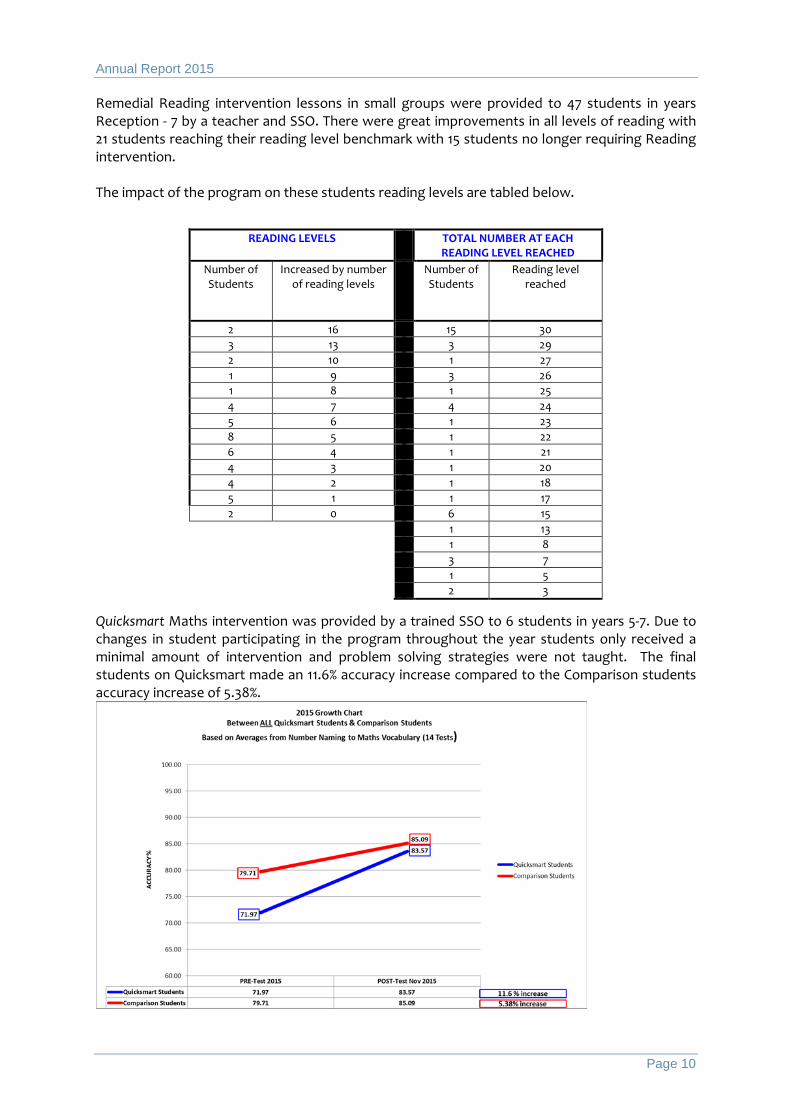
Remedial Reading intervention lessons in small groups were provided to 47 students in years Reception - 7 by a teacher and SSO. There were great improvements in all levels of reading with 21 students reaching their reading level benchmark with 15 students no longer requiring Reading intervention. The impact of the program on these students reading levels are tabled below. Quicksmart Maths intervention was provided by a trained SSO to 6 students in years 5-7. Due to changes in student participating in the program throughout the year students only received a minimal amount of intervention and problem solving strategies were not taught. The final students on Quicksmart made an 11.6% accuracy increase compared to the Comparison students accuracy increase of 5.38%.
READING LEVELS TOTAL NUMBER AT EACH READING LEVEL REACHED
Number of Students
Increased by number of reading levels
Number of Students
Reading level reached
2 16 15 30 3 13 3 29 2 10 1 27 1 9 3 26 1 8 1 25 4 7 4 24 5 6 1 23 8 5 1 22 6 4 1 21 4 3 1 20 4 2 1 18 5 1 1 17 2 0 6 15 1 13 1 8 3 7 1 5 2 3
Annual Report 2015
Page 11
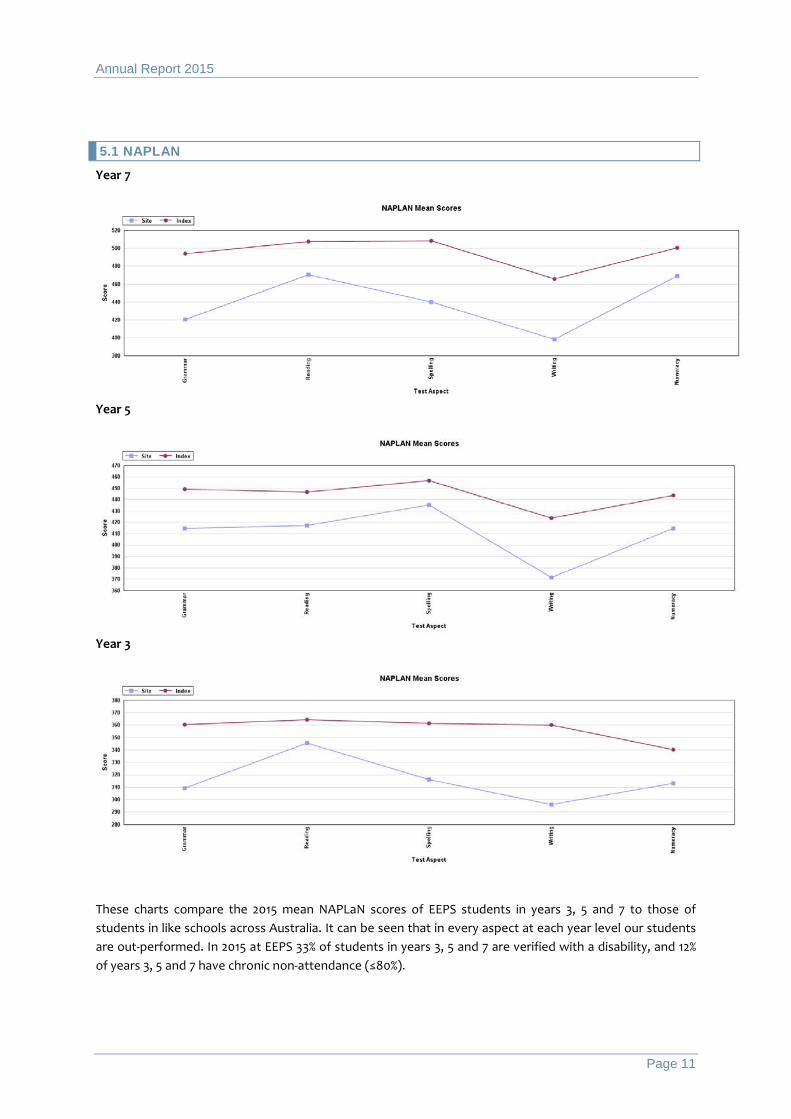
5.1 NAPLAN
Year 7
Year 5
Year 3
These charts compare the 2015 mean NAPLaN scores of EEPS students in years 3, 5 and 7 to those of students in like schools across Australia. It can be seen that in every aspect at each year level our students are out-performed. In 2015 at EEPS 33% of students in years 3, 5 and 7 are verified with a disability, and 12% of years 3, 5 and 7 have chronic non-attendance (≤80%).
Annual Report 2015
Page 12
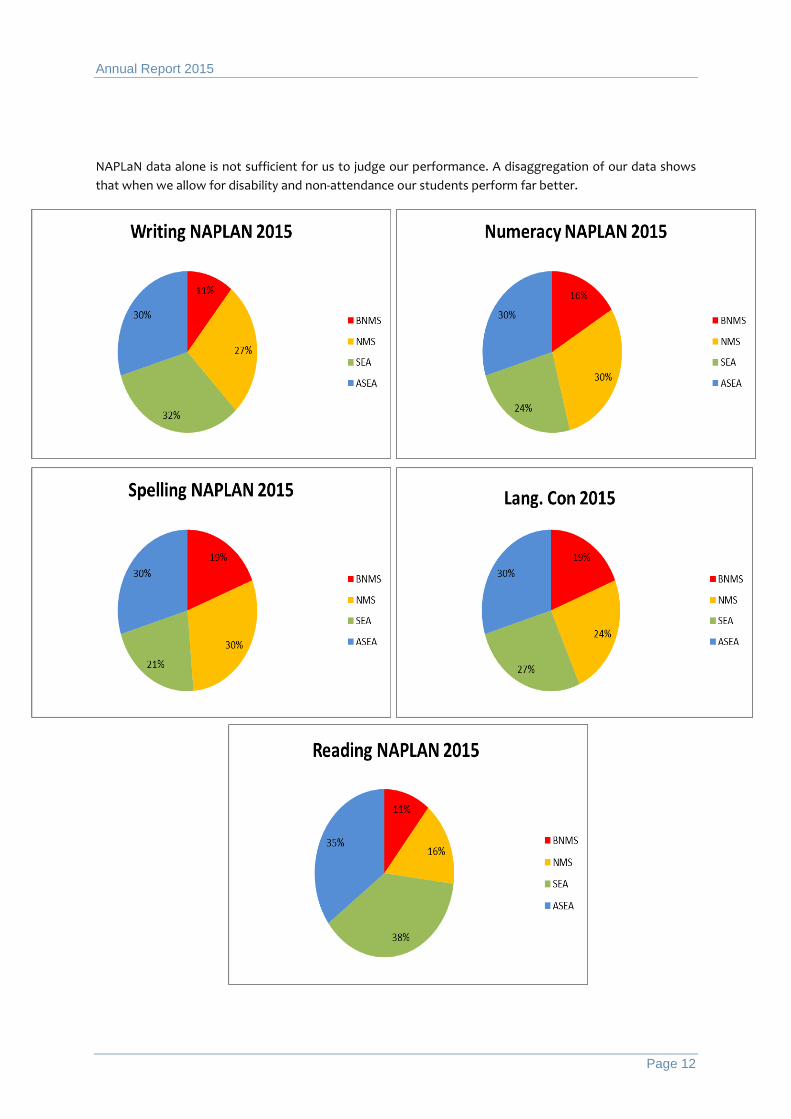
NAPLaN data alone is not sufficient for us to judge our performance. A disaggregation of our data shows that when we allow for disability and non-attendance our students perform far better.
Annual Report 2015
Page 13
6. STUDENT DATA
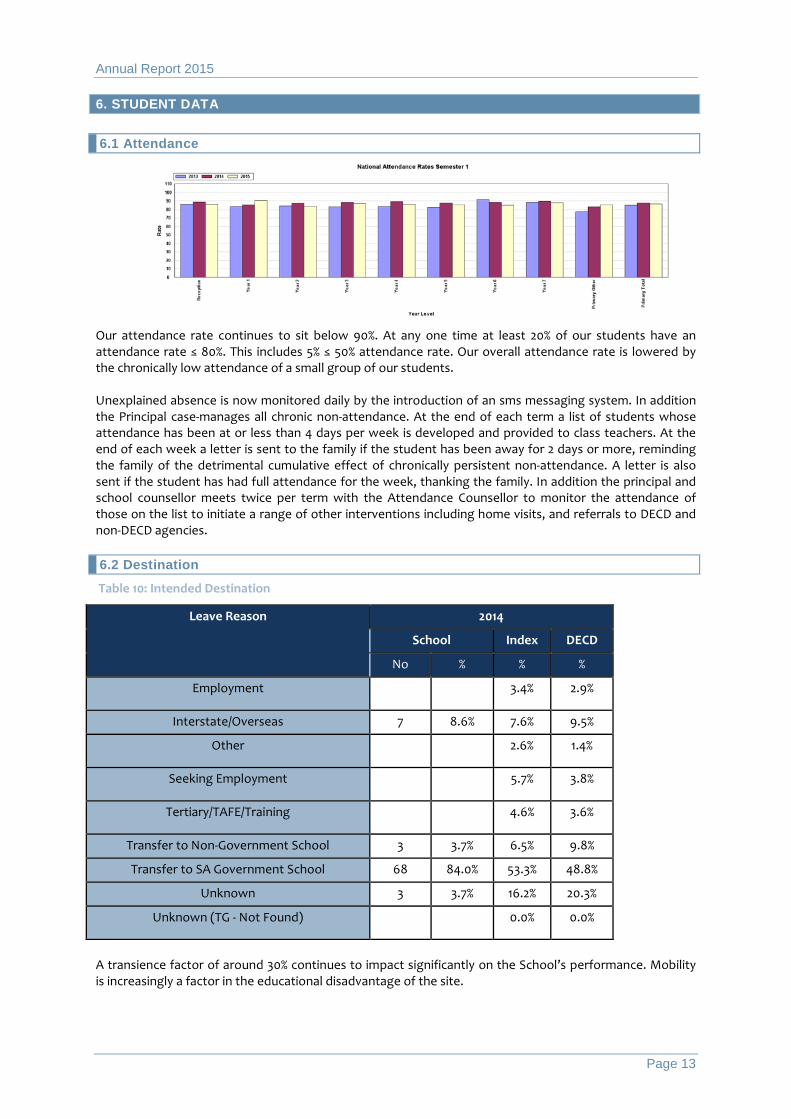
6.1 Attendance Our attendance rate continues to sit below 90%. At any one time at least 20% of our students have an attendance rate ≤ 80%. This includes 5% ≤ 50% attendance rate. Our overall attendance rate is lowered by the chronically low attendance of a small group of our students. Unexplained absence is now monitored daily by the introduction of an sms messaging system. In addition the Principal case-manages all chronic non-attendance. At the end of each term a list of students whose attendance has been at or less than 4 days per week is developed and provided to class teachers. At the end of each week a letter is sent to the family if the student has been away for 2 days or more, reminding the family of the detrimental cumulative effect of chronically persistent non-attendance. A letter is also sent if the student has had full attendance for the week, thanking the family. In addition the principal and school counsellor meets twice per term with the Attendance Counsellor to monitor the attendance of those on the list to initiate a range of other interventions including home visits, and referrals to DECD and non-DECD agencies. 6.2 Destination
Table 10: Intended Destination
Leave Reason 2014
School Index DECD
No % % %
Employment 3.4% 2.9%
Interstate/Overseas 7 8.6% 7.6% 9.5%
Other 2.6% 1.4%
Seeking Employment 5.7% 3.8%
Tertiary/TAFE/Training 4.6% 3.6%
Transfer to Non-Government School 3 3.7% 6.5% 9.8%
Transfer to SA Government School 68 84.0% 53.3% 48.8%
Unknown 3 3.7% 16.2% 20.3%
Unknown (TG - Not Found) 0.0% 0.0%
A transience factor of around 30% continues to impact significantly on the School’s performance. Mobility is increasingly a factor in the educational disadvantage of the site.
Annual Report 2015
Page 14
7. CLIENT OPINION PARENT SURVEY
Aspect
1. Teachers at this school expect my child to do his or her best
2. Teachers at this school provide my child with useful feedback about his or her school work
3. Teachers at this school treat students fairly
4. This school is well maintained
5. My child feels safe at this school
6. My child likes being at this school
7. This school looks for ways to improve
8. This school involves parents in decision making
9. Teachers at this school motivate my child to learn
10. My child is making good progress at this school
11. My child’s learning needs are met by this school
12. This school works with me to support my child’s learning
13. Parent Volunteers are welcomed and supported with training in this school
14. There is a clear grievance procedure for parents and carers to use when there is an issue
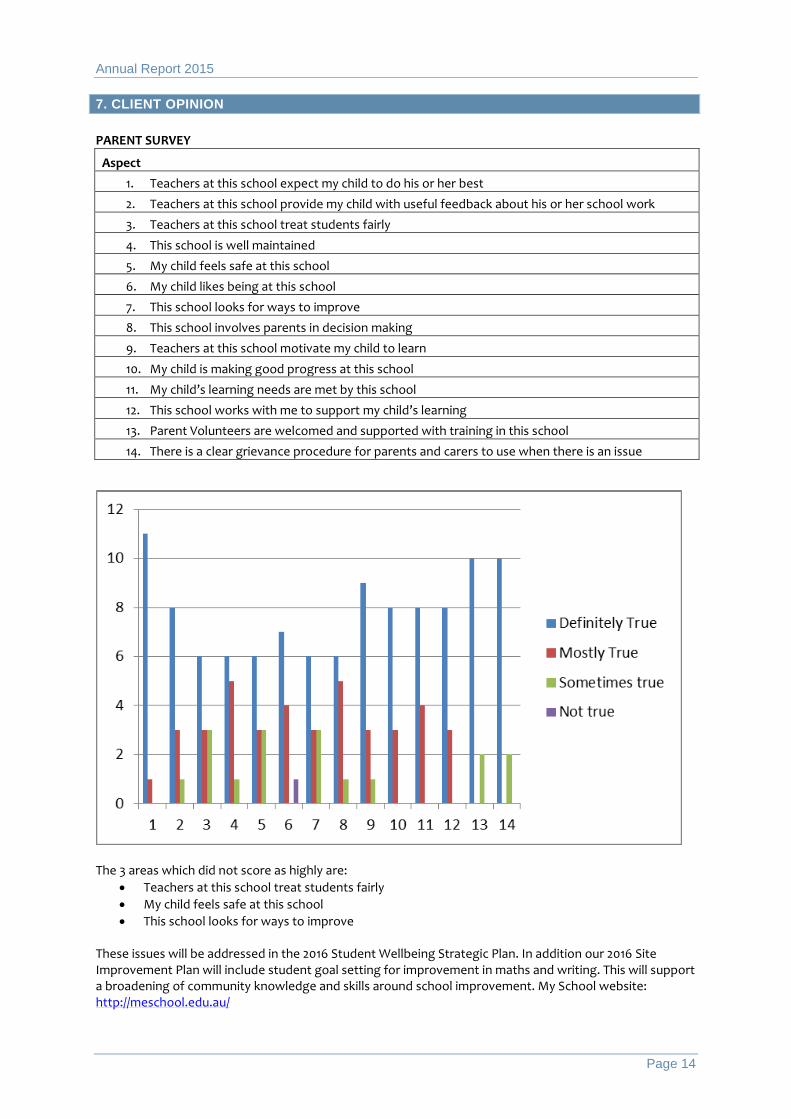
The 3 areas which did not score as highly are:
• Teachers at this school treat students fairly • My child feels safe at this school • This school looks for ways to improve
These issues will be addressed in the 2016 Student Wellbeing Strategic Plan. In addition our 2016 Site Improvement Plan will include student goal setting for improvement in maths and writing. This will support a broadening of community knowledge and skills around school improvement. My School website: http://meschool.edu.au/
Annual Report 2015
Page 15
EEPS Teacher Survey November 2015
Not
true
Onl
y tr
ue to
so
me
degr
ee
Mos
tly tr
ue
Defin
itely
true
Leadership commitment to a safe schoolThe school leadership team takes responsibility for the development and maintenance of a safe, supportive and respectful learning environment 0% 20% 25% 55%Within the school there is a clear understanding of the school's current capacity to enhance the wellbeing and safety of its students and actions that need to be taken to enhance that capacity 0% 15% 50% 35%
Supportive and connected to school cultureStudents feels connected to the school 0% 20% 75% 5%Data is collected about harassment, aggression, violence and bullying on a regular basis to inform decision making about the safety of the school learning context 0% 5% 40% 55%Parents and carers feel connected to the school 0% 31% 53% 16%The school has a focus on staff wellbeingThe needs of specific groups (e.g. Aboriginal or Torres Straight Islander or refugee and immigrant communities, people with a disability) in the school community have been recognised and addressed 0% 20% 25% 55%
Policies and ProceduresSafety and wellbeing policies have been developed 0% 5% 25% 70%Step-by-step procedures are in place for staff when responding to child abuse and neglect, harassment, aggression and bullying 0% 5% 15% 80%All staff are aware of these procedures 0% 15% 35% 50%A responsible technology usage agreement is in place in the school 0% 5% 40% 55%A risk assessment of the physical school environment has been done which informs effective risk management plans 0% 0% 5% 75%Protocols about appropriate and inappropriate adult-student contact within the school context are followed 0% 5% 30% 65%
Professional LearningOpportunities are regularly provided for more expert and advanced professional learning for staff 0% 10% 20% 70%Non-teaching and casual/specialist/visiting staff are included in relevant professional learning opportunities 0% 31% 11% 58%
Positive behaviour managementDecisions about the selection of behaviour support programs and resources are evidence based 0% 21% 26% 53%Positive student behaviour is promoted and recognised 15% 10% 25% 50%The school's selected approach(es) towards student safety are consistently implemented by all staff at both the school and classroom level 0% 20% 45% 35%
Engagement, skill development and safe school curriculumThere is a strong school focus on student engagement 0% 15% 40% 45%Skills and understandings are taught for cyber safety and for countering harassment, aggression, violence and bullying 0% 20% 55% 25%A personal safety and protective behaviours curriculum is in place at appropriate year levels 0% 5% 55% 40%
A focus on student well being and student ownershipEffective pastoral care and peer support structures are in place 6% 35% 24% 35%
Early intervention and targeted supportStudents and their families who could benefit from additional support are identified as early as possible 0% 11% 31% 58%Appropriate early student intervention involving support, skill development and social restructuring is undertaken 0% 25% 25% 50%Ongoing support is provided to identified students and their families 0% 5% 15% 80%
Partnerships with families and communityThe school provides opportunities for parent and carer education around issues related to safety and wellbeing and work collaboratively with parents/carers on issues related to student safety and wellbeing 10% 5% 45% 40%The school works with community organisations to provide a consistent message about student safety and wellbeing 5% 16% 32% 47%The school works with community agencies to maximise its effectiveness and extend support to students and families 5% 5% 26% 64%
Annual Report 2015
Page 16
EEPS SSO Survey November 2015
Not
true
Onl
y tr
ue to
so
me
degr
ee
Mos
tly tr
ue
Defin
itely
true
Leadership commitment to a safe schoolThe school leadership team takes responsibility for the development and maintenance of a safe, supportive and respectful learning environment 0% 6% 27% 67%Within the school there is a clear understanding of the school's current capacity to enhance the wellbeing and safety of its students and actions that need to be taken to enhance that capacity 0% 6% 62% 31%
Supportive and connected to school cultureStudents feels connected to the school 0% 13% 81% 6%
Data is collected about harassment, aggression, violence and bullying on a regular basis to inform decision making about the safety of the school learning context 0% 6% 31% 63%Parents and carers feel connected to the school 13% 6% 75% 6%The school has a focus on staff wellbeing 0% 20% 13% 67%
The needs of specific groups (e.g. Aboriginal or Torres Straight Islander or refugee and immigrant communities, people with a disability) in the school community have been recognised and addressed 0% 0% 31% 69%
Policies and ProceduresSafety and wellbeing policies have been developed 0% 0% 38% 62%
Step-by-step procedures are in place for staff when responding to child abuse and neglect, harassment, aggression and bullying 0% 6% 38% 56%All staff are aware of these procedures 13% 13% 37% 37%A responsible technology usage agreement is in place in the school 0% 7% 53% 40%A risk assessment of the physical school environment has been done which informs effective risk management plans 0% 6% 44% 50%Protocols about appropriate and inappropriate adult-student contact within the school context are followed 0% 6% 25% 69%
Professional LearningOpportunities are regularly provided for more expert and advanced professional learning for staff 6% 20% 37% 37%
Non-teaching and casual/specialist/visiting staff are included in relevant professional learning opportunities 6% 13% 44% 37%
Positive behaviour managementDecisions about the selection of behaviour support programs and resources are evidence based 0% 13% 34% 53%Positive student behaviour is promoted and recognised 6% 12% 13% 69%
The school's selected approach(es) towards student safety are consistently implemented by all staff at both the school and classroom level 7% 7% 40% 46%
Engagement, skill development and safe school curriculumThere is a strong school focus on student engagement 6% 12% 25% 56%Skills and understandings are taught for cyber safety and for countering harassment, aggression, violence and bullying 0% 6% 31% 63%A personal safety and protective behaviours curriculum is in place at appropriate year levels 0% 14% 28% 58%
A focus on student well being and student ownershipEffective pastoral care and peer support structures are in place 7% 14% 43% 36%
Early intervention and targeted supportStudents and their families who could benefit from additional support are identified as early as possible 0% 0% 40% 60%Appropriate early student intervention involving support, skill development and social restructuring is undertaken 0% 6% 50% 44%
Ongoing support is provided to identified students and their families 0% 0% 37% 63%
Partnerships with families and communityThe school provides opportunities for parent and carer education around issues related to safety and wellbeing and work collaboratively with parents/carers on issues related to student safety and wellbeing 0% 6% 37% 57%The school works with community organisations to provide a consistent message about student safety and wellbeing 0% 0% 50% 50%The school works with community agencies to maximise its effectiveness and extend support to students and families 0% 0% 50% 50%
Annual Report 2015
Page 17
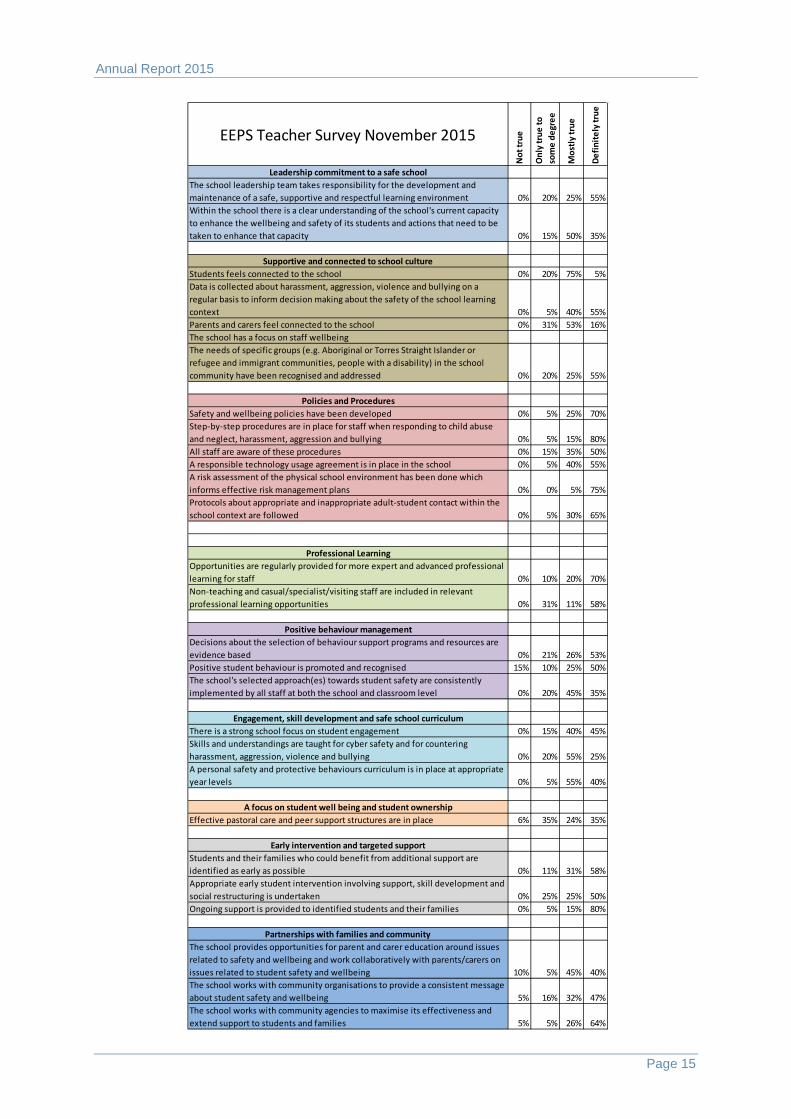
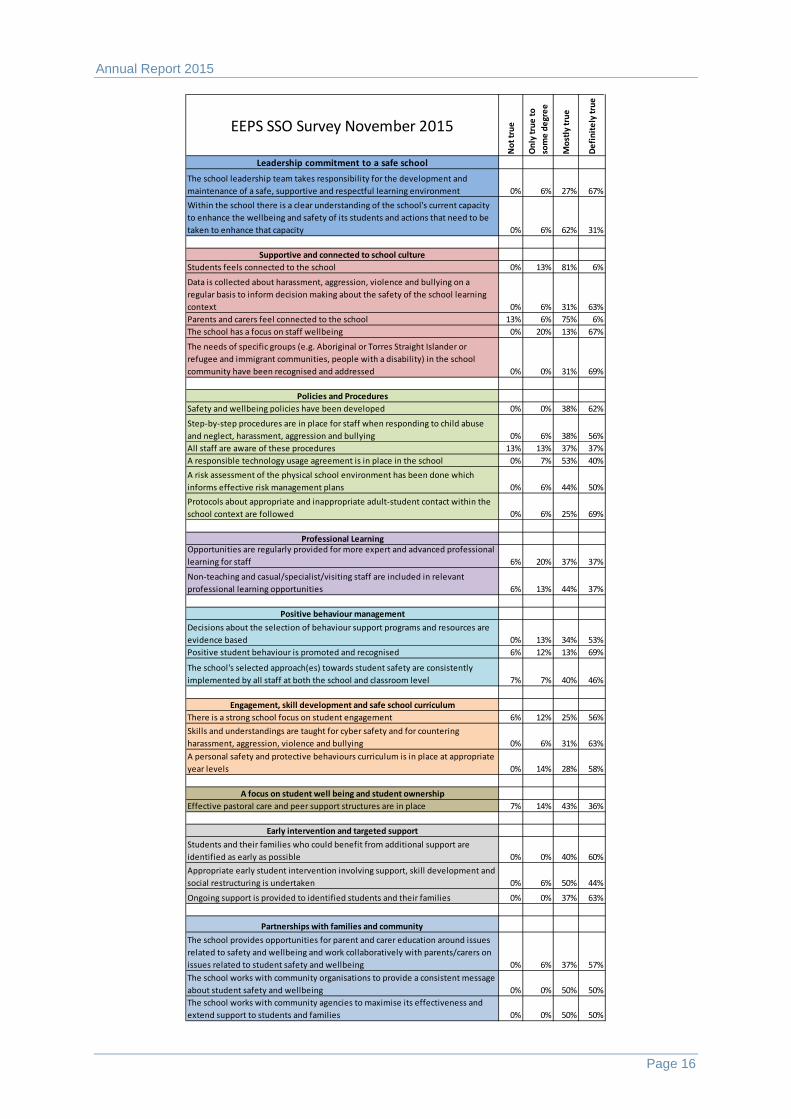
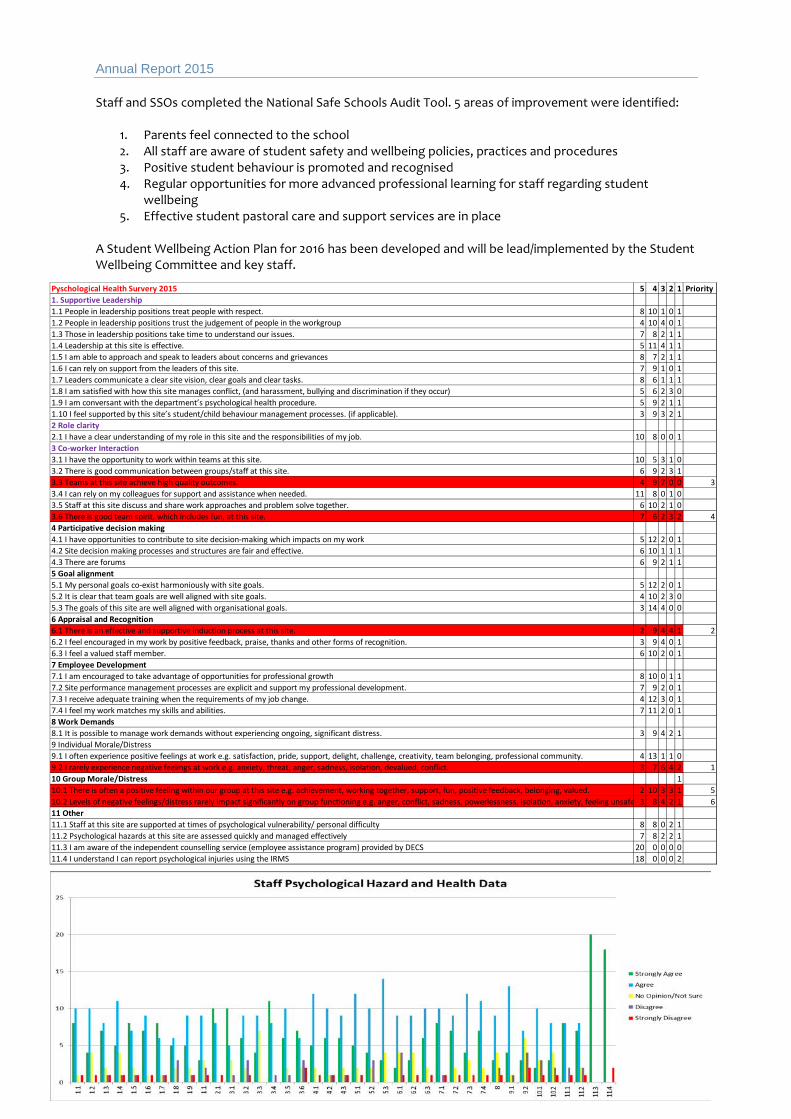
Staff and SSOs completed the National Safe Schools Audit Tool. 5 areas of improvement were identified:
1. Parents feel connected to the school 2. All staff are aware of student safety and wellbeing policies, practices and procedures 3. Positive student behaviour is promoted and recognised 4. Regular opportunities for more advanced professional learning for staff regarding student
wellbeing 5. Effective student pastoral care and support services are in place
A Student Wellbeing Action Plan for 2016 has been developed and will be lead/implemented by the Student Wellbeing Committee and key staff.
Pyschological Health Survery 2015 5 4 3 2 1 Priority 1. Supportive Leadership1.1 People in leadership positions treat people with respect. 8 10 1 0 11.2 People in leadership positions trust the judgement of people in the workgroup 4 10 4 0 11.3 Those in leadership positions take time to understand our issues. 7 8 2 1 11.4 Leadership at this site is effective. 5 11 4 1 11.5 I am able to approach and speak to leaders about concerns and grievances 8 7 2 1 11.6 I can rely on support from the leaders of this site. 7 9 1 0 11.7 Leaders communicate a clear site vision, clear goals and clear tasks. 8 6 1 1 11.8 I am satisfied with how this site manages conflict, (and harassment, bullying and discrimination if they occur) 5 6 2 3 01.9 I am conversant with the department’s psychological health procedure. 5 9 2 1 11.10 I feel supported by this site’s student/child behaviour management processes. (if applicable). 3 9 3 2 12 Role clarity2.1 I have a clear understanding of my role in this site and the responsibilities of my job. 10 8 0 0 13 Co-worker Interaction3.1 I have the opportunity to work within teams at this site. 10 5 3 1 03.2 There is good communication between groups/staff at this site. 6 9 2 3 13.3 Teams at this site achieve high quality outcomes. 4 9 7 0 0 33.4 I can rely on my colleagues for support and assistance when needed. 11 8 0 1 03.5 Staff at this site discuss and share work approaches and problem solve together. 6 10 2 1 03.6 There is good team spirit, which includes fun, at this site. 7 6 2 3 2 44 Participative decision making4.1 I have opportunities to contribute to site decision-making which impacts on my work 5 12 2 0 14.2 Site decision making processes and structures are fair and effective. 6 10 1 1 14.3 There are forums 6 9 2 1 15 Goal alignment5.1 My personal goals co-exist harmoniously with site goals. 5 12 2 0 15.2 It is clear that team goals are well aligned with site goals. 4 10 2 3 05.3 The goals of this site are well aligned with organisational goals. 3 14 4 0 06 Appraisal and Recognition6.1 There is an effective and supportive induction process at this site. 2 9 4 4 1 26.2 I feel encouraged in my work by positive feedback, praise, thanks and other forms of recognition. 3 9 4 0 16.3 I feel a valued staff member. 6 10 2 0 17 Employee Development7.1 I am encouraged to take advantage of opportunities for professional growth 8 10 0 1 17.2 Site performance management processes are explicit and support my professional development. 7 9 2 0 17.3 I receive adequate training when the requirements of my job change. 4 12 3 0 17.4 I feel my work matches my skills and abilities. 7 11 2 0 18 Work Demands8.1 It is possible to manage work demands without experiencing ongoing, significant distress. 3 9 4 2 19 Individual Morale/Distress9.1 I often experience positive feelings at work e.g. satisfaction, pride, support, delight, challenge, creativity, team belonging, professional community. 4 13 1 1 09.2 I rarely experience negative feelings at work e.g. anxiety, threat, anger, sadness, isolation, devalued, conflict. 3 7 6 4 2 110 Group Morale/Distress 110.1 There is often a positive feeling within our group at this site e.g. achievement, working together, support, fun, positive feedback, belonging, valued. 2 10 3 3 1 510.2 Levels of negative feelings/distress rarely impact significantly on group functioning e.g. anger, conflict, sadness, powerlessness, isolation, anxiety, feeling unsafe 3 8 4 2 1 611 Other11.1 Staff at this site are supported at times of psychological vulnerability/ personal difficulty 8 8 0 2 111.2 Psychological hazards at this site are assessed quickly and managed effectively 7 8 2 2 111.3 I am aware of the independent counselling service (employee assistance program) provided by DECS 20 0 0 0 011.4 I understand I can report psychological injuries using the IRMS 18 0 0 0 2
Annual Report 2015
Page 18
Staff and SSOs completed the Psychological Hazard and Health Audit Tool. Areas of improvement were identified, including quality outcomes, team spirit, induction processes. A Staff Wellbeing Action Plan for 2016 has been developed and will be lead/implemented by the Staff Wellbeing Committee and key WHS staff.
8. ACCOUNTABILITY
8.1 Behaviour Management
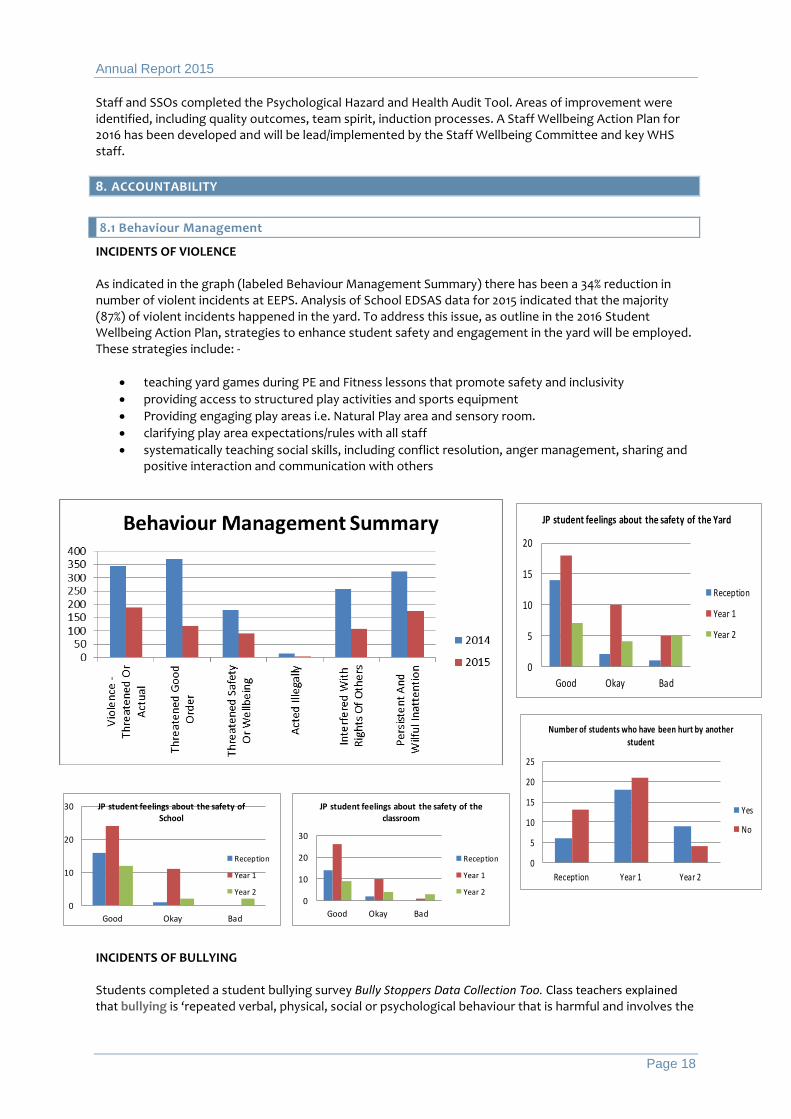
INCIDENTS OF VIOLENCE As indicated in the graph (labeled Behaviour Management Summary) there has been a 34% reduction in number of violent incidents at EEPS. Analysis of School EDSAS data for 2015 indicated that the majority (87%) of violent incidents happened in the yard. To address this issue, as outline in the 2016 Student Wellbeing Action Plan, strategies to enhance student safety and engagement in the yard will be employed. These strategies include: -
• teaching yard games during PE and Fitness lessons that promote safety and inclusivity • providing access to structured play activities and sports equipment • Providing engaging play areas i.e. Natural Play area and sensory room. • clarifying play area expectations/rules with all staff • systematically teaching social skills, including conflict resolution, anger management, sharing and
positive interaction and communication with others
INCIDENTS OF BULLYING Students completed a student bullying survey Bully Stoppers Data Collection Too. Class teachers explained that bullying is ‘repeated verbal, physical, social or psychological behaviour that is harmful and involves the
0
10
20
30
Good Okay Bad
JP student feelings about the safety of School
Reception
Year 1
Year 2
0
5
10
15
20
Good Okay Bad
JP student feelings about the safety of the Yard
Reception
Year 1
Year 2
0
5
10
15
20
25
Reception Year 1 Year 2
Number of students who have been hurt by another student
Yes
No
0
10
20
30
Good Okay Bad
JP student feelings about the safety of the classroom
Reception
Year 1
Year 2
Annual Report 2015
Page 19
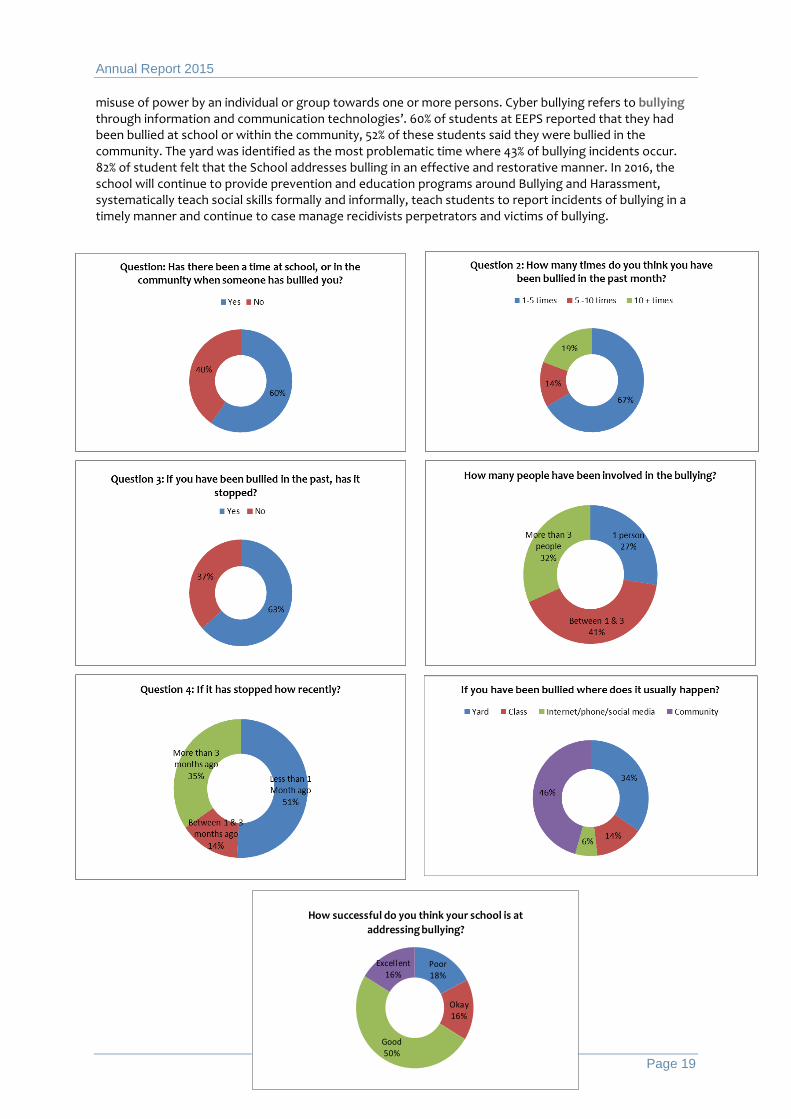
misuse of power by an individual or group towards one or more persons. Cyber bullying refers to bullying through information and communication technologies’. 60% of students at EEPS reported that they had been bullied at school or within the community, 52% of these students said they were bullied in the community. The yard was identified as the most problematic time where 43% of bullying incidents occur. 82% of student felt that the School addresses bulling in an effective and restorative manner. In 2016, the school will continue to provide prevention and education programs around Bullying and Harassment, systematically teach social skills formally and informally, teach students to report incidents of bullying in a timely manner and continue to case manage recidivists perpetrators and victims of bullying.
Poor18%
Okay16%
Good50%
Excellent 16%
How successful do you think your school is at addressing bullying?
Annual Report 2015
Page 20
8.2 Relevant History Screening
Elizabeth East Primary School continued to follow the DECD requirement which meant that all DECD employees, contractors, volunteers, third party providers and specific groups of students e.g. tertiary and some adult re-entry students had a current approved criminal history screening related to working with children at all times throughout their employment or prescribed duties in a DECD site. The Department for Communities and Social Inclusion (DCSI) Screening Unit provides this screening service for child-related screening. These screenings will be required to be updated every three years Screening for teachers is undertaken by the Teachers Registration Board of SA. Registered teachers do not need to be screened by the DCSI Screening Unit. All members of Governing Council, the Fundraising Committee and any parent volunteers are now DCSI screened. The process for staff is documented and managed through the HR Portal for documentation. All volunteers, third party providers, contractors and tertiary students provide a copy of their DCSI screening to the Deputy Principal who entered this information onto the EDSAS system. The EDSAS system is the electronic management process for recording and maintaining records. A copy of the DCSI screen is also kept in a screening folder. The roll out of the National Disability Insurance Scheme (NDIS) has seen a significant rise in the number of Third Party Providers (such as Speech Pathologists or Occupational Therapists) and reinforced the need for electronic management of the DCSI clearances in the school. This year the school assisted and paid for eight volunteers to apply for their screening. 8.3 HUMAN RESOURCES - Workforce Data
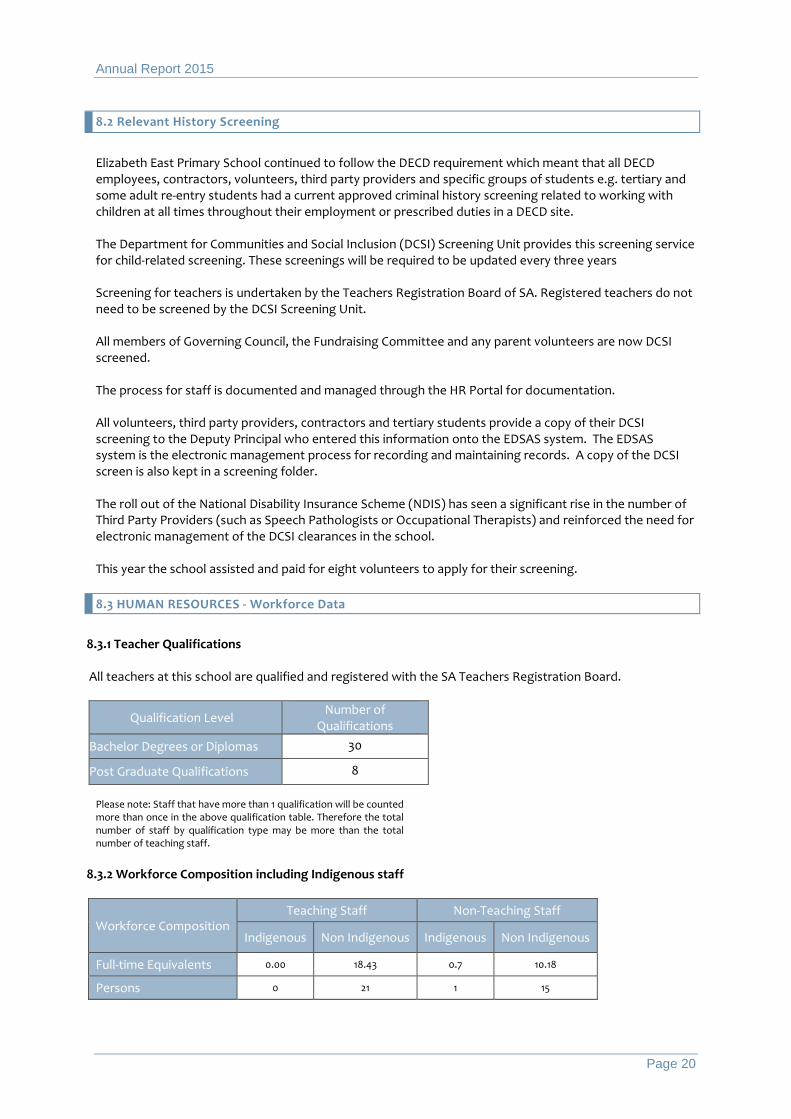
8.3.1 Teacher Qualifications All teachers at this school are qualified and registered with the SA Teachers Registration Board.
Qualification Level Number of Qualifications
Bachelor Degrees or Diplomas 30
Post Graduate Qualifications 8 Please note: Staff that have more than 1 qualification will be counted more than once in the above qualification table. Therefore the total number of staff by qualification type may be more than the total number of teaching staff.
8.3.2 Workforce Composition including Indigenous staff
Workforce Composition Teaching Staff Non-Teaching Staff
Indigenous Non Indigenous Indigenous Non Indigenous
Full-time Equivalents 0.00 18.43 0.7 10.18
Persons 0 21 1 15
Annual Report 2015
Page 21
9. FINANCIAL STATEMENT
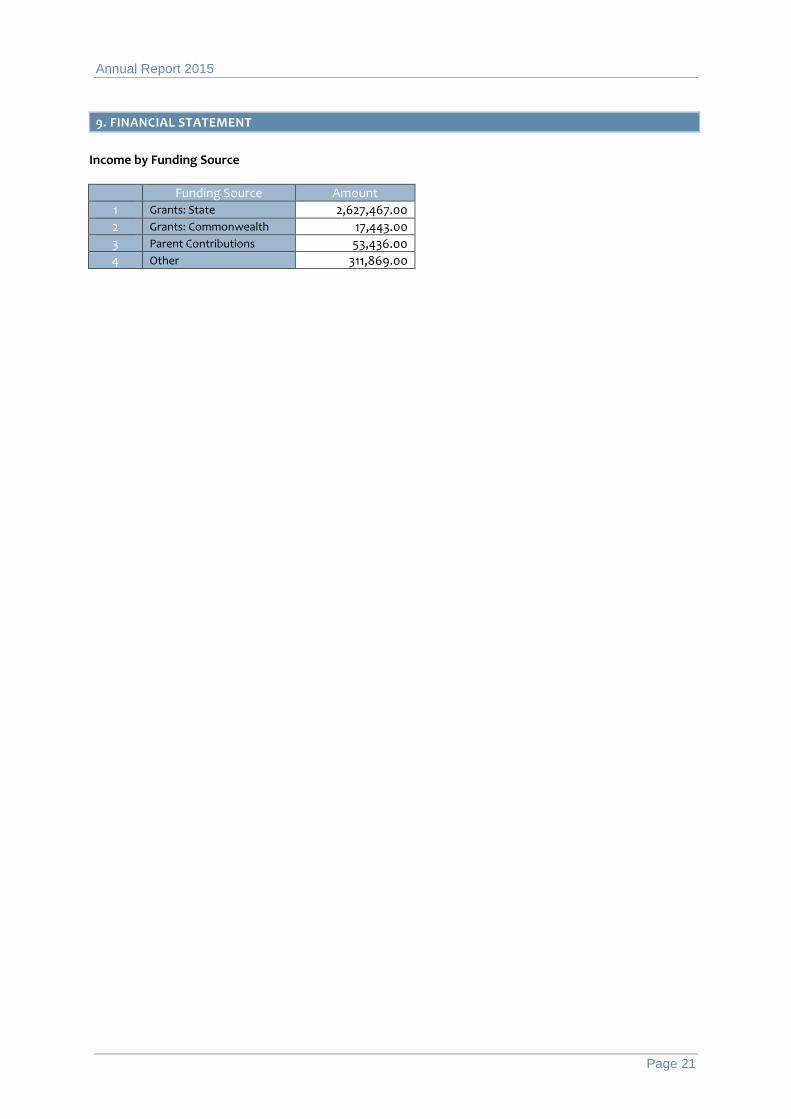
Income by Funding Source
Funding Source Amount 1 Grants: State 2,627,467.00 2 Grants: Commonwealth 17,443.00 3 Parent Contributions 53,436.00 4 Other 311,869.00