Embed Size (px)
Citation preview
T h e H e a r t o f A u s t r a l i a ’ s F i n a n c i a l M a r k e t s
Annual Report 2015
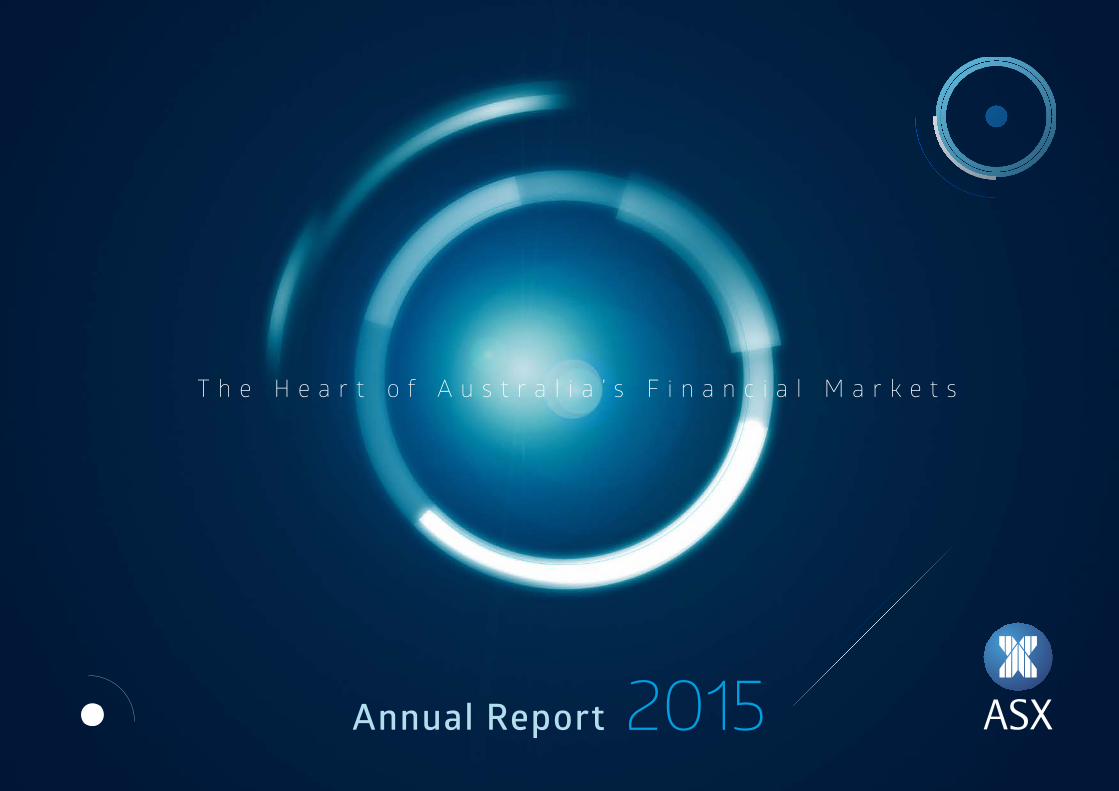
W H O W E A R EASX operates at the heart of Australia’s financial
markets. It is among the world’s top 10 exchange groups and is a global leader in A$ and NZ$ financial markets.
C O N T E N T S02 | Letter from the Chairman and the CEO
04 | Operating and financial review
1 2 | Regulatory environment and market structure
14 | Customer engagement
1 5 | Environment, social and governance
18 | Corporate governance
26 | Remuneration report
36 | Statutory report – Directors’ report
39 | Statutory report – Financial statements
67 | Key financial ratios
68 | Transaction levels and statistics
7 1 | Shareholder information
73 | Directory
More information about ASX can be found at www.asx.com.au
We are a fully integrated exchange across multiple asset classes – equi-ties, fixed income, derivatives and managed funds.
We service retail, institutional and corporate customers directly and through Australian and international intermediaries.
We provide services that allow our customers to invest, trade and manage risk. These include listings, trading, post-trade services, tech-nology, and information and data services.
We operate and invest in the infra-structure that promotes the stability of Australia’s financial markets and is critical for the efficient functioning of the nation’s economy, economic growth and position in the Asia Pacific region.
We advocate for regulations that support end-investors, grow and promote the integrity of the market, and strengthen Australia’s global competitiveness.
The Annual General Meeting of ASX Limited will be held in the ASX
Auditorium, lower ground floor, 18 Bridge Street, Sydney, on Wednesday 30 September
2015 at 10am (Australian Eastern
Standard Time)
ASX Limited ABN 98 008 624 691
93.0 85.1 82.3 89.9 95.1
90.2 92.8 87.9 88.2 92.3
FY15FY14FY13FY12FY11
FY15FY14FY13FY12FY11
617.6 610.4 617.4658.3
700.7
FY15FY14FY13FY12FY11
198.
4
190.
6
195.
5
198.
5
205.
7
200.
8
194.
6
195.
5
198.
5
208.
4
FY15FY14FY13FY12FY11
352.
3
339.
2
348.
2
383.
2
397.8
356.
6
346.
2
348.
2
383.
2
403.
2
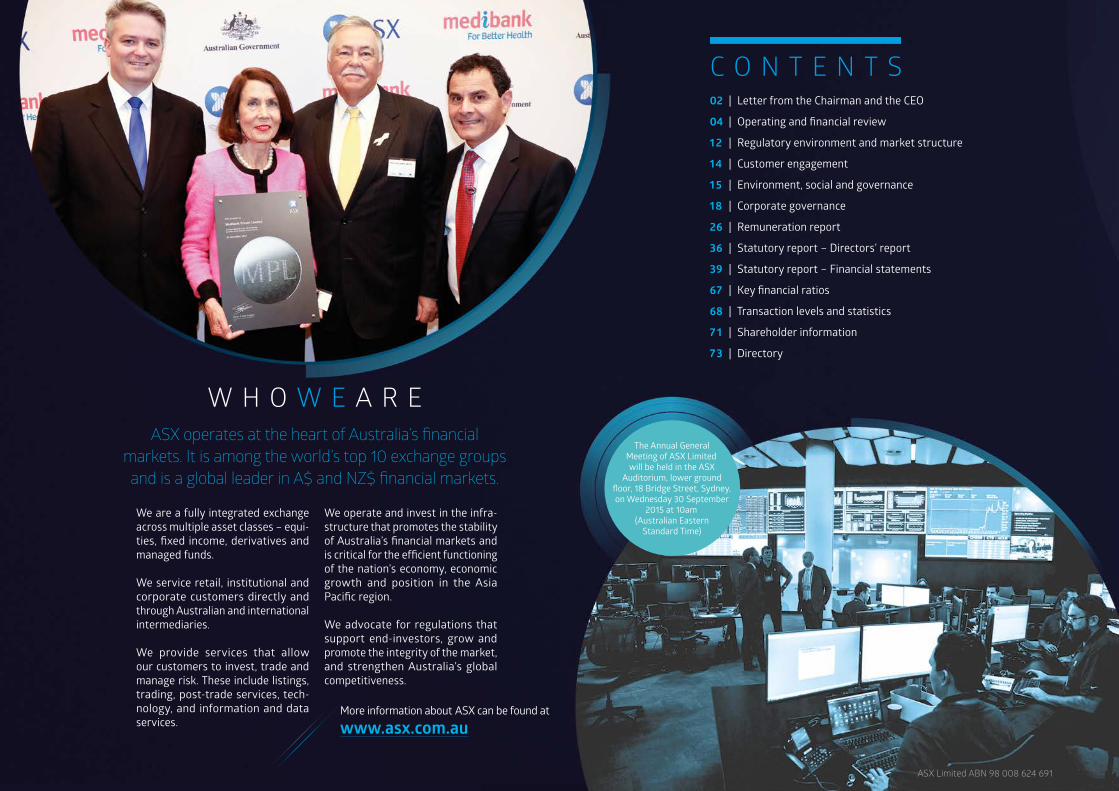
F I N A N C I A L H I G H L I G H T S
O P E R A T I N G R E V E N U E S$MILLION
• Segment operating revenues $700.7 million, up 6.4%
P R O F I T A F T E R T A X$MILLION
• Statutory profit after tax $397.8 million, up 3.8%
• Underlying profit after tax $403.2 million, up 5.2% driven by revenue growth
D I V I D E N D SCENTS PER SHARE
• Final dividend 95.1 cents per share fully franked, up 5.8%
• Total FY15 dividends 187.4 cents per share, up 5.2%
• Payout ratio 90% of underlying profit after tax
E A R N I N G S P E R S H A R ECENTS
• EPS 205.7 cents per share, up 3.6%
• Underlying EPS 208.4 cents per share, up 5.0%
• Interim • Final • Reported EPS • Underlying EPS
• Statutory profit • Underlying profit
02 ASX Annual Report 2015 | Letter from the Chairman and the CEO
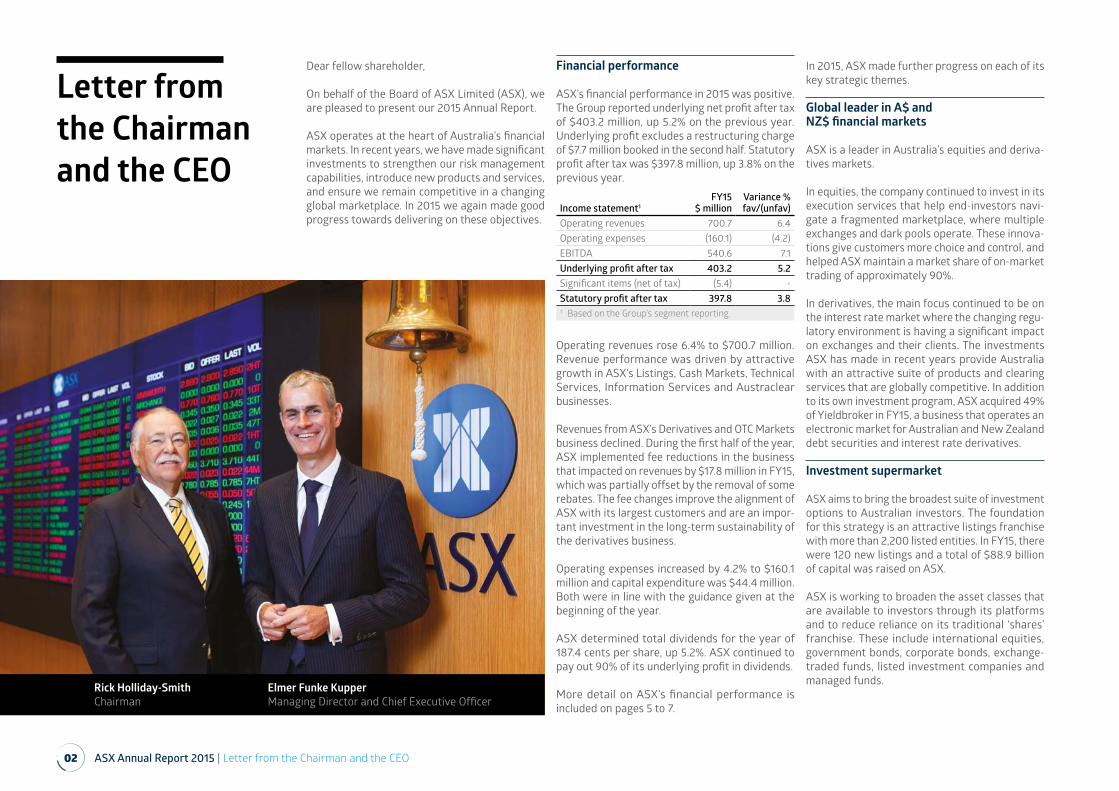
Letter from the Chairman and the CEO
Dear fellow shareholder,
On behalf of the Board of ASX Limited (ASX), we are pleased to present our 2015 Annual Report.
ASX operates at the heart of Australia’s financial markets. In recent years, we have made significant investments to strengthen our risk management capabilities, introduce new products and services, and ensure we remain competitive in a changing global marketplace. In 2015 we again made good progress towards delivering on these objectives.
Financial performance
ASX’s financial performance in 2015 was positive. The Group reported underlying net profit after tax of $403.2 million, up 5.2% on the previous year. Underlying profit excludes a restructuring charge of $7.7 million booked in the second half. Statutory profit after tax was $397.8 million, up 3.8% on the previous year.
Income statement1FY15
$ millionVariance %fav/(unfav)
Operating revenues 700.7 6.4Operating expenses (160.1) (4.2)EBITDA 540.6 7.1Underlying profit after tax 403.2 5.2Significant items (net of tax) (5.4) -Statutory profit after tax 397.8 3.81 Based on the Group’s segment reporting.
Operating revenues rose 6.4% to $700.7 million. Revenue performance was driven by attractive growth in ASX’s Listings, Cash Markets, Technical Services, Information Services and Austraclear businesses.
Revenues from ASX’s Derivatives and OTC Markets business declined. During the first half of the year, ASX implemented fee reductions in the business that impacted on revenues by $17.8 million in FY15, which was partially offset by the removal of some rebates. The fee changes improve the alignment of ASX with its largest customers and are an impor-tant investment in the long-term sustainability of the derivatives business.
Operating expenses increased by 4.2% to $160.1 million and capital expenditure was $44.4 million. Both were in line with the guidance given at the beginning of the year.
ASX determined total dividends for the year of 187.4 cents per share, up 5.2%. ASX continued to pay out 90% of its underlying profit in dividends.
More detail on ASX’s financial performance is included on pages 5 to 7.
In 2015, ASX made further progress on each of its key strategic themes.
Global leader in A$ and NZ$ financial markets
ASX is a leader in Australia’s equities and deriva-tives markets.
In equities, the company continued to invest in its execution services that help end-investors navi-gate a fragmented marketplace, where multiple exchanges and dark pools operate. These innova-tions give customers more choice and control, and helped ASX maintain a market share of on-market trading of approximately 90%.
In derivatives, the main focus continued to be on the interest rate market where the changing regu-latory environment is having a significant impact on exchanges and their clients. The investments ASX has made in recent years provide Australia with an attractive suite of products and clearing services that are globally competitive. In addition to its own investment program, ASX acquired 49% of Yieldbroker in FY15, a business that operates an electronic market for Australian and New Zealand debt securities and interest rate derivatives.
Investment supermarket
ASX aims to bring the broadest suite of investment options to Australian investors. The foundation for this strategy is an attractive listings franchise with more than 2,200 listed entities. In FY15, there were 120 new listings and a total of $88.9 billion of capital was raised on ASX.
ASX is working to broaden the asset classes that are available to investors through its platforms and to reduce reliance on its traditional ‘shares’ franchise. These include international equities, government bonds, corporate bonds, exchange-traded funds, listed investment companies and managed funds.Elmer Funke Kupper
Managing Director and Chief Executive OfficerRick Holliday-Smith Chairman
ASX Annual Report 2015 | Letter from the Chairman and the CEO 03
World-class, globally connected infrastructure
In February 2015, ASX announced that it would upgrade all of its main trading and post-trade technology platforms. Phase 1 of the program will replace ASX’s equities and derivatives trading systems. The program will improve the ability of the exchange to innovate and bring products to market quickly, make it easier for clients to connect to ASX and reduce their internal operating costs. This technology transformation is now underway with support from ASX’s clients and industry partners.
Outstanding customer service
In FY15, ASX took further steps to deliver on its commitment to customer service. It now operates 12 forums that allow customers to provide input on the investment priorities for key markets and services. In April 2015, ASX opened its 24-hour Customer Support Centre, integrating the operations, tech-nology and market surveillance teams that oper-ate Australia’s financial markets. The Customer Support Centre is located in ASX’s Australian Liquidity Centre, which brings together more than 100 customers and service providers that are critical to Australia’s financial markets ecosystem.
Regulations that support growth and end-investors
ASX continues to be an advocate for regula-tions that support end-investors and strengthen Australia’s global competitive position.
Australia’s market regulations are positive. In the equity market, the regulations put in place by ASIC help prevent end-investors from being materially disadvantaged by market fragmenta-tion. As a result, the concerns that exist in some overseas markets about high frequency trading do not currently exist in Australia.
During FY15, the Council of Financial Regulators reviewed the market structure for clearing of cash equities. ASX is currently the sole provider of this service and believes it is the right model for a market the size of Australia.
ASX has recommended that the current market structure be retained for a further five years. This would give ASX certainty to proceed with a signif-icant investment in Australia’s equities clearing and settlement infrastructure, including a ‘once in a generation’ replacement of CHESS. If the current model is retained, ASX has also commit-ted to implement a new clearing fee schedule that would provide savings to its clients.
A Government decision in relation to the review is expected soon. The current moratorium on compe-tition in cash equities clearing remains in place until a decision is announced.
In the derivatives market, the regulations are more global in nature. The strong support from ASX shareholders for the capital raising ASX conducted in mid-2013 positioned the company to meet the higher global standards. During FY15, ASX was one of the first exchanges to be granted regulatory recognition by the European Securities and Markets Authority. ASX was also the first to obtain an exemption from the US regulator, the Commodity Futures Trading Commission, to provide certain clearing services to US bank branches.
ASX appreciates the significant effort from ASIC and the RBA to ensure that the Australian regu-latory regime is both world-class and recognised by overseas regulatory agencies.
Employer of choice in financial markets
To be globally competitive ASX needs to invest in its skills base and people. In 2015, ASX recruited a number of new senior executives who bring strong international financial market expertise.
ASX conducts a staff survey each year. In 2015 there was an increase in staff engagement and alignment with the long-term strategy of ASX. This improvement follows a three-year investment in customers, products, services and capabilities.
Board renewal
In February 2015, ASX continued its board renewal program, welcoming Ms Yasmin Allen as a non-ex-ecutive director. Yasmin has brought strong busi-ness and risk management skills to the Board. She will stand for election at ASX’s Annual General Meeting on 30 September 2015.
Ms Jillian Segal will leave the Board on 1 September 2015 after 12 years. Jillian helped guide the company through an exciting and at times challeng-ing period. She leaves a proud legacy, and the Board and management thank her for her stewardship.
We thank all ASX employees for their commitment and hard work during the year, and we are grateful to our shareholders for your support.
ASX recognises that its position at the heart of Australia’s financial marketplace comes with responsibility. We strive to earn our privileged position every day.
The Board and management look forward to 2016 with confidence and enthusiasm.
Rick Holliday-SmithChairman
Elmer Funke KupperManaging Director and Chief Executive Officer
“We have made significant investments
to strengthen our risk management
capabilities, introduce new products and
services, and ensure we remain competitive
in a changing global marketplace.”
04 ASX Annual Report 2015 | Operating and financial review
Operating and financial review
The Operating and Financial Review outlines ASX’s activities, performance during the year, financial position and main business strategies. It also discusses the key risks and uncertainties that could impact on ASX and its subsidiaries (together referred to as the Group) and its ability to achieve its financial and other objectives.
Business model and operating environment
ASX is a multi-asset class and vertically integrated exchange group, and ranks in the top 10 exchange groups globally when measured by market capital-isation. It operates markets for cash equities and derivatives, and provides a full service offering including listings, trading, clearing, settlement, registry, and information and technical services. ASX operates a significant part of the infrastructure that supports Australia’s financial markets.
The business is conducted through a number of regulated legal entities. ASX holds market operator licences and clearing and settlement licences to undertake its activities. ASX is subject to over-sight by the Australian Securities and Investments Commission (ASIC) and the Reserve Bank of Australia (RBA).
ASX services companies and other issuers that list equity and debt securities on the exchange, as well as a wide range of retail and institutional investors that invest in and trade those securities. Many of ASX’s services are provided through intermediar-ies including stockbrokers, Australian banks and Australian-based international banks. Clients of these intermediaries include retail and corporate investors, asset managers, custodians and other financial market participants.
While ASX’s operations are primarily based in Australia, the Group services both domestic and international customers and some of its services are accessible from offshore.
ASX’s diversified business model is typical of large exchange groups operating in the Asia Pacific.
Primary markets – capital formationCapital formation is the process that brings together, in one marketplace, organisations that require capital and those that provide it. ASX, through its Listing Rules and infrastructure, provides a facility for companies to list, raise capi-tal, and have their securities publicly traded.
The Group provides a range of services to issuers of capital, including the generation of security holding statements and other shareholder and sub-register services. At 30 June 2015, there were 2,220 issuers on ASX. Along with the shares of listed companies, ASX lists debt securities (including government debt securities) and exchange-traded funds.
ASX also provides its mFund settlement service to access unlisted managed funds.
The Group earns revenue from listed entities for initial listing, annual listing, secondary capital rais-ings, and for issuer services. The main drivers of revenue in this category include the:
• number of listed entities and their market value
• number and value of initial public offerings (IPOs)
• level of corporate actions, such as secondary capital raisings and mergers and acquisitions
• level of retail trading activity and the resulting number of holding statements
• number and value of managed funds utilising mFund.
ASX faces competition for listings from other exchanges both domestically and internationally. There are also non-public means of raising capital, such as private equity funds, which can compete with the ASX primary market.
New methods of raising equity capital, such as crowd funding, are under active consideration by the Australian Government and regulators to assist start-up businesses that are not able to access established equity markets or private equity funds.
Secondary markets – trading servicesThe Group operates two licensed markets to facil-itate the buying and selling of exchange-traded securities:
• cash market – trading of cash market securi-ties including equities (shares), equity options, warrants, exchange-traded funds and listed debt securities. At 30 June 2015, there were 77 trad-ing participants, many of which provide inter-mediary broking services to end-investors. The value of turnover transacted on the ASX market is the primary revenue driver. There is compe-tition in trading from another equity market operator and off-market trading facilities, which are often referred to as ‘broker dark pools’
• derivatives – trading of futures and options on futures on interest rate, equity index, agricultural and energy contracts. At 30 June 2015, there were 50 trading participants and approximately $48.4 trillion of notional value was traded during the year. The volume of contracts traded is the primary revenue driver. Competition comes from offshore exchanges and over-the-counter (OTC) products.
ASX provides information and technical services to its clients to support their secondary market activ-ities. Information services include the provision of real-time market data for the cash and derivatives markets, company news, and index and other refer-ence data. The main revenue driver is the number of end users accessing real-time market data.
Technical services consists of four main categories of services to facilitate market connectivity and access to ASX and third-party services by custom-ers. These are:
• liquidity access via ASX platforms
• community and connectivity services including a secure low latency communication network via ASX Net
• application services including terminals and smart order routers
• hosting of customer hardware within the ASX Australian Liquidity Centre (ALC).
ASX Annual Report 2015 | Operating and financial review 05
Revenue drivers for each category consist of the volume of services used by customers, such as the number of connections to ASX markets or the number of cabinets hosted in the ALC.
Post-trade and other servicesASX’s clearing and settlement infrastructure provides critical risk management services to financial market participants and investors. ASX’s post-trade operations are backed by significant Australian-based capital and collateral, and are overseen by Australia’s regulators.
ClearingASX provides central counterparty (CCP) clearing services to the cash and derivatives markets. It does this through the operation of two licensed subsidiaries, ASX Clear and ASX Clear (Futures). As CCPs, the clearing subsidiaries become the central counterparty to every trade and assume the credit risk of each ASX clearing participant. In effect, they become the seller to every buyer and the buyer to every seller. This process is known as novation. The CCPs undertake these risk management activities for exchange-traded and certain OTC transactions. The main revenue drivers for clearing services are the value of equity securities and number of derivatives contracts novated and centrally cleared.
Cash equities settlementASX’s settlement services help reduce counterparty and systemic risk, and provide transaction effi-ciency and certainty for end-investors. Settlement occurs on a delivery-versus-payment (DvP) basis and involves the exchange of cash for physical delivery of securities.
Cash market settlement is conducted through the Clearing House Electronic Sub-register System (CHESS). This system registers the title (ownership) of shares and held $1.6 trillion of securities at 30 June 2015. ASX’s model for cash market settle-ment maximises efficiency through the netting of settlement obligations in each individual security and the netting of all payment obligations, while minimising the risk of settlement failure (known as DvP model 3). The main driver of settlement revenue is the number of settlement messages.
ASX is currently the sole provider of clearing and settlement services for Australia’s cash market. ASX clears and settles transactions undertaken on another licensed market through a Trade Acceptance Service, allowing the seamless clear-ing and settlement of these transactions alongside ASX transactions. ASX also facilitates settlement of certain OTC transactions.
In 2015 the Australian Government asked the Council of Financial Regulators to review the market structure for the clearing of Australia’s cash market. At the date of this report no announcement had been made by the Government on the outcome of that review.
AustraclearAustraclear provides settlement, depository and registry services for debt securities and cash trans-actions. ASX’s model for debt securities settles transactions on a trade-by-trade basis, which provides for certainty of settlement (DvP model 1). The number of transactions is the main revenue driver.
Depository services are provided through the Austraclear Central Securities Depository (CSD), which held $1.8 trillion of debt securities at 30 June 2015. These securities consist of fixed income secu-rities such as asset-backed securities, Australian government bonds and semi-government bonds. Settlement of transactions on these securities occurs through real-time gross settlement (RTGS). The value of securities held is the main revenue driver.
Registry services are provided whereby Austraclear facilitates security registration, the holding of relevant documentation and the subsequent cash transfers associated with the terms of the individual securities. The main drivers of registry revenues are the number and value of securities held in the registry.
The ASX Collateral service allows customers of ASX to utilise collateral held in Austraclear as an alternative to cash, to meet obligations to other customers or to ASX’s clearing subsidiaries. With increasing regulatory requirements and higher compliance costs, the service adds value by reduc-ing the cost of collateral for market participants. ASX earns revenues for this service based on the value of collateral lodged.
Following is a discussion of the contribution of each of the above services to the Group’s segment revenues and a review of the Group’s operations over the financial year.
Review of operations
Investment in Yieldbroker Pty Limited (Yieldbroker)On 28 November 2014, ASX acquired a 49% non-controlling shareholding in Yieldbroker, an entity that specialises in operating licensed electronic markets for trading Australian and New Zealand debt securities and interest rate derivatives. The investment complements ASX’s exchange-traded services and provides an oppor-tunity to improve infrastructure and efficiencies for the Australian market. The carrying value of the investment as at 30 June 2015 was $65.7 million.
Standard & Poor’s credit ratingsASX Limited and its two central clearing subsidi-aries have been assigned a long-term credit rating of AA- and short-term rating of A-1+ by Standard & Poor’s (S&P). The ratings outlook from S&P for all entities is stable.
Results of operations
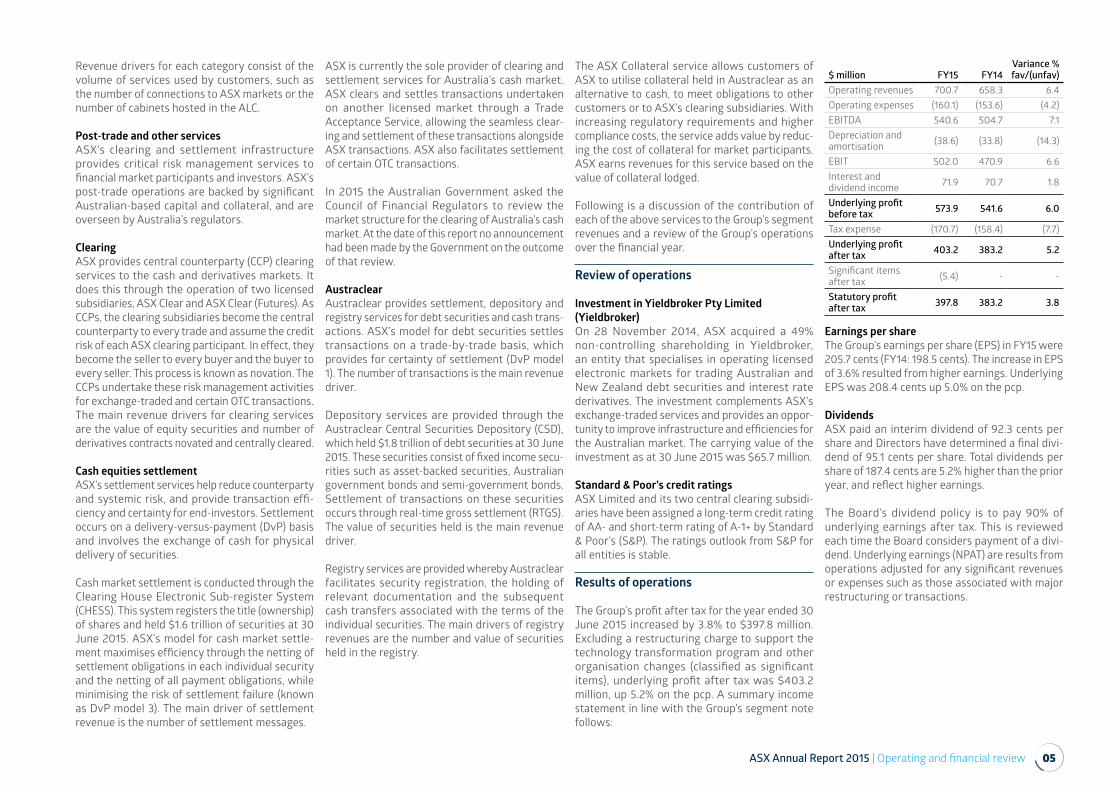
The Group’s profit after tax for the year ended 30 June 2015 increased by 3.8% to $397.8 million. Excluding a restructuring charge to support the technology transformation program and other organisation changes (classified as significant items), underlying profit after tax was $403.2 million, up 5.2% on the pcp. A summary income statement in line with the Group’s segment note follows:
$ million FY15 FY14Variance % fav/(unfav)
Operating revenues 700.7 658.3 6.4Operating expenses (160.1) (153.6) (4.2)EBITDA 540.6 504.7 7.1Depreciation and amortisation (38.6) (33.8) (14.3)
EBIT 502.0 470.9 6.6Interest anddividend income 71.9 70.7 1.8
Underlying profit before tax 573.9 541.6 6.0
Tax expense (170.7) (158.4) (7.7)Underlying profit after tax 403.2 383.2 5.2
Significant items after tax (5.4) - -
Statutory profit after tax 397.8 383.2 3.8
Earnings per share The Group’s earnings per share (EPS) in FY15 were 205.7 cents (FY14: 198.5 cents). The increase in EPS of 3.6% resulted from higher earnings. Underlying EPS was 208.4 cents up 5.0% on the pcp.
Dividends ASX paid an interim dividend of 92.3 cents per share and Directors have determined a final divi-dend of 95.1 cents per share. Total dividends per share of 187.4 cents are 5.2% higher than the prior year, and reflect higher earnings.
The Board’s dividend policy is to pay 90% of underlying earnings after tax. This is reviewed each time the Board considers payment of a divi-dend. Underlying earnings (NPAT) are results from operations adjusted for any significant revenues or expenses such as those associated with major restructuring or transactions.
06 ASX Annual Report 2015 | Operating and financial review
Operating revenues
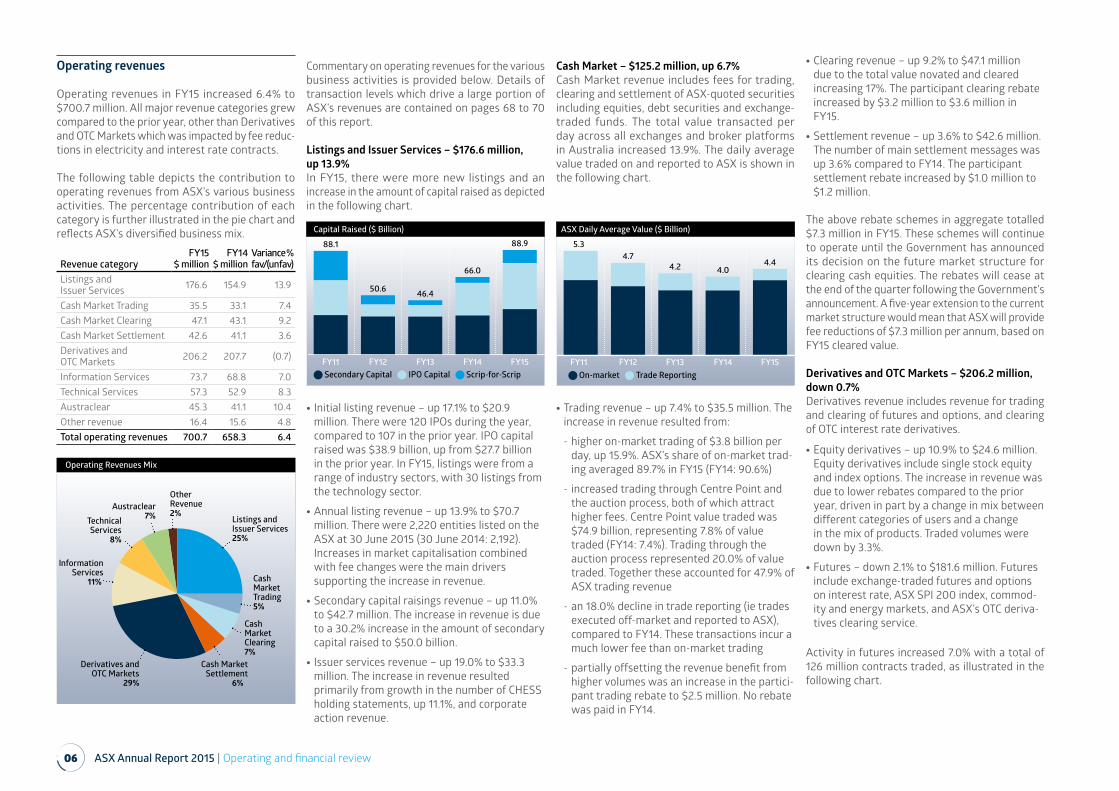
Operating revenues in FY15 increased 6.4% to $700.7 million. All major revenue categories grew compared to the prior year, other than Derivatives and OTC Markets which was impacted by fee reduc-tions in electricity and interest rate contracts.
The following table depicts the contribution to operating revenues from ASX’s various business activities. The percentage contribution of each category is further illustrated in the pie chart and reflects ASX’s diversified business mix.
Revenue categoryFY15
$ millionFY14
$ millionVariance %fav/(unfav)
Listings and Issuer Services 176.6 154.9 13.9
Cash Market Trading 35.5 33.1 7.4Cash Market Clearing 47.1 43.1 9.2Cash Market Settlement 42.6 41.1 3.6Derivatives and OTC Markets 206.2 207.7 (0.7)
Information Services 73.7 68.8 7.0Technical Services 57.3 52.9 8.3Austraclear 45.3 41.1 10.4Other revenue 16.4 15.6 4.8Total operating revenues 700.7 658.3 6.4
Commentary on operating revenues for the various business activities is provided below. Details of transaction levels which drive a large portion of ASX’s revenues are contained on pages 68 to 70 of this report.
Listings and Issuer Services – $176.6 million, up 13.9%In FY15, there were more new listings and an increase in the amount of capital raised as depicted in the following chart.
• Initial listing revenue – up 17.1% to $20.9 million. There were 120 IPOs during the year, compared to 107 in the prior year. IPO capital raised was $38.9 billion, up from $27.7 billion in the prior year. In FY15, listings were from a range of industry sectors, with 30 listings from the technology sector.
• Annual listing revenue – up 13.9% to $70.7 million. There were 2,220 entities listed on the ASX at 30 June 2015 (30 June 2014: 2,192). Increases in market capitalisation combined with fee changes were the main drivers supporting the increase in revenue.
• Secondary capital raisings revenue – up 11.0% to $42.7 million. The increase in revenue is due to a 30.2% increase in the amount of secondary capital raised to $50.0 billion.
• Issuer services revenue – up 19.0% to $33.3 million. The increase in revenue resulted primarily from growth in the number of CHESS holding statements, up 11.1%, and corporate action revenue.
Cash Market – $125.2 million, up 6.7%Cash Market revenue includes fees for trading, clearing and settlement of ASX-quoted securities including equities, debt securities and exchange-traded funds. The total value transacted per day across all exchanges and broker platforms in Australia increased 13.9%. The daily average value traded on and reported to ASX is shown in the following chart.
• Trading revenue – up 7.4% to $35.5 million. The increase in revenue resulted from:
- higher on-market trading of $3.8 billion per day, up 15.9%. ASX’s share of on-market trad-ing averaged 89.7% in FY15 (FY14: 90.6%)
- increased trading through Centre Point and the auction process, both of which attract higher fees. Centre Point value traded was $74.9 billion, representing 7.8% of value traded (FY14: 7.4%). Trading through the auction process represented 20.0% of value traded. Together these accounted for 47.9% of ASX trading revenue
- an 18.0% decline in trade reporting (ie trades executed off-market and reported to ASX), compared to FY14. These transactions incur a much lower fee than on-market trading
- partially offsetting the revenue benefit from higher volumes was an increase in the partici-pant trading rebate to $2.5 million. No rebate was paid in FY14.
• Clearing revenue – up 9.2% to $47.1 million due to the total value novated and cleared increasing 17%. The participant clearing rebate increased by $3.2 million to $3.6 million in FY15.
• Settlement revenue – up 3.6% to $42.6 million. The number of main settlement messages was up 3.6% compared to FY14. The participant settlement rebate increased by $1.0 million to $1.2 million.
The above rebate schemes in aggregate totalled $7.3 million in FY15. These schemes will continue to operate until the Government has announced its decision on the future market structure for clearing cash equities. The rebates will cease at the end of the quarter following the Government’s announcement. A five-year extension to the current market structure would mean that ASX will provide fee reductions of $7.3 million per annum, based on FY15 cleared value.
Derivatives and OTC Markets – $206.2 million, down 0.7%Derivatives revenue includes revenue for trading and clearing of futures and options, and clearing of OTC interest rate derivatives.
• Equity derivatives – up 10.9% to $24.6 million. Equity derivatives include single stock equity and index options. The increase in revenue was due to lower rebates compared to the prior year, driven in part by a change in mix between different categories of users and a change in the mix of products. Traded volumes were down by 3.3%.
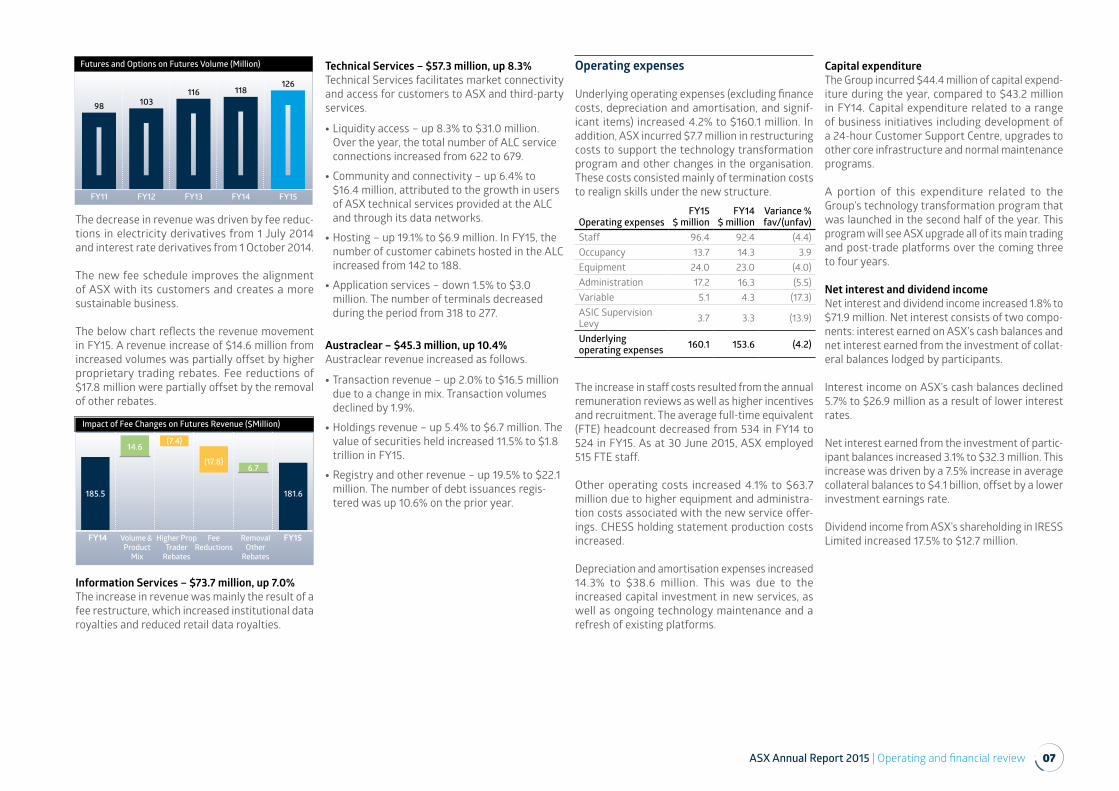
• Futures – down 2.1% to $181.6 million. Futures include exchange-traded futures and options on interest rate, ASX SPI 200 index, commod-ity and energy markets, and ASX’s OTC deriva-tives clearing service.
Activity in futures increased 7.0% with a total of 126 million contracts traded, as illustrated in the following chart.
Operating Revenues Mix
Listings andIssuer Services25%
Derivatives andOTC Markets
29%
CashMarketClearing7%
CashMarketTrading5%
InformationServices
11%
Austraclear7%
OtherRevenue2%
TechnicalServices
8%
Cash MarketSettlement
6%
Capital Raised ($ Billion)
FY15
88.9
FY14
66.0
FY13
46.4
FY12
50.6
FY11
88.1
Secondary Capital Scrip-for-ScripIPO Capital
ASX Daily Average Value ($ Billion)
FY15FY14FY13FY12FY11
4.44.04.2
4.75.3
On-market Trade Reporting
ASX Annual Report 2015 | Operating and financial review 07
The decrease in revenue was driven by fee reduc-tions in electricity derivatives from 1 July 2014 and interest rate derivatives from 1 October 2014.
The new fee schedule improves the alignment of ASX with its customers and creates a more sustainable business.
The below chart reflects the revenue movement in FY15. A revenue increase of $14.6 million from increased volumes was partially offset by higher proprietary trading rebates. Fee reductions of $17.8 million were partially offset by the removal of other rebates.
Information Services – $73.7 million, up 7.0%The increase in revenue was mainly the result of a fee restructure, which increased institutional data royalties and reduced retail data royalties.
Technical Services – $57.3 million, up 8.3%Technical Services facilitates market connectivity and access for customers to ASX and third-party services.
• Liquidity access – up 8.3% to $31.0 million. Over the year, the total number of ALC service connections increased from 622 to 679.
• Community and connectivity – up 6.4% to $16.4 million, attributed to the growth in users of ASX technical services provided at the ALC and through its data networks.
• Hosting – up 19.1% to $6.9 million. In FY15, the number of customer cabinets hosted in the ALC increased from 142 to 188.
• Application services – down 1.5% to $3.0 million. The number of terminals decreased during the period from 318 to 277.
Austraclear – $45.3 million, up 10.4%Austraclear revenue increased as follows.
• Transaction revenue – up 2.0% to $16.5 million due to a change in mix. Transaction volumes declined by 1.9%.
• Holdings revenue – up 5.4% to $6.7 million. The value of securities held increased 11.5% to $1.8 trillion in FY15.
• Registry and other revenue – up 19.5% to $22.1 million. The number of debt issuances regis-tered was up 10.6% on the prior year.
Operating expenses
Underlying operating expenses (excluding finance costs, depreciation and amortisation, and signif-icant items) increased 4.2% to $160.1 million. In addition, ASX incurred $7.7 million in restructuring costs to support the technology transformation program and other changes in the organisation. These costs consisted mainly of termination costs to realign skills under the new structure.
Operating expensesFY15
$ millionFY14
$ millionVariance % fav/(unfav)
Staff 96.4 92.4 (4.4)Occupancy 13.7 14.3 3.9Equipment 24.0 23.0 (4.0)Administration 17.2 16.3 (5.5)Variable 5.1 4.3 (17.3)ASIC Supervision Levy 3.7 3.3 (13.9)
Underlying operating expenses 160.1 153.6 (4.2)
The increase in staff costs resulted from the annual remuneration reviews as well as higher incentives and recruitment. The average full-time equivalent (FTE) headcount decreased from 534 in FY14 to 524 in FY15. As at 30 June 2015, ASX employed 515 FTE staff.
Other operating costs increased 4.1% to $63.7 million due to higher equipment and administra-tion costs associated with the new service offer-ings. CHESS holding statement production costs increased.
Depreciation and amortisation expenses increased 14.3% to $38.6 million. This was due to the increased capital investment in new services, as well as ongoing technology maintenance and a refresh of existing platforms.
Capital expenditureThe Group incurred $44.4 million of capital expend-iture during the year, compared to $43.2 million in FY14. Capital expenditure related to a range of business initiatives including development of a 24-hour Customer Support Centre, upgrades to other core infrastructure and normal maintenance programs.
A portion of this expenditure related to the Group’s technology transformation program that was launched in the second half of the year. This program will see ASX upgrade all of its main trading and post-trade platforms over the coming three to four years.
Net interest and dividend incomeNet interest and dividend income increased 1.8% to $71.9 million. Net interest consists of two compo-nents: interest earned on ASX’s cash balances and net interest earned from the investment of collat-eral balances lodged by participants.
Interest income on ASX’s cash balances declined 5.7% to $26.9 million as a result of lower interest rates.
Net interest earned from the investment of partic-ipant balances increased 3.1% to $32.3 million. This increase was driven by a 7.5% increase in average collateral balances to $4.1 billion, offset by a lower investment earnings rate.
Dividend income from ASX’s shareholding in IRESS Limited increased 17.5% to $12.7 million.
Futures and Options on Futures Volume (Million)
FY13FY12FY11 FY15FY14
11610398
126118
RemovalOther
Rebates
Higher PropTrader
Rebates
FeeReductions
Volume & Product
Mix
FY14 FY15
185.5
14.6(7.4)
(17.8)6.7
181.6
Impact of Fee Changes on Futures Revenue ($Million)
08 ASX Annual Report 2015 | Operating and financial review
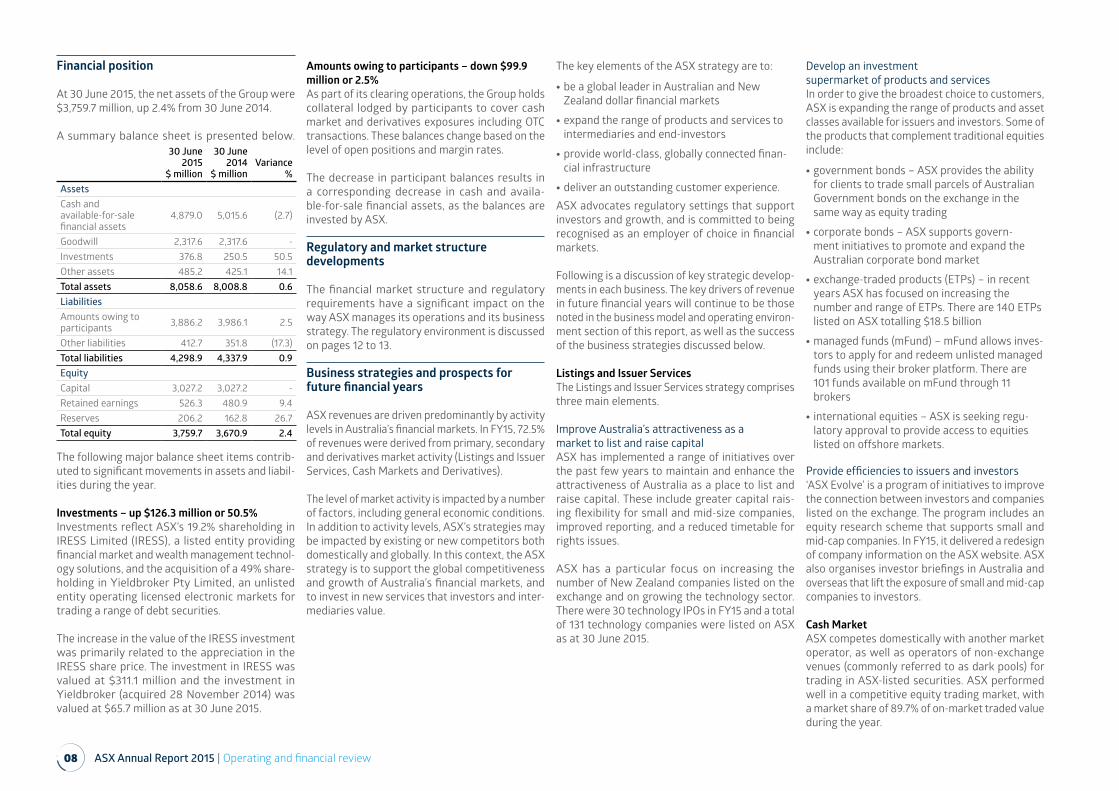
Financial position
At 30 June 2015, the net assets of the Group were $3,759.7 million, up 2.4% from 30 June 2014.
A summary balance sheet is presented below.30 June
2015$ million
30 June 2014
$ millionVariance
%AssetsCash and available-for-sale financial assets
4,879.0 5,015.6 (2.7)
Goodwill 2,317.6 2,317.6 -Investments 376.8 250.5 50.5Other assets 485.2 425.1 14.1Total assets 8,058.6 8,008.8 0.6LiabilitiesAmounts owing to participants 3,886.2 3,986.1 2.5
Other liabilities 412.7 351.8 (17.3)Total liabilities 4,298.9 4,337.9 0.9EquityCapital 3,027.2 3,027.2 -Retained earnings 526.3 480.9 9.4Reserves 206.2 162.8 26.7Total equity 3,759.7 3,670.9 2.4
The following major balance sheet items contrib-uted to significant movements in assets and liabil-ities during the year.
Investments – up $126.3 million or 50.5%Investments reflect ASX’s 19.2% shareholding in IRESS Limited (IRESS), a listed entity providing financial market and wealth management technol-ogy solutions, and the acquisition of a 49% share-holding in Yieldbroker Pty Limited, an unlisted entity operating licensed electronic markets for trading a range of debt securities.
The increase in the value of the IRESS investment was primarily related to the appreciation in the IRESS share price. The investment in IRESS was valued at $311.1 million and the investment in Yieldbroker (acquired 28 November 2014) was valued at $65.7 million as at 30 June 2015.
Amounts owing to participants – down $99.9 million or 2.5%As part of its clearing operations, the Group holds collateral lodged by participants to cover cash market and derivatives exposures including OTC transactions. These balances change based on the level of open positions and margin rates.
The decrease in participant balances results in a corresponding decrease in cash and availa-ble-for-sale financial assets, as the balances are invested by ASX.
Regulatory and market structure developments
The financial market structure and regulatory requirements have a significant impact on the way ASX manages its operations and its business strategy. The regulatory environment is discussed on pages 12 to 13.
Business strategies and prospects for future financial years
ASX revenues are driven predominantly by activity levels in Australia’s financial markets. In FY15, 72.5% of revenues were derived from primary, secondary and derivatives market activity (Listings and Issuer Services, Cash Markets and Derivatives).
The level of market activity is impacted by a number of factors, including general economic conditions. In addition to activity levels, ASX’s strategies may be impacted by existing or new competitors both domestically and globally. In this context, the ASX strategy is to support the global competitiveness and growth of Australia’s financial markets, and to invest in new services that investors and inter-mediaries value.
The key elements of the ASX strategy are to:
• be a global leader in Australian and New Zealand dollar financial markets
• expand the range of products and services to intermediaries and end-investors
• provide world-class, globally connected finan-cial infrastructure
• deliver an outstanding customer experience.ASX advocates regulatory settings that support investors and growth, and is committed to being recognised as an employer of choice in financial markets.
Following is a discussion of key strategic develop-ments in each business. The key drivers of revenue in future financial years will continue to be those noted in the business model and operating environ-ment section of this report, as well as the success of the business strategies discussed below.
Listings and Issuer ServicesThe Listings and Issuer Services strategy comprises three main elements.
Improve Australia’s attractiveness as a market to list and raise capitalASX has implemented a range of initiatives over the past few years to maintain and enhance the attractiveness of Australia as a place to list and raise capital. These include greater capital rais-ing flexibility for small and mid-size companies, improved reporting, and a reduced timetable for rights issues.
ASX has a particular focus on increasing the number of New Zealand companies listed on the exchange and on growing the technology sector. There were 30 technology IPOs in FY15 and a total of 131 technology companies were listed on ASX as at 30 June 2015.
Develop an investment supermarket of products and servicesIn order to give the broadest choice to customers, ASX is expanding the range of products and asset classes available for issuers and investors. Some of the products that complement traditional equities include:
• government bonds – ASX provides the ability for clients to trade small parcels of Australian Government bonds on the exchange in the same way as equity trading
• corporate bonds – ASX supports govern-ment initiatives to promote and expand the Australian corporate bond market
• exchange-traded products (ETPs) – in recent years ASX has focused on increasing the number and range of ETPs. There are 140 ETPs listed on ASX totalling $18.5 billion
• managed funds (mFund) – mFund allows inves-tors to apply for and redeem unlisted managed funds using their broker platform. There are 101 funds available on mFund through 11 brokers
• international equities – ASX is seeking regu-latory approval to provide access to equities listed on offshore markets.
Provide efficiencies to issuers and investors‘ASX Evolve’ is a program of initiatives to improve the connection between investors and companies listed on the exchange. The program includes an equity research scheme that supports small and mid-cap companies. In FY15, it delivered a redesign of company information on the ASX website. ASX also organises investor briefings in Australia and overseas that lift the exposure of small and mid-cap companies to investors.
Cash MarketASX competes domestically with another market operator, as well as operators of non-exchange venues (commonly referred to as dark pools) for trading in ASX-listed securities. ASX performed well in a competitive equity trading market, with a market share of 89.7% of on-market traded value during the year.
ASX Annual Report 2015 | Operating and financial review 09
ASX’s strategy is to continue to innovate in the provision of services to maximise the attractive-ness of trading on ASX, and to meet the needs of a varied customer base.
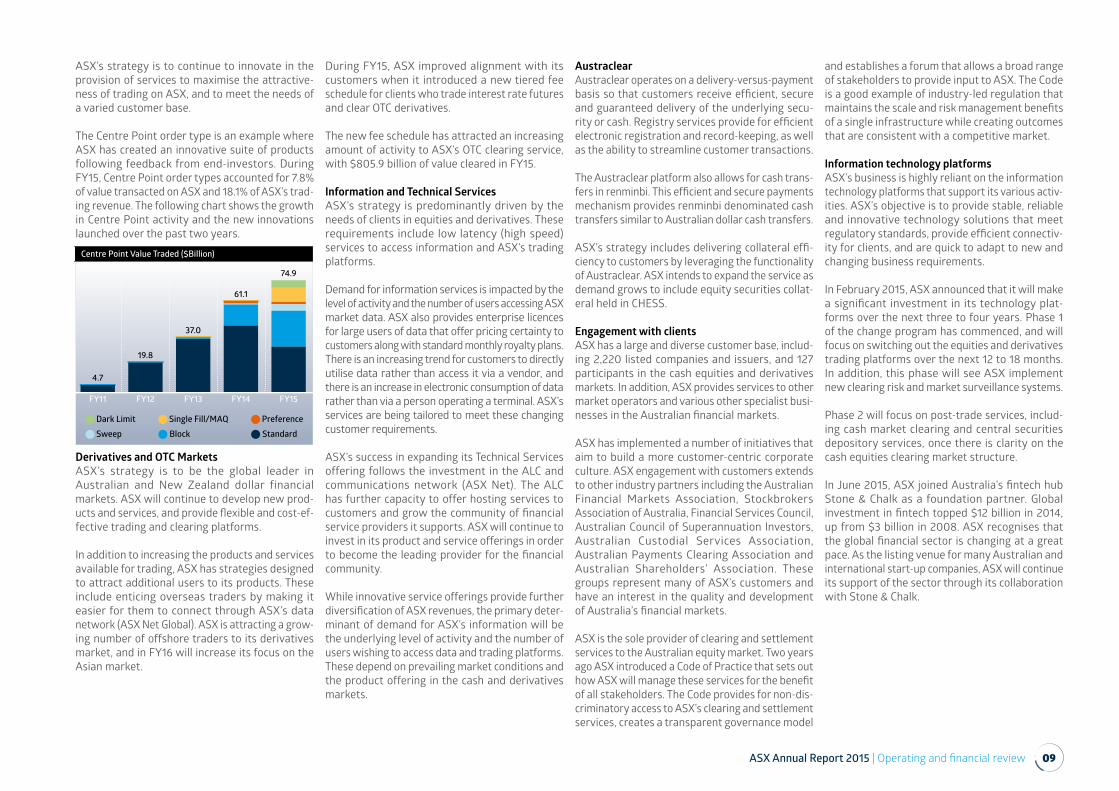
The Centre Point order type is an example where ASX has created an innovative suite of products following feedback from end-investors. During FY15, Centre Point order types accounted for 7.8% of value transacted on ASX and 18.1% of ASX’s trad-ing revenue. The following chart shows the growth in Centre Point activity and the new innovations launched over the past two years.
Derivatives and OTC MarketsASX’s strategy is to be the global leader in Australian and New Zealand dollar financial markets. ASX will continue to develop new prod-ucts and services, and provide flexible and cost-ef-fective trading and clearing platforms.
In addition to increasing the products and services available for trading, ASX has strategies designed to attract additional users to its products. These include enticing overseas traders by making it easier for them to connect through ASX’s data network (ASX Net Global). ASX is attracting a grow-ing number of offshore traders to its derivatives market, and in FY16 will increase its focus on the Asian market.
During FY15, ASX improved alignment with its customers when it introduced a new tiered fee schedule for clients who trade interest rate futures and clear OTC derivatives.
The new fee schedule has attracted an increasing amount of activity to ASX’s OTC clearing service, with $805.9 billion of value cleared in FY15.
Information and Technical ServicesASX’s strategy is predominantly driven by the needs of clients in equities and derivatives. These requirements include low latency (high speed) services to access information and ASX’s trading platforms.
Demand for information services is impacted by the level of activity and the number of users accessing ASX market data. ASX also provides enterprise licences for large users of data that offer pricing certainty to customers along with standard monthly royalty plans.There is an increasing trend for customers to directly utilise data rather than access it via a vendor, and there is an increase in electronic consumption of data rather than via a person operating a terminal. ASX’s services are being tailored to meet these changing customer requirements.
ASX’s success in expanding its Technical Services offering follows the investment in the ALC and communications network (ASX Net). The ALC has further capacity to offer hosting services to customers and grow the community of financial service providers it supports. ASX will continue to invest in its product and service offerings in order to become the leading provider for the financial community.
While innovative service offerings provide further diversification of ASX revenues, the primary deter-minant of demand for ASX’s information will be the underlying level of activity and the number of users wishing to access data and trading platforms. These depend on prevailing market conditions and the product offering in the cash and derivatives markets.
AustraclearAustraclear operates on a delivery-versus-payment basis so that customers receive efficient, secure and guaranteed delivery of the underlying secu-rity or cash. Registry services provide for efficient electronic registration and record-keeping, as well as the ability to streamline customer transactions.
The Austraclear platform also allows for cash trans-fers in renminbi. This efficient and secure payments mechanism provides renminbi denominated cash transfers similar to Australian dollar cash transfers.
ASX’s strategy includes delivering collateral effi-ciency to customers by leveraging the functionality of Austraclear. ASX intends to expand the service as demand grows to include equity securities collat-eral held in CHESS.
Engagement with clientsASX has a large and diverse customer base, includ-ing 2,220 listed companies and issuers, and 127 participants in the cash equities and derivatives markets. In addition, ASX provides services to other market operators and various other specialist busi-nesses in the Australian financial markets.
ASX has implemented a number of initiatives that aim to build a more customer-centric corporate culture. ASX engagement with customers extends to other industry partners including the Australian Financial Markets Association, Stockbrokers Association of Australia, Financial Services Council, Australian Council of Superannuation Investors, Australian Custodial Services Association, Australian Payments Clearing Association and Australian Shareholders’ Association. These groups represent many of ASX’s customers and have an interest in the quality and development of Australia’s financial markets.
ASX is the sole provider of clearing and settlement services to the Australian equity market. Two years ago ASX introduced a Code of Practice that sets out how ASX will manage these services for the benefit of all stakeholders. The Code provides for non-dis-criminatory access to ASX’s clearing and settlement services, creates a transparent governance model
and establishes a forum that allows a broad range of stakeholders to provide input to ASX. The Code is a good example of industry-led regulation that maintains the scale and risk management benefits of a single infrastructure while creating outcomes that are consistent with a competitive market.
Information technology platformsASX’s business is highly reliant on the information technology platforms that support its various activ-ities. ASX’s objective is to provide stable, reliable and innovative technology solutions that meet regulatory standards, provide efficient connectiv-ity for clients, and are quick to adapt to new and changing business requirements.
In February 2015, ASX announced that it will make a significant investment in its technology plat-forms over the next three to four years. Phase 1 of the change program has commenced, and will focus on switching out the equities and derivatives trading platforms over the next 12 to 18 months. In addition, this phase will see ASX implement new clearing risk and market surveillance systems.
Phase 2 will focus on post-trade services, includ-ing cash market clearing and central securities depository services, once there is clarity on the cash equities clearing market structure.
In June 2015, ASX joined Australia’s fintech hub Stone & Chalk as a foundation partner. Global investment in fintech topped $12 billion in 2014, up from $3 billion in 2008. ASX recognises that the global financial sector is changing at a great pace. As the listing venue for many Australian and international start-up companies, ASX will continue its support of the sector through its collaboration with Stone & Chalk.
Dark Limit Single Fill/MAQ Preference
Sweep Block Standard
Centre Point Value Traded ($Billion)
74.9
61.1
37.0
19.8
4.7
FY15FY14FY13FY12FY11
10 ASX Annual Report 2015 | Operating and financial review
Risks
The Group’s operations and financial results are subject to a number of risks. ASX has a strong track record of managing the wide range of risks that arise from operating and servicing Australia’s finan-cial markets. Many of these risks are not directly within the control of ASX. The main risks affecting ASX include:
• the economic environment and market activity levels
• changes to regulation and market structure
• operational risks in technology infrastructure and processes
• clearing and settlement risk, as well as increased capital and liquidity requirements
• investment risk on cash and other investments.
The economic environment and market activity levelsThe ASX businesses, financial position and oper-ating results are highly dependent on the levels of market activity. These include the number of listed issuers, the number of new company listings, the volume and value of financial instruments traded, the number of settlement messages, and similar factors. Market activity levels are significantly influenced by economic performance, government policy and general financial market conditions in Australia and internationally. A slowing of economic activity can lead to a reduction in activity and reve-nues. ASX’s diversified business model mitigates some of these risks, as revenues are earned from a range of activities and services. The expansion into new services is designed to further diversify the Group’s revenues over time.
Changes to regulation and market structureASX’s businesses operate in highly regulated markets. The business is affected by licences that it holds, the market structure in which it operates, and the regulations under which it and its custom-ers operate.
LicencesSeveral of the Group entities hold licences to oper-ate financial markets, such as securities and deriv-atives exchanges as well as clearing and settlement facilities. These licences impose obligations on ASX to comply with a range of conditions. Failure to meet these obligations may result in reputa-tional damage, action being taken against the Group, or loss of the licences. In addition to line management, the Group has internal audit and regulatory assurance functions, and executive and Board oversight to monitor these risks. ASIC and RBA provide annual assessments of the Group’s licensed subsidiaries.
In addition, the clearing and settlement, and ASX Compliance subsidiaries have independent boards to oversee these operations.
The licence obligations may result in the Group undertaking significant programs or investments in order to meet licence conditions. These can impact on ASX as well as ASX’s customers. ASX seeks to manage these risks by engaging with regula-tors and customers to achieve the best possible outcome for Australia’s financial markets.
Market structure and competitionASX faces competition domestically and interna-tionally in many parts of its business. Competition can come from other exchanges as well as non-tra-ditional sources.
Changes to the existing financial market structure can affect the strategic market position and perfor-mance of ASX. An example of a change in market structure was the licensing of another market operator in the Australian cash equities market.
As noted under the regulatory and market struc-ture developments section, the market struc-ture for clearing cash equities is currently under review by the Government. ASX is the only licensed clearing and settlement facility for cash equities in Australia. A single provider model is the most efficient for a market the size of Australia. ASX recommended that the current market structure be retained for a further five years. On this basis, ASX
has committed to a new tiered fee schedule that would provide an immediate reduction in clearing fees, to strengthen the Code, including requiring regulatory review of future fee proposals, and to an upgrade of clearing and settlement infrastructure.
In some of its businesses, ASX is facing competi-tion from overseas financial markets. Decisions by Australian or overseas regulators can impact on ASX’s relative competitive position. For example, regulators have implemented location require-ments for certain systemically important services. Changes to these requirements can impact on Australia’s and ASX’s competitiveness. ASX makes significant investments in its business to ensure that Australia continues to have world-class finan-cial markets. ASX’s strategy is to provide a globally competitive service offering in all of its businesses.
While changes to the market structure are outside the control of ASX, the company actively provides input to regulators and policymakers.
Regulations that affect ASX and its customersRegulations can impact on the way ASX provides its services and the attractiveness of its services to customers. Changes to domestic or international regulations can pose risks to ASX. From time to time, new regulations may provide opportunities for ASX to offer new services to its customers. The development of ASX’s clearing service for OTC derivatives arose from changing international regulations.
During the year, ASX’s clearing subsidiaries received European regulatory equivalence and US CFTC regulatory clearance, allowing ASX to offer services to participants regulated by those jurisdictions.
Regulations may change over time and may require ASX to change the capital and liquidity it provides in support of the Group’s clearing and settlement activities. Changing regulations also impact on the level of capital and liquidity ASX customers are required to hold in order to undertake their business through ASX. These changes can lead to customers undertaking less activity through ASX. In
some instances, regulations may also benefit ASX by providing capital efficiencies to customers who transact through licensed exchanges such as ASX.
Regulations may also impact on the investment strategy that ASX adopts in relation to capital and collateral balances held to support its licensed clearing and settlement activities. Changes in regu-lations over time may impact on earnings gener-ated by the investing of these balances.
The Group manages the risks from changing regu-lations by active engagement with regulators, policymakers and customers. As regulatory settings, particularly international, are outside the control of ASX, changes may impact on ASX’s business.
Operational risks in technology infrastructure, procedures and processesThe Group operates a number of technology platforms that facilitate trading, clearing and settlement. Due to the complexity of and the high reliance on this infrastructure, operational inci-dents can impact on the functioning of markets and have a financial impact on ASX. Given the nature of ASX’s business, clients and other third parties connect to ASX via its ASX Net proprietary network and to the ASX website. This exposes the Group to cyber security risks.
The Group seeks to reduce these risks by invest-ing in its underlying infrastructure, maintaining an understanding of trends in technology and cyber security, and entering into strategic rela-tionships with specialist technology providers. The infrastructure and operations are subject to regulatory oversight, and ASX has backup recovery infrastructure and processes to reduce the impact from disruptions.
The Group’s operations and responsibilities cover a broad range of services and functions. The way in which these responsibilities and functions are discharged, or operational incidents or errors, can impact on the financial performance of the Group and adversely affect its reputation. ASX seeks to manage operational risk by putting in place clear
ASX Annual Report 2015 | Operating and financial review 11
procedures, automating activities and by following its enterprise risk framework. While these policies assist in reducing the likelihood of events occurring, the high volume and value of transactions on ASX means that operational activities or incidents, or fraudulent activity could have a significant impact on the Group.
Clearing riskThe Group’s CCP activities expose it to credit, investment and liquidity risk. In the event that clearing participants encounter financial difficul-ties, a failure to meet their contractual obligations could result. This risk is commonly referred to as clearing default risk and is managed by a number of controls. These include enforcing minimum financial and operating criteria for clearing participants, requiring participants to provide collateral, holding pre-funded financial resources, and maintaining established risk policies and procedures to ensure that the counterparty risks are monitored and proactively managed.
Central counterparty clearing activities expose ASX to investment and liquidity risk on participants’ collateral balances. The Group is also exposed to investment risk on its own cash reserves. The Group seeks to manage these risks by investing cash with high quality counterparties, maintaining sufficient cash reserves and marketable securities, and regular forward planning and forecasting of liquidity requirements. Furthermore, the Board has implemented policies that specify concentra-tion limits as well as maximum average maturity limits. At 30 June 2015, the Group had $4.9 billion invested with a range of counterparties, comprising collateral balances and cash reserves.
The CCP pre-funded financial resources provided by ASX, which are at risk of loss in the event of a default, currently total $250 million in ASX Clear and $450 million is ASX Clear (Futures). These resources and their application are fully described in note B1 to the financial statements.
The management of clearing risk is important to the stability of Australia’s financial markets, as the CCPs provide critical infrastructure for the orderly completion of transactions. For cash equity transac-tions, the risk is typically the period between execu-tion of a trade and settlement; while in derivatives, the risk is typically the daily movement in the value of the open positions or outstanding contracts. Collateral is called daily by the CCPs and in some instances intra-day. Additional collateral is called depending on market conditions and the individual exposures of clearing participants.
Settlement riskASX settles equity and debt instrument transac-tions on a delivery-versus-payment basis. As such, it facilitates the orderly exchange of securities for cash. Settlement errors expose the Group to potenital financial and reputational impacts. On average, the Group settled $4.3 billion of equity securities and $62.6 billion of debt instruments daily through its settlement facilities.
The Group manages settlement risk by a range of measures, including setting out rules and processes for settlement to occur and having infrastructure (IT platforms and processes) in place to conduct the settlement process.
ASX plans to change the settlement cycle for cash equities from T+3 to T+2 in early 2016. This reduces risk by requiring settlement of equity transactions to occur two days after trade compared to the current three days. T+2 settlement operates in a number of global markets.
Investment riskASX is exposed to counterparty risk in the event an investment counterparty fails, such as a bank or issuer of financial instruments. At 30 June 2015, ASX had approximately $3.9 billion of cash collat-eral invested with a range of counterparties. In addition, it had approximately $1 billion of Group cash invested, much of which supports clearing and settlement activities. Investment earnings on the Group cash is impacted by the level of interest rates and is also subject to the risk of investment counterparty default. ASX utilises public credit
ratings and invests with counterparties with a minimum S&P short-term rating of A1.
New Financial Stability guidelines will impact on ASX’s investment strategy for clearing house capital and cash collateral lodged by participants. The new guidelines will result in a reposition-ing of the portfolio over the next two years into largely secured assets. As a result, earnings from the investment of cash collateral are expected to decline over time. The impact in FY16 is not expected to be material.
ASX has investments in IRESS and Yieldbroker ($376.8 million at 30 June 2015). The value of these investments is subject to change based on market conditions and the performance of each entity. A significant decline in their financial performance may result in a loss to ASX as the value of the investment would be reduced. In addition, ASX has $2.3 billion of goodwill recognised on balance sheet. The carrying value of this asset may be impacted if the financial performance of ASX deteriorates. Details of the carrying value and analysis of possi-ble impairment are contained in note C1 of the financial statements. There have been no impair-ments recognised on these assets to date.
12 ASX Annual Report 2015 | Regulatory environment and market structure
Regulatory environment and market structure
ASX operates in a highly regulated, globally competitive environment. International capital markets are increasingly connected, and regula-tors around the world are implementing global standards to achieve systemic stability. Australia’s regulatory settings are recognised as consistent with these international standards.
Australia’s regulatory environment
ASX is a global leader in Australian dollar equities and derivatives products. It is focused on deliv-ering services that make it easier for customers to connect to liquidity in a cost-effective way. ASX’s ability to do so is supported by the work of the two government agencies that oversee ASX’s operations: the Australian Securities and Investments Commission (ASIC) and the Reserve Bank of Australia (RBA).
ASIC is responsible for the supervision of real-time trading on Australia’s domestic markets and sets market integrity rules to govern whole-of-market activity. ASIC annually assesses market, and clearing and settlement facility licensees on compliance with their licence obligations. The latest ASIC Market Assessment Report concluded that ASX met its obligations.
The RBA is responsible for assessing whether licensed clearing and settlement facilities have complied with the Financial Stability Standards (FSS) and have done all other things necessary to reduce systemic risk. RBA annually assesses whether ASX is complying with the FSS. The latest RBA Assessment concluded that ASX observed or broadly observed all relevant requirements.
The RBA is the chair and ASIC is a member of the Council of Financial Regulators (CFR). CFR is the coordinating body for Australia’s financial regulatory agencies. The other members are the Australian Prudential Regulation Authority and The Treasury. CFR works in collaboration with the Australian Competition and Consumer Commission.
Consistency with global standards
In December 2012, the RBA published its FSS, which it uses to assess whether licensed clearing and settlement facilities, including those oper-ated by ASX, have done all things necessary to reduce systemic risk. In October 2014, RBA issued supplementary FSS guidance that allows ASX Clear (Futures) and ASX Clear to provide services to European Union clearing participants.
ASX complies with the FSS, as well as the global Principles for Financial Market Infrastructure (PFMIs) established by the Committee on Payments and Market Infrastructures (CPMI) and the International Organisation of Securities Commissions (IOSCO). The Principles for FMI Disclosure Framework document sets out how ASX complies with the FSS and PFMIs.
In March 2015, ASX moved to a ‘Cover 2’ standard for credit and liquidity risk for its cash equities clearing business. Both ASX Clear and ASX Clear (Futures) hold sufficient capital to withstand the default of their two largest participants under extreme but plausible market conditions. Each of ASX Limited, ASX Clear and ASX Clear (Futures) has an investment grade long-term credit rating of AA- from Standard & Poor’s.
Recovery and resolution
An important outcome of international regula-tory harmonisation has been the requirement to develop recovery and resolution plans for clearing houses such as ASX Clear and ASX Clear (Futures). Regulators and customers have focused on the powers of clearing houses (that act as central coun-terparties) to address losses or liquidity short-falls following extreme circumstances that require replenishing their default funds (recovery); and on a regime that would enable a public authority to take control of a distressed central counterparty to return it to viability or facilitate its orderly wind-down (resolution).
In August 2015, ASX released its Response to Consultation Feedback on exposure draft rules to implement proposed loss allocation and replen-ishment tools for clearing participant default and non-default loss. This followed earlier consulta-tions in October 2014 and April 2015. The new rules are expected to take effect in late 2015, and comply with domestic and international regulatory requirements.
In February 2015, the Treasury released a Resolution Regime for Financial Market Infrastructure Consultation paper proposing legislation to estab-lish an Australian resolution regime for central counterparties. ASX supports the early implemen-tation of the resolution regime.
Clearing market structure and Code of Practice
In February 2015, the Government announced a review of the market structure for clearing Australian cash equities. ASX is currently the sole provider of this service and believes it is the right model for a market the size of Australia. A Government decision in relation to the review is expected soon. The current moratorium on compe-tition in cash equities clearing remains in place until a decision is announced.
ASX has recommended that the current market structure be extended for five years. This would give ASX certainty to invest in a ‘once in a genera-tion’ replacement of CHESS. ASX has also commit-ted to implement a new clearing fee schedule that would provide savings to its clients, and to strengthen the Code of Practice that sets out how ASX manages the infrastructure on behalf of the market if the current model is continued.
The Code has been operating since August 2013 and improved transparency around pricing, financial performance and international benchmarking of ASX’s post-trade services for the cash market. A number of advisory bodies have been created under the Code that provide input on ASX’s invest-ment in the design, operation and development of clearing and settlement services.
ASX Annual Report 2015 | Regulatory environment and market structure 13
“ASX is a global leader in A$ equities and derivatives, and is
focused on delivering services that make it
easier for customers to connect to liquidity in a
cost-effective way.”
Financial System Inquiry
In December 2014, the Government released the final report of the Financial System Inquiry to examine how the financial system could be positioned to meet Australia’s evolving needs and support economic growth. ASX endorsed the recommendations relating to financial markets, including the development of the corporate bond market and the change in the national interest test that applies to ASX’s 15% ownership cap.
Mandated clearing of OTC derivatives
In December 2014, CFR announced that the Government will mandate centralised clearing of Australian dollar interest rate derivatives between internationally active dealers at the same time as the four major global currencies. The mandate is expected to come into effect by March 2016.
European and US OTC clearing standards
Many of ASX’s customers are headquartered in jurisdictions that have placed conditions on where those counterparties may clear their OTC deriva-tives transactions. ASX, the RBA and ASIC have worked with the regulators in those jurisdictions to allow these customers to use ASX’s financial market infrastructure to clear their transactions in Australia though ASX Clear (Futures).
ESMA
The European Securities and Markets Authority (ESMA) is responsible for the implementation of the European Market Infrastructure Regulation (EMIR) – the EU regulation dealing with OTC derivatives, central counterparties and trade repositories.
In April 2015, ESMA confirmed it had formally recognised each of ASX Clear and ASX Clear (Futures) as a ‘Third Country CCP’. ASX’s clearing houses were amongst the first group of international clearing houses to obtain this recognition. This will allow EU-headquartered banking groups wishing to clear transactions through ASX Clear or ASX Clear (Futures) to avoid higher regulatory capital charges that would otherwise apply to them if ASX Clear and ASX Clear (Futures) were not recognised.
CFTC
The US Commodity Futures Trading Commission (CFTC) is responsible for the regulation of US futures and swaps markets. ASX Clear (Futures) is permitted to clear proprietary swap positions for its US clearing members.
On 18 August 2015, the CFTC issued an order of exemption from registration as a Derivatives Clearing Organization to ASX Clear (Futures). The order is the first issued by the CFTC based on its authority under Section 5b(h) of the Commodity Exchange Act.
14 ASX Annual Report 2015 | Customer engagement
Customer engagement
ASX is positioned at the heart of Australia’s finan-cial markets. Its clients include:
• 2,220 companies and other issuers who list on ASX to connect with investors and access Australia’s capital markets
• more than 180 local and international inter-mediaries and banks, hundreds of settlement participants, market data vendors, and other market operators who rely on ASX to provide Australia’s financial market infrastructure seamlessly every day
• institutional investors, asset managers, superannuation funds, professional traders and millions of retail investors who use ASX’s financial markets to invest, trade and manage risk.
In 2012, ASX adopted a Customer Charter that sets out how it balances the interests of custom-ers, shareholders, end-investors and the broader financial markets.
Companies and issuers
In FY15, the ASX listings business progressed initi-atives that improve efficiency and flexibility for companies, to ensure that Australia remains an attractive market to list and raise capital.
In addition, ASX expanded its Evolve program to help listed companies connect with investors. The program funds broker research and provides a platform for listed companies to interact with investors both in Australia and overseas. In FY15, the program rebuilt the company information section on asx.com.au and launched the Listed@ASX magazine in print and online.
In FY16, ASX will replace ASX Online, its B2B digital platform used by companies to interact with ASX. The new portal will provide a simpler and richer experience.
Market participants
ASX has implemented a number of initiatives to improve the customer experience for the inter-mediaries that service investors and other users of its financial markets.
Improving the experienceASX has established a dedicated team to deliver an outstanding customer experience. The team is led by a member of the Executive Committee and brings together the main customer-facing functions from across ASX, ensur-ing that senior management is directly engaged in the issues that matter most to customers.
In April 2015, the Federal Treasurer opened ASX’s 24-hour Customer Support Centre. The Centre integrates ASX’s technology, operations, clear-ing risk and market surveillance teams to provide end-to-end customer support.
A new Technical Account Manager team has also been created. This team seeks to understand the plans of ASX customers, prepare them for change, and provide a single point of contact for any service-related issues. This ‘high touch’ approach is welcomed by customers who are looking for a streamlined way to engage with ASX.
Progress on engagementOver the last two years, ASX has broadened engagement with intermediaries, creating 12 forums across all main businesses. These forums discuss current market developments, provide feedback on service delivery, and help prioritise investment in products and services.
Fee reductionsASX recognises the cost pressures facing its inter-mediary customers. During FY15, ASX reduced fees for interest rate, electricity and grains futures, and for OTC clearing services. These changes impacted on ASX revenues by $17.8 million and were partially offset by the removal of some rebates. The fee changes strengthen alignment with intermediaries and create a more sustainable business.
ASX has also proposed to implement fee reduc-tions as part of its submission to the Government’s review of the market structure for clearing Australian cash equities. Based on current activity levels, the savings for equities clearing clients could be approximately $7.3 million in FY16.
Surveying customersIn FY15, ASX conducted its first Customer Satisfaction Survey. While the results show that progress has been made to improve customer service, there is considerable room to improve even further. Customers would like deeper engage-ment with ASX, initiatives to reduce their costs and improved service delivery.
This feedback will be incorporated into ASX plans to enrich the customer experience.
Investors
ASX recognises that financial markets must meet the needs and expectations of end-investors.
ASX advocates for market regulations that support the interests of investors. It continues to develop services that give investors choice and allow them to transact efficiently. In FY15, ASX introduced enhancements to its Centre Point execution service based on direct feedback from investors about the challenges of transacting in a fragmented equity market.
Australia has one of the highest levels of retail share ownership in the world. In FY15, ASX continued to provide retail education services and operate the popular Sharemarket Game. ASX also conducted the biennial Australian Share Ownership Study that provides a comprehensive insight into the behav-iours, attitudes and knowledge of retail investors.
ASX Annual Report 2015 | Environment, social and governance 15
Environment, social and governance
ASX is focused on the long-term sustainability of its business. Environment, social and governance (ESG) risks are monitored as part of the Board’s oversight of ASX’s enterprise risk management framework. This section describes how ASX addresses these risks, and provides transparency on the manage-ment of ASX’s environmental footprint.
Investor education
According to the most recent Australian Share Ownership Study, 54% of investors said they will definitely or probably buy shares in the next 12 months. This is the highest level of interest since the GFC. Thirty-six percent of adult Australians currently participate in the share market directly through shares and other listed investments, or indirectly through managed funds or self-man-aged super.
ASX’s website provides a range of free tools and resources to help investors understand invest-ing, its potential rewards and risks. In FY15, more than 180,000 online courses on shares, bonds and hybrids, exchange-traded products, instal-ment warrants, options, futures and Australian government bonds were downloaded. Short form, mobile-friendly introductory tutorials are available. ASX’s YouTube channel features presentations from finance industry experts. ASX’s monthly Investor Update e-newsletter covers topics ranging from the investment basics to strategies relevant to more experienced investors, and has over 198,000 subscribers.
ASX produces the ASX Sharemarket Game for the general public and secondary school students. The Game provides an opportunity to become familiar with the mechanics of share trading. Its link to the live market makes it particularly effective in connecting students to real-world events. Over 71,250 students from 1,000 schools and 41,462 members of the public played the Game last year.
Ethics and integrity
ASX’s Code of Conduct and Anti-Bribery and Corruption, Fraud Control and Whistleblower Protection policies promote ethical and responsible decision-making by all directors and employees of the ASX Group. All ASX employees must complete periodic training on ASX policies promoting ethi-cal behaviour, including fraud, Equal Employment Opportunity (EEO), diversity, whistleblowing, conflicts handling and dealing rules.
Further details are set out on page 25 of the corpo-rate governance section of this report.
ASX people
ASX aims to build and retain a highly motivated team of professionals with the best available skills and experience.
The Remuneration Committee oversees and receives periodic reports about ASX’s human capital policies and programs. ASX’s Talent and Diversity Council, comprising the CEO and the Group Executive Committee, regularly reviews talent and leadership programs, performance management and reward processes, succession planning outcomes, diversity strategy progress, and staff alignment and engagement results.
Alignment and engagementASX measures staff alignment and engagement through an annual staff survey. Both alignment and engagement significantly improved in FY15. Compared to its peer companies, ASX’s alignment reached the top quartile and its engagement was at the upper end of the second quartile. The Remuneration Committee reviews the results of the survey to assist in monitoring the culture of the organisation.
Training and retentionA learning and development program is in place for all levels of the organisation. Programs for emerg-ing and senior executive leaders identify, train and retain high potential, high performing employees.
RemunerationASX market positioning for fixed remuneration is the median to upper quartile. The majority of employees participate in a short-term incentive (STI) plan, which is linked to their contribution to ASX’s performance. During FY16, ASX will offer all employees the opportunity to participate in a plan to acquire ASX shares.
ASX’s remuneration report on page 26 describes ASX’s approach to senior executive remuneration.
RecognitionRecognition at ASX is supported through two programs: a non-financial peer-to-peer program that recognises individual contributions during the year, and a formal CEO Awards program that rewards excellence on an annual basis.
Both programs focus on excellence in the behav-iours critical to the Company’s long-term success: customer impact, critical thinking and innovation, talent culture, and action and accountability.
ASX WellbeingASX Wellbeing supports staff to balance work, personal and family life.
In FY15, ASX employees participated in the Happy Body at Work initiative that targeted the four life-style habits affected by a typical work environment: sitting, moving, stress and sleep. The program was enthusiastically received by employees and provided a structured program to help staff change their habits and improve their energy, resilience, performance and general wellbeing.
Other wellbeing initiatives include yoga, pilates and meditation classes, lunchtime sport and a walking club. The ASX Social Committee coordinates a range of company-funded social activities and events throughout the year.
Workplace health and safetyASX’s FY15 lost-time injury frequency rate (the number of lost-time injuries per 1 million hours worked) was 0.93. This is well below industry benchmarks.
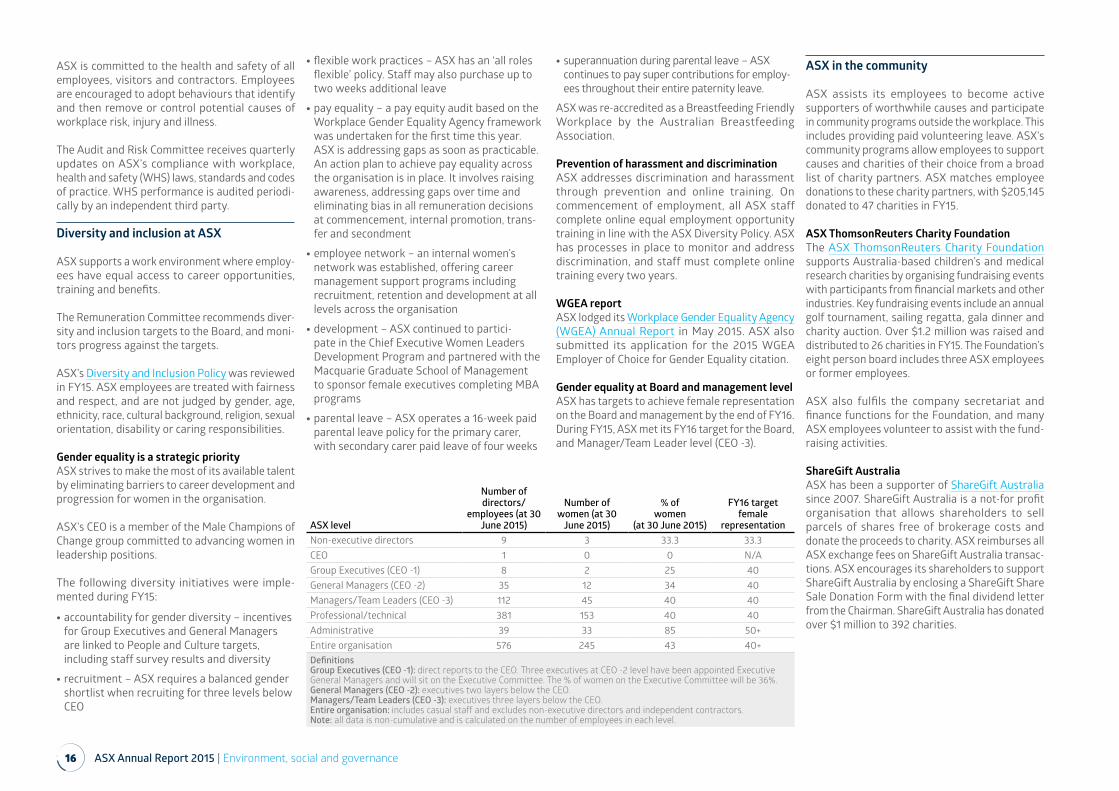
16 ASX Annual Report 2015 | Environment, social and governance
ASX is committed to the health and safety of all employees, visitors and contractors. Employees are encouraged to adopt behaviours that identify and then remove or control potential causes of workplace risk, injury and illness.
The Audit and Risk Committee receives quarterly updates on ASX’s compliance with workplace, health and safety (WHS) laws, standards and codes of practice. WHS performance is audited periodi-cally by an independent third party.
Diversity and inclusion at ASX
ASX supports a work environment where employ-ees have equal access to career opportunities, training and benefits.
The Remuneration Committee recommends diver-sity and inclusion targets to the Board, and moni-tors progress against the targets.
ASX’s Diversity and Inclusion Policy was reviewed in FY15. ASX employees are treated with fairness and respect, and are not judged by gender, age, ethnicity, race, cultural background, religion, sexual orientation, disability or caring responsibilities.
Gender equality is a strategic priorityASX strives to make the most of its available talent by eliminating barriers to career development and progression for women in the organisation.
ASX’s CEO is a member of the Male Champions of Change group committed to advancing women in leadership positions.
The following diversity initiatives were imple-mented during FY15:
• accountability for gender diversity – incentives for Group Executives and General Managers are linked to People and Culture targets, including staff survey results and diversity
• recruitment – ASX requires a balanced gender shortlist when recruiting for three levels below CEO
• flexible work practices – ASX has an ‘all roles flexible’ policy. Staff may also purchase up to two weeks additional leave
• pay equality – a pay equity audit based on the Workplace Gender Equality Agency framework was undertaken for the first time this year. ASX is addressing gaps as soon as practicable. An action plan to achieve pay equality across the organisation is in place. It involves raising awareness, addressing gaps over time and eliminating bias in all remuneration decisions at commencement, internal promotion, trans-fer and secondment
• employee network – an internal women’s network was established, offering career management support programs including recruitment, retention and development at all levels across the organisation
• development – ASX continued to partici-pate in the Chief Executive Women Leaders Development Program and partnered with the Macquarie Graduate School of Management to sponsor female executives completing MBA programs
• parental leave – ASX operates a 16-week paid parental leave policy for the primary carer, with secondary carer paid leave of four weeks
• superannuation during parental leave – ASX continues to pay super contributions for employ-ees throughout their entire paternity leave.
ASX was re-accredited as a Breastfeeding Friendly Workplace by the Australian Breastfeeding Association.
Prevention of harassment and discriminationASX addresses discrimination and harassment through prevention and online training. On commencement of employment, all ASX staff complete online equal employment opportunity training in line with the ASX Diversity Policy. ASX has processes in place to monitor and address discrimination, and staff must complete online training every two years.
WGEA reportASX lodged its Workplace Gender Equality Agency (WGEA) Annual Report in May 2015. ASX also submitted its application for the 2015 WGEA Employer of Choice for Gender Equality citation.
Gender equality at Board and management levelASX has targets to achieve female representation on the Board and management by the end of FY16. During FY15, ASX met its FY16 target for the Board, and Manager/Team Leader level (CEO -3).
ASX in the community
ASX assists its employees to become active supporters of worthwhile causes and participate in community programs outside the workplace. This includes providing paid volunteering leave. ASX’s community programs allow employees to support causes and charities of their choice from a broad list of charity partners. ASX matches employee donations to these charity partners, with $205,145 donated to 47 charities in FY15.
ASX ThomsonReuters Charity FoundationThe ASX ThomsonReuters Charity Foundation supports Australia-based children’s and medical research charities by organising fundraising events with participants from financial markets and other industries. Key fundraising events include an annual golf tournament, sailing regatta, gala dinner and charity auction. Over $1.2 million was raised and distributed to 26 charities in FY15. The Foundation’s eight person board includes three ASX employees or former employees.
ASX also fulfils the company secretariat and finance functions for the Foundation, and many ASX employees volunteer to assist with the fund-raising activities.
ShareGift AustraliaASX has been a supporter of ShareGift Australia since 2007. ShareGift Australia is a not-for profit organisation that allows shareholders to sell parcels of shares free of brokerage costs and donate the proceeds to charity. ASX reimburses all ASX exchange fees on ShareGift Australia transac-tions. ASX encourages its shareholders to support ShareGift Australia by enclosing a ShareGift Share Sale Donation Form with the final dividend letter from the Chairman. ShareGift Australia has donated over $1 million to 392 charities.
ASX level
Number of directors/
employees (at 30 June 2015)
Number of women (at 30
June 2015)
% ofwomen
(at 30 June 2015)
FY16 target female
representationNon-executive directors 9 3 33.3 33.3CEO 1 0 0 N/AGroup Executives (CEO -1) 8 2 25 40General Managers (CEO -2) 35 12 34 40Managers/Team Leaders (CEO -3) 112 45 40 40Professional/technical 381 153 40 40Administrative 39 33 85 50+Entire organisation 576 245 43 40+DefinitionsGroup Executives (CEO -1): direct reports to the CEO. Three executives at CEO -2 level have been appointed Executive General Managers and will sit on the Executive Committee. The % of women on the Executive Committee will be 36%.General Managers (CEO -2): executives two layers below the CEO. Managers/Team Leaders (CEO -3): executives three layers below the CEO.Entire organisation: includes casual staff and excludes non-executive directors and independent contractors.Note: all data is non-cumulative and is calculated on the number of employees in each level.
ASX Annual Report 2015 | Environment, social and governance 17
Anzac Centenary Public FundASX is contributing $1 million to the Anzac Centenary Public Fund (The Fund). The Fund, established by the Australian Government, receives donations to commemorate the centenary of Australia’s involvement in the First World War and a Century of Service. Projects honour and improve understanding of the service and sacri-fice of Australia’s servicemen and women, past and present, in defending Australia’s values and freedoms.
Environment
ASX is a service-based organisation that does not extract physical or natural resources and is not involved in the manufacture or transport of products. The Group’s operations comprise approximately 570 staff, located in a head office, two interstate offices and two data centres. Accordingly, ASX’s environmental footprint is small and arises from the energy used by the offices and data centres, and also from consumables, primarily paper. Based on this small environmental footprint, ASX’s environmental risks are not significant.
A growing proportion of the energy consumed by ASX is used in the Australian Liquidity Centre (ALC, ASX’s primary data centre) to support the equipment and systems of customers who co-lo-cate equipment with ASX instead of their own or other facilities.
The number of cabinets in the ALC has increased from 76 to 188 over the last three years. Excluding the energy consumed by these cabinets, ASX’s energy consumption is broadly flat over this period.
Environmental risks are monitored, assessed and managed as part of ASX’s risk management frame-work. ASX’s approach to managing these risks includes: measuring the impact of its activities, minimising consumption of materials, recycling and re-using consumables, and supporting aware-ness of environmental issues. A cross-divisional Environmental Committee is in place to oversee ASX’s environmental impact-reduction activities.
During FY15, ASX launched Straight-Through-Processing for the five most frequently used corpo-rate actions, and the mFund settlement service to allow investors to invest in managed funds online. Both initiatives use automation to improve efficien-cies and remove paper from the financial system.
Environmental indicators and initiatives Climate change Unit 2013 2014 2015Direct emissions (diesel fuel for backup generators)
kt CO2-e 0.30 0.07 0.03
Indirect emissions (electricity, paper, travel, waste)
kt CO2-e 12 13 14
FY15 initiatives • ASX ’s new Customer Support Centre fit-out speci-fications and Bridge Street lease renewal included energy efficient requirements.
• ASX internal paper usage and CHESS statements converted to certified carbon neutral paper under the National Carbon Offset Standard.
Waste, water, energy Unit 2013 2014 2015
Direct emissions GJ 44,145 49,526 52,620
Indirect emissions (electricity, paper, travel, waste)
GJ 2,881 1,221 435
Paper consumed tonnes 78 76 81
FY15 initiatives • Ongoing successful initiatives to reduce diesel and gas usage at the ALC.
• Energy reduction initiatives, including: - replacing all monitors and PCs with new devices - implementeing virtual/energy efficient energy server strategy
- replacing high energy consumption networking equipment with smaller and faster switches
- upgrading to energy efficient lighting in Sydney, Perth and Melbourne offices.
Assessment of ASX’s ESG practices
Given ASX small environmental footprint, it does not set specific ESG targets or participate in all ESG evaluation surveys or indices. ASX is:
• a participant in the Carbon Disclosure Project that provides transparency on ASX’s moni-toring and minimisation arrangements for emissions, waste and water usage
• a constituent of the FTSE4Good Index Series that is designed to facilitate investment in companies that have met stringent social and environmental criteria.
ASX is aware that its ESG practices have also been assessed by:
• MSCI ESG research
• Trucost.
ASX Corporate Governance Council
The ASX Corporate Governance Council, which was established in August 2002, has continued to refresh the principles-based framework for corporate governance practices – the Corporate Governance Principles and Recommendations (Principles) – so they continue as a relevant and practical guide for listed entities, investors and the wider Australian community.
The Council brings together 21 business, investment and shareholder groups. As the convenor, ASX nominates the chair (currently Mr Alan Cameron AO) and provides executive support, as well as contributing one member of the Council.
ASX requires listed entities to disclose the extent to which they have followed the recommendations set by the Council during the relevant reporting period. Where companies have not followed a recommen-dation, they must provide an explanation (‘if not, why not’ reporting). These reporting requirements provide for transparency of the corporate govern-ance practices of listed companies, which better positions investors to make informed investment decisions.
The third edition of the Principles released in March 2014 gave listed entities the flexibility to make their corporate governance disclosures on their website rather than in their Annual Report.
The Council has also contributed to a significant improvement in public reporting and awareness of how listed entities manage their economic, environ-mental, social sustainability and governance risks, through a recommendation that this information be included in listed entity Annual Reports.
ASX’s corporate governance framework
ASX’s approach to corporate governance is described on the following pages.
18 ASX Annual Report 2015 | Corporate governance
Corporate governance
ASX’s corporate governance framework
ASX’s governance arrangements have been consist-ent with the third edition of the ASX Corporate Governance Council’s Corporate Governance Principles and Recommendations (Principles) throughout the reporting period.
More information on ASX’s corporate governance is available on ASX’s website.
This statement is current as at 20 August 2015 and has been approved by the Board.
Delegation to committees, subsidiary boards and Management • The Board has established the Audit and Risk, Nomination and Remuneration committees to assist it to discharge its duties
• Day-to-day management and operations are delegated to Management
• ASX Compliance monitors and enforces compli-ance with the ASX Operating Rules under the oversight of the ASX Compliance board
• The clearing and settlement boards focus on risk management and oversight of the clearing and settlement operations
• Charters set out respective responsibilities and how each board or committee supports and provides input into the other’s deliberations
Board of directors
Role and responsibilities of the Board • Accountable for the performance of the ASX Group
• Oversees the conduct of the ASX Group, consistent with its licence obligations and public policy objectives of financial market integrity and financial system stability
• Reviews and approves the corporate strategy, annual budget and financial plans
• Monitors financial performance
• Appoints and assesses the performance of the
CEO, and oversees succession plans for the senior executive team
• Oversees the effectiveness of Management processes and approves major corporate initiatives
• Monitors ASX’s culture
• Oversees the process for identifying significant risks facing ASX and control, monitoring and reporting mechanisms
• Enhances and protects the reputation of ASX
• Reports to and communicates with shareholders
• Reviews earnings and other forecasts
The responsibilities of the Board are detailed in the Board Charter. The Board’s conduct is also governed by ASX’s Constitution.
Responsibilities of the Chairman • Independent and non-executive
• The CEO may not be or become Chairman
• Leads the Board in its duties to ASX
• Facilitates effective Board meeting discussion
• Oversees processes and procedures to evalu-ate the performance of the Board, its commit-tees and individual directors
Composition of the Board • At the date of this report, there are 10 direc-tors, whose names, skills and experience are detailed on pages 19 to 21
• Ms Jillian Segal will retire from the Board on 1 September 2015
• Ms Yasmin Allen was appointed to the Board on 9 February 2015
• The Board is committed to maintaining the diversity of the Board and at least 33% female representation
• The Board considers that individually and collectively, the directors have an appropriate mix of skills, experience and expertise
Board renewal and succession planningThe Board regularly reviews its composition and succession plans. It uses the skills matrix below to guide its assessment of the skills and experience of current directors, and to identify any gaps in the collective skills of the Board.
Category ExplanationExecutive leadership
Successful career as a senior executive or CEO
StrategyDefine strategic objectives, constructively question business plans and implement strategy
Financial acumen
Accounting and reporting, corporate finance and internal controls, includ-ing assessing quality of financial controls
Risk and compliance
Forward-looking, able to identify the key risks to the organisation and monitor effectiveness of risk manage-ment frameworks and practices
Public policy Public and regulatory policy, including impact on markets and corporations
Information/ Technology
Use and governance of critical infor-mation technology infrastructure, digital disruption and information monetisation
Business development
Commercial and business experience, including development of product, service or customer management strategies, and innovation
People and change management
Overseeing and assessing senior management, remuneration frame-works, strategic human resource management and organisational change
Corporate governance
Knowledge, experience and commit-ment to the highest standards of governance
International exchange experience
International financial markets or exchange groups, including post-trade services and relationships with finan-cial market participants
Financial services experience
Broking, funds management, super-annuation and/or investment banking activities
The skills and experience of the Board reflects ASX’s role as the provider of critical infrastructure to Australia’s financial markets and its position in the Asia Pacific region.
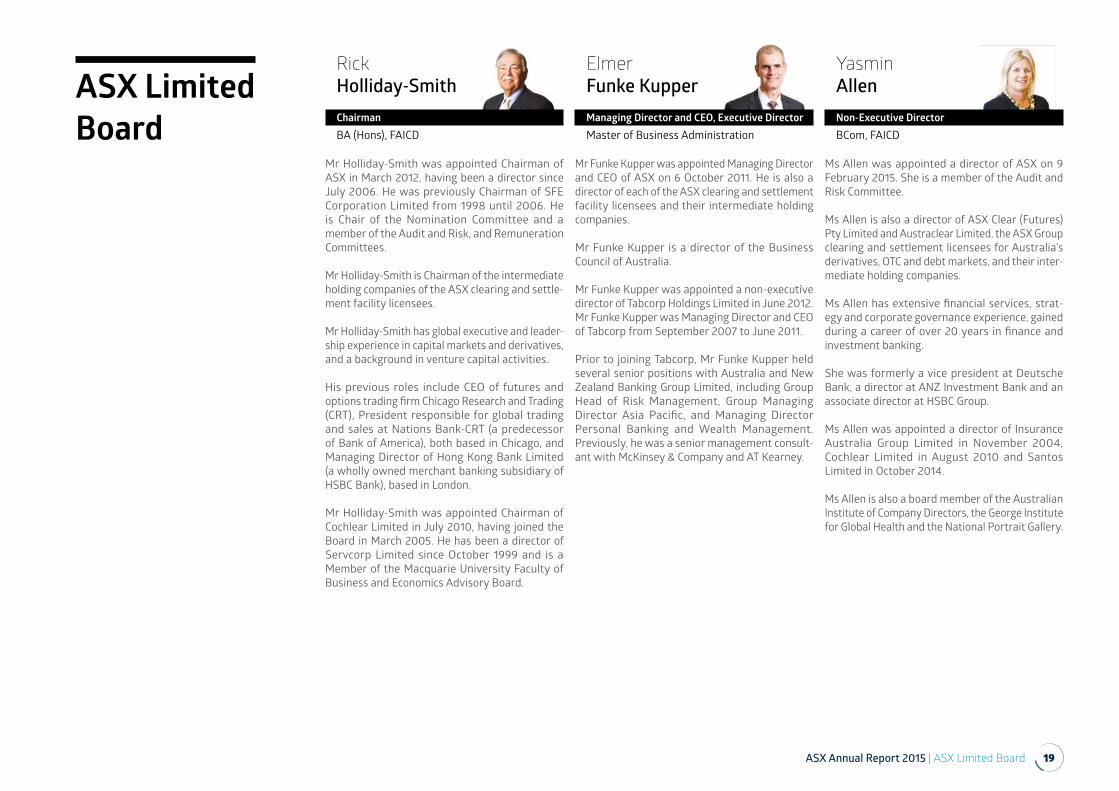
ASX Annual Report 2015 | ASX Limited Board 19
ASX Limited Board
Rick Holliday-SmithChairmanBA (Hons), FAICD
Mr Holliday-Smith was appointed Chairman of ASX in March 2012, having been a director since July 2006. He was previously Chairman of SFE Corporation Limited from 1998 until 2006. He is Chair of the Nomination Committee and a member of the Audit and Risk, and Remuneration Committees.
Mr Holliday-Smith is Chairman of the intermediate holding companies of the ASX clearing and settle-ment facility licensees.
Mr Holliday-Smith has global executive and leader-ship experience in capital markets and derivatives, and a background in venture capital activities.
His previous roles include CEO of futures and options trading firm Chicago Research and Trading (CRT), President responsible for global trading and sales at Nations Bank-CRT (a predecessor of Bank of America), both based in Chicago, and Managing Director of Hong Kong Bank Limited (a wholly owned merchant banking subsidiary of HSBC Bank), based in London.
Mr Holliday-Smith was appointed Chairman of Cochlear Limited in July 2010, having joined the Board in March 2005. He has been a director of Servcorp Limited since October 1999 and is a Member of the Macquarie University Faculty of Business and Economics Advisory Board.
Elmer Funke KupperManaging Director and CEO, Executive DirectorMaster of Business Administration
Mr Funke Kupper was appointed Managing Director and CEO of ASX on 6 October 2011. He is also a director of each of the ASX clearing and settlement facility licensees and their intermediate holding companies.
Mr Funke Kupper is a director of the Business Council of Australia.
Mr Funke Kupper was appointed a non-executive director of Tabcorp Holdings Limited in June 2012. Mr Funke Kupper was Managing Director and CEO of Tabcorp from September 2007 to June 2011.
Prior to joining Tabcorp, Mr Funke Kupper held several senior positions with Australia and New Zealand Banking Group Limited, including Group Head of Risk Management, Group Managing Director Asia Pacific, and Managing Director Personal Banking and Wealth Management. Previously, he was a senior management consult-ant with McKinsey & Company and AT Kearney.
Yasmin AllenNon-Executive DirectorBCom, FAICD
Ms Allen was appointed a director of ASX on 9 February 2015. She is a member of the Audit and Risk Committee.
Ms Allen is also a director of ASX Clear (Futures) Pty Limited and Austraclear Limited, the ASX Group clearing and settlement licensees for Australia’s derivatives, OTC and debt markets, and their inter-mediate holding companies.
Ms Allen has extensive financial services, strat-egy and corporate governance experience, gained during a career of over 20 years in finance and investment banking.
She was formerly a vice president at Deutsche Bank, a director at ANZ Investment Bank and an associate director at HSBC Group.
Ms Allen was appointed a director of Insurance Australia Group Limited in November 2004, Cochlear Limited in August 2010 and Santos Limited in October 2014.
Ms Allen is also a board member of the Australian Institute of Company Directors, the George Institute for Global Health and the National Portrait Gallery.
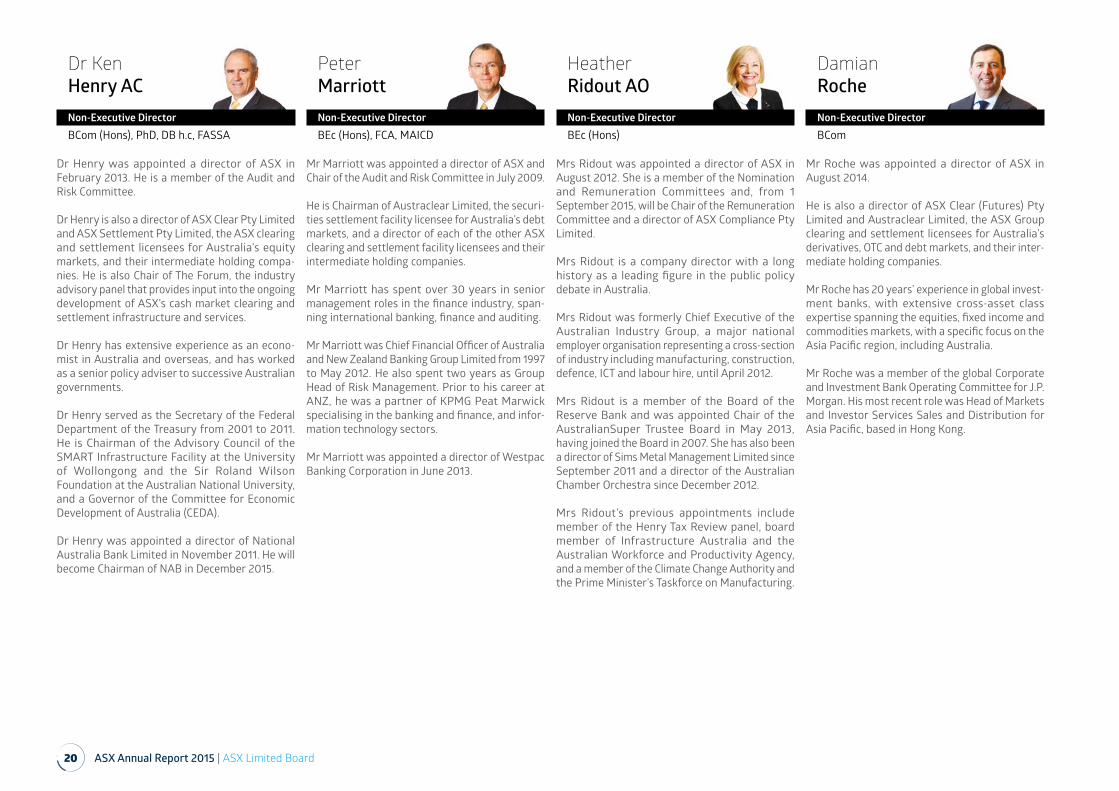
20 ASX Annual Report 2015 | ASX Limited Board
Dr Ken Henry ACNon-Executive DirectorBCom (Hons), PhD, DB h.c, FASSA
Dr Henry was appointed a director of ASX in February 2013. He is a member of the Audit and Risk Committee.
Dr Henry is also a director of ASX Clear Pty Limited and ASX Settlement Pty Limited, the ASX clearing and settlement licensees for Australia’s equity markets, and their intermediate holding compa-nies. He is also Chair of The Forum, the industry advisory panel that provides input into the ongoing development of ASX’s cash market clearing and settlement infrastructure and services.
Dr Henry has extensive experience as an econo-mist in Australia and overseas, and has worked as a senior policy adviser to successive Australian governments.
Dr Henry served as the Secretary of the Federal Department of the Treasury from 2001 to 2011. He is Chairman of the Advisory Council of the SMART Infrastructure Facility at the University of Wollongong and the Sir Roland Wilson Foundation at the Australian National University, and a Governor of the Committee for Economic Development of Australia (CEDA).
Dr Henry was appointed a director of National Australia Bank Limited in November 2011. He will become Chairman of NAB in December 2015.
Peter MarriottNon-Executive DirectorBEc (Hons), FCA, MAICD
Mr Marriott was appointed a director of ASX and Chair of the Audit and Risk Committee in July 2009.
He is Chairman of Austraclear Limited, the securi-ties settlement facility licensee for Australia’s debt markets, and a director of each of the other ASX clearing and settlement facility licensees and their intermediate holding companies.
Mr Marriott has spent over 30 years in senior management roles in the finance industry, span-ning international banking, finance and auditing.
Mr Marriott was Chief Financial Officer of Australia and New Zealand Banking Group Limited from 1997 to May 2012. He also spent two years as Group Head of Risk Management. Prior to his career at ANZ, he was a partner of KPMG Peat Marwick specialising in the banking and finance, and infor-mation technology sectors.
Mr Marriott was appointed a director of Westpac Banking Corporation in June 2013.
Heather Ridout AONon-Executive DirectorBEc (Hons)
Mrs Ridout was appointed a director of ASX in August 2012. She is a member of the Nomination and Remuneration Committees and, from 1 September 2015, will be Chair of the Remuneration Committee and a director of ASX Compliance Pty Limited.
Mrs Ridout is a company director with a long history as a leading figure in the public policy debate in Australia.
Mrs Ridout was formerly Chief Executive of the Australian Industry Group, a major national employer organisation representing a cross-section of industry including manufacturing, construction, defence, ICT and labour hire, until April 2012.
Mrs Ridout is a member of the Board of the Reserve Bank and was appointed Chair of the AustralianSuper Trustee Board in May 2013, having joined the Board in 2007. She has also been a director of Sims Metal Management Limited since September 2011 and a director of the Australian Chamber Orchestra since December 2012.
Mrs Ridout’s previous appointments include member of the Henry Tax Review panel, board member of Infrastructure Australia and the Australian Workforce and Productivity Agency, and a member of the Climate Change Authority and the Prime Minister’s Taskforce on Manufacturing.
Damian RocheNon-Executive DirectorBCom
Mr Roche was appointed a director of ASX in August 2014.
He is also a director of ASX Clear (Futures) Pty Limited and Austraclear Limited, the ASX Group clearing and settlement licensees for Australia’s derivatives, OTC and debt markets, and their inter-mediate holding companies.
Mr Roche has 20 years’ experience in global invest-ment banks, with extensive cross-asset class expertise spanning the equities, fixed income and commodities markets, with a specific focus on the Asia Pacific region, including Australia.
Mr Roche was a member of the global Corporate and Investment Bank Operating Committee for J.P. Morgan. His most recent role was Head of Markets and Investor Services Sales and Distribution for Asia Pacific, based in Hong Kong.
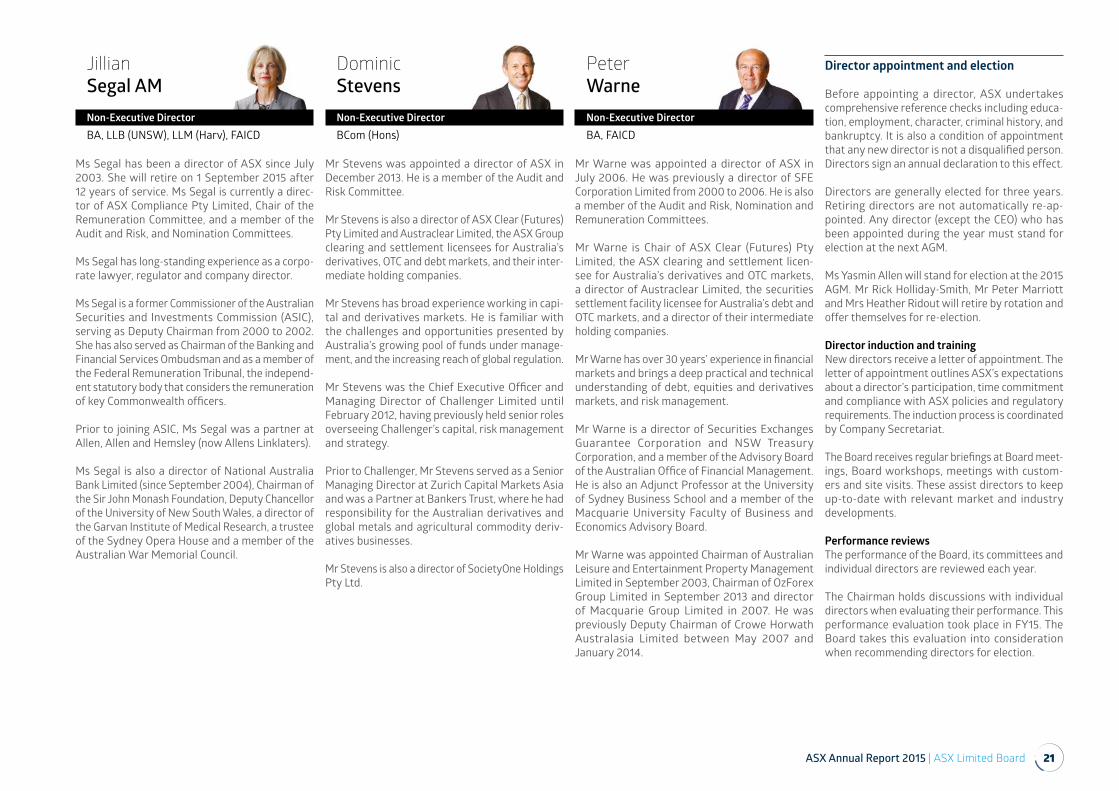
ASX Annual Report 2015 | ASX Limited Board 21
Jillian Segal AMNon-Executive DirectorBA, LLB (UNSW), LLM (Harv), FAICD
Ms Segal has been a director of ASX since July 2003. She will retire on 1 September 2015 after 12 years of service. Ms Segal is currently a direc-tor of ASX Compliance Pty Limited, Chair of the Remuneration Committee, and a member of the Audit and Risk, and Nomination Committees.
Ms Segal has long-standing experience as a corpo-rate lawyer, regulator and company director.
Ms Segal is a former Commissioner of the Australian Securities and Investments Commission (ASIC), serving as Deputy Chairman from 2000 to 2002. She has also served as Chairman of the Banking and Financial Services Ombudsman and as a member of the Federal Remuneration Tribunal, the independ-ent statutory body that considers the remuneration of key Commonwealth officers.
Prior to joining ASIC, Ms Segal was a partner at Allen, Allen and Hemsley (now Allens Linklaters).
Ms Segal is also a director of National Australia Bank Limited (since September 2004), Chairman of the Sir John Monash Foundation, Deputy Chancellor of the University of New South Wales, a director of the Garvan Institute of Medical Research, a trustee of the Sydney Opera House and a member of the Australian War Memorial Council.
Dominic StevensNon-Executive DirectorBCom (Hons)
Mr Stevens was appointed a director of ASX in December 2013. He is a member of the Audit and Risk Committee.
Mr Stevens is also a director of ASX Clear (Futures) Pty Limited and Austraclear Limited, the ASX Group clearing and settlement licensees for Australia’s derivatives, OTC and debt markets, and their inter-mediate holding companies.
Mr Stevens has broad experience working in capi-tal and derivatives markets. He is familiar with the challenges and opportunities presented by Australia’s growing pool of funds under manage-ment, and the increasing reach of global regulation.
Mr Stevens was the Chief Executive Officer and Managing Director of Challenger Limited until February 2012, having previously held senior roles overseeing Challenger’s capital, risk management and strategy.
Prior to Challenger, Mr Stevens served as a Senior Managing Director at Zurich Capital Markets Asia and was a Partner at Bankers Trust, where he had responsibility for the Australian derivatives and global metals and agricultural commodity deriv-atives businesses.
Mr Stevens is also a director of SocietyOne Holdings Pty Ltd.
Peter WarneNon-Executive DirectorBA, FAICD
Mr Warne was appointed a director of ASX in July 2006. He was previously a director of SFE Corporation Limited from 2000 to 2006. He is also a member of the Audit and Risk, Nomination and Remuneration Committees.
Mr Warne is Chair of ASX Clear (Futures) Pty Limited, the ASX clearing and settlement licen-see for Australia’s derivatives and OTC markets, a director of Austraclear Limited, the securities settlement facility licensee for Australia’s debt and OTC markets, and a director of their intermediate holding companies.
Mr Warne has over 30 years’ experience in financial markets and brings a deep practical and technical understanding of debt, equities and derivatives markets, and risk management.
Mr Warne is a director of Securities Exchanges Guarantee Corporation and NSW Treasury Corporation, and a member of the Advisory Board of the Australian Office of Financial Management. He is also an Adjunct Professor at the University of Sydney Business School and a member of the Macquarie University Faculty of Business and Economics Advisory Board.
Mr Warne was appointed Chairman of Australian Leisure and Entertainment Property Management Limited in September 2003, Chairman of OzForex Group Limited in September 2013 and director of Macquarie Group Limited in 2007. He was previously Deputy Chairman of Crowe Horwath Australasia Limited between May 2007 and January 2014.
Director appointment and election
Before appointing a director, ASX undertakes comprehensive reference checks including educa-tion, employment, character, criminal history, and bankruptcy. It is also a condition of appointment that any new director is not a disqualified person. Directors sign an annual declaration to this effect.
Directors are generally elected for three years. Retiring directors are not automatically re-ap-pointed. Any director (except the CEO) who has been appointed during the year must stand for election at the next AGM.
Ms Yasmin Allen will stand for election at the 2015 AGM. Mr Rick Holliday-Smith, Mr Peter Marriott and Mrs Heather Ridout will retire by rotation and offer themselves for re-election.
Director induction and trainingNew directors receive a letter of appointment. The letter of appointment outlines ASX’s expectations about a director’s participation, time commitment and compliance with ASX policies and regulatory requirements. The induction process is coordinated by Company Secretariat.
The Board receives regular briefings at Board meet-ings, Board workshops, meetings with custom-ers and site visits. These assist directors to keep up-to-date with relevant market and industry developments.
Performance reviewsThe performance of the Board, its committees and individual directors are reviewed each year.
The Chairman holds discussions with individual directors when evaluating their performance. This performance evaluation took place in FY15. The Board takes this evaluation into consideration when recommending directors for election.
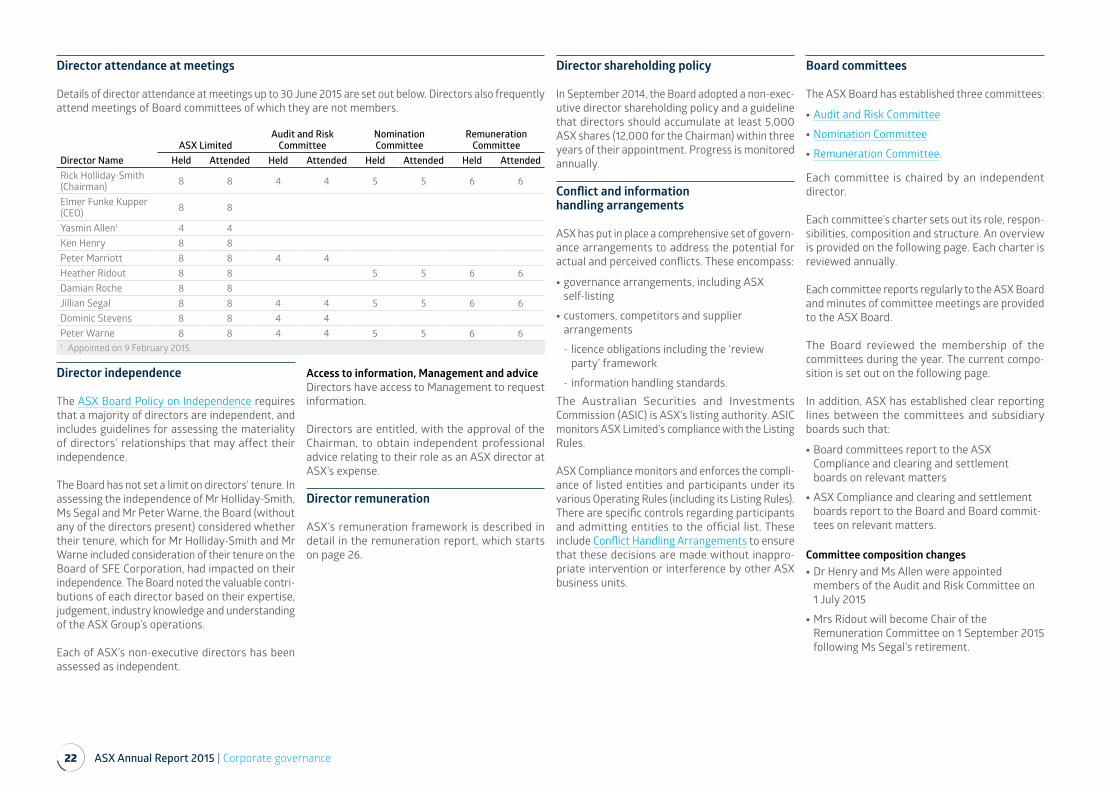
22 ASX Annual Report 2015 | Corporate governance
Director attendance at meetings
Details of director attendance at meetings up to 30 June 2015 are set out below. Directors also frequently attend meetings of Board committees of which they are not members.
Director independence
The ASX Board Policy on Independence requires that a majority of directors are independent, and includes guidelines for assessing the materiality of directors’ relationships that may affect their independence.
The Board has not set a limit on directors’ tenure. In assessing the independence of Mr Holliday-Smith, Ms Segal and Mr Peter Warne, the Board (without any of the directors present) considered whether their tenure, which for Mr Holliday-Smith and Mr Warne included consideration of their tenure on the Board of SFE Corporation, had impacted on their independence. The Board noted the valuable contri-butions of each director based on their expertise, judgement, industry knowledge and understanding of the ASX Group’s operations.
Each of ASX’s non-executive directors has been assessed as independent.
Access to information, Management and adviceDirectors have access to Management to request information.
Directors are entitled, with the approval of the Chairman, to obtain independent professional advice relating to their role as an ASX director at ASX’s expense.
Director remuneration
ASX’s remuneration framework is described in detail in the remuneration report, which starts on page 26.
Director shareholding policy
In September 2014, the Board adopted a non-exec-utive director shareholding policy and a guideline that directors should accumulate at least 5,000 ASX shares (12,000 for the Chairman) within three years of their appointment. Progress is monitored annually.
Conflict and information handling arrangements
ASX has put in place a comprehensive set of govern-ance arrangements to address the potential for actual and perceived conflicts. These encompass:
• governance arrangements, including ASX self-listing
• customers, competitors and supplier arrangements
- licence obligations including the ‘review party’ framework
- information handling standards.The Australian Securities and Investments Commission (ASIC) is ASX’s listing authority. ASIC monitors ASX Limited’s compliance with the Listing Rules.
ASX Compliance monitors and enforces the compli-ance of listed entities and participants under its various Operating Rules (including its Listing Rules). There are specific controls regarding participants and admitting entities to the official list. These include Conflict Handling Arrangements to ensure that these decisions are made without inappro-priate intervention or interference by other ASX business units.
Board committees
The ASX Board has established three committees:
• Audit and Risk Committee
• Nomination Committee
• Remuneration Committee.
Each committee is chaired by an independent director.
Each committee’s charter sets out its role, respon-sibilities, composition and structure. An overview is provided on the following page. Each charter is reviewed annually.
Each committee reports regularly to the ASX Board and minutes of committee meetings are provided to the ASX Board.
The Board reviewed the membership of the committees during the year. The current compo-sition is set out on the following page.
In addition, ASX has established clear reporting lines between the committees and subsidiary boards such that:
• Board committees report to the ASX Compliance and clearing and settlement boards on relevant matters
• ASX Compliance and clearing and settlement boards report to the Board and Board commit-tees on relevant matters.
Committee composition changes • Dr Henry and Ms Allen were appointed members of the Audit and Risk Committee on 1 July 2015
• Mrs Ridout will become Chair of the Remuneration Committee on 1 September 2015 following Ms Segal’s retirement.
Director NameASX Limited
Audit and Risk Committee
Nomination Committee
Remuneration Committee
Held Attended Held Attended Held Attended Held AttendedRick Holliday-Smith (Chairman) 8 8 4 4 5 5 6 6
Elmer Funke Kupper (CEO) 8 8
Yasmin Allen1 4 4 Ken Henry 8 8 Peter Marriott 8 8 4 4 Heather Ridout 8 8 5 5 6 6Damian Roche 8 8 Jillian Segal 8 8 4 4 5 5 6 6Dominic Stevens 8 8 4 4 Peter Warne 8 8 4 4 5 5 6 61 Appointed on 9 February 2015.
ASX Annual Report 2015 | Corporate governance 23
Audit and Risk Committee
Responsibilities • Integrity of ASX Limited’s consolidated finan-cial reports
• Adequacy of ASX’s corporate reporting process
• Systems of risk management, internal control and legal compliance (except matters overseen by the ASX Compliance or clearing and settle-ment boards)
• Internal audit oversight
• External audit liaison and monitoring of perfor-mance and effectiveness
• Receive audit reports and approve the audit plan
• Review external auditor independence, includ-ing considering the level of non-audit work carried out by the external auditor
Interaction with subsidiary boards • Receives reports from the ASX Compliance and clearing and settlement boards about compli-ance and risk management matters delegated to those entities
• Serves as the audit and risk committee of the clearing and settlement boards
• Preparation and methodology for special purpose accounts pursuant to the Code of Practice for Clearing and Settlement of Cash Equities
Audit and Risk Committee members• Peter Marriott (Chair) • Yasmin Allen (from 1 July 2015) • Ken Henry (from 1 July 2015) • Rick Holliday-Smith • Jillian Segal (retires 1 September 2015) • Dominic Stevens • Peter Warne
Nomination Committee
Responsibilities • Review process for nomination and selection of directors
• Identify desirable director competencies and experience
• Review director performance and the process for reviewing contributions
• Review director succession plans and induction programs
• Set and review Board gender diversity strategies
Interaction with subsidiary boards • Serves as nomination committee for the appointment of non-executive directors to the ASX Compliance and clearing and settlement boards
• Reports to ASX Compliance and clearing and settlement boards about nomination matters
Nomination Committee members• Rick Holliday-Smith (Chair) • Heather Ridout • Jillian Segal (retires 1 September 2015) • Peter Warne
Remuneration Committee
Responsibilities • Remuneration for ASX Group and non-execu-tive directors
• Remuneration and incentive framework for the CEO, senior executives and all staff
• Achievement against gender diversity objec-tives, including remuneration
Interaction with subsidiary boards • Serves as remuneration committee for the ASX Compliance and clearing and settlement boards in relation to remuneration and perfor-mance management of the Chief Compliance Officer, and the Chief Risk Officer and Group Executive Operations, respectively
• Receives input from the ASX Compliance and clearing and settlement boards as part of the annual performance management process for these senior executives
Remuneration Committee members• Jillian Segal (Chair, retires 1 September 2015) • Rick Holliday-Smith • Heather Ridout (Chair, from 1 September 2015) • Peter Warne
ASX Compliance
ASX’s Board relies on the ASX Compliance board and management to:
• oversee each ASX Group licensees’ compliance, enforcement and conflict handling obligations
• make certain compliance and enforcement decisions delegated to it by ASX Group licensees
• provide services to the ASX Group licensees such that there are adequate arrangements for enforcing (and in the case of a market licensee, monitoring) compliance with the Operating Rules.
The ASX Compliance board charter sets out further details regarding its function and governance.
The Chief Compliance Officer reports directly to the ASX Compliance board on all matters concerned with compliance and enforcement responsibility, including listed company compliance with Listing Rules and participant compliance with Operating Rules.
All ASX Compliance directors are independ-ent non-executives. The biographies of the ASX Compliance board directors are available on ASX’s website.
Ms Segal will retire as a director of ASX Compliance on 1 September 2015. Mrs Ridout will become a director of ASX Compliance from this date.
ASX has implemented robust controls and procedures in the form of Information Handling Standards to manage commercially sensitive infor-mation provided to ASX by other licensed listing and trading venues.
24 ASX Annual Report 2015 | Corporate governance
ASX clearing and settlement subsidiaries
ASX has four subsidiary companies that hold clear-ing and settlement licences required to operate clearing and settlement facilities, and two inter-mediate holding companies. The clearing and settlement boards focus on risk management and oversight of the clearing and settlement operations of the clearing and settlement subsidiaries.
The ASX Board relies on these boards to provide oversight of the management accounts of the clear-ing and settlement subsidiaries, the management of clearing and settlement risk, and compliance with the Financial Stability Standards determined by the Reserve Bank of Australia.
The clearing and settlement boards’ charter sets out further details regarding their functions and governance.
ASX Clear and ASX Settlement are the sole provid-ers of clearing and settlement arrangements for Australia’s cash equities markets. The boards of ASX Clear and ASX Settlement each have three directors who do not sit on the ASX Limited board. These direc-tors meet separately, constituted as the board of ASX Clear and ASX Settlement, to determine matters which require consideration of commercially sensitive information if another market operator or listing venue is obtaining services from, or access to, ASX’s clearing and settlement facilities. These boards also oversee Management’s handling of commercially sensitive information and the provision of services, or access to, other market operators and listing venues. ASX Limited directors do not attend or receive copies of papers or minutes for such meetings. Management attendance is limited to employees given permission by the relevant market operator or listing venue.
All of the directors (other than ASX’s CEO) are independent non-executives. The biographies of the ASX clearing and settlement board directors are available on ASX’s website.
Management
Role and responsibilities of the CEOThe Board has delegated day-to-day management of the ASX Group to the Managing Director and CEO (CEO).
The CEO is responsible for the overall operational and business management of ASX.
He is also responsible for managing ASX’s reputa-tion and profit performance in accordance with the strategy, plans and policies approved by the Board.
Senior ManagementThe senior executives reporting to the CEO are listed on page 31 of the remuneration report.
Roles and responsibilities are defined in specific position descriptions.
The biographies of ASX’s senior executives are available on ASX’s website.
Management performance and remuneration • The Board assesses senior executive perfor-mance on an annual basis
• This assessment is undertaken with the assistance of the CEO and the Remuneration Committee
• Senior executives are assessed against Group and individual performance targets
• The overall performance of the ASX Group, the senior executive’s function and the individual performance of the executive are considered in assessing performance
• The CEO is not present when the ASX Board and committees consider his performance and remuneration
• Further details regarding senior executive and CEO performance and remuneration are set out in the remuneration report which commences on page 26
• A performance evaluation for senior executives took place in FY15 in accordance with this process
Company secretariesThe Board is responsible for the appointment of company secretaries. The ASX Group General Counsel and Company Secretary is accountable directly to the Board, through the Chairman, on all matters to do with the proper functioning of the Board. The names of ASX’s company secretaries and their skills, experience and qualifications are contained on page 36.
Trading by ASX Group directors and employees
ASX’s Group Dealing Policy restricts dealing in securities by ASX directors and employees. Using derivatives and hedging arrangements for unvested ASX securities, or vested ASX securities subject to holding locks, is prohibited. Derivatives or hedging arrangements over vested ASX securities by a director or other senior executive will be publicly disclosed by ASX. This policy was updated in accordance with the latest guidance in FY15.
Risk management
ASX believes effective risk management is key to achieving and maintaining its operational and strategic objectives. The Board is responsible for approving and reviewing the ASX Group risk management policy and strategy. The active iden-tification of risks and implementation of mitiga-tion measures are responsibilities of Management. Material business risks are described in the Operating and Financial Review, which also outlines the Group’s activities, performance during the year, financial position and main business strategies. ASX’s management of economic, environmental and social sustainability risks is discussed in the environment, social and governance section of this report on pages 15 to 17.
The Audit and Risk Committee reviews ASX’s enterprise risk management framework annually and receives quarterly reports about enterprise (strategic and operational) risks, technology and cyber security, internal audit, regulatory assurance and external audit. It also receives reports from the clearing and settlement boards, as well as half-yearly Management certifications.
The clearing and settlement boards review and provide oversight of risk management processes, internal controls and compliance systems in respect of the management of clearing and settlement risks (including clearing counterparty credit risk, treasury investment risk and liquidity risk of ASX Clear and ASX Clear (Futures), and the settle-ment risks within ASX Settlement), as well as the ASX Group’s compliance with the RBA’s Financial Stability Standards. The clearing and settlement boards provide regular reports to the Audit and Risk Committee and minutes of their meetings are provided to the ASX Board (except where they cover matters relating to commercially sensitive information).
Management has established an Enterprise Risk Management Committee to approve risk policies, monitor framework execution and coordinate general risk matters consistent with the Board’s risk appetite, and to oversee ASX’s enterprise risk
ASX Annual Report 2015 | Corporate governance 25
management framework. The risk framework recognises the broad economic and regulatory context the Group operates within and distin-guishes between strategic and operational risks.
Internal control systems and procedures are reviewed by the internal auditor. The General Manager Internal Audit reports to the Audit and Risk Committee, ASX Compliance board, clear-ing and settlement boards, and the CEO for functional audit purposes, and to the Chief Risk Officer for administrative purposes. The Audit and Risk Committee approves the remuneration of the General Manager Internal Audit. The internal audit function is independent of external audit, and has full and free access to the Audit and Risk Committee, ASX employees and ASX records. The Audit and Risk Committee determines internal audit’s scope and budget each year, and monitors Management’s response to internal audit reviews. The Internal Audit charter is available online.
Regulatory Assurance also provides an assurance function. It conducts oversight of the Group by mapping the compliance framework for key obli-gations with a focus on market operator and clear-ing and settlement facility obligations; providing training to the business so that key Australian and international obligations are understood and complied with; undertaking compliance reviews; and reporting to regulators. The General Manager Regulatory Assurance has a direct reporting line to the chairs of the Audit and Risk Committee, ASX Compliance board, and the clearing and settle-ment boards for key licence obligations and conflict handling arrangements, and to the Group General Counsel.
When considering the Audit and Risk Committee’s review of half-year and full-year financial state-ments, the ASX Board receives a statement from the CEO and the Chief Financial Officer affirming that ASX’s financial statements give a true and fair view, in all material respects, of the consolidated entity’s financial position and comply in all mate-rial respects with relevant accounting standards. This statement also confirms that the financial statements are founded on a sound system of
risk management and internal control, and that the system is operating effectively for financial reporting risks.
In a separate statement, the CEO and Chief Risk Officer also confirm to the Board that ASX’s risk management and internal control systems are operating effectively for material business risks, and that nothing has occurred since period-end that would materially change the position.
ASX’s policies on oversight and management of material business risks are summarised online.
Continuous disclosureASX’s Listing Rule 3.1 Policy sets out how ASX complies with its disclosure obligations. This policy was reviewed and updated in accordance with the latest guidance in FY15.
Code of Conduct
ASX’s Code of Conduct and Anti-Bribery and Corruption, and Fraud Control policies promote ethical and responsible decision-making by all directors and employees of the ASX Group. Employees are required to act with high stand-ards of honesty, integrity, fairness and equity in all aspects of their employment. There are formal escalation and grievance procedures. All forms of facilitation payments are forbidden.
During FY15, ASX implemented a Gift and Entertainment Policy for employees and direc-tors. All gifts above $200 (for staff) and $500 (for directors) must be reported. The Audit and Risk Committee receives periodic reports.
The Whistleblower Protection Policy supports employees who report non-compliant or suspi-cious and unethical conduct by other employees. This formalises ASX’s commitment to protect the confidentiality and position of employees wishing to raise matters that affect the integrity of ASX.
The Audit and Risk Committee receives regular reporting on these matters.
Diversity
ASX’s Diversity Policy Statement describes how ASX promotes diversity in the workforce. The diversity objectives adopted by the Board and performance in FY15 are set out on page 16.
Shareholder engagement
ASX’s shareholder communications policy sets out ASX’s aim to:
• communicate with shareholders concisely, accurately and in plain language
• deal with shareholders fairly, transparently and openly.
All market sensitive disclosure, including any earn-ings or other guidance, is first made available on the ASX Market Announcements Platform. ASX does not selectively brief or provide broker forecasts to analysts or investors.
ASX uses a number of channels and technologies, including webcasting and social media, to commu-nicate widely and promptly. It enables shareholders to participate in shareholder meetings, and deals with shareholder enquiries respectfully and quickly.
AGMASX’s AGM will be held on Wednesday 30 September 2015 at 10am Australian Eastern Standard Time, in the ASX Auditorium, lower ground floor, Exchange Square, 18 Bridge Street, Sydney. Further details about ASX’s 2015 AGM are provided on page 72.
Payments to political parties
ASX actively engages with government and polit-ical decision-makers to help them understand the role ASX performs, the investments it is making to build world-class infrastructure, and the globally competitive and dynamic market environment in which it operates.
ASX has a responsibility to its shareholders, customers and staff to proactively and clearly communicate its position on matters of public policy and the opportunities and challenges facing the business.
During FY15, ASX paid $100,000 in membership fees to each of the Liberal Party Australian Business Network and the Federal Labor Business Forum. ASX’s membership of these business networks provides an opportunity to engage with a wide cross-section of policy and business decision-mak-ers. ASX made no other payments to political parties during FY15.
All payments to political parties are disclosed by ASX and must be approved by the CEO and the Group General Counsel in line with the policy and limits set by the Board.
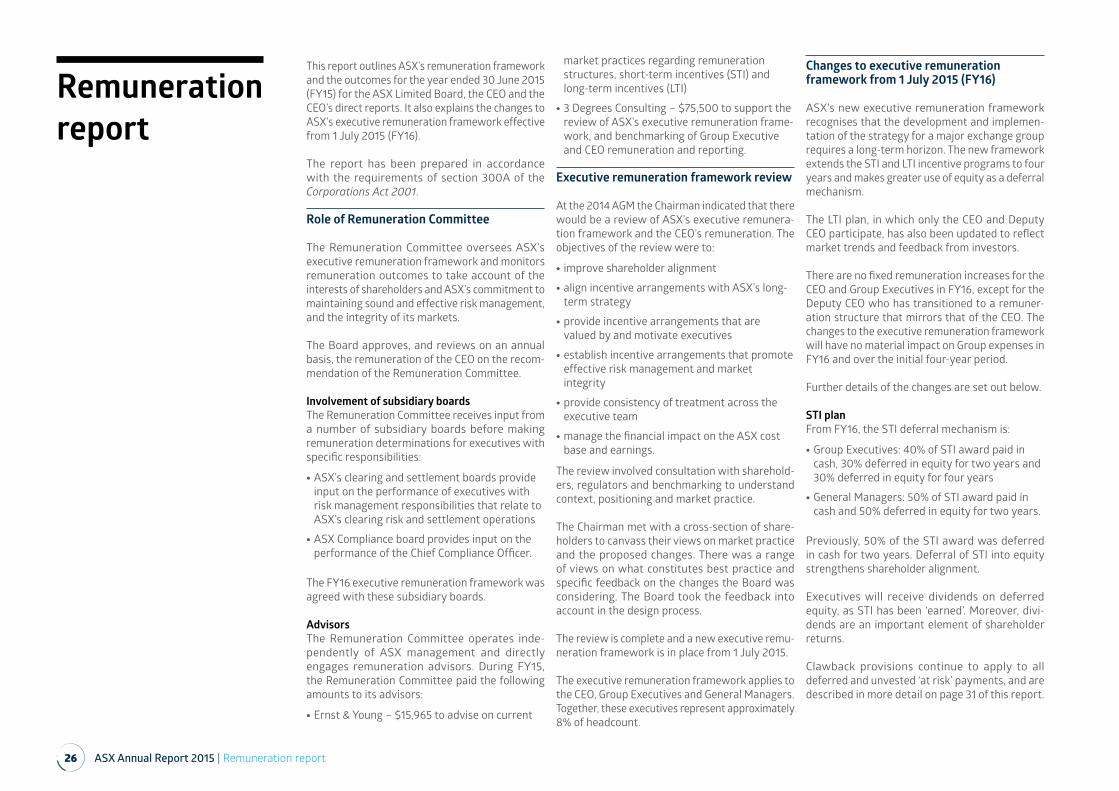
26 ASX Annual Report 2015 | Remuneration report
Remuneration report
This report outlines ASX’s remuneration framework and the outcomes for the year ended 30 June 2015 (FY15) for the ASX Limited Board, the CEO and the CEO’s direct reports. It also explains the changes to ASX’s executive remuneration framework effective from 1 July 2015 (FY16).
The report has been prepared in accordance with the requirements of section 300A of the Corporations Act 2001.
Role of Remuneration Committee
The Remuneration Committee oversees ASX’s executive remuneration framework and monitors remuneration outcomes to take account of the interests of shareholders and ASX’s commitment to maintaining sound and effective risk management, and the integrity of its markets.
The Board approves, and reviews on an annual basis, the remuneration of the CEO on the recom-mendation of the Remuneration Committee.
Involvement of subsidiary boards The Remuneration Committee receives input from a number of subsidiary boards before making remuneration determinations for executives with specific responsibilities:
• ASX’s clearing and settlement boards provide input on the performance of executives with risk management responsibilities that relate to ASX’s clearing risk and settlement operations
• ASX Compliance board provides input on the performance of the Chief Compliance Officer.
The FY16 executive remuneration framework was agreed with these subsidiary boards.
AdvisorsThe Remuneration Committee operates inde-pendently of ASX management and directly engages remuneration advisors. During FY15, the Remuneration Committee paid the following amounts to its advisors:
• Ernst & Young – $15,965 to advise on current
market practices regarding remuneration structures, short-term incentives (STI) and long-term incentives (LTI)
• 3 Degrees Consulting – $75,500 to support the review of ASX’s executive remuneration frame-work, and benchmarking of Group Executive and CEO remuneration and reporting.
Executive remuneration framework review
At the 2014 AGM the Chairman indicated that there would be a review of ASX’s executive remunera-tion framework and the CEO’s remuneration. The objectives of the review were to:
• improve shareholder alignment
• align incentive arrangements with ASX’s long-term strategy
• provide incentive arrangements that are valued by and motivate executives
• establish incentive arrangements that promote effective risk management and market integrity
• provide consistency of treatment across the executive team
• manage the financial impact on the ASX cost base and earnings.
The review involved consultation with sharehold-ers, regulators and benchmarking to understand context, positioning and market practice.
The Chairman met with a cross-section of share-holders to canvass their views on market practice and the proposed changes. There was a range of views on what constitutes best practice and specific feedback on the changes the Board was considering. The Board took the feedback into account in the design process.
The review is complete and a new executive remu-neration framework is in place from 1 July 2015.
The executive remuneration framework applies to the CEO, Group Executives and General Managers. Together, these executives represent approximately 8% of headcount.
Changes to executive remuneration framework from 1 July 2015 (FY16)
ASX’s new executive remuneration framework recognises that the development and implemen-tation of the strategy for a major exchange group requires a long-term horizon. The new framework extends the STI and LTI incentive programs to four years and makes greater use of equity as a deferral mechanism.
The LTI plan, in which only the CEO and Deputy CEO participate, has also been updated to reflect market trends and feedback from investors.
There are no fixed remuneration increases for the CEO and Group Executives in FY16, except for the Deputy CEO who has transitioned to a remuner-ation structure that mirrors that of the CEO. The changes to the executive remuneration framework will have no material impact on Group expenses in FY16 and over the initial four-year period.
Further details of the changes are set out below.
STI plan From FY16, the STI deferral mechanism is:
• Group Executives: 40% of STI award paid in cash, 30% deferred in equity for two years and 30% deferred in equity for four years
• General Managers: 50% of STI award paid in cash and 50% deferred in equity for two years.
Previously, 50% of the STI award was deferred in cash for two years. Deferral of STI into equity strengthens shareholder alignment.
Executives will receive dividends on deferred equity, as STI has been ‘earned’. Moreover, divi-dends are an important element of shareholder returns.
Clawback provisions continue to apply to all deferred and unvested ‘at risk’ payments, and are described in more detail on page 31 of this report.
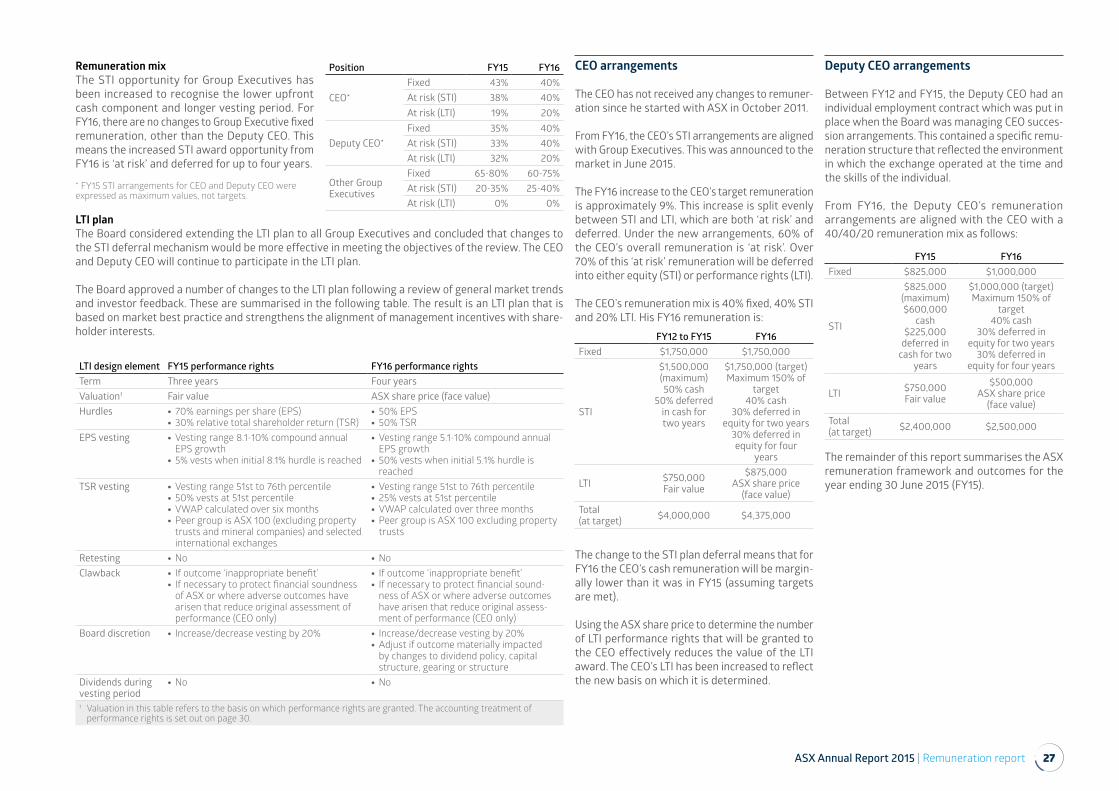
ASX Annual Report 2015 | Remuneration report 27
Remuneration mix The STI opportunity for Group Executives has been increased to recognise the lower upfront cash component and longer vesting period. For FY16, there are no changes to Group Executive fixed remuneration, other than the Deputy CEO. This means the increased STI award opportunity from FY16 is ‘at risk’ and deferred for up to four years.
* FY15 STI arrangements for CEO and Deputy CEO were expressed as maximum values, not targets.
Position FY15 FY16
CEO*Fixed 43% 40%At risk (STI) 38% 40%At risk (LTI) 19% 20%
Deputy CEO*Fixed 35% 40%At risk (STI) 33% 40%At risk (LTI) 32% 20%
Other Group Executives
Fixed 65-80% 60-75%At risk (STI) 20-35% 25-40%At risk (LTI) 0% 0%
CEO arrangements
The CEO has not received any changes to remuner-ation since he started with ASX in October 2011.
From FY16, the CEO’s STI arrangements are aligned with Group Executives. This was announced to the market in June 2015.
The FY16 increase to the CEO’s target remuneration is approximately 9%. This increase is split evenly between STI and LTI, which are both ‘at risk’ and deferred. Under the new arrangements, 60% of the CEO’s overall remuneration is ‘at risk’. Over 70% of this ‘at risk’ remuneration will be deferred into either equity (STI) or performance rights (LTI).
The CEO’s remuneration mix is 40% fixed, 40% STI and 20% LTI. His FY16 remuneration is:
FY12 to FY15 FY16Fixed $1,750,000 $1,750,000
STI
$1,500,000 (maximum)50% cash
50% deferred in cash for two years
$1,750,000 (target) Maximum 150% of
target 40% cash
30% deferred in equity for two years
30% deferred in equity for four
years
LTI $750,000Fair value
$875,000ASX share price
(face value)Total(at target) $4,000,000 $4,375,000
The change to the STI plan deferral means that for FY16 the CEO’s cash remuneration will be margin-ally lower than it was in FY15 (assuming targets are met).
Using the ASX share price to determine the number of LTI performance rights that will be granted to the CEO effectively reduces the value of the LTI award. The CEO’s LTI has been increased to reflect the new basis on which it is determined.
Deputy CEO arrangements
Between FY12 and FY15, the Deputy CEO had an individual employment contract which was put in place when the Board was managing CEO succes-sion arrangements. This contained a specific remu-neration structure that reflected the environment in which the exchange operated at the time and the skills of the individual.
From FY16, the Deputy CEO’s remuneration arrangements are aligned with the CEO with a 40/40/20 remuneration mix as follows:
FY15 FY16Fixed $825,000 $1,000,000
STI
$825,000 (maximum)$600,000
cash$225,000
deferred in cash for two
years
$1,000,000 (target)Maximum 150% of
target40% cash
30% deferred in equity for two years
30% deferred in equity for four years
LTI $750,000Fair value
$500,000ASX share price
(face value)Total (at target) $2,400,000 $2,500,000
The remainder of this report summarises the ASX remuneration framework and outcomes for the year ending 30 June 2015 (FY15).
LTI design element FY15 performance rights FY16 performance rightsTerm Three years Four yearsValuation1 Fair value ASX share price (face value)Hurdles • 70% earnings per share (EPS)
• 30% relative total shareholder return (TSR) • 50% EPS • 50% TSR
EPS vesting • Vesting range 8.1-10% compound annual EPS growth
• 5% vests when initial 8.1% hurdle is reached
• Vesting range 5.1-10% compound annual EPS growth
• 50% vests when initial 5.1% hurdle is reached
TSR vesting • Vesting range 51st to 76th percentile • 50% vests at 51st percentile • VWAP calculated over six months • Peer group is ASX 100 (excluding property trusts and mineral companies) and selected international exchanges
• Vesting range 51st to 76th percentile • 25% vests at 51st percentile • VWAP calculated over three months • Peer group is ASX 100 excluding property trusts
Retesting • No • NoClawback • If outcome ‘inappropriate benefit’
• If necessary to protect financial soundness of ASX or where adverse outcomes have arisen that reduce original assessment of performance (CEO only)
• If outcome ‘inappropriate benefit’ • If necessary to protect financial sound-ness of ASX or where adverse outcomes have arisen that reduce original assess-ment of performance (CEO only)
Board discretion • Increase/decrease vesting by 20% • Increase/decrease vesting by 20% • Adjust if outcome materially impacted by changes to dividend policy, capital structure, gearing or structure
Dividends during vesting period
• No • No
1 Valuation in this table refers to the basis on which performance rights are granted. The accounting treatment of performance rights is set out on page 30.
LTI plan The Board considered extending the LTI plan to all Group Executives and concluded that changes to the STI deferral mechanism would be more effective in meeting the objectives of the review. The CEO and Deputy CEO will continue to participate in the LTI plan.
The Board approved a number of changes to the LTI plan following a review of general market trends and investor feedback. These are summarised in the following table. The result is an LTI plan that is based on market best practice and strengthens the alignment of management incentives with share-holder interests.
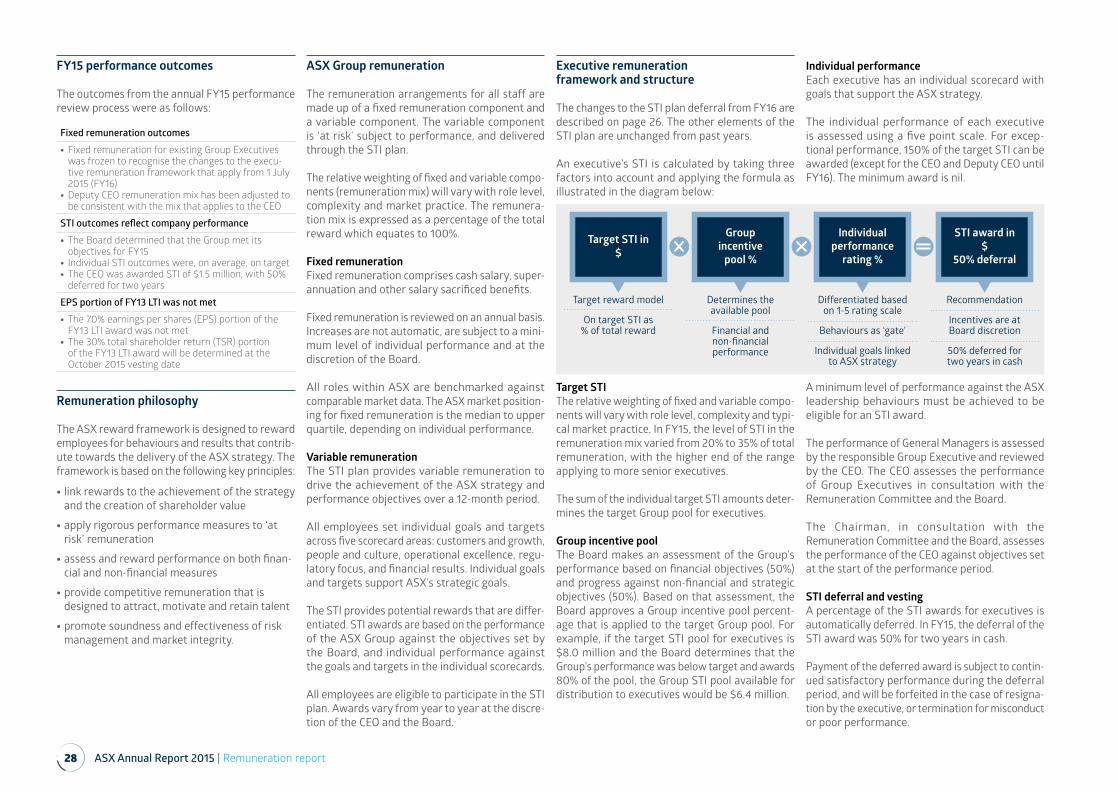
28 ASX Annual Report 2015 | Remuneration report
FY15 performance outcomes
The outcomes from the annual FY15 performance review process were as follows:
Fixed remuneration outcomes
• Fixed remuneration for existing Group Executives was frozen to recognise the changes to the execu-tive remuneration framework that apply from 1 July 2015 (FY16)
• Deputy CEO remuneration mix has been adjusted to be consistent with the mix that applies to the CEO
STI outcomes reflect company performance
• The Board determined that the Group met its objectives for FY15
• Individual STI outcomes were, on average, on target • The CEO was awarded STI of $1.5 million, with 50% deferred for two years
EPS portion of FY13 LTI was not met
• The 70% earnings per shares (EPS) portion of the FY13 LTI award was not met
• The 30% total shareholder return (TSR) portion of the FY13 LTI award will be determined at the October 2015 vesting date
Remuneration philosophy
The ASX reward framework is designed to reward employees for behaviours and results that contrib-ute towards the delivery of the ASX strategy. The framework is based on the following key principles:
• link rewards to the achievement of the strategy and the creation of shareholder value
• apply rigorous performance measures to ‘at risk’ remuneration
• assess and reward performance on both finan-cial and non-financial measures
• provide competitive remuneration that is designed to attract, motivate and retain talent
• promote soundness and effectiveness of risk management and market integrity.
ASX Group remuneration
The remuneration arrangements for all staff are made up of a fixed remuneration component and a variable component. The variable component is ‘at risk’ subject to performance, and delivered through the STI plan.
The relative weighting of fixed and variable compo-nents (remuneration mix) will vary with role level, complexity and market practice. The remunera-tion mix is expressed as a percentage of the total reward which equates to 100%.
Fixed remunerationFixed remuneration comprises cash salary, super-annuation and other salary sacrificed benefits.
Fixed remuneration is reviewed on an annual basis. Increases are not automatic, are subject to a mini-mum level of individual performance and at the discretion of the Board.
All roles within ASX are benchmarked against comparable market data. The ASX market position-ing for fixed remuneration is the median to upper quartile, depending on individual performance.
Variable remunerationThe STI plan provides variable remuneration to drive the achievement of the ASX strategy and performance objectives over a 12-month period.
All employees set individual goals and targets across five scorecard areas: customers and growth, people and culture, operational excellence, regu-latory focus, and financial results. Individual goals and targets support ASX’s strategic goals.
The STI provides potential rewards that are differ-entiated. STI awards are based on the performance of the ASX Group against the objectives set by the Board, and individual performance against the goals and targets in the individual scorecards.
All employees are eligible to participate in the STI plan. Awards vary from year to year at the discre-tion of the CEO and the Board.
Executive remuneration framework and structure
The changes to the STI plan deferral from FY16 are described on page 26. The other elements of the STI plan are unchanged from past years.
An executive’s STI is calculated by taking three factors into account and applying the formula as illustrated in the diagram below:
Target STIThe relative weighting of fixed and variable compo-nents will vary with role level, complexity and typi-cal market practice. In FY15, the level of STI in the remuneration mix varied from 20% to 35% of total remuneration, with the higher end of the range applying to more senior executives.
The sum of the individual target STI amounts deter-mines the target Group pool for executives.
Group incentive poolThe Board makes an assessment of the Group’s performance based on financial objectives (50%) and progress against non-financial and strategic objectives (50%). Based on that assessment, the Board approves a Group incentive pool percent-age that is applied to the target Group pool. For example, if the target STI pool for executives is $8.0 million and the Board determines that the Group’s performance was below target and awards 80% of the pool, the Group STI pool available for distribution to executives would be $6.4 million.
Individual performanceEach executive has an individual scorecard with goals that support the ASX strategy.
The individual performance of each executive is assessed using a five point scale. For excep-tional performance, 150% of the target STI can be awarded (except for the CEO and Deputy CEO until FY16). The minimum award is nil.
A minimum level of performance against the ASX leadership behaviours must be achieved to be eligible for an STI award.
The performance of General Managers is assessed by the responsible Group Executive and reviewed by the CEO. The CEO assesses the performance of Group Executives in consultation with the Remuneration Committee and the Board.
The Chairman, in consultation with the Remuneration Committee and the Board, assesses the performance of the CEO against objectives set at the start of the performance period.
STI deferral and vestingA percentage of the STI awards for executives is automatically deferred. In FY15, the deferral of the STI award was 50% for two years in cash.
Payment of the deferred award is subject to contin-ued satisfactory performance during the deferral period, and will be forfeited in the case of resigna-tion by the executive, or termination for misconduct or poor performance.
Target reward model
On target STI as% of total reward
Determines the available pool
Financial andnon-financial performance
Differentiated basedon 1-5 rating scale
Behaviours as ‘gate’
Individual goals linked to ASX strategy
Recommendation
Incentives are atBoard discretion
50% deferred fortwo years in cash
Target STI in$
Groupincentive
pool %
Individualperformance
rating %
STI award in$
50% deferral
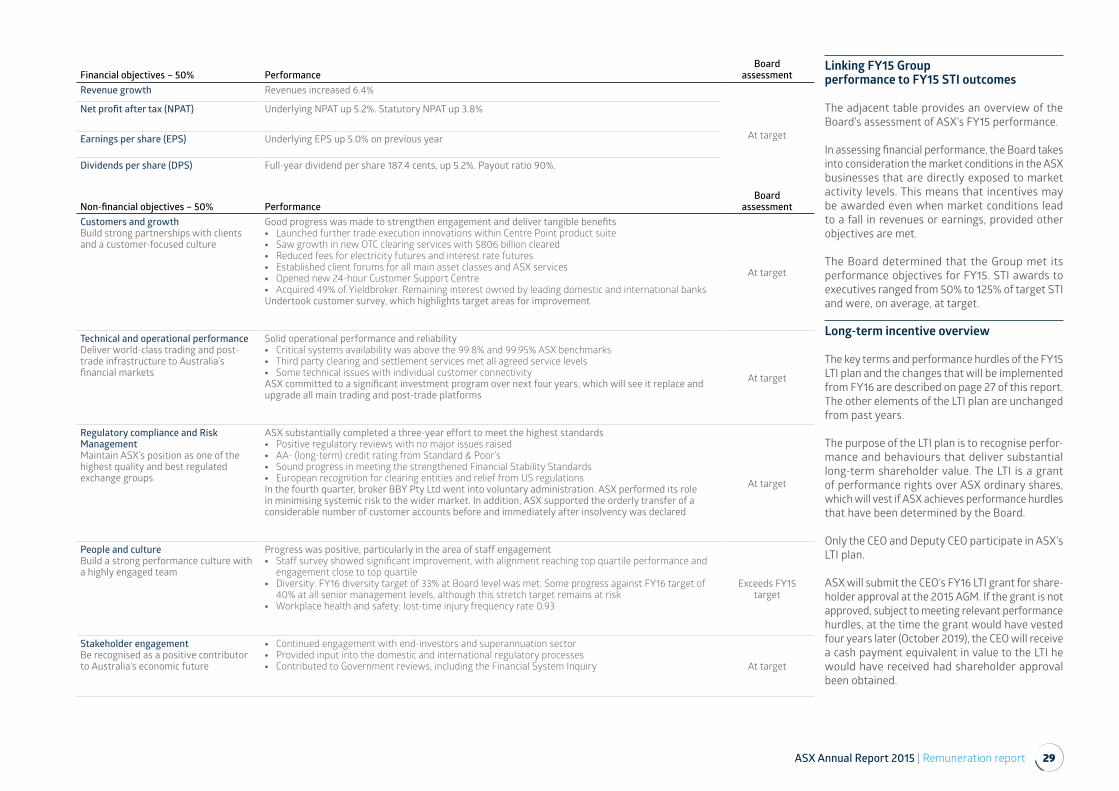
ASX Annual Report 2015 | Remuneration report 29
Financial objectives – 50% PerformanceBoard
assessmentRevenue growth Revenues increased 6.4%
At target
Net profit after tax (NPAT) Underlying NPAT up 5.2%. Statutory NPAT up 3.8%
Earnings per share (EPS) Underlying EPS up 5.0% on previous year
Dividends per share (DPS) Full-year dividend per share 187.4 cents, up 5.2%. Payout ratio 90%.
Non-financial objectives – 50% PerformanceBoard
assessmentCustomers and growthBuild strong partnerships with clients and a customer-focused culture
Good progress was made to strengthen engagement and deliver tangible benefits • Launched further trade execution innovations within Centre Point product suite • Saw growth in new OTC clearing services with $806 billion cleared • Reduced fees for electricity futures and interest rate futures • Established client forums for all main asset classes and ASX services • Opened new 24-hour Customer Support Centre • Acquired 49% of Yieldbroker. Remaining interest owned by leading domestic and international banks
Undertook customer survey, which highlights target areas for improvement
At target
Technical and operational performanceDeliver world-class trading and post-trade infrastructure to Australia’s financial markets
Solid operational performance and reliability • Critical systems availability was above the 99.8% and 99.95% ASX benchmarks • Third party clearing and settlement services met all agreed service levels • Some technical issues with individual customer connectivity
ASX committed to a significant investment program over next four years, which will see it replace and upgrade all main trading and post-trade platforms
At target
Regulatory compliance and Risk ManagementMaintain ASX’s position as one of the highest quality and best regulated exchange groups
ASX substantially completed a three-year effort to meet the highest standards • Positive regulatory reviews with no major issues raised • AA- (long-term) credit rating from Standard & Poor’s • Sound progress in meeting the strengthened Financial Stability Standards • European recognition for clearing entities and relief from US regulations
In the fourth quarter, broker BBY Pty Ltd went into voluntary administration. ASX performed its role in minimising systemic risk to the wider market. In addition, ASX supported the orderly transfer of a considerable number of customer accounts before and immediately after insolvency was declared
At target
People and cultureBuild a strong performance culture with a highly engaged team
Progress was positive, particularly in the area of staff engagement • Staff survey showed significant improvement, with alignment reaching top quartile performance and
engagement close to top quartile • Diversity: FY16 diversity target of 33% at Board level was met. Some progress against FY16 target of
40% at all senior management levels, although this stretch target remains at risk • Workplace health and safety: lost-time injury frequency rate 0.93
Exceeds FY15 target
Stakeholder engagementBe recognised as a positive contributor to Australia’s economic future
• Continued engagement with end-investors and superannuation sector • Provided input into the domestic and international regulatory processes • Contributed to Government reviews, including the Financial System Inquiry At target
Linking FY15 Group performance to FY15 STI outcomes
The adjacent table provides an overview of the Board’s assessment of ASX’s FY15 performance.
In assessing financial performance, the Board takes into consideration the market conditions in the ASX businesses that are directly exposed to market activity levels. This means that incentives may be awarded even when market conditions lead to a fall in revenues or earnings, provided other objectives are met.
The Board determined that the Group met its performance objectives for FY15. STI awards to executives ranged from 50% to 125% of target STI and were, on average, at target.
Long-term incentive overview
The key terms and performance hurdles of the FY15 LTI plan and the changes that will be implemented from FY16 are described on page 27 of this report. The other elements of the LTI plan are unchanged from past years.
The purpose of the LTI plan is to recognise perfor-mance and behaviours that deliver substantial long-term shareholder value. The LTI is a grant of performance rights over ASX ordinary shares, which will vest if ASX achieves performance hurdles that have been determined by the Board.
Only the CEO and Deputy CEO participate in ASX’s LTI plan.
ASX will submit the CEO’s FY16 LTI grant for share-holder approval at the 2015 AGM. If the grant is not approved, subject to meeting relevant performance hurdles, at the time the grant would have vested four years later (October 2019), the CEO will receive a cash payment equivalent in value to the LTI he would have received had shareholder approval been obtained.
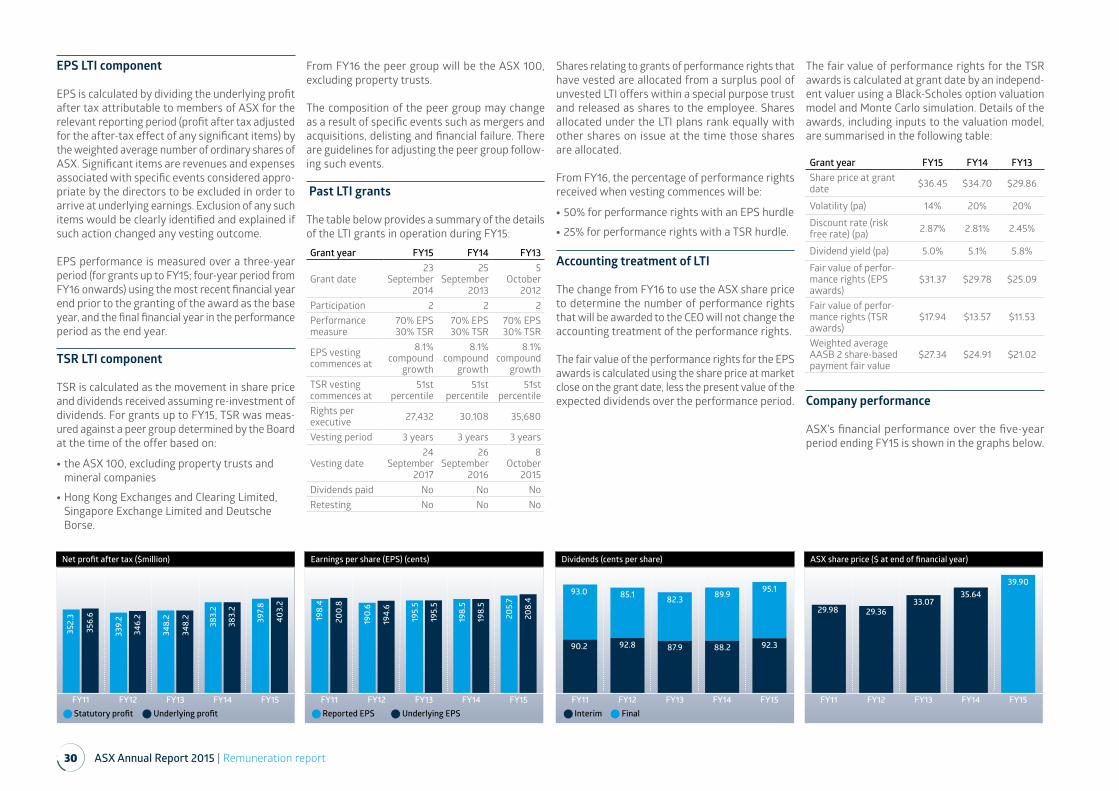
30 ASX Annual Report 2015 | Remuneration report
EPS LTI component
EPS is calculated by dividing the underlying profit after tax attributable to members of ASX for the relevant reporting period (profit after tax adjusted for the after-tax effect of any significant items) by the weighted average number of ordinary shares of ASX. Significant items are revenues and expenses associated with specific events considered appro-priate by the directors to be excluded in order to arrive at underlying earnings. Exclusion of any such items would be clearly identified and explained if such action changed any vesting outcome.
EPS performance is measured over a three-year period (for grants up to FY15; four-year period from FY16 onwards) using the most recent financial year end prior to the granting of the award as the base year, and the final financial year in the performance period as the end year.
TSR LTI component
TSR is calculated as the movement in share price and dividends received assuming re-investment of dividends. For grants up to FY15, TSR was meas-ured against a peer group determined by the Board at the time of the offer based on:
• the ASX 100, excluding property trusts and mineral companies
• Hong Kong Exchanges and Clearing Limited, Singapore Exchange Limited and Deutsche Borse.
From FY16 the peer group will be the ASX 100, excluding property trusts.
The composition of the peer group may change as a result of specific events such as mergers and acquisitions, delisting and financial failure. There are guidelines for adjusting the peer group follow-ing such events.
Past LTI grants
The table below provides a summary of the details of the LTI grants in operation during FY15:Grant year FY15 FY14 FY13
Grant date23
September 2014
25 September
2013
5 October
2012Participation 2 2 2Performance measure
70% EPS30% TSR
70% EPS30% TSR
70% EPS30% TSR
EPS vesting commences at
8.1% compound
growth
8.1% compound
growth
8.1% compound
growthTSR vesting commences at
51st percentile
51st percentile
51st percentile
Rights per executive 27,432 30,108 35,680
Vesting period 3 years 3 years 3 years
Vesting date24
September 2017
26 September
2016
8 October
2015Dividends paid No No NoRetesting No No No
Shares relating to grants of performance rights that have vested are allocated from a surplus pool of unvested LTI offers within a special purpose trust and released as shares to the employee. Shares allocated under the LTI plans rank equally with other shares on issue at the time those shares are allocated.
From FY16, the percentage of performance rights received when vesting commences will be:
• 50% for performance rights with an EPS hurdle
• 25% for performance rights with a TSR hurdle.
Accounting treatment of LTI
The change from FY16 to use the ASX share price to determine the number of performance rights that will be awarded to the CEO will not change the accounting treatment of the performance rights.
The fair value of the performance rights for the EPS awards is calculated using the share price at market close on the grant date, less the present value of the expected dividends over the performance period.
The fair value of performance rights for the TSR awards is calculated at grant date by an independ-ent valuer using a Black-Scholes option valuation model and Monte Carlo simulation. Details of the awards, including inputs to the valuation model, are summarised in the following table:
Grant year FY15 FY14 FY13Share price at grant date $36.45 $34.70 $29.86
Volatility (pa) 14% 20% 20%
Discount rate (risk free rate) (pa) 2.87% 2.81% 2.45%
Dividend yield (pa) 5.0% 5.1% 5.8%
Fair value of perfor-mance rights (EPS awards)
$31.37 $29.78 $25.09
Fair value of perfor-mance rights (TSR awards)
$17.94 $13.57 $11.53
Weighted average AASB 2 share-based payment fair value
$27.34 $24.91 $21.02
Company performance
ASX’s financial performance over the five-year period ending FY15 is shown in the graphs below.
Earnings per share (EPS) (cents)
FY15FY14FY13FY12FY11
198.
4
190.
6
195.
5
198.
5
205.
7
200.
8
194.
6
195.
5
198.
5
208.
4
Reported EPS Underlying EPSStatutory profit Underlying profit
Net profit after tax ($million)
FY15FY14FY13FY12FY11
352.
3
339.
2
348.
2
383.
2
397
.8
356.
6
346.
2
348.
2
383.
2
403.
2
Dividends (cents per share)
FY15FY14FY13FY12FY11
93.0 85.1 82.3 89.9 95.1
90.2 92.8 87.9 88.2 92.3
Interim Final
ASX share price ($ at end of financial year)
FY15FY14FY13FY11
29.98 29.3633.07
35.6439.90
FY12
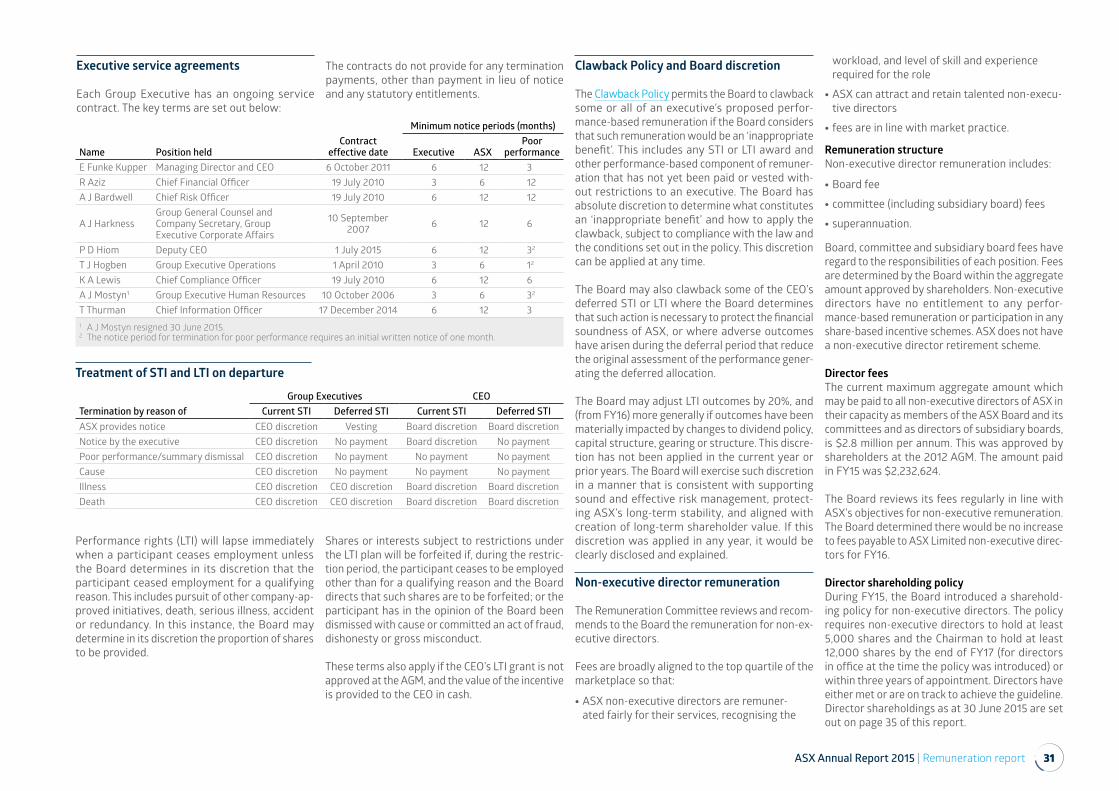
ASX Annual Report 2015 | Remuneration report 31
Performance rights (LTI) will lapse immediately when a participant ceases employment unless the Board determines in its discretion that the participant ceased employment for a qualifying reason. This includes pursuit of other company-ap-proved initiatives, death, serious illness, accident or redundancy. In this instance, the Board may determine in its discretion the proportion of shares to be provided.
Shares or interests subject to restrictions under the LTI plan will be forfeited if, during the restric-tion period, the participant ceases to be employed other than for a qualifying reason and the Board directs that such shares are to be forfeited; or the participant has in the opinion of the Board been dismissed with cause or committed an act of fraud, dishonesty or gross misconduct.
These terms also apply if the CEO’s LTI grant is not approved at the AGM, and the value of the incentive is provided to the CEO in cash.
Clawback Policy and Board discretion
The Clawback Policy permits the Board to clawback some or all of an executive’s proposed perfor-mance-based remuneration if the Board considers that such remuneration would be an ‘inappropriate benefit’. This includes any STI or LTI award and other performance-based component of remuner-ation that has not yet been paid or vested with-out restrictions to an executive. The Board has absolute discretion to determine what constitutes an ‘inappropriate benefit’ and how to apply the clawback, subject to compliance with the law and the conditions set out in the policy. This discretion can be applied at any time.
The Board may also clawback some of the CEO’s deferred STI or LTI where the Board determines that such action is necessary to protect the financial soundness of ASX, or where adverse outcomes have arisen during the deferral period that reduce the original assessment of the performance gener-ating the deferred allocation.
The Board may adjust LTI outcomes by 20%, and (from FY16) more generally if outcomes have been materially impacted by changes to dividend policy, capital structure, gearing or structure. This discre-tion has not been applied in the current year or prior years. The Board will exercise such discretion in a manner that is consistent with supporting sound and effective risk management, protect-ing ASX’s long-term stability, and aligned with creation of long-term shareholder value. If this discretion was applied in any year, it would be clearly disclosed and explained.
Non-executive director remuneration
The Remuneration Committee reviews and recom-mends to the Board the remuneration for non-ex-ecutive directors.
Fees are broadly aligned to the top quartile of the marketplace so that:
• ASX non-executive directors are remuner-ated fairly for their services, recognising the
workload, and level of skill and experience required for the role
• ASX can attract and retain talented non-execu-tive directors
• fees are in line with market practice.
Remuneration structureNon-executive director remuneration includes:
• Board fee
• committee (including subsidiary board) fees
• superannuation.
Board, committee and subsidiary board fees have regard to the responsibilities of each position. Fees are determined by the Board within the aggregate amount approved by shareholders. Non-executive directors have no entitlement to any perfor-mance-based remuneration or participation in any share-based incentive schemes. ASX does not have a non-executive director retirement scheme.
Director feesThe current maximum aggregate amount which may be paid to all non-executive directors of ASX in their capacity as members of the ASX Board and its committees and as directors of subsidiary boards, is $2.8 million per annum. This was approved by shareholders at the 2012 AGM. The amount paid in FY15 was $2,232,624.
The Board reviews its fees regularly in line with ASX’s objectives for non-executive remuneration. The Board determined there would be no increase to fees payable to ASX Limited non-executive direc-tors for FY16.
Director shareholding policyDuring FY15, the Board introduced a sharehold-ing policy for non-executive directors. The policy requires non-executive directors to hold at least 5,000 shares and the Chairman to hold at least 12,000 shares by the end of FY17 (for directors in office at the time the policy was introduced) or within three years of appointment. Directors have either met or are on track to achieve the guideline. Director shareholdings as at 30 June 2015 are set out on page 35 of this report.
Treatment of STI and LTI on departure
Termination by reason of Group Executives CEO
Current STI Deferred STI Current STI Deferred STIASX provides notice CEO discretion Vesting Board discretion Board discretion Notice by the executive CEO discretion No payment Board discretion No payment Poor performance/summary dismissal CEO discretion No payment No payment No payment Cause CEO discretion No payment No payment No payment Illness CEO discretion CEO discretion Board discretion Board discretion Death CEO discretion CEO discretion Board discretion Board discretion
Name Position heldContract
effective date
Minimum notice periods (months)
Executive ASXPoor
performanceE Funke Kupper Managing Director and CEO 6 October 2011 6 12 3R Aziz Chief Financial Officer 19 July 2010 3 6 12A J Bardwell Chief Risk Officer 19 July 2010 6 12 12
A J HarknessGroup General Counsel and Company Secretary, Group Executive Corporate Affairs
10 September 2007 6 12 6
P D Hiom Deputy CEO 1 July 2015 6 12 32
T J Hogben Group Executive Operations 1 April 2010 3 6 12
K A Lewis Chief Compliance Officer 19 July 2010 6 12 6A J Mostyn1 Group Executive Human Resources 10 October 2006 3 6 32
T Thurman Chief Information Officer 17 December 2014 6 12 31 A J Mostyn resigned 30 June 2015.2 The notice period for termination for poor performance requires an initial written notice of one month.
Executive service agreements
Each Group Executive has an ongoing service contract. The key terms are set out below:
The contracts do not provide for any termination payments, other than payment in lieu of notice and any statutory entitlements.
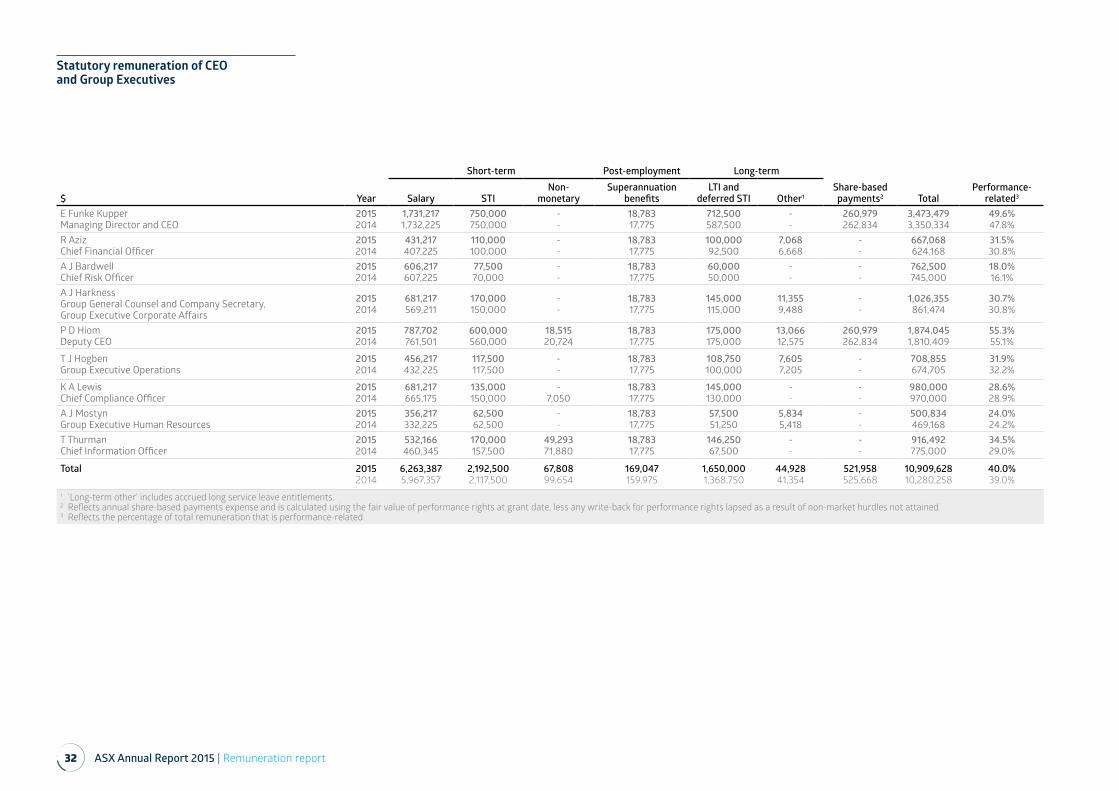
32 ASX Annual Report 2015 | Remuneration report
Statutory remuneration of CEO and Group Executives
$ Year
Short-term Post-employment Long-termShare-based payments2 Total
Performance-related3Salary STI
Non-monetary
Superannuation benefits
LTI and deferred STI Other1
E Funke KupperManaging Director and CEO
20152014
1,731,2171,732,225
750,000750,000
--
18,78317,775
712,500587,500
--
260,979262,834
3,473,4793,350,334
49.6%47.8%
R AzizChief Financial Officer
20152014
431,217407,225
110,000100,000
--
18,78317,775
100,00092,500
7,0686,668
--
667,068624,168
31.5%30.8%
A J BardwellChief Risk Officer
20152014
606,217607,225
77,50070,000
--
18,78317,775
60,00050,000
--
--
762,500745,000
18.0%16.1%
A J HarknessGroup General Counsel and Company Secretary, Group Executive Corporate Affairs
20152014
681,217569,211
170,000150,000
--
18,78317,775
145,000115,000
11,3559,488
--
1,026,355861,474
30.7%30.8%
P D HiomDeputy CEO
20152014
787,702761,501
600,000560,000
18,51520,724
18,78317,775
175,000175,000
13,06612,575
260,979262,834
1,874,0451,810,409
55.3%55.1%
T J HogbenGroup Executive Operations
20152014
456,217432,225
117,500117,500
--
18,78317,775
108,750100,000
7,6057,205
--
708,855674,705
31.9%32.2%
K A LewisChief Compliance Officer
20152014
681,217665,175
135,000150,000
-7,050
18,78317,775
145,000130,000
--
--
980,000970,000
28.6%28.9%
A J MostynGroup Executive Human Resources
20152014
356,217332,225
62,50062,500
--
18,78317,775
57,50051,250
5,8345,418
--
500,834469,168
24.0%24.2%
T ThurmanChief Information Officer
20152014
532,166460,345
170,000157,500
49,29371,880
18,78317,775
146,25067,500
--
--
916,492775,000
34.5%29.0%
Total 20152014
6,263,3875,967,357
2,192,5002,117,500
67,80899,654
169,047159,975
1,650,0001,368,750
44,92841,354
521,958525,668
10,909,62810,280,258
40.0%39.0%
1 ‘Long-term other’ includes accrued long service leave entitlements.2 Reflects annual share-based payments expense and is calculated using the fair value of performance rights at grant date, less any write-back for performance rights lapsed as a result of non-market hurdles not attained.3 Reflects the percentage of total remuneration that is performance-related.
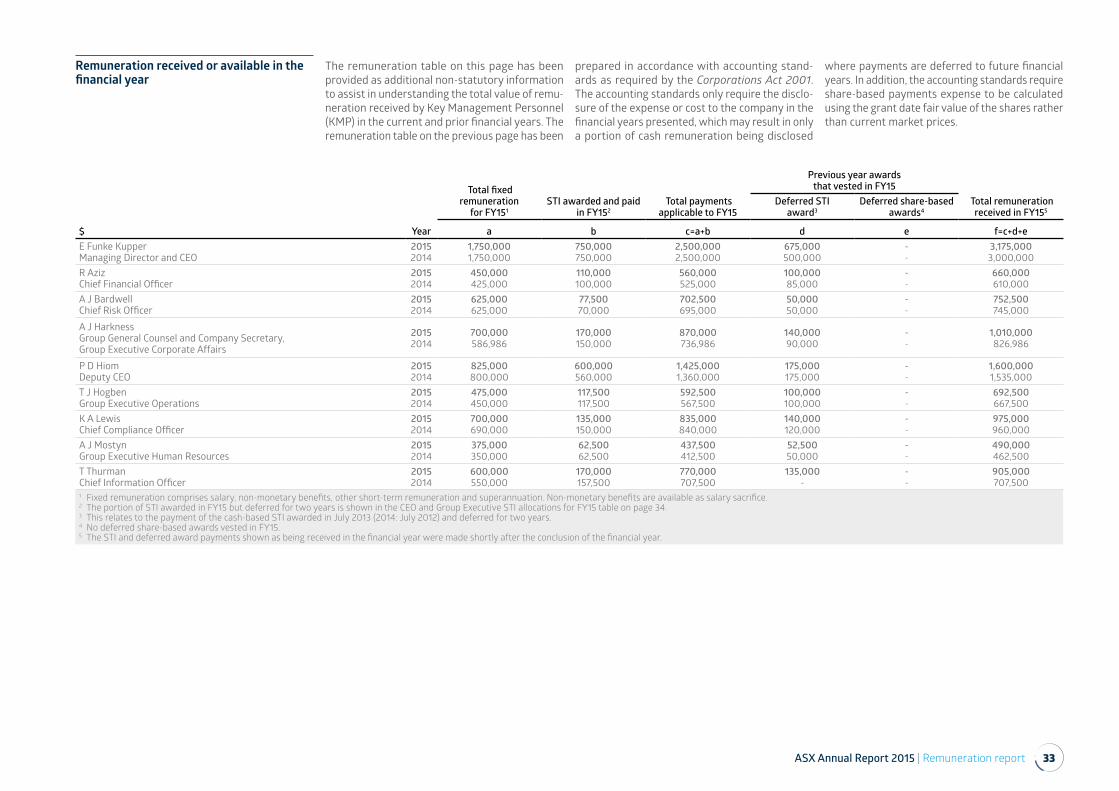
ASX Annual Report 2015 | Remuneration report 33
Remuneration received or available in the financial year
The remuneration table on this page has been provided as additional non-statutory information to assist in understanding the total value of remu-neration received by Key Management Personnel (KMP) in the current and prior financial years. The remuneration table on the previous page has been
prepared in accordance with accounting stand-ards as required by the Corporations Act 2001. The accounting standards only require the disclo-sure of the expense or cost to the company in the financial years presented, which may result in only a portion of cash remuneration being disclosed
where payments are deferred to future financial years. In addition, the accounting standards require share-based payments expense to be calculated using the grant date fair value of the shares rather than current market prices.
$ Year
Total fixed remuneration
for FY151STI awarded and paid
in FY152 Total payments
applicable to FY15
Previous year awards that vested in FY15
Total remuneration received in FY155
Deferred STI award3
Deferred share-based awards4
a b c=a+b d e f=c+d+eE Funke KupperManaging Director and CEO
20152014
1,750,0001,750,000
750,000750,000
2,500,0002,500,000
675,000500,000
--
3,175,0003,000,000
R AzizChief Financial Officer
20152014
450,000425,000
110,000100,000
560,000525,000
100,00085,000
--
660,000610,000
A J BardwellChief Risk Officer
20152014
625,000625,000
77,50070,000
702,500695,000
50,00050,000
--
752,500745,000
A J HarknessGroup General Counsel and Company Secretary, Group Executive Corporate Affairs
20152014
700,000586,986
170,000150,000
870,000736,986
140,00090,000
--
1,010,000826,986
P D HiomDeputy CEO
20152014
825,000800,000
600,000560,000
1,425,0001,360,000
175,000175,000
--
1,600,0001,535,000
T J HogbenGroup Executive Operations
20152014
475,000450,000
117,500117,500
592,500567,500
100,000100,000
--
692,500667,500
K A LewisChief Compliance Officer
20152014
700,000690,000
135,000150,000
835,000840,000
140,000120,000
--
975,000960,000
A J MostynGroup Executive Human Resources
20152014
375,000350,000
62,50062,500
437,500412,500
52,50050,000
--
490,000462,500
T ThurmanChief Information Officer
20152014
600,000550,000
170,000157,500
770,000707,500
135,000-
--
905,000707,500
1 Fixed remuneration comprises salary, non-monetary benefits, other short-term remuneration and superannuation. Non-monetary benefits are available as salary sacrifice.2 The portion of STI awarded in FY15 but deferred for two years is shown in the CEO and Group Executive STI allocations for FY15 table on page 34.3 This relates to the payment of the cash-based STI awarded in July 2013 (2014: July 2012) and deferred for two years.4 No deferred share-based awards vested in FY15.5 The STI and deferred award payments shown as being received in the financial year were made shortly after the conclusion of the financial year.
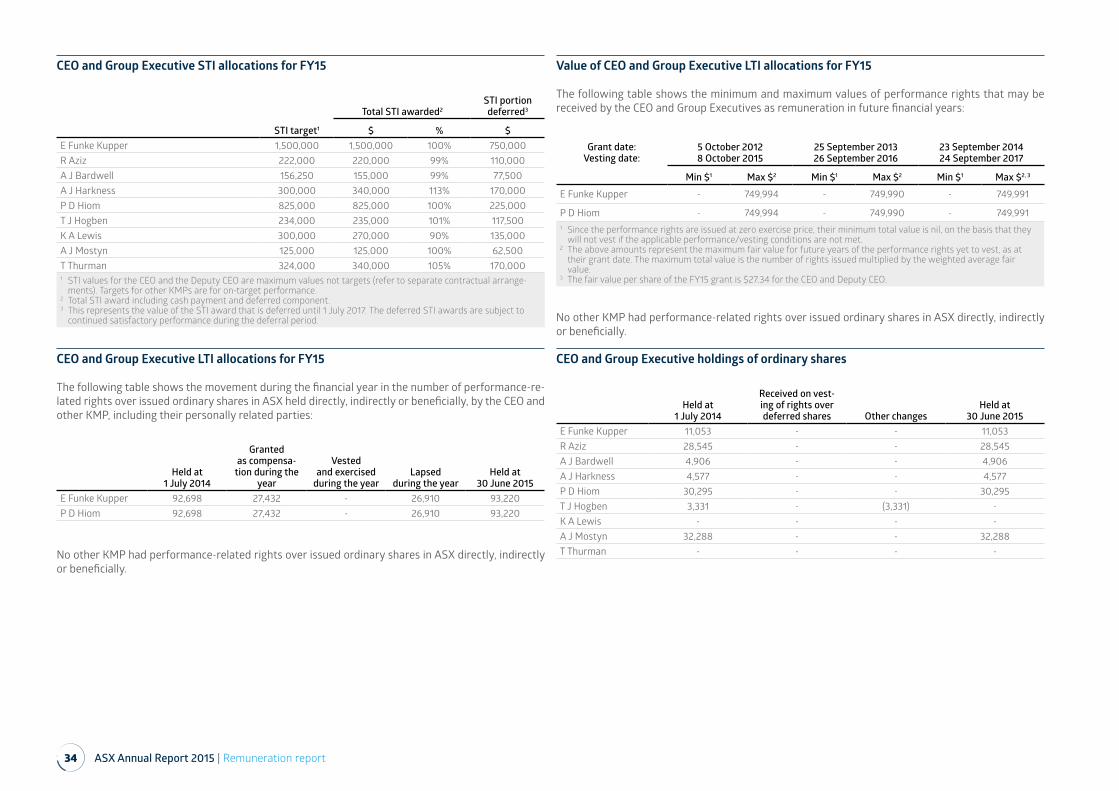
34 ASX Annual Report 2015 | Remuneration report
CEO and Group Executive STI allocations for FY15
STI target1
Total STI awarded2STI portion deferred3
$ % $E Funke Kupper 1,500,000 1,500,000 100% 750,000 R Aziz 222,000 220,000 99% 110,000 A J Bardwell 156,250 155,000 99% 77,500 A J Harkness 300,000 340,000 113% 170,000 P D Hiom 825,000 825,000 100% 225,000 T J Hogben 234,000 235,000 101% 117,500 K A Lewis 300,000 270,000 90% 135,000 A J Mostyn 125,000 125,000 100% 62,500 T Thurman 324,000 340,000 105% 170,000 1 STI values for the CEO and the Deputy CEO are maximum values not targets (refer to separate contractual arrange-
ments). Targets for other KMPs are for on-target performance.2 Total STI award including cash payment and deferred component. 3 This represents the value of the STI award that is deferred until 1 July 2017. The deferred STI awards are subject to
continued satisfactory performance during the deferral period.
CEO and Group Executive LTI allocations for FY15
The following table shows the movement during the financial year in the number of performance-re-lated rights over issued ordinary shares in ASX held directly, indirectly or beneficially, by the CEO and other KMP, including their personally related parties:
Held at 1 July 2014
Granted as compensa-
tion during the year
Vested and exercised
during the yearLapsed
during the yearHeld at
30 June 2015E Funke Kupper 92,698 27,432 - 26,910 93,220P D Hiom 92,698 27,432 - 26,910 93,220
No other KMP had performance-related rights over issued ordinary shares in ASX directly, indirectly or beneficially.
Value of CEO and Group Executive LTI allocations for FY15
The following table shows the minimum and maximum values of performance rights that may be received by the CEO and Group Executives as remuneration in future financial years:
Grant date:Vesting date:
5 October 20128 October 2015
25 September 201326 September 2016
23 September 201424 September 2017
Min $1 Max $2 Min $1 Max $2 Min $1 Max $2, 3
E Funke Kupper - 749,994 - 749,990 - 749,991
P D Hiom - 749,994 - 749,990 - 749,9911 Since the performance rights are issued at zero exercise price, their minimum total value is nil, on the basis that they
will not vest if the applicable performance/vesting conditions are not met.2 The above amounts represent the maximum fair value for future years of the performance rights yet to vest, as at
their grant date. The maximum total value is the number of rights issued multiplied by the weighted average fair value.
3 The fair value per share of the FY15 grant is $27.34 for the CEO and Deputy CEO.
No other KMP had performance-related rights over issued ordinary shares in ASX directly, indirectly or beneficially.
CEO and Group Executive holdings of ordinary shares
Held at 1 July 2014
Received on vest-ing of rights over deferred shares Other changes
Held at 30 June 2015
E Funke Kupper 11,053 - - 11,053R Aziz 28,545 - - 28,545A J Bardwell 4,906 - - 4,906A J Harkness 4,577 - - 4,577P D Hiom 30,295 - - 30,295T J Hogben 3,331 - (3,331) -K A Lewis - - - -A J Mostyn 32,288 - - 32,288T Thurman - - - -
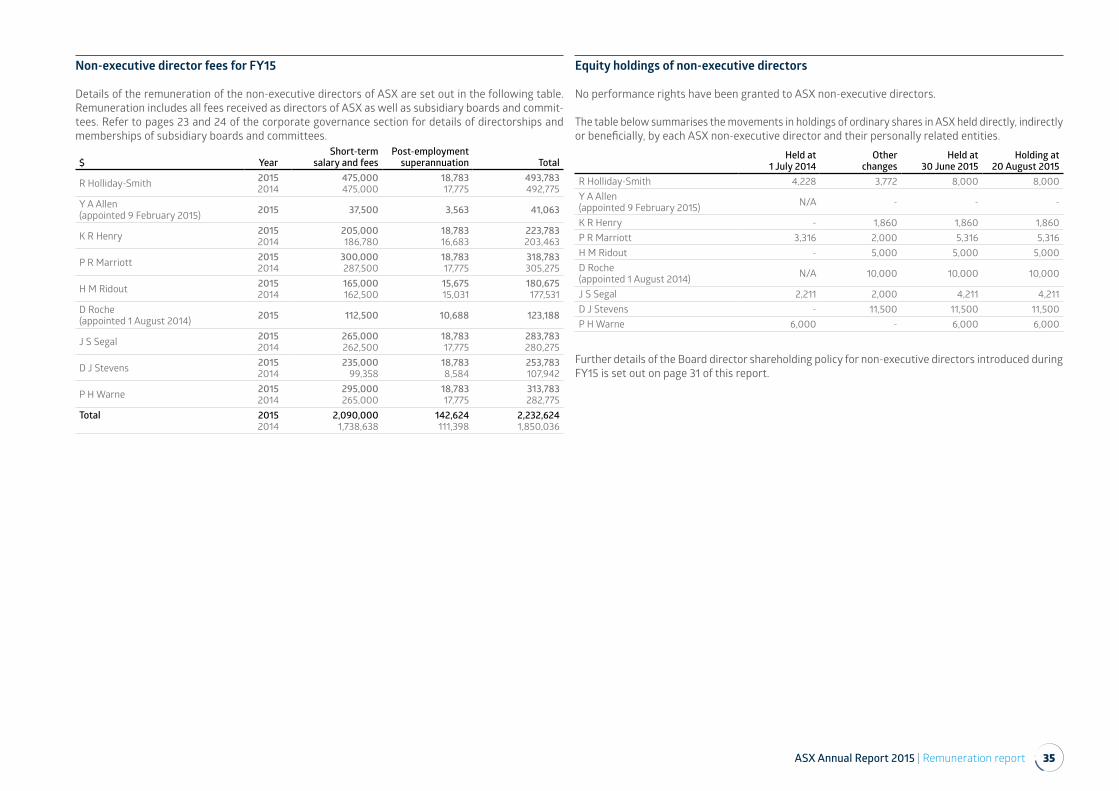
ASX Annual Report 2015 | Remuneration report 35
Non-executive director fees for FY15
Details of the remuneration of the non-executive directors of ASX are set out in the following table. Remuneration includes all fees received as directors of ASX as well as subsidiary boards and commit-tees. Refer to pages 23 and 24 of the corporate governance section for details of directorships and memberships of subsidiary boards and committees.
$ YearShort-term
salary and feesPost-employment
superannuation Total
R Holliday-Smith 20152014
475,000475,000
18,78317,775
493,783492,775
Y A Allen(appointed 9 February 2015) 2015 37,500 3,563 41,063
K R Henry 20152014
205,000186,780
18,78316,683
223,783203,463
P R Marriott 20152014
300,000287,500
18,78317,775
318,783305,275
H M Ridout 20152014
165,000162,500
15,67515,031
180,675177,531
D Roche(appointed 1 August 2014) 2015 112,500 10,688 123,188
J S Segal 20152014
265,000262,500
18,78317,775
283,783280,275
D J Stevens 20152014
235,00099,358
18,7838,584
253,783107,942
P H Warne 20152014
295,000265,000
18,78317,775
313,783282,775
Total 20152014
2,090,0001,738,638
142,624111,398
2,232,6241,850,036
Equity holdings of non-executive directors
No performance rights have been granted to ASX non-executive directors.
The table below summarises the movements in holdings of ordinary shares in ASX held directly, indirectly or beneficially, by each ASX non-executive director and their personally related entities.
Held at 1 July 2014
Other changes
Held at 30 June 2015
Holding at 20 August 2015
R Holliday-Smith 4,228 3,772 8,000 8,000Y A Allen(appointed 9 February 2015) N/A - - -
K R Henry - 1,860 1,860 1,860P R Marriott 3,316 2,000 5,316 5,316H M Ridout - 5,000 5,000 5,000D Roche(appointed 1 August 2014) N/A 10,000 10,000 10,000
J S Segal 2,211 2,000 4,211 4,211D J Stevens - 11,500 11,500 11,500P H Warne 6,000 - 6,000 6,000
Further details of the Board director shareholding policy for non-executive directors introduced during FY15 is set out on page 31 of this report.
36 ASX Annual Report 2015 | Directors’ report
Directors’ report
The directors present their report, together with the financial statements of ASX Limited (ASX or the Company) and its subsidiaries (together referred to as the Group), for the year ended 30 June 2015 (FY15) and the auditor’s report thereon . The finan-cial statements have been reviewed and approved by the directors on the recommendation of the ASX Audit and Risk Committee.
The consolidated net profit after tax for the year attributable to the members of ASX was $397.8 million (2014: $383 .2 million).
Directors
The directors of ASX in office during the financial year and at the date of this report (unless otherwise stated) were as follows:
• Mr Rick Holliday-Smith (Chairman)
• Mr Elmer Funke Kupper (Managing Director and CEO)
• Ms Yasmin A Allen (appointed 9 February 2015)
• Dr Ken R Henry AC
• Mr Peter R Marriott
• Mrs Heather M Ridout AO
• Mr Damian Roche (appointed 1 August 2014)
• Ms Jillian S Segal AM
• Mr Dominic J Stevens
• Mr Peter H Warne
Directors’ meetings and their attendance at those meetings for FY15 (including meetings of commit-tees of directors) are disclosed on page 22 of the Annual Report. The qualifications and experience of directors, including current and recent director-ships, are detailed on pages 19 to 21 of the Annual Report.
Company secretaries
Amanda J Harkness Group General Counsel and Company Secretary, Group Executive Corporate Affairs BEc LLB (Hons)(ANU), MA (Macquarie), FGIA, FAIM, FAICDMs Harkness is Group General Counsel and Company Secretary. As Company Secretary, she is responsible for company secretarial and corporate governance support across the Group. Ms Harkness has held senior adviser roles as a partner in the Australian law firm Herbert Smith Freehills and at the consulting firm McKinsey & Co. Ms Harkness has held executive management roles in Telstra and a start-up joint venture funded by British Telecom. She has worked in businesses in Australia, New Zealand, Malaysia, Korea, Hong Kong and Japan. Since 2009, she has been a non-executive direc-tor of Vodafone Hutchison Australia Pty Limited. Previously she has served on a range of Federal Government advisory boards focused on innovation and technology development.
The following people are also Company Secretaries: Marcin Firek, BEc LLB (Macquarie), FGIA, General Manager Company Secretariat; and Daniel Csillag, BA LLB (UNSW), Senior Legal Counsel and Company Secretary. They both have experience in company secretariat roles arising from time at ASX, large listed companies and other relevant entities.
Report on the business
Principal activitiesDuring the year the principal activities of the Group consisted of the provision of:
• securities exchange and ancillary services
• derivative exchange and ancillary services
• central counterparty clearing services
• registry, depository, settlement and delivery- versus-payment clearing of financial products.
Review of operations
Information on the operations and financial posi-tion of the Group and its business strategies and prospects is set out in the Operating and Financial Review on pages 4 to 11 of this Annual Report.
Dividends
The following table includes information relating to dividends in respect of the current and prior finan-cial years, including dividends paid or determined by the Company since the end of the financial year.
TypeCents per
share
Total amount
$m Date of paymentIn respect of the current financial yearInterim 92.3 178.7 18 March 2015Final 95.1 184.1 23 September 2015Total 187.4 362.8
In respect of the prior financial yearInterim 88.2 170.8 26 March 2014Final 89.9 174.0 24 September 2014Total 178.1 344.8
The final dividend was determined on 20 August 2015.
Significant changes in the state of affairsThere were no significant changes in the state of affairs during the year.
Events subsequent to balance dateNo matter or circumstance has arisen since 30 June 2015 that has significantly affected, or may significantly affect, the:
a. Group’s operations in future financial years
b. results of those operations in future financial years, or
c. Group’s state of affairs in future financial years.
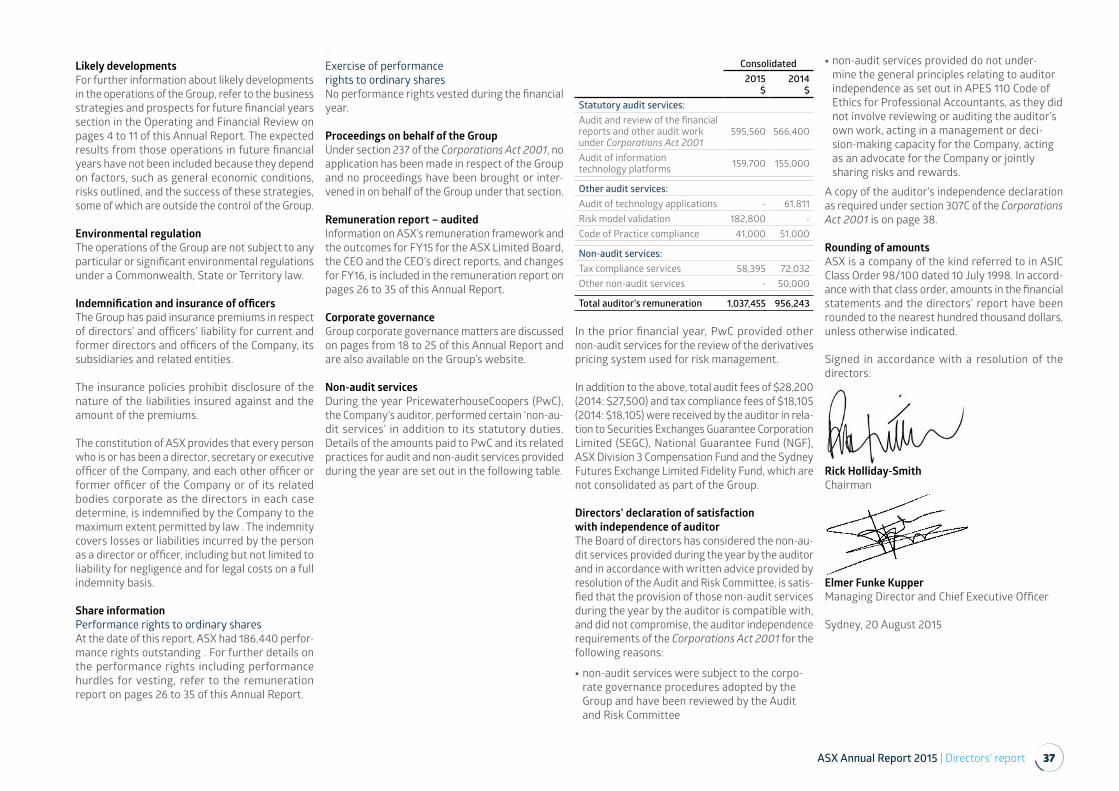
ASX Annual Report 2015 | Directors’ report 37
Likely developmentsFor further information about likely developments in the operations of the Group, refer to the business strategies and prospects for future financial years section in the Operating and Financial Review on pages 4 to 11 of this Annual Report. The expected results from those operations in future financial years have not been included because they depend on factors, such as general economic conditions, risks outlined, and the success of these strategies, some of which are outside the control of the Group.
Environmental regulationThe operations of the Group are not subject to any particular or significant environmental regulations under a Commonwealth, State or Territory law.
Indemnification and insurance of officersThe Group has paid insurance premiums in respect of directors’ and officers’ liability for current and former directors and officers of the Company, its subsidiaries and related entities.
The insurance policies prohibit disclosure of the nature of the liabilities insured against and the amount of the premiums.
The constitution of ASX provides that every person who is or has been a director, secretary or executive officer of the Company, and each other officer or former officer of the Company or of its related bodies corporate as the directors in each case determine, is indemnified by the Company to the maximum extent permitted by law . The indemnity covers losses or liabilities incurred by the person as a director or officer, including but not limited to liability for negligence and for legal costs on a full indemnity basis.
Share information Performance rights to ordinary sharesAt the date of this report, ASX had 186,440 perfor-mance rights outstanding . For further details on the performance rights including performance hurdles for vesting, refer to the remuneration report on pages 26 to 35 of this Annual Report.
Exercise of performance rights to ordinary sharesNo performance rights vested during the financial year.
Proceedings on behalf of the GroupUnder section 237 of the Corporations Act 2001, no application has been made in respect of the Group and no proceedings have been brought or inter-vened in on behalf of the Group under that section.
Remuneration report – auditedInformation on ASX’s remuneration framework and the outcomes for FY15 for the ASX Limited Board, the CEO and the CEO’s direct reports, and changes for FY16, is included in the remuneration report on pages 26 to 35 of this Annual Report.
Corporate governanceGroup corporate governance matters are discussed on pages from 18 to 25 of this Annual Report and are also available on the Group’s website.
Non-audit servicesDuring the year PricewaterhouseCoopers (PwC), the Company’s auditor, performed certain ‘non-au-dit services’ in addition to its statutory duties. Details of the amounts paid to PwC and its related practices for audit and non-audit services provided during the year are set out in the following table.
Consolidated2015
$2014
$Statutory audit services:Audit and review of the financial reports and other audit work under Corporations Act 2001
595,560 566,400
Audit of information technology platforms 159,700 155,000
Other audit services:Audit of technology applications - 61,811Risk model validation 182,800 -Code of Practice compliance 41,000 51,000
Non-audit services:Tax compliance services 58,395 72,032Other non-audit services - 50,000
Total auditor’s remuneration 1,037,455 956,243
In the prior financial year, PwC provided other non-audit services for the review of the derivatives pricing system used for risk management.
In addition to the above, total audit fees of $28,200 (2014: $27,500) and tax compliance fees of $18,105 (2014: $18,105) were received by the auditor in rela-tion to Securities Exchanges Guarantee Corporation Limited (SEGC), National Guarantee Fund (NGF), ASX Division 3 Compensation Fund and the Sydney Futures Exchange Limited Fidelity Fund, which are not consolidated as part of the Group.
Directors’ declaration of satisfaction with independence of auditorThe Board of directors has considered the non-au-dit services provided during the year by the auditor and in accordance with written advice provided by resolution of the Audit and Risk Committee, is satis-fied that the provision of those non-audit services during the year by the auditor is compatible with, and did not compromise, the auditor independence requirements of the Corporations Act 2001 for the following reasons:
• non-audit services were subject to the corpo-rate governance procedures adopted by the Group and have been reviewed by the Audit and Risk Committee
• non-audit services provided do not under-mine the general principles relating to auditor independence as set out in APES 110 Code of Ethics for Professional Accountants, as they did not involve reviewing or auditing the auditor’s own work, acting in a management or deci-sion-making capacity for the Company, acting as an advocate for the Company or jointly sharing risks and rewards.
A copy of the auditor’s independence declaration as required under section 307C of the Corporations Act 2001 is on page 38.
Rounding of amountsASX is a company of the kind referred to in ASIC Class Order 98/100 dated 10 July 1998. In accord-ance with that class order, amounts in the financial statements and the directors’ report have been rounded to the nearest hundred thousand dollars, unless otherwise indicated.
Signed in accordance with a resolution of the directors:
Rick Holliday-Smith Chairman
Elmer Funke Kupper Managing Director and Chief Executive Officer
Sydney, 20 August 2015
38 ASX Annual Report 2015 | Auditor’s independence declaration
Auditor’s independence declaration
As lead auditor for the audit of ASX Limited for the year ended 30 June 2015, I declare that to the best of my knowledge and belief, there have been:
a. no contraventions of the auditor independ-ence requirements of the Corporations Act 2001 in relation to the audit; and
b. no contraventions of any applicable code of professional conduct in relation to the audit.
This declaration is in respect of ASX Limited and the entities it controlled during the period.
Matthew Lunn Partner
PricewaterhouseCoopers
Sydney, 20 August 2015
PricewaterhouseCoopers, ABN 52 780 433 757Darling Park Tower 2, 201 Sussex Street, GPO BOX 2650, SYDNEY NSW 1171
T: +61 2 8266 0000 F: +61 2 8266 9999 www.pwc.com.au
Liability limited by a scheme approved under Professional Standards Legislation.
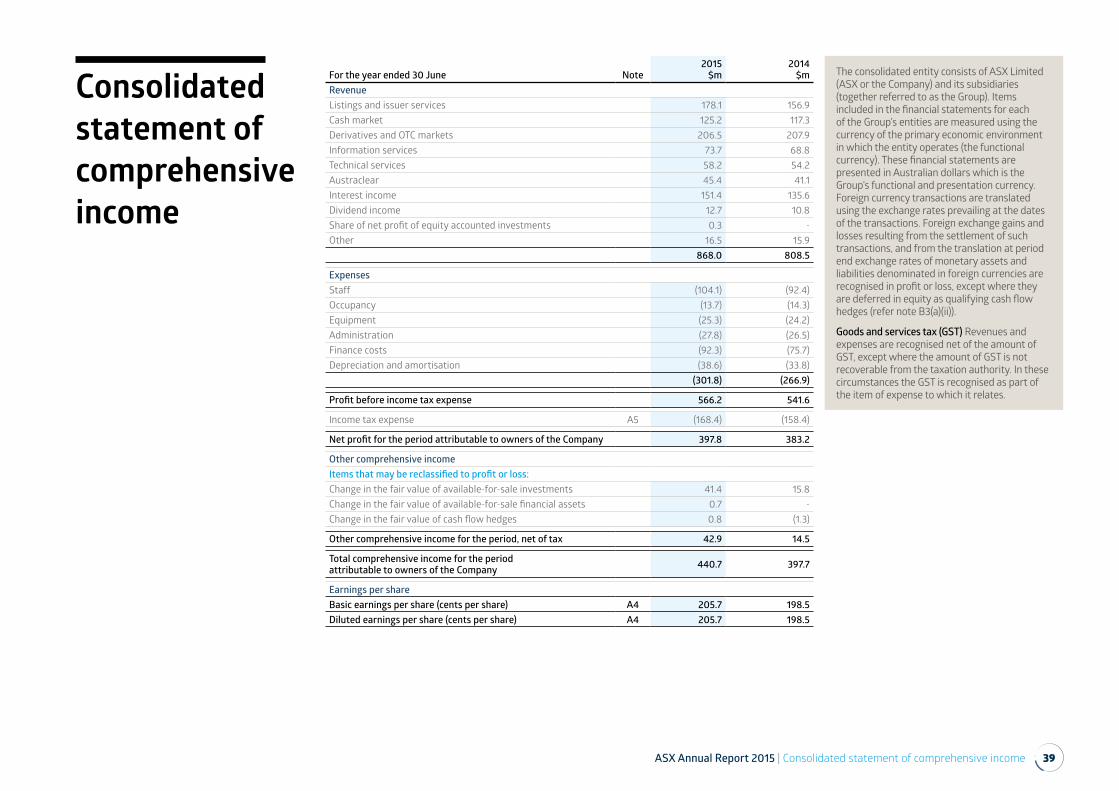
ASX Annual Report 2015 | Consolidated statement of comprehensive income 39
Consolidated statement of comprehensive income
For the year ended 30 June Note2015
$m2014
$mRevenueListings and issuer services 178.1 156.9Cash market 125.2 117.3Derivatives and OTC markets 206.5 207.9Information services 73.7 68.8Technical services 58.2 54.2Austraclear 45.4 41.1Interest income 151.4 135.6Dividend income 12.7 10.8Share of net profit of equity accounted investments 0.3 -Other 16.5 15.9
868.0 808.5
ExpensesStaff (104.1) (92.4)Occupancy (13.7) (14.3)Equipment (25.3) (24.2)Administration (27.8) (26.5)Finance costs (92.3) (75.7)Depreciation and amortisation (38.6) (33.8)
(301.8) (266.9)
Profit before income tax expense 566.2 541.6
Income tax expense A5 (168.4) (158.4)
Net profit for the period attributable to owners of the Company 397.8 383.2
Other comprehensive incomeItems that may be reclassified to profit or loss:Change in the fair value of available-for-sale investments 41.4 15.8Change in the fair value of available-for-sale financial assets 0.7 -Change in the fair value of cash flow hedges 0.8 (1.3)
Other comprehensive income for the period, net of tax 42.9 14.5
Total comprehensive income for the period attributable to owners of the Company 440.7 397.7
Earnings per shareBasic earnings per share (cents per share) A4 205.7 198.5Diluted earnings per share (cents per share) A4 205.7 198.5
The consolidated entity consists of ASX Limited (ASX or the Company) and its subsidiaries (together referred to as the Group). Items included in the financial statements for each of the Group’s entities are measured using the currency of the primary economic environment in which the entity operates (the functional currency). These financial statements are presented in Australian dollars which is the Group’s functional and presentation currency. Foreign currency transactions are translated using the exchange rates prevailing at the dates of the transactions. Foreign exchange gains and losses resulting from the settlement of such transactions, and from the translation at period end exchange rates of monetary assets and liabilities denominated in foreign currencies are recognised in profit or loss, except where they are deferred in equity as qualifying cash flow hedges (refer note B3(a)(ii)).
Goods and services tax (GST) Revenues and expenses are recognised net of the amount of GST, except where the amount of GST is not recoverable from the taxation authority. In these circumstances the GST is recognised as part of the item of expense to which it relates.
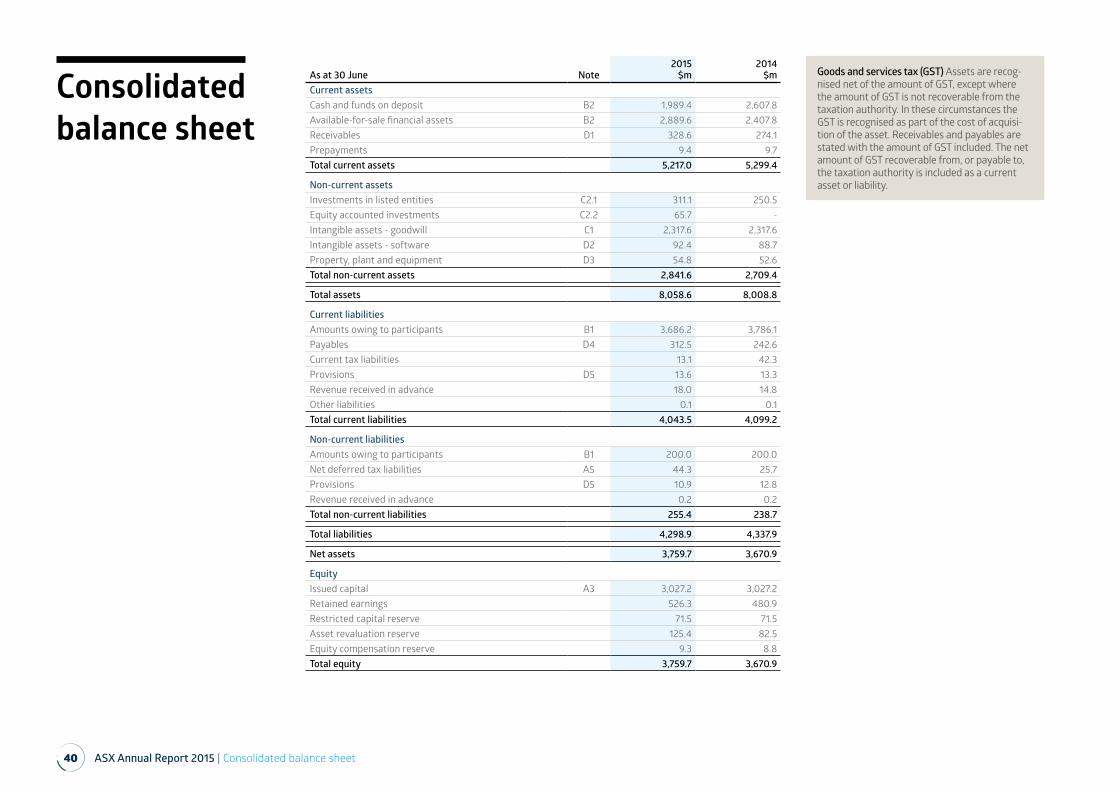
40 ASX Annual Report 2015 | Consolidated balance sheet
Consolidated balance sheet
As at 30 June Note 2015
$m2014
$mCurrent assetsCash and funds on deposit B2 1,989.4 2,607.8Available-for-sale financial assets B2 2,889.6 2,407.8Receivables D1 328.6 274.1Prepayments 9.4 9.7Total current assets 5,217.0 5,299.4
Non-current assetsInvestments in listed entities C2.1 311.1 250.5Equity accounted investments C2.2 65.7 -Intangible assets - goodwill C1 2,317.6 2,317.6Intangible assets - software D2 92.4 88.7Property, plant and equipment D3 54.8 52.6Total non-current assets 2,841.6 2,709.4
Total assets 8,058.6 8,008.8
Current liabilitiesAmounts owing to participants B1 3,686.2 3,786.1Payables D4 312.5 242.6Current tax liabilities 13.1 42.3Provisions D5 13.6 13.3Revenue received in advance 18.0 14.8Other liabilities 0.1 0.1Total current liabilities 4,043.5 4,099.2
Non-current liabilitiesAmounts owing to participants B1 200.0 200.0Net deferred tax liabilities A5 44.3 25.7Provisions D5 10.9 12.8Revenue received in advance 0.2 0.2Total non-current liabilities 255.4 238.7
Total liabilities 4,298.9 4,337.9
Net assets 3,759.7 3,670.9
EquityIssued capital A3 3,027.2 3,027.2Retained earnings 526.3 480.9Restricted capital reserve 71.5 71.5Asset revaluation reserve 125.4 82.5Equity compensation reserve 9.3 8.8Total equity 3,759.7 3,670.9
Goods and services tax (GST) Assets are recog-nised net of the amount of GST, except where the amount of GST is not recoverable from the taxation authority. In these circumstances the GST is recognised as part of the cost of acquisi-tion of the asset. Receivables and payables are stated with the amount of GST included. The net amount of GST recoverable from, or payable to, the taxation authority is included as a current asset or liability.
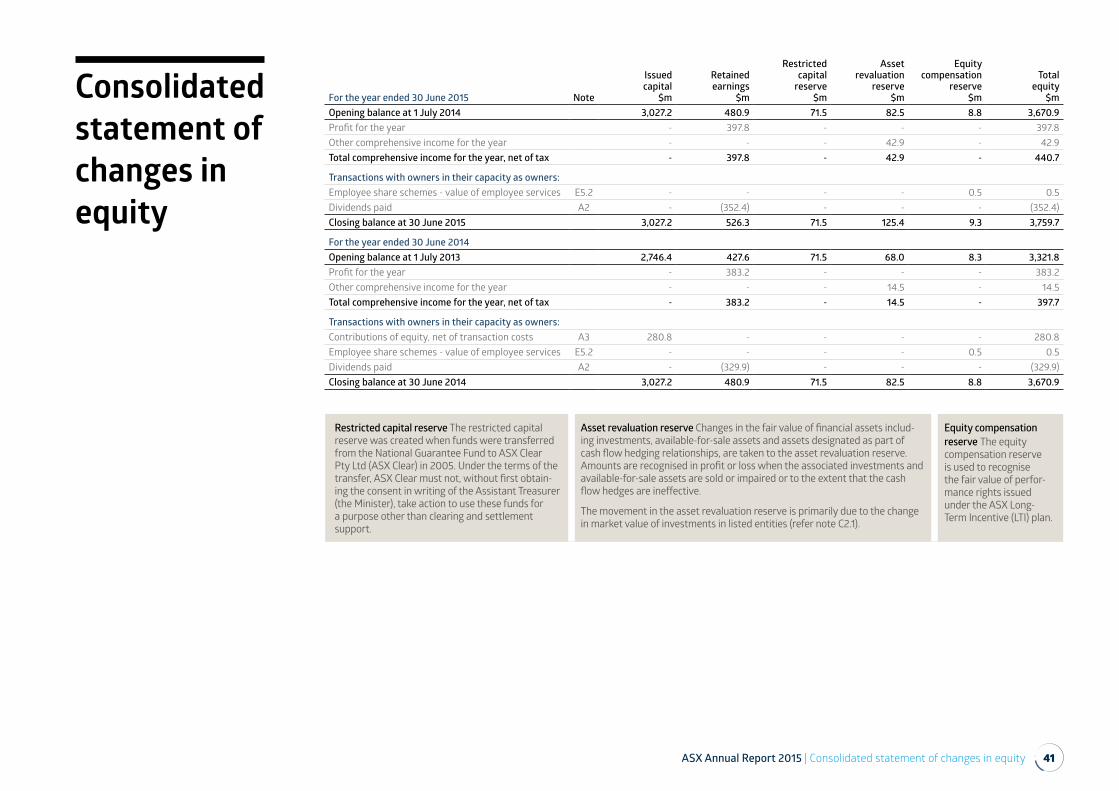
ASX Annual Report 2015 | Consolidated statement of changes in equity 41
Consolidated statement of changes in equity
For the year ended 30 June 2015 Note
Issued capital
$m
Retained earnings
$m
Restricted capital
reserve $m
Asset revaluation
reserve $m
Equity compensation
reserve $m
Total equity
$mOpening balance at 1 July 2014 3,027.2 480.9 71.5 82.5 8.8 3,670.9Profit for the year - 397.8 - - - 397.8Other comprehensive income for the year - - - 42.9 - 42.9Total comprehensive income for the year, net of tax - 397.8 - 42.9 - 440.7
Transactions with owners in their capacity as owners:Employee share schemes - value of employee services E5.2 - - - - 0.5 0.5Dividends paid A2 - (352.4) - - - (352.4)Closing balance at 30 June 2015 3,027.2 526.3 71.5 125.4 9.3 3,759.7
For the year ended 30 June 2014Opening balance at 1 July 2013 2,746.4 427.6 71.5 68.0 8.3 3,321.8Profit for the year - 383.2 - - - 383.2Other comprehensive income for the year - - - 14.5 - 14.5Total comprehensive income for the year, net of tax - 383.2 - 14.5 - 397.7
Transactions with owners in their capacity as owners:Contributions of equity, net of transaction costs A3 280.8 - - - - 280.8Employee share schemes - value of employee services E5.2 - - - - 0.5 0.5Dividends paid A2 - (329.9) - - - (329.9)Closing balance at 30 June 2014 3,027.2 480.9 71.5 82.5 8.8 3,670.9
Restricted capital reserve The restricted capital reserve was created when funds were transferred from the National Guarantee Fund to ASX Clear Pty Ltd (ASX Clear) in 2005. Under the terms of the transfer, ASX Clear must not, without first obtain-ing the consent in writing of the Assistant Treasurer (the Minister), take action to use these funds for a purpose other than clearing and settlement support.
Asset revaluation reserve Changes in the fair value of financial assets includ-ing investments, available-for-sale assets and assets designated as part of cash flow hedging relationships, are taken to the asset revaluation reserve. Amounts are recognised in profit or loss when the associated investments and available-for-sale assets are sold or impaired or to the extent that the cash flow hedges are ineffective.
The movement in the asset revaluation reserve is primarily due to the change in market value of investments in listed entities (refer note C2.1).
Equity compensation reserve The equity compensation reserve is used to recognise the fair value of perfor-mance rights issued under the ASX Long-Term Incentive (LTI) plan.
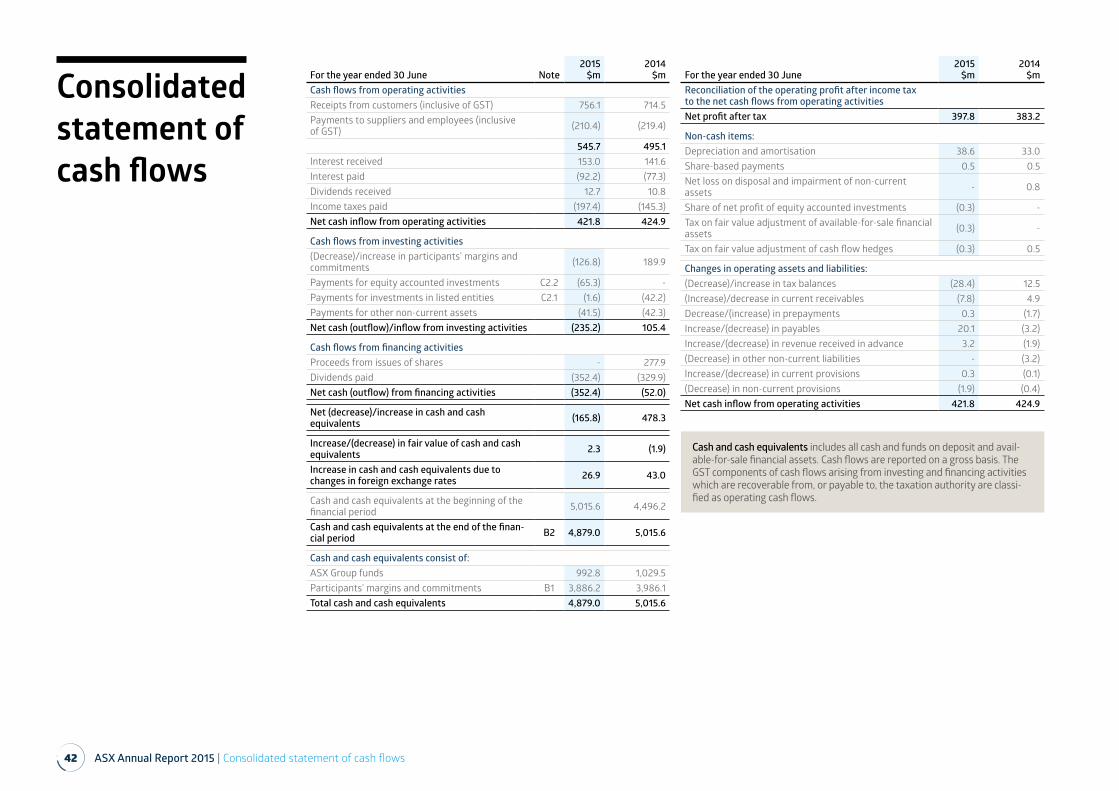
42 ASX Annual Report 2015 | Consolidated statement of cash flows
Consolidated statement of cash flows
For the year ended 30 June Note2015
$m2014
$mCash flows from operating activitiesReceipts from customers (inclusive of GST) 756.1 714.5Payments to suppliers and employees (inclusive of GST) (210.4) (219.4)
545.7 495.1Interest received 153.0 141.6Interest paid (92.2) (77.3)Dividends received 12.7 10.8Income taxes paid (197.4) (145.3)Net cash inflow from operating activities 421.8 424.9
Cash flows from investing activities(Decrease)/increase in participants’ margins and commitments (126.8) 189.9
Payments for equity accounted investments C2.2 (65.3) -Payments for investments in listed entities C2.1 (1.6) (42.2)Payments for other non-current assets (41.5) (42.3)Net cash (outflow)/inflow from investing activities (235.2) 105.4
Cash flows from financing activitiesProceeds from issues of shares - 277.9Dividends paid (352.4) (329.9)Net cash (outflow) from financing activities (352.4) (52.0)
Net (decrease)/increase in cash and cash equivalents (165.8) 478.3
Increase/(decrease) in fair value of cash and cash equivalents 2.3 (1.9)
Increase in cash and cash equivalents due to changes in foreign exchange rates 26.9 43.0
Cash and cash equivalents at the beginning of the financial period 5,015.6 4,496.2
Cash and cash equivalents at the end of the finan-cial period B2 4,879.0 5,015.6
Cash and cash equivalents consist of:ASX Group funds 992.8 1,029.5Participants’ margins and commitments B1 3,886.2 3,986.1Total cash and cash equivalents 4,879.0 5,015.6
For the year ended 30 June2015
$m2014
$mReconciliation of the operating profit after income tax to the net cash flows from operating activitiesNet profit after tax 397.8 383.2
Non-cash items:Depreciation and amortisation 38.6 33.0Share-based payments 0.5 0.5Net loss on disposal and impairment of non-current assets - 0.8
Share of net profit of equity accounted investments (0.3) -Tax on fair value adjustment of available-for-sale financial assets (0.3) -
Tax on fair value adjustment of cash flow hedges (0.3) 0.5
Changes in operating assets and liabilities:(Decrease)/increase in tax balances (28.4) 12.5(Increase)/decrease in current receivables (7.8) 4.9Decrease/(increase) in prepayments 0.3 (1.7)Increase/(decrease) in payables 20.1 (3.2)Increase/(decrease) in revenue received in advance 3.2 (1.9)(Decrease) in other non-current liabilities - (3.2)Increase/(decrease) in current provisions 0.3 (0.1)(Decrease) in non-current provisions (1.9) (0.4)Net cash inflow from operating activities 421.8 424.9
Cash and cash equivalents includes all cash and funds on deposit and avail-able-for-sale financial assets. Cash flows are reported on a gross basis. The GST components of cash flows arising from investing and financing activities which are recoverable from, or payable to, the taxation authority are classi-fied as operating cash flows.

ASX Annual Report 2015 | Preface to the notes to the financial statements 43
Preface to the notes to the financial statements
The notes to the financial statements have been reordered based on relevance to provide more useful information to users of the financial state-ments. Significant accounting policies and key judgements and estimates are contained in shaded text and are included within the relevant note. These policies have been consistently applied to all years presented, unless otherwise stated.
ASX is a for-profit company limited by shares incor-porated and domiciled in Australia.
The consolidated financial statements of the Group for the year ended 30 June 2015 were authorised for issue by the Board of directors on 20 August 2015. The directors have the power to amend and reissue the financial statements.
The financial statements are general purpose finan-cial statements that:
• have been prepared in accordance with the requirements of the Corporations Act 2001, Australian Accounting Standards and other authoritative pronouncements of the Australian Accounting Standards Board (AASB) and International Financial Reporting Standards (IFRS) as issued by the International Accounting Standards Board (IASB)
• include the assets and liabilities of all subsid-iaries of the Company as at 30 June 2015 and the results of the subsidiaries for the year then ended. Unrealised gains and losses on inter-en-tity balances resulting from transactions with, or between, subsidiaries are eliminated in full on consolidation
• have been prepared on a historical cost basis, except for available-for-sale financial assets and investments in listed entities, which have been measured at fair value
• are presented in Australian dollars (being ASX’s functional and presentation currency) with all values rounded to the nearest hundred thousand dollars unless otherwise stated, in accordance with ASIC Class Order 98/100.
Key judgements and estimatesIn the process of applying the Group’s account-ing policies, management has made a number of judgements and applied estimates of future events.
Judgements and estimates that are material to the financial report are found in the following notes:
• C1 Intangible assets – goodwill
• C2 Investments
• D2 Intangible assets – software.
C O N T E N T SPerformance of the Group44 | A1 Segment reporting46 | A2 Dividends46 | A3 Capital management47 | A4 Earnings per share47 | A5 Taxation
Risk management48 | B1 Clearing risk49 | B2 Cash and funds on deposit and
available-for-sale financial assets49 | B3 Financial risk management
Investments54 | C1 Intangibles – goodwill54 | C2 Investments54 | C2.1 Investments in listed entities54 | C2.2 Equity accounted investments
Other balance sheet assets and liabilities55 | D1 Receivables55 | D2 Intangible assets – software56 | D3 Property, plant and equipment57 | D4 Payables57 | D5 Provisions
Group disclosures58 | E1 Subsidiaries58 | E2 Deed of Cross Guarantee59 | E3 Related party transactions59 | E4 Parent entity financial information60 | E5 Other disclosures60 | E5.1 Commitments60 | E5.2 Share-based payments61 | E5.3 Key Management Personnel
remuneration61 | E5.4 Auditor’s remuneration61 | E5.5 Other accounting policies62 | E5.6 Subsequent events
44 ASX Annual Report 2015 | Performance of the Group
Performance of the Group
A1 Segment reporting
(a) Description of segmentOperating segments are reported in a manner consistent with the internal reporting provided to the Chief Operating Decision Maker (CODM). The CODM, who is responsible for allocating resources and assessing performance of the operating segments, has been identified as the Managing Director and CEO.
The Managing Director and CEO assesses perfor-mance of the Group as a single segment, being a vertically integrated organisation (eg providing services to the primary and secondary financial markets as well as post-trade activities) that provides a multi-asset class product offering.
Vertical integration includes the:
• listing and issuer services offered to public companies and other issuers
• trading venue or exchange activities for trading
• clearing and settlement activities
• exchange-traded and over-the-counter (OTC) products.
Multi-asset class service offerings include equities, interest rate, commodity and energy products across cash and derivatives markets.
In addition to reviewing performance based on statutory profit after tax, the CODM assesses the performance of the Group based on underlying profit after tax. This measure excludes amounts regarded as significant items of revenue and expense such as those that may be associated with significant business restructuring or indi-vidual transactions of an infrequent nature. A restructure charge of $7.7 million, classified as significant items, was recognised in this financial year to support the technology transformation program and other organisational changes. There were no items reported as significant in the prior financial year.
Group performance measures including earn-ings before interest and tax (EBIT) and earnings before interest, tax, depreciation and amortisa-tion (EBITDA), are also reviewed by the CODM. In assessing performance, doubtful debt provisions and arrangements where revenue is shared with external parties are reclassified from expenses to operating revenue; certain expenses are reclassi-fied within operating expenses; and gross interest income and expense is reclassified to net inter-est income. The reporting provided to the CODM presents interest income net of interest expense.
(b) Segment resultsThe information provided on a regular basis to the CODM, along with a reconciliation to statu-tory profit after tax for the period attributable to owners of the Company, is presented on the following page.
ASX derives all external customer revenue within Australia and some services are accessible offshore.
No single customer generates revenue greater than 10% of the Group’s total revenues.
Revenue is measured at the fair value of the consideration received or receivable, net of rebates. Revenue is recognised when it can be reliably measured, and when it is probable that the economic benefits will flow to the Group. Revenue is recognised for the major revenue lines as shown below.
• Listings and issuer services includes listing fees and other issuer services revenue. Initial and subsequent listing fees are recognised when the listing or subsequent event has taken place. Annual listing fees are recognised on a pro rata basis over the financial year to which they relate. Unamortised balances are recognised as deferred revenue on the balance sheet. Issuer services revenue includes reve-nue for the provision of holding statements and other related activities, and is recognised in the period that the service is provided.
• Cash market includes revenue from trading, clearing and settlement of equities, warrants, exchange-traded funds and interest rate
products. Transaction revenue is recognised at settlement date. The normal market conven-tion is that settlement occurs three days after the initial trade date. Accordingly, revenue for trades transacted in the last three days prior to period end are recognised in the subse-quent reporting period (settlement date).
• Derivatives and OTC markets includes reve-nue from trading and clearing of futures and options, as well as clearing of OTC interest rate swaps. Transaction revenue is recognised at trade date.
• Information services includes the provision of market data, whereby revenue is recognised over the period the service is provided.
• Technical services includes liquidity access, community and connectivity, application services and hosting, whereby revenue is recognised over the period the service is provided.
• Austraclear revenue from depository, regis-try and settlement fees is recognised over the period the service is provided. This may involve deferring a portion of the revenue to future reporting periods.
Dividend income is recognised when the right to receive the dividend has been established.
Interest income comprises interest earned on the Group’s own funds and restricted capital reserve, as well as interest earned from the investment of funds lodged by participants as collateral. Interest income is recognised using the effective interest method.
Interest expense is recognised as a finance cost in the statement of comprehensive income using the effective interest rate method.
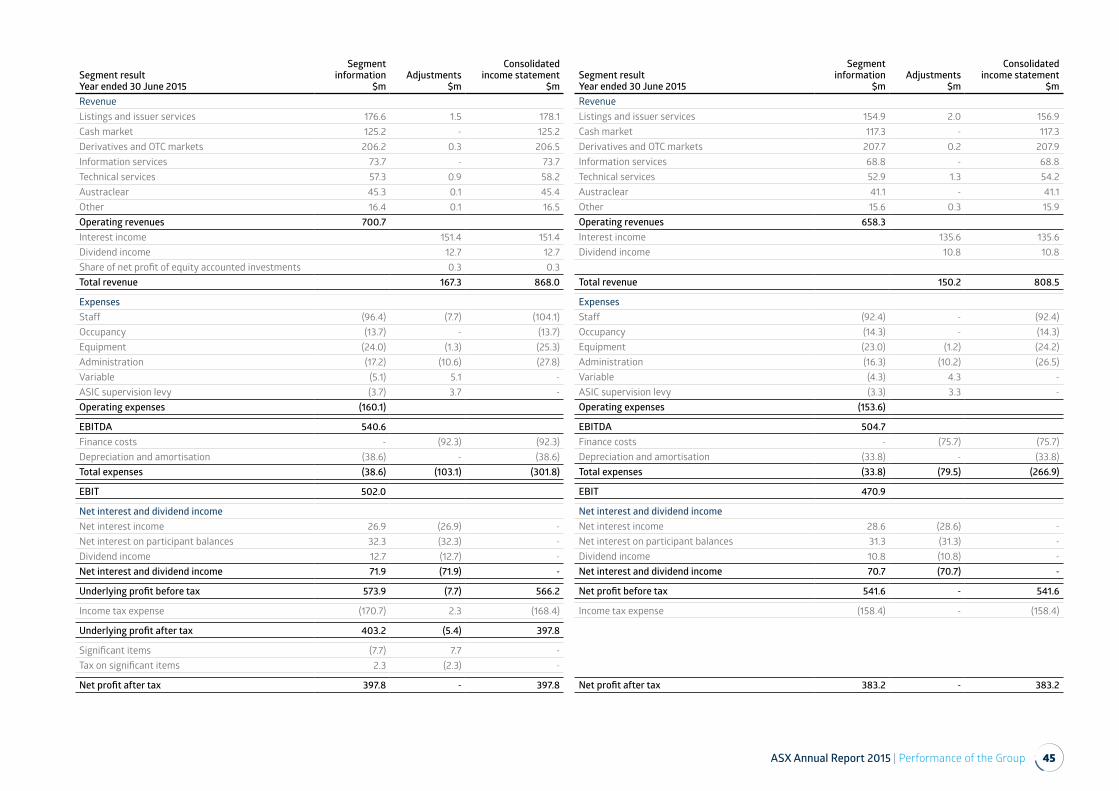
ASX Annual Report 2015 | Performance of the Group 45
Segment resultYear ended 30 June 2015
Segmentinformation
$mAdjustments
$m
Consolidated income statement
$mRevenueListings and issuer services 176.6 1.5 178.1Cash market 125.2 - 125.2Derivatives and OTC markets 206.2 0.3 206.5Information services 73.7 - 73.7Technical services 57.3 0.9 58.2Austraclear 45.3 0.1 45.4Other 16.4 0.1 16.5Operating revenues 700.7Interest income 151.4 151.4Dividend income 12.7 12.7Share of net profit of equity accounted investments 0.3 0.3Total revenue 167.3 868.0
ExpensesStaff (96.4) (7.7) (104.1)Occupancy (13.7) - (13.7)Equipment (24.0) (1.3) (25.3)Administration (17.2) (10.6) (27.8)Variable (5.1) 5.1 -ASIC supervision levy (3.7) 3.7 -Operating expenses (160.1)
EBITDA 540.6Finance costs - (92.3) (92.3)Depreciation and amortisation (38.6) - (38.6)Total expenses (38.6) (103.1) (301.8)
EBIT 502.0
Net interest and dividend incomeNet interest income 26.9 (26.9) -Net interest on participant balances 32.3 (32.3) -Dividend income 12.7 (12.7) -Net interest and dividend income 71.9 (71.9) -
Underlying profit before tax 573.9 (7.7) 566.2
Income tax expense (170.7) 2.3 (168.4)
Underlying profit after tax 403.2 (5.4) 397.8
Significant items (7.7) 7.7 -Tax on significant items 2.3 (2.3) -
Net profit after tax 397.8 - 397.8
Segment resultYear ended 30 June 2015
Segmentinformation
$mAdjustments
$m
Consolidated income statement
$mRevenueListings and issuer services 154.9 2.0 156.9Cash market 117.3 - 117.3Derivatives and OTC markets 207.7 0.2 207.9Information services 68.8 - 68.8Technical services 52.9 1.3 54.2Austraclear 41.1 - 41.1Other 15.6 0.3 15.9Operating revenues 658.3Interest income 135.6 135.6Dividend income 10.8 10.8
Total revenue 150.2 808.5
ExpensesStaff (92.4) - (92.4)Occupancy (14.3) - (14.3)Equipment (23.0) (1.2) (24.2)Administration (16.3) (10.2) (26.5)Variable (4.3) 4.3 -ASIC supervision levy (3.3) 3.3 -Operating expenses (153.6)
EBITDA 504.7Finance costs - (75.7) (75.7)Depreciation and amortisation (33.8) - (33.8)Total expenses (33.8) (79.5) (266.9)
EBIT 470.9
Net interest and dividend incomeNet interest income 28.6 (28.6) -Net interest on participant balances 31.3 (31.3) -Dividend income 10.8 (10.8) -Net interest and dividend income 70.7 (70.7) -
Net profit before tax 541.6 - 541.6
Income tax expense (158.4) - (158.4)
Net profit after tax 383.2 - 383.2
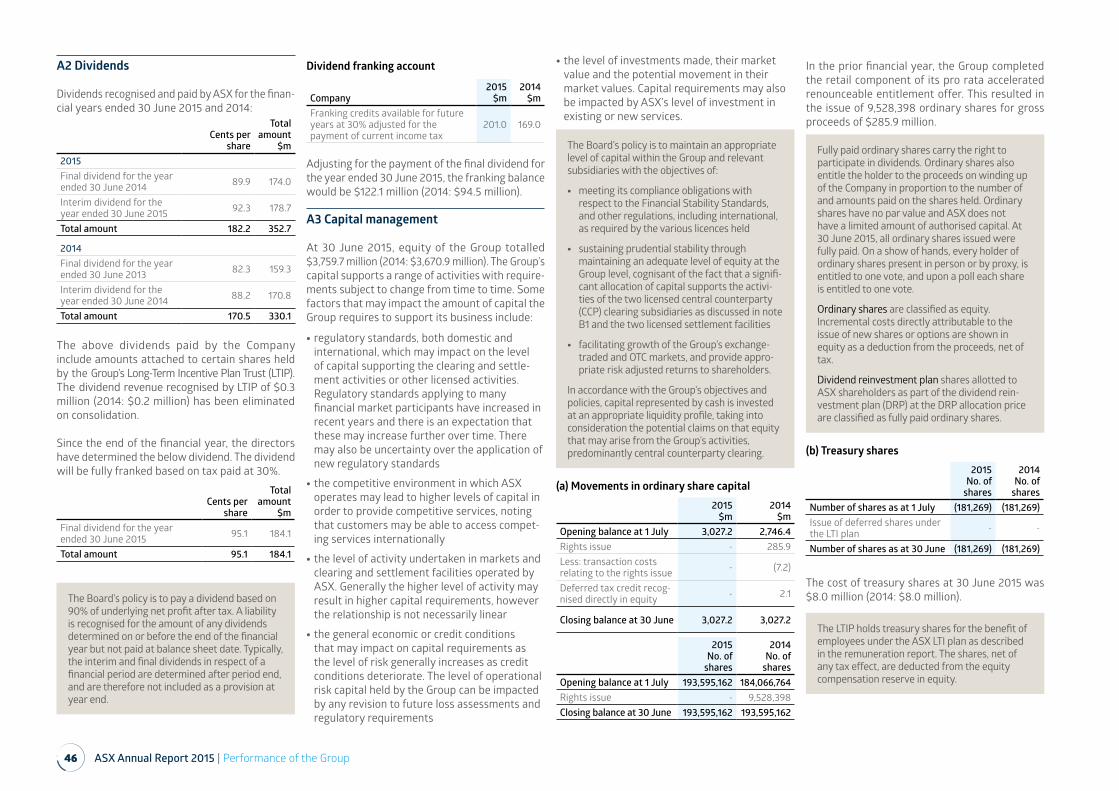
46 ASX Annual Report 2015 | Performance of the Group
A2 Dividends
Dividends recognised and paid by ASX for the finan-cial years ended 30 June 2015 and 2014:
Cents pershare
Total amount
$m2015Final dividend for the year ended 30 June 2014 89.9 174.0
Interim dividend for the year ended 30 June 2015 92.3 178.7
Total amount 182.2 352.7
2014Final dividend for the year ended 30 June 2013 82.3 159.3
Interim dividend for the year ended 30 June 2014 88.2 170.8
Total amount 170.5 330.1
The above dividends paid by the Company include amounts attached to certain shares held by the Group’s Long-Term Incentive Plan Trust (LTIP). The dividend revenue recognised by LTIP of $0.3 million (2014: $0.2 million) has been eliminated on consolidation.
Since the end of the financial year, the directors have determined the below dividend. The dividend will be fully franked based on tax paid at 30%.
Cents per share
Total amount
$mFinal dividend for the year ended 30 June 2015 95.1 184.1
Total amount 95.1 184.1
The Board’s policy is to pay a dividend based on 90% of underlying net profit after tax. A liability is recognised for the amount of any dividends determined on or before the end of the financial year but not paid at balance sheet date. Typically, the interim and final dividends in respect of a financial period are determined after period end, and are therefore not included as a provision at year end.
Dividend franking account
Company2015
$m2014
$mFranking credits available for future years at 30% adjusted for the payment of current income tax
201.0 169.0
Adjusting for the payment of the final dividend for the year ended 30 June 2015, the franking balance would be $122.1 million (2014: $94.5 million).
A3 Capital management
At 30 June 2015, equity of the Group totalled $3,759.7 million (2014: $3,670.9 million). The Group’s capital supports a range of activities with require-ments subject to change from time to time. Some factors that may impact the amount of capital the Group requires to support its business include:
• regulatory standards, both domestic and international, which may impact on the level of capital supporting the clearing and settle-ment activities or other licensed activities. Regulatory standards applying to many financial market participants have increased in recent years and there is an expectation that these may increase further over time. There may also be uncertainty over the application of new regulatory standards
• the competitive environment in which ASX operates may lead to higher levels of capital in order to provide competitive services, noting that customers may be able to access compet-ing services internationally
• the level of activity undertaken in markets and clearing and settlement facilities operated by ASX. Generally the higher level of activity may result in higher capital requirements, however the relationship is not necessarily linear
• the general economic or credit conditions that may impact on capital requirements as the level of risk generally increases as credit conditions deteriorate. The level of operational risk capital held by the Group can be impacted by any revision to future loss assessments and regulatory requirements
• the level of investments made, their market value and the potential movement in their market values. Capital requirements may also be impacted by ASX’s level of investment in existing or new services.
(a) Movements in ordinary share capital2015
$m2014
$mOpening balance at 1 July 3,027.2 2,746.4Rights issue - 285.9Less: transaction costs relating to the rights issue - (7.2)
Deferred tax credit recog-nised directly in equity - 2.1
Closing balance at 30 June 3,027.2 3,027.2
2015No. of
shares
2014No. of
sharesOpening balance at 1 July 193,595,162 184,066,764Rights issue - 9,528,398Closing balance at 30 June 193,595,162 193,595,162
In the prior financial year, the Group completed the retail component of its pro rata accelerated renounceable entitlement offer. This resulted in the issue of 9,528,398 ordinary shares for gross proceeds of $285.9 million.
Fully paid ordinary shares carry the right to participate in dividends. Ordinary shares also entitle the holder to the proceeds on winding up of the Company in proportion to the number of and amounts paid on the shares held. Ordinary shares have no par value and ASX does not have a limited amount of authorised capital. At 30 June 2015, all ordinary shares issued were fully paid. On a show of hands, every holder of ordinary shares present in person or by proxy, is entitled to one vote, and upon a poll each share is entitled to one vote.
Ordinary shares are classified as equity. Incremental costs directly attributable to the issue of new shares or options are shown in equity as a deduction from the proceeds, net of tax.
Dividend reinvestment plan shares allotted to ASX shareholders as part of the dividend rein-vestment plan (DRP) at the DRP allocation price are classified as fully paid ordinary shares.
(b) Treasury shares2015
No. of shares
2014No. of
sharesNumber of shares as at 1 July (181,269) (181,269)Issue of deferred shares under the LTI plan - -
Number of shares as at 30 June (181,269) (181,269)
The cost of treasury shares at 30 June 2015 was $8.0 million (2014: $8.0 million).
The LTIP holds treasury shares for the benefit of employees under the ASX LTI plan as described in the remuneration report. The shares, net of any tax effect, are deducted from the equity compensation reserve in equity.
The Board’s policy is to maintain an appropriate level of capital within the Group and relevant subsidiaries with the objectives of:
• meeting its compliance obligations with respect to the Financial Stability Standards, and other regulations, including international, as required by the various licences held
• sustaining prudential stability through maintaining an adequate level of equity at the Group level, cognisant of the fact that a signifi-cant allocation of capital supports the activi-ties of the two licensed central counterparty (CCP) clearing subsidiaries as discussed in note B1 and the two licensed settlement facilities
• facilitating growth of the Group’s exchange-traded and OTC markets, and provide appro-priate risk adjusted returns to shareholders.
In accordance with the Group’s objectives and policies, capital represented by cash is invested at an appropriate liquidity profile, taking into consideration the potential claims on that equity that may arise from the Group’s activities, predominantly central counterparty clearing.
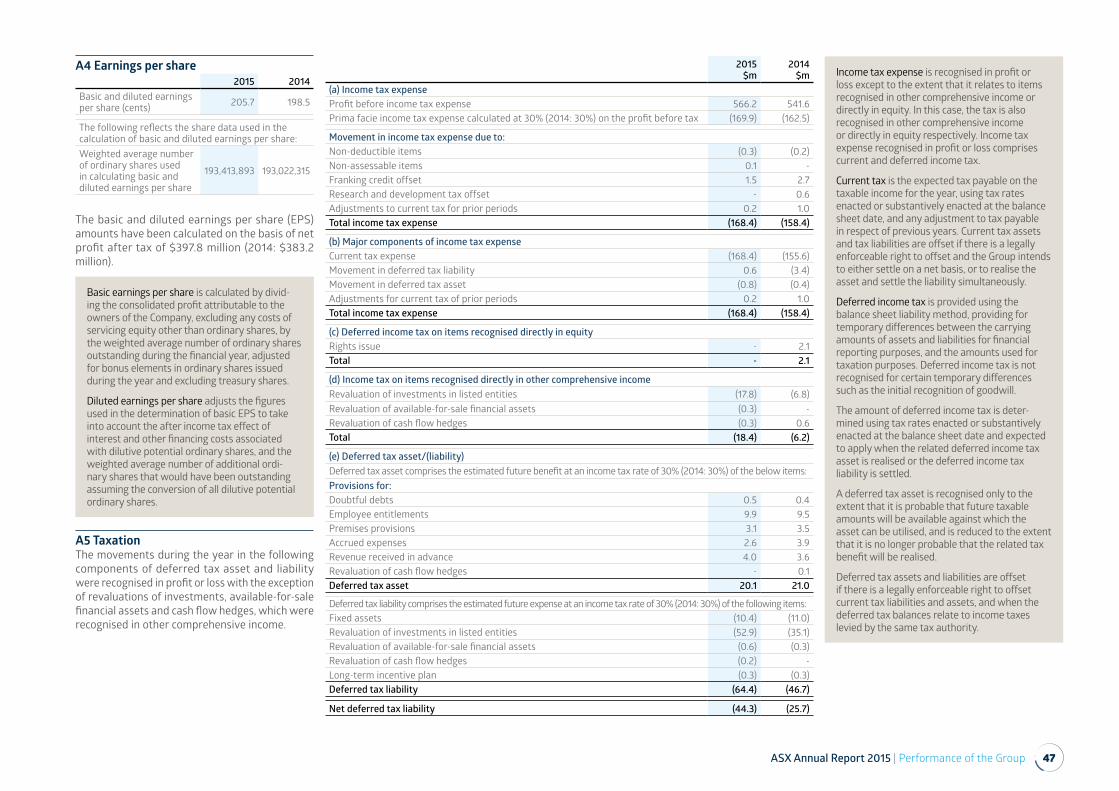
ASX Annual Report 2015 | Performance of the Group 47
A4 Earnings per share2015 2014
Basic and diluted earnings per share (cents) 205.7 198.5
The following reflects the share data used in the calculation of basic and diluted earnings per share:Weighted average number of ordinary shares used in calculating basic and diluted earnings per share
193,413,893 193,022,315
The basic and diluted earnings per share (EPS) amounts have been calculated on the basis of net profit after tax of $397.8 million (2014: $383.2 million).
Basic earnings per share is calculated by divid-ing the consolidated profit attributable to the owners of the Company, excluding any costs of servicing equity other than ordinary shares, by the weighted average number of ordinary shares outstanding during the financial year, adjusted for bonus elements in ordinary shares issued during the year and excluding treasury shares.
Diluted earnings per share adjusts the figures used in the determination of basic EPS to take into account the after income tax effect of interest and other financing costs associated with dilutive potential ordinary shares, and the weighted average number of additional ordi-nary shares that would have been outstanding assuming the conversion of all dilutive potential ordinary shares.
A5 TaxationThe movements during the year in the following components of deferred tax asset and liability were recognised in profit or loss with the exception of revaluations of investments, available-for-sale financial assets and cash flow hedges, which were recognised in other comprehensive income.
2015$m
2014$m
(a) Income tax expenseProfit before income tax expense 566.2 541.6Prima facie income tax expense calculated at 30% (2014: 30%) on the profit before tax (169.9) (162.5)
Movement in income tax expense due to:Non-deductible items (0.3) (0.2)Non-assessable items 0.1 -Franking credit offset 1.5 2.7Research and development tax offset - 0.6Adjustments to current tax for prior periods 0.2 1.0Total income tax expense (168.4) (158.4)
(b) Major components of income tax expenseCurrent tax expense (168.4) (155.6)Movement in deferred tax liability 0.6 (3.4)Movement in deferred tax asset (0.8) (0.4)Adjustments for current tax of prior periods 0.2 1.0Total income tax expense (168.4) (158.4)
(c) Deferred income tax on items recognised directly in equityRights issue - 2.1Total - 2.1
(d) Income tax on items recognised directly in other comprehensive incomeRevaluation of investments in listed entities (17.8) (6.8)Revaluation of available-for-sale financial assets (0.3) -Revaluation of cash flow hedges (0.3) 0.6Total (18.4) (6.2)
(e) Deferred tax asset/(liability)Deferred tax asset comprises the estimated future benefit at an income tax rate of 30% (2014: 30%) of the below items:Provisions for:Doubtful debts 0.5 0.4Employee entitlements 9.9 9.5Premises provisions 3.1 3.5Accrued expenses 2.6 3.9Revenue received in advance 4.0 3.6Revaluation of cash flow hedges - 0.1Deferred tax asset 20.1 21.0
Deferred tax liability comprises the estimated future expense at an income tax rate of 30% (2014: 30%) of the following items:Fixed assets (10.4) (11.0)Revaluation of investments in listed entities (52.9) (35.1)Revaluation of available-for-sale financial assets (0.6) (0.3)Revaluation of cash flow hedges (0.2) -Long-term incentive plan (0.3) (0.3)Deferred tax liability (64.4) (46.7)
Net deferred tax liability (44.3) (25.7)
Income tax expense is recognised in profit or loss except to the extent that it relates to items recognised in other comprehensive income or directly in equity. In this case, the tax is also recognised in other comprehensive income or directly in equity respectively. Income tax expense recognised in profit or loss comprises current and deferred income tax.
Current tax is the expected tax payable on the taxable income for the year, using tax rates enacted or substantively enacted at the balance sheet date, and any adjustment to tax payable in respect of previous years. Current tax assets and tax liabilities are offset if there is a legally enforceable right to offset and the Group intends to either settle on a net basis, or to realise the asset and settle the liability simultaneously.
Deferred income tax is provided using the balance sheet liability method, providing for temporary differences between the carrying amounts of assets and liabilities for financial reporting purposes, and the amounts used for taxation purposes. Deferred income tax is not recognised for certain temporary differences such as the initial recognition of goodwill.
The amount of deferred income tax is deter-mined using tax rates enacted or substantively enacted at the balance sheet date and expected to apply when the related deferred income tax asset is realised or the deferred income tax liability is settled.
A deferred tax asset is recognised only to the extent that it is probable that future taxable amounts will be available against which the asset can be utilised, and is reduced to the extent that it is no longer probable that the related tax benefit will be realised.
Deferred tax assets and liabilities are offset if there is a legally enforceable right to offset current tax liabilities and assets, and when the deferred tax balances relate to income taxes levied by the same tax authority.
48 ASX Annual Report 2015 | Risk management
Risk management
Some of the risks the Group is exposed to include clearing and settlement risk and operational risk. ASX settles equity (on average $4.3 billion per day) and debt instrument (on average $62.6 billion per day) transactions on a ‘delivery-versus-pay-ment’ basis. Settlement errors expose the Group to potenital financial and reputational losses. Operational incidents or errors can impact on the financial performance of the Group and adversely affect its reputation.
B1 Clearing risk
At 30 June, participants’ margins and commitments recognised on balance sheet comprised of:
2015$m
2014$m
Cash 3,595.1 3,668.1Debt securities 91.1 118.0Current amounts owing to participants 3,686.2 3,786.1
Participant financial backing 200.0 200.0Non-current amounts owing to participants 200.0 200.0
Total participants’ margins and commitments 3,886.2 3,986.1
Current amounts owing to participants represent collateral lodged to cover margin requirements on unsettled derivative contracts and cash market trades. Non-current amounts owing to participants represent cash balances deposited by participants as commitments to clearing guarantee funds, which at reporting date had no determined repayment date.
Subsections (a) and (b) below discuss participants obligations and the nature of collateral lodged and commitments, as well as ASX’s recognition principles concerning these liabilities.
(a) NovationThe Group has the following wholly-owned subsid-iaries that provide CCP clearing services:
• ASX Clear Pty Limited (ASX Clear), which provides novation of cash market securities and derivatives
• ASX Clear (Futures) Pty Limited (ASX Clear (Futures)), which provides novation of both exchange-traded and OTC derivatives.
Transactions between two clearing participant organisations are replaced by novation. This makes the CCPs contractually responsible for the obliga-tions entered into by clearing participants on ASX and other markets, on both the buying and selling legs of the same transaction. Through novation, the respective CCP assumes the credit risk of the underlying clearing participant in the event of a participant default. The novation process results in all positions held by the CCPs being matched.
(b) Participants marginsClearing participants are required to lodge an amount (initial margin) on open cash market and derivative positions novated to the Group’s CCPs. These margins are based on risk parameters attached to the underlying product at trade date. These are subject to regulatory standards includ-ing a high level of confidence based on historical events, however there could be circumstances where losses are greater than the margins held.
In addition to the initial margin, participants must also settle changes in the fair value of derivatives contracts (variation margin). Participants must settle both initial and variation margins daily. The amounts owing to participants are repayable on settlement or closure of the contracts.
Margins which are settled by cash or debt securi-ties are recognised on balance sheet at fair value and are classified as amounts owing to partici-pants within current liabilities. Balances lodged in cash are interest bearing and are carried at the amounts deposited which represent fair value. Margins which are settled by bank guarantees or equity securities are not recognised on balance sheet as the Group is not party to the contractual provisions of the instruments other than in the event of a default.
In the event of default by a clearing participant on its obligations under contracts, ASX Clear and ASX Clear (Futures) have the authority to retain collat-eral deposited by the defaulting clearing participant to satisfy its obligations.
As at 30 June, collateral lodged by clearing participants was as follows:
ASX ClearASX Clear (Futures)
2015$m
2014$m
2015$m
2014$m
Cash 673.7 549.8 2,921.4 3,118.3
Bank guarantees 16.0 15.7 - -
Equity securities 3,625.2 4,289.3 - -
Debt securities - - 91.1 118.0
All net delivery and net payment obligations relat-ing to cash market and derivative securities owing to or by participants as at 30 June 2015 were subse-quently settled.
(c) Financial resources available to central counterpartiesIn accordance with the Financial Stability Standards, each CCP must have adequate financial resources to support the loss of the two participants with the largest exposures in extreme but plausible circum-stances. Financial resources include the below mentioned resources as well as collateral lodged by participants. The level of financial resources may therefore increase from time to time. The Group may utilise a number of alternatives to provide these financial resources including its own cash reserves.
ASX Clear2015
$m2014
$m
Restricted capital reserve 71.5 71.5
Equity provided by the Group 103.5 103.5
Subordinated debt provided by the Group 75.0 75.0
Paid in resources 250.0 250.0
Emergency assessments 300.0 300.0
Total financial resources 550.0 550.0
The financial resources at 30 June 2015 available to ASX Clear in the event of a clearing default would be applied in the following order.
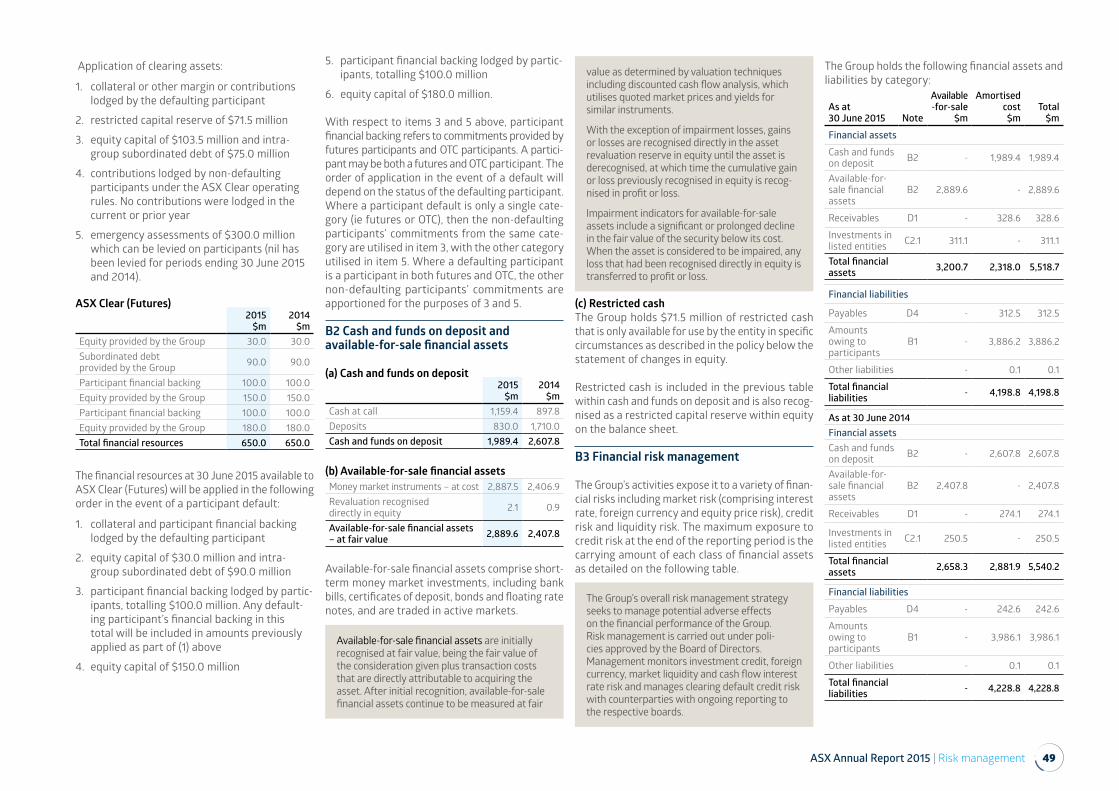
ASX Annual Report 2015 | Risk management 49
Application of clearing assets:
1. collateral or other margin or contributions lodged by the defaulting participant
2. restricted capital reserve of $71.5 million
3. equity capital of $103.5 million and intra-group subordinated debt of $75.0 million
4. contributions lodged by non-defaulting participants under the ASX Clear operating rules. No contributions were lodged in the current or prior year
5. emergency assessments of $300.0 million which can be levied on participants (nil has been levied for periods ending 30 June 2015 and 2014).
ASX Clear (Futures) 2015
$m 2014
$mEquity provided by the Group 30.0 30.0Subordinated debt provided by the Group 90.0 90.0
Participant financial backing 100.0 100.0Equity provided by the Group 150.0 150.0Participant financial backing 100.0 100.0Equity provided by the Group 180.0 180.0Total financial resources 650.0 650.0
The financial resources at 30 June 2015 available to ASX Clear (Futures) will be applied in the following order in the event of a participant default:
1. collateral and participant financial backing lodged by the defaulting participant
2. equity capital of $30.0 million and intra-group subordinated debt of $90.0 million
3. participant financial backing lodged by partic-ipants, totalling $100.0 million. Any default-ing participant’s financial backing in this total will be included in amounts previously applied as part of (1) above
4. equity capital of $150.0 million
5. participant financial backing lodged by partic-ipants, totalling $100.0 million
6. equity capital of $180.0 million.
With respect to items 3 and 5 above, participant financial backing refers to commitments provided by futures participants and OTC participants. A partici-pant may be both a futures and OTC participant. The order of application in the event of a default will depend on the status of the defaulting participant. Where a participant default is only a single cate-gory (ie futures or OTC), then the non-defaulting participants’ commitments from the same cate-gory are utilised in item 3, with the other category utilised in item 5. Where a defaulting participant is a participant in both futures and OTC, the other non-defaulting participants’ commitments are apportioned for the purposes of 3 and 5.
B2 Cash and funds on deposit and available-for-sale financial assets
(a) Cash and funds on deposit2015
$m2014
$mCash at call 1,159.4 897.8Deposits 830.0 1,710.0Cash and funds on deposit 1,989.4 2,607.8
(b) Available-for-sale financial assetsMoney market instruments – at cost 2,887.5 2,406.9Revaluation recognised directly in equity 2.1 0.9
Available-for-sale financial assets – at fair value 2,889.6 2,407.8
Available-for-sale financial assets comprise short-term money market investments, including bank bills, certificates of deposit, bonds and floating rate notes, and are traded in active markets.
Available-for-sale financial assets are initially recognised at fair value, being the fair value of the consideration given plus transaction costs that are directly attributable to acquiring the asset. After initial recognition, available-for-sale financial assets continue to be measured at fair
value as determined by valuation techniques including discounted cash flow analysis, which utilises quoted market prices and yields for similar instruments.
With the exception of impairment losses, gains or losses are recognised directly in the asset revaluation reserve in equity until the asset is derecognised, at which time the cumulative gain or loss previously recognised in equity is recog-nised in profit or loss.
Impairment indicators for available-for-sale assets include a significant or prolonged decline in the fair value of the security below its cost. When the asset is considered to be impaired, any loss that had been recognised directly in equity is transferred to profit or loss.
(c) Restricted cashThe Group holds $71.5 million of restricted cash that is only available for use by the entity in specific circumstances as described in the policy below the statement of changes in equity.
Restricted cash is included in the previous table within cash and funds on deposit and is also recog-nised as a restricted capital reserve within equity on the balance sheet.
B3 Financial risk management
The Group’s activities expose it to a variety of finan-cial risks including market risk (comprising interest rate, foreign currency and equity price risk), credit risk and liquidity risk. The maximum exposure to credit risk at the end of the reporting period is the carrying amount of each class of financial assets as detailed on the following table.
The Group holds the following financial assets and liabilities by category:
As at 30 June 2015 Note
Available -for-sale
$m
Amortised cost$m
Total$m
Financial assets
Cash and funds on deposit B2 - 1,989.4 1,989.4
Available-for-sale financial assets
B2 2,889.6 - 2,889.6
Receivables D1 - 328.6 328.6
Investments in listed entities C2.1 311.1 - 311.1
Total financial assets 3,200.7 2,318.0 5,518.7
Financial liabilities
Payables D4 - 312.5 312.5
Amounts owing to participants
B1 - 3,886.2 3,886.2
Other liabilities - 0.1 0.1
Total financial liabilities - 4,198.8 4,198.8
As at 30 June 2014Financial assetsCash and funds on deposit B2 - 2,607.8 2,607.8
Available-for-sale financial assets
B2 2,407.8 - 2,407.8
Receivables D1 - 274.1 274.1
Investments in listed entities C2.1 250.5 - 250.5
Total financial assets 2,658.3 2,881.9 5,540.2
Financial liabilities
Payables D4 - 242.6 242.6
Amounts owing to participants
B1 - 3,986.1 3,986.1
Other liabilities - 0.1 0.1
Total financial liabilities - 4,228.8 4,228.8
The Group’s overall risk management strategy seeks to manage potential adverse effects on the financial performance of the Group. Risk management is carried out under poli-cies approved by the Board of Directors. Management monitors investment credit, foreign currency, market liquidity and cash flow interest rate risk and manages clearing default credit risk with counterparties with ongoing reporting to the respective boards.
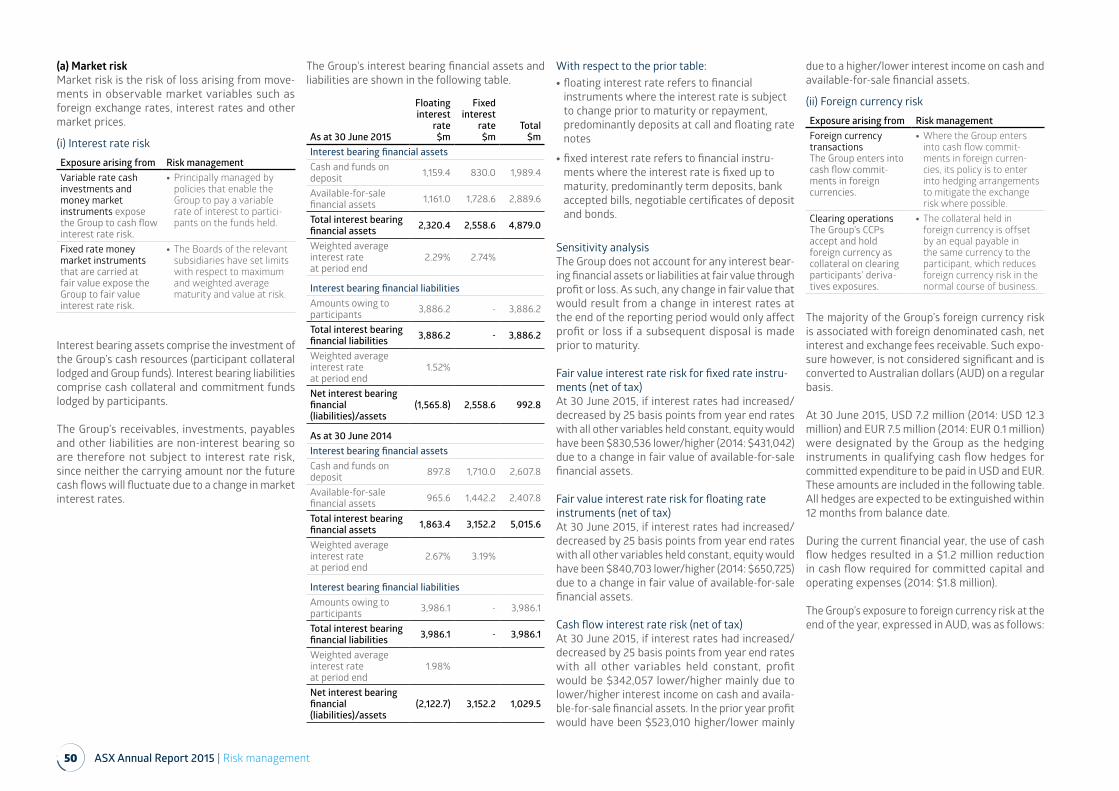
50 ASX Annual Report 2015 | Risk management
(a) Market riskMarket risk is the risk of loss arising from move-ments in observable market variables such as foreign exchange rates, interest rates and other market prices.
(i) Interest rate risk
Exposure arising from Risk managementVariable rate cash investments and money market instruments expose the Group to cash flow interest rate risk.
• Principally managed by policies that enable the Group to pay a variable rate of interest to partici-pants on the funds held.
Fixed rate money market instruments that are carried at fair value expose the Group to fair value interest rate risk.
• The Boards of the relevant subsidiaries have set limits with respect to maximum and weighted average maturity and value at risk.
Interest bearing assets comprise the investment of the Group’s cash resources (participant collateral lodged and Group funds). Interest bearing liabilities comprise cash collateral and commitment funds lodged by participants.
The Group’s receivables, investments, payables and other liabilities are non-interest bearing so are therefore not subject to interest rate risk, since neither the carrying amount nor the future cash flows will fluctuate due to a change in market interest rates.
The Group’s interest bearing financial assets and liabilities are shown in the following table.
As at 30 June 2015
Floating interest
rate$m
Fixed interest
rate$m
Total$m
Interest bearing financial assetsCash and funds on deposit 1,159.4 830.0 1,989.4
Available-for-sale financial assets 1,161.0 1,728.6 2,889.6
Total interest bearing financial assets 2,320.4 2,558.6 4,879.0
Weighted average interest rate at period end
2.29% 2.74%
Interest bearing financial liabilitiesAmounts owing to participants 3,886.2 - 3,886.2
Total interest bearing financial liabilities 3,886.2 - 3,886.2
Weighted average interest rate at period end
1.52%
Net interest bearing financial (liabilities)/assets
(1,565.8) 2,558.6 992.8
As at 30 June 2014Interest bearing financial assetsCash and funds on deposit 897.8 1,710.0 2,607.8
Available-for-sale financial assets 965.6 1,442.2 2,407.8
Total interest bearing financial assets 1,863.4 3,152.2 5,015.6
Weighted average interest rate at period end
2.67% 3.19%
Interest bearing financial liabilitiesAmounts owing to participants 3,986.1 - 3,986.1
Total interest bearing financial liabilities 3,986.1 - 3,986.1
Weighted average interest rate at period end
1.98%
Net interest bearing financial (liabilities)/assets
(2,122.7) 3,152.2 1,029.5
With respect to the prior table: • floating interest rate refers to financial instruments where the interest rate is subject to change prior to maturity or repayment, predominantly deposits at call and floating rate notes
• fixed interest rate refers to financial instru-ments where the interest rate is fixed up to maturity, predominantly term deposits, bank accepted bills, negotiable certificates of deposit and bonds.
Sensitivity analysisThe Group does not account for any interest bear-ing financial assets or liabilities at fair value through profit or loss. As such, any change in fair value that would result from a change in interest rates at the end of the reporting period would only affect profit or loss if a subsequent disposal is made prior to maturity.
Fair value interest rate risk for fixed rate instru-ments (net of tax)At 30 June 2015, if interest rates had increased/decreased by 25 basis points from year end rates with all other variables held constant, equity would have been $830,536 lower/higher (2014: $431,042) due to a change in fair value of available-for-sale financial assets.
Fair value interest rate risk for floating rate instruments (net of tax)At 30 June 2015, if interest rates had increased/decreased by 25 basis points from year end rates with all other variables held constant, equity would have been $840,703 lower/higher (2014: $650,725) due to a change in fair value of available-for-sale financial assets.
Cash flow interest rate risk (net of tax)At 30 June 2015, if interest rates had increased/decreased by 25 basis points from year end rates with all other variables held constant, profit would be $342,057 lower/higher mainly due to lower/higher interest income on cash and availa-ble-for-sale financial assets. In the prior year profit would have been $523,010 higher/lower mainly
due to a higher/lower interest income on cash and available-for-sale financial assets.
(ii) Foreign currency risk
Exposure arising from Risk managementForeign currency transactions The Group enters into cash flow commit-ments in foreign currencies.
• Where the Group enters into cash flow commit-ments in foreign curren-cies, its policy is to enter into hedging arrangements to mitigate the exchange risk where possible.
Clearing operations The Group’s CCPs accept and hold foreign currency as collateral on clearing participants’ deriva-tives exposures.
• The collateral held in foreign currency is offset by an equal payable in the same currency to the participant, which reduces foreign currency risk in the normal course of business.
The majority of the Group’s foreign currency risk is associated with foreign denominated cash, net interest and exchange fees receivable. Such expo-sure however, is not considered significant and is converted to Australian dollars (AUD) on a regular basis.
At 30 June 2015, USD 7.2 million (2014: USD 12.3 million) and EUR 7.5 million (2014: EUR 0.1 million) were designated by the Group as the hedging instruments in qualifying cash flow hedges for committed expenditure to be paid in USD and EUR. These amounts are included in the following table. All hedges are expected to be extinguished within 12 months from balance date.
During the current financial year, the use of cash flow hedges resulted in a $1.2 million reduction in cash flow required for committed capital and operating expenses (2014: $1.8 million).
The Group’s exposure to foreign currency risk at the end of the year, expressed in AUD, was as follows:
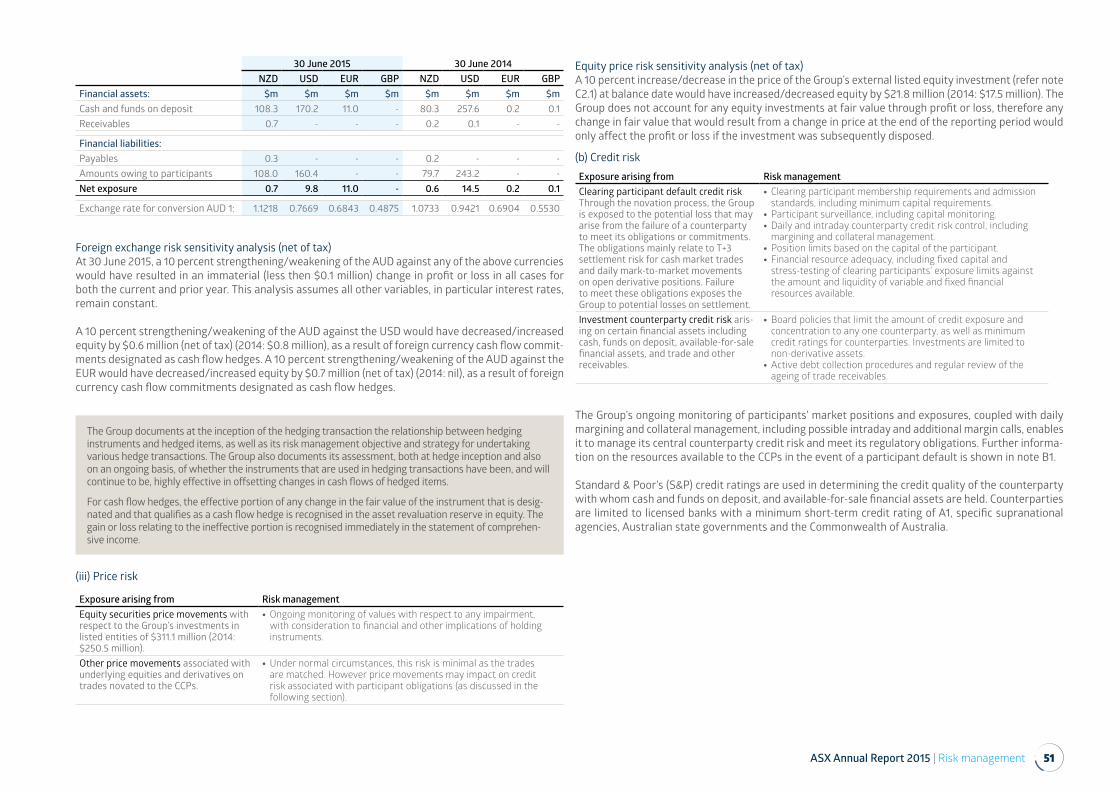
ASX Annual Report 2015 | Risk management 51
30 June 2015 30 June 2014NZD USD EUR GBP NZD USD EUR GBP
Financial assets: $m $m $m $m $m $m $m $mCash and funds on deposit 108.3 170.2 11.0 - 80.3 257.6 0.2 0.1Receivables 0.7 - - - 0.2 0.1 - -
Financial liabilities:Payables 0.3 - - - 0.2 - - -Amounts owing to participants 108.0 160.4 - - 79.7 243.2 - -Net exposure 0.7 9.8 11.0 - 0.6 14.5 0.2 0.1
Exchange rate for conversion AUD 1: 1.1218 0.7669 0.6843 0.4875 1.0733 0.9421 0.6904 0.5530
Foreign exchange risk sensitivity analysis (net of tax)At 30 June 2015, a 10 percent strengthening/weakening of the AUD against any of the above currencies would have resulted in an immaterial (less then $0.1 million) change in profit or loss in all cases for both the current and prior year. This analysis assumes all other variables, in particular interest rates, remain constant.
A 10 percent strengthening/weakening of the AUD against the USD would have decreased/increased equity by $0.6 million (net of tax) (2014: $0.8 million), as a result of foreign currency cash flow commit-ments designated as cash flow hedges. A 10 percent strengthening/weakening of the AUD against the EUR would have decreased/increased equity by $0.7 million (net of tax) (2014: nil), as a result of foreign currency cash flow commitments designated as cash flow hedges.
The Group documents at the inception of the hedging transaction the relationship between hedging instruments and hedged items, as well as its risk management objective and strategy for undertaking various hedge transactions. The Group also documents its assessment, both at hedge inception and also on an ongoing basis, of whether the instruments that are used in hedging transactions have been, and will continue to be, highly effective in offsetting changes in cash flows of hedged items.
For cash flow hedges, the effective portion of any change in the fair value of the instrument that is desig-nated and that qualifies as a cash flow hedge is recognised in the asset revaluation reserve in equity. The gain or loss relating to the ineffective portion is recognised immediately in the statement of comprehen-sive income.
(iii) Price risk
Exposure arising from Risk managementEquity securities price movements with respect to the Group’s investments in listed entities of $311.1 million (2014: $250.5 million).
• Ongoing monitoring of values with respect to any impairment, with consideration to financial and other implications of holding instruments.
Other price movements associated with underlying equities and derivatives on trades novated to the CCPs.
• Under normal circumstances, this risk is minimal as the trades are matched. However price movements may impact on credit risk associated with participant obligations (as discussed in the following section).
Equity price risk sensitivity analysis (net of tax)A 10 percent increase/decrease in the price of the Group’s external listed equity investment (refer note C2.1) at balance date would have increased/decreased equity by $21.8 million (2014: $17.5 million). The Group does not account for any equity investments at fair value through profit or loss, therefore any change in fair value that would result from a change in price at the end of the reporting period would only affect the profit or loss if the investment was subsequently disposed.
(b) Credit risk
Exposure arising from Risk managementClearing participant default credit risk Through the novation process, the Group is exposed to the potential loss that may arise from the failure of a counterparty to meet its obligations or commitments. The obligations mainly relate to T+3 settlement risk for cash market trades and daily mark-to-market movements on open derivative positions. Failure to meet these obligations exposes the Group to potential losses on settlement.
• Clearing participant membership requirements and admission standards, including minimum capital requirements.
• Participant surveillance, including capital monitoring. • Daily and intraday counterparty credit risk control, including margining and collateral management.
• Position limits based on the capital of the participant. • Financial resource adequacy, including fixed capital and stress-testing of clearing participants’ exposure limits against the amount and liquidity of variable and fixed financial resources available.
Investment counterparty credit risk aris-ing on certain financial assets including cash, funds on deposit, available-for-sale financial assets, and trade and other receivables.
• Board policies that limit the amount of credit exposure and concentration to any one counterparty, as well as minimum credit ratings for counterparties. Investments are limited to non-derivative assets.
• Active debt collection procedures and regular review of the ageing of trade receivables.
The Group’s ongoing monitoring of participants’ market positions and exposures, coupled with daily margining and collateral management, including possible intraday and additional margin calls, enables it to manage its central counterparty credit risk and meet its regulatory obligations. Further informa-tion on the resources available to the CCPs in the event of a participant default is shown in note B1.
Standard & Poor’s (S&P) credit ratings are used in determining the credit quality of the counterparty with whom cash and funds on deposit, and available-for-sale financial assets are held. Counterparties are limited to licensed banks with a minimum short-term credit rating of A1, specific supranational agencies, Australian state governments and the Commonwealth of Australia.
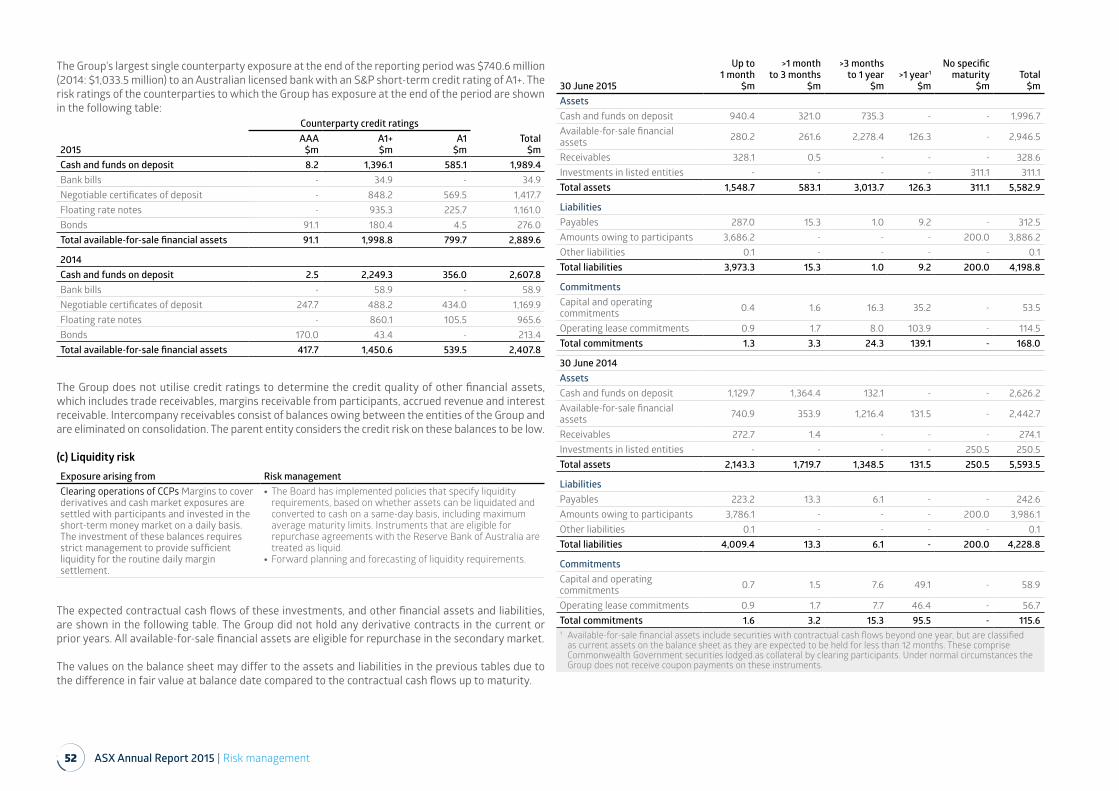
52 ASX Annual Report 2015 | Risk management
The Group’s largest single counterparty exposure at the end of the reporting period was $740.6 million (2014: $1,033.5 million) to an Australian licensed bank with an S&P short-term credit rating of A1+. The risk ratings of the counterparties to which the Group has exposure at the end of the period are shown in the following table:
2015
Counterparty credit ratingsAAA
$mA1+ $m
A1 $m
Total $m
Cash and funds on deposit 8.2 1,396.1 585.1 1,989.4Bank bills - 34.9 - 34.9Negotiable certificates of deposit - 848.2 569.5 1,417.7Floating rate notes - 935.3 225.7 1,161.0Bonds 91.1 180.4 4.5 276.0Total available-for-sale financial assets 91.1 1,998.8 799.7 2,889.6
2014Cash and funds on deposit 2.5 2,249.3 356.0 2,607.8Bank bills - 58.9 - 58.9Negotiable certificates of deposit 247.7 488.2 434.0 1,169.9Floating rate notes - 860.1 105.5 965.6Bonds 170.0 43.4 - 213.4Total available-for-sale financial assets 417.7 1,450.6 539.5 2,407.8
The Group does not utilise credit ratings to determine the credit quality of other financial assets, which includes trade receivables, margins receivable from participants, accrued revenue and interest receivable. Intercompany receivables consist of balances owing between the entities of the Group and are eliminated on consolidation. The parent entity considers the credit risk on these balances to be low.
(c) Liquidity riskExposure arising from Risk managementClearing operations of CCPs Margins to cover derivatives and cash market exposures are settled with participants and invested in the short-term money market on a daily basis. The investment of these balances requires strict management to provide sufficient liquidity for the routine daily margin settlement.
• The Board has implemented policies that specify liquidity requirements, based on whether assets can be liquidated and converted to cash on a same-day basis, including maximum average maturity limits. Instruments that are eligible for repurchase agreements with the Reserve Bank of Australia are treated as liquid.
• Forward planning and forecasting of liquidity requirements.
The expected contractual cash flows of these investments, and other financial assets and liabilities, are shown in the following table. The Group did not hold any derivative contracts in the current or prior years. All available-for-sale financial assets are eligible for repurchase in the secondary market.
The values on the balance sheet may differ to the assets and liabilities in the previous tables due to the difference in fair value at balance date compared to the contractual cash flows up to maturity.
30 June 2015
Up to 1 month
$m
>1 month to 3 months
$m
>3 monthsto 1 year
$m>1 year1
$m
No specific maturity
$mTotal
$mAssetsCash and funds on deposit 940.4 321.0 735.3 - - 1,996.7Available-for-sale financial assets 280.2 261.6 2,278.4 126.3 - 2,946.5
Receivables 328.1 0.5 - - - 328.6Investments in listed entities - - - - 311.1 311.1Total assets 1,548.7 583.1 3,013.7 126.3 311.1 5,582.9
LiabilitiesPayables 287.0 15.3 1.0 9.2 - 312.5Amounts owing to participants 3,686.2 - - - 200.0 3,886.2Other liabilities 0.1 - - - - 0.1Total liabilities 3,973.3 15.3 1.0 9.2 200.0 4,198.8
CommitmentsCapital and operating commitments 0.4 1.6 16.3 35.2 - 53.5
Operating lease commitments 0.9 1.7 8.0 103.9 - 114.5Total commitments 1.3 3.3 24.3 139.1 - 168.0
30 June 2014AssetsCash and funds on deposit 1,129.7 1,364.4 132.1 - - 2,626.2Available-for-sale financial assets 740.9 353.9 1,216.4 131.5 - 2,442.7
Receivables 272.7 1.4 - - - 274.1Investments in listed entities - - - - 250.5 250.5Total assets 2,143.3 1,719.7 1,348.5 131.5 250.5 5,593.5
LiabilitiesPayables 223.2 13.3 6.1 - - 242.6Amounts owing to participants 3,786.1 - - - 200.0 3,986.1Other liabilities 0.1 - - - - 0.1Total liabilities 4,009.4 13.3 6.1 - 200.0 4,228.8
CommitmentsCapital and operating commitments 0.7 1.5 7.6 49.1 - 58.9
Operating lease commitments 0.9 1.7 7.7 46.4 - 56.7Total commitments 1.6 3.2 15.3 95.5 - 115.61 Available-for-sale financial assets include securities with contractual cash flows beyond one year, but are classified
as current assets on the balance sheet as they are expected to be held for less than 12 months. These comprise Commonwealth Government securities lodged as collateral by clearing participants. Under normal circumstances the Group does not receive coupon payments on these instruments.
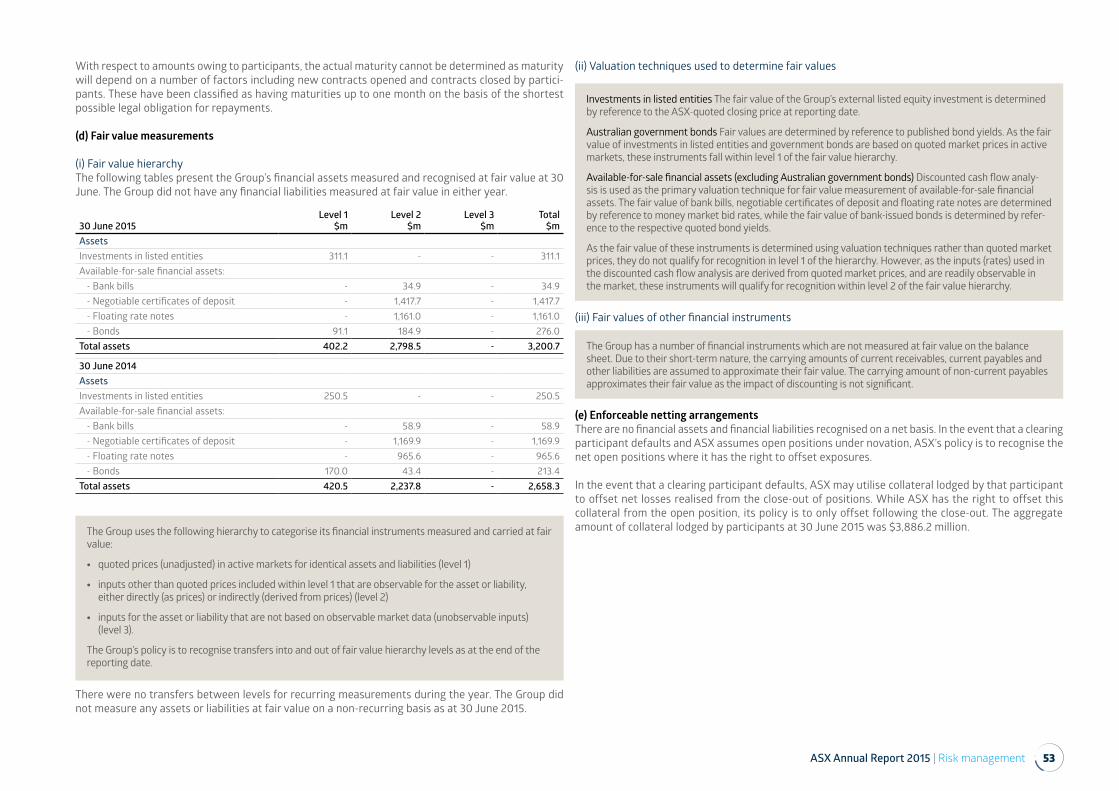
ASX Annual Report 2015 | Risk management 53
With respect to amounts owing to participants, the actual maturity cannot be determined as maturity will depend on a number of factors including new contracts opened and contracts closed by partici-pants. These have been classified as having maturities up to one month on the basis of the shortest possible legal obligation for repayments.
(d) Fair value measurements
(i) Fair value hierarchy The following tables present the Group’s financial assets measured and recognised at fair value at 30 June. The Group did not have any financial liabilities measured at fair value in either year.
30 June 2015Level 1
$mLevel 2
$mLevel 3
$mTotal
$mAssetsInvestments in listed entities 311.1 - - 311.1Available-for-sale financial assets:
- Bank bills - 34.9 - 34.9- Negotiable certificates of deposit - 1,417.7 - 1,417.7- Floating rate notes - 1,161.0 - 1,161.0- Bonds 91.1 184.9 - 276.0
Total assets 402.2 2,798.5 - 3,200.7
30 June 2014AssetsInvestments in listed entities 250.5 - - 250.5Available-for-sale financial assets:
- Bank bills - 58.9 - 58.9- Negotiable certificates of deposit - 1,169.9 - 1,169.9- Floating rate notes - 965.6 - 965.6- Bonds 170.0 43.4 - 213.4
Total assets 420.5 2,237.8 - 2,658.3
The Group uses the following hierarchy to categorise its financial instruments measured and carried at fair value:
• quoted prices (unadjusted) in active markets for identical assets and liabilities (level 1)
• inputs other than quoted prices included within level 1 that are observable for the asset or liability, either directly (as prices) or indirectly (derived from prices) (level 2)
• inputs for the asset or liability that are not based on observable market data (unobservable inputs) (level 3).
The Group’s policy is to recognise transfers into and out of fair value hierarchy levels as at the end of the reporting date.
There were no transfers between levels for recurring measurements during the year. The Group did not measure any assets or liabilities at fair value on a non-recurring basis as at 30 June 2015.
(ii) Valuation techniques used to determine fair values
Investments in listed entities The fair value of the Group’s external listed equity investment is determined by reference to the ASX-quoted closing price at reporting date.
Australian government bonds Fair values are determined by reference to published bond yields. As the fair value of investments in listed entities and government bonds are based on quoted market prices in active markets, these instruments fall within level 1 of the fair value hierarchy.
Available-for-sale financial assets (excluding Australian government bonds) Discounted cash flow analy-sis is used as the primary valuation technique for fair value measurement of available-for-sale financial assets. The fair value of bank bills, negotiable certificates of deposit and floating rate notes are determined by reference to money market bid rates, while the fair value of bank-issued bonds is determined by refer-ence to the respective quoted bond yields.
As the fair value of these instruments is determined using valuation techniques rather than quoted market prices, they do not qualify for recognition in level 1 of the hierarchy. However, as the inputs (rates) used in the discounted cash flow analysis are derived from quoted market prices, and are readily observable in the market, these instruments will qualify for recognition within level 2 of the fair value hierarchy.
(iii) Fair values of other financial instruments
The Group has a number of financial instruments which are not measured at fair value on the balance sheet. Due to their short-term nature, the carrying amounts of current receivables, current payables and other liabilities are assumed to approximate their fair value. The carrying amount of non-current payables approximates their fair value as the impact of discounting is not significant.
(e) Enforceable netting arrangementsThere are no financial assets and financial liabilities recognised on a net basis. In the event that a clearing participant defaults and ASX assumes open positions under novation, ASX’s policy is to recognise the net open positions where it has the right to offset exposures.
In the event that a clearing participant defaults, ASX may utilise collateral lodged by that participant to offset net losses realised from the close-out of positions. While ASX has the right to offset this collateral from the open position, its policy is to only offset following the close-out. The aggregate amount of collateral lodged by participants at 30 June 2015 was $3,886.2 million.
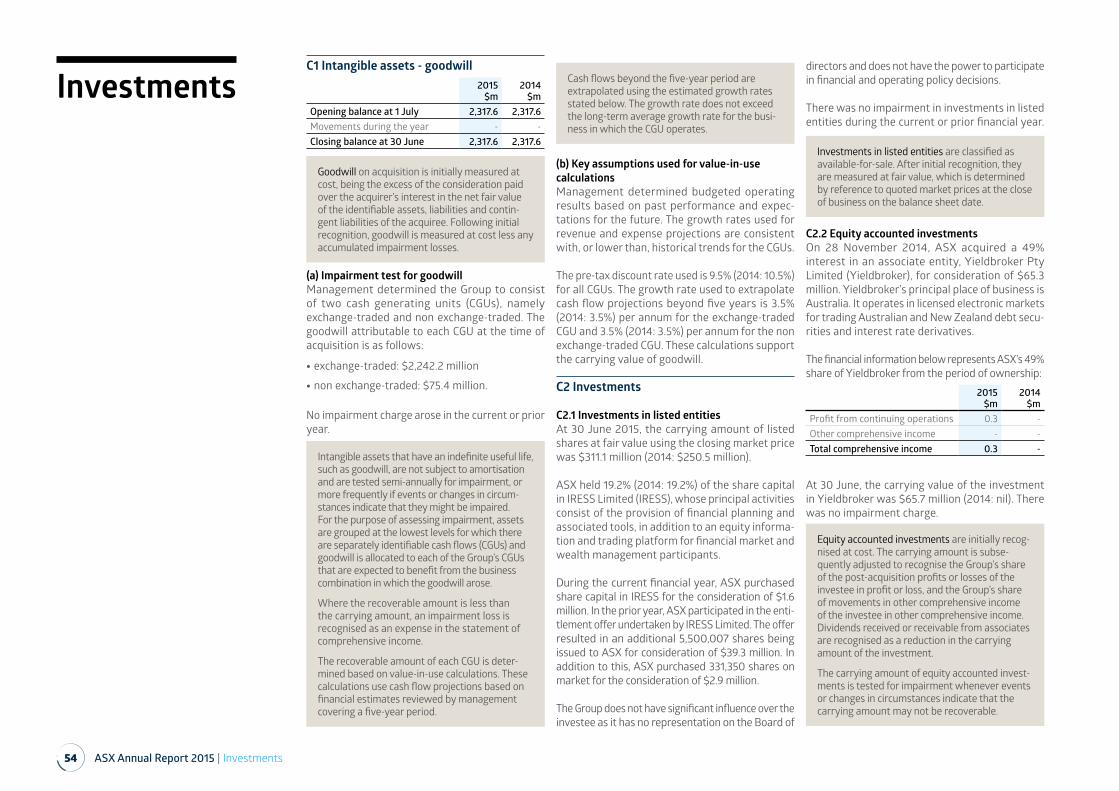
54 ASX Annual Report 2015 | Investments
InvestmentsC1 Intangible assets - goodwill
2015$m
2014$m
Opening balance at 1 July 2,317.6 2,317.6Movements during the year - -Closing balance at 30 June 2,317.6 2,317.6
Goodwill on acquisition is initially measured at cost, being the excess of the consideration paid over the acquirer’s interest in the net fair value of the identifiable assets, liabilities and contin-gent liabilities of the acquiree. Following initial recognition, goodwill is measured at cost less any accumulated impairment losses.
(a) Impairment test for goodwillManagement determined the Group to consist of two cash generating units (CGUs), namely exchange-traded and non exchange-traded. The goodwill attributable to each CGU at the time of acquisition is as follows:
• exchange-traded: $2,242.2 million
• non exchange-traded: $75.4 million.
No impairment charge arose in the current or prior year.
Intangible assets that have an indefinite useful life, such as goodwill, are not subject to amortisation and are tested semi-annually for impairment, or more frequently if events or changes in circum-stances indicate that they might be impaired. For the purpose of assessing impairment, assets are grouped at the lowest levels for which there are separately identifiable cash flows (CGUs) and goodwill is allocated to each of the Group’s CGUs that are expected to benefit from the business combination in which the goodwill arose.
Where the recoverable amount is less than the carrying amount, an impairment loss is recognised as an expense in the statement of comprehensive income.
The recoverable amount of each CGU is deter-mined based on value-in-use calculations. These calculations use cash flow projections based on financial estimates reviewed by management covering a five-year period.
Cash flows beyond the five-year period are extrapolated using the estimated growth rates stated below. The growth rate does not exceed the long-term average growth rate for the busi-ness in which the CGU operates.
(b) Key assumptions used for value-in-use calculationsManagement determined budgeted operating results based on past performance and expec-tations for the future. The growth rates used for revenue and expense projections are consistent with, or lower than, historical trends for the CGUs.
The pre-tax discount rate used is 9.5% (2014: 10.5%) for all CGUs. The growth rate used to extrapolate cash flow projections beyond five years is 3.5% (2014: 3.5%) per annum for the exchange-traded CGU and 3.5% (2014: 3.5%) per annum for the non exchange-traded CGU. These calculations support the carrying value of goodwill.
C2 Investments
C2.1 Investments in listed entitiesAt 30 June 2015, the carrying amount of listed shares at fair value using the closing market price was $311.1 million (2014: $250.5 million).
ASX held 19.2% (2014: 19.2%) of the share capital in IRESS Limited (IRESS), whose principal activities consist of the provision of financial planning and associated tools, in addition to an equity informa-tion and trading platform for financial market and wealth management participants.
During the current financial year, ASX purchased share capital in IRESS for the consideration of $1.6 million. In the prior year, ASX participated in the enti-tlement offer undertaken by IRESS Limited. The offer resulted in an additional 5,500,007 shares being issued to ASX for consideration of $39.3 million. In addition to this, ASX purchased 331,350 shares on market for the consideration of $2.9 million.
The Group does not have significant influence over the investee as it has no representation on the Board of
directors and does not have the power to participate in financial and operating policy decisions.
There was no impairment in investments in listed entities during the current or prior financial year.
Investments in listed entities are classified as available-for-sale. After initial recognition, they are measured at fair value, which is determined by reference to quoted market prices at the close of business on the balance sheet date.
C2.2 Equity accounted investmentsOn 28 November 2014, ASX acquired a 49% interest in an associate entity, Yieldbroker Pty Limited (Yieldbroker), for consideration of $65.3 million. Yieldbroker’s principal place of business is Australia. It operates in licensed electronic markets for trading Australian and New Zealand debt secu-rities and interest rate derivatives.
The financial information below represents ASX’s 49% share of Yieldbroker from the period of ownership:
2015$m
2014$m
Profit from continuing operations 0.3 -Other comprehensive income - -Total comprehensive income 0.3 -
At 30 June, the carrying value of the investment in Yieldbroker was $65.7 million (2014: nil). There was no impairment charge.
Equity accounted investments are initially recog-nised at cost. The carrying amount is subse-quently adjusted to recognise the Group’s share of the post-acquisition profits or losses of the investee in profit or loss, and the Group’s share of movements in other comprehensive income of the investee in other comprehensive income. Dividends received or receivable from associates are recognised as a reduction in the carrying amount of the investment.
The carrying amount of equity accounted invest-ments is tested for impairment whenever events or changes in circumstances indicate that the carrying amount may not be recoverable.
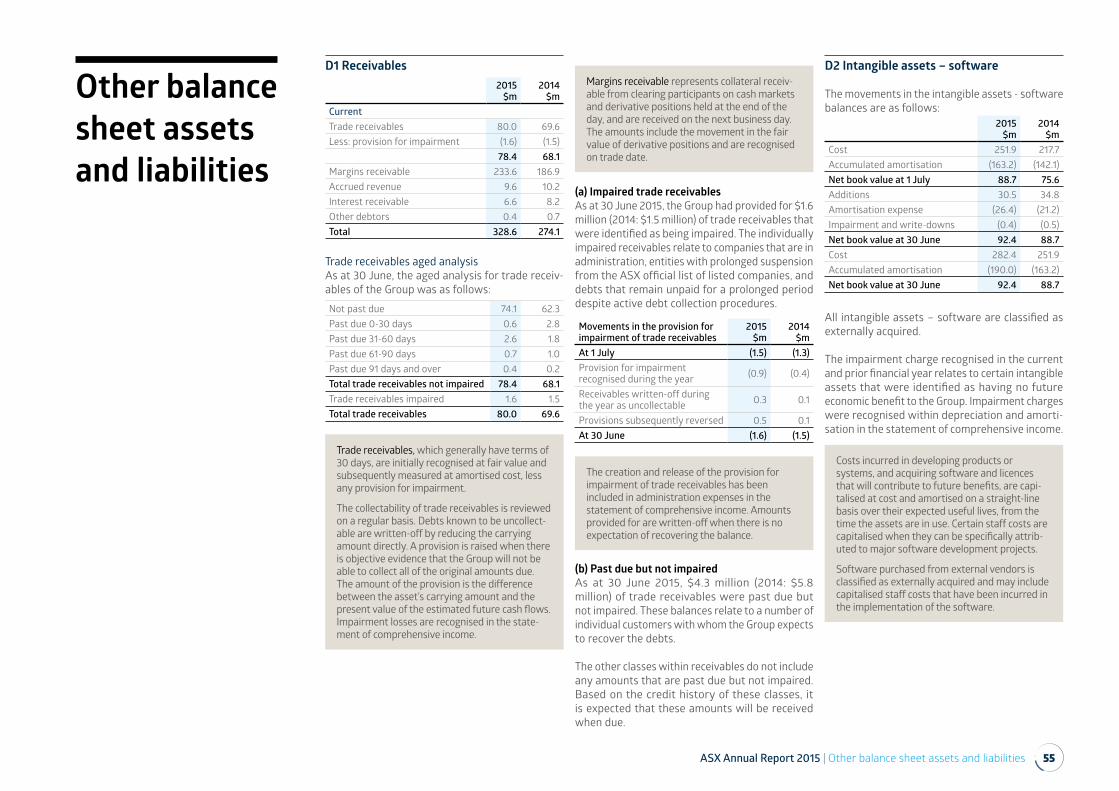
ASX Annual Report 2015 | Other balance sheet assets and liabilities 55
Other balance sheet assets and liabilities
D1 Receivables2015
$m2014
$mCurrentTrade receivables 80.0 69.6Less: provision for impairment (1.6) (1.5)
78.4 68.1Margins receivable 233.6 186.9Accrued revenue 9.6 10.2Interest receivable 6.6 8.2Other debtors 0.4 0.7Total 328.6 274.1
Trade receivables aged analysisAs at 30 June, the aged analysis for trade receiv-ables of the Group was as follows:
Not past due 74.1 62.3Past due 0-30 days 0.6 2.8Past due 31-60 days 2.6 1.8Past due 61-90 days 0.7 1.0Past due 91 days and over 0.4 0.2Total trade receivables not impaired 78.4 68.1Trade receivables impaired 1.6 1.5Total trade receivables 80.0 69.6
Trade receivables, which generally have terms of 30 days, are initially recognised at fair value and subsequently measured at amortised cost, less any provision for impairment.
The collectability of trade receivables is reviewed on a regular basis. Debts known to be uncollect-able are written-off by reducing the carrying amount directly. A provision is raised when there is objective evidence that the Group will not be able to collect all of the original amounts due. The amount of the provision is the difference between the asset’s carrying amount and the present value of the estimated future cash flows. Impairment losses are recognised in the state-ment of comprehensive income.
Margins receivable represents collateral receiv-able from clearing participants on cash markets and derivative positions held at the end of the day, and are received on the next business day. The amounts include the movement in the fair value of derivative positions and are recognised on trade date.
(a) Impaired trade receivablesAs at 30 June 2015, the Group had provided for $1.6 million (2014: $1.5 million) of trade receivables that were identified as being impaired. The individually impaired receivables relate to companies that are in administration, entities with prolonged suspension from the ASX official list of listed companies, and debts that remain unpaid for a prolonged period despite active debt collection procedures.
Movements in the provision for impairment of trade receivables
2015$m
2014$m
At 1 July (1.5) (1.3)Provision for impairment recognised during the year (0.9) (0.4)
Receivables written-off during the year as uncollectable 0.3 0.1
Provisions subsequently reversed 0.5 0.1At 30 June (1.6) (1.5)
The creation and release of the provision for impairment of trade receivables has been included in administration expenses in the statement of comprehensive income. Amounts provided for are written-off when there is no expectation of recovering the balance.
(b) Past due but not impairedAs at 30 June 2015, $4.3 million (2014: $5.8 million) of trade receivables were past due but not impaired. These balances relate to a number of individual customers with whom the Group expects to recover the debts.
The other classes within receivables do not include any amounts that are past due but not impaired. Based on the credit history of these classes, it is expected that these amounts will be received when due.
D2 Intangible assets – software
The movements in the intangible assets - software balances are as follows:
2015$m
2014$m
Cost 251.9 217.7Accumulated amortisation (163.2) (142.1)Net book value at 1 July 88.7 75.6Additions 30.5 34.8Amortisation expense (26.4) (21.2)Impairment and write-downs (0.4) (0.5)Net book value at 30 June 92.4 88.7Cost 282.4 251.9Accumulated amortisation (190.0) (163.2)Net book value at 30 June 92.4 88.7
All intangible assets – software are classified as externally acquired.
The impairment charge recognised in the current and prior financial year relates to certain intangible assets that were identified as having no future economic benefit to the Group. Impairment charges were recognised within depreciation and amorti-sation in the statement of comprehensive income.
Costs incurred in developing products or systems, and acquiring software and licences that will contribute to future benefits, are capi-talised at cost and amortised on a straight-line basis over their expected useful lives, from the time the assets are in use. Certain staff costs are capitalised when they can be specifically attrib-uted to major software development projects.
Software purchased from external vendors is classified as externally acquired and may include capitalised staff costs that have been incurred in the implementation of the software.
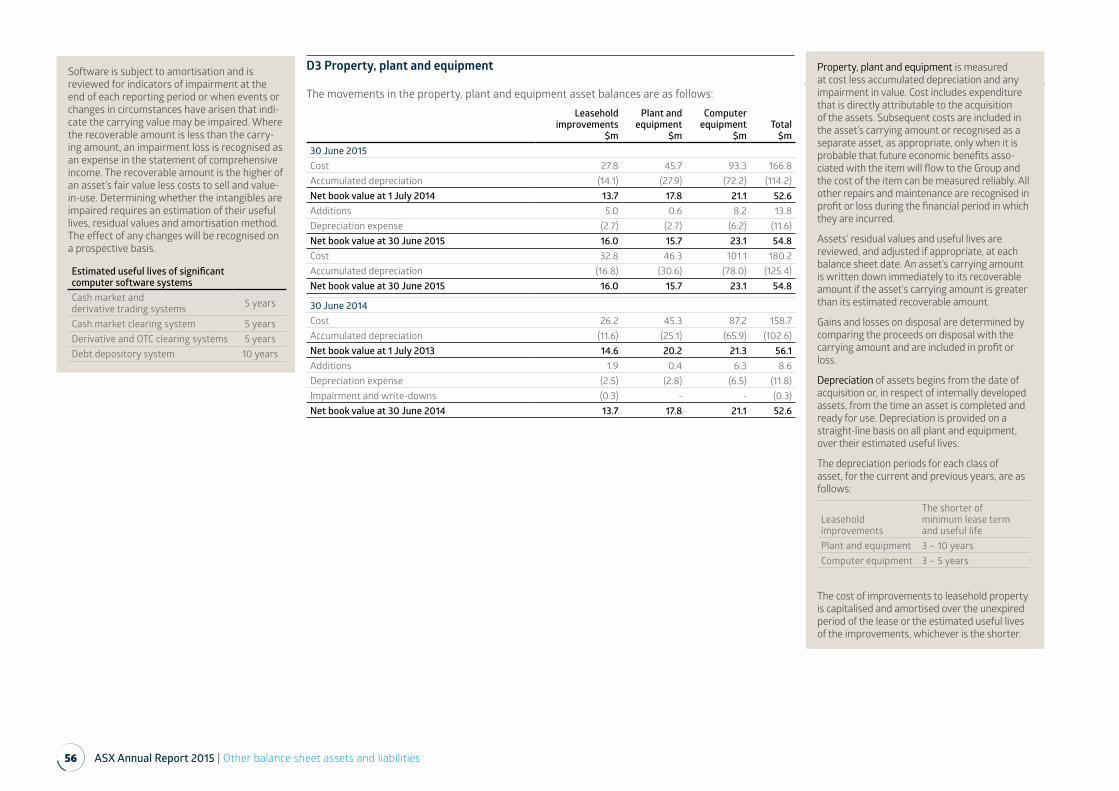
56 ASX Annual Report 2015 | Other balance sheet assets and liabilities
Software is subject to amortisation and is reviewed for indicators of impairment at the end of each reporting period or when events or changes in circumstances have arisen that indi-cate the carrying value may be impaired. Where the recoverable amount is less than the carry-ing amount, an impairment loss is recognised as an expense in the statement of comprehensive income. The recoverable amount is the higher of an asset’s fair value less costs to sell and value-in-use. Determining whether the intangibles are impaired requires an estimation of their useful lives, residual values and amortisation method. The effect of any changes will be recognised on a prospective basis.
Estimated useful lives of significant computer software systemsCash market and derivative trading systems 5 years
Cash market clearing system 5 yearsDerivative and OTC clearing systems 5 yearsDebt depository system 10 years
D3 Property, plant and equipment
The movements in the property, plant and equipment asset balances are as follows:
Leaseholdimprovements
$m
Plant and equipment
$m
Computer equipment
$mTotal
$m30 June 2015Cost 27.8 45.7 93.3 166.8Accumulated depreciation (14.1) (27.9) (72.2) (114.2)Net book value at 1 July 2014 13.7 17.8 21.1 52.6Additions 5.0 0.6 8.2 13.8Depreciation expense (2.7) (2.7) (6.2) (11.6)Net book value at 30 June 2015 16.0 15.7 23.1 54.8Cost 32.8 46.3 101.1 180.2Accumulated depreciation (16.8) (30.6) (78.0) (125.4)Net book value at 30 June 2015 16.0 15.7 23.1 54.8
30 June 2014Cost 26.2 45.3 87.2 158.7Accumulated depreciation (11.6) (25.1) (65.9) (102.6)Net book value at 1 July 2013 14.6 20.2 21.3 56.1Additions 1.9 0.4 6.3 8.6Depreciation expense (2.5) (2.8) (6.5) (11.8)Impairment and write-downs (0.3) - - (0.3)Net book value at 30 June 2014 13.7 17.8 21.1 52.6
Property, plant and equipment is measured at cost less accumulated depreciation and any impairment in value. Cost includes expenditure that is directly attributable to the acquisition of the assets. Subsequent costs are included in the asset’s carrying amount or recognised as a separate asset, as appropriate, only when it is probable that future economic benefits asso-ciated with the item will flow to the Group and the cost of the item can be measured reliably. All other repairs and maintenance are recognised in profit or loss during the financial period in which they are incurred.
Assets’ residual values and useful lives are reviewed, and adjusted if appropriate, at each balance sheet date. An asset’s carrying amount is written down immediately to its recoverable amount if the asset’s carrying amount is greater than its estimated recoverable amount.
Gains and losses on disposal are determined by comparing the proceeds on disposal with the carrying amount and are included in profit or loss.
Depreciation of assets begins from the date of acquisition or, in respect of internally developed assets, from the time an asset is completed and ready for use. Depreciation is provided on a straight-line basis on all plant and equipment, over their estimated useful lives.
The depreciation periods for each class of asset, for the current and previous years, are as follows:
Leasehold improvements
The shorter of minimum lease term and useful life
Plant and equipment 3 – 10 yearsComputer equipment 3 – 5 years
The cost of improvements to leasehold property is capitalised and amortised over the unexpired period of the lease or the estimated useful lives of the improvements, whichever is the shorter.
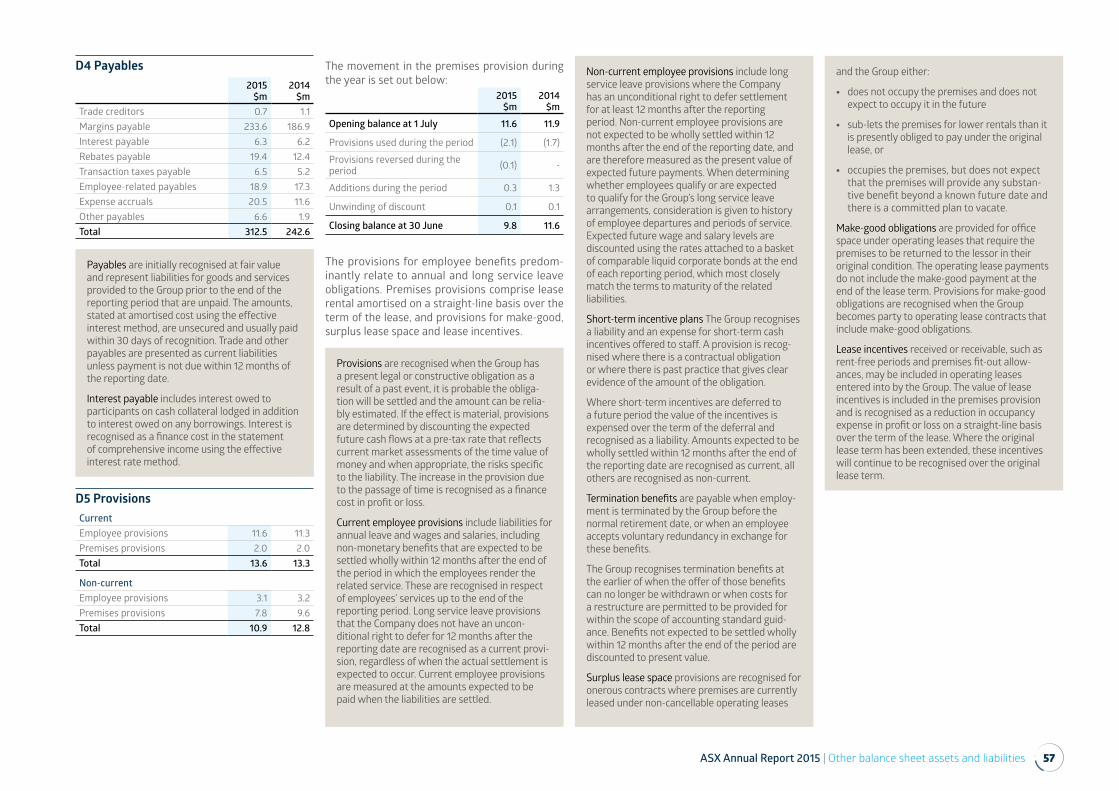
ASX Annual Report 2015 | Other balance sheet assets and liabilities 57
D4 Payables2015
$m2014
$mTrade creditors 0.7 1.1Margins payable 233.6 186.9Interest payable 6.3 6.2Rebates payable 19.4 12.4Transaction taxes payable 6.5 5.2Employee-related payables 18.9 17.3Expense accruals 20.5 11.6Other payables 6.6 1.9Total 312.5 242.6
Payables are initially recognised at fair value and represent liabilities for goods and services provided to the Group prior to the end of the reporting period that are unpaid. The amounts, stated at amortised cost using the effective interest method, are unsecured and usually paid within 30 days of recognition. Trade and other payables are presented as current liabilities unless payment is not due within 12 months of the reporting date.
Interest payable includes interest owed to participants on cash collateral lodged in addition to interest owed on any borrowings. Interest is recognised as a finance cost in the statement of comprehensive income using the effective interest rate method.
D5 ProvisionsCurrentEmployee provisions 11.6 11.3Premises provisions 2.0 2.0Total 13.6 13.3
Non-currentEmployee provisions 3.1 3.2Premises provisions 7.8 9.6Total 10.9 12.8
The movement in the premises provision during the year is set out below:
2015$m
2014$m
Opening balance at 1 July 11.6 11.9
Provisions used during the period (2.1) (1.7)
Provisions reversed during the period (0.1) -
Additions during the period 0.3 1.3
Unwinding of discount 0.1 0.1
Closing balance at 30 June 9.8 11.6
The provisions for employee benefits predom-inantly relate to annual and long service leave obligations. Premises provisions comprise lease rental amortised on a straight-line basis over the term of the lease, and provisions for make-good, surplus lease space and lease incentives.
and the Group either:
• does not occupy the premises and does not expect to occupy it in the future
• sub-lets the premises for lower rentals than it is presently obliged to pay under the original lease, or
• occupies the premises, but does not expect that the premises will provide any substan-tive benefit beyond a known future date and there is a committed plan to vacate.
Make-good obligations are provided for office space under operating leases that require the premises to be returned to the lessor in their original condition. The operating lease payments do not include the make-good payment at the end of the lease term. Provisions for make-good obligations are recognised when the Group becomes party to operating lease contracts that include make-good obligations.
Lease incentives received or receivable, such as rent-free periods and premises fit-out allow-ances, may be included in operating leases entered into by the Group. The value of lease incentives is included in the premises provision and is recognised as a reduction in occupancy expense in profit or loss on a straight-line basis over the term of the lease. Where the original lease term has been extended, these incentives will continue to be recognised over the original lease term.
Non-current employee provisions include long service leave provisions where the Company has an unconditional right to defer settlement for at least 12 months after the reporting period. Non-current employee provisions are not expected to be wholly settled within 12 months after the end of the reporting date, and are therefore measured as the present value of expected future payments. When determining whether employees qualify or are expected to qualify for the Group’s long service leave arrangements, consideration is given to history of employee departures and periods of service. Expected future wage and salary levels are discounted using the rates attached to a basket of comparable liquid corporate bonds at the end of each reporting period, which most closely match the terms to maturity of the related liabilities.
Short-term incentive plans The Group recognises a liability and an expense for short-term cash incentives offered to staff. A provision is recog-nised where there is a contractual obligation or where there is past practice that gives clear evidence of the amount of the obligation.
Where short-term incentives are deferred to a future period the value of the incentives is expensed over the term of the deferral and recognised as a liability. Amounts expected to be wholly settled within 12 months after the end of the reporting date are recognised as current, all others are recognised as non-current.
Termination benefits are payable when employ-ment is terminated by the Group before the normal retirement date, or when an employee accepts voluntary redundancy in exchange for these benefits.
The Group recognises termination benefits at the earlier of when the offer of those benefits can no longer be withdrawn or when costs for a restructure are permitted to be provided for within the scope of accounting standard guid-ance. Benefits not expected to be settled wholly within 12 months after the end of the period are discounted to present value.
Surplus lease space provisions are recognised for onerous contracts where premises are currently leased under non-cancellable operating leases
Provisions are recognised when the Group has a present legal or constructive obligation as a result of a past event, it is probable the obliga-tion will be settled and the amount can be relia-bly estimated. If the effect is material, provisions are determined by discounting the expected future cash flows at a pre-tax rate that reflects current market assessments of the time value of money and when appropriate, the risks specific to the liability. The increase in the provision due to the passage of time is recognised as a finance cost in profit or loss.
Current employee provisions include liabilities for annual leave and wages and salaries, including non-monetary benefits that are expected to be settled wholly within 12 months after the end of the period in which the employees render the related service. These are recognised in respect of employees’ services up to the end of the reporting period. Long service leave provisions that the Company does not have an uncon-ditional right to defer for 12 months after the reporting date are recognised as a current provi-sion, regardless of when the actual settlement is expected to occur. Current employee provisions are measured at the amounts expected to be paid when the liabilities are settled.
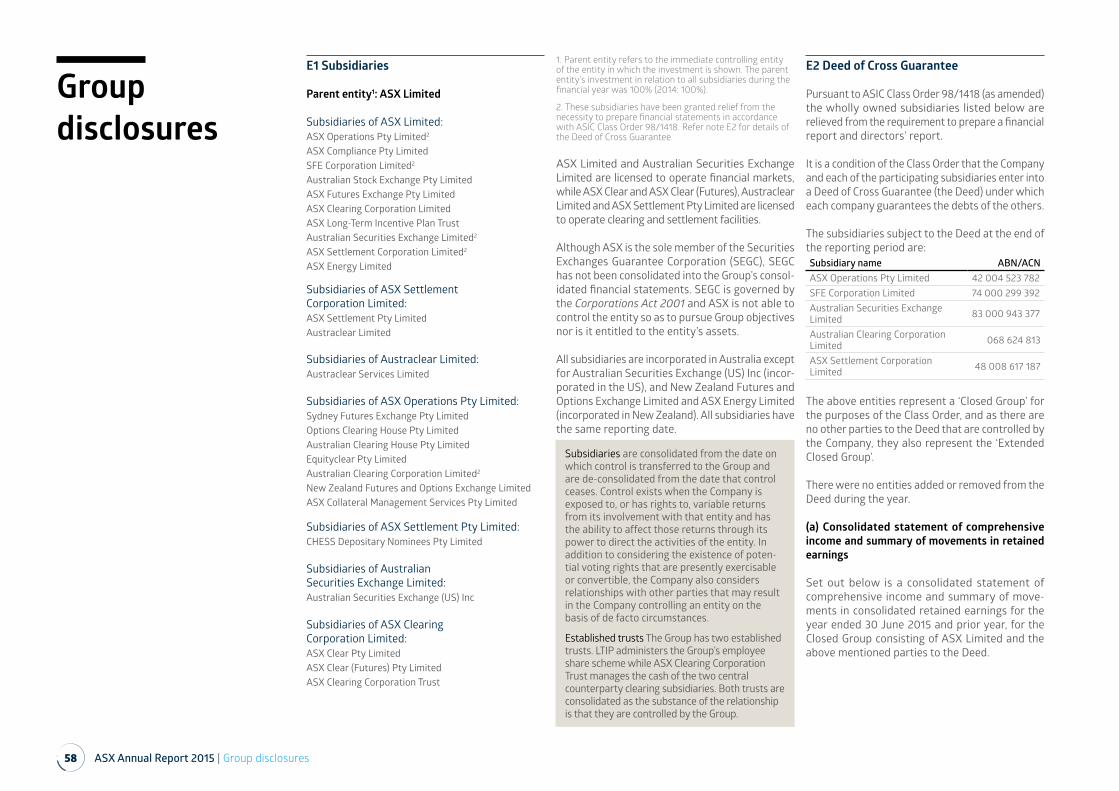
58 ASX Annual Report 2015 | Group disclosures
Group disclosures
E1 Subsidiaries
Parent entity1: ASX Limited
Subsidiaries of ASX Limited:ASX Operations Pty Limited2
ASX Compliance Pty LimitedSFE Corporation Limited2
Australian Stock Exchange Pty LimitedASX Futures Exchange Pty LimitedASX Clearing Corporation Limited ASX Long-Term Incentive Plan TrustAustralian Securities Exchange Limited2
ASX Settlement Corporation Limited2
ASX Energy Limited
Subsidiaries of ASX Settlement Corporation Limited:ASX Settlement Pty LimitedAustraclear Limited
Subsidiaries of Austraclear Limited: Austraclear Services Limited
Subsidiaries of ASX Operations Pty Limited:Sydney Futures Exchange Pty Limited Options Clearing House Pty LimitedAustralian Clearing House Pty LimitedEquityclear Pty LimitedAustralian Clearing Corporation Limited2
New Zealand Futures and Options Exchange LimitedASX Collateral Management Services Pty Limited
Subsidiaries of ASX Settlement Pty Limited: CHESS Depositary Nominees Pty Limited
Subsidiaries of Australian Securities Exchange Limited:Australian Securities Exchange (US) Inc
Subsidiaries of ASX Clearing Corporation Limited:ASX Clear Pty LimitedASX Clear (Futures) Pty Limited ASX Clearing Corporation Trust
1. Parent entity refers to the immediate controlling entity of the entity in which the investment is shown. The parent entity’s investment in relation to all subsidiaries during the financial year was 100% (2014: 100%).
2. These subsidiaries have been granted relief from the necessity to prepare financial statements in accordance with ASIC Class Order 98/1418. Refer note E2 for details of the Deed of Cross Guarantee.
ASX Limited and Australian Securities Exchange Limited are licensed to operate financial markets, while ASX Clear and ASX Clear (Futures), Austraclear Limited and ASX Settlement Pty Limited are licensed to operate clearing and settlement facilities.
Although ASX is the sole member of the Securities Exchanges Guarantee Corporation (SEGC), SEGC has not been consolidated into the Group’s consol-idated financial statements. SEGC is governed by the Corporations Act 2001 and ASX is not able to control the entity so as to pursue Group objectives nor is it entitled to the entity’s assets.
All subsidiaries are incorporated in Australia except for Australian Securities Exchange (US) Inc (incor-porated in the US), and New Zealand Futures and Options Exchange Limited and ASX Energy Limited (incorporated in New Zealand). All subsidiaries have the same reporting date.
E2 Deed of Cross Guarantee
Pursuant to ASIC Class Order 98/1418 (as amended) the wholly owned subsidiaries listed below are relieved from the requirement to prepare a financial report and directors’ report.
It is a condition of the Class Order that the Company and each of the participating subsidiaries enter into a Deed of Cross Guarantee (the Deed) under which each company guarantees the debts of the others.
The subsidiaries subject to the Deed at the end of the reporting period are:Subsidiary name ABN/ACNASX Operations Pty Limited 42 004 523 782SFE Corporation Limited 74 000 299 392Australian Securities Exchange Limited 83 000 943 377
Australian Clearing Corporation Limited 068 624 813
ASX Settlement Corporation Limited 48 008 617 187
The above entities represent a ‘Closed Group’ for the purposes of the Class Order, and as there are no other parties to the Deed that are controlled by the Company, they also represent the ‘Extended Closed Group’.
There were no entities added or removed from the Deed during the year.
(a) Consolidated statement of comprehensive income and summary of movements in retained earnings
Set out below is a consolidated statement of comprehensive income and summary of move-ments in consolidated retained earnings for the year ended 30 June 2015 and prior year, for the Closed Group consisting of ASX Limited and the above mentioned parties to the Deed.
Subsidiaries are consolidated from the date on which control is transferred to the Group and are de-consolidated from the date that control ceases. Control exists when the Company is exposed to, or has rights to, variable returns from its involvement with that entity and has the ability to affect those returns through its power to direct the activities of the entity. In addition to considering the existence of poten-tial voting rights that are presently exercisable or convertible, the Company also considers relationships with other parties that may result in the Company controlling an entity on the basis of de facto circumstances.
Established trusts The Group has two established trusts. LTIP administers the Group’s employee share scheme while ASX Clearing Corporation Trust manages the cash of the two central counterparty clearing subsidiaries. Both trusts are consolidated as the substance of the relationship is that they are controlled by the Group.
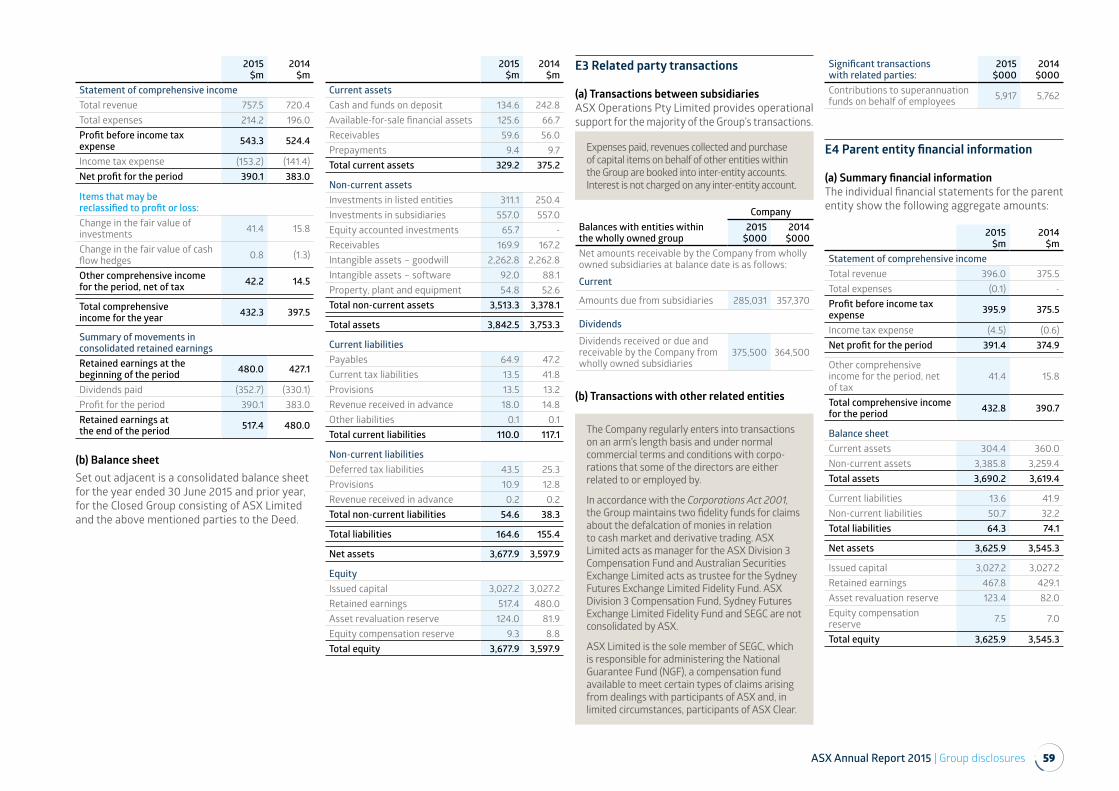
ASX Annual Report 2015 | Group disclosures 59
2015$m
2014$m
Statement of comprehensive incomeTotal revenue 757.5 720.4Total expenses 214.2 196.0Profit before income tax expense 543.3 524.4
Income tax expense (153.2) (141.4)Net profit for the period 390.1 383.0
Items that may be reclassified to profit or loss:Change in the fair value of investments 41.4 15.8
Change in the fair value of cash flow hedges 0.8 (1.3)
Other comprehensive income for the period, net of tax 42.2 14.5
Total comprehensive income for the year 432.3 397.5
Summary of movements in consolidated retained earningsRetained earnings at the beginning of the period 480.0 427.1
Dividends paid (352.7) (330.1)Profit for the period 390.1 383.0Retained earnings at the end of the period 517.4 480.0
(b) Balance sheetSet out adjacent is a consolidated balance sheet for the year ended 30 June 2015 and prior year, for the Closed Group consisting of ASX Limited and the above mentioned parties to the Deed.
2015$m
2014$m
Current assetsCash and funds on deposit 134.6 242.8Available-for-sale financial assets 125.6 66.7Receivables 59.6 56.0Prepayments 9.4 9.7Total current assets 329.2 375.2
Non-current assetsInvestments in listed entities 311.1 250.4Investments in subsidiaries 557.0 557.0Equity accounted investments 65.7 -Receivables 169.9 167.2Intangible assets – goodwill 2,262.8 2,262.8Intangible assets – software 92.0 88.1Property, plant and equipment 54.8 52.6Total non-current assets 3,513.3 3,378.1
Total assets 3,842.5 3,753.3
Current liabilitiesPayables 64.9 47.2Current tax liabilities 13.5 41.8Provisions 13.5 13.2Revenue received in advance 18.0 14.8Other liabilities 0.1 0.1Total current liabilities 110.0 117.1
Non-current liabilitiesDeferred tax liabilities 43.5 25.3Provisions 10.9 12.8Revenue received in advance 0.2 0.2Total non-current liabilities 54.6 38.3
Total liabilities 164.6 155.4
Net assets 3,677.9 3,597.9
EquityIssued capital 3,027.2 3,027.2Retained earnings 517.4 480.0Asset revaluation reserve 124.0 81.9Equity compensation reserve 9.3 8.8Total equity 3,677.9 3,597.9
E3 Related party transactions
(a) Transactions between subsidiariesASX Operations Pty Limited provides operational support for the majority of the Group’s transactions.
Expenses paid, revenues collected and purchase of capital items on behalf of other entities within the Group are booked into inter-entity accounts. Interest is not charged on any inter-entity account.
CompanyBalances with entities within the wholly owned group
2015$000
2014$000
Net amounts receivable by the Company from wholly owned subsidiaries at balance date is as follows:
Current
Amounts due from subsidiaries 285,031 357,370
Dividends
Dividends received or due and receivable by the Company from wholly owned subsidiaries
375,500 364,500
(b) Transactions with other related entities
The Company regularly enters into transactions on an arm’s length basis and under normal commercial terms and conditions with corpo-rations that some of the directors are either related to or employed by.
In accordance with the Corporations Act 2001, the Group maintains two fidelity funds for claims about the defalcation of monies in relation to cash market and derivative trading. ASX Limited acts as manager for the ASX Division 3 Compensation Fund and Australian Securities Exchange Limited acts as trustee for the Sydney Futures Exchange Limited Fidelity Fund. ASX Division 3 Compensation Fund, Sydney Futures Exchange Limited Fidelity Fund and SEGC are not consolidated by ASX.
ASX Limited is the sole member of SEGC, which is responsible for administering the National Guarantee Fund (NGF), a compensation fund available to meet certain types of claims arising from dealings with participants of ASX and, in limited circumstances, participants of ASX Clear.
Significant transactions with related parties:
2015$000
2014$000
Contributions to superannuation funds on behalf of employees 5,917 5,762
E4 Parent entity financial information
(a) Summary financial informationThe individual financial statements for the parent entity show the following aggregate amounts:
2015$m
2014$m
Statement of comprehensive incomeTotal revenue 396.0 375.5Total expenses (0.1) -Profit before income tax expense 395.9 375.5
Income tax expense (4.5) (0.6)Net profit for the period 391.4 374.9
Other comprehensive income for the period, net of tax
41.4 15.8
Total comprehensive income for the period 432.8 390.7
Balance sheetCurrent assets 304.4 360.0Non-current assets 3,385.8 3,259.4Total assets 3,690.2 3,619.4
Current liabilities 13.6 41.9Non-current liabilities 50.7 32.2Total liabilities 64.3 74.1
Net assets 3,625.9 3,545.3
Issued capital 3,027.2 3,027.2Retained earnings 467.8 429.1Asset revaluation reserve 123.4 82.0Equity compensation reserve 7.5 7.0
Total equity 3,625.9 3,545.3
60 ASX Annual Report 2015 | Group disclosures
The financial information for the parent entity, ASX, has been prepared on the same basis as the consolidated financial statements, except as set out below.
Unlisted shares in subsidiaries are accounted for at cost in the financial statements of ASX.
Tax consolidation ASX elected to form a tax consolidated group for income tax purposes. ASX is the head entity and is therefore liable for the income tax liabilities of the tax consol-idated group. The consolidated current and deferred tax amounts arising from temporary differences of the members of the tax consol-idated group are recognised in the separate financial statements of the members of the tax consolidated group using the ‘separate taxpayer within group’ approach.
Tax funding agreement ASX has entered into a tax funding agreement with members of the Australian tax consolidation group. The agreement has the objective of achieving an appropriate allocation of the Group’s income tax expense to the main operating subsidiaries within the Group. The tax funding agreement also has the objective of allocating deferred tax assets relating to tax losses only, and current tax liabilities of the main operating subsidiaries to ASX. The subsidiaries will reimburse ASX for their portion of the Group’s current tax liability and will recognise this payment as an inter-en-tity payable or receivable in their financial statements for that financial year. ASX will reimburse the subsidiaries for the deferred tax asset from any unused tax losses or credits by making a payment equal to the carrying value of the deferred tax asset.
(b) Guarantees entered into by the parent entityThe parent entity, ASX, is party to a Deed of Cross Guarantee together with the entities defined in note E2. Under the Deed, the Company guarantees to each creditor payment in full of any debt in the event of winding up of any of the subsidiaries under certain provisions of the Corporations Act 2001. No deficiencies of assets exist in any of these entities.
ASX is also party to an agreement whereby it undertakes, in certain circumstances, to replen-ish any shortfall of share capital in ASX Clearing
Corporation Limited up to a maximum of $33.5 million. In addition, ASX also guarantees to make, or procures ASX Clearing Corporation Limited to make, such loan advances that may be required to ensure that the combined outstanding principal amount of the subordinated loans provided by ASX Clearing Corporation Limited to ASX Clear and ASX Clear (Futures) do not fall below $145.0 million. Both of the above undertakings are subject to the solvency of ASX Clear and ASX Clear (Futures), and the occurrence of other limited and specific circum-stances. There was no shortfall in either share capital or subordinated loan balances as at 30 June 2015 or 30 June 2014. Further details in regards to the subordinated loans are provided in note B1.
(c) Contractual commitments and contingenciesASX has entered into an agreement with ASX Clear for a $150 million standby loan facility that may be used in limited and specific circumstances following default of clearing participants.
ASX has entered into an agreement with CHESS Depositary Nominees Pty Limited (CDN) which provides $10 million (2014: $10 million) in funds to support CDN’s licence obligations. No payments were made under either facility in the current or prior year.
The National Guarantee Fund (NGF), which is administered by SEGC, is maintained to provide compensation for prescribed claims arising from dealings with market participants as set out in the Corporations Act 2001. If the net assets of the NGF fall below the minimum amount determined by the Minister, SEGC may determine that ASX must pay a levy to SEGC. Where a levy becomes paya-ble, ASX may determine that market participants must pay a levy, provided that the total amounts payable under this levy do not exceed the amount payable by ASX to SEGC. No levies were called in the current or prior year.
In accordance with the Australian Financial Services Licence of ASX Collateral Management Services Pty Limited, the Group has an obligation to fund any amounts required to the subsidiary.
ASX Limited did not have any other contractual commitments or contingent liabilities as at 30 June 2015 or 30 June 2014.
(d) BorrowingsThe Group did not have any drawn borrowings during the current or previous financial year. During the year ASX Limited entered into a five-year unsecured facility that can only be called upon to provide short-term liquidity to ASX Clear following a clearing participant default. The facility limit is $100 million and remained undrawn at the date of this report.
E5 Other disclosures
E5.1 Commitments(a) Capital commitmentsCapital commitments contracted for but not yet incurred as at balance date are as follows:
2015$m
2014$m
Intangible assets - software 4.4 -
(b) Operating lease commitmentsCommitments for minimum lease payments of non-cancellable leases:Due:Not later than one year 10.6 10.3Later than one year but not later than five years 38.6 29.7
Later than five years 65.3 16.7Total 114.5 56.7
The Group’s major leases are for the premises from which it operates. These leases are all generally long-term with unexpired periods up to 13 years, with options to extend for further periods included in certain lease agreements. Future rentals are subject to indexation and periodical rent reviews. The operating lease expense for the year was $10.4 million (2014: $10.8 million).
Operating leases are those in which a significant portion of the risks and rewards of ownership are not transferred to the Group as lessee. Payments made under operating leases are recognised in profit or loss on a straight-line basis over the period of the lease. Where oper-ating leases have fixed increases, the payments are recognised over the period of the lease on a straight-line basis.
E5.2 Share-based paymentsThe Group provides performance rights to ordinary shares of the Company to employees as part of the LTI plan to recognise performance, skills and behav-iours that deliver sustainable long-term share-holder value. They entitle certain Key Management Personnel (KMP) to performance rights over ASX Limited shares.
Under the plans, participants are granted perfor-mance rights that only vest if certain performance conditions are met. All performance rights are to be settled by physical delivery of ordinary shares in ASX Limited subject to the performance conditions being attained.
The number of rights that vest depends on an EPS hurdle being achieved and ASX’s total share-holder return (TSR) relative to a comparator group comprising the S&P/ASX 100 constituents (excluding resource companies and property trusts) established at the beginning of the performance period, as well as selected overseas exchanges. The plans do not carry rights to dividends. The terms and conditions of these grants are shown in the following table.
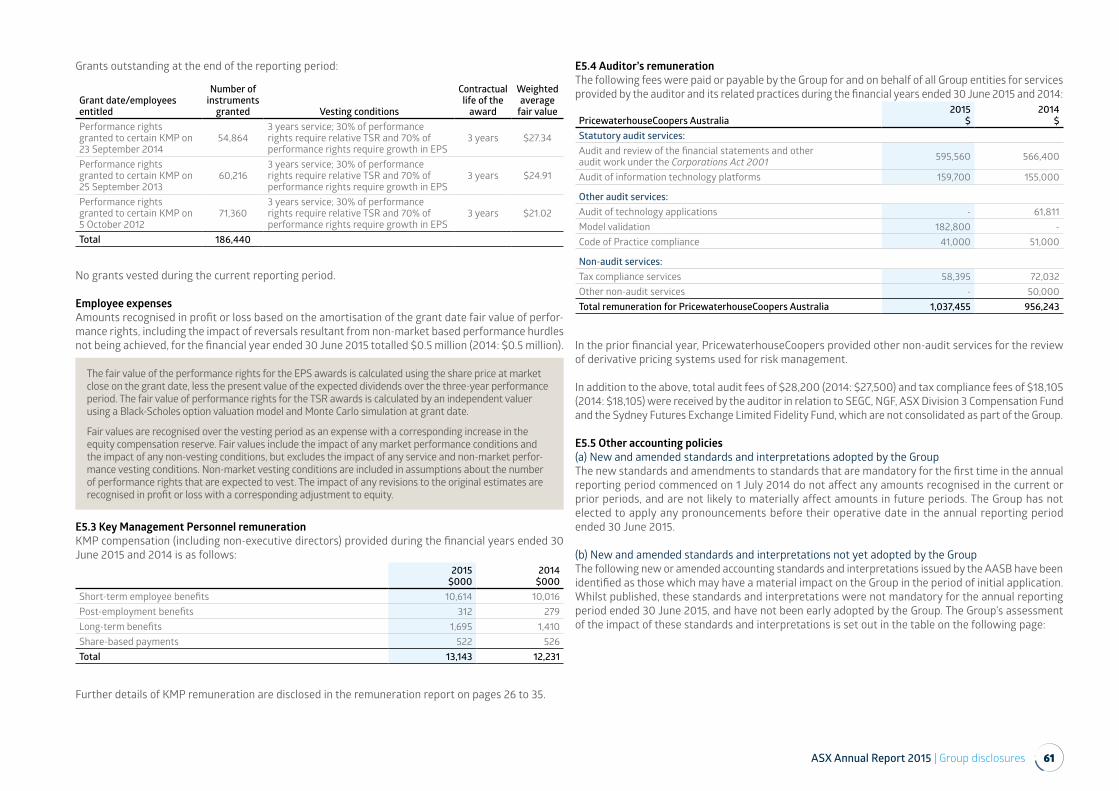
ASX Annual Report 2015 | Group disclosures 61
Grants outstanding at the end of the reporting period:
Grant date/employees entitled
Number of instruments
granted Vesting conditions
Contractual life of the
award
Weighted average
fair valuePerformance rights granted to certain KMP on 23 September 2014
54,8643 years service; 30% of performance rights require relative TSR and 70% of performance rights require growth in EPS
3 years $27.34
Performance rights granted to certain KMP on 25 September 2013
60,2163 years service; 30% of performance rights require relative TSR and 70% of performance rights require growth in EPS
3 years $24.91
Performance rights granted to certain KMP on 5 October 2012
71,3603 years service; 30% of performance rights require relative TSR and 70% of performance rights require growth in EPS
3 years $21.02
Total 186,440
No grants vested during the current reporting period.
Employee expensesAmounts recognised in profit or loss based on the amortisation of the grant date fair value of perfor-mance rights, including the impact of reversals resultant from non-market based performance hurdles not being achieved, for the financial year ended 30 June 2015 totalled $0.5 million (2014: $0.5 million).
The fair value of the performance rights for the EPS awards is calculated using the share price at market close on the grant date, less the present value of the expected dividends over the three-year performance period. The fair value of performance rights for the TSR awards is calculated by an independent valuer using a Black-Scholes option valuation model and Monte Carlo simulation at grant date.
Fair values are recognised over the vesting period as an expense with a corresponding increase in the equity compensation reserve. Fair values include the impact of any market performance conditions and the impact of any non-vesting conditions, but excludes the impact of any service and non-market perfor-mance vesting conditions. Non-market vesting conditions are included in assumptions about the number of performance rights that are expected to vest. The impact of any revisions to the original estimates are recognised in profit or loss with a corresponding adjustment to equity.
E5.3 Key Management Personnel remunerationKMP compensation (including non-executive directors) provided during the financial years ended 30 June 2015 and 2014 is as follows:
2015$000
2014$000
Short-term employee benefits 10,614 10,016Post-employment benefits 312 279Long-term benefits 1,695 1,410Share-based payments 522 526Total 13,143 12,231
Further details of KMP remuneration are disclosed in the remuneration report on pages 26 to 35.
E5.4 Auditor’s remunerationThe following fees were paid or payable by the Group for and on behalf of all Group entities for services provided by the auditor and its related practices during the financial years ended 30 June 2015 and 2014:
PricewaterhouseCoopers Australia2015
$2014
$Statutory audit services:Audit and review of the financial statements and other audit work under the Corporations Act 2001 595,560 566,400
Audit of information technology platforms 159,700 155,000
Other audit services:Audit of technology applications - 61,811Model validation 182,800 -Code of Practice compliance 41,000 51,000
Non-audit services:Tax compliance services 58,395 72,032Other non-audit services - 50,000Total remuneration for PricewaterhouseCoopers Australia 1,037,455 956,243
In the prior financial year, PricewaterhouseCoopers provided other non-audit services for the review of derivative pricing systems used for risk management.
In addition to the above, total audit fees of $28,200 (2014: $27,500) and tax compliance fees of $18,105 (2014: $18,105) were received by the auditor in relation to SEGC, NGF, ASX Division 3 Compensation Fund and the Sydney Futures Exchange Limited Fidelity Fund, which are not consolidated as part of the Group.
E5.5 Other accounting policies(a) New and amended standards and interpretations adopted by the GroupThe new standards and amendments to standards that are mandatory for the first time in the annual reporting period commenced on 1 July 2014 do not affect any amounts recognised in the current or prior periods, and are not likely to materially affect amounts in future periods. The Group has not elected to apply any pronouncements before their operative date in the annual reporting period ended 30 June 2015.
(b) New and amended standards and interpretations not yet adopted by the GroupThe following new or amended accounting standards and interpretations issued by the AASB have been identified as those which may have a material impact on the Group in the period of initial application. Whilst published, these standards and interpretations were not mandatory for the annual reporting period ended 30 June 2015, and have not been early adopted by the Group. The Group’s assessment of the impact of these standards and interpretations is set out in the table on the following page:
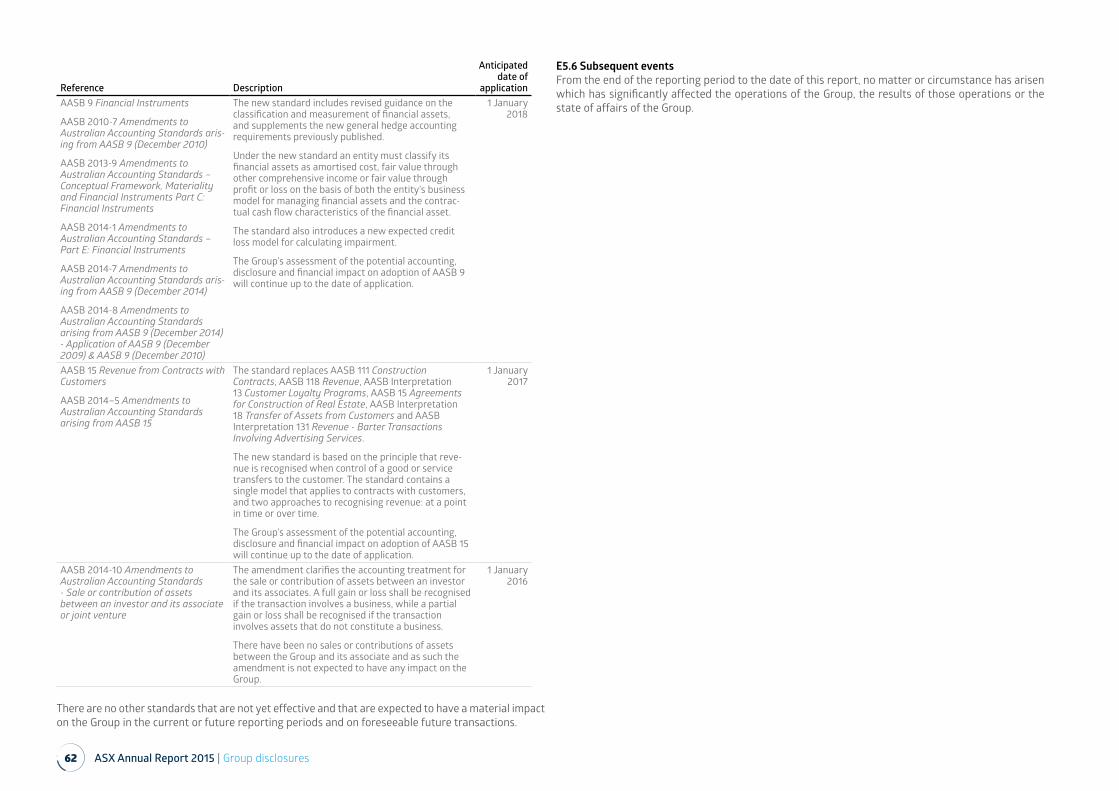
62 ASX Annual Report 2015 | Group disclosures
E5.6 Subsequent eventsFrom the end of the reporting period to the date of this report, no matter or circumstance has arisen which has significantly affected the operations of the Group, the results of those operations or the state of affairs of the Group.
Reference Description
Anticipated date of
applicationAASB 9 Financial Instruments
AASB 2010-7 Amendments to Australian Accounting Standards aris-ing from AASB 9 (December 2010)
AASB 2013-9 Amendments to Australian Accounting Standards – Conceptual Framework, Materiality and Financial Instruments Part C: Financial Instruments
AASB 2014-1 Amendments to Australian Accounting Standards – Part E: Financial Instruments
AASB 2014-7 Amendments to Australian Accounting Standards aris-ing from AASB 9 (December 2014)
AASB 2014-8 Amendments to Australian Accounting Standards arising from AASB 9 (December 2014) - Application of AASB 9 (December 2009) & AASB 9 (December 2010)
The new standard includes revised guidance on the classification and measurement of financial assets, and supplements the new general hedge accounting requirements previously published.
Under the new standard an entity must classify its financial assets as amortised cost, fair value through other comprehensive income or fair value through profit or loss on the basis of both the entity’s business model for managing financial assets and the contrac-tual cash flow characteristics of the financial asset.
The standard also introduces a new expected credit loss model for calculating impairment.
The Group’s assessment of the potential accounting, disclosure and financial impact on adoption of AASB 9 will continue up to the date of application.
1 January 2018
AASB 15 Revenue from Contracts with Customers
AASB 2014–5 Amendments to Australian Accounting Standards arising from AASB 15
The standard replaces AASB 111 Construction Contracts, AASB 118 Revenue, AASB Interpretation 13 Customer Loyalty Programs, AASB 15 Agreements for Construction of Real Estate, AASB Interpretation 18 Transfer of Assets from Customers and AASB Interpretation 131 Revenue - Barter Transactions Involving Advertising Services.
The new standard is based on the principle that reve-nue is recognised when control of a good or service transfers to the customer. The standard contains a single model that applies to contracts with customers, and two approaches to recognising revenue: at a point in time or over time.
The Group’s assessment of the potential accounting, disclosure and financial impact on adoption of AASB 15 will continue up to the date of application.
1 January 2017
AASB 2014-10 Amendments to Australian Accounting Standards - Sale or contribution of assets between an investor and its associate or joint venture
The amendment clarifies the accounting treatment for the sale or contribution of assets between an investor and its associates. A full gain or loss shall be recognised if the transaction involves a business, while a partial gain or loss shall be recognised if the transaction involves assets that do not constitute a business.
There have been no sales or contributions of assets between the Group and its associate and as such the amendment is not expected to have any impact on the Group.
1 January 2016
There are no other standards that are not yet effective and that are expected to have a material impact on the Group in the current or future reporting periods and on foreseeable future transactions.
ASX Annual Report 2015 | Directors’ declaration 63
Directors’ declaration
In the opinion of the directors of ASX Limited (the Company):
a. the financial statements and notes that are contained in pages 39 to 62 and the remu-neration report set out on pages 26 to 35 in the Annual Report, are in accordance with the Corporations Act 2001, including:
i. giving a true and fair view of the consol-idated entity’s financial position as at 30 June 2015 and of its performance for the financial year ended on that date, and
ii. complying with Australian Accounting Standards, the Corporations Regulations 2001 and other mandatory professional reporting requirements
b. there are reasonable grounds to believe that the Company will be able to pay its debts as and when they become due and payable
c. at the date of this declaration, there are reasonable grounds to believe that the members of the Extended Closed Group identified in note E2 will be able to meet any obligations or liabilities to which they are, or may become, subject by virtue of the Deed of Cross Guarantee described in note E2, and
d. the financial statements also comply with International Financial Reporting Standards.
The directors have been given the declarations required by section 295A of the Corporations Act 2001 from the Chief Executive Officer and Chief Financial Officer for the financial year ended 30 June 2015.
Signed in accordance with a resolution of the directors:
Rick Holliday-SmithChairman
Elmer Funke KupperManaging Director and Chief Executive Officer
Sydney, 20 August 2015
64 ASX Annual Report 2015 | Independent auditor’s report to the members of ASX Limited
Independent auditor’s report to the members of ASX Limited
Report on the audit of the financial report
OpinionWe have audited the financial report of ASX Limited (the Company), including its subsidiaries (the Group), which comprises the consolidated balance sheet as at 30 June 2015, the consoli-dated statement of comprehensive income, the consolidated statement of changes in equity and the consolidated statement of cash flows for the year then ended, notes comprising a summary of significant accounting policies and other explan-atory information, and the directors’ declaration of the Company.
In our opinion:
a. the accompanying financial report of the Company is in accordance with the Corporations Act 2001, including:
i. giving a true and fair view of the Group’s consolidated financial position as at 30 June 2015 and of its consolidated financial performance for the year ended on that date; and
ii. complying with Australian Accounting Standards and the Corporations Regulations 2001.
b. the financial report also complies with International Financial Reporting Standards as disclosed in the preface to the notes to the financial statements.
Basis for opinionWe conducted our audit in accordance with Australian Auditing Standards. Our responsibili-ties under those standards are further described in the Auditor’s responsibilities for the audit of the financial report section of our report. We are independent of the Group in accordance with the Corporations Act 2001 and the ethical require-ments of the Accounting Professional and Ethical Standards Board’s APES 110 Code of Ethics for Professional Accountants (the Code) that are rele-vant to our audit of the financial report in Australia. We have also fulfilled our other ethical responsi-bilities in accordance with the Code.
We confirm that the independence declaration required by the Corporations Act 2001, which has been given to the directors of the Company, would be in the same terms if given to the directors as at the time of this auditor’s report.
We believe that the audit evidence we have obtained is sufficient and appropriate to provide a basis for our opinion.
Audit scopeWe designed our audit by determining materiality and assessing the risks of material misstatement in the financial report. In particular, we considered where the directors made subjective judgements; for example in respect of significant accounting estimates that involved making assumptions and considering future events that are inherently uncer-tain. As in all of our audits, we also addressed the risk of management override of internal controls, including whether there was evidence of bias that represented a risk of material misstatement due to fraud.
We tailored the scope of our audit in order to perform sufficient work to enable us to provide an opinion on the financial report as a whole, taking into account the structure of the Group, the accounting processes and controls, and the industry in which the Group operates.
MaterialityThe scope of our audit was influenced by our application of materiality. Our audit opinion aims to provide reasonable assurance that the finan-cial report is free from material misstatement. Misstatements may arise due to fraud or error. They are considered material if individually or in aggregate, they could reasonably be expected to influence the economic decisions of users taken on the basis of the financial report.
We determined certain quantitative thresholds for materiality, including the overall Group materiality set out in the table below. These, together with qualitative considerations, helped us to determine the scope of our audit and the nature, timing and extent of our audit procedures and to evaluate the
effect of misstatements, both individually and in aggregate on the financial report as a whole.
Overall Group materiality $28 million (2014: $27 million)
How we deter-mined it 5% of profit before tax
Rationale for the materiality benchmark applied
We chose profit before tax as the benchmark because, in our view, it is the benchmark against which the performance of the Group is most commonly measured, and is a generally accepted benchmark. We chose 5% which is within the range of acceptable quantitative material-ity thresholds in auditing standards.
Key audit mattersKey audit matters are those matters that, in our professional judgement, were of most signifi-cance in our audit of the financial report for the current period. We have communicated the key audit matters to the Audit and Risk Committee, but they are not a comprehensive reflection of all matters that were identified by our audit and that were discussed with the committee. On the following page we have described the key audit matters we identified and have included a summary of the audit procedures we performed to address those matters.
The key audit matters were addressed in the context of our audit of the financial report as a whole, and in forming our opinion thereon, and we do not provide a separate opinion on these matters.
PricewaterhouseCoopers, ABN 52 780 433 757Darling Park Tower 2, 201 Sussex Street, GPO BOX 2650, SYDNEY NSW 1171
T: +61 2 8266 0000 F: +61 2 8266 9999 www.pwc.com.au
Liability limited by a scheme approved under Professional Standards Legislation.
ASX Annual Report 2015 | Independent auditor’s report to the members of ASX Limited 65
Key audit matter
Goodwill impairment assessmentThe Group’s goodwill is recognised in two Cash Generating Units (CGUs): “exchange-traded” ($2,242.2m) and “non exchange-traded” ($75.4m).
We focused on this area due to the size of the good-will balance ($2,317.6 million as at 30 June 2015), and because the directors’ assessment of the ‘value in use’ of the Group’s CGUs involves judgements about the future results of the business and the discount rates applied to future cash flow forecasts.
For the year ended 30 June 2015 management have performed an impairment assessment over the good-will balance by:
1. calculating the value in use for each CGU using a discounted cash flow model. These models used cash flows (revenues, expenses and capital expenditure) for each CGU for 5 years, with a terminal growth rate applied to the 5th year. These cash flows were then discounted to net present value using the Company’s weighted average cost of capital (WACC); and
2. comparing the resulting value in use of each CGU to their respective book values.
Management also performed a sensitivity analysis over the value in use calculations, by varying the assump-tions used (growth rates, terminal growth rate and WACC) to assess the impact on the valuations.
As a final check, management compared the book values of each CGU to the ASX Limited market capi-talisation and to major analyst valuations for the Company.
Refer to page 40 (Consolidated balance sheet), and page 54 note C1 for details of management’s impair-ment test and assumptions.
How our audit addressed the matterWhile only 3% of the Goodwill relates to the non exchange-traded CGU, the balance is still well above our materiality threshold and so we perform detailed procedures over both CGUs which included the following:
We evaluated management’s cashflow forecasts and the process by which they were developed, including verifying the mathematical accuracy of the underlying calculations. We also compared them to the latest Board approved budgets. We found that the budgets used in the value in use calculations were consist-ent with the Board approved budgets, and that the key assumptions were subject to oversight by the Directors. We noted that the Board approved budgets cover a period of 3 years, but that forecasts for the purposes of the value in use calculation extend out to 5 years. We therefore made years 4-5 a particular focus area for the procedures below.
We compared current year (2015) actual results with the figures included in the prior year (2014) forecast to consider whether any forecasts included assumptions that, with hindsight, had been optimistic. We found that actual performance was materially consistent with forecast performance.
We also challenged:
1. management’s key assumptions for long-term growth rates in the forecasts by comparing them to historical results and economic and industry forecasts; and
2. the discount rate used in the model by assessing the cost of capital for the Group by comparing it to market data and industry research.
We found that the growth rate assumptions were consistent with historic results adjusted for the economic outlook and industry forecasts.
We found that the discount rate used by management of 9.5% pre-tax was consistent with market data and industry research.
We then stress-tested the assumptions used by analys-ing the impact on results from using other growth rates and discount rates which were within a reasonably foreseeable range.
We found that significant headroom remained between the stress-tested value in use calculations and the carrying value of the CGUs in the financial statements. In particular, we noted that significant headroom remained even when a zero terminal growth rate was assumed in conjunction with no revenue growth for the first 5 years.
As a final test we also compared the Group’s net assets as at 30 June 2015 of $3.8 billion to its market capitali-sation of $7.8 billion and noted the $4 billion of implied headroom was consistent with the results of our testing.
Key audit matter
Valuation and existence of available-for-sale financial assetsWe focused on this area due to the size of the balance and the inherent judgement involved in determining the fair value of financial instruments.
As at 30 June 2015 the available-for-sale assets were valued at $2,889.6m (2014: $2,407.8m).
Of these assets, $91.1m were classified as “level 1” financial instruments in accordance with the classifi-cation under Australian Accounting Standards where quoted prices in active markets are available for identical assets.
The remaining $2,798.5m were classified as “level 2” financial instruments in accordance with the classifi-cation under Australian Accounting Standards where values are derived from observable prices (or inputs to valuation models) other than quoted prices included within level 1.
The valuation of the level 2 securities therefore requires a higher degree of judgement.
Refer to page 49 note B2 (b) for details of the assets and page 53 note B3 (d) for the level 1 or 2 classification.
How our audit addressed the matterOur audit procedures included the following:
We agreed available-for-sale security balances held at 30 June 2015 to Austraclear holdings statements. Austraclear provides depository, registration, cash transfer and settlement services for debt instrument securities in financial markets in Australia.
As Austraclear is owned and operated by the Company, our work included testing the:
1. controls used to manage and control the Information Technology activities and computer environment, covering the overall IT computer environment, program development, program changes, access to programs and data and computer operations in place at Austraclear;
2. operation of the Austraclear control that matches trade details between counterparties, by inputting a range of test trades, with both correct and incorrect details, to ensure that only appropriate trades were processed by the system; and
3. generation of the Austraclear holdings reports by running test reports and comparing the output to the observed data in the system.
We found these controls to be appropriately designed and operating effectively and the relevant reports generated from Austraclear could be relied upon for the purposes of our audit.
To test valuation we first understood and evaluated the controls in place over the valuation of available-for-sale securities.
For both level 1 and level 2 securities we then used independent sources of information to determine an acceptable range of valuations for 100% of the secu-rities held at 30 June 2015, and compared this to the valuations recorded on the balance sheet.
We found that all securities tested were carried at values within the range of acceptable valuations that we independently calculated.
66 ASX Annual Report 2015 | Independent auditor’s report to the members of ASX Limited
Directors’ responsibilities for the financial reportThe directors of the Company are responsible for the preparation of the financial report that gives a true and fair view in accordance with Australian Accounting Standards and the Corporations Act 2001 and for such internal control as the directors determine is necessary to enable the preparation of the financial report that gives a true and fair view and is free from material misstatement, whether due to fraud or error.
In preparing the financial report, the directors are responsible for assessing the Group’s ability to continue as a going concern, disclosing, as appli-cable, matters related to going concern and using the going concern basis of accounting unless the directors either intend to liquidate the Group or to cease operations, or have no realistic alternative but to do so.
Other informationThe directors are responsible for the other infor-mation. The other information comprises the infor-mation in the Company’s annual report for the year ended 30 June 2015, but does not include the financial report and the auditor’s report thereon.
Our opinion on the financial report does not cover the other information and we do not express any form of assurance conclusion thereon.
In connection with our audit of the financial report, our responsibility is to read the other information and, in doing so, consider whether the other infor-mation is materially inconsistent with the financial report or our knowledge obtained in the audit or otherwise appears to be materially misstated. If, based on the work we have performed, we conclude that there is a material misstatement of this other information we are required to report that fact. We have nothing to report in this regard.
Auditor’s responsibilities for the audit of the financial reportOur objectives are to obtain reasonable assurance about whether the financial report as a whole is free from material misstatement, whether due to fraud or error, and to issue an auditor’s report that includes our opinion. Reasonable assurance is a high level of assurance, but is not a guaran-tee that an audit conducted in accordance with the Australian Auditing Standards will always detect a material misstatement when it exists. Misstatements can arise from fraud or error and are considered material if, individually or in the aggregate, they could reasonably be expected to influence the economic decisions of users taken on the basis of the financial report.
As part of an audit in accordance with the Australian Auditing Standards, we exercise profes-sional judgement and maintain professional scep-ticism throughout the audit. We obtain sufficient appropriate audit evidence regarding the financial information of the entities or business activities within the Group to express an opinion on the consolidated financial statements. We are responsi-ble for the direction, supervision and performance of the Group audit. We remain solely responsible for our audit opinion.
In obtaining sufficient appropriate audit evidence, we:
• identify and assess the risks of material misstatement of the financial report, whether due to fraud or error, design and perform audit procedures responsive to those risks, and obtain audit evidence that is sufficient and appropriate to provide a basis for our opinion. The risk of not detecting a material misstate-ment resulting from fraud is higher than for one resulting from error, as fraud may involve collusion, forgery, intentional omissions, misrepresentations, or the override of internal control;
• obtain an understanding of internal control relevant to the audit in order to design audit procedures that are appropriate in the circum-stances, but not for the purpose of expressing
an opinion on the effectiveness of the Group’s internal control;
• evaluate the appropriateness of account-ing policies used and the reasonableness of accounting estimates and related disclosures made by the directors;
• conclude on the appropriateness of the directors’ use of the going concern basis of accounting and, based on the audit evidence obtained, whether a material uncertainty exists related to events or conditions that may cast significant doubt on the Group’s ability to continue as a going concern. If we conclude that a material uncertainty exists, we are required to draw attention in our auditor’s report to the related disclosures in the financial report or, if such disclosures are inadequate, to modify our opinion. Our conclusions are based on the audit evidence obtained up to the date of our auditor’s report. However, future events or conditions may cause the Group to cease to continue as a going concern; and
• evaluate the overall presentation, structure and content of the financial report, including the disclosures, and whether the financial report represents the underlying transactions and events in a manner that achieves fair presentation.
We communicate with the directors regarding, among other matters, the planned scope and timing of the audit and significant audit findings, including any significant deficiencies in internal control that we identify during our audit.
We also provide the directors with a statement that we have complied with relevant ethical require-ments regarding independence, and communi-cate with them all relationships and other matters that may reasonably be thought to bear on our independence, and where applicable, related safeguards.
From the matters communicated with the directors, we determine those matters that were of most significance in the audit of the financial report for the current period and are therefore the key
audit matters. We describe these matters in our auditor’s report unless law or regulation precludes public disclosure about the matter or when, in extremely rare circumstances, we determine that a matter should not be communicated in our report because the adverse consequences of doing so would reasonably be expected to outweigh the public interest benefits of such communication.
Report on the remuneration report
Opinion on the remuneration reportWe have audited the remuneration report included in pages 26 to 35 of the directors’ report for the year ended 30 June 2015. In our opinion, the remu-neration report of ASX Limited, for the year ended 30 June 2015 complies with section 300A of the Corporations Act 2001.
Responsibilities for the remuneration reportThe directors of the Company are responsible for the preparation and presentation of the remuner-ation report in accordance with section 300A of the Corporations Act 2001. Our responsibility is to express an opinion on the remuneration report, based on our audit conducted in accordance with Australian Auditing Standards.
PricewaterhouseCoopers
Matthew LunnPartner
Sydney, 20 August 2015
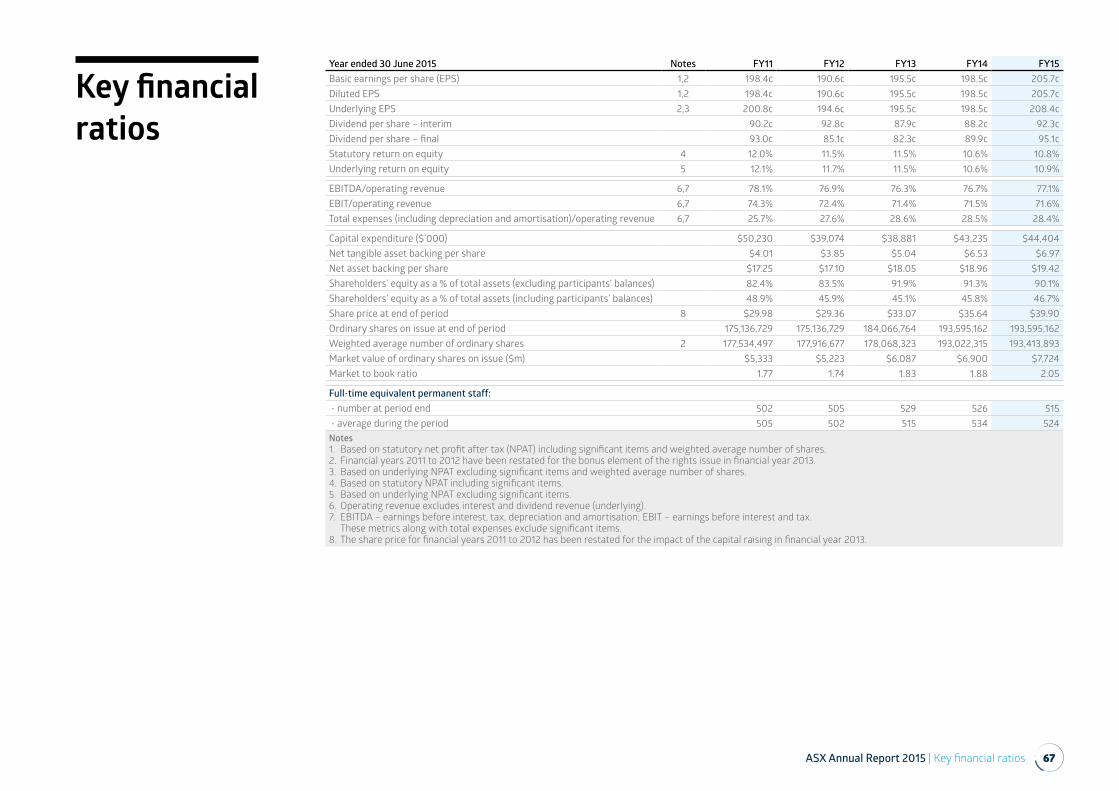
ASX Annual Report 2015 | Key financial ratios 67
Key financial ratios
Year ended 30 June 2015 Notes FY11 FY12 FY13 FY14 FY15Basic earnings per share (EPS) 1,2 198.4c 190.6c 195.5c 198.5c 205.7cDiluted EPS 1,2 198.4c 190.6c 195.5c 198.5c 205.7cUnderlying EPS 2,3 200.8c 194.6c 195.5c 198.5c 208.4cDividend per share – interim 90.2c 92.8c 87.9c 88.2c 92.3cDividend per share – final 93.0c 85.1c 82.3c 89.9c 95.1cStatutory return on equity 4 12.0% 11.5% 11.5% 10.6% 10.8%Underlying return on equity 5 12.1% 11.7% 11.5% 10.6% 10.9%
EBITDA/operating revenue 6,7 78.1% 76.9% 76.3% 76.7% 77.1%EBIT/operating revenue 6,7 74.3% 72.4% 71.4% 71.5% 71.6%Total expenses (including depreciation and amortisation)/operating revenue 6,7 25.7% 27.6% 28.6% 28.5% 28.4%
Capital expenditure ($’000) $50,230 $39,074 $38,881 $43,235 $44,404Net tangible asset backing per share $4.01 $3.85 $5.04 $6.53 $6.97Net asset backing per share $17.25 $17.10 $18.05 $18.96 $19.42Shareholders’ equity as a % of total assets (excluding participants’ balances) 82.4% 83.5% 91.9% 91.3% 90.1%Shareholders’ equity as a % of total assets (including participants’ balances) 48.9% 45.9% 45.1% 45.8% 46.7%Share price at end of period 8 $29.98 $29.36 $33.07 $35.64 $39.90Ordinary shares on issue at end of period 175,136,729 175,136,729 184,066,764 193,595,162 193,595,162Weighted average number of ordinary shares 2 177,534,497 177,916,677 178,068,323 193,022,315 193,413,893Market value of ordinary shares on issue ($m) $5,333 $5,223 $6,087 $6,900 $7,724Market to book ratio 1.77 1.74 1.83 1.88 2.05
Full-time equivalent permanent staff: - number at period end 502 505 529 526 515 - average during the period 505 502 515 534 524Notes1. Based on statutory net profit after tax (NPAT) including significant items and weighted average number of shares.2. Financial years 2011 to 2012 have been restated for the bonus element of the rights issue in financial year 2013.3. Based on underlying NPAT excluding significant items and weighted average number of shares. 4. Based on statutory NPAT including significant items.5. Based on underlying NPAT excluding significant items.6. Operating revenue excludes interest and dividend revenue (underlying).7. EBITDA – earnings before interest, tax, depreciation and amortisation; EBIT – earnings before interest and tax.
These metrics along with total expenses exclude significant items.8. The share price for financial years 2011 to 2012 has been restated for the impact of the capital raising in financial year 2013.
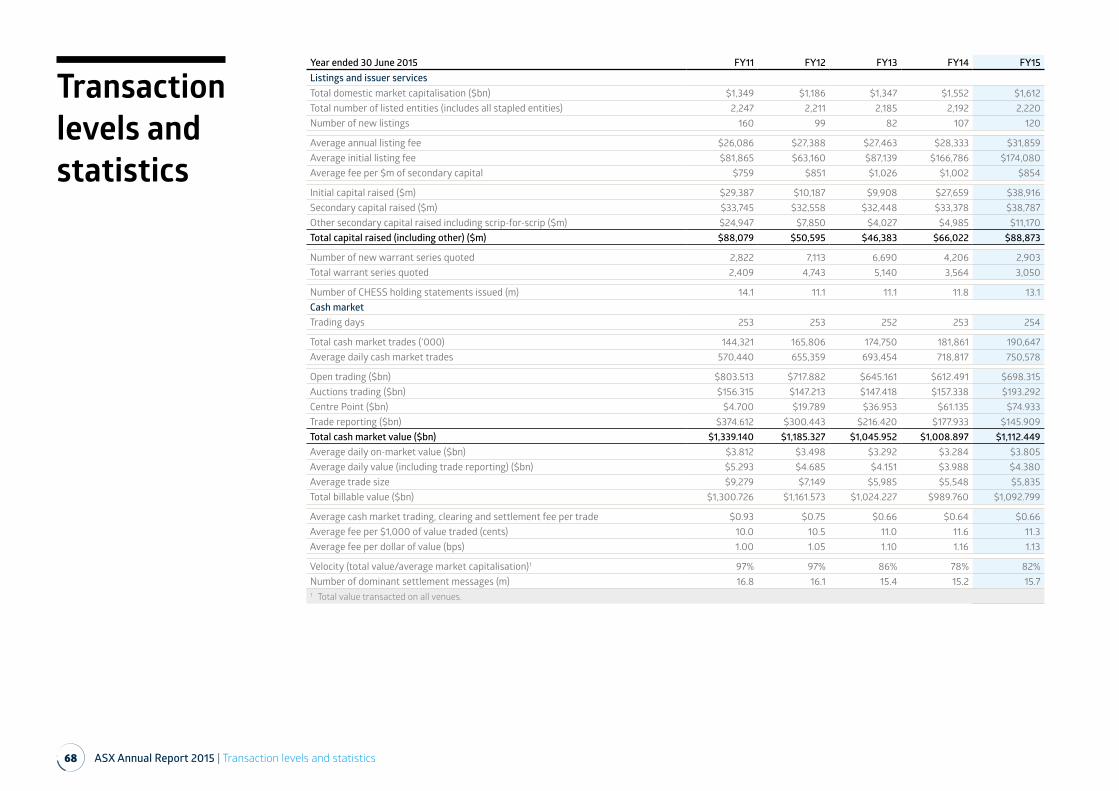
68 ASX Annual Report 2015 | Transaction levels and statistics
Transaction levels and statistics
Year ended 30 June 2015 FY11 FY12 FY13 FY14 FY15Listings and issuer servicesTotal domestic market capitalisation ($bn) $1,349 $1,186 $1,347 $1,552 $1,612Total number of listed entities (includes all stapled entities) 2,247 2,211 2,185 2,192 2,220Number of new listings 160 99 82 107 120
Average annual listing fee $26,086 $27,388 $27,463 $28,333 $31,859Average initial listing fee $81,865 $63,160 $87,139 $166,786 $174,080Average fee per $m of secondary capital $759 $851 $1,026 $1,002 $854
Initial capital raised ($m) $29,387 $10,187 $9,908 $27,659 $38,916Secondary capital raised ($m) $33,745 $32,558 $32,448 $33,378 $38,787Other secondary capital raised including scrip-for-scrip ($m) $24,947 $7,850 $4,027 $4,985 $11,170Total capital raised (including other) ($m) $88,079 $50,595 $46,383 $66,022 $88,873
Number of new warrant series quoted 2,822 7,113 6,690 4,206 2,903Total warrant series quoted 2,409 4,743 5,140 3,564 3,050
Number of CHESS holding statements issued (m) 14.1 11.1 11.1 11.8 13.1Cash marketTrading days 253 253 252 253 254
Total cash market trades (‘000) 144,321 165,806 174,750 181,861 190,647Average daily cash market trades 570,440 655,359 693,454 718,817 750,578
Open trading ($bn) $803.513 $717.882 $645.161 $612.491 $698.315Auctions trading ($bn) $156.315 $147.213 $147.418 $157.338 $193.292Centre Point ($bn) $4.700 $19.789 $36.953 $61.135 $74.933Trade reporting ($bn) $374.612 $300.443 $216.420 $177.933 $145.909Total cash market value ($bn) $1,339.140 $1,185.327 $1,045.952 $1,008.897 $1,112.449Average daily on-market value ($bn) $3.812 $3.498 $3.292 $3.284 $3.805Average daily value (including trade reporting) ($bn) $5.293 $4.685 $4.151 $3.988 $4.380Average trade size $9,279 $7,149 $5,985 $5,548 $5,835Total billable value ($bn) $1,300.726 $1,161.573 $1,024.227 $989.760 $1,092.799
Average cash market trading, clearing and settlement fee per trade $0.93 $0.75 $0.66 $0.64 $0.66Average fee per $1,000 of value traded (cents) 10.0 10.5 11.0 11.6 11.3Average fee per dollar of value (bps) 1.00 1.05 1.10 1.16 1.13
Velocity (total value/average market capitalisation)1 97% 97% 86% 78% 82%Number of dominant settlement messages (m) 16.8 16.1 15.4 15.2 15.71 Total value transacted on all venues.
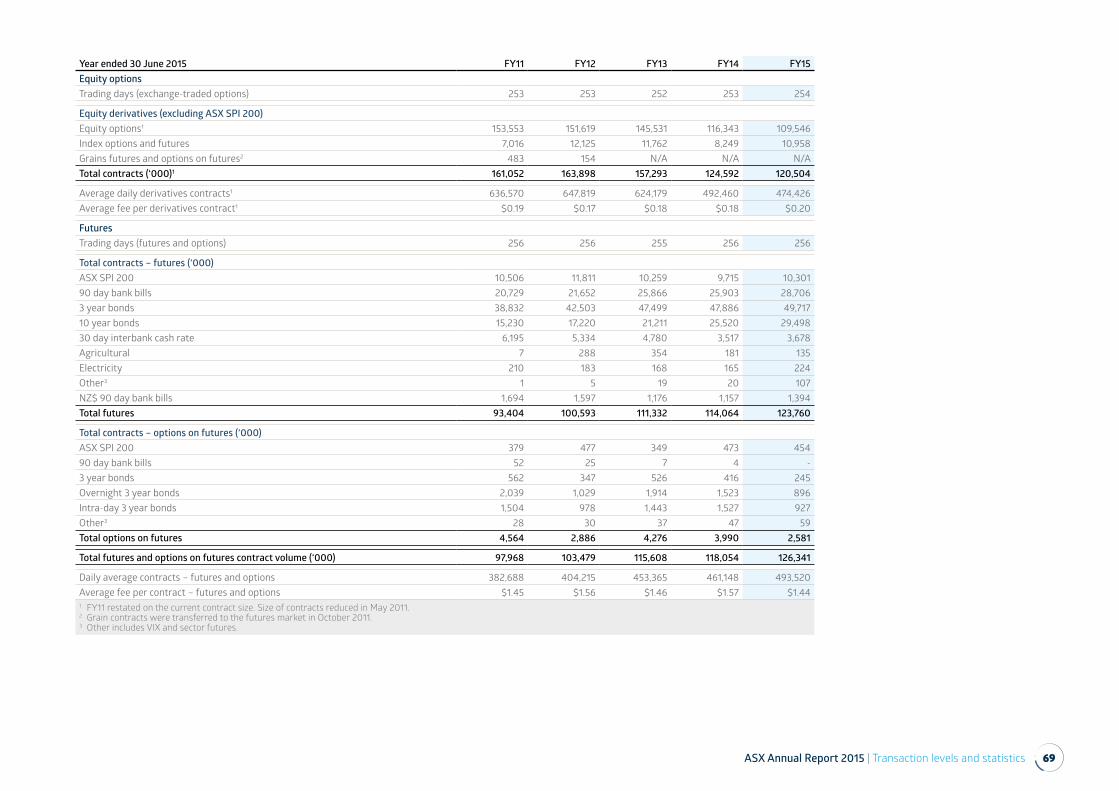
ASX Annual Report 2015 | Transaction levels and statistics 69
Year ended 30 June 2015 FY11 FY12 FY13 FY14 FY15Equity optionsTrading days (exchange-traded options) 253 253 252 253 254
Equity derivatives (excluding ASX SPI 200)Equity options1 153,553 151,619 145,531 116,343 109,546Index options and futures 7,016 12,125 11,762 8,249 10,958Grains futures and options on futures2 483 154 N/A N/A N/ATotal contracts (‘000)1 161,052 163,898 157,293 124,592 120,504
Average daily derivatives contracts1 636,570 647,819 624,179 492,460 474,426Average fee per derivatives contract1 $0.19 $0.17 $0.18 $0.18 $0.20
FuturesTrading days (futures and options) 256 256 255 256 256
Total contracts – futures (‘000)ASX SPI 200 10,506 11,811 10,259 9,715 10,30190 day bank bills 20,729 21,652 25,866 25,903 28,7063 year bonds 38,832 42,503 47,499 47,886 49,71710 year bonds 15,230 17,220 21,211 25,520 29,49830 day interbank cash rate 6,195 5,334 4,780 3,517 3,678Agricultural 7 288 354 181 135Electricity 210 183 168 165 224Other3 1 5 19 20 107NZ$ 90 day bank bills 1,694 1,597 1,176 1,157 1,394Total futures 93,404 100,593 111,332 114,064 123,760
Total contracts – options on futures (‘000)ASX SPI 200 379 477 349 473 45490 day bank bills 52 25 7 4 -3 year bonds 562 347 526 416 245Overnight 3 year bonds 2,039 1,029 1,914 1,523 896Intra-day 3 year bonds 1,504 978 1,443 1,527 927Other3 28 30 37 47 59Total options on futures 4,564 2,886 4,276 3,990 2,581
Total futures and options on futures contract volume (‘000) 97,968 103,479 115,608 118,054 126,341
Daily average contracts – futures and options 382,688 404,215 453,365 461,148 493,520Average fee per contract – futures and options $1.45 $1.56 $1.46 $1.57 $1.441 FY11 restated on the current contract size. Size of contracts reduced in May 2011.2 Grain contracts were transferred to the futures market in October 2011.3 Other includes VIX and sector futures.
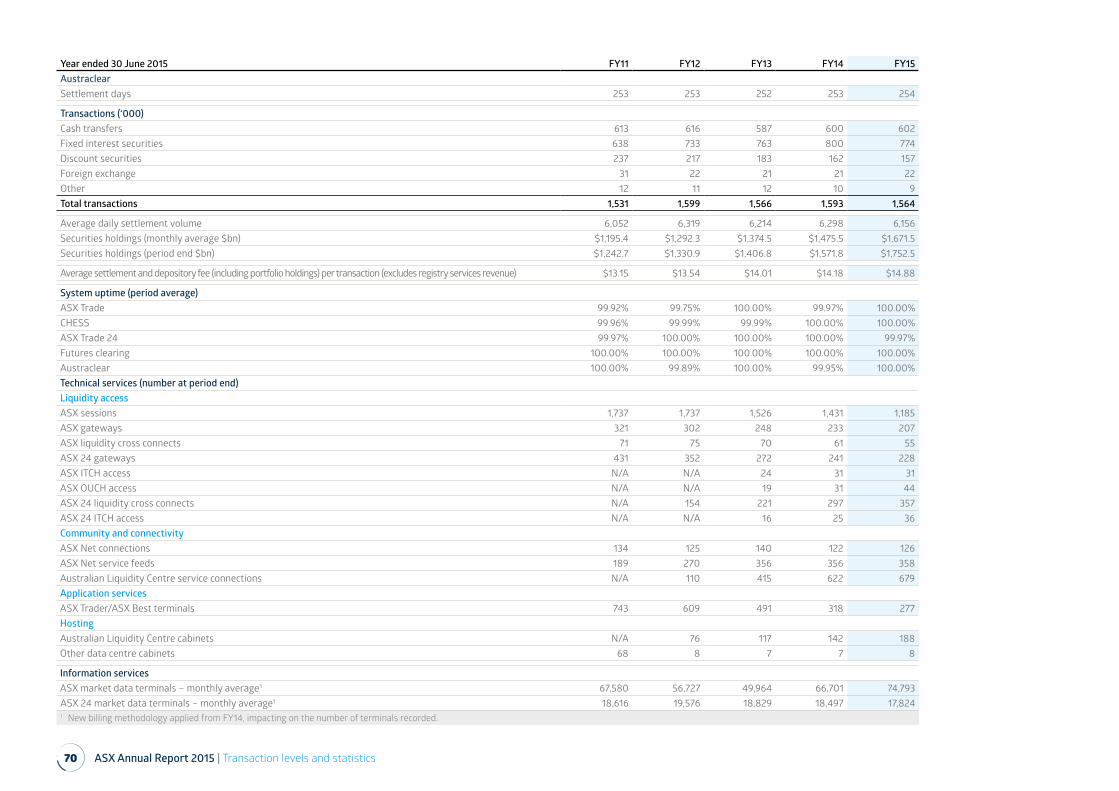
70 ASX Annual Report 2015 | Transaction levels and statistics
Year ended 30 June 2015 FY11 FY12 FY13 FY14 FY15AustraclearSettlement days 253 253 252 253 254
Transactions (‘000)Cash transfers 613 616 587 600 602Fixed interest securities 638 733 763 800 774Discount securities 237 217 183 162 157Foreign exchange 31 22 21 21 22Other 12 11 12 10 9Total transactions 1,531 1,599 1,566 1,593 1,564
Average daily settlement volume 6,052 6,319 6,214 6,298 6,156Securities holdings (monthly average $bn) $1,195.4 $1,292.3 $1,374.5 $1,475.5 $1,671.5Securities holdings (period end $bn) $1,242.7 $1,330.9 $1,406.8 $1,571.8 $1,752.5
Average settlement and depository fee (including portfolio holdings) per transaction (excludes registry services revenue) $13.15 $13.54 $14.01 $14.18 $14.88
System uptime (period average)ASX Trade 99.92% 99.75% 100.00% 99.97% 100.00%CHESS 99.96% 99.99% 99.99% 100.00% 100.00%ASX Trade 24 99.97% 100.00% 100.00% 100.00% 99.97%Futures clearing 100.00% 100.00% 100.00% 100.00% 100.00%Austraclear 100.00% 99.89% 100.00% 99.95% 100.00%Technical services (number at period end) Liquidity accessASX sessions 1,737 1,737 1,526 1,431 1,185ASX gateways 321 302 248 233 207ASX liquidity cross connects 71 75 70 61 55ASX 24 gateways 431 352 272 241 228ASX ITCH access N/A N/A 24 31 31ASX OUCH access N/A N/A 19 31 44ASX 24 liquidity cross connects N/A 154 221 297 357ASX 24 ITCH access N/A N/A 16 25 36Community and connectivityASX Net connections 134 125 140 122 126ASX Net service feeds 189 270 356 356 358Australian Liquidity Centre service connections N/A 110 415 622 679Application servicesASX Trader/ASX Best terminals 743 609 491 318 277HostingAustralian Liquidity Centre cabinets N/A 76 117 142 188Other data centre cabinets 68 8 7 7 8
Information servicesASX market data terminals – monthly average1 67,580 56,727 49,964 66,701 74,793ASX 24 market data terminals – monthly average1 18,616 19,576 18,829 18,497 17,8241 New billing methodology applied from FY14, impacting on the number of terminals recorded.
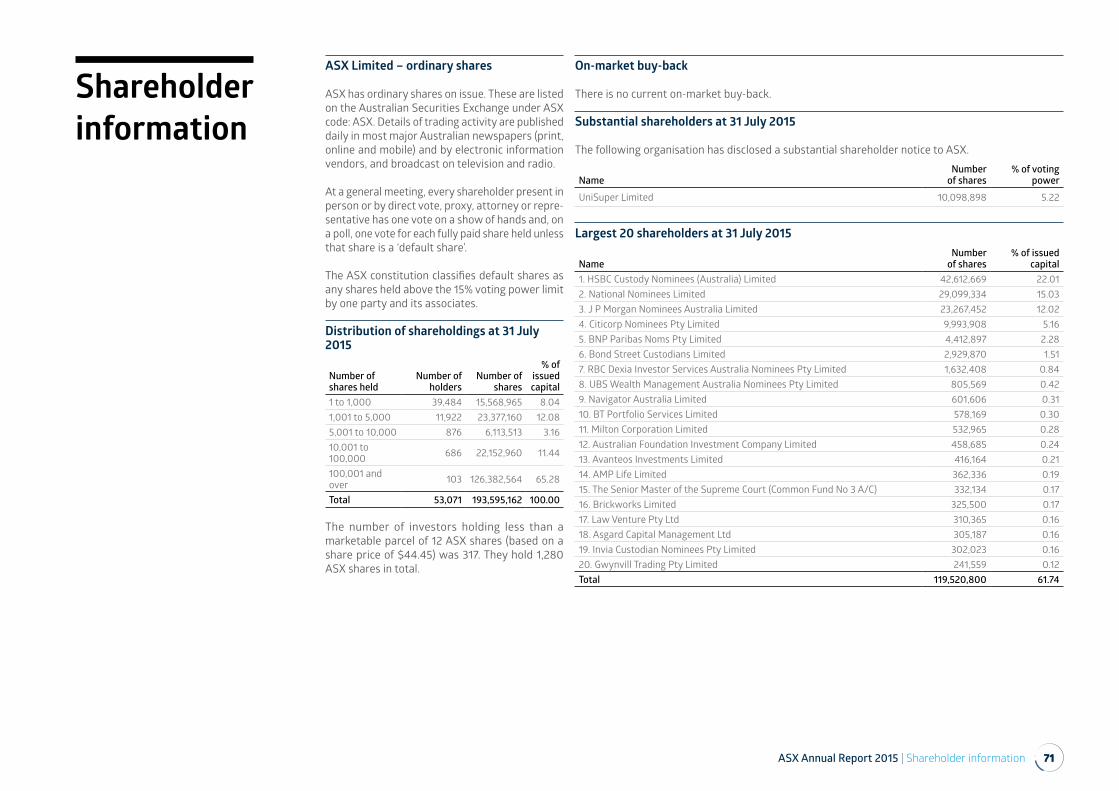
ASX Annual Report 2015 | Shareholder information 71
Shareholder information
ASX Limited – ordinary shares
ASX has ordinary shares on issue. These are listed on the Australian Securities Exchange under ASX code: ASX. Details of trading activity are published daily in most major Australian newspapers (print, online and mobile) and by electronic information vendors, and broadcast on television and radio.
At a general meeting, every shareholder present in person or by direct vote, proxy, attorney or repre-sentative has one vote on a show of hands and, on a poll, one vote for each fully paid share held unless that share is a ‘default share’.
The ASX constitution classifies default shares as any shares held above the 15% voting power limit by one party and its associates.
Distribution of shareholdings at 31 July 2015
Number of shares held
Number of holders
Number of shares
% of issued capital
1 to 1,000 39,484 15,568,965 8.041,001 to 5,000 11,922 23,377,160 12.085,001 to 10,000 876 6,113,513 3.1610,001 to 100,000 686 22,152,960 11.44
100,001 and over 103 126,382,564 65.28
Total 53,071 193,595,162 100.00
The number of investors holding less than a marketable parcel of 12 ASX shares (based on a share price of $44.45) was 317. They hold 1,280 ASX shares in total.
On-market buy-back
There is no current on-market buy-back.
Substantial shareholders at 31 July 2015
The following organisation has disclosed a substantial shareholder notice to ASX.
NameNumber
of shares% of voting
power
UniSuper Limited 10,098,898 5.22
Largest 20 shareholders at 31 July 2015
NameNumber
of shares% of issued
capital1. HSBC Custody Nominees (Australia) Limited 42,612,669 22.012. National Nominees Limited 29,099,334 15.033. J P Morgan Nominees Australia Limited 23,267,452 12.024. Citicorp Nominees Pty Limited 9,993,908 5.165. BNP Paribas Noms Pty Limited 4,412,897 2.286. Bond Street Custodians Limited 2,929,870 1.517. RBC Dexia Investor Services Australia Nominees Pty Limited 1,632,408 0.848. UBS Wealth Management Australia Nominees Pty Limited 805,569 0.429. Navigator Australia Limited 601,606 0.3110. BT Portfolio Services Limited 578,169 0.3011. Milton Corporation Limited 532,965 0.2812. Australian Foundation Investment Company Limited 458,685 0.2413. Avanteos Investments Limited 416,164 0.2114. AMP Life Limited 362,336 0.1915. The Senior Master of the Supreme Court (Common Fund No 3 A/C) 332,134 0.1716. Brickworks Limited 325,500 0.1717. Law Venture Pty Ltd 310,365 0.1618. Asgard Capital Management Ltd 305,187 0.1619. Invia Custodian Nominees Pty Limited 302,023 0.1620. Gwynvill Trading Pty Limited 241,559 0.12Total 119,520,800 61.74
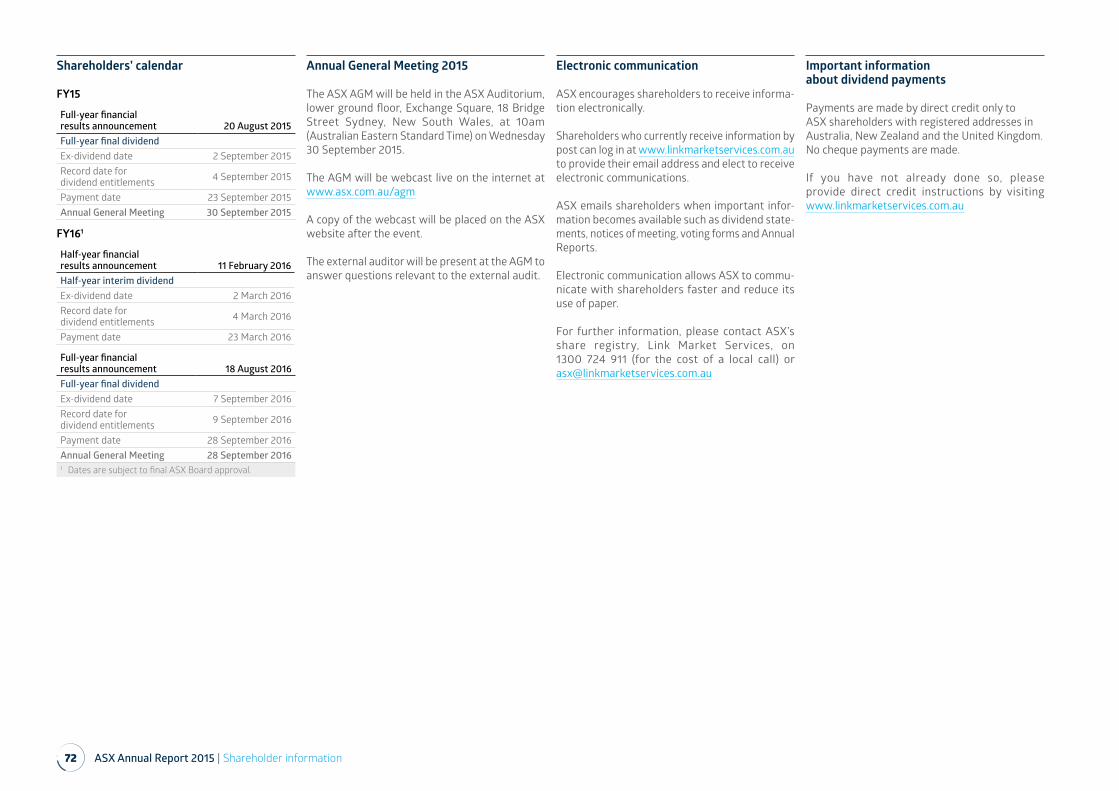
72 ASX Annual Report 2015 | Shareholder information
Shareholders’ calendar
FY15
Full-year financial results announcement 20 August 2015Full-year final dividendEx-dividend date 2 September 2015Record date for dividend entitlements 4 September 2015
Payment date 23 September 2015Annual General Meeting 30 September 2015
FY161
Half-year financial results announcement 11 February 2016Half-year interim dividend Ex-dividend date 2 March 2016Record date for dividend entitlements 4 March 2016
Payment date 23 March 2016
Full-year financial results announcement 18 August 2016Full-year final dividendEx-dividend date 7 September 2016Record date for dividend entitlements 9 September 2016
Payment date 28 September 2016Annual General Meeting 28 September 20161 Dates are subject to final ASX Board approval.
Annual General Meeting 2015
The ASX AGM will be held in the ASX Auditorium, lower ground floor, Exchange Square, 18 Bridge Street Sydney, New South Wales, at 10am (Australian Eastern Standard Time) on Wednesday 30 September 2015.
The AGM will be webcast live on the internet at www.asx.com.au/agm
A copy of the webcast will be placed on the ASX website after the event.
The external auditor will be present at the AGM to answer questions relevant to the external audit.
Electronic communication
ASX encourages shareholders to receive informa-tion electronically.
Shareholders who currently receive information by post can log in at www.linkmarketservices.com.au to provide their email address and elect to receive electronic communications.
ASX emails shareholders when important infor-mation becomes available such as dividend state-ments, notices of meeting, voting forms and Annual Reports.
Electronic communication allows ASX to commu-nicate with shareholders faster and reduce its use of paper.
For further information, please contact ASX’s share registry, Link Market Services, on 1300 724 911 (for the cost of a local call) or [email protected]
Important information about dividend payments
Payments are made by direct credit only to ASX shareholders with registered addresses in Australia, New Zealand and the United Kingdom. No cheque payments are made.
If you have not already done so, please provide direct credit instructions by visiting www.linkmarketservices.com.au
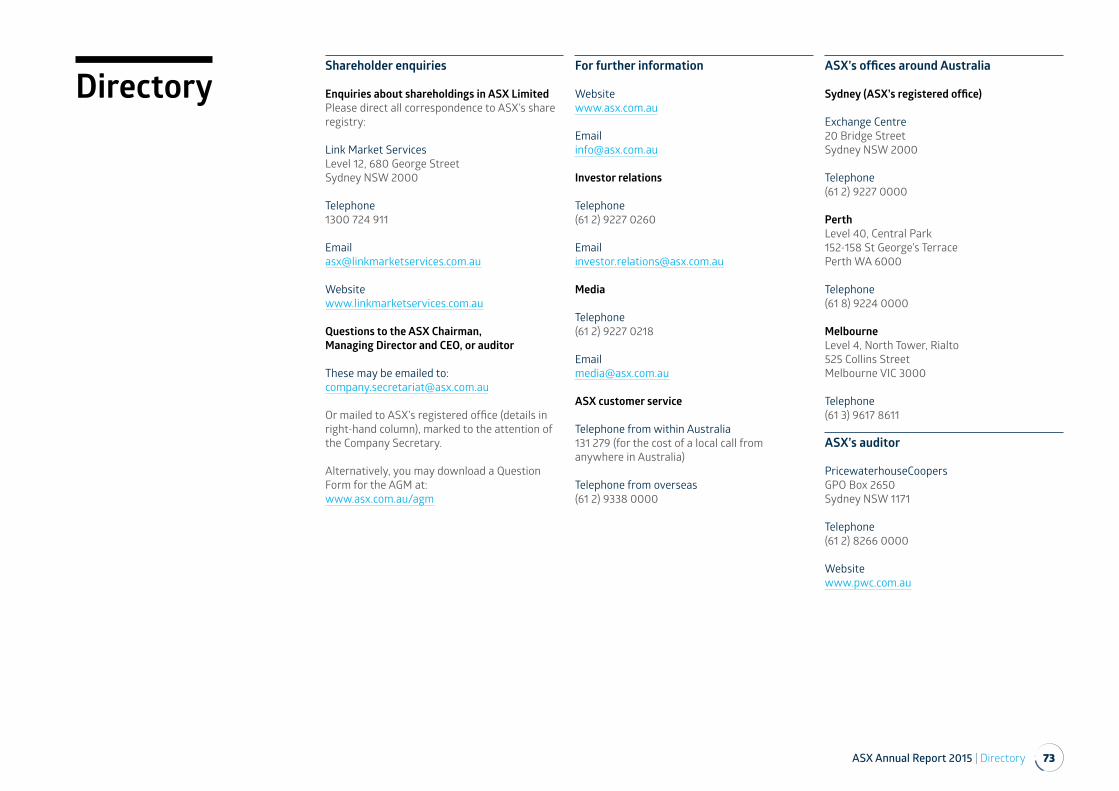
ASX Annual Report 2015 | Directory 73
DirectoryShareholder enquiries
Enquiries about shareholdings in ASX LimitedPlease direct all correspondence to ASX’s share registry:
Link Market ServicesLevel 12, 680 George Street Sydney NSW 2000
Telephone1300 724 911
Websitewww.linkmarketservices.com.au
Questions to the ASX Chairman, Managing Director and CEO, or auditor
These may be emailed to:[email protected]
Or mailed to ASX’s registered office (details in right-hand column), marked to the attention of the Company Secretary.
Alternatively, you may download a Question Form for the AGM at: www.asx.com.au/agm
For further information
Websitewww.asx.com.au
Investor relations
Telephone(61 2) 9227 0260
Media
Telephone(61 2) 9227 0218
ASX customer service
Telephone from within Australia131 279 (for the cost of a local call from anywhere in Australia)
Telephone from overseas(61 2) 9338 0000
ASX’s offices around Australia
Sydney (ASX’s registered office)
Exchange Centre20 Bridge Street Sydney NSW 2000
Telephone(61 2) 9227 0000
PerthLevel 40, Central Park 152-158 St George’s Terrace Perth WA 6000
Telephone(61 8) 9224 0000
MelbourneLevel 4, North Tower, Rialto 525 Collins Street Melbourne VIC 3000
Telephone(61 3) 9617 8611
ASX’s auditor
PricewaterhouseCoopersGPO Box 2650 Sydney NSW 1171
Telephone(61 2) 8266 0000
Websitewww.pwc.com.au

© Copyright 2015 ASX Limited ABN 98 008 624 691The information in this publication does not constitute investment, financial or legal advice and must not be relied on as such. You should obtain independent professional advice tailored to your specific circumstances and needs prior to making any investment and/or financial decisions. The information in this document is not, and must not be construed as, an offer or recommendation of securities or other financial products.