Embed Size (px)
Citation preview

Annual Report 2016
matrix-corp.org
For
per
sona
l use
onl
y
CONTENTSCONTENTS 1
CHAIRMAN’S REPORT 2
CHIEF EXECUTIVE OFFICER’S REPORT 4
CORPORATE DIRECTORY 6
DIRECTORS’ REPORT 7
AUDITED REMUNERATION REPORT 18
AUDITOR’S INDEPENDENCE DECLARATION 30
CONSOLIDATED STATEMENT OF PROFIT OR LOSS 31
CONSOLIDATED STATEMENT OF PROFIT OR LOSS AND OTHER COMPREHENSIVE INCOME 32
CONSOLIDATED STATEMENT OF FINANCIAL POSITION 33
CONSOLIDATED STATEMENT OF CASH FLOWS 34
CONSOLIDATED STATEMENT OF CHANGES IN EQUITY 35
NOTES TO AND FORMING PART OF THE FINANCIAL STATEMENTS 37
DIRECTORS’ DECLARATION 79
INDEPENDENT AUDITORS’ REPORT 80
ADDITIONAL ASX INFORMATION 82For
per
sona
l use
onl
y

2 MATRIX ANNUAL REPORT 2016|
Dear Shareholders
On behalf of the Board I am pleased to present the 2016 Annual Report for Matrix Composites & Engineering Ltd (Matrix).
Sustained low global energy prices led to further reduced demand for associated equipment and services to the sector in FY16. In response, Matrix took steps to ensure it is well positioned in the current market and to benefit from the oil price recovery. For example, in the year Matrix maintained its strong research and development focus to ensure we maintain our market and technology-leading position; developed additional new products tailored to current conditions; eliminated our term debt, and aligned the business’ cost base to reflect the current environment whilst maintaining the flexibility to increase production when the time is right.
Despite our standing in the market as a supplier of choice, ongoing low global energy prices in the year resulted in reduced demand for Matrix’s products. As a result, Matrix reported revenue of $95.7 million in FY16, which was 33.6 per cent lower than FY15. Matrix reported an underlying EBITDA of $11.3 million, in line with guidance provided to the market (FY16: $24.3 million). FY16 underlying EBITDA removes non-recurring costs of $3.8 million – primarily reflecting redundancy costs as the business adapted to market conditions and a non-cash loss on the sale of the Company’s former Malaga workshops in Western Australia – and foreign exchange losses of $1.1 million. When factoring in those one-off costs, at a headline level Matrix recorded a net loss after tax of $2.1 million (FY15: $3.6 million NPAT), driven by the lower revenue base.
Importantly, Matrix continued to maintain a positive operating margin and cash flow in the subdued oil and gas environment, reflecting improvements to the cost base throughout the year and an ability to target new markets. The Company reported cash flow from operations of $2.8 million in FY16 (FY15: $3.5 million). In addition, Matrix ended the year with a strong balance sheet position, ensuring the Company is well placed to withstand the challenging conditions whilst being able to pursue growth opportunities in target markets and quickly benefit from an oil price recovery. At 30 June 2016, Matrix had no term debt and an adjusted net cash position of $3.6 million (30 June 2015: $7.8 million net debt position).
Matrix did not declare a final dividend for FY16 in order to maintain liquidity, in line with the Board’s dividend policy of maintaining an ordinary fully franked dividend payout not exceeding net profit after tax. In the year, Matrix also concluded an on-market buyback of shares that commenced in FY15 as part of its ongoing capital management strategy, with 805,428 shares acquired at an average price of $0.54, representing 6.6 per cent of all shares traded over the period the buyback was active.
I would like to take a moment to reflect on executive changes during FY16. In October 2015, Matrix welcomed Adam Santa Maria as joint Company Secretary and Group Legal Counsel. Adam has brought a wealth of experience to Matrix, gained through providing advice through a number of significant corporate transactions as well as to leading Western Australian companies. Subsequent to the year end, Matrix announced in August 2016 that Brendan Cocks would succeed outgoing Chief Financial Officer Peter Tazewell. Brendan has more than 20 years’ experience across a broad range of industries, including manufacturing, resources, retail, and professional services. On behalf of the Board, I wish to thank Peter for the contribution he has made to the business over almost five years and also welcome Brendan to the role.
Looking to the new financial year, Matrix entered FY17 with a US$46.0 million backlog, which supports production through to end of the first half of FY17. Although demand remains subdued in line with the low energy price environment, the Company’s strong balance sheet position ensures Matrix is well placed to capitalise on future growth opportunities, including those that will arise upon the successful implementation of the Matrix LGSTM system and the step out strategies identified by Matrix to drive business growth and development.
CHAIRMAN’S REPORT
For
per
sona
l use
onl
y

3MATRIX ANNUAL REPORT 2016 |
On behalf of the Matrix Board I would like to thank our senior management and employees for their commitment and hard work during what has been a subdued year. I would also like to thank shareholders for their support throughout the year and we look forward to building on opportunities in FY17 that are targeted at generating shareholder value.
Peter Hood
Chairman
For
per
sona
l use
onl
y

4 MATRIX ANNUAL REPORT 2016|
CHIEF EXECUTIVE OFFICER’S REPORTThe oil and gas sector was subdued in FY16 in light of sustained low energy prices, which adversely impacted demand for products and services to the industry. Matrix was by no means immune, with demand for buoyancy products particularly impacted as drillship utilisation and day-rates declined to low levels. Despite the difficult industry conditions, Matrix was able to maintain positive operating margin and cash flow in FY16. This was testament to the value of Matrix’s products to its clients, our ability to deliver ongoing improvements to the cost base, and success in growing our distribution base and launching new products. Matrix also strengthened its balance sheet in the year, ensuring the Company is positioned to capitalise on future growth opportunities, both in existing markets and new markets, as well as to target new strategies identified to drive business growth and development.
FINANCIAL RESULTSMatrix’s FY16 financial results were in line with guidance, with revenue of $95.7 million and underlying EBITDA of $11.3 million. These results were lower than FY15 (revenue $144.1 million, underlying EBITDA $24.3 million), principally due to reduced output of buoyancy products, with demand slowing in the wake of the sustained low oil price. Despite this, we were pleased to maintain a positive underlying EBITDA margin of 11.8 per cent (FY15: 14.6 per cent) and operating cash flow of $2.8 million (FY15: $3.5 million), as the Company matched production to demand and implemented cost efficiencies across the business.
The FY16 underlying EBITDA result removed non-recurring costs of approximately $3.8 million, principally redundancy costs and a non-cash loss on the sale of the Company’s former Malaga workshops. Matrix‘s full year net loss after tax of $2.1 million (FY15: $3.6 million NPAT) reflected the lower production rates as well as the level of non-recurring costs. Importantly, Matrix ended FY16 in a strong financial position, with no term debt and a positive adjusted net cash position of $3.6 million. This ensures the Company is able to invest in new products, new markets, and is positioned to benefit from an oil price recovery.
BUSINESS REVIEWWith the subdued oil and gas sector adversely impacting demand for products and services to the industry, including Matrix’s buoyancy products, the Company moderated production and has targeted new products, markets, and services to best position the business to grow.
At the forefront of this was the launch of Matrix’s new drag reduction system “Matrix LGS” (LGS™) technology in the year. This revolutionary product targets the operating floating rig market and subsea production installations. It works by reducing drag for floating rigs operating in strong ocean currents, allowing operators to reduce costs and increase production through less down time. Matrix delivered its first LGS™ product in June 2016, which was deployed at a rig in the Gulf of Mexico. Matrix has also received strong interest from other operators for the product, with the attributable market for LGS™ in the drilling market alone estimated to be in excess of US$400 million. The launch of LGS™ was consistent with the Company’s strategy of innovation and creating new business lines in a difficult operating environment.
Furthermore, in addition to launching LGS™, Matrix targeted new, developing markets in the Middle East and Asia for well construction products. The Company also continued its strong research and development focus by developing products for new markets, including outside the oil and gas sector such as infrastructure, defence, and marine. These markets enable Matrix to leverage its core skills in engineering and advanced materials.
Finally, Matrix’s production changes and ongoing improvements to its cost base throughout the year have meant that the business is much better positioned to manage market demand.
Matrix maintained its strong focus on safety throughout the year, with the Company continuing to ensure that the welfare of its people is prioritised. Pleasingly, Matrix built on the strong safety record achieved in FY15 – the Company recorded zero Lost Time Injury Frequency Rate (LTIFR) in FY16, making it 25 months of no lost time injuries across the business at 30 June 2016. In addition, Matrix’s Total Recordable Injury Frequency Rate (TRIFR) in FY16 was less than a third of FY15.
For
per
sona
l use
onl
y

5MATRIX ANNUAL REPORT 2016 |
STRATEGYMatrix has a three-pronged strategy to target new opportunities in response to the difficult industry conditions:
1. Expanding our oil and gas product and service range, targeting the industry’s ongoing operational expenditure
2. Developing materials and products for the infrastructure sector
3. Reducing its fixed cost base whilst maintaining production flexibility
A cornerstone of Matrix’s forward strategy is to target growth of its LGS™ product following delivery of our first LGS™ system in the Gulf of Mexico. With the product in the water, results from its performance will be key to generating additional traction, with quotations in excess of US$150 million submitted by Matrix. The Company expects growing demand for this product as operators become more confident of the financial and operating benefits of the system. Matrix is also pursuing growth opportunities associated with high value oil well consumables and technical services. Targeted service areas include subsea equipment services, well intervention services, inspection, and preservation and maintenance services for operator and contractor-owned equipment for the Australasian market.
In a new strategic development, Matrix has broadened the application of its technology into the infrastructure sector, with the Company’s lightweight materials technology adapted into a broad range of applications for the infrastructure and civil sectors. These include additives for concrete systems, lightweight building materials, structures, and energy absorption. Markets include civil engineering, rail infrastructure, mine site infrastructure, and commercial marine applications.
Matrix will remain dynamic in responding to difficult industry conditions by ensuring we continue to moderate production to align with demand. This includes identifying and implementing further operational improvements and cost efficiencies to Matrix’s labour, materials, and fixed cost base whilst maintaining the flexibility to increase production as the oil price recovers.
OUTLOOKMatrix has entered FY17 in a solid financial position that will enable the Company to capitalise on future growth opportunities, whether arising from traditional market sectors already serviced by Matrix or from product diversification and step-out strategies identified to drive business growth and development. At 30 June 2016, Matrix had a backlog of US$46.0 million, supporting production through H1 FY17. It is also anticipated that new products, new markets, and increased efficiencies will offset difficult trading conditions in the short-term, with Matrix continuing to generate cash from operations.
In addition, Matrix has a number of opportunities to build on early success of the LGS™ launch, with new technical products and the expansion of technical services to provide new sustainable growth opportunities. Matrix will maintain its strong R&D focus in FY17 to support the development of leading edge products.
In existing markets, Matrix expects a decline in contracted rig demand in CY17 before a forecast recovery in CY18. Meanwhile, global subsea capex is forecast to increase sharply from CY17 onwards, which is a lead indicator for SURF products. Matrix is developing products for SURF applications, which remain a significant opportunity for the Company. Matrix also plans to expand its presence and service offering in South East Asia and the Middle East to focus on the well construction market, and foresees continued improvement in this market in FY17.
Aaron Begley
Managing Director & Chief Executive Officer
For
per
sona
l use
onl
y

6 MATRIX ANNUAL REPORT 2016|
CORPORATE DIRECTORY
DIRECTORSMr P J Hood (Chairman) Mr A P Begley (CEO) Dr D P Clegg Mr S Cole Mr C N Duncan
COMPANY SECRETARYMr A Santa Maria
HEAD OFFICEMatrix Composites & Engineering Ltd 150 Quill Way Henderson WA 6166 Telephone: +61 (08) 9412 1200 E-mail: [email protected]
OVERSEAS OFFICESMatrix Composites & Engineering (US), Inc 3200 Southwest Freeway Suite 3300 Houston Texas 77027 U.S.A E-mail: [email protected]
MC&E (Europe) Limited Herschel House 58 Herschel Street Slough Berkshire SL1 1HD E-mail: [email protected]
BANKERANZ Level 10, 77 St Georges Terrace Perth WA 6000
LAWYERSLavan Legal 1 William Street PERTH WA 6000
Ashurst 32/2 The Esplanade PERTH WA 6000
AUDITORDeloitte Touche Tohmatsu Brookfield Place, Tower 2 123 St Georges Terrace PERTH WA 6000
SHARE REGISTRYLink Market Services Ltd Level 4 Central Park 152-158 St Georges Terrace PERTH WA 6000
For
per
sona
l use
onl
y

7MATRIX ANNUAL REPORT 2016 |
DIRECTORS’ REPORTThe directors of Matrix Composites & Engineering Ltd (“Matrix” or “the Company”) submit herewith the annual report of the Company for the financial year ended 30 June 2016. In order to comply with the provisions of the Corporations Act 2001, the directors report as follows.
INFORMATION ABOUT THE DIRECTORSThe names and particulars of the directors of the Company during or since the end of the financial year are:
PETER J HOODIndependent Non-Executive Chairman
QUALIFICATIONS & EXPERIENCE
Peter Hood is a qualified Chemical Engineer with over 45 years’ experience in senior management and project development in the mining, oil and gas, and chemical industries.
Mr Hood was previously the CEO of Coogee Resources Ltd, a company involved in the exploration and production of oil and gas in the Timor Sea. Prior to this he was the CEO of Coogee Chemicals Pty Ltd where he oversaw a period of significant growth in the company’s value.
Mr Hood is currently the Immediate Past President of the Australian Chamber of Commerce and Industry (ACCI), a Non-Executive Director of the Chamber of Commerce and Industry of WA and Chairman of GR Engineering Ltd and MAK Industrial Water Systems Pty Ltd. He was also previously Chairman of Apollo Gas Ltd and Vice-Chairman of APPEA.
Mr Hood chairs the Remuneration and Nominations Committees and is a member of the Audit and Risk Committees.
EDUCATION
Bachelor of Engineering (Chemical), Melbourne University, 1970
Advanced Management Program, Harvard Business School, 1997
Graduate Diploma of Administration, Western Australian Institute of Technology (now Curtin University), 1974
MEMBERSHIPS
Fellow of the Australian Institute of Company Directors
Fellow of the Institute of Chemical Engineers
Member of the Australian Institute of Mining and Metallurgy
AARON P BEGLEYManaging Director & Chief Executive Officer
QUALIFICATIONS & EXPERIENCE
Aaron Begley has over 20 years’ experience in manufacturing and marketing specialized industrial equipment, materials and services to the oil & gas and marine technology sectors.
Prior to his current role as Managing Director and Chief Executive Officer, Mr Begley held various positions within Matrix Composites & Engineering Ltd since starting with the company in 1993. Throughout his tenure, Mr Begley has overseen the company’s growth from a local engineering firm to a global market leader in the manufacture and development of composite materials technologies and engineered products for the oil & gas sector.
EDUCATION
Post Graduate Diploma of Management (Curtin), 2002
Bachelor of Economics (University of Western Australia), 1993
MEMBERSHIPS
Australian Institute of Company Directors
Society of Underwater Technology (SUT)
Society of Petroleum Engineers (SPE)
International Association of Drilling Contractors (IADC)
DUNCAN P CLEGGIndependent Non-Executive Director
QUALIFICATIONS & EXPERIENCE
Dr Clegg has 40 years’ experience in the global oil and gas industry as an engineer and business executive. With extensive leadership experience, Dr Clegg has worked in venture formation, project development and management of large scale projects in Australia, Asia, Europe and Africa. Dr Clegg is a consultant to a number of energy companies. Previously, Dr Clegg was the Manager of Projects and Developments at Coogee Resources Pty Ltd, and has held senior management and executive positions at Woodside Petroleum Limited and Shell International Petroleum Maatschappij.
Dr Clegg is a member of the Risk, Remuneration and Nomination Committees.
EDUCATION
Chartered Engineer, 1985
Doctor of Philosophy (Soil Mechanics), University of Cambridge, 1981
Bachelor of Science (Hons), University of Cardiff, 1975
MEMBERSHIPS
Graduate of the Australian Institute of Company Directors
For
per
sona
l use
onl
y

8 MATRIX ANNUAL REPORT 2016|
DIRECTORS’ REPORT
STEVEN COLEIndependent Non-Executive Director
QUALIFICATIONS & EXPERIENCE
Steven Cole has over 40 years’ of legal, business and corporate experience as well as a range of executive management and non-executive appointments. His extensive boardroom and board sub-committee experience includes ASX listed, statutory, proprietary and NFP organisations covering the industrial, financial, educational, professional services, health and resources sectors. Mr Cole is Chairman of Neometals Limited, the Queen Elizabeth II Medical Centre Trust, Brightwater Care Group Ltd and a board member of the Chamber of Commerce & Industry (WA). Mr Cole was also previously WA State President and a national board member of the Australian Institute of Company Directors.
Mr Cole chairs the Audit Committee and is a member of the Remuneration and Nomination Committees.
EDUCATION
Bachelor of Laws (Hons)
MEMBERSHIPS
Fellow of the Australian Institute of Company Directors
CRAIG N DUNCANIndependent Non-Executive Director
QUALIFICATIONS & EXPERIENCE
Craig Duncan has over 35 years’ experience in the petroleum and mining industries in Australia, Asia, the Middle East and Africa. He was previously a Drilling Superintendent at Apache Energy for 12 years and was responsible for managing well construction operations. Prior to this role, Mr Duncan was involved in manufacturing specialised equipment for the gold mining industry.
Mr Duncan chairs the Risk Committee and is a member of the Audit Committee.
EDUCATION
Graduate Diploma in Petroleum Engineering, University of New South Wales, 2005
The above named directors held office during the whole of the financial year and since the end of the financial year.
For
per
sona
l use
onl
y

9MATRIX ANNUAL REPORT 2016 |
DIRECTORS’ REPORT
DIRECTORSHIPS OF OTHER LISTED COMPANIESDirectorships of other listed companies held by directors in the three years immediately before the end of the financial year are as follows:
NAME COMPANY PERIOD OF DIRECTORSHIP
PJ Hood GR Engineering Ltd 2010 – Current
S Cole Neometals Ltd 2008 – Current
DIRECTORS’ SHAREHOLDINGSThe following table sets out each director’s relevant interest in shares, and share appreciation rights or options in shares of the Company or a related body corporate as at the date of this report.
DIRECTORS FULLY PAID SHARESNUMBER
SHARE APPRECIATIONRIGHTS – FY15
SHARE APPRECIATIONRIGHTS – FY14
PJ Hood 630,000 nil nil
AP Begley 3,643,077 1,545,455 592,593
DP Clegg 39,918 nil nil
S Cole 20,000 nil nil
CN Duncan 590,429 nil nil
No shares, share appreciation rights or options in shares have been issued for compensation purposes during or since the end of the financial year to any Director of the Company, other than 1,545,455 Executive Share Appreciation Rights (2015: 592,593) that have been granted to Mr Aaron Begley pursuant to the Matrix Rights Plan. The grant of Executive Share Appreciation Rights to Mr Aaron Begley, was approved by shareholders at the Annual General Meeting of shareholders held on 4 November 2015.
REMUNERATION OF KEY MANAGEMENT PERSONNELInformation about the remuneration of key management personnel is set out in the remuneration report of this director’s report, on pages 18 to 30. The term ‘key management personnel’ refers to those persons having authority and responsibility for planning, directing and controlling the activities of the consolidated entity, directly or indirectly, including any director (whether executive or otherwise) of the consolidated entity.
RIGHTS GRANTED TO DIRECTORS AND EXECUTIVE MANAGEMENTDuring and since the end of the financial year, an aggregate 3,727,272 Executive Share Appreciation Rights and 16,129 Executive Performance Rights were granted to the following directors and senior executives of the company and its controlled entities as part of their remuneration:
DIRECTOR/EXECUTIVE ISSUING ENTITY EXECUTIVE SHARE APPRECIATION RIGHTS
EXECUTIVE PERFORMANCE RIGHTS
Aaron Begley Matrix Composites & Engineering Ltd 1,545,455 Nil
Stephen Edgar Matrix Composites & Engineering Ltd 454,545 Nil
Peter Pezet Matrix Composites & Engineering Ltd 454,545 16,129
Peter Tazewell Matrix Composites & Engineering Ltd 772,727 Nil
Alex Vincan Matrix Composites & Engineering Ltd 500,000 Nil
For
per
sona
l use
onl
y

10 MATRIX ANNUAL REPORT 2016|
DIRECTORS’ REPORT
COMPANY SECRETARYMr Adam Santa Maria (BCom, LLB (Hons), MAppFin) was appointed Joint Company Secretary on 26 October 2015 and held the position at the end of the financial year. Mr Santa Maria is admitted to practice as a barrister and solicitor of the Supreme Court of Western Australia and Victoria and the High Court of Australia.
Mr Peter Tazewell (BCom, FCA, F Fin) joined Matrix in December 2011 and held the position of company secretary of the Company at the end of the financial year. He is a Fellow of the Institute of Chartered Accountants in Australia and Senior Associate of the Financial Services Institute of Australasia.
PRINCIPAL ACTIVITIES FOR FY16The consolidated entity’s principal activities during the course of the financial year were the:
• manufacture and supply of capital drilling equipment (primarily comprised of syntactic foam buoyancy) and provision of inspection, maintenance and repair services;
• manufacture and supply of subsea umbilical risers and flowline (SURF) ancillary equipment and associated services; and
• manufacture and supply of well construction products, including centralizers and conductors.
REVIEW OF OPERATIONS
OVERVIEW
Matrix’s financial performance was adversely impacted by the significant downturn suffered by oil field service companies globally. Lower oil and gas prices have resulted in the deferral, and in some instances, cancellation of oil field projects and the associated equipment and services required to commission them. In the face of this outlook, Matrix has reduced buoyancy production to match customer demand. This reduction in buoyancy production had a significant adverse impact on output, revenue and earnings.
During the financial year Matrix completed the closure of its fabrication and machine shop services, due to declining demand, and sold the resultant surplus real property and equipment assets.
Matrix continued to grow its distribution base for well construction products entering into key distribution agreements with agents in USA, Saudi Arabia and United Arab Emirates.
SAFETY
Matrix continued to improve safety performance across all of its operating sites during the financial year, improving on the existing low recordable incidents and organisational safety culture.
Matrix operates an occupational health and safety (OHS) management system that is accredited to AS/NZS 4801: 2001 and OHSAS18001: 2007. Matrix continues to scrutinise and identify hazards and risks to prevent injuries and illnesses. Matrix continues to improve controls of recognised hazards and continues to resolve or lower the risks with appropriate actions.
Matrix maintained a lost time injury frequency rate (LTIFR) of zero, with 25 months of no lost time injuries across the company. Matrix also achieved a medical treatment injury frequency rate of zero (MTIFR) on 19 February 2016, having had the last MTI on 19 February 2015 and has been maintained at zero also. The total recordable injury frequency rate (TRIFR) is less than a third of the previous year.
Proactive lead indicators have been applied, and the annual review of those indicators has shown an improved understanding of the workplace safety culture and commitment to safety. The lead indicators support the company wide no-blame culture, which is still evident at all levels and supports the positive mindset of a lean and dynamic operating environment.
Matrix has an annual plan to measure safety success, so that the agreed objectives can be monitored and achieved. The objectives are aligned with the management of Matrix’s risk profile and support the Company values.
Matrix is a member of IFAP, has an affiliation with the Occupational Health Society of WA, and is again providing mentoring for undergraduate HSE students from Curtin University of Technology.
MANUFACTURING OPERATIONS
Demand for buoyancy products declined further in FY16 causing Matrix to revert to a two-shift roster in December 2015. Headcount was reduced in proportion to the reduction in output. As a result, actual production across the full year was approximately 50 per cent lower than in FY15. Matrix has maintained a backlog (US$35 million at 30 June 2016) which will substantially underwrite production, at current rates, throughout 1H FY17.
Matrix continued its continuous improvement programme during FY16 which resulted in ongoing efficiencies in process management, labour costs and materials costs.
Matrix continued production of its patented centralizer products at Henderson. Demand for centralizers was approximately 45 per cent lower than in FY15, primarily due to continued weakness in the North American market. Notwithstanding this, North America comprised 58 per cent of global sales volumes and new markets in Asia accounted for 30 per cent.
COMMERCIAL
Matrix continued to service the oil and gas sector maintaining sales and support functions in the key markets of Asia (Perth), North America (Houston) and Europe (Alnwick). Due to the consolidation of customer purchasing functions, sales resources have been refocussed more prominently into North America.
In February 2016, Matrix introduced its LGS™ drag reduction system for offshore buoyancy products. Matrix has submitted quotations for in excess of US$150 million of LGS™ buoyancy with the first installed system being deployed in the Gulf of Mexico in June 2016. The LGS™ system reduces drag and vortex induced vibration for floating drill rigs operating in strong ocean current conditions, allowing operators to
For
per
sona
l use
onl
y
11MATRIX ANNUAL REPORT 2016 |
DIRECTORS’ REPORT reduce costs and increase productivity through less rig downtime. Matrix anticipates growing demand for this product as operators become more confident of the financial and operating benefits of the system.
As noted previously, Matrix expanded its distribution network for well construction products and services with new distributors appointed in USA, Saudi Arabia and the United Arab Emirates. Matrix is in advanced negotiations with a local distributor in Indonesia. Matrix is also expanding its product range in this offering.
Matrix has established a strategically located service base in Karratha, Western Australia to service mobile
drilling equipment. Although revenue generation from this facility has not met short term projections, primarily due to the reduction in the number of offshore vessels operating in Australian waters, the facility provides a footprint to expand Matrix’s range of equipment servicing capabilities to both fixed and mobile offshore rigs and processing installations.
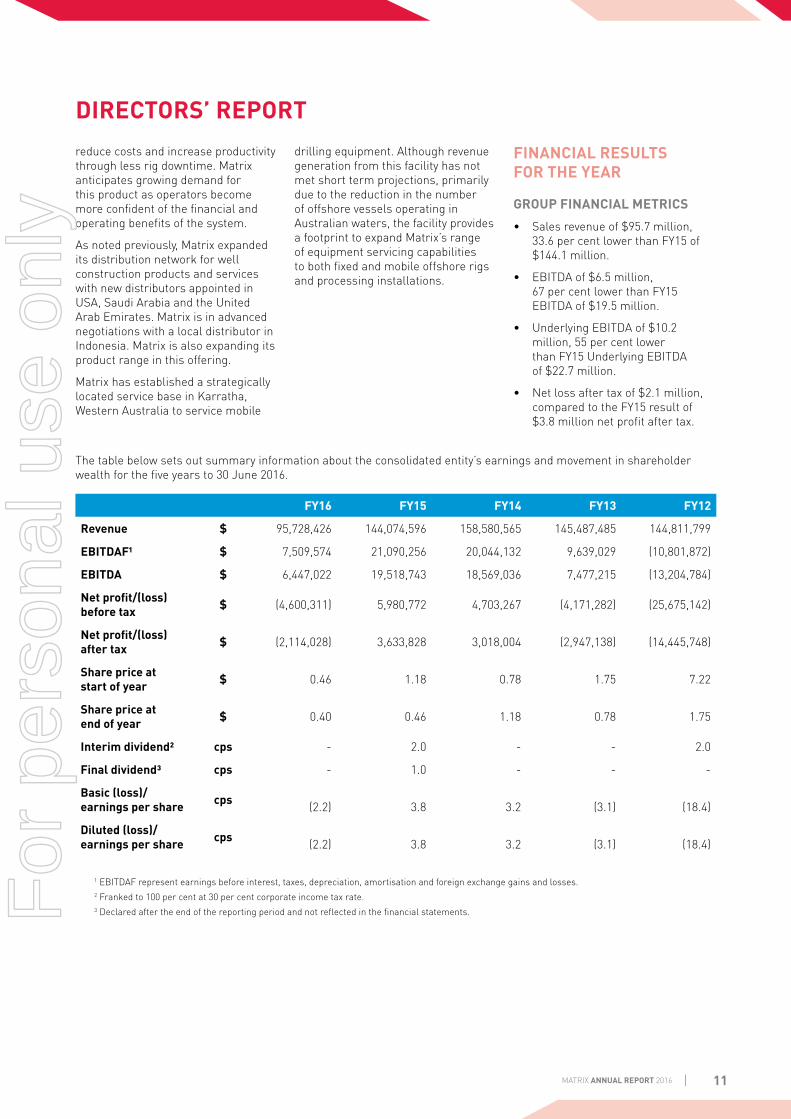
FINANCIAL RESULTS FOR THE YEAR
GROUP FINANCIAL METRICS
• Sales revenue of $95.7 million, 33.6 per cent lower than FY15 of $144.1 million.
• EBITDA of $6.5 million, 67 per cent lower than FY15 EBITDA of $19.5 million.
• Underlying EBITDA of $10.2 million, 55 per cent lower than FY15 Underlying EBITDA of $22.7 million.
• Net loss after tax of $2.1 million, compared to the FY15 result of $3.8 million net profit after tax.
The table below sets out summary information about the consolidated entity’s earnings and movement in shareholder wealth for the five years to 30 June 2016.
FY16 FY15 FY14 FY13 FY12
Revenue $ 95,728,426 144,074,596 158,580,565 145,487,485 144,811,799
EBITDAF¹ $ 7,509,574 21,090,256 20,044,132 9,639,029 (10,801,872)
EBITDA $ 6,447,022 19,518,743 18,569,036 7,477,215 (13,204,784)
Net profit/(loss) before tax $ (4,600,311) 5,980,772 4,703,267 (4,171,282) (25,675,142)
Net profit/(loss) after tax $ (2,114,028) 3,633,828 3,018,004 (2,947,138) (14,445,748)
Share price at start of year $ 0.46 1.18 0.78 1.75 7.22
Share price at end of year $ 0.40 0.46 1.18 0.78 1.75
Interim dividend² cps - 2.0 - - 2.0
Final dividend³ cps - 1.0 - - -
Basic (loss)/ earnings per share cps
(2.2)
3.8
3.2
(3.1)
(18.4)
Diluted (loss)/ earnings per share cps
(2.2)
3.8
3.2
(3.1)
(18.4)
1 EBITDAF represent earnings before interest, taxes, depreciation, amortisation and foreign exchange gains and losses.2 Franked to 100 per cent at 30 per cent corporate income tax rate.3 Declared after the end of the reporting period and not reflected in the financial statements.
For
per
sona
l use
onl
y

12 MATRIX ANNUAL REPORT 2016|
DIRECTORS’ REPORT EARNINGS
Matrix reported reduced earnings in FY16, a result of lower production in response to reduced demand across its product and service lines, particularly for buoyancy products. Operating margins were adversely impacted by the production inefficiencies of low production rates, despite ongoing labour and materials efficiencies being achieved. Raw material costs have continued to fall in response to lower levels of global economic activity.
Earnings from well construction products were adversely impacted by lower volumes in the Company’s principal centralizer product line, with new product lines and services contributing positively to the overall result.
Interest and finance charges have reduced as a result of lower term debt and a more favourable banking facility. Depreciation is also significantly reduced following the closure of the Malaga fabrication and machining workshop.
Matrix’s statutory result was adversely impacted by a series of non-recurring items as set out below:
RECONCILIATION OF UNDERLYING EBITDAF $
Statutory EBIT (4,162,244)
Depreciation and amortisation 10,609,266
Foreign Exchange losses 1,062,552
Statutory EBITDA 7,509,574
Redundancy Costs 1,965,827
Prior year workers compensation insurance adjustment 556,541
Write off of raw material inventory 420,858
Loss on disposal of Camboon Road property 679,580
Other 150,769
Underlying EBITDA¹ 11,283,149
Profitability (NPAT) continues to be challenged by the high level of depreciation resulting from the significant capital expenditure incurred between 2010 and 2012. Matrix’s ongoing future capital expenditure is expected to remain relatively constant at approximately 50 per cent of annual depreciation. As noted above, depreciation charges are significantly reduced, and are expected to fall further in future years.
Matrix incurred significantly lower foreign exchange losses in FY16, despite the currency trending higher over the course of the year.
CASH FLOW
Matrix generated positive cash flow from operations of $2.8 million during the financial year. Net cash flow for the year was $(6.4) million. Key impacts on net cash flow included:
i) Repayment of $8.0 million in term debt;
ii) $1.2 million in shareholder distributions (dividends and on-market share buy back); and
iii) $4.1 million received for the sale of real property and other surplus plant and equipment.
Capital expenditure of $5.6 million was higher than the previous year (2015: $4.7 million), primarily due to research and development and tooling costs associated with developing the new LGS™ buoyancy system.
During the financial year Matrix paid a final dividend in relation to FY15 of 1.0 cents per share in September 2015. Matrix also completed its on-market share buy-back of 805,428 shares at an average price of $0.54 per share.
1 Underlying EBITDA excludes non-recurring costs and foreign exchange losses.
For
per
sona
l use
onl
y

13MATRIX ANNUAL REPORT 2016 |
DIRECTORS’ REPORT Matrix maintained positive operating cash flow, as set out in Chart 1 below.
-
5
(2.1)(2.5) (0.4)
10.6 6.4 0.4 0.7
7.6
10.1 7.2
13.2
0.2 2.8 6.9
(4.1) (5.1) (0.3) (0.9) (6.4)(5)
(10)
10
$m
15
20
25
NPAT
Income tax
Net Interest
DepreciationEBITDA
Net Interest
Loss on PPE
Receivables
Inventory
Payables
Progress Billing
Other
CASH FROM OPERATIONS
Capex/R&D
Proceeds from asset sales
Net Debt R
eduction
Share Buy back
Dividends
NET CHANGE IN CASH
FINANCIAL POSITION
As at the end of the financial year, Matrix maintained a solid financial position with positive cash earnings and strong balance sheet management. Term debt has been eliminated and the Company is in a net cash position. Working capital is sufficient to support the current operations of the Company.
BUSINESS STRATEGIESMatrix’s business strategies are as follows:
i) broaden range of service and products targeting operational expenditure and the IMR sector of the Oil & Gas industry;
ii) continue to drive unit costs down through labour
efficiencies and supply chain improvements;
iii) leverage materials technologies into high value technical applications; and
iv) pursue market diversification opportunities in the infrastructure space via organic growth and acquisition opportunities.
OUTLOOKThe market for buoyancy products for the offshore oil and gas sector continues to be challenging and while the longer term outlook for energy demand remains strong, the short to medium term outlook remains uncertain as the global economy adjusts to the current imbalance
between oil supply and oil demand. Matrix has prudently adapted to this new macro environment by reducing short term production output.
Drillship utilisation and day-rates remain at levels below what is necessary to drive new investment. Notwithstanding this, Matrix LGS™ is a product that can be retro-fitted and can be targeted at the global deployed rig fleet. The accessible market size is global demand for deployed semi and drillship market which is projected to recover from 173 units in 2016 to 215 units in 2020. Matrix LGSTM also has applications in the SURF market for flexible and rigid risers, tethers and other structures. Matrix remains confident that LGS™ technology will drive volumes of replacement buoyancy over the next few years.
Chart 1 Cash Flow Bridge
CASH FLOW BRIDGE
For
per
sona
l use
onl
y

14 MATRIX ANNUAL REPORT 2016|
DIRECTORS’ REPORT
NEWBUILD DRILLSHIPS
0
5
10
15
20
25
30
35
20092010
20112012
20132014
20152016E
2017E2018E
2019E2020E
Built Under Construction Ordered
Chart 2 (Source: Company Data)
Chart 2 shows the anticipated construction profile for new drillships, historically and over the next three years. While the outlook for newbuild drillships is highly uncertain, Matrix expects increased volumes for buoyancy products to come from the replacement market until drillship utilisation rates improve.
In addition, fleet retirements are being accelerated as older vessels are either scrapped or cold-stacked where drilling contractors are unable to secure new contracts. Ultimately this will lead to increased newbuild commitments when the oil price recovers.
Matrix expects there will be continued demand from the replacement market, primarily for LGS™ products.
Chart 3 shows the supply-demand balance of the existing global floater fleet. Utilisation is forecast to continue to trend downwards before stabilising in 2017 and recovering thereafter. Typically, utilisation rates are in excess of 80 per cent to stimulate new drillship construction. Matrix does not expect to see a recovery in buoyancy supply to the newbuild sector until 2018 or later.
FLOATER SUPPLY-DEMAND MODEL
0
50
100
150
200
250
300
350 100%
90%
80%
70%
60%
50%
40%
30%
20%
10%
0%
20022004
20062008
20102012
20142016
20182020
Contracted Demand Marketed Supply Marketed Utilisation Chart 3 (Source: Company Data)
For
per
sona
l use
onl
y

15MATRIX ANNUAL REPORT 2016 |
DIRECTORS’ REPORT Matrix continues to develop products for SURF applications which remains a significant opportunity for the Company. Subsea expenditure stabilised in CY16 after a significant reduction experienced in CY15. Global capital expenditure forecast to increase sharply in CY17, returning to CY14 levels, before experiencing significant growth. Chart 4 sets out the forecast capital expenditure for offshore oil and gas developments over the next five years which is a lead indicator for SURF buoyancy products.
GLOBAL SUBSEA CAPEX (US$bn) 2010 - 2020
0
10
20
30
40
20102011
20122013
20142015
20162017
20182019
2020
AfricaAustralia
Latin AmericaNorth America
AsiaEurope
Middle East & Caspian Sea
Chart 4 (Source: Infield, February 2015)
The market for Matrix’s well construction products has also been adversely impacted by the fall in the oil price. Chart 5 sets out the historical and forecast ‘feet volume’ to be drilled on land and offshore wells. While there has been a sharp fall (approximately 44 per cent) from the peak activity recorded in 2014, “feet volume” is forecast to grow strongly in 2017 and over the next five years. In addition, Matrix has been successful in developing new markets for its well construction products and expects increased revenue in FY17.
The outlook for Matrix’s products has been significantly impacted by the sustained period of low oil and gas prices. Notwithstanding this, Matrix has continued to reduce output and costs to ensure the business remains cash flow positive. Matrix’s disciplined approach to reducing debt over the past three years has resulted in the company having a strong balance sheet with no term debt and significant liquidity.
USA Total NAM
0
300
200
100
400
Foot
age
(m)
600
500
700
900
800
20112012
20132014
20152016
20172018
20192020
Chart 5 (Source: Spears & Associates, June 2016)
GLOBAL DRILLING FOOTAGE (2011-2020)
For
per
sona
l use
onl
y

16 MATRIX ANNUAL REPORT 2016|
DIRECTORS’ REPORT
CHANGES IN STATE OF AFFAIRSDuring the year Matrix successfully launched its range of new LGS™ drag reduction technologies. Matrix also disposed of surplus real property and equipment associated with its former fabrication and machining workshop activities. Other than these matters, there were no significant changes in the state of affairs of the consolidated entity during the financial year.
SUBSEQUENT EVENTSThere has not been any matter or circumstance occurring subsequent to the end of the financial year that has significantly affected or may significantly affect the operations of the consolidated entity, the results of those operations, or the state of affairs of the consolidated entity in future financial years.
FUTURE DEVELOPMENTSHaving regard to its current balance of contracted work for buoyancy products (including both drilling and SURF products), Matrix will continue to flex production and overheads in order to meet demand. The principal risk to Matrix’s ongoing production rates is the presence of global client demand and its ability to secure contracted work in a timely manner.
Matrix expects that demand for its well construction products will continue, as new products are introduced and new markets entered. Despite lower oil and gas prices, there continues to be significant drilling activity, both onshore and offshore.
Matrix expects ongoing demand for maintenance services to the offshore oil and gas sector in Western Australia will continue to provide market opportunities for inspection, maintenance and repair services. The Karratha Riser base provides a footprint to expand Matrix's range of equipment servicing to both fixed and mobile offshore rigs and onshore processing installations.
Matrix is continuing to market its new range of Matrix LGS™ products which targets the existing global rig fleet and new applications for subsea production, reducing reliance on the newbuild rig cycle. Matrix is also targeting new growth markets outside of the oil and gas industry where it can leverage its core skills in engineering and advanced materials. These markets include marine, defence and civil.
ENVIRONMENTAL REGULATIONSThe consolidated entity’s principal operating site at Henderson, Western Australia is subject to the operation of the Environmental Protection Act 1986 (WA) (EP Act). Compliance with the provisions of the EP Act and reporting of any material breaches is overseen by the Group Occupational Health Safety and Environment department. When breaches occur, they are reported to the Department of Environmental Regulation (DER) as required and actions taken to prevent recurrences.
During the year there were no breaches of the EP Act and Matrix has been able to demonstrate continued good environmental performance. This is demonstrated by compliance against the environmental licence in accordance with Part V of the EP Act. The Henderson site continues to operate as designed, and had no reportable events.
Environmental objectives and key performance indicators (KPIs) have been agreed, and accepted at the senior management level. These KPIs have been reviewed and monitored over the financial year to ensure opportunities for improvement are identified and acted on.
DIVIDENDSIn respect of the financial year ended 30 June 2015, as detailed in the directors’ report for that financial year, an interim dividend of 2.0 cents per share and a final dividend of 1.0 cents per share, each franked to 100
per cent at the 30 per cent corporate income tax rate, was paid to holders of fully paid shares on 31 March 2015 and 30 September 2015 respectively.
In respect of the financial year ended 30 June 2016, no interim dividend was paid and the directors have determined that no final dividend will be paid.
SHARES UNDER OPTION OR ISSUED ON EXERCISE OF OPTIONSDuring the financial year there were no shares issued as a result of exercise of options.
INDEMNIFICATION OF OFFICERS AND AUDITORSDuring the financial year, the Company paid a premium in respect of a contract insuring the directors of the Company (as named above) and all executive officers of the Company and any related body corporate against a liability incurred as such director or executive officer to the extent permitted by the Corporations Act 2001. The contract of insurance prohibits disclosure of the nature of the liability and the amount of the premium.
The Company has not otherwise, during or since the end of the financial year, except to the extent permitted by law, indemnified or agreed to indemnify an officer or auditor of the Company or of any related body corporate, against a liability incurred as such an officer or auditor.
The company was not a party to any such proceedings during the year.
For
per
sona
l use
onl
y

17MATRIX ANNUAL REPORT 2016 |
DIRECTORS’ REPORT
DIRECTORS’ MEETINGS The following table sets out the number of directors’ meetings (including meetings of committees of directors) held during the financial year and the number of meetings attended by each director (while they were a director or committee member). During the financial year, nine board meetings, two remuneration committee meetings, one nominations committee meeting, three risk committee meetings and three audit committee meetings were held.
BOARD OF DIRECTORS
REMUNERATION COMMITTEE
NOMINATION COMMITTEE
AUDIT COMMITTEE
RISK COMMITTEE
Directors Held Attended Held Attended Held Attended Held Attended Held Attended
PJ Hood 9 9 2 2 1 1 3 3 3 3
AP Begley 9 9 - - - - - - - -
DP Clegg 9 9 2 2 1 1 - - 3 3
S Cole 9 9 2 2 1 1 3 3 - -
CN Duncan 9 7 - - - - 3 3 3 3
PROCEEDINGS ON BEHALF OF COMPANYNo person has applied for leave of Court under the Corporations Act 2001 to bring proceedings on behalf of the Company or intervene in any proceedings to which the Company is a party for the purposes of taking responsibility on behalf of the Company for all or any part of those proceedings.
NON-AUDIT SERVICESDetails of amounts paid or payable to the auditor for non-audit services provided during the year by the auditor are outlined in note 5 to the financial statements. The directors are satisfied that the provision of non-audit services, during the year, by the auditor (or by another person or firm on the auditor’s behalf) is compatible with the general standard of independence for auditors imposed by the Corporations Act 2001.
The directors are of the opinion that the services as disclosed in note 5 to the financial statements do not compromise the external auditor’s independence, based on advice received from the Audit Committee, for the following reasons:
• all non-audit services have been reviewed and approved to ensure that they do not impact the integrity and objectivity of the auditor; and
• none of the services undermine the general principles relating to auditor independence as set out in APES 110 ‘Code of Ethics for Professional Accountants’ issued by the Accounting Professional & Ethical Standards Board, including reviewing or auditing the auditor’s own work, acting in a management or decision-making capacity for the company, acting as advocate for the company or jointly sharing economic risks and rewards.
AUDITOR’S INDEPENDENCE DECLARATIONThe auditor’s independence declaration is included on page 30 of the annual report.
CORPORATE GOVERNANCE STATEMENTThe Board of Matrix is responsible for the corporate governance of the company and its subsidiaries. The Board has governance oversight of all matters relating to the strategic direction, corporate governance, policies, practices, management and operations of Matrix with the aim of delivering value to its Shareholders and respecting the legitimate interests of its other valued stakeholders, including employees, customers and suppliers.
Under ASX Listing Rule 4.10.3, Matrix is required to provide in its annual report details of where shareholders can obtain a copy of a corporate governance statement, disclosing the extent to which the Company has followed the ASX Corporate Governance Council Principles and Recommendations in the reporting period. Matrix has published its corporate governance statement on the “Corporate Governance” page of its web site at www.matrix-corp.org
For
per
sona
l use
onl
y

18 MATRIX ANNUAL REPORT 2016|
AUDITED REMUNERATION REPORTThis remuneration report, which forms part of the directors’ report, sets out information about the remuneration of the Company’s directors and key management personnel for the financial year ended 30 June 2016.
The term Key Management Personnel refers to those persons having authority and responsibility for planning, controlling and directing the activities of the consolidated entity, directly or indirectly, including any director (whether executive or otherwise) of the consolidated entity. Any reference to “Executives” in this report refers to those Key Management Personnel who are not Non-Executive Directors. The prescribed details for each person covered by this report are detailed below under the following headings:
• Key management personnel
• Remuneration policy
• Remuneration structure
• Relationship between the remuneration policy and company performance
• Remuneration of directors and key management personnel
• Key terms of employment contracts
• Key management personnel equity holdings
• Key management personnel Share Based Payment holdings – Share Appreciation Rights
• Key management personnel Share Based Payment holdings – Performance Rights
KEY MANAGEMENT PERSONNELThe directors and other Key Management Personnel of the consolidated entity during or since the end of the financial year were:
NON-EXECUTIVE DIRECTORSThe following persons acted as non-executive directors of the Company during the financial year:
Mr PJ Hood (Chairperson)
Dr DP Clegg
Mr S Cole
Mr CN Duncan
Unless otherwise stated, the named persons held their current position for the whole of the financial year and since the end of the financial year.
EXECUTIVE OFFICERSThe following persons were employed as Matrix executives during the financial year:
Mr AP Begley (Chief Executive Officer)
Mr S Edgar (General Manager - Commercial)
Mr P Pezet (General Manager - Engineering)
Mr P Tazewell (Chief Financial Officer/Company Secretary)
Mr A Vincan (Chief Operating Officer)
Except as noted, the named persons held their current position for the whole of the financial year and since the end of the financial year. Messrs Edgar and Pezet are continuing employees who were designated as Key Management Personnel effective 1 July 2015.
Mr Tazewell ceased employment at the Company on 9 September 2016.
REMUNERATION POLICY
NON-EXECUTIVE DIRECTORSThe remuneration policy aims to attract, retain and motivate talented and highly skilled non-executive Directors and to remunerate fairly and responsibly having regard to the following factors:
• the level of fees paid to non-executive Directors are at market rate for comparable companies;
• the size and complexity of the Company’s operations; and
• the responsibilities and work requirements of the Directors.
The Remuneration Committee determines payments to the non-executive Directors and reviews their remuneration annually based on market practice, duties and accountability. Independent external advice is sought where required.
Non-executive Directors are paid fixed annual fees; they do not receive any variable, performance based remuneration. The maximum aggregate amount of fees that can be paid to non-executive Directors is subject to approval by shareholders (currently $500,000 per annum).
The allocation of fees to non-executive directors within this cap has been determined after consideration of a number of factors including the time commitment of directors, the size and scale of the Company’s operations, the skillsets of Directors, the quantum of fees paid to non-executive directors of comparable companies and participation in Board Committee work.
As a result of a market review conducted during FY15, the annual fees of non-executive directors (inclusive of superannuation) were revised in accordance with the following table, effective 1 July 2015.
For
per
sona
l use
onl
y

19MATRIX ANNUAL REPORT 2016 |
AUDITED REMUNERATION REPORT
NAME PREVIOUS FEES REVISED FEES
Peter Hood $98,325 $125,000
Duncan Clegg $60,088 $75,000
Steven Cole $60,088 $75,000
Craig Duncan $60,088 $75,000
Having regard to changing market conditions throughout the financial year and the Company’s efforts to achieve cost savings where practicable, the Board determined to reduce the annual fees (inclusive of superannuation) paid to non-executive directors by 10 per cent, as set out in the following table, effective 1 April 2016. This 10 per cent reduction in Directors’ fees is in line with reductions for salaried staff outlined on page 19.
NAME PREVIOUS FEES REVISED FEES
Peter Hood $125,000 $112,500
Duncan Clegg $75,000 $67,500
Steven Cole $75,000 $67,500
Craig Duncan $75,000 $67,500
In FY16 the Chairperson received an annual fee of $122,158 (2015: $98,550). All other non-executive directors received an annual fee of $73,295 (2015: $60,225). All amounts specified in this section are inclusive of superannuation contributions.
MATRIX EXECUTIVESThe Company’s remuneration policy for Matrix executives (including executive directors) is to fairly and responsibly reward them having regard to the performance of the Group, the performance of the executive and prevailing remuneration expectations in the market.
The Company also seeks to establish remuneration structures which align the interests of its key management personnel with the interests of the Company and its shareholders. The payment of any incentive amounts to executive Directors and Matrix executives is based on the delivery of key Group and individual outcomes, and the profitability of the Matrix Group.
As detailed in this report, certain Matrix executives are entitled to receive short term incentive payments in respect of FY16 based on delivery of key financial and non-financial outcomes. Matrix executives were not paid incentives resulting from
increases in the Company’s share price in FY16.
The details of Matrix’s long term incentive plan for its executives are provided below.
The amount of compensation for current and future periods for Matrix executives is based on consideration of market factors, comparison to peers and reference to the individual’s experience and performance. Overall, remuneration policies are subject to the discretion of the Board and can be changed to reflect the competitive market and business conditions when in the interest of the Company and shareholders.
REMUNERATION STRUCTUREThe remuneration structure for Matrix Executives comprises fixed and variable components which are reviewed annually by the Remuneration Committee.
FIXED REMUNERATIONFixed remuneration comprises base salary, employer superannuation contributions and other allowances and non-cash benefits. Each Executive’s fixed remuneration is reviewed and benchmarked annually.
The level of remuneration is set to enable the Company to attract and retain proven performers.
As a result of cost saving initiatives implemented by the Company, Mr A Begley, as the Chief Executive Officer of Matrix, agreed to a fixed salary reduction of 10 per cent, effective 1 April 2016 for a period of one year. In addition, all full time employees (including Executives, but excluding Mr A Begley) have agreed, effective 1 July 2016, to participate in the Company’s Flexible Day Off (FDO) programme, which results in an effective reduction in salary of 10 per cent.F
or p
erso
nal u
se o
nly

20 MATRIX ANNUAL REPORT 2016|
VARIABLE REMUNERATIONVariable remuneration comprises short term incentives (STIs) linked to Company and individual performance over one year, and long term incentives (LTIs) linked to performance over a period greater than a year.
The following table sets out the maximum variable remuneration each Executive can achieve in FY16, expressed as percentage of total remuneration, if maximum performance was achieved for the STI and LTI components of their variable remuneration.
EXECUTIVE
MAXIMUM STI
(% OF TOTAL REM)
MAXIMUM LTI
(% OF TOTAL REM)
MAXIMUM TOTAL VARIABLE REMUNERATION
(% OF TOTAL REM)
Aaron Begley Managing Director & Chief Executive Officer 13.77 21.27 35.04
Stephen Edgar General Manager – Commercial 14.40 13.09 27.49
Peter Pezet General Manager - Engineering 12.53 13.93 26.46
Peter Tazewell Chief Financial Officer 10.79 16.68 27.47
Alex Vincan Chief Operating Officer 10.92 10.92 21.84
STI REMUNERATION
A comprehensive Short Term Incentive Plan (STI Plan) was in place for key management personnel for FY16. The STI Plan is based on a number of key performance indicators (KPIs) including a subjective performance KPI, safety performance KPI and profitability KPI. The STI Plan allows executives and employees to benefit from achieving results that surpass their target KPIs. Conversely, they will only be proportionately rewarded should the KPI targets not be fully achieved.
STI KEY PERFORMANCE INDICATORS
The STI KPIs comprise a mix of financial and non-financial metrics which are aligned to both the financial success of the Company and its longer term sustainability and are set each year. The KPIs for each Executive are tailored to their individual responsibilities but are broadly described in the following categories:
i) Financial: Achievement of predetermined targets for EBITDA and cost management.
ii) Safety: The Board reviews the Company’s safety performance and has established a series of lagging and lead indicators to measure the Company’s performance in ensuring a safe workplace. The primary metrics include lost time injuries (LTI), medical treatment injury frequency rate (MTIFR) and hazard reporting, which is a behaviour based lead indicator.
iii) Leadership: Providing leadership in pre-determined functional areas (technical, operational and quality) has been identified by the Board as critical to the ongoing success of the Company. Executives have tailored KPIs set in those functional areas that they have the ability to influence.
iv) Personal Objectives: The Board recognises each Executive contributes to the Company’s business strategy differently. Progress in the achievement of each Executive’s personal objectives is monitored by the Board and is included in the STI plan to ensure that an appropriate balance is maintained between the Company’s short term and long term objectives.
AUDITED REMUNERATION REPORT
For
per
sona
l use
onl
y

21MATRIX ANNUAL REPORT 2016 |
The following table sets out the various KPI categories for the FY15 STI Plan and the weightings attributable to each of them. In the Board’s view, the KPIs that have been established align the reward of the Executives with the interests of shareholders.
KPI A BEGLEY P TAZEWELL A VINCAN S EDGAR P PEZET
Financial 40.0 42.5 30.0 40.0 35.0
Safety 10.0 5.0 15.0 10.0 10.0
Leadership 15.0 0.0 40.0 0.0 30.0
Personal Objectives 35.0 52.5 15.0 50.0 25.0
TOTAL 100.0 100.0 100.0 100.0 100.0
Despite certain STI KPIs being met, the Board has determined that no STI payments will be made in relation to FY16.
LTI REMUNERATION
Long term incentive remuneration is determined in accordance with the Matrix Rights Plan. The Matrix Rights Plan includes a Senior Executive Performance Rights Plan (SEPRP) and a Senior Executive Share Appreciation Rights Plan (SESARP) (together “the LTI Plans”). The LTI Plans apply exclusively to those Matrix Executives who are Key Management Personnel. Separate long term incentive plans have been established for other Matrix employees.
The Executives named below were invited to accept a dollar value grant of rights, which they could allocate between rights issued under the SEPRP and the SESARP respectively, with an allocation to the SEPRP not to exceed a maximum of 50 per cent of the total value of their respective LTI Plan grants. The total dollar value of the grant offered to each of these executives and their respective allocations of rights under the SEPRP and SESARP in FY16 are set out in the following table:
NAME GRANT VALUE PERFORMANCE RIGHTS SARS
Aaron Begley $170,000 nil 1,545,455
Stephen Edgar $50,000 nil 454,545
Peter Pezet $50,000 nil 454,545
Peter Tazewell $85,000 nil 772,727
Alex Vincan $55,000 nil 500,000
This LTI grant made in FY16 relates to FY15.
RIGHTS GRANTED UNDER THE SEPRPPerformance Rights (PRs) granted under the SEPRP are entitlements to receive a Share on the basis of one Share for each Performance Right that vests upon satisfaction of the relevant vesting conditions and other terms and conditions determined by the Board under the Plan.
Rights granted under the SEPRP are subject to the following vesting conditions:
• three year service and TSR performance testing period from 1 July 2015; and
• relative total shareholder return (TSR) ranking of the Company against a TSR comparator group comprising all companies in the ASX300 as follows:
AUDITED REMUNERATION REPORT
For
per
sona
l use
onl
y

22 MATRIX ANNUAL REPORT 2016|
AUDITED REMUNERATION REPORT
TSR RANKING AT END OF PERFORMANCE PERIOD % OF PERFORMANCE RIGHTS VESTED
75% and over 100%
50 – 75% 50 – 100% on sliding scale
Below 50% Nil
For example, an Eligible Participant receiving an indicative annual grant value of $20,000 will receive 74,074 Performance Rights ($20,000 ÷ $0.27). Should the vesting conditions be met, the Performance Rights will convert into 74,074 Shares in Matrix, or a cash equivalent (subject to Board discretion). If the vesting conditions are not met, the Performance Rights will lapse.
All Executives elected to receive Share Appreciation Rights in relation to their FY15 LTI grants. As a result, no Performance Rights were granted in relation to the FY15 LTI grants.
RIGHTS GRANTED UNDER THE SESARPShare Appreciation Rights (SARs) issued under the SESARP are entitlements to acquire a number of Shares equal to the growth in the value of the underlying Shares (if any) upon satisfaction of the relevant vesting conditions and other terms and conditions determined by the Board under the Plan.
SARs granted under the SESARP during FY16 are subject to the following vesting conditions:
• three year service period from 1 July 2015; and
• the same TSR target and comparator group as applies to the PRs.
Upon vesting of any SARs, participants will be issued with Shares or the cash equivalent equal to the value derived by multiplying the number of vested Rights by the relative growth in share price over the performance period. Relative share price growth is determined by a comparison of the MCE share price growth with the hurdle share price. The hurdle share price of $0.53 is calculated by reference to:
• the 28 day volume weighted average price of MCE shares following the release of the Company’s 2015 Financial Year statutory accounts on 19 August 2015, being $0.44; and
• the annual growth rate of 6.53 per cent for the ASX300 Accumulation Index over the five years prior to 1 July 2015.
For example, an Eligible Participant receiving an indicative annual grant value of $20,000 in FY16 will receive 181,818 SARs ($20,000 ÷ $0.11) which, should the vesting conditions be met in FY18, convert into a number of ordinary fully paid shares in Matrix dependent upon the range of share price outcomes set out below, or a cash equivalent (subject to Board discretion).
TARGET FUTURE SHARE PRICE $0.50 $1.00 $2.00
Grant Value $20,000 $20,000 $20,000
SAR value $0.11 $0.11 $0.11
SARs granted 181,818 181,818 181,818
Hurdle Price $0.53 $0.53 $0.53
Share Price Uplift Nil $0.47 $1.47
Benefit Nil $85,454 $267,272
Matrix share conversion Nil 85,454 133,636
If the vesting conditions are not met, all benefits under these rights will lapse.F
or p
erso
nal u
se o
nly

23MATRIX ANNUAL REPORT 2016 |
AUDITED REMUNERATION REPORT
HEDGING LTI GRANTSThe Company’s Remuneration Policy expressly prohibits participants in an equity based remuneration plan from entering into transactions which limit the economic risk of participating in the plan, through the use of derivatives or otherwise.
RELATIONSHIP BETWEEN REMUNERATION AND COMPANY PERFORMANCEOne of the directors’ remuneration objectives is to align the interests of its key management personnel with the interests of the Company and its shareholders. In FY16 this was achieved through the continuation of the STI Plan which placed a material proportion of executives’ remuneration at risk, with STI Plan KPIs linked to financial performance, safety performance and the achievement of key strategic goals and objectives.
In addition, the operation of the Matrix Rights Plan in FY16 further aligns the interests of the Company’s key management personnel with its shareholders.
As noted previously, no payments of STI will be made to Executives in relation to FY16.
REMUNERATION OF DIRECTORS AND KEY MANAGEMENT PERSONNELDetails of the elements comprising the remuneration of the Company’s key management personnel are set out in the following table. The table does not include the following components of remuneration because they were not part of the remuneration package offered to Executives during FY16:
• Short term cash profit sharing bonuses;
• Payments made to KMP in respect of a period before or after the person held the KMP position;
• Long term incentives distributed in cash;
• Post employment benefits other than superannuation; and
• Non-monetary benefits.
For
per
sona
l use
onl
y

24 MATRIX ANNUAL REPORT 2016|
AUDITED REMUNERATION REPORT REMUNERATION OF DIRECTORS & KEY MANAGEMENT PERSONNEL
Year
Short-term BenefitsPost
Employment Benefits
Long-term
Benefits
Share Based Payments Total
Proportion Performance
related
Salary & fees STI1 Total
Super- annuation
benefits
Long Service
Leave
Performance rights
and share appreciation
rights3
$ $ $ $ $ $ $ %
Executive Director
AP Begley (MD & CEO)
2016 499,784 - 499,784 19,308 (678) 37,006 555,420 6.7%
2015 496,004 45,500 541,504 18,783 31,048 3,951 595,286 8.3%
Non - Executive Directors
PJ Hood2016 111,560 - 111,560 10,598 - - 122,158 -
2015 90,000 - 90,000 8,550 - - 98,550 -
S Cole2016 66,936 - 66,936 6,359 - - 73,295 -
2015 55,000 - 55,000 5,225 - - 60,225 -
CN Duncan2016 66,936 - 66,936 6,359 - - 73,295 -
2015 55,000 - 55,000 5,225 - - 60,225 -
D Clegg2016 66,936 - 66,936 6,359 - - 73,295 -
2015 43,389 - 43,389 4,122 - - 47,511 -
P Wright2016 - - - - - - - -
2015 22,917 - 22,917 2,177 - - 25,094 -
Executive officers
PJ Tazewell (CFO/Company Secretary)
2016 350,204 - 350,204 19,308 - 19,451 388,963 5.0%
2015 349,813 31,250 381,063 18,783 - 2,923 402,769 8.5%
A Vincan (Chief Operating Officer)
2016 374,424 - 374,424 19,308 - 11,791 405,523 2.9%
2015 369,371 34,300 403,671 18,783 - 1,096 423,550 8.4%
SRH Edgar² (General Manager – Commercial)
2016 257,643 - 257,643 19,308 - 9,722 286,673 3.4%
2015 - - - - - - - -
PB Pezet² (General Manager – Engineering)
2016 244,706 - 244,706 19,308 - 10,569 274,583 3.8%
2015 - - - - - - - -
G Rooke (General Manager – MOSE)
2016 - - - - - - - -
2015 94,861 - 94,861 4,696 - - 99,557 -
Total 2016 2,039,129 - 2,039,129 126,215 (678) 88,539 2,253,205 -
Total 2015 1,576,355 111,050 1,687,405 86,344 31,048 7,970 1,812,767 -1 The STI amounts shown above in relation to FY15 were accrued in the FY15 financial results but paid in the year ending 30 June 2016.
No STI has been accrued for FY16.2 Messrs Edgar and Pezet were designated as Key Management Personnel effective 1 July 2015.3 Share based payments are accounted for progressively over the three year vesting period.
For
per
sona
l use
onl
y

25MATRIX ANNUAL REPORT 2016 |
AUDITED REMUNERATION REPORT KEY TERMS OF EMPLOYMENT CONTRACTS
EXECUTIVE SERVICE AGREEMENTSThe Company entered into new executive service agreements with each of its Key Management Personnel during the financial year. The key terms of the executive service agreements are as follows.
NAME ORIGINAL START DATE TERM NOTICE PERIOD
AP Begley Managing Director & CEO 04/10/1999 Indefinite 6 months (Company) /
3 months (individual)
SRH Edgar General Manager - Commercial 28/04/2014 Indefinite 6 months (Company) /
3 months (individual)
PB Pezet General Manager - Engineering 14/07/2008 Indefinite 6 months (Company) /
3 months (individual)
PJ Tazewell CFO & Company Secretary 19/12/2011 Indefinite 6 months (Company) /
3 months (individual)
A Vincan Chief Operating Officer 14/09/2009 Indefinite 6 months (Company) /
3 months (individual)
Each of the above executives are entitled to participate in the Company’s STI and LTI programmes.
LOANS TO KEY MANAGEMENT PERSONNELThere are no loans from the Company to a Key management person.
For
per
sona
l use
onl
y

26 MATRIX ANNUAL REPORT 2016|
AUDITED REMUNERATION REPORT
KEY MANAGEMENT PERSONNEL EQUITY HOLDINGSThe movement during the reporting period in the number of shares in Matrix Composites & Engineering Ltd held directly, indirectly or beneficially, by each key management person, including related parties, is as follows:
2016Balance at
1 July 2015 No.
Granted as Remuneration
No.
On Exercise of Options
No.
Net Other Change
No.
Balance at 30 June 2016
No.
Directors
PJ Hood 500,000 - - 130,000 630,000
AP Begley 3,625,877 - - 17,200 3,643,077
DP Clegg2 - - - 39,918 39,918
S Cole 20,000 - - - 20,000
CN Duncan 590,429 - - - 590,429
Executives
SRH Edgar1 - - -
PB Pezet¹ - - -
PJ Tazewell 15,000 - - - 15,000
A Vincan 386,038 - - - 386,038
2015Balance at
1 July 2014 No.
Granted as Remuneration
No.
On Exercise of Options
No.
Net Other Change
No.
Balance at 30 June 2015
No.
Directors
PJ Hood 260,000 - - 240,000 500,000
AP Begley 3,545,877 - - 80,000 3,625,877
DP Clegg² - - - - -
S Cole - - - 20,000 20,000
CN Duncan 590,429 - - - 590,429
PR Wright 1,435,635 - - n/a* n/a*
Executives
G Rooke - - - n/a* n/a*
PJ Tazewell - - - 15,000 15,000
A Vincan - - - 386,038 386,038
1 Messrs Edgar and Pezet were designated as Key Management Personnel effective 1 July 2015.2 Dr D Clegg was appointed as a director on 17 September 2014.
* These individuals ceased to be key management personnel during the relevant reporting period and the presentation in this table may not indicate the status of their shareholding at the end of the relevant reporting period.
For
per
sona
l use
onl
y

27MATRIX ANNUAL REPORT 2016 | 27MATRIX ANNUAL REPORT 2016 |
AU
DIT
ED R
EMU
NER
ATIO
N R
EPO
RT
KEY
MA
NAG
EMEN
T PE
RSO
NN
EL S
HA
RE-
BA
SED
PAY
MEN
T H
OLD
ING
S –
PER
FOR
MA
NCE
RIG
HTS
(PR
)
2016
Bal
ance
at
1 Ju
ly 2
015
No.
Gran
ted
as
Rem
uner
atio
n N
o.Ex
erci
sed
No.
Net
Oth
er
Chan
ge
No.
Bal
ance
at
30 J
une
2016
N
o.
Bal
ance
Ves
ted
at
30 J
une
2016
N
o.
Vest
ed b
ut n
ot
exer
cisa
ble
No.
Vest
ed a
nd
exer
cisa
ble
No.
PRs
Vest
ed
duri
ng y
ear
No.
Dir
ecto
rs
PJ H
ood
--
--
--
--
-
AP B
egle
y-
--
--
--
--
DP
Cle
gg-
--
--
--
--
S C
ole
--
--
--
--
-
CN
Dun
can
--
--
--
--
-
PR W
righ
t-
--
--
--
--
Exec
utiv
es
SRH
Edg
ar1
--
--
--
--
-
PB P
ezet
¹-
16,1
29-
-16
,129
--
--
PJ T
azew
ell
64,5
16-
--
64,5
16-
--
-
A Vi
ncan
24,1
93-
--
24,1
93-
--
-
2015
Bal
ance
at
1 Ju
ly 2
014
No.
Gran
ted
as
Rem
uner
atio
n N
o.Ex
erci
sed
No.
Net
Oth
er
Chan
ge
No.
Bal
ance
at
30 J
une
2015
N
o.
Bal
ance
Ves
ted
at
30 J
une
2015
N
o.
Vest
ed b
ut n
ot
exer
cisa
ble
No.
Vest
ed a
nd
exer
cisa
ble
No.
PRs
Vest
ed
duri
ng y
ear
No.
Dir
ecto
rs
PJ H
ood
--
--
--
--
-
AP B
egle
y-
--
--
--
--
DP
Cle
gg-
--
--
--
--
S C
ole
--
--
--
--
-
CN
Dun
can
--
--
--
--
-
PR W
righ
t-
--
--
--
--
Exec
utiv
es
G R
ooke
--
--
--
--
-
PJ T
azew
ell
-64
,516
--
64,5
16-
--
-
A Vi
ncan
-24
,193
--
24,1
93-
--
-
1 M
essr
s Ed
gar
and
Peze
t wer
e de
sign
ated
as
key
man
agem
ent p
erso
nnel
effe
ctiv
e fr
om 1
Jul
y 20
15.
For
per
sona
l use
onl
y

28 MATRIX ANNUAL REPORT 2016|
AU
DIT
ED R
EMU
NER
ATIO
N R
EPO
RT
KEY
MAN
AGEM
ENT
PER
SON
NEL
SH
ARE-
BAS
ED P
AYM
ENT
HOL
DIN
GS –
SH
ARE
APPR
ECIA
TION
RIG
HTS
(SAR
)
2016
Bal
ance
at
1 Ju
ly 2
015
No.
Gran
ted
as
Rem
uner
atio
n N
o.Ex
erci
sed
No.
Net
Oth
er
Chan
ge
No.
Bal
ance
at
30 J
une
2016
N
o.
Bal
ance
Ves
ted
at 3
0 Ju
ne 2
016
No.
Vest
ed b
ut n
ot
exer
cisa
ble
No.
Vest
ed a
nd
exer
cisa
ble
No.
SAR
s Ve
sted
du
ring
yea
r N
o.
Dir
ecto
rs
PJ H
ood
--
--
--
--
-
AP B
egle
y59
2,59
31,
545,
455
--
2,13
8,04
8-
--
-
DP
Cle
gg-
--
--
--
--
S C
ole
--
--
--
--
-
CN
Dun
can
--
--
--
--
-
Exec
utiv
es
SRH
Edg
ar¹
-45
4,54
5-
-45
4,54
5-
--
-
PB P
ezet
¹-
454,
545
--
454,
545
--
--
PJ T
azew
ell
148,
148
772,
727
--
920,
875
--
--
A Vi
ncan
55,5
5550
0,00
0-
-55
5,55
5-
--
-
2015
Bal
ance
at
1 Ju
ly 2
014
No.
Gran
ted
as
Rem
uner
atio
n N
o.Ex
erci
sed
No.
Net
Oth
er
Chan
ge
No.
Bal
ance
at
30 J
une
2015
N
o.
Bal
ance
Ves
ted
at 3
0 Ju
ne 2
015
No.
Vest
ed b
ut n
ot
exer
cisa
ble
No.
Vest
ed a
nd
exer
cisa
ble
No.
SAR
s Ve
sted
du
ring
yea
r N
o.
Dir
ecto
rs
PJ H
ood
--
--
--
--
-
AP B
egle
y-
592,
593
--
592,
593
--
--
S C
ole
--
--
--
--
-
DP
Cle
gg-
--
--
--
--
CN
Dun
can
--
--
--
--
-
PR W
righ
t-
--
--
--
--
Exec
utiv
es
G R
ooke
--
--
--
--
-
PJ T
azew
ell
-14
8,14
8-
-14
8,14
8-
--
-
A Vi
ncan
-55
,555
--
55,5
55-
--
-
1 M
essr
s Ed
gar
and
Peze
t wer
e de
sign
ated
as
Key
Man
agem
ent P
erso
nnel
effe
ctiv
e 1
July
201
5.
For
per
sona
l use
onl
y

29MATRIX ANNUAL REPORT 2016 |
AUDITED REMUNERATION REPORT This Directors’ report is signed in accordance with a resolution of directors made pursuant to s.298(2) of the Corporations Act 2001.
On behalf of the Directors
Aaron P Begley
Managing Director and Chief Executive Officer
Perth, 24 August 2016
For
per
sona
l use
onl
y

30 MATRIX ANNUAL REPORT 2016|
AUDITOR'S INDEPENDENCE DECLARATION
Liability limited by a scheme approved under Professional Standards Legislation.
Member of Deloitte Touche Tohmatsu Limited
Dear Board Members
Matrix Composites & Engineering Ltd
In accordance with section 307C of the Corporations Act 2001, I am pleased to provide the following declaration of independence to the directors of Matrix Composites & Engineering Ltd. As lead audit partner for the audit of the financial statements of Matrix Composites & Engineering Ltd for the financial year ended 30 June 2016, I declare that to the best of my knowledge and belief, there have been no contraventions of: (i) the auditor independence requirements of the Corporations Act 2001 in relation to the audit;
and
(ii) any applicable code of professional conduct in relation to the audit. Yours sincerely DELOITTE TOUCHE TOHMATSU John Sibenaler Partner Chartered Accountants
Deloitte Touche Tohmatsu ABN 74 490 121 060 Tower 2 Brookfield Place 123 St Georges Terrace Perth WA 6000 GPO Box A46 Perth WA 6837 Australia Tel: +61 8 9365 7000 Fax: +61 8 9365 7001 www.deloitte.com.au
The Board of Directors Matrix Composites & Engineering Ltd 150 Quill Way, Henderson WA 6166 24 August 2016
For
per
sona
l use
onl
y

31MATRIX ANNUAL REPORT 2016 |
CONSOLIDATED STATEMENT OF PROFIT OR LOSSFOR THE YEAR ENDED 30 JUNE 2016
Note 2016 2015
$ $
Continuing operations
Revenue 95,728,426 144,074,596
Cost of sales (86,511,912) (123,013,503)
Gross profit 9,216,514 21,061,093
Other income 3 311,284 613,778
Other losses 3 (1,767,657) (1,673,465)
Administration expenses (6,291,448) (7,511,532)
Finance costs (459,826) (1,022,615)
Marketing expenses (4,164,016) (4,829,210)
Research expenses (1,445,162) (657,277)
(Loss)/profit before income tax 4 (4,600,311) 5,980,772
Income tax benefit/(expense) 6 2,486,283 (2,346,944)
(Loss)/profit for the year from continuing operations (2,114,028) 3,633,828
(Loss)/profit attributable to:
Owners of the Company (2,114,028) 3,633,828
Non-controlling interest - -
(2,114,028) 3,633,828
(Loss)/profit per share
Basic (loss)/profit per share (cents) 29 (2.2) 3.8
Diluted (loss)/profit per share (cents) 29 (2.2) 3.8
The above consolidated statement of profit or loss should be read in conjunction with the accompanying notes.
For
per
sona
l use
onl
y

32 MATRIX ANNUAL REPORT 2016|
CONSOLIDATED STATEMENT OF PROFIT OR LOSS AND OTHER COMPREHENSIVE INCOMEFOR THE YEAR ENDED 30 JUNE 2016
2016 2015
$ $
(Loss)/profit for the year (2,114,028) 3,633,828
Other comprehensive (expense)/income
Items that may be reclassified subsequent to profit or loss:
Net foreign currency translation differences 40,758 (602,748)
40,758 (602,748)
Change in fair value of cash flow hedges (520,442) (18,487)
Net income tax benefit 134,168 29,371
(386,274) 10,884
Property revaluation reserve transferred to profit or loss (787,664) -
(787,664) -
Total comprehensive (expense)/income for the year (3,247,208) 3,041,964
Total comprehensive (expense)/income attributable to:
Owners of the parent entity (3,247,208) 3,041,964
Non-controlling interest - -
Total comprehensive (expense)/income for the year (3,247,208) 3,041,964
The above consolidated statement of profit or loss and other comprehensive income should be read in conjunction with the accompanying notes.
For
per
sona
l use
onl
y

33MATRIX ANNUAL REPORT 2016 |
CONSOLIDATED STATEMENT OF FINANCIAL POSITION
AS AT 30 JUNE 2016
Note 2016 2015
$ $
CURRENT ASSETS
Cash and cash equivalents 7 8,403,463 14,468,450
Trade and other receivables 8 25,487,486 34,482,261
Inventories 9 10,632,083 20,726,023
Other current assets 10 746,754 943,787
Financial assets 12 - 501,615
TOTAL CURRENT ASSETS 45,269,786 71,122,136
NON CURRENT ASSETS
Trade and other receivables 8 1,444,576 -
Property, plant and equipment 11 81,742,949 91,321,352
Intangible assets 13 9,004,065 8,699,057
Deferred tax assets 6 9,179,510 9,071,097
TOTAL NON CURRENT ASSETS 101,371,100 109,091,506
TOTAL ASSETS 146,640,886 180,213,642
CURRENT LIABILITIES
Trade and other payables 14 4,414,667 11,618,252
Progress claims and deposits 15 1,879,063 14,297,482
Financial liabilities 16 3,429,048 6,164,911
Provisions 17 780,272 1,098,092
TOTAL CURRENT LIABILITIES 10,503,050 33,178,737
NON CURRENT LIABILITIES
Financial liabilities 16 - 4,000,000
Deferred tax liabilities 6 2,304,788 4,847,458
Provisions 17 396,032 373,820
TOTAL NON CURRENT LIABILITIES 2,700,820 9,221,278
TOTAL LIABILITIES 13,203,870 42,400,015
NET ASSETS 133,437,016 137,813,627
EQUITY
Issued capital 18 111,283,768 111,555,600
Reserves 19 (645,725) 678,468
Retained earnings 20 22,809,176 25,589,762
Equity attributable to owners of the Company 133,447,219 137,823,830
Non-controlling interest (10,203) (10,203)
TOTAL EQUITY 133,437,016 137,813,627
The above consolidated statement of financial position should be read in conjunction with the accompanying notes.
For
per
sona
l use
onl
y

34 MATRIX ANNUAL REPORT 2016|
CONSOLIDATED STATEMENT OF CASH FLOWS
FOR THE YEAR ENDED 30 JUNE 2016
Note 2016 2015
$ $
CASH FLOWS FROM OPERATING ACTIVITIES
Receipts from customers 95,483,922 148,913,385
Payments to suppliers and employees (92,294,403) (145,869,550)
Interest received 21,759 296,334
Finance costs paid (459,826) (1,022,615)
Net receipt from tax 2,671 1,189,657
Net cash from operating activities 21(b) 2,754,123 3,507,211
CASH FLOWS USED IN INVESTING ACTIVITIES
Proceeds from sale of property, plant and equipment 4,111,827 236,520
Payments for property, plant and equipment (5,608,550) (4,655,142)
Payments for capitalised development costs (1,329,241) (392,808)
Net cash used in investing activities (2,825,964) (4,811,430)
CASH FLOWS USED IN FINANCING ACTIVITIES
Buy-back of ordinary shares (234,045) (200,659)
Share buy-back costs (37,787) (28,604)
Payment of dividends (939,558) (1,891,109)
Proceeds from borrowings 2,930,811 -
Repayment of borrowings (8,000,000) (4,947,262)
Net cash used in financing activities (6,280,579) (7,067,634)
Net decrease in cash and cash equivalents (6,352,420) (8,371,853)
Cash and cash equivalents at 1 July 14,468,450 19,546,289
Effects of exchange rate changes on the balance of cash held in foreign currencies 287,433 3,294,014
Cash and cash equivalents at 30 June 21(a) 8,403,463 14,468,450
The above consolidated statement of cash flows should be read in conjunction with the accompanying notes.
For
per
sona
l use
onl
y
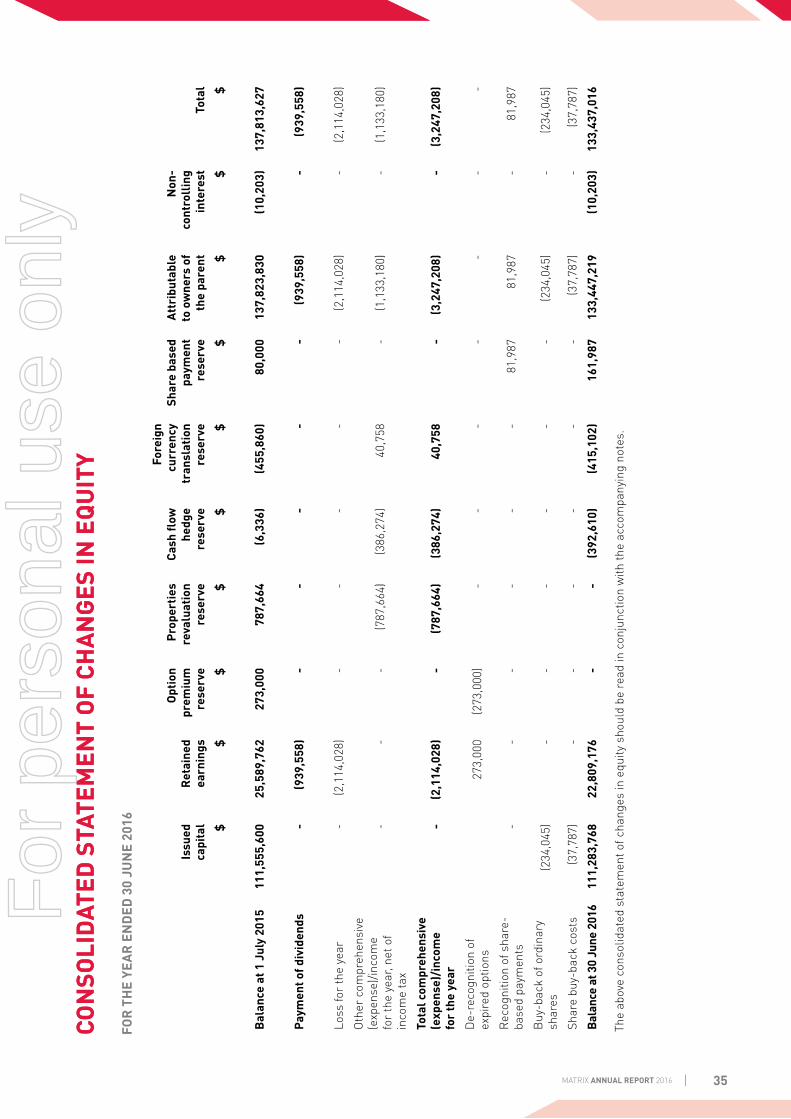
35MATRIX ANNUAL REPORT 2016 |
CON
SOLI
DAT
ED S
TATE
MEN
T O
F CH
AN
GES
IN E
QU
ITY
CON
SOLI
DAT
ED S
TATE
MEN
T O
F CH
AN
GES
IN E
QU
ITY
FOR
TH
E YE
AR
EN
DED
30
JUN
E 20
16
Issu
ed
capi
tal
Ret
aine
d ea
rnin
gs
Opt
ion
prem
ium
re
serv
e
Prop
ertie
s re
valu
atio
n re
serv
e
Cash
flow
he
dge
rese
rve
Fore
ign
curr
ency
tr
ansl
atio
n re
serv
e
Shar
e ba
sed
paym
ent
rese
rve
Attr
ibut
able
to
ow
ners
of
the
pare
nt
Non
- co
ntro
llin
g in
tere
stTo
tal
$$
$$
$$
$$
$$
Bal
ance
at 1
Jul
y 20
1511
1,55
5,60
025
,589
,762
273,
000
787,
664
(6,3
36)
(455
,860
)80
,000
137,
823,
830
(10,
203)
137,
813,
627
Paym
ent o
f div
iden
ds-
(939
,558
)-
--
--
(939
,558
)-
(939
,558
)
Loss
for
the
year
-(2
,114
,028
)-
--
--
(2,1
14,0
28)
-(2
,114
,028
)
Oth
er c
ompr
ehen
sive
(e
xpen
se)/i
ncom
e
for
the
year
, net
of
inco
me
tax
--
-(7
87,6
64)
(386
,274
)40
,758
-(1
,133
,180
)-
(1,1
33,1
80)
Tota
l com
preh
ensi
ve
(exp
ense
)/in
com
e
for
the
year
-(2
,114
,028
)-
(787
,664
)(3
86,2
74)
40,7
58-
(3,2
47,2
08)
-(3
,247
,208
)
De-
reco
gniti
on o
f ex
pire
d op
tions
273,
000
(273
,000
)-
--
--
--
Rec
ogni
tion
of s
hare
- ba
sed
paym
ents
-
--
--
-81
,987
81,9
87-
81,9
87
Buy
-bac
k of
ord
inar
y sh
ares
(234
,045
)-
--
--
-(2
34,0
45)
-(2
34,0
45)
Shar
e bu
y-ba
ck c
osts
(37,
787)
--
--
--
(37,
787)
-(3
7,78
7)
Bala
nce
at 3
0 Ju
ne 2
016
111,
283,
768
22,8
09,1
76-
-(3
92,6
10)
(415
,102
)16
1,98
713
3,44
7,21
9(1
0,20
3)13
3,43
7,01
6
The
abo
ve c
onso
lidat
ed s
tate
men
t of c
hang
es in
equ
ity s
houl
d be
read
in c
onju
nctio
n w
ith th
e ac
com
pany
ing
note
s.
For
per
sona
l use
onl
y

36 MATRIX ANNUAL REPORT 2016|
CON
SOLI
DAT
ED S
TATE
MEN
T O
F CH
AN
GES
IN E
QU
ITY
CON
SOLI
DAT
ED S
TATE
MEN
T O
F CH
AN
GES
IN E
QU
ITY
FOR
TH
E YE
AR
EN
DED
30
JUN
E 20
16
Issu
ed
capi
tal
Ret
aine
d ea
rnin
gs
Opt
ion
prem
ium
re
serv
e
Prop
ertie
s re
valu
atio
n re
serv
e
Cash
flow
he
dge
rese
rve
Fore
ign
curr
ency
tr
ansl
atio
n re
serv
e
Shar
e ba
sed
paym
ent
rese
rve
Attr
ibut
able
to
ow
ners
of
the
pare
nt
Non
- co
ntro
llin
g in
tere
stTo
tal
$$
$$
$$
$$
$$
Bal
ance
at 1
Jul
y 20
1411
1,78
4,86
323
,847
,043
273,
000
787,
664
(17,
220)
146,
888
-13
6,82
2,23
8(1
0,20
3)13
6,81
2,03
5
Paym
ent o
f div
iden
ds-
(1,8
91,1
09)
--
--
-(1
,891
,109
)-
(1,8
91,1
09)
Profi
t for
the
year
-3,
633,
828
--
--
-3,
633,
828
-3,
633,
828
Oth
er c
ompr
ehen
sive
in
com
e fo
r th
e ye
ar,
net o
f inc
ome
tax
--
--
10,8
84(6
02,7
48)
-(5
91,8
64)
-(5
91,8
64)
Tota
l com
preh
ensi
ve
inco
me
for
the
year
-3,
633,
828
--
10,8
84(6
02,7
48)
-3,
041,
964
-3,
041,
964
Rec
ogni
tion
of s
hare
- ba
sed
paym
ents
-
--
--
-80
,000
80,0
00-
80,0
00
Buy
-bac
k of
ord
inar
y sh
ares
(200
,659
)-
--
--
-(2
00,6
59)
-(2
00,6
59)
Shar
e bu
y-ba
ck c
osts
(28,
604)
--
--
--
(28,
604)
-(2
8,60
4)
Bala
nce
at 3
0 Ju
ne 2
015
111,
555,
600
25,5
89,7
6227
3,00
078
7,66
4(6
,336
)(4
55,8
60)
80,0
0013
7,82
3,83
0(1
0,20
3)13
7,81
3,62
7
The
abo
ve c
onso
lidat
ed s
tate
men
t of c
hang
es in
equ
ity s
houl
d be
read
in c
onju
nctio
n w
ith th
e ac
com
pany
ing
note
s.
For
per
sona
l use
onl
y

37MATRIX ANNUAL REPORT 2016 |
NOTES TO AND FORMING PART OF THE FINANCIAL STATEMENTSNOTE 1: STATEMENT OF SIGNIFICANT ACCOUNTING POLICIES
GENERAL INFORMATIONMatrix Composites & Engineering Ltd (the Company) is a limited liability company incorporated in Australia. The addresses of its registered office, principal places of business and principal activities are disclosed in the introduction to the annual report.
STATEMENT OF COMPLIANCEThese financial statements are general purpose financial statements which have been prepared in accordance with the Corporations Act 2001, Accounting Standards and Interpretations, and comply with other requirements of the law.
The financial statements comprise the consolidated financial statements of the Group. For the purpose of preparing the consolidated financial statements, the Company is a for profit entity.
Accounting Standards include Australian Accounting Standards. Compliance with Australian Accounting Standards ensures that the financial statements and notes of the Company and the Group comply with International Financial Reporting Standards (‘IFRS’).
The financial statements were authorised for issue by the directors on 24 August 2016.
BASIS OF PREPARATIONThe consolidated financial statements have been prepared on the basis of historical cost, except for certain non-current assets and financial instruments that are measured at revalued amounts or fair values, as explained in the accounting policies below. Historical cost is generally based on the fair values of the consideration given in exchange for assets. All amounts are presented in Australian dollars, unless otherwise noted.
APPLICATION OF NEW AND REVISED ACCOUNTING STANDARDS
STANDARDS AND INTERPRETATIONS AFFECTING AMOUNTS REPORTED IN THE CURRENT PERIOD (AND/OR PRIOR PERIODS)
The Group has adopted all of the new and revised Standards and Interpretations issued by the Australian Accounting Standards Board (the AASB) that are relevant to their operations and are mandatorily effective for the current reporting period.
The adoption of these amendments has not resulted in any changes to the Group’s accounting policies and has no significant effect on the disclosures or the amounts reported for the current or prior periods.
For
per
sona
l use
onl
y

38 MATRIX ANNUAL REPORT 2016|
NOTES TO AND FORMING PART OF THE FINANCIAL STATEMENTS STANDARDS AND INTERPRETATIONS IN ISSUE NOT YET ADOPTEDAt the date of authorisation of the financial statements, the Standards and Interpretations listed below were in issue but not yet effective. The potential effect of the revised Standards and Interpretations on the Group’s financial statements has not yet been determined.
STANDARD/INTERPRETATION
EFFECTIVE FOR ANNUAL REPORTING PERIODS BEGINNING
ON OR AFTER
EXPECTED TO BE INITIALLY APPLIED IN THE FINANCIAL
YEAR ENDING
AASB 9 ‘Financial Instruments’, and the relevant amending standards 1 January 2018 30 June 2019
AASB 15 ‘Revenue from Contracts with Customers’, AASB 2014-5 ‘Amendments to Australian Accounting Standards arising from AASB 15’, AASB 2015-8 ‘Amendments to Australian Accounting Standards – Effective Date of AASB 15’, and AASB 2016-3 ‘Amendments to Australian Accounting Standards – Clarifications to AASB 15’
1 January 2018 30 June 2019
AASB 1057 ‘Application of Australian Accounting Standards’ and AASB 2015-9 ‘Amendments to Australian Accounting Standards – Scope and Application Paragraphs’
1 January 2016 30 June 2017
AASB 2014-4 ‘Amendments to Australian Accounting Standards – Clarification of Acceptable Methods of Depreciation and Amortisation’
1 January 2016 30 June 2017
AASB 2015-1 ‘Amendments to Australian Accounting Standards – Annual Improvements to Australian Accounting Standards 2012-2014 Cycle’
1 January 2016 30 June 2017
AASB 2015-2 ‘Amendments to Australian Accounting Standards – Disclosure Initiative: Amendments to AASB 101’ 1 January 2016 30 June 2017
AASB 2016-2 ‘Amendments to Australian Accounting Standards – Disclosure Initiative: Amendments to AASB 107’ 1 January 2017 30 June 2018
For
per
sona
l use
onl
y

39MATRIX ANNUAL REPORT 2016 |
NOTES TO AND FORMING PART OF THE FINANCIAL STATEMENTS The following significant accounting policies have been adopted in the preparation and presentation of the financial report:
(A) BASIS OF CONSOLIDATION
The consolidated financial statements incorporate the financial statements of the Company and entities (including structured entities) controlled by the Company and its subsidiaries. Control is achieved when the Company:
• has power over the investee;
• is exposed, or has rights, to variable returns from its involvement with the investee; and
• has the ability to use its power to affect its returns.
The Company reassesses whether or not it controls an investee if facts and circumstances indicate that there are changes to one or more of the three elements of control listed above.
When the Company has less than a majority of the voting rights of an investee, it has power over the investee when the voting rights are sufficient to give it the practical ability to direct the relevant activities of the investee unilaterally. The Company considers all relevant facts and circumstances in assessing whether or not the Company's voting rights in an investee are sufficient to give it power, including:
• the size of the Company's holding of voting rights relative to the size and dispersion of holdings of the other vote holders;
• potential voting rights held by the Company, other vote holders or other parties;
• rights arising from other contractual arrangements; and
• any additional facts and circumstances that indicate that the Company has, or does not have, the current ability to direct the relevant activities at the time that decisions need to be made, including voting patterns at previous shareholders' meetings.
Consolidation of a subsidiary begins when the Company obtains control over the subsidiary and ceases when
the Company loses control of the subsidiary. Specifically, income and expenses of a subsidiary acquired or disposed of during the year are included in the consolidated statement of profit or loss and other comprehensive income from the date the Company gains control until the date when the Company ceases to control the subsidiary.
Profit or loss and each component of other comprehensive income are attributed to the owners of the Company and to the non-controlling interests. Total comprehensive income of subsidiaries is attributed to the owners of the Company and to the non-controlling interests even if this results in the non-controlling interests having a deficit balance.
When necessary, adjustments are made to the financial statements of subsidiaries to bring their accounting policies into line with the Group's accounting policies.
All intragroup assets and liabilities, equity, income, expenses and cash flows relating to transactions between members of the Group are eliminated in full on consolidation.
(B) OPERATING SEGMENTS
An operating segment is a component of the Group that engages in business activities from which it may earn revenues and incur expenses (including those relating to transactions with other components of the same entity), whose operating results are regularly reviewed by the chief operating decision makers (being the Board of Directors) for which discrete financial information is available.
(C) INCOME TAXThe charge for current income tax expense is based on the profit for the year end adjusted for any non-assessable or disallowed items. It is calculated using the tax rates that have been enacted or are
substantively enacted by the end of the reporting period.
Deferred tax is recognised in respect of temporary differences arising between the tax bases of assets and liabilities and their carrying amounts in the financial statements. No deferred tax is recognised from the initial recognition of an asset or liability, excluding a business combination, where there is no effect on accounting or taxable profit or loss.
Deferred tax is calculated at the tax rates that are expected to apply to the period when the asset is realised or liability is settled. Current and deferred tax is recognised in the profit or loss except where it relates to items that may be recognised directly in equity or in other comprehensive income.
Deferred tax assets and liabilities are offset if there is a legally enforceable right to do so, and where they relate to income taxes levied by the same tax authority on the same or different tax entities that intend to settle current tax liabilities and assets on a net basis.
Deferred tax assets are recognised to the extent that it is probable that future taxable profits will be available against which deductible temporary differences can be utilised.
The amount of benefits brought to account or which may be realised in the future is based on the assumption that no adverse change will occur in income taxation legislation and the anticipation that the economic entity will derive sufficient future assessable income to enable the benefit to be realised and comply with the conditions of deductibility imposed by the law.
TAX CONSOLIDATIONThe company and its wholly-owned Australian resident entities have formed a tax-consolidated group with effect from 1 July 2010 and are therefore taxed as a single entity from that date. The head entity within the
For
per
sona
l use
onl
y

40 MATRIX ANNUAL REPORT 2016|
NOTES TO AND FORMING PART OF THE FINANCIAL STATEMENTS tax-consolidated group is Matrix Composites & Engineering Ltd. Tax expense/income, deferred tax liabilities and deferred tax assets arising from temporary differences of the members of the tax-consolidated group are recognised in the separate financial statements of the members of the tax-consolidated group using the ‘separate taxpayer within group’ approach by reference to the carrying amounts in the separate financial statements of each entity and the tax values applying under tax consolidation. Current tax liabilities and assets and deferred tax assets arising from unused tax losses and relevant tax credits of the members of the tax-consolidated group are recognised by the company (as head entity in the tax-consolidated group).
Due to the existence of a tax funding arrangement between the entities in the tax-consolidated group, amounts are recognised as payable to or receivable by the company and each member of the group in relation to the tax contribution amounts paid or payable between the parent entity and the other members of the tax-consolidated group in accordance with the arrangement.
Entities within the tax-consolidated group have entered into a tax funding arrangement and a tax sharing agreement with the head entity. Under the terms of the tax funding arrangement, Matrix Composites & Engineering Ltd and each of the entities in the tax-consolidated group has agreed to pay a tax equivalent payment to or from the head entity, based on the current tax liability or current tax asset of the entity.
(D) INVENTORIESInventories include raw materials, work in progress and finished goods, and are measured at the lower of cost and net realisable value. The cost of manufactured products includes direct materials, direct labour and an appropriate share of manufacturing overheads. Costs are assigned on the basis of weighted average costs.
(E) PROPERTY, PLANT AND EQUIPMENT
Each class of property, plant and equipment is carried at cost or fair value less, where applicable, any accumulated depreciation and impairment losses.
PROPERTYProperties in the course of construction for production, supply or administration purposes, or for purposes not yet determined, are carried at cost, less any recognised impairment loss. Cost includes professional fees and, for qualifying assets, borrowing costs capitalised in accordance with the Group’s accounting policy. Depreciation of these assets, on the same basis as other property assets, commences when the assets are ready for their intended use.
Freehold land is not depreciated.
PLANT AND EQUIPMENTAny accumulated depreciation at the date of revaluation is eliminated against the gross carrying amount of the asset and the net amount is restated to the revalued amount of the asset.
Plant and equipment is measured at cost basis less accumulated depreciation and impairment losses.
The carrying amount of plant and equipment is reviewed annually by directors to ensure it is not in excess of the recoverable amount from these assets. The recoverable amount is assessed on the basis of the expected net cash flows that will be received from the assets employment and subsequent disposal. The expected net cash flows have been discounted to their present values in determining recoverable amounts.
The cost of self-constructed assets includes the cost of materials, direct labour, borrowing costs (where such assets are qualifying assets) and an appropriate proportion of fixed and variable overheads.
Subsequent costs are included in the asset's carrying amount or recognised as a separate asset, as appropriate,
only when it is probable that future economic benefits associated with the item will flow to the entity and the cost of the item can be measured reliably. All other repairs and maintenance are charged to the profit or loss during the financial period in which they are incurred.
DEPRECIATIONThe depreciable amount of all non-current assets including building and capitalised lease assets, but excluding freehold land, is depreciated on a straight line basis over their useful lives to the entity commencing from the time the asset is held ready for use. Leasehold improvements are depreciated over the shorter of either the unexpired period of the lease or the estimated useful lives of the improvements.
The depreciation rates used for each class of depreciable assets are:
CLASS OF FIXED ASSET
DEPRECIATION RATE (%)
Buildings 2.5
Plant and equipment 7.5 – 30.0
Motor vehicles 22.5
Office equipment 11.25 – 25.0
Computer equipment 37.50 – 50.0
The assets' residual values and useful lives are reviewed, and adjusted if appropriate, at each balance sheet date.
Development costs have a finite life and are amortised on a systematic basis matched to the future economic benefits over the useful life of the project.
Software is stated at cost less accumulated amortisation and impairment losses. Amortisation is charged to the income statement on a straight line basis over the estimated useful life of three to five years.
An asset's carrying amount is written down immediately to its recoverable amount if the asset's carrying amount is greater than its estimated recoverable amount.
For
per
sona
l use
onl
y
41MATRIX ANNUAL REPORT 2016 |
NOTES TO AND FORMING PART OF THE FINANCIAL STATEMENTS Gains and losses on disposals are determined by comparing proceeds with the carrying amount. These gains or losses are included in the income statement. When revalued assets are sold, amounts included in the revaluation reserve relating to that asset are transferred to retained earnings.
(F) GOODWILLGoodwill arising on an acquisition of a business is carried at cost as established at the date of the acquisition of the business less accumulated impairment losses, if any. For the purposes of impairment testing, goodwill is allocated to the Group's cash-generating unit that is expected to benefit from the synergies of the combination.
A cash-generating unit to which goodwill has been allocated is tested for impairment annually, or more frequently when there is indication that the unit may be impaired. If the recoverable amount of the cash-generating unit is less than its carrying amount, the impairment loss is allocated first to reduce the carrying amount of any goodwill allocated to the unit and then to the other assets of the unit pro rata based on the carrying amount of each asset in the unit. Any impairment loss for goodwill is recognised directly in profit or loss in the consolidated statement of comprehensive income. Impairment testing is performed annually for goodwill and intangible assets with indefinite lives. An impairment loss recognised for goodwill is not reversed in subsequent periods.
On disposal of the relevant cash-generating unit, the attributable amount of goodwill is included in the determination of the profit or loss on disposal.
(G) LEASESLeases are classified as operating leases where substantially all the risks and benefits incidental to the ownership of the asset, but not the legal ownership, are transferred to the Group. All other leases are classified as operating leases.
Operating lease payments are expenses over the lease term or where another systematic basis is more representative of the time pattern in which the economic benefits from the asset are consumed. Lease incentives under operating leases are recognised as a liability and amortised on a straight-line basis over the life of the lease term.
(H) FINANCIAL INSTRUMENTS
Financial assets and financial liabilities are recognised when a Group entity becomes a party to the contractual provisions of the instrument. Financial assets and financial liabilities are initially measured at fair value. Transaction costs that are directly attributable to the acquisition or issue of financial assets and financial liabilities (other than financial assets and financial liabilities at fair value through profit or loss) are added to or deducted from the fair value of the financial assets or financial liabilities, as appropriate, on initial recognition. Transaction costs directly attributable to the acquisition of financial assets or financial liabilities at fair value through profit or loss are recognised immediately in profit or loss.
FINANCIAL ASSETSFinancial assets are classified into the following specified categories: financial assets ‘at fair value through profit or loss’ (FVTPL), ‘held-to-maturity’ investments, ‘available-for-sale’ (AFS) financial assets and ‘loans and receivables’. The classification depends on the nature and purpose of the financial assets and is determined at the time of initial recognition. All regular way purchases or sales of financial assets are recognised and derecognised on a trade date basis. Regular way purchases or sales are purchases or sales of financial assets that require delivery of assets within the time frame established by regulation or convention in the marketplace.
FINANCIAL ASSETS AT FAIR VALUE THROUGH PROFIT AND LOSSA financial asset is classified in this category if acquired principally for the purpose of selling in the short term or if so designated by management. Realised and unrealised gains and losses arising from changes in the fair value of these assets are included in profit or loss in the period in which they arise.
LOANS AND RECEIVABLESLoans and receivables are non-derivative financial assets with fixed or determinable payments that are not quoted in an active market, such assets are initially recognised at fair value plus any directly attributable transaction costs. Subsequent to initial recognition, these assets are measured at amortised cost using the effective interest rate method, less any impairment losses.
FINANCIAL LIABILITIES AND EQUITY INSTRUMENTS
CLASSIFICATION AS DEBT OR EQUITY
Debt and equity instruments are classified as either financial liabilities or as equity in accordance with the substance of the contractual arrangement.
FINANCIAL LIABILITIESNon-derivative financial liabilities are recognised initially at fair value plus any directly attributable transaction costs. Subsequent to initial recognition, they are measured at amortised cost, using the effective interest rate method.
DERIVATIVE FINANCIAL INSTRUMENTS AND HEDGINGThe Group uses derivative financial instruments (including forward exchange contracts, currency options, call/put options and interest rate swaps) to hedge its risks associated
For
per
sona
l use
onl
y

42 MATRIX ANNUAL REPORT 2016|
NOTES TO AND FORMING PART OF THE FINANCIAL STATEMENTS with foreign currency and interest rate fluctuations. Such derivative financial instruments are initially recognised at fair value on the date on which a derivative contract is entered into, and are subsequently measured at fair value.
Derivative financial instruments that do not qualify for hedge accounting are remeasured to fair value with changes in fair value recognised immediately in the income statement.
The Group has entered into various put and call currency option transactions as part of its overall hedging strategy. Details of call/put options outstanding at 30 June are included in Note 22. There were no put option positions at 30 June. Movements in the value of these derivative instruments are recognised immediately in profit or loss.
At the inception of a hedge relationship, the Group formally designates and documents the hedge relationship to which the Group wishes to apply hedge accounting and the risk management objective and strategy for undertaking the hedge. The documentation includes identification of the hedging instrument, the hedged item or transaction, the nature of the risk being hedged and how the entity will assess the hedging instrument’s effectiveness in offsetting the exposure to changes in the hedged item’s fair value or cash flows attributable to the hedged risk.
Such hedges, if expected to be highly effective in achieving offsetting changes in the fair value or cash flows, are assessed on an ongoing basis to determine that they actually have been highly effective throughout the financial reporting periods for which they were designated.
The hedges that meet the strict criteria for hedge accounting are accounted for as follows:
CASH FLOW HEDGESCash flow hedges are hedges of the Group’s exposure to variability in cash flows that is attributable to a particular risk associated with a highly probable forecast transaction
and that could affect profit and loss. The effective portion of changes in the fair value of derivatives that are designated and qualify as cash flow hedges are recognised in equity. The gain or loss relating to the ineffective portion is recognised immediately in profit or loss.
Amounts recognised in other comprehensive income and accumulated in equity are transferred out of equity and included in the measurement of the hedged transaction when the forecast transaction occurs.
Hedge accounting is discontinued when the hedging instrument expires or is sold, terminated, or exercised, or no longer qualifies for hedge accounting. At that time, any cumulative gain or loss previously recognised in equity remains in equity until the forecast transaction affects profit or loss. When a forecast transaction is no longer expected to occur, amounts recognised in equity are transferred immediately to profit or loss.
The Group tests each of the designated cash flow hedges for effectiveness at the inception of the hedge and then at each reporting date both prospectively and retrospectively.
For foreign currency cash flow hedges if the risk is over-hedged, the ineffective portion is taken immediately to profit or loss.
FAIR VALUEFair value is determined based on current bid prices for all quoted investments. Valuation techniques are applied to determine the fair value for all unlisted securities, including recent arm’s length transactions, reference to similar instruments and option pricing models.
IMPAIRMENT OF FINANCIAL ASSETSAt each reporting date, the company assesses whether there is objective evidence that a financial asset not carried at fair value through profit or loss has been impaired. A financial asset is impaired if objective evidence indicates that a loss event has occurred, and where the decline in
fair value is considered significant or prolonged. Impairment losses are recognised in profit or loss.
(I) IMPAIRMENT OF NON-FINANCIAL ASSETS OTHER THAN GOODWILL
At the end of each reporting period, the Group reviews the carrying amounts of its tangible and intangible assets to determine whether there is any indication that those assets have suffered an impairment loss. If any such indication exists, the recoverable amount of the asset is estimated in order to determine the extent of the impairment loss (if any). Where it is not possible to estimate the recoverable amount of an individual asset, the Group estimates the recoverable amount of the cash-generating unit to which the asset belongs. Where a reasonable and consistent basis of allocation can be identified, corporate assets are also allocated to individual cash-generating units, or otherwise they are allocated to the smallest Group of cash-generating units for which a reasonable and consistent allocation basis can be identified.
Intangible assets with indefinite useful lives and intangible assets not yet available for use are tested for impairment at least annually, and whenever there is an indication that the asset may be impaired.
Recoverable amount is the higher of fair value less costs to sell and value in use. In assessing value in use, the estimated future cash flows are discounted to their present value using a pre-tax discount rate that reflects current market assessments of the time value of money and the risks specific to the asset for which the estimates of future cash flows have not been adjusted.
If the recoverable amount of an asset (or cash-generating unit) is estimated to be less than its carrying amount, the carrying amount of the asset (or cash-generating unit) is reduced to its recoverable amount. An impairment loss is recognised immediately in profit or loss, unless the relevant
For
per
sona
l use
onl
y

43MATRIX ANNUAL REPORT 2016 |
NOTES TO AND FORMING PART OF THE FINANCIAL STATEMENTS asset is carried at a revalued amount, in which case the impairment loss is treated as a revaluation decrease.
Where an impairment loss subsequently reverses, the carrying amount of the asset (or cash generating unit) is increased to the revised estimate of its recoverable amount, but so that the increased carrying amount does not exceed the carrying amount that would have been determined had no impairment loss been recognised for the asset (or cash-generating unit) in prior years.
A reversal of an impairment loss is recognised immediately in profit or loss, unless the relevant asset is carried at a revalued amount, in which case the reversal of the impairment loss is treated as a revaluation increase. The Group assesses impairment of all non-financial assets other than goodwill at each reporting date by evaluating conditions specific to the Group and to the particular asset that may lead to impairment.
These include product and service delivery performance, technology, economic and political environments and future product expectations. If an impairment trigger exists the recoverable amount of the asset is determined.
The carrying amounts of all assets, other than inventory, financial assets and deferred tax assets, are reviewed half-yearly to determine whether there is indication of an impairment loss. If such an indication exists, the recoverable amount of the asset, being the higher of the asset’s fair value less costs to sell and value in use, is compared to the asset’s carrying value. Any excess of the asset’s carrying value over its recoverable amount is expensed to profit or loss.
Where it is not possible to estimate the recoverable amount of an individual asset, the company estimates the recoverable amount of the cash-generating unit to which the asset belongs.
(J) FOREIGN CURRENCY TRANSACTIONS AND BALANCES
TRANSACTION AND BALANCESThe individual financial statements of each Group entity are presented in the currency of the primary economic environment in which the entity operates (its functional currency). For the purpose of the consolidated financial statements, the results and financial position of each Group entity are expressed in Australian dollars (‘$’), which is the functional currency of the Company and the presentation currency for the consolidated financial statements.
In preparing the financial statements of each individual Group entity, transactions in currencies other than the entity’s functional currency (foreign currencies) are recognised at the rates of exchange prevailing at the dates of the transactions. At the end of each reporting period, monetary items denominated in foreign currencies are retranslated at the rates prevailing at that date. Non-monetary items carried at fair value that are denominated in foreign currencies are retranslated at the rates prevailing at the date when the fair value was determined. Non-monetary items that are measured in terms of historical cost in a foreign currency are not retranslated.
Exchange differences arising on the translation of monetary and non-monetary items are recognised in profit or loss, except where recognised in other comprehensive income as a qualifying cash flow or net investment hedge.
FOREIGN CURRENCY CASH FLOWSCash flows arising from transactions in a foreign currency shall be recorded in an entity’s functional currency by applying to the foreign currency amount the exchange rate
between the functional currency and the foreign currency at the date of the cash flow.
The cash flows of a foreign subsidiary shall be translated at the exchange rates between the functional currency and the foreign currency at the dates of the cash flows.
Cash flows denominated in a foreign currency are reported in a manner consistent with IAS 21 The Effects of Changes in Foreign Exchange Rates. This permits the use of an exchange rate that approximates the actual rate. For example, a weighted average exchange rate for a period may be used for recording foreign currency transactions or the translation of the cash flows of a foreign subsidiary. However, IAS 21 does not permit use of the exchange rate at the end of the reporting period when translating the cash flows of a foreign subsidiary.
Unrealised gains and losses arising from changes in foreign currency exchange rates are not cash flows. However, the effect of exchange rate changes on cash and cash equivalents held or due in a foreign currency is reported in the statement of cash flows in order to reconcile cash and cash equivalents at the beginning and the end of the period. This amount is presented separately from cash flows from operating, investing and financing activities and includes the differences, if any, had those cash flows been reported at end of period exchange rates.
(K) EMPLOYEE BENEFITS
Provision is made for the company’s liability for employee benefits arising from services rendered by employees to balance date. Short-term employee benefits have been measured at nominal value, plus related on-costs. Long-term employee benefits have been measured at the present value of the estimated future cash outflows to be made for those benefits. Payments to defined contribution plans are recognised as an expense when employees have rendered service entitling them to contributions.
For
per
sona
l use
onl
y

44 MATRIX ANNUAL REPORT 2016|
NOTES TO AND FORMING PART OF THE FINANCIAL STATEMENTS (L) PROVISIONSProvisions are recognised when the Group has a legal or constructive obligation, as a result of past events, for which it is probable that an outflow of economic benefits will result and that outflow can be reliably measured.
(M) CASH AND CASH EQUIVALENTS
Cash and cash equivalents includes cash on hand, deposits held at call with banks, other short-term highly liquid investments with original maturities of three months or less, and bank overdrafts. Bank overdrafts are shown within borrowings in current liabilities on the balance sheet.
(N) REVENUE RECOGNITION
Revenue is recognised and measured at the fair value of the consideration received or receivable to the extent that it is probable that the economic benefits will flow to the Group and the revenue can be reliably measured. The following specific recognition criteria must also be met before revenue is recognised.
SALE OF GOODSRevenue is recognised when the significant risks and rewards of ownership of the goods have passed to the buyer and the cost incurred or to be incurred in respect of the transaction can be measured reliably.
Risks and rewards are assessed in relation to the:
i) delivery of the goods to the customers;
ii) receipt of payment from the customer;
iii) achieving a relevant invoicing milestone under a contract with the customer; or
iv) contractual terms.
EX-WORKS REVENUERevenue in relation to ex-works contracts are recognised when the goods are produced and contract terms are fulfilled.
SERVICE REVENUE Service revenue and expenses are recognised in accordance with the percentage of completion method unless the outcome of the contract cannot be relied upon or estimated. Where it is probable that a loss will arise from a contract, the excess of total expected contract costs over total expected contract revenue is recognised as an expense immediately. Where the contract outcome cannot be reliably estimated, revenue is recognised only to the extent of the expenses incurred that are likely to be recoverable.
RENDERING OF SERVICESRevenue from consulting services is recognised when the services have been provided and where the amount can be reliably estimated and is considered recoverable.
INTERESTRevenue is recognised as interest accrues using the effective interest method. This is a method of calculating the amortised cost of a financial asset and allocating the interest income over the relevant period using the effective interest rate, which is the rate that exactly discounts estimated future cash receipts through the expected life of the financial asset to the net carrying amount of the financial asset.
All revenue is stated net of the amount of goods and services tax (GST).
(O) COST OF SALESThe cost of manufactured products includes direct materials, direct labour and manufacturing overheads.
(P) GOODS AND SERVICES TAX (GST)
Revenues, expenses and assets are recognised net of the amount of GST, except where the amount of GST incurred is not recoverable from the Australian Tax Office. In these circumstances the GST is recognised as part of the cost of acquisition of the asset or as part of an item of the expense. Receivables and payables in the balance sheet are shown inclusive of GST.
Cash flows are presented in the cash flow statement on a gross basis, except for the GST component of investing and financing activities, which are disclosed as operating cash flows.
(Q) EARNINGS PER SHARE
Basic earnings per share is calculated as net profit or loss attributable to members of the company divided by the weighted average number of ordinary shares outstanding during the period.
Diluted earnings per share is determined by adjusting the profit or loss attributable to members of the company and the weighted average number of ordinary shares outstanding for the effects of all dilutive potential ordinary shares.
(R) COMPARATIVE FIGURES
Where required by Accounting Standards, comparative figures have been adjusted to conform to changes in presentation for the current financial year.
For
per
sona
l use
onl
y

45MATRIX ANNUAL REPORT 2016 |
NOTES TO AND FORMING PART OF THE FINANCIAL STATEMENTS (S) SIGNIFICANT
ACCOUNTING ESTIMATES AND JUDGEMENTS
The preparation of the financial statements requires management to make judgements, estimates and assumptions that affect the reported amounts in the financial statements.
The following critical accounting policies were identified as requiring significant judgements, estimates and assumptions.
I. IMPAIRMENT OF GOODWILL (REFER TO NOTE 13)
Determining whether goodwill is impaired requires an estimation of the value in use of the cash-generating units to which goodwill has been allocated. The value in use calculation requires the directors to estimate the future cash flows expected to arise from the cash-generating unit and a suitable discount rate in order to calculate present value.
II. VALUATION OF FINANCIAL INSTRUMENTS
As described in note 22, the Group uses valuation techniques that include inputs that are not based on observable market data to estimate the fair value of certain types of financial instruments. Note 22 provides detailed information about the key assumptions used in the determination of the fair value of financial instruments, as well as the detailed sensitivity analysis for these assumptions.
The directors believe that the chosen valuation techniques and assumptions used are appropriate in determining the fair value of financial instruments.
III. TAXES (REFER TO NOTE 6)
Uncertainties exist with respect to the interpretation of complex tax regulations, changes in tax laws, and the amount and timing of future taxable income. Given the wide range of international business relationships and the long-term nature and complexity of existing contractual agreements, differences arising between the actual results and the assumptions made, or future changes to such assumptions, could necessitate future adjustments to tax income and expense already recorded. The Group establishes provisions, based on reasonable estimates, for possible consequences of audits by the tax authorities of the respective counties in which it operates. The amount of such provisions is based on various factors, such as experience of previous tax audits and differing interpretations of tax regulations by the taxable entity and the responsible tax authority. Such differences of interpretation may arise on a wide variety of issues depending on the conditions prevailing in the respective Group company’s domicile. As the Group assesses the probability for litigation and subsequent cash outflow with respect to taxes as remote, no contingent liability has been recognised.
Deferred tax assets are recognised for all unused tax losses to the extent that it is probable that taxable profit will be available against which the losses can be utilised. Significant management judgement is required to determine the amount of deferred tax assets that can be recognised, based upon the likely timing and the level of future taxable profits together with future tax planning strategies.
For
per
sona
l use
onl
y

46 MATRIX ANNUAL REPORT 2016|
NOTES TO AND FORMING PART OF THE FINANCIAL STATEMENTS 2. OPERATING SEGMENTSIn conjunction with AASB 8 Operating Segments, the Group has identified its operating segment based on internal reports that are reviewed and used by the Chief Operating Decision Maker (CODM) in assessing performance and in determining the allocation of resources.
PERFORMANCE MONITORING AND EVALUATIONThe CODM is identified as the Chief Executive Officer (CEO) who monitors the operating results of the consolidated group and organises its business activities and product lines to serve the global oil and gas industry. The performance of the consolidated group is evaluated based on Earnings before Interest, Taxes, Depreciation and Amortisation (“EBITDA”) and Earnings before Interest, Taxes, Depreciation, Amortisation, and Foreign Exchange (“EBITDAF”) which are measured in accordance with the Group’s accounting policies.
The following is an analysis of the Group’s revenue and results from continuing operations by reportable segment.
MCE Group 30 Jun 2016
$
MCE Group 30 Jun 2015
$
Revenue 95,728,426 144,074,596
EBITDAF 7,509,574 21,090,256
Foreign exchange loss (1,062,552) (1,571,513)
EBITDA 6,447,022 19,518,743
Depreciation and amortisation (10,609,266) (12,811,690)
EBIT (4,162,244) 6,707,053
Net finance costs (438,067) (726,281)
(Loss)/profit before tax (continuing operations) (4,600,311) 5,980,772
MCE Group 30 Jun 2016
$
MCE Group 30 Jun 2015
$
Total consolidated assets 146,640,886 180,213,642
Total consolidated liabilities 13,203,870 42,400,015
Geographical Assets
Australia 145,304,651 178,675,604
Others 1,336,235 1,538,038
146,640,886 180,213,642
Geographical Liabilities
Australia 6,661,816 37,386,415
Others 6,542,054 5,013,600
13,203,870 42,400,015
MAJOR CUSTOMERSMatrix supplies goods and services to a broad range of customers in the global oil & gas industry. During the reporting periods, three major customers (2015: four major customers), each individually accounted for greater than 10 per cent of total group revenue; collectively representing 64 per cent (2014: 74 per cent) of the total group revenue.
For
per
sona
l use
onl
y

47MATRIX ANNUAL REPORT 2016 |
NOTES TO AND FORMING PART OF THE FINANCIAL STATEMENTS 3. OTHER INCOME/(LOSSES)
2016 2015
$ $
Other Income
Interest received 21,759 296,334
Sundry income 86,231 113,811
Interest rate swap revaluation gain 203,294 203,633
311,284 613,778
Other Losses
Foreign exchange loss (1,062,552) (1,571,513)
Fixed assets disposals/write off (702,429) (42,403)
Other expenses (2,676) (59,549)
Total other losses (1,767,657) (1,673,465)
The Group generates revenue in foreign currencies. As part of its risk management practices Matrix hedges a portion of this revenue.
4. (LOSS)/PROFIT BEFORE INCOME TAX
(Loss)/profit before income tax is stated after charging the following expenses:
2016 2015
$ $
Depreciation and amortisation 10,609,266 12,811,690
Employee benefits expense 22,968,304 32,896,143
Finance costs 459,826 1,022,615
5. AUDITORS’ REMUNERATION
2016 2015
$ $
Auditor of the parent entity (Deloitte Touche Tohmatsu)
Audit and review fees for the year 129,056 123,690
Taxation and other advisory services - 23,000
Internal controls review - 33,088
129,056 179,778
For
per
sona
l use
onl
y

48 MATRIX ANNUAL REPORT 2016|
NOTES TO AND FORMING PART OF THE FINANCIAL STATEMENTS 6. INCOME TAX (BENEFIT)/EXPENSE
2016 2015
Current tax $ $
In respect of the current year - 488,129
In respect of prior years 25,528 506,005
25,528 994,134
Deferred tax
In respect of the current year (1,191,013) 1,367,830
In respect of prior years (1,320,798) (15,020)
(2,511,811) 1,352,810
Total income tax (benefit)/expense recognised in the current year relating to continuing operations (2,486,283) 2,346,944
The income tax expense for the year can be reconciled to the accounting (loss)/profit as follows:
2016 2015
$ $
(Loss)/profit before tax from continuing operations (4,600,311) 5,980,772
Income tax (benefit)/expense calculated at 30% (2015:30%) (1,380,093) 1,794,232
Effect of expenses that are not deductible in determining taxable profit 275,530 413,257
Effect of concessions (R&D and other allowances) (276,692) (351,529)
Effect of unused tax losses and tax offsets not recognised as deferred tax assets 190,242 -
(1,191,013) 1,855,960
Adjustments recognised in the current year in relation to the deferred tax (benefit)/expense of prior years (1,295,270) 490,984
Total income tax (benefit)/expense recognised in the current year relating to continuing operations (2,486,283) 2,346,944
The tax rate used for the 2016 and 2015 reconciliations above is the corporate tax rate of 30% payable by Australian corporate entities on taxable profits under Australian tax law.
2016 2015
INCOME TAX RECOGNISED DIRECTLY IN OTHER COMPREHENSIVE INCOME $ $
Deferred tax
Arising on income and expenses recognised in other comprehensive income:
Fair value measurements of hedging instruments entered into for cash flow hedges (139,582) (29,371)
Arising on income and expenses reclassified from equity to profit and loss:
Relating to cash flow hedges 5,414 -
Total income tax recognised in other comprehensive income (134,168) (29,371)For
per
sona
l use
onl
y

49MATRIX ANNUAL REPORT 2016 |
NOTES TO AND FORMING PART OF THE FINANCIAL STATEMENTS 6. INCOME TAX (BENEFIT)/EXPENSE
DEFERRED TAX ASSETS AND LIABILITIES
Deferred tax assets
2016 2015
$ $
Benefits of tax losses to be carried back to recover taxes paid in prior periods
Assessed losses 4,466,449 5,316,049
Research and development claims 3,469,233 2,508,653
Trade and other payables - 206,354
Provisions 389,798 373,884
Capital raising costs - 84,653
Borrowing costs 16,316 183,890
Other creditors & accruals 43,200 280,556
Employee entitlements - 58,713
Intangible assets 350,312 43,042
Cash flow hedges 149,471 15,303
Other 294,731 -
9,179,510 9,071,097
Deferred tax liabilities
Trade and other receivables - (1,150,017)
Property, plant & equipment (2,209,722) (2,697,610)
Inventories (79,592) (80,855)
Prepayments (15,474) (36,846)
Financial liabilities - (61,090)
Asset revaluation reserve - (814,497)
Other - (6,543)
(2,304,788) (4,847,458)
Deferred tax balances
Deferred tax assets 9,179,510 9,071,097
Deferred tax liabilities (2,304,788) (4,847,458)
6,874,722 4,223,639
For
per
sona
l use
onl
y

50 MATRIX ANNUAL REPORT 2016|
NOTES TO AND FORMING PART OF THE FINANCIAL STATEMENTS
2016 OpeningRecognised
in profit or loss
Recognised in other
comprehensive income
Recognised directly
in equity
Reclassified from equity
to profit or loss
Closing
Temporary differences
Cash flow hedges 15,303 - 139,582 - (5,414) 149,471
Asset revaluation reserve (814,497) 814,497 - - - -
Trade and other payables 206,354 (206,354) - - - -
Provisions 373,884 15,914 - - - 389,798
Capital raising costs 84,653 (84,653) - - - -
Borrowing costs 183,890 (167,574) - - - 16,316
Other creditors & accruals 280,556 (237,356) - - - 43,200
Employee entitlements 58,713 (58,713) - - - -
Intangible assets 43,042 307,270 - - - 350,312
Other (6,543) 301,274 - - - 294,731
Trade and other receivables (1,150,017) 1,150,017 - - - -
Property, plant & equipment (2,697,610) 487,888 - - - (2,209,722)
Inventories (80,855) 1,263 - - - (79,592)
Prepayments (36,846) 21,372 - - - (15,474)
Financial liabilities (61,090) 61,090 - - - -
(3,601,063) 2,405,935 139,582 - (5,414) (1,060,960)
Unused tax losses and credits
Tax losses and R&D Credits 7,824,702 110,980 - - - 7,935,682
7,824,702 110,980 - - - 7,935,682
4,223,639 2,516,915 139,582 - (5,414) 6,874,722
For
per
sona
l use
onl
y

51MATRIX ANNUAL REPORT 2016 |
NOTES TO AND FORMING PART OF THE FINANCIAL STATEMENTS
2015 OpeningRecognised
in profit or loss
Recognised in other
comprehensive income
Recognised directly
in equity
Reclassified from equity
to profit or loss
Closing
Temporary differences
Cash flow hedges (14,068) - 29,371 - - 15,303
Asset revaluation reserve (814,497) - - - - (814,497)
Trade and other payables 183,790 22,564 - - - 206,354
Provisions 389,709 (15,825) - - - 373,884
Capital raising costs 242,691 (158,038) - - - 84,653
Borrowing costs - 183,890 - - - 183,890
Other creditors & accruals 83,695 196,861 - - - 280,556
Employee entitlements 165,290 (106,577) - - - 58,713
Intangible assets - 43,042 - - - 43,042
Other 1,887 (8,430) - - - (6,543)
Trade and other receivables (113,966) (1,036,051) - - - (1,150,017)
Property, plant & equipment (2,241,429) (456,181) - - - (2,697,610)
Inventories (74,139) (6,716) - - - (80,855)
Prepayments (24,587) (12,259) - - - (36,846)
Financial liabilities (62,000) 910 - - - (61,090)
(2,277,624) (1,352,810) 29,371 - - (3,601,063)
Unused tax losses and credits
Tax losses and R&D Credits 10,000,816 (2,176,114) - - - 7,824,702
10,000,816 (2,176,114) - - - 7,824,702
7,723,192 (3,528,924) 29,371 - - 4,223,639
UNRECOGNISED DEFERRED TAX ASSETS
Deductible temporary differences, unused tax losses and unused tax credits for which no deferred tax assets have been recognised are attributable to the following:
Unrecognised deferred tax assets At 100% At 30%
Transferred tax losses 1,069,452 320,836
Capital losses 3,876,570 1,162,971
For
per
sona
l use
onl
y

52 MATRIX ANNUAL REPORT 2016|
NOTES TO AND FORMING PART OF THE FINANCIAL STATEMENTS 7. CASH AND CASH EQUIVALENTS
2016 2015
$ $
Cash on hand 305 1,028
Cash management accounts 5,137,304 6,889,669
Cash and bank balances 3,265,854 7,577,753
8,403,463 14,468,450
8. TRADE AND OTHER RECEIVABLES2016 2015
CURRENT $ $
Trade receivables (i) 8,825,068 21,168,585
Other receivables – Trade (ii) 16,512,282 13,077,247
GST refundable 150,136 236,429
25,487,486 34,482,261
NON-CURRENT
Other receivables – Trade (ii) 1,444,576 -
i) The Company’s standard terms and conditions require customers to pay trade receivables within 30 days from invoice date. The average collectability timeframe is ordinarily between 30 to 60 days. These amounts are generally non-interest bearing, although, there are customers who will be subjected to interest charges at management’s discretion.
ii) Other receivables – Trade, relates to products completed which have recognised as revenue but are yet to be invoiced, pending collection by customer. Refer to note 22 credit risk for further information.
9. INVENTORIES2016 2015
$ $
Raw Materials at cost 6,071,490 8,814,030
Work in progress at cost 1,242,175 3,374,539
Finished goods at cost 3,318,418 8,537,454
10,632,083 20,726,023
10. OTHER CURRENT ASSETS
2016 2015
$ $
Prepayments 746,754 943,787
For
per
sona
l use
onl
y

53MATRIX ANNUAL REPORT 2016 |
NOTES TO AND FORMING PART OF THE FINANCIAL STATEMENTS 11. PROPERTY, PLANT AND EQUIPMENT
2016 2015
$ $
Land and Building/Leasehold improvements:
Land at independent valuation¹ - 3,406,700
Building at independent valuation¹ - 1,243,300
Buildings² 34,817,462 34,817,462
Other leasehold improvements³ 1,117,702 705,806
Less: accumulated depreciation (5,523,262) (4,221,457)
30,411,902 35,951,811
Plant and Equipment:
Plant and equipment at cost 90,478,436 89,894,676
Less: accumulated depreciation (41,710,119) (36,901,886)
48,768,317 52,992,790
Motor Vehicles:
Motor vehicles at cost 41,150 140,796
Less: accumulated depreciation (22,976) (97,577)
18,174 43,219
Office Equipment:
Office equipment at cost 460,445 462,879
Less: accumulated depreciation (410,726) (311,250)
49,719 151,629
Computer Equipment:
Computer equipment at cost 2,653,337 2,311,417
Less: accumulated depreciation (2,293,965) (2,139,481)
359,372 171,936
Assets under construction:
Plant and equipment in progress at cost 2,135,465 2,009,967
81,742,949 91,321,352
1 The land and buildings located at 185 Camboon Road, Malaga were independently valued by Knight Frank in June 2014 and was subsequently sold on 11 April 2016.
2 Relates to the Group’s Henderson manufacturing and office complex.3 Leasehold improvements are located at Malaga, Karratha and US Houston office.
ASSETS PLEDGED AS SECURITYBuildings and leasehold improvements with a carrying amount of approximately $30,411,902 (2015: $35,951,811) have been pledged to secure the Group’s working capital, bonding and overdraft facilities (see note 16). The Group is not permitted to pledge these assets as security for other borrowings.
For
per
sona
l use
onl
y

54 MATRIX ANNUAL REPORT 2016|
NOT
ES T
O A
ND
FO
RM
ING
PA
RT
OF
THE
FIN
AN
CIA
L ST
ATEM
ENTS
11. P
RO
PER
TY, P
LAN
T A
ND
EQ
UIP
MEN
TR
ECO
NCI
LIAT
ION
S
R
econ
cilia
tions
of t
he c
arry
ing
amou
nts
of e
ach
clas
s of
pro
pert
y, pl
ant a
nd e
quip
men
t at t
he b
egin
ning
and
end
of t
he c
urre
nt a
nd p
revi
ous
finan
cial
yea
r ar
e se
t out
bel
ow:
Land
and
bui
ldin
g/
Leas
ehol
d im
prov
emen
tPl
ant a
nd
equi
pmen
tM
otor
veh
icle
sO
ffice
eq
uipm
ent
Com
pute
r eq
uipm
ent
Asse
ts u
nder
co
nstr
uctio
nTo
tal
$$
$$
$$
$
Cons
olid
ated
Car
ryin
g am
ount
at 1
Jul
y 20
1535
,951
,811
52,9
92,7
9043
,219
151,
629
171,
936
2,00
9,96
791
,321
,352
Addi
tions
411,
708
4,70
3,30
1-
13,4
5835
4,58
512
5,49
85,
608,
550
Dis
posa
ls/w
rite
-offs
(4,6
50,0
00)
(911
,937
)(1
7,19
8)(1
2,22
9)(1
0,55
6)-
(5,6
01,9
20)
Dep
reci
atio
n/am
ortis
atio
n ex
pens
es(1
,301
,617
)(8
,015
,837
)(7
,847
)(1
03,1
39)
(156
,593
)-
(9,5
85,0
33)
Car
ryin
g am
ount
at 3
0 Ju
ne 2
016
30,4
11,9
0248
,768
,317
18,1
7449
,719
359,
372
2,13
5,46
581
,742
,949
Car
ryin
g am
ount
at 1
Jul
y 20
1437
,035
,641
60,2
95,1
0431
,480
194,
964
254,
877
2,03
9,62
599
,851
,691
Addi
tions
3,08
84,
510,
588
35,8
059,
563
108,
663
2,29
84,
670,
005
Dis
posa
ls/w
rite
-offs
-(5
08,2
12)
(8,8
90)
(2,1
48)
(2,0
60)
(31,
956)
(553
,266
)
Dep
reci
atio
n/am
ortis
atio
n ex
pens
es(1
,086
,918
)(1
1,30
4,69
0)(1
5,17
6)(5
0,75
0)(1
89,5
44)
-(1
2,64
7,07
8)
Car
ryin
g am
ount
at 3
0 Ju
ne 2
015
35,9
51,8
1152
,992
,790
43,2
1915
1,62
917
1,93
62,
009,
967
91,3
21,3
52
For
per
sona
l use
onl
y

55MATRIX ANNUAL REPORT 2016 |
NOTES TO AND FORMING PART OF THE FINANCIAL STATEMENTS 12. FINANCIAL ASSETS
2016 2015
$ $
Foreign currency options (hedge-accounted) - 501,615
- 501,615
The group had a net hedge liability position of $498,237 (2015: net hedge liability position of $1,460,002) reflecting the negative mark-to-market value of foreign exchange contracts and call/put options. Refer to note 22, financial instruments for further details on the instruments.
13. INTANGIBLE ASSETS2016 2015
$ $
Development costs net of amortisation (i) 3,786,874 2,457,633
Accumulated amortisation (1,198,024) (173,791)
Goodwill on acquisition of Specialist Engineering 6,415,215 6,415,215
Services (Aust) Pty Ltd (ii) 9,004,065 8,699,057
i) Development costs incurred to date relate to several ongoing projects that are in the development phase prior to anticipated commercialisation.
ii) Goodwill is associated with acquisition of Specialist Engineering Services (Aust) Pty Ltd. Following the business reorganisation undertaken in 2014, goodwill was allocated for impairment testing purposes too a single cash generating unit (CGU), being the MCE Group, refer Note 2 for details.
The Group has evaluated whether the recoverable amount of the CGU exceeds its carrying amount. The carrying amount is determined to be the higher of its fair value less costs to sell or its value in use. For impairment testing purposes at 30 June 2016 the Group has prepared a value in use model. The value in use model uses cash flow projections approved by the directors covering a five year period with a steady growth rate for years beyond the five year period.
The estimation of future cash flows requires significant estimates and judgements. Details of the key assumptions used in the value in use model at 30 June 2016 and adopted by the Board are included below.
KEY ASSUMPTIONS:
DISCOUNT RATE
A post-tax discount rate of 10 per cent (2015: 10 per cent) reflecting the Group’s long term weighted average cost of capital adjusted for market risk.
REVENUE
The sustained low oil and gas price over the past year has led to reduced levels of activity in the oil and gas sector which the Group primarily services. Revenue forecasts have incorporated the impacts of the lower levels of activity but incorporate a gradual recovery in demand over the next five year period. The model assumes manufacturing products and providing services based on current volumes achieved with a gradual recovery in demand over the next five year period. Selling prices reflect current values with an assumption that over the next five year period the price will retain its baseline USD price and will also grow at a rate of US CPI being two per cent.
In addition, the model incorporates the introduction of the Longitudinally Grooved Suppression (LGSTM) system into the overall product mix including a pricing structure that represents recent contract prices and industry guidance.
For
per
sona
l use
onl
y

56 MATRIX ANNUAL REPORT 2016|
NOTES TO AND FORMING PART OF THE FINANCIAL STATEMENTS COST OF GOODS SOLDIn determining gross margin, management has used historical performance trends, overlaying the impacts of recent initiatives and changes to product mix to reduce costs.
TERMINAL GROWTH RATEA terminal value growth rate of two per cent (2015: two per cent) has been applied.
FOREIGN EXCHANGE RATEA AUD:USD foreign exchange rate of 0.74 (2015: 0.73) has been applied.
SENSITIVITY ANALYSIS:Sensitivity analyses were performed to determine whether carrying values are supported by different assumptions. Key variables to the sensitivity analysis include:
• Revenue – production growth rates over the next five year period
• Revenue – sales price growth rates over the next five year period
• Discount rate
• Terminal value growth rate
• Foreign exchange rate
Each of the assumptions in the analysis has been evaluated at levels above and below expected values, as described above. The following table sets out the impact on the recoverable amount for a change in the key assumptions:
ASSUMPTION VARIANCE NEGATIVE IMPACT $ MILLION
POSITIVE IMPACT $ MILLION
Revenue – production growth rate ± 10% 52.7 51.1
Revenue – sales price growth rate ± 10% 103.5 100.2
Discount rate ± 2% 54.6 91.7
Terminal value growth rate ± 0.5% 10.9 12.3
Foreign exchange rate ± 0.05 37.3 41.4
Using this sensitivity analysis, the directors determined that a reasonably possible increase in raw material costs, being the predominant component of direct costs, of 28.5 per cent, without any associated increase in revenue, would result in a reduction in gross margin sufficient to cause the carrying value of the CGU to exceed its recoverable value.
Similarly, a reasonably possible reduction in revenue of 16.3 per cent, without any associated reduction in material prices, or improvements in plant efficiencies, would result in a reduction in gross margin sufficient to cause the carrying value of the CGU to exceed its recoverable value.
14. TRADE AND OTHER PAYABLES2016 2015
$ $
Trade payables 3,749,926 8,841,152
Other creditors and accruals 655,936 2,710,200
GST payable 8,805 66,900
4,414,667 11,618,252
Trade and other payables are generally paid within 30 to 45 days. No security is provided for these liabilities and no interest has been paid.
For
per
sona
l use
onl
y

57MATRIX ANNUAL REPORT 2016 |
NOTES TO AND FORMING PART OF THE FINANCIAL STATEMENTS 15. PROGRESS CLAIMS AND DEPOSITS
2016 2015
$ $
Progress claims and deposits 1,879,063 14,297,482
Progress claims and deposits represents cash deposits received for products that have not been produced or not reached the relevant invoicing milestone under a contract with the customer.
16. FINANCIAL LIABILITIES
2016 2015
CURRENT $ $
Bank loan (i) - 4,000,000
Trade finance (i) 2,930,811 -
Interest rate swap option (ii) - 203,294
Foreign currency options (hedge accounted) (iii) 231,975 510,556
Forward exchange contracts liability (hedge accounted) (iii) 266,262 1,451,061
3,429,048 6,164,911
NON CURRENT
Bank loan (i) - 4,000,000
i) The Company has a $20 million multi-option, multi-currency funding package with Australia and New Zealand Banking Group Limited (ANZ). The $20 million facility covers the Group’s working capital, bonding and overdraft facilities and encompasses sub-limits for certain facilities. The working capital, bonding and overdraft facilities can be drawn in multiple currencies using a variety of instruments.
ii) These were held at fair value through profit or loss and expired on 29 February 2016.
iii) The Group had a net hedge liability position of $498,237 represented by net movement foreign currency options and net foreign exchange contracts (2015: net hedge liability position of $1,460,002) reflecting the negative mark-to-market value of foreign exchange contracts and call/put options. Refer to note 22 financial instruments for further details on the instruments.
2016 2015
TOTAL CURRENT AND NON CURRENT INTEREST BEARING LOAN LIABILITIES: $ $
Bank loan - 8,000,000
Trade finance 2,930,811 -
2,930,811 8,000,000
For
per
sona
l use
onl
y

58 MATRIX ANNUAL REPORT 2016|
NOTES TO AND FORMING PART OF THE FINANCIAL STATEMENTS TERMS AND CONDITIONS OF FACILITY
Working Capital and Contingent Lines Currency Nominal
interest rateApproved Facilities
Amount Utilised
Available Facilities
% $ $ $
ANZ Multi-option Bank Guarantee AUD/USD 0.5 4,161,060
20,000,000 12,881,600
ANZ Working capital AUD/USD 1.72 2,957,340
NAB Bank Guarantee AUD BBSY + 2% 837,794 837,794 -
20,837,794 7,956,194 12,881,600
17. PROVISIONS
2016 2015
CURRENT $ $
Employee Entitlements 780,272 1,098,092
NON-CURRENT
Employee Entitlements 396,032 373,820
18. ISSUED CAPITAL2016 2015
$ $
Issued and paid up capital 93,750,000 (2015: 94,231,942) fully paid ordinary shares 111,555,600 111,784,863
Less: Buy-back of ordinary shares (234,045) (200,659)
Less: Share buy-back costs (37,787) (28,604)
111,283,768 111,555,600
Changes to the then Corporations Law abolished the authorised capital and par value concept in relation to share capital from 1 July 1998. Therefore, the company does not have a limited amount of authorised capital and issued shares do not have a par value.
MOVEMENTS IN ORDINARY SHARE CAPITAL
Date Number of shares $
Balance 1 July 2014 94,555,428 111,784,863
Less: Buy-back of ordinary shares (323,486) (200,659)
Less: Share buy-back costs - (28,604)
Balance 30 June 2015 94,231,942 111,555,600
Less: Buy-back of ordinary shares (481,942) (234,045)
Less: Share buy-back costs - (37,787)
Balance 30 June 2016 93,750,000 111,283,768
Ordinary shares participate in dividends and the proceeds on winding up of the parent entity in proportion to the number of shares held. Ordinary shares carry one vote per share.
}
For
per
sona
l use
onl
y

59MATRIX ANNUAL REPORT 2016 |
NOTES TO AND FORMING PART OF THE FINANCIAL STATEMENTS CAPITAL MANAGEMENTThe directors’ main objective is to ensure that the Group continues as a going concern and generates a return for shareholders better than the industry average benchmark. Management also seeks to maintain a capital structure that ensures the lowest cost of capital available to the Group.
The directors’ are constantly reviewing the capital structure to ensure they can minimise the cost of capital. As the market is constantly changing, the directors may change the amount of dividends to be paid to shareholders, return capital to shareholders, issue new shares or sell assets to reduce debt.
The Group targets a gearing ratio of up to 20 per cent, determined as a proportion of adjusted net debt to equity. Adjusted net debt is determined after considering the value of any progress claims and deposits received in advance of work commencing as debt. The gearing ratio at 30 June 2016 of negative 2.7 per cent (2015: 5.7 per cent) is below the target gearing level.
2016 2015
$ $
Term Debt¹ - 8,000,000
Trade finance² 2,930,811 -
Progress claims and deposits 1,879,063 14,297,482
Cash and cash equivalents (8,403,463) (14,468,450)
Adjusted net (asset)/debt (3,593,589) 7,829,032
Equity³ 133,437,016 137,813,627
Net (asset)/debt to equity ratio at 30 June (2.7%) 5.7%1 Term Debt is defined as long-term and short-term amortising borrowings (excluding derivatives and financial guarantee contracts). Refer to note 16.2 Trade finance forms part of the Company’s working capital facilities.3 Equity includes all capital and reserves of the Group that are managed as capital.
19. RESERVES
2016 2015
$ $
Option premium reserve - 273,000
Properties revaluation reserve - 787,664
Cash flow hedge reserve (392,610) (6,336)
Foreign currency translation reserve (415,102) (455,860)
Share based payment reserve 161,987 80,000
(645,725) 678,468
OPTION PREMIUM RESERVEThe option premium reserve relates to share options granted by the Company to some of its directors under a share option plan. The share options expired during the period and the share option plan has been discontinued.F
or p
erso
nal u
se o
nly

60 MATRIX ANNUAL REPORT 2016|
NOTES TO AND FORMING PART OF THE FINANCIAL STATEMENTS PROPERTIES REVALUATION RESERVE
2016 2015
$ $
Properties Revaluation Reserve
Balance at beginning of year 787,664 787,664
Transferred to profit & loss on disposal of freehold land and building (787,664) -
Balance at end of year - 787,664
The properties revaluation reserve arose on the revaluation of land and buildings in prior periods. The revalued land and building was sold during the financial year and as a result of the loss incurred on disposal, the attributable revaluation reserve was transferred to the statement of profit or loss.
CASH FLOW HEDGE RESERVE
2016 2015
$ $
Cash Flow Hedge Reserve
Balance at beginning of year (6,336) (17,220)
Gain/(loss) arising on changes in fair value of hedging instruments entered into for cash flow hedges:
– Forward foreign exchange contracts (538,488) 15,549
– Income tax related to loss recognised in other comprehensive income 139,582 (4,665)
Cumulative gain/(loss) arising on changes in fair value of hedging instruments reclassified to profit or loss:
– Forward foreign exchange contracts 18,046 -
– Income tax related to amounts reclassified to profit or loss (5,414) -
Balance at end of year (392,610) (6,336)
The cash flow hedge reserve represents the cumulative effective portion of gains or losses arising on changes in fair value of hedging instruments entered into for cash flow hedges. The cumulative gain or loss arising on changes in fair value of the hedging instruments that are recognised and accumulated under the heading of cash flow hedging reserve will be reclassified to profit or loss only when the hedged transaction affects the profit or loss, or is included as a basis adjustment to the non-financial hedged item, consistent with the relevant accounting policy.
Cumulative (gains)/losses arising on changes in fair value of hedging instruments reclassified from equity into profit or loss during the year are included in the following line items:
2016 2015
$ $
Foreign exchange 18,046 -
Income tax expense (5,414) -
12,632 -For
per
sona
l use
onl
y

61MATRIX ANNUAL REPORT 2016 |
NOTES TO AND FORMING PART OF THE FINANCIAL STATEMENTS FOREIGN CURRENCY TRANSLATION RESERVE
2016 2015
$ $
Foreign Currency Translation Reserve
Balance at beginning of year (455,860) 146,888
Exchange differences arising on translating the foreign operations 40,758 (602,748)
Balance at end of year (415,102) (455,860)
Exchange differences relating to the translation of results and net assets of the Group’s foreign operations from their functional currencies to the Group’s presentation currency (i.e Australian dollars) are recognised directly in other comprehensive income and accumulated in the foreign currency translation reserve.
SHARE BASED PREMIUM RESERVE
2016 2015
$ $
Share-based Premium Reserve
Balance at beginning of year 80,000 -
Arising on share-based payments 81,987 80,000
Balance at end of year 161,987 80,000
The above share-based premium reserve relates to equity based instruments granted by the Company to its employees under its employee equity-based instruments plan. Further information about share-based payments is set out in note 25.
20. RETAINED EARNINGS 2016 2015
$ $
Retained earnings 22,809,176 25,589,762
Balance at beginning of year 25,589,762 23,847,043
(Loss)/profit attributable to owners of the company (2,114,028) 3,633,828
Payment of dividends (939,558) (1,891,109)
Expiry of options 273,000 -
Balance at end of year 22,809,176 25,589,762
For
per
sona
l use
onl
y

62 MATRIX ANNUAL REPORT 2016|
NOTES TO AND FORMING PART OF THE FINANCIAL STATEMENTS 21. NOTES TO THE STATEMENT OF CASH FLOW
2016 2015
$ $
(a) Reconciliation of cash and cash equivalents
Cash and cash equivalents at the end of the financial year as shown in the statement of cash flows is reconciled to items in the statement of financial position as follows:
Cash and cash equivalents 8,403,463 14,468,450
(b) Reconciliation of cash flow from operations with (loss)/profit after income tax
(Loss)/profit after income tax (2,114,028) 3,633,828
Adjustment for non-cash items
– Depreciation of property, plant & equipment 9,585,033 12,647,078
– Amortisation of intangibles 1,024,233 164,612
– Expense recognised in respect of equity-settled share-based payments 81,987 80,000
– Effects of exchange rate changes on the balance of cash held in foreign currencies (287,433) (3,294,014)
– Effects of translation of foreign operations 40,758 (602,751)
– Net (gain)/loss arising on financial liabilities designated as at fair value through profit or loss (1,551,332) 1,575,339
– Loss on disposal of property, plant & equipment 702,429 42,403
– Loss on disposal of property, plant & equipment included in cost of sales - 274,343
Changes in assets & liabilities
– Decrease/(increase) in trade and other receivables 7,550,199 (998,191)
– Decrease/(increase) in other assets 197,033 (388,487)
– Decrease/(increase) in inventories 10,093,940 (1,967,891)
– Decrease in trade & other payables, progress claims & deposits (19,622,004) (10,749,758)
– (Decrease)/increase in employee provisions (295,609) (408,851)
– (Increase)/decrease in deferred tax asset (108,413) 1,982,712
– (Decrease)/increase in deferred tax liability (2,542,670) 1,516,839
Net cash flows from operating activities 2,754,123 3,507,211
22. FINANCIAL INSTRUMENTS
FINANCIAL RISK MANAGEMENT POLICIESThe Group’s financial instruments consist mainly of deposits with banks, trade and other receivables, trade and other payables, finance leases, bank borrowings, other borrowings and derivatives. The main purpose of non-derivative financial instruments is to raise finance for Group operations. Derivatives are used by the Group for hedging purposes. The Group does not speculate in the trading of derivative instruments. Senior executives meet regularly to analyse and monitor the financial risk associated with the financial instruments used by the Group.
FINANCIAL RISK EXPOSURES AND MANAGEMENTThe main risks the Group is exposed to through its financial instruments are interest rate risk, foreign currency risk, liquidity risk and credit risk.
For
per
sona
l use
onl
y

63MATRIX ANNUAL REPORT 2016 |
NOTES TO AND FORMING PART OF THE FINANCIAL STATEMENTS INTEREST RATE RISKThe Group is exposed to interest rate risk because entities in the Group borrow funds at both fixed and floating interest rates. The risk is managed by the Group by maintaining an appropriate mix between fixed and floating rate borrowing and the use of interest rate swap contracts where appropriate. Hedging activities are evaluated on a regular basis to align with interest rate views and defined risk appetite, ensuring the most cost-effective measures are put in place.
INTEREST RATE SENSITIVITY ANALYSISThe following sensitivity analysis has been determined based on the exposure to interest rates for non-derivative instruments at the reporting date and the stipulated change taking place at the beginning of the financial year and held constant throughout the reporting period.
At 30 June 2016, the after tax effect on profit and equity as a result of changes in the interest rate, with all other variables remaining constant at balance date would be as follows:
2016 2015
$ $
Change in profit
Increase in interest rate by 2% (200 basis point) 68,581 203,298
Decrease in interest rate by 2% (200 basis point) (68,581) (203,298)
Change in other comprehensive income
Increase in interest rate by 2% (200 basis point) - -
Decrease in interest rate by 2% (200 basis point) - -
The sensitivity to a 200 basis point increase or decrease in interest rates is considered reasonable given the markets forecast available at the reporting date and under the current economic environment in which the Group operates.
For
per
sona
l use
onl
y

64 MATRIX ANNUAL REPORT 2016|
NOT
ES T
O A
ND
FO
RM
ING
PA
RT
OF
THE
FIN
AN
CIA
L ST
ATEM
ENTS
22.
FIN
AN
CIA
L IN
STR
UM
ENTS
(CON
T...)
FIN
AN
CIA
L A
SSET
S
Wei
ghte
d Av
erag
e
Effe
ctiv
e In
tere
st R
ate
Floa
ting
In
tere
st R
ate
Fixe
d In
tere
st
Rat
e M
atur
ing
Non
-Int
eres
t B
eari
ng
With
in 1
Yea
rO
ver
1 Ye
ar
2016
2015
2016
2015
2016
2015
2016
2015
2016
2015
%%
$$
$$
$$
$$
Cas
h an
d C
ash
Equi
vale
nts
--
--
--
--
8,40
3,46
314
,468
,450
Trad
e an
d O
ther
Rec
eiva
bles
--
--
--
--
26,7
81,9
2634
,245
,832
Oth
er F
inan
cial
Ass
ets
--
--
--
--
-50
1,61
5
Tota
l Fin
anci
al A
sset
s-
--
--
-35
,185
,389
49,2
15,8
97
FIN
AN
CIA
L LI
AB
ILIT
IES
Wei
ghte
d Av
erag
e
Effe
ctiv
e In
tere
st R
ate
Floa
ting
In
tere
st R
ate
Fixe
d In
tere
st
Rat
e M
atur
ing
Non
-Int
eres
t B
eari
ng
With
in 1
Yea
rO
ver
1 Ye
ar
2016
2015
2016
2015
2016
2015
2016
2015
2016
2015
%%
$$
$$
$$
$$
Trad
e an
d O
ther
Pay
able
s-
--
--
--
-4,
405,
862
11,5
51,3
52
Trad
e Fi
nanc
e1.
72-
2,93
0,81
1-
--
--
--
Ban
k Lo
an
-3.
35-
8,00
0,00
0-
--
--
-
Inte
rest
Rat
e Sw
aps
-3.
69-
203,
294
--
--
--
Oth
er F
inan
cial
Lia
bilit
ies
--
498,
237
1,96
1,61
7-
--
--
-
Tota
l Fin
anci
al L
iabi
litie
s3,
429,
048
10,1
64,9
11-
--
-4,
405,
862
11,5
51,3
52
For
per
sona
l use
onl
y

65MATRIX ANNUAL REPORT 2016 |
NOTES TO AND FORMING PART OF THE FINANCIAL STATEMENTS 22. FINANCIAL INSTRUMENTS (CONT...)
CREDIT RISKCredit risk relates to the risk that a counter party will default on its contractual obligations resulting in financial loss to the Group.
The maximum exposure to credit risk, excluding the value of any collateral or other security, at balance date to recognised financial assets, is the carrying amount, net of any provisions for impairment of those assets, as disclosed in the balance sheet and notes to the financial statements. There is no material amount of collateral held as security at 30 June 2016.
Credit risk is managed on a Group basis and reviewed regularly by senior executives. It arises from exposures to customers and deposits with financial institutions. The following criteria are applied by senior executives in the assessment of counter party risk:
• Deposits and borrowings are with Australian based banks;
• Significant customers are rated for credit worthiness.
The consolidated entity's maximum exposure to credit risk at the reporting date was:
2016 2015
$ $
Trade receivables 8,825,068 21,168,585
At balance date, the aging analysis of trade receivables is as follows:
Days
0-30 6,072,955 13,243,760
31-60 2,600,030 7,921,436
61-90 105,478 3,389
90+ 46,605 -
8,825,068 21,168,585
Trade receivables of $2,861,042 (2015: $463,153) were past due at 30 June, of which $2,860,473 (2015: $256,076) has been collected up to the date of this report. There were no impairment provisions in respect of trade receivables that were past due as at 30 June 2016.
EXPOSURE TO CREDIT RISKExcluded from the above analysis is a trade receivable of US$10.9 million which relates to a shipyard customer. The customer has requested a deferral of the payment terms associated with the contract. Matrix has completed the production and the goods have not yet been collected by the customer. Matrix is negotiating with the shipyard customer in order to reach an acceptable settlement of this matter. Matrix remains confident of receiving full settlement of this amount.
FOREIGN CURRENCY RISKThe Group undertakes transactions denominated in foreign currencies; consequently exposure to exchange rate fluctuations arise. Exchange rate exposures are managed within approved policy parameters utilising forward foreign exchange contracts and currency option contracts.
The carrying amounts of the Group’s foreign currency denominated assets and monetary liabilities at the end of the period are as follows:
For
per
sona
l use
onl
y

66 MATRIX ANNUAL REPORT 2016|
NOTES TO AND FORMING PART OF THE FINANCIAL STATEMENTS 22. FINANCIAL INSTRUMENTS (CONT...)
Liabilities Assets
2016 2015 2016 2015
$ $ $ $
US Dollars 5,638,482 23,267,877 29,362,466 48,714,282
FOREIGN CURRENCY SENSITIVITY ANALYSISThe Group is mainly exposed to fluctuations in the US Dollar.
The following table details the Group’s sensitivity to a 10 per cent increase and decrease in the Australian dollar against the relevant foreign currencies. 10 per cent is the sensitivity rate used when reporting foreign currency risk internally to key management personnel and represents management’s assessment of the reasonably possible change in foreign exchange rates. The sensitivity analysis includes only outstanding foreign currency denominated monetary items and adjusts their translation at the year-end for a 10 per cent change in foreign currency rates. A positive number below indicates an increase in profit or equity where the Australian dollar strengthens 10 per cent against the relevant currency. For a 10 per cent weakening of the Australian dollar against the relevant currency, there would be a comparable impact on the profit or equity, and the balances would be negative.
Profit after tax Other Comprehensive Income
Increase/(Decrease) Increase/(Decrease)
2016 2015 2016 2015
$000 $000 $000 $000
A$ vs US$ +10% (2,157) (1,831) 918 1,929
A$ vs US$ -10% 2,372 2,015 (1,010) (2,122)
The movement in other comprehensive income is due to an increase/decrease in the fair value of forward foreign exchange contracts designated as cash flow hedges.
FORWARD FOREIGN EXCHANGE CONTRACTSIt is the policy of the Group to enter into forward foreign exchange contracts to cover specific foreign currency payments and receipts within 50 to 100 per cent of the net exposure generated. The Group also enters into forward foreign exchange contracts to manage the risk associated with contracted sales transactions for the period of contracts within 50 to 100 per cent of the net exposure generated. Basis adjustments are made to the carrying amounts of non-financial hedged items when the anticipated sale or purchase transaction takes place.
The following table details the forward foreign currency (FC) contract outstanding at the end of the reporting period:
Average exchange rate Foreign currency Notional value Fair value
2016 2015 2016 2015 2016 2015 2016 2015
$ $ US$000 US$000 US$000 US$000 US$000 US$000
Cash flow hedges
Sell US Dollar
Less than 1 month - 0.8648 - 5,500 - 6,360 - (776)
Less than 3 months 0.7629 0.8418 5,000 5,000 6,554 5,940 (178) (580)
3 to 6 months 0.7598 0.7617 2,500 4,500 3,290 5,908 (88) (74)
6 months to 1 year - 0.7598 - 1,300 - 1,711 - (21)
(266) (1,451)
For
per
sona
l use
onl
y

67MATRIX ANNUAL REPORT 2016 |
NOTES TO AND FORMING PART OF THE FINANCIAL STATEMENTS 22. FINANCIAL INSTRUMENTS (CONT...)
At 30 June 2016, the aggregate amount of gains under forward foreign exchange contracts recognised in other comprehensive income and accumulated in the cash flow reserve relating to the exposure on these anticipated future transactions is a loss of $392,610 (2014: loss $6,336). It is anticipated that the sales will take place during the next financial year, at which time the amount deferred in equity will be reclassified to profit or loss.
The Group is exposed to fluctuations in foreign currencies arising from the sale of goods denoted in U.S. Dollars. Currently the Group uses derivatives to hedge against movements in foreign currency.
FOREIGN CURRENCY OPTIONS The Group has entered into a series of foreign currency options to protect a portion of the Group’s future revenue against unfavourable exchange rate movements.
The face value of the foreign currency options as at 30 June 2016 was nil. (2015: US$13.95 million).
At 30 June 2016, the aggregate amount of loss recognised under foreign currency option in profit or loss is $501,615 (2015: loss $162,133).
LIQUIDITY RISKLiquidity risk is the risk that the consolidated entity will not be able to meet its financial obligations as they fall due. The consolidated entity’s approach to managing liquidity is to ensure, as far as possible, that it will always have sufficient liquidity to meet its liabilities when due, under both normal and stressed conditions, without incurring unacceptable losses or risking damage to the consolidated entity’s reputation.
The Group manages liquidity risk by monitoring forecast cash flows, maintaining cash reserves and managing trade payables.
The following table details the Group’s expected maturity for its financial assets. The table has been drawn up based on the undiscounted contractual maturities of the financial assets including interest that will be earned on those assets. The inclusion of information on financial assets is necessary in order to understand the Group’s liquidity risk management as the liquidity is managed on a net asset and liability basis.
For
per
sona
l use
onl
y

68 MATRIX ANNUAL REPORT 2016|
NOTES TO AND FORMING PART OF THE FINANCIAL STATEMENTS 22. FINANCIAL INSTRUMENTS (CONT...)
LIQUIDITY RISK
Weighted average effective
interest rateLess than
1 month1-3
months3 months to 1 year
1-5 years Total
% $ $ $ $ $
30 June 2016
Cash and other equivalents - 8,403,463 - - - 8,403,463
Trade and other receivables - 6,464,104 3,641,136 15,232,110 1,444,576 26,781,926
Foreign Exchange Contracts - - (177,584) (88,678) - (266,262)
Call/Put Options liability - - - (231,975) - (231,975)
Trade and other payables - (3,415,315) (990,547) - - (4,405,862)
Borrowing 1.72 - - (2,930,811) - (2,930,811)
11,452,252 2,473,005 11,980,646 1,444,576 27,350,479
30 June 2015
Cash and other equivalents - 14,468,450 - - - 14,468,450
Trade and other receivables - 27,287,889 - 6,957,943 - 34,245,832
Foreign currency options - - - 501,615 - 501,615
Foreign Exchange Contracts - (775,807) (579,900) (95,354) - (1,451,061)
Call/Put Options liability - - - (510,556) - (510,556)
Trade and other payables - (6,617,777) (3,686,793) (1,246,782) - (11,551,352)
Borrowing 3.35 - - (4,000,000) (4,000,000) (8,000,000)
Interest Rate Swap Option 3.69 - - (203,294) - (203,294)
34,362,755 (4,266,693) 1,403,572 (4,000,000) 27,499,634
The amounts included above for variable interest rate instruments for both financial assets and liabilities is subject to change if changes in variable interest rates differ to those estimates of interest rates determined at the end of the reporting period.
FAIR VALUE OF FINANCIAL INSTRUMENTSThe Directors consider that the carrying amount of financial assets and liabilities recorded in the financial statements approximates their fair value.
For
per
sona
l use
onl
y

69MATRIX ANNUAL REPORT 2016 |
NOTES TO AND FORMING PART OF THE FINANCIAL STATEMENTS 22. FINANCIAL INSTRUMENTS (CONT...)
FAIR VALUE HIERARCHYFair value measurements recognised in the consolidated statement of financial position.
The following table provides an analysis of financial instruments that are measured subsequent to initial recognition at fair value, Grouped into Levels 1 to 3 based on the degree to which the fair value is observable.
The fair value of the Group’s financial assets and liabilities are determined on the following basis.
FINANCIAL ASSETS AND FINANCIAL LIABILITIES THAT ARE MEASURED AT FAIR VALUE ON A RECURRING BASISSubsequent to initial recognition, at fair value financial instruments are grouped into Levels 1 to 3 based on the degree to which the fair value is observable.
Levels are defined as follows:
• Level 1 fair value measurements are those derived from quoted prices (unadjusted) in active markets for identical assets of liabilities.
• Level 2 fair value measurements are those derived from inputs other than quoted prices included with Level 1 that are observable for the asset or liability, either directly (i.e. as prices) or indirectly (i.e. derived from prices).
• Level 3 fair value measurements are those derived from valuation techniques that include inputs for the asset or liability that are not based on observable market data (unobservable inputs).
The Group has derivative financial assets and liabilities which are classified as level 2 fair value measurements. There were no transfers between level 1 and 2 in the current or prior period.
These level 2 financial assets and liabilities include:
• foreign exchange derivative assets of $501,615 in prior year are valued using discounted cash flow techniques. Under this technique future cash flows are estimated based on forward exchange contract rates (from observable forward exchange contract rates at the end of the reporting period) and contract forward rates, discounted at a rate that reflects the credit risk of the counterparties.
• foreign exchange derivative liabilities of $498,237 (2015: $2,164,911) are valued using discounted cash flow techniques. Under this technique future cash flows are estimated based on forward interest rates (from observable yield curves at the end of the reporting period) and contract interest rates, discounted at a rate that reflects the credit risk of the counterparties.
In neither case are there significant unobservable inputs.
Level 1 Level 2 Level 3 Total
30 June 2016 $ $ $ $
Derivative financial assets - - - -
Derivative financial liabilities - (498,237) - (498,237)
Total - (498,237) - (498,237)
30 June 2015
Derivative financial assets - 501,615 - 501,615
Derivative financial liabilities - (2,164,911) - (2,164,911)
Total - (1,663,296) - (1,663,296)For
per
sona
l use
onl
y

70 MATRIX ANNUAL REPORT 2016|
NOTES TO AND FORMING PART OF THE FINANCIAL STATEMENTS The Group has no significant financial assets and liabilities grouped as level 1 or level 3 fair value measurements.
Financial Assets and Financial Liabilities that are not measured at fair value on a recurring basis (but where fair value disclosures are required)
At balance date, the carrying amount of financial assets and financial liabilities for the Group is considered to approximate their fair values.
23. OPERATING LEASE COMMITMENTS
2016 2015
$ $
Not later than 1 year 2,159,761 1,620,040
Later than 1 year but not later than 5 years 4,540,430 4,203,106
Later than 5 years 30,768,979 28,438,821
The lease commitment relates to land at 150 Quill Way, Henderson. Land and buildings at 42 Truganina Road, Malaga, Karratha and US warehouse.
24. FRANKING ACCOUNT2016 2015
$ $
Franking account balance at 1 July 14,594,111 16,687,218
Franking credits/(debits) that will arise from income tax return amendment refund 92,975 (1,282,632)
Franking debits that will arise from the payment of dividends (402,668) (810,475)
Franking account balance at 30 June 14,284,418 14,594,111
Net franking credits available 14,284,418 14,594,111
25. SHARE-BASED PAYMENTS
SHARE OPTIONSThere have been no share options brought forward, issued or exercised during the year (2015: nil).
LONG TERM INCENTIVE PLANSMatrix has established a long term incentive plan designed to provide the opportunity to employees to acquire Matrix shares and thus assist with:
• attracting, motivating and retaining employees;
• delivering rewards to employees for individuals and Company performance;
• giving employees the opportunity to become shareholders; and
• aligning the interests of employees and shareholder.
The Board is able to grant long term incentive awards to eligible participants, including senior executives. In general, those executives and employees who have capacity to impact the long term performance of the Company will be granted either performance rights or share appreciation rights under the Matrix Rights Plan. Other employees will have the opportunity to acquire shares in Matrix under the Matrix Tax Exempt Share Plan (TESP).
For
per
sona
l use
onl
y

71MATRIX ANNUAL REPORT 2016 |
NOTES TO AND FORMING PART OF THE FINANCIAL STATEMENTS All incentives granted to eligible participants under the Matrix long term incentive plan will only vest on the satisfaction of appropriate vesting conditions. The vesting conditions will be measured and tested over a period of three years.
There are three types of grant under the Rights plan offered to professional staff, senior management and senior executives of the Matrix. The plans are summarised below:
TESPThe TESP is open to all employees not covered by a higher level plan, provided they have two years or more of service with Matrix. The value of shares to be issued under the grant will be not greater than $1,000 and at the absolute discretion of the Board.
Shares issued to employees under the TESP will be tax-exempt in the hands of the employee, not subject to FBT and tax deductible to the Company.
Holders of TESP shares will be entitled to vote at shareholder meetings and participate in dividends and other shareholder distributions. The TESP shares will have a trading restriction which will expire at the earlier of three years from the date of issue or upon the holder ceasing to be employed by Matrix.
MANAGEMENT PERFORMANCE RIGHTS PLAN (MPRP)MPRP will be open to certain professional staff with two or more years’ service with Matrix. Eligible participants will be offered a grant of Performance Rights in dollar value terms up to but not exceeding $2,000. Performance Rights granted under the MPRP will be subject to a vesting condition of a three year service period from beginning of financial year. Upon vesting, the Performance Rights will convert to Matrix fully paid ordinary shares on a one for one basis or the cash equivalent, at the discretion of the Board. Any shares transferred to MPRP participants on conversion of Performance Rights may be acquired either on-market, or by way of a new issue of shares.
EXECUTIVE PERFORMANCE RIGHTS PLAN (EPRP)EPRP will be open to executives who are not participants in the Senior Executive Plan with two or more years’ services with Matrix. Eligible participants will be offered a grant of Performance Rights in dollar value terms up to but not exceeding $10,000. Performance Rights granted under the EPRP will be subject to the following vesting conditions:
• three year service period; and
• Total Shareholder Return (TSR) target based on a TSR comparator group comprising of ASX 300 group of companies as follows:
TSR TARGET ACHIEVED DURING PERFORMANCE PERIOD % OF PERFORMANCE RIGHTS VESTED
75% and over 100%
50 – 75% 50 – 100% of sliding scale
Below 50% Nil
Upon vesting, the Performance Rights will convert to Matrix fully paid ordinary shares on a one for one basis or the cash equivalent, at the discretion of the Board. Any shares transferred to MPRP participants on conversion of Performance Rights may be acquired either on-market, or by way of a new issue of shares.
SENIOR EXECUTIVE PLAN – SENIOR EXECUTIVE PERFORMANCE RIGHTS PLAN (SEPRP) & SENIOR EXECUTIVE SHARE APPRECIATION RIGHTS PLAN (SESARP)Under the SEPRP and SESARP senior executives will be offered an annual dollar value grant in accordance with the terms of their respective Executive Service Agreements, which they may allocate to participate in the SEPRP or the SESARP. A participant may elect to allocate up to a maximum of 50 per cent of the grant entitlement to the SEPRP.
Grants under the SEPRP and SESARP are made on an annual basis.
For
per
sona
l use
onl
y

72 MATRIX ANNUAL REPORT 2016|
NOTES TO AND FORMING PART OF THE FINANCIAL STATEMENTS SEPRPRights granted under the SEPRP will be subject to the following conditions:
• three year service period; and
• TSR target based on a TSR comparator group comprising of ASX 300 group of companies as follows:
TSR TARGET ACHIEVED DURING PERFORMANCE PERIOD % OF PERFORMANCE RIGHTS VESTED
75% and over 100%
50 – 75% 50 – 100% of sliding scale
Below 50% Nil
Upon vesting, the Performance Rights will convert to Matrix fully paid ordinary shares on a one for one basis or the cash equivalent, at the discretion of the Board. Any shares transferred to SEPRP participants on conversion of Performance Rights may be acquired either on-market, or by way of a new issue of shares.
SESARPUnder the SESARP, Share Appreciation Rights (SARs) will be issued to participants. SARs are an entitlement to a number of Shares equal to the growth in value of the underlying Shares, or to receive a cash equivalent value on terms and conditions determined by the Board.
SARs granted under the SEPRP will be subject to the following vesting conditions:
• three year service period; and
• TSR target based on a TSR comparator group comprising of ASX 300 group of companies as follows:
TSR TARGET ACHIEVED DURING PERFORMANCE PERIOD % OF PERFORMANCE RIGHTS VESTED
75% and over 100%
50 – 75% 50 – 100% of sliding scale
Below 50% Nil
Upon vesting of any SARs, participants will be issued with Shares, or the cash equivalent, equal to the value derived by multiplying the number of vested Rights by the growth in share price over the performance period, determined by the Matrix share price growth over and above the hurdle share price. The hurdle share price will be based on the growth rate for the ASX300 Accumulation Index over the five years prior to the grant date of the Rights.
Holders of rights under the SEPRP and SESARP will be not entitled to vote at shareholder meetings or participate in dividends or any other shareholder distributions. The rights are non-transferable however once the vesting condition is met, should shares be issued, there are no additional trading restrictions in relation to the shares. Should the rights have been converted into shares these shareholders will be entitled to vote at shareholder meetings and participate in dividends and other shareholder distributions.
The rights are not taxable in the hands of the employees until the vesting conditions are met. At this point the value is crystallised and subject to income tax in the employees hands. The value of the rights is only tax deductible to Matrix at the point of vesting even though it is an expense for accounting (amortised over the three year vesting period) at the point of granting.F
or p
erso
nal u
se o
nly

73MATRIX ANNUAL REPORT 2016 |
NOTES TO AND FORMING PART OF THE FINANCIAL STATEMENTS SHARE RIGHTS IN EXISTENCE IN THE YEAR
The following share-based payment arrangements were in existence during the current and prior reporting periods:
SERIES
GRANT DATE
GRANT DATE
FAIR VALUE $
VALUE $
HURDLE GROWTH
RATE
HURDLE PRICE
EXPIRY DATE
VESTING DATE
FY14 SEPRP 29 Jul 2015 0.44 0.09 n/a n/a 14 Sep 2017 14 Sep 2017
FY14 SESARP 29 Jul 2015 0.44 0.02 8.25% $1.39 14 Sep 2017 14 Sep 2017
There has been no alteration of the terms and conditions of the above share based payment arrangements since the grant date.
FAIR VALUE OF SHARE RIGHTS GRANTED IN THE YEARThe Performance Rights and Share Appreciation Rights contemplated by the Rights Plan have been subject to valuation reports by Ernst & Young dated 19 August 2015 and 19 October 2015 respectively. The valuations were adopted by the Directors of the Company.
The valuation used a Monte-Carlo simulation as the appropriate methodology to value the rights granted under the SEPRP and SESARP. A Monte-Carlo simulation is a highly flexible valuation technique which can cope with a variety of award structures and is often used where instruments have more than one hurdle. The key assumptions adopted when valuing the rights is set out below:
SERIES FY14 MPRP
FY14 EPRP
FY15 MPRP
FY15 EPRP/SEPRP
FY15 SESARP
Grant date 11 Sep 2015 11 Sep 2015 16 Sep 2015 16 Sep 2015 16 Sep 2015
Vesting date 28 Sep 2017 28 Sep 2017 16 Sep 2018 16 Sep 2018 16 Sep 2018
Share price at grant $0.44 $0.44 $0.46 $0.46 $0.46
Value $0.40 $0.09 $0.39 $0.27 $0.11
Hurdle Growth Rate n/a n/a n/a n/a 6.53%
Hurdle Price n/a n/a n/a n/a $0.53
Expected life 2 years 2 years 3 years 3 years 3 years
Volatility 55% 55% 55% 55% 55%
Risk free interest rate 1.85% 1.85% 1.94% 1.94% 1.94%
Dividend yield 4.1% 4.1% 4.3% 4.3% 4.3%
For
per
sona
l use
onl
y

74 MATRIX ANNUAL REPORT 2016|
NOTES TO AND FORMING PART OF THE FINANCIAL STATEMENTS MOVEMENTS IN SHARE PLANS DURING THE YEARThe following table reconciles the share plans outstanding at the beginning and end of the year:
MPRP
2016 BALANCE AT BEGINNING
OF THE YEAR NO.
GRANTED DURING
THE YEAR NO.
FORFEITED DURING
THE YEAR NO.
EXERCISED DURING
THE YEAR NO.
LAPSED DURING
THE YEAR NO.
BALANCE AT END OF THE YEAR
NO.
FY14 MPRP - 47,426 - - - 47,426
FY15 MPRP - 338,448 - - - 338,448
Total - 385,874 - - - 385,874
EPRP
2016 BALANCE AT BEGINNING
OF THE YEAR NO.
GRANTED DURING
THE YEAR NO.
FORFEITED DURING
THE YEAR NO.
EXERCISED DURING
THE YEAR NO.
LAPSED DURING
THE YEAR NO.
BALANCE AT END OF THE YEAR
NO.
FY14 EPRP - 145,161 - - - 145,161
FY15 EPRP - 418,518 - - - 418,518
Total - 563,679 - - - 563,679
SESARP
2016 BALANCE AT BEGINNING
OF THE YEAR NO.
GRANTED DURING
THE YEAR NO.
FORFEITED DURING
THE YEAR NO.
EXERCISED DURING
THE YEAR NO.
LAPSED DURING
THE YEAR NO.
BALANCE AT END OF THE YEAR
NO.
FY14 SESARP 796,296 - - - - 796,296
FY15 SESARP - 3,727,272 - - - 3,727,272
Total 796,296 3,727,272 - - - 4,523,568
SEPRP
2016 BALANCE AT BEGINNING
OF THE YEAR NO.
GRANTED DURING
THE YEAR NO.
FORFEITED DURING
THE YEAR NO.
EXERCISED DURING
THE YEAR NO.
LAPSED DURING
THE YEAR NO.
BALANCE AT END OF THE YEAR
NO.
FY14 SEPRP 88,709 - - - - 88,709
Total 88,709 - - - - 88,709For
per
sona
l use
onl
y

75MATRIX ANNUAL REPORT 2016 |
NOTES TO AND FORMING PART OF THE FINANCIAL STATEMENTS 26. RELATED PARTY DISCLOSURES
(A) KEY MANAGEMENT PERSONNEL COMPENSATION
2016 2015
$ $
Short term employment benefits 2,039,129 1,687,405
Share based payments 88,539 7,970
Post-employment benefits 125,537 117,392
2,253,205 1,812,767
(B) PARENT ENTITYThe ultimate parent entity within the Group is Matrix Composites & Engineering Ltd.
(C) RELATED PARTY TRANSACTIONS Transactions between related parties are at arms-length terms.
2016 2015
$ $
The premise at 42 Truganina Road is leased from Kanu Pty Ltd, a company of which Maxwell Begley is a substantial shareholder. Mr Begley and his associated parties have a substantial shareholding in Matrix.
371,588 370,767
(D) OPTION HOLDINGS OF KEY MANAGEMENT PERSONNEL There have been no movements during the reporting period (2015: nil movement) in the number of options over ordinary shares in Matrix Composites & Engineering Ltd held, directly, indirectly or beneficially, by each key management person, including related parties.
(E) KEY MANAGEMENT PERSONNEL• There were no loans to key management personnel during the year or outstanding at the end of the year (2015: nil).
• No options have been issued to key management personnel during the year (2015: nil).
(F) OTHER TRANSACTIONS AND BALANCES WITH KEY MANAGEMENT PERSONNELThere were no other transactions with key management personnel at the end of the year (2015: nil).
For
per
sona
l use
onl
y

76 MATRIX ANNUAL REPORT 2016|
NOTES TO AND FORMING PART OF THE FINANCIAL STATEMENTS 27. SUBSIDIARIES The consolidated financial statements include the following subsidiaries:
Name Incorporation Shares Equity Holding %
2016 2015
Specialist Engineering Services (Aust) Pty Ltd Australia Ordinary 100 100
Drilling Solutions Pty Ltd¹ Australia Ordinary 99 99
Matrix Henderson Property Pty Ltd Australia Ordinary 100 100
MC&E (Europe) Limited UK Ordinary 100 100
Matrix Composites & Engineering (US) Inc. USA Ordinary 100 100
MCE (Asia) Pte. Ltd.² Singapore Ordinary 100 -
1 This entity is owned by Specialist Engineering Services (Aust) Pty Ltd. During the year application was made to deregister this entity. 2 This entity commenced operation on 5 February 2016.
For
per
sona
l use
onl
y
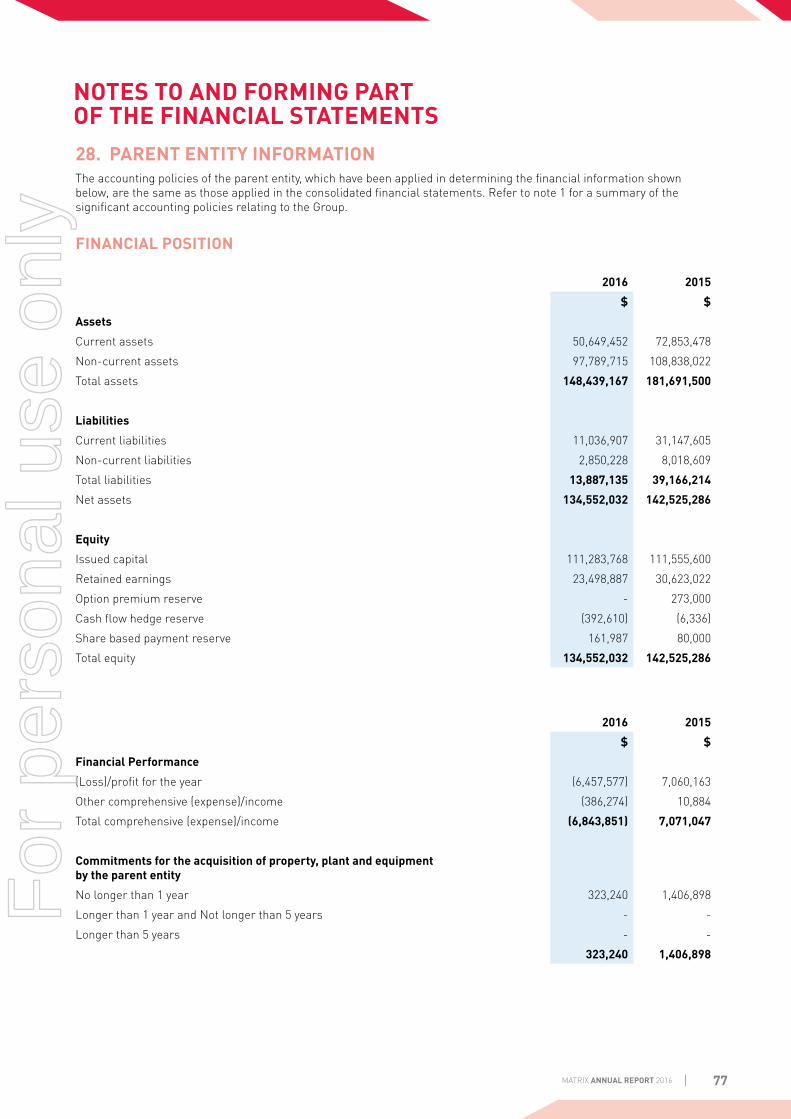
77MATRIX ANNUAL REPORT 2016 |
NOTES TO AND FORMING PART OF THE FINANCIAL STATEMENTS 28. PARENT ENTITY INFORMATIONThe accounting policies of the parent entity, which have been applied in determining the financial information shown below, are the same as those applied in the consolidated financial statements. Refer to note 1 for a summary of the significant accounting policies relating to the Group.
FINANCIAL POSITION
2016 2015
$ $
Assets
Current assets 50,649,452 72,853,478
Non-current assets 97,789,715 108,838,022
Total assets 148,439,167 181,691,500
Liabilities
Current liabilities 11,036,907 31,147,605
Non-current liabilities 2,850,228 8,018,609
Total liabilities 13,887,135 39,166,214
Net assets 134,552,032 142,525,286
Equity
Issued capital 111,283,768 111,555,600
Retained earnings 23,498,887 30,623,022
Option premium reserve - 273,000
Cash flow hedge reserve (392,610) (6,336)
Share based payment reserve 161,987 80,000
Total equity 134,552,032 142,525,286
2016 2015
$ $
Financial Performance
(Loss)/profit for the year (6,457,577) 7,060,163
Other comprehensive (expense)/income (386,274) 10,884
Total comprehensive (expense)/income (6,843,851) 7,071,047
Commitments for the acquisition of property, plant and equipment by the parent entity
No longer than 1 year 323,240 1,406,898
Longer than 1 year and Not longer than 5 years - -
Longer than 5 years - -
323,240 1,406,898
For
per
sona
l use
onl
y

78 MATRIX ANNUAL REPORT 2016|
NOTES TO AND FORMING PART OF THE FINANCIAL STATEMENTS 29. EARNINGS PER SHARE
2016 2015
(Loss)/profit attributable to members of parent entity ($) (2,114,028) 3,633,828
Weighted average number of shares on issue (number) 94,123,725 94,504,583
Weighted average number of shares adjusted for dilution (number) 94,123,725 94,504,583
Basic (loss)/profit per share (cents) (2.2) 3.8
Diluted (loss)/profit per share (cents) (2.2) 3.8
30. DIVIDENDS PAID AND PROPOSED
Year Ended 30 June 2016 Year Ended 30 June 2015
Recognised amounts Cents per share
Total $
Cents per share
Total $
Fully paid ordinary shares
Interim dividend - - 2.0 1,891,109
Final dividend 1.0 939,558 - -
939,558 1,891,109
Unrecognised amounts
Fully paid ordinary shares
Final dividend - - 1.0 939,558
31. CAPITAL AND OTHER COMMITMENTS The Group has entered into capital commitments of $323,240 for plant & equipment at 30 June 2016 (2015: $1,406,898).
32. COMPANY DETAILSThe registered office and principal place of business of the company is 150 Quill Way, Henderson, Western Australia.
33. CONTINGENT LIABILITIES AND ASSETSThere were no contingent liabilities or assets at 30 June 2016.
34. EVENTS AFTER THE REPORTING DATEThere are no other events of a material nature that have occurred subsequent to the reporting date other than the matters disclosed in directors’ report.
For
per
sona
l use
onl
y

79MATRIX ANNUAL REPORT 2016 |
DIRECTORS’ DECLARATIONThe directors declare that:
(a) in the directors’ opinion, there are reasonable grounds to believe that the company will be able to pay its debts as and when they become due and payable;
(b) in the directors’ opinion, the attached financial statements are in compliance with International Financial Reporting Standards, as stated in note 1 to the financial statements;
(c) in the directors’ opinion, the attached financial statements and notes thereto are in accordance with the Corporations Act 2001, including compliance with accounting standards and giving a true and fair view of the financial position and performance of the consolidated entity; and
(d) the directors have been given the declarations required by s.295A of the Corporations Act 2001.
Signed in accordance with a resolution of the directors made pursuant to s.295(5) of the Corporations Act 2001.
This declaration is made in accordance with a resolution of the Board of Directors:
Aaron P Begley
Managing Director and Chief Executive Officer
Dated 24 August 2016
For
per
sona
l use
onl
y

80 MATRIX ANNUAL REPORT 2016|
INDEPENDENT AUDITORS’ REPORT
Report on the Financial Report
We have audited the accompanying financial report of Matrix Composites & Engineering Ltd, which comprises the consolidated statement of financial position as at 30 June 2016, the consolidated statement of profit or loss and other comprehensive income, the consolidated statement of cash flows and the consolidated statement of changes in equity for the year ended on that date, notes comprising a summary of significant accounting policies and other explanatory information, and the directors’ declaration of the consolidated entity comprising the company and the entities it controlled at the year’s end or from time to time during the financial year as set out on pages 31 to 79.
Directors’ Responsibility for the Financial Report
The directors of the company are responsible for the preparation of the financial report that gives a true and fair view in accordance with Australian Accounting Standards and the Corporations Act 2001 and for such internal control as the directors determine is necessary to enable the preparation of the financial report that gives a true and fair view and is free from material misstatement, whether due to fraud or error. In Note 1, the directors also state, in accordance with Accounting Standard AASB 101 Presentation of Financial Statements , that the consolidated financial statements comply with International Financial Reporting Standards.
Auditor’s Responsibility
Our responsibility is to express an opinion on the financial report based on our audit. We conducted our audit in accordance with Australian Auditing Standards. Those standards require that we comply with relevant ethical requirements relating to audit engagements and plan and perform the audit to obtain reasonable assurance whether the financial report is free from material misstatement.
An audit involves performing procedures to obtain audit evidence about the amounts and disclosures in the financial report. The procedures selected depend on the auditor’s judgement, including the assessment of the risks of material misstatement of the financial report, whether due to fraud or error. In making those risk assessments, the auditor considers internal control, relevant to the entity’s preparation of the financial report that gives a true and fair view, in order to design audit procedures that are appropriate in the circumstances, but not for the purpose of expressing an opinion on the effectiveness of the entity’s internal control. An audit also includes evaluating the appropriateness of accounting policies used and the reasonableness of accounting estimates made by the directors, as well as evaluating the overall presentation of the financial report.
We believe that the audit evidence we have obtained is sufficient and appropriate to provide a basis for our audit opinion.
Liability limited by a scheme approved under Professional Standards Legislation.
Member of Deloitte Touche Tohmatsu Limited
Deloitte Touche Tohmatsu ABN 74 490 121 060
Tower 2 Brookfield Place 123 St Georges Terrace Perth WA 6000 GPO Box A46 Perth WA 6837 Australia
Tel: +61 8 9365 7000 Fax: +61 8 9365 7001 www.deloitte.com.au Independent Auditor’s Report
to the members of Matrix Composites & Engineering Ltd
For
per
sona
l use
onl
y

81MATRIX ANNUAL REPORT 2016 |
INDEPENDENT AUDITORS’ REPORT
Auditor’s Independence Declaration
In conducting our audit, we have complied with the independence requirements of the Corporations Act 2001. We confirm that the independence declaration required by the Corporations Act 2001, which has been given to the directors of Matrix Composites & Engineering Ltd, would be in the same terms if given to the directors as at the time of this auditor’s report.
Opinion
In our opinion:
(a) the financial report of Matrix Composites & Engineering Ltd is in accordance with theCorporations Act 2001, including:
(i) giving a true and fair view of the consolidated entity’s financial position as at 30 June 2016and its performance for the year ended on that date; and
(ii) complying with Australian Accounting Standards and the Corporations Regulations 2001; and
(b) the consolidated financial statements also comply with International Financial ReportingStandards as disclosed in Note 1.
Report on the Remuneration Report
We have audited the Remuneration Report included in pages 18 to 29 of the directors’ report for the year ended 30 June 2016. The directors of the company are responsible for the preparation and presentation of the Remuneration Report in accordance with section 300A of the Corporations Act 2001. Our responsibility is to express an opinion on the Remuneration Report, based on our audit conducted in accordance with Australian Auditing Standards.
Opinion
In our opinion the Remuneration Report of Matrix Composites & Engineering Ltd for the year ended 30 June 2016, complies with section 300A of the Corporations Act 2001.
DELOITTE TOUCHE TOHMATSU
John Sibenaler Partner Chartered Accountants Perth, 24 August 2016
For
per
sona
l use
onl
y

82 MATRIX ANNUAL REPORT 2016|
ADDITIONAL STOCK EXCHANGE INFORMATIONAS AT 8 SEPTEMBER 2016
ORDINARY SHARE CAPITAL93,750,000 fully paid ordinary shares are held by 2,693 individual shareholders. All issued shares carry one vote per share and are entitled to dividends.
DISTRIBUTION OF HOLDERS OF EQUITY SECURITIES
RANGE FULLY PAID ORDINARY SHARES NUMBER OF HOLDERS % OF ISSUED CAPITAL
100,001 and Over 75,793,622 72 80.85
10,001 to 100,000 12,775,947 419 13.63
5,001 to 10,000 2,241,930 286 2.39
1,001 to 5,000 2,469,656 944 2.63
1 to 1,000 468,845 972 0.50
Total 93,750,000 2,693 100.00
UNMARKETABLE PARCELSThere were 1,038 members holding less than a marketable parcel of shares in the company.
TWENTY (20) LARGEST HOLDERS OF QUOTED EQUITY SECURITIES
FULLY PAID ORDINARY SHARES
RANK NAME NUMBER % OF ISSUED CAPITAL
1 Milto Pty Ltd 16,729,702 17.85
2 National Nominees Limited 11,326,661 12.08
3 J P Morgan Nominees Australia Limited 8,615,791 9.19
4 Hsbc Custody Nominees (Australia) Limited 6,690,301 7.14
5 Citicorp Nominees Pty Limited 6,302,816 6.72
6 Mr Aaron Paul Begley 3,062,763 3.27
7 Bond Street Custodians Limited 1,895,886 2.02
8 Mr Maxwell Graham Begley 1,610,308 1.72
9 Milto Pty Ltd 1,553,295 1.66
10 Citicorp Nominees Pty Limited 1,291,607 1.38
11 Milto Pty Ltd 1,176,027 1.25
12 Begley Superannuation Co Pty Ltd 764,584 0.82
13 Mr Paul Richard Wright & Mrs Karen Bronwyn Wright 616,994 0.66
14 Fortress Enterprises Pty Ltd 553,333 0.59
15 Mr Todd Justin Begley 550,000 0.59
16 Mr Craig Neil Duncan 535,214 0.57
17 RACT Super Pty Ltd 500,000 0.53
18 Mr Peter Lindsay Wright 485,859 0.52
19 Mr Leslie Kroll 444,236 0.47
20 Mr Jonathon Michael Riley 415,925 0.44
Total 65,121,302 69.47
For
per
sona
l use
onl
y

83MATRIX ANNUAL REPORT 2016 |
ADDITIONAL STOCK EXCHANGE INFORMATION
SUBSTANTIAL SHAREHOLDERSThe names of substantial shareholders which have notified the Company in accordance with section 671B of the Corporations Act 2001 are:
FULLY PAID ORDINARY SHARES
SHAREHOLDER NUMBER %
1 M.G Begley & Associates 22,870,160 24.39%
2 Allan Gray Australia 17,097,845 18.24%
3 Forager Funds Management Pty Ltd 7,994,870 8.53%
4 IOOF Holdings Limited 6,454,972 6.89%
COMPANY SECRETARYMr Adam Santa Maria
REGISTERED AND PRINCIPAL ADMINISTRATION OFFICE150 Quill Way Henderson WA 6166
Phone: +61 8 9412 1200
SHARE REGISTRYLink Market Services Ltd Level 4 Central Park 152-158 St Georges Terrace Perth WA 6000
Phone: + 61 8 9211 6670
ON-MARKET SHARE BUY-BACKThe Company concluded an on-market buy back scheme on 5 March 2016.
RESTRICTED SECURITIESThere are no securities subject to any voluntary escrow or any transfer restrictions.
For
per
sona
l use
onl
y

This page intentionally left blank.
For
per
sona
l use
onl
y

Annual Report 2016
matrix-corp.org
For
per
sona
l use
onl
y