Embed Size (px)
Citation preview

Annual Report 2017
Stud
svik An
nu
al Rep
ort 2017
Studsvik AB (publ)SE 611 82 NyköpingTelephone: +46 155 22 10 00www.studsvik.com

ANNUAL GENERAL MEETING OF SHAREHOLDERS, APRIL 25, 2018
The Annual General Meeting will be held in Stockholm, World Trade Center, Klarabergsviadukten 70 / Kungsbron 1, on
Wednesday, April 25, 2018, at 16.00.
NotificationShareholders wishing to participate must be registered in the share register kept by Euroclear Sweden AB by Thursday, April 19,
2018, and must give notification of their intention to attend by Thursday, April 19 at the latest.
• via Studsvik’s website, www.studsvik.se.
• by telephone +46 155 22 10 25,
• by mail to Studsvik AB, SE-611 82 Nyköping, Sweden,
• by email to [email protected], or
• by fax +46 155 26 30 70
The shareholder’s notification should state
• name
• personal/corporate identity number
• address and telephone number
• number of shares
For entitlement to vote at the Annual General Meeting, shareholders with nominee-registered holdings must apply to the
bank or broker managing their shares for temporary re-registration a couple of banking days before Thursday, April 19, 2018.
Nomination CommitteeStudsvik’s Nomination Committee consists of:
• Sven Ericsson, representative of the Karinen family (chair)
• Stina Barchan, Briban Invest AB
• Carina Heilborn, Peter Gyllenhammar AB
• Anders Ullberg, Chairman of the Board
The task of the Nomination Committee is to submit proposals to the Annual General Meeting of Shareholders regarding
election of the Board of Directors, auditors and alternate auditors and their fees.
FORTHCOMING FINANCIAL INFORMATION 2018
• Report on the first quarter as at March 31 April 25, 2018
• Report on first half year as at June 30 July 20, 2018
• Report on the three first quarters as at September 30 October 22, 2018
• Year-end report 2018 February 2019
• Annual report 2018 April 2019
The reports will be available at www.studsvik.com on the publication dates.
Information to shareholders
Studsvik AB (publ) Annual Report 2017 Corporate identity number 556501-0997
© Studsvik AB (publ)
Worldwide
SVERIGEStudsvik ABSE 611 82 NyköpingVisiting address: StudsvikTel: +46 155 22 10 00Fax: + 46 155 26 30 70
Studsvik Nuclear ABSE 611 82 NyköpingVisiting address: StudsvikTel: + 46 155 22 10 00Fax: + 46 155 26 30 70
Studsvik Consulting ABSE 611 82 NyköpingTel: + 46 155 22 10 00Fax: + 46 155 26 30 70
Studsvik Nuclear AB /ALARA EngineeringStensborgsgatan 4SE 721 32 VästeråsTel: + 46 155 22 10 00
Studsvik Scandpower ABStensborgsgatan 4SE 721 32 VästeråsTel: + 46 021 41 57 83
FRANCE Studsvik France SAS166, Boulevard du MontparnasseF-75014 ParisFrance Tel: +33 1 4279 5130 Fax: +33 1 4279 5131
UNITED ARAB EMIRATESStudsvik Ltd. Middle Eastc/o UMG, Sky Tower, #604, Reem IslandAbu Dhabi, United Arab EmiratesTel: +971 2 6777102Fax: +971 2 6777108
JAPANStudsvik Japan, LtdRinku Gate Tower Building 1409,1 Rinku Oraikita, Izumisano-city,Osaka, 598-0048 JapanTel / Fax: +81 (0)72 493 7418
CHINAStudsvik Scandpower Inc.,Room 2501, Tower 3888 Yu Yuan RoadChang Ning District,Shanghai, 200050, ChinaTel +86 13524572096
SWITZERLANDStudsvik Suisse AGSchlösslistrasse 12,CH-5408 Ennetbaden,SchweizTel: + 41 79 501 42 08
UNITED KINGDOMStudsvik LtdRibble HouseMeany GateBamber Bridge, Preston, PR5 6UP, United KingdomTel: +44 (0) 1772 646880Fax: +44 (0) 1772646899
GERMANYStudsvik Scandpower GmbHRathausallee 28DE-22846 NorderstedtTysklandTel: +49 40 3098 088 10Fax: +49 40 3098 088 88
Studsvik GmbH & Co. KGWalter-Krause-Str. 11DE-68163 MannheimTysklandTel: + 49 (0) 621 950 403 01Fax: + 49 (0) 621 950 403 02
USAStudsvik Scandpower, Inc.101 North Third Street, Suite 202Wilmington, NC 28401 USATel: +1 910 777 2553Fax: + 1 910 769 3249
Studsvik, Inc.5605 Glenridge Dr Suite 705Atlanta, GA 30342USATel: +1 404 497 4900Fax: +1 404 497 4901

STUDSV IK AB (PUBL ) ANNUAL REPORT 2017
ADMINISTRATION REPORT 1
Contents
Facts about Studsvik 3
President's comments 4
Administration report 7
Fuel and Materials Technology 11
Consultancy Services 12
Studsvik Scandpower 15
Sustainability report 19
Risk management 26
Proposed distribution of profit 28
The Studsvik Share 28
Financial statements 30
Group 30
Parent company 34
Notes to the consolidated accounts 38
Notes to the parent company accounts 62
Auditor's report 67
Corporate Governance 70
Board of Directors and Auditors 74
Executive Group Management 76
Five-year review 78
Definitions of key figures and ratios 80
STUDSV IK AB (PUBL ) ANNUAL REPORT 2017
2 ADMINISTRATION REPORT

STUDSV IK AB (PUBL ) ANNUAL REPORT 2017
ADMINISTRATION REPORT 3
Facts about Studsvik
THIS IS STUDSVIKWe supply innovative technical solutions that create value by improving reactor performance and reducing both risks and costs for our customers throughout the entire lifecycle for the nuclear and radiological sector.
CREATING VALUEOur services include advanced engineering and consultancy services, fuel and materials testing, fuel optimization software and core monitoring, as well as management of nuclear risks and radiation risks throughout the entire lifecycle, decommissioning of nuclear power facilities and methods for radioactive waste management. We support our customers along the way to the long-term goal of delivering reliable and more sustainable energy to the world’s growing population.
Studsvik is divided into three business areas: Fuel and Materials Technology, Consultancy Services and Studsvik Scandpower, as well as having a managerial staff function for the Group.
THE COMPANYThe Studsvik company was established in Studsvik, which is situated on the Baltic Sea outside Nyköping, a hundred kilometers south of Stockholm. Studsvik has continued to develop in the past 70 years and today is a global company with offices in Sweden, Germany, the United Kingdom, the USA, Japan, China and the United Arab Emirates.
We are a global actor with 700 employees, helping customers throughout the world and at all stages of the reactor life cycle. We attract the industry’s best and most competent employees, who are experts in their respective fields.
2017 IN BRIEF • Agreement with Dynatech in China on FBSR licenses• Camilla Hoflund appointed as new President/CEO• More efficient organization• Isotope agreement with Elekta worth more than
SEK 400 million• Agreement on final settlement with EDF for the sale of the
Waste Treatment business area in 2016
STUDSVIK'S VISION"Leading innovation for sustainable nuclear solutions"Our long-term goal and vision is to be at the forefront of innovation, giving sustainable solutions. We work closely with our customers to achieve this.
Studsvik's endeavor is to always be at the forefront of inno-vative solutions that improve efficiency and increase safety in nuclear power plants while contributing to a more sustainable energy supply. We supply the international radiological market with the latest technology, analyses and material tests, as well as consultancy services that pave the way for new solutions in future nuclear technology.
OUR MARKETSStudsvik supports customers in the global nuclear power sector as well as the environmental sector and other industries that manage radiological issues. Studsvik is an international company, supporting customers around the world – in Europe, North America, Asia with Japan and China as well as the Middle East.
Studsvik mainly works in the nuclear power sector and assists various types of customer at all stages of the reactor and fuel life cycle. In addition, there are a number of industries that do not belong to the nuclear power sector, that nevertheless use, produce or handle radioactive material as part of their core activities. For example they may use radioactive sources or manage waste from mineral extraction or similar processes, called NORM waste (natu-rally occurring radioactive material). Studsvik has long experience of applying its technical knowledge for efficient and safe manage-ment of radioactivity and radioactive material, either from the nuclear power sector or naturally occurring as a result of other environmental activity. Our customers can safely concentrate on their core activities in the knowledge that Studsvik will deal smoothly and effectively with matters concerning radioactivity.
PRODUCTS AND SERVICESStudsvik offers its customers a number of technical specialist services. We develop, sell and deliver innovative technical solu-tions that create value by improving efficiency and reducing risks.
Our offer includes advanced engineering and consultancy services, fuel and materials testing, software for fuel optimization and core monitoring, as well as management of nuclear radiation risks throughout the entire reactor lifecycle, decommissioning of nuclear power plants and method design for management of radioactive waste.
CUSTOMER VALUEStudsvik focuses on creating value for customers. Customer collabo-ration starts with our establishing detailed insight into the customers' needs, operations and methods to then consult with them to develop special technical solutions that improve efficiency, increase lifespan or create conditions for alternative, more effective solutions.
Key figures 2017 2016
Sales, SEK million 704.8 758.8
Operating profit, SEK million –41.6 24.7
Profit/loss after net financial items, SEK million –58.7 –0.5
Earnings per share, SEK –5.47 0.99
Operating margin, % –5.9 3.2
Debt/equity ratio, % 35.1 0.8
Equity per share, SEK 35.09 42.41
Average number of employees 662 687
1) Net financial items and the translation difference in Other comprehensive income for 2016 have been adjusted for comparability. Net financial items for 2016 thus deteriorated by SEK 8.9 million and the translation difference improved by SEK 8.9 million.

STUDSV IK AB (PUBL ) ANNUAL REPORT 2017
4 ADMINISTRATION REPORT
Customer focused future
2017 was a demanding and challenging year for us and several of our customers. The market is undergoing great change, leading to uncertainty and prolonged decision processes. For us this is reflected in the year’s weak sales, earnings and cash flow. In our domestic markets, Europe and the USA, electricity prices are low and nuclear power plants are implementing extensive cost sav-ings while customers in Sweden and Germany are preparing for the decommissioning of a large number of nuclear power plants. In Asia, China in particular is continuing its extensive investment in carbon free electric energy, where nuclear power and renewa-ble energy sources are rapidly replacing coal power. For us this means that we must present solutions based on our skills that show we understand and meet our customers’ needs in all phas-es, from planning of new nuclear power plants to decommission-ing and final disposal. Consequently, we provide solutions for high safety and efficient operation, such as fuel optimization, increased lifespan and sustainable management of operational waste to the nuclear power industry. In parallel with this, we are increasing our initiatives in relation to other industries that handle radioactivity or use radioactive material in their products.
A stoppage at the Studsvik facility had a negative impact on Fuel and Materials Technology. The shutdown lasted from September to November and impacted earnings by about SEK 12 million. At the same time, incoming material deliveries were delayed due to time-consuming decision processes. No orders were lost, demand for the services provided by Fuel and Materials Technology continues to be high and the order situation for 2018 is strong. In addition, in 2018 we will be installing and bringing into operation the production line for automated delivery of medical isotopes. Studsvik has a long history of supplying isotopes in the period when the research reactor was in operation and is now resuming operations in this area.
Consultancy Services is successfully continuing work on FBSR technology (Fluid Bed Steam Reforming). In 2017 a cooperation agreement was signed for the Chinese market and work on local feasibility studies was started. We have previously sold licenses for construction of one facility in the USA and one in France. We also consider that we are well-placed for success in Japan through our joint venture with Kobe Steel. The work of eliminat-ing low-margin business in England and Sweden as well as rising demand for advanced engineering services in the USA in combi-nation contributed to reduced losses in the underlying consultan-cy operations. Earnings in the operations in Germany deteriorat-ed, however, during the year due to weak demand in low-margin services such as operational and outage support, while a staff shortage in advanced engineering services meant that we could not fully meet customers’ needs. We are taking further measures to ensure profitability in Germany while we evaluate alternative strategies. In 2018 the business area will continue to focus on international sales of FBSR technology and sales of advanced consultancy services from England, Sweden and the USA.
In 2017 Studsvik Scandpower conducted far-reaching negotiations with a number of customers on the sale of new licenses for software and related services. However, customers’ decision processes tend to be more and more prolonged and software sales were therefore lower in 2017 than the previous year. The business area manage-ment is making changes with a focus on customers’ needs for safe and efficient handling of fuel during production and during intermediate storage and final disposal.
In December 2017 we signed an agreement with EDF on final settlement for the sale of Waste Treatment operations in 2016. The agreement did not impact earnings and the SEK 20 million deposited in a blocked account was released in January 2018.
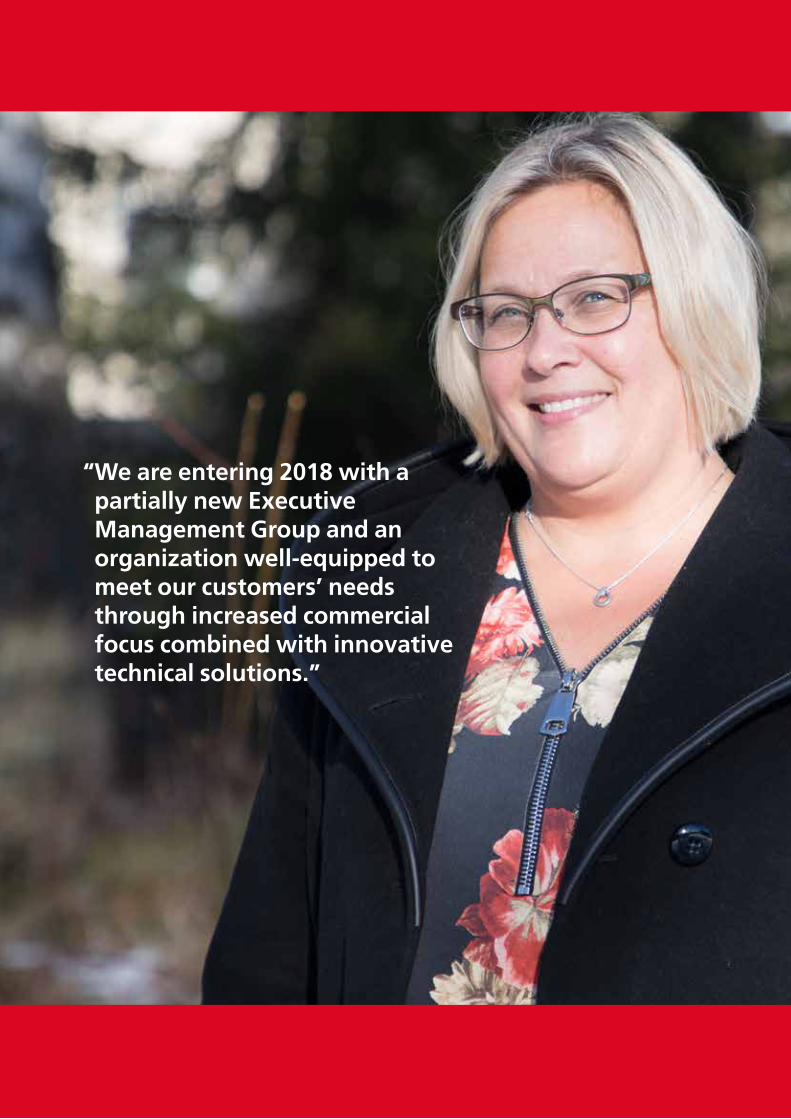
We are entering 2018 with a partially new Executive Manage-ment Group and an organization well-equipped to meet our customers’ needs through increased commercial focus combined with innovative technical solutions. Despite setbacks in 2017 we are a company undergoing positive change. We work systema-tically to develop our employees, while adding new competencies through external recruitment.
Demand in the energy sector in our home markets is still charac terized by weak profitability and transition from operations to decommissioning. There is a need for our services in this market, and at the same time we see rising demand for our services in new markets in Asia and the Middle East and in related product and service areas. Opportunities are opening on new markets, for example testing and qualification of fuel and reactor design, operating efficiency, waste treatment and design of inter-mediate storage and final repositories.
In 2018 we will focus on delivering value to our customers through:• Risk minimization based on more than 70 years’ cumulative
international experience• Personal commitment through long-term customer relations• Safe, efficient and profitable solutions
Successful delivery of these customer values leads to satisfied cus-tomers, motivated staff, positive earnings and a positive cash flow.
The three principles developed in this year’s sustainability report: develop sustainable solutions, be an attractive employer and take responsible economic decisions, can be directly linked to our vision: Leading innovation for sustainable nuclear solutions. And that is our main task in 2018; to provide sustainable solutions to our customers’ problems.
Stockholm, February 2018Camilla Hoflund
STUDSV IK AB (PUBL ) ANNUAL REPORT 2017
ADMINISTRATION REPORT 5
“ We are entering 2018 with a partially new Executive Management Group and an organization well-equipped to meet our customers’ needs through increased commercial focus combined with innovative technical solutions.”

STUDSV IK AB (PUBL ) ANNUAL REPORT 2017
6 ADMINISTRATION REPORT
STUDSV IK AB (PUBL ) ANNUAL REPORT 2017
ADMINISTRATION REPORT 7
BUSINESS ACTIVITIES OF THE GROUP Studsvik delivers services to the international nuclear power industry. Its customers are mainly nuclear power plants and suppliers to the nuclear industry. Studsvik's operations are conducted at its own facilities in Sweden and at customer sites. The services cover the entire life cycle of the nuclear power plants as regards waste management, consultancy services and fuel optimization and issues related to fuel and construction materials.
The company’s share is listed on NASDAQ Stockholm.
MARKETDemand in Europe is characterized by short-term cost savings at the plants in operation, while customers in Sweden and Germany prepare for future decommissioning. The American market is also characterized by restraint due to the “Nuclear Promise” efficiency-improvement program agreed on by the actors. In Asia market development continues to be positive, mainly driven by major initi-atives in China at the same time as demand for our services in Japan is recovering. We are also seeing a continued rise in demand for our consultancy services in the Middle East. Global demand for electricity is still expected to grow by more than 30 per cent in the next 25 years, mainly in non-OECD countries where demand from Asia, and mainly China, makes up a considerable part. The positive development, with a growing percentage of renewable and nuclear electricity, is continuing at the expense of fossil fuels.
The overall conditions for nuclear power are to a great extent governed by national decisions based on each country’s economic situation, energy supply, environmental guidelines and public acceptance of nuclear power. Many governments see nuclear power as a reliable source of energy with low carbon dioxide emissions. Nuclear power is also seen as a way to balance dependence on energy imports from other countries, which leads to reduced economic and political risks. In addition to this, the economic conditions for nuclear power are governed by other factors, such as energy prices, financing costs and costs of safety and waste management.
With the prevailing low energy prices the market is focusing on continuing to reduce costs, extend lifespan and increase output while the work of planning for future decommissioning, especially in Sweden and Germany, is increasing. All in all, this means that demand for such services as fuel optimization, management of spent nuclear fuel and consultancy services related to decommissioning is expected to increase.
STUDSVIK'S MARKET POSITIONStudsvik offers services to the global nuclear power industry but also to other industries that deal with radioactivity and radioactive material.
We develop, sell and deliver innovative technical solutions that create considerable added value by optimizing operation and reducing risks. We offer innovative solutions for all phases of the life cycle of reactor fuel and nuclear power plants; from research and development, design and operation, to decommissioning, dismantling and waste treatment.
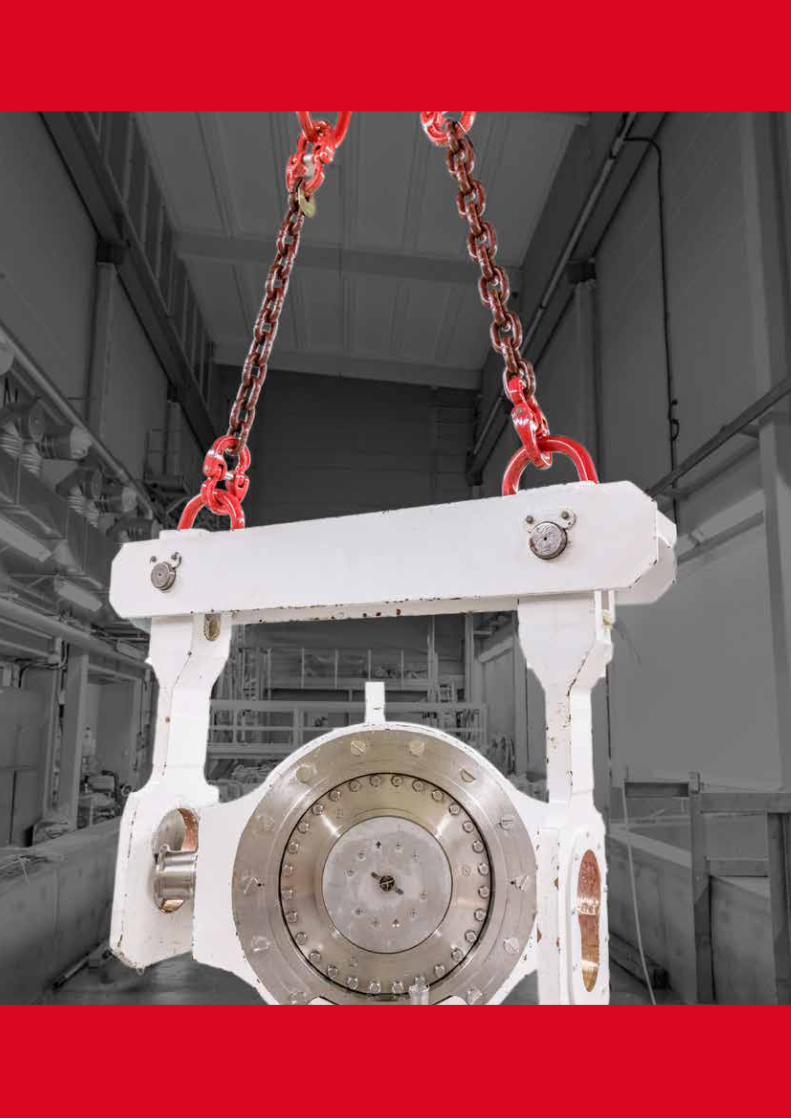
Studsvik holds a strong market position based on 70 years' experience. With our unique laboratories at the Studsvik facility as its base, the Fuel and Materials Technology business area is a world leader in nuclear hot-cell technology, nuclear fuel and materials performance testing and analysis, and corrosion and water chemistry studies. Fuel and Materials Technology offers fuel optimization, improvement of reactor performance and lifespan extension, as well as solutions for managing damaged fuel.
Studsvik Scandpower offers tools, analysis and technology for fuel optimization. The business area currently supports more than 200 commercial nuclear power plants around the world.
Consultancy Services is a global supplier of services focused on advanced technology for optimizing our customers' radio-logical programs. Our experience and competence provide safe solutions for our customers, stakeholders, the environment and future generations.
STUDSVIK’S AREAS OF OPERATIONFuel and Materials Technology Turning complicated conditions into pragmatic solutionsFuel and Materials Technology leads development through new and innovative ways of thinking for the nuclear power industry and offering solutions by combining expertise, unique facilities and external networks. Our customers come to us for our customized solutions that are highly flexible, thus meeting their needs exactly.
With our Hot Cell facilities that meet all global and technical requirements and standards, together with the expertise our employees have, we can offer high-tech services for qualification and final disposal of fuel, as well as qualification of construction material under different operating conditions.
We support our customers in finding effective solutions for challenges related to fuel or material.
Consultancy Services Expertise that delivers safe solutionsConsultancy Services offers services in nuclear technology and environment, mainly related to radioactivity, radiological waste and associated issues. Our offer focuses on advanced consultancy services, engineering services, technologies and services that optimize our customers’ radiological programs. Our experience
Administration report
The Board of Directors and the President of Studsvik AB (publ), company registration number 556501-0997, submit the annual accounts for 2017. This report also includes statements concerning Studsvik AB’s (556501-0997) sustainability reporting under Chapter 6, Sections 10-14 of the Swedish Annual Accounts Act. The report covers the company and underlying subsidiaries in the same Group.
Apart from the risks described in this report, the company has not identified any further non-financial risks that are relevant to the business and that are to be described in this report.

STUDSV IK AB (PUBL ) ANNUAL REPORT 2017
8 ADMINISTRATION REPORT
and expertise, delivered through national and international experts provides safe solutions for our customers and their stake-holders, the environment and future generations.
Our position at the heart of some of the world’s foremost waste treatment projects, gives us knowledge that can be trans-ferred to new projects. Consequently, our customers can be sure that the latest methods are applied to increase confidence in quality and efficiency, while demonstrating to regulators and stakeholders that the most effective methods are used to maintain safety and compliance.
Studsvik Scandpower
Always State-of-the-ArtStudsvik Scandpower is a global leader in software for in-core fuel management. Studsvik Scandpower offers software and engineering services to support nuclear power plants, fuel manufacturers, authorities, next generation reactor developers and research organizations. The products for reactor fuel and core design, analysis and operational support are used all over the world. The products are fuel-vendor-independent and the applications support the entire fuel cycle.
SALES AND EARNINGS Sales in the first quarter were SEK 704.8 (758.8) million, a decrease in local currencies of 8 per cent. The operating profit was SEK –41.6 (24.7) million, including non-recurring items of SEK –21.1 (–17.0) million. Adjusted for non-recurring items the operating profit was SEK –20.5 (41.7) million.
Fuel and Materials Technology sales and earnings decreased by about SEK 12 million due to a stoppage during the autumn.
Sales for the Consultancy Services business area decreased due to discontinuation of services with a low margin, combined with low capacity utilization in Germany and Sweden. Sales and earnings from FBSR licenses of SEK 21.0 (47.9) million are lower than the previous year. The Consultancy Services business area is experiencing great interest in licensing of FBSR technology, while capacity utilization was weak in engineering services in England and the USA, as well as in maintenance services in Germany. Profit was also reduced by costs for rationalization programs in Germany and England.
For Studsvik Scandpower, software sales were SEK 13 million lower and earnings SEK 7 million lower than the previous year.
At the end of the year the Group implemented an organiza-tional change in the Executive Group Management to adapt the cost level to the current volume of business.
PROFITABILITY The operating margin for the Group was 5.9 (3.2) per cent. Adjusted for non-recurring items the operating margin was –2.9 (5.5) per cent. Return on capital employed was 7.8 (7.3) per cent.
CASH FLOWCash flow from operating activities was SEK –73.1 (–56.1) million and the free cash flow excluding the cash flow effect of sale of subsidiaries was SEK –84.2 (129.6) million.
FINANCINGIn February 2016 Studsvik issued a senior, unsecured corporate bond of SEK 300 million with a maturity of three years in the Swedish market, with final maturity in February 2019. After early repayment of SEK 100 million in autumn 2016, SEK 200 million remains. The bond bears a variable interest rate of STIBOR 3m + 6.50 per cent.
FINANCIAL TARGETS Studsvik’s overall financial targets are an average annual growth of 10 per cent, achieving an operating margin of 8 per cent and an equity/assets ratio of at least 40 per cent. In 2017 sales in local currencies decreased and the operating margin decreased to –5.9 (3.2) per cent. Adjusted for non-recurring items the operating margin in 2017 was –2,9 (5.5) per cent. The equity/assets ratio decreased to 35.0 (38.7) per cent and the net debt/equity ratio increased to 35.1 (0.8) per cent.
INVESTMENTS The Group’s capital expenditure investments amounted to SEK 22.1 (15.3) million. The investments mainly referred to equipment for testing and maintenance of the facility in Sweden.
RESEARCH AND DEVELOPMENT Development projects are initiated and implemented both in part-nership with customers in the form of consultancy contracts and within the framework of Studsvik's own product development. Research expenditure is expensed as it is incurred. Identifiable expenditure for the development of new processes and products is capitalized to the extent it is expected to bring economic benefits.
In 2017 total costs of company-funded research and develop-ment amounted to SEK 28.2 (27.5) million. The greatest resources were allocated to Studsvik's in-core fuel management codes and reactor operation. Within software development the expenditure is a combination of further development of existing software and new development.

STUDSV IK AB (PUBL ) ANNUAL REPORT 2017
ADMINISTRATION REPORT 9

STUDSV IK AB (PUBL ) ANNUAL REPORT 2017
10 ADMINISTRATION REPORT

STUDSV IK AB (PUBL ) ANNUAL REPORT 2017
ADMINISTRATION REPORT 11
The business area offers high-tech services in materials and fuel technology for nuclear power plants, reactor and fuel manufac-turers and authorities, organizations and industrial actors that use irradiated substances in their operations. The offer includes fuel qualification, analysis of irradiated and non-irradiated material, research on final disposal and advanced consultancy services applicable to reactor operation. Testing and analysis operations are conducted in Studsvik's facility in Sweden and sometimes in collaboration with universities and other higher education institu-tions and other international partners. The customer-value based sales are continuing with the objective of achieving long-term growth through addressing new markets such as China, Russia and Korea as well as an extended range of products and services such as isotopes for industrial and medical use.
Sales amounted to SEK 195.0 (196.3) million, while the operating profit decreased to SEK 5.3 (29.7) million. In local currencies sales decreased by 1 per cent. Items affecting comparability reduced earnings for the year by SEK 1.4 million. The operating margin before items affecting comparability decreased to 3 (16) per cent. The operations contribute to improved operating economy and a higher level of safety in the nuclear power industry. After a strong start to the year with increased sales and good margins in the testing and analysis operations, the facility suffered a stoppage in September that lasted until mid-November. No orders were lost, but production and thus sales have been rescheduled to the first half of 2018.
The underlying operations, report increased sales in previously established services as well as sales of new services related to management of fuel after operation. During the year the business area devoted considerable resources to business development and product development for production of isotopes for medical and industrial use.
Fuel and Materials Technology
Amounts in SEK million 2017 2016
Sales 195.0 196.3
Operating profit 5.3 29.7
Operating margin, % 2.7 15.1
Items affecting comparability 1.4 0.8
Adjusted operating profit 6.7 30.5
Adjusted operating margin, % 3.4 15.5
Investments 13.8 11.7
Average number of employees 101 93
0
20
40
60
Q4Q3Q2Q1Q4Q3Q2Q1
Nyckeltal
52.5 52.2
36.0
54.4
-6
-3
0
3
6
9
12
15
Q4Q3Q2Q1Q4Q3Q2Q1
6.14.9
-3.6 -0.6
43.5
54.1
32.8
65.9
8.0
10.9
0.6
11.0
2016
2016
2017
2017
Andel av försäljningen
26%
11%
0
20
40
60
Q4Q3Q2Q1Q4Q3Q2Q1
Nyckeltal
52.5 52.2
36.0
54.4
-6
-3
0
3
6
9
12
15
Q4Q3Q2Q1Q4Q3Q2Q1
6.14.9
-3.6 -0.6
43.5
54.1
32.8
65.9
8.0
10.9
0.6
11.0
2016
2016
2017
2017
Andel av försäljningen
26%
11%
0
20
40
60
Q4Q3Q2Q1Q4Q3Q2Q1
Försäljning i Mkr
Key figures and ratios
19,7 17,119,6
24,618,0 17,1
18,9
42,4
-6
-3
0
3
6
9
12
15
Q4Q3Q2Q1Q4Q3Q2Q1
Rörelseresultat exklusive jämförelsestörande poster i Mkr
-3,6 -3,5 -2,7
1,2
-2,7 -5,2 -2,9
13,6
2016
2016
2017
2017
Percentage of sales
29%
Capacity utilization in ALARA Engineering has improved but is still unsatisfactory, which has a negative impact on the margin. During the year the business area added more competency and production capacity by means of staff development and external recruitment.
Operating profit excluding items affecting comparability in SEK million
Key figures and ratiosPercentage of sales
Sales in SEK million

STUDSV IK AB (PUBL ) ANNUAL REPORT 2017
12 ADMINISTRATION REPORT
Consultancy Services
Sales in local currencies decreased by 10 per cent to SEK 407.3 (448.4) million, and the operating profit decreased to SEK 2.9 (14.0) million. Items affecting comparability reduced earnings for the year by SEK 4 (13.4) million. Adjusted for items affecting comparability, the operating margin for 2017 was 1.7 (6.1) per cent. Demand for advanced consultancy services was good during the year in the USA and England but weak in Sweden. Demand for services in inspection and maintenance of nuclear facilities in Germany, Belgium and Switzerland was weak. License revenues of SEK 21.3 (47.9) million related to FBSR technology continue to contribute a great share of earnings. The loss in the underlying operations has decreased to SEK –14.4 (–20.5) million.
A new contract that involves FBSR was signed with Dynatech in China. The FBSR contracts include consultancy support and asso-ciated license revenues for erecting an FBSR facility.
The successes of the FBSR technology mean continued increase in demand for engineering services related to process technology. The operations in Germany report weak earnings, partly due to weak demand but also due to a lack of resources in advanced engineering services. Sales in the United Kingdom fell, while earnings improved after services with a low margin, mainly in simpler waste treatment, were discontinued. Demand for services in waste treatment and interest from the oil, mining and gas industries in services relating to NORM continue to increase.
Studsvik provides consulting and engineering services in nuclear technology and the environment. Customers are in Europe, North America, the Middle East and Asia. The range of services covers the life cycle from planning and design of facilities to management and final disposal of waste such as treatment of radioactive waste, safety analyses, health physics services and services related to decommissioning. The inspection and maintenance operations for nuclear facilities in Germany, Belgium and Switzerland are included in this business area. The business area also includes consultancy services and application of FBSR, the pyrolysis technology developed by Studsvik for radioactive waste that is difficult to treat.
Amounts in SEK million 2017 2016
Sales 407.3 448.4
Operating profit 2.9 14.0
Operating margin, % 0.7 3.1
Items affecting comparability 4.0 13.4
Adjusted operating profit 6.9 27.4
Adjusted operating margin, % 1.7 6.1
Investments 4.0 2.4
Average number of employees 492 523
0
30
60
90
120
150
Q4Q3Q2Q1Q4Q3Q2Q1
Nyckeltal
103.4 98.8
120.7
84.4
-12.0
-3.6
4.8
13.2
21.6
30.0
Q4Q3Q2Q1Q4Q3Q2Q1
3.0
-10.5
26.2
-11.9
109.6 105.6 104.3
128.9
12.2
3.2-1.9
13.9
2016
2016
2017
2017
60%
Andel av försäljningen
0
30
60
90
120
150
Q4Q3Q2Q1Q4Q3Q2Q1
Nyckeltal
103.4 98.8
120.7
84.4
-12.0
-3.6
4.8
13.2
21.6
30.0
Q4Q3Q2Q1Q4Q3Q2Q1
3.0
-10.5
26.2
-11.9
109.6 105.6 104.3
128.9
12.2
3.2-1.9
13.9
2016
2016
2017
2017
60%
Andel av försäljningen
0
30
60
90
120
150
Q4Q3Q2Q1Q4Q3Q2Q1
Nyckeltal
103.4 98.8
120.7
84.4
-12.0
-3.6
4.8
13.2
21.6
30.0
Q4Q3Q2Q1Q4Q3Q2Q1
3.0
-10.5
26.2
-11.9
109.6 105.6 104.3
128.9
12.2
3.2-1.9
13.9
2016
2016
2017
2017
60%
Andel av försäljningen
Operating profit excluding items affecting comparability in SEK millionSales in SEK million
Key figures and ratiosPercentage of sales

STUDSV IK AB (PUBL ) ANNUAL REPORT 2017
ADMINISTRATION REPORT 13

STUDSV IK AB (PUBL ) ANNUAL REPORT 2017
14 ADMINISTRATION REPORT

STUDSV IK AB (PUBL ) ANNUAL REPORT 2017
ADMINISTRATION REPORT 15
Studsvik Scandpower
Studsvik Scandpower is a global leader in software for in-core fuel management and is independent of fuel vendors. The operations are conducted at offices in Europe, the USA, Japan and China. The software development is based in the USA. Studsvik Scandpower’s software is used in half of the world’s nuclear power plants and we are now seeing an increasing interest in using Studsvik Scandpower’s software for managing fuel in intermediate and final storage. Apart from license fees from software sales, Studsvik Scandpower receives maintenance fees and consultancy services from the customers that have software installed. Studsvik Scandpower also sells consultancy services related to fuel analysis.
0
20
40
60
Q4Q3Q2Q1Q4Q3Q2Q1
Nyckeltal
19.7 17.119.6
24.618.0 17.1
18.9
42.4
-6
-3
0
3
6
9
12
15
Q4Q3Q2Q1Q4Q3Q2Q1
-3.6 -3.5 -2.7
1.2
-2.7 -5.2 -2.9
13.6
2016
2016
2017
2017
Andel av försäljningen
11%
0
20
40
60
Q4Q3Q2Q1Q4Q3Q2Q1
Nyckeltal
19.7 17.119.6
24.618.0 17.1
18.9
42.4
-6
-3
0
3
6
9
12
15
Q4Q3Q2Q1Q4Q3Q2Q1
-3.6 -3.5 -2.7
1.2
-2.7 -5.2 -2.9
13.6
2016
2016
2017
2017
Andel av försäljningen
11%
Amounts in SEK million 2017 2016
Sales 81.0 96.4
Operating profit –11.8 2.8
Operating margin, % –14.6 2.9
Items affecting comparability 3.2 0.0
Adjusted operating profit –8.6 2.8
Adjusted operating margin, % –10.6 2.9
Investments 0.7 0.1
Average number of employees 34 34
Sales in local currencies decreased by 16 per cent to SEK 81.0 (96.4) million, and the operating profit decreased to SEK –11.8 (2.8) million. Items affecting comparability reduced earnings for the year by SEK 3.2 (0) million. Adjusted for items affecting comparability, the operating margin for 2017 was –10.6 (2.9) per cent. Sales mainly consist of software licenses, maintenance agreements and consultancy services related to the software. Software is sold both as one-time licenses and annual fee sub-scriptions. When selling one-time licenses the license revenue
and profit are reported in their entirety at the time of delivery. In 2017 far-reaching negotiations were conducted on sales of software, but the decision processes tend to be more prolonged. The work of obtaining the license required for exporting Studsvik Scandpower’s software from the USA to China is continuing but it is not clear when a license may be granted. In parallel with the licensing process, some of Studsvik Scandpower’s software is being adapted to the prevailing export conditions.
0
20
40
60
Q4Q3Q2Q1Q4Q3Q2Q1
Nyckeltal
19.7 17.119.6
24.618.0 17.1
18.9
42.4
-6
-3
0
3
6
9
12
15
Q4Q3Q2Q1Q4Q3Q2Q1
-3.6 -3.5 -2.7
1.2
-2.7 -5.2 -2.9
13.6
2016
2016
2017
2017
Andel av försäljningen
11%
Operating profit excluding items affecting comparability in SEK millionSales in SEK million
Key figures and ratiosPercentage of sales
STUDSV IK AB (PUBL ) ANNUAL REPORT 2017
16 ADMINISTRATION REPORT
PARENT COMPANY Operations in the parent company consist of coordination of the Group. The parent company’s sales decreased to SEK 19.7 (22.5) million and operating profit to SEK –29.1 (–16.3) million, of which items affecting comparability SEK –9.2 (0) million related to restructuring of the Executive Group Management and admini-stration. The loss after financial items was SEK –42.1 (–8.1) million. The year’s net financial income includes revaluation of intra-group loans of SEK –7.0 (8.9) million. Cash and cash equivalents including current investments amounted to SEK 24.9 (43.9) million and interest-bearing liabilities to SEK 200 (200) million.
BENEFITS TO SENIOR MANAGEMENT The principles for benefits to senior management were adopted by the Annual General Meeting held on April 27, 2017.
Senior management executives will be offered a commercially competitive fixed salary based on the individual executive’s responsibilities and powers. Salary will be fixed per calendar year. Senior management may be offered variable remuneration of a maximum of 50 per cent of fixed salary. Variable remuneration will be primarily based on the Group’s financial targets. A plan for variable remuneration will be determined for the financial year.
Senior management can make an individual choice of pension solution in addition to what has been agreed. Thus they can convert salary and variable remuneration to extra pension payments, given that the cost to Studsvik is unchanged.
A maximum period of notice of 12 months from either senior management or Studsvik is applicable. Severance payment equi-valent to a maximum of 6 months’ salary may be made in addition to salary during the period of notice. There is more information concerning benefits to senior management in note 38.
The Board of Directors does not intend to propose any change in these principles at the 2018 Annual General Meeting.
EMPLOYEES The average number of employees in the Group in 2017 was 662 (687). The decrease is due to a smaller number of employees in administration and in the German operations. Demand is increasing for Consultancy Services and Fuel and Materials Technology, which, together with the generational shift that the nuclear power industry is facing, further underlines the importance of creating attractive conditions for the Group’s existing and potential employees.
Safe work environment For Studsvik a safe work environment and the work of creating a strong safety culture have the highest priority. The ultimate target is to completely avoid work-related injuries. Studsvik has a program to reduce the number of work-related injuries and the number of injuries resulting in sickness absence has decreased in recent years.
Measures are being taken to eliminate physical work environment risks both at the Group’s and customers' facilities. Improved knowledge of risks and influencing and changing attitudes and behavior are equally important. Part of this work is to encourage all employees to identify improvements and to report potential risks and risk behaviors.
Equal opportunities and diversity Studsvik values and encourages diversity in the organization in a way that reflects the diversity in our markets. An organization made up of employees with different experience and back-grounds makes the business more innovative. Studsvik does not tolerate any form of discrimination and all forms of harassment are actively opposed by the company and its managers.
SAFETY, SUSTAINABLE DEVELOPMENT AND THE ENVIRONMENT (CORPORATE RESPONSIBILITY) Safety, sustainable development and environmental responsibility, i.e. Studsvik's corporate responsibility activities, are integrated parts of the Group’s business strategy. Studsvik's sustainability report can be found on pages 19–25.
SOCIAL COMMITMENT Studsvik endeavors to maintain good and open communications with regions, municipalities, authorities and other stakeholders. We also aim to support the local community through cooperation with organizations and municipal administrations on matters that are strategically important for Studsvik.
DECOMMISSIONING OF STUDSVIK’S NUCLEAR FACILITIES The operations at Studsvik’s nuclear facilities in Sweden are conducted under license pursuant to the Swedish Act on Nuclear Activities and it is therefore Studsvik’s responsibility to decommission the facilities. Under the Act the holder of the license has both the technical and the financial responsibility for decommissioning.
In accordance with the Act on Financing the Handling of Certain Radioactive Waste etc. (1988:1597) (the Studsvik Act) the Swedish nuclear power producers pay a fee per generated kWh of electricity to the Nuclear Waste Fund to cover the costs of decommissioning the main part of Studsvik's nuclear facilities. Regular cost estimates are made to establish the extent of the commitment. These form the basis for determining the fee payable to the Nuclear Waste Fund by the nuclear industry.
Decommissioning in practice means that when Studsvik decides to permanently close down a facility covered by the Studsvik Act, ownership is transferred to a company owned by the nuclear power industry, which carries out the decommissioning at a time decided by that company.

STUDSV IK AB (PUBL ) ANNUAL REPORT 2017
ADMINISTRATION REPORT 17
The Group's Swedish facilities that are not covered by the Studsvik Act are governed by an Act that came into force in 2007 (2006:647). Under that Act Studsvik is financially liable to ensure future decommissioning of these facilities. This is done partly by paying a fee to the Nuclear Waste Fund, partly by pledging collateral to assure compliance. Cost estimates are made to determine the extent of Studsvik's commitment. These then form the basis for determining the fee to be paid by Studsvik to the Nuclear Waste Fund. In 2017 the fee to the Nuclear Waste Fund was SEK 381,000.
Studsvik assesses that the annual fee will continue at that level. Provision is made in the accounts for the obligation Studsvik has under IAS 37, which also means that an annual cost of the obligation for the estimated economic life of the facility is recog-nized in income. The annual cost will be more or less equivalent to the fee paid to the Nuclear Waste Fund. The balance in the Nuclear Waste Fund is recorded as an asset in the accounts.

STUDSV IK AB (PUBL ) ANNUAL REPORT 2017
18 ADMINISTRATION REPORT
STUDSV IK AB (PUBL ) ANNUAL REPORT 2017
ADMINISTRATION REPORT 19
Sustainability report
The purpose of this report is to provide Studsvik's stakeholders with new perspectives on how we as a company create value for our customers, employees and the communities where we operate. Consequently we have given an account of the social, economic and environmental principles that are important to us, with an accompanying description of how we manage our most material risks within the company, in accordance with Chapter 6, Sections 10-14 of the Annual Accounts Act.
When compiling this report three principles were identified that are fundamental to Studsvik's sustainability activities. They are crucial for the company’s profitability and are to function as guidelines for Studsvik's future sustainability work. These principles are to develop environmentally sustainable solutions for the nuclear industry, be an attractive employer for our potential and existing employees and take responsible and long-term economic decisions.
Developenvironmentally
sustainablesolutions
Be an attractive employer
Take responsible economic decisions
Index for Chapter 6, Sections 10-14 of the Annual Accounts Act Page
Business model 19–20
Policy for sustainability questions, including objective, perfor-mance and application
20–21
Diversity and gender equality policy, including objective, performance and application
21
Material risks associated with the company’s operations and the management of these risks
21–25
Environment 22, 25
Social conditions and staff 23–24
Respect for human rights 24
Anti-corruption 21, 24
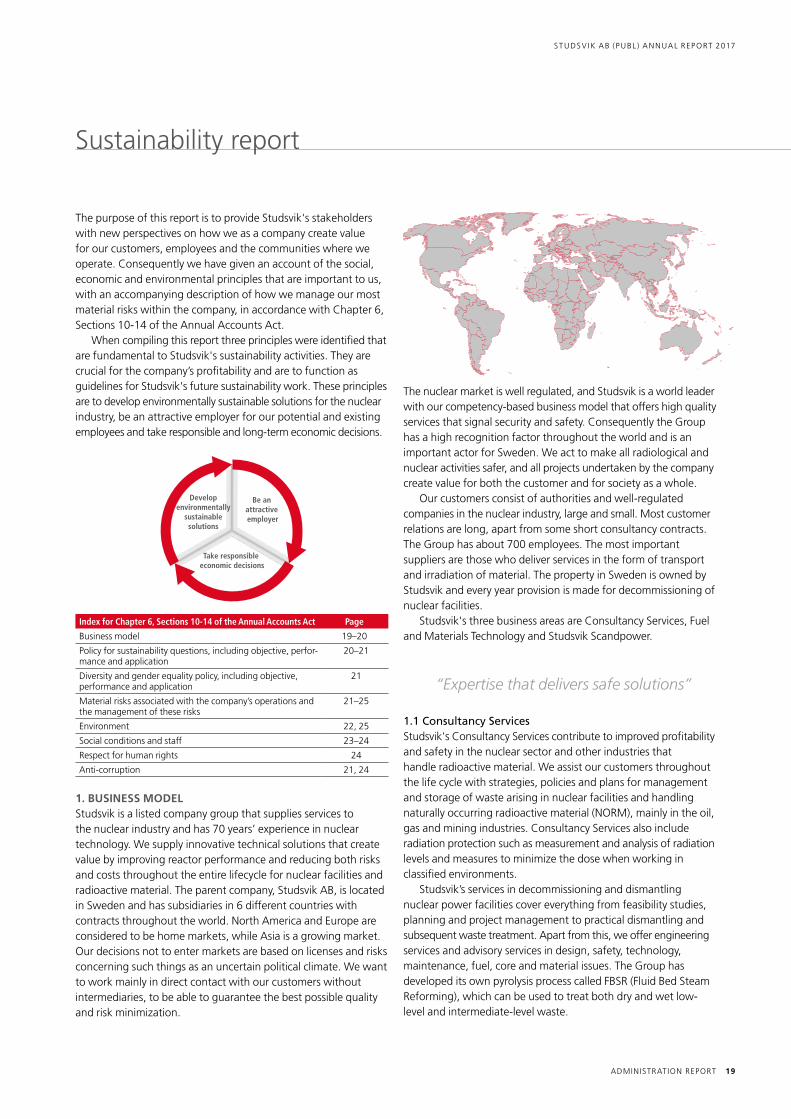
1. BUSINESS MODELStudsvik is a listed company group that supplies services to the nuclear industry and has 70 years’ experience in nuclear techno logy. We supply innovative technical solutions that create value by improving reactor performance and reducing both risks and costs throughout the entire lifecycle for nuclear facilities and radioactive material. The parent company, Studsvik AB, is located in Sweden and has subsidiaries in 6 different countries with contracts throughout the world. North America and Europe are considered to be home markets, while Asia is a growing market. Our decisions not to enter markets are based on licenses and risks concerning such things as an uncertain political climate. We want to work mainly in direct contact with our customers without intermediaries, to be able to guarantee the best possible quality and risk minimization.
The nuclear market is well regulated, and Studsvik is a world leader with our competency-based business model that offers high quality services that signal security and safety. Consequently the Group has a high recognition factor throughout the world and is an important actor for Sweden. We act to make all radiological and nuclear activities safer, and all projects undertaken by the company create value for both the customer and for society as a whole.
Our customers consist of authorities and well-regulated companies in the nuclear industry, large and small. Most customer relations are long, apart from some short consultancy contracts. The Group has about 700 employees. The most important suppliers are those who deliver services in the form of transport and irradiation of material. The property in Sweden is owned by Studsvik and every year provision is made for decommissioning of nuclear facilities.
Studsvik's three business areas are Consultancy Services, Fuel and Materials Technology and Studsvik Scandpower.
“Expertise that delivers safe solutions”
1.1 Consultancy ServicesStudsvik's Consultancy Services contribute to improved profitability and safety in the nuclear sector and other industries that handle radioactive material. We assist our customers throughout the life cycle with strategies, policies and plans for management and storage of waste arising in nuclear facilities and handling naturally occurring radioactive material (NORM), mainly in the oil, gas and mining industries. Consultancy Services also include radiation protection such as measurement and analysis of radiation levels and measures to minimize the dose when working in classified environments.
Studsvik’s services in decommissioning and dismantling nuclear power facilities cover everything from feasibility studies, planning and project management to practical dismantling and subsequent waste treatment. Apart from this, we offer engineering services and advisory services in design, safety, technology, maintenance, fuel, core and material issues. The Group has developed its own pyrolysis process called FBSR (Fluid Bed Steam Reforming), which can be used to treat both dry and wet low-level and intermediate-level waste.
STUDSV IK AB (PUBL ) ANNUAL REPORT 2017
20 ADMINISTRATION REPORT
“Turns complicated conditions into pragmatic solutions”
1.2 Fuel and Materials Technology Studsvik's expertise in fuel and materials technology contributes to better operating economy and improved safety in the nuclear industry. A long life and sound fuel economy are central for achieving good profitability in operating a nuclear power plant. Fuel and Materials Technology provides innovative technical solu-tions for nuclear power plants, reactor and fuel manufacturers and authorities and organizations. Studsvik has a long history of supplying isotopes in the period when the research reactor was in operation and is now resuming operations in this area. Testing and analysis operations are conducted in Studsvik's facility in Sweden and sometimes in collaboration with universities and other higher education institutions and other international partners. The results give our customers a basis for effectively and safely optimizing construction material and fuel for both operation and re-investment. There is an increased demand for services regarding spent fuel management, i.e. services for intermediate and final storage. The customer value based sales are continuing, with the aim of achieving long-term growth also on new markets such as China, Russia and Korea.
“The global leader in in-core fuel management analysis”
1.3 Studsvik Scandpower Studsvik Scandpower supplies world-leading software for fuel and core optimization and monitoring. The software increases burn-up of reactor fuel and thus the power output, while not jeopardizing operating safety. The software is also used to support spent fuel management. The operations are conducted at offices in Europe, the USA and Japan. The software development is based in the USA. Increased commercial focus drives sales and development of software and services in existing and new markets, mainly China and Russia. Studsvik Scandpower is a world leader in software for fuel optimization and core monitoring.
2. POLICY
2.1 SustainabilityStudsvik's policy for safety, the environment, health and quality refers to the entire Group. We offer services that increase safety, quality and environmental performance and it is important to us to set a good example. Therefore the best conceivable financially justifiable technology is used. The ambition is also to uphold good communication with respect to environmental aspects with
local communities, employees, authorities, customers, the media and other stakeholders.
We want to avoid accidents at the workplace by means of effective safety procedures, high requirements of facilities and competent personnel. Safety must always have highest priority in all the company’s activities, and includes everything from safety of nuclear power and radioactivity to fire safety. We also intend to prevent work-related injuries and ill health for our employees.
2.1.1 ObjectiveThe purpose of Studsvik's policy for safety, the environment, health and quality is that it should be followed and be a natural part of the day-to-day work of the company. All employees have a personal responsibility to help to ensure that activities are implemented. This includes discovering and reporting any non-conformances and ensuring that they are rectified.
2.1.2 ApplicationDuring the year policy documents have been developed and a management system has been integrated into the organization that ensures compliance with policies. Objectives and action plans are established to develop and improve the business activities. An annual employee survey has been conducted and we work closely with trade unions in Germany and Sweden. A survey has been made of energy consumption and carbon emissions from passenger cars used on business.
2.1.3 Effect• The employee survey has been followed up. Among other things,
the survey showed that equal treatment and zero tolerance of sexual harassment are highly valued according to the employees, regardless of group or country.
• A rehabilitation policy has been developed, in which Studsvik works more proactively with the staff health service before rehabilitation is needed.
• The Safety Committee in Sweden has held a total of 4 meetings during the year at which all injuries and accidents relating to the work environment and transport to and from work are followed up. According to plan a safety round is carried out at least once per year in Sweden.
• An energy survey in stages for Studsvik in Sweden has been started, in which specific facilities are studied in detail based on the greatest potential for saving energy. The survey has identified a need for better equipment for measurement and automatic control engineering. During the year an energy survey report was published that refers to figures from the 2016 financial year. The report does not cover the whole Group, but only Studsvik in Sweden, but the intention is to inspire the rest of the Group to be more energy efficient.
• In the previous financial year an emission limit of 130 g carbon dioxide/km was introduced for all passenger cars used by Studsvik in Sweden. This has led to a reduction in average emissions from our passenger cars from 132 g to 110 g carbon dioxide/km after the policy came into force.

STUDSV IK AB (PUBL ) ANNUAL REPORT 2017
ADMINISTRATION REPORT 21
2.2 Gender equality and diversityWe value and encourage diversity in the organization in a way that reflects the diversity in our global market. At Studsvik every-one is judged according to their skills, both job applicants and employees. No forms of discrimination or harassment are tolerated and are actively opposed.
2.2.1 ObjectiveThe purpose of the gender equality and diversity policy is to ensure that everyone, regardless of differences, has the same opportunities regarding employment, working conditions and development opportunities. To achieve this, we must take responsibility at all levels and focus on the following areas of development:• Improve the opportunity to combine working life and family life • Encourage women to take leading positions • Combat harassment • Everyone must be offered the same opportunity for pay
increases
2.2.2 ApplicationAn assessment of comparable groups and of what determines pay differences between different groups has been made. Studsvik offers flextime and the opportunity to discuss individual working hours. In some cases working at home may occur to a limited extent. We have also drawn up an action plan against all types of harassment. All employees are to be aware of this and all new recruits have been informed.
2.2.3 EffectAt the close of the financial year the gender distribution in the Group was as follows:
Women Men
Employees 106 546
Managers (number) 11 25
Ratio of managers to employees (%) 31 69
Female/male ratio of managers (%) 10 5
A survey of pay was carried out during the year with a review of individual salaries in the various groups, based on level of education, professional experience, responsibilities, input and gender. Recommendations were then made to managers on which to base adjustments. According to a subsequent questionnaire these managers considered that this was a good and proactive way to work on these problems.
2.3 Bribery and corruptionStudsvik has zero tolerance for corruption and all employees must always comply with both Swedish and local legislation. If they differ, the strictest legislation will apply. Studsvik may not use illegal payments, offer or accept bribes or use other doubtful incentives to influence a business transaction. This policy also applies to representatives and proxies.
Studsvik also has a whistleblower function, which means that employees can safely and securely draw the management’s attention to information about any irregularities. The function is set up so that an email can be sent to an external law firm that in turn contacts the Chairman of the Board, who takes the matter further with the Executive Group Management, or deals with the matter together with the law firm. In 2018 Studsvik will introduce the possibility of remaining anonymous.
2.3.1 ObjectiveThe purpose of the policy for dealing with bribery and corruption is to provide guidance on anti-corruption rules set out in the Group’s Code of Conduct and to encourage employees to report any problems without risk of reprisals or discrimination.
2.3.2 Application Compliance with this policy is compulsory and infringements are regarded as a disciplinary breach. All white-collar workers in the Group must give annual confirmation that they have taken note of the policy. This can be done either though acceptance of the conditions on the intranet, or by an email sent to everyone. Studsvik AB is responsible for the reminder.
2.3.3 EffectNo cases of bribery or corruption have been identified during the year.
3. SUSTAINABILITY RISKS
3.1 Materiality analysisTo enable us to comply with our three sustainability principles: to develop environmentally sustainable solutions, be an attractive employer and take responsible economic decisions, we needed to identify our material sustainability risks. This is to be able to identify, prioritize and manage the focus areas that are of high material importance to us and our stakeholders. The material risks are identified using four analyses:• An analysis of our stakeholders and their requirements of
Studsvik as a company and actor in society. See section 3.2 for a description of our communication with our stakeholders.
• An analysis of the industry and the risks addressed by similar organizations.
• An analysis of Studsvik's total costs and the risks inherent in day-to-day economic decisions taken internally.
• An analysis of future sustainability requirements with the help of the UN Agenda 2030 and how the 17 global goals are relevant to Studsvik's operations. See section 3.3 for a continued description.
• This has resulted in giving priority to 10 focus areas that line up with our three sustainability principles and dealing with our sustainability risks. In section 3.4 a description follows of why these areas are of material importance and how Studsvik deals with them in its operations.

STUDSV IK AB (PUBL ) ANNUAL REPORT 2017
22 ADMINISTRATION REPORT
0 4 8 12 16 200
4
8
12
16
20
Business ethics
Attractive employer
Waste and water management
Data and information security
Digitalization
Energy consumption and carbon dioxide emissions
Health and safety at the workplace
Sustainable solutions for the nuclear industry
Stable economy
Systematic risk management
Environmental sustainability Social sustainability Economic sustainability
IMPORTANT FOR STUDSVIK
IMPO
RTAN
T FOR STA
KEH
OLD
ERS
3.2 Our stakeholdersThis is our first sustainability report and as part of its compilation a survey of our most important stakeholders was made to enable us to conduct future sustainability work. Along with the survey a dialog plan was also drawn up.
The employees are our most important resource. Without their leading edge skills and experience the company cannot perform the services we offer our customers. We also endeavor to hold open and frequent dialogs with our customers, the local community and authorities. We support our local community by cooperating with relevant organizations and local authorities on matters that are of strategic importance to us, or where we can make a difference to those around us.
Stakeholder group Dialog method
Employees Employee performance review, at least once a year
Customers Annual physical customer meetings and customer satisfaction survey via questionnaire
Local community Annual information meeting for people living near the Studsvik facility
Authorities Frequent meetings with authorities
Apart from these stakeholder groups we have identified suppliers, industry-specific organizations, financers, the media and universities and other higher education institutions as stakeholders. During the year we made a dialog plan as a guidance tool in our future contacts with stakeholders.
Our objective is to review our largest and most important suppliers regularly to ensure that they live up to our requirements and ethical standards. In 2017 an extensive review was made of one of these suppliers. The review program takes up human rights and social responsibility in accordance with a checklist that addresses principles under the UN Global Compact program.
INGENFATTIGDOM
INGENHUNGER
GOD UTBILDNING FÖR ALLA
JÄMSTÄLLDHET RENT VATTEN OCHSANITET FÖR ALLA
Good health and well-being
Affordable and clean energy
Decent work and economic growth
Industry, innovation and infrastructure
MINSKADOJÄMLIKHET
HÅLLBARA STÄDEROCH SAMHÄLLEN
HÅLLBAR KONSUMTION OCHPRODUKTION
EKOSYSTEM OCH BIOLOGISK MÅNGFALD
FREDLIGA OCH INKLUDERANDESAMHÄLLEN
BEKÄMPA KLIMAT-FÖRÄNDRINGARNA
HAV OCH MARINARESURSER
Genomförande OCH GLOBALTPARTNERSKAP
THE GLOBAL GOALS for Sustainable Development
3.3 The UN’s 17 Global Goals The Global Goals were adopted by the heads of state and government at the UN summit meeting in 2015, and is an agenda for peace-ful and sustainable development to 2030. The term sustainable development integrates social, economic and environmental sustainability. Everyone is equally responsible for global development, from individual to global level. To achieve these goals, all member countries must act and cooperate with the business sector. All 17 goals are equally important, but initially we have decided to address 4 of them, see below. This means that we are endeavoring to contribute to the world’s successful achievement of these goals, by being responsible for the areas where we can make most difference.
3.4 Material risks associated with the operations
3.4.1 Sustainable solutions for the nuclear industry Our task is to contribute to a more sustainable nuclear industry. With our services our customers can use existing assets longer, more safely and with less environmental impact. Our innovative technical solutions improve reactor performance and reduce both risks and costs over the entire lifecycle. We provide advisory services for managing radioactive material throughout the waste chain with the aim of having as small volume of contaminated waste as possible. We create more sustainable waste treatment for our customers and for society.
It is important for us to always have an innovative approach to all our assignments and together with our customers we develop innovative, customized and effective services. We are proud of our collaboration with our customers and we depend on an open dialog to be able to create sustainable solutions for the nuclear industry.
The Studsvik Cladding Integrity Project (SCIP) is an inter-national OECD project run by Studsvik and launched in 2004. The project is conducted in the form of experiments, studies, development of testing methods and knowledge transfer.
INGENFATTIGDOM
INGENHUNGER
GOD UTBILDNING FÖR ALLA
JÄMSTÄLLDHET RENT VATTEN OCHSANITET FÖR ALLA
Good health and well-being
Affordable and clean energy
Decent work and economic growth
Industry, innovation and infrastructure
MINSKADOJÄMLIKHET
HÅLLBARA STÄDEROCH SAMHÄLLEN
HÅLLBAR KONSUMTION OCHPRODUKTION
EKOSYSTEM OCH BIOLOGISK MÅNGFALD
FREDLIGA OCH INKLUDERANDESAMHÄLLEN
BEKÄMPA KLIMAT-FÖRÄNDRINGARNA
HAV OCH MARINARESURSER
Genomförande OCH GLOBALTPARTNERSKAP
THE GLOBAL GOALS for Sustainable Development

STUDSV IK AB (PUBL ) ANNUAL REPORT 2017
ADMINISTRATION REPORT 23
The SCIP project participants are from Sweden, the Czech Republic, Finland, France, Germany, Switzerland, Japan, South Korea, Spain, the USA, Russia, Norway, Hungary and China.
3.4.2 Systematic risk management We want to prevent accidents by having competent and motivated staff and high requirements of the facilities. Our constant endeavor to improve is based on our management system, commitment on the part of employees and targets and action plans that are regularly monitored. We apply the precautionary principle in all our assignments, by systematically assessing, managing and communicating environ-mental, economic and social risks that the company’s operations entail. We also help our customers to apply the precautionary principle in their operations.
Studsvik has well-established procedures for systematic risk management. They are formulated together with relevant authorities that take a position on our risk assessment and on whether the management of these risks is adequate. Risk dialogs are frequent and documented and are a necessity to be able to maintain and extend our licenses. Consequently, our systematic risk management is a fundamental condition for our operations. Announced and unannounced regulatory controls are carried out at regular intervals to examine and ensure that we comply with the safety procedures set up. Physical and mental risks are checked at the Studsvik facility, as well as administrative risks that may have indirect effects on the nuclear operations. Non-conformances require follow-up.
An overall analysis of the Group’s risks and how they are to be managed is presented annually to the Board of Directors of Studsvik AB. The Group has a strong safety culture that rests on a long tradition of procedures for quality assurance and monitoring of several quality assurance processes. Being an actor in the nuclear power industry entails specific risks that are regulated and supervised by national authorities and international organizations. An overall risk analysis is included in the annual report for 2017 (see the risk section in the annual report, pages 26-28).
INGENFATTIGDOM
INGENHUNGER
GOD UTBILDNING FÖR ALLA
JÄMSTÄLLDHET RENT VATTEN OCHSANITET FÖR ALLA
Good health and well-being
Affordable and clean energy
Decent work and economic growth
Industry, innovation and infrastructure
MINSKADOJÄMLIKHET
HÅLLBARA STÄDEROCH SAMHÄLLEN
HÅLLBAR KONSUMTION OCHPRODUKTION
EKOSYSTEM OCH BIOLOGISK MÅNGFALD
FREDLIGA OCH INKLUDERANDESAMHÄLLEN
BEKÄMPA KLIMAT-FÖRÄNDRINGARNA
HAV OCH MARINARESURSER
Genomförande OCH GLOBALTPARTNERSKAP
THE GLOBAL GOALS for Sustainable Development
3.4.3 Health and safety at the workplace Our most important resource is our employees and their health, consequently safety is of the highest relevance to us. We therefore run our business with a high standard of both physical and mental health in the work environment. The work environment must be safe and fulfilling for all employees. Our employees carry out their work in areas that require a high level of safety. Consequently, health and safety are highly important for Studsvik as an employer and we must always be a step ahead in our management of safety risks.
Under our management system every employee must show personal commitment to the work environment in their day-to-day work. The 2016 employee survey showed that important aspects of our employees’ health at the workplace were that the work environment must be inspiring, ergonomic and free of sexual harassment. The employee survey is conducted every 18 months so that it can be followed up and any dissatisfaction recti-fied. The next survey will be in 2018. During the year compulsory health examinations were carried out for those who have radio-logical jobs, which is the majority of our employees.
90 % (91 %) of the Group’s employees consider that they have a safe work envi-ronment in relation to their duties. The majority of the 10 % who do not consider that they have a safe work environment work with consultancy services for decom-missioning in Germany.
Country Sickness absence (%) Accidents during the year (number)
Sweden 2.13 4
UK 0.35 0
USA 0.42 0
Germany 13.17 242
Total 8.96 31
3.4.4 Attractive employer Being an attractive employer means attracting the right skills and stimulating our employees. As a knowledge-intensive service company the right skills for the right role is a fundamental aspect to enable us to quality assure our services and attracting and retaining suitable and competent personnel is crucial. Therefore we must live up to the expectations our future talents have of their future employer. As an employer Studsvik is a unique company with its international, innovative and research-heavy operations. For those who want to work in the nuclear industry it is attractive to share in the experience our specialists have, but we also see that demands on employers today and in the future will be different from how it has been before. Consequently, we must adapt our communication and what we as employers have to offer our potential employees accordingly. Our leadership training has been started and will be further developed in coming years.
INGENFATTIGDOM
INGENHUNGER
GOD UTBILDNING FÖR ALLA
JÄMSTÄLLDHET RENT VATTEN OCHSANITET FÖR ALLA
Good health and well-being
Affordable and clean energy
Decent work and economic growth
Industry, innovation and infrastructure
MINSKADOJÄMLIKHET
HÅLLBARA STÄDEROCH SAMHÄLLEN
HÅLLBAR KONSUMTION OCHPRODUKTION
EKOSYSTEM OCH BIOLOGISK MÅNGFALD
FREDLIGA OCH INKLUDERANDESAMHÄLLEN
BEKÄMPA KLIMAT-FÖRÄNDRINGARNA
HAV OCH MARINARESURSER
Genomförande OCH GLOBALTPARTNERSKAP
THE GLOBAL GOALS for Sustainable Development
90%
INGENFATTIGDOM
INGENHUNGER
GOD UTBILDNING FÖR ALLA
JÄMSTÄLLDHET RENT VATTEN OCHSANITET FÖR ALLA
Good health and well-being
Affordable and clean energy
Decent work and economic growth
Industry, innovation and infrastructure
MINSKADOJÄMLIKHET
HÅLLBARA STÄDEROCH SAMHÄLLEN
HÅLLBAR KONSUMTION OCHPRODUKTION
EKOSYSTEM OCH BIOLOGISK MÅNGFALD
FREDLIGA OCH INKLUDERANDESAMHÄLLEN
BEKÄMPA KLIMAT-FÖRÄNDRINGARNA
HAV OCH MARINARESURSER
Genomförande OCH GLOBALTPARTNERSKAP
THE GLOBAL GOALS for Sustainable Development

STUDSV IK AB (PUBL ) ANNUAL REPORT 2017
24 ADMINISTRATION REPORT
We work continually to improve the quality of our operations by endeavoring to make the work interesting for our employees, to ensure that we stimulate them and retain the specialist skills many of them have. This also means creating a working climate where we can benefit from each other’s differences. As a global Group, diversity has become a natural and important part of our operations, with contracts that extend across national borders. Our employees’ differences reflect our international business and varying duties and ensures that we can tackle the global challeng-es we face. To ensure that no type of discrimination takes place when recruiting, the requirements for new employees are solely competency based.
The employee survey showed that 69 % (72 %) of the Group’s employees were satis-fied with their work and their work situation.
Country Staff turnover (%)
Sweden 13.25
UK 57.69
USA (CS) 10.00
Germany (CS) No info
All countries excluding Sweden (SSP) 6.67
Total 17.37
Average period of employment (years) 11.1
Average age (years) 48.6
3.4.5 Stable economy Studsvik's economic strategy is long-term and our aim is a sustainable business. We value long-term economic stability above decisions characterized by short-term profit. The aim to be sustainable in all economic decisions. The Group is characterized by responsible leadership with zero tolerance for bribery and corrup-tion. We endeavor to have long-term relations with our suppliers.
Economic stability is important for our stakeholders, not least our employees. Our profitability is contingent on political decisions, as well as the price of other energy sources, which makes it difficult to predict future business. Market restructuring impacts profitability.
Studsvik's services cover all phases of the nuclear industry. There is investment in and decommissioning of nuclear power plants in other parts of the world, from new construction in China to decommissioning in Germany. Our assessment is that more nuclear power contracts will develop in the long term and Studsvik is and will be an important actor in ensuring a future efficient, safe and sustainable nuclear power industry. Studsvik has a long history of supplying isotopes in the period when the research reactor was in operation and is now resuming operations in this area.
69%
31%
INGENFATTIGDOM
INGENHUNGER
GOD UTBILDNING FÖR ALLA
JÄMSTÄLLDHET RENT VATTEN OCHSANITET FÖR ALLA
Good health and well-being
Affordable and clean energy
Decent work and economic growth
Industry, innovation and infrastructure
MINSKADOJÄMLIKHET
HÅLLBARA STÄDEROCH SAMHÄLLEN
HÅLLBAR KONSUMTION OCHPRODUKTION
EKOSYSTEM OCH BIOLOGISK MÅNGFALD
FREDLIGA OCH INKLUDERANDESAMHÄLLEN
BEKÄMPA KLIMAT-FÖRÄNDRINGARNA
HAV OCH MARINARESURSER
Genomförande OCH GLOBALTPARTNERSKAP
THE GLOBAL GOALS for Sustainable Development
2017
Net debt-equity ratio 35.1
Equity-assets ratio 35.0
3.4.6 Data and information security The nuclear industry is often based on confidential infor-mation. For Studsvik it is of utmost importance to handle confidential and classified information securely and in a structured manner, for the sake of the company, the customers and society. An information security policy has therefore been drawn up with guidelines for dealing with the IT infrastructure at the company. The EU General Data Protection Regulation, GDPR (Directive 96/46/EC) comes into force in May 2018. The regulation aims to harmonize laws on content integrity in Europe. In 2018 we will adapt current procedures to the regulation.
3.4.7 Business ethics Studsvik's business ethics are based on legislative requirements and standards of business ethics. We always ensure that we follow the laws applicable in the countries where we operate and we must constantly keep ourselves updated as regards new and existing legislative requirements all over the world. We also function as a consultation body on nuclear matters. To ensure a sustainable value chain Studsvik has drawn up a Code of Conduct that applies to both the Group and its suppliers. Some of the common requirements defined through the Code of Conduct are:• That we meet the requirements for our ISO certifications• That no type of child labor takes place in any of our operations,
at our contractors or sub-contractors • That we comply with legislation on bribery and corruption,
where Swedish law constitutes the minimum level • That we comply with all local safety rules and laws • That we have a sound financial positionThe Code of Conduct is sent to our partners and suppliers together with our anti-corruption policy and an Execution of Agreement document, which they must sign and return to us.
3.4.8 Digitalization Digital development is essential for effective internal operation and delivery to our customers. Digitalized tools help us to be more structured and by gathering previously used information and experience we help our customers more effectively. Adaptation to digital development is important to enable us to deliver sustainable and competitive solutions in accordance with the expectations of our employees, customers and society. To adapt we develop digital platforms and tools for operational efficiency and project implementation.
In the nuclear industry collaboration and exchange of experience and research findings are essential for development of the industry.
INGENFATTIGDOM
INGENHUNGER
GOD UTBILDNING FÖR ALLA
JÄMSTÄLLDHET RENT VATTEN OCHSANITET FÖR ALLA
Good health and well-being
Affordable and clean energy
Decent work and economic growth
Industry, innovation and infrastructure
MINSKADOJÄMLIKHET
HÅLLBARA STÄDEROCH SAMHÄLLEN
HÅLLBAR KONSUMTION OCHPRODUKTION
EKOSYSTEM OCH BIOLOGISK MÅNGFALD
FREDLIGA OCH INKLUDERANDESAMHÄLLEN
BEKÄMPA KLIMAT-FÖRÄNDRINGARNA
HAV OCH MARINARESURSER
Genomförande OCH GLOBALTPARTNERSKAP
THE GLOBAL GOALS for Sustainable Development

STUDSV IK AB (PUBL ) ANNUAL REPORT 2017
ADMINISTRATION REPORT 25
Using digital tools makes communication and information flows easier and more efficient. In the past 3 years we have invested about SEK 5 million in IT infrastructure and platforms to enable digitalization of processes and facilitate interaction and exchange of information both internally and externally.
3.4.9 Energy consumption and carbon dioxide emissions In our own operations we endeavor to minimize impact on our environment within the framework of what is reasonable from a business perspective. Our constant efforts to improve in the area of the environment are based on the commitment of all our employees as well as environ-mental targets set and monitored within the company organization. An important part of our environmental impact is our energy consumption and our carbon dioxide emissions in our operations.
Electricity consumption 2017 Heat production 2017
Total [MWh] 14,485 Total production thermal power plant [MWh]
12,887
Sold to external custom-er [MWh]
10,063 Sold to external customer [MWh]
5,216
CO2 emissions [tonnes]4 0.58 Recovered heat from treat-ment facility Cyclife-EDF [MWh]
3,520
The table refers to the facility in Sweden.
Business travel is an important and necessary part of the work of our organization. The diesel used for our passenger cars is B5 diesel, a sulphur-free motor fuel that meets the environment class 1 requirements and 5 % that is renewable fuel. The mixture means that we reduce our fossil carbon dioxide emissions. As regards other forms of transport, our travel policy makes it clear that it is important to take the environment and safety into consideration when we travel. Increasing cost efficiency and being environmentally aware do not need to mean that we sacrifice safety, quality or service in our business travel.
3.4.10 Waste and water management Studsvik has developed world-leading, rigorous processes for managing different types of radioactive waste, which considerably reduce our and our customers' waste volumes and enable recovery of energy and raw materials such as steel. Only small amounts of radioactive waste are generated by Studsvik's own operations. All hazardous waste is categorized, packaged and managed on a continuous basis. The waste water generated by the facility is purified in our own water treatment plant. Continual measurements are made, both in the form of analysis of bottom sediment and exploratory fishery that is regulated by the authorities.
Annual emissions
Phosphorus (kg) 14
Nitrogen (kg) 703
Biochemical oxygen consumption, 7 days (kg) 251
Organic carbon (kg) 552
Sludge (m3) 191
The table refers to the facility in Sweden.
4. CONCLUDING WORDSThe decisions we make today will have a great impact on our future generations. Through an open dialog with our stake-holders we want to uphold a transparency that challenges and develops Studsvik as a responsible actor in society. Bearing in mind that this is the first sustainability report we have published, we are aware that it is part of a development process. We will continue aiming to develop more environmentally sustainable solutions for the nuclear industry, to constantly improve as an employer and continue to take responsible economic decisions that will guarantee Studsvik's sustainable future.
INGENFATTIGDOM
INGENHUNGER
GOD UTBILDNING FÖR ALLA
JÄMSTÄLLDHET RENT VATTEN OCHSANITET FÖR ALLA
Good health and well-being
Affordable and clean energy
Decent work and economic growth
Industry, innovation and infrastructure
MINSKADOJÄMLIKHET
HÅLLBARA STÄDEROCH SAMHÄLLEN
HÅLLBAR KONSUMTION OCHPRODUKTION
EKOSYSTEM OCH BIOLOGISK MÅNGFALD
FREDLIGA OCH INKLUDERANDESAMHÄLLEN
BEKÄMPA KLIMAT-FÖRÄNDRINGARNA
HAV OCH MARINARESURSER
Genomförande OCH GLOBALTPARTNERSKAP
THE GLOBAL GOALS for Sustainable Development
1 http://www.globalamalen.se/2 Measures taken3 Employee satisfaction has fallen by three percentage points since the last
financial year. This is discussed and dealt with in each respective unit4 Conversion factor 0.04 g CO2/kWh, Vattenfall’s ”electricity mix”; 44.9% nu-
clear power, 53.7% hydropower, 1.4% wind power (www.vattenfall.se 2016)

STUDSV IK AB (PUBL ) ANNUAL REPORT 2017
26 ADMINISTRATION REPORT
RISK MANAGEMENT Studsvik operates in an international, competitive market. The responsibility for assessing operational and financial risks lies with each respective business area. The business areas' risk assessments are examined, compared and followed up by the parent company as well as being dealt with in connection with the regular follow-up in each business area.
An overall analysis of the Group's risks and how they are dealt with is presented annually to the Board of Directors of Studsvik AB and is followed up on a regular basis. The Group has a high security culture, which rests on a long tradition of clear routines for quality assurance and follow up in the context of various quality certification processes.
The fact that Studsvik operates in the nuclear sector entails special risks that are regulated and supervised by national authorities and international bodies. An overall risk assessment must include all parts of the operations and a general business environment assessment. Selected risk factors are described below in no order of rank. Financial risks are dealt with in the “Financial risk management” section, note 2.
EXTERNAL RISKS
Licensing obligation and regulatory framework Studsvik handles radioactive material and waste, which means that some of the operations must be licensed and are subject to official supervision and approval. Consequently there is a risk that the conditions governing operations may be changed through amend-ment or cancellation of official permits, changes in the regulatory framework or through political decisions. This may for example involve further protective measures that Studsvik may need to invest in to fulfill requirements. Studsvik may be notified by regu-lators of alleged infringements of licensing or regulations. Studsvik fulfills the requirements imposed by such regulations. The Group’s high safety culture means that it has a high capacity for adjustment to new rules and terms of reference. Working methods that reduce emissions and risks are continuously being enhanced.
Market Demand for Studsvik’s services is affected by a number of factors, and in the long term is dependent on developments in the nuclear power industry and the factors that influence them. By addressing its services to the nuclear power industry's needs throughout plant life cycles, the business is only dependent in the very long term on the survival of the nuclear power industry.
Public opinion Issues relating to nuclear technology are of public interest. Various issues may be subject to expressions of opinion and debate. In such a context it cannot be ruled out that opinion may emerge on matters that directly or indirectly restrict Studsvik’s scope of business action. Studsvik acts consistently to maintain high public confidence by doing what it can not to conduct its business in conflict with public opinion.
Business activities focus on improving the safety profile of nuclear power. Its approach to the world around is characterized by dialogue and the principle of the greatest possible transparency.
OPERATIONAL RISKS
Technology Software, laboratory activities, waste management and certain specialist services provided through Studsvik's operations are based on proprietary technology that is constantly exposed to competitive challenges. The possibility of other methods being developed that reduce the competitiveness of Studsvik's techno-logies cannot be ruled out.
The risk is managed through continuous product develop-ment in close cooperation with customers, as well as through largely offering customers package solutions, based on Studsvik's extensive experience, which makes Studsvik less sensitive to the replication of individual services or products. Studsvik also manages this risk by patenting its proprietary technology whenever it is considered possible and financially justifiable.
Transportation Part of Studsvik's business, especially in the field of materials testing and waste management, involves the transportation of material to and from Studsvik's facilities, which could be hindered by new legislation or amendments to international conventions. Transpor-tation also requires official approval, special equipment and/or vehicles, resulting in the possibility of prolonged licensing processes, which can lead to deferment or losses in earnings. Transportation complies with high safety standards, is subject to frequent inspections by supervisory authorities and has a low risk of harmful consequences in the event of an accident. By maintaining a high level of expertise in our own transport organization, and through availability of our own transport packaging the risk is limited.
Operation of company facilities Studsvik conducts its business at its own facilities. Technical failures that cause unplanned operational disruptions cannot be ruled out, and may have an adverse effect on income and give rise to costs. Studsvik’s quality system, monitoring and main-tenance systems, as well as competence development processes, are intended to minimize the risk of operational disruptions, and improve contingency planning to minimize the effects of any disruptions that do nevertheless occur.
Dependence on employees The running of Studsvik's facilities depends on the workforce being complete and competent. Studsvik has a long history of industrial peace. However, labor conflicts that may affect business and cause loss of income cannot be ruled out. Studsvik works actively to create stable and sound relations with employees and trade union organizations. An active human resources policy with the means and systems required for staff development creates a high level of job satisfaction. In accordance with Swedish legislation Studsvik has employee representatives on the board of the parent company.

STUDSV IK AB (PUBL ) ANNUAL REPORT 2017
ADMINISTRATION REPORT 27
Dependence on key personnel Studsvik offers proprietary technical solutions and services using different types of specialist expertise. This makes the company to some extent dependent on key personnel. This risk is limited by systematizing processes, recruitment and skills development.
Fixed price contracts Studsvik sometimes agrees on a fixed price for large service con-tracts. These contracts require good risk management and project management. Studsvik trains its project managers and applies special procedures that are integrated into the Group’s quality systems to ensure that these risks are managed professionally.
Supplier liabilityStudsvik supplies services with a high technical content to qualified customers. As a supplier, Studsvik is responsible for timely delivery, functionality and other qualities of services ordered. If a service is delivered late or does not fulfill requirements that a customer can rightfully impose, Studsvik risks loss of income and/or costs incurred for replacement or damages. Studsvik makes regular assessments of potential exposures and makes provision for identified risks.
Owner liability for waste Studsvik has owner liability for waste arising from its own processes and operations. In addition, Studsvik has owner liability for a limited period for some waste from its customers. The Group aims to have agreements with sub-contractors on the conditions for final disposal of this waste. Changes in regulatory or commercial conditions that necessitate amendments or supplements to these arrangements cannot be ruled out. The risk is managed through Studsvik periodically calculating the economic effects of these commitments, making provision in the balance sheet for future costs of final disposal, paying in fees in accordance with local regulations and receiving remuneration from customers for Studsvik's commitments.
Dependence on suppliers Part of Studsvik's strategy is to develop customer offers together with selected partners. This can result in a measure of natural dependence on these partners. The design of Studsvik’s contracts enables close relationships based on trust, while keeping alternative partners available.
Financing and political decisions In most countries, nuclear decommissioning and the treatment of radioactive waste require the active involvement of the authorities, for example through decisions on financing, decommissioning permits, and rules regulating final disposal.
In many markets these activities are funded through complex systems involving a combination of accumulated funds, income from the operations of nuclear power plants, and taxes. Conse-quently, political decisions affect demand for Studsvik's services, mainly in the area of decommissioning. Delays in processing by the authorities and resulting delay in completion of contracts cannot be ruled out.
INSURABLE RISKS
Accidents and stoppages Studsvik conducts its business at its own laboratories and facilities. The possibility of an accident at one of these sites, or in connection with transportation to or from a site, cannot be ruled out. Potential accident risks are surveyed regularly and preventive measures are integrated into the Group’s quality and safety systems. In order to reduce the negative impact on profits that an accident and subsequent stoppage could have, all facilities are covered by property insurance and consequential loss insurance has been taken out for all strategic facilities.
Damage caused to a contracting party or third party Error or negligence in performance of a service or delivery of a product can lead to a contracting party or third party suffering physical and/or financial damage. The concept of damage includes personal injury, material damage and financial damage. Third party liability insurance has been taken out to cover Studsvik against the financial risks and consequences its business entails. The business is insured from two risk perspectives; nuclear liability and non-nuclear liability.
In cases where the Group conducts nuclear activities subject to license, it is a licensing requirement that insurance has been taken out and maintained. This is regulated in the Nuclear Liability Act in Sweden and corresponding legislation in other countries. This legislation also regulates the insurance amounts, which are currently SDR 360 (million special drawing rights), equivalent to SEK 4.2 billion. Nuclear liability insurance for the Swedish operations is provided by Nordic Nuclear Insurers (NNI) and European Liability Insurers Limited (ELINI). The non-nuclear operations are insured through a global liability insurance policy with the insurance company IF P&C Insurance Ltd.
OTHER RISKS
Theft, sabotage or attack A company handling radioactive material can never completely exclude the possibility of theft of this material. The transportation of radioactive material, as well as facilities for storage and pro-cessing, can be the target of sabotage or other forms of attack.
Studsvik takes active measures to maintain physical protection in close cooperation with the police and public authorities. The level of physical protection is continually adjusted in line with the assessment of the threat picture made by the police and public authorities. Studsvik follows the plans drawn up by the licensing and supervisory authorities.
Cost liability for decommissioning The operations at Studsvik’s Swedish nuclear facilities are conducted under license pursuant to the Swedish Act on Nuclear Activities and it is therefore Studsvik’s responsibility to decommission the facilities.

STUDSV IK AB (PUBL ) ANNUAL REPORT 2017
28 ADMINISTRATION REPORT
SHAREHOLDERS DECEMBER 31, 2017Number of
shares Holding, %
Karinen Family 1,769,552 21.5Briban Invest AB 1,285,492 15.6Peter Gyllenhammar AB 812,863 9.9Credit Agricole Suisse SA 363,879 4.4Avanza Pensionsförsäkring AB 329,075 4.0Malte Edenius 250,000 3.0Nordnet Pensionsförsäkring AB 234,152 2.9Leif Lundin 192,500 2.3Invus Investment AB 191,594 2.3Unionen 152,709 1.9Total of the 10 largest shareholders – holdings 5,581,816 67.8Other shareholders 2,636,795 32.2Total 8,218,611 100.0
Liability for operational waste Studsvik generates a limited volume of own waste that impacts the environment. When Studsvik processes radioactive waste on behalf of a customer it is the customer that is responsible for the radioactive residual products.
Sensitivity analysis Variations in prices to customers and the Group's costs affect the Group's earnings. The Group's largest single cost item is personnel, which accounts for about 63 per cent of total costs. The Group's currency exposure is greatest against EUR, GBP and USD.
Sensitivity analysis Change Effect on
operating profit
Price to customer 1 % +/– SEK 7.0 millionPersonnel costs 1 % +/– SEK 4.6 millionExchange rate EUR/GBP/USD 10 % +/– SEK 3.3 million
CORPORATE GOVERNANCE The company has drawn up a corporate governance report separate from the administration report, which can be found in the Corporate Governance section.
PROPOSED DISTRIBUTION OF PROFIT The Board of Directors proposes that no dividend be distributed for 2017. Dividend was SEK 1.00 per share in the previous year. The total profits at the disposal of the Annual General Meeting comprise the parent company's non-restricted equity, SEK 12,248,005, consisting of retained earnings, SEK 45,056,865 and profit for the year, SEK –32,808,860. The Board's proposal means the following distribution of profit:
To be carried forward SEK 12,248,005
Total non-restricted equity in the parent company SEK 12,248,005
THE STUDSVIK SHAREShare price and trading The Studsvik share is listed on NASDAQ Stockholm. In 2017 the share price fell by 22 per cent from SEK 59.50 to SEK 46.10. At the close of the year the market value was SEK 372 million. During the year the share price varied between a high of SEK 69.25 on March 8 and a low of SEK 42.10 on December 21.
In 2017, 1.8 million Studsvik shares were traded for a value of SEK 103.9 million. This corresponds to 32 per cent of the free float (the value of shares that are available for trading), to be compared with 51 per cent in the previous year. The free float refers to shares held by shareholders with less than 10 per cent of the capital.
Number of shares and share capital On December 31, 2017 Studsvik AB (publ) had 8,218,611 shares in issue. Each share carries one vote and entitles the owner to share equally in the company's assets and earnings. The quotient value is SEK 1.0 and the share capital amounted to SEK 8.2 million.
Shareholders On December 31, 2017 Studsvik had 3,136 shareholders. The percentage of shares registered abroad was 23 per cent. The three largest owners, the Karinen family, Briban Invest AB and Peter Gyllenhammar AB, held 47 per cent of the shares and the ten largest shareholders 67.8 per cent. The shareholdings of the Board and the Executive Group Management are presented in the sections Board of Directors and auditors and Executive Group Management.
Dividend policy and dividendThe Board's goal is that on average over time the dividend should correspond to at least 30 per cent of the consolidated profit after tax. Decisions on dividend proposals will, however, take into consider-ation Studsvik’s expansion potential, the strength of its balance sheet, liquid funds and financial position in general. The Board of Directors proposes that no dividend be distributed for 2017.
Market maker Remium AB has been appointed to act as market maker for the company's share.
ANALYSTS The Studsvik share is monitored on a continuous basis by Remium.
INFORMATION ON THE ARTICLES OF ASSOCIATION ETC. There is no provision in Studsvik's Articles of Association that restricts the right to transfer shares. The company has not trans-ferred any of its own shares or issued new shares during the financial year. The company is not aware of any agreements between shareholders that may result in restrictions on the right to transfer shares in the company. The company is not a party to any material agreement that is affected by any public take-over bid. The company’s employees do not hold any shares for which the voting right cannot be exercised directly. The elected members of the Board of Directors are appointed by the Annual General Meeting. There is no provision in the Articles of Association concerning appointment and dismissal of Board members. The Board of Directors is not authorized to decide on the issue of new shares or acquisition of own shares.

STUDSV IK AB (PUBL ) ANNUAL REPORT 2017
ADMINISTRATION REPORT 29
CHANGE IN SHARE CAPITAL
Year Transaction
Increase in number of
sharesShare capital
SEK
Total number of
shares
1994 Formation 500,000 500,000 500,000
2001 Bonus issue 5,300,000 5,800,000 5,800,000
2001 Private placement 2,314,211 8,114,211 8,114,211
2004 New issue1) 2,400 8,116,611 8,116,611
2005 New issue1) 102,000 8,218,611 8,218,611
1) Conversion of warrants.
SHAREHOLDER STRUCTURE, DECEMBER 31, 2017
ShareholdingNumber of
shareholdersNumber of
shares% of total
shares
1 – 500 2,700 248,673 3.0
501 – 1 000 187 159,371 1.9
1 001 – 5 000 165 368,079 4.5
5 000 – 10 000 20 145,387 1.8
10 001 – 15 000 17 207,595 2.5
15 001– 20 000 3 55,636 0.8
20 001 – 44 7,033,870 85.5
Summa 3,307 8,218,611 100.0
DATA PER SHAREAmount, SEK 2013 2014 2015 2016 2017
Number of shares at close of period 8,218,611 8,218,611 8,218,611 8,218,611 8,218,611
Average number of shares 8,218,611 8,218,611 8,218,611 8,218,611 8,218,611
Price, December 31 37.80 32.80 32.70 59.50 46.10
Earnings per share from continuing operations before and after dilution –2.78 0.63 1.78 2.07 –5.47
Earnings per share from operations to be sold before and after dilution –21.15 –2.09 –1.49 5.60 –
Equity per share 34.83 35.64 36.30 42.41 35.09
P/E ratio neg neg 112 7.8 neg
0
200
400
600
800
1 000
1 200
1 400
1 600
Traded number of shares in 1 000s per month
201720162015201420130
10
20
30
40
50
60
70
80
OMX Stockholm_PI
Studsvik
Source:

30 CONSOLIDATED ACCOUNTS
STUDSV IK AB (PUBL ) ANNUAL REPORT 2017
Consolidated statement of profit or loss and other comprehensive income
Continuing operations Note 2017 2016
Sales revenues 4 704,833 758,771Costs of services sold 7 –539,121 –535,279Gross profit 165,712 223,492Selling and marketing costs 7 –44,196 –44,416Administrative expenses 7, 8 –116,901 –112,789Research and development costs 7 –28,178 –27,534Profit share from associated companies and joint ventures 17, 18 8,680 4,145Other operating income 5 2,843 8,195Other operating expense 6 –29,526 –26,403Operating profit 4, 5, 6, 7, 8, 9 –41,567 24,690Financial income 10 980 128Financial expenses 10 –15,309 –24,957Fair value gain/loss (realized and unrealized) 10, 12 –2,757 –391Profit/loss before tax –58,654 –530Income tax 11 13,662 8,666Profit/loss for the year from continuing operations –44,991 8,136
Operations held for saleProfit/loss for the year from operations held for sale 39 0 46,003NET PROFIT/LOSS FOR THE YEAR –44,991 54,139
Other comprehensive incomeItems that may later be reversed in the income statementTranslation differences on foreign subsidiaries 28 –9,904 –4,593Cash flow hedges 4,058 781Income tax on items recognized in other comprehensive income –893 –172Other comprehensive income for the year, net after tax –6,739 –3,984Total profit or loss and other comprehensive income for the year –51,730 50,155
Income for the year attributable toParent company’s shareholders 27 –44,991 54,139Non-controlling interests – –
Total comprehensive income attributable toParent company’s shareholders –51,695 50,125Non-controlling interests –35 30
Earnings per share calculated on income attributable to the parent company's shareholders during the year (SEK)Earnings per share before and after dilutionProfit/loss from continuing operations 13 –5.47 0.99Profit/loss from operations held for sale – 5.60NET PROFIT/LOSS FOR THE YEAR –5.47 6.59
Amounts in SEK ’000

CONSOLIDATED ACCOUNTS 31
STUDSV IK AB (PUBL ) ANNUAL REPORT 2017
Group statement of financial position
Note 2017 2016
ASSETSNon-current assetsProperty, plant and equipment 15 116,556 113,317Intangible assets 16 177,407 178,037Holdings in associated companies and joint ventures 17, 18 6,867 9,254Deferred tax assets 31 98,097 89,902Financial assets at fair value through profit or loss 19, 23 30,928 29,938Derivative instruments 19, 21, 23 95 –Trade and other receivables 19, 22 26,664 26,676Total non-current assets 456,614 447,124
Current assetsInventories 24 622 1,967Trade and other receivables 19, 22 266,329 254,329Financial assets at fair value through profit or loss 19, 23 – –Derivative instruments 19, 21, 23 2,638 2,246Cash and cash equivalents 19, 25 98,672 195,363Total current assets 368,261 453,905Assets in operations held for sale 39 – –TOTAL ASSETS 824,875 901,029
EQUITYCapital and reserves attributable to parent company's shareholdersShare capital 26 8,219 8,219Other contributed capital 26 225,272 225,272Other reserves 28 4,785 11,528Retained earnings 27 49,858 103,068Equity attributable to the parent company’s shareholders 288,134 348,087Non-controlling interests 339 374Total equity 288,473 348,461
LIABILITIESLong-term liabilitiesBorrowings 19, 30 199,850 198,250Derivative instruments 19, 21, 23 – 1,139Deferred tax liabilities 31 33,283 32,156Pension obligations 32 9,767 5,525Other provisions 33 106,755 107,721Trade and other payables 29 14,987 15,180Total long-term liabilities 364,642 359,971
Current liabilitiesTrade and other payables 29 162,001 179,486Current tax liabilities 880 5,704Borrowings 19, 30 – –Derivative instruments 19, 21, 23 2,862 4,790Other provisions 33 6,017 2,617Total current liabilities 171,760 192,597Liabilities in operations held for sale 39 – –Total liabilities 536,402 552,568TOTAL EQUITY AND LIABILITIES 824,875 901,029
Amounts in SEK ’000
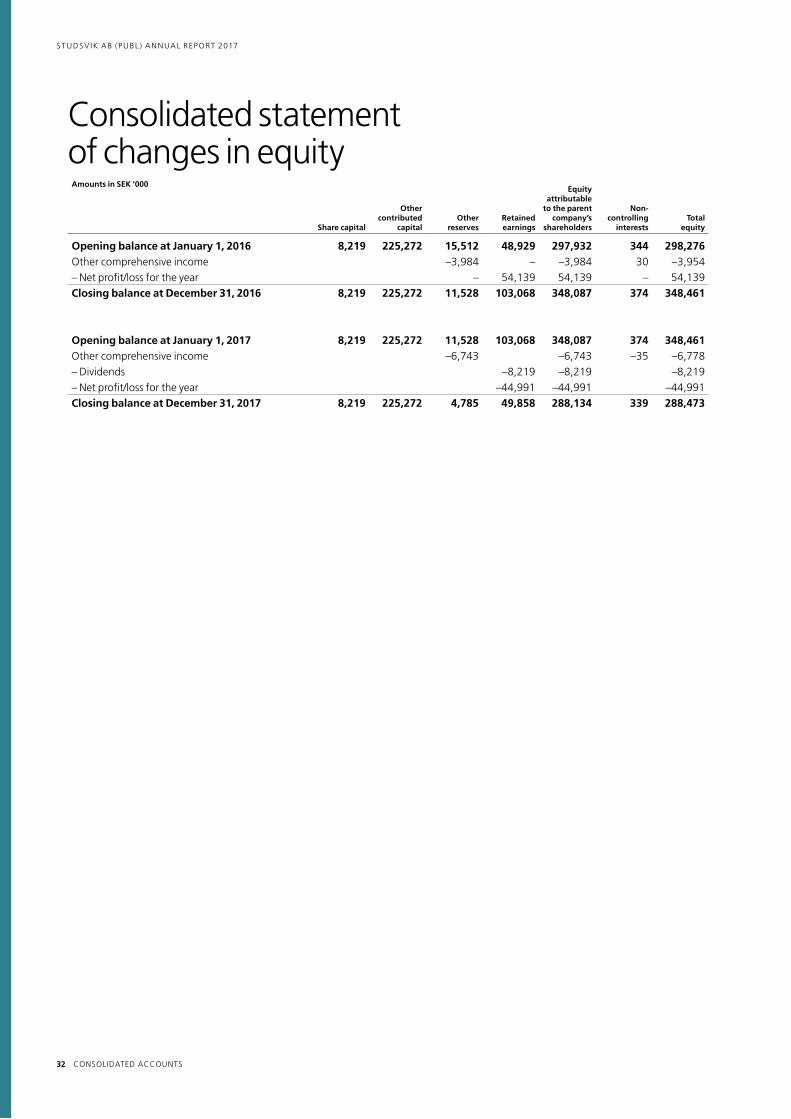
32 CONSOLIDATED ACCOUNTS
STUDSV IK AB (PUBL ) ANNUAL REPORT 2017
Consolidated statement of changes in equity
Share capital
Other contributed
capitalOther
reservesRetainedearnings
Equity attributable
to the parent company’s
shareholders
Non- controlling
interestsTotal
equity
Opening balance at January 1, 2016 8,219 225,272 15,512 48,929 297,932 344 298,276Other comprehensive income –3,984 – –3,984 30 –3,954– Net profit/loss for the year – 54,139 54,139 – 54,139Closing balance at December 31, 2016 8,219 225,272 11,528 103,068 348,087 374 348,461
Opening balance at January 1, 2017 8,219 225,272 11,528 103,068 348,087 374 348,461Other comprehensive income –6,743 –6,743 –35 –6,778– Dividends –8,219 –8,219 –8,219– Net profit/loss for the year –44,991 –44,991 –44,991Closing balance at December 31, 2017 8,219 225,272 4,785 49,858 288,134 339 288,473
Amounts in SEK ’000
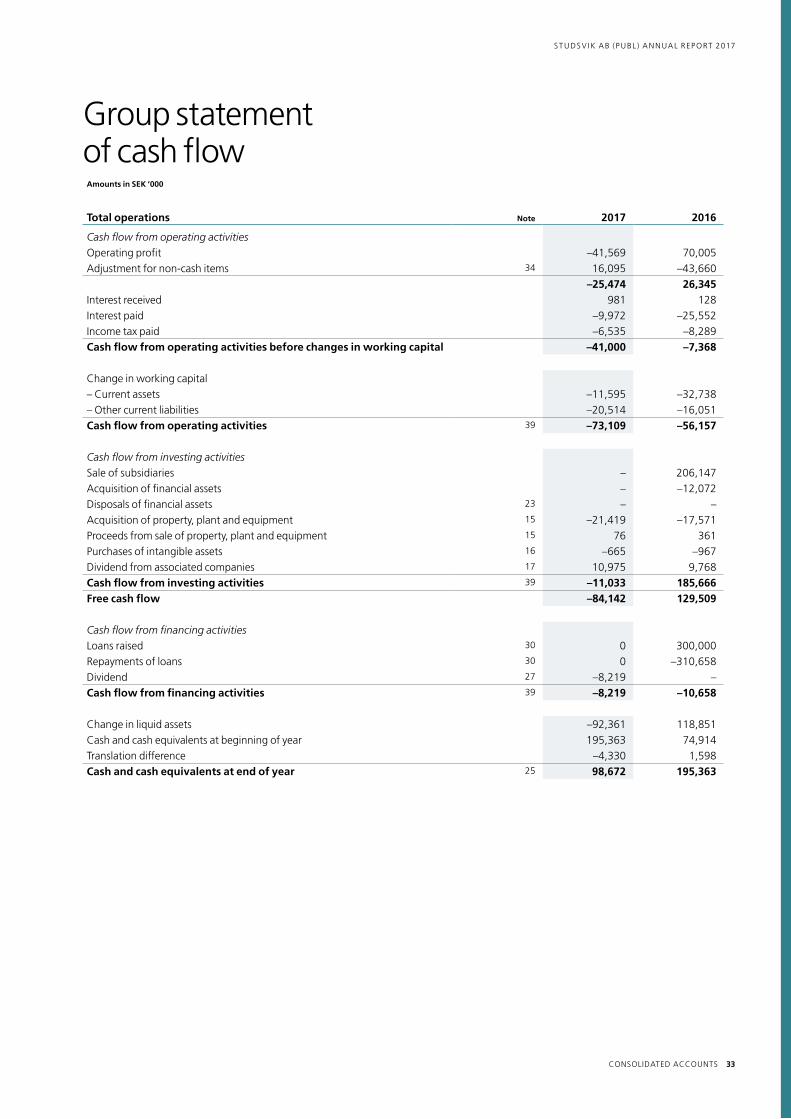
CONSOLIDATED ACCOUNTS 33
STUDSV IK AB (PUBL ) ANNUAL REPORT 2017
Group statement of cash flow
Total operations Note 2017 2016
Cash flow from operating activitiesOperating profit –41,569 70,005Adjustment for non-cash items 34 16,095 –43,660
–25,474 26,345Interest received 981 128Interest paid –9,972 –25,552Income tax paid –6,535 –8,289Cash flow from operating activities before changes in working capital –41,000 –7,368
Change in working capital– Current assets –11,595 –32,738– Other current liabilities –20,514 –16,051Cash flow from operating activities 39 –73,109 –56,157
Cash flow from investing activitiesSale of subsidiaries – 206,147Acquisition of financial assets – –12,072Disposals of financial assets 23 – –Acquisition of property, plant and equipment 15 –21,419 –17,571Proceeds from sale of property, plant and equipment 15 76 361Purchases of intangible assets 16 –665 –967Dividend from associated companies 17 10,975 9,768Cash flow from investing activities 39 –11,033 185,666Free cash flow –84,142 129,509
Cash flow from financing activitiesLoans raised 30 0 300,000Repayments of loans 30 0 –310,658Dividend 27 –8,219 –Cash flow from financing activities 39 –8,219 –10,658
Change in liquid assets –92,361 118,851Cash and cash equivalents at beginning of year 195,363 74,914Translation difference –4,330 1,598Cash and cash equivalents at end of year 25 98,672 195,363
Amounts in SEK ’000

34 PARENT COMPANY ACCOUNTS
STUDSV IK AB (PUBL ) ANNUAL REPORT 2017
Parent company income statement
Note 2017 2016
Sales revenues 42 19,668 22,453Costs of services sold 45 –900 –2,779Gross profit 18,768 19,674Administrative expenses 44 –39,220 –36,849Other operating income 46 829 997
Other operating expense 46 –9,459 –134Operating profit 42, 43, 44, 45, 46, 47 –29,081 –16,312Profit/loss from participations in group companies 48 0 14,311Interest income and similar items 49 10,150 18,864Interest expense and similar items 50 –23,225 –25,012Profit/loss before tax –42,156 –8,149Appropriations 51 – –Income tax 52 9,348 4,058NET PROFIT/LOSS FOR THE YEAR –32,809 –4,091
Parent company statement of comprehensive incomeNet profit/loss for the year –32,809 –4,091Other comprehensive income – –Total comprehensive income for the year –32,809 –4,091
Amounts in SEK ’000

PARENT COMPANY ACCOUNTS 35
STUDSV IK AB (PUBL ) ANNUAL REPORT 2017
Parent company balance sheet
Note 2017 2016
ASSETS
Non-current assetsIntangible assets 53 1,869 2,571Property, plant and equipment– Equipment and tools – –Financial assets 54
– Deferred tax assets 17,264 7,917– Shares in subsidiaries 56 383,740 383,740– Participations in associated companies and joint ventures 54 12,073 12,073– Receivables from subsidiaries 54 203,662 222,711Financial assets at fair value through profit or loss 54 27,067 26,450Derivative instruments 61 – –Total non-current assets 645,675 655,462Current assetsInventories and goods for resale 458 539Trade and other receivables 5,848 5,842Derivative instruments 61 – –Receivables from group companies 986 9,788Prepaid expenses and accrued income 55 943 7,901Cash and cash equivalents 24,853 43,938Total current assets 33,088 68,008TOTAL ASSETS 678,763 723,470
EQUITYEquityShare capital 8,219 8,219Restricted reserves 225,272 225,272Total restricted equity 233,491 233,491Non-restricted equityNon-restricted reserves 45,056 57,367Net profit/loss for the year –32,809 –4,091Total non-restricted equity 12,247 53,276Total equity 245,738 286,767
Untaxed reserves – –
LIABILITIESLong-term liabilitiesLiabilites to credit institutions 57 199,850 198,250Deferred tax liabilities – –Liabilities to group companies 29,544 54,550Other liabilities 14,028 14,191Total long-term liabilities 243,422 266,991Current liabilitiesLiabilities to group companies 166,432 155,533Trade payables 1,292 2,315Liabilities to credit institutions 57 – –Derivative instruments 61 – –Other liabilities 2,631 3,123Accrued expenses and deferred income 58 19,248 8,741Total current liabilities 189,603 169,712Total liabilities 433,025 436,703TOTAL EQUITY AND LIABILITIES 678,763 723,470
Amounts in SEK ’000

36 PARENT COMPANY ACCOUNTS
STUDSV IK AB (PUBL ) ANNUAL REPORT 2017
Parent company statement of changes in equity
Share capital
Othercontributed
capitalRetainedearnings
Equity attributable
to the parent company’s
shareholdersTotal
equity
Opening balance at January 1, 2016 8,219 225,272 57,367 290,858 290,858Comprehensive income– Net profit/loss for the year –4,091 –4,091 –4,091Closing balance at December 31, 2016 8,219 225,272 53,276 286,767 286,767
Opening balance at January 1, 2017 8,219 225,272 53,276 286,767 286,767Comprehensive income– Dividends –8,220 –8,220 –8,220– Net profit/loss for the year –32,809 –32,809 –32,809Closing balance at December 31, 2017 8,219 225,272 12,247 245,738 245,738
Amounts in SEK ’000

PARENT COMPANY ACCOUNTS 37
STUDSV IK AB (PUBL ) ANNUAL REPORT 2017
Parent company cash flow statement
Note 2017 2016
Cash flow from operating activitiesOperating profit –29,081 –16,312Adjustment for non-cash items 63 702 –564
–28,379 –16,876Interest received 10,150 2,924Interest paid –13,727 –25,003Income tax paid – –Cash flow from operating activities before changes in working capital –31,956 –38,955
Change in working capital– Current assets 17,021 27,720– Other current liabilities 20,442 87,284Cash flow from operating activities 5,507 76,049
Cash flow from investing activitiesGroup contribution received – 14,311Acquisition of property, plant and equipment 53 – –Acquisition of financial assets 54 – –23,034Amortization of financial assets 54 16,695Loans to group companies 54 – –37,886Cash flow from investing activities 16,695 –46,609
Cash flow from financing activitiesLoans raised – 300,000Repayments of loans –33,067 –300,000Dividend paid –8,220 –Cash flow from financing activities –41,287 –
Change in liquid assets –19,085 29,440Cash and cash equivalents at beginning of year 49,938 14,498Cash and cash equivalents at end of year 24,853 43,938
Amounts in SEK ’000

38 NOTES TO THE CONSOLIDATED ACCOUNTS
STUDSV IK AB (PUBL ) ANNUAL REPORT 2017
Amounts in SEK ‘000 unless otherwise stated
NOTES TO THE CONSOLIDATED ACCOUNTS
Notes
Note 1 Accounting policies and valuation principles
The principal accounting policies applied in the preparation of these consolidated accounts are set out below. These policies have been applied consistently to all the years presented, unless otherwise stated.
1.1. BASIS OF PREPARATIONThe consolidated accounts for the Studsvik Group have been prepared in accordance with the Annual Accounts Act, the Swedish Financial Reporting Board recommendation RFR 1, Supplementary accounting rules for groups, International Financial Reporting Standards (IFRS) and interpretations by the IFRS Interpretations Committee (IFRIC) as adopted by the EU. The consolidated accounts have been prepared in accordance with the historical cost method except as regards financial assets and liabilities carried at fair value through profit or loss. Preparing statements in accordance with IFRS requires the use of a number of important accounting estimates. Furthermore, the management must make certain judgments when applying the Group’s accounting policies. The areas that entail a high degree of judgment, which are complex or of such a nature that assumptions and estimates are critical to the consolidated accounts are specified in note 3.
Standards, amendments and interpretations that have come into force and are applied by the GroupNone of the IFRS and IFRIC interpretations that are compulsory for the first time in the financial year starting on January 1, 2017 apply to the Group. Other standards, amend-ments and interpretations that come into force for the financial year starting on January 1, 2017, have no material impact on the Group’s financial statements.
New and amended standards applied by the GroupThe following standards will be applied by the Group for the first time for the finan-cial year starting on January 1, 2017:• Accounting for acquisitions of interests in joint operations – Amendments to IFRS 11• Clarification of acceptable methods of depreciation and amortization –
Amendments to IAS 16 and IAS 38• Annual improvements to IFRS standards, 2012-2014 cycle, and Disclosure
Initiative: Amendments to IAS 1
The application of these amendments has not had any impact on the Group’s accounting policies or disclosures for the current financial year or the previous finan-cial year and neither is it expected to have any impact on coming periods.
A number of new standards and interpretations will come into force for financial years starting on or after January 1, 2017 and have not been applied when prepar-ing these financial statements. These new standards and interpretations are expected to impact the Group’s financial statements as follows:
Implementation of new International Financial Reporting StandardsAs of January 1, 2018 IFRS 9 Financial instruments and IFRS 15 Revenue from contracts with customers come into force. The Group has carried out an analysis to evaluate the effects of implementation of the new standards. As of January 1, 2019 IFRS 16 comes into force. IFRS 9IFRS 9 deals with classification, measurement and accounting for financial assets and liabilities and introduces new rules for hedge accounting. The standard replaces the parts of IAS 39 that deal with classification and measurement of financial instruments and introduces a new impairment model. The Group has not identified any material impact on classification, measurement or recognition of the Group’s financial assets and liabilities. The rules for derecognition from the balance sheet have been transferred from IAS 39 Financial instruments: Recognition and measurement have not been changed. The new hedge accounting rules in IFRS 9 are more consistent with the company’s risk management in practice. It will be easier in general to apply hedge accounting since the standard introduces a more principles-based approach for hedge accounting. The Group’s current hedging situation will continue to qualify for hedge accounting and the accounting treatment will be the same as before under IFRS 9. The new model for calculating credit loss reserves is based on expected credit losses, instead of incurred credit losses under IAS 39, which could entail earlier recognition of credit losses. The model is to be applied to financial assets
recognized at amortized cost, debt instruments measured at fair value through other comprehensive income, contract assets under IFRS 15 Revenue from contracts with customers, lease receivables, loans and some financial guarantees. Analysis carried out shows that the Group’s reserves for credit losses will not be materially impacted by the new rules. The extended disclosure requirements that follow from the new standard will mean changes in future financial statements. IFRS 9 is to be applied retroactively with some practical exceptions presented in the standard. The Group will not restate previous periods.
IFRS 15IFRS 15 is the new standard for revenue recognition. IFRS 15 replaces IAS 18 Reve-nue and IAS 11 Construction contracts. IFRS 15 is based on the principle that revenue is recognized when the customer obtains control over a good or service, a principle that replaces the earlier principle that revenue is recognized when risks and rewards have been transferred to the buyer.
Implementation of IFRS 15 will have an impact in principle. This applies to Studsvik’s recognition of license revenues. Under IFRS 15 one form of license that Studsvik sells is deemed to be a “right to use” license where control of the license is obtained by the customer directly at the time of its sale and delivery. Previously some licenses have been recognized in revenue over the period of the contract. The difference between IFRS 15 application and earlier principles means that Studsvik will recognize the revenue earlier. For other customer contracts analyzed, no material differences in revenue recognition have emerged. A company can choose between a “full retroactive” application or prospective application with further disclosures in future periods to provide comparability for users of the financial statements. Studsvik will present the transition to IFRS 15 prospectively from January 1, 2018. This means that accumulated positive revenue effects of ongoing license agreements of SEK 1.5 million will be recognized in equity (retained earnings) on January 1, 2018. The income statement for 2017 will not be restated, which means that comparative figures in the income statement for 2017 will be reported unchanged in future financial statements.
IFRS 16 LeasesIFRS 16 was published in January 2016. Implementation of the standard will mean that almost all leases will be recognized in the balance sheet, as no differentiation is made any longer between operating and finance leases. Under the new standard an asset (the right to use a leased asset) and a financial liability to make lease payments must be recognized. Short-term leases and leases of low-value assets are exempted. Lessors’ accounting will essentially be unchanged.
The standard will mainly impact reporting of the Group’s operating leases. On the balance sheet date the Group’s non-cancellable operating leases amounted to SEK 22,923 thousand, see note 36. However, the Group has not yet evaluated the extent to which these obligations will be recognized as assets and liabilities and how this will affect the Group’s earnings and classification of cash flows.
Some obligations may be covered by the exemption for short-term leases and leases of low-value asset and some obligations may refer to arrangements that are not to be recognized as leases under IFRS 16.
The standard is effective from January 1, 2019 and at present the Group does not intend to opt for early application.
1.2 CONSOLIDATED ACCOUNTS Subsidiaries Subsidiaries are all companies over which the Group has a controlling interest (note 56). The Group controls a company when it is exposed, or has rights, to variable returns from its involvement with the company and has the ability to affect those returns through its power over the company. Subsidiaries are fully consolidated from the date on which control is transferred to the Group. They are de-consolidated from the date that control ceases.
The acquisition method of accounting is used to account for the Group’s business combinations. The purchase price for the acquisition of a subsidiary consists of the fair value of transferred assets, liabilities and shares issued by the Group. The purchase price also includes the fair value of all assets and liabilities that are a consequence of an agreement on contingent purchase price. Acquisition related costs are recognized as expenses when they arise. Identifiable assets acquired and liabilities and contingent liabilities assumed in a business combination are measured initially at their fair value at the acquisition date. For each acquisition the Group determines if all non-controlling interests in the acquired company are to be measured at fair value or at their

NOTES TO THE CONSOLIDATED ACCOUNTS 39
STUDSV IK AB (PUBL ) ANNUAL REPORT 2017
proportionate share of the acquiree’s identifiable net assets. The excess of the purchase price, any non-controlling interest and fair value on the acquisition date of prior shareholdings over the fair value of the Group’s share of identifiable net assets acquired is recognized as goodwill. If the amount is less than the fair value for the acquired subsidiary’s assets in the case of a “bargain purchase”, the difference is recognized directly in the statement of comprehensive income.
Inter-company transactions, balances and unrealized gains on transactions between Group companies are eliminated. Accounting policies of subsidiaries have been changed where necessary to ensure consistency with the policies adopted by the Group.
Transactions with non-controlling interestsThe Group treats transactions with non-controlling interests as transactions with the Group’s shareholders. For acquisitions from non-controlling interests the difference between the purchase price paid and the actual acquired share of the carrying amount of the subsidiary’s net assets is recognized directly in equity. Gains and losses on sales to non-controlling interests are also recognized in equity.
When the Group no longer has a controlling interest or significant influence, each remaining holding is revalued to fair value and the change in the carrying amount is recognized in the income statement. The fair value is used as the first carrying amount and forms the basis of continued accounting treatment of the remaining holding as an associated company, joint venture or financial asset. All amounts referring to the entity sold, which were previously recorded in other comprehensive income, are recorded as though the Group had sold the related assets or liabilities directly. This may mean that amounts previously recorded in other comprehensive income are reclassified to profit or loss.
If the participating interest in an associated company decreases, but a significant influence nevertheless remains, where relevant only a proportional share of the amounts previously recorded in other comprehensive income is reclassified to profit or loss.
Associated companiesAssociated companies are all entities over which the Group has significant influence but not control, generally accompanying a shareholding of between 20 per cent and 50 per cent of the voting rights. Investments in associated companies are accounted for in accordance with the equity method and initially recorded at cost. The Group’s carrying amount for investments in associated companies includes goodwill identified on acquisition, net of any impairment.
The Group’s share of the post-acquisition profit or loss of an associated company is recognized in the income statement and its share of post-acquisition changes in other comprehensive income is recognized in other comprehensive income. The cumulative post-acquisition changes are adjusted against the carrying amount of the investment. When the Group’s share of losses in an associated company equals or exceeds its interest in the associated company, including any unsecured receivables, the Group does not recognize further losses, unless it has incurred obligations or made payments on behalf of the associated company.
Unrealized gains on transactions between the Group and its associated companies are eliminated in relation to the Group’s holding in the associated company. Unrealized losses are also eliminated, unless the transaction provides evidence of an impairment of the asset transferred. Accounting policies of associated companies have been amended where necessary to ensure consistency with the policies adopted by the Group. Dilution gains and losses on participations in associated companies are recognized in the income statement.
Joint venturesFor joint ventures, where there is a common controlling interest, the equity method is applied. Interests in a joint venture are initially recognized at cost at the time of acquisition and adjusted on a current basis by its share of changes in the equity of the entity under common control.
The Group’s share of the profit from the entity under common control is recognized in the consolidated statement of comprehensive income. If the Group’s share of accumulated losses is equal to or more than the Group’s share of the equity of the entity under common control, the Group does not recognize further losses.
1.3 SEGMENT REPORTING Operating segments must be reported in line with the internal reports submitted to the chief operating decision maker. The chief operating decision maker has been identified as the President.
1.4 FOREIGN CURRENCY TRANSLATIONFunctional and presentation currency Items included in the financial statements of each of the Group’s entities are measured using the currency of the primary economic environment in which the entity operates (functional currency). The consolidated financial statements are presented in SEK, which is the parent company’s functional and presentation currency. Transactions and balances Foreign currency transactions are translated into the functional currency using
the exchange rates prevailing at the dates of the transactions. Foreign exchange gains and losses resulting from the settlement of such transactions and from the translation at year-end exchange rates of monetary assets and liabilities denominated in foreign currencies are recognized in the income statement. An exception is when the transactions qualify as cash flow hedges, in which case the gains/losses are recognized in other comprehensive income.
Foreign exchange gains and losses attributable to loans and cash and cash equivalents are recognized in the income statement as financial income or expense. All other foreign exchange gains or losses, mainly on trade receivables and trade payables, are recorded in the items ‘Other operating income’ and ‘Other operating expenses’ in the income statement.
Translation differences for non-monetary financial assets and liabilities are recorded as part of fair value gains/losses. Translation differences for non-monetary financial assets and liabilities, such as shares recognized at fair value in the income statement, are recorded in the income statement as part of fair value gains/losses.
Group companies The results and financial position of all the Group companies (none of which has the currency of a hyperinflationary economy) that have a functional currency different from the presentation currency are translated into the Group’s presentation currency as follows: • Assets and liabilities for each balance sheet presented are translated at the
closing rate. • Income and expenses for each income statement are translated at average
exchange rates. • All foreign exchange differences arising are recorded in other comprehensive income.
On consolidation, foreign exchange differences arising from the translation of the net investment in foreign operations, and of borrowings and other currency instruments designated as hedges of such investments, are recognized in other comprehensive income. When a foreign business is sold, fully or partly, the currency differences reported in equity are transferred to the income statement and recognized as part of the capital gain/loss. Goodwill and fair value adjustments arising on the acquisition of a foreign entity are treated as assets and liabilities of the foreign entity and translated at the closing rate.
1.5 PROPERTY, PLANT AND EQUIPMENT Property, plant and equipment is recorded at historical cost less depreciation. The Group applies depreciation of components, where each part of an item of property, plant and equipment with a cost of acquisition that is significant in relation to the total cost of the item is to be depreciated separately. Historical cost includes expenses directly attributable to the acquisition of the asset. Expenditure for dismantling and restoration is added to the historical cost and reported as a separate component. Dismantling and restoration costs during the useful life of the asset are calculated annually on the basis of the evaluation made on each date of estimate. Any adjustments of the future costs adjust the cost of acquisition of the asset.
Subsequent costs are included in the asset’s carrying amount or recognized as a separate asset, as appropriate, only when it is probable that the future economic benefits associated with the item will flow to the Group and the cost of the item can be measured reliably. The carrying amount for the replaced part is removed from the balance sheet. All other repairs and maintenance are charged to the income statement during the financial period in which they are incurred.
Land is not depreciated. Depreciation on other assets is calculated using the straight-line method to allocate their cost or revalued amounts to their residual values over their estimated useful lives as follows: • Buildings and land improvements 20–50 years• Plant and machinery 3-20 years • Equipment and tools 3-20 years
The assets’ residual values and useful lives are reviewed, and adjusted if appropriate, at each balance sheet date.
An asset’s carrying amount is written down immediately to its recoverable amount if the asset’s carrying amount is greater than its estimated recoverable amount.
Gains and losses on disposals are determined by comparing sales proceeds with the carrying amount and are recorded under ‘Other operating income’ and ‘Other operating expenses’ in the income statement.
1.6 INTANGIBLE ASSETS Goodwill Goodwill on acquisition of subsidiaries is included in intangible assets. Goodwill on acquisition of associated companies is included in the value of investments in associated companies and tested for impairment as part of the value of the total investment. Goodwill that is disclosed separately is tested annually for impairment and recognized at cost less accumulated impairment losses. Goodwill impairment loss is not reversed. Gains and losses on the disposal of an entity include the carrying amount of goodwill relating to the entity sold.
40 NOTES TO THE CONSOLIDATED ACCOUNTS
STUDSV IK AB (PUBL ) ANNUAL REPORT 2017
Goodwill is allocated to cash-generating units when tested for impairment. Allo-cation is to the cash-generating units or groups of cash-generating units that are expected to benefit from the business combination giving rise to the goodwill item.
Computer software Acquired computer software licenses are capitalized on the basis of the costs incurred to acquire and bring to use the specific software. These capitalized costs are amortized over the estimated useful life (normally 10 years).
Costs associated with developing or maintaining computer software are recognized as an expense as incurred.
Development costs for software recognized as an asset are amortized over the estimated useful life.
Contractual customer relations and similar rightsContractual customer relations and similar rights consist mainly of customer relations and contracts as well as some tenancy rights. Documents to verify their capitalization could be business plans, budgets or the company’s assessments of future outcomes. An individual assessment is made for each item. Amortization starts when the asset is ready for use and subsequently continues over the estimated useful life. Contractual customer relations are amortized over 15 years The amortization period for other rights varies.
1.7 IMPAIRMENT LOSSES ON NON-FINANCIAL ASSETS Assets that have an indefinite useful life, such as goodwill, are not subject to amortization and are tested annually for impairment. Assets that are subject to amortization are reviewed for impairment whenever events or changes in circumstances indicate that the carrying amount may not be recoverable. An impairment loss is recognized for the amount by which the asset’s carrying amount exceeds its recoverable amount. The recoverable amount is the higher of an asset’s fair value less selling costs and value in use. For the purposes of assessing impairment, assets are grouped at the lowest levels for which there are separately identifiable cash flows (cash-generating units). Assets other than financial assets and goodwill for which an impairment loss has previously been recognized, are tested to establish if any reversal should be made.
1.8 FINANCIAL ASSETS The Group classifies its financial assets in the following categories: financial assets at fair value through profit or loss, loans and receivables and derivatives for hedging. The classification depends on the purpose for which the financial asset was acquired. The management determines the classification of financial assets when they are first reported.
Financial assets at fair value through profit or loss Financial assets at fair value through profit or loss are financial assets held for trading. A financial asset is classified in this category if it is acquired mainly for the purpose of selling in the short term Derivatives are classified as held for trading if they are not designated as hedging instruments. Assets in this category are classified as current assets if they are expected to be settled within 12 months. Otherwise they are classified as non-current assets.
Loans and receivables Loans and receivables are non-derivative financial assets with fixed or determinable payments that are not quoted in an active market. They are included in current assets, except for maturities greater than 12 months after the balance sheet date. These are classified as non-current assets. The Group’s loans and receivables comprise ‘Trade and other receivables’ and ‘Cash and cash equivalents’ in the balance sheet (notes 22 and 25).
Derivatives for hedgingDerivatives that are classified as hedging instruments are designated as hedges and qualify for hedge accounting treatment. The Group normally only enters into derivatives contracts when they qualify for hedge accounting treatment. The Group’s derivatives are recorded as current and long-term assets and liabilities.
Recognition and measurementPurchases and sales of financial assets are recognized on the trade date – the date on which the Group commits to purchase or sell the asset Financial instruments are initially recognized at fair value plus transaction costs for all financial assets not carried at fair value through profit or loss. Financial assets recognized at fair value through profit or loss are initially recognized at fair value, while related transaction costs are recognized in the income statement. Financial assets are derecognized when the rights to receive cash flows from the instruments have expired or have been transferred and the Group has transferred substantially all risks and benefits of ownership.
Financial assets at fair value through profit or loss are subsequently carried at fair value after the date of acquisition. Loans and trade receivables are carried at amortized cost after the acquisition date, applying the effective interest method. Trade receivables with short maturities are recognized at nominal value.
Gains and losses arising from changes in the fair value of the “financial assets at fair value through profit or loss” category, are presented in the income statement in the period in which they arise under the items ‘Other operating income’ and ‘Other operating expenses’.
1.9 OFFSET OF FINANCIAL INSTRUMENTSFinancial assets and liabilities are offset and recognized net in the balance sheet only if there is a legally enforceable right to set off the recognized amounts and an intention to settle on a net basis, or to realize the asset and settle the liability simultaneously. The legal right may not be contingent on a future event and it must be legally enforceable on the company and the counterparty, both in the normal course of business or in the event of default, insolvency or bankruptcy.
1.10 IMPAIRMENT LOSSES ON FINANCIAL ASSETSAssets carried at amortized cost The Group assesses at the close of each accounting period whether there is objective evidence that a financial asset or group of financial assets is impaired. A financial asset or group of financial assets is impaired, and impairment losses are recognized, only if there is objective evidence as a result of one or more events that occurred after the initial recognition of the asset (a loss event) and this event (or events) has an impact on the estimated future cash flows of the financial asset or group of financial assets that can be reliably measured.
The Group first assesses whether there is objective evidence of impairment. The impairment is estimated as the difference between the carrying amount of
the asset and the present value of estimated future cash flows (excluding future credit losses that have not yet occurred), discounted at the original effective interest rate of the financial asset. The carrying amount of the asset is written down and the impairment loss is recognized in the consolidated income statement. If a loan or investment held to maturity has a variable interest rate, the current contractual effective interest rate used as the discount rate when impairment has been established. As a practical solution, the Group can establish impairment loss on the basis of the fair value of the instrument using an observable market price. If the impairment loss decreases in a subsequent period and the decrease can be related objectively to an event occurring after the impairment was recognized (for example an improvement in the debtor’s creditworthiness), the previously recognized impairment loss is reversed through the consolidated income statement.
1.11 DERIVATIVE INSTRUMENTS AND HEDGING ACTIVITIES Derivatives are recognized in the balance sheet on the date of the contract at fair value, both initially and on subsequent remeasurement. The method of reporting the gain or loss arising on revaluation depends on whether the derivative is identified as a hedging instrument, and, if so, the nature of the hedged item. The Group identifies certain derivatives as either:• a hedge of the fair value of a recognized asset or liability or a firm commitment
(fair value hedge), • a hedge of a particular risk associated with a recognized asset or liability or a
highly probable forecast transaction (cash flow hedge).
When the transaction is entered into, the Group documents the relationship between the hedging instrument and the hedged item, as well as the Group’s risk management objective and strategy for undertaking the hedge. The Group also documents its assessment, both when the hedge is undertaken and on a continuous basis, of whether the derivative instruments used in hedging transactions are effective in offsetting the changes in the fair value or cash flows of the hedged items.
Information on the fair value of the different derivative instruments used for hedging purposes is given in note 21. The entire fair value of a derivative designated as a hedging instrument is classified as a non-current asset or liability when the remaining maturity of the hedged item is more than 12 months and as a current asset or liability when the remaining maturity of the hedged item is less than 12 months.
Fair value hedgingThe Group only applies fair value hedging for certain financial non-current assets and borrowing.
Cash flow hedging The effective portion of the change in fair value of a derivative instrument identified as a cash flow hedge and satisfying the criteria for hedge accounting, is reported in other comprehensive income. The gain or loss referring to the ineffective portion is recognized immediately in the income statement in the items ‘Other operating income’ or ‘Other operating expenses’ - net. When a hedging instrument matures or is sold or when the hedge no longer fulfills the criteria for hedge accounting and accumulated gains or losses referring to the hedge are in equity, these gains/losses remain in equity and are recognized in revenue at the time when the forecast transaction is ultimately reported in the income statement. When a forecast transaction is no longer expected to occur, the accumulated gains or losses deferred in equity must immediately be taken to the income statement items ’Other operating income’ or ’Other operating expenses – net’.

NOTES TO THE CONSOLIDATED ACCOUNTS 41
STUDSV IK AB (PUBL ) ANNUAL REPORT 2017
1.12 INVENTORIES Inventories are stated at the lower of cost and net realizable value. Cost is determined using the first-in, first-out (FIFO) method. The cost of finished goods and work in progress comprises raw materials, direct labor, other direct costs and related production overheads. Borrowing costs are not included. Net realizable value is the estimated selling price in the ordinary course of business, less applicable variable selling expenses.
1.13 TRADE RECEIVABLES Trade receivables are reported in the amount expected to be paid in after deduction for individually assessed doubtful receivables. The expected maturity of trade receivables is less than twelve months and therefore the value has been recognized at the nominal amount without discounting. Impairment losses in trade receivables are recognized in the item ‘Selling and marketing costs’.
1.14 CASH AND CASH EQUIVALENTS Cash and cash equivalents includes cash in hand, bank balances and other short-term liquid investments with original maturities of three months or less of the date of acquisition.
1.15 SHARE CAPITAL Ordinary shares are classified as equity. Transaction costs directly attributable to the issue of new shares or options are shown in equity as a deduction, net of tax, from the proceeds.
1.16 TRADE PAYABLES Trade payables are recognized at fair value and are commitments to pay for goods or services acquired from suppliers in the operating activities. Trade payables have a short expected maturity and are classified as current liabilities.
1.17 BORROWINGS Borrowings are recognized at fair value, net after transaction costs.
Borrowings are classified as current liabilities unless the Group has an unconditional right to defer settlement of the liability for at least 12 months after the balance sheet date.
1.18 CURRENT AND DEFERRED INCOME TAX Tax expense for the period includes current and deferred tax. Tax is reported in the income statement, except when the tax refers to items reported in other comprehensive income or directly in equity. In that case the tax is also reported in other comprehensive income and equity respectively.
The current tax expense is calculated on the basis of the tax laws that have been enacted or substantively enacted on the balance sheet date in the countries in which the parent company’s subsidiaries and associated companies operate and generate taxable revenues., The management regularly assesses claims made in tax returns for situations where applicable tax rules are subject to interpretation and, where deemed appropriate, makes provision for amounts that will probably have to be paid to the tax authorities.
Deferred tax is recognized in its entirety, using the balance sheet method, on all temporary differences arising between the tax bases of assets and liabilities and their carrying amounts in the consolidated accounts. However, the deferred tax is not recognized if it arises as a consequence of a transaction constituting the initial recognition of an asset or liability in a transaction other than a business combination that, at the time of the transaction, affects neither accounting profit nor taxable profit. Deferred income tax is determined using tax rates (and laws) that have been enacted or substantially enacted by the balance sheet date and are expected to apply when the related deferred tax asset is realized or the deferred tax liability is settled.
Deferred tax assets are recognized to the extent it is probable that future taxable profit will be available against which the temporary differences can be applied.
Deferred tax assets and liabilities are offset when there is a legally enforceable right to set off current tax assets against current tax liabilities and when the deferred tax assets and deferred tax liabilities relate to income taxes levied by the same taxation authority on either the same taxable entity or different taxable entities which intend to settle current tax liabilities and assets on a net basis.
1.19 EMPLOYEE BENEFITS Pension obligations The Group companies operate various pension schemes. The schemes are generally funded through payments to insurance companies or trustee-administered funds, in which the payments are determined on the basis of periodic actuarial calculations. The Group has both defined benefit and defined contribution plans. A defined contribution plan is a pension plan under which the Group pays fixed contributions into a separate legal entity. The Group has no legal or constructive obligation to pay further contributions if this legal entity does not have sufficient assets to pay all employee benefits associated with the employees’ service in the current or prior periods. A defined benefit plan is a pension plan that is not a defined contribution plan. It is characteristic of defined benefit plans that they define an amount of pension benefit that an employee will receive on retirement, usually dependent on one or more factors such as age, years of service and compensation.
The liability recognized in the balance sheet in respect of defined benefit pension plans is the present value of the defined benefit obligation at the balance sheet date less the fair value of plan assets. The defined benefit obligation is calculated annually by independent actuaries using the projected unit credit method. The present value of the defined benefit obligation is determined by discounting the estimated future cash outflows using interest rates of high-quality corporate bonds that are denominated in the currency in which the benefits will be paid and that have terms to maturity approximating to the terms of the related pension liability
Actuarial gains and losses as a result of experience adjustments and changes in actuarial assumptions are reported in other comprehensive income in the period in which they arise. Past service costs are recognized directly in the income statement. For defined contribution plans, the Group pays contributions to publicly or privately administered pension insurance plans on a mandatory, contractual or voluntary basis. The Group has no further payment obligations once the contributions have been paid. The contributions are recognized as employee benefit expense when they are due. Prepaid contributions are recognized as an asset to the extent that cash refund or a reduction in the future payments is available to the Group.
Termination benefits Termination benefits are payable when employment is terminated by the Group before the normal retirement date, or whenever an employee accepts voluntary redundancy or in exchange for these benefits. The Group recognizes termination benefits at the earlier of the following dates, a) when the Group can no longer with-draw the offer of those benefits, and b) when the company recognizes the costs for a restructuring within the scope of IAS 37 that includes the payment of termination benefits. In cases where the company has made an offer to encourage voluntary redundancy, the termination benefits are calculated on the basis of the number of employees expected to accept the offer.
Profit sharing and variable salary componentsThe Group recognizes a liability and an expense for variable salary and profit-sharing, based on a formula that takes into consideration the profit that can be attributed to the parent company’s shareholders after certain adjustments. The Group recognizes a provision where contractually obliged or where there is a past practice that has created a constructive obligation.
1.20 PROVISIONS Provisions for environmental restoration measures, future waste management costs, restructuring costs and other legal requirements are recognized when: the Group has a present legal or constructive obligation as a result of past events; it is more probable than not that an outflow of resources will be required to settle the obligation; and the amount has been reliably estimated. No provision has been made for future operating losses.
If there are a number of similar obligations, the probability that an outflow of resources will be required to settle the obligations will be assessed overall for the entire group of obligations. A provision is reported even if the probability of an outflow for a particular item in this group of obligations is minor. See note 33, ‘Other provisions’.
1.21 REVENUE RECOGNITION Revenue comprises the fair value of the consideration received or receivable for goods and services sold in the Group’s operating activities. Revenue is reported exclusive of value added tax, returns and discounts and after elimination of sales within the Group.
The Group recognizes revenue when its amount can be reliably measured, it is probable that the future economic benefits will flow to the company and special criteria are fulfilled for each of the Group’s operations as described below.
The Group uses the percentage of completion method to determine the appropriate amount to recognize in a given period. Only contract costs incurred for work performed on the balance sheet date are recognized as expenses.
Revenue for the software developed by the Group is received through contract revenue, sales of software and through license fees.
The Group presents as an asset the gross amount due from customers for contract work for all contracts in progress for which costs incurred plus recognized profits exceed progress billings. Progress billings not yet paid by customers and retention are included in ‘Trade and other receivables’.
The Group presents as a liability the gross amount due to customers for contract work for all contracts in progress for which progress billings exceed costs incurred plus recognized profits.
Sales of contract services are recognized in the accounting period in which the services are rendered, by reference to completion on the balance sheet date as a proportion of the total services to be provided.
Interest income is recognized on a time-proportion basis using the effective interest method. When the value of a receivable is impaired, the Group reduces the carrying amount to the recoverable amount, which is the estimated future cash flow, discounted at the original effective interest rate for the instrument, and continues to reverse the discount effect as interest income. Interest income on impaired loans is recorded at the original effective interest rate.
Dividend income is recognized when the right to receive payment is established.

42 NOTES TO THE CONSOLIDATED ACCOUNTS
STUDSV IK AB (PUBL ) ANNUAL REPORT 2017
1.22 LEASES Leases in which a significant portion of the risks and rewards of ownership are retained by the lessor are classified as operating leases. Payments made under operating leases (less any lease incentives) are recognized as expenses in the income statement on a straight-line basis over the lease term.
The Group leases some property, plant and equipment. Leases on non-current assets, in which the Group holds the financial risks and rewards incident to legal ownership, are classified as finance leases. At the start of the lease term finance leases are recorded in the balance sheet at the lower of the leased asset’s fair value and present value of the minimum lease payments.
Each lease payment is allocated between amortization of the debt and financial costs for achieving a fixed rate of interest on the reported debt. The corresponding payment liabilities, less financial expenses, are included in the balance sheet items ‘Non-current borrowing’ and ‘Current borrowing’. The interest component of the financial expenses is allocated over the lease term in the income statement so that each accounting period is charged with an amount equivalent to a fixed interest rate on the reported debt in the respective period. Non-current assets held as finance leases are depreciated over the shorter of the useful life of the asset and the lease term.
1.23 DIVIDENDS Dividend distribution to the parent company’s shareholders is recognized as a liability in the Group’s financial statements in the period in which the dividends are approved by the parent company’s shareholders.
1.24 PARENT COMPANYThe Parent Company has prepared its annual accounts in accordance with the Swedish Annual Accounts Act and Swedish Financial Reporting Board recommendation RFR 2, Accounting for Legal Entities. RFR 2 means that the Parent Company, in its separate financial statements, must apply all the IFRS and statements adopted by the EU as far as possible, subject to the Annual Accounts Act and the Act on Safeguarding Pension Obligations, taking into account the connection between accounting and taxation. The recommendation specifies the exemptions and additions that must be made in relation to IFRS. The differences between the Group’s and the Parent Company’s accounting policies are presented below. The main differences between the accounting policies applied by the Group and the Parent Company are:
FormatsThe income statement and balance sheet follow the format of the Annual Accounts Act. This entails differences compared with the consolidated accounts, mainly as regards financial income and expense, the statement of comprehensive income, provisions and the statement of changes in equity.
Shares and participations in subsidiariesInvestments in subsidiaries are recorded at the lower of cost and fair value. Assessments are made as to whether the book amount corresponds to fair value and the book amount is written down if the impairment is deemed permanent and recorded in the item ’Profit/loss from participations in Group companies ‘.Dividend received is reported as financial income.
IncomeThe Parent Company’s income includes dividends and group contributions received from subsidiaries and other internal transactions that are eliminated in the consolidated accounts.
LeasesAll leases, regardless of whether they are finance or operating leases, are recorded as rental agreements (operating leases).
PensionsPension obligations refer to defined contribution plans and are covered by insurance arrangements.
TaxesThe accumulated values of accelerated depreciation and other untaxed reserves are presented in the parent company balance sheet under the item ‘Untaxed reserves’ with no deduction for the deferred tax. Changes in the untaxed reserves are shown on a separate line in the income statement in the parent company income statement. The consolidated accounts, however, divide untaxed reserves into deferred tax liability and equity.
Group contributions and shareholders’ contributions for legal entitiesThe company reports group contributions and shareholders’ contributions in accordance with the Swedish Financial Reporting Board’s recommendation RFR 2. Shareholders’ contributions are recognized directly in the equity of the recipient and capitalized in shares and participations by the giver, to the extent there is no impairment loss. Group contributions from subsidiaries are reported as financial income as is normal dividend from subsidiaries. Tax on group contributions is reported in accordance with IAS,12 in the income statement.
Note 2 Financial risk management 2.1 FINANCIAL RISK FACTORSThrough its operations the Group is exposed to a number of different financial risks; market risk (covering currency risk, fair value interest rate risk, cash-flow interest rate risk and price risk), credit risk and liquidity risk. The financial risks also include the company’s ability to uphold financial key ratios (covenants) that regulate borrowing. The Group’s overall risk management policy focuses on the unpredictability of financial markets and aims to minimize potential adverse effects on the Group’s financial performance. The Group uses derivative instruments to hedge certain risk exposure. Risk management is handled by a central treasury function in accordance with policies determined by the Board of Directors. The central function identifies, evaluates and hedges financial risk in close cooperation with the Group’s operating units. The Board of Directors draws up written policies, both for overall risk management and for specific areas, such as currency risk, interest rate risk, credit risk, use of derivative and non-derivative financial instruments and investment of surplus liquidity.
Market risk Price riskThe Group’s largest single cost item is personnel, which accounts for 64 (66) per cent of the total costs of continuing operations. Other expenses vary. The Group’s risk exposure as regards purchases is therefore of less significance. Currency risk The Group operates internationally and is exposed to currency risk arising from various currency exposures, above all in US dollars (USD), euros (EUR) and pounds sterling (GBP). Currency risk arises through future business transactions, reported assets and liabilities and net investment in foreign operations.
The Board of Directors has drawn up policies and guidelines for how currency risk is to be managed in the Group. To minimize the currency risk arising on business transactions and for reported assets and liabilities, the companies use different forms of currency derivatives issued by external banks. Currency risk arises when future business transactions or reported assets and liabilities are denominated in a currency that is not the functional currency of the unit.
At Group level only external foreign currency derivative contracts are classified as hedges of gross amounts of specific assets, liabilities or future transactions.
If the Swedish krona had weakened by 10 per cent against the euro, all other variables being constant, the year’s profit for continuing operations as at December 31, 2017 would have been SEK 1.3 lower (1.4 million lower), as the Group’s total costs in EUR are lower than the corresponding revenue in EUR. Equity would have been SEK 1.3 million lower (1.4 million lower), mainly due to translation of the Group’s net investments in Germany.
If the Swedish krona had weakened by 10 per cent against the pound sterling, all other variables being constant, the year’s profit for continuing operations as at December 31, 2017 would have been SEK 0.2 million higher (1.1 million lower), as the Group’s total revenues in GBP are greater than the corresponding expenses in GBP. Equity would have been SEK 0.2 million higher (1.1 million lower), mainly due to translation of the Group’s net investments in the United Kingdom.
If the Swedish krona had weakened by 10 per cent against the US dollar, all other variables being constant, the year’s profit from continuing operations as at December 31, 2017 would have been SEK 2.2 million lower (SEK 1.1 million lower), mainly as a result of Scandpower Inc’s operations. Equity would have been SEK 2.1 million lower (1.2 million lower), mainly due to translation of the Group’s net investments in the USA.
Interest rate risk referring to cash flows and fair values Since the Group does not have any material interest-bearing assets, the Group’s income and cash flow from operating activities are in all essentials independent of changes in market interest rates.
The Group’s interest rate risk arises through long-term borrowings. Borrowing at variable interest rates exposes the Group to cash flow interest rate risk. Borrowing at fixed interest rates exposes the Group to fair value interest rate risk. The Group’s contractual repricing dates for interest rates are shown in note 30.
The Group analyses its interest rate exposure regularly. Different scenarios are simulated, taking into account refinancing, renewals of existing positions, alternative funding and hedging. With these scenarios as a base, the Group calculates the impact on earnings of a given interest rate change. For each simulation the same interest rate change is used for all currencies. The scenarios are only simulated for debt constituting the largest interest-bearing positions.
Simulations carried out show that the impact on pre-tax earnings of a change of 0.1,percentage point would be a maximum increase or decrease respectively of SEK 0.2 (0.2) million.
If the interest rate on borrowing in SEK on December 31, 2017 had been 0.5 percentage points higher/lower, all other variables being constant, the pre-tax earnings for the financial year would have been SEK 1.1 (1.4) million higher/lower, mainly as an effect of higher/lower interest expense in connection with changes in reference rates.

NOTES TO THE CONSOLIDATED ACCOUNTS 43
STUDSV IK AB (PUBL ) ANNUAL REPORT 2017
Credit risk Credit risk is managed at company and Group level. Credit risk arises through cash and cash equivalents, derivative instruments and balances at banks and financial institutions, as well as credit exposure to customers, including outstanding receivables and contractual transactions. The Group only uses banks with an A+ or higher rating for depositing cash and cash equivalents. In cases where no independent credit evaluation exists, a risk appraisal is made of the customer’s creditworthiness in which financial position and prior experience and other factors are taken into consideration. Individual risk limits are set, based on internal or external credit evaluations in accordance with limits set by the Board of Directors.
The credit quality of financial assets is reported in note 20.
Liquidity riskLiquidity risk is managed through the Group holding sufficient cash and cash equivalents and short-term deposits in a liquid market, available funding through contracted credit lines and the possibility of closing market positions. Due to the dynamic character of operations, the Group retains flexibility of funding by maintaining contracts for withdrawable lines of credit. The company has a bond loan of SEK 200.1 thousand, which falls due on February 22, 2019. The loan carries interest of 6.5 % + STIBOR 3 months. Expected interest expense is estimated as SEK 13,007 thousand for 2018, and SEK 1,915 thousand for 2019, amounting to SEK 14,922 thousand to the maturity date. In addition, the cost of the bond arrangement, already paid, SEK 1 ,750 thousand, will be amortized over the period. The management also carefully follows rolling forecasts of the Group’s liquidity reserve, consisting of unutilized loan assurances (note 30) and cash and cash equivalents (note 25), on the basis of expected cash flows.
The table below analyses the Group’s financial liabilities and derivative instruments settled net that constitute financial liabilities, broken down by the contractual time to maturity remaining on the balance sheet date. The amounts stated in the table are the contracted, undiscounted cash flows.
As at December 31, 2017
Less than 1
year
Between 1 and 2
years
Between 2 and 5
years
More than 5 years
Bank loans – – – –
Bond loans 13,007 202,015 – –
Derivative instruments 2,855 7 – –
Trade and other payables 162,001 1,500 4,500 8,987
As at December 31, 2016
Less than 1
year
Between 1 and 2
years
Between 2 and 5
years
More than 5 years
Bank loans – – – –
Bond loans 13,000 13,000 201,900 –
Derivative instruments 4,790 1,072 67 –
Trade and other payables 179,486 1,500 4,500 9,180
The table below analyses the Group’s financial derivative instruments that will be settled gross, broken down by the contractual time to maturity remaining on the balance sheet date. The amounts stated in the table are the contracted, undiscounted cash flows. The amounts that mature within 12 months have not been discounted, since the discount effect is immaterial.
As at December 31, 2017Less than 1
year
Between 1 and 2
years
Between 2 and 5
yearsMore than
5 years
Forward exchange contracts – Cash flow hedges
– Outflow – – – –
– Inflow 24,739 5,057 – –
As at December 31, 2016Less than 1
year
Between 1 and 2
years
Between 2 and 5
yearsMore than
5 years
Forward exchange contracts – Cash flow hedges
– Outflow – – – –
– Inflow 27,893 9,610 922 –
2.2 CAPITAL RISK MANAGEMENT The Group’s goal for its capital structure is to safeguard the Group’s ability to continue as a going concern, so that it can generate a return for its shareholders and benefit for other stakeholders and maintain an optimal capital structure as a means of controlling the cost of capital. The Group assesses the capital on the basis of debt/equity ratio and equity/assets ratio. Studsvik has an overall goal of an equity/assets ratio of 40 per cent. The equity/assets ratio at the close of the year was 34.5 (38.6) per cent.
To retain or adjust the capital structure, the Group can alter the dividend it pays to shareholders, repay capital to shareholders, issue new shares or sell assets to reduce its liabilities
Just like other companies in the industry, the Group assesses its capital on the basis of the debt/equity ratio. This ratio is defined as net debt divided by total equity. Net debt is defined as total borrowing (including the items ‘Current borrowing’ and ‘Non-current borrowing’ in the consolidated balance sheet) less cash and cash equivalents. Equity is calculated including non-controlling interests.
2017 2016
Total borrowing (note 30) 199,850 198,250
Less cash and cash equivalents (note 25) –98,672 –195,363
Net debt 101,178 2,887
Total equity 288,473 348,461
Debt/equity ratio 35,1% 0,8,%
The change in debt/equity ratio in 2017 was mainly a consequence of lower cash and cash equivalents after a negative cash flow in 2017. Negative earnings is the main reason for lower equity.
2.3 FAIR VALUE ESTIMATIONThe table below shows financial instruments at fair value on the basis of their classifi-cation in the fair value hierarchy. The different levels are defined as follows: • Level 1 – Quoted prices (unadjusted) on active markets for identical assets or
liabilities. • Level 2 – Other observable market data for the asset or liability other than
quoted prices included in level 1, either direct (i.e. as quoted prices) or indirect (i.e. derived from quoted prices).
• Level 3 – Data on the asset or liability not based on observable market data (i.e. unobservable inputs).
The following table shows the Group’s assets and liabilities measured at fair value as at December 31, 2017.
Level 1 Level 2 Level 3
Assets
Financial assets at fair value through profit or loss
– Unlisted shareholdings – – 13,039
– Capital insurance – 14,028 –
– Long-term bank deposits – 3,861 –
Derivatives used for hedging – 2,733 –
Total assets – 20,622 13,039
Liabilities
Derivatives used for hedging – 2,862 –
Total liabilities – 2,862 –
The following table shows the Group’s assets and liabilities measured at fair value as at December 31, 2016.
Level 1 Level 2 Level 3
Assets
Financial assets at fair value through profit or loss
– Unlisted shareholdings – – 12,259
– Capital insurance – 14,191 –
– Long-term bank deposits – 3,488
Derivatives used for hedging – 2,246 –
Total assets – 19,925 12,259
Liabilities
Derivatives used for hedging – 5,929 –
Total liabilities – 5,929 –
The fair value of financial instruments traded in active markets is based on quoted market prices at the balance sheet date. A market is regarded as active if quoted prices from a stock exchange, broker, industrial group, pricing service or supervisory authority are easily and regularly available, and these prices represent actual and regularly occurring market transactions at arm’s length. The Group does not currently hold such assets or liabilities
Fair value of financial instruments not traded on an active market (for example OTC derivatives) is established using valuation techniques. These techniques use market information as far as possible when this is available, while company-specific information is used as little as possible If all material inputs required for fair value measurement of an instrument are observable the instrument is found at level 2. In the cases where one or more material inputs are not based on observable market information the instrument concerned is classified at level 3.
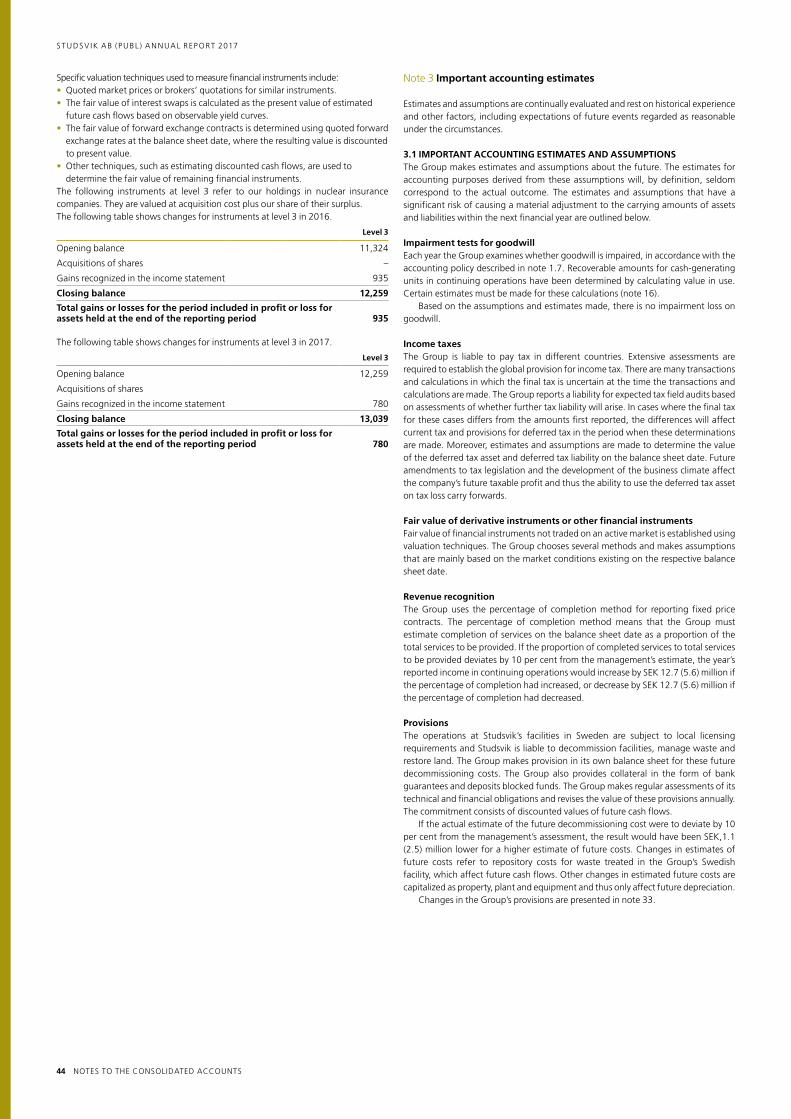
44 NOTES TO THE CONSOLIDATED ACCOUNTS
STUDSV IK AB (PUBL ) ANNUAL REPORT 2017
Specific valuation techniques used to measure financial instruments include:• Quoted market prices or brokers’ quotations for similar instruments.• The fair value of interest swaps is calculated as the present value of estimated
future cash flows based on observable yield curves.• The fair value of forward exchange contracts is determined using quoted forward
exchange rates at the balance sheet date, where the resulting value is discounted to present value.
• Other techniques, such as estimating discounted cash flows, are used to determine the fair value of remaining financial instruments.
The following instruments at level 3 refer to our holdings in nuclear insurance companies. They are valued at acquisition cost plus our share of their surplus.The following table shows changes for instruments at level 3 in 2016.
Level 3
Opening balance 11,324
Acquisitions of shares –
Gains recognized in the income statement 935
Closing balance 12,259
Total gains or losses for the period included in profit or loss for assets held at the end of the reporting period 935
The following table shows changes for instruments at level 3 in 2017.
Level 3
Opening balance 12,259
Acquisitions of shares
Gains recognized in the income statement 780
Closing balance 13,039
Total gains or losses for the period included in profit or loss for assets held at the end of the reporting period
780
Note 3 Important accounting estimates
Estimates and assumptions are continually evaluated and rest on historical experience and other factors, including expectations of future events regarded as reasonable under the circumstances.
3.1 IMPORTANT ACCOUNTING ESTIMATES AND ASSUMPTIONS The Group makes estimates and assumptions about the future. The estimates for accounting purposes derived from these assumptions will, by definition, seldom correspond to the actual outcome. The estimates and assumptions that have a significant risk of causing a material adjustment to the carrying amounts of assets and liabilities within the next financial year are outlined below.
Impairment tests for goodwill Each year the Group examines whether goodwill is impaired, in accordance with the accounting policy described in note 1.7. Recoverable amounts for cash-generating units in continuing operations have been determined by calculating value in use. Certain estimates must be made for these calculations (note 16). Based on the assumptions and estimates made, there is no impairment loss on goodwill.
Income taxes The Group is liable to pay tax in different countries. Extensive assessments are required to establish the global provision for income tax. There are many transactions and calculations in which the final tax is uncertain at the time the transactions and calculations are made. The Group reports a liability for expected tax field audits based on assessments of whether further tax liability will arise. In cases where the final tax for these cases differs from the amounts first reported, the differences will affect current tax and provisions for deferred tax in the period when these determinations are made. Moreover, estimates and assumptions are made to determine the value of the deferred tax asset and deferred tax liability on the balance sheet date. Future amendments to tax legislation and the development of the business climate affect the company’s future taxable profit and thus the ability to use the deferred tax asset on tax loss carry forwards.
Fair value of derivative instruments or other financial instruments Fair value of financial instruments not traded on an active market is established using valuation techniques. The Group chooses several methods and makes assumptions that are mainly based on the market conditions existing on the respective balance sheet date.
Revenue recognition The Group uses the percentage of completion method for reporting fixed price contracts. The percentage of completion method means that the Group must estimate completion of services on the balance sheet date as a proportion of the total services to be provided. If the proportion of completed services to total services to be provided deviates by 10 per cent from the management’s estimate, the year’s reported income in continuing operations would increase by SEK 12.7 (5.6) million if the percentage of completion had increased, or decrease by SEK 12.7 (5.6) million if the percentage of completion had decreased.
ProvisionsThe operations at Studsvik’s facilities in Sweden are subject to local licensing requirements and Studsvik is liable to decommission facilities, manage waste and restore land. The Group makes provision in its own balance sheet for these future decommissioning costs. The Group also provides collateral in the form of bank guarantees and deposits blocked funds. The Group makes regular assessments of its technical and financial obligations and revises the value of these provisions annually. The commitment consists of discounted values of future cash flows. If the actual estimate of the future decommissioning cost were to deviate by 10 per cent from the management’s assessment, the result would have been SEK,1.1 (2.5) million lower for a higher estimate of future costs. Changes in estimates of future costs refer to repository costs for waste treated in the Group’s Swedish facility, which affect future cash flows. Other changes in estimated future costs are capitalized as property, plant and equipment and thus only affect future depreciation. Changes in the Group’s provisions are presented in note 33.

NOTES TO THE CONSOLIDATED ACCOUNTS 45
STUDSV IK AB (PUBL ) ANNUAL REPORT 2017
Financial year 2017Consultancy
ServicesFuel and Materials
TechnologyStudsvik
Scandpower Other Eliminations Group
Sales revenues 407,260 195,038 81,015 69,345 –47,826 704,833
External sales revenue 395,503 192,138 73,482 43,710 – 704,833
EBITDA before non-recurring items 385 16,541 –7,808 –21,668 – –12,550Non-recurring items –3,981 –1,413 –3,163 –12,550 – –21,107
Depreciation/amortization and impairment –2,164 –9,879 –809 –3,738 – –16,590
Earnings from associated companies and joint ventures 8,680 – – – – 8,680
Operating profit 2,920 5,249 –11,780 –37,956 – –41,567
Net financial items –17,086
Taxes 13,662
Profit/loss for the year from continuing operations – –44,991
Share of equity in associated companies and joint ventures 6,867 6,867
Other operating segments 367,892 182,716 94,958 419,533 –247,091 810,008
Assets in disposal group held for sale 0
Total assets 374,759 182,716 94,958 419,533 –247,091 824,875
Operating segment liabilities 311,157 151,023 22,501 298,812 –247,091 536,402
Equity 288,473
Liabilities in disposal group held for sale 0
Total equity and liabilities 824,875
Investments from continuing operations 4,021 13,849 727 3,487 22,084
Average number of employees from continuing operations 492 101 34 35 662
Financial year 2016Consultancy
ServicesFuel and Materials
TechnologyStudsvik
Scandpower Other Eliminations Group
Sales revenues 448,419 196,355 96,347 71,928 –54,278 758,771
External sales revenue 435,116 193,758 86,127 43,770 0 758,771
EBITDA before non-recurring items 28,972 38,074 3,593 –15,490 – 55,149
Non-recurring items –16,247 –783 – – – –17,030
Depreciation/amortization and impairment –2,857 –7,554 –784 –6,379 – –17,574
Earnings from associated companies and joint ventures 4,124 21 – – – 4,145
Operating profit 13,992 29,759 2,809 –21,869 – 24,690
Net financial items –25,220
Taxes 8,666
Profit/loss for the year from continuing operations 8,136
Share of equity in associated companies and joint ventures –1,922 69 – 11,107 – 9,254
Other operating segments 427,042 277,832 – 476,268 –289,367 891,775
Assets in disposal group held for sale 0
Total assets 425,120 277,901 – 487,375 –289,367 901,029
Operating segment liabilities 353,091 171,106 – 317,738 –289,367 552,568
Equity 348,461
Liabilities in disposal group held for sale 0
Total equity and liabilities 901,029
Investments from continuing operations 2,427 11,825 1,059 15,311
Average number of employees from continuing operations 523 127 37 687
Note 4 Segment reporting
Operating segments have been established on the basis of information dealt with by the Board of Directors and the President and used to make strategic decisions. The Board of Directors and the President assess operations mainly from a business area perspective, and therefore the segments consist of the Group’s three business areas, which are described on pages 11 to 15.
The Board of Directors and the President assess the operating segments’ performance on the basis of operating profit.
Operating segment assets refer to all non-current assets and current assets allocated by segment. Operating segment liabilities refers to all long-term and current liabilities allocated by segment. Interest income and expenses are not allocated to the segments, since they are affected by measures taken by the central treasury, which handles the Group’s cash liquidity. Reclassification of income, earnings and employees was made between segments for the comparison year to achieve comparability with 2017.

46 NOTES TO THE CONSOLIDATED ACCOUNTS
STUDSV IK AB (PUBL ) ANNUAL REPORT 2017
Note 4 (cont.)
External sales revenue per product area 2017 2016
Consultancy and engineering services 130,779 171,746
Health physics services 132,285 121,152
Transport and logistics 11,935 6,356
Decommissioning services 0 0
Operational and outage support 157,441 168,551
Fuel and materials performance 119,859 123,548
Corrosion and water chemistry studies 45,649 48,430
Fuel optimization software 55,182 75,163
Other operations 51,702 43,825
Total 704,833 758,771
Other operations include the parent company and the part of the Swedish company Studsvik Nuclear AB that is not part of the Consultancy Services or Fuel and Materials Technology segments.
External sales revenue based on the customer’s country of location
2017 2016
SEKthousand Per cent
SEKthousand Per cent
Sweden 157,133 22.3 180,373 23.8
Europe excluding Sweden 424,405 60.2 424,903 56.0
North America 72,695 10.3 101,480 13.4
Asia 50,600 7.2 30,614 4.0
All other countries 0 0.0 21,401 2.8
Total 704,833 100.0 758,771 100.0
In 2017 the Group had no customer that accounted for more than 10 per cent of total sales.
Non-current assets per country
2017 2016
SEK thousand Per cent
SEKthousand Per cent
Sweden 186,992 41.2 183,613 41.1
Europe excluding Sweden 165,214 36.8 159,014 35.6
North America 101,472 21.4 99,766 22.3
Asia 2,937 0.6 4,731 1.1
Total 456,615 100.0 447,124 100.0
Note 5 Other operating incomeOther income 2017 2016
Sale of property, plant and equipment 76 38
Insurance compensation 2 19
Revaluation of holding in mutual insurance company 781 934
Other 700 4,323
Total 1,559 5,314
Other gains 2017 2016
Other financial assets measured at fair value through profit or loss
– Fair value gains 654 1,364
Forward exchange contracts
– Foreign exchange differences 630 1,517
Total 1,284 2,881
Note 6 Other operating expenses
Other costs 2017 2016
Sale of property, plant and equipment 0 0
Non-recurrent structural costs 21,107 17,030
Other 2,291 5,877
Total 23,398 22,907
Other losses 2017 2016
Other financial assets measured at fair value through profit or loss
– Fair value losses 3,779 2,156
Forward exchange contracts
– Foreign exchange differences 2,349 1,340
Total 6,128 3,496
Non-recurring structural costs amount to SEK 21,107 thousand and consist of costs for termination of staff in Sweden of SEK 11,685 thousand, in the USA of SEK 4,494 thousand, in the UK of SEK 2,466 thousand and in Germany of SEK 2,462 thousand.
Note 7 Costs by nature of expense2017 2016
Purchases of material and services 229,670 190,785
Personnel costs 462,541 473,857
Energy 8,330 11,171
Depreciation/amortization and impairment 17,873 15,843
Other costs 9,982 28,362
Total 728,396 720,018
Note 8 Remuneration to auditors2017 2016
PricewaterhouseCoopers
– Audit assignments 1,834 1,950
–Audit services in addition to audit 325 1,471
–Tax consultancy 201 975
– Other services 163 1,394
Total 2,523 5,790
Other auditors
– Audit assignments 204 52
–Audit services in addition to audit 239 171
–Tax consultancy 1,755 288
– Other services 0 0
Total 2,198 511
Group total 4,721 6,301
Audit assignments refers to examination of the annual accounts, the accounting records and the administration by the Board of Directors and the President, other duties incumbent on the company’s auditors, as well as advisory services and other types of support as a result of observations made through such an examination or performance of such duties. Other services consist mainly of fees referring to sale of the Waste Treatment operations. The fees specified above refer to the following: PwC Sweden, audit assignments SEK 894 thousand, audit business in addition to audit SEK 325 thousand (tax consultancy) and other services SEK 32 thousand.

NOTES TO THE CONSOLIDATED ACCOUNTS 47
STUDSV IK AB (PUBL ) ANNUAL REPORT 2017
Note 9 Employee benefits
Employee benefits 2017 2016
Salaries 386,212 376,237
Social security contributions 78,544 76,872
Pension costs – defined contribution based 27,282 29,789
Pension costs – defined benefit based 178 437
Total 492,216 483,335
Of which continuing operations 492,216 446,168
Of which operations held for sale – 37,167
Salaries and other remuneration distributed between board members and president as well as other employees
2017 2016
Board and President
Of which variable
remunerationOther
employees Board and President
Of which variable remuner-
ationOther
employees
Parent company 10,925 0 6,000 6,027 200 6,438
Subsidiaries in Sweden 3,786 0 82,348 2,201 0 92,606
Subsidiaries abroad 6,988 55 276,165 12,795 47 229,780
Total, subsidiaries 10,774 55 358,513 14,996 47 322,386
Operations for sale 0 0 0 0 26,143
Total for Group 21,699 55 364,513 21,023 247 354,967
2017 2016
Average number of employees Men Women Total Men Women Total
Parent company 3 3 6 3 4 7
Subsidiaries in Sweden 106 48 154 98 47 145
Subsidiaries abroad 473 29 502
- Germany 406 15 421 397 36 433
– United Kingdom 17 9 26 28 11 39
– USA 31 4 35 30 4 34
– Japan 1 0 1 1 0 1
– Switzerland 17 1 18 26 1 27
– France 1 0 1 0 1 1
Total, subsidiaries 579 77 656 580 100 680
Operations for sale 0 0 0 37 9 46
Total for Group 582 80 662 620 113 733
Gender breakdown in the Group (including subsidiaries) for members of the Board and other senior management
2017 2016
Number on balance sheet date Of which men
Number on balance sheet date Of which men
Board members 8* 5 8* 5
President and other senior management 7 5 7 5
Total for Group 15 10 15 10
All the Board Members and the President belong to continuing operations. Salaries and other remuneration includes severance pay in 2017. For information on benefits to senior manage-ment, see note 38.* The number of board members only refers to ordinary members.

48 NOTES TO THE CONSOLIDATED ACCOUNTS
STUDSV IK AB (PUBL ) ANNUAL REPORT 2017
Note 10 Financial income and expense
2017 2016
Financial income
Current bank balances 893 19
Fair value gains (realized and unrealized) 334 8,930
Other financial income 87 109
Total 1,314 9,058
Financial expenses
Bank loans –13,439 –17,969
Fair value losses (realized and unrealized) –3,091 –9,321
Other financial expenses –1,870 –6,989
Total –18,400 –34,279
Net financial items –17,086 –25,221
Note 11 Income tax2017 2016
Current tax
Current tax on profit for the year –700 –3,947
Adjustment for previous years –1,213 –106
Total –1,913 –4,053
Deferred tax (note 31)
Origination and reversal of temporary differences 15,575 12,719
Total 15,575 12,719
Total income tax 13,662 8,666
The Swedish income tax rate is 22 (22) per cent. The income tax on the Group’s profit before tax differs from the theoretical amount that would arise using the weighted average tax rate for profits of the consolidated companies as follows.
2017 2016*
Profit/loss before tax –58,654 8,334
Tax in accordance with the current tax rate 13,490 –3,509
Non-taxable revenue 1,952 867
Expenses not deductible for tax purposes –216 –898
Recognized tax asset related to previously unrecognized tax loss carry forwards 11,034 –
Recognized tax asset related to losses 0 12,312
Adjustment for foreign tax rate –7,065
Adjustment for previous years’ tax assessment –1,213 –106
Tax loss carry-forwards utilized –4,528 –
Other effects 208 –
Tax expense 13,662 8,666
The weighted average tax rate was 23 (–104) per cent.Other comprehensive income only includes tax effects on cash flow hedges and
on December 31 these amounted to SEK 893 (172) thousand. Other comprehensive income also includes foreign exchange differences, but they have no tax effect.
*The 2016 period of comparison has not been adjusted as a consequence of the Group having changed its principle for recognition of translation effects of intra-group loans in foreign currency in 2017 to include them in other comprehensive income.
Note12 Foreign exchange differences – netForeign exchange differences are recognized in the income statement as follows.
2017 2016
Other gains and losses – net (notes 5 and 6) –4,844 –615
Financial items (note 10) –2,757 –391
Total –7,601 –1,006
Note 13 Earnings per share
Diluted earnings per share is calculated by adjusting the weighted average number of shares in issue to assume conversion of all dilutive potential shares. There were no unconverted share options or convertible debt instruments in issue on the balance sheet date.
Earnings per share before and after dilution is calculated by dividing the profit for the year by the weighted average number of shares in issue (note 26).
Before and after dilution, continuing operations 2017 2016
Net profit/loss for the year –44,991 8,136
Weighted average number of ordinary shares in issue 8,218,611 8,218,611
Earnings per share before and after dilution (SEK per share) –5.47 0.99
Before and after dilution, operations held for sale 2017 2016
Net profit/loss for the year – 46,003
Weighted average number of ordinary shares in issue – 8,218,611
Earnings per share before and after dilution (SEK per share) – 5.60
Before and after dilution, total operations 2017 2016
Net profit/loss for the year –44,991 54,139
Weighted average number of ordinary shares in issue 8,218,611 8,218,611
Earnings per share before and after dilution (SEK per share) –5.47 6.59
Note 14 Dividend per share
Dividend paid in 2017 and 2016 was SEK 1 (0) per share. At the Annual General Meeting on April 25 2018 it will be proposed that no dividend be distributed for the 2017 financial year.

NOTES TO THE CONSOLIDATED ACCOUNTS 49
STUDSV IK AB (PUBL ) ANNUAL REPORT 2017
Note 15 Property, plant and equipment
Land and buildingsPlant and
machineryEquipment
and tools
Construction in progress and
advance payments for property, plant
and equipment Total
As at December 31, 2015
Cost of acquisition 324,223 229,916 140,004 48,546 742,689
Accumulated depreciation and impairment –123,600 –160,962 –113,330 – –397,892
Book value 200,623 68,954 26,674 48,546 344,797
January 1 – December 31, 2016
Opening book value non-divested companies 200,623 68,954 26,674 48,546 344,797
Foreign exchange differences –11,854 –855 183 0 –12,526
Investments – 3,658 825 13,088 17,571
Capitalization of future restoration cost 3,669 – – – 3,669
Redistributions 3,836 13,803 4,381 –21,694 326
Disposals and retirements –167,214 –50,433 –3,825 –750 –222,222
Depreciation/amortization –3,645 –9,030 –5,623 0 –18,298
Impairment losses for the year – – – – –
Closing book value 25,415 26,097 22,615 39,190 113,317
As at December 31, 2016
Cost of acquisition 83,356 124,965 124,157 39,190 371,668
Accumulated depreciation and impairment –57,941 –98,868 –101,542 0 258,351
Book value 25,415 26,097 22,615 39,190 113,317
January 1 – December 31, 2017
Opening book value non-divested companies 25,415 26,097 22,615 39,190 113,317
Foreign exchange differences –22 51 –249 0 –220
Investments 724 485 2,952 17,258 21,419
Capitalization of future restoration cost 0 0 0 0 0
Redistributions 28,547 9,487 5,654 –43,688 0
Disposals and retirements –1,106 0 –1,187 0 –2,293
Depreciation/amortization –2,865 –7,172 –5,630 0 –15,667
Impairment losses for the year 0 0 0 0 0
Closing book value 50,693 28,948 24,155 12,760 116,556
As at December 31, 2017
Cost of acquisition 111,081 132,900 121,550 12,760 378,291
Accumulated depreciation and impairment –60,388 –103,952 –97,395 0 –261,735
Book value 50,693 28,948 24,155 12,760 116,556
Depreciation costs include SEK 14,150 (17,503) thousand in ‘Cost of services sold’ SEK 78 (172) thousand in ‘Selling and marketing costs’ SEK 1,149 (435) thousand in ‘Administrative expenses’ and SEK 290 (282) thousand in ‘Research and development costs’. The value of finance leases capitalized as property, plant and equipment is presented in note 36.

50 NOTES TO THE CONSOLIDATED ACCOUNTS
STUDSV IK AB (PUBL ) ANNUAL REPORT 2017
Note 16 Intangible assets
GoodwillSoftware
rights
Contractual customer relations
and similar rights Total
As at December 31, 2015
Cost of acquisition 205,626 29,360 28,323 263,309
Accumulated depreciation and impairment
–33,604 –24,597 –23,701 –81,902
Book value 172,022 4,763 4,622 181,407
January 1 – December 31, 2016
Opening book value 172,022 4,763 4,622 181,407
Foreign exchange differences 5,202 68 27 5,297
Investments – 968 0 968
Depreciation/amortization –3,541 – –3,604 –7,145
Impairment losses for the year –1 –1,772 –717 –2,490
Closing book value 173,682 4,027 328 178,037
As at December 31, 2016
Cost of acquisition 208,620 30,637 17,768 257,025
Accumulated depreciation and impairment
–34,938 –26,610 –17,440 –78,988
Book value 173,682 4,027 328 178,037
January 1 – December 31, 2017
Opening book value 173,682 4,027 328 178,037
Foreign exchange differences –270 –111 8 –373
Investments 0 646 20 666
Disposals and retirements 0 0 0 0
Depreciation/amortization 0 –904 –19 –923
Impairment losses for the year 0
Closing book value 173,412 3,658 337 177,407
As at December 31, 2017
Cost of acquisition 209,284 31,001 18,236 258,521
Accumulated depreciation and impairment
–35,872 –27,343 –17,899 –81,114
Book value 173,412 3,658 337 177,407
Contractual customer relations and similar rights consist mainly of customer relations/contracts as well as some tenancy rights. Amortization of SEK 923 (1,781) thousand is included in ‘Cost of services sold’ in the income statement.
Impairment tests for goodwill Goodwill is allocated to the Group’s cash generating units (CGUs) identified by segment. A segment level summary of the goodwill allocation is presented below.
2017 2016
Consultancy Services 173,412 173,682
Other 0 0
Total 173,412 173,682
Goodwill is tested annually to identify any impairment loss. Acquired operations are integrated with other operations after acquisition. Impairment testing is therefore carried out at segment level. The segments are identified as cash generating units. The cash-generating units’ recoverable amount is based on value in use. These values are based on estimated future cash flows based on business plans approved by the Board of Directors for the next three years. The management has established the budgeted gross margin on the basis of previous earnings and its expectations concerning market developments. The rate of growth is estimated for each cash-generating unit on the basis of market position and development. Cash flows beyond the three-year period are extrapolated with an estimated annual rate of growth. A weighted cost of capital for borrowed capital and equity is applied as the discount rate, as presented below.
Material assumptions used for calculating value in use:
Gross margin %
Rate of growth
after year 3, %
Discount rate, %
Consultancy Services 2017 11 2.5 10.8
Consultancy Services 2016 14 2.5 9.9
The cost of borrowed capital has been determined individually for each segment, thereby taking into consideration differences in market rates between the markets in which the various units operate. The cost of equity is calculated as the return on risk-free investments for each segment, plus a market risk premium. The weighted cost of capital used in calculating the recoverable amount is 16 (14) per cent before tax. Based on the assumptions and estimates made, there is no impairment loss on goodwill. Studsvik has also assessed the sensitivity of value in use to unfavorable changes in the most important assumptions concerning cash flows and discount rate. There are no other specific circumstances that have affected impairment testing.

NOTES TO THE CONSOLIDATED ACCOUNTS 51
STUDSV IK AB (PUBL ) ANNUAL REPORT 2017
Note 17 Investments in associated companies2017 2016
As at January 1 4,010 3,886
Share in earnings 10,116 10,684
Disposals –74 –
Dividend received from associated companies –10,975 –9,768
Share in proceeds from disposals 5 –
Foreign exchange differences 39 –792
As at December 31 3,121 4,010
The Group’s holding in UK Nuclear Waste Management Ltd. The ordinary shares are directly owned by the Group. During the year the shares in KraftAkademin AB were sold.
2017 Operating site Participating interest % Valuation method
UK Nuclear Waste Management Ltd United Kingdom 15 Equity method
2016 Operating site Participating interest % Valuation method
KraftAkademin AB Sweden 25 Equity method
UK Nuclear Waste Management Ltd United Kingdom 15 Equity method
KraftAkademin AB produces and conducts training for the nuclear power industry. The business concept is based on giving customers the opportunity of supplementing their internal training activities with courses and seminars when implementing individual competence development plans. Studsvik contributes competence in thermo-hydraulics, reactor dynamics and health physics to KraftAkademin’s operations.
UK Nuclear Waste Management Ltd (NWM) has been appointed to be responsible, together with the Nuclear Decommissioning Authority (NDA), for management and operation of a final repository and to implement a well-functioning strategy for management of low level waste in the United Kingdom.
Obligations and contingent liabilities
There is an obligation to contribute capital to associated companies if necessary.
Financial information for the Group’s associated companies
A financial summary of the Group’s associated companies to which the equity method is applied is given below.
Balance sheet KraftAkademin AB* UK Nuclear Waste Management Ltd* Total
2017 2016 2017 2016 2017 2016
Current
Cash and cash equivalents 0 459 1,215 1,534 1,215 1,993
Other current assets 0 409 1,268 1,601 1,268 2,010
Total non-current assets 0 868 2,482 3,135 2,482 4,003
Financial liabilities (excluding trade payables) – – – – – –
Other current liabilities (including trade payables) 0 592 13,915 17,574 13,915 18,166
Total current liabilities 0 592 13,915 17,574 13,915 18,166
Non-current
Non-current assets – – 32,237 40,714 32,237 40,714
Total non-current assets – – 32,237 40,714 32,237 40,714
Financial liabilities – – – – – –
Other long-term liabilities – – – – – –
Total long-term liabilities – – – – – –
Net assets 0 276 20,804 26,275 20,804 26,551
Statement of comprehensive income 2017 2016 2017 2016 2017 2016
Income 0 2,552 71,404 85,396 71,404 87,948
Depreciation/amortization – – – – –
Interest income – – – – –
Interest expense – – – – –
Profit/loss before tax 0 158 67,440 71,087 67,440 71,245
Income tax 0 –21 – 0 –21
Net profit/loss for the year 0 137 67,440 71,087 67,440 71,224
Other comprehensive income – – – – – –
Total comprehensive income 0 137 67,440 71,087 67,440 71,224
The information above reflects the figures presented in the associated companies’ financial statements adjusted for differences in accounting rules between the Group and the respective associated company.
* Kraftakademin's financial year runs from September 1 to August 31, and UKNWM's financial year runes from April 1 to March 31. The figures are estimated on the basis of information available at the year-end closing in 2016 and 2017.

52 NOTES TO THE CONSOLIDATED ACCOUNTS
STUDSV IK AB (PUBL ) ANNUAL REPORT 2017
Reconciliation of the financial information
Reconciliation of the financial information to the carrying amount of the Group’s participations in associated companies.
KraftAkademin AB UK Nuclear Waste Management Ltd Total
2017 2016 2017 2016 2017 2016
Net assets as at January 1 0 175 26,275 25,586 26,275 25,761
Net profit/loss for the year 0 –36 67,440 71,087 67,440 71,051
Dividend 0 – –73,168 –65,121 –73,168 –65,121
Capital contributions from owners 0 – – 0 –
Foreign exchange differences 0 – 257 –5,277 257 –5,277
Other comprehensive income 0 – 0 – 0 –
Net assets as at December 31 0 139 20,804 26,275 20,804 26,414Participating interest associated companies 0 35 3,121 3,941 3,121 3,976Carrying amount 0 48 3,121 3,941 3,121 3,989
Note 18 Interests in joint ventures2017 2016
As at January 1 5,245 963Share in earnings –1,441 –805Investments for the year 0 6,338Dividend received from joint ventures – –Less participations sold – –Foreign exchange differences –58 –1,251As at December 31 3,746 5,245
The Group’s share in earnings of the joint ventures in which the company has interests, all of which are unlisted, and its share of assets (including goodwill and liabilities) is as follows.
2017Non-current
assetsCurrent
assetsCurrent
liabilities Net assets Income ResultsParticipating
interest
THOR Treatment Technologies, LLC USA 989 453 556 –21 –23 50
KOBELCO STUDSVIK Co., Ltd Japan 4,317 4,164 569 7,913 958 –2,245 49
Total 4,317 5,153 1,022 8,468 937 –2,268
2016Non-current
assetsCurrent
assetsCurrent
liabilities Net assets Income ResultsParticipating
interest
THOR Treatment Technologies, LLC USA – 1,116 502 615 17,227 –409 50
KOBELCO STUDSVIK Co., Ltd Japan 5,444 5,304 34 10,714 0 –396 49
Total 5,444 6,421 536 11,329 17,227 –805
THOR Treatment Technologies, LLC (TTT), is a joint venture where Studsvik is a co-owner under a cooperation agreement on joint control. TTT conducts waste treatment operations on the US federal waste market. KOBELCO STUDSVIK Co., Ltd is a joint venture in Japan, focusing on design of facilities for treatment of Japanese radioactive waste.
Obligations and contingent liabilities
A summary is given below of the Group’s joint venture companies in which the equity method is applied.

NOTES TO THE CONSOLIDATED ACCOUNTS 53
STUDSV IK AB (PUBL ) ANNUAL REPORT 2017
Financial information for the Group’s joint ventures
A summary is given below of the Group’s joint venture companies in which the equity method is applied.
Balance sheet KOBELCO STUDSVIK Co., Ltd THOR Treatment Technologies, LLC
2017 2016 2017 2016
Current
Cash and cash equivalents 241 10,825 2,216 2,456
Other current assets 8,258 0 0 0
Total non-current assets 8,498 10,825 2,216 2,456
Financial liabilities (excluding trade payables) – – –
Other current liabilities (including trade payables) 1,161 69 1,298 1,391
Total current liabilities 1,161 69 1,298 1,391
Non-current
Non-current assets 8,811 11,110 149 165
Total non-current assets 8,811 11,110 149 165
Financial liabilities – – – –
Other long-term liabilities – – – –
Total long-term liabilities – – – –
Net assets 16,148 21,866 1,067 1,230
Share of net assets 7,913 10,714 534 615
Elimination of intra-group profit against share of equity –5,498 –6,084 – –
Carrying amount 2,415 4,630 534 615
Statement of comprehensive income KOBELCO STUDSVIK Co., Ltd THOR Treatment Technologies, LLC
2017 2016 2017 2016
Income 1,955 0 –42 34,455
Depreciation/amortization – – – –
Interest income – – – –
Interest expense – – – –
Profit/loss before tax –4,582 –809 –50 –818
Income tax – – – –
Net profit/loss for the year –4,582 –809 –50 –818
Other comprehensive income – – – –
Total comprehensive income –4,582 –809 –50 –818
The information above reflects the figures presented in THOR Treatment Technologies, LLC, KOBELCO STUDSVIK Co., Ltd, financial statements adjusted for differences in accounting rules between the Group and the joint venture company.

54 NOTES TO THE CONSOLIDATED ACCOUNTS
STUDSV IK AB (PUBL ) ANNUAL REPORT 2017
Note 19 Financial instruments by category
Accounting policies for financial instruments have been applied to the items below.
Loans and trade receivables
Assets at fair value through
profit or lossDerivatives for hedging Total
As at December 31, 2017Assets on the balance sheetDerivative instruments – – 2,733 2,733Trade and other receivables 266,329 – – 266,329Other financial assets measured at fair value through profit or loss – 57,592 – 57,592Cash and cash equivalents 98,672 – – 98,672Total 365,018 57,592 2,733 425,326
Liabilities at fair value through
profit or loss
Otherfinancial liabilities
Derivatives for hedging Total
Liabilities on the balance sheetBorrowings – 199,850 – 199,850Derivative instruments – – 2,862 2,862Total – 199,850 2,862 202,712
Loans and trade receivables
Assets at fair value through
profit or lossDerivatives for hedging Total
As at December 31, 2016Assets on the balance sheetDerivative instruments – – 2,246, 2,246Trade and other receivables 254,329 – – 254,329Other financial assets measured at fair value through profit or loss – 56,614 – 56,614Cash and cash equivalents 195,363 – – 195,363Total 449,692 56,614 2,246 508,552
Liabilities at fair value through
profit or loss
Otherfinancial liabilities
Derivatives for hedging Total
Liabilities on the balance sheetBorrowings – 198,250 – 198,250Derivative instruments – – 5,929 5,929Total 0 198,250 5,929 204,179
Note 20 Credit quality of the financial assets
The credit quality of the financial assets can be assessed by referring to external credit ratings (if available) or to the counterparty’s payment history.
2017 2016
Trade receivables
Counterparties without external credit rating
- New customers (less than 6 months) 8,170 645
- Existing customers with no defaults in the past 150,744 149,030
- Existing customers with some delayed payments in the past 0 1,065
Total 158,914 150,740
Loans to related parties
Existing related party with no previous defaults 1,654 1,876
Total 1,654 1,876
No repayment of loans to related parties was made during the year.
Bank balances and short-term borrowing
AA- and A+ 98,672 195,363
Total 98,672 195,363
Derivative instruments
AA- and A+ 2,733 2,246
Total 2,733 2,246
No repayment of loans to related parties was made during the year.

NOTES TO THE CONSOLIDATED ACCOUNTS 55
STUDSV IK AB (PUBL ) ANNUAL REPORT 2017
Note 21 Derivative instruments
2017 2016
Assets Liabilities Assets Liabilities
Forward exchange contracts – Cash flow hedges 2,733 2,862 2,246 5,929
The entire fair value of a derivative instrument designated as a hedging instrument is classified as a non-current asset or liability when the remaining maturity of the hedged item is more than 12 months and as a current asset or liability when the remaining maturity is less than 12 months. Revaluation of forward exchange contracts designated as hedges is through equity. Other forward contracts are revalued through profit or loss. The ineffective portion, recognized in the income statement, referring to cash flow hedges, amounts to SEK –1,719 thousand (notes 5 and 6). The hedged, highly probable forecast transactions in foreign currency are expected to occur on varying dates during the coming 36 months. Gains and losses on forward exchange contracts as at December 31, 2017, recognized in the hedging reserve in equity (note 28), are recognized in the income statement in the period or periods during which the hedged forecast transaction affects the income statement.
Outstanding forward exchange contracts on December 31, 2017
INFLOW CURRENCIES OUTFLOW CURRENCIES
EUR GBP USD EUR JPY
Maturity year 000 000 000 000 000
2018 Amount 690 15 2,239 – –
Rate1 9,491 10,933 8,051 – –
2019 Amount 314 – 251 – –
Rate1 9,490 – 8,275 – –
Remeasured at fair value, SEK thousands 9,200 165 20,054 – –
1 Average contractual rate
The nominal amount for outstanding forward exchange contracts is SEK 29,796 (38,425) thousand.
Note 22 Trade and other receivables 2017 2016
Trade receivables 159,258 152,000
Less – Provision for impairment of receivables –344 –1,260
Trade receivables – net 158,914 150,740
Loans to related parties (note 37) 1,654 1,876
Other receivables 24,800 24,800
Service contracts in progress 53,477 53,537
Tax assets 11,268 11,470
Other receivables 28,962 0
Prepaid expenses and accrued income
- Accrued income 6,070 2,959
- Prepaid rent 925 626
- Prepaid lease charges 0 0
- Prepaid insurance premiums 1,653 2,516
– Other prepaid expenses 5,270 25,084
Total 292,993 281,005
Long term portion 26,664 26,676
Current portion 266,329 254,329
Total 292,993 281,005
Of the long-term receivables SEK 1,654 (1,876) million constitutes receivables from related parties, which is on level 2 of the fair value hierarchy. The book value for trade and other receivables is the fair value.
The effective interest rate on long-term receivables is as follows.
2017 2016
Loans to related parties (note 37) 2.0 % 2.0 %
As at December 31, 2017 trade receivables amounting to SEK 53,108 (38,852) million were overdue without any impairment loss being identified. These refer to a number of independent customers who have not had payment difficulties in the past. An age analysis of these trade receivables is given below:
2017 2016
Less than 3 months 45,109 37,275
3 to 6 months 6,462 1,459
More than 6 months 1,537 118
Total 53,108 38,852
The reserve for doubtful receivables amounted to SEK 344 (1,260) thousand as at December 31, 2017.
Carrying amounts of the Group’s trade and other receivables by currency are as follows.
2017 2016
SEK 158,123 169,747
EUR 74,765 67,775
GBP 12,058 10,917
USD 41,009 24,500
Other currencies 7,038 8,066
Total 292,993 281,005
Changes in the reserve for doubtful receivables:
2017 2016
As at January 1 –1,261 –1,829
Translation difference 0 0
Provision for doubtful receivables 0 0
Receivables written off as unrecoverable 307 367
Unused amounts reversed 610 201
As at December 31 –344 –1,261
Transfers to and reversals from reserves for doubtful receivables are included in the item ’Other costs’ in the income statement. Amounts stated in the depreciation account are normally written off when the Group is not expected to recover further cash funds. No impairment loss has been identified for any assets in other categories of trade and other receivables. There is no concentration of credit risk with respect to trade receivables, as the Group has a large number of customers, internationally dispersed.
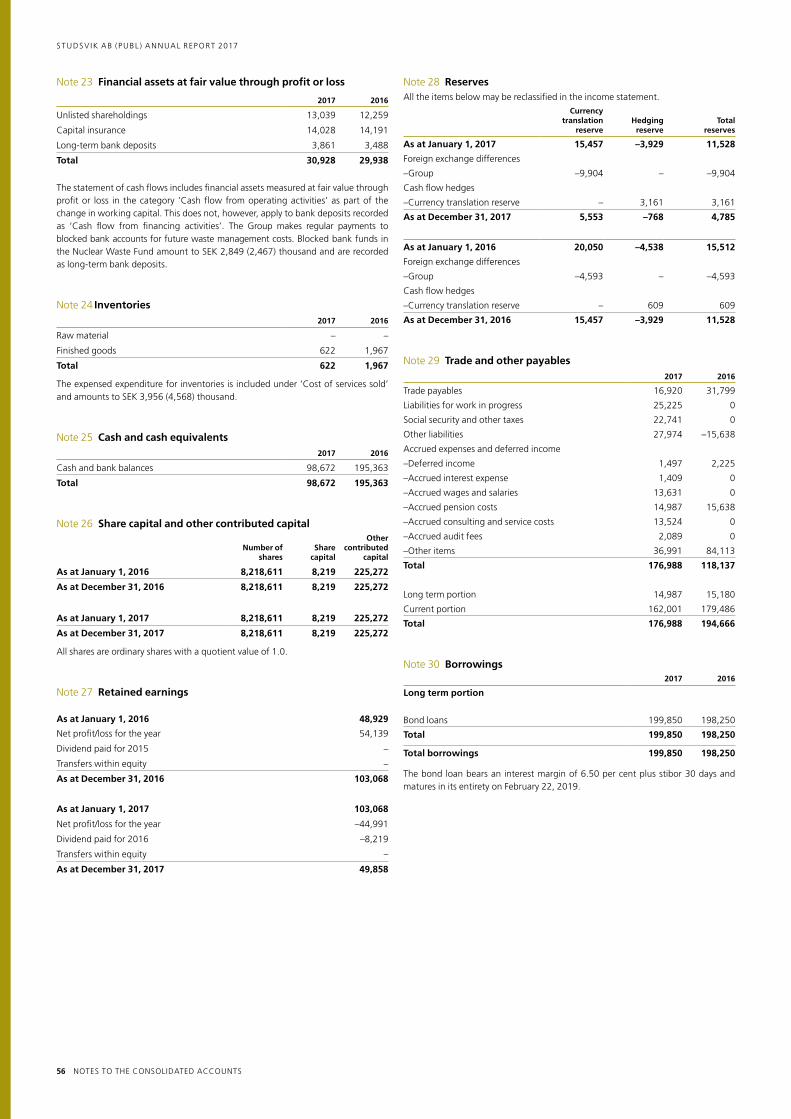
56 NOTES TO THE CONSOLIDATED ACCOUNTS
STUDSV IK AB (PUBL ) ANNUAL REPORT 2017
Note 23 Financial assets at fair value through profit or loss
2017 2016
Unlisted shareholdings 13,039 12,259
Capital insurance 14,028 14,191
Long-term bank deposits 3,861 3,488
Total 30,928 29,938
The statement of cash flows includes financial assets measured at fair value through profit or loss in the category ‘Cash flow from operating activities’ as part of the change in working capital. This does not, however, apply to bank deposits recorded as ‘Cash flow from financing activities’. The Group makes regular payments to blocked bank accounts for future waste management costs. Blocked bank funds in the Nuclear Waste Fund amount to SEK 2,849 (2,467) thousand and are recorded as long-term bank deposits.
Note 24 Inventories2017 2016
Raw material – –
Finished goods 622 1,967
Total 622 1,967
The expensed expenditure for inventories is included under ’Cost of services sold’ and amounts to SEK 3,956 (4,568) thousand.
Note 25 Cash and cash equivalents2017 2016
Cash and bank balances 98,672 195,363
Total 98,672 195,363
Note 26 Share capital and other contributed capital
Number of shares
Share capital
Othercontributed
capital
As at January 1, 2016 8,218,611 8,219 225,272
As at December 31, 2016 8,218,611 8,219 225,272
As at January 1, 2017 8,218,611 8,219 225,272
As at December 31, 2017 8,218,611 8,219 225,272
All shares are ordinary shares with a quotient value of 1.0.
Note 27 Retained earnings
As at January 1, 2016 48,929
Net profit/loss for the year 54,139
Dividend paid for 2015 –
Transfers within equity –
As at December 31, 2016 103,068
As at January 1, 2017 103,068
Net profit/loss for the year –44,991
Dividend paid for 2016 –8,219
Transfers within equity –
As at December 31, 2017 49,858
Note 28 ReservesAll the items below may be reclassified in the income statement.
Currency translation
reserveHedging
reserveTotal
reserves
As at January 1, 2017 15,457 –3,929 11,528
Foreign exchange differences
–Group –9,904 – –9,904
Cash flow hedges
–Currency translation reserve – 3,161 3,161
As at December 31, 2017 5,553 –768 4,785
As at January 1, 2016 20,050 –4,538 15,512
Foreign exchange differences
–Group –4,593 – –4,593
Cash flow hedges
–Currency translation reserve – 609 609
As at December 31, 2016 15,457 –3,929 11,528
Note 29 Trade and other payables2017 2016
Trade payables 16,920 31,799
Liabilities for work in progress 25,225 0
Social security and other taxes 22,741 0
Other liabilities 27,974 –15,638
Accrued expenses and deferred income
–Deferred income 1,497 2,225
–Accrued interest expense 1,409 0
–Accrued wages and salaries 13,631 0
–Accrued pension costs 14,987 15,638
–Accrued consulting and service costs 13,524 0
–Accrued audit fees 2,089 0
–Other items 36,991 84,113
Total 176,988 118,137
Long term portion 14,987 15,180
Current portion 162,001 179,486
Total 176,988 194,666
Note 30 Borrowings2017 2016
Long term portion
Bond loans 199,850 198,250
Total 199,850 198,250
Total borrowings 199,850 198,250
The bond loan bears an interest margin of 6.50 per cent plus stibor 30 days and matures in its entirety on February 22, 2019.
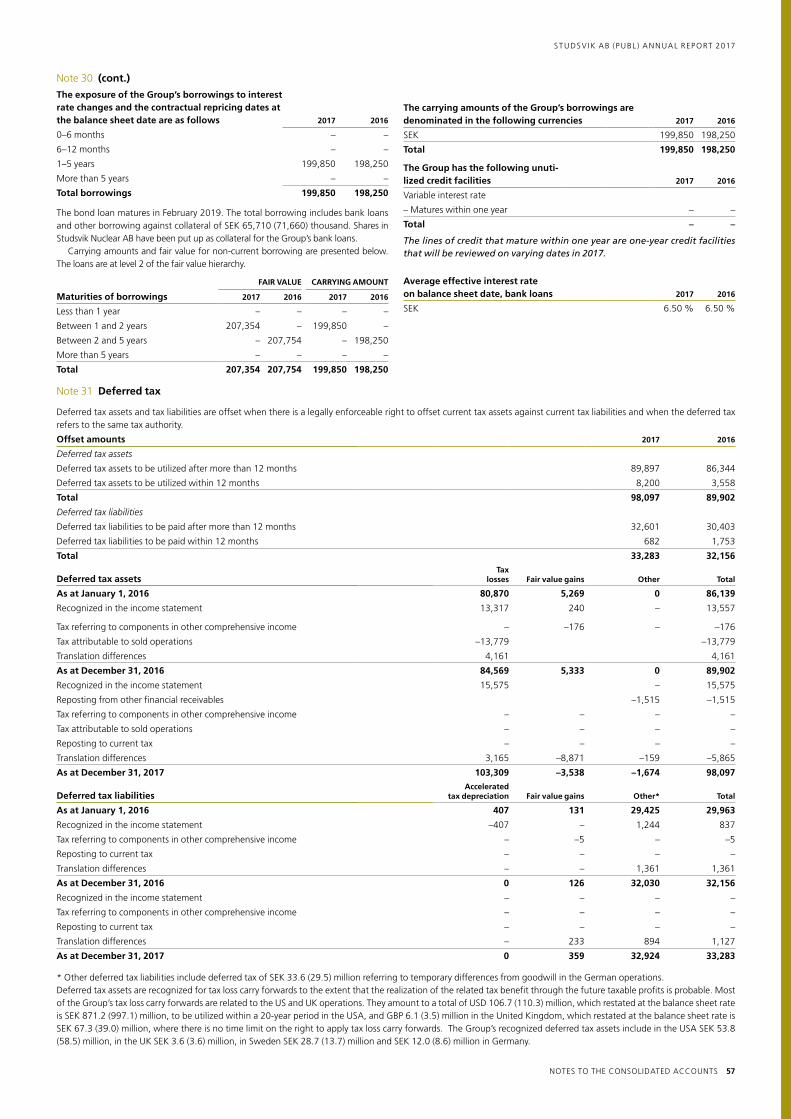
NOTES TO THE CONSOLIDATED ACCOUNTS 57
STUDSV IK AB (PUBL ) ANNUAL REPORT 2017
Note 30 (cont.)
The exposure of the Group’s borrowings to interest rate changes and the contractual repricing dates at the balance sheet date are as follows 2017 2016
0–6 months – –
6–12 months – –
1–5 years 199,850 198,250
More than 5 years – –
Total borrowings 199,850 198,250
The bond loan matures in February 2019. The total borrowing includes bank loans and other borrowing against collateral of SEK 65,710 (71,660) thousand. Shares in Studsvik Nuclear AB have been put up as collateral for the Group’s bank loans.
Carrying amounts and fair value for non-current borrowing are presented below. The loans are at level 2 of the fair value hierarchy.
FAIR VALUE CARRYING AMOUNT
Maturities of borrowings 2017 2016 2017 2016
Less than 1 year – – – –
Between 1 and 2 years 207,354 – 199,850 –
Between 2 and 5 years – 207,754 – 198,250
More than 5 years – – – –
Total 207,354 207,754 199,850 198,250
The carrying amounts of the Group’s borrowings are denominated in the following currencies 2017 2016
SEK 199,850 198,250
Total 199,850 198,250
The Group has the following unuti-lized credit facilities 2017 2016
Variable interest rate
– Matures within one year – –
Total – –
The lines of credit that mature within one year are one-year credit facilities that will be reviewed on varying dates in 2017.
Average effective interest rate on balance sheet date, bank loans 2017 2016
SEK 6.50 % 6.50 %
Note 31 Deferred tax
Deferred tax assets and tax liabilities are offset when there is a legally enforceable right to offset current tax assets against current tax liabilities and when the deferred tax refers to the same tax authority.
Offset amounts 2017 2016
Deferred tax assets
Deferred tax assets to be utilized after more than 12 months 89,897 86,344
Deferred tax assets to be utilized within 12 months 8,200 3,558
Total 98,097 89,902
Deferred tax liabilities
Deferred tax liabilities to be paid after more than 12 months 32,601 30,403
Deferred tax liabilities to be paid within 12 months 682 1,753
Total 33,283 32,156
Deferred tax assetsTax
losses Fair value gains Other Total
As at January 1, 2016 80,870 5,269 0 86,139
Recognized in the income statement 13,317 240 – 13,557
Tax referring to components in other comprehensive income – –176 – –176
Tax attributable to sold operations –13,779 –13,779
Translation differences 4,161 4,161
As at December 31, 2016 84,569 5,333 0 89,902
Recognized in the income statement 15,575 – 15,575
Reposting from other financial receivables –1,515 –1,515
Tax referring to components in other comprehensive income – – – –
Tax attributable to sold operations – – – –
Reposting to current tax – – – –
Translation differences 3,165 –8,871 –159 –5,865
As at December 31, 2017 103,309 –3,538 –1,674 98,097
Deferred tax liabilitiesAccelerated
tax depreciation Fair value gains Other* Total
As at January 1, 2016 407 131 29,425 29,963
Recognized in the income statement –407 – 1,244 837
Tax referring to components in other comprehensive income – –5 – –5
Reposting to current tax – – – –
Translation differences – – 1,361 1,361
As at December 31, 2016 0 126 32,030 32,156
Recognized in the income statement – – – –
Tax referring to components in other comprehensive income – – – –
Reposting to current tax – – – –
Translation differences – 233 894 1,127
As at December 31, 2017 0 359 32,924 33,283
* Other deferred tax liabilities include deferred tax of SEK 33.6 (29.5) million referring to temporary differences from goodwill in the German operations.Deferred tax assets are recognized for tax loss carry forwards to the extent that the realization of the related tax benefit through the future taxable profits is probable. Most of the Group’s tax loss carry forwards are related to the US and UK operations. They amount to a total of USD 106.7 (110.3) million, which restated at the balance sheet rate is SEK 871.2 (997.1) million, to be utilized within a 20-year period in the USA, and GBP 6.1 (3.5) million in the United Kingdom, which restated at the balance sheet rate is SEK 67.3 (39.0) million, where there is no time limit on the right to apply tax loss carry forwards. The Group’s recognized deferred tax assets include in the USA SEK 53.8 (58.5) million, in the UK SEK 3.6 (3.6) million, in Sweden SEK 28.7 (13.7) million and SEK 12.0 (8.6) million in Germany.

58 NOTES TO THE CONSOLIDATED ACCOUNTS
STUDSV IK AB (PUBL ) ANNUAL REPORT 2017
Note 32 Pension obligations
Defined benefit pension plansThere are a few defined benefit pension plans within the Group, which are primarily based on final salary. The largest of the plans is in Germany. Other pension obligations, which also exist in Germany and Japan, have not been regarded as having any material effect and have not been subject to actuarial calculation.
Pension insurance with Alecta Commitments for old-age pension and family pension for employees in Sweden are safeguarded through insurance with Alecta. According to a statement by the Swedish Financial Reporting Board, UFR 10, this is a defined benefit plan covering several employers. For the 2017 financial year the Group has not had access to information that makes it possible to report this plan as a defined benefit plan. The pension plan under ITP, which is vested through insurance with Alecta, is therefore reported as a defined contribution plan. The year’s contributions for pension insurance taken out with Alecta amount to SEK,5,798 (5,288) thousand. Alecta’s surplus can be distributed to the policy holders and/or the insured. At the end of 2017 Alecta’s surplus in the form of a collective solvency level was 154 (148) per cent. The collective solvency level comprises the market value of Alecta’s assets as a percentage of its insurance commitments calculated in accordance with Alecta’s actuarial assumptions, which do not comply with IAS 19.
2017 2016
Obligations in the balance sheet for
Pension benefits 9,767 5,525
Recognition in the income statement for (note 9)
Pension costs 27,460 30,226
Amounts recognized in the balance sheet 2017 2016
Present value of unfunded obligations 9,767 5,525
Total 9,767 5,525
Amounts recognized in the income statement 2017 2016
Defined benefit plans
Current service cost 0 239
Interest expense 57 75
Total 57 314
Of the total cost, SEK 57 (314) thousand was included in the items ’Cost of goods sold’ and ’Administrative expenses’. The actual return on plan assets was SEK – (–) thousand.
Changes in the liability recognized in the consolidated balance sheet 2017 2016
At the start of the year 5,525 5,478
Translation differences 4,302 –105
Total expense recognized in the income statement 57 314
Contributions paid –117 –162
At the end of the year 9,767 5,525
Total pension costs recognized in the consolidated income statement 2017 2016
Total costs for defined benefit plans 57 314
Total costs for defined contribution plans 23,567 25,538
Costs of special employer’s contribution and tax on returns from pension funds 3,836 4,374
Total 27,460 30,226
Actuarial assumptions 2017 2016
Discount rate 1.5 % 1.5 %
Expected return on plan assets 1.0 % 0.0 %
Future salary increases 0.0 % 0.0 %
Future pension increases 1.0 % 1.0 %
Note 33 Other provisionsFuture
waste man-agement
costs Other
provisions Total
As at January 1, 2017 86,984 23,354 110,338
Recognized as an expense in the consoli-dated income statement
– Additional provisions 10,496 256 10,752
– Reversed provisions – – –
Capitalized as property, plant and equipment
Transfers 897 –2,996 –2,099
Discount effect – 0
Foreign exchange difference 0 0 0
Funds in sold operations 0 0 0
Amount utilized during the period –6,047 –171 –6,218
Translation difference – 0 0
As at December 31, 2017 92,330 20,443 112,772
Long term portion 86,553 20,203 106,755
Current portion 5,777 240 6,017
Total 92,330 20,443 112,772
The Group’s operations generate nuclear waste and radioactive waste which must be sent for final disposal within the framework of the systems and rules in force in the countries in which Studsvik carries on operations in its own production facilities. Provisions are made for operational waste, spent reactor fuel and also to some extent for decommissioning of facilities and the resulting decommissioning waste. The main part of the costs of decommissioning and decommissioning waste from the Group’s Swedish nuclear facilities is financed, under the provisions of the Studsvik Act 1988:1597, through a charge on nuclear generated electricity. Fees paid in are administered by the Nuclear Waste Fund. The Group’s total payments to the Nuclear Waste Fund amount to SEK 2,849 (2,467) million and are recorded as long-term bank deposits, see note 23. Funds for decommissioning and waste management may be withdrawn from the Fund by Studsvik, which holds the nuclear permit for the facilities in question. Studsvik is not liable to pay under the current Act. Studsvik’s responsibility for decommissioning and waste management for its own nuclear facilities is limited to buildings, systems and components coming into existence after June 30, 1991. Studsvik estimates these commitments on a current basis and provision is made for them.
Future waste management costsFuture waste management costs cover provisions for operational waste and spent reactor fuel. Of the total provisions of SEK 92.3 million, SEK 5,8 million is expected to be utilized in 2018 and the rest is expected to be utilized successively and at the earliest starting in 2019.
Other provisionsOther provisions cover future costs for decommissioning and management of waste in connection with the decommissioning of the Studsvik facility. Of the total provisions of SEK 20.4 million, SEK 0.2 million is expected to be utilized in 2018. The remaining part of the provisions is expected to be utilized only in connection with decommissioning operations. Studsvik’s payments to the Nuclear Waste Fund are included in the item ‘Financial assets at fair value through profit or loss’.
Note 34 Cash flow from operating activities
Non-cash items 2017 2016
Depreciation/amortization 16,590 20,788
Impairment losses on property, plant and equipment 2,293 678
Proceeds from sale of property, plant and equipment – –
Proceeds from sale of subsidiaries and other business units –76 –107,174
Share in earnings from associated companies –8,680 –4,145
Revaluation of financial holdings –545 –550
Other changes in provisions 6,513 46,743
Total 16,095 –43,660

NOTES TO THE CONSOLIDATED ACCOUNTS 59
STUDSV IK AB (PUBL ) ANNUAL REPORT 2017
Note 37 Transactions with related parties
Studsvik, Inc. owns 50 percent of THOR Treatment Technologies, LLC (TTT). In accordance with a Joint Venture Operating Agreement the owners are to provide management, technical and marketing services to TTT. Studsvik owns 15 per cent of UK Nuclear Waste Management Ltd (NWM), where Studsvik, in a consortium together with other partners, will manage and operate a repository for low level radioactive waste in the United Kingdom. Studsvik AB owns 49 % of KOBELCO STUDSVIK Co,. Ltd, a joint venture in Japan, focusing on design of facilities for treatment of Japanese waste.
Transactions with related parties 2017 2016
Sale of services– THOR Treatment Technologies, LLC 0 17,227– UK Nuclear Waste Management Ltd 10,116 10,663– KOBELCO STUDSVIK Co., Ltd 3,952 5,736
Reported receivables from related parties
– THOR Treatment Technologies, LLC 0 1,609– UK Nuclear Waste Management Ltd 3,121 5,273– KOBELCO STUDSVIK Co., Ltd 1,895 0
Provision for doubtful trade receivables – –Impairment loss on trade receivables – –
Total costs referring to provisions and impairment losses recognized in the income statement 19,084 40,508
Loans receivable from related parties– UK Nuclear Waste Management Ltd 1,654 1,876
Under an agreement with the owners the services are supplied on a commercial basis. There have been no transactions with other related parties, besides remuneration to the Board of Directors, President and senior management. Remuneration to the Board of Directors, President and senior management is described in Note 9. Studsvik holds 79 per cent of Studsvik Scandpower, Inc. The remaining 21 per cent is held by a private individual previously employed by the company. Studsvik owns 91 per cent of Studsvik Scandpower AB and its subsidiary Studsvik Scandpower GmbH. The remaining 9 per cent is held by the minority shareholder of Studsvik Scandpower, Inc. The owners have agreed on how share transfers are to take place in the event of one of the parties wishing to relinquish or increase their holdings in the two companies. Studsvik can only increase its ownership through acquisition of the entire minority holding. The acquisition must be at market price. An acquisition must cover both companies. If the minority wishes to relinquish its ownership, the shares must be offered to Studsvik at market price. The market price will be determined by an independent valuation institute. In a situation where Studsvik AB wishes to relinquish its holding the minority has an option to acquire 12 per cent of the shares in Studsvik Scandpower AB at book value of equity.
Note 35 Contingent liabilities
The Group has contingent liabilities in respect of bank guarantees and other guarantees as well as other items arising in the normal course of business. No material liabilities are expected to arise through these contingent liabilities. In the normal course of business the Group has issued guarantees amounting to SEK 65,710 (71,660) thousand to third parties. No further payments are expected as at the date of these financial statements.
Note 36 Commitments
CAPITAL COMMITMENTSCapital expenditure contracted for at the balance sheet date but not yet recognized in the financial statements is as follows.
2017 2016
Property, plant and equipment – –
Total – –
OPERATING LEASE COMMITMENTSLease expenses for operating leases for the year amounted to SEK 12,948 (14,168) thousand.
Future aggregate minimum lease payments 2017 2016
Within 1 year 8,593 10,582
Between 1 and 5 years 14,330 12,484
More than 5 years – 150
Total 22,923 23,216

60 NOTES TO THE CONSOLIDATED ACCOUNTS
STUDSV IK AB (PUBL ) ANNUAL REPORT 2017
Note 38 Information on the Board of Directors and senior management
Salaries and other benefits, 2017Basic salary/
Board feeCommittee
feeVariable
remunerationOther
benefitsPension
costOther
remuneration Total
Chairman of the Board
– Anders Ullberg 650 75 – – – – 725
Members of the board (6)
– Jan Barchan 225 – – – – – 225
– Anna Karinen 225 – – – – – 225
– Alf Lindfors 225 – – – – – 225
– Peter Gossas 225 150 – – – – 375
– Agneta Nestenborg 225 75 – – – – 300
Employee representatives* (4) – – – – – – –
President 3,829 – – 160 2,713 4,862 11,564
Other senior management (6) 8,894 – 55 550 2,728 3,020 15,247
Total 14,498 300 55 710 5,441 7,882 28,886
Salaries and other benefits, 2016Basic salary/
Board feeCommittee
feeVariable
remunerationOther
benefitsPension
costOther
remuneration Total
Chairman of the Board
– Anders Ullberg 650 75 – – – – 725
Members of the board (6)
– Jan Barchan 225 – – – – – 225
– Lars Engström 113 75 – – – – 188
– Anna Karinen 225 – – – – – 225
– Alf Lindfors 225 – – – – – 225
– Peter Gossas 225 113 – – – – 338
– Agneta Nestenborg 225 38 – – – – 263
Employee representatives* (4) – – – – – – –
President 3,646 – 200 121 1,264 – 5,231
Other senior management (6) 8,894 – 303 332 1,921 – 10,999
Total 13,977 300 503 453 3,185 – 18,419
* Two ordinary members and two alternates.
Remuneration to the board of directors and other senior management 2017 2016
Parent company
Salaries and other remuneration 15,206 9,342
– Of which variable remuneration – 400
Pensions 3,777 2,054
Number of persons 9 13
SubsidiariesSalaries and other remuneration 8,239 5,891– Of which variable remuneration 55
Pensions 1,664 1,131
Number of persons 4 4
Group
Salaries and other remuneration 23,445 15,233
– Of which variable remuneration 55 503
Pensions 5,441 3,185
Number of persons 13 17
PrinciplesIn 2017 the members of the Board of Directors did not receive any remuneration in addition to the Board and Committee fees.
Variable remunerationThe President has the right to variable remuneration. The forms of the variable salary component are established annually. No variable remuneration was paid for 2017. The variable salary component for other senior management for 2017 is based on outcomes related to individually specified targets at both Group and unit level. For 100 per cent target fulfillment in all parameters a maximum variable salary component is payable of 10–30 percent of the basic salary.
Other benefits and remunerationOther benefits reported are company car, meal subsidies and other benefits such as health care. Other remuneration consists of severance pay.
Financial instrumentsUnder current employment contracts there are no share based payments.
PensionThe pensionable age of the President is 65 years. Apart from statutory national pension he has a defined contribution pension plan to which the company pays in a monthly pension premium equivalent to 35 per cent of fixed monthly salary. For other members of the Executive Group Management a pension is payable as a rule from the age of 65. The members of the Swedish Executive Group Management follow the ITP plan. In one case there is a defined contribution pension plan to which the company pays a premium equivalent to 25 per cent of fixed salary. Defined contribution plans apply to Executive Group Management members outside Sweden.
Termination and severance payThe President’s period of notice is 6 months for his own termination of employment and 12 months for termination by the company. In the case of termination of employment by the company, salary is payable during the period of notice as well as an additional monthly severance payment for 6 months after termination of employment, though no longer than until retirement age. The monthly severance payment will be equivalent to the fixed monthly salary received during the period of notice. Deduction is made for any salary from a new employer. For other members of the group executive management, the main rule is that the period of notice is 6 months when employment is terminated by the employee and 6 months when terminated by the company. In the case of termination of employment by the company, salary is payable during the period of notice as well as an additional severance payment of up to 6 months’ salary.

NOTES TO THE CONSOLIDATED ACCOUNTS 61
STUDSV IK AB (PUBL ) ANNUAL REPORT 2017
Note 39 Operations held for sale
Cash flow from operations held for sale 2017 2016
Cash flow from operating activities – –47,100
Cash flow from investing activities – –3,200
Cash flow from financing activities – –1,607
Total – –51,907
Cash flow from operations held for sale is included in the Group’s reported cash flows in the amounts above.
Assets in the disposal group classified as operations held for sale 2017 2016
Property, plant and equipment – –
Goodwill – –
Other current assets – –
Total – –
Liabilities in the disposal group classified as opera-tions held for sale 2017 2016
Trade and other payables – –
Provisions – –
Total – –
Accumulated income reported in other comprehen-sive income referring to disposal group classified as operations held for sale 2017 2016
Translation differences on foreign subsidiaries – 4,137
Total – 4,137
Analysis of profit from operations held for sale and accounting profit on revaluation of operations held for sale 2017 2016
Sales revenues – 71,629
Other operating income – –
Costs – –133,463
Other operating expense – –
Operating profit – –61,834
Financial expenses – –594
Profit/loss from operations held for sale - before tax – –62,428
Income tax – 1,282
Profit/loss from operations held for sale - after tax – –61,146
Proceeds of disposal – 107,149
Income tax – –
Profit/loss from operations held for sale - after tax – 46,003
On July 28 2016 the Waste Treatment business area was sold to EDF. The transac-tion generated a net gain of SEK 107 million.
Note 40 Events after the close of the reporting period
No events considered to be material as defined in IAS 10 have occurred after the close of the reporting period on December 31, 2017.
Note 41 Reconciliations of key figures and ratios
Amounts in SEK million
Return on capital employed 2017 2016
Profit/loss after financial items –58.7 –0.6
Financial costs according to the income statement 15.3 25.0
Fair value- foreign exchange losses 2.8 0.5
Total –40.6 24.9
Balance sheet total 901.0 686.6
Provisions and other long-term liabilities –161.7 –80.6
Trade and other payables –192.6 –224.3
Opening capital employed 546.7 381.7
Balance sheet total 824.9 901.0
Provisions and other long-term liabilities –164.8 –161.7
Trade and other payables –171.8 –192.6
Closing capital employed 488.3 546.7
Average capital employed 517.5 464.2
Return on capital employed –7.8 7.3
Return on equity 2017 2016
Net profit/loss for the year –45.0 54.1
Total –45.0 54.1
Opening equity 348.5 298.3
Closing equity 288.4 348.5
Return on equity –14.1 2.5
Net debt 2017 2016
Current borrowing – 0
Non-current borrowing 199.9 198.2
Total debt 199.9 198.2
Cash and cash equivalents 98.7 195.4
Net debt 101.2 2.9
Definitions of key figures and ratios are presented on page 80.

STUDSV IK AB (PUBL ) ANNUAL REPORT 2017
Note 46 Other operating income and expense
Other operating income 2017 2016
Financial assets at fair value through profit or loss
– Fair value gains 781 934
Foreign exchange gains 48 63
Total 829 997
Other operating expense 2017 2016
Provision for severance payment –9,255 –
Foreign exchange losses –204 –134
Total –9,459 –134
Note 47 Operating leases 2017 2016
Maturity within one year 60 440
Maturity after one year but within five years – 60
Maturity after five years –
Total 60 500
The parent company’s leases mainly refer to vehicles and premises with traditional terms and conditions.
Note 48 Result from participation in group companies2017 2016
Dividend from group companies – 8,000
Group contributions from subsidiaries – 6,311
Result of recognition of impairment loss on shares in subsidiary
– –
Total 0 14,311
Note 49 Interest income and similar profit/loss items2017 2016
Interest 10,150 9,971
Exchange rate differences – 8,893
Total 10,150 18,864
Of which in respect of Group companies
Interest 10,150 9,971
Total 10,150 9,971
NOTES TO THE PARENT COMPANY ACCOUNTS
For the parent company’s accounting policies, see note 1.24.Note 42 Sales revenue
Sales revenue by geographical market 2017 2016
Sweden 7,826 9,543
Europe, not including Sweden 8,776 9,563
Asia 7 –
North America 3,059 3,347
Total 19,668 22,453
Note 43 Employee benefits2017 2016
Salariesand other
remuneration* (of which
variable remuneration)
Social security
expenses (of which
pension costs)
Salariesand other
remuneration* (of which
variable remuneration)
Social security
expenses (of which
pension costs)
Board of Directors 10,925 6,324 6,027 3,457and President (–) (2,713) (–) (1,570)
Other employees 6,000 4,803 6,638 5,278(2,546) (2,497)
Total 16,925 11,127 12,665 8,735(–) (5,259) (–) (4,067)
See also note 38.
*Salaries and other remuneration includes severance payments. See also note 38.
Note 44 Costs by nature of expense2017 2016
Purchases of material and services 20,847 19,640
Personnel costs 18,675 19,298
Depreciation/amortization 702 690
Total 40,224 39,628
Services include fees and remuneration to accounting firms as follows:
2017 2016
PricewaterhouseCoopers
Audit assignments 450 465
Audit business in addition to audit – 0
Tax consultancy – 40
Other services 325 38
Total 775 543
Audit assignments refer to the examination of the annual accounts, the accounting records and the administration by the Board of Directors and the President. It also includes other duties that are incumbent on the company’s auditors as well as advisory services and other types of support as a result of observations made through such an examination or performance of such duties.
Note 45 Depreciation/amortization2017 2016
According to plan
Book According to plan
Book
Equipment and tools 702 702 690 690
Total 702 702 690 690
62 NOTES TO THE PARENT COMPANY ACCOUNTS

STUDSV IK AB (PUBL ) ANNUAL REPORT 2017
NOTES TO THE PARENT COMPANY ACCOUNTS 63
Note 54 Financial assets2017 2016
Shares in subsidiaries
Opening cost of acquisition 1,035,994 1,024,067
New issue – 11,927
Investment in subsidiaries – –
Closing cost of acquisition 1,035,994 1,035,994
Opening impairment losses –652,254 –652,254
Impairment losses for the year – –
Closing impairment losses –652,254 –652,254
Closing value 383,740 383,740
2017 2016
Interests in joint ventures
Opening cost of acquisition 12,073 –
Investments for the year 0 12,073
Closing cost of acquisition 12,073 12,073
NumberNominal
value Interest, %Book value
31/12/17 Book value
31/12/16
Kobe Steel, Ltd. 3,000 98.000 YEN 49 % 12,073 12,073
2017 2016
Receivables from subsidiaries
Loans to Studsvik Holding, Inc. Group
– Opening cost of acquisition 115,441 109,346
– Repayment received –23,661
– New loans 0 3,767
– Change in accrued interest 1,159 –7,966
– Conversion to shareholders’ contribution
– Foreign exchange differences –10,142 10,294
Closing value 82,797 115,441
2017 2016
Loan to Studsvik Ltd
– Opening cost of acquisition 15,403 8,430
– Repayment received –1,634 –
– New loans 1,700 8,333
– Change in accrued interest –287 –
– Foreign exchange differences –160 –1,360
Closing value 15,022 15,403
Note 50 Interest expense and similar profit/loss items2017 2016
Interest 14,624 20,000
Exchange rate differences 8,601 5,012
Total 23,225 25,012
Of which in respect of Group companies
Interest 1,178 2,129
Total 1,178 2,129
Note 51 Appropriations2017 2016
Dissolution of tax allocation reserve – –
Total – –
Note 52 Income tax2017 2016
Current tax
Current tax on profit for the year – –
Adjustment for previous years – –
Total 0 0
Deferred tax
Origination and reversal of temporary differences 9,348 4,058
Total 9,348 4,058
Total income tax 9,348 4,058
The Swedish income tax rate is 22,0 (22,0) per cent. The income tax on the parent company’s profit before tax differs from the theoretical amount that would arise using the weighted average tax rate for profits as follows:
2017 2016
Profit/loss before tax –42,157 –8,149
Tax in accordance with the current tax rate 9,275 1,793
Non-taxable revenue 490 2,241
Expenses not deductible for tax purposes –394 –216
Revaluation to new tax rate – –
Tax referring to temporary differences –23 240
Adjustment for previous years’ tax assessment – –
Total 9,348 4,058
The weighted average tax rate was –22.2 (–49.8) per cent.
Note 53 Intangible assets2017 2016
Equipment and tools
Opening cost of acquisition 3,505 3,505
Investments for the year – –
Closing accumulated cost of acquisition 3,505 3,505
Opening depreciation –934 –244Depreciation for the year –702 –690
Closing accumulated depreciation –1,636 –934
Closing residual value according to plan 1,869 2,571

STUDSV IK AB (PUBL ) ANNUAL REPORT 2017
64 NOTES TO THE PARENT COMPANY ACCOUNTS
Note 54 (cont.)
Loans to Studsvik France SAS– Opening cost of acquisition 951 910
– Repayment received –
– New loans –
– Change in accrued interest –1 0
– Foreign exchange differences 29 41
Closing value 979 951
Loans to Studsvik GmbH
– Opening cost of acquisition 90,916 86,996
– New loans 6,868 –
– Change in accrued interest 4,321 –50
– Foreign exchange differences 2,761 3,970
Closing value 104,866 90,916
Financial assets at fair value through profit or lossUnlisted shareholdings
– Opening cost of acquisition 12,258 11,325
– Acquisition of new shares –
– Revaluation to fair value 781 933
Closing value 13,039 12,258
Capital insurance
– Opening cost of acquisition 14,191 14,555
– Items added –
– Reposting to current asset 0 –197
– Revaluation to fair value –163 –166
Closing value 14,028 14,191
Note 55 Prepaid expenses and accrued income
2017 2016
Prepaid rent – –
Prepaid credit charges and fees – –
Prepaid pension premiums 180 206
Prepaid software licenses 153 826
Prepaid service charges – –
Accrued income 435 6,097
Other 175 772
Total 943 7,901
Note 56 Shares and participations in subsidiaries
Share of equity, %
Share of voting
rights, %
Number of partici-
pations/shares Nominal value
Bookvalue
Parent company’s holdings
Studsvik Holding Inc. 100 100 2,000 kUSD 25,372 24,042
Studsvik Nuclear AB 100 100 5,000 kSEK 50,000 223,400
Studsvik Scandpower Inc. 79 79 1,503 kUSD 149 984
Studsvik Scandpower AB 91 91 910 kSEK 91 603
Studsvik Japan Ltd 100 100 10,000 kJPY 10,000 373
Studsvik Germany GmbH 100 100 kEUR 26 241
Studsvik Verwaltungs GmbH 100 100 kEUR 26 261
Studsvik Instrument Systems AB 100 100 17,000 kSEK 17,000 18,106
Studsvik France SAS 100 100 4,950 kEUR 5 43
Studsvik Limited 100 100 1,000,000 kGBP 1,000 115,687
Total 383,740
Information on subsidiaries’ corporate identity numbers and registered offices
Corporate identity number
Registered office
Studsvik Nuclear AB 556051-6212 Nyköping, Sweden
Studsvik Scandpower, Inc. 36-3088916 Boston, USA
Studsvik Scandpower AB 556137-8190 Nyköping, Sweden
Studsvik Scandpower GmbH HRB 4839 Norderstedt, Germany
Studsvik Suisse AG CH400.3.036.599-0 Fischbach-Göslikon, Switzerland
Studsvik Japan Ltd Tokyo, Japan
Studsvik Holding, Inc. 35-3481732 Atlanta, USA
Studsvik, Inc. 36-2999957 Atlanta, USA
RACE Holding, LLC 20-2472653 Atlanta, USA
Studsvik Germany GmbH HRB 504467 Mannheim, Germany
Studsvik Verwaltungs GmbH HRB 504468 Mannheim, Germany
Studsvik GmbH & Co. KG HRA 503411 Mannheim, Germany
Studsvik Instrument Systems AB 556197-1481 Nyköping, Sweden
Studsvik France SAS 791 048 200 000 12 Paris, France
Studsvik Consulting AB 559019-2448 Nyköping, Sweden
Studsvik Limited 09660060 Gateshead, England
Note 57 Liabilities to credit institutions2017 2016
Bank loans
Long term portion 199,850 198,250
Current portion – –
Total 199,850 198,250

STUDSV IK AB (PUBL ) ANNUAL REPORT 2017
NOTES TO THE PARENT COMPANY ACCOUNTS 65
Note 64 Transactions with related partiesIntra-Group purchases and salesThe percentage of the year’s purchases and sales referring to other companies within the Studsvik Group is presented below.
2017 2016
Purchases 23 % 24 %
Sales 100 % 100 %
The same pricing principles are applied to purchases and sales between group companies as apply to transactions with external parties.
Note 65 Number of employees2017 2016
Women 3 4
Men 3 3
Total 6 7
Board members and senior management executives
2017 2016
Number onbalance sheet
date
Of whichmen
Number onbalance sheet
date
Of whichmen
Board members 8* 5 8* 5
President and other senior management executives 3 2 3 2
* The number of board members only refers to ordinary members.
Agreements on severance payments and other commitments to Board members and the PresidentThe President’s period of notice is 6 months for his own termination of employment and 12 months for termination by the company. In the case of termination of employment by the company, salary is payable during the period of notice as well as an additional severance payment equivalent to 6 months’ salary. See also note 38.
Note 66 Investment in subsidiaries2017 2016
New issue – 11,927
Total 0 11,927
The new issue refers to Studsvik Limited.
Note 58 Accrued expenses and deferred income
2017 2016
Holiday pay liability 1,408 1,186
Accrued wages and salaries – –
Accrued social security contributions 5,294 5,628
Accrued interest expense 1,409 1,408
Provision for severance payment 9,253 105
Other 1,884 414
Total 19,248 8,741
Note 59 Pledged assets 2017 2016
Shares in subsidiaries 223,400 223,400
Total 223,400 223,400
Shares in Studsvik Nuclear AB have been put up as collateral for bank loans.
Note 60 Contingent liabilities2017 2016
Guarantees – –
Contingent liabilities referring to insurance 3,578 4,564
Total 3,578 4,564
In addition, the parent company has made a guarantee commitment for a subsidiary as for its own debt.
Note 61 Derivative instruments2017 2016
Assets Liabilities Assets Liabilities
Forward exchange contracts – – – –
Revaluation of forward exchange contracts is through profit or loss.
Note 62 Investments in non-current assets
2017 2016
Patents – –
Equipment and tools – –
Total 0 0
Note 63 Cash flow from operating activities
Non-cash items 2017 2016
Depreciation/amortization 702 690
Fair value gains –1,254
Other items –
Total 702 –564

Nyköping, February 26, 2018
Anders Ullberg Anna Karinen Jan BarchanChairman Vice Chairman Board Member
Peter Gossas Linda EkstrandBoard Member Employee representative
Alf Lindfors Roger Lundström Agneta NestenborgBoard Member Employee representative Board Member
Camilla HoflundPresident/CEO
Our auditor’s report was submitted on March 6, 2018PricewaterhouseCoopers AB
Martin JohanssonAuthorized public accountant
The consolidated income statements and balance sheets will be presented to the Annual General Meeting on April 25, 2018 for approval.
The Board of Directors and the President certify that the consolidated accounts have been prepared in accordance with international financial reporting standards, IFRS, as adopted by the EU and give a true and fair view of the Group’s financial position and results of operations. The annual accounts have been prepared
in accordance with generally accepted accounting principles and give a true and fair view of the parent company’s financial position and results of operations.
The administration report for the Group and parent company provides a fair review of the development of the Group’s and the parent company’s business, financial position and performance and describes significant risks and uncertainties faced by the parent company and the companies that are part of the Group.
STUDSV IK AB (PUBL ) ANNUAL REPORT 2017
66
Auditor’s report
Report on the annual accounts and consolidated accounts
OpinionsWe have audited the annual accounts and consolidated accounts of Studsvik AB (publ) for 2017 with the exception of the sustainability report on pages 19-25. The company’s annual accounts and consolidated accounts are included on pages 7-66 of this document.
In our opinion, the annual accounts have been prepared in accordance with the Annual Accounts Act and present fairly, in all material respects, the financial position of the parent company as at December 31, 2017 and of its financial performance and its cash flows for the year then ended in accordance with the Annual Accounts Act. The consolidated accounts have been prepared in accordance with the Annual Accounts Act and present fairly, in all material respects, the financial position of the Group as at December 31, 2017 and of its financial performance and cash flow for the year then ended in accordance with International Financial Reporting Standards (IFRS), as adopted by the EU, and the Annual Accounts Act. The statutory administration report is consistent with the other parts of the annual accounts and consolidated accounts. Our opinions do not include the sustainability report on pages 19-25.
We therefore recommend that the General Meeting adopt the income statement and balance sheet for the parent company and the Group.
Our opinions in this report on the annual accounts and consolidated accounts are consistent with the contents of the additional report submitted to the parent company’s and the Group’s Audit Committee in accordance with Article 11 of the Audit Regulation (537/2014).
Basis for opinionWe conducted our audit in accordance with International Standards on Auditing (ISAs) and generally accepted auditing standards in Sweden. Our responsibilities under those standards are further described in the Auditor’s Responsibilities section. We are independent of the parent company and the group in accordance with professional ethics for accountants in Sweden and we have fulfilled our other ethical responsibilities in accordance with these requirements. This includes that, based on the best of our knowledge and belief, no prohibited services referred to Article 5 of the Audit Regulation (537/2014), have been provided to the audited company or, where applicable, its parent company or its controlled companies within the EU.
We believe that the audit evidence we have obtained is sufficient and appropriate to provide a basis for our audit opinion.
To the General Meeting of Shareholders of Studsvik AB (publ), corporate identity number 556501-0997
Our audit approach
OVERVIEW
AUDIT FOCUS AND SCOPEWe designed our audit by determining materiality and assessing the risk of material misstatement in the financial statements. In particular, we considered areas where the President and Board of Directors made subjective assessments, for example in respect of significant accounting estimates that involved making assumptions and considering future events that are inherently uncertain. As in all of our audits, we also addressed the risk of management override of internal controls, including among other matters consideration of whether there was evidence of systematic bias that represented a risk of material misstatement due to fraud.
We tailored our audit to perform sufficient work to enable us to provide an opinion on the financial statements as a whole, taking into account the structure of the Group, accounting processes and controls, and the industry in which the Group operates.
The Studsvik Group consists of a number of companies. Of these, operations in Sweden, Germany and the UK constitute significant units and are therefore included in our audit of the Group. The audit of these units and the parent company includes testing of details supplemented by analytical review of income statement and balance sheet items material to the Group. A majority of the subsidiaries in the Group are also subject to statutory audit under local requirements.
MATERIALITYThe scope and focus of our audit was influenced by our application of materiality. An audit is designed to achieve reasonable assurance that the financial statements are free from material misstatement. Misstatements may arise due to fraud or error. They are considered material if, individually or in aggregate, they could reasonably be expected to influence the economic decisions of users taken on the basis of the financial statements.
Based on our professional judgement, we determined certain quantitative thresholds for materiality, including for the financial statements as a whole. These, together with qualitative considerations, helped us to determine the focus and scope of our audit and the nature, timing and extent of our audit procedures and to evaluate the effect of misstatements, both individually and in aggregate, on the financial statements as a whole.
Key audit mattersKey audit matters are those matters that, in our professional judgement, were of most significance in our audit of the annual accounts and consolidated accounts for the current period. These matters were addressed in the context of the audit of, and in forming our opinion on, the annual accounts and consolidated accounts as a whole, and we do not provide a separate opinion on these matters.
STUDSV IK AB (PUBL ) ANNUAL REPORT 2017
AUDITOR’S REPORT 67
Key audit matters How our audit addressed the key audit matter
Provisions for decommissioning, waste treatment and resto-ration of land (see the Group’s accounting policies in note 1.20, material assumptions in note 3 and note 33)
The operations at Studsvik’s facilities in Sweden and the now sold facility in the UK are subject to local licensing requirements and Studsvik is liable to decommission facilities, manage waste and restore land. The Group makes provision in the balance sheet for these future decommissioning costs, as well as costs for handling waste.
At the close of 2017, provision of SEK 113 million was made in the balance sheet for future waste costs and decommissioning and restoration.
The Group has a process for monitoring and measuring provisions for waste treatment, decommissioning and restoration. Determi-nation of provisions has a significant influence on the audit of the Group, as the assessment of the value of the size of provisions is influenced by the management’s estimates and assumptions.
We have audited the Group’s process for identifying future waste and the process for valuation of the provision for treatment of waste, decommissioning and restoration of land.
Our audit procedures include evaluating whether the provisions comply with the Group’s accounting policies.
Moreover, based on risk and materiality, we have cross-checked and assessed material parameters, such as volume and price, for calculating the provision against documentation in the form of agreements with external parties, where these exist, and internal calculations on which these are based.
In addition, we have tested the mathematical correctness of the provision calculations
Valuation of deferred tax assets (see the Group’s accounting policies in note 1.18, material assumptions in note 3 and note 31)
The Group reports deferred tax assets referring to tax loss carry forwards of SEK 103 million.
As valuation of tax loss carry forwards reported in the balance sheet depend on the management’s estimates in the form of forecasts of future taxable profit, the determination of the value of the deferred tax assets has a significant influence on the audit.
We have examined whether the management’s estimate of the carrying amount of deferred tax assets referring to tax loss carry forwards is based on the Group’s budgets and forecasts regularly prepared by the management.
We have checked that the assumptions used in these budgets and forecasts of future taxable profits are in accordance with the management’s strategic plans and intentions and that they are realistic on the basis of our experience of the business. This was done by analyzing how well previous years’ assumptions were met, any adjustments made of assumptions from previous years as a consequence of developments in the operations, as well as external factors.
In addition, we have tested the mathematical correctness of the calculations for material deferred tax assets referring to tax loss carry forwards.
Information in the annual report additional to the annual accounts and consolidated accounts
This document also includes other information than the annual accounts and consolidated accounts and can be found on pages 1-7 and 66-70 as well as the sustainability report on pages 19-25. The additional information consists of information about the Studsvik Group and information about the Board of Directors and Executive Group Management as well as definitions of key figures and ratios. The Board of Directors and the President are responsible for this other information.
Our opinion on the annual accounts and consolidated accounts does not cover this other information and we do not express any form of assurance conclusion regarding this other information.
In connection with our audit of the annual accounts and consolidated accounts, our responsibility is to read the information identified above and consider whether the information is materially inconsistent with the annual accounts and consolidated accounts. In this procedure we also take into account our knowledge otherwise obtained in the audit and assess whether the information in other respects appears to be materially misstated.
If we, based on the work performed concerning this information,
conclude that there is a material misstatement of this other information, we are required to report that fact. We have nothing to report in this regard.
Responsibilities of the Board of Directors and PresidentThe Board of Directors and President are responsible for the preparation of the annual accounts and consolidated accounts and that they give a fair presentation in accordance with the Annual Accounts Act and, concerning the consolidated accounts, in accordance with International Financial Reporting Standards (IFRS) as adopted by the EU, and the Annual Accounts Act. The Board of Directors and President are also responsible for such internal control as they determine is necessary to enable the preparation of annual accounts and consolidated accounts that are free from material misstatement, whether due to fraud or error.
In preparing the annual accounts and consolidated accounts, the Board of Directors and the President are responsible for the assessment of the company’s and the group’s ability to continue as a going concern. They disclose, as applicable, matters related to going concern and using the going concern basis of accounting. The going concern basis of accounting is, however, not applied if the Board of Directors and the President intend to liquidate the
STUDSV IK AB (PUBL ) ANNUAL REPORT 2017
68 AUDITOR’S REPORT
company, to cease operations or have no realistic alternative but to do so.
The Board of Director’s Audit Committee shall, among other things and without impacting the Board’s responsibilities and duties in general, monitor the company’s financial reporting.
Auditor’s responsibilityOur objectives are to obtain reasonable assurance on whether the annual accounts and consolidated accounts as a whole are free from material misstatement, whether due to fraud or error, and to issue an auditor’s report that includes our opinions. Reasonable assurance is a high level of assurance, but is not a guarantee that an audit conducted in accordance with ISA:s and generally accepted auditing standards in Sweden will always detect a material misstatement when it exists. Misstatements can arise from fraud or error and are considered material if, individually or in the aggregate, they could reasonably be expected to influence the economic decisions of users taken on the basis of these annual accounts and consolidated accounts.
A further description of our responsibility for the audit of the annual accounts and consolidated accounts can be found on the website of the Swedish Inspectorate of Auditors: www.revisorsinspektionen.se/revisornsansvar. This description is part of the auditor’s report.
Report on other legal and regulatory requirementsOpinionsIn addition to our audit of the annual accounts and consolidated accounts, we have examined the administration of the Board of Directors and the President of Studsvik AB (publ) for 2017 and the proposed appropriations of the company’s profit or loss.
We recommend to the General Meeting of Shareholders that the profit be appropriated in accordance with the proposal in the statutory administration report and that the members of the Board of Directors and the President be discharged from liability for the financial year.
Basis for opinionWe conducted the audit in accordance with generally accepted auditing standards in Sweden. Our responsibilities under those standards are further described in the Auditor’s Responsibilities section. We are independent of the parent company and the group in accordance with professional ethics for accountants in Sweden and we have fulfilled our other ethical responsibilities in accordance with these requirements.
We believe that the audit evidence we have obtained is sufficient and appropriate to provide a basis for our audit opinion.
Responsibilities of the Board of Directors and PresidentThe Board of Directors is responsible for the proposed appropriations of the company’s profit or loss. When proposing a dividend, this includes an assessment of whether the dividend is justifiable considering the requirements which the company’s and the Group’s type of operations, size and risks place on the size of the Parent
Company’s and the Group’s equity, consolidation requirements, liquidity and position in general.
The Board of Directors is responsible for the organization of the company and the administration of its affairs. This includes among other things continuous assessment of the company’s and the group’s financial situation and ensuring that the company’s organization is designed so that the accounting, management of assets and the company’s financial affairs in other respects are controlled in a satisfactory manner. The President shall conduct the day-to-day management in accordance with the Board of Director’s guidelines and instructions and take measures that are necessary to fulfill the company’s accounting in accordance with law and handle the management of assets in a satisfactory manner.
Auditor’s responsibilityOur objective concerning the audit of the administration, and thereby our opinion on discharge from liability, is to obtain audit evidence to assess with reasonable assurance whether any member of the Board of Directors or the President in any material respect:• has undertaken any action or been guilty of any omission that
may give rise to liability to the company,• in any other way has acted in contravention of the Swedish
Companies Act, the Annual Accounts Act or the Articles of Association.
Our objective concerning the audit of the proposed appropriations of the company’s profit or loss, and thereby our opinion on this, is to assess with reasonable assurance whether the proposal is in accordance with the Swedish Companies Act.
Reasonable assurance is a high level of assurance, but is not a guarantee that an audit conducted in accordance with generally accepted auditing standards in Sweden will always detect actions or omissions that can give rise to liability to the company, or that the proposed appropriations of the company’s profit or loss are not in accordance with the Companies Act.
A further description of our responsibility for the audit of the administration can be found on the website of the Swedish Inspectorate of Auditors: www.revisorsinspektionen.se/revisornsansvar. This description is part of the auditor’s report.
Auditor’s statement on the statutory sustainability reportThe Board of Directors is responsible for the sustainability report
on pages 19–25 and for ensuring that it has been prepared in accordance with the Annual Accounts Act.
Our examination was conducted in accordance with FAR’s recommendation RevR 12 The auditor’s statement on the statutory sustainability report. This means that our examination of the sustainability report is different and substantially less in scope than an audit conducted in accordance with International Standards on Auditing and generally accepted auditing standards in Sweden. We believe that the examination has provided us with sufficient basis for our opinion.
A sustainability report has been prepared.PricewaterhouseCoopers AB, Torsgatan 21, Stockholm, was
appointed as auditor of Studsvik AB (publ) by the General Meeting held on April 27, 2017 and has been the company’s auditor since its listing on May 4, 2001.
Stockholm, March 6, 2018PricewaterhouseCoopers AB
Martin JohanssonAuthorized public accountant
STUDSV IK AB (PUBL ) ANNUAL REPORT 2017
AUDITOR’S REPORT 69

Corporate Governance
Corporate GovernanceStudsvik AB is a Swedish public company with its registered office in Nyköping and is listed on Nasdaq Stockholm. The company is the parent of a Group that carries on business in nuclear technology in an international arena. Corporate governance is based on the Articles of Association and the Swedish Companies Act, a number of Swedish and foreign laws and ordinances and the Swedish Code of Corporate Governance (the Code). Studsvik has no departures from the Code to report.
General Meeting of Shareholders The General Meeting is the company’s highest decision-making body, where the shareholders exercise their influence through discussions and decisions. An Annual General Meeting shall be held once a year to adopt the income statement and balance sheet, decide on dividend, elect a Board of Directors and auditors and decide on their remuneration.
The number of shareholders on December 31, 2017 was 3,136. The total number of shares was 8,218,611. All shares have an equal right to participate in the company’s assets and profits. Information on shareholders, voting rights and the Articles of Association is presented in the annual report on pages 70–77.
At the Annual General Meeting in April 2017, 32 shareholders participated, representing a total of 48.6 per cent of all votes in the company. The Annual General Meeting adopted the consolidated income statement and balance sheet, adopted the Board of Directors proposal concerning dividend, discharged the Board of Directors and President from liability and appointed PricewaterhouseCoopers AB as auditor. All members of the Board of Directors were re-elected and Anders Ullberg was appointed as Chairman. The Meeting also established principles for benefits to senior management and appointed the Nomination Committee. The minutes of the Annual General Meeting can be found on the company’s website.
Nomination Committee The main task of the Nomination Committee is to propose to the Annual General Meeting candidates for the Board of Directors, Chairman of the Board and auditors and their fees. The Nomination Committee is also to propose a new Nomination Committee.
As resolved by the Annual General Meeting, the Nomination Committee is to consist of the Chairman of the Board and representatives of each of the three largest shareholders. The Annual General Meeting appointed Stina Barchan (Briban Invest AB), Sven Ericsson (representative of the Karinen family), Carina Heilborn (Peter Gyllenhammar AB) and Anders Ullberg (Chairman of the Board) as members of the Nomination Committee. The Nomination Committee’s term of office is until a new Nomination Committee is appointed. The composition of the Nomination Committee was announced on April 27, 2017 in a press release and on Studsvik’s website.
Information on how shareholders can submit proposals to the Nomination Committee has been published on Studsvik’s website. The work of the Nomination Committee focuses on ensuring that the Board of Directors is composed of members that together have the knowledge and experience that meet the requirements of the owners concerning Studsvik’s highest governing body. In the process of preparing proposals for candidate members of the Board, the Chairman of the Board therefore presents to the Nomination Committee the evaluation made of the work of the Board of Directors in the past year.
Composition of the Board of Directors The Board of Directors consists of six board members elected by the general meeting of shareholders, as well as two members and two alternates appointed by the local trade union organizations Unionen and the Swedish Association of Graduate Engineers. The members of the Board of Directors are presented on pages 74-75 of the annual report and under Board of Directors and auditors on the website.
AuditorsElected by the Annual General Meeting.
Audit the accounts, bookkeeping and admi-nistration of the Board of Directors and
President.
ShareholdersExercise control via the Annual General
Meeting and where applicable extraordi-nary general meetings .
President/Chief Executive Officer and Executive Group Management
The President leads the business operations in consultation with other members of the
Executive Group Management.
Nomination Committee4 members. Submits proposals to the Annual General Meeting concerning
members of the Board of Directors and fees.
Internal control functionIntegrated part of the Group Accounting and
Finance function. Findings are reported to the Audit Committee.
Audit Committee (3 members)
Remuneration Committee (3 members)
Board of Directors6 members elected by the Annual General Meeting and 2 members appointed by the
local personnel organizations.
STUDSV IK AB (PUBL ) ANNUAL REPORT 2017
70 CORPORATE GOVERNANCE

The members elected by the Annual General Meeting are to be regarded as independent in relation to the company and the company management. All, apart from Jan Barchan and Anna Karinen, are independent of major shareholders.
Chairman Anders Ullberg is the Chairman of the Board and leads the work of the Board. He has a particular responsibility to follow the company’s development between Board meetings and ensure that the Board Members regularly receive the information necessary for performing a satisfactory job. The Chairman is to maintain regular contact with the President on various matters as needed.
Work of the Board of Directors The task of the Board of Directors is to administer the company’s business in the best way possible and safeguard the interests of the shareholders in its work. The Board’s work follows rules of procedure adopted annually at the inaugural board meeting. The rules of procedure specify the division of duties between the Board and the President, the responsibilities of the Chairman and President respectively, and the forms of financial reporting. The President takes part in the work of the Board of Directors and other employees take part when this is called for. The Group’s Chief Financial Officer acts as secretary to the Board.
In 2017 the Board of Directors held eight meetings, including the inaugural meeting in connection with the Annual General Meeting. The attendance of the members is shown in the table below.
The Board of Directors receives information on the company’s economic and financial situation through monthly reports and at board meetings. Operations in the various segments are monitored and discussed in accordance with a rolling plan, which means that the Board of Directors makes a detailed analysis of each business area at least once a year. Moreover, the Board of Directors agrees each year on a number of issues that are to be examined at a board meeting during the year. In 2017 the Group’s strategy and further
development of operations in Consultancy Services and Studsvik Scandpower were discussed.
Ahead of each board meeting the Chairman and President go through the business to be dealt with at the meeting and supporting documentation for the Board’s processing of the business is sent to the members about a week before each board meeting.
In 2017 the Board devoted particular attention to the Group’s financing, strategic alternatives for the consultancy operations in Germany, increased customer focus in the software operations and cost savings in consultancy operations and administration.
At one meeting the company’s auditors reported on their findings from the audit of the annual accounts and the company’s administration. The Board of Directors was then also given the opportunity of discussions with the auditors without the company management being present. The Chairman ensures that the work of the Board of Directors is evaluated annually and that the Nomination Committee receives the information necessary concerning the results of the evaluation. The evaluation is discussed by the Board of Directors as a basis for planning the Board’s work for the coming year.
Policies, guidelines and instructions The Board reviews and adopts Group policies and guidelines and the Group’s Code of Conduct. The Code of Conduct aims to provide guidance to employees and business partners, minimize risks, strengthen the corporate culture and convey Studsvik’s core values.
The President adopts guidelines and operative instructions based on policies and guidelines established by the Board. Guidelines and operative instructions issued by the President primarily cover financial reporting and information technology (IT). All policies and guidelines are available to the Group’s employees on Studsvik’s intranet.
Audit Committee The Board of Directors has set up an Audit Committee. The Committee monitors the effectiveness of the company’s internal
Board members Elected Attendance Remuneration Audit Independent Independent Fee kSEK
Anders Ullberg, Chairman 2007 8/8 1/1 4/4 Yes Yes 725
Anna Karinen, deputy Chairman 2003 8/8 1/1 Yes No 225
Jan Barchan 2004 8/8 1/1 Yes No 225
Peter Gossas 2013 5/8 4/4 Yes Yes 375
Alf Lindfors 2006 8/8 Yes Yes 225
Agneta Nestenborg 2010 8/8 4/4 Yes Yes 300
Roger Lundström (Employee rep) 2005 3/8
Per Ekberg (Employee rep) alternate 2006 7/8
Lena Sivars Becker (Employee rep)1 2015 5/8
Linda Ekstrand2 2016 8/8
Jennifer Arnesson3 2017 2/81 Member of the Board until September 5, 2017,2 Member of the Board from September 5, 2017, 3 Alternate member of the Board from September 5, 2017.
STUDSV IK AB (PUBL ) ANNUAL REPORT 2017
CORPORATE GOVERNANCE 71

controls, management of the company’s risks and assures the quality of the company’s financial reporting. The Audit Committee consists of Peter Gossas (chair), Agneta Nestenborg and Anders Ullberg. The presenter on the Committee is the Chief Financial Officer. Apart from the Group’s quarterly reports, during the year the Committee has taken note of and dealt with reports from the follow-up of internal controls. In addition, the Committee has been updated on the development of major current fixed price contracts, dealt with accounting matters, with particular focus on impairment calculations, as well as continually following the progress of the Group’s legal disputes. The company’s auditors reported to the Committee on their findings from the six-monthly accounts, the hard-close and internal control, conducted at the time of the second and third quarter closings, and the audit of the annual accounts. The Committee meets before each reporting date and on more occasions if necessary. The Committee held four meetings during the year. The Audit Committee works in accordance with the instructions adopted annually by the Board of Directors and reports on its work to the Board of Directors.
Remuneration Committee The Board has appointed a Remuneration Committee from among its number. The Remuneration Committee submits proposals to the Board for the President’s salary and other conditions of employment and approves salaries and other conditions of employment for the Executive Group Management proposed by the President. The Committee also draws up the Board of Directors’ proposals to the General Meeting concerning principles of remuneration and other conditions of employment for the Executive Group Management. The Committee held one meeting during the year. The Remuneration Committee works in accordance with the instructions adopted annually by the Board of Directors and reports on its work to the Board of Directors. The Remuneration Committee consists of Anders Ullberg (chair), Jan Barchan and Anna Karinen.
A description of benefits to senior management is given in note 38 on page 60.
Board fees The total board fee paid by Studsvik AB for 2017 amounted to SEK 2,075,000 (2,189,000). In accordance with a resolution passed by the Annual General Meeting, the Chairman of the Board receives SEK 650,000 per year and ordinary members SEK 225,000 per year. No fee is paid to members appointed by the employee organizations. The chairman of the Audit Committee receives a fee of SEK 150,000 per year and the members SEK 75,000 per year. No fee is paid to the Remuneration Committee. Board fees paid are presented in note 38 on page 60.
AuditorsAt the 2017 Annual General Meeting the registered public accounting firm PricewaterhouseCoopers AB was elected as auditor for the period up to and including the 2018 Annual General Meeting. The auditor in charge is authorized public accountant Martin Johansson. PricewaterhouseCoopers conducts the audit of all the Group’s material companies. The audit is based on an audit
plan and during the year the auditor regularly reports findings to the Audit Committee and on at least one occasion to the Board of Directors. The auditor obtains views from the Audit Committee concerning Studsvik’s risks, which are thereafter given particular consideration in the audit plan. The auditor also participates in the Annual General Meeting to present the auditor’s report and describe the audit work and findings.
In addition to the audit assignment Studsvik has consulted PricewaterhouseCoopers in the area of taxation and on various accounting and financial issues. PricewaterhouseCoopers is obliged to test its independence prior to every decision to provide advice to Studsvik unrelated to the audit assignment. Advisory services in excess of SEK 50,000 are to be approved in advance by the chairman of the Audit Committee. Remuneration to the company’s auditors is paid in accordance with an approved invoice on agreed terms. For information concerning remuneration in 2017 please refer to notes 8 and 44.
President/CEO and Executive Group Management The President is responsible for the day-to-day management of the company. He leads the operative business and prepares information and data for decision-making for the Board of Directors and is the presenter at Board meetings. In 2017 the Executive Group Management consisted of the President/Chief Executive Officer, the Chief Financial Officer, the Head of Business Development (to April 1, 2016), the Senior Vice-President for HR to December 31, 2017) and the heads of the three business areas. The Executive Group Management is presented on pages 76–77 of the annual report and on the website under Executive Group Management.
The Executive Group Management meets every month to follow up the operative and financial developments in the segments. On two to three occasions during the financial year the Executive Group Management meets to deal in more detail with matters of an operative, strategic or long-term nature.
The President/CEO and Group functions are located in Stockholm. In accordance with the policies and guidelines established by the Board, the Group functions are responsible for business development, allocation of financial resources among the Group’s operations, capital structure, risk management and human resources. The tasks also include questions of Group wide acquisitions and disposals, certain major projects, the Group’s financial reporting, communication with the stock market and other internal and external communication.
Operative management The Group’s operative business was conducted in 2017 in subsidiaries of Studsvik AB, which are included in the three business areas. Operations in the business areas were followed up partly through business area reviews, partly through active board work in the subsidiaries. The business area reviews, which take place quarterly, not only analyze and discuss financial developments, but also market developments, risks and CR issues, among other things. The management groups for the business areas follow the business areas’ day to day activities on a monthly basis. Business plans and
STUDSV IK AB (PUBL ) ANNUAL REPORT 2017
72 CORPORATE GOVERNANCE

budgets are prepared by each business area in consultation with the Executive Group Management. The business is carried on in accordance with the rules, guidelines and policies established by the parent company, and local rules established by the respective local board. The heads of business areas have budget responsibility and are to ensure growth in their operations as well as being responsible for utilizing the synergies between the Group’s various units.
Internal control Internal control aims to ensure: • that company strategies and goals are followed up,• that shareholders’ interests are protected, • that external financial reporting reflects the actual situation
with reasonable assurance, • that financial reports are prepared in accordance with
generally accepted accounting principles, laws and ordinances and other requirements of listed companies.
The Board of Directors has the overall responsibility for ensuring the Group has effective internal controls. The President is responsible for ensuring that processes and organization that guarantee
internal control and the quality of financial reporting are in place. Studsvik has no special internal audit function. The audit and internal control is conducted by an external consultant on the instructions of the Chief Financial Officer, which the Board has found to be appropriate.
The review is based on an overall risk analysis at Group level and on checklists and question lists in material for self-assessment that is subsequently verified from the point of view of materiality through direct audit. The audit is conducted via interviews and spot checks and is summarized in a report to the Audit Committee, where it is dealt with. A detailed description of the Group’s risks and how they are managed is presented in the Administration Report on pages 26–27. An account of the Group’s financial risks can be found in note 2 on pages 42–44.
The outcome of the examination is reported to the Audit Committee and the Board. The company’s financial situation is discussed at every board meeting and the management makes a monthly analysis of the financial reporting at a detailed level. At its meetings the Audit Committee follows up the financial reporting and receives a report from the auditors.
Assignment and division of responsibilitiesThe Board of Directors is responsible for the corporate governance report for 2017 on pages 70–72 and for its preparation in accordance with the Annual Accounts Act.
Focus and scope of the examinationOur examination was conducted in accordance with FAR’s statement RevU 16 The auditor’s examination of the corporate governance report. This means that our examination of the corporate governance report is different and substantially less in scope than an audit conducted in accordance with International
Standards on Auditing and generally accepted auditing standards in Sweden. We believe that the examination has provided us with sufficient basis for our opinions.
OpinionA corporate governance report has been prepared. Disclosures in accordance with Chapter 6, Section 6, second paragraph, points 2–6 of the Annual Accounts Act and Chapter 7, Section 31, second paragraph of the same Act are consistent with the annual accounts and consolidated accounts and are in accordance with the Annual Accounts Act.
Statement by the auditor on the corporate governance report To the General Meeting of Shareholders of Studsvik AB (publ), corporate identity number 556501-0997
Stockholm, March 6, 2018PricewaterhouseCoopers AB
Martin JohanssonAuthorized public accountant
STUDSV IK AB (PUBL ) ANNUAL REPORT 2017
CORPORATE GOVERNANCE 73

Anders UllbergDanderyd, born in 1946 Chairman since 2007 Former President and CEO of SSAB, Svenskt Stål. Chairman of the board of Boliden and Eneqvist Consulting and member of the board of Atlas Copco, Beijer Alma and Valedo Partners. Chair of the Swedish Financial Reporting Board and board member of the European Financial Reporting Advisory GroupEducation: M.Sc. (Business and Economics) Holding: 60,000 shares
Anna KarinenSparreholm, born in 1963 Member since 2003, Vice Chairman since 2007 Self-employed, in commercial real estate management, member of the board of the Flen local branch of Handelsbanken. Education: Bachelor of laws Holding: 1,327,492 shares
Jan BarchanMalmö, born in 1946 Member since 2004 President of Briban Invest AB, member of the board of Audiodev AB and member of the board of Net Insight AB, Trianon AB and Trialbee AB Education: M.Sc. (Business and Economics) Holding: 1,285,492 shares
Peter GossasMora, born in 1949Member since 2013 Previously President of the Sandvik Materials Technology business area Chairman of the board of Maintpartner Group OY and Motor Group AB. Member of the board of Höganäs AB. Industrial Advisor at Peter Gossas AB and KIGO Business Development.Education: M.Sc. Engineering physics Holding: 2,000 shares
Alf LindforsÖsthammar, born in 1946 Member since 2006 Senior advisor, former head of the Electricity Generation business area and Vice President of Vattenfall AB Education: M.Sc. (Engineering) and post-graduate qualification in reactor technology Holding: 0 shares
Agneta NestenborgKävlinge, born in 1961 Member since 2010 Director, Project Support & Administration, European Spallation Source ERICEducation: Ph.D. and MBA Holding: 2,000 shares
EMPLOYEE REPRESENTATIVES
Linda EkstrandNyköping, born in 1982Member since 2017, alternate 2016Employee representative appointed by the Swedish Association of Graduate Engineers. Works in the Consultancy Operations at Studsvik Consulting ABEducation: M.Sc.Holding: 65 shares
Roger LundströmNyköping, born in 1966 Member since 2005, alternate 2003-2005 Employee representative appointed by Unionen. Works in microscopy and damage analysis at Studsvik Nuclear AB Education: Mechanical engineer Holding: 0 shares
Per EkbergNyköping, born in 1959 Alternate since 2006 Employee representative appointed by Unionen. Works in the materials research department at Studsvik Nuclear AB Education: Power generation technology Holding: 100 shares
Jennifer ArnessonHuddinge, born in 1989Alternate since 2017Employee representative appointed by the Swedish Association of Graduate Engineers. Works in the Consultancy Operations at Studsvik Consulting ABEducation: Higher education qualification in nuclear power engineeringHolding: 0 shares
AUDITORPricewaterhouseCoopers ABAuditor in charge: Martin JohanssonYear of birth 1967 Auditor of Studsvik since 2016 Other assignments: Melker Schörling AB, Endomines AB, Orio AB and Toyota Industries Europe AB
Board of Directors and Auditors
STUDSV IK AB (PUBL ) ANNUAL REPORT 2017
74 BOARD OF DIRECTORS AND AUDITORS

ANDERS ULLBERG
ALF LINDFORS
PER EKBERG
PETER GOSSAS LINDA EKSTRAND
AGNETA NESTENBORG
ANNA KARINEN ROGER LUNDSTRÖM
JAN BARCHAN
JENNIFER ARNESSON
STUDSV IK AB (PUBL ) ANNUAL REPORT 2017
BOARD OF DIRECTORS AND AUDITORS 75

Camilla HoflundPresident and Chief Executive OfficerEducation: Mining engineer, Materials technologyBorn in: 1969Year of employment: 1994–2000, 2003Background: Consultant and business developer at Det Norske Veritas and other senior positions in the groupHolding: 0 shares
Pål JarnessChief Financial Officer Education: M.Sc. (Business and Economics) Born in: 1964Year of employment: 2013Background: Chief Financial Officer at Actic, Goodyear Dunlop Nordic and Kraft Foods Nordic and various positions in treasury and human resources at Philip Morris.Holding: 37,500 shares
Joakim LundströmHead of Fuel and Materials technology business areaEducation: M.Sc. Engineering physics Born in: 1978Year of employment: 2002Background: Various leading positions at Studsvik Nuclear ABHolding: 0 shares
Stefan BergströmHead of the Consultancy Services business areaEducation: M.Sc. (Engineering) Born in: 1963 Year of employment: 2016Background: Several leading roles in the Swedish Trade and Invest Council and the ABB Group.Holding: 0 shares
Steven FreelHead of the Studsvik Scandpower business areaEducation: BSc Mechanical Engineering and MBABorn in: 1964Year of employment: 2016 Background: Administrative and technical manager at GSE Systems Inc. and other leading positions in SAIC and RaytheonHolding: 0 shares
Executive Group Management
STUDSV IK AB (PUBL ) ANNUAL REPORT 2017
76 EXECUTIVE GROUP MANAGEMENT
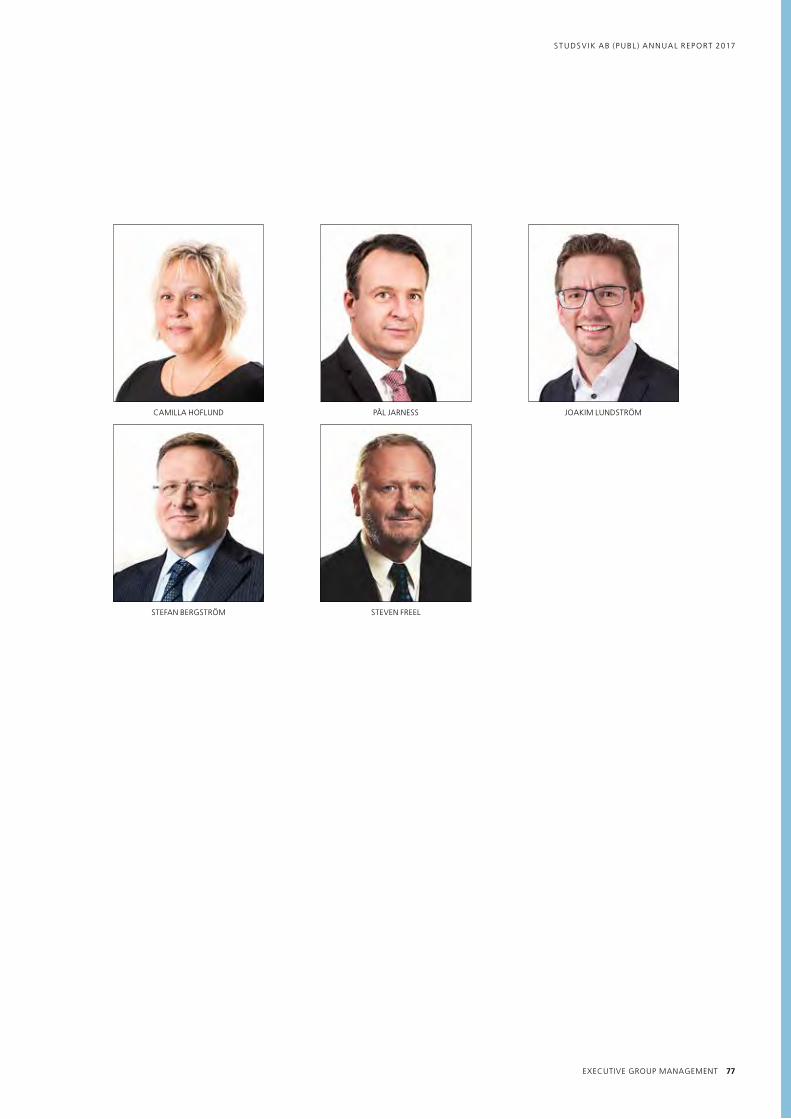
PÅL JARNESS JOAKIM LUNDSTRÖM
STEVEN FREELSTEFAN BERGSTRÖM
CAMILLA HOFLUND
STUDSV IK AB (PUBL ) ANNUAL REPORT 2017
EXECUTIVE GROUP MANAGEMENT 77

CONDENSED INCOME STATEMENT
Amounts in SEK million 2013 2014 2015 2016 2017
Sales revenues 1,001.3 909.6 721.2 758.8 704.8
Cost of services sold –742.1 –660.5 –538.2 –535.3 –539.1
Gross profit 259.1 249.1 183.0 223.5 165.7
Selling and marketing costs –46.5 –47.6 –36.4 –44.4 –44.2
Administrative expenses –142.0 –146.9 –93.1 –112.8 –116.9
Research and development costs –26.6 –25.8 –25.1 –27.5 –28.2
Participation in associated company's profit before tax 7.3 11.5 11.6 4.1 8.7
Other, net –31.9 –9.8 –3.4 –18.2 –26.7
Operating profit 16.0 30.5 36.6 24.7 –41.6
Net financial items –18.8 –18.9 –17.7 –16.4 –17.1
Profit/loss after financial items –2.8 11.6 18.9 8.3 –58.6
Income tax –20.1 –6.4 –4.3 8.7 13.7
Profit/loss for the year from continuing operations –22.9 5.2 14.6 17.0 –45.0
Operations held for sale
Profit/loss for the year from operations held for sale –173.9 –17.2 –12.2 46.0 –
NET PROFIT/LOSS FOR THE YEAR –196.8 –12.0 2.4 63.0 –45.0
Five year review
CONDENSED BALANCE SHEETS
Amounts in SEK million 2013 2014 2015 2016 2017
Assets
Goodwill 158.8 173.9 172.0 173.7 173.4
Other non-current assets 448.2 481.7 481.9 273.4 283.2
Trade receivables 151.7 183.3 196.6 150.8 158.9
Other non-interest bearing current assets 92.6 73.0 68.1 107.7 110.7
Cash and cash equivalents and short-term investments 151.4 129.4 74.9 195.4 98.7
Assets in operations held for sale 260.7 – – – –
Total assets 1,263.4 1,041.3 993.5 901.0 824.9
Equity and liabilities
Equity 286.0 292.6 297.9 348.1 288.1
Non-controlling interests 0.3 0.3 0.3 0.4 0.3
Long-term interest-bearing liabilities 264.8 203.0 1.0 198.2 199.9
Long-term non-interest-bearing liabilities 222.7 242.3 238.0 161.7 164.8
Short-term interest-bearing liabilities 42.3 22.8 208.2 – –
Short-term non-interest-bearing liabilities 275.4 280.3 248.1 192.6 171.8
Liabilities in operations held for sale 171.9 – – – –
Total equity and liabilities 1,263.4 1,041.3 993.5 901.0 824.9
STUDSV IK AB (PUBL ) ANNUAL REPORT 2017
78 FIVE YEAR REVIEW

CONDENSED CASH FLOW STATEMENTS
Refers to total operations
Amounts in SEK million 2013 2014 2015 2016 2017
Operating profit –165.3 17.9 24.4 70.0 –41.6
Reversal of depreciation/amortization 63.5 33.5 33.5 20.8 16.1
Other non-cash items 89.7 –16.2 –4.8 –64.4 –
Cash flow from operating activities –12.1 35.2 53.1 26.4 –25.5
Net financial items –18.5 –17.6 –11.5 –25.5 –9.0
Taxes –13.3 1.1 –6.9 –8.3 –6.5
Cash flow before changes in working capital –43.9 18.7 34.7 –7.4 –41.0
Changes in working capital 19.3 –39.5 –41.3 –48.7 –32.1
Cash flow before investments –24.6 –20.8 –6.6 –56.1 –73.1
Investments –15.3 70.7 –23.2 185.6 –11.0
Cash flow after investments –39.9 49.9 –29.8 129.5 –84.1
DATA PER SHARE 2013 2014 2015 2016 2017
Number of shares at close of period 8,218,611 8,218,611 8,218,611 8,218,611 8,218,611
Average number of shares 8,218,611 8,218,611 8,218,611 8,218,611 8,218,611
Earnings per share from continuing operations before and after dilution, SEK –2.78 0.63 1.78 2.07 –5.47
Earnings per share from operations held for sale before a nd after dilution, SEK –21.15 –2.09 –1.49 5.6 –
Earnings per share before and after dilution, SEK –23.93 –1.46 0.29 7.67 –5.47
Equity per share, SEK 34.83 35.64 36.30 42.41 35.09
KEY FINANCIAL FIGURES AND RATIOS 2013* 2014 2015 2016* 2017
Margins
Operating margin, % 1.6 3.3 5.1 3.2 –5.9
Profit margin, % –0.3 1.3 2.6 –0.1 –8.3
Return on investment*
Return on operating capital, % 4.5 7.7 8.9 6.3 –11.2
Return on capital employed, % 3.5 5.5 12.0 7.3 –7.8
Return on equity, % –6.0 1.8 0.8 2.5 –14.1
Capital structure
Operating capital, SEK million 353.2 398.6 432.6 351.3 389.6
Capital employed, SEK million 504.6 518.7 507.5 546.7 488.3
Equity, SEK million 286.3 292.9 298.3 348.5 288.4
Net interest-bearing debt, SEK million 155.7 105.7 134.3 2.9 101.2
Net debt-equity ratio, % 54.4 36.1 45.0 0.8 35.1
Interest coverage ratio, multiple –0.9 1.8 1.8 1.3 –2.6
Equity-assets ratio, % 26.2 28.1 30.0 38.7 35.0
Cash flow
Self-financing ratio, multiple 0.5 – – – –
Investments, SEK million 20.1 32.8 14.6 15.3 22.1
EBITDA 49.8 50.7 51.2 40.0 –25.0
EBITDA/Net financial items 2.7 3.2 2.9 2.4 –1.5
Employees
Average number of employees 988 895 708 687 662
Net sales per employee, SEK million 1.0 1.0 1.1 1.1 1.1
* Calculation based on continuing operations.
STUDSV IK AB (PUBL ) ANNUAL REPORT 2017
FIVE YEAR REVIEW 79

Definitions of key figures and ratios
EBITDAOperating result before amortization and impairment.
EBITDA/Net financial itemsOperating result before amortization and impairment divided by net financial items.
EquityThe total of non-restricted and restricted equity at the end of the year. Average equity capital has been calculated as opening balance plus closing balance of equity capital, divided by two.
Equity per shareEquity divided by the number of shares at the end of the period.
Sales revenue per employeeThe year’s net sales divided by the average number of employees.
InvestmentsTotal of the acquisition of businesses/subsidiaries and acquisition of intangible assets and property, plant and equipment
Average number of employeesAverage number of employees at the end of each month.
Net debtTotal long-term and short-term borrowing less cash and cash equivalents.
Net debt-equity ratioInterest-bearing net debt divided by equity including non-controlling interests.
Operating capitalThe balance sheet total less non-interest-bearing liabilities, current investments, cash and bank balances. Average operating capital has been calculated as opening balance plus closing balance of operating capital, divided by two.
P/E ratioShare price divided by earnings per share.
Earnings per shareProfit for the year divided by the average number of shares. The average number of shares has been calculated as a weighted average of all shares in issue for the year.
Return on equityProfit for the year as a percentage of average equity.
Return on operating capitalOperating result as a percentage of average operating capital.
Return on capital employedProfit/loss after financial items with financial expenses added back, as a percentage of average capital employed.
Net interest-bearing debtTotal of current and long-term interest-bearing liabilities less current investments and cash and bank balances.
Interest coverage ratioProfit after financial income divided by financial expense.
Operating marginOperating result after amortization as a percentage of net sales.
Self-financing ratioCash flow before investments divided by investments.
Equity-assets ratioEquity including non-controlling interests as a percentage of the balance sheet total.
Capital employedBalance sheet total less non-interest-bearing liabilities. Average capital employed has been calculated as opening balance plus closing balance of capital employed, divided by two.
Profit marginProfit/loss after financial items as a percentage of net sales.
STUDSV IK AB (PUBL ) ANNUAL REPORT 2017
80
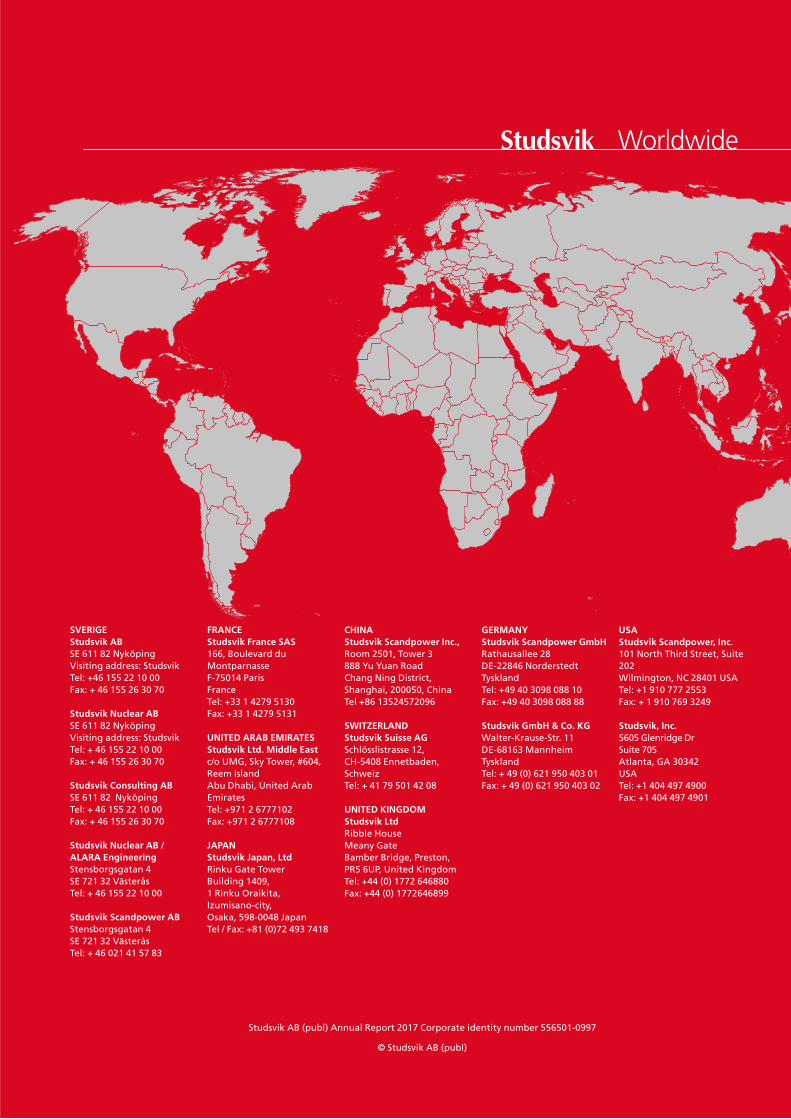
ANNUAL GENERAL MEETING OF SHAREHOLDERS, APRIL 25, 2018
The Annual General Meeting will be held in Stockholm, World Trade Center, Klarabergsviadukten 70 / Kungsbron 1, on
Wednesday, April 25, 2018, at 16.00.
NotificationShareholders wishing to participate must be registered in the share register kept by Euroclear Sweden AB by Thursday, April 19,
2018, and must give notification of their intention to attend by Thursday, April 19 at the latest.
• via Studsvik’s website, www.studsvik.se.
• by telephone +46 155 22 10 25,
• by mail to Studsvik AB, SE-611 82 Nyköping, Sweden,
• by email to [email protected], or
• by fax +46 155 26 30 70
The shareholder’s notification should state
• name
• personal/corporate identity number
• address and telephone number
• number of shares
For entitlement to vote at the Annual General Meeting, shareholders with nominee-registered holdings must apply to the
bank or broker managing their shares for temporary re-registration a couple of banking days before Thursday, April 19, 2018.
Nomination CommitteeStudsvik’s Nomination Committee consists of:
• Sven Ericsson, representative of the Karinen family (chair)
• Stina Barchan, Briban Invest AB
• Carina Heilborn, Peter Gyllenhammar AB
• Anders Ullberg, Chairman of the Board
The task of the Nomination Committee is to submit proposals to the Annual General Meeting of Shareholders regarding
election of the Board of Directors, auditors and alternate auditors and their fees.
FORTHCOMING FINANCIAL INFORMATION 2018
• Report on the first quarter as at March 31 April 25, 2018
• Report on first half year as at June 30 July 20, 2018
• Report on the three first quarters as at September 30 October 22, 2018
• Year-end report 2018 February 2019
• Annual report 2018 April 2019
The reports will be available at www.studsvik.com on the publication dates.
Information to shareholders
Studsvik AB (publ) Annual Report 2017 Corporate identity number 556501-0997
© Studsvik AB (publ)
Worldwide
SVERIGEStudsvik ABSE 611 82 NyköpingVisiting address: StudsvikTel: +46 155 22 10 00Fax: + 46 155 26 30 70
Studsvik Nuclear ABSE 611 82 NyköpingVisiting address: StudsvikTel: + 46 155 22 10 00Fax: + 46 155 26 30 70
Studsvik Consulting ABSE 611 82 NyköpingTel: + 46 155 22 10 00Fax: + 46 155 26 30 70
Studsvik Nuclear AB /ALARA EngineeringStensborgsgatan 4SE 721 32 VästeråsTel: + 46 155 22 10 00
Studsvik Scandpower ABStensborgsgatan 4SE 721 32 VästeråsTel: + 46 021 41 57 83
FRANCE Studsvik France SAS166, Boulevard du MontparnasseF-75014 ParisFrance Tel: +33 1 4279 5130 Fax: +33 1 4279 5131
UNITED ARAB EMIRATESStudsvik Ltd. Middle Eastc/o UMG, Sky Tower, #604, Reem IslandAbu Dhabi, United Arab EmiratesTel: +971 2 6777102Fax: +971 2 6777108
JAPANStudsvik Japan, LtdRinku Gate Tower Building 1409,1 Rinku Oraikita, Izumisano-city,Osaka, 598-0048 JapanTel / Fax: +81 (0)72 493 7418
CHINAStudsvik Scandpower Inc.,Room 2501, Tower 3888 Yu Yuan RoadChang Ning District,Shanghai, 200050, ChinaTel +86 13524572096
SWITZERLANDStudsvik Suisse AGSchlösslistrasse 12,CH-5408 Ennetbaden,SchweizTel: + 41 79 501 42 08
UNITED KINGDOMStudsvik LtdRibble HouseMeany GateBamber Bridge, Preston, PR5 6UP, United KingdomTel: +44 (0) 1772 646880Fax: +44 (0) 1772646899
GERMANYStudsvik Scandpower GmbHRathausallee 28DE-22846 NorderstedtTysklandTel: +49 40 3098 088 10Fax: +49 40 3098 088 88
Studsvik GmbH & Co. KGWalter-Krause-Str. 11DE-68163 MannheimTysklandTel: + 49 (0) 621 950 403 01Fax: + 49 (0) 621 950 403 02
USAStudsvik Scandpower, Inc.101 North Third Street, Suite 202Wilmington, NC 28401 USATel: +1 910 777 2553Fax: + 1 910 769 3249
Studsvik, Inc.5605 Glenridge Dr Suite 705Atlanta, GA 30342USATel: +1 404 497 4900Fax: +1 404 497 4901

Annual Report 2017
Stud
svik An
nu
al Rep
ort 2017
Studsvik AB (publ)SE 611 82 NyköpingTelephone: +46 155 22 10 00www.studsvik.com