Embed Size (px)
Citation preview

1
Vicore Pharma Holding AB (publ)
vicorepharma.com
Annual Report 2018
Focus on patients with fibrotic lung disease

32
Table of Contents
Summary of the period .................................. 4
CEO comments .............................................. 6
IPF - Patient story ........................................... 8
Project status ...............................................12
Market overview ...........................................14
The orphan drug market ..............................16
Annual report 2018 Administration report ...................................18
Multi-year overview ......................................24
Financial reports group ................................25
Financial reports parent company ..............30
Notes group ..................................................34
Notes parent company ................................67
Board, management and auditor ................78
Signatures.....................................................86
Auditors report .............................................87
Glossary ........................................................90
Contact information .....................................91

54
Important events during 2018 In February, Vicore acquired additional shares from an
existing shareholder in I-Tech. After this transaction, Vicore’s holding amounted to 26.5%. In March, I-Tech issued shares to a new shareholder, Cambrex Karlskoga AB. Vicore’s holding was consequently reduced to 21.2%
In April, Vicore Pharma received approval from the UK authorities and the Ethics Committee to initiate a Phase IIa study in Idiopathic Pulmonary Fibrosis (IPF)
In May, I-Tech AB (publ), issued new shares in conjunction with the company’s share listing on Nasdaq First North
In July, Vicore announced it had entered into an agreement to acquire INIM, a Swedish biopharmaceutical company developing a new local treatment for severe rare fibroticlungdiseases.Followingthetransaction, HealthCap VII L.P, became the largest shareholder in Vicore with 30.4% of the shares
In August, an Extraordinary General Meeting was held and passed resolutions on the following:
- Issue in kind regarding the acquisition of INIM
- Distribution of the majority of the shares held in I-Tech to Vicore shareholders
Summary of the Period
Financial overview for 2018 Operating income amounted to 0.6 MSEK (1.0)
Loss for the period was -21.7 MSEK (-24.2)
Loss per share, before and after dilution, was -0.95 SEK (-1.43)
On December 31, 2018, cash and cash equivalents amounted to 224.7 MSEK (24.0)
Important events after year-end In January, the directed share issue of approximately 160
MSEK was approved by an Extraordinary General Meeting. The total number of shares after the share issue amounts to 42,374,714
The group consists of the parent company, Vicore Pharma Holding AB (publ) (“Vicore”), the subsidiary, Vicore Pharma AB (“Vicore Pharma”), INIM Pharma AB (“INIM Pharma”) as well as the dormant company, ITIN Holding AB.
- Pre-emptive rights issue in Vicore
- Long-term incentive programs for certain senior leaders and board members
- Election of two new board members in Vicore: Hans Schikan and Jacob Gunterberg
In August, Vicore announced that Carl-Johan Dalsgaard was appointed new CEO as of September 1, 2018
In September, Vicore announced that the clinical program VP01 (C21) was expanded in order to increase the likelihood of showing signals of functional effect and successfully advance C21 in its clinical development
In September, Vicore Pharma strengthened its team with two key hires: Rohit Batta as CMO and Göran Tornling as Senior Medical Adviser
In October, Vicore announced that the rights issue completed in September was oversubscribed by 33% and raised approximately 82 MSEK
In October, Göran Wessman announced his resignation, from the Board of Directors due to health reasons
In November, the Board of Directors decided to act for the Company’s shares to be admitted for trading on Nasdaq Stockholm’s main list in 2019
In November, the Board of Directors resolved on a directed share issue raising approximately 160 MSEK
Upcoming financial reportsMay 15, 2019 ............................................... Interim report, quarter 1
August 23, 2019 .......................................... Interim report, quarter 2
November 8, 2019 ....................................... Interim report, quarter 3
Financial reports are available on the company’s website www.vicorepharma.com from the day of publication.
Annual General Meeting 2019Vicore’s Annual General Meeting will be held on May 15, 2019 at the Company’s premises at AstraZeneca in Mölndal. Information about the Annual General Meeting is available on www.vicorepharma.com

76
Vicore is determined to develop an attractive product portfolio target-ingidiopathicpulmonaryfibrosis
(IPF) and other associated lung disor-ders. During 2018, we emphasized three important success factors: (1) securing financing;(2)buildingaworldclassteamand (3) developing the pipeline including the design of the key phase II trial with the lead program VP01 (C21) in IPF to enable the detection of a therapeutic effect.
And the year was indeed transfor-mative. With the acquisition of INIM Pharma in July through an issue in kind, the company gained an active and long-term shareholder in HealthCap. The subsequent streamlining of operations included the distribution of the majority of the shares held in I-Tech thereby creating a rare disease company with focus on patientswithfibroticlungdisease.
Theshareholders’confidenceinVicore’s acquisition of INIM and start oftransformationwasconfirmedintheover-subscribed rights issue which was completed in October, raising 82 MSEK. The Board of Directors also resolved on a directed share issue, raising 160 MSEK, tofinancethenewbusinessplan.Thedi-rected issue was successfully performed inNovemberandgainedsignificantinterest among a number of Swedish and international long-term institutional inves-tors and sector specialist funds. In total we raised approximately 242 MSEK in a few months which enables us to execute on our plan to reach important value-driv-ing milestones going forward. In Novem-ber, the Board of Directors decided to act for an up-listing of the company’s shares to the Nasdaq Stockholm main list. The up-listingwillbeasignificantstepforthecompany and aims to further increase the attractiveness of the Vicore share through increased liquidity as the addressable investorbasegrowssignificantly.
Following my appointment as CEO in September, we made a strategic review of Vicore’s lead program VP01 (C21) and how we best could build on its unique pro-filetocaptureafunctionaleffectalreadyinourfirstpatienttrial.Byredesigningthetrial - extending the duration of treatment, increasing the number of subjects and monitoring lung function – we will be able to detect a potential therapeutic effect of our drug. During the year we have also put a lot of effort in identifying and evaluat-ing a second indication for VP01, which will broaden our pipeline. In the second program, VP02 (IMiD), the emphasis is to develop a dose and formulation that will capture the immunomodulatory (and anti-tussive) effects with a reduced sys-temic exposure. This work is progress-ing according to plan with the relevant models and technologies up and running. Exploring a second indication for VP01 and developing the VP02 (IMiD) program for IPF and IPF cough, give us two unique and differentiated drug development programs.
Goals 2019Complete Phase I for VP01 (C21) with the extended dosing
Initiate the Phase IIa study with VP01 (C21)
Select a second indication for VP01 and initiate a mechanistic pilot study in patients
Investigate safety and kinetics of the local VP02 (IMiD) programme
Up-list to the Stockholm Nasdaq main list
In order to execute on the plans we are building a world class team, starting in the medical area with Dr. Rohit Batta as
the new CMO. Dr Batta has been involved in GSK’s pulmonary hypertension efforts and more recently bringing the pediatric gene therapy product Strimvelis to the market. Furthermore, Dr. Göran Tornling was employed as senior medical advisor who together with our external interna-tional clinical advisors, Professor Toby Maher and Dr Maureen Horton, bring significantdiseasespecificexpertisetothe company. In addition, we are organiz-ing a clinical operations unit in-house led by Mimi Flensburg to secure control of future clinical trials.
Through the acquisition of INIM, Vicore also strengthened its Board of Di-rectors with two experienced new board members;HansSchikanandJacobGunt-erberg. Other key recruitments include Dr Johan Raud as CSO, Dr Ola Camber as responsible for CMC and Christian Hall as Head of investor relations.
To summarize, 2018 was in a true sense transformative. Building on what we now have initiated, Vicore is increas-ing both focus and speed in the value driving activities. In this context, the start of our phase II trial is the most important activity during 2019.
I am looking forward to keeping you updated on our progress.
Carl-Johan Dalsgaard, CEO
CEO Comments
GoalVicore’s goal is to establish the company as a leadingplayerinfibroticlungdiseaseandrelat-ed indications. Through clinical studies, Vicore will document the therapeutic properties of VP01 (C21) and VP02 (the IMiD-technology) in IPF and other indications. By generating strongclinicaldata,Vicorewillbuildsignificantvalue in the company and thereby create the prerequisitesforfuturefinancingandcommercialcollaborations. The company’s long-term goal is to obtain regulatory approval and launch medicines to help patients suffering from fibroticlungdisease.
VisionVicore’s vision is to remove the pain and sufferingcausedbyfibroticlungdisease.Asacompany, we pride ourselves on our collabo-rative approach to science and are committed to working closely with the patient community, scientificexpertsandclinicianstofindinnova-tive solutions that meet their needs.

98
To be diagnosed with idiopathic pulmonaryfibrosisistobegivenadeath sentence. You are told you
only have 2 to 4 years to live and there is nothing much doctors can offer you.
I went to my GP with a tickly cough in spring 2016. Eleven months later, after misdiagnosis and long waits for hospital appointments,Iwasfinallydiagnosed.Bythen, the other main symptom - breath-lessness - had begun to kick in. I was findingitdifficulttowalkupstairsathomewithout resting and gentle slopes were becoming a problem. The lung scarring was getting worse.
Over the next two years, I became pro-gressively more and more breathless and suffered an exacerbation. I was admitted to hospital with a chest infection, which ended up cutting my lung function by 10%. I now use supplementary oxygen to walk in my house and outside. I have just been told that I should now be on oxygen 24/7.Recently,Ihavefounditdifficultto shower or get dressed without help and I now depend on my wife for almost everything.
The future for me is not great but I try
to stay positive. Any day is a gift to be enjoyed.However,itisdifficultattimesand I have had some psychological counselling.
I am lucky not to have money worries. Sadly, this is not the case for many of my friends living with IPF. Government does providehelp,butitisofteninsufficient.When you have IPF, many things, such as transport and oxygen, when on holiday, costmore.Thiscanbedifficultforsomepeople.
Being a member of our local pulmo-naryfibrosissupportgrouphelpsmeenormously. It’s great to meet and talk to other people living with the disease and to be able to support each other. Our group meets every month and is always full of laughter. It helps a lot.
One thing that bothers me is that I am often too self-centred. It’s all too easy to be obsessed with one’s own problems and to forget the impact the disease is havingonlovedones.Myjourneyisdiffi-cult but so is the journey which my wife and children have to travel. Over time, with increasing breathlessness I have become less able to do things for myself.
At the same time my wife, who was my companion and lover, has had to become my carer. As I have become more and more dependent on her, she has also lost her independence. And as I worry about the future, so does she.
Currentlytherearetwoanti-fibroticmedicines, which have been shown toslowtherateoffibrosisformanypatients. I take one of these. But more effective drugs are needed to stop this devastating disease in its tracks. These new medicines won’t come in time to helpmebutIhopetheywillbenefitfuturegenerations.
In the future, with a better understand-ing of genetics and of the basic process-esinvolvedinfibrosis,moreeffectiveandpersonalised care, tailored to the needs of individual patients, will hopefully be possible.
IPF Patient story
This patient story has been kindly provided by Action for Pulmonary Fibrosis charity through a small grant and any patient details or photo-graphs have been anonymised or removed to protect confidentiality.

1110
Europe• 30,000-35,000 new diagnoses in IPF per
year• 80,000-111,000 people in the EU live with
IPF
USA• 30,000-40,000 new diagnoses of IPF per
year • Approximately 100,000 people in the US
live with IPF
Worldwide prevalence of IPF13-20/ 100,000

1312
Idiopathic pulmonary fibrosisIdiopathicpulmonaryfibrosis(IPF)isthemostcommontypeofpulmonaryfibrosisand is a severe and devastating disease with no known cause. It is characterized by a shrinking of the lungs due to the irreversibleformationoffibrosis(i.e.scartissue) causing stiffness, an irreversible lossoflungfunctionanddifficultyinbreathing. Debilitating symptoms of dyspnea and severe persistent dry cough typically appear between the ages of 50 and 70 years and while the disease is more common in men, the number of cases in women is increasing. It has been estimated that between 80,000 and 111,000 people in the EU are currently living with IPF, with 30,000-35,000 new cases being diagnosed each year. In the USA, approximately 100,000 people are currently living with IPF, with 30,000-40,000 new diagnoses per year. The over-all prevalence worldwide is estimated to
be 13-20/100,000 people. For being an orphan indication, the number of patients is relatively large.
The mortality associated with the disease is similar to lung cancer, with amediansurvivalofthreetofiveyearsafter diagnose. Currently, there is no cure for IPF and treatment options are limited. Two medicines have been approved for use in IPF: Ofev® (nintedanib, Boehringer Ingelheim) and Esbriet® (pirfenidone, Roche). Both have been shown to slow the development of the disease. However, the associated side-effects have limited their use. According to the American Thoracic Society, an average of 60% to 70% of mild to moderate IPF patients are not receiving treatment. The reason is either that they have failed to tolerate the treatment or are reluctant to risk the ex-posure to the known strong side effects associated with the drugs. Nevertheless, Esbriet and Ofev have been successful commercially, reaching combined sales of more than 1.9 BUSD in 2017.
In summary, the need for novel therapeu-ticoptionswithimprovedefficacyandsafety remains high.
VP01 - AT2 receptor agonist - multi-modal effectVicore’s drug candidate VP01 (C21) originated from extensive research on the Renin-Angiotensin System (RAS), a central system in the body for regu-lating blood pressure and salt balance. Within RAS, there is the AT2 receptor which, upon stimulation, may contribute to healing effects in tissue damage or within immune system disorders and may also counteract the negative effects of the AT1 receptor. The AT2 receptor is found to be highly up-regulated in diseases such as IPF to the magnitude of 200x-600x. Results from extensive preclinical research conducted with VP01 indicatedthatithasanti-inflammatory,
anti-fibrotic,anti-proliferative,vasodil-atory and vascular remodeling actions – this distinguishing multi-modal effect is ideal for complex diseases such as IPF. The drug selectively binds to the AT2 receptor and thereby generates several biologicaleffectsbeneficialtocounter-actingfibrosisandinflammation.Vicorehas received orphan drug designation for VP01 in IPF which e.g. provides for a ten-year market exclusivity period (from the date of registration of an approved drug) in Europe and Japan and seven years in the United States.
Project statusDuring 2016, Vicore conducted a SAD/MAD1 phase I trial with VP01 in healthy individuals. The study progressed as expectedandconfirmedthatVP01hasagoodsafetyprofile.Theseresultshaveopened the opportunity to conduct an additional Phase I dose-escalating study, with the objective to identify the highest optimal dose which may be used in the Phase IIa IPF study which is on track to commence during 2019. The Phase IIa study is being designed in collaboration with world renowned IPF clinical experts and will capture both safety and the functional end point FVC2. The Phase II a study aims to support the decision to movetoconfirmatoryPhaseII/IIIstudy.
Furthermore, development work is continuing to further understand the multi-modal effects of VP01, in particular relating to vascular aspects. Human data suggest an opportunity to target condi-tions such as diffuse cutaneous Systemic Sclerosis(dcSSc)whichhasbothfibroticand vascular components impacting mul-tiple organs, including the lungs, causing
complications such as interstitial lung disease. There is also data to suggest effects in pulmonary hypertension, with orwithoutconcomitantfibroticdisease.Vicore is actively working on identifying a second indication for VP01.
In parallel, efforts are continuing to identify new selective AT2-receptor molecules for further development. This work is taking place in collaboration with external research partners.
VP02 – Targeting IPF and IPF related coughVP02 is a novel formulation utilizing an existing immunomodulatory drug (IMiD) that can be administered locally in the lung by loading the drug molecules into amorphous micro particles. It is thought that the actions of VP02 suppress pathwaysinvolvedwithinthecoughreflextogether with disease modifying effects.
Many IPF patients suffer from a chronic intractable cough which consid-erably affects the patient’s quality of life duetosleepdisturbances,difficultiesatwork and stress incontinence3. Currently, there is no therapy for IPF cough and standard cough suppressants have little or no effect. The mechanism is unknown but thought to be due to architectural dis-tortion of the lungs, increased sensitivity ofthecoughreflex,airwayinflammationor changes in mucus production and clearance4.
Using IMiDs to treat IPF related cough isabreakthroughfindingwhichhasbeenshown to have clinical validity. IMiDs have documentedantifibroticandanti-inflam-matory attributes and may therefore be
1 SAD (Single Ascending Dose), MAD (Multiple Ascending Dose) 2 FVC (Forced Vital Capacity). FDA and EMA approved measure for lungfunction 3 Saini et al 2011 4 Vigeland et al 2017 5 Horton et al 2012
well suited for treatment of interstitial lung diseases. In a clinical study, an IMiD demonstratedasignificantpositiveeffecton patients with IPF, reducing the cough and dramatically improving quality of life which is paradoxically never seen in interventional clinical trials5. However, the high risk of severe side effects such as constipation, sedation and peripheral neuropathy due to systemic exposure have limited their use. Vicore’s VP02 program aims to address the negative aspects of systemic exposure by devel-oping VP02 for local administration in the lungs.
Theanti-inflammatoryandantifibroticproperties of IMiDs make the substances potentially suitable for the treatment of pulmonary sarcoidosis which is anoth-er interstitial lung disease. Similar to IPF, severe steroid resistant pulmonary sarcoidosis is a rare disease with fatal outcome where prerequisites to obtain orphan drug designation exist. Clinical case studies demonstrate the positive effects IMiDs can have on sarcoidosis despite the side effects of systemic expo-sure. Targeting local delivery, VP02 could haveabeneficialeffectonthediseaseprogression of pulmonary sarcoidosis.
Project statusTogether with Nanologica, Vicore devel-ops formulations that maximize local uptake in the lung but with lower risks of systemic side effects. The formulation work for VP02 is ongoing and the goal during 2019 is to identify a formulation with properties suitable for the drug candidate. The next step is to conduct toxicology studies and to subsequently initiate a Phase I trial during 2020.
Project Status
ExploratoryIndication
VP01 (C21)Idiopathic Pulmonary Fibrosis (IPF)
Second indication
Idiopathic Pulmonary Fibrosis (IPF)
New chemistry
VP02 (IMiD)
New follow-on molecules
Preclinical Phase I Phase II
Pipeline

1514
Idiopathic Pulmonary Fibrosis (IPF)Vicore has chosen idiopathic pulmonary fibrosis(IPF)asthefirstindicationforthe clinical development of the drug candidate VP01 (C21). The disease falls within the scope of the so-called orphan drug legislation, and Vicore has received orphan drug designation (ODD) for IPF in the EU and the US.
Fibrosis means that increased scar tissue is formed in one or more organs asaresultofinjury,inflammationorforunknown reasons. IPF is the most com-montypeofpulmonaryfibrosisandisaserious and fatal disease with no known cause of origin.
IPF means that the small air sacs in the lungs (the alveoli) and the lung tissue adjacent to the alveoli are damaged. The disease is aggravated by the fact that the healing process causes thickening and damage to the walls of the alveoli, and thatfibrosis(scarring)inthealveoliandlung tissue occurs. The scar formation is progressive and gradually degrades lung function. The mortality associated with IPF is at about the same level as lung cancer with a life exptectancy of three to fiveyearsafterdiagnosis.Thesurvivalrate for IPF is thus lower than for most forms of cancer1.
IPF is a rare disease that usually affects people aged 50 to 70 and more often men than women. IPF has a large patient population for an orphan disease. It is estimated that between 80,000 and 111,000 people in the EU live with IPF, where 30,000-35,000 new cases are diag-nosed each year. In the United States, ap-proximately 100,000 people live with IPF
today, with 30,000-40,000 new diagnoses per year. The overall prevalence world-wide is estimated to be 13-20 individuals per 100,000 people2.
Currently, there is no cure for IPF and the treatment options are limited. The market today consists of two approved drugs that can slow down the progress of the deterioration of the lung function, Esbriet(pirfenidone;Roche/Shionogi)andOfev(nintedanib;BoeringerattIngelheim). The research company Allied Market Research forecasts that the annu-al sales of pharmaceuticals for IPF will be 3.6 BUSD by 2023, corresponding to an increase by almost 90 percent versus 2017.
Although both Esbriet and Ofev can slow down the progress of IPF disease, both drugs are associated with side ef-fects such as vomiting and diarrhea3 , and have not yet shown that they can improve survival or quality of life of the affected patients, leaving many patients abstain-ing from treatment4. Despite a limited effect and risk of severe side effects, the two drugs together sold for approximate-ly 1.9 BUSD in 20175. For a drug that can showbetterefficacyand/orbettersafetyandtoleranceprofile,Vicoreestimatesthatthereisasignificantsalespotential.
Market trends and competition within IPFThe market for IPF medicines has in recent years attracted a great deal of interest from the pharmaceutical industry because of the great medical need. Ac-cording to the American Thoracic Society, on average 60-70% of patients with mild to moderate IPF receive no treatment11.
The explanation is either that the patient has not tolerated the treatment or that the patient is not prepared to exposehimselftotheknownsignificantside effects associated with the drugs. Thus, there is a great need for new drugs withabettersideeffectprofilethatcanprolong survival or quality of life for affected patients. IPF as an indication is now the main priority in the respiratory area among several of the world’s leading pharmaceutical companies. As a result, several successful license deals and company acquisitions have been carried out in the area. Among the acquisitions, The Roche aquisition of Intermune for 8.3 BUSD6 stands out. Several of the major license and option transactions in the IPFareahavealsoincludedsignificantup-front payments.
In 2021, patent protection for Esbriet will cease in the US, while new improved therapies can reach the market. Accord-ing to Vicore’s assessment, several of the larger the major pharmaceutical compa-nies are among the competitors as well as smaller companies such as Fibrogen, Galapagos, Prometic Life Sciences and Promedior.
Market Overview
Year Target/Licensor Acquiror/ Licensee Type of deal
Development stage at
transaction
Total deal value (MUSD)
2016 Nitto Denko BMS License Phase Ib Not public
2016 Afferent Pharmaceuticals Merck Acquisition Phase IIb 1,250
2015 Promedior BMS Option Phase II 1,250
2014 Intermune Roche Acquisition Approved (EU and Canada), 8,300
2014 Galecto Biotech BMS Option Phase I/IIa 444
2012 Stromedix Biogen Idec Acquisition Phase II 562
2011 Amira Pharmaceuticals BMS Acquisition Phase I 475
2011 Arresto BioSciences Gilead Sciences Acquisition Phase I 225 + milestones
1 MartinKolb,MartinaVašáková,RespiratoryResearch2019March14;20(1):57. 2 NIH National Library of Medicine. Genetics Home Reference3 Pharmaceutical Facts about Esbriet and Ofev from FASS (Pharmaceutical Specialists in Sweden)4 Initiation research note by Goetz Partners, published March 28, 2018 5 Roche, sales in 2017 (Esbriet) and Boehringer Ingelheim, sales in 2017 (Ofev) 5 Roche, sales in 2017 (Esbriet) och Boehringer Ingelheim, sales in 2017 (Ofev6 ATS (American Thoracic Society) conference 2018
Corporate acquisitions and license deals in antifibrosis and/or IPFThe information below regarding total deal value is, if published, taken from the respective acquirors/licensees’ press releases in connection with the publication of the transaction.

1716
The regulatory authorities can grant a drug candidate a so-called Orphan Drug Designation (ODD).
Orphan drug status is a way of encourag-ing research and development of drugs for the treatment of rare diseases. The or-phan drug market is growing faster than the rest of the pharmaceutical market. According to EvaluatePharma, orphan drug sales are estimated to exceed 260 BUSD in 20241.
In the US and Europe, about 60 million people are believed to suffer from one ofthe7,000identifiedrarediseases2,3. In total, about 350 million people around the world are assessed to suffer from one of theidentifiedrarediseases4.
Historically, the pharmaceutical indus-try has not given priority to developing drugs for a limited patient group. In order to increase the incentives to develop drugs for smaller patient groups, different forms of regulation have been designed. TheUnitedStateswasthefirsttointro-duceaspecificregulatoryframeworkforthis type of disease in 1983 through the Orphan Drug Act. Since its introduction, the FDA has approved more than 500
drugs for sale under this regulation and has granted orphan drug designation to more than 4,300 projects. The success of the American program meant that Japan (1993) and later Europe (2000) followed suit with their own legislation.
The definition of rare disease for different markets5
USA: <200,000 patients per indication
Japan: <50,000 patients per indication
Europe: <5 per 10,000 citizens (ap proximately 250,000 patients per indication) Developing a drug with orphan drug statusprovidesanumberofbenefits.Financial driving forces include, among other things, market exclusivity that can mean product protection. In the USA, market exclusivity can be obtained for seven years from approval and in the EU and Japan ten years from approval5.
Otherbenefitsoforphandrugstatusare linked to region. Among other things,
they can include tax credits for parts of the development costs and that a discounted fee to the FDA in the US is obtained. In the EU and Japan, assis-tance with the development of the drug is possible and a discount on the fee to the European Medicines Agency EMA is also possible5.
When it comes to orphan drugs, which are aimed at relatively fewer number of patients, the studies are often smaller, more emphasis is placed on biomarkers and the development phases are often combined, which can lead to a faster development process6.
Despite the limited patient population in rare diseases, several large compa-nies focus exclusively on orphan drugs. According to Vicore, the US companies Alexion Pharmaceuticals, Biomarin, Celgene and Genzyme are probably the best known examples. Genzyme was acquiredin2011bySanofiforapproxi-mately 20 BUSD7. Alexion Pharmaceuti-cals, Biomarin and Celgene have market capitalizations of 30, 16 and 109 BUSD respectively8. There are several examples of Nordic companies that have success-
The Orphan Drug Market
1 EvaluatePharma, Orphan Drug Report 2018, May 20182 ATS (American Thoracic Society) conference 20183 European Medicines Agency (EMA), ”Orphan designation”, 20174 Biostock, “The market value of orphan drugs doubled by the year 2022”, November 1, 20175 EvaluatePharma, Orphan Drug Report 2018, May 2018
6 Biostock, “The market value of orphan drugs doubled by the year 2022”, November 1, 20177Reuters,2011,”SanofitobuyGenzymeformorethanUSD20billion”8 Yahoo! Finance, market cap for respective company9 Nasdaq Stockholm, market capitalization of Sobi10 Alexion, ” Alexion To Acquire Wilson Therapeutics”, April 11, 2018
fully developed and launched orphan drugs. One example is Sobi which has developed and launched several orphan drugs within, in particular, hemophilia. Sobi is listed on Nasdaq Stockholm and has a market capitalization of approx-imately 60 BSEK9. Another example is Wilson Therapeutics, which was founded in 2012 and developed WTX101 as poten-tial treatment of Wilson’s disease. Wilson Therapeutics was listed on Nasdaq Stockholm in May 2016. Follow-ing a positive clinical development, the US pharmaceutical company Alexion acquired Wilson Therapeutics for approx-imately 7 BSEK10 in 2018.
The orphan drug market is large and growing rapidlyThe orphan drug market has shown strong growth in recent years. In 2017, sales increased by 11.3 percent com-pared to the previous year and amounted to 125 BUSD according to EvaluatePhar-ma5. During the same period total sales of prescription drugs (excluding generics) increased by 2.9 percent and totaled 708 BUSD in 2017 according to the same source5.
According to a report from Evaluate-Pharma, the market for orphan drugs is expected to grow by 11.2 percent per year between 2017 and 2024 and reach a val-ue of 262 BUSD. This can be compared to
an expected annual growth of 5.1 percent for the total prescription drug market (ex-cluding generics) over the same period, according to the same source. According to EvaluatePharma, orphan drugs are expected to account for 36 percent of global sales growth in prescription drugs during the same period, corresponding to 137 BUSD. This means that orphan drugs are estimated to account for 24 percent of global sales of prescription drugs (excluding generics) in 2024.
BUSD
Orphan drugs (CAGR 2017-2024): 11.2% Other prescription drugs excl generics (CAGR 2017-2024): 5.1%
Source: Orphan Drug Report 2018, EvaluatePharma
Worldwide Orphan Drug & Prescription Drugs Sales
900
800
700
600
500
400
300
200
100
0
2010 2017 2024
1918
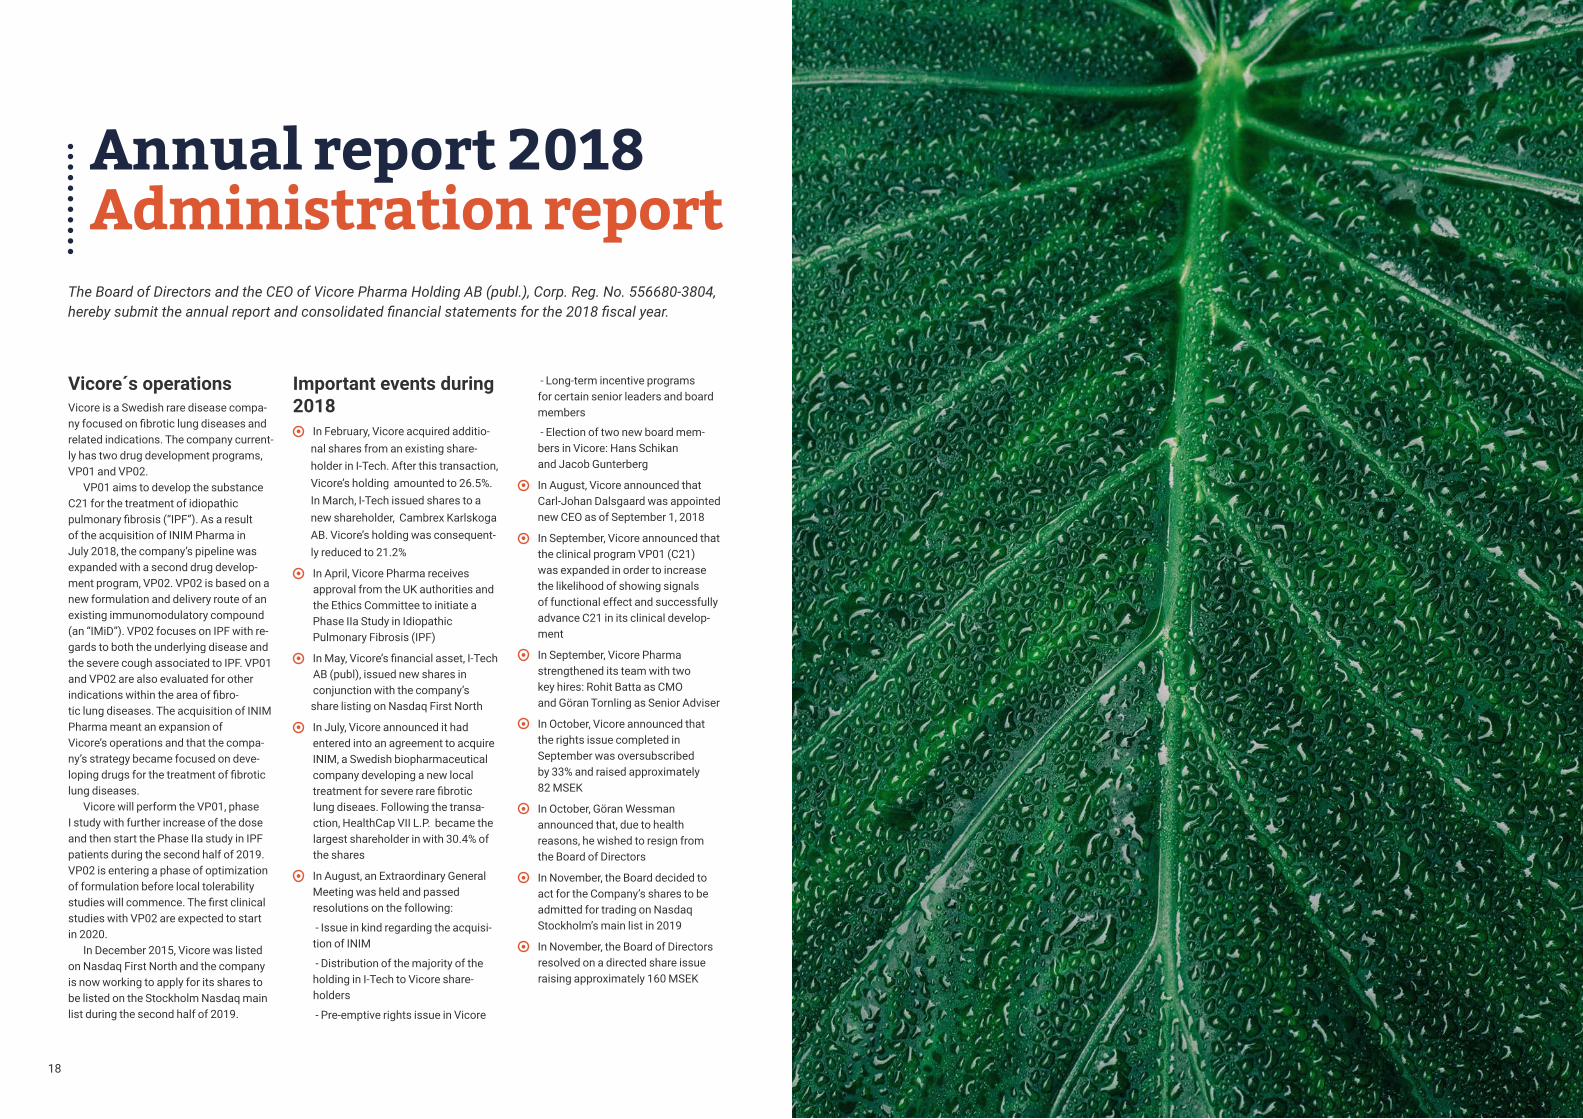
Annual report 2018 Administration report
The Board of Directors and the CEO of Vicore Pharma Holding AB (publ.), Corp. Reg. No. 556680-3804, hereby submit the annual report and consolidated financial statements for the 2018 fiscal year.
Vicore´s operationsVicore is a Swedish rare disease compa-nyfocusedonfibroticlungdiseasesandrelated indications. The company current-ly has two drug development programs, VP01 and VP02.
VP01 aims to develop the substance C21 for the treatment of idiopathic pulmonaryfibrosis(“IPF”).Asaresultof the acquisition of INIM Pharma in July 2018, the company’s pipeline was expanded with a second drug develop-ment program, VP02. VP02 is based on a new formulation and delivery route of an existing immunomodulatory compound (an “IMiD”). VP02 focuses on IPF with re-gards to both the underlying disease and the severe cough associated to IPF. VP01 and VP02 are also evaluated for other indicationswithintheareaoffibro- tic lung diseases. The acquisition of INIM Pharma meant an expansion of Vicore’s operations and that the compa-ny’s strategy became focused on deve- lopingdrugsforthetreatmentoffibroticlung diseases.
Vicore will perform the VP01, phase I study with further increase of the dose and then start the Phase IIa study in IPF patients during the second half of 2019. VP02 is entering a phase of optimization of formulation before local tolerability studieswillcommence.Thefirstclinicalstudies with VP02 are expected to start in 2020.
In December 2015, Vicore was listed on Nasdaq First North and the company is now working to apply for its shares to be listed on the Stockholm Nasdaq main list during the second half of 2019.
Important events during 2018
In February, Vicore acquired additio- nal shares from an existing share- holder in I-Tech. After this transaction, Vicore’s holding amounted to 26.5%. In March, I-Tech issued shares to a new shareholder, Cambrex Karlskoga AB. Vicore’s holding was consequent- ly reduced to 21.2%
In April, Vicore Pharma receives approval from the UK authorities and the Ethics Committee to initiate a Phase IIa Study in Idiopathic Pulmonary Fibrosis (IPF)
InMay,Vicore’sfinancialasset,I-Tech AB (publ), issued new shares in conjunction with the company’s share listing on Nasdaq First North
In July, Vicore announced it had entered into an agreement to acquire INIM, a Swedish biopharmaceutical company developing a new local treatmentforsevererarefibrotic lung diseaes. Following the transa- ction, HealthCap VII L.P. became the largest shareholder in with 30.4% of the shares
In August, an Extraordinary General Meeting was held and passed resolutions on the following:
- Issue in kind regarding the acquisi- tion of INIM
- Distribution of the majority of the holding in I-Tech to Vicore share- holders
- Pre-emptive rights issue in Vicore
- Long-term incentive programs for certain senior leaders and board members
- Election of two new board mem- bers in Vicore: Hans Schikan and Jacob Gunterberg
In August, Vicore announced that Carl-Johan Dalsgaard was appointed new CEO as of September 1, 2018
In September, Vicore announced that the clinical program VP01 (C21) was expanded in order to increase the likelihood of showing signals of functional effect and successfully advance C21 in its clinical develop- ment
In September, Vicore Pharma strengthened its team with two key hires: Rohit Batta as CMO and Göran Tornling as Senior Adviser
In October, Vicore announced that the rights issue completed in September was oversubscribed by 33% and raised approximately 82 MSEK
In October, Göran Wessman announced that, due to health reasons, he wished to resign from the Board of Directors
In November, the Board decided to act for the Company’s shares to be admitted for trading on Nasdaq Stockholm’s main list in 2019
In November, the Board of Directors resolved on a directed share issue raising approximately 160 MSEK

2120
During 2018, 475,000 share awards have been granted within the framework of Board LTIP 2018 and options corre-sponding to 300,000 shares have been granted within the framework of Co-work-er LTIP 2018.
The shareVicore’s shares were listed on Nasdaq First North on December 10, 2015, with the ticker VICO and ISIN SE0007577895. As of December 31, 2018, the total num-ber of shares amounted to 32,960,008 and the market capitalization was ap-proximately 527 MSEK. In January 2019, the company completed a directed share issue of a total 9,414,706 shares. The to-tal number of shares in the company after the directed share issue is 42,374,714. The company’s shares are issued in one class and each share carries one vote.
Certified AdviserVicore’scertifiedadviserisErikPenserBank, telephone: +46 8 463 83 00, e-mail: [email protected].
Important events after year end
In January, the directed share issue of approximately 160 MSEK was approved by an Extraordinary General Meeting. The total number of shares after the share issue amounts to 42,374,714
Sales and earningsOperating income amounted to 0.6
MSEK (1.0, 0.9) for the year 2018, wherof 0.5 MSEK was management fee from I-Tech.
During the year, research and devel-opment expenses amounted to 20.5 MSEK (17.6, 12.3). The research and development expenses consisted mainly of purchases of services from clinical research organizations (CROs) and other consultancy fees related to clinical trials.
Personnel costs including share-based payments amounted to 13.1 MSEK (6.7, 4.1) during 2018. The increase is mainly due to the company’s growing or-ganization. The total costs for the share-based incentive programs amounted to 1.0 MSEK (0, 0) for the year 2018, out of which 0.3 MSEK (0, 0) was provisions for social security contributions and 0.7 MSEK(0,0)wasIFRS2classifiedsalarycosts. These costs have had no cash impact.
During the second quarter of 2018, theinvestmentinI-Techwerereclassifiedfromassociatedcompaniestofinancialassets.Thefinancialassetwasrevaluedto market value at the stock market listing forI-Tech.Shareofprofitsinassociatedcompanies amounted to 16.6 MSEK during 2018.
The loss for the year 2018 was -21.7 MSEK (-24.2, -24.5). This corresponds to a loss per share, before and after dilution, of SEK -0.95 (-1.43, -1.77) for the year 2018.
Cash flow, investments and financial position
Cashflowfromoperatingactivitiesamounted to -33,0 MSEK (-27.9, -20.7) for the year 2018. The company repaid the bridge loan to Erik Penser Bank as part of the net proceeds from the rights issue.
Cashflowfrominvestingactivitieswas 15.0 MSEK (-2.6, -0.5) for the year. The increase compared with the previous year is mainly related to the completed acquisition of INIM, which consisted of approximately 20 MSEK in cash at the time of acquisition.
Cashflowfromfinancingactivitiesamounted to 218.7 MSEK (50.2, 0.3) for the full year 2018. During the year, the company raised 242.4 MSEK before issue costsof12.3MSEKintwofinancingrounds. In the rights issue completed in October, 2018, the company raised 82.4 MSEK before issue costs. In the directed share issue announced in November, 2018, which subsequently was approved by the Extraordinary General Meeting on January 7, 2019, the company raised approximately 160 MSEK before issue costs.
At December 31, 2018, cash and cash equivalents amounted to 224.7 MSEK, compared with 24.0 MSEK at December 31, 2017. Of the 224.7 MSEK in cash and cash equivalents as of December 31, 2018, approximately 150 MSEK were re-stricted cash held in escrow and subject to shareholder approval at the Extraordi-nary General Meeting on January 7, 2019.
Parent companyOperating income for the parent compa-ny amounted to 5.2 MSEK (3.0, 2.8) for the full year. The loss for the year 2018 was -11.1 MSEK (-3.9, -2.2). The costs consisted mainly of consultancy fees, salaries, travel and marketing. During the fourth quarter, a shareholder contribution amounting to 131.4 MSEK was provided from Vicore Pharma Holding AB to Vicore Pharma AB. At December 31, 2018, the parent compa-ny’s cash and cash equivalents amounted to 198.0 MSEK (22.9, 3.1).
The group consists of the parent com-pany, Vicore Pharma Holding AB (publ) (“Vicore”), the subsidiary, Vicore Pharma AB (“Vicore Pharma”), INIM Pharma AB (“INIM Pharma”) as well as the dormant company, ITIN Holding AB.
PersonnelAs of December 31, 2018, the group had seven employees, of whom three were
women and four men. The company also engages consultants for specialist tasks and assignments on a frequent basis. Thestaffhasahighlevelofeducation;71% of the personnel have a doctoral degree.
Share-based incentive programsThe purpose of share-based incentive programs is to promote the company’s long-term interests by motivating and rewarding the company’s senior manage-ment and other co-workers in line with the interests of the shareholders. Vicore currently has three active programs that include the management team, certain board members, key employees and key consultants.
On January 8, 2016, Vicore issued 570,000 options to key employees and key consultants. The increase in the company’s share capital, assuming full exercise of the options, will amount to SEK 285,000, which corresponds to a dilution of 1.3% of the total number of shares and of the total number of votes in the company.
At the Extraordinary General Meeting on August 13, 2018, it was resolved to implement two new incentive programs: a maximum of 2,000,000 options to senior leaders and key persons (”Co-worker LTIP2018”);andamaximumof475,000share awards to board members (”Board LTIP 2018”). Both these programs are performance-based programs entitling the holder to a maximum of one common share in Vicore per option or share award after three years. For further information about these programs, see the minutes of the Extraordinary General Meeting, held on August 13, 2018, published on the company’s website, www.vicorepharma.com and Note 7 Share-based payments. The increase in the company’s share capital, assuming full utilization and max-imum goal achievement of both incentive programs, amounts to a maximum of approximately SEK 1,237,500, corre-sponding to a dilution of 5.5% of the total number of shares.
Guidelines for remuneration of senior executivesVicore shall offer remuneration in accordance with market practice which enables the recruitment and retention of internationallyqualifiedseniorexecu-tives. Remunerations within Vicore shall be based on principles of performance, competitiveness and fairness.
Senior executives refer to the CEO and the other members of the executive management. The guidelines shall apply to employment agreements concluded after the Annual General Meeting’s reso-lution to adopt these guidelines, as well as when changes are made to existing agreements thereafter. The remuneration toseniorexecutivesconsistsoffixedremuneration, share and share-price related incentive programs, pension and otherbenefits.Iflocalconditionsjustifyvariations in the remuneration principles, such variations may occur.
Fixed remunerationThefixedremunerationshallreflecttheindividual’s responsibility and experience level.Thefixedremunerationshallbereviewed annually.
Shareholder No of shares %
HealthCap VII L.P. 11,796,408 27.8%Göran Wessman1 3,526,849 8.3%Swedbank Robur 2,683,332 6.3%Fourth Swedish National Pension Fund 2,060,000 4.9%HBM Healthcare Investments (Cayman) Ltd 1,952,666 4.6%Kjell Stenberg 1,531,303 3.6%Unionen 1,438,990 3.4%Pomona-gruppen AB 1,074,440 2.5%Alfred Berg 941,666 2.2%Handelsbanken Funds 900,000 2.1%Other 14,469,060 34.1%
Total number of shares 42,374,714 100.0%
1 Shareholdings privately and through Protem Wessman AB where Göran Wessman controls 40 percent of votes/capital.
Ownership structure Largest shareholders in Vicore as of January 25, 2019, after registration of the directed share issue referred to above.

2322
Share-based incentive programsShare and share-price related incentive programs shall, if resolved on, be decided by the shareholders’ meeting.
PensionsPension shall, where possible, be premi-um based. For the CEO and other senior executives, the premium may, in situa-tions where premium based pension is applicable amount to a maximum of 30% ofthefixedsalary.Notwithstandingtheabove, the Board of Directors is entitled to offer other solutions which, in terms of cost, are equivalent to the above.
Severance pay, etc.Between the company and the CEO, the notice period shall be six months upon notice by the company. Upon notice by the CEO, the notice period is six months. For other senior executives, notice periods of 3-6 months apply. During the notice period, normal salaries shall be paid.
Other benefitsSenior executives may be awarded other customarybenefitssuchascompanyhealthcareetc.Suchotherbenefitsshallnot constitute a substantial part of the total remuneration.
Deviation from guidelinesThe Board of Directors is entitled to deviate from the guidelines if the Board of Directors, in a certain case, deems that there are good reasons for the deviation.
Proposal for the 2019 Annual General Meeting regarding variable remunerationVariable remuneration paid in cash may notexceed40%oftheannualfixedremu-neration for the CEO and may not exceed 30%oftheannualfixedremunerationforother senior executives. Variable remu-nerations shall be connected to predeter-mined and measurable criteria, designed with the aim of promoting the company’s long-term value creation.
Nomination committee for the 2019 Annual General MeetingVicore’s nomination committee for the 2019 Annual General Meeting con-sists of Staffan Lindstrand, appointed by HealthCap VII L.P., Evert Carlsson, appointed by Swedbank Robur, Göran Wessman, appointed by Protem Wess-man AB and Leif Darner, Chairman of the Board of Directors of Vicore
Risk factors
Operational risksVicore is engaged in research and devel-opment operations through its subsidiary Vicore Pharma. Research and develop-mentinvolveasignificantinherentlevelof risk and is a capital-intensive process. The majority of initiated projects will never reach market registration due to technological risks, including the risk forinsufficientefficacy,intolerablesideeffects or manufacturing problems. Up until today, Vicore has not yet generated significantrevenue.Vicore’sexpansionand development related to VP01 and VP02 may be delayed and/or incur great-er costs and capital need than expected. Patents that the company has applied for may not be granted and granted patents may be challenged leading to loss of pat-ent protection. If competing pharmaceu-ticals capture market share or reach the market faster, or if competing research projectsachievebetterproductprofiles,the future value of the product portfolio may be lower than expected. The oper-ations may also be impacted negatively by decisions from public authorities, including decisions related to approvals, reimbursement and price changes.
Financial risksVicore’s treasury policy governing the managementoffinancialriskshasbeendesigned by the Board of Directors and represents a framework of guidelines and rules in the form of risk mandates and
Share premium reserve 402,662,719
Loss brought forward -11,266,864
Loss of the year -11,099,993
380,295,862
limitsforfinancialactivities.Thetreasurypolicy is updated at least once annually. Formoreinformationaboutfinancialrisks and risk management, see Note 17.
Proposed appropriation of the company’s profits or loss for the 2018 financial yearThefollowingprofit/lossstatedinSEKis at the disposal of the Annual General Meeting:
The Board of Directors proposes that SEK 380,295,862 are to be carried forward.
Financial targets and dividend policyVicore’sfinancialtargetsarethefollow-ing:
1. Toinacost-efficientwaydevelopVP01 and VP02 until proof of con-ceptinmanandmanagefinancialrisks related to this development.
2. The target is to distribute approxi-mately 50% of the Company’s annual netprofitasdividendswhenVicorehasachievedthedesiredfinancialstability, taking into account present andfutureprofitlevels,investmentneeds, liquidity and development opportunities as well as general eco-nomic and business conditions.
In accordance with the Board’s dividend policy, no dividend is to be paid before the companygeneratessignificantrevenue.

2524
Financial reports Group
Consolidated statement of comprehensive income
1 Thecomparativefiguresfor2015havenotbeenrestatedtoIFRS.
2 Thecomparativefiguresfor2015havenotbeenrestatedtoRFR2.
Multi-year overview, group1 IFRS 2018
IFRS 2017
IFRS 2016
K3 2015
Net sales (KSEK) 508 932 852 840
Lossafterfinancialitems(KSEK) -21,681 -24,231 -24,544 -4,570
Total assets (KSEK) 301,600 64,135 37,634 89,225Equity ratio (%) 94.6 89.8 83.9 91.8Number of employees 6 5 3 3
Multi-year overview, parent company2 RFR 2 2018
RFR 2 2017
RFR 2 2016
K3 2015
Net sales (KSEK) 0 0 0 0
Lossafterfinancialitems(KSEK) -11,100 -3,876 -2,231 -1,967
Total assets (KSEK) 488,965 126,309 80,017 85,267Equity ratio (%) 82.10 98.60 97.71 93.93Number of employees 3 2 2 2
KSEK Note Jan-Dec 2018
Jan-Dec 2017
Jan-Dec 2016
Operating income
Net sales 3, 25 508 932 852Other operating income 3 125 97 60
633 1,029 912
Operating costs
Research and development costs -20,463 -17,555 -12,257
Other external costs 4, 5 -8,624 -4,933 -4,719
Personnel costs 6, 7 -13,125 -6,707 -4,057
Depreciation and amortizations 13 -7 -7 -6
Profit/loss from operations -44,280 -28,583 -20,127
Results from financial items
Shareinprofitsinassociatedcompanies 14 16,573 -410 0
Financial income 8 3,684 4,414 0Financial expenses 9 -352 -62 -4,417
Net financial income/expense 19,905 3,942 -4,417
Loss after financial items -21,681 -24,231 -24,544
Tax 10 0 0 0
Loss for the year attributable to the parent company´s shareholders -21,681 -24,231 -24,544
Other comprehensive income
Other comprehensive income 0 0 0
Other comprehensive income for the year, net of tax 0 0 0
Total comprehensive income attributable to the parent company´s shareholders -21,681 -24,231 -24,544
Earnings per share, before and after dilution 11 -0.95 -1.43 -1.77
Multi-year overview
Multi-year overview, group1
Multi-year overview, parent company2

2726
Consolidated statement of financial position
KSEK Note Dec 31 2018
Dec 31 2017
Dec 31 2016
Jan 1 2016
Assets
Fixed assets
Patents, licenses and similar rights 12 69,192 16,637 16,637 16,637
Equipment 13 21 28 2 8
Participations in associated companies 14, 17 21 28 2 8Long-term investments 15, 16 5,567 22,745 16,196 20,110
Total fixed assets 74,780 39,410 32,835 36,755
Current Assets
Trade receivables 17 4 206 122 146
Other receivables 1,613 337 223 973
Prepaid expenes and accrued income 18 515 163 188 52Cash and cash equivalents 19 224,688 24,019 4,266 25,175
Total current assets 226,820 24,725 4,799 26,346
Total assets 301,600 64,135 37,634 63,101
Equity and liabilities
Equity 20, 21
Share capital 20,892 7,934 6,184 6,184
Other contributed capital 402,347 125,101 76,625 76,306
Retainedearnings(includingprofit(loss)for the period) -137,803 -75,459 -51,228 -26,684
Total equity attributable to the parent company's shareholders 285,436 57,576 31,581 55,806
Non-current liabilitiesProvision for social security contribu-tions, share based incentive program 22 278 0 0 0
Deferred tax liability 10 1,978 1,978 1,978 1,978
Total non-current liabilities 2,256 1,978 1,978 1,978
Current liabilities
Trade payables 16,17 2,384 2,780 2,184 2,312
Current tax liability 285 143 86 126
Other liabilities 445 250 188 1,816Accrued expenses and deferred income 23 10,794 1,408 1,617 1,063
Total current liabilities 13,908 4,581 4,075 5,317
Total equity and liabilities 301,600 64,135 37,634 63,101
Consolidated statement of changes in shareholder´s equity
Shareholders equity attributable to the parent company
KSEK Share capital
Ongoing new share-
issue
Other contributed
capital
Retained earnings in-
cluding profit (loss) for the
period
Total
Equity Jan 1, 2016 6,184 0 76,306 -26,684 55,806Profitfortheyear 0 0 0 -24,544 -24,544
Other comprehensive income for the year 0 0 0 0 0
Total comprehensive income for the year 0 0 0 -24 544 -24 544
Transactions with owners:
Long term incentive program 0 0 319 0 319
Total transactions with owners 0 0 319 0 319
Equity Dec 31, 2016 6,184 0 76,625 -51,228 31,581
Equity Jan 1, 2017 6,184 0 76,625 -51,228 31,581
Profitfortheyear 0 0 0 -24 231 -24 231
Other comprehensive income for the year 0 0 0 0 0
Total comprehensive income for the year 0 0 0 -24,231 -24,231
Transactions with owners:
Issue of new shares 1,750 0 54,250 0 56,000
Issue expenditures 0 0 -5,764 0 -5,764
Total transactions with owners 1,750 0 48,486 0 50,236
Equity Dec 31, 2017 7,934 0 125,111 -75,459 57,586
Equity Jan 1, 2018 7,934 0 125,111 -75,459 57,586
Profitfortheyear 0 0 0 -21,681 -21,681
Other comprehensive income for the year 0 0 0 0 0
Total comprehensive income for the year 0 0 0 -21,681 -21,681
Transactions with owners:
Issue of new shares and issue in kind 8,546 0 144,656 0 153,202
Issue of new shares, paid but not registered 0 4,412 145,608 0 150,020
Issue expenditures 0 0 -13,745 0 -13,745
Long term incentive program 0 0 717 0 717
Dividends of shares in associated companies 0 0 0 -40,663 -40,663
Total transactions with owners 8,546 4,412 277,236 -40,663 249,531
Equity Dec 31, 2018 16,480 4,412 402,347 -137,803 285,436

2928
Consolidated statement of cash flow
KSEK Note Jan-Dec 2018
Jan-Dec 2017
Jan-Dec 2016
Operating activities
Operatingprofit -41,586
-28,173 -20,127
Adjustmentforitemsnotincludedinthecashflow 24 722 7 6
Interest received 0 0 0
Interest paid -351 -62 -3Income tax paid 142 47 0Cash flow from operating activities before changes in working capital
-41,073 -28,181 -20,124
Cash flow from changes in working capital
Change in operating receivables -1,275 -174 638Change in operating payables 9,312 450 -1,242
Cash flow from operating activities -33,036 -27,905 -20,728
Investing activitiesAcquisition of intangible assets 26 -2,000 0 0Acquisition of equipment 0 -33 0Acquisition of long-term investments -3,228 -2,545 -500Acquisition of subsidiaries, net liquidity impact 24 20,258 0 0
Cash flow from investing activities 15,030 -2,578 -500
Financing activities
Issue of new shares 232,420 56,000 319Issue expenditures -13,745 -5,764 0
Cash flow from financing activities 218,675 50,236 319
Cash flow for the year 200,669 19,753 -20,909
Cash and cash equivalents at the beginning of the year 24,019 4,266 25,175
Cash and cash equivalents at year-end 19 224,688 24,019 4,266

3130
Parent company’s balance sheetKSEK Note Dec 31
2018Dec 31
2017Dec 31
2016Jan 1 2016
Assets
Fixed assets
Tangible assetsEquipment 10 22 28 2 8
Total tangible assets 22 28 2 8Financial assets
Participations in group companies 11 275,898 73,643 42,243 42,243
Receivables from group companies 0 19,930 26,936 10,155
Participations in associated companies 0 9,526 0 0Long-term investments 13 565 0 6,981 6,481
Total financial assets 276,463 103,099 76,160 58,879
Total fixed assets 276,485 103,127 76,162 58,887
Current assets 14
Receivables
Trade receivables 4 206 101 146
Receivables from group companies 4,019 0 431 672
Other receivables 10,373 1 29 527Prepaid expenses and accrued income 61 73 175 52
14,457 280 736 1,397
Cash and cash equivalents 16 198,023 22,902 3,119 24,983Total current assets 212,480 23,182 3,855 26,380
Total assets 488,965 126,309 80,017 85,267
Parent company’s income statement
KSEK Note Jan-Dec 2018
Jan-Dec2017
Jan-Dec2016
Operating income
Net sales 2 0 0 0Other operating income 3 5,177 2,982 2,809
5,177 2,982 2,809
Operating costs
Other external costs 4,5 -8,065 -3,879 -3,332
Personnel costs 6 -9,285 -3,530 -2,444Depreciation and amortization of tangible and intangible assets 10 -7 -7 -6
Profit/loss from operations -12,180 -4,434 -2,973
Result from financial itemsInterest income from participations in group companies 1,428 616 745
Otherinterestincomeandsimilarprofit(loss)items 7 0 0 0
OtherInterestexpensesandloss(profit)similar items 8 -348 -58 -3
Finance net 1,080 558 742
Loss after financial items -11,100 -3,876 -2,231
Tax 9 0 0 0
Loss for the year -11,100 -3,876 -2,231
Other comprehensive income
Other comprehensive income 0 0 0
Other comprehensive income for the year 0 0 0
Comprehensive income for the year -11,100 -3,876 -2,231
Financial reports Parent company
Equity and liabilities
Equity 17
Restricted equity
Share capital 16,480 7,934 6,184 6,184Ongoing new share issue 4,707 0 0 0
Total fixed assets 21,187 7,934 6,184 6,184
Non-restricted equityShare premium reserve 402,663 116,400 67,913 67,913
Accumulatedprofitorloss -11,267 4,087 6,319 7,967
Profit(loss)fortheyear -11,100 -3,876 -2,231 -1,967
380,296 116,611 72,001 73,913
Total equity 401,483 124,545 78,185 80,097
Non-current liabilitiesProvisions 6, 7, 22 278 0 0 0
Non-current liabilities to group companies 400 400 400 400
678 400 400 400
Current liabilities
Trade payables 1,510 404 318 1,983
Liabilities to group companies 75,000 0 0 0
Current liabilities 9 157 69 64 122
Other liabilities 358 143 90 1,661
Short-term provisions 0 0 0 0Accrued expenses and deferred income 20 9,779 748 960 1,004
86,804 1,364 1,432 4,770
Total liabilities 87,482 1,764 1,832 5,170
Total equity and liabilities 488,965 126,309 80,017 85,267

3332
The parent company’s cash flow statement
KSEK NoteJan-Dec
2018Jan-Dec
2017Jan-Dec
2016
Operating activities
Operationprofit -12,180 -4,434 -2,973
Adjustmentsforitemsnotincludedinthecashflow 717 7 6
Interest received 1,428 616 745
Interest paid -349 -58 -3Income tax paid 88 5 0
Cash flow from operating activities before changes in working capital -10,296 -3,864 -2,225
Cash flow from changes in working capitalChange in operating receivables -13,855 456 661
Change in operating payables 10,632 -73 -3,338
Change in working capital -13,519 -3,481 -4,902
Investing activitiesAcquisitionoftangiblefixedassets 0 -33 0
Loans granted to Group companies -36,836 -24,394 -16,781Acquisition of long-term investments -3,228 -2,545 -500
Cash flow from investment activities -40,064 -26,972 -17,281
Financing activitiesIssue of new shares 228,704 50,236 0Incentive program 0 0 319
Cash flow from financing activities 228,704 50,236 319
The cash flow for the year 175,121 19,783 -21,864
Cash and cash equivalents at the beginning of the year 22,902 3 ,119 24,983
Cash and cash equivalents at the end of the year 16 198,023 22,902 3,119
KSEK Share capital
Ongoing new
share issue
Share premium
reserve
Loss brought forward
Loss for the year Total
Equity Jan 1, 2016 6,184 0 67,913 7,967 -1,967 80,097
Transfer of previous year’s loss 0 0 0 -1,967 1,967 0Loss for the year 0 0 0 0 -2,231 -2,231
Total comprehensive income for the year 0 0 0 6,000 -2,231 77,866
Transactions with owners:Issue of new shares 0 0 0 319 0 319
Total transaction with owners 0 0 0 319 0 319
Equity Dec 31, 2016 6,184 0 67,913 6,319 -2,231 78,185
Equity Jan 1, 2017 6,184 0 67,913 6,319 -2,231 78,185
Transfer of previous year’s loss 0 0 0 -2,231 2,231 0
Loss for the year 0 0 0 0 -3,876 -3,876
Total comprehensive income for the year 0 0 0 4,088 -3,876 74,309
Transactions with owners:
Issue of new shares 1,750 0 54,250 0 0 56,000Issue expenditures 0 0 -5,764 0 0 -5,764
Total transaction with owners 1,750 0 48,486 0 0 50,236
Equity Dec 31, 2017 7,934 0 116,399 4,088 -3,876 124,545
Equity Jan 1, 2018 7,934 0 116,399 4,088 -3,876 124,545
Transfer of previous year’s loss 0 0 0 -3,876 3,876 0
Loss for the year 0 0 0 0 -11,100 -11,100
Total comprehensive income for the year 7,934 116,399 212 -11,100 113,445
Transactions with owners:
Issue of new shares 8,546 0 300,009 0 0 308,555
Issue of new shares, not registered 0 4,707 0 0 0 4,707
Issue expenditures 0 0 -13,745 0 0 -13,745
Incentive programs 0 0 0 710 0 710Dividends paid 0 0 0 -12,189 0 -12,189
Total transaction with owners 8,546 4,707 286,264 -11,479 0 288,038
Equity Dec 31, 2018 16,480 4,707 402,663 -11,267 -11,100 401,483
The parent company’s report of changes in equity
3534
Note 1 Accounting principlesThisAnnualReportandtheconsolidatedfinancialstatementscomprise the Swedish parent company Vicore Pharma Holding AB (publ), corporate registration number 556680-3804, and its subsidiaries. The parent company is a limited liability company withitsregisteredofficeinMölndal,Sweden.TheaddressofthemainofficeisPepparedsleden1,43183Mölndal.Themainoperation of the group is research and development of pharma-ceutical products.
On April 12, 2019, the Board of Directors approved this Annu-alReportandtheconsolidatedfinancialstatements,whichwillbe presented for approval at the Annual General Meeting on May 15, 2019.
Applied regulationsVicore’s consolidated accounts have been prepared in accor-dance with the International Financial Reporting Standards (IFRS) issued by the International Accounting Standards Board (IASB) as well as the interpretations from the IFRS Interpreta-tion Committee (IFRS IC) as adopted by the European Union (EU). Furthermore, the group also applies the Annual Accounts Act (1995: 1554) and the Swedish Financial Reporting Board’s recommendation RFR 1 ”Supplementary Accounting Rules for Groups.”
Thisisthegroup’sfirstannualreportinaccordancewithIFRSwith the transition date: 1 January 2016. The group has previ-ously applied BFNAR 2012:1 Annual Reports and Consolidated Accounts (K3).
Basis for the consolidated accountsPreparingfinancialstatementsinaccordancewithIFRSrequiresthe company management to make estimates for accounting purposes. These assessments and estimates are based on his-torical experiences, as well as other factors that are considered to be reasonable during the current circumstances. The actual result can deviate from these estimates and assessments.
New and amended IFRS that are not yet effective
IFRS 16 Leases
As of January 1, 2019, IFRS 16 Leases replaced the former lease standard IAS 17 and related interpretations IFRIC 4, SIC 15 and SIC 27. As a result of the introduction of IFRS 16, Vicore’s bal-ance sheet total will increase due to the recognition of right-of-use assets and lease liabilities. Lease payments that previously under IAS 17 have been recognized as operating expenses will be replaced by depreciation of the right-of-use assets recog-nized as an operating expense and interest expense on the lease liability,whichisreportedasafinancialexpense.Inthecashflowstatement,theleasepaymentissplitbetweenamortizationon the lease liability and payment of interest.
The standard allows the application of practical exemptions regarding short-term leases (lease term of less than 12 months) and leases where the underlying asset is of low value for which the lease payments are recognized as an expense on a straight-line basis. Vicore will apply both practical exemptions. Leases with a remaining lease term of less than 12 months at the time oftransitiontoIFRS16arealsoclassifiedasshort-termleasesin accordance with the practical expedient in the transition guidelines and are thus not included in the opening balance for the lease liability and right-of-use asset.
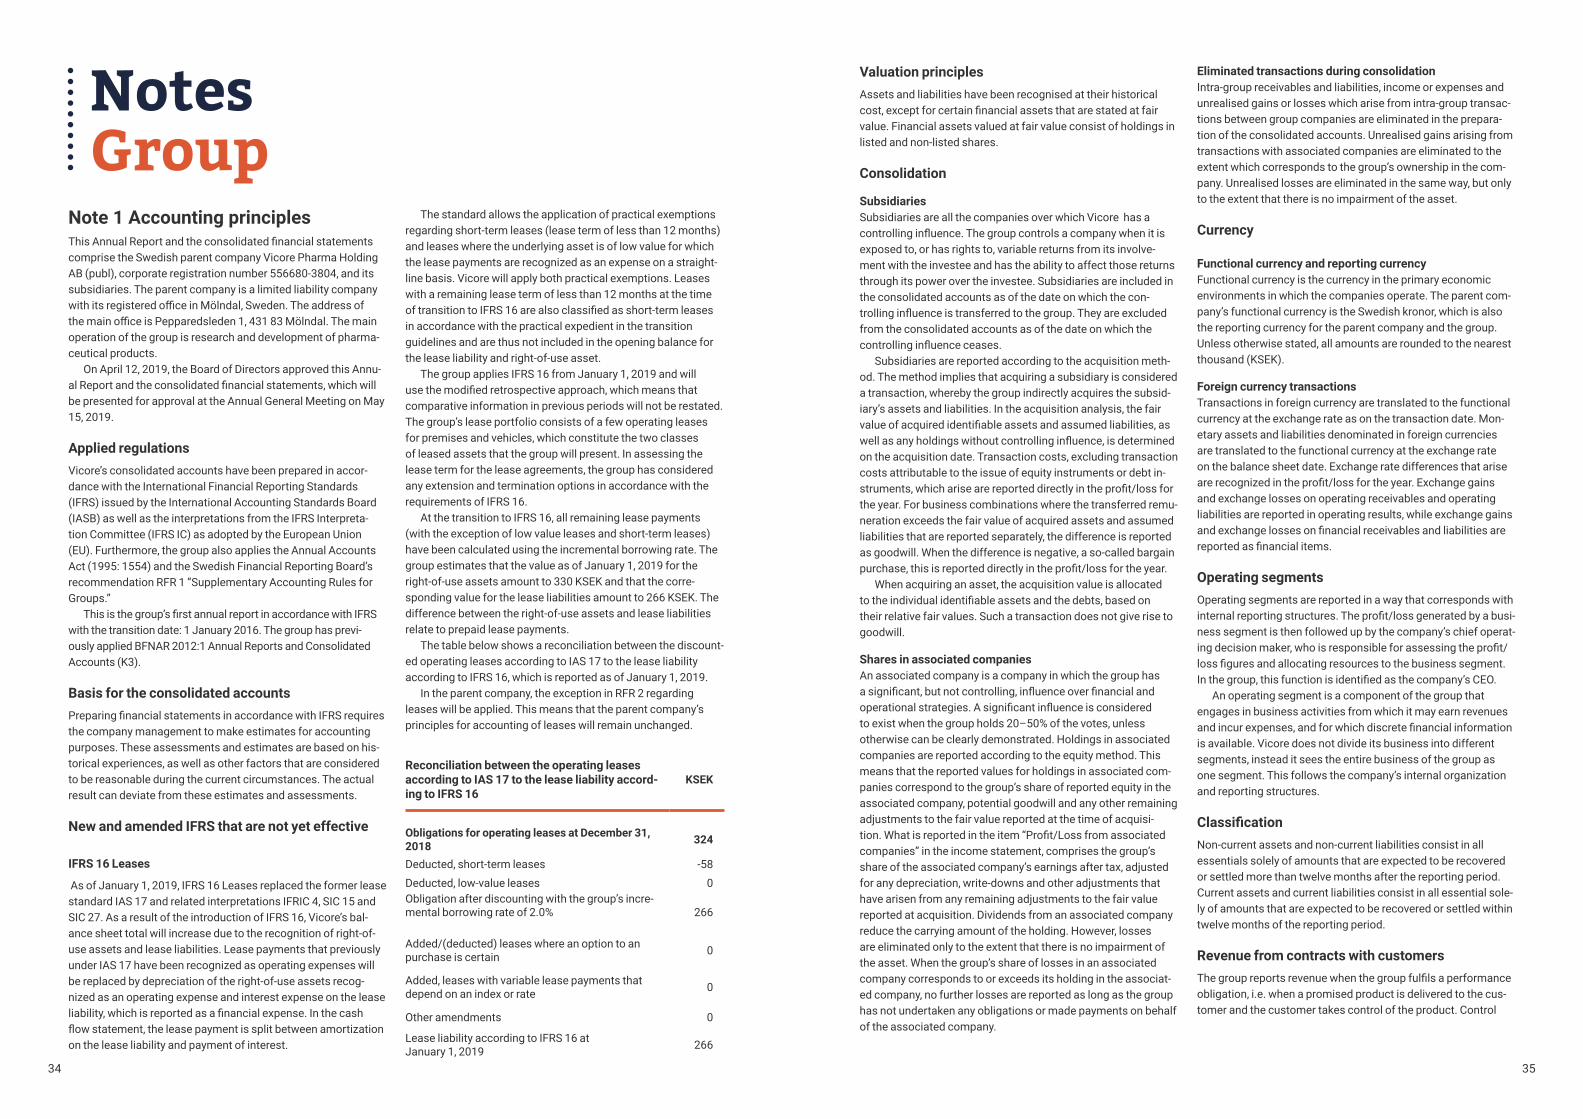
The group applies IFRS 16 from January 1, 2019 and will usethemodifiedretrospectiveapproach,whichmeansthatcomparative information in previous periods will not be restated. The group’s lease portfolio consists of a few operating leases for premises and vehicles, which constitute the two classes of leased assets that the group will present. In assessing the lease term for the lease agreements, the group has considered any extension and termination options in accordance with the requirements of IFRS 16.
At the transition to IFRS 16, all remaining lease payments (with the exception of low value leases and short-term leases) have been calculated using the incremental borrowing rate. The group estimates that the value as of January 1, 2019 for the right-of-use assets amount to 330 KSEK and that the corre-sponding value for the lease liabilities amount to 266 KSEK. The difference between the right-of-use assets and lease liabilities relate to prepaid lease payments.
The table below shows a reconciliation between the discount-ed operating leases according to IAS 17 to the lease liability according to IFRS 16, which is reported as of January 1, 2019.
In the parent company, the exception in RFR 2 regarding leases will be applied. This means that the parent company’s principles for accounting of leases will remain unchanged.
Notes Group
Reconciliation between the operating leases according to IAS 17 to the lease liability accord-ing to IFRS 16
KSEK
Obligations for operating leases at December 31, 2018 324
Deducted, short-term leases -58
Deducted, low-value leases 0Obligation after discounting with the group’s incre-mental borrowing rate of 2.0%
266
Added/(deducted) leases where an option to an purchase is certain 0
Added, leases with variable lease payments that depend on an index or rate 0
Other amendments 0
Lease liability according to IFRS 16 at January 1, 2019 266
Valuation principlesAssets and liabilities have been recognised at their historical cost,exceptforcertainfinancialassetsthatarestatedatfairvalue. Financial assets valued at fair value consist of holdings in listed and non-listed shares.
Consolidation
SubsidiariesSubsidiaries are all the companies over which Vicore has a controllinginfluence.Thegroupcontrolsacompanywhenitisexposed to, or has rights to, variable returns from its involve-ment with the investee and has the ability to affect those returns through its power over the investee. Subsidiaries are included in the consolidated accounts as of the date on which the con-trollinginfluenceistransferredtothegroup.Theyareexcludedfrom the consolidated accounts as of the date on which the controllinginfluenceceases.
Subsidiaries are reported according to the acquisition meth-od. The method implies that acquiring a subsidiary is considered a transaction, whereby the group indirectly acquires the subsid-iary’s assets and liabilities. In the acquisition analysis, the fair valueofacquiredidentifiableassetsandassumedliabilities,aswellasanyholdingswithoutcontrollinginfluence,isdeterminedon the acquisition date. Transaction costs, excluding transaction costs attributable to the issue of equity instruments or debt in-struments,whicharisearereporteddirectlyintheprofit/lossforthe year. For business combinations where the transferred remu-neration exceeds the fair value of acquired assets and assumed liabilities that are reported separately, the difference is reported as goodwill. When the difference is negative, a so-called bargain purchase,thisisreporteddirectlyintheprofit/lossfortheyear.
When acquiring an asset, the acquisition value is allocated totheindividualidentifiableassetsandthedebts,basedontheir relative fair values. Such a transaction does not give rise to goodwill.
Shares in associated companiesAn associated company is a company in which the group has asignificant,butnotcontrolling,influenceoverfinancialandoperationalstrategies.Asignificantinfluenceisconsideredto exist when the group holds 20–50% of the votes, unless otherwise can be clearly demonstrated. Holdings in associated companies are reported according to the equity method. This means that the reported values for holdings in associated com-panies correspond to the group’s share of reported equity in the associated company, potential goodwill and any other remaining adjustments to the fair value reported at the time of acquisi-tion.Whatisreportedintheitem“Profit/Lossfromassociatedcompanies” in the income statement, comprises the group’s share of the associated company’s earnings after tax, adjusted for any depreciation, write-downs and other adjustments that have arisen from any remaining adjustments to the fair value reported at acquisition. Dividends from an associated company reduce the carrying amount of the holding. However, losses are eliminated only to the extent that there is no impairment of the asset. When the group’s share of losses in an associated company corresponds to or exceeds its holding in the associat-ed company, no further losses are reported as long as the group has not undertaken any obligations or made payments on behalf of the associated company.
Eliminated transactions during consolidationIntra-group receivables and liabilities, income or expenses and unrealised gains or losses which arise from intra-group transac-tions between group companies are eliminated in the prepara-tion of the consolidated accounts. Unrealised gains arising from transactions with associated companies are eliminated to the extent which corresponds to the group’s ownership in the com-pany. Unrealised losses are eliminated in the same way, but only to the extent that there is no impairment of the asset.
Currency
Functional currency and reporting currencyFunctional currency is the currency in the primary economic environments in which the companies operate. The parent com-pany’s functional currency is the Swedish kronor, which is also the reporting currency for the parent company and the group. Unless otherwise stated, all amounts are rounded to the nearest thousand (KSEK).
Foreign currency transactionsTransactions in foreign currency are translated to the functional currency at the exchange rate as on the transaction date. Mon-etary assets and liabilities denominated in foreign currencies are translated to the functional currency at the exchange rate on the balance sheet date. Exchange rate differences that arise arerecognizedintheprofit/lossfortheyear.Exchangegainsand exchange losses on operating receivables and operating liabilities are reported in operating results, while exchange gains andexchangelossesonfinancialreceivablesandliabilitiesarereportedasfinancialitems.
Operating segmentsOperating segments are reported in a way that corresponds with internalreportingstructures.Theprofit/lossgeneratedbyabusi-ness segment is then followed up by the company’s chief operat-ingdecisionmaker,whoisresponsibleforassessingtheprofit/lossfiguresandallocatingresourcestothebusinesssegment.Inthegroup,thisfunctionisidentifiedasthecompany’sCEO.
An operating segment is a component of the group that engages in business activities from which it may earn revenues andincurexpenses,andforwhichdiscretefinancialinformationis available. Vicore does not divide its business into different segments, instead it sees the entire business of the group as one segment. This follows the company’s internal organization and reporting structures.
ClassificationNon-current assets and non-current liabilities consist in all essentials solely of amounts that are expected to be recovered or settled more than twelve months after the reporting period. Current assets and current liabilities consist in all essential sole-ly of amounts that are expected to be recovered or settled within twelve months of the reporting period.
Revenue from contracts with customersThegroupreportsrevenuewhenthegroupfulfilsaperformanceobligation, i.e. when a promised product is delivered to the cus-tomer and the customer takes control of the product. Control
3736
of a performance obligation can be transferred over time or at a point in time. Revenue consists of the amount the company expects to receive as compensation for the transferred products or services. For the group to report revenue from contracts with customers, each customer contract is analyzed according to the five-stepmodelincludedinthestandard:
Step 1: Identify a contract between at least two parties that consists of enforceable rights and obligations.
Step 2: Identify the performance obligations in the contract.
Step 3: Determine the transaction price, i.e. the amount of con-sideration that the company is expected to receive in exchange for the promised goods or services.
Step 4:Allocatethetransactionpriceovertheidentifiedperfor-mance obligations.
Step 5: Recognize revenue when the performance obligations aresatisfied,i.e.whencontrolistransferredtothecustomer.
Thegroup’snetsalesarecurrentlynotasignificantpartofthebusiness. The company only conducts development activities andisnotexpectedtoreceiveanysignificantincomeduringthenext few years.
LeasingAll leasing contracts where the lessor maintains all risks and benefitsofownershipareclassifiedasoperational.Leasingfeesare expensed on a straight-line basis in the income statement overthetermofthelease.Benefitsobtainedinconnectionwiththe signing of a lease are initially taken into account. The group only holds leasing agreements that are deemed to be operation-al leases.
Employee benefits
Short term remunerationShort term remuneration to employees, such as salary, social security contributions, holiday pay and bonus, is expensed when the employees perform the services.
Pension obligationsThegrouponlyhasdefinedcontributionpensionplans.Inde-finedcontributionplans,thegrouppaysfixedcontributionstoaseparate entity and has no legal or constructive obligation to pay furthercontributionsifthisentitydoesnothavesufficientassetsto pay all the remuneration to employees connected with the employees’ service during the current or prior periods. Therefore, the group has no additional risk. For the group’s obligations regardingcontributionsfordefinedcontributionplans,thesearereportedasanexpenseintheconsolidatedprofit/lossasthebenefitsareearned.
Long term incentive programsThere are two types of share-based incentive programs in the group: one option program for employees and consultants, and one program for share awards for certain board members. The option and share awards have been granted free of charge and are settled with equity instruments.
The fair value of share-based payments is accounted for as personnel costs. The fair value of the employee stock options is determined at grant date with the Black-Scholes model for pric-ing of options. For the share awards, the fair value is determined
at the time of allocation using a Monte Carlo simulation of future stock price development. The cost is reported, along with a corresponding increase in equity, during the period in which the vestingconditionsarefulfilled,uptoandincludingthedatewhenthe persons concerned are fully entitled to the compensation.
The accumulated cost included in each reporting period shows to what extent the vesting period has been recognised with an estimate of the number of share-related instruments that eventually will be vested.
Social contributions attributable to share-related instruments to employees as compensation for purchased services must be expensed over the periods during which the services are performed. This cost must then be calculated using the same valuation model that was used when the options were issued. The provision made shall be reassessed at each reporting date based on a calculation of the amount social charges that may be payable when the instruments are settled.
In addition to the option program described above, options have been allocated to employees at market price.
Financial income and expenses
Financial incomeFinancial income consists of capital gains on and dividend incomesfromfinancialfixedassets.Dividendincomeisrecog-nized when the right to receive a dividend has been established.
Exchange rate gains and losses are reported net.
Financial costsFinancial costs consist mainly of interest expenses on loans. Exchange rate gains and losses are reported net.
Income taxesIncome taxes consist of current tax and deferred tax. Income taxesarerecognizedinprofitorlossfortheyear,exceptwhenthe underlying transaction is recognized in other comprehensive income or equity, in which case the tax effect is recognized in other comprehensive income or equity.
Current taxCurrent tax is the tax that must be paid or received for the current year, with the application of the tax rates that have been decided, or in practice decided, on the balance sheet date. Cur-rent tax also includes adjustments to the current tax attributable to previous periods.
Deferred tax asset/tax liabilityDeferred tax is reported in its entirety, according to the bal-ance sheet method and is based on the temporary differences between the tax base value of assets and liabilities and their carrying amount. Temporary differences are not taken into account in consolidated goodwill or differences attributable to participations in subsidiaries, which are not expected to be taxed in the foreseeable future. The valuation of deferred tax is based on how underlying assets or liabilities are expected to be realized or regulated. Deferred tax amounts are calculated by applying the tax rates and tax rules that have been decided or announced as of the balance sheet date and which are expected to apply when the deferred tax asset is realized or the deferred tax liability is settled.
Deferred tax assets related to deductible temporary differ-
ences and loss carry forwards are only recognized to the extent it is probable that these will be utilized.
The value of deferred tax assets is reduced when it is no lon-ger deemed likely that they can be utilized. Deferred tax assets and deferred tax liabilities are offset if there is a legal right to offset short-term tax assets against short-term tax liabilities and the deferred tax is attributable to the same entity in the group and the same tax authority.
Earnings per shareEarningspersharebeforedilutionarecalculatedasprofitorlossattributable to the parent company shareholders divided by the weighted average number of ordinary shares outstanding during the period.
Earningspershareafterdilutionarecalculatedasprofitorloss attributable to the parent company shareholders divided, in some cases adjusted, by the sum of the weighted average num-ber of ordinary shares and potential ordinary shares that may give rise to dilution effects. A dilution effect of potential ordinary shares is recognized only if a translation into ordinary shares would lead to a reduction of earnings per share after dilution.
Intangible assetsIntangible assets in the group consist of technology in the form of patents, licenses and similar rights. They are valued at cost that is decreased by accumulated depreciation and any accumu-lated impairment losses.
An intangible asset is recognized if it is probable that the assetwillgeneratefutureeconomicbenefitsforthegroup,thecriteria for capitalization are met and the costs can be measured reliably. An intangible asset is valued at cost when it is included forthefirsttimeinthefinancialreport.Intangibleassetswithlimited useful life are reported at cost less depreciation and any impairmentlosses.Intangibleassetswithindefiniteusefullivesare instead tested annually for impairment.
Intangiblefixedassetswithafiniteusefullifearedepreciatedsystematically over the asset’s estimated useful life.
Intangibleassetswithfiniteandindefiniteusefullivesarereviewed for impairment requirements in cases where there are indications that a write-down may be needed. The useful life of intangible assets is reviewed at each balance sheet date and adjusted if necessary.
Capitalization of development expenditureThe expenses that arise during the development phase are cap-italized as intangible assets when, according to management’s assessment,theyarelikelytoresultinfutureeconomicbenefitsfor the group, the criteria for capitalization are met and the costs can be measured in a reliable way. Otherwise, development expenses are expensed as normal operating expenses.
The group only has acquired intangible assets.
Depreciation principlesDepreciation begins when the asset can be used, i.e. when it is in the place and in the condition required to be able to use it in the way management intends. Depreciation has not yet begun for the group’s intangible assets, which means that they are reviewed annually for impairment.
Tangible fixed assetsTangiblefixedassetsarereportedinthegroupatcostafterdeductions for accumulated depreciation and any accumulated impairment losses. The cost includes the purchase price and any costs directly attributable to the asset to bring it in place and in condition to be utilized in accordance with the purpose of the acquisition.
The carrying amount of an asset is derecognized from the balance sheet when disposing or divesting, or when no future economicbenefitsareexpectedfromuseordisposing/divestingof the asset. Gains or losses arising from the sale or disposal of an asset consist of the difference between the selling price and the asset’s carrying amount with the deduction of direct sales costs. Gains and losses are reported as other operating income/expenses.
Additional expensesAdditional expenses are added to the asset’s carrying amount onlyifitisprobablethatthefutureeconomicbenefitsassoci-ated with the asset will be leveraged by the group and that the cost of the asset can be measured reliably. All other additional expenses are reported as an expense during the period they arise. Repairs are expensed on an ongoing basis.
Depreciation principlesThe depreciable amount shall be allocated on a systematic basis over the asset’s estimated useful life. Used depreciation methods, residual values and useful lives are reviewed at the end of each year.
The estimated useful lives are:Equipment ................ 5 years
Impairment of non-financial assetsThe group’s reported assets are assessed in cases where there are indications of a decline in value of tangible or intangible as-sets, i.e. whenever events or changes in circumstances indicate that the fair value is not recoverable. Furthermore, the group’s development projects are reviewed annually for impairment requirements until they are available for use. This is done regard-less of whether there are indications of a decline in value or not.
An impairment is recognized when an asset’s carrying amount exceeds its recoverable amount. The recoverable amount is the higher of the asset’s fair value less the cost of sale on the one hand and the value in use on the other. When assessing impairment, assets are grouped at the lowest level wherethereareseparateidentifiablecashflows(cash-generat-ingunits).Whentheneedforimpairmenthasbeenidentifiedfora cash-generating unit (group of units), the impairment amount is distributed proportionally among the assets included in the cash-generating unit (group of units).
A previously recognized impairment is reversed if the recov-ery amount is deemed to exceed the fair value. Reversal does not occur with an amount that is greater than what the fair value would have been recorded to if the impairment had not been recognized in previous periods. Any reversals are reported in the income statement.

3938
Financial assets and liabilitiesAfinancialassetorfinancialliabilityisrecognizedinthebalancesheet when the group becomes a party according to the instru-ment’scontractualterms.Afinancialassetisremovedfromthebalance sheet when the rights in the agreement are realized, expire or when the group loses control over them. The same ap-pliestoapartofafinancialasset.Afinancialliabilityisremovedfrom the balance sheet when the obligation in the agreement is fulfilledorotherwiseextinguished.Thesameappliestoapartofafinancialdebt.
Acquisitionsanddivestmentsoffinancialassetsarereportedon the trade date. The trade date constitutes the day when the company undertakes to acquire or divest the asset.
Financialinstrumentsareclassifiedoninitialrecognition,including on the basis of what purpose the instrument was acquiredandmanaged.Thisclassificationdeterminesthevalua-tion of the instruments.
Classification and valuation of financial assetsTheclassificationoffinancialassetsthataredebtinstruments,is based on the group’s business model for managing the asset andthenatureoftheasset’scontractualcashflows.
Assets are classified according to:- Amortized cost-Fairvaluethroughprofitorloss,or- Fair value through other comprehensive income
Thegroup’sfinancialassetsthatareclassifiedatamortizedcost include accounts receivable, certain other receivables, and cashandcashequivalents.Financialassetsclassifiedatamor-tised cost are initially measured at fair value with the addition of transaction costs. After initial recognition, the assets are valued at amortized cost after a deduction of a loss reserve for expectedcreditlosses.Assetsclassifiedatamortizedcostareheld according to the business model to collect contractual cash flows,whicharesolelypaymentsofprincipalandinterestontheoutstanding principal amount.
Thegroup’sfinancialassetsthatareclassifiedatfairvaluethroughprofitorlossrelatetoholdingsinlistedandnon-listedshares.
Impairment of financial assetsThe group’s impairment model is based on expected credit losses, and takes into account prospective information. A loss reserve is made when there is an exposure to credit risk, usually at initial recognition for an asset or receivable.
Classification and valuation of financial liabilitiesThegroup’sfinancialliabilitiesconsistofaccountspayableandothercurrentliabilities,whichareallclassifiedatamortizedcost. Financial liabilities recognized at amortized cost are initially measured at fair value including transaction costs. After the initial recognition, they are valued according to the effective interest method.
Cash and cash equivalentsCash and cash equivalents consist of cash and balances as well as immediately available credit balances with banks and corre-spondingfinancialinstitutions.
EquityAll shares in the company are ordinary shares, which are report-
ed as equity. The share capital is reported up to its quota value and any excess part is reported as Other contributed capital. Transaction costs, directly attributable to the issue of new ordi-nary shares or options, are reported, net after tax, in equity as a deduction from the issue proceeds.
Contingent liabilitiesA contingent liability is recognised when there is a possible commitment that arises from past events and whose existence isconfirmedonlybyoneormoreuncertainfutureevents,orwhen there is a commitment that is not reported as a liability or provisionduetoitbeingunlikelythatanoutflowofresourceswillbe required.
Cash flowCash and cash equivalents consist of available cash, bank credit balances and other liquid investments with an original maturity oflessthanthreemonths,whichareexposedtoinsignificantvaluefluctuation.Incomingandoutgoingpaymentsarereportedinthecashflowstatement.Thecashflowstatementhasbeenprepared in accordance with the indirect method.
Parent company’s accounting principlesTheparentcompanyhasprepareditsfinancialreportsinaccor-dance with the Annual Accounts Act and the Swedish Financial Reporting Board recommendation RFR 2 “Accounting for Legal Entiities”.
The differences between the group’s and the parent compa-ny’s accounting principles are described below. The accounting policies set out below for the parent company have been consis-tently applied for all periods as presented in the parent compa-ny’sfinancialstatements,unlessotherwisestated.
Modified accounting principlesThe parent company has previously applied BFNAR 2012: 1 Annual Report and Group Accounting (K3) when preparing the financialreports.Asofthisyear,asaresultofthegroup’stransi-tion to IFRS, the parent company applies ÅRL and RFR 2. This pri-marily means that the disclosure requirements have increased and that the parent company shall also submit a complete set of financialstatements,i.e.anincomestatementandstatementofcomprehensive income, a balance sheet, a statement of chang-esinequityreport,acashflowstatementandnotes.
Classification and formatThe parent company’s income statement and balance sheets are prepared in accordance with the Annual Accounts Act’s scheme, while the statement of comprehensive income, state-mentofchangesinequityandthestatementofcashflowarebased on IAS 1 Presentation of Financial Statements and IAS 7, Statement of Cash Flow. The differences concerning the group’s statements, which are relevant to the parent company’s income statement and balance sheet consist mostly of the presentation of equity.
Subsidiary and associated companiesParticipations in subsidiaries and associated companies are recognized in the parent company according to the cost method less any write-downs. This means that transaction costs are included in the carrying amount of the subsidiaries.
Financial assets and liabilitiesDue to the relation between accounting and tax, the rules pertainingtothefinancialinstrumentsinIFRS9arenotapplied
in the parent company as a legal entity. Instead the parent com-pany applies accounting at cost in accordance with the Annual AccountingAct.Intheparentcompany,therefore,financialnon-currentassetsarevaluedatcostandfinancialcurrentas-sets according to the lowest value principle, with the application of impairments for expected credit losses according to IFRS 9 forassetsthataredebtinstruments.Forotherfinancialassets,impairments are based on market values.
LeasingThe parent company recognizes all leases in accordance with the regulations for operational leasing.
Group contributions and shareholder contributionsBoth received and paid group contributions are recognized as appropriations in accordance with the alternative method. Shareholder contributions are recognized directly in the receiv-er’s equity and capitalised in shares and participations of the parent company, to the extent that impairment is not required.
Note 2 Judgements and accounting estimatesThepreparationofthefinancialstatementsinaccordancewithIFRS requires company management to make judgements and accounting estimates that affect the application of the ac-counting policies and the carrying amounts of assets, liabilities, revenue and expenses. The actual outcome could deviate from these estimates.
The accounting estimates and assumptions are evaluated continuously. Changes to the accounting estimates are recog-nized in the period in which the change is made if the change only has affected the period, or in the period in which the change is made and future periods if the change affects both the current period and future periods.
Sources of uncertainty in the accounting estimatesThe sources of uncertainty in the accounting estimates, entail-ingasignificantriskthatthevalueofassetsorliabilitiesmightneed to be adjusted to a material extent during the forthcoming fiscalyear,includeimpairmenttestingofintangibleassetswithindefiniteusefullives.
Impairment testing of intangible assets Whenimpairmenttestingintangibleassets,anumberofsignifi-cant assumptions and judgements must be taken into account in order to calculate a recoverable amount. These assumptions and judgements relate to, among others, future expected selling price for the company’s products VP01 and VP02, expected market penetration, expected development-, sales and marketing costs and expected likelihood that the products will pass the remaining stages of development. The assumptions are based on industry- andmarket-specificdataandareproducedbythemanagementand reviewed by the Board. For more information about impairment testing , see Note 13.
Other judgments and accounting estimates
Capitalization of intangible assetsDevelopmentexpendituresarecapitalizedwhentheyfulfillthecriteria set out in IAS 38 and are expected to represent material amounts for the development initiative as a whole. Development expenditures are otherwise expensed as normal operating
costs. The most important criteria for capitalization are that the end product of the development work has a demonstrable future earningcapacityorcostsavingsandcashflow,andthattherearetechnicalandfinancialpreconditionstofinishthedevelop-ment work when it begins. The group only has acquired intangible assets. Since regulatory approv-al has not yet been obtained, no costs have been capitalized. Incentive programsThe group has two share-based long term incentive programs. The applicable accounting policies are described on page 36. The cost for the remuneration that is recognized in a period is dependent on the original valuation that was made on the contract date of with the holder of the option/share award, the number of months of service required by the participant for be-coming entitled to options (accruals are made over this period), the number of options that are expected to be vested by the participant under the terms of the programs and a continuous reassessmentofthevalueofthetaxbenefitsfortheparticipantsin the incentive programs (for determining provisions for social security contributions). Those estimates which affect the cost in a period and the corresponding increase in equity mainly refer to inputs for the valuation of the options. The models used for this purpose are the Black & Scholes model and a Monte Carlo simulation.Significantassumptionsinthesevaluationsaredescribed in Note 7.
Tax loss carryforwardsThe group’s tax loss carryforwards have not been measured and are not recognized as a deferred tax asset. These tax loss carryforwards will be measured valued only when the group has establishedalevelofearningswhichmanagementwithconfi-denceestimatewillleadtotaxableprofits.
Vicore acquired INIM Pharma in July 2018 in exchange for newly issued shares worth approximately 71 MSEK. The assets of INIM Pharma consisted of a registered share capital of 50 KSEK, cash in the amount of 20 MSEK IP (patent) valued at ap-prox. 50 MSEK. In August, 2018, a patent application was wrong-fully transferred from INIM to Vicore Pharma for a purchase price of 1 SEK. Vicore has now corrected this by reversing the transfer which potentially could result in tax consequences and intends to, in connection with the submission of the declaration totheSwedishTaxAgency,fileanopenclaim.IftheSwedishTaxAgency would not approve the reversal of the transfer from a tax perspective, the company may lose a part of its accumulated tax losses carryforward up to and including 2017.
Note 3 Operating segments and other operation revenueVicore does not divide its business into different operating segments. Instead the group’s entire business is treated as one operatingsegment.Thisreflectsthecompany’sinternalorgan-isation and reporting system. Vicore’s chief operating decision maker is the CEO. Currently, Vicore is operating only in Sweden, where the group’s tangibleandintangiblefixedassetsareattributed.Salesofservices to I-Tech amount to 100% of external invoicing. Man-agement fee during 2018 amounted to 493 KSEK (787 KSEK, 735 KSEK). The agreement was terminated in 2018. Operating income amounts to 633 KSEK (1,029 KSEK, 912 KSEK) and refers mainly to management fee to I-Tech as well as currency changes in supplier payments.

4140
Note 4 Audit fees
Ernst & Young AB 2018 2017 2016
Audit fees 243 177 226
Other auditing related services 70 7 0
Tax consultancy services 0 0 0Other services 187 5 0
500 189 226
Future minimum lease payments 2018 2017 2016
No later than 1 year 191 385 68
Between 1 and 5 years 14 367 135Later than 5 years 0 0 0
205 752 203
2018 2017 2016
No. of employees
of which men/
women
No. of employees
of which men/
women
No. of employees
of which men/
women
Parent company 3 67%/33% 2 50%/50% 2 50%/50%Subsidiaries 3 0%/100% 3 0%/100% 1 0%/100%
Group total 6 33%/67% 5 20%/80% 3 33%/67%
Note 5 Leases
Operating lesseeOperatingleasingcostsfortheyearconcerningoperatingleasesmainlycompriserentforpremises,officeequipmentandcarsandamounts to 203 KSEK (419 KSEK, 360 KSEK).
Future payment commitments as of December 31 for operating leases are divided up as follows:
2018 2017 2016
Group
The Board and other senior executives
Salaries and other remuneration 7,097 2,081 1,267
Social security contributions 2,330 685 407
Pension costs 821 490 224
10,248 3,256 1,898Group
Other employees
Salaries and other remuneration 1,484 2,315 1,248
Social security contributions 517 800 420Pension costs 207 299 114
2,208 3,414 1,782Parent company
The Board and other senior executives
Salaries and other remuneration 5,841 2,081 1,267
Social security contributions 1,944 685 407Pension costs 592 490 224
8,377 3,256 1,898Parent company
Other employees
Salaries and other remuneration 525 510 473
Social security contributions 177 172 159Pension costs 50 48 43
752 730 675
Senior executives include members of the Board, the CEO and other senior executives.
Salaries and other remunerationCosts related to the long term incentive programs amounts to 710 KSEK of the payroll expenses and 278 KSEK of the social security contributions.
PensionsAllpensionplansinthegrouparedefinedcontributionplans.Thegroup’stotalcostfordefinedcontributionplansamountedto1,009KSEK (790 KSEK, 354 KSEK).
Average number of employees
Personnel costs for the Board, senior executives and other employees
Note 6 Employees and personnel costs
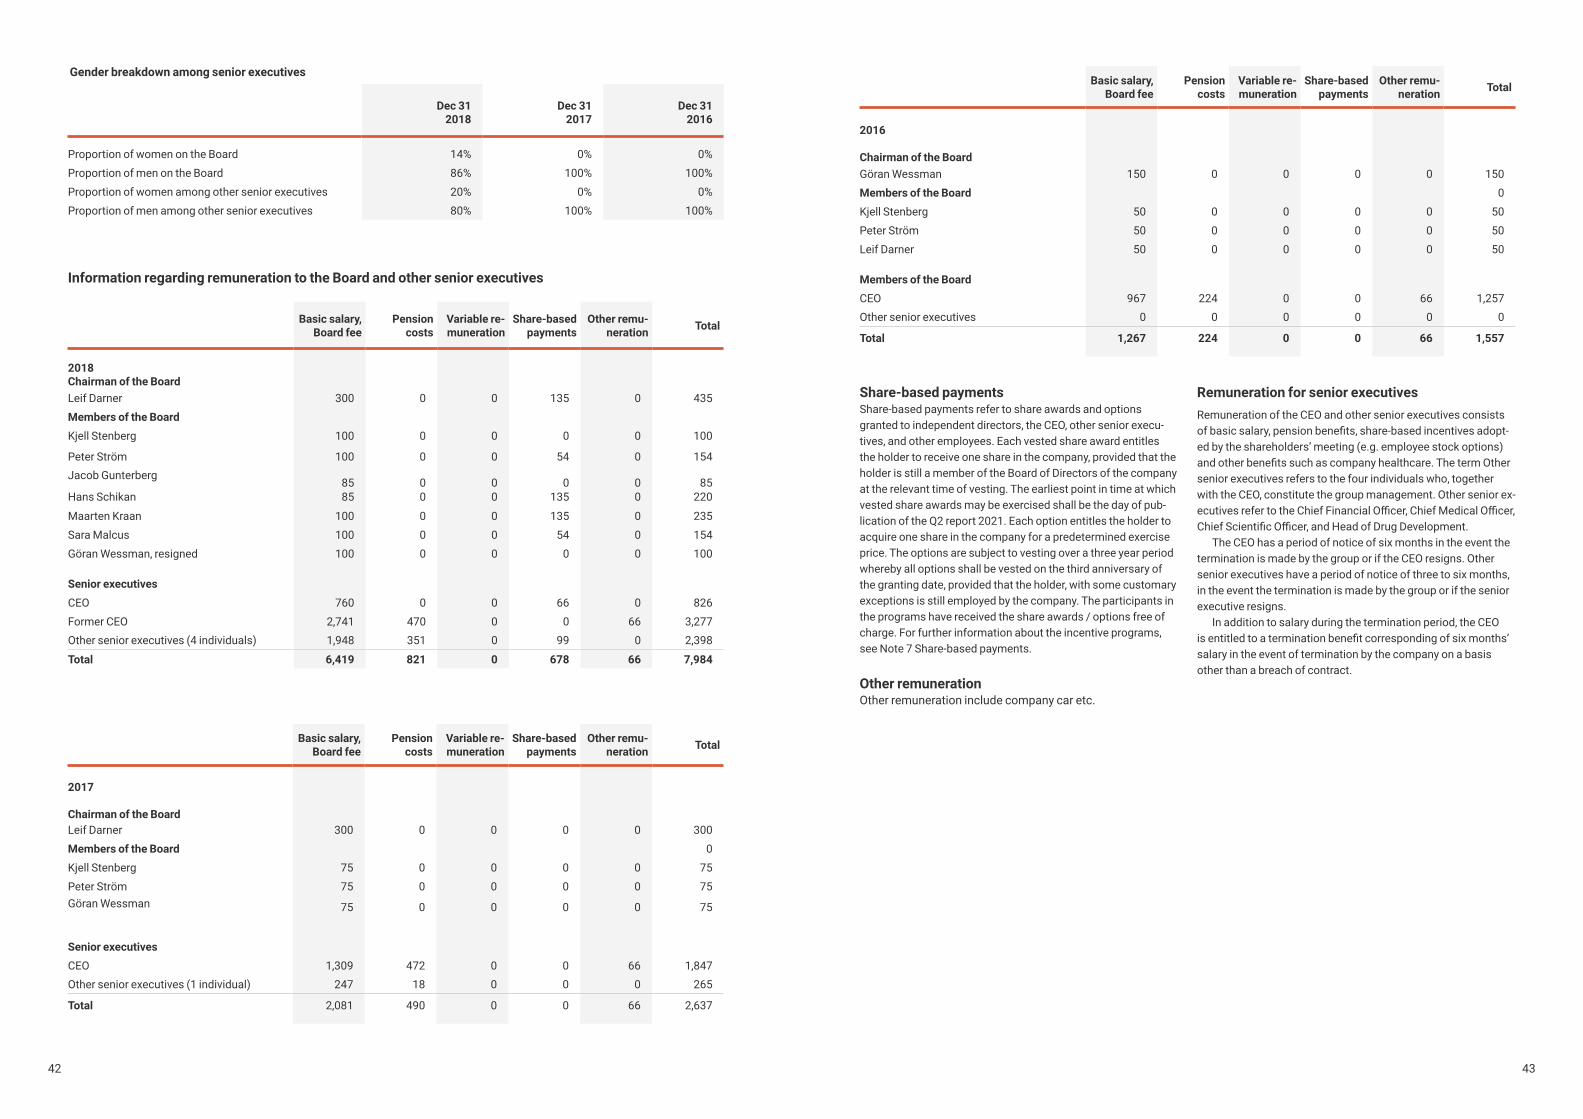
4342
Dec 31 2018
Dec 31 2017
Dec 31 2016
Proportion of women on the Board 14% 0% 0%
Proportion of men on the Board 86% 100% 100%
Proportion of women among other senior executives 20% 0% 0%
Proportion of men among other senior executives 80% 100% 100%
Basic salary, Board fee
Pension costs
Variable re-muneration
Share-based payments
Other remu-neration Total
2018 Chairman of the BoardLeif Darner 300 0 0 135 0 435
Members of the Board
Kjell Stenberg 100 0 0 0 0 100
Peter Ström 100 0 0 54 0 154 Jacob Gunterberg
85 0 0 0 0 85 Hans Schikan 85 0 0 135 0 220
Maarten Kraan 100 0 0 135 0 235
Sara Malcus 100 0 0 54 0 154
Göran Wessman, resigned 100 0 0 0 0 100
Senior executives
CEO 760 0 0 66 0 826
Former CEO 2,741 470 0 0 66 3,277 Other senior executives (4 individuals) 1,948 351 0 99 0 2,398
Total 6,419 821 0 678 66 7,984
Basic salary, Board fee
Pension costs
Variable re-muneration
Share-based payments
Other remu-neration Total
2017
Chairman of the BoardLeif Darner 300 0 0 0 0 300
Members of the Board 0
Kjell Stenberg 75 0 0 0 0 75
Peter Ström 75 0 0 0 0 75 Göran Wessman 75 0 0 0 0 75
Senior executives
CEO 1,309 472 0 0 66 1,847Other senior executives (1 individual) 247 18 0 0 0 265
Total 2,081 490 0 0 66 2,637
Basic salary, Board fee
Pension costs
Variable re-muneration
Share-based payments
Other remu-neration Total
2016
Chairman of the BoardGöran Wessman 150 0 0 0 0 150
Members of the Board 0
Kjell Stenberg 50 0 0 0 0 50
Peter Ström 50 0 0 0 0 50
Leif Darner 50 0 0 0 0 50
Members of the Board
CEO 967 224 0 0 66 1,257 Other senior executives 0 0 0 0 0 0
Total 1,267 224 0 0 66 1,557
Share-based paymentsShare-based payments refer to share awards and options granted to independent directors, the CEO, other senior execu-tives, and other employees. Each vested share award entitles the holder to receive one share in the company, provided that the holder is still a member of the Board of Directors of the company at the relevant time of vesting. The earliest point in time at which vested share awards may be exercised shall be the day of pub-lication of the Q2 report 2021. Each option entitles the holder to acquire one share in the company for a predetermined exercise price. The options are subject to vesting over a three year period whereby all options shall be vested on the third anniversary of the granting date, provided that the holder, with some customary exceptions is still employed by the company. The participants in the programs have received the share awards / options free of charge. For further information about the incentive programs, see Note 7 Share-based payments.
Remuneration for senior executivesRemuneration of the CEO and other senior executives consists ofbasicsalary,pensionbenefits,share-basedincentivesadopt-ed by the shareholders’ meeting (e.g. employee stock options) andotherbenefitssuchascompanyhealthcare.ThetermOthersenior executives refers to the four individuals who, together with the CEO, constitute the group management. Other senior ex-ecutivesrefertotheChiefFinancialOfficer,ChiefMedicalOfficer,ChiefScientificOfficer,andHeadofDrugDevelopment.
The CEO has a period of notice of six months in the event the termination is made by the group or if the CEO resigns. Other senior executives have a period of notice of three to six months, in the event the termination is made by the group or if the senior executive resigns.
In addition to salary during the termination period, the CEO isentitledtoaterminationbenefitcorrespondingofsixmonths’salary in the event of termination by the company on a basis other than a breach of contract.
Other remuneration Other remuneration include company car etc.
Gender breakdown among senior executives
Information regarding remuneration to the Board and other senior executives

4544
2018
Issued share awards (Board LTIP 2018)
Average exercise price per share award Number of share awards
At January 1, 2018 0 0
Granted during the year 0 475,000
At December 31, 2018 0 475,000
Vested and exercised at December 31, 2018 0 0
No share awards have been exercised or forfeited during the year. No share awards have expired during the years presented.
Note 7 Share-based paymentsThe purpose of share-based incentive programs is to pro-
mote the company’s long-term interests by motivating and re-warding the company’s senior management and other co-work-ers in line with the interests of the shareholders. Vicore currently has three active programs that include the management team, certain board members, key employees and key consultants.
Long term incentive program 2016On January 8, 2016, Vicore Pharma Holding AB issued
570,000 warrants to key employees and researchers. Each warrant entitles the holder to subscribe for one new share in Vicore Pharma at an exercise price of SEK 12. The exercise date is January 3, 2020. The warrants were sold key employees and researchers on market terms at a price established on the basis of an estimated market value of the warrants using the Black & Scholes model. The value has been set at SEK 0.56 per option based on a share price of SEK 7.025 with a future annual increase of approximately 14 percent. The increase in the com-pany’s share capital in full exercise of the warrants will amount to SEK 285,000, which corresponds to a dilution of 1.3 percent of the total number of shares and of the total number of votes in the company.
Long term incentive programs 2018The Extra General Meeting in Vicore held on August 13, 2018,
resolved, in accordance with the Board of Directors’ propos-al, to adopt a long-term incentive program for certain of the company’s senior management and key persons (“Co-worker LTIP 2018”) and for certain members of the Board of Directors (“Board LTIP 2018”) in Vicore. A maximum of 2,000,000 options (Co-worker LTIP 2018) or 475,000 share awards (Board LTIP 2018) may be allotted to participants under the program. Of these, a total of 300,000 options and 475,000 share awards have been allocated. The increase in the company’s share capital in full utilization of both incentive programs amounts to a maximum of approximately SEK 1,237,500, corresponding to a dilution of 5.5 percent of the total number of shares. The options and share awards have been granted to the participants of the incentive programs free of charge and the settlement is made with equity instruments.
Board LTIP 2018Board LTIP 2018 is a program under which the participants
will be granted, free of charge, share awards subject to perfor-mance vesting (“share awards”) that entitle to shares in the company to be calculated in accordance with the principles stipulated below, however a maximum of 475,000 shares.
Board LTIP 2018 is intended for members of the Board of Directors of the company independent from the main owners. The main owners believe that an equity-based incentive program is a central part of an attractive and competitive remuneration package in order to attract, retain and motivate internationally competent members of the Board of Directors of the company, and to focus the participants on delivering exceptional perfor-mance which contributes to value creation for all shareholders.
The share awards are subject to gradual vesting gradually over approximately three years, corresponding to three terms until the day of publication of the Q2 report 2021. The share awards shall be vested by 1/3 at the end of each term, provided that the participant is still a member of the Board of Directors of the company on said date. In addition to the vesting conditions just stated, the share awards are subject to performance vesting based on the development of the company’s share price, in accordance with the vesting conditions below.
The share awards are subject to performance vesting based on the development of the company’s share price over the period from the date of 13 August, 2018, up to and including the date of the annual general meeting 2021. The development of the share price will be measured based on the volume weighted average price of the share price will be measured based on the volume weighted average price of the company’s share price for the 30 trading days immediately following after 17 August, 2018, and the 30 trading days immediately preceding the date of the publication of the Q2 report 2021. In the event the price of the company’s share has thereby increased by more than 150 percent, 100 percent of the share awards shall vest, and should the share price have increased by 50 percent, 25 percent of such share awards shall vest. In the event of an increase of the share price between 50 and 150 percent, vesting of the share awards will occur linearly. Should the increase of the share price be less than 50 percent, no vesting will occur.
The valuation of the share awards is based on a Monte Carlo simulation in accordance with accepted valuation theory. Volatil-ity has been based on the expected volatility of the Vicore share and other listed companies with similar operations. The risk-free interest rate has been derived through an interpolation between a 2-year and 5-year government bond, respectively. The fair value of the share awards at the time of allocation amounts to SEK 4.70 per share award. In order to calculate the value of the share awards in relation to the current performance conditions, a starting value is used that corresponds to the volume-weighted averagepricepaidfortheVicoreshareoverafixedperiod,whichin this case corresponds to the value of the underlying share at the time of valuation.
Co-worker LTIP 2018Co-worker LTIP 2018 is an incentive program intended for
members of senior management and key persons in the compa-ny. According to the program participants will be granted, free of charge, options subject to three year vesting that entitle to acquire a maximum of 2,000,000 shares in the company in total, in accordance with the terms stipulated below.
The Board of Directors of the company believes that an equity-based incentive program is a central part of an attractive and competitive remuneration package in order to attract, retain and motivate competent members of senior management and key persons in the company, and to focus the participants on delivering exceptional performance which contributes to value creation for all shareholders.
Co-worker LTIP 2018 is an incentive program under which the
Average share price 17.70 SEK
Excercise price 25.26 SEK
Expected volatility 45.00 %
Option life 4 years
Expected dividends 0 SEK
Risk-free interest rate -0.05 %
Summary of issued share awards and options
No options have been exercised or forfeited during the year. No options have expired during the years presented. There were no share-basedpaymentsbefore2018,hencenocomparativefigures.
Issued options (Co-worker LTIP 2018) Average exercise price per option Number of options
At January 1, 2018 0 0
Granted during the year 25.26 300,000
At December 31, 2018 22.02 300,000
Vested and exercised at December 31, 2018 0 0
participants will be granted options free of charge. The Board of Directors shall resolve upon the allocation of options annually or at such time as the Board of Directors can be considered as relevant to such decision (with each respective date of grant-ing being a “granting date”). Each option entitles the holder to acquire one share in the company for a predetermined exercise price. The exercise price per share shall correspond to 150 percent of the volume weighted average price of the company’s shareforthefivetradingdaysprecedingthegrantingdate.Theoptions are subject to vesting over a three year period where-by all options shall be vested on the third anniversary of the granting date, provided that the holder, with some customary exceptions is still employed by the company. The latest point in time at which vested options may be exercised shall be the fourth anniversary of the granting date.
The options are valued according to the so-called Black & Scholes model, which means that the value of the options de¬pends, among other things, on the value of the underlying share, the options’s issue price and life, risk-free interest rate and volatility. The volatility has been based on the expected volatility of the Vicore share and other listed companies with similar op-erations. The risk-free interest rate was equated with the interest rate for Swedish government bonds. The fair value of the options at the time of allocation amounts to SEK 4.20 per option. The following inputs have been used in the model:

4746
Note 8 Financial income
2018 2017 2016
Change in value for long-term investments 3,684 4,414 0Total 3,684 4,414 0
Total reported in net financial items 3,684 4,414 0
Note 9 Financial expenses
2018 2017 2016
Change in value for long-term investments 0 0 -4,414
Total 0 0 -4,414
Financial liabilities measured at amortized costInterestexpensesotherfinancialliabilities -352 -62 -3Total interest expenses calculated using the effective interest method -352 -62 -3
Total disclosed in net financial income/expenses -352 -62 -4,417
2018 2017 2016
Current tax 0 0 0
Recognized tax 0 0 0
Reconciliation of effective tax rates 2018 2017 2016Loss before tax -21,681 -24,231 -24,544
Tax according to applicable tax rate for parent company (22%) 4,770 5,331 5,400
Tax relating to non-recognized deferred tax assets -36,052 -18,156 -10,713
Non-deductable expenses -101 -37 -994
Non-taxableeconomicbenefits 4,456 881 0
Tax brought forward from earlier years 18,156 10,713 6,307Tax attributable to items in shareholder’s equity 8,771 1,268 0
Recognized tax 0 0 0
Effective tax rate 0% 0% 0%
Note 10 Tax on profit for the year
The group has no tax items that are recognized in other comprehensive income, but there are issue costs as well as rever-sal of previous capitalized development expenses booked directly against shareholder’s equity.
Information about deferred tax assets and tax liabilities Inthetablebelow,thetaxeffectofthetemporarydifferencesisspecified:
Tax loss carryforwards for which deferred tax assets have not been recognized in the balance sheet amounted to 163,875 KSEK (53,258 KSEK, 35,216 KSEK). These carryforwards have no time limit. Deferred tax assets have not been recognized fortheseitems,asitisunlikelythatthegroupinaforeseeablefuturewillutilizethemtooffsetfuturetaxableprofits.Forfurther information about tax loss carryforwards, see Note 2 on page 39.
Deferred tax liability Dec 31 2018
Dec 31 2017
Dec 31 2016
Jan 1 2016
Intangible assets 1,978 1,978 1,978 1,978
Carrying amount 1,978 1,978 1,978 1,978
Financial assets measured at fair value through profit and loss
Financial assets measured at fair value through profit and loss
Program 2018 options (Co-worker LTIP 2018)
Number outstanding at Jan 1, 2018 Granted/forfeited Number outstanding
at Dec 31, 2018
CEO Carl-Johan Dalsgaard 0 100,000 100,000
Other senior executives 0 150,000 150,000Other employees 0 50,000 50,000
Program 2018 share awards (Board LTIP 2018)
Number outstanding at Jan 1, 2018 Granted/forfeited Number outstanding
at Dec 31, 2018
Chairman of the Board Leif Darner 0 125,000 125,000
Member of the Board Hans Schikan 0 125,000 125,000Member of the Board Maarten Kraan 0 125,000 125,000Member of the Board Peter Ström 0 50,000 50,000Member of the Board Sara Malcus 0 50,000 50,000
The costs for social security contributions related to share-based incentive programs varies from quarter to quarter due to the changeintheunderlyingshareprice.Relatedprovisionsarereportedasnon-currentliabilities.TotalIFRS2-classifiedpayrollexpens-es for the incentive programs for the entire duration of the programs amount to 3,493 KSEK. The total costs for the share-based in-centive programs during 2018 amounted to 1.0 MSEK (0) out of which 0.3 MSEK (0) were provisions for social security contributions and0.7MSEK(0)wereIFRS2classifiedpayrollexpenses.Thesecostshavehadnocashimpact.
Program per year Date of expiration Exercise price
Share awards / options at
December 31, 2018
Share awards / options at
December 31, 2017
Program share awards (Board LTIP 2018) September, 2021 0 475,000 0
Program options (Co-worker LTIP 2018)
September 27, 2022 25.26 300,000 0
Outstanding share awards and options at year-end

4948
2018 2017 2016
Earnings per share before and after dilution
Profitfortheyearattributabletoshareholdersof the parent company -21,680,676 -24,231,433 -24,543,348
Average number of ordinary shares, average 22,882,323 16,989,771 13,833,859
Earnings per share before and after dilution -0.95 -1.43 -1.77
Diluted earnings per share is calculated by adjusting the weighted average number of ordinary shares outstanding for the dilution effect from all potential ordinary shares. These potential ordinary shares are attributable to the options and share awards allocated to senior executives, key personnel and certain board members during 2016 and 2018. For further information, see Note 7. If there is a loss for the year, the options are not treated as dilutive. Neither are the options considered dilutive if the exer-
The average number of outstanding shares has been adjusted for bonus shares in new stock issued targeted towards existing shareholders.
Note 11 Earnings per share
cise rate, including the addition of the value of remaining future services to be recognized during the vesting period, exceeds the average trading price for the period. There is no dilution effect for potential ordinary shares as there was a loss for the year, as demonstrated above.
For more information about the changes of the number of outstanding shares, see Note 21 Shareholders’ equity.
Dec 312018
Dec 31 2017
Dec 312016
Opening cost 16,637 16,637 16,637
Additions for the year 52 555 0 0
Closing accumulated cost 69,192 16,637 16,637
Closing carrying amount 69,192 16,637 16,637
Note 12 Patents, licenses and similar rights
Impairment testing
To test the value of intangible assets, Vicore uses a probabil-ity-adjusteddiscountedcashflowmodelbasedonfairvalue.The valuation of ongoing development projects is determined by calculatingthepresentvalueoftheestimatedfuturecashflowsand adjusting these in order to take the development risk into ac-count.Thevaluationconsidersthecashflowsovertheprojects’estimated remaining useful life, but does not involve calculation of any residual value thereafter. The methodology used is an accepted one for impairment testing within the biopharmaceu-tical industry. The measurement is attributed to Level 3 in the fair value hierarchy and comprises the material assumptions specifiedbelow:
• Revenue- and cost forecasts for the development project, which for VP01 stretches over 7 years for the US and 10 years for the EU and Japan. For VP02, the corresponding period stretches over 20 years.
• Revenue is calculated using estimations based on available data of different types considered indicators, e.g. forecasts of total market size, growth, anticipated market share of the product, competition from rival products and assessed price level. Market, growth, anticipated market share of the product and assessed price level is derived from secondary sources, accepted industry assumptions and assumptions made by Vicore.
• Costs comprise development expenditures as well as direct and indirect project costs based on Vicore’s business plan. Operating margins are derived from secondary sources,
accepted industry assumptions and assumptions made by Vicore.
• Thepresentvalueofthecashflowsiscalculatedandadjustedtoreflecttheprobabilityofsuccessfortheproject.This probability is based on accepted assumptions regard-ing the possibility for a corresponding product to go to market from the current development stage. The probability of success for VP01 is estimated at 16.7% and for VP02 at 7.2%.
• The weighted average cost of capital has been estimated at 15%.
The most critical assumptions mainly consist of assumptions made about market size, market share and price level. As with many pharmaceutical development projects, the results of the development work may be binary in the sense that the project can either be developed according to plan or must be cancelled altogether. Where appropriate, the valuation has been calibrated against completed share issues with external investors. No rea-sonable changes in the assumptions and estimates made would lead to an impairment loss.
Amortization begins when the asset is available for use, i.e. when it is in the place and condition required to be used in the way intended by the company’s management. Amortization has not yet begun on the group’s intangible assets.
The impairment assessments for the years presented above have not demonstrated a need for any impairments. No reason-able changes in the assumptions and estimates made would lead to an impairment.
Dec 31 2018
Dec 31 2017
Dec 31 2016
Opening cost 93 60 60
Additions for the year 0 33 0
Closing accumulated cost 93 93 60
Opening depreciations -65 -58 -52Depreciations for the year -7 -7 -6
Closing accumulated depreciations -72 -65 -58
Closing carrying amount 21 28 2
Note 13 Equipment

5150
Dec 312018
Dec 312017
Dec 312016
Opening cost 0 16,196 20,110
Reclassification 25,973 -23,155 0
Acquisitions 0 2,545 500
Dividend of holding in I-Tech -40,663 0 0Changeinvalueinprofit 20,257 4,414 -4,414
Closing carrying amount 5,567 0 16,196
Note 15 Long-term investments
Long-term investments comprise the investment in I-Tech, which duringthepastthreeyearshasshiftedfrombeingafinancialasset(2016),tobeingre-classifiedasanassociatedcompany(2017),andthenre-classifiedasafinancialasset(2018).
In December 2017, Vicore increased its investment in I-Tech from 16.5% to 21% via a new share issue. In connection with this, theinvestmentwasreclassifiedfromafinancialassettoanas-sociated company. In February 2018, Vicore further expanded its holding in I-Tech to 26.5% through the acquisition of shares from an existing shareholder in I-Tech. In March 2018, I-Tech issued shares to a new shareholder, which subsequently decreased Vicore’s holding to 21.2%. In May 2018, I-Tech carried out a new
share issue in connection with the listing on Nasdaq First North. At the end of the second quarter of 2018, Vicore owned 17.8% ofthesharesinI-Tech,whichsubsequentlywasre-classifiedasafinancialasset.InJuly2018,Vicoreannouncedthatithadentered into an agreement to acquire INIM Pharma through an issue in kind conditional to an approval at an Extraordinary General Meeting. In conjunction with the Extraordinary General Meeting in August 2018, it was also resolved to distribute the majority of the investment in I-Tech to Vicore´s shareholders. After the distribution Vicore holds 91,829 shares in I-Tech, which areclassifiedasafinancialasset.
Note 16 Financial assets and liabilities
Financial assets/ liabilities measured at fair value through
profit and loss
Financial assets/ liabilities measured
at amortized cost
Total carrying amount
Financial assets
Other long-term investments 5,567 0 5,567
Trade receivables 0 4 4
Other current receivables 0 200 200Cash and cash equivalents 0 224,688 224,688
5,567 224,892 230,459
Financial liablilitiesTrade payables 0 2,384 2,384Accrued expenses 0 7,373 7,373
0 9,757 9,757
ThemaximumcreditriskofthefinancialassetsconsistsofthenetamountsofthereportedvaluesinthetableaboveThegrouphasnotreceivedanypledgedassetsforthefinancialnetassets.
Note 14 Participations in associated companies
Financial assets and liabilities at December 31, 2018
Company No. of shares
Propor-tion of equity
Share of voting power
Dec 31 2018
Dec 312017
Dec 312016
Jan 12016
I-Tech 0 22,745 0 0
Corp.reg.no556585-9682
Domicile of the entity Mölndal
I-TechDec 31
2018Dec 31
2017Dec 31
2016
Opening carrying amount 22,745 0 0
Shareinprofits 0 -410 0
Acquisitions for the year 3,228 0 0Reclassifications -25,973 23,155 0Closing carrying amount, proportion of equity 0 22,745 0
Holding in I-Tech Dec 31 2017
Fixed assets 35,148
Current assets 24,767
Non-current liabilities 13,264Current liabilities 9,696Net assets 36,955
Results before depreciation -6,190
Depreciation and amortizations -1,258
Financial income 0
Financial expenses -970
Tax 0
Profit (loss) for the year -8,418
Other comprehensive income 0
Total comprehensive income -8,418
Reconciliation carrying amounts
Opening net assets 34,883
Profitfortheyear -8,418
Total comprehensive income 0
New share issue 10,490
Closing net assets 36,955
Share (%) attributable to the group 21.23%
Share (KSEK) attributable to the group 7,845
Goodwill 14,900
Carrying amount 22,745
During the second quarter of 2018, the investment in I-Tech were reclassifiedfromassociatedcompaniestofinancialassets.ThefinancialassetwasrevaluedtomarketvalueatthestockmarketlistingforI-Tech.Shareofprofitsinassociatedcompaniesamounted to 16.6 MSEK during 2018.
The investment in I-Tech has over the three most recent years shiftedfrombeingafinancialasset(2016),tobeingreclassifiedasanassociatedcompany(2017),andthenreclassifiedasafinancialasset(2018).
Carrying amount

5352
Financial assets/ liabilities measured at fair value through
profit and loss
Financial assets/ liabilities measured
at amortized costTotal carrying amount
Financial assets
Other long-term investments 0 22,745 22,745
Trade receivables 0 206 206
Other current receivables 0 43 43Cash and cash equivalents 0 24,019 24,019
0 47,013 47,013
Financial liablilitiesTrade payables 0 2,780 2,780Accrued expenses 0 689 689
0 3,469 3,469
Themaximumcreditriskofthefinancialassetsconsistsofthenetamountsofthereportedvaluesinthetableabove.Thegrouphasnotreceivedanypledgedassetsforthefinancialnetassets.
Financial assets/ liabilities measured at fair value through
profit and loss
Financial assets/ liabilities measured
at amortized costTotal carrying amount
Financial assets
Other long-term investments 16,196 0 16,196
Trade receivables 0 122 122
Accrued income 0 13 13Cash and cash equivalents 0 4,266 4,266
16,196 4,401 20,597
Financial liablilitiesTrade payables 0 2,184 2,184Accrued expenses 0 737 737
0 2,921 2,921
Themaximumcreditriskofthefinancialassetsconsistsofthenetamountsofthereportedvaluesinthetableabove.Thegrouphasnotreceivedanypledgedassetsforthefinancialnetassets.
Financial assets/ liabilities measuredat fair value through
profit and loss
Financial assets/ liabilities measured
at amortized costTotal carrying amount
Financial assets
Otherlong-terminvestmentsheldasfixedassets 0 20,110 20,110
Trade receivables 0 146 146
Other current receivables 0 13 13Cash and cash equivalents 0 25,175 25,175
0 45,444 45,444
Financial liablilitiesTrade payables 0 2,312 2,312
Other current liabilities 0 1,542 1,542Accrued expenses 0 235 235
0 4,089 4,089
Themaximumcreditriskofthefinancialassetsconsistsofthenetamountsofthereportedvaluesinthetableabove.Thegrouphasnotreceivedanypledgedassetsforthefinancialnetassets.
Fair value measurement
IFRS 13, Fair Value Measurement contains a valuation hierarchy regarding inputs to the measurements. This measurement hier-archy is divided into three levels, which comprise:
Level 1 – Quoted prices (unadjusted) in active markets for iden-tical assets or liabilities
Level 2 – Inputs other than quoted prices included within level 1 that are observable for the asset or liability, either directly (that is, as price quotations) or indirectly (that is, derived from price quotations)
Level 3 – Inputs for the asset or liability that are not based on observable market data (that is, non-observable inputs)
Other financial assets and liabilitiesFor trade receivables, other current receivables and liabilities, cash and cash equivalents, trade payables, and accrued ex-penses and income with a short maturity, the carrying amount is considered a reasonable estimate of the fair value.
Change in value for investements in unlisted shares 2016
Opening carrying amount 20,610Changeinvalueinprofitandloss -4,414
Closing carrying amount 16,196
Other long-term investments
Investmentsinfinancialfixedassetsaremeasuredatfairvaluewithchangesinvalueinprofitandloss.Investmentsinlistedshares are measured at fair value according to Level 1 in the val-uation hierarchy. Investments in unlisted shares have been mea-sured according to Level 3 in the valuation hierarchy based on non-observable inputs. Listed investments are measured on the basis of their share price on the reporting. Investments in unlist-edsharesaremeasuredonthelastprivateroundoffinancing.Significantincreases(decreases)inmeasurementsinprivatefinancingroundswouldresultinasignificantlyhigher(lower)fairvalue measurement. All measurements in Level 3 are based on assumptions and judgments that management consider to be reasonable based on the circumstances prevailing at the time. Changes in assumptions may result in adjustments to reported values and the actual outcome may differ from the estimates and judgments that were made. Change in value for investments in unlisted shares in Level 3 is presented below.
Financial assets and liabilities at December 31, 2017
Financial assets and liabilities at December 31, 2016
Financial assets and liabilities at January 1, 2016

5554
Note 17 Financial risksThrough its operations, Vicore is exposed to various types of financialrisk;creditrisks,marketrisks(foreignexchangerisk,in-terest rate risk and other price risks) and liquidity risks (including refinancingrisk).Thegroup’soverallriskmanagementobjectivefocusesontheunpredictabilityoffinancialmarketsandstrivesto minimize potentially unfavorable consequences for the group’sfinancialpositionandperformance.
The Board of Directors has overall responsibility for man-agingfinancialrisksandinternalcontrolsrelatedtofinancialtransactions. Financial risks and transactions are managed centrally by the parent company through the group’s CFO and CEO.Theoverallobjectiveintermsoffinancialrisksis:topro-videcost-effectivefinancingandcashmanagement,toensurethat all payment commitments are processed at the right time, toensurethatallfinancialtransactionsareorganizedinawaythatsupportsthegroupinachievingthefinancialkeyratiosandensure that risk exposures relating to credit risk, market risks and liquidity risk are reduced to an acceptable level.
The Board of Directors establishes written principles both fortheoverallriskmanagementandforspecificareassuchas
creditrisks,foreignexchangerisks,interestraterisks,refinanc-ing risks, liquidity risks and the use of derivative instruments and the handling of excess liquidity. The group does not currently use derivatives, but allows hedging of currency in certain situa-tions.
Credit risk Creditriskistheriskthatthegroup’scounterpartyofafinan-cialinstrumentcannotfulfillitsobligationandtherebycausesafinanciallossforthegroup.Giventhenatureofthegroup’sbusiness, with no foreseen revenues, credit risk is not a material issue at this stage of the company’s development. However, some credit risk exists in the group’s cash management, which is managed through Vicore’s treasury policy.
Credit risk in trade receivables Of the group’s sale of services, 100% comprises of management fees to I-Tech. Terms of payment amounts to 15-30 days de-pendent on counterparty. The age analysis for overdue, but not impaired trade receivables at reporting date is presented below.
Dec 312018
Dec 312017
Dec 312016
Jan 12016
Non-overdue trade receivables 4 206 122 146
Carrying amount 4 206 122 146
Thegrouphaschosentoapplythesimplifiedmethodforreport-ing expected credit losses on trade receivables. This means that expected credit losses are reserved for the remaining maturity, which is expected to be less than one year for all trade receiv-ables. The group reserves for expected credit losses based on historical credit losses and forward-looking information. The group’s customers are a homogeneous group with a similar risk profile,whichiswhythecreditriskisinitiallyassessedcollec-tively for all customers. Any substantial individual receivables are assessed per counterparty. Impairment losses of trade receivables are recognised when there is no longer any expecta-tion of receiving payment and when active measures to obtain payment have been terminated.
Based on the group’s assessments according to the above method, taking into account other known information and forward-looking factors, expected credit losses for trade receiv-ablesarenotdeemedtobesignificantandnoprovisionhastherefore been recognised.
Financial credit riskThefinancialassetsthatarecoveredbyprovisionsforexpectedcredit losses according to the general method consist of cash and cash equivalents. Vicore applies a rating-based method in combination with other known information and forward-looking factors for assessing expected credit losses. The group has defineddefaultaswhenpaymentoftheclaimis90daysoverdueor more, or if other factors indicate a suspension of payments. Significantincreaseincreditriskhasnotbeenconsideredtoexist for any receivable or asset on the reporting date. Such assessment is based on whether payment is 30 days overdue or more,orifsignificantdeteriorationoftheratingoccurs,entailinga rating below investment grade. In cases where the amounts arenotdeemedtobeinsignificant,aprovisionforexpectedcred-itlossesisalsorecognizedforthesefinancialinstruments.
The assessment has been made that there has been no significantincreaseincreditriskforanyofthegroup’sfinancialassets. There counterparties do not have credit ratings, except for cash and cash equivalents where the counterparties have credit risk ratings of AA-.
The credit quality of trade receivables that are not overdue or impaired is deemed to be good.
Market risksMarketriskistheriskthatthefairvalueorfuturecashflowsofafinancialinstrumentwillfluctuateduetochangesinmarketpric-es. Market risks are according to IFRS divided into three types: foreign exchange risk, interest rate risk and other price risks. Foreign exchange risk is the market risk with the greatest impact onthegroupasthefinancingreceivedshallcoverforresearchand development costs mainly in foreign currencies.
The group does not currently have any loans that expose it to interest rate risks. Interest risk may occur in short term cash management, and is regulated by maximum maturities.
The group is partly exposed to other price risks from invest-ments in listed shares. However, the risks associated with the investmentshavenotbeenconsideredtobesignificant.
Operating income Operating expenses
Foreign exchange exposure, 2018 (%)
USD - 14%
GBP - 1%
EUR - 20%SEK - 66%
Foreign exchange exposure, 2017 (%)USD - 25%
GBP - 1%
EUR - 16%SEK - 58%
Foreign exchange exposure, 2016 (%)USD - 5%
GBP - 2%
EUR - 32%SEK - 62%
Foreign exchange risk Foreign exchange risk is the risk that the fair value of or future cashflowfromafinancialinstrumentmayvaryduetochangesin foreign exchange rates. Foreign exchange risk relates to the riskthatfluctuationsinexchangerateswillhaveanegativeimpactonthegroup’sP&L,balancesheetorcashflow.
Transaction currency risk The main exposure derives from the group’s expenses in foreign currencies. This exposure is referred to as transaction exposure. Foreign exchange hedging is decided by the Board of Directors basedoncashflowforecasts.Currently,nocurrencyhedgingis applied. See the table below for the level of exposure in each currency.
As indicated in the table above, the group’s main transaction exposure consists of USD and EUR. A 10% stronger USD against SEKwouldhaveanegativeimpactontheprofitaftertaxandshareholders’ equity by approximately 475 KSEK (668 KSEK, 73 KSEK). A 10% stronger EUR against SEK would have a negative impactontheprofitaftertaxandshareholders’equitybyapprox-imately 674 KSEK (431 KSEK, 481 KSEK).
Refinancing riskRefinancingriskreferstotheriskthatcashandcashequivalentsareunavailableandthatfinancingcanonlybeobtainedpartially,notatalloratanelevatedcost.Currently,thegroupisfinancedby shareholders’ equity and is therefore not exposed to risks relatedtoexternalloanfinancing.Themainrisksthereforeentailthe inability to obtain further equity investments from Vicore’s shareholders.
Liquidity riskLiquidityriskistheriskthatthegroupwillencounterdifficul-tiesinfulfillingitsobligationsrelatedtofinancialliabilities.The Board of Directors manage liquidity risk by continuously followingupthecashflowtoreduceliquidityriskandensurethesolvency of the group.
The group’s contractual and undiscounted interest payments andfinancialliabilityrepaymentsareshowninthetablebelow.Amounts in foreign currencies have been translated into SEK at the closing rate on the reporting date. Financial instruments with a variable interest rate have been calculated using the interest rate at the reporting date. Liabilities have been included in the earliest period during which repayment may be required.
The age analysis for overdue but not impaired receivables on the balance sheet date is given below.
Operating expenses in the table above are excluded from payroll costs

5756
<6 months 6-12 months >12 months
Maturity analysis
Trade payables 2,384 0 0
Other current liabilities 0 0 0
Accrued expenses 7,373 0 0
Dec 31, 2018
Capital managementThe group’s goals regarding the capital structure are to ensure financingofthecompany’sdevelopmentandbusinessplan.Equityorfinancingrelatedtoequityisexpectedtobethemostrealistic and possible alternative in the near future.
No change occurred in the group’s capital management during the year. None of the group companies are subject to external capital requirements.
Note 18 Prepaid expenses and accrued income
Dec 312018
Dec 312017
Dec 312016
Jan 12016
Prepaid rental charges 15 0 0 0
Other prepaid expenses 500 163 175 52
Accrued income 0 0 13 0
515 163 188 52
<6 months 6-12 months >12 months
Maturity analysis
Trade payables 2,312 0 0
Other current liabilities 1,542 0 0
Accrued expenses 235 0 0
Jan 1, 2016
<6 months 6-12 months >12 months
Maturity analysis
Trade payables 2,184 0 0
Other current liabilities 0 0 0
Accrued expenses 737 0 0
Dec 31 2016
<6 months 6-12 months >12 months
Maturity analysis
Trade payables 2,780 0 0
Other current liabilities 0 0 0
Accrued expenses 689 0 0
Dec 31, 2017
Of the 224,688 KSEK in cash and cash equivalents as of December 31, 2018, 150,020 KSEK where restricted cash held i escrow and subject to the shareholder approval at the Extraordinary General Meeting on January 7, 2019.
Note 19 Cash and cash equivalents
Dec 312018
Dec 312017
Dec 312016
Jan 12016
Available balances 224,688 24,019 4,266 25,175224,688 24,019 4,266 25,175
In August, Vicore Pharma completed the acquisition of 100% of the shares and votes in INIM Pharma AB through an issue in kind. Since INIM mainly consisted of intangible assets in the form of patents and development projects, the acquisition was
Note 20 Group companies
Company Principal activity Share of equity and voting rights
Dec 312018
Dec 312017
Dec 312016
Jan 12016
Vicore Pharma Holding AB Own and manage shares in subsidiaries
ITIN Holding AB Dormant 100% 100% 100% 100%
Vicore Pharma AB Research and Development of pharmaceutical products 100% 100% 100% 100%
INIM Pharma AB Research and Development of pharmaceutical products 100% - - -
considered to be an asset acquisition and not a business com-bination. The purchase price amounted to 70,8 MSEK, which is allocated to intangible assets amounting to 50,8 MSEK and cash and cash equivalents of 20 MSEK.
Parent company

5958
Note 22 Provision for social security contribution linked to share-based payments
For more information about options and share awards, see Note 7 Share-based payments.
Dec 31 2018
Dec 31 2017
Dec 31 2016
Jan 1 2016
Provisions for the year 278 0 0 0
278 0 0 0
Note 21 Shareholders’ equity
Number of ordinary shares Share capital Other
contributed capital
At January 1, 2016 12,368,504 6,184,252 76,306,570Share-based payments 0 0 319,200
At December 31, 2016 12,368,504 6,184,252 76,625,770New share issue decided in February 2017 2,000,000 1,000,000 27,609,614New share issue decided in February 2017 1,500,000 750,000 20,876,672
At December 31, 2017 15,868,504 7,934,252 125,112,056New share issue decided in August 2018 17,091,504 8,545,752 139,252,465Share-based payments 0 0 716,259
At December 31, 2018 32,960,008 16,480,004 265,080,780
New share issue decided in November 2018, registered in January 2019 4,412,353 137,276,764
20,892,357 402,357,544
Share capitalAt December 31, 2018, the registered share capital encom-passed 32,960,008 ordinary shares. All shares have been fully paid and no shares are reserved for transfer. At year-end, there was an ongoing issue of new shares of a total of 9,414,706 ordinary shares, of which 590,000 were not paid. The payment was made on January 8, 2019. Each share carries one vote. The quotient value is SEK 0.5 (0.5, 0.5). No shares are held by the company itself or its subsidiaries.
During 2018, Vicore acquired INIM Pharma AB (“INIM”) through an issue in kind where Vicore issued 8,851,502 shares as compensation for all outstanding shares in INIM Pharma to an issue price of 8 SEK per share . The issue in kind entailed a dilution for Vicore’s shareholders of 35.8 percent. At the acqui-sition date, HealthCap VII LP (“HealthCap”) owned 85 percent of INIM, which after the acquisition held about 30.4 percent of the shares in Vicore. At the time of the acquisition, INIM had cash and cash equivalents amounting to 20 MSEK.
Other contributed capitalOther contributed capital comprises capital contributed by the owners of the company, for example share premiums when subscribing for shares.
Share-based paymentsVicore currently has three active programs that include the man-agement team, certain board members, key employees and key consultants. For further information about the option programs, see Note 7 Share-based payments.
Distribution in kindIn conjunction with the Extraordinary General Meeting in August 2018, it was resolved to distribute the majority of the investment in the I-Tech to Vicore´s shareholders. After the distribution Vicoreholds91,829sharesinI-Tech,whichareclassifiedasafinancialasset.ThedistributionofsharesinI-TechisbasedonarefinementofVicore’sbusinessthroughtheacquisitionofINIMPharma.
Acquired assets in INIM Pharma AB
Patents, licenses and similar rights 50,555Cash and cash equivalents 20,258
Purchase price 70,813
Issue in kind 70,813
Excluding: Cash and cash equivalents in acquired company -20,558
Impact on cash flow 20,558
Note 25 Related-party transactions
Sale of goods or services
Purchase of goods or services Other Receivables at
closing dayPayables on closing day
2018 0 0 0 0 02017 787 0 0 193 0
2016 0 0 0 0 0
For information about remuneration of senior executives, see Note 6 Employees and personnel costs. Transactions with the associat-ed company I-Tech AB have only been invoicing management. The management fee during 2018 amounted to 493 KSEK (787 KSEK, 735 KSEK). The agreement was terminated in 2018. There are no agreements or transactions with related parties, other than what has been set out above and in Notes 6 and 7.
Note 23 Accrued expenses and deferred income
Dec 31 2018
Dec 31 2017
Dec 31 2016
Jan 1 2016
Accrued personnel-related expenses 3,421 719 880 828Accrued interest 103 103 103 103Accrued consulting fees 7,270 586 634 132
10,794 1,408 1,617 1,063
Note 24 Supplementary information to the cash flow statement
Dec 31 2018
Dec 31 2017
Dec 31 2016
Jan 1 2016
Depreciations 7 7 6 6
Loss on sale of tangible and intangible assets 0 0 0 44
Incentive programs 710 0 0 0Other 5 0 0 0
722 7 6 50
Share capital and other contributed capital
Social security costs linked to incentive programs
Adjustment for items not included in the cash flow
Acquisition of subsidiaries (Asset acquisition)
Transactions with associated companies

6160
Note 27 Impact of transition to IFRSVicorepresentedthegroup’sfirstfinancialreportsinaccordancewith IFRS as adopted by the EU, in the 2018 year-end report. Previously prepared annual accounts for the group have been reported in accordance with BFNAR 2012: 1 Annual Report and Consolidated Accounts (K3). The accounting principles in Note 1havebeenappliedwhentheconsolidatedfinancialaccountswere prepared as of 31 December 2018, and for the comparative information presented as of 31 December 2017, and as of 31 December 2016, as well as when preparing the statement of the openingfinancialpositionoftheperiodasof1January2016.
The accounting estimates made according to IFRS as of 1 January 2016 are in accordance with the accounting estimates made according to previously applied accounting principles. The group has decided not to retroactively apply IFRS 3 Aquisitions for periods prior to the transition to IFRS, ie January 1, 2016. The following summary shows the effects of the above-mentioned applications on the group’s statement of comprehensive income andthestatementoffinancialposition.ThetransitiontoIFRShashadnoimpactonthegroup’scashflow.
Below a summary of material agreements which the company has entered int during the three most recent years:
Agreement with Emeriti Bio ABVicore Pharma entered into a cooperation and development agreement with Emeriti Bio AB on August 24, 2016. On Novem-ber 1, 2017, the parties expanded their collaboration by conclud-ing an additional agreement. The agreement is valid until there is no longer any obligation to pay royalties to Emeriti Bio AB. The main purpose of the agreement is to develop new follow-on mol-ecules based on C21 and other drug substances. For Emeriti Bio AB’s development work, Vicore Pharma pays consultancy fees, possible milestone compensation as well as royalties should the collaboration result in approved products. Vicore Pharma owns all results. The total maximum payments in the form of milestone compensation and royalties under the agreement is limited to 29 MSEK, of which nothing has yet been paid.
Agreement with Nanologica ABOn May 9, 2018, INIM Pharma entered into a license agreement with Nanologica AB (publ) regarding the use of Nanologica AB’s drug delivery technology, NLAB Silica® for a unique product that INIM Pharma is developing. The agreement is valid until further notice, where INIM Pharma has a unilateral right to terminate the agreement at any time without any period of notice. All results are owned by INIM Pharma. In order to fully obtain the license, INIM Pharma is required to pay a one-time payment equivalent to 2 MSEK. This payment was completed in Q4 2018. Further-more, INIM Pharma is obliged to pay milestone compensations equivalentto1MSEKperproductatadefinedstageofdevelop-ment. INIM Pharma has an obligation to develop products within a certain period of time in order not to lose the license. However, INIM Pharma is entitled to maintain its license by issuing a new one-time payment equivalent to 2 MSEK. INIM Pharma is respon-sible for all development.
Restricted cash and cash equivalentsOf the 224,688 KSEK in cash and cash equivalents as of Decem-ber 31, 2018, 150,020 KSEK were restricted cash held in escrow and subject to the shareholder approval at the Extraordinary General Meeting on January 7, 2019.
Note 26 Pledged assets and contingent liabilities
KSEK Note
According to previous
applied accounting
principles
IFRS adjustments
According to IFRS
Assets
Fixed assetsPatents, licenses and similar rights A 42,761 -26,124 16,637Equipment 8 0 8Financial assets 20,110 0 20,110
Total fixed assets 62,879 -26,124 36,755
Current assets 26,346 0 26,346
Total assets 89,225 -26,124 63,101
Equity and liabilitiesEquity attributable to the parent companys shareholders 81,930 -26,124 55,806
Long-term debt 1,978 0 1,978
Current liabilities 5,317 0 5,317
Total equity and liabilities 89,225 -26,124 63,101
Aggregated consolidated statement of financial position as of January 1, 2016

6362
KSEK Note
According to previous
applied accounting
principles
IFRS adjustments
According to IFRS
Operating income
Net sales 852 0 852Capitalized work performed by the company for its own use A 1,221 -1,221 0
Other operating income 60 0 60
2,133 -1,221 912
Operating expenses A
Research and development costs 0 -12,257 -12,257
Other external expenses -5,006 0 -5,006
Personnel costs -3,770 0 -3,770
Depreciation and amortizations -6 0 -6Shareinprofitsinassociatedcompanies 0 0 0
Profit (loss) from operations -6,649 -13,478 -20,127
Shareinprofitsinassociatedcompanies 0 0 0Financial income 0 0 0Financial expenses C -3 -4,414 -4,417
Net financial income/expense -3 -4,414 -4,417
Profit (loss) before tax -6,652 -17,892 -24,544
Tax 0 0 0
Profit for the year attributable to the parent company’s shareholders -6,652 -17,892 -24,544
Other comprehensive incomeOther comprehensive income 0 0 0
Other comprehensive income for the period net of tax 0 0 0
Total comprehensive income attributable to the parent company’s shareholders -6,652 -17,892 -24,544
Consolidated statement of comprehensive income for Jan-Dec 2016
KSEK Note
According to previous ly
applied accounting
principles
IFRS adjustments
According to IFRS
Assets
Fixed assets
Patents, licenses and similar rights A 56,239 -39,602 16,637Equipment 2 0 2Financial assets C 20,610 -4,414 16,196
Total fixed assets 76,851 -44,016 32,835
Current assets 4,799 0 4,799
Total assets 81,650 -44,016 37,634
Equity and liabilitiesShareholders’ equity attributable to the parent company 75,597 -44,016 31,581
Long-term debt 1,978 0 1,978
Current liabilities 4,075 0 4,075
Total equity and liabilities 81,650 -44,016 37,634
Aggregated consolidated statement of financial position as of December 31, 2016

6564
KSEK Note
According to previous
applied accounting
principles
IFRS adjustments
According to IFRS
Operating income
Net sales 932 0 932Capitalized work performed by the company for its own use A 2,645 -2,645 0
Other operating income 97 0 97
3,674 -2,645 1,029
Operating expenses
Research and development costs A 0 -17,555 -17,555
Other external expenses -5,431 0 -5 ,431
Personnel costs -6,209 0 -6,209
Depreciation and amortizations A -4,417 4,410 -7Shareinprofitsinassociatedcompanies -410 0 -410
Profit (loss) from operations -12,793 -15,790 -28,583
Shareinprofitsinassociatedcompanies 0 0 0Financial income C 0 4,414 4,414Financial expenses -62 0 -62
Net financial income/expense -62 4,414 4,352
Profit (loss) before tax -12,855 -11,376 -24,231
Tax 0 0 0
Profit for the year attributable to the parent company’s shareholders -12,855 -11,376 -24,231
Other comprehensive incomeOther comprehensive income 0 0 0
Other comprehensive income for the period after tax 0 0 0
Total comprehensive income attributable to the parent company’s shareholders -12,855 -11,376 -24,231
Consolidated statement of comprehensive income for Jan-Dec 2017
KSEK Note
According to previous
applied accounting
principles
IFRS adjustments
According to IFRS
Assets
Fixed assets
Patents, licenses and similar rights A 72,029 -55,392 16,637Equipment 28 0 28Financial assets 22,745 0 22,745
Total fixed assets 94,802 -55,392 39,410
Current assets 24,725 0 24,725
Total assets 119,527 -55,392 64,135
Equity and liabilitiesShareholders’ equity attributable to the parent company 112,968 -55,392 57,576
Long-term debt 1,978 0 1,978
Current liabilities 4,581 0 4,581
Total equity and liabilities 119,527 -55,392 64,135
The group’s summary of financial position as of December 31, 2017
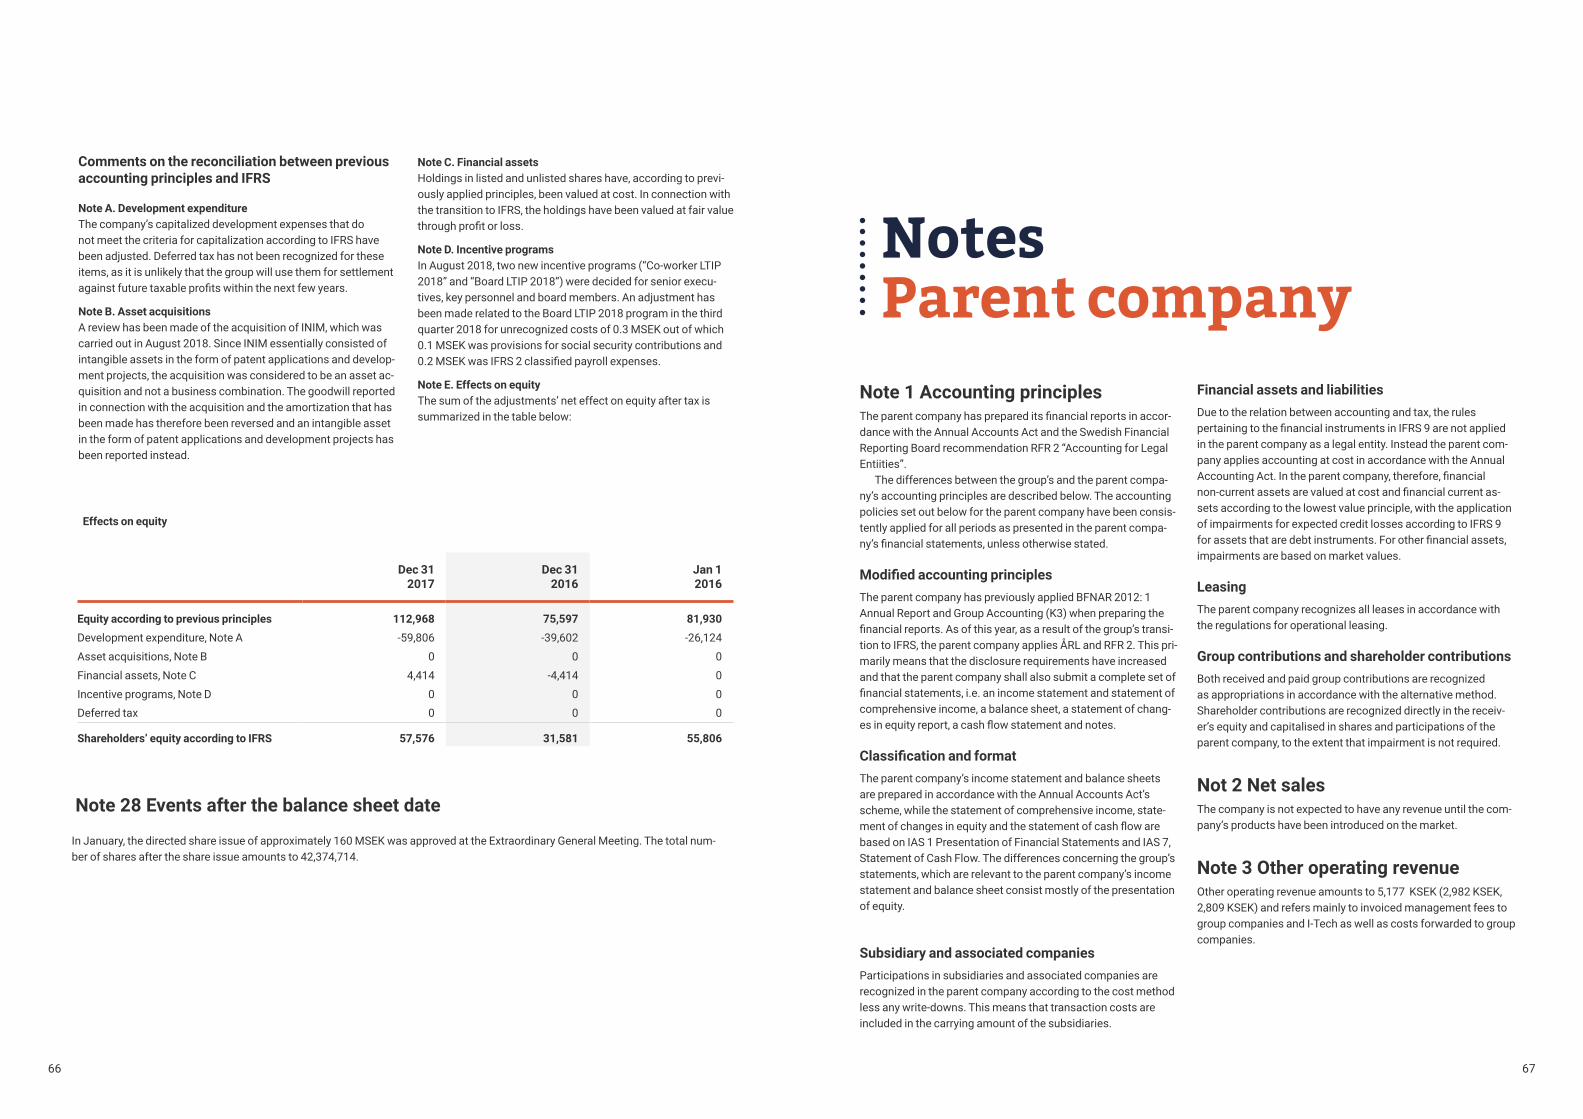
6766
In January, the directed share issue of approximately 160 MSEK was approved at the Extraordinary General Meeting. The total num-ber of shares after the share issue amounts to 42,374,714.
Dec 31 2017
Dec 31 2016
Jan 1 2016
Equity according to previous principles 112,968 75,597 81,930
Development expenditure, Note A -59,806 -39,602 -26,124
Asset acquisitions, Note B 0 0 0
Financial assets, Note C 4,414 -4,414 0
Incentive programs, Note D 0 0 0Deferred tax 0 0 0
Shareholders’ equity according to IFRS 57,576 31,581 55,806
Note 28 Events after the balance sheet date
Notes Parent company
Note 1 Accounting principlesTheparentcompanyhasprepareditsfinancialreportsinaccor-dance with the Annual Accounts Act and the Swedish Financial Reporting Board recommendation RFR 2 “Accounting for Legal Entiities”.
The differences between the group’s and the parent compa-ny’s accounting principles are described below. The accounting policies set out below for the parent company have been consis-tently applied for all periods as presented in the parent compa-ny’sfinancialstatements,unlessotherwisestated.
Modified accounting principlesThe parent company has previously applied BFNAR 2012: 1 Annual Report and Group Accounting (K3) when preparing the financialreports.Asofthisyear,asaresultofthegroup’stransi-tion to IFRS, the parent company applies ÅRL and RFR 2. This pri-marily means that the disclosure requirements have increased and that the parent company shall also submit a complete set of financialstatements,i.e.anincomestatementandstatementofcomprehensive income, a balance sheet, a statement of chang-esinequityreport,acashflowstatementandnotes.
Classification and formatThe parent company’s income statement and balance sheets are prepared in accordance with the Annual Accounts Act’s scheme, while the statement of comprehensive income, state-mentofchangesinequityandthestatementofcashflowarebased on IAS 1 Presentation of Financial Statements and IAS 7, Statement of Cash Flow. The differences concerning the group’s statements, which are relevant to the parent company’s income statement and balance sheet consist mostly of the presentation of equity.
Subsidiary and associated companiesParticipations in subsidiaries and associated companies are recognized in the parent company according to the cost method less any write-downs. This means that transaction costs are included in the carrying amount of the subsidiaries.
Financial assets and liabilitiesDue to the relation between accounting and tax, the rules pertainingtothefinancialinstrumentsinIFRS9arenotappliedin the parent company as a legal entity. Instead the parent com-pany applies accounting at cost in accordance with the Annual AccountingAct.Intheparentcompany,therefore,financialnon-currentassetsarevaluedatcostandfinancialcurrentas-sets according to the lowest value principle, with the application of impairments for expected credit losses according to IFRS 9 forassetsthataredebtinstruments.Forotherfinancialassets,impairments are based on market values.
LeasingThe parent company recognizes all leases in accordance with the regulations for operational leasing.
Group contributions and shareholder contributionsBoth received and paid group contributions are recognized as appropriations in accordance with the alternative method. Shareholder contributions are recognized directly in the receiv-er’s equity and capitalised in shares and participations of the parent company, to the extent that impairment is not required.
Not 2 Net sales The company is not expected to have any revenue until the com-pany’s products have been introduced on the market.
Note 3 Other operating revenueOther operating revenue amounts to 5,177 KSEK (2,982 KSEK, 2,809 KSEK) and refers mainly to invoiced management fees to group companies and I-Tech as well as costs forwarded to group companies.
Effects on equity
Comments on the reconciliation between previous accounting principles and IFRS
Note A. Development expenditureThe company’s capitalized development expenses that do not meet the criteria for capitalization according to IFRS have been adjusted. Deferred tax has not been recognized for these items, as it is unlikely that the group will use them for settlement againstfuturetaxableprofitswithinthenextfewyears.
Note B. Asset acquisitionsA review has been made of the acquisition of INIM, which was carried out in August 2018. Since INIM essentially consisted of intangible assets in the form of patent applications and develop-ment projects, the acquisition was considered to be an asset ac-quisition and not a business combination. The goodwill reported in connection with the acquisition and the amortization that has been made has therefore been reversed and an intangible asset in the form of patent applications and development projects has been reported instead.
Note C. Financial assetsHoldings in listed and unlisted shares have, according to previ-ously applied principles, been valued at cost. In connection with the transition to IFRS, the holdings have been valued at fair value throughprofitorloss.
Note D. Incentive programsIn August 2018, two new incentive programs (“Co-worker LTIP 2018” and “Board LTIP 2018”) were decided for senior execu-tives, key personnel and board members. An adjustment has been made related to the Board LTIP 2018 program in the third quarter 2018 for unrecognized costs of 0.3 MSEK out of which 0.1 MSEK was provisions for social security contributions and 0.2MSEKwasIFRS2classifiedpayrollexpenses.
Note E. Effects on equityThe sum of the adjustments’ net effect on equity after tax is summarized in the table below:
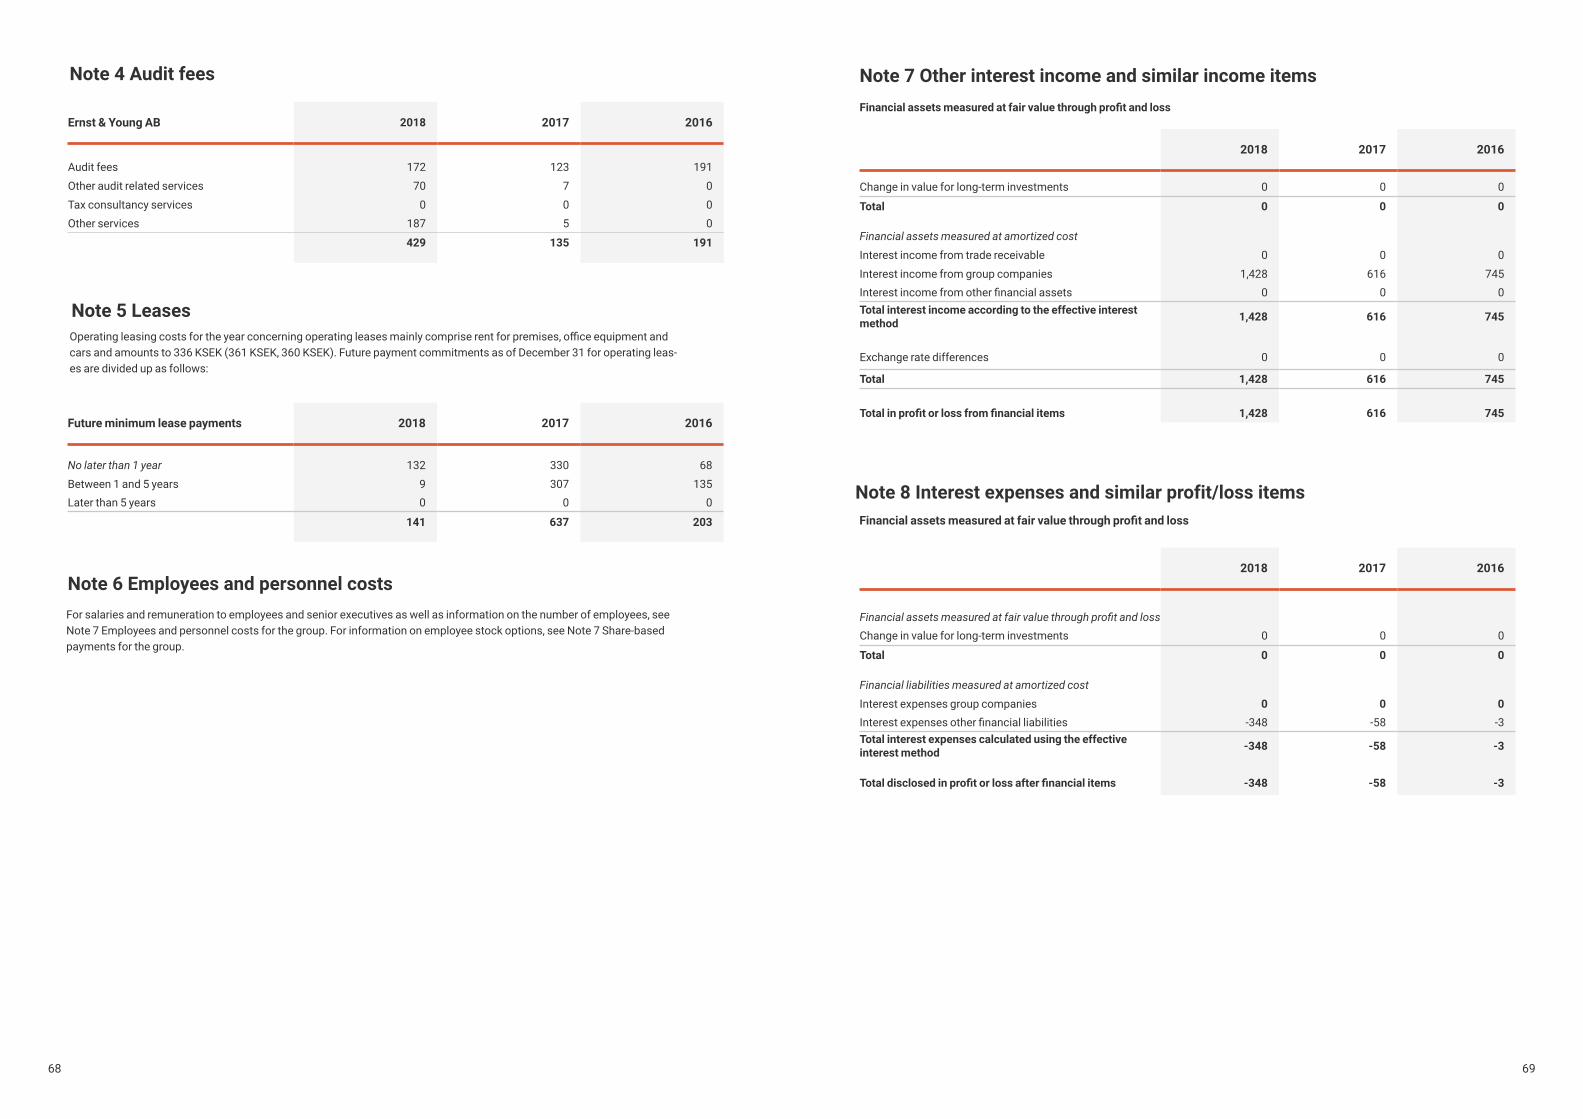
6968
Note 6 Employees and personnel costs
Note 8 Interest expenses and similar profit/loss items
Note 7 Other interest income and similar income items
For salaries and remuneration to employees and senior executives as well as information on the number of employees, see Note 7 Employees and personnel costs for the group. For information on employee stock options, see Note 7 Share-based payments for the group.
2018 2017 2016
Change in value for long-term investments 0 0 0
Total 0 0 0
Financial assets measured at amortized cost
Interest income from trade receivable 0 0 0
Interest income from group companies 1,428 616 745Interestincomefromotherfinancialassets 0 0 0Total interest income according to the effective interest method 1,428 616 745
Exchange rate differences 0 0 0
Total 1,428 616 745
Total in profit or loss from financial items 1,428 616 745
2018 2017 2016
Financial assets measured at fair value through profit and lossChange in value for long-term investments 0 0 0
Total 0 0 0
Financial liabilities measured at amortized cost
Interest expenses group companies 0 0 0Interestexpensesotherfinancialliabilities -348 -58 -3Total interest expenses calculated using the effective interest method -348 -58 -3
Total disclosed in profit or loss after financial items -348 -58 -3
Future minimum lease payments 2018 2017 2016
No later than 1 year 132 330 68
Between 1 and 5 years 9 307 135Later than 5 years 0 0 0
141 637 203
Operatingleasingcostsfortheyearconcerningoperatingleasesmainlycompriserentforpremises,officeequipmentandcars and amounts to 336 KSEK (361 KSEK, 360 KSEK). Future payment commitments as of December 31 for operating leas-es are divided up as follows:
Note 5 Leases
Ernst & Young AB 2018 2017 2016
Audit fees 172 123 191
Other audit related services 70 7 0
Tax consultancy services 0 0 0Other services 187 5 0
429 135 191
Note 4 Audit fees
Financial assets measured at fair value through profit and loss
Financial assets measured at fair value through profit and loss
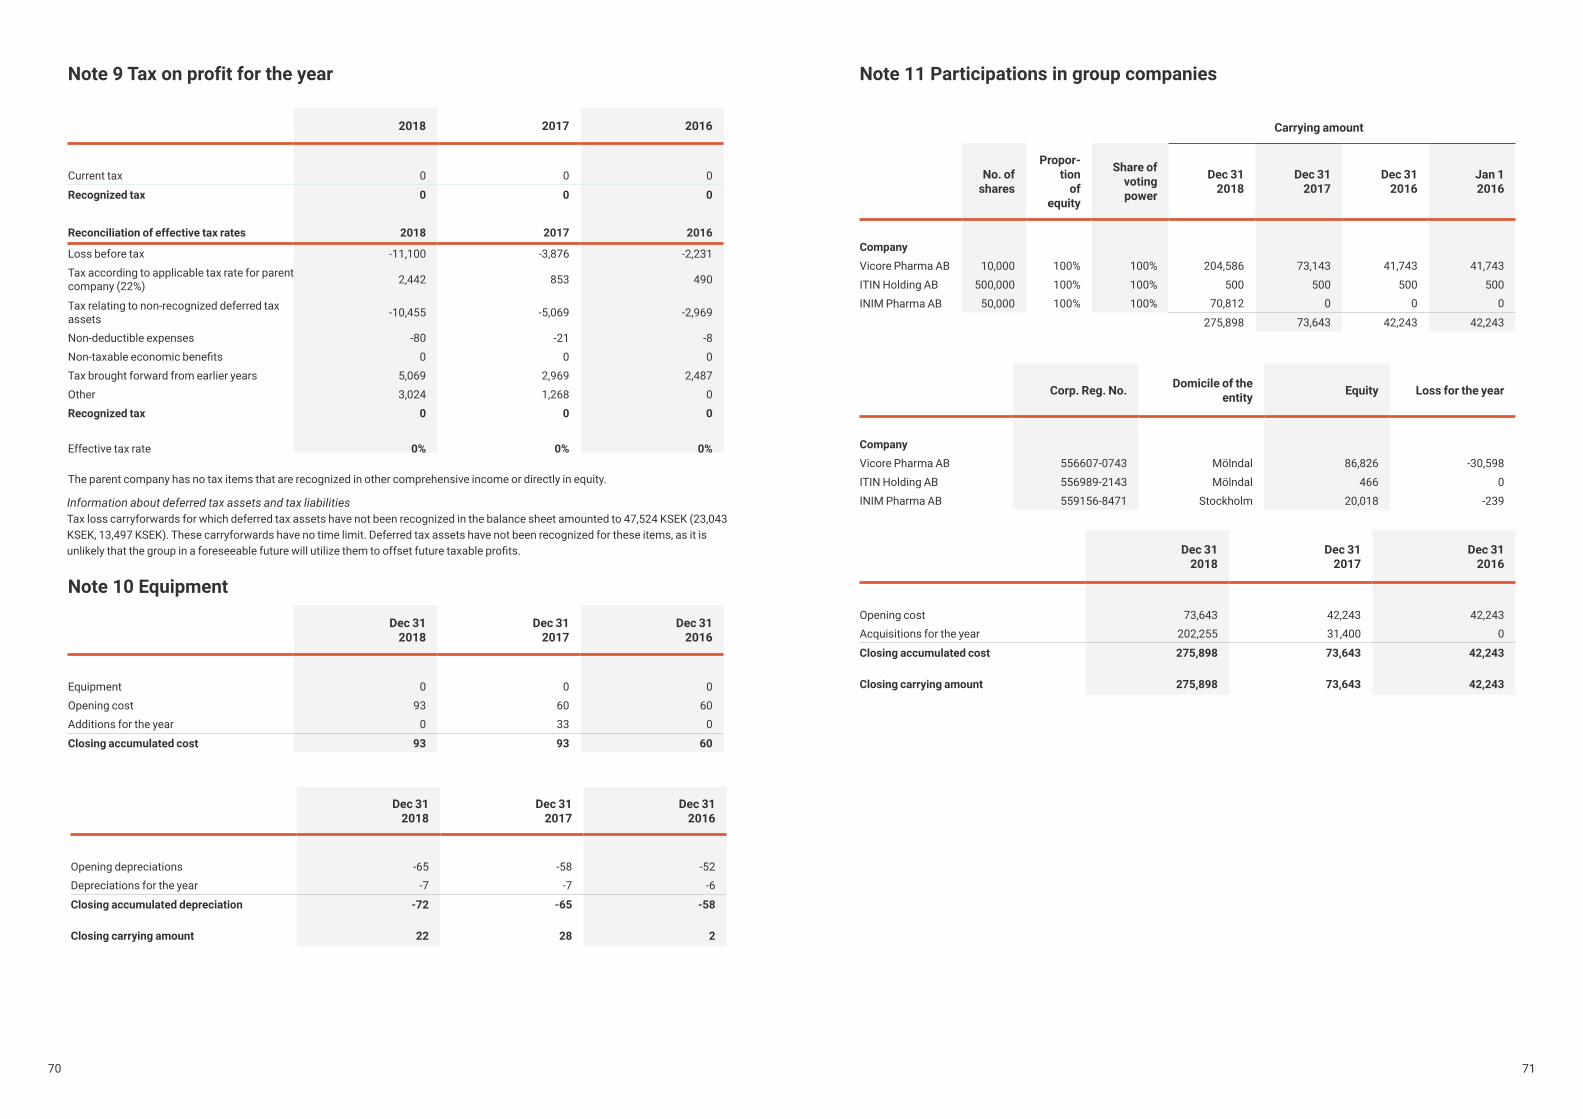
7170
Note 9 Tax on profit for the year
2018 2017 2016
Current tax 0 0 0
Recognized tax 0 0 0
Reconciliation of effective tax rates 2018 2017 2016
Loss before tax -11,100 -3,876 -2,231
Tax according to applicable tax rate for parent company (22%) 2,442 853 490
Tax relating to non-recognized deferred tax assets -10,455 -5,069 -2,969
Non-deductible expenses -80 -21 -8
Non-taxableeconomicbenefits 0 0 0
Tax brought forward from earlier years 5,069 2,969 2,487
Other 3,024 1,268 0
Recognized tax 0 0 0
Effective tax rate 0% 0% 0%
Note 10 Equipment
Dec 31 2018
Dec 312017
Dec 312016
Equipment 0 0 0
Opening cost 93 60 60Additions for the year 0 33 0
Closing accumulated cost 93 93 60
Dec 31 2018
Dec 312017
Dec 312016
Opening depreciations -65 -58 -52Depreciations for the year -7 -7 -6
Closing accumulated depreciation -72 -65 -58
Closing carrying amount 22 28 2
Information about deferred tax assets and tax liabilities Tax loss carryforwards for which deferred tax assets have not been recognized in the balance sheet amounted to 47,524 KSEK (23,043 KSEK, 13,497 KSEK). These carryforwards have no time limit. Deferred tax assets have not been recognized for these items, as it is unlikelythatthegroupinaforeseeablefuturewillutilizethemtooffsetfuturetaxableprofits.
Note 11 Participations in group companies
No. of shares
Propor-tion
of equity
Share of voting power
Dec 31 2018
Dec 312017
Dec 312016
Jan 12016
Company
Vicore Pharma AB 10,000 100% 100% 204,586 73,143 41,743 41,743
ITIN Holding AB 500,000 100% 100% 500 500 500 500
INIM Pharma AB 50,000 100% 100% 70,812 0 0 0
275,898 73,643 42,243 42,243
Corp. Reg. No. Domicile of the entity Equity Loss for the year
Company
Vicore Pharma AB 556607-0743 Mölndal 86,826 -30,598
ITIN Holding AB 556989-2143 Mölndal 466 0
INIM Pharma AB 559156-8471 Stockholm 20,018 -239
Carrying amount
Dec 31 2018
Dec 312017
Dec 312016
Opening cost 73,643 42,243 42,243Acquisitions for the year 202,255 31,400 0
Closing accumulated cost 275,898 73,643 42,243
Closing carrying amount 275,898 73,643 42,243
The parent company has no tax items that are recognized in other comprehensive income or directly in equity.

7372
Note 12 Participation in associated companies
Note 13 Long-term investments
Dec 31 2018
Dec 312017
Dec 312016
Jan 12016
Company
I-Tech 0 9,526 0 0
Carrying amount
Dec 31 2018
Dec 312017
Dec 312016
Opening cost 0 6,981 6,481
Acquisitions for the year 0 2,545 500Reclassifications 565 -9,526 0
Closing carrying amount 565 0 6,981
Equity Profit/loss for the year
Information about equity and profit /loss for the year I-Tech
Dec 31 2018
Dec 312017
Dec 312016
Opening carrying amount 9,526 0 0
Dividend -12,189 0 0
Acquisitions for the year 3,228 0 0Reclassifications -565 9,526 0Closing carrying amount, proportion of equity 0 9,526 0
Long-terminvestmentscomprisetheinvestmentinI-Tech,whichduringthepastthreeyearshasshiftedfrombeingafinancialasset(2016),tobeingre-classifiedasanassociatedcompany(2017),andthenre-classifiedasafinancialasset(2018).
Note 14 Financial assets and liabilities
Financial assets and liabilities at December 31, 2018
Financial assets and liabilities at December 31, 2017
Financial assets/ liabilities measured
at fair value through profit and loss
Financial assets/ liabilities measured
at amortized costTotal carrying amount
Financial assetsReceivables from group compa-nies 0 4,019 4,019
Trade receivables 0 4 4
Other current receivables 0 10,030 10,030
Accrued income 0 0 0Cash and cash equivalents 0 198,023 198,023
0 212,076 212,076Financial liablilities
Liabilities to group companies 0 75,400 75,400
Trade payables 0 1,510 1,510
Other current liabilities 0 515 515Accrued expenses 0 6,573 6,573
0 83,483 83,483
Themaximumcreditriskofthefinancialassetsconsistsofthenetamountsofthereportedvaluesinthetableabove.Theparentcompanyhasnotreceivedanypledgedassetsforthefinancialnetassets.
Themaximumcreditriskofthefinancialassetsconsistsofthenetamountsofthereportedvaluesinthetableabove.Theparentcompanyhasnotreceivedanypledgedassetsforthefinancialnetassets.
Financial assets/ liabilities measured
at fair value through profit and loss
Financial assets/ liabilities measured
at amortized costTotal carrying amount
Financial assetsReceivables from group companies 0 19,930 19,930
Trade receivables 0 206 206
Other current receivables 0 0 0
Accrued income 0 0 0Cash and cash equivalents 0 22,902 22,902
0 43,038 43,038Financial liablilities
Liabilities to group companies 0 400 400
Trade payables 0 404 404
Other current liabilities 0 212 212Accrued expenses 0 0 0
0 1,016 1,016

7574
Financial assets and liabilities at December 31, 2016
Financial assets and liabilities at January 1, 2016
Themaximumcreditriskofthefinancialassetsconsistsofthenetamountsofthereportedvaluesinthetableabove.Theparentcompanyhasnotreceivedanypledgedassetsforthefinancialnetassets.
Financial assets/ liabilities measured
at fair valuethrough profit and loss
Financial assets/ liabilities measured
at amortized costTotal carrying amount
Financial assetsReceivables from group compa-nies 0 27,367 27,367
Trade receivables 0 101 101
Other current receivables 0 0 0
Accrued income 0 13 13Cash and cash equivalents 0 3,119 3,119
0 30,600 30,600Financial liablilities
Liabilities to group companies 0 400 400
Trade payables 0 318 318
Other current liabilities 0 0 0Accrued expenses 0 323 323
0 1,041 1,041
Financial assets/ liabilities measured
at fair value through profit and loss
Financial assets/ liabilities measured
at amortized costTotal carrying amount
Financial assetsReceivables from group compa-nies 0 10,827 10,827
Trade receivables 0 146 146
Other current receivables 0 4 4
Accrued income 0 0 0Cash and cash equivalents 0 24,983 24,983
0 35,960 35,960Financial liablilitiesGroup debt 0 400 400Trade payables 0 1,983 1,983
Other current liabilities 0 1,548 1,548Accrued expenses 0 215 215
0 4,146 4,146
For fair value measurement of long-term investments see Note 16 for the group.
For trade receivable, other current receivables and liabili-ties, cash and cash equivalents, trade payables, and accrued expenses and income with a short maturity, the carrying amount is considered a reasonable estimate of the fair value.Based on the parent company’s assessment, taking into account
other known information and forward-looking factors, expected creditlossesforanyoftheparentcompany’sfinancialassetsaredeemedtobenon-significantandnoprovisionhasthereforebeen recognized. The counterparties do not have credit ratings, except for cash and cash equivalents where counterparties have credit risk ratings of AA-. For a description of the expected credit loss for the cash and cash equivalents according to the general method, see the group’s note 17 Financial risks.
Note 15 Prepaid expenses and accrued income
Note 16 Cash and bank balances
Note 17 Shareholders’ equity
Note 18 Provisions
Dec 312018
Dec 312017
Dec 312016
Jan 12016
Prepaid rental charges 8 32 68 4
Other prepaid expenses 53 41 94 48Accrued income 0 0 13 0
61 73 175 52
Dec 312018
Dec 312017
Dec 312016
Jan 12016
Available balances 198,023 22,902 3,119 24,983
198,023 22,902 3,119 24,983
Of the 198,023 KSEK in cash and bank balances as of December 31, 2018, 150 020 KSEK where restricted cash held in escrow and subject to the shareholders approval at the Extraordinary General Meeting on January 7, 2019.
At December 31, 2018, the registered share capital comprised 32,960,008 ordinary shares. All shares are fully paid and no shares are reserved for transfer. At year-end, there was an ongoing issue of new shares of a total of 9,414,706 ordinary shares, of which 590,000 were not paid. The payment was made on January 8, 2019. Each share carries one vote. The quota value amounts to 0.5 SEK (0.5, SEK 0.5 SEK).
The share premium reserve refers to capital from new share issues that have been issued at a price that exceeds the quotient value and includes deductions of expenditures for new share issues.
For more information about incentive programs, see Note 7 Share-based payments for the group.
Dec 312018
Dec 312017
Dec 312016
Jan 12016
Provisions for the year 278 0 0 0
278 0 0 0
Social security contributions related to share-based incentive programs
Themaximumcreditriskofthefinancialassetsconsistsofthenetamountsofthereportedvaluesinthetableabove.Theparentcompanyhasnotreceivedanypledgedassetsforthefinancialnetassets.

7776
For information about pledged assets and contingent liabilities in the parent company, see to the group’s Note 26 Pledged assets and contingent liabilities.
Note 19 Non-current liabilities to group companies
Note 20 Accrued expenses and deferred income
Note 21 Pledged assets and contingent liabilities
Note 22 Related-party transactions
The loans mature between 2 and 5 years after closing date.
Dec 312018
Dec 31 2017
Dec 312016
Jan 12016
Opening cost 400 400 400 400
Closing carrying amount 400 400 400 400
Dec 312018
Dec 312017
Dec 312016
Jan 12016
Accrued personnel-related expenses 3,206 510 637 789
Accrued interest 103 103 103 103
Accrued consulting fees 6,470 135 220 112
9,779 748 960 1,004
Other in the table above relates to invoiced costs. For salaries and remuneration to employees and senior executives , see Note 6 Employees and personnel costs for the group.
Sales of goods or services
Purchase sof goods
or servicesOther
Receiv-ables on
closing day
Payables on closing
day
Transactions with subsidiaries
2018 2,160 0 3,929 4,019 400
2017 2,160 0 633 19,930 4002016 1,440 0 1,325 27,367 400
5,760 0 5,887 51,316 1,200
Transactions with associated companies
2018 0 0 0 0 0
2017 787 0 0 193 02016 0 0 0 0 0
787 0 0 193 0
Note 23 Transition to RFR 2In August 2018, two new long-term incentive programs (“Co-worker LTIP 2018” and “Board LTIP 2018”) were implemented for senior executives, key personnel and board members. An adjustment has been made related to the Board LTIP 2018 program in the third quarter 2018 for unrecognized costs of 0.3 MSEK, whereof 0.1 MSEK were provisions for social secu-ritycontributionsand0.2MSEKwereIFRS2classifiedpayrollexpenses.

7978
Board, Management and Auditor
Leif DarnerChairman of the Board since 2017
Leif Darner owns all shares in Darner Asset Management AB. He is also a board member of I-Tech AB and of Flowserve Corporation. Prior to that he was a member of the Board of Management at AkzoNobel Bv, responsible for Coatings from 2008 and for Chemicals from 2004. Prior to this he has held several executive positions including CEO of BU Marine & Protective Coatings at Cour-taulds plc and CEO of International Färg AB.
Shareholdings: 130,000 Share awards: 125,000
Education: M.Sc. in Business Administration from the University of Gothenburg, School of Busi-ness, Economics and Law.
Other assignments: Board member of Darner Asset Management AB, I-Tech AB and Flowserve Corporation.
Previous assignments in the last five years: Board member of LKAB.
Independent of the company and its senior management and independent of major shareholders of the company.
Maarten KraanBoard member since 2018
Maarten Kraan has extensive experience in biomedicine and has, among others, held a senior posi-tion at AstraZeneca AB where he was responsible for the research and development of medicines forrespiratory,inflammatoryandautoimmunesymptoms.
Shareholdings: -
Share awards: 125,000
Education: Doctor’s degree in rheumatology at the University of Leiden.
Other assignments: Maarten Kraan is a board member of Toleranzia AB and CDS Gmbh.
Previous assignments in the last five years: None.
Independent of the company and its senior management and independent of major shareholders of the company.
Board of Directors
Sara MalcusBoard member since 2018
Sara Malcus has ten years of experience from operational management and board work through her work with developing early drug projects at GU Ventures, Astra Zeneca AB and in smaller start-up companies.
Shareholdings: - Share awards: 50,000
Education: Doctor’sdegreeinimmunologyandinflammatorymedicineattheUniversityofGothen-burg.
Other assignments: Sara Malcus is the external Managing Director of MetaboGen AB.
Previous assignments in the past five years: Board member of Oncorena AB, Oncorena Holding AB,CerenoScientificABandMetaboGenAB.
Independent of the company and its senior management and independent of major shareholders of the company.
Kjell StenbergBoard member since 2010
Kjell Stenberg has extensive experience from board work from a number of companies active in various industries and has been the chairman of seven listed companies since 1994.
Shareholdings: 1,148,478
Share awards: -
Education: Economics studies at Stockholm University.
Other assignments: Board member of WntResearch AB, Kjell Stenberg Aktiebolag and CN Sten-berg Aktiebolag and deputy director of Wntreseach Incentive AB.
Previous assignments in the last five years: Board member of ITIN Holding AB, Ziramic Produc-tion AB, Cad.esthetics AB, Taurus Energy AB (publ), GAKS Bilförsäljning AB and deputy director of Scandinavian Technology AB and Taurus Oil AB. Furthermore.
Independent of the company and its senior management and independent of major shareholders of the company.
Peter StrömBoard member since 2015
During 1979-2005, Peter Ström has held senior positions in Kabi Vitrum AB, Kabi Pharmacia AB, Pharmacia & Upjohn and IMS Health. Peter Ström has since 2003 been a board member of a number of listed companies, such as Active Biotech AB, Oasmia Pharmaceutical AB and LIDDS AB. Peter Ström is also a board member of Dentosystem Scandinavia AB and Stockholm Corporate Finance AB and deputy director of Comtax Support AB and Comtax Holding AB.
Shareholdings: 84,084
Share awards: 50,000
Education: M.Sc. in Business Administration from Stockholm School of Economics.
Other assignments: Board member of Stockholm Corporate Finance, Comtax AB och Dentosys-tem AB.
Previous assignments in the past five years: Chairman of Wntresearch AB and board member of Wntresearch Incentive AB and Psoriasis+ Creams Sweden AB.
Independent of the company and its senior management and independent of major shareholders of the company.

8180
Jacob GunterbergBoard member since 2018
Jacob Gunterberg is a partner at HealthCap since 2007 and has extensive experience in venture capitalinvestmentoperationsandcorporatefinanceinlifescience.JacobGunterbergis,amongothers, a board member of Trimb Holding AB, HealthCap Orx Holdings GP AB, Carisma Therapeu-tics Inc. and former chairman of INIM Pharma AB.
Shareholdings: -
Share awards: -
Education: M.Sc. in Business Administration and Economics from Lund University.
Other assignments: Board member Skipjack AB, Ancilla AB, EllAug AB and Tova Skrenen Stock-holm AB. Chairman and board member of JUSG Aktiebolag.
Previous assignments in the last five years: Board member of M - PS Helmet AB, MIPS AB, OxThera Intellectual Property AB and Trimb Healthcare AB. Chairman and board member of OxThera AB. Deputy director of BONESUPPORT AB, BONESUPPORT HOLDING AB and Wilson Ther-apeutics AB. Board member of HealthCap Holdings GP Aktiebolag, HealthCap Annex Fund I-II Bis GP Aktiebolag and HealthCap Aero Holdings GP AB (merged in 2016) and Cenova AB.
Independent of the company and its senior management but dependent of major shareholders of the company.
Hans SchikanBoard member since 2018
Hans Schikan has more than 25 years of experience from senior positions in the global pharma-ceutical industry.
Shareholdings: -
Share awards: 125,000
Education: Doctor of Pharmacy (PharmD) from the University of Utrecht.
Other assignments: Hans Schikan is the chairman of Interna Technologies B.V., Complix NV and Asceneuron SA and board member of Swedish Orphan Biovitrum AB (publ), Topteam Life Sciences & Health NV and Therachon AG. Hans Schikan is also adviser to a number of Life Science compa-nies, including HealthCap.
Previous assignments in the past five years: Board member of Prosensa Holding NV, Hansa Medi-cal AB (publ), Wilson Therapeutics AB (publ), INIM Pharma AB and CEO of Prosensa.
Independent of the company and its senior management and independent of major shareholders of the company.

8382
Carl-Johan DalsgaardCEO since 2018
Carl-Johan Dalsgaard has been a Venture Partner at HealthCap since 2000, thereby he has served as CEO of several companies in which HealthCap has invested. Prior to that, he has ten years of experience from senior positions within the AstraZeneca Group, such as pre-clinical research direc-tor, therapeutic area manager of pain and anesthesia, CEO of Astra Pain Control AB and part of the Group’s research management team.
Shareholdings: 477,981
Options: 100,000
Education: MD from the Karolinska Institute. PhD in neurobiology and post-doc experience from Harvard Medical School. Carl-Johan Dalsgaard has also completed a specialist training in plastic surgery.
Hans JeppssonCFO since 2017
Hans Jeppsson has previously worked as a pharmaceutical research analyst at Danske Bank and hasexperiencefromthecapitalmarketandfinancing-relatedquestions.
Shareholdings: 5,000
Options: 50,000
Education: M.Sc. in Finance from the University of Gothenburg, School of Business, Economics and Law, and also holds a doctor’s degree in Finance from the same university. After he obtained his doctor’s degree he conducted postdoctoral studies at the UC Berkeley in the US. He also has a background in chemical engineering with a focus on biotechnology from Chalmers University of Technology.
Christina Johansson Pharmaceutical Development Manager since 2017
Christina Johansson has been active in the pharmaceutical industry for 26 years, and has during the last 19 years been directly responsible for strategy and development of nearly 50 potential drug substances in a number of different areas of disease. This has led to knowledge and experi-ence of all aspects of drug development, focusing on development phases before Phase III.
Shareholdings: –
Options: 50,000
Education: M.Sc. in Pharmacy from Uppsala University. Christina Johansson also holds a doctor’s degree in tumor immunology at the University of Gothenburg.
Management
Rohit Batta Chief Medical Officer since 2018
Rohit Batta has 18 years of experience as a medical doctor with an extensive background leading medical and clinical development teams whilst developing drugs for rare diseases. His previous roles include Senior Director of Cell and Gene Therapy at GlaxoSmithKline leading the clinical developmentanddefiningtheclinicalstrategyforhaemoglobinopathygenetherapymedicines.Healsoledtheglobalmedicalandlatestageclinicaldevelopmentteamstolaunchtheworld’sfirstgene therapy for patients with a paediatric rare disease. Rohit holds an MBBS from Kings College London and is a member of the Royal College of General Practitioners and the Faculty of Pharma-ceutical Medicine.
Shareholdings: -
Options: 50,000
Education: MBBS from Kings College London and is a member of the Royal College of General Practitioners and the Faculty of Pharmaceutical Medicine.
Johan RaudChief Scientific Officer since 2018
Johan Raud has more than 20 years of experience from heading research teams and managing drug discovery projects in both big pharma and startups. Johan gained his MD, PhD and Associate Professorship at Karolinska Institutet and Vanderbilt University.
Shareholdings: 238,991
Options: -
Education: MD PhD from the Karolinska Institute and Vanderbilt university, USA
Christian HallInvestor Relations Manager since 2019
Christian Hall is an IR professional with an extensive experience. He has worked as a senior IR professional since 2012 with a number of companies, including Folksam and Academedia. Before that, Christian worked with equity research on banks and stock brokers. Between 1999 and 2012 he worked for Swedbank in different positions, including Head of Equity Research, Equity Strategist and as head of several sectors.
Shareholdings: -
Options: -
Education: B.Sc, Major in Finance, Stockholm School of Economics.

8584
Idiopathic Pulmonary Fibrosis: a rare disease with significant unmet medical needs
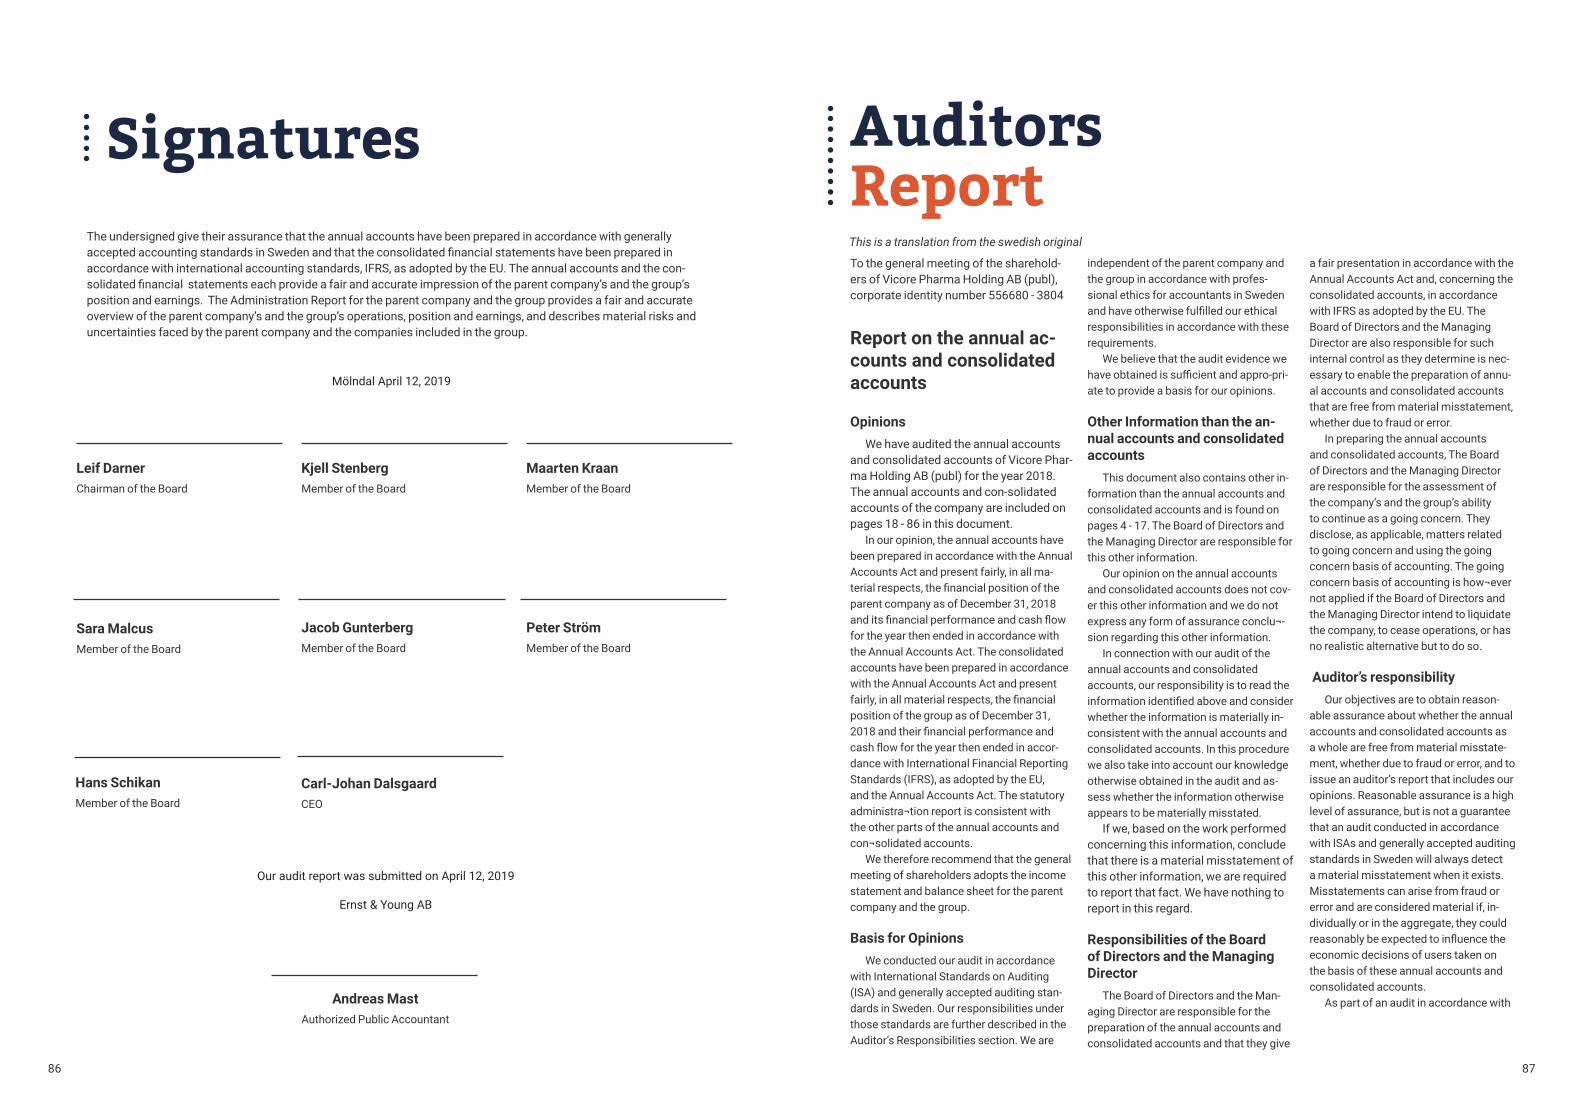
8786
Signatures
Leif DarnerChairman of the Board
Sara MalcusMember of the Board
Carl-Johan DalsgaardCEO
Kjell StenbergMember of the Board
Jacob GunterbergMember of the Board
Maarten KraanMember of the Board
Peter StrömMember of the Board
The undersigned give their assurance that the annual accounts have been prepared in accordance with generally acceptedaccountingstandardsinSwedenandthattheconsolidatedfinancialstatementshavebeenpreparedinaccordance with international accounting standards, IFRS, as adopted by the EU. The annual accounts and the con-solidatedfinancialstatementseachprovideafairandaccurateimpressionoftheparentcompany’sandthegroup’sposition and earnings. The Administration Report for the parent company and the group provides a fair and accurate overview of the parent company’s and the group’s operations, position and earnings, and describes material risks and uncertainties faced by the parent company and the companies included in the group.
Our audit report was submitted on April 12, 2019
Ernst & Young AB
Andreas MastAuthorized Public Accountant
Mölndal April 12, 2019
Hans SchikanMember of the Board
Auditors ReportTo the general meeting of the sharehold-ers of Vicore Pharma Holding AB (publ), corporate identity number 556680 - 3804
Report on the annual ac-counts and consolidated accounts
OpinionsWe have audited the annual accounts
and consolidated accounts of Vicore Phar-ma Holding AB (publ) for the year 2018. The annual accounts and con-solidated accounts of the company are included on pages 18 - 86 in this document.
In our opinion, the annual accounts have been prepared in accordance with the Annual Accounts Act and present fairly, in all ma-terialrespects,thefinancialpositionoftheparent company as of December 31, 2018 anditsfinancialperformanceandcashflowfor the year then ended in accordance with the Annual Accounts Act. The consolidated accounts have been prepared in accordance with the Annual Accounts Act and present fairly,inallmaterialrespects,thefinancialposition of the group as of December 31, 2018andtheirfinancialperformanceandcashflowfortheyearthenendedinaccor-dance with International Financial Reporting Standards (IFRS), as adopted by the EU, and the Annual Accounts Act. The statutory administra¬tion report is consistent with the other parts of the annual accounts and con¬solidated accounts.
We therefore recommend that the general meeting of shareholders adopts the income statement and balance sheet for the parent company and the group.
Basis for OpinionsWe conducted our audit in accordance
with International Standards on Auditing (ISA) and generally accepted auditing stan-dards in Sweden. Our responsibilities under those standards are further described in the Auditor’s Responsibilities section. We are
independent of the parent company and the group in accordance with profes-sional ethics for accountants in Sweden andhaveotherwisefulfilledourethicalresponsibilities in accordance with these requirements.
We believe that the audit evidence we haveobtainedissufficientandappro-pri-ate to provide a basis for our opinions.
Other Information than the an-nual accounts and consolidated accounts
This document also contains other in-formation than the annual accounts and consolidated accounts and is found on pages 4 - 17. The Board of Directors and the Managing Director are responsible for this other information.
Our opinion on the annual accounts and consolidated accounts does not cov-er this other information and we do not express any form of assurance conclu¬-sion regarding this other information.
In connection with our audit of the annual accounts and consolidated accounts, our responsibility is to read the informationidentifiedaboveandconsiderwhether the information is materially in-consistent with the annual accounts and consolidated accounts. In this procedure we also take into account our knowledge otherwise obtained in the audit and as-sess whether the information otherwise appears to be materially misstated.
If we, based on the work performed concerning this information, conclude that there is a material misstatement of this other information, we are required to report that fact. We have nothing to report in this regard.
Responsibilities of the Board of Directors and the Managing Director
The Board of Directors and the Man-aging Director are responsible for the preparation of the annual accounts and consolidated accounts and that they give
a fair presentation in accordance with the Annual Accounts Act and, concerning the consolidated accounts, in accordance with IFRS as adopted by the EU. The Board of Directors and the Managing Director are also responsible for such internal control as they determine is nec-essary to enable the preparation of annu-al accounts and consolidated accounts that are free from material misstatement, whether due to fraud or error.
In preparing the annual accounts and consolidated accounts, The Board of Directors and the Managing Director are responsible for the assessment of the company’s and the group’s ability to continue as a going concern. They disclose, as applicable, matters related to going concern and using the going concern basis of accounting. The going concern basis of accounting is how¬ever not applied if the Board of Directors and the Managing Director intend to liquidate the company, to cease operations, or has no realistic alternative but to do so.
Auditor’s responsibilityOur objectives are to obtain reason-
able assurance about whether the annual accounts and consolidated accounts as a whole are free from material misstate-ment, whether due to fraud or error, and to issue an auditor’s report that includes our opinions. Reasonable assurance is a high level of assurance, but is not a guarantee that an audit conducted in accordance with ISAs and generally accepted auditing standards in Sweden will always detect a material misstatement when it exists. Misstatements can arise from fraud or error and are considered material if, in-dividually or in the aggregate, they could reasonablybeexpectedtoinfluencetheeconomic decisions of users taken on the basis of these annual accounts and consolidated accounts.
As part of an audit in accordance with
This is a translation from the swedish original

8988
ISAs, we exercise professional judgment and maintain professional skepticism throughout the audit. We also: • Identify and assess the risks of
material misstatement of the annual accounts and consolidated accounts, whether due to fraud or error, de-sign and perform audit procedures responsive to those risks, and obtain auditevidencethatissufficientandappropriate to provide a basis for our opinions. The risk of not detecting a material misstatement resulting from fraud is higher than for one resulting from error, as fraud may involve col-lusion, forgery, intentional omissions, misrepresenta¬tions, or the override of internal control.
• Obtain an understanding of the company’s internal control relevant to our audit in order to design audit procedures that are appropriate in the circumstances, but not for the purpose of expressing an opinion on the ef-fectiveness of the company’s internal control.
• Evaluate the appropriateness of accounting policies used and the rea-sonableness of accounting estimates and related disclosures made by the Board of Directors [and the Managing Director].
• Conclude on the appropriateness of the Board of Directors’ [and the Manag-ing Director’s] use of the going concern basis of accounting in preparing the annual accounts and consolidated accounts. We also draw a conclusion, based on the audit evidence obtained, as to whether any material uncertainty exists related to events or conditions thatmaycastsignificantdoubtonthe company’s and the group’s ability to continue as a going concern. If we conclude that a material uncer-tainty exists, we are required to draw attention in our auditor’s report to the related dis-closures in the annual accounts and consolidated accounts or, if such disclosures are inadequate, to modify our opinion about the annual accounts and consolidated accounts. Our conclusions are based on the audit evidence obtained up to the date of our auditor’s report. However, future events or conditions may cause a com-pany and a group to cease to continue as a going concern.
• Evaluate the overall presentation,
structure and content of the annual accounts and consolidated ac-counts, including the disclosures, and whether the annual accounts and consolidated accounts represent the underlying transac-tions and events in a manner that achieves fair presentation.
• Obtainsufficientandappropri-ate audit evidence regarding the financialinformationoftheentitiesor business activities within the group to express an opinion on the consolidated accounts. We are responsible for the direction, supervision and performance of the group audit. We remain solely responsible for our opinions.
We must inform the Board of Directors of, among other matters, the planned scope and timing of the audit. We must alsoinformofsignificantauditfindingsduringouraudit,includinganysignifi-cantdeficienciesininternalcontrolthatweidentified.
Report on other legal and regulatory require-ments
OpinionsIn addition to our audit of the annual
accounts and consolidated accounts, we have also audited the administra-tion of the Board of Directors and the Managing Director of Vicore Pharma Holding AB (publ) for the year 2018 and the proposed appropriations of the company’sprofitorloss.
We recommend to the general meetingofshareholdersthattheprofitbe appropriated in accordance with the proposal in the statutory administration report and that the members of the Board of Directors and the Managing Director be discharged from liability for thefinancialyear.
Basis for OpinionsWe conducted the audit in accor-
dance with generally accepted auditing standards in Sweden. Our responsibil-ities under those standards are further described in the Auditor’s Responsi-bilities section. We are independent of the parent company and the group in
accordance with professional ethics for accountants in Sweden and have other-wisefulfilledourethicalresponsibili¬tiesin accordance with these requirements.
We believe that the audit evidence we haveobtainedissufficientandappropri-ate to provide a basis for our opinions.
Responsibilities of the Board of Directors and the Managing Director
The Board of Directors is responsi-ble for the proposal for appropriations ofthecompany’sprofitorloss.Attheproposal of a dividend, this includes an assessment of whether the dividend is justifiableconsideringtherequire-mentswhich the company’s and the group’s type of operations, size and risks place on the size of the parent company’s and the group’s equity, consolida¬tion requirements, liquidity and position in general.
The Board of Directors is responsible for the company’s organization and the administration of the company’s affairs. This includes among other things con-tinuous assessment of the company’s andthegroup’sfinancialsituationandensuring that the company’s organiza-tion is designed so that the accounting, management of assets and the com-pany’sfinancialaffairsother-wisearecontrolled in a reassuring manner. The Managing Director shall manage the ongoing administration according to the Board of Directors’ guidelines and in-structions and among other matters take measuresthatarenecessarytofulfillthecompany’s accounting in accordance with law and handle the management of assets in a reassuring manner.
Auditor’s responsibility
Our objective concerning the audit of the administration, and thereby our opinion about discharge from liability, is to obtain audit evidence to assess with a reasonable degree of assurance whether any member of the Board of Directors or the Managing Director in any material respect:• has undertaken any action or been
guilty of any omission which can give rise to liability to the company, or
• in any other way has acted in con-
travention of the Companies Act, the Annual Accounts Act or the Articles of Association.
Our objective concerning the audit of the proposed appropriations of the company’sprofitorloss,andtherebyour opinion about this, is to assess with reasonable degree of assurance whether the proposal is in accordance with the Companies Act.
Reasonable assurance is a high level of assurance, but is not a guarantee that an audit conducted in accordance with generally accepted auditing standards in Sweden will always detect actions or omissions that can give rise to liability to the company, or that the proposed appropriationsofthecompany’sprofitor loss are not in accordance with the Companies Act.
As part of an audit in accordance with generally accepted auditing standards in Sweden, we exercise professional judgment and maintain professional skepticism throughout the audit. The examination of the administration and the proposed appropriations of the com-pany’sprofitorlossisbasedprimarilyon the audit of the accounts. Additional audit procedures performed are based on our professional judgment with starting point in risk and materiality. This means
that we focus the examination on such actions, areas and relationships that are material for the operations and where deviations and violations would have particular importance for the company’s situation. We examine and test deci-sions undertaken, support for decisions, actions taken and other circumstances that are relevant to our opinion concern-ing discharge from liability. As a basis for our opinion on the Board of Directors’ proposed appropriations of the compa-ny’sprofitorlossweexaminedwhetherthe proposal is in accordance with the Companies Act.
Göteborg, April 12, 2019
Ernst & Young AB
Andreas Mast
Authorized Public Accountant

9190
Adress Vicore Pharma Holding AB c/o BioVentureHub Pepparedsleden 1 431 83 Mölndal SwedenTel: +46 (0)31-788 05 60 Swedish corporate reg. no.: 556680-3804 www.vicorepharma.com
Contact Carl-Johan Dalsgaard, CEO Tel:[email protected]
Hans Jeppsson, CFO Tel:[email protected]
Vicore Pharma Holding ABKornhamnstorg 53111 27 Stockholm, Sweden
Contact Information
GlossaryAgonistAdrugthathasaffinityfor,andstimu-lates physiological activity, via cellular receptors that are normally stimulated by naturally occurring substances.
Angiotensin Peptides and hormonal substances within the renin-angiotensin system. The most potent form known as Angioten-sin II, which may bind to two different receptors;theAT1receptorandtheAT2receptor. Stimulation of the AT1 recep-tor via Angiotensin II provides inter alia a contraction of the blood vessels and increases the blood pressure.
Antagonist A substance that tends to nullify the ac-tionofanother;inpharmaceuticalterms,a drug that binds to a receptor without eliciting a biological response.
AT2 receptor The Angiotensin II type 2 receptor or AT2 receptor is regarded as the “protective” receptor of the Renin-Angiotensin sys-tem. Many effects seen after stimulation of the AT2 receptor counteracts effects mediated via the AT1 receptor thus coun-teracting cytokines and growth factors. The AT2 receptor belongs to a family of G protein-coupled receptors. In contrast to the ubiquitous AT1 receptor, the AT2 receptor is predominantly expressed during embryonic development. In adults, however, it is mainly expressed after injury and in different disease states.
Clinical studiesPhase I isthefirsttimethatthedrugistested on humans. This is usually done on a small group (10-30) of healthy volun-teers with normal weight who are always men. This is because women’s reproduc-tive capacity is more sensitive if it should prove that the substance is toxic. In the
phase I study the safety of the drug is investigated, how it is broken down in the body and its effects. In the phase I study the subject is only given a small fraction of the amount that is given to experimen-tal animals, because the effect on people is completely unknown.
Phase II is carried out on a larger group of patients suffering from a disease (20-3,000) to study how effective the drug is to treat the disease. During phase II, dose studies are also usually conducted to arrive at the right dose to be given to pa-tients in the future. This dose is used later in the phase III studies. Phase II studies can be divided into early phase (IIa) and late phase (IIb)
Phase III is carried out in a very large population (300-30,000) to conclusively definehowsuitablethedrugistotreatthe disease. This patient group should as far as possible mimic the population of whichthefinishedproductistobeusedon, e.g. weight, age, gender, etc. Compar-isons are made to the current standard treatment or placebo (sugar pill) if there is no standard treatment for the disease. Phase III may also be divided into two subgroups phase IIIa and phase IIIb. In phase IIIa, the drug has not come out in the market yet and during phase IIIb the drug is on the market, but new areas of use for it are tested.
Phase IV comes after the drug has start-ed to be sold in the market, when new unusual side effects can be discovered. Phase IV can be seen as a monitoring of what is happening.
Idiopathic pulmonary fibrosis (IPF)IPF is a chronic and ultimately fatal disease characterized by a progres-sive decline in lung function. The term pulmonaryfibrosismeansscarringof
lung tissue and is the cause of worsening dyspnoea (shortness of breath). Fibrosis is usually associated with a poor progno-sis. IPF usually occurs in adult individuals of between 50 and 70 years of age, and affects more men than women.
Preclinical researchPreclinical research is a stage of research that begins before clinical trials (testing in humans) can begin, and during which important feasibility, iterative testing and drug safety data are collected. The main goals of pre-clinical studies are to deter-minethesafedoseforfirst-in-manstudyandassessaproduct’ssafetyprofile.
RAS, Renin-Angiotensin SystemThe Renin-Angiotensin System (RAS) or the Renin-Angiotensin-Aldosterone System (RAAS) is a hormone system that regulates blood pressure and water (fluid)balance.Drugsthatblocktheras, e.g. ACE inhibitors and Angiotensin receptor blockers, have been widely used clinically to treat high blood pressure, and for reducing mortality of patients with myocardial infarction and heart failure patients. With these drugs, the negative effects of Angiotensin II are blocked, which occurs when AT1r stimulated.
Receptor Aspecificmoleculeonthesurfaceorwithin the cytoplasm of a cell that recog-nizesandbindswithotherspecificmol-ecules, such as the cell molecules that bind with hormone or neurotransmitter molecules and react with other molecules thatrespondinaspecificway.
RegulatorySummary term for the work done to meet the authorities’ formal requirements regarding, for example, pharmaceutical registration.

92Vicore Pharma Holding AB BioVentureHub | Pepparedsleden 1, 431 83 Mölndal SWEDEN | +46 (0)31-788 05 60 | vicorepharma.com