Embed Size (px)
Citation preview
ANNUAL REPORT2018/19

Cape Town, Western Cape
3 general information
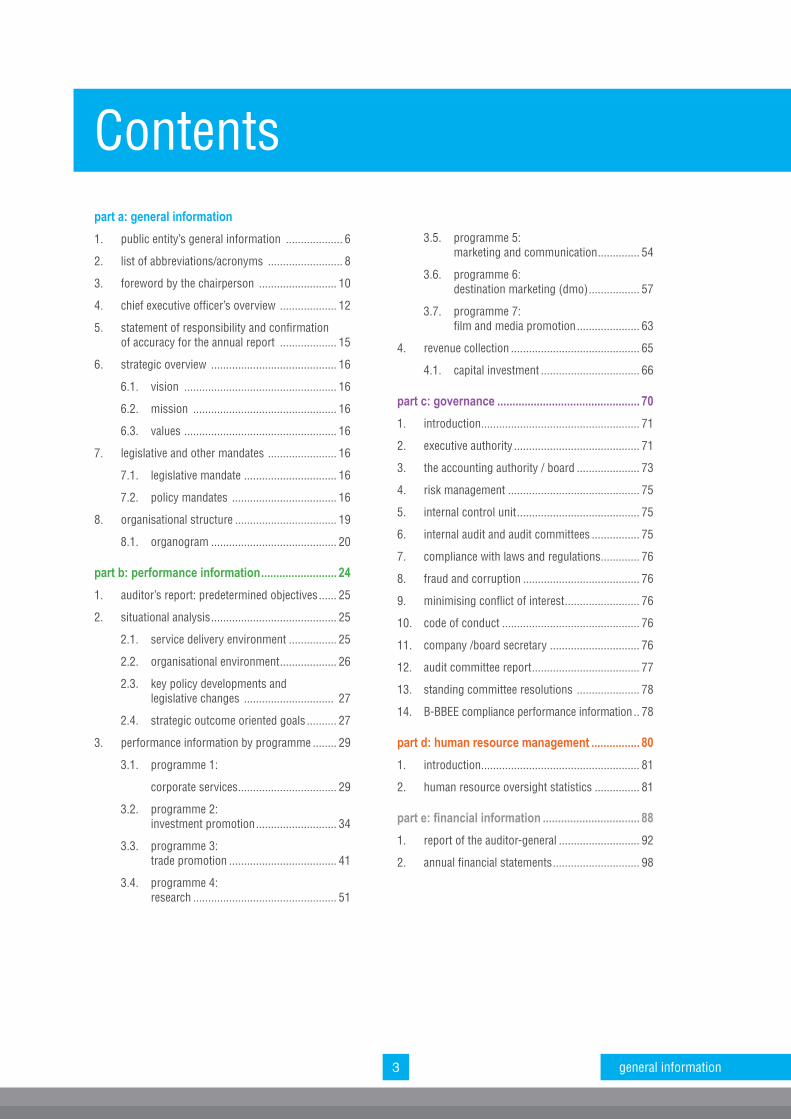
Contentspart a: general information1. public entity’s general information ................... 6
2. list of abbreviations/acronyms ......................... 8
3. foreword by the chairperson .......................... 10
4. chief executive officer’s overview ................... 12
5. statement of responsibility and confirmation of accuracy for the annual report ................... 15
6. strategic overview .......................................... 16
6.1. vision ................................................... 16
6.2. mission ................................................ 16
6.3. values ................................................... 16
7. legislative and other mandates ....................... 16
7.1. legislative mandate ............................... 16
7.2. policy mandates ................................... 16
8. organisational structure .................................. 19
8.1. organogram .......................................... 20
part b: performance information ......................... 241. auditor’s report: predetermined objectives ...... 25
2. situational analysis .......................................... 25
2.1. service delivery environment ................ 25
2.2. organisational environment ................... 26
2.3. key policy developments and legislative changes .............................. 27
2.4. strategic outcome oriented goals .......... 27
3. performance information by programme ........ 29
3.1. programme 1:
corporate services ................................. 29
3.2. programme 2: investment promotion ........................... 34
3.3. programme 3: trade promotion .................................... 41
3.4. programme 4: research ................................................ 51
3.5. programme 5: marketing and communication .............. 54
3.6. programme 6: destination marketing (dmo) ................. 57
3.7. programme 7: film and media promotion ..................... 63
4. revenue collection ........................................... 65
4.1. capital investment ................................. 66
part c: governance ............................................... 701. introduction ..................................................... 71
2. executive authority .......................................... 71
3. the accounting authority / board ..................... 73
4. risk management ............................................ 75
5. internal control unit ......................................... 75
6. internal audit and audit committees ................ 75
7. compliance with laws and regulations ............. 76
8. fraud and corruption ....................................... 76
9. minimising conflict of interest ......................... 76
10. code of conduct .............................................. 76
11. company /board secretary .............................. 76
12. audit committee report .................................... 77
13. standing committee resolutions ..................... 78
14. B-BBEE compliance performance information .. 78
part d: human resource management ................ 801. introduction ..................................................... 81
2. human resource oversight statistics ............... 81
part e: financial information ................................ 881. report of the auditor-general ........................... 92
2. annual financial statements ............................. 98
Knysna harbour in the Garden Route, Western Cape
part a: general information

general information
part a
part a: general information
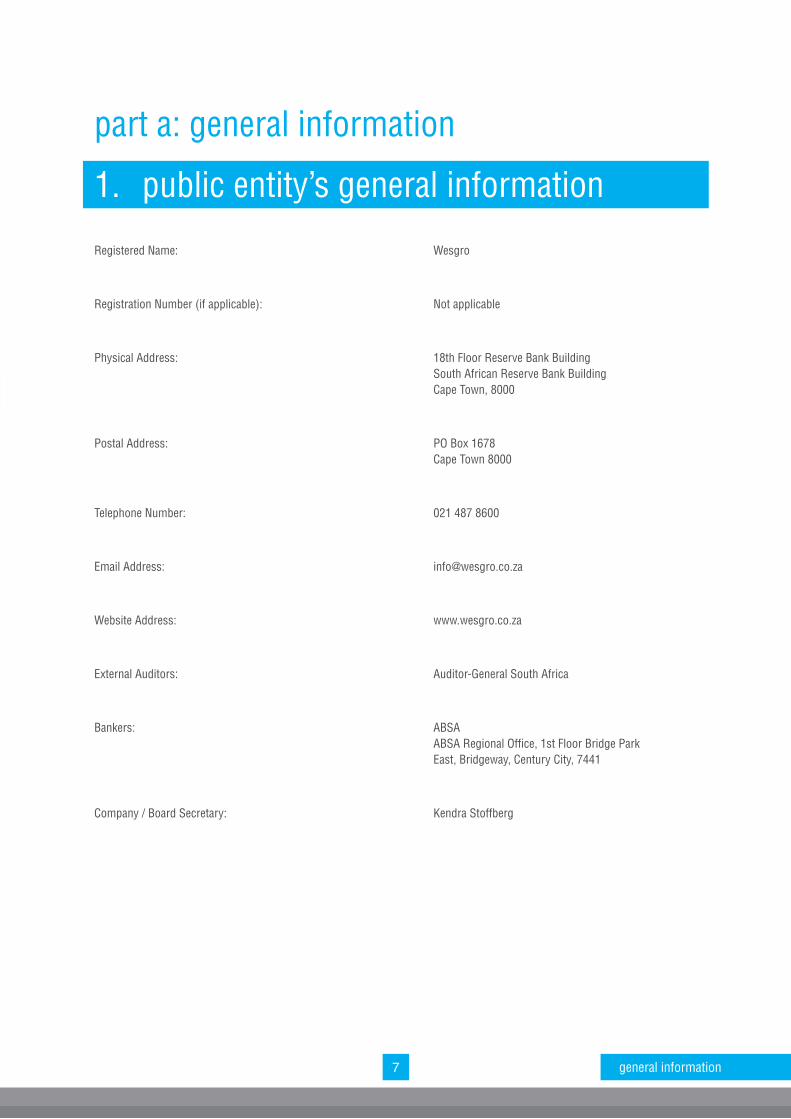
1. public entity’s general information
Registered Name: Wesgro
Registration Number (if applicable): Not applicable
Physical Address: 18th Floor Reserve Bank Building South African Reserve Bank Building Cape Town, 8000
Postal Address: PO Box 1678 Cape Town 8000
Telephone Number: 021 487 8600
Email Address: [email protected]
Website Address: www.wesgro.co.za
External Auditors: Auditor-General South Africa
Bankers: ABSA ABSA Regional Office, 1st Floor Bridge Park East, Bridgeway, Century City, 7441
Company / Board Secretary: Kendra Stoffberg
7 general information
8part a
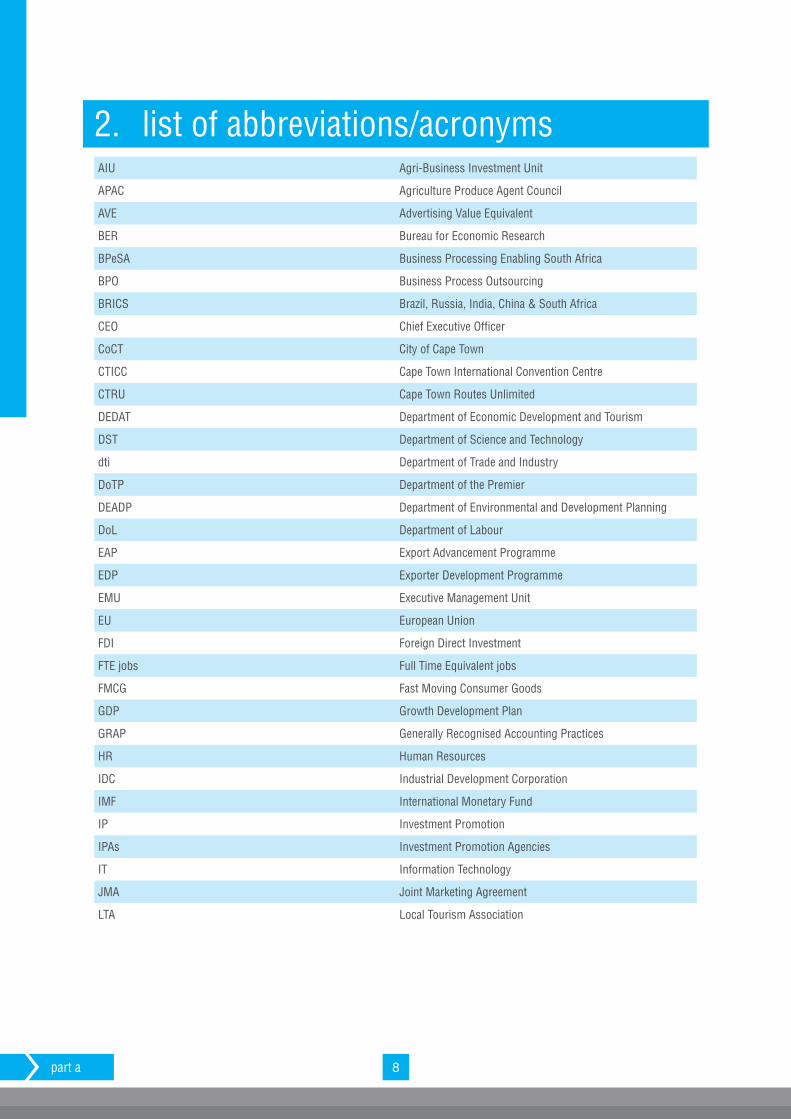
2. list of abbreviations/acronymsAIU Agri-Business Investment Unit
APAC Agriculture Produce Agent Council
AVE Advertising Value Equivalent
BER Bureau for Economic Research
BPeSA Business Processing Enabling South Africa
BPO Business Process Outsourcing
BRICS Brazil, Russia, India, China & South Africa
CEO Chief Executive Officer
CoCT City of Cape Town
CTICC Cape Town International Convention Centre
CTRU Cape Town Routes Unlimited
DEDAT Department of Economic Development and Tourism
DST Department of Science and Technology
dti Department of Trade and Industry
DoTP Department of the Premier
DEADP Department of Environmental and Development Planning
DoL Department of Labour
EAP Export Advancement Programme
EDP Exporter Development Programme
EMU Executive Management Unit
EU European Union
FDI Foreign Direct Investment
FTE jobs Full Time Equivalent jobs
FMCG Fast Moving Consumer Goods
GDP Growth Development Plan
GRAP Generally Recognised Accounting Practices
HR Human Resources
IDC Industrial Development Corporation
IMF International Monetary Fund
IP Investment Promotion
IPAs Investment Promotion Agencies
IT Information Technology
JMA Joint Marketing Agreement
LTA Local Tourism Association
9 general information
MCU Marketing and Communication Unit
MDG Millennium Development Goals
MFMA Municipal Finance Management Act
MOA Memorandum of Agreement
MOU Memorandum of Understanding
MTBPS Medium Term Budget Policy Statement
MTEF Medium Term Expenditure Framework
MTSF Medium Term Strategic Framework
NCA National Credit Act
NDP National Development Plan
NT National Treasury
OFDI Outward Foreign Direct Investment
OTS Opportunities To See
PFMA Public Finance Management Act
PSG Provincial Strategic Goal
PSP Provincial Strategic Plan
RSA Republic of South Africa
RTO Regional Tourism Organisation
SAOGA South African Oil and Gas Alliance
SARB South African Reserve Bank
SAT South African Tourism
SBIDZ Saldanha Bay Industrial Development Zone
SDG Sustainable Development Goals
SEZ Special Economic Zone
SLA Service Level Agreement
SMMEs Small, Medium and Micro-sized Enterprises
SOE Stated Owned Enterprises
SPV Special Purpose Vehicle
StatsSA Statistics South Africa
TNCs Transnational Companies
TP Trade Promotion
UN United Nations
UNCTAD United Nations Conference on Trade and Development
USA United States of America
WTO World Trade Organisation
ZAR South African Rand
10part a
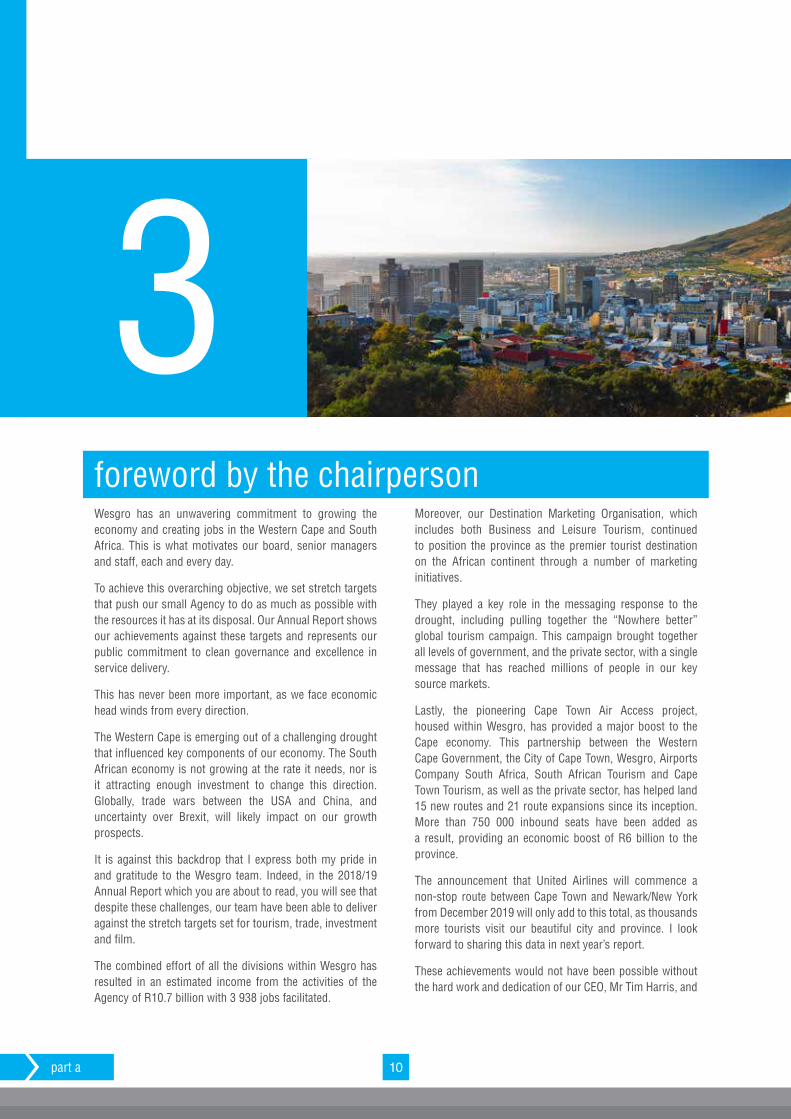
foreword by the chairpersonWesgro has an unwavering commitment to growing the economy and creating jobs in the Western Cape and South Africa. This is what motivates our board, senior managers and staff, each and every day.
To achieve this overarching objective, we set stretch targets that push our small Agency to do as much as possible with the resources it has at its disposal. Our Annual Report shows our achievements against these targets and represents our public commitment to clean governance and excellence in service delivery.
This has never been more important, as we face economic head winds from every direction.
The Western Cape is emerging out of a challenging drought that influenced key components of our economy. The South African economy is not growing at the rate it needs, nor is it attracting enough investment to change this direction. Globally, trade wars between the USA and China, and uncertainty over Brexit, will likely impact on our growth prospects.
It is against this backdrop that I express both my pride in and gratitude to the Wesgro team. Indeed, in the 2018/19 Annual Report which you are about to read, you will see that despite these challenges, our team have been able to deliver against the stretch targets set for tourism, trade, investment and film.
The combined effort of all the divisions within Wesgro has resulted in an estimated income from the activities of the Agency of R10.7 billion with 3 938 jobs facilitated.
Moreover, our Destination Marketing Organisation, which includes both Business and Leisure Tourism, continued to position the province as the premier tourist destination on the African continent through a number of marketing initiatives.
They played a key role in the messaging response to the drought, including pulling together the “Nowhere better” global tourism campaign. This campaign brought together all levels of government, and the private sector, with a single message that has reached millions of people in our key source markets.
Lastly, the pioneering Cape Town Air Access project, housed within Wesgro, has provided a major boost to the Cape economy. This partnership between the Western Cape Government, the City of Cape Town, Wesgro, Airports Company South Africa, South African Tourism and Cape Town Tourism, as well as the private sector, has helped land 15 new routes and 21 route expansions since its inception. More than 750 000 inbound seats have been added as a result, providing an economic boost of R6 billion to the province.
The announcement that United Airlines will commence a non-stop route between Cape Town and Newark/New York from December 2019 will only add to this total, as thousands more tourists visit our beautiful city and province. I look forward to sharing this data in next year’s report.
These achievements would not have been possible without the hard work and dedication of our CEO, Mr Tim Harris, and
3
11 general information
the Wesgro staff. On behalf of the Wesgro board, I wish to thank every member for their tireless efforts in helping grow the economy and creating jobs.
These results would also not have been possible without the support, vision and motivation provided by our partners in government. I would therefore like to thank our partners in the Western Cape government - led by Premier Alan Winde and MEC David Maynier – as well as our partners in the the City of Cape Town – led by Mayor Dan Plato and Alderman James Vos - for their guidance and leadership.
And finally, to my fellow board members: I thank you for your commitment to ensuring that Wesgro is a world-class, well-run, public entity that contributes positively to the economy of our province and country. This commitment to excellence is reflected in this Annual Report.
In the end, the question we should all be asking ourselves in South Africa, each and every day, is whether our projects and interventions are helping create jobs for the millions of citizens who remain unemployed or have given up looking for work. This must be our guiding light.
To all the residents of the Western Cape, our stakeholders and partners in government, and to the business community at large, you have our unwavering commitment to ensuring this priority is given effect to in all our endeavours.
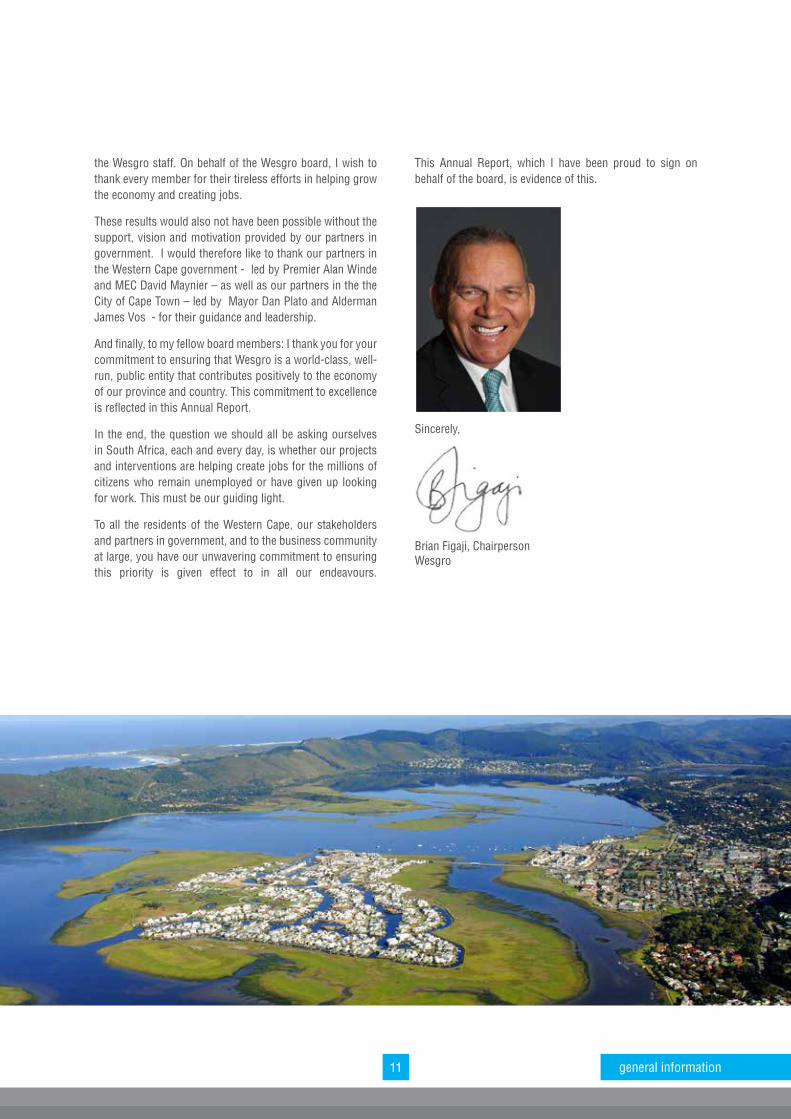
This Annual Report, which I have been proud to sign on behalf of the board, is evidence of this.
Sincerely,
Brian Figaji, ChairpersonWesgro
12part a
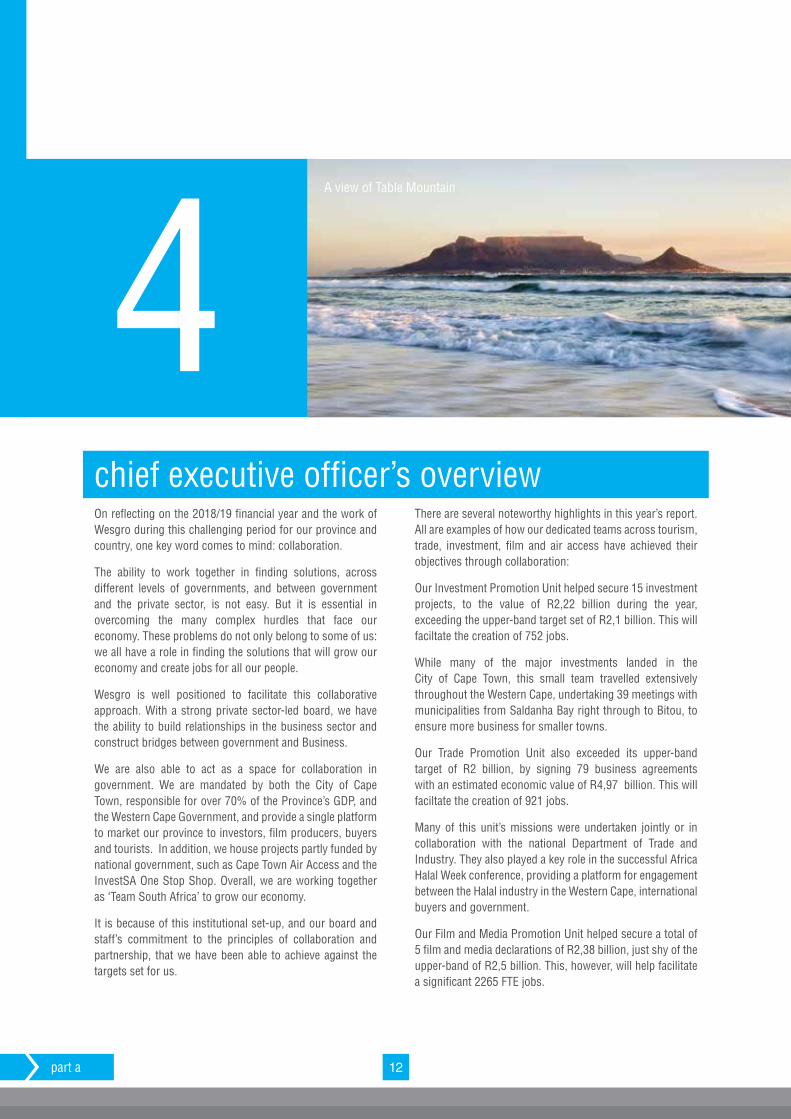
chief executive officer’s overviewOn reflecting on the 2018/19 financial year and the work of Wesgro during this challenging period for our province and country, one key word comes to mind: collaboration.
The ability to work together in finding solutions, across different levels of governments, and between government and the private sector, is not easy. But it is essential in overcoming the many complex hurdles that face our economy. These problems do not only belong to some of us: we all have a role in finding the solutions that will grow our economy and create jobs for all our people.
Wesgro is well positioned to facilitate this collaborative approach. With a strong private sector-led board, we have the ability to build relationships in the business sector and construct bridges between government and Business.
We are also able to act as a space for collaboration in government. We are mandated by both the City of Cape Town, responsible for over 70% of the Province’s GDP, and the Western Cape Government, and provide a single platform to market our province to investors, film producers, buyers and tourists. In addition, we house projects partly funded by national government, such as Cape Town Air Access and the InvestSA One Stop Shop. Overall, we are working together as ‘Team South Africa’ to grow our economy.
It is because of this institutional set-up, and our board and staff’s commitment to the principles of collaboration and partnership, that we have been able to achieve against the targets set for us.
There are several noteworthy highlights in this year’s report. All are examples of how our dedicated teams across tourism, trade, investment, film and air access have achieved their objectives through collaboration:
Our Investment Promotion Unit helped secure 15 investment projects, to the value of R2,22 billion during the year, exceeding the upper-band target set of R2,1 billion. This will faciltate the creation of 752 jobs.
While many of the major investments landed in the City of Cape Town, this small team travelled extensively throughout the Western Cape, undertaking 39 meetings with municipalities from Saldanha Bay right through to Bitou, to ensure more business for smaller towns.
Our Trade Promotion Unit also exceeded its upper-band target of R2 billion, by signing 79 business agreements with an estimated economic value of R4,97 billion. This will faciltate the creation of 921 jobs.
Many of this unit’s missions were undertaken jointly or in collaboration with the national Department of Trade and Industry. They also played a key role in the successful Africa Halal Week conference, providing a platform for engagement between the Halal industry in the Western Cape, international buyers and government.
Our Film and Media Promotion Unit helped secure a total of 5 film and media declarations of R2,38 billion, just shy of the upper-band of R2,5 billion. This, however, will help facilitate a significant 2265 FTE jobs.
4A view of Table Mountain
13 general information
This small team of two not only proactively became African Film Commissioners, to help create better linkages between the Western Cape and the African film network, but also worked closely with initiatives such as Film Cape Town to respond to the challenges the film industry encountered during the year, including the drought.
Our Destination Marketing Organisation, which includes both Leisure and Business Tourism units, worked hard during a challenging year to promote our beautiful city and province to visitors and delegates. The total estimated economic value of these initiatives supported amounts to R1, 15 billion. This far exceeded the target of R171, 6 million.
The “Nowhere Better” global tourism campaign which was put together by all levels of government and the private sector was the first “white label” campaign produced in the tourism industry, and provided an unprecedented effort to counter the negative messaging linked to the drought and its associated “Day Zero” message. This campaign has reached millions of prospective travellers.
Our Marketing and Communications Unit, tasked with building confidence in the economy of the province through media and marketing tools, helped generate R157,4 million in Advertising Value Equivalent. This was essential given the numerous shocks in the media linked to the drought, crime and corruption.
The Unit also worked with the City of Cape Town’s Invest Cape Town initiative, DEDAT and the InvestSA One Stop Shop on the province’s first ever-global investor confidence campaign. This digital campaign targeted investors in key source markets, and represented the Western Cape’s commitment to President Ramaphosa’s objective of landing US$100 billion in foreign direct investment.
Finally, the award-winning Cape Town Air Access partnership housed within Wesgro is the embodiment of the spirit of partnership and collaboration. This partnership between government and the private sector helped land major routes, including a non-stop flight between Cape Town and Hong Kong, as well as the much-awaited non-stop flight between Cape Town and New York. We are now looking to improve connectivity to West Africa, Australia and South America. Watch this space.
Behind these numbers is a dedicated team at Wesgro who inspired every day to help grow the economy and create jobs in the Western Cape and South Africa. I would like to thank each and every one of them for their hard work and commitment.
I also wish to thank our partners at all levels of government, and the private sector, for collaborating with us, as we seek to make the Western Cape the most successful regional economy in the world.
In particular, I wish to thank the Western Cape Government’s Department of Economic Development and Tourism, under the leadership of Mr Solly Fourie, and the City of Cape Town’s Enterprise and Investment Department, under the leadership of Mr Lance Greyling. These departments contribute greatly to our achievements and are part of our success.
Successful organisations are governed by boards with an unwavering commitment to the values of excellence and good-governance. There is no better example than this than Wesgro. I wish to thank every board member for their leadership and guidance and for always expecting nothing but the best from our team.
Over the next year, we will no doubt encounter many more hurdles that will need a joint-up approach to solving them. At Wesgro we are committed to addressing these challenges with determination and in the spirit of collaboration. This has never been more important.
To our stakeholders in government and the private sector, and to all the residents of the Western Cape: join us in telling the world that Cape Town and the Western Cape is open for business. There really is nowhere better.
.
Tim Harris, Chief Executive Officer Wesgro
A view of Table Mountain
14part a
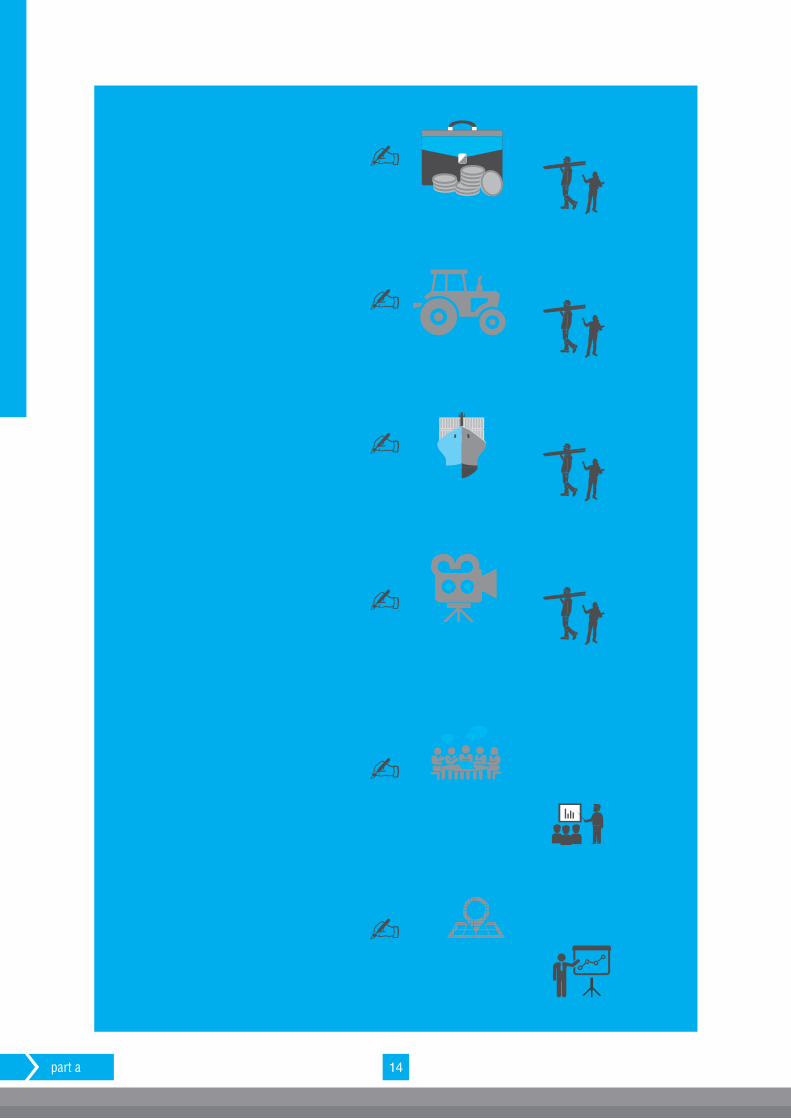
752
jobs createdagainst a target of R1,3bn to R2,1bn
Investment Promotion Unit
487
jobs createdagainst a target of R300m to R420m
against a target of R1,1bn to R2bn
Agribusiness Investment Unit
921
jobs created
Trade Promotion Unit
2265
fte jobs created
against a target of R1,5bn to R2,5bn
Film and Media Promotion Unit
45 strategic media engagements were hostedagainst a target of eight
generated a total of R157,4m in advertising value equivalent (AVE)
Marketing and Communication Unit
against a
target of 13
with an estimated economic impact of over R1bn
Destination Marketing
secured 15 investment projects, to the value of
R2,22bn
six investment projects, to the value of
R653,9m were realised
79 business agreements with an estimated economic value of
R4,97bn
total of five film and media declarations to the value of
R2,38bn were recorded
51 strategic corporate agency events hosted against a target of eight
supported 34 tourism marketing initiatives
15 general information
5. statement of responsibility and confirmation of accuracy for the annual report
To the best of my knowledge and belief, I confirm the following:
All information and amounts disclosed in the annual report are consistent with the annual financial statements audited by the Auditor-General.
The annual report is complete, accurate, and free from any omissions.
The annual report has been prepared in accordance with the guidelines on the annual report as issued by National Treasury.
The Annual Financial Statements (Part E) have been prepared in accordance with the South African Standards of Generally Recognised Accounting Practices (GRAP), standards applicable to the public entity.
The accounting authority is responsible for the preparation of the annual financial statements and for the judgements made in this information.
The accounting authority is responsible for establishing and implementing a system of internal control, which has been designed to provide reasonable assurance as to the integrity and reliability of the performance information, the human resources information and the annual financial statements.
The external auditors are engaged to express an independent opinion on the annual financial statements.
In our opinion, the annual report fairly reflects the operations, the performance information, the human resources information, and the financial affairs of the public entity for the financial year ended 31 March 2019.
Yours faithfully
Tim Harris Brian FigajiChief Executive Officer Chairperson of the Board Date: 31 July 2019 Date: 31 July 2019
16part a
6. strategic overview6.1. vision To grow the Western Cape economy beyond expectation.
6.2. missionThe mission of Wesgro is:
l To attract and retain direct investment in the Western Cape, grow exports, and market the province as a competitive and sustainable tourism destination globally
l To facilitate the link between business and government decision-makers
l To provide service excellence in all our business support functions.
6.3. valuesWesgro management and staff will strive to uphold the following values in all its business activities:
l Professionalism and commitment to excellence
l Efficient and outcomes driven
l Accountability
l Innovation
l Enabling
l Passionate
l Integrity and trust
7. legislative and other mandates7.1. legislative mandateWesgro draws its mandate from the Wesgro Act, 1996 as amended according to the Western Cape Investment and Trade Promotion Agency Amendment Act, Act No. 6 of 2013.
The objectives of the Agency shall be:
a) To promote tourism, trade and investment in the Western Cape province
b) To undertake, at the request of the responsible Member or other stakeholders or agencies, activities for which the necessary resources can be raised and which, in the opinion of the Board, will contribute to the strengthening of the Western Cape and/or promote equitable participation in the economy by sectors of the community and/or regions of the Western Cape.
In terms of the PFMA, Act No. 1 of 1999 Wesgro is a Schedule 3(c) public entity.
7.2. policy mandatesNational policy framework:In our review of the policy framework at national level, we have analysed the following documents:
l National Development Plan (NDP)
The National Development Plan (NDP) represents a vision
for South Africa in 2030. It aims to enable faster economic growth, higher investment, and greater labour absorption. The NDP contains detailed plans and interventions across all sectors of the economy to enable the achievement of this vision.
l Medium Term Strategic Framework (MTSF)
The Medium Term Strategic Framework (MTSF) is Govern-ment’s strategic plan for the 2014–2019 electoral term. The MTSF sets out the actions Government will take and the targets to be achieved. It also provides a framework for the other plans of national, provincial and local government.
Provincial policy framework
In our review of the policy framework at provincial level, we have reviewed the following documents:
l Project Khulisa
Project Khulisa identified “a small number of high potential opportunities that can deliver meaningful jobs and growth within a 3–5 year framework”. It is a contribution to the achievement of the Provincial Strategic Goal 1 – creating opportunities for economic growth and jobs. It is defined by an effort to narrow the focus of government interventions, but to engage deeply within the chosen sectors. Project Khulisa identified three horizons:
Ü Horizon 1 – Over the next 3–5 years, the focus will be on the Tourism, Oil, Gas, and Agro-processing sectors of the Western Cape economy.
17 general information
Ü Horizon 2 – Over the next 5–10 years, the expanded focus will be on Business Process Outsourcing and the Film sectors.
Ü Horizon 3 – Over the next 10 plus years, the approach is to build on the broader ecosystem, namely the ICT and Software, Manufacturing and Private Healthcare sectors.
Wesgro, in conjunction with the Department of Economic Development and Tourism and other departments active in the promotion of PSG 1, will play a central role in achieving the stated objectives in each of the chosen sectors.
l OneCape2040
The OneCape 2040 vision was developed by a broad range of stakeholders and envisages six transitions. The vision is of a highly-skilled, innovation-driven, resource-efficient, connected, high-opportunity and collaborative society.
l Provincial Strategic Plan (PSP)
The PSP sets out the five provincial strategic goals, which are:
Ü PSG 1 – Create opportunities for economic growth and jobs
Ü PSG 2 – Improve education outcomes and opportunities for youth development
Ü PSG 3 – Increase wellness and safety and tackle social ills
Ü PSG 4 – Build a quality living environment, resilient to climate change
Ü PSG 5 – Embed good governance and integrated service delivery through partner-ships and spatial alignment.
DEDAT through its programmes and activities contributes to PSG 1. The following strategic priorities have been identified by DEDAT:
Ü Invest in growing, attracting and retaining the skills required by our economy
Ü Support entrepreneurs and small businesses
Ü Make it easier to do business by addressing red tape
Ü Invest in high quality, efficient and competitive infrastructure
Ü Rebrand the region to increase internal and external investment
Ü Open markets for Western Cape firms and key sectors wanting to export
Ü Ensure our economic, social and environ-mental sustainability
Ü Demonstrate leadership which promotes an improved regional economic ecosystem (governance) and embraces innovation
Ü Improve our visitor economy through destination marketing.
l State of the Province Address
This is the speech delivered by the Premier at the start of the year setting out the Provincial Government’s priorities for the year.
l Green Economy Strategic Framework
The aim of the framework is to position the Western Cape as the lowest carbon footprint province in South Africa and the leading green economic hub of the African continent.
l The Western Cape Infrastructure Framework
The provincial Infrastructure Framework aligns the planning, delivery and management of infrastructure provided by all stakeholders (national government, provincial government, local government, parastatals and the private sector).
l International Relations Strategy
The international relations strategy aims to harness the activities of the provincial government for maximum impact of our economic diplomacy efforts.
Policy frameworks at municipal level: l Integrated Development Plan (IDP) of the
District Municipalities
l Local Economic Development Strategies of Cape Winelands; Central Karoo; Eden; Cape Overberg and West Coast
l Integrated Development Plan (IDP) of the City of Cape Town
l Economic Development Strategy of the City of Cape Town
part a
Tourists on kayaks viewing penguins at Boulder’s Beach near Simon’s Town in Cape Town
18
general information
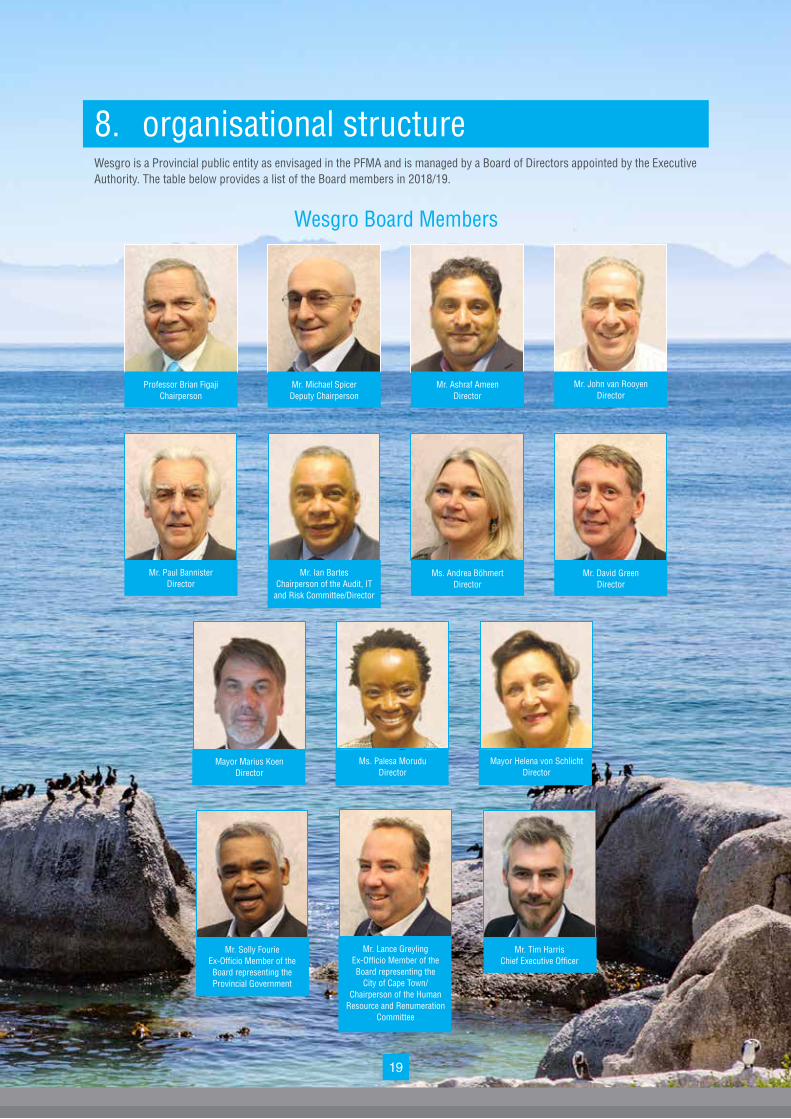
Mr. Paul BannisterDirector
Mr. Ian Bartes Chairperson of the Audit, IT
and Risk Committee/Director
Ms. Andrea BöhmertDirector
Mr. David GreenDirector
Mayor Helena von SchlichtDirector
Ms. Palesa MoruduDirector
Mayor Marius KoenDirector
Mr. Solly Fourie Ex-Officio Member of the Board representing the Provincial Government
Mr. Lance GreylingEx-Officio Member of the Board representing the
City of Cape Town/ Chairperson of the Human
Resource and Renumeration Committee
Mr. Tim HarrisChief Executive Officer
Mr. Ashraf AmeenDirector
8. organisational structureWesgro is a Provincial public entity as envisaged in the PFMA and is managed by a Board of Directors appointed by the Executive Authority. The table below provides a list of the Board members in 2018/19.
Wesgro Board Members
Professor Brian Figaji Chairperson
Mr. Michael SpicerDeputy Chairperson
19
Mr. John van RooyenDirector
20part a
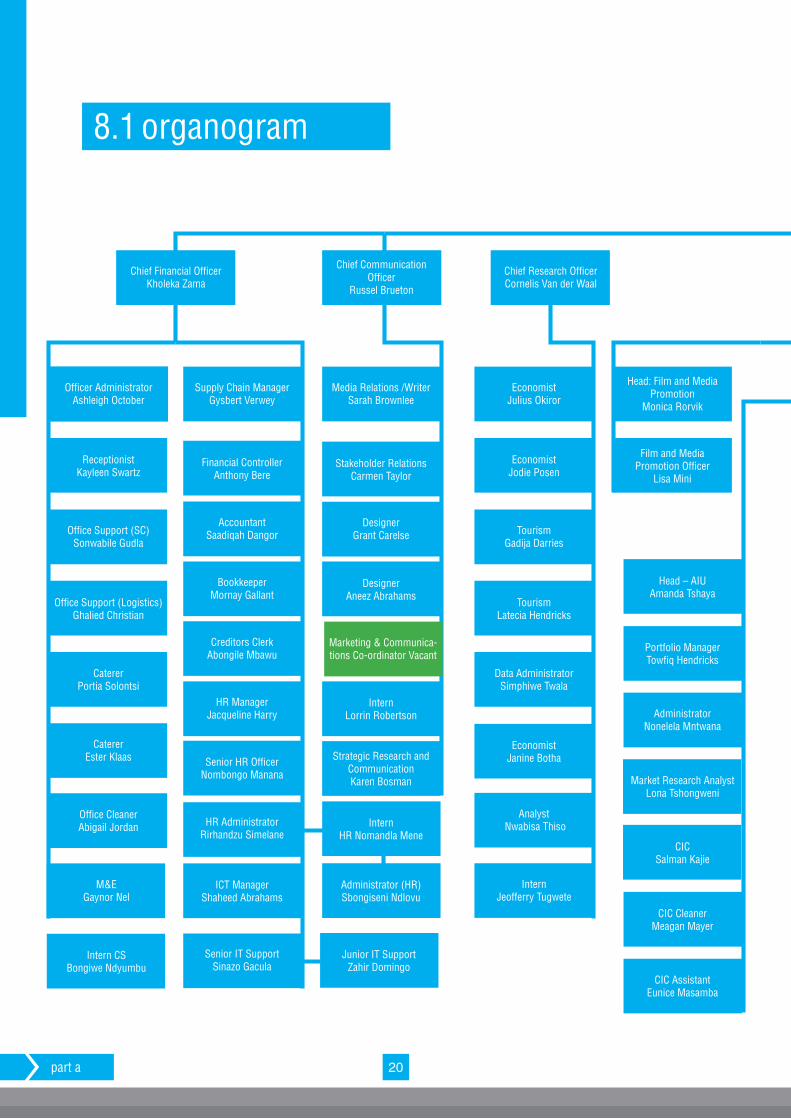
Officer Administrator Ashleigh October
Chief Financial OfficerKholeka Zama
Chief Communication Officer
Russel Brueton
Chief Research OfficerCornelis Van der Waal
Office Support (SC)Sonwabile Gudla
CatererPortia Solontsi
Office CleanerAbigail Jordan
ReceptionistKayleen Swartz
Office Support (Logistics)Ghalied Christian
CatererEster Klaas
M&EGaynor Nel
Intern CSBongiwe Ndyumbu
Supply Chain ManagerGysbert Verwey
EconomistJulius Okiror
Head: Film and Media Promotion
Monica Rorvik
Media Relations /Writer Sarah Brownlee
AccountantSaadiqah Dangor Tourism
Gadija Darries
DesignerGrant Carelse
Creditors ClerkAbongile Mbawu
Data AdministratorSimphiwe Twala
Portfolio ManagerTowfiq Hendricks
InternLorrin Robertson
Strategic Research and CommunicationKaren Bosman
Senior HR OfficerNombongo Manana
HR AdministratorRirhandzu Simelane
Market Research AnalystLona Tshongweni
CICSalman Kajie
CIC CleanerMeagan Mayer
CIC AssistantEunice Masamba
Financial ControllerAnthony Bere
EconomistJodie Posen
Film and Media Promotion Officer
Lisa MiniStakeholder Relations
Carmen Taylor
BookkeeperMornay Gallant
TourismLatecia Hendricks
Head – AIUAmanda Tshaya
DesignerAneez Abrahams
HR ManagerJacqueline Harry
Analyst Nwabisa Thiso
InternJeofferry Tugwete
AdministratorNonelela Mntwana
Marketing & Communica-tions Co-ordinator Vacant
ICT ManagerShaheed Abrahams
Administrator (HR)Sbongiseni Ndlovu
InternHR Nomandla Mene
Junior IT SupportZahir Domingo
EconomistJanine Botha
Senior IT SupportSinazo Gacula
8.1 organogram
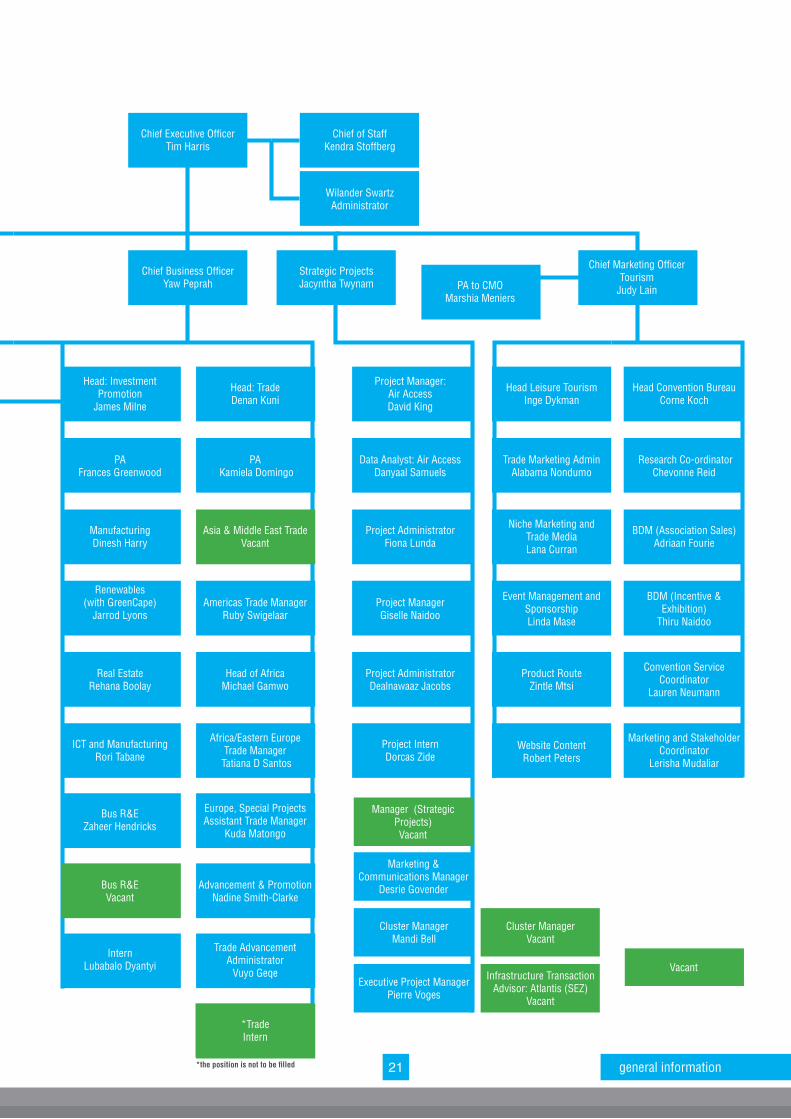
21 general information
Chief of StaffKendra Stoffberg
Chief Business OfficerYaw Peprah
Strategic Projects Jacyntha Twynam PA to CMO
Marshia Meniers
Chief Marketing Officer Tourism
Judy Lain
Project Manager: Air AccessDavid King
Head Leisure Tourism Inge Dykman
Head Convention BureauCorne Koch
Project AdministratorFiona Lunda
Niche Marketing and Trade MediaLana Curran
BDM (Association Sales)Adriaan Fourie
Project AdministratorDealnawaaz Jacobs
Product Route Zintle Mtsi
Convention Service Coordinator
Lauren Neumann
Manager (Strategic Projects)Vacant
Marketing & Communications Manager
Desrie Govender
Cluster Manager Mandi Bell
Cluster Manager Vacant
Executive Project Manager Pierre Voges
Infrastructure Transaction Advisor: Atlantis (SEZ)
Vacant
Data Analyst: Air AccessDanyaal Samuels
Trade Marketing Admin Alabama Nondumo
Research Co-ordinatorChevonne Reid
Project ManagerGiselle Naidoo
Event Management and SponsorshipLinda Mase
BDM (Incentive & Exhibition)
Thiru Naidoo
Project InternDorcas Zide
Website ContentRobert Peters
Marketing and Stakeholder Coordinator
Lerisha Mudaliar
Head: Investment Promotion
James Milne
Head: TradeDenan Kuni
ManufacturingDinesh Harry
Asia & Middle East Trade Vacant
Real Estate Rehana Boolay
Head of AfricaMichael Gamwo
Bus R&EZaheer Hendricks
Europe, Special Projects Assistant Trade Manager
Kuda Matongo
PA Frances Greenwood
Renewables (with GreenCape)
Jarrod LyonsAmericas Trade Manager
Ruby Swigelaar
ICT and ManufacturingRori Tabane
Africa/Eastern Europe Trade Manager
Tatiana D Santos
Bus R&EVacant
Advancement & PromotionNadine Smith-Clarke
Intern Lubabalo Dyantyi
Trade Advancement Administrator
Vuyo Geqe
*Trade Intern
Vacant
Wilander SwartzAdministrator
PA Kamiela Domingo
*the position is not to be filled
Chief Executive OfficerTim Harris

Cango Caves in Oudtshoorn, Western Cape

part b: performance inform
ation

performance information
part b
part b: performance information
1. auditor’s report: predetermined objectives
The Auditor-General of South Africa currently performs the necessary audit procedures on the performance information to provide reasonable assurance in the form of an audit conclusion. The audit conclusion on the performance against predetermined objectives is included in the report to management, with material findings being reported under
the “Predetermined Objectives” heading in the “Report on other legal and regulatory requirements” section of the auditor’s report.
Refer to page 93 – 94 of the Auditor’s Report, published as Part E: Financial Information.
2. situational analysis2.1. service delivery environmentA number of headwinds during the period under review created a challenging environment for the Agency to deliver. An increasingly volatile global trade regime, a stagnating economy at home, and the ongoing effects of the drought on the Western Cape, in particular, contributed to this situation. Notwithstanding these very serious challenges, the Agency performed well under the period under review.
During the financial year under review the Agency committed a total of 15 investment projects with an investment value of R2,22bn, resulting in the facilitation of 752 jobs. The Agency, through investment promotion, has contributed to the objectives outlined in Project Khulisa through the realisation of investments in the renewable energy and manufacturing sectors, among others. The Agency continues to focus on building a robust project pipeline, focusing on the sectors outlined in Project Khulisa as it adopts a targeted, data-driven approach to investment promotion.
Through increased efforts in driving global exports and the facilitation of outward foreign direct investment (OFDI), the Agency performed well during the period under review. A total of 79 trade promotion business agreements were signed, with an estimated economic impact of R4,97bn, resulting in the facilitation of 921 jobs. In addition, seven OFDI projects were committed to the value of R381m.
To circumvent economic challenges and uncertainty around foreign direct investment projects, the Agency has set the targets for the Investment Promotion and Trade Promotion programme within a range. With this in mind, it should be noted that the deviations from the planned targets set are calculated based on the lower limit of the band.
As one of the key focus areas of Project Khulisa, the
Agency has confidently pursued its mandate to promote the province and the city as the preferred business and tourism destination, through the implementation of various tourism destination marketing initiatives. During the period under review, the Agency supported a total of 34 tourism destination marketing initiatives, with an estimated economic impact of over R1,1bn. The Convention Bureau secured 30 bids, with an estimated economic impact of over R1bn. Wesgro financially supported 50 regional events during the reporting period.
The Agency has emphasised the importance of research-driven planning and lead generation. The Research team assists the Agency in achieving its mandate, by providing economic research, and market intelligence to support the work of tourism, trade, investment and film, and for the use of Wesgro clients. During the financial year under review, the Agency produced 105 publications and completed 237 information requests with an average turnaround time of 1,4 days.
As part of the new strategy, the Agency focused on building the Cape’s business brand, the provincial tourism brand and the Wesgro brand. A number of reputation management and knowledge building initiatives were implemented. During the financial year under review, the Agency generated a total of R157,4m worth of media coverage (measured using “Advertising Value-Equivalent”). Furthermore, a total of 51 strategic corporate engagements and 45 media engagements were held.
The film and media industry continues to gain momentum, and significant strides have been made in promoting the province as a globally competitive filming destination.
25 performance information
26part b
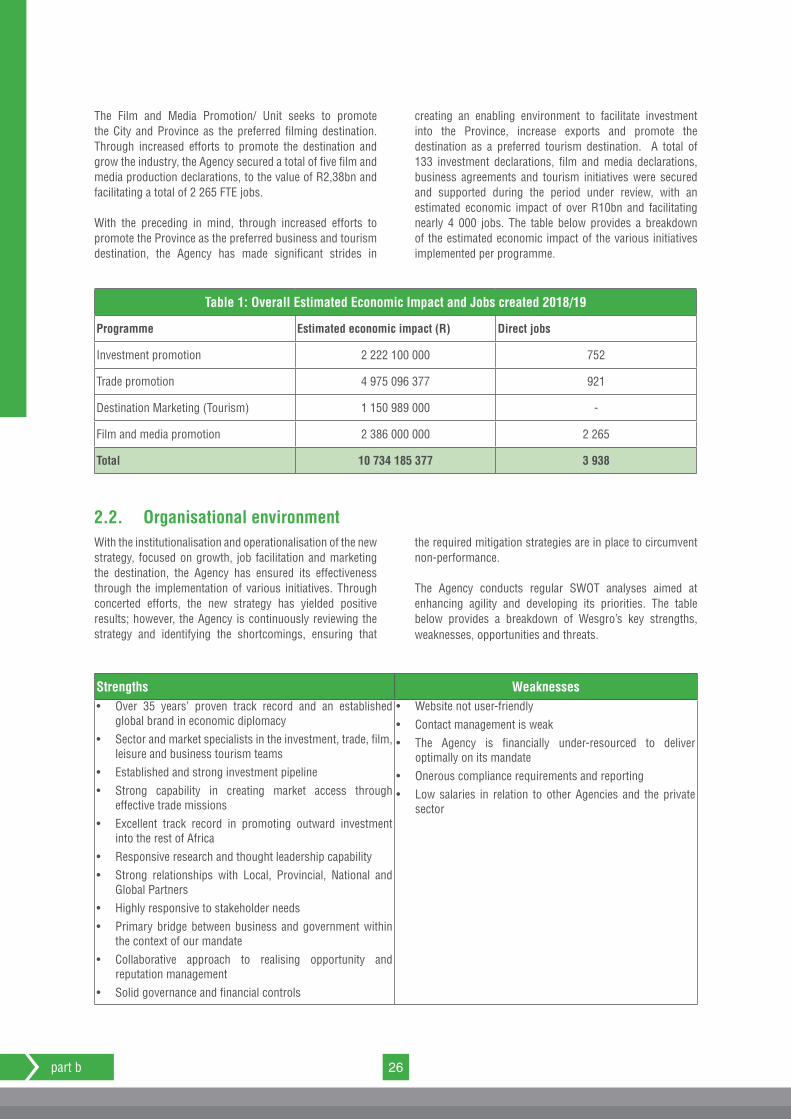
The Film and Media Promotion/ Unit seeks to promote the City and Province as the preferred filming destination. Through increased efforts to promote the destination and grow the industry, the Agency secured a total of five film and media production declarations, to the value of R2,38bn and facilitating a total of 2 265 FTE jobs.
With the preceding in mind, through increased efforts to promote the Province as the preferred business and tourism destination, the Agency has made significant strides in
creating an enabling environment to facilitate investment into the Province, increase exports and promote the destination as a preferred tourism destination. A total of 133 investment declarations, film and media declarations, business agreements and tourism initiatives were secured and supported during the period under review, with an estimated economic impact of over R10bn and facilitating nearly 4 000 jobs. The table below provides a breakdown of the estimated economic impact of the various initiatives implemented per programme.
Table 1: Overall Estimated Economic Impact and Jobs created 2018/19
Programme Estimated economic impact (R) Direct jobs
Investment promotion 2 222 100 000 752
Trade promotion 4 975 096 377 921
Destination Marketing (Tourism) 1 150 989 000 -
Film and media promotion 2 386 000 000 2 265
Total 10 734 185 377 3 938
2.2. Organisational environment With the institutionalisation and operationalisation of the new strategy, focused on growth, job facilitation and marketing the destination, the Agency has ensured its effectiveness through the implementation of various initiatives. Through concerted efforts, the new strategy has yielded positive results; however, the Agency is continuously reviewing the strategy and identifying the shortcomings, ensuring that
the required mitigation strategies are in place to circumvent non-performance.
The Agency conducts regular SWOT analyses aimed at enhancing agility and developing its priorities. The table below provides a breakdown of Wesgro’s key strengths, weaknesses, opportunities and threats.
Strengths Weaknesses• Over 35 years’ proven track record and an established
global brand in economic diplomacy• Sector and market specialists in the investment, trade, film,
leisure and business tourism teams• Established and strong investment pipeline• Strong capability in creating market access through
effective trade missions• Excellent track record in promoting outward investment
into the rest of Africa• Responsive research and thought leadership capability• Strong relationships with Local, Provincial, National and
Global Partners• Highly responsive to stakeholder needs• Primary bridge between business and government within
the context of our mandate• Collaborative approach to realising opportunity and
reputation management• Solid governance and financial controls
• Website not user-friendly• Contact management is weak• The Agency is financially under-resourced to deliver
optimally on its mandate• Onerous compliance requirements and reporting• Low salaries in relation to other Agencies and the private
sector
27 performance information
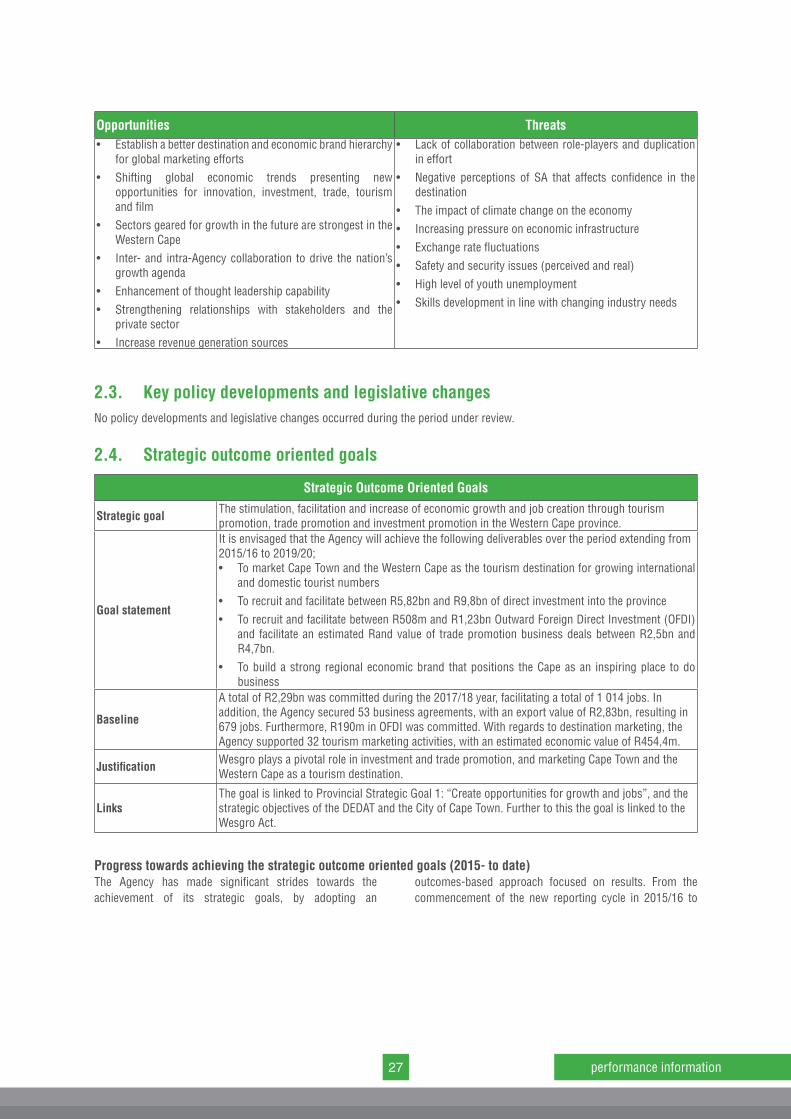
Opportunities Threats• Establish a better destination and economic brand hierarchy
for global marketing efforts• Shifting global economic trends presenting new
opportunities for innovation, investment, trade, tourism and film
• Sectors geared for growth in the future are strongest in the Western Cape
• Inter- and intra-Agency collaboration to drive the nation’s growth agenda
• Enhancement of thought leadership capability• Strengthening relationships with stakeholders and the
private sector• Increase revenue generation sources
• Lack of collaboration between role-players and duplication in effort
• Negative perceptions of SA that affects confidence in the destination
• The impact of climate change on the economy• Increasing pressure on economic infrastructure• Exchange rate fluctuations• Safety and security issues (perceived and real)• High level of youth unemployment• Skills development in line with changing industry needs
2.3. Key policy developments and legislative changesNo policy developments and legislative changes occurred during the period under review.
2.4. Strategic outcome oriented goals
Strategic Outcome Oriented Goals
Strategic goal The stimulation, facilitation and increase of economic growth and job creation through tourism promotion, trade promotion and investment promotion in the Western Cape province.
Goal statement
It is envisaged that the Agency will achieve the following deliverables over the period extending from 2015/16 to 2019/20;• To market Cape Town and the Western Cape as the tourism destination for growing international
and domestic tourist numbers• To recruit and facilitate between R5,82bn and R9,8bn of direct investment into the province• To recruit and facilitate between R508m and R1,23bn Outward Foreign Direct Investment (OFDI)
and facilitate an estimated Rand value of trade promotion business deals between R2,5bn and R4,7bn.
• To build a strong regional economic brand that positions the Cape as an inspiring place to do business
Baseline
A total of R2,29bn was committed during the 2017/18 year, facilitating a total of 1 014 jobs. In addition, the Agency secured 53 business agreements, with an export value of R2,83bn, resulting in 679 jobs. Furthermore, R190m in OFDI was committed. With regards to destination marketing, the Agency supported 32 tourism marketing activities, with an estimated economic value of R454,4m.
Justification Wesgro plays a pivotal role in investment and trade promotion, and marketing Cape Town and the Western Cape as a tourism destination.
LinksThe goal is linked to Provincial Strategic Goal 1: “Create opportunities for growth and jobs”, and the strategic objectives of the DEDAT and the City of Cape Town. Further to this the goal is linked to the Wesgro Act.
Progress towards achieving the strategic outcome oriented goals (2015- to date)The Agency has made significant strides towards the achievement of its strategic goals, by adopting an
outcomes-based approach focused on results. From the commencement of the new reporting cycle in 2015/16 to
28part b
date, the Investment Promotion Unit committed a total of 49 projects with an investment value of R8,61bn, facilitating a total of 3 143 jobs.
Aimed at increasing the value of global exports and assisting companies expand into Africa, the Agency has adopted a more proactive approach, which has yielded positive results. A total of 173 trade promotion business agreements were signed with an estimated export value of R16,85bn, facilitating 2 381 jobs. In addition, the Agency committed three OFDI projects, with an investment value of R1,07bn.
To promote the region as a preferred tourism and business destination the Agency has implemented and supported various tourism initiatives. Guided by Project Khulisa, the Agency has focused on specific initiatives that contribute to regional growth and job creation. During the period under
review the Agency supported a total of 80 tourism initiatives with an estimated economic value of R2,04bn. The initiatives supported throughout the period enabled the Agency to increase awareness about the region, generating a total of R288,2m worth of advertising value equivalent (AVE).
Furthermore, the Agency is committed to building a globally competitive film sector within the province and has implemented a robust strategy aimed at strengthening the sector and attracting productions in to the Province. For the period under review, the Agency has signed a total of 19 film and media declarations with an estimated value of over R5bn, facilitating a total of 7 984 FTE jobs.
29 performance information
3. performance information by programme3.1. programme 1: corporate servicesPurposeThe purpose of the programme is to provide efficient, cost effective, transparent and responsive corporate services to the Agency and ensure that the principles of good corporate governance are implemented.
Programme structureSub-programme 1.1: Financial managementEffective financial management is aimed at ensuring the upholding of the legislative requirements of the Agency. The sub-programme of financial management will also ensure that the necessary resources to efficiently run core operations are provided.
Sub-programme 1.2: IT and Administrative servicesAs a provincial public entity, the Agency also has to comply with the Public Finance Management Act 1 of 1999 and the Public Service Act. Wesgro is compelled to follow the principles of these Acts in ensuring that modernisation of systems of management within the public sector is achieved, and transparency and accountability are maintained and visible.
The corporate services programme has a focus on maintaining sound IT and administrative systems and infrastructure. Effective systems and processes are a necessary component to maintain credibility, ensure accountability, improve operating efficiencies and generate institutional memory.
Sub-programme 1.3: Human Resource ManagementThe Human Resources sub-programme will help ensure that the Agency becomes the employer of choice and maintains a world-class, talented and skilled workforce. A priority is to attract, recruit and retain staff by creating a culture and climate conducive to sustaining a motivated workforce. In addition, the sub-programme will ensure all legislative compliance with regards to human resource management.
Sub- programme 1.4: Monitoring and Evaluation This sub-programme is responsible for the implementation and management of reporting systems, which must comply with the guidelines set in the Treasury Regulations and the Public Finance Management Act (PFMA). The sub-programme is also responsible for the timely and accurate delivery of monthly, quarterly, and annual reports to stakeholders.
Strategic objectivesThe strategic objectives of the programme are:
l To attain and maintain a high-level financial management capability over 5 years
l To provide first class IT and administration services to the Agency
l To create a culture and climate to attract, sustain and retain a motivated, talented and skilled workforce and ensure that the Agency becomes the employer of choice
l To ensure that an effective monitoring and evaluation system is implemented aligned to the legislative and regulatory prescripts pertaining to performance management.
Strategic objectives, performance indicators, planned targets and actual achievements
Financial ManagementDuring the financial year under review, the Unit implemented the necessary systems and processes to ensure compliance with the relevant legislative prescripts in terms of expenditure and supply chain management, as well as performance management. The Agency received an unqualified audit for the 2017/18 financial year.
The final budget and Annual Performance Plan for the ensuing financial year were completed and submitted as per the legislative requirements. The new project management budget tool was installed and will be implemented in the ensuing financial year.
IT and administrative servicesSince the in-sourcing of the IT function, the Agency has updated IT infrastructure and streamlined various processes to enhance operational efficiency.
The recent upgrading of IT infrastructure resulted in an increase in network security, which led to a significant decrease in downtime. With the preceding in mind, the Agency experienced downtime of four hours and two minutes for the period under review.
Desktop support continues to respond to IT support queries timeously, due to the implementation of efficient processes.
HR The annual inflationary staff increase of 6,5% was approved by the Wesgro Board and was effected on 1 April 2018.
The Agency has signed off the performance agreements for the 2018/19 period and has implemented the training needs identified, subject to the budget. As part of the implementation, the Agency also assisted staff members by allocating funds towards their post-graduate programmes, which will further assist to develop them in both their
30part b
professional and personal capacities. This forms part of the retention strategy.
The external audit was completed successfully and signed off, and the performance bonus for 2017/18 was approved by the Wesgro Board and paid in August 2018.
To create employment and growth opportunities for talented young individuals, Wesgro implemented an annual internship programme. As part of the programme, the Agency participated in Career Expos at Stellenbosch University, the University of the Western Cape and the University of Cape Town, aimed at promoting and profiling the Agency as the employer of choice.
Monitoring and Evaluation During the financial year under review, the Agency submitted five progress reports and four corporate plans to the relevant stakeholders as legislatively required. Increased efforts to enhance internal controls and accurate performance reporting yielded positive results, we received an unqualified external performance audit outcome for the 2017/18 financial year. The Agency appeared before the Standing Committee on Economic Opportunities, Tourism and Agriculture and the Standing Committee on Public Accounts to present the Annual Report for 2017/18, the report was well received. In addition, the Agency appeared before the Standing Committee on Economic Opportunities, Tourism and Agriculture, in conjunction with the Department, to discuss the Vote 12 Appropriation Bill for the ensuing financial year.
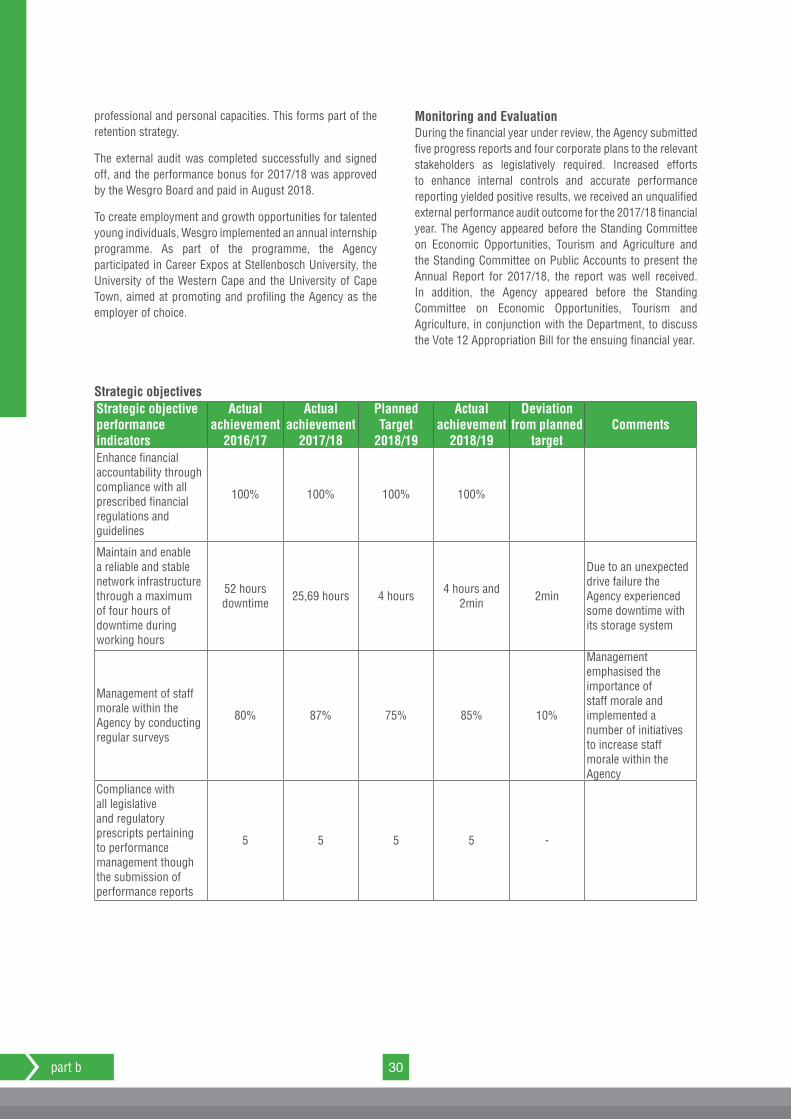
Strategic objectivesStrategic objective performance indicators
Actual achievement
2016/17
Actual achievement
2017/18
Planned Target
2018/19
Actual achievement
2018/19
Deviation from planned
targetComments
Enhance financial accountability through compliance with all prescribed financial regulations and guidelines
100% 100% 100% 100%
Maintain and enable a reliable and stable network infrastructure through a maximum of four hours of downtime during working hours
52 hours downtime 25,69 hours 4 hours 4 hours and
2min 2min
Due to an unexpected drive failure the Agency experienced some downtime with its storage system
Management of staff morale within the Agency by conducting regular surveys
80% 87% 75% 85% 10%
Management emphasised the importance of staff morale and implemented a number of initiatives to increase staff morale within the Agency
Compliance with all legislative and regulatory prescripts pertaining to performance management though the submission of performance reports
5 5 5 5 -
31 performance information
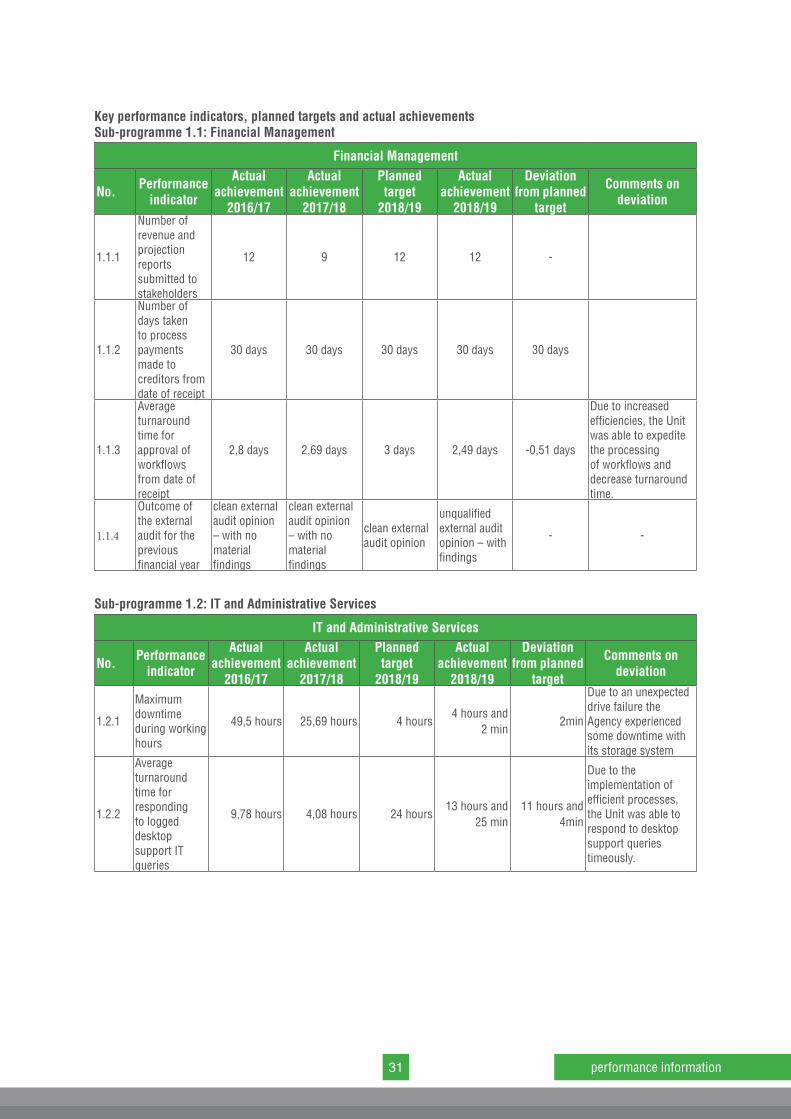
Key performance indicators, planned targets and actual achievements Sub-programme 1.1: Financial Management
Financial Management
No. Performance indicator
Actual achievement
2016/17
Actual achievement
2017/18
Planned target
2018/19
Actual achievement
2018/19
Deviation from planned
target
Comments on deviation
1.1.1
Number of revenue and projection reports submitted to stakeholders
12 9 12 12 -
1.1.2
Number of days taken to process payments made to creditors from date of receipt
30 days 30 days 30 days 30 days 30 days
1.1.3
Average turnaround time for approval of workflows from date of receipt
2,8 days 2,69 days 3 days 2,49 days -0,51 days
Due to increased efficiencies, the Unit was able to expedite the processing of workflows and decrease turnaround time.
1.1.4
Outcome of the external audit for the previous financial year
clean external audit opinion – with no material findings
clean external audit opinion – with no material findings
clean external audit opinion
unqualified external audit opinion – with findings
- -
Sub-programme 1.2: IT and Administrative Services
IT and Administrative Services
No. Performance indicator
Actual achievement
2016/17
Actual achievement
2017/18
Planned target
2018/19
Actual achievement
2018/19
Deviation from planned
target
Comments on deviation
1.2.1
Maximum downtime during working hours
49,5 hours 25,69 hours 4 hours4 hours and
2 min2min
Due to an unexpected drive failure the Agency experienced some downtime with its storage system
1.2.2
Average turnaround time for responding to logged desktop support IT queries
9,78 hours 4,08 hours 24 hours13 hours and
25 min11 hours and
4min
Due to the implementation of efficient processes, the Unit was able to respond to desktop support queries timeously.
32part b
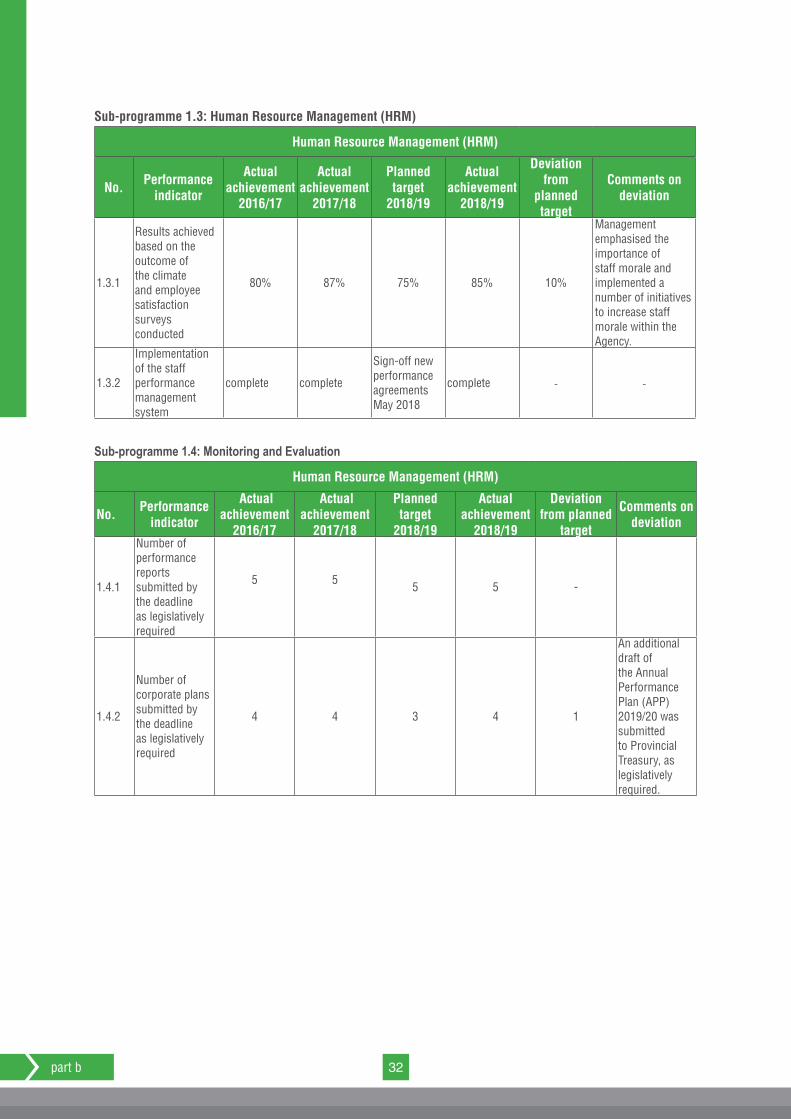
Sub-programme 1.3: Human Resource Management (HRM)
Human Resource Management (HRM)
No. Performance indicator
Actual achievement
2016/17
Actual achievement
2017/18
Planned target
2018/19
Actual achievement
2018/19
Deviation from
planned target
Comments on deviation
1.3.1
Results achieved based on the outcome of the climate and employee satisfaction surveys conducted
80% 87% 75% 85% 10%
Management emphasised the importance of staff morale and implemented a number of initiatives to increase staff morale within the Agency.
1.3.2
Implementation of the staff performance management system
complete complete
Sign-off new performance agreements May 2018
complete - -
Sub-programme 1.4: Monitoring and Evaluation
Human Resource Management (HRM)
No. Performance indicator
Actual achievement
2016/17
Actual achievement
2017/18
Planned target
2018/19
Actual achievement
2018/19
Deviation from planned
target
Comments on deviation
1.4.1
Number of performance reports submitted by the deadline as legislatively required
5 5 5 5 -
1.4.2
Number of corporate plans submitted by the deadline as legislatively required
4 4 3 4 1
An additional draft of the Annual Performance Plan (APP) 2019/20 was submitted to Provincial Treasury, as legislatively required.
33 performance information
Strategy to overcome underperformanceThe IT service has been in-sourced and IT infrastructure and systems have been updated to ensure operational efficiency.
Changes to planned targetsNo targets have been adjusted during the financial year.
Linking performance with budget
Programme
2018/19 2017/18
Budget Actual expenditure
(Over)/Under expenditure Budget Actual
expenditure(Over)/Under expenditure
(R’000) (R’000) (R’000) (R’000) (R’000) (R’000)
Corporate services 15 816 15 341 475 14 773 15 144 -371
Total 15 816 15 341 475 14 773 15 144 -371
Fair Value Movement on PUT option not included in the budget

34part b
3.2. programme 2: investment promotionPurposeThe purpose of the programme is to attract and facilitate foreign and domestic direct investment into the Western Cape and the City of Cape Town.
Programme structureWesgro attracts direct investment to the Western Cape from international, national, and local sources by providing the following services.
Investment recruitmentWesgro proactively markets the province and priority sectors in order to attract investment. The Agency’s investment promotion activities include:
l Investor research
l Investor targeting
l Inward and outward missions
l Matchmaking local and foreign firms
l Business facilitation
Investment facilitation aims to minimise delays in the investment process. Wesgro offers several investment facilitation services including:
l Facilitation of access to incentives/grants (‘best-efforts’ basis)
l Site location
l Facilitation of access to finance (‘best-efforts’ basis)
l Professional referral services
l Access to strategic networks
l Assistance in approval expedition
l Policy advocacy
l Strategic matchmaking
l Immigration guidance
AftercareThrough the aftercare programme, Wesgro aims to use the current pool of Wesgro investor clients, as well as current investors in the Western Cape who have not used the Agency’s services, as a source of increased investment through the expansion of their business interests in the province. The commitment to business retention and expansion emphasises a dedication to current investors in the ambit of facilitation and advocacy.
AdvocacyThe aim of policy advocacy is to identify constraints to investment and alert decision-makers to the negative effects these policies have on the business environment. The lobbying initiatives are driven to enhance the attractiveness of the Western Cape as an investment location.
Special projects: Agribusiness Investment UnitThe aim of the special projects programme is to manage key projects on behalf of our stakeholders. The Investment Promotion Unit manages the Agribusiness Investment Unit as a project on behalf of the Department of Agriculture. The Unit is responsible for locating new direct investments in the Western Cape Agri-Business sector, as well as retaining existing investments and supporting their expansions.
Strategic objectivesThe strategic objective of the programme is to:
l Facilitate investment and job creation in the Western Cape.
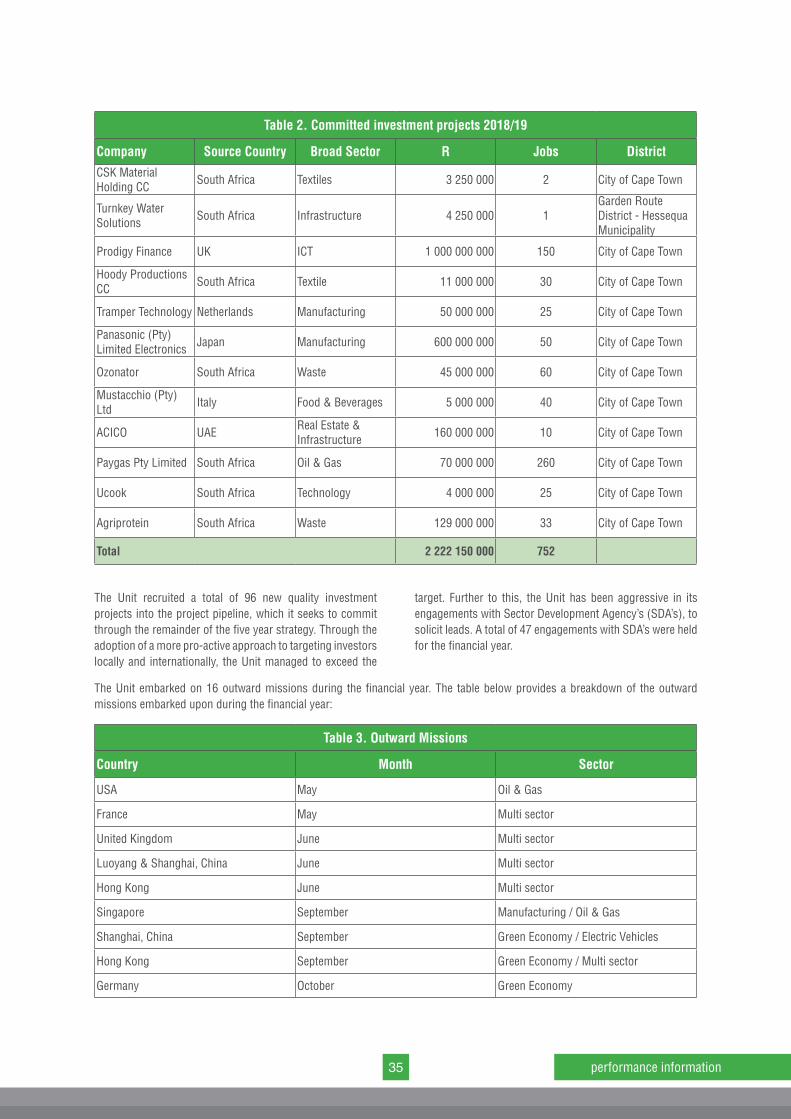
Strategic objectives, performance indicators, planned targets and actual achievementsThe Unit realised a total of 15 investment projects, to the value of R2,22bn, against a target of R1,3–R2,1bn. This has assisted in the facilitation of 752 jobs and growing the Western Cape’s industrial base. Investment performance has also contributed to the objectives outlined in Project Khulisa through the commercialisation of investments in the renewable energy and manufacturing sectors, among others. The table below provides a breakdown of committed investment projects and the number of jobs created during the financial year under review:
Table 2. Committed investment projects 2018/19
Company Source Country Broad Sector R Jobs District
MHK Group UAE Oil & Gas 20 000 000 5 City of Cape Town
Global Energy South Africa Waste/Agri-processing 600 000 1 City of Cape Town
Citra SwitzerlandReal Estate/Infrastructure Development
120 000 000 60 City of Cape Town
35 performance information
Table 2. Committed investment projects 2018/19
Company Source Country Broad Sector R Jobs DistrictCSK Material Holding CC South Africa Textiles 3 250 000 2 City of Cape Town
Turnkey Water Solutions South Africa Infrastructure 4 250 000 1
Garden Route District - Hessequa Municipality
Prodigy Finance UK ICT 1 000 000 000 150 City of Cape Town
Hoody Productions CC South Africa Textile 11 000 000 30 City of Cape Town
Tramper Technology Netherlands Manufacturing 50 000 000 25 City of Cape Town
Panasonic (Pty) Limited Electronics Japan Manufacturing 600 000 000 50 City of Cape Town
Ozonator South Africa Waste 45 000 000 60 City of Cape Town
Mustacchio (Pty) Ltd Italy Food & Beverages 5 000 000 40 City of Cape Town
ACICO UAE Real Estate & Infrastructure 160 000 000 10 City of Cape Town
Paygas Pty Limited South Africa Oil & Gas 70 000 000 260 City of Cape Town
Ucook South Africa Technology 4 000 000 25 City of Cape Town
Agriprotein South Africa Waste 129 000 000 33 City of Cape Town
Total 2 222 150 000 752
The Unit recruited a total of 96 new quality investment projects into the project pipeline, which it seeks to commit through the remainder of the five year strategy. Through the adoption of a more pro-active approach to targeting investors locally and internationally, the Unit managed to exceed the
target. Further to this, the Unit has been aggressive in its engagements with Sector Development Agency’s (SDA’s), to solicit leads. A total of 47 engagements with SDA’s were held for the financial year.
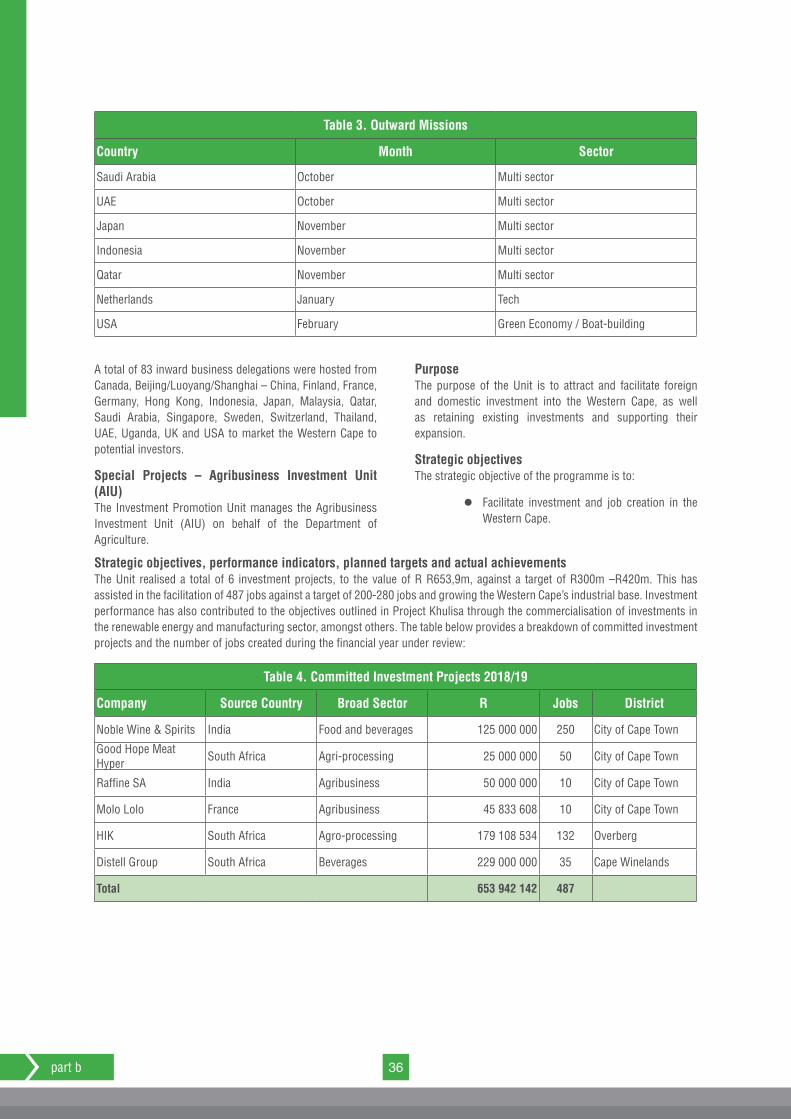
The Unit embarked on 16 outward missions during the financial year. The table below provides a breakdown of the outward missions embarked upon during the financial year:
Table 3. Outward Missions
Country Month Sector
USA May Oil & Gas
France May Multi sector
United Kingdom June Multi sector
Luoyang & Shanghai, China June Multi sector
Hong Kong June Multi sector
Singapore September Manufacturing / Oil & Gas
Shanghai, China September Green Economy / Electric Vehicles
Hong Kong September Green Economy / Multi sector
Germany October Green Economy
36part b
Table 3. Outward Missions
Country Month Sector
Saudi Arabia October Multi sector
UAE October Multi sector
Japan November Multi sector
Indonesia November Multi sector
Qatar November Multi sector
Netherlands January Tech
USA February Green Economy / Boat-building
A total of 83 inward business delegations were hosted from Canada, Beijing/Luoyang/Shanghai – China, Finland, France, Germany, Hong Kong, Indonesia, Japan, Malaysia, Qatar, Saudi Arabia, Singapore, Sweden, Switzerland, Thailand, UAE, Uganda, UK and USA to market the Western Cape to potential investors.
Special Projects – Agribusiness Investment Unit (AIU)The Investment Promotion Unit manages the Agribusiness Investment Unit (AIU) on behalf of the Department of Agriculture.
PurposeThe purpose of the Unit is to attract and facilitate foreign and domestic investment into the Western Cape, as well as retaining existing investments and supporting their expansion.
Strategic objectives The strategic objective of the programme is to:
l Facilitate investment and job creation in the Western Cape.
Strategic objectives, performance indicators, planned targets and actual achievementsThe Unit realised a total of 6 investment projects, to the value of R R653,9m, against a target of R300m –R420m. This has assisted in the facilitation of 487 jobs against a target of 200-280 jobs and growing the Western Cape’s industrial base. Investment performance has also contributed to the objectives outlined in Project Khulisa through the commercialisation of investments in the renewable energy and manufacturing sector, amongst others. The table below provides a breakdown of committed investment projects and the number of jobs created during the financial year under review:
Table 4. Committed Investment Projects 2018/19
Company Source Country Broad Sector R Jobs District
Noble Wine & Spirits India Food and beverages 125 000 000 250 City of Cape Town
Good Hope Meat Hyper South Africa Agri-processing 25 000 000 50 City of Cape Town
Raffine SA India Agribusiness 50 000 000 10 City of Cape Town
Molo Lolo France Agribusiness 45 833 608 10 City of Cape Town
HIK South Africa Agro-processing 179 108 534 132 Overberg
Distell Group South Africa Beverages 229 000 000 35 Cape Winelands
Total 653 942 142 487
37 performance information
The Unit recruited 23 new quality investment projects into the project pipeline, which it seeks to commit through the remainder of the five-year strategy. Through the adoption of a more pro-active approach to targeting investors locally and internationally, the Unit managed to exceed the target.
In addition, the Unit has expanded engagements with Local and District Municipalities to enhance support across the province, undertaking 19 engagements during the financial year.
The Unit embarked on nine outward missions during the financial year (Netherlands and France were visited in one outward mission).The table below provides a breakdown of the outward missions embarked upon during the financial year.
Table 5. Outward Missions
Country Month Sector
Malaysia March Agribusiness
USA April Agribusiness
Germany May Agribusiness
UK June Agribusiness
France July Agribusiness
Qatar November Agribusiness
U.A.E November Agribusiness
France December Agribusiness
India December Agribusiness
Special Projects – Invest SA One-Stop-Shop: Western CapeWesgro has been tasked to set up and operationalise the provincial “One Stop Shop”. This is an initiative being run by the DTI’s Invest SA division. The Cape Investor Centre (“CIC”) will be a collaboration of various arms of both national and regional government who will endeavour to assist potential investors with regulatory and administrative bottlenecks.
Purpose To reduce the red tape around setting up and operating a business in the Western Cape and as a result increase investment and job creation in the region.
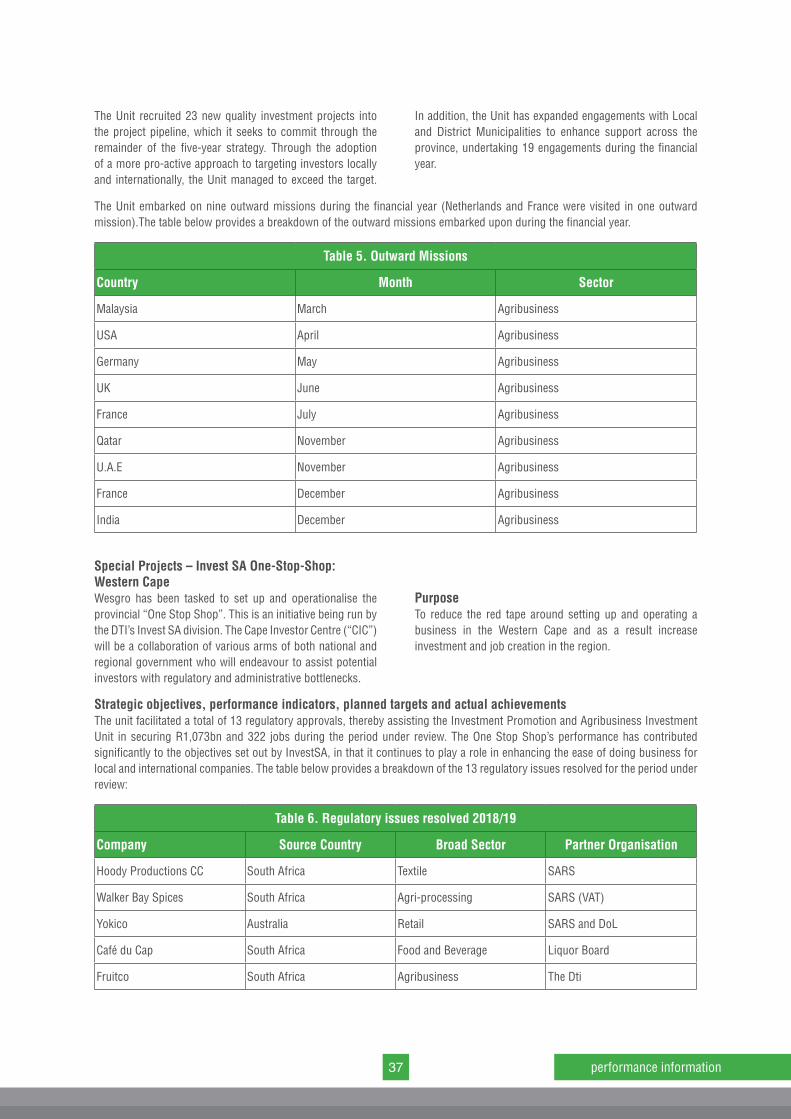
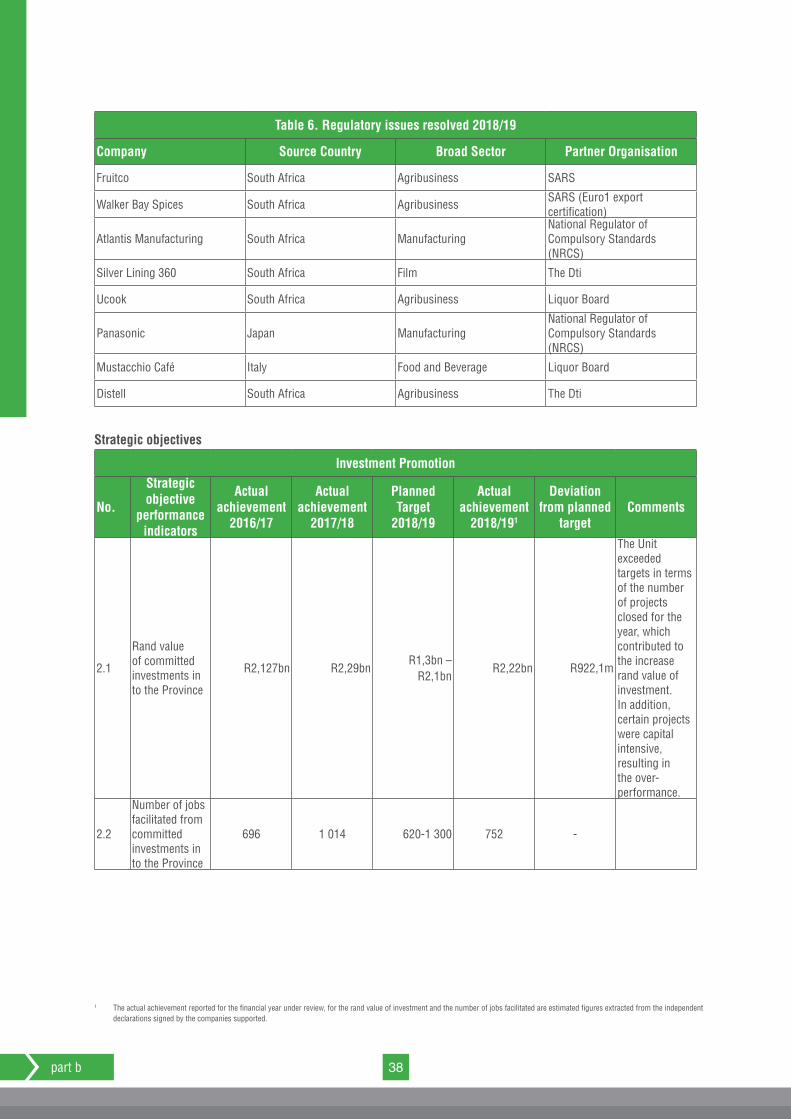
Strategic objectives, performance indicators, planned targets and actual achievementsThe unit facilitated a total of 13 regulatory approvals, thereby assisting the Investment Promotion and Agribusiness Investment Unit in securing R1,073bn and 322 jobs during the period under review. The One Stop Shop’s performance has contributed significantly to the objectives set out by InvestSA, in that it continues to play a role in enhancing the ease of doing business for local and international companies. The table below provides a breakdown of the 13 regulatory issues resolved for the period under review:
Table 6. Regulatory issues resolved 2018/19
Company Source Country Broad Sector Partner Organisation
Hoody Productions CC South Africa Textile SARS
Walker Bay Spices South Africa Agri-processing SARS (VAT)
Yokico Australia Retail SARS and DoL
Café du Cap South Africa Food and Beverage Liquor Board
Fruitco South Africa Agribusiness The Dti
38part b
Table 6. Regulatory issues resolved 2018/19
Company Source Country Broad Sector Partner Organisation
Fruitco South Africa Agribusiness SARS
Walker Bay Spices South Africa Agribusiness SARS (Euro1 export certification)
Atlantis Manufacturing South Africa ManufacturingNational Regulator of Compulsory Standards (NRCS)
Silver Lining 360 South Africa Film The Dti
Ucook South Africa Agribusiness Liquor Board
Panasonic Japan ManufacturingNational Regulator of Compulsory Standards (NRCS)
Mustacchio Café Italy Food and Beverage Liquor Board
Distell South Africa Agribusiness The Dti
Strategic objectives
Investment Promotion
No.
Strategic objective
performance indicators
Actual achievement
2016/17
Actual achievement
2017/18
Planned Target
2018/19
Actual achievement
2018/191
Deviation from planned
targetComments
2.1
Rand value of committed investments in to the Province
R2,127bn R2,29bnR1,3bn –
R2,1bnR2,22bn R922,1m
The Unit exceeded targets in terms of the number of projects closed for the year, which contributed to the increase rand value of investment. In addition, certain projects were capital intensive, resulting in the over-performance.
2.2
Number of jobs facilitated from committed investments in to the Province
696 1 014 620-1 300 752 -
1 The actual achievement reported for the financial year under review, for the rand value of investment and the number of jobs facilitated are estimated figures extracted from the independent declarations signed by the companies supported.
39 performance information
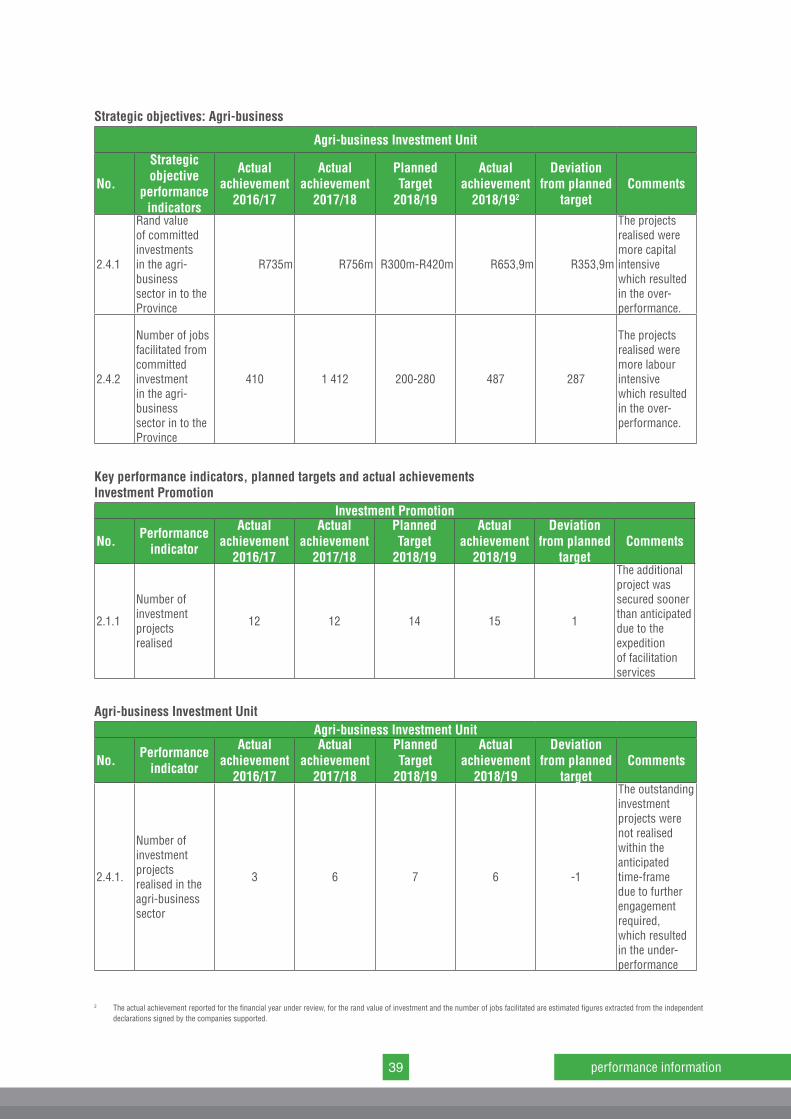
Strategic objectives: Agri-business
Agri-business Investment Unit
No.
Strategic objective
performance indicators
Actual achievement
2016/17
Actual achievement
2017/18
Planned Target
2018/19
Actual achievement
2018/192
Deviation from planned
targetComments
2.4.1
Rand value of committed investments in the agri-business sector in to the Province
R735m R756m R300m-R420m R653,9m R353,9m
The projects realised were more capital intensive which resulted in the over-performance.
2.4.2
Number of jobs facilitated from committed investment in the agri-business sector in to the Province
410 1 412 200-280 487 287
The projects realised were more labour intensive which resulted in the over-performance.
Key performance indicators, planned targets and actual achievementsInvestment Promotion
Investment Promotion
No. Performance indicator
Actual achievement
2016/17
Actual achievement
2017/18
Planned Target
2018/19
Actual achievement
2018/19
Deviation from planned
targetComments
2.1.1
Number of investment projects realised
12 12 14 15 1
The additional project was secured sooner than anticipated due to the expedition of facilitation services
Agri-business Investment UnitAgri-business Investment Unit
No. Performance indicator
Actual achievement
2016/17
Actual achievement
2017/18
Planned Target
2018/19
Actual achievement
2018/19
Deviation from planned
targetComments
2.4.1.
Number of investment projects realised in the agri-business sector
3 6 7 6 -1
The outstanding investment projects were not realised within the anticipated time-frame due to further engagement required, which resulted in the under-performance
2 The actual achievement reported for the financial year under review, for the rand value of investment and the number of jobs facilitated are estimated figures extracted from the independent declarations signed by the companies supported.
40part b
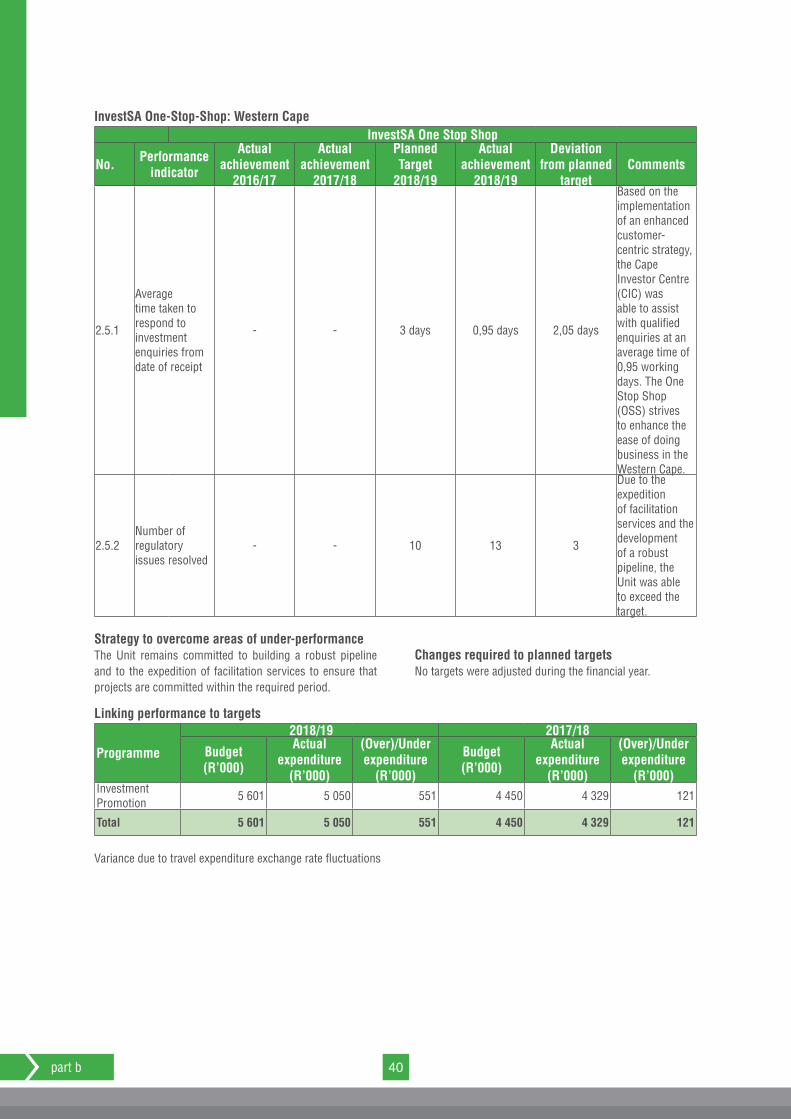
InvestSA One-Stop-Shop: Western CapeInvestSA One Stop Shop
No. Performance indicator
Actual achievement
2016/17
Actual achievement
2017/18
Planned Target
2018/19
Actual achievement
2018/19
Deviation from planned
targetComments
2.5.1
Average time taken to respond to investment enquiries from date of receipt
- - 3 days 0,95 days 2,05 days
Based on the implementation of an enhanced customer-centric strategy, the Cape Investor Centre (CIC) was able to assist with qualified enquiries at an average time of 0,95 working days. The One Stop Shop (OSS) strives to enhance the ease of doing business in the Western Cape.
2.5.2Number of regulatory issues resolved
- - 10 13 3
Due to the expedition of facilitation services and the development of a robust pipeline, the Unit was able to exceed the target.
Strategy to overcome areas of under-performanceThe Unit remains committed to building a robust pipeline and to the expedition of facilitation services to ensure that projects are committed within the required period.
Changes required to planned targetsNo targets were adjusted during the financial year.
Linking performance to targets
Programme
2018/19 2017/18
Budget(R’000)
Actual expenditure
(R’000)
(Over)/Under expenditure
(R’000)
Budget(R’000)
Actual expenditure
(R’000)
(Over)/Under expenditure
(R’000)Investment Promotion 5 601 5 050 551 4 450 4 329 121
Total 5 601 5 050 551 4 450 4 329 121
Variance due to travel expenditure exchange rate fluctuations
41 performance information
3.3. programme 3: trade promotionPurposeThe purpose of this programme is to promote and facilitate export of goods and services from qualified companies in the Western Cape and to facilitate and support operations and expansion of qualified Western Cape companies into the rest of Africa through investment.
Programme structureThe programme is divided into two sub-programmes:
l Sub-programme 3.1: Trade Promotion
l Sub-programme 3.2: African Expansion (Outward Foreign Direct Investment - OFDI).
In response to the request made by the Minister of Economic Opportunities, to explore ways of supporting Western Cape companies with increasing trade and expanding into the rest of the African continent, the Trade Promotion Programme changed its strategic direction. The programme will now focus on increasing the Rand value of exports into global markets and the number of jobs resulting from export orders, as well as the facilitation of support operations and expansion of qualified Western Cape companies into the rest of Africa.
Sub-programme 3.1: Trade PromotionWesgro will focus on companies that have export experience and capacity to supply a demand for goods or services in global markets. The programme will present proactive client engagement activities.
Business facilitationThe Agency’s facilitation activities include:
l Business agreement facilitation
l Accessing finance
l Investor and company matching
l Market research and information
l Forging strategic collaboration and partnerships
PromotionWesgro offers several promotional services including:
l Buying and selling missions
l Advocacy and specialised advisory services
l Access to strategic networks
l Marketing of value-added goods and services
Sub-programme 3.2: African Expansion (OFDI)Wesgro will focus on Western Cape companies that have export or outward investment experience and have the capacity to expand their operations into the rest of the African market.
Business facilitationThe Agency’s facilitation activities include:
l Operating business agreement facilitation
l Accessing finance
l Investor and company matching
l Market research and information
l Forging strategic collaboration and partnerships
PromotionWesgro offers several promotional services including:
l Buying and selling missions
l Advocacy and specialised advisory services
l Access to strategic networks
l Marketing of value-added goods and services
Strategic objectives The strategic objectives of the programme are:
l To promote and facilitate global exports of goods and services from qualified companies in the Western Cape
l To facilitate and support operations and expansion of Western Cape companies into the rest of Africa.
42part b
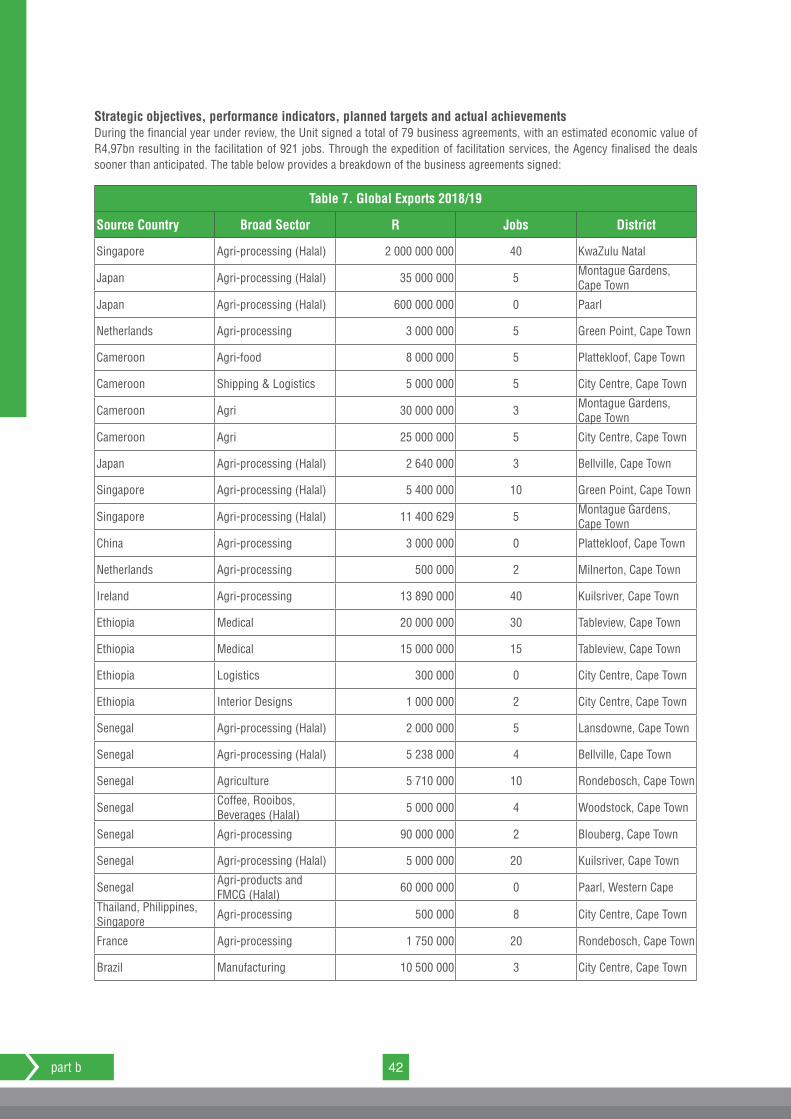
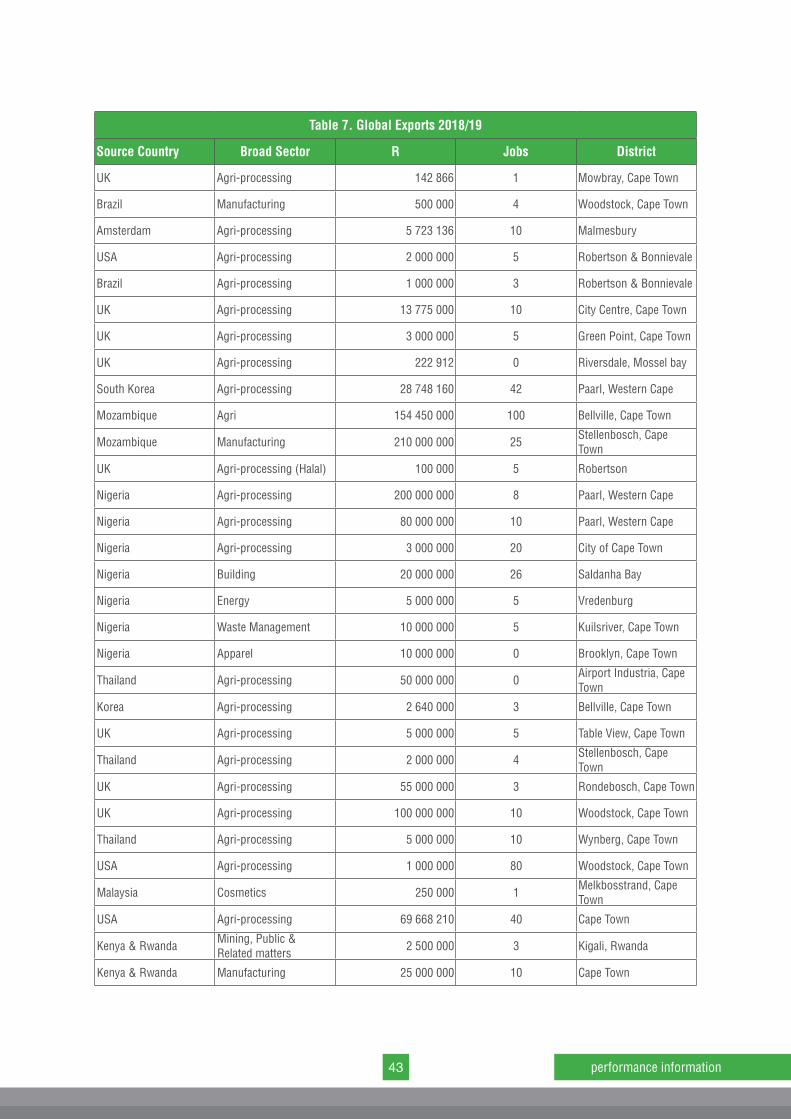
Strategic objectives, performance indicators, planned targets and actual achievementsDuring the financial year under review, the Unit signed a total of 79 business agreements, with an estimated economic value of R4,97bn resulting in the facilitation of 921 jobs. Through the expedition of facilitation services, the Agency finalised the deals sooner than anticipated. The table below provides a breakdown of the business agreements signed:
Table 7. Global Exports 2018/19
Source Country Broad Sector R Jobs District
Singapore Agri-processing (Halal) 2 000 000 000 40 KwaZulu Natal
Japan Agri-processing (Halal) 35 000 000 5 Montague Gardens, Cape Town
Japan Agri-processing (Halal) 600 000 000 0 Paarl
Netherlands Agri-processing 3 000 000 5 Green Point, Cape Town
Cameroon Agri-food 8 000 000 5 Plattekloof, Cape Town
Cameroon Shipping & Logistics 5 000 000 5 City Centre, Cape Town
Cameroon Agri 30 000 000 3 Montague Gardens, Cape Town
Cameroon Agri 25 000 000 5 City Centre, Cape Town
Japan Agri-processing (Halal) 2 640 000 3 Bellville, Cape Town
Singapore Agri-processing (Halal) 5 400 000 10 Green Point, Cape Town
Singapore Agri-processing (Halal) 11 400 629 5 Montague Gardens, Cape Town
China Agri-processing 3 000 000 0 Plattekloof, Cape Town
Netherlands Agri-processing 500 000 2 Milnerton, Cape Town
Ireland Agri-processing 13 890 000 40 Kuilsriver, Cape Town
Ethiopia Medical 20 000 000 30 Tableview, Cape Town
Ethiopia Medical 15 000 000 15 Tableview, Cape Town
Ethiopia Logistics 300 000 0 City Centre, Cape Town
Ethiopia Interior Designs 1 000 000 2 City Centre, Cape Town
Senegal Agri-processing (Halal) 2 000 000 5 Lansdowne, Cape Town
Senegal Agri-processing (Halal) 5 238 000 4 Bellville, Cape Town
Senegal Agriculture 5 710 000 10 Rondebosch, Cape Town
Senegal Coffee, Rooibos, Beverages (Halal) 5 000 000 4 Woodstock, Cape Town
Senegal Agri-processing 90 000 000 2 Blouberg, Cape Town
Senegal Agri-processing (Halal) 5 000 000 20 Kuilsriver, Cape Town
Senegal Agri-products and FMCG (Halal) 60 000 000 0 Paarl, Western Cape
Thailand, Philippines, Singapore Agri-processing 500 000 8 City Centre, Cape Town
France Agri-processing 1 750 000 20 Rondebosch, Cape Town
Brazil Manufacturing 10 500 000 3 City Centre, Cape Town
43 performance information
Table 7. Global Exports 2018/19
Source Country Broad Sector R Jobs District
UK Agri-processing 142 866 1 Mowbray, Cape Town
Brazil Manufacturing 500 000 4 Woodstock, Cape Town
Amsterdam Agri-processing 5 723 136 10 Malmesbury
USA Agri-processing 2 000 000 5 Robertson & Bonnievale
Brazil Agri-processing 1 000 000 3 Robertson & Bonnievale
UK Agri-processing 13 775 000 10 City Centre, Cape Town
UK Agri-processing 3 000 000 5 Green Point, Cape Town
UK Agri-processing 222 912 0 Riversdale, Mossel bay
South Korea Agri-processing 28 748 160 42 Paarl, Western Cape
Mozambique Agri 154 450 000 100 Bellville, Cape Town
Mozambique Manufacturing 210 000 000 25 Stellenbosch, Cape Town
UK Agri-processing (Halal) 100 000 5 Robertson
Nigeria Agri-processing 200 000 000 8 Paarl, Western Cape
Nigeria Agri-processing 80 000 000 10 Paarl, Western Cape
Nigeria Agri-processing 3 000 000 20 City of Cape Town
Nigeria Building 20 000 000 26 Saldanha Bay
Nigeria Energy 5 000 000 5 Vredenburg
Nigeria Waste Management 10 000 000 5 Kuilsriver, Cape Town
Nigeria Apparel 10 000 000 0 Brooklyn, Cape Town
Thailand Agri-processing 50 000 000 0 Airport Industria, Cape Town
Korea Agri-processing 2 640 000 3 Bellville, Cape Town
UK Agri-processing 5 000 000 5 Table View, Cape Town
Thailand Agri-processing 2 000 000 4 Stellenbosch, Cape Town
UK Agri-processing 55 000 000 3 Rondebosch, Cape Town
UK Agri-processing 100 000 000 10 Woodstock, Cape Town
Thailand Agri-processing 5 000 000 10 Wynberg, Cape Town
USA Agri-processing 1 000 000 80 Woodstock, Cape Town
Malaysia Cosmetics 250 000 1 Melkbosstrand, Cape Town
USA Agri-processing 69 668 210 40 Cape Town
Kenya & Rwanda Mining, Public & Related matters 2 500 000 3 Kigali, Rwanda
Kenya & Rwanda Manufacturing 25 000 000 10 Cape Town
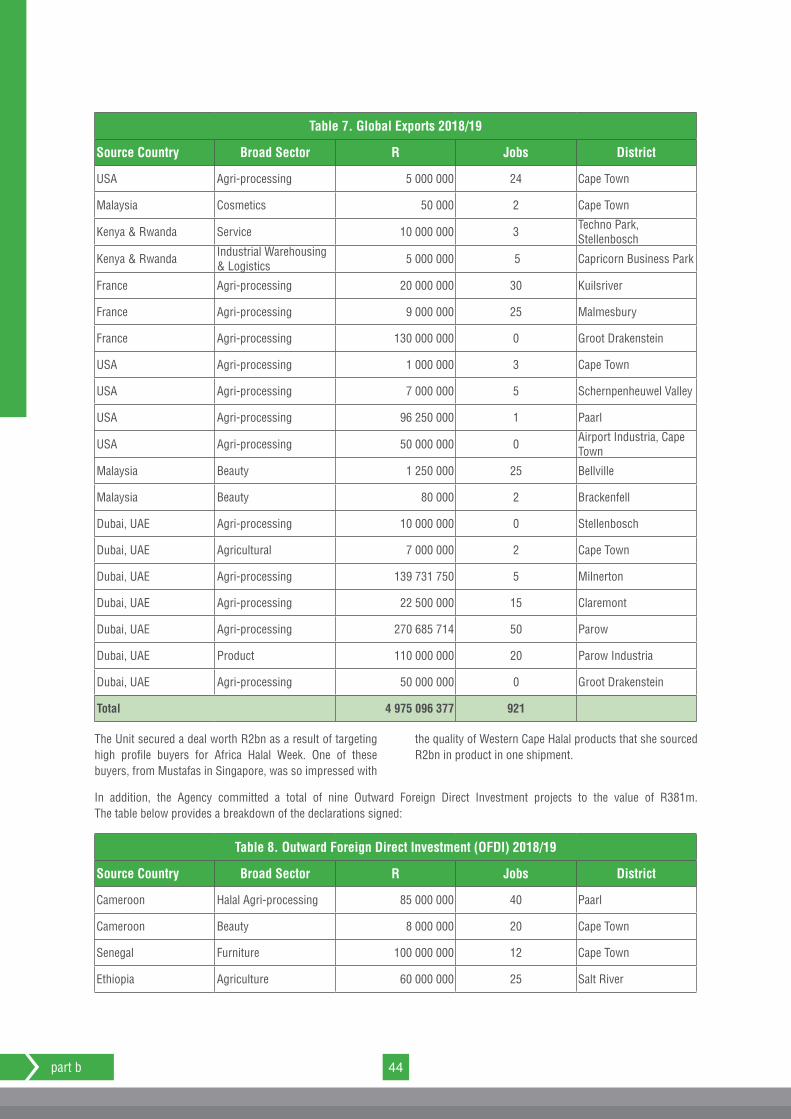
44part b
Table 7. Global Exports 2018/19
Source Country Broad Sector R Jobs District
USA Agri-processing 5 000 000 24 Cape Town
Malaysia Cosmetics 50 000 2 Cape Town
Kenya & Rwanda Service 10 000 000 3 Techno Park, Stellenbosch
Kenya & Rwanda Industrial Warehousing & Logistics 5 000 000 5 Capricorn Business Park
France Agri-processing 20 000 000 30 Kuilsriver
France Agri-processing 9 000 000 25 Malmesbury
France Agri-processing 130 000 000 0 Groot Drakenstein
USA Agri-processing 1 000 000 3 Cape Town
USA Agri-processing 7 000 000 5 Schernpenheuwel Valley
USA Agri-processing 96 250 000 1 Paarl
USA Agri-processing 50 000 000 0 Airport Industria, Cape Town
Malaysia Beauty 1 250 000 25 Bellville
Malaysia Beauty 80 000 2 Brackenfell
Dubai, UAE Agri-processing 10 000 000 0 Stellenbosch
Dubai, UAE Agricultural 7 000 000 2 Cape Town
Dubai, UAE Agri-processing 139 731 750 5 Milnerton
Dubai, UAE Agri-processing 22 500 000 15 Claremont
Dubai, UAE Agri-processing 270 685 714 50 Parow
Dubai, UAE Product 110 000 000 20 Parow Industria
Dubai, UAE Agri-processing 50 000 000 0 Groot Drakenstein
Total 4 975 096 377 921
The Unit secured a deal worth R2bn as a result of targeting high profile buyers for Africa Halal Week. One of these buyers, from Mustafas in Singapore, was so impressed with
the quality of Western Cape Halal products that she sourced R2bn in product in one shipment.
In addition, the Agency committed a total of nine Outward Foreign Direct Investment projects to the value of R381m. The table below provides a breakdown of the declarations signed:
Table 8. Outward Foreign Direct Investment (OFDI) 2018/19
Source Country Broad Sector R Jobs District
Cameroon Halal Agri-processing 85 000 000 40 Paarl
Cameroon Beauty 8 000 000 20 Cape Town
Senegal Furniture 100 000 000 12 Cape Town
Ethiopia Agriculture 60 000 000 25 Salt River
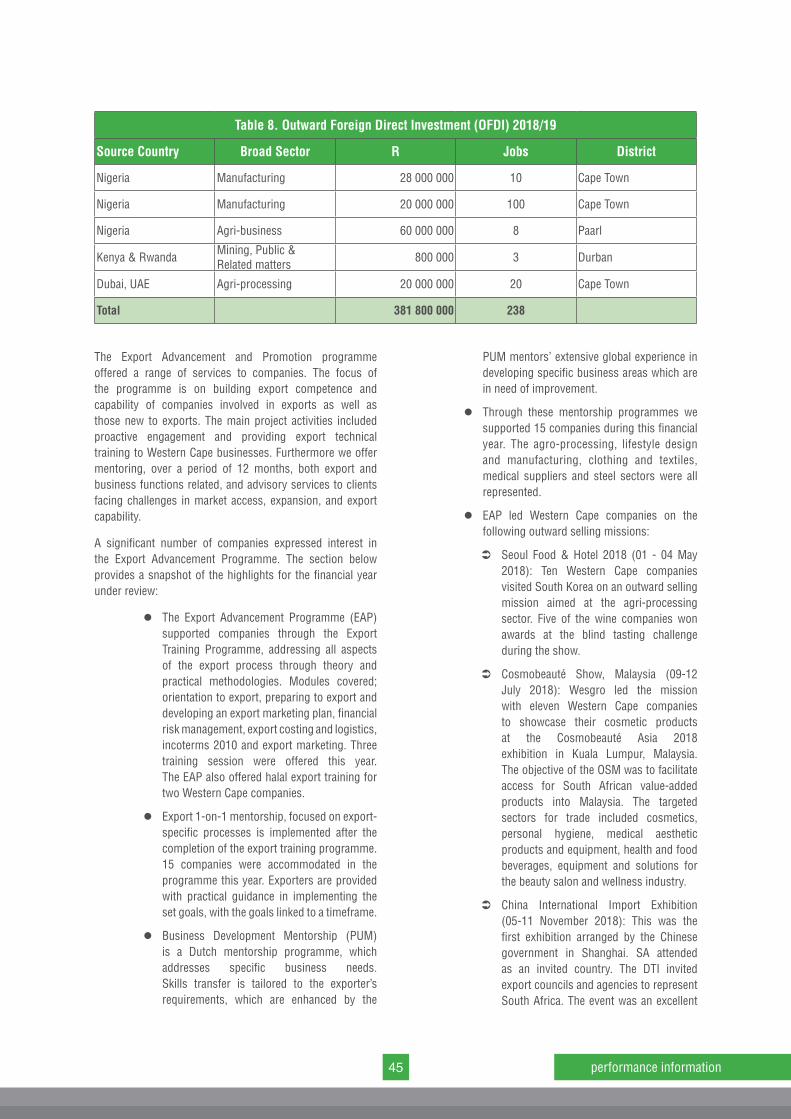
45 performance information
Table 8. Outward Foreign Direct Investment (OFDI) 2018/19
Source Country Broad Sector R Jobs District
Nigeria Manufacturing 28 000 000 10 Cape Town
Nigeria Manufacturing 20 000 000 100 Cape Town
Nigeria Agri-business 60 000 000 8 Paarl
Kenya & Rwanda Mining, Public & Related matters 800 000 3 Durban
Dubai, UAE Agri-processing 20 000 000 20 Cape Town
Total 381 800 000 238
The Export Advancement and Promotion programme offered a range of services to companies. The focus of the programme is on building export competence and capability of companies involved in exports as well as those new to exports. The main project activities included proactive engagement and providing export technical training to Western Cape businesses. Furthermore we offer mentoring, over a period of 12 months, both export and business functions related, and advisory services to clients facing challenges in market access, expansion, and export capability.
A significant number of companies expressed interest in the Export Advancement Programme. The section below provides a snapshot of the highlights for the financial year under review:
l The Export Advancement Programme (EAP) supported companies through the Export Training Programme, addressing all aspects of the export process through theory and practical methodologies. Modules covered; orientation to export, preparing to export and developing an export marketing plan, financial risk management, export costing and logistics, incoterms 2010 and export marketing. Three training session were offered this year. The EAP also offered halal export training for two Western Cape companies.
l Export 1-on-1 mentorship, focused on export-specific processes is implemented after the completion of the export training programme. 15 companies were accommodated in the programme this year. Exporters are provided with practical guidance in implementing the set goals, with the goals linked to a timeframe.
l Business Development Mentorship (PUM) is a Dutch mentorship programme, which addresses specific business needs. Skills transfer is tailored to the exporter’s requirements, which are enhanced by the
PUM mentors’ extensive global experience in developing specific business areas which are in need of improvement.
l Through these mentorship programmes we supported 15 companies during this financial year. The agro-processing, lifestyle design and manufacturing, clothing and textiles, medical suppliers and steel sectors were all represented.
l EAP led Western Cape companies on the following outward selling missions:
Ü Seoul Food & Hotel 2018 (01 - 04 May 2018): Ten Western Cape companies visited South Korea on an outward selling mission aimed at the agri-processing sector. Five of the wine companies won awards at the blind tasting challenge during the show.
Ü Cosmobeauté Show, Malaysia (09-12 July 2018): Wesgro led the mission with eleven Western Cape companies to showcase their cosmetic products at the Cosmobeauté Asia 2018 exhibition in Kuala Lumpur, Malaysia. The objective of the OSM was to facilitate access for South African value-added products into Malaysia. The targeted sectors for trade included cosmetics, personal hygiene, medical aesthetic products and equipment, health and food beverages, equipment and solutions for the beauty salon and wellness industry.
Ü China International Import Exhibition (05-11 November 2018): This was the first exhibition arranged by the Chinese government in Shanghai. SA attended as an invited country. The DTI invited export councils and agencies to represent South Africa. The event was an excellent
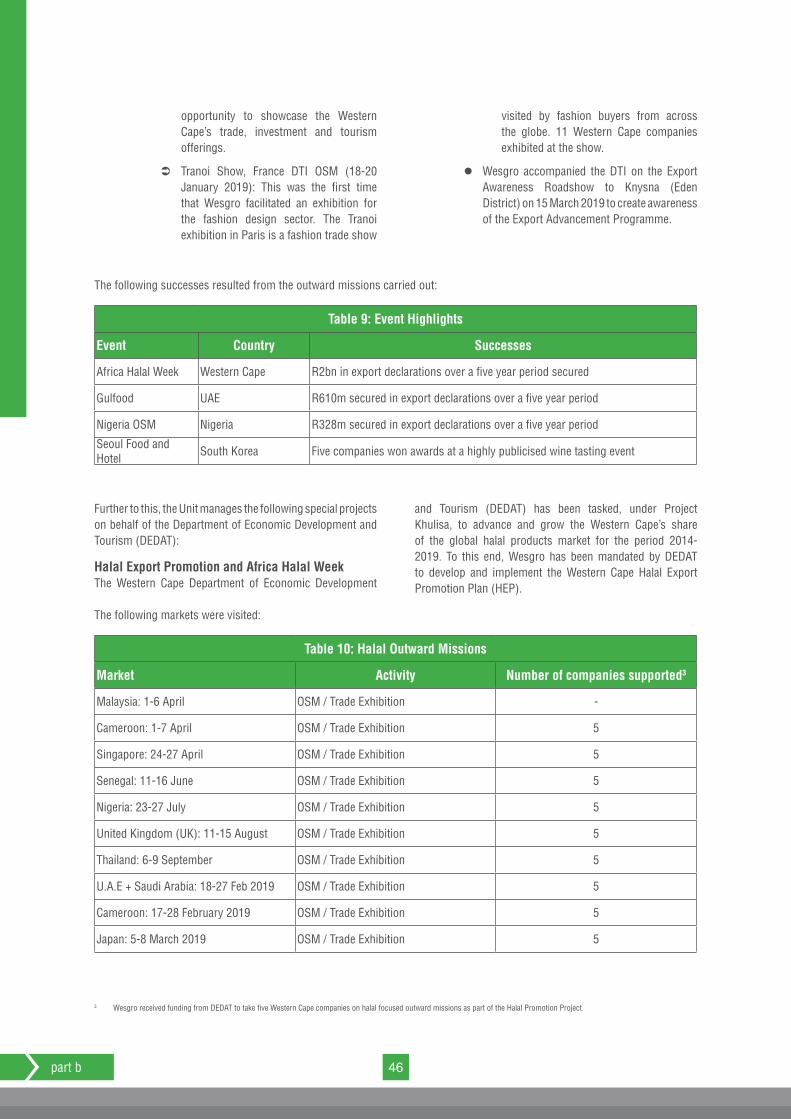
46part b
opportunity to showcase the Western Cape’s trade, investment and tourism offerings.
Ü Tranoi Show, France DTI OSM (18-20 January 2019): This was the first time that Wesgro facilitated an exhibition for the fashion design sector. The Tranoi exhibition in Paris is a fashion trade show
visited by fashion buyers from across the globe. 11 Western Cape companies exhibited at the show.
l Wesgro accompanied the DTI on the Export Awareness Roadshow to Knysna (Eden District) on 15 March 2019 to create awareness of the Export Advancement Programme.
The following successes resulted from the outward missions carried out:
Table 9: Event Highlights
Event Country Successes
Africa Halal Week Western Cape R2bn in export declarations over a five year period secured
Gulfood UAE R610m secured in export declarations over a five year period
Nigeria OSM Nigeria R328m secured in export declarations over a five year period
Seoul Food and Hotel South Korea Five companies won awards at a highly publicised wine tasting event
Further to this, the Unit manages the following special projects on behalf of the Department of Economic Development and Tourism (DEDAT):
Halal Export Promotion and Africa Halal WeekThe Western Cape Department of Economic Development
and Tourism (DEDAT) has been tasked, under Project Khulisa, to advance and grow the Western Cape’s share of the global halal products market for the period 2014-2019. To this end, Wesgro has been mandated by DEDAT to develop and implement the Western Cape Halal Export Promotion Plan (HEP).
The following markets were visited:
Table 10: Halal Outward Missions
Market Activity Number of companies supported3
Malaysia: 1-6 April OSM / Trade Exhibition -
Cameroon: 1-7 April OSM / Trade Exhibition 5
Singapore: 24-27 April OSM / Trade Exhibition 5
Senegal: 11-16 June OSM / Trade Exhibition 5
Nigeria: 23-27 July OSM / Trade Exhibition 5
United Kingdom (UK): 11-15 August OSM / Trade Exhibition 5
Thailand: 6-9 September OSM / Trade Exhibition 5
U.A.E + Saudi Arabia: 18-27 Feb 2019 OSM / Trade Exhibition 5
Cameroon: 17-28 February 2019 OSM / Trade Exhibition 5
Japan: 5-8 March 2019 OSM / Trade Exhibition 5
3 Wesgro received funding from DEDAT to take five Western Cape companies on halal focused outward missions as part of the Halal Promotion Project.
47 performance information
Africa Halal Week:Objectives:
l Develop a Western Cape trade exhibition for halal certified food and beverage companies to engage with international buyers
l Showcase the Western Cape as a modest fashion hub with quality fashion products ready for export
l Promote the Western Cape as a halal-friendly Finance and Investment hub
l Promote the Western Cape as a halal-friendly film/media destination
l Promote the Western Cape as a halal-friendly tourism destination
l Engage multiple stakeholders in the halal industry including the Halal Forum that represents the broader Muslim community in the Western Cape and all five of the Certification Bodies to create alignment and partnerships in driving the Province’s halal strategy.
Highlights:
1. Africa Halal Week 2018 was a great success overall and there has been positive feedback from exhibitors, buyers, delegates, sponsors, partners and stakeholders.
2. Event Statistics: 66 exhibitors displayed their products in the food, beverage, fashion and services (tourism) sectors, 20 international buyers of halal products attended – part of the 25 international .guests and a total of 777 guests registered for the event.
3. The event generated R3 274 129 in AVE (Advertising Value Equivalent), 14 551 352 in OTS (reach), 322 engagements and 218 re-shares.
4. The Trade Track:
l The expected Rand value of exports generated as a result of discussions between exhibitors is being collected. During a de-briefing session with some of the hosted buyers, five indicated willingness to secure 40ft containers of consolidated halal certified products at $300 000.
l A positive image of the quality of Western Cape halal products was demonstrated through the exhibition.
l Post event surveys and follow-up communications with exhibitors and buyers to declare their export deals to Wesgro are underway. Both are being asked to complete the Wesgro Trade Declaration Form.
l The accessing markets in Africa, the Middle East, Asia and Europe were well attended and gave participants a sound understanding of opportunities and challenges in each market.
5. The Modest Fashion Track:
l It was clear that designers require a structural environment for modest fashion to grow and become economically sustainable.
l The Council of Modest Fashion (COMF) identified a succession plan that would help see designers develop through three stages. Stage 1: Entrepreneur (business start-ups), Stage 2: Retail and Production (business development and export readiness), and Stage 3: Act as a Fashion Agency (representing designers to global and local trade, retail, media and online markets.)
l A large majority of designers are in the entrepreneurial stage. It is important that the COMF identify the potential of such designers to gain access to further development, by assessing their short-falls. COMF will utilise these assessments to create the best strategy for implementing growth, development and employment in these small businesses.
l The programme also identified the need to host regular conferences or information sessions to formalise the structure of the modest fashion industry and for modest fashion designers to have access to information and knowledge.
6. The Islamic Finance and Investment Track:
l Wesgro Investment Promotion formed a strategic partnership with IConsult Africa.
l Through this partnership, the inaugural Islamic Finance and Investment Conference had strong, senior speaker participation from the heads/decision makers of most major banks and asset managers who operate in this space. These included FNB, Standard Bank, Absa, Kagiso, and Element Investments.
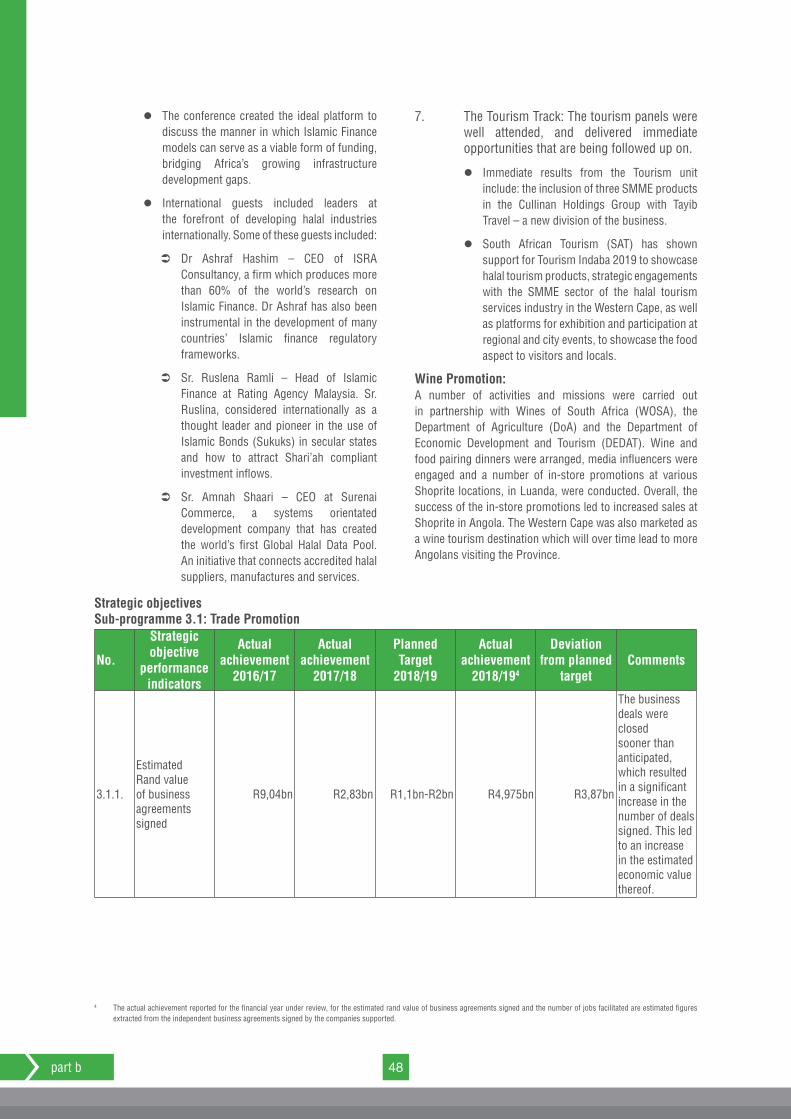
48part b
l The conference created the ideal platform to discuss the manner in which Islamic Finance models can serve as a viable form of funding, bridging Africa’s growing infrastructure development gaps.
l International guests included leaders at the forefront of developing halal industries internationally. Some of these guests included:
Ü Dr Ashraf Hashim – CEO of ISRA Consultancy, a firm which produces more than 60% of the world’s research on Islamic Finance. Dr Ashraf has also been instrumental in the development of many countries’ Islamic finance regulatory frameworks.
Ü Sr. Ruslena Ramli – Head of Islamic Finance at Rating Agency Malaysia. Sr. Ruslina, considered internationally as a thought leader and pioneer in the use of Islamic Bonds (Sukuks) in secular states and how to attract Shari’ah compliant investment inflows.
Ü Sr. Amnah Shaari – CEO at Surenai Commerce, a systems orientated development company that has created the world’s first Global Halal Data Pool. An initiative that connects accredited halal suppliers, manufactures and services.
7. The Tourism Track: The tourism panels were well attended, and delivered immediate opportunities that are being followed up on.
l Immediate results from the Tourism unit include: the inclusion of three SMME products in the Cullinan Holdings Group with Tayib Travel – a new division of the business.
l South African Tourism (SAT) has shown support for Tourism Indaba 2019 to showcase halal tourism products, strategic engagements with the SMME sector of the halal tourism services industry in the Western Cape, as well as platforms for exhibition and participation at regional and city events, to showcase the food aspect to visitors and locals.
Wine Promotion:A number of activities and missions were carried out in partnership with Wines of South Africa (WOSA), the Department of Agriculture (DoA) and the Department of Economic Development and Tourism (DEDAT). Wine and food pairing dinners were arranged, media influencers were engaged and a number of in-store promotions at various Shoprite locations, in Luanda, were conducted. Overall, the success of the in-store promotions led to increased sales at Shoprite in Angola. The Western Cape was also marketed as a wine tourism destination which will over time lead to more Angolans visiting the Province.
Strategic objectivesSub-programme 3.1: Trade Promotion
No.
Strategic objective
performance indicators
Actual achievement
2016/17
Actual achievement
2017/18
Planned Target
2018/19
Actual achievement
2018/194
Deviation from planned
targetComments
3.1.1.
Estimated Rand value of business agreements signed
R9,04bn R2,83bn R1,1bn-R2bn R4,975bn R3,87bn
The business deals were closed sooner than anticipated, which resulted in a significant increase in the number of deals signed. This led to an increase in the estimated economic value thereof.
4 The actual achievement reported for the financial year under review, for the estimated rand value of business agreements signed and the number of jobs facilitated are estimated figures extracted from the independent business agreements signed by the companies supported.
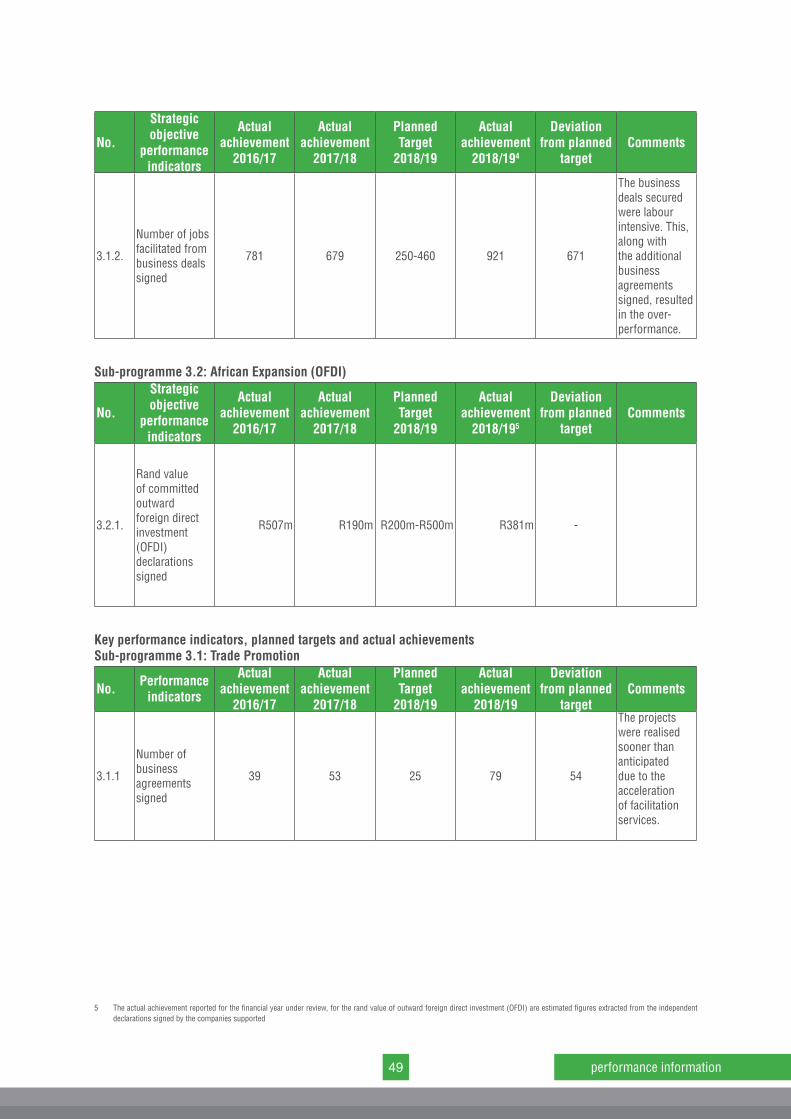
49 performance information
No.
Strategic objective
performance indicators
Actual achievement
2016/17
Actual achievement
2017/18
Planned Target
2018/19
Actual achievement
2018/194
Deviation from planned
targetComments
3.1.2.
Number of jobs facilitated from business deals signed
781 679 250-460 921 671
The business deals secured were labour intensive. This, along with the additional business agreements signed, resulted in the over-performance.
Sub-programme 3.2: African Expansion (OFDI)
No.
Strategic objective
performance indicators
Actual achievement
2016/17
Actual achievement
2017/18
Planned Target
2018/19
Actual achievement
2018/195
Deviation from planned
targetComments
3.2.1.
Rand value of committed outward foreign direct investment (OFDI) declarations signed
R507m R190m R200m-R500m R381m -
Key performance indicators, planned targets and actual achievementsSub-programme 3.1: Trade Promotion
No. Performance indicators
Actual achievement
2016/17
Actual achievement
2017/18
Planned Target
2018/19
Actual achievement
2018/19
Deviation from planned
targetComments
3.1.1
Number of business agreements signed
39 53 25 79 54
The projects were realised sooner than anticipated due to the acceleration of facilitation services.
5 The actual achievement reported for the financial year under review, for the rand value of outward foreign direct investment (OFDI) are estimated figures extracted from the independent declarations signed by the companies supported
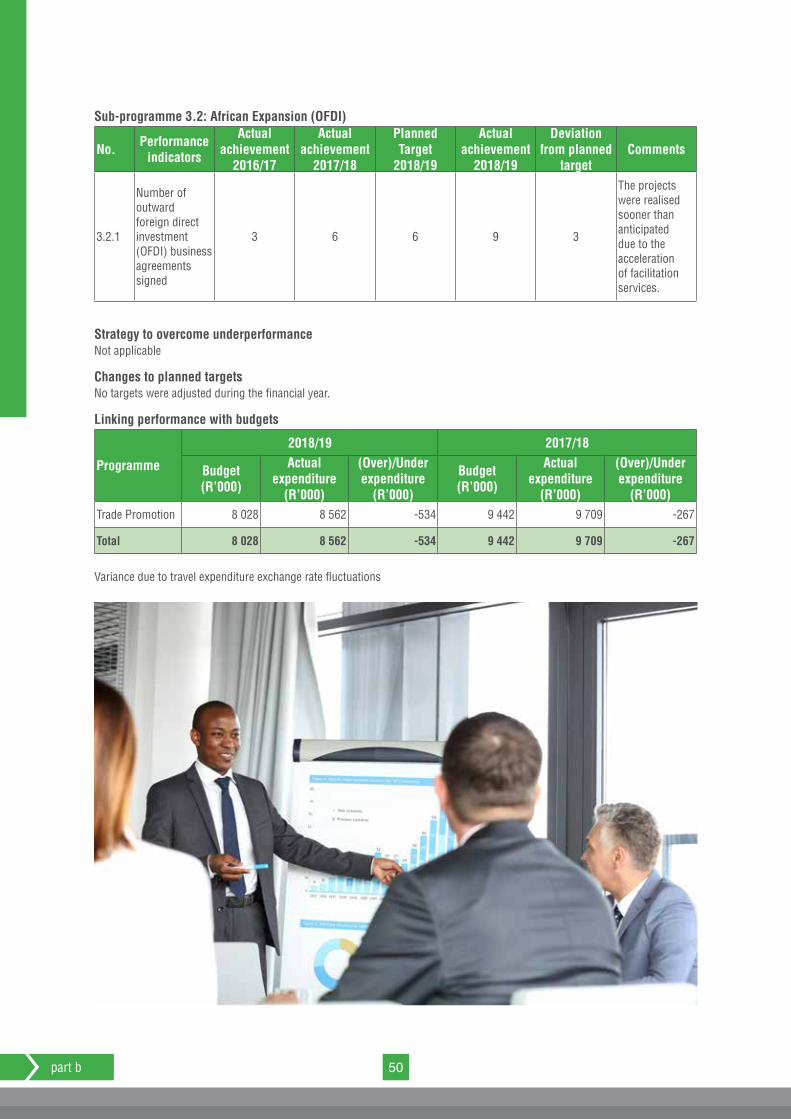
50part b
Sub-programme 3.2: African Expansion (OFDI)
No. Performance indicators
Actual achievement
2016/17
Actual achievement
2017/18
Planned Target
2018/19
Actual achievement
2018/19
Deviation from planned
targetComments
3.2.1
Number of outward foreign direct investment (OFDI) business agreements signed
3 6 6 9 3
The projects were realised sooner than anticipated due to the acceleration of facilitation services.
Strategy to overcome underperformanceNot applicable
Changes to planned targetsNo targets were adjusted during the financial year.
Linking performance with budgets
Programme
2018/19 2017/18
Budget(R’000)
Actual expenditure
(R’000)
(Over)/Under expenditure
(R’000)
Budget(R’000)
Actual expenditure
(R’000)
(Over)/Under expenditure
(R’000)Trade Promotion 8 028 8 562 -534 9 442 9 709 -267
Total 8 028 8 562 -534 9 442 9 709 -267
Variance due to travel expenditure exchange rate fluctuations
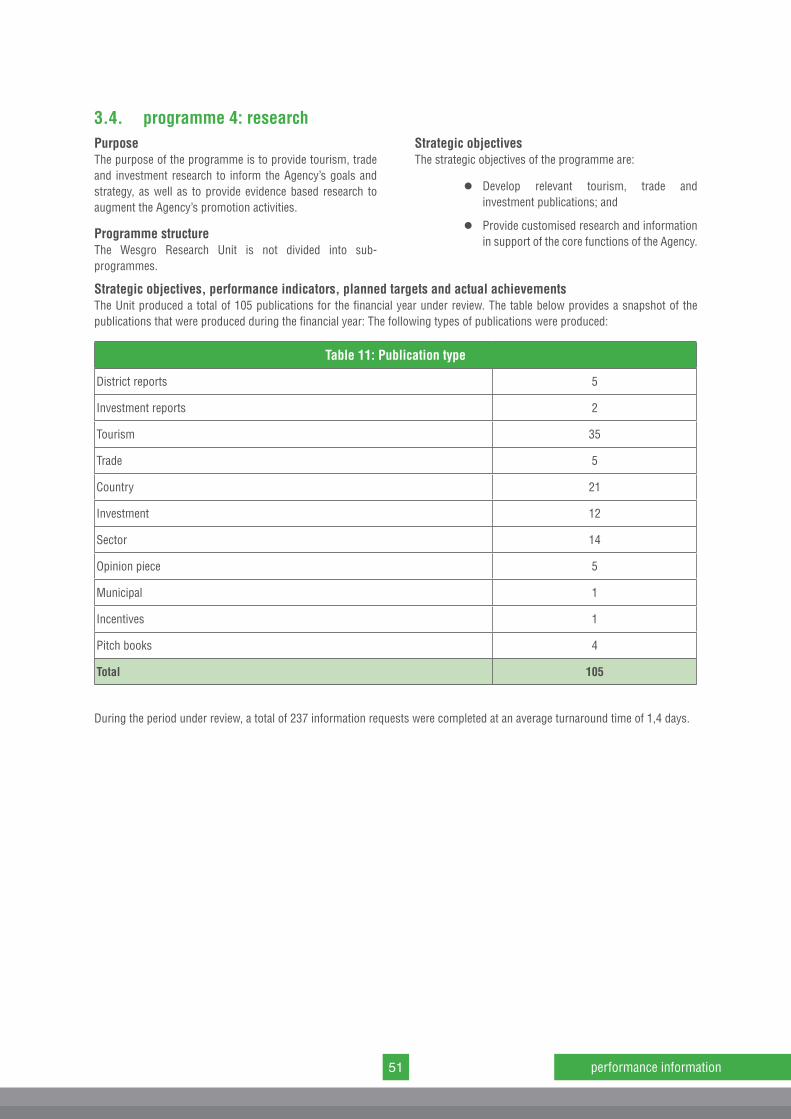
51 performance information
3.4. programme 4: researchPurposeThe purpose of the programme is to provide tourism, trade and investment research to inform the Agency’s goals and strategy, as well as to provide evidence based research to augment the Agency’s promotion activities.
Programme structureThe Wesgro Research Unit is not divided into sub-programmes.
Strategic objectivesThe strategic objectives of the programme are:
l Develop relevant tourism, trade and investment publications; and
l Provide customised research and information in support of the core functions of the Agency.
Strategic objectives, performance indicators, planned targets and actual achievementsThe Unit produced a total of 105 publications for the financial year under review. The table below provides a snapshot of the publications that were produced during the financial year: The following types of publications were produced:
Table 11: Publication type
District reports 5
Investment reports 2
Tourism 35
Trade 5
Country 21
Investment 12
Sector 14
Opinion piece 5
Municipal 1
Incentives 1
Pitch books 4
Total 105
During the period under review, a total of 237 information requests were completed at an average turnaround time of 1,4 days.
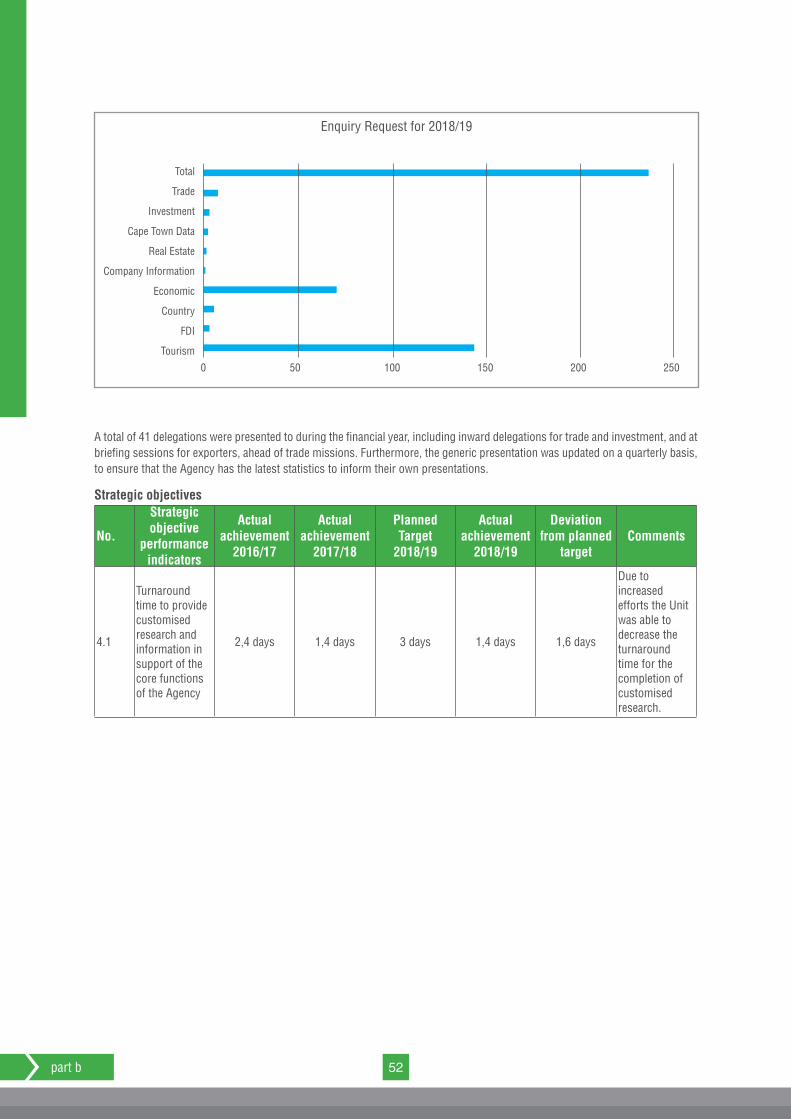
52part b
Total
Trade
Investment
Cape Town Data
Real Estate
Company Information
Economic
Country
FDI
Tourism
Enquiry Request for 2018/19
0 50 100 150 200 250
A total of 41 delegations were presented to during the financial year, including inward delegations for trade and investment, and at briefing sessions for exporters, ahead of trade missions. Furthermore, the generic presentation was updated on a quarterly basis, to ensure that the Agency has the latest statistics to inform their own presentations.
Strategic objectives
No.
Strategic objective
performance indicators
Actual achievement
2016/17
Actual achievement
2017/18
Planned Target
2018/19
Actual achievement
2018/19
Deviation from planned
targetComments
4.1
Turnaround time to provide customised research and information in support of the core functions of the Agency
2,4 days 1,4 days 3 days 1,4 days 1,6 days
Due to increased efforts the Unit was able to decrease the turnaround time for the completion of customised research.
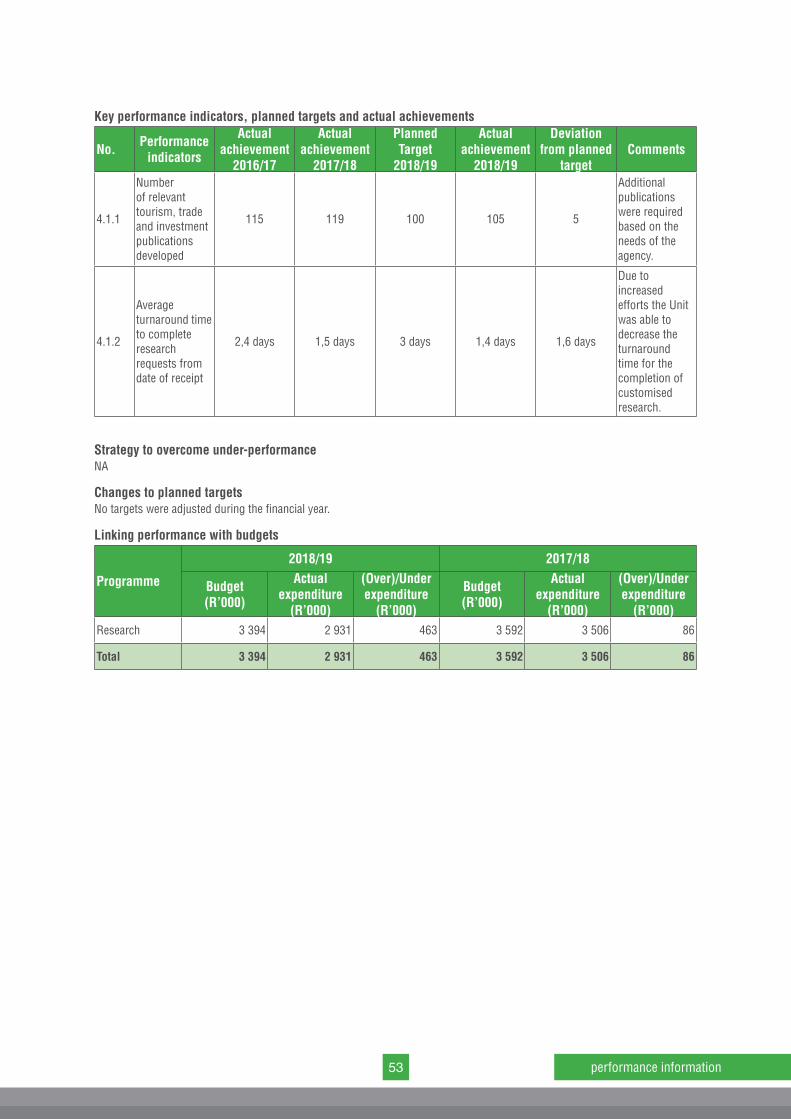
53 performance information
Key performance indicators, planned targets and actual achievements
No. Performance indicators
Actual achievement
2016/17
Actual achievement
2017/18
Planned Target
2018/19
Actual achievement
2018/19
Deviation from planned
targetComments
4.1.1
Number of relevant tourism, trade and investment publications developed
115 119 100 105 5
Additional publications were required based on the needs of the agency.
4.1.2
Average turnaround time to complete research requests from date of receipt
2,4 days 1,5 days 3 days 1,4 days 1,6 days
Due to increased efforts the Unit was able to decrease the turnaround time for the completion of customised research.
Strategy to overcome under-performanceNA
Changes to planned targetsNo targets were adjusted during the financial year.
Linking performance with budgets
Programme
2018/19 2017/18
Budget(R’000)
Actual expenditure
(R’000)
(Over)/Under expenditure
(R’000)
Budget(R’000)
Actual expenditure
(R’000)
(Over)/Under expenditure
(R’000)Research 3 394 2 931 463 3 592 3 506 86
Total 3 394 2 931 463 3 592 3 506 86
54part b
3.5. programme 5: marketing and communicationPurposeThe purpose of this programme is to conduct marketing and communication for Wesgro business units and Cape Town and the Western Cape in terms of tourism, trade and investment.
Programme structure The programme is divided into two sub-programmes.
Sub-programme 5.1: Positioning of the Agency and the destinationTo improve the position of the Agency and the destination with shareholders, citizens, domestic and international businesses.
l Assistance with and/or hosting of and/or the logistical management of strategic corporate and external events with partners
l Marketing campaigns via social media, digital and traditional media channels
l Creation of bespoke content (audio, visual and printed) for Wesgro and the destination to be used in marketing campaigns
l Customer relationship marketing
Sub-programme 5.2: Management of the reputation of the Agency and the destinationTo manage the reputation of the Agency and destination through media opportunities.
l Writing and distribution of op-ed pieces
l Writing and distribution of media releases
l Website management
l Hosting of strategic media engagements
l Distribution of research publications via media opportunities
l Monthly tracking of advertising value equivalent (AVE) generated
Strategic objectives The strategic objectives of the programme are:
l To improve the position of the Agency and the destination with shareholders, citizens, domestic and international business
l To manage the reputation of the Agency and destination through media opportunities.
Strategic objectives, performance indicators, planned targets and actual achievementsThe year in review was challenging, with numerous shocks to the economic brand of the Western Cape and South Africa. It is in this context that the Marketing and Communications Unit set out to create a positive narrative for tourism, trade, investment and film in the Cape, and to ensure that the local and international business community remained aware of the many exciting opportunities for business in our province.
This was done through a variety of key interventions. The most noteworthy was the execution of the global investor confidence campaign. This digitally-led campaign, which ran in key investment source markets, reached potential investors through advanced targeting. Prospective investors in these countries are directed to a microsite: investwesterncape.com, where more information can be obtained on the investment case of the province and country.
As part of this campaign, high-level engagements with senior business leaders in the province were also organised. This was done on the clear understanding that confidence-building starts at home, and that these leaders are also investment promotion ambassadors for our province and country.
Another key intervention during this time, was the Unit taking the lead in thought-leadership, especially around risks that might impact on confidence in the economy. A number of engagements on key topics were organised to provide the business community with up-to-date information on developments that might impact their operations. For example, updates on the city and province’s water strategies were undertaken, as well as briefings on Brexit and its potential impact on Cape exports.
A key focus of the Unit is to disseminate confidence-building communication through our digital channels, and through earned-media (media relations). Through a greater focus on digital media, the use of our channels to amplify events, and our involvement in the global investor confidence campaign, we were able to far exceed our target for AVE during this financial year.
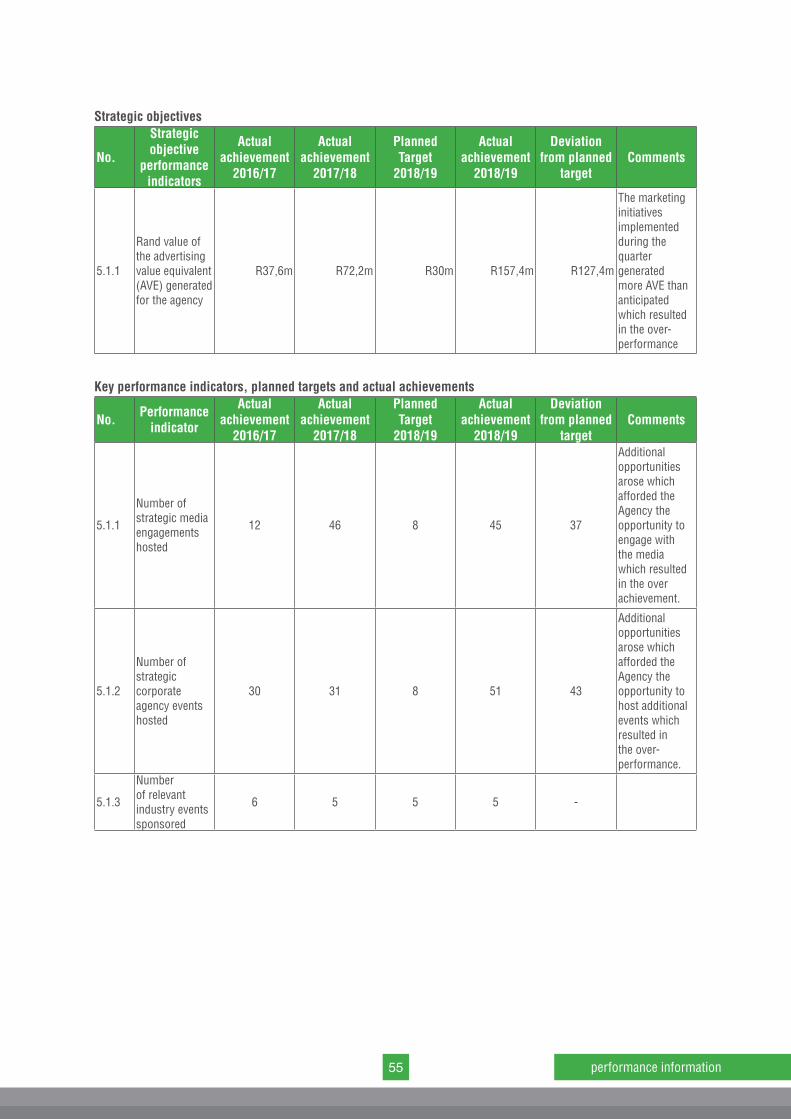
55 performance information
Strategic objectives
No.
Strategic objective
performance indicators
Actual achievement
2016/17
Actual achievement
2017/18
Planned Target
2018/19
Actual achievement
2018/19
Deviation from planned
targetComments
5.1.1
Rand value of the advertising value equivalent (AVE) generated for the agency
R37,6m R72,2m R30m R157,4m R127,4m
The marketing initiatives implemented during the quarter generated more AVE than anticipated which resulted in the over-performance
Key performance indicators, planned targets and actual achievements
No. Performance indicator
Actual achievement
2016/17
Actual achievement
2017/18
Planned Target
2018/19
Actual achievement
2018/19
Deviation from planned
targetComments
5.1.1
Number of strategic media engagements hosted
12 46 8 45 37
Additional opportunities arose which afforded the Agency the opportunity to engage with the media which resulted in the over achievement.
5.1.2
Number of strategic corporate agency events hosted
30 31 8 51 43
Additional opportunities arose which afforded the Agency the opportunity to host additional events which resulted in the over-performance.
5.1.3
Number of relevant industry events sponsored
6 5 5 5 -
56part b
Strategy to overcome under-performanceNA
Changes to planned targetsNo targets were adjusted during the financial year.
Linking performance with budgets
Programme
2018/19 2017/18
Budget(R’000)
Actual expenditure
(R’000)
(Over)/Under expenditure
(R’000)
Budget(R’000)
Actual expenditure
(R’000)
(Over)/Under expenditure
(R’000)Marketing and Communication 5 823 6 587 -764 5 643 4 873 770
Total 5 823 6 587 -764 5 643 4 873 770
Over expenditure on the municipal workshop during 2018/19.
57 performance information
3.6. programme 6: destination marketing (dmo)PurposeThe purpose of the DMO is to promote the Western Cape internationally and domestically in order to increase the number of visitors. The DMO markets the destination by focusing on business tourism (through its Convention Bureau team), tourism trade, media, influencers and marketing campaigns.
By increasing the visitor numbers of leisure and business tourists to the province, direct, indirect and induced revenue is generated for the Cape.
The DMO’s activity thereby contributes to economic growth and job creation.
In growing business tourism, the unit places emphasis on:
l A well-defined and successful methodology to bidding
l Creation of demand through promotional activities such as attending trade shows (locally and internationally)
l Leveraging of international association memberships (e.g. BestCities Global Alliance and International Congress and Convention Association)
l Unique programmes and value-added offerings (e.g. delegate boosting, networking and legacy programme)
l Focused sector approach and cross-selling with other Wesgro units (e.g. trade team)
The leisure tourism team places emphasis on:
l The creation of demand through marketing activities, not tourism product development
l The acquisition and generation of data and intelligence
l Collaboration with various provincial (e.g. regional and local tourism offices), national (e.g. South African Tourism) and international (e.g. UNWTO) organisations
l Joint marketing opportunities with private sector (e.g. trade and media)
The DMO must also ensure that focus is given to the priority initiatives as identified by the Western Cape Government’s Project Khulisa: tourism strategy.
Programme structure The programme structure has been aligned to Project Khulisa: Tourism Activity Dashboard as approved by Cabinet and is made up of three sub-programmes. The financial year under review is the second year of Project Khulisa and
the sub-programmes will work off the foundation built in 2016/17.
Sub-programme 6.1: Boost awareness of the Western Cape in key markets and sectorsThis sub-programme will be made up of the following strategic initiatives:
l Competitive identity
l Partnership growth strategies in key markets
l Digital management and real-time intelligence
l Grow business tourism
l CRM and stakeholder management
Sub-programme 6.2: Improve accessibility to Cape Town and the regionsThis sub-programme will be made up of the following strategic initiatives:
l Air Access (which forms part of a separate strategic unit within Wesgro)
l Cape Investor Centre (which forms part of Wesgro’s Trade and Investment Unit)
l Local transport marketing
Sub-programme 6.3: Boost the attractiveness of the Cape through a competitive offeringThis sub-programme will be made up of the following strategic initiatives:
l The Cross Cape promotion
l Madiba legacy route
l Gastronomy tourism promotion
l Cape of Great Events promotion
l Service level improvement
Strategic objectivesThe strategic objective of the programme is:
l Enhance the attractiveness, awareness and accessibility of the of region and drive conversion.
Strategic objectives, performance indicators, planned targets and actual achievementsDuring the financial year under review, the Unit supported a total of 34 tourism marketing initiatives, with an estimated economic value of over R1,1bn.
Convention BureauCorporate meetings, incentive travel, conferences and exhibitions are business tourism events that fuel the Western
58part b
Cape’s knowledge economy, and bring thousands of high value delegates to our province. Many business events are in sectors such as information and communication technology, medical sciences and education – sectors that contribute significantly in growing the region’s expertise, knowledge and skills and are strongly linked to the work done by the trade and investment promotion teams.
The Convention Bureau team secured 30 new bids for the period under review, with an estimated economic impact exceeding R1 billion, for the first time. Highlight of the bids won this year includes the International Astronomy Union General Assembly, taking place in August 2024, with an estimated delegate attendance of 3 000. The event will take place during the traditional low-season, and it will run for a period of 10 days, which significantly increases the estimated economic impact.
Cape Town was ranked as the top city for international association meetings in Africa, according to the International Congress and Convention Association (ICCA) Statistics Report 2018. A total of 42 association meetings were held in the Mother City, during that period. In addition, Stellenbosch hosted an additional 9 international association meetings during the same period. The Western Cape therefore hosted 51 international association meetings, out of a total of 1 000 meetings that took place in South Africa during this period.
Furthermore, the destination hosted the Young Presidents’ Organisation (YPO) Global Leadership and Edge Conference, in March 2019 with an estimated 2,500 delegates. These high-level CEOs from over 130 countries are also investors, and therefore the conference was extremely important for the business brand of the destination.
Leisure tourismDespite a challenging year, due to the impact of various negative factors which included, amongst others, the drought messaging, the Leisure Unit had a very successful year, utilising the opportunities available to increase engagements
and collaborations with partners and stakeholders.
One of the main highlights for the period under review, was the launch of the “Nowhere Does it Better” Global Campaign in November 2018. Government in partnership with the private sector combined resources to address negative messaging, targeting our main source markets namely, the UK, Germany and USA, to ensure that the province remains the travel destination of choice.
Furthermore, additional campaigns were executed, to enhance the positive messaging, such as the, “It’s all still here” surfing digital campaign – a collaboration between Wesgro and some of South Africa’s top surfers on the local and international front, addressing the water messaging.
The Unit successfully launched and continues to promote three additional cycling routes, namely; Cape Town 364, Cederberg Circuit and the Overberg Meander. The unveiling of the Madiba Statue, at the Cape Town City Hall, as part of the Madiba Centenary Year, was also extremely successful and attracted a significant amount of international media coverage.
As part of its commitment to enhance regional spread, the Agency supports events throughout the Province. The event industry is a dynamic and fast-growing sector with obvious synergies with tourism. When appropriately hosted, events have the potential to; expand the visitor economy, provide media exposure, promote development, and stimulate infrastructure upgrades which include the emergence of new partnerships. During the financial year under review the Agency supported 50 events, of which 43 events took place within regions outside the City, drawing over two hundred thousand visitors to the regions. The increase in visitors to the region, generated an estimated economic impact of over R215m, resulting in the creation of over five thousand temporary jobs. The table provides a breakdown of the events hosted;
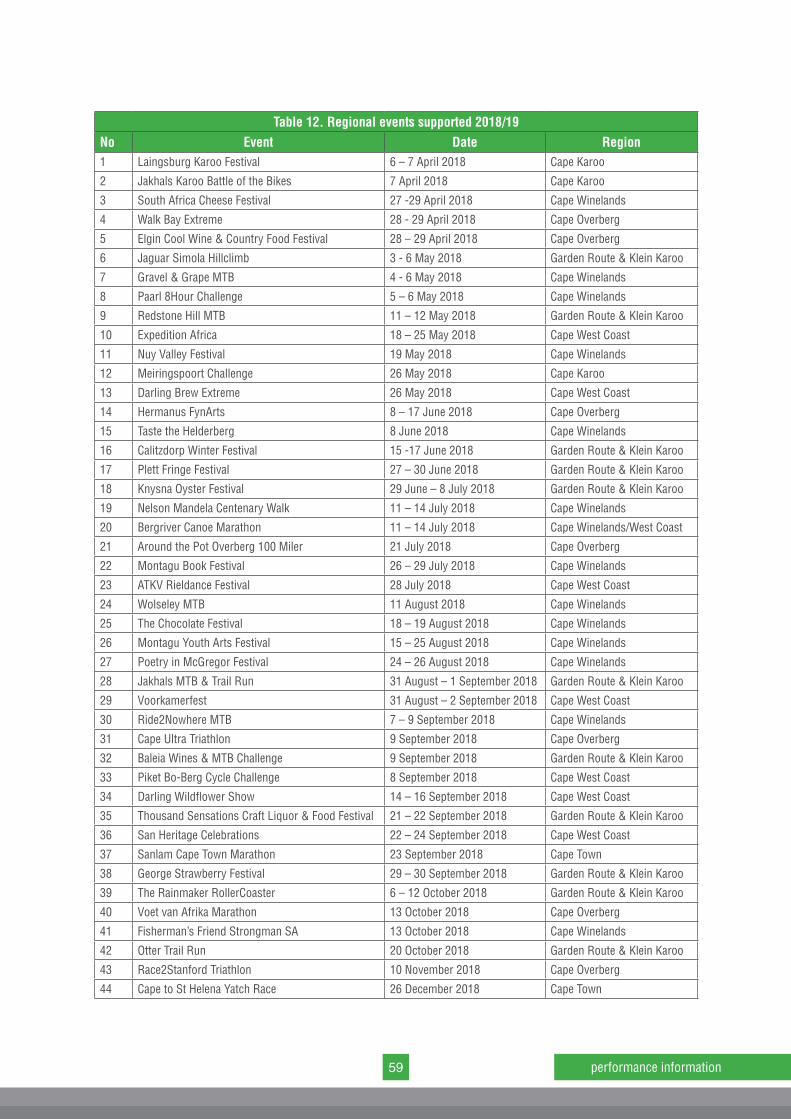
59 performance information
Table 12. Regional events supported 2018/19No Event Date Region1 Laingsburg Karoo Festival 6 – 7 April 2018 Cape Karoo
2 Jakhals Karoo Battle of the Bikes 7 April 2018 Cape Karoo
3 South Africa Cheese Festival 27 -29 April 2018 Cape Winelands
4 Walk Bay Extreme 28 - 29 April 2018 Cape Overberg
5 Elgin Cool Wine & Country Food Festival 28 – 29 April 2018 Cape Overberg
6 Jaguar Simola Hillclimb 3 - 6 May 2018 Garden Route & Klein Karoo
7 Gravel & Grape MTB 4 - 6 May 2018 Cape Winelands
8 Paarl 8Hour Challenge 5 – 6 May 2018 Cape Winelands
9 Redstone Hill MTB 11 – 12 May 2018 Garden Route & Klein Karoo
10 Expedition Africa 18 – 25 May 2018 Cape West Coast
11 Nuy Valley Festival 19 May 2018 Cape Winelands
12 Meiringspoort Challenge 26 May 2018 Cape Karoo
13 Darling Brew Extreme 26 May 2018 Cape West Coast
14 Hermanus FynArts 8 – 17 June 2018 Cape Overberg
15 Taste the Helderberg 8 June 2018 Cape Winelands
16 Calitzdorp Winter Festival 15 -17 June 2018 Garden Route & Klein Karoo
17 Plett Fringe Festival 27 – 30 June 2018 Garden Route & Klein Karoo
18 Knysna Oyster Festival 29 June – 8 July 2018 Garden Route & Klein Karoo
19 Nelson Mandela Centenary Walk 11 – 14 July 2018 Cape Winelands
20 Bergriver Canoe Marathon 11 – 14 July 2018 Cape Winelands/West Coast
21 Around the Pot Overberg 100 Miler 21 July 2018 Cape Overberg
22 Montagu Book Festival 26 – 29 July 2018 Cape Winelands
23 ATKV Rieldance Festival 28 July 2018 Cape West Coast
24 Wolseley MTB 11 August 2018 Cape Winelands
25 The Chocolate Festival 18 – 19 August 2018 Cape Winelands
26 Montagu Youth Arts Festival 15 – 25 August 2018 Cape Winelands
27 Poetry in McGregor Festival 24 – 26 August 2018 Cape Winelands
28 Jakhals MTB & Trail Run 31 August – 1 September 2018 Garden Route & Klein Karoo
29 Voorkamerfest 31 August – 2 September 2018 Cape West Coast
30 Ride2Nowhere MTB 7 – 9 September 2018 Cape Winelands
31 Cape Ultra Triathlon 9 September 2018 Cape Overberg
32 Baleia Wines & MTB Challenge 9 September 2018 Garden Route & Klein Karoo
33 Piket Bo-Berg Cycle Challenge 8 September 2018 Cape West Coast
34 Darling Wildflower Show 14 – 16 September 2018 Cape West Coast
35 Thousand Sensations Craft Liquor & Food Festival 21 – 22 September 2018 Garden Route & Klein Karoo
36 San Heritage Celebrations 22 – 24 September 2018 Cape West Coast
37 Sanlam Cape Town Marathon 23 September 2018 Cape Town
38 George Strawberry Festival 29 – 30 September 2018 Garden Route & Klein Karoo
39 The Rainmaker RollerCoaster 6 – 12 October 2018 Garden Route & Klein Karoo
40 Voet van Afrika Marathon 13 October 2018 Cape Overberg
41 Fisherman’s Friend Strongman SA 13 October 2018 Cape Winelands
42 Otter Trail Run 20 October 2018 Garden Route & Klein Karoo
43 Race2Stanford Triathlon 10 November 2018 Cape Overberg
44 Cape to St Helena Yatch Race 26 December 2018 Cape Town
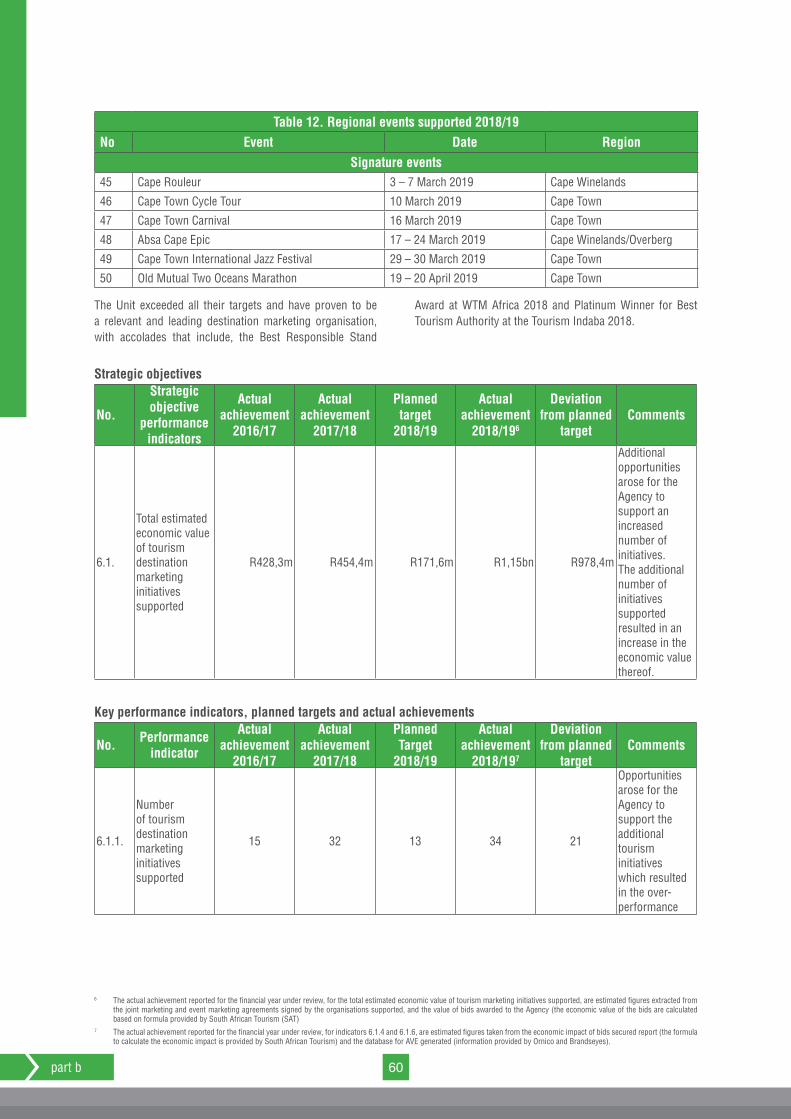
60part b
Table 12. Regional events supported 2018/19No Event Date Region
Signature events45 Cape Rouleur 3 – 7 March 2019 Cape Winelands
46 Cape Town Cycle Tour 10 March 2019 Cape Town
47 Cape Town Carnival 16 March 2019 Cape Town
48 Absa Cape Epic 17 – 24 March 2019 Cape Winelands/Overberg
49 Cape Town International Jazz Festival 29 – 30 March 2019 Cape Town
50 Old Mutual Two Oceans Marathon 19 – 20 April 2019 Cape Town
The Unit exceeded all their targets and have proven to be a relevant and leading destination marketing organisation, with accolades that include, the Best Responsible Stand
Award at WTM Africa 2018 and Platinum Winner for Best Tourism Authority at the Tourism Indaba 2018.
Strategic objectives
No.
Strategic objective
performance indicators
Actual achievement
2016/17
Actual achievement
2017/18
Planned target
2018/19
Actual achievement
2018/196
Deviation from planned
targetComments
6.1.
Total estimated economic value of tourism destination marketing initiatives supported
R428,3m R454,4m R171,6m R1,15bn R978,4m
Additional opportunities arose for the Agency to support an increased number of initiatives. The additional number of initiatives supported resulted in an increase in the economic value thereof.
Key performance indicators, planned targets and actual achievements
No. Performance indicator
Actual achievement
2016/17
Actual achievement
2017/18
Planned Target
2018/19
Actual achievement
2018/197
Deviation from planned
targetComments
6.1.1.
Number of tourism destination marketing initiatives supported
15 32 13 34 21
Opportunities arose for the Agency to support the additional tourism initiatives which resulted in the over-performance
6 The actual achievement reported for the financial year under review, for the total estimated economic value of tourism marketing initiatives supported, are estimated figures extracted from the joint marketing and event marketing agreements signed by the organisations supported, and the value of bids awarded to the Agency (the economic value of the bids are calculated based on formula provided by South African Tourism (SAT)
7 The actual achievement reported for the financial year under review, for indicators 6.1.4 and 6.1.6, are estimated figures taken from the economic impact of bids secured report (the formula to calculate the economic impact is provided by South African Tourism) and the database for AVE generated (information provided by Ornico and Brandseyes).
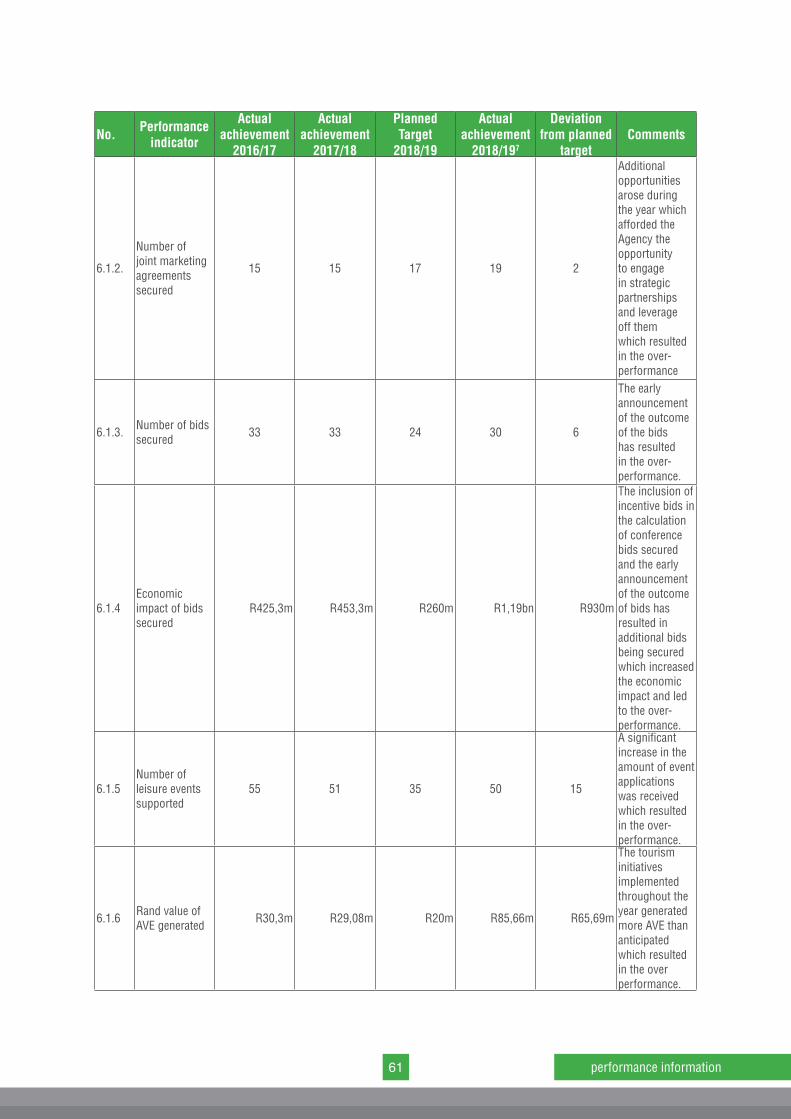
61 performance information
No. Performance indicator
Actual achievement
2016/17
Actual achievement
2017/18
Planned Target
2018/19
Actual achievement
2018/197
Deviation from planned
targetComments
6.1.2.
Number of joint marketing agreements secured
15 15 17 19 2
Additional opportunities arose during the year which afforded the Agency the opportunity to engage in strategic partnerships and leverage off them which resulted in the over- performance
6.1.3. Number of bids secured 33 33 24 30 6
The early announcement of the outcome of the bids has resulted in the over-performance.
6.1.4Economic impact of bids secured
R425,3m R453,3m R260m R1,19bn R930m
The inclusion of incentive bids in the calculation of conference bids secured and the early announcement of the outcome of bids has resulted in additional bids being secured which increased the economic impact and led to the over-performance.
6.1.5Number of leisure events supported
55 51 35 50 15
A significant increase in the amount of event applications was received which resulted in the over-performance.
6.1.6 Rand value of AVE generated R30,3m R29,08m R20m R85,66m R65,69m
The tourism initiatives implemented throughout the year generated more AVE than anticipated which resulted in the over performance.
62part b
Strategy to overcome under-performanceNA
Changes required to planned targetsNo targets were adjusted during the financial year.
Linking performance with budget
Programme
2018/19 2017/18
Budget Actual expenditure
(Over)/Under expenditure Budget Actual
expenditure(Over)/Under expenditure
(R’000) (R’000) (R’000) (R’000) (R’000) (R’000)
Tourism promotion 17 781 17 857 -76 16 836 16 960 -124
Total 17 781 17 857 -76 16 836 16 960 -124
Contributions towards WTM Africa and other international platforms including membership to Best City Alliance influenced by the exchange rate fluctuations.
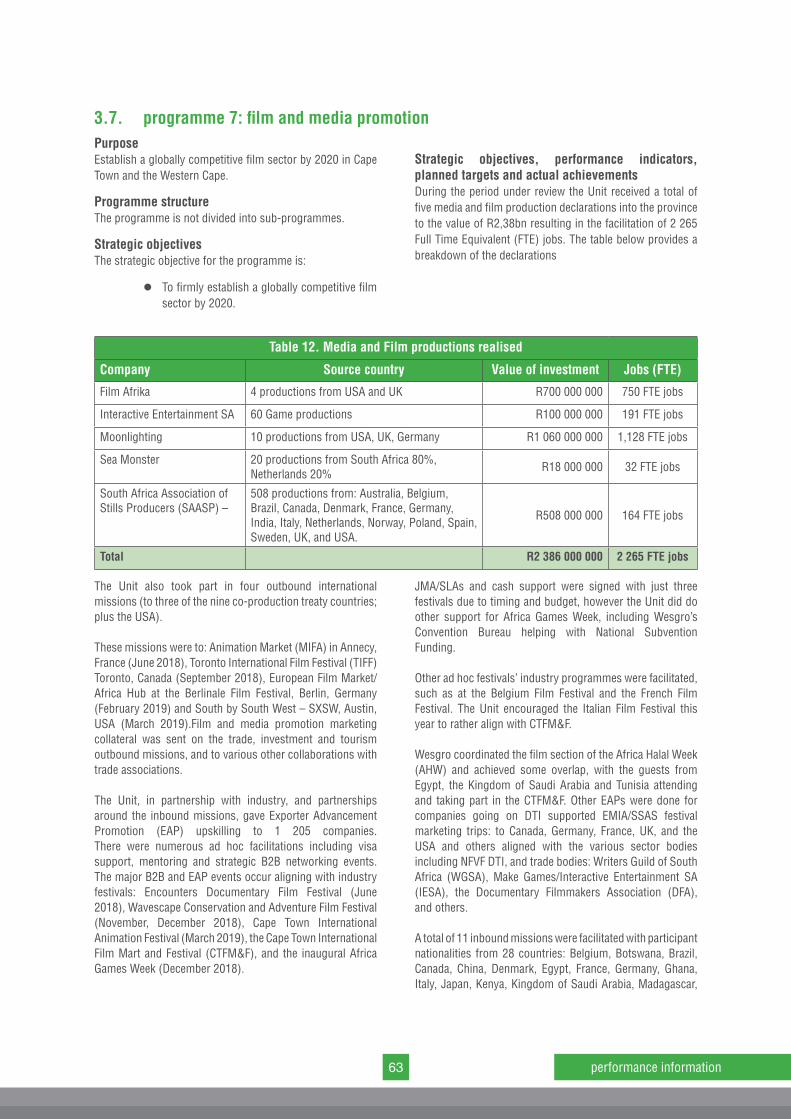
63 performance information
Table 12. Media and Film productions realised
Company Source country Value of investment Jobs (FTE)
Film Afrika 4 productions from USA and UK R700 000 000 750 FTE jobs
Interactive Entertainment SA 60 Game productions R100 000 000 191 FTE jobs
Moonlighting 10 productions from USA, UK, Germany R1 060 000 000 1,128 FTE jobs
Sea Monster 20 productions from South Africa 80%, Netherlands 20% R18 000 000 32 FTE jobs
South Africa Association of Stills Producers (SAASP) –
508 productions from: Australia, Belgium, Brazil, Canada, Denmark, France, Germany, India, Italy, Netherlands, Norway, Poland, Spain, Sweden, UK, and USA.
R508 000 000 164 FTE jobs
Total R2 386 000 000 2 265 FTE jobs
The Unit also took part in four outbound international missions (to three of the nine co-production treaty countries; plus the USA).
These missions were to: Animation Market (MIFA) in Annecy, France (June 2018), Toronto International Film Festival (TIFF) Toronto, Canada (September 2018), European Film Market/Africa Hub at the Berlinale Film Festival, Berlin, Germany (February 2019) and South by South West – SXSW, Austin, USA (March 2019).Film and media promotion marketing collateral was sent on the trade, investment and tourism outbound missions, and to various other collaborations with trade associations.
The Unit, in partnership with industry, and partnerships around the inbound missions, gave Exporter Advancement Promotion (EAP) upskilling to 1 205 companies. There were numerous ad hoc facilitations including visa support, mentoring and strategic B2B networking events. The major B2B and EAP events occur aligning with industry festivals: Encounters Documentary Film Festival (June 2018), Wavescape Conservation and Adventure Film Festival (November, December 2018), Cape Town International Animation Festival (March 2019), the Cape Town International Film Mart and Festival (CTFM&F), and the inaugural Africa Games Week (December 2018).
JMA/SLAs and cash support were signed with just three festivals due to timing and budget, however the Unit did do other support for Africa Games Week, including Wesgro’s Convention Bureau helping with National Subvention Funding.
Other ad hoc festivals’ industry programmes were facilitated, such as at the Belgium Film Festival and the French Film Festival. The Unit encouraged the Italian Film Festival this year to rather align with CTFM&F.
Wesgro coordinated the film section of the Africa Halal Week (AHW) and achieved some overlap, with the guests from Egypt, the Kingdom of Saudi Arabia and Tunisia attending and taking part in the CTFM&F. Other EAPs were done for companies going on DTI supported EMIA/SSAS festival marketing trips: to Canada, Germany, France, UK, and the USA and others aligned with the various sector bodies including NFVF DTI, and trade bodies: Writers Guild of South Africa (WGSA), Make Games/Interactive Entertainment SA (IESA), the Documentary Filmmakers Association (DFA), and others.
A total of 11 inbound missions were facilitated with participant nationalities from 28 countries: Belgium, Botswana, Brazil, Canada, China, Denmark, Egypt, France, Germany, Ghana, Italy, Japan, Kenya, Kingdom of Saudi Arabia, Madagascar,
3.7. programme 7: film and media promotion PurposeEstablish a globally competitive film sector by 2020 in Cape Town and the Western Cape.
Programme structureThe programme is not divided into sub-programmes.
Strategic objectivesThe strategic objective for the programme is:
l To firmly establish a globally competitive film sector by 2020.
Strategic objectives, performance indicators, planned targets and actual achievementsDuring the period under review the Unit received a total of five media and film production declarations into the province to the value of R2,38bn resulting in the facilitation of 2 265 Full Time Equivalent (FTE) jobs. The table below provides a breakdown of the declarations
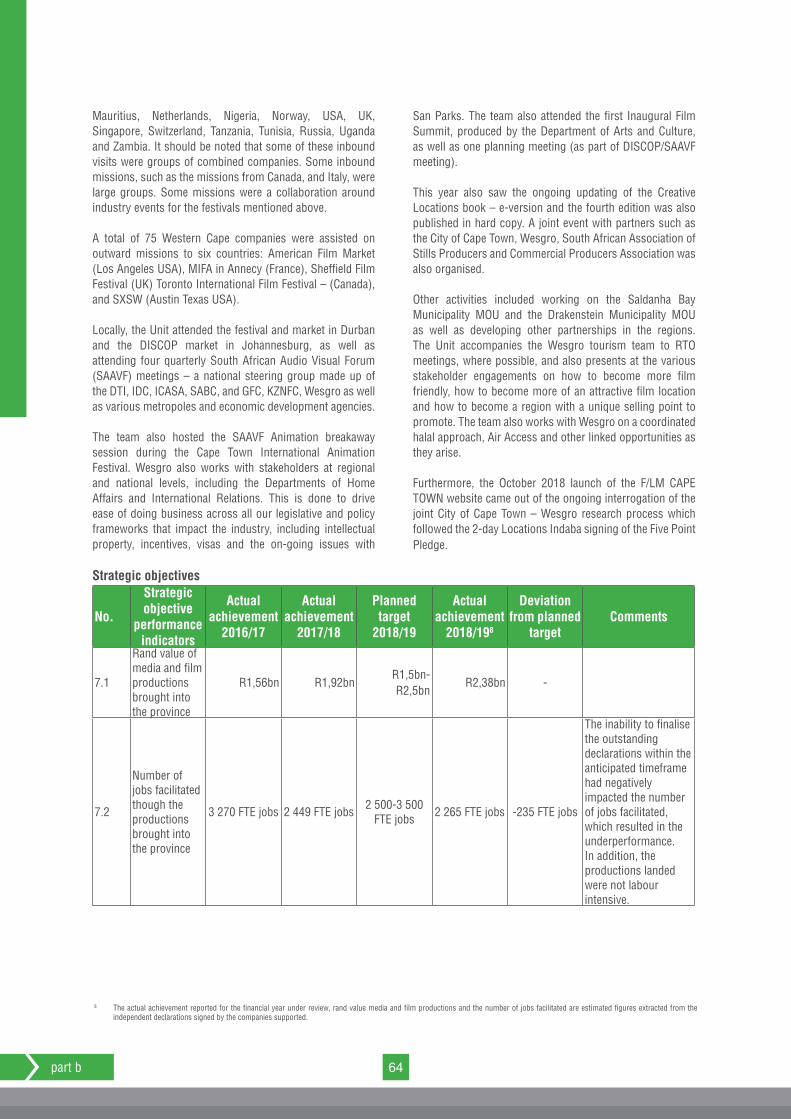
64part b
Mauritius, Netherlands, Nigeria, Norway, USA, UK, Singapore, Switzerland, Tanzania, Tunisia, Russia, Uganda and Zambia. It should be noted that some of these inbound visits were groups of combined companies. Some inbound missions, such as the missions from Canada, and Italy, were large groups. Some missions were a collaboration around industry events for the festivals mentioned above.
A total of 75 Western Cape companies were assisted on outward missions to six countries: American Film Market (Los Angeles USA), MIFA in Annecy (France), Sheffield Film Festival (UK) Toronto International Film Festival – (Canada), and SXSW (Austin Texas USA).
Locally, the Unit attended the festival and market in Durban and the DISCOP market in Johannesburg, as well as attending four quarterly South African Audio Visual Forum (SAAVF) meetings – a national steering group made up of the DTI, IDC, ICASA, SABC, and GFC, KZNFC, Wesgro as well as various metropoles and economic development agencies.
The team also hosted the SAAVF Animation breakaway session during the Cape Town International Animation Festival. Wesgro also works with stakeholders at regional and national levels, including the Departments of Home Affairs and International Relations. This is done to drive ease of doing business across all our legislative and policy frameworks that impact the industry, including intellectual property, incentives, visas and the on-going issues with
San Parks. The team also attended the first Inaugural Film Summit, produced by the Department of Arts and Culture, as well as one planning meeting (as part of DISCOP/SAAVF meeting).
This year also saw the ongoing updating of the Creative Locations book – e-version and the fourth edition was also published in hard copy. A joint event with partners such as the City of Cape Town, Wesgro, South African Association of Stills Producers and Commercial Producers Association was also organised.
Other activities included working on the Saldanha Bay Municipality MOU and the Drakenstein Municipality MOU as well as developing other partnerships in the regions. The Unit accompanies the Wesgro tourism team to RTO meetings, where possible, and also presents at the various stakeholder engagements on how to become more film friendly, how to become more of an attractive film location and how to become a region with a unique selling point to promote. The team also works with Wesgro on a coordinated halal approach, Air Access and other linked opportunities as they arise.
Furthermore, the October 2018 launch of the F/LM CAPE TOWN website came out of the ongoing interrogation of the joint City of Cape Town – Wesgro research process which followed the 2-day Locations Indaba signing of the Five Point Pledge.
Strategic objectives
No.
Strategic objective
performance indicators
Actual achievement
2016/17
Actual achievement
2017/18
Planned target
2018/19
Actual achievement
2018/198
Deviation from planned
targetComments
7.1
Rand value of media and film productions brought into the province
R1,56bn R1,92bnR1,5bn- R2,5bn
R2,38bn -
7.2
Number of jobs facilitated though the productions brought into the province
3 270 FTE jobs 2 449 FTE jobs 2 500-3 500 FTE jobs 2 265 FTE jobs -235 FTE jobs
The inability to finalise the outstanding declarations within the anticipated timeframe had negatively impacted the number of jobs facilitated, which resulted in the underperformance. In addition, the productions landed were not labour intensive.
8 The actual achievement reported for the financial year under review, rand value media and film productions and the number of jobs facilitated are estimated figures extracted from the independent declarations signed by the companies supported.
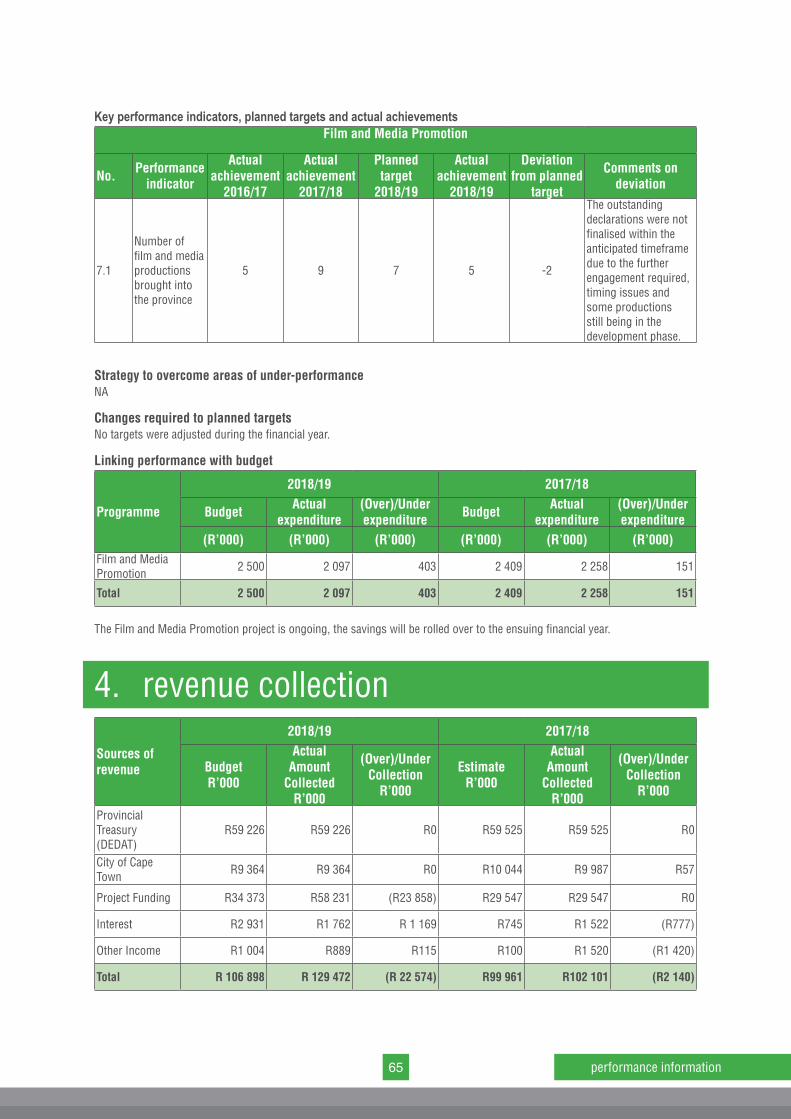
65 performance information
Key performance indicators, planned targets and actual achievementsFilm and Media Promotion
No. Performance indicator
Actual achievement
2016/17
Actual achievement
2017/18
Planned target
2018/19
Actual achievement
2018/19
Deviation from planned
target
Comments on deviation
7.1
Number of film and media productions brought into the province
5 9 7 5 -2
The outstanding declarations were not finalised within the anticipated timeframe due to the further engagement required, timing issues and some productions still being in the development phase.
Strategy to overcome areas of under-performanceNA
Changes required to planned targetsNo targets were adjusted during the financial year.
Linking performance with budget
Programme
2018/19 2017/18
Budget Actual expenditure
(Over)/Under expenditure Budget Actual
expenditure(Over)/Under expenditure
(R’000) (R’000) (R’000) (R’000) (R’000) (R’000)Film and Media Promotion 2 500 2 097 403 2 409 2 258 151
Total 2 500 2 097 403 2 409 2 258 151
The Film and Media Promotion project is ongoing, the savings will be rolled over to the ensuing financial year.
4. revenue collection
Sources of revenue
2018/19 2017/18
BudgetR’000
ActualAmount
CollectedR’000
(Over)/Under Collection
R’000
EstimateR’000
ActualAmount
CollectedR’000
(Over)/Under Collection
R’000
Provincial Treasury (DEDAT)
R59 226 R59 226 R0 R59 525 R59 525 R0
City of Cape Town R9 364 R9 364 R0 R10 044 R9 987 R57
Project Funding R34 373 R58 231 (R23 858) R29 547 R29 547 R0
Interest R2 931 R1 762 R 1 169 R745 R1 522 (R777)
Other Income R1 004 R889 R115 R100 R1 520 (R1 420)
Total R 106 898 R 129 472 (R 22 574) R99 961 R102 101 (R2 140)
66part b
The Agency received funding from the DEDAT and the City of Cape Town (CoCT). For the period under review, a total of R26,7m was received from DEDAT to fund investment and trade promotion activities, and a total of R8,864m from the CoCT. The CoCT ring-fenced a total of R4,4m for special projects, which included Air Access (R800 000), Film (R2m), One Stop Shop (R100 000), Business Tourism (R 500 000) and Invest Cape Town (R1 000 000).
A total of R41,67m was received from DEDAT for Destination Marketing and Project Khulisa. The allocation was broken down as follows: staff and operational costs (R17,78m), Khulisa programme expenditure (R14,745m) and other projects (R9,15m). Project income from other
projects included Agribusiness (R2m) and Visit Knysna Office (R4m). Other income was received from interest generated from the Agency’s investment in the Corporation of deposits. A total of R1,76m was received in interest. The budgeted amount differs from the amount collected due to higher interest rates received on larger projects.
Other income (R889) was received from management fees for the management of special projects within the Agency, sundry income from the sale of disposed assets, and for the rental of the stand space to other regional and local tourism trade bodies at the Indaba. However, the management fee income on the sale of assets and rental of stand space did not form part of the budgeted income.
4.1. capital investment Not applicable
67 performance information
Clifton Beach, Cape Town

68part b
Landscape in George, Western Cape

part c: governance
governance
part c
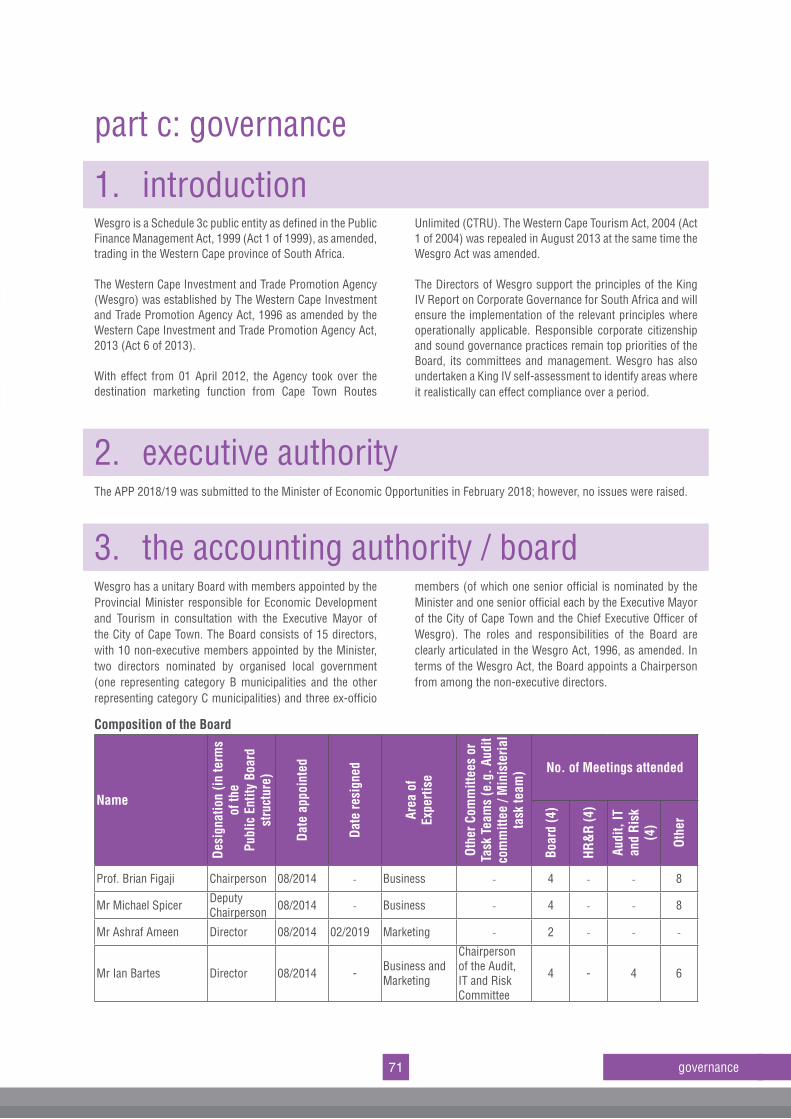
part c: governance
1. introductionWesgro is a Schedule 3c public entity as defined in the Public Finance Management Act, 1999 (Act 1 of 1999), as amended, trading in the Western Cape province of South Africa.
The Western Cape Investment and Trade Promotion Agency (Wesgro) was established by The Western Cape Investment and Trade Promotion Agency Act, 1996 as amended by the Western Cape Investment and Trade Promotion Agency Act, 2013 (Act 6 of 2013).
With effect from 01 April 2012, the Agency took over the destination marketing function from Cape Town Routes
Unlimited (CTRU). The Western Cape Tourism Act, 2004 (Act 1 of 2004) was repealed in August 2013 at the same time the Wesgro Act was amended.
The Directors of Wesgro support the principles of the King IV Report on Corporate Governance for South Africa and will ensure the implementation of the relevant principles where operationally applicable. Responsible corporate citizenship and sound governance practices remain top priorities of the Board, its committees and management. Wesgro has also undertaken a King IV self-assessment to identify areas where it realistically can effect compliance over a period.
2. executive authorityThe APP 2018/19 was submitted to the Minister of Economic Opportunities in February 2018; however, no issues were raised.
3. the accounting authority / board Wesgro has a unitary Board with members appointed by the Provincial Minister responsible for Economic Development and Tourism in consultation with the Executive Mayor of the City of Cape Town. The Board consists of 15 directors, with 10 non-executive members appointed by the Minister, two directors nominated by organised local government (one representing category B municipalities and the other representing category C municipalities) and three ex-officio
members (of which one senior official is nominated by the Minister and one senior official each by the Executive Mayor of the City of Cape Town and the Chief Executive Officer of Wesgro). The roles and responsibilities of the Board are clearly articulated in the Wesgro Act, 1996, as amended. In terms of the Wesgro Act, the Board appoints a Chairperson from among the non-executive directors.
Composition of the Board
Name
Desi
gnat
ion
(in te
rms
of th
e
Publ
ic E
ntity
Boa
rd
stru
ctur
e)
Date
app
oint
ed
Date
resi
gned
Area
of
Expe
rtise
Othe
r Com
mitt
ees
or
Task
Tea
ms
(e.g
. Aud
it co
mm
ittee
/ M
inis
teria
l ta
sk te
am) No. of Meetings attended
Boar
d (4
)
HR&
R (4
)
Audi
t, IT
an
d Ri
sk
(4)
Othe
r
Prof. Brian Figaji Chairperson 08/2014 - Business - 4 - - 8
Mr Michael Spicer Deputy Chairperson 08/2014 - Business - 4 - - 8
Mr Ashraf Ameen Director 08/2014 02/2019 Marketing - 2 - - -
Mr Ian Bartes Director 08/2014 - Business and Marketing
Chairperson of the Audit, IT and Risk Committee
4 - 4 6
71 governance
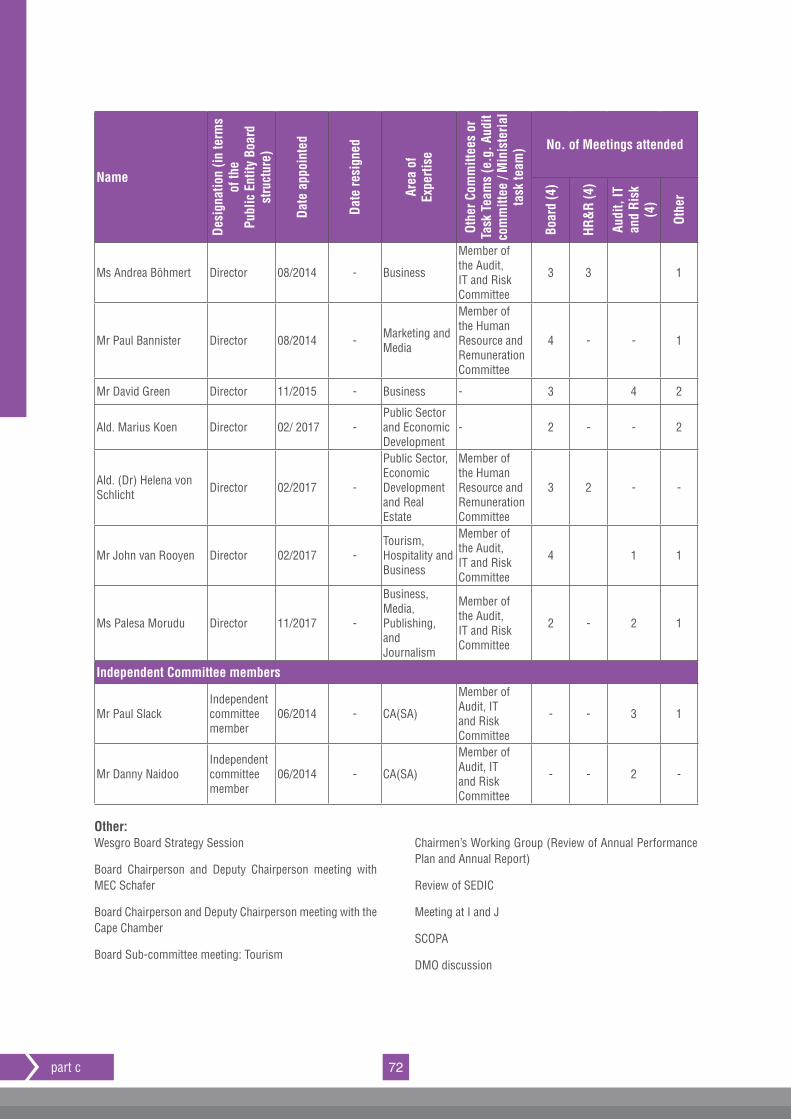
72part c
Name
Desi
gnat
ion
(in te
rms
of th
e
Publ
ic E
ntity
Boa
rd
stru
ctur
e)
Date
app
oint
ed
Date
resi
gned
Area
of
Expe
rtise
Othe
r Com
mitt
ees
or
Task
Tea
ms
(e.g
. Aud
it co
mm
ittee
/ M
inis
teria
l ta
sk te
am) No. of Meetings attended
Boar
d (4
)
HR&
R (4
)
Audi
t, IT
an
d Ri
sk
(4)
Othe
r
Ms Andrea Böhmert Director 08/2014 - Business
Member of the Audit, IT and Risk Committee
3 3 1
Mr Paul Bannister Director 08/2014 - Marketing and Media
Member of the Human Resource and Remuneration Committee
4 - - 1
Mr David Green Director 11/2015 - Business - 3 4 2
Ald. Marius Koen Director 02/ 2017 -Public Sector and Economic Development
- 2 - - 2
Ald. (Dr) Helena von Schlicht Director 02/2017 -
Public Sector, Economic Development and Real Estate
Member of the Human Resource and Remuneration Committee
3 2 - -
Mr John van Rooyen Director 02/2017 -Tourism, Hospitality and Business
Member of the Audit, IT and Risk Committee
4 1 1
Ms Palesa Morudu Director 11/2017 -
Business, Media, Publishing, and Journalism
Member of the Audit, IT and Risk Committee
2 - 2 1
Independent Committee members
Mr Paul SlackIndependent committee member
06/2014 - CA(SA)
Member of Audit, IT and Risk Committee
- - 3 1
Mr Danny NaidooIndependent committee member
06/2014 - CA(SA)
Member of Audit, IT and Risk Committee
- - 2 -
Other:Wesgro Board Strategy Session
Board Chairperson and Deputy Chairperson meeting with MEC Schafer
Board Chairperson and Deputy Chairperson meeting with the Cape Chamber
Board Sub-committee meeting: Tourism
Chairmen’s Working Group (Review of Annual Performance Plan and Annual Report)
Review of SEDIC
Meeting at I and J
SCOPA
DMO discussion
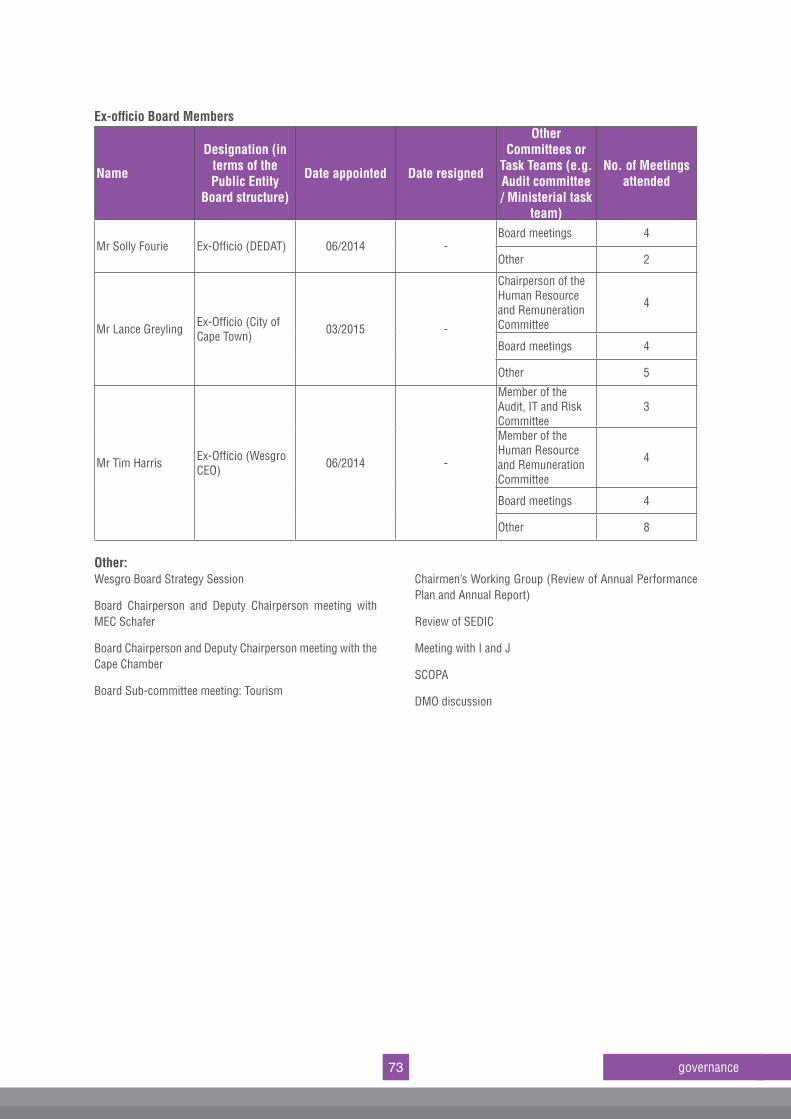
73 governance
Ex-officio Board Members
Name
Designation (in terms of the Public Entity
Board structure)
Date appointed Date resigned
Other Committees or
Task Teams (e.g. Audit committee / Ministerial task
team)
No. of Meetings attended
Mr Solly Fourie Ex-Officio (DEDAT) 06/2014 -Board meetings 4
Other 2
Mr Lance Greyling Ex-Officio (City of Cape Town) 03/2015 -
Chairperson of the Human Resource and Remuneration Committee
4
Board meetings 4
Other 5
Mr Tim Harris Ex-Officio (Wesgro CEO) 06/2014 -
Member of the Audit, IT and Risk Committee
3
Member of the Human Resource and Remuneration Committee
4
Board meetings 4
Other 8
Other: Wesgro Board Strategy Session
Board Chairperson and Deputy Chairperson meeting with MEC Schafer
Board Chairperson and Deputy Chairperson meeting with the Cape Chamber
Board Sub-committee meeting: Tourism
Chairmen’s Working Group (Review of Annual Performance Plan and Annual Report)
Review of SEDIC
Meeting with I and J
SCOPA
DMO discussion
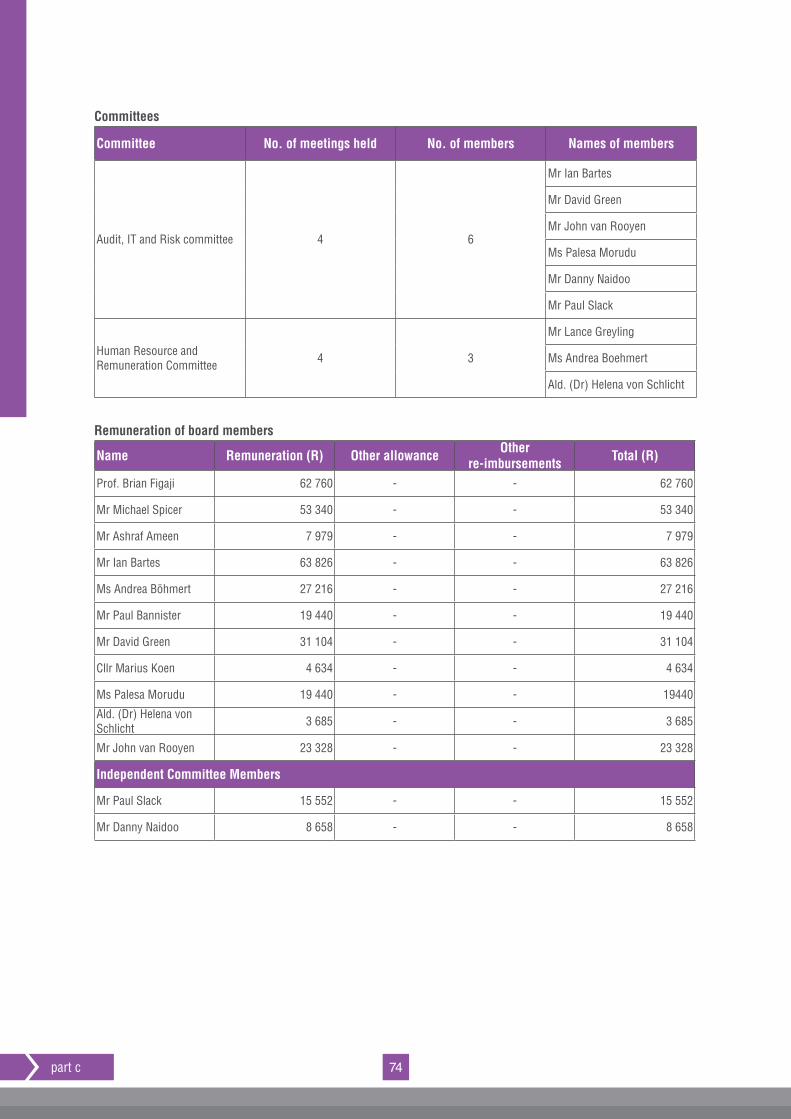
74part c
Committees
Committee No. of meetings held No. of members Names of members
Audit, IT and Risk committee 4 6
Mr Ian Bartes
Mr David Green
Mr John van Rooyen
Ms Palesa Morudu
Mr Danny Naidoo
Mr Paul Slack
Human Resource and Remuneration Committee 4 3
Mr Lance Greyling
Ms Andrea Boehmert
Ald. (Dr) Helena von Schlicht
Remuneration of board members
Name Remuneration (R) Other allowance Other re-imbursements Total (R)
Prof. Brian Figaji 62 760 - - 62 760
Mr Michael Spicer 53 340 - - 53 340
Mr Ashraf Ameen 7 979 - - 7 979
Mr Ian Bartes 63 826 - - 63 826
Ms Andrea Böhmert 27 216 - - 27 216
Mr Paul Bannister 19 440 - - 19 440
Mr David Green 31 104 - - 31 104
Cllr Marius Koen 4 634 - - 4 634
Ms Palesa Morudu 19 440 - - 19440
Ald. (Dr) Helena von Schlicht 3 685 - - 3 685
Mr John van Rooyen 23 328 - - 23 328
Independent Committee Members
Mr Paul Slack 15 552 - - 15 552
Mr Danny Naidoo 8 658 - - 8 658
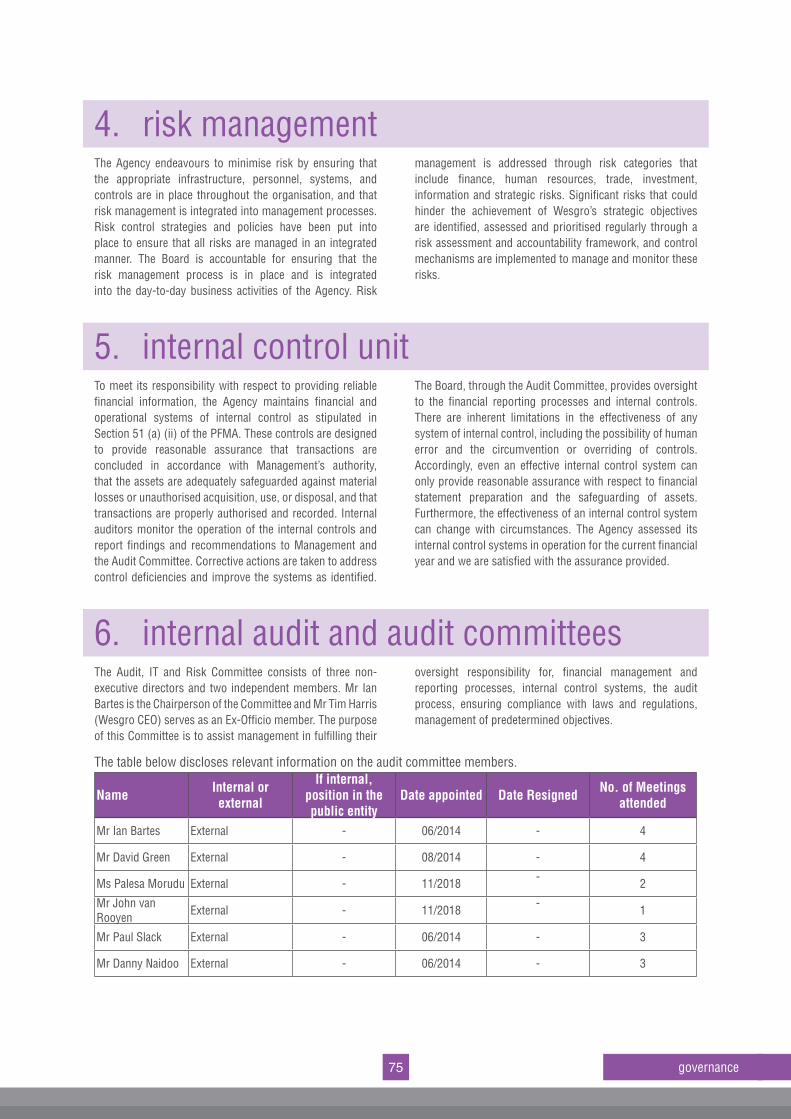
75 governance
4. risk managementThe Agency endeavours to minimise risk by ensuring that the appropriate infrastructure, personnel, systems, and controls are in place throughout the organisation, and that risk management is integrated into management processes. Risk control strategies and policies have been put into place to ensure that all risks are managed in an integrated manner. The Board is accountable for ensuring that the risk management process is in place and is integrated into the day-to-day business activities of the Agency. Risk
management is addressed through risk categories that include finance, human resources, trade, investment, information and strategic risks. Significant risks that could hinder the achievement of Wesgro’s strategic objectives are identified, assessed and prioritised regularly through a risk assessment and accountability framework, and control mechanisms are implemented to manage and monitor these risks.
5. internal control unitTo meet its responsibility with respect to providing reliable financial information, the Agency maintains financial and operational systems of internal control as stipulated in Section 51 (a) (ii) of the PFMA. These controls are designed to provide reasonable assurance that transactions are concluded in accordance with Management’s authority, that the assets are adequately safeguarded against material losses or unauthorised acquisition, use, or disposal, and that transactions are properly authorised and recorded. Internal auditors monitor the operation of the internal controls and report findings and recommendations to Management and the Audit Committee. Corrective actions are taken to address control deficiencies and improve the systems as identified.
The Board, through the Audit Committee, provides oversight to the financial reporting processes and internal controls. There are inherent limitations in the effectiveness of any system of internal control, including the possibility of human error and the circumvention or overriding of controls. Accordingly, even an effective internal control system can only provide reasonable assurance with respect to financial statement preparation and the safeguarding of assets. Furthermore, the effectiveness of an internal control system can change with circumstances. The Agency assessed its internal control systems in operation for the current financial year and we are satisfied with the assurance provided.
6. internal audit and audit committeesThe Audit, IT and Risk Committee consists of three non-executive directors and two independent members. Mr Ian Bartes is the Chairperson of the Committee and Mr Tim Harris (Wesgro CEO) serves as an Ex-Officio member. The purpose of this Committee is to assist management in fulfilling their
oversight responsibility for, financial management and reporting processes, internal control systems, the audit process, ensuring compliance with laws and regulations, management of predetermined objectives.
The table below discloses relevant information on the audit committee members.
Name Internal or external
If internal, position in the public entity
Date appointed Date Resigned No. of Meetings attended
Mr Ian Bartes External - 06/2014 - 4
Mr David Green External - 08/2014 - 4
Ms Palesa Morudu External - 11/2018 - 2
Mr John van Rooyen External - 11/2018 - 1
Mr Paul Slack External - 06/2014 - 3
Mr Danny Naidoo External - 06/2014 - 3
76part c
7. compliance with laws and regulationsAs a Schedule 3(c) public entity, the Agency complies with Public Finance Management Acts, (Act 1 of 1999) as amended. Wesgro also complies with the requirements set out in the National Treasury Regulations, Provincial Treasury Instructions and Provincial Circulars, issued during the
financial year. The Agency compiles its financial statements in accordance with the GRAP standards and ensures that these standards are updated when required, as prescribed by Provincial Treasury.
8. fraud and corruption The Agency has an Anti-fraud and Corruption policy in place, aimed at managing the risk and ensuring the reduction thereof, as well as increasing the level of fraud awareness. In addition, the Agency has implemented a Fraud Prevention Plan, reinforcing existing policies and procedures, emphasising Wesgro’s zero-tolerance stance to fraud.
The Fraud Prevention Plan is reviewed annually to ensure compliance with relevant legislative and regulatory prescripts and best practice. Various mechanisms were implemented, which allow staff to report cases of fraud and corruption. With the preceding in mind, no fraud and corruption cases were reported during the financial year under review.
9. minimising conflict of interestThe Agency conducts monthly compliance reviews for all employees and members of the Board. Monthly compliance reports are submitted to Provincial Treasury for review. In addition, all employees and Board members are obliged to complete a declaration of interest on an annual basis.
Furthermore, all suppliers over R10 000 are required to submit the relevant compliance documentation, which is reviewed to ensure compliance with the relevant provincial and national regulations pertaining to supply chain management.
10. code of conduct Directors and employees are required to maintain the highest ethical standards, ensuring that business practices are conducted in a manner, which, in all reasonable circumstances, is beyond reproach. The Agency has a code of conduct in place, which is presented to employees during the induction process. Directors and staff are required to complete a declaration of interest on an annual basis. However, Directors declare their interests at every board
meeting. Signed copies of the signed declarations are kept on file by the board secretariat.
The Board is the custodian of good governance practices and sound business conduct within the organisation. In addition, the Chief Executive Officer promotes an organisational culture that promotes ethical practices, individual integrity, and global citizenship.
11. company / board secretary The role of the Secretariat has been acknowledged to encompass, among other functions, the following:
l The secretariat has a key role to play in ensuring that the Board and Committee meeting procedures are both followed and reviewed regularly, and has the responsibility to ensure that each Director is made aware of
and provided with guidance as to their duties, responsibilities and powers
l It is the responsibility of the Board, and in its own best interests, to ensure that the Secretariat remains capable of fulfilling the function
77 governance
l The Secretariat is responsible for ensuring that the applicable rules and regulations pertaining to the conduct of the affairs of the Board are complied with and that all matters associated with its efficient operation are maintained
l In addition to the statutory duties of the Secretariat, it must provide the Board as a whole with detailed guidance as to how their
responsibilities should be properly discharged in the best interests of the agency
l The Secretariat must keep abreast of, and inform the Board of current governance thinking and practice
l The Secretariat is responsible for co-ordinating performance evaluation of the Board of Directors.
12. audit committee reportWe are pleased to present our report for the financial year ended 31 March 2019.
Audit Committee ResponsibilityThe Audit Committee reports that it has complied with its responsibilities arising from Section 51 (1)(a)(ii) of the Public Finance Management Act and Treasury Regulation 3.1.13. The Audit Committee also reports that it has adopted appropriate formal terms of reference as its Audit Committee Charter, has regulated its affairs in compliance with this charter and has discharged all its responsibilities as contained therein, except that we have not reviewed changes in accounting policies and practices.
The Effectiveness of Internal ControlOur review of the findings of the Internal Audit work, which was based on the risk assessments conducted in the public entity, revealed certain weaknesses, which were then raised with the public entity.
The following internal audit work was completed during the year under review:
l Financial discipline review
l Review of predetermined objectives
l Review of human resources
l Review of supply chain management
l Follow up on previous queries and findings.
All matters raised were resolved.
In-Year Management and Monthly/Quarterly ReportThe public entity has submitted monthly and quarterly reports to Provincial Treasury, the Department of Economic Development and Tourism, and the City of Cape Town.
Evaluation of Financial StatementsWe have reviewed the annual financial statements prepared by the public entity.
Auditor’s ReportWe have reviewed the public entity’s implementation plan for audit issues raised in the prior year and we are satisfied that the matters have been adequately resolved.
The Audit Committee concurs and accepts the conclusions of the external auditor on the annual financial statements and is of the opinion that the audited annual financial statements be accepted and read together with the report of the auditor.
_________________Ian BartesChairperson of the Audit CommitteeWesgro31 July 2019
78part c
13. standing committee resolutionsThe Agency appeared before the Standing Committee on Public Accounts (SCOPA), to present the Annual Report 2017/18. No resolutions emanated from the session.
14. B-BBEE compliance performance informationThe Agency did not complete the B-BBEE verification process for 2018/19, resulting from insufficient knowledge of the legislative requirement; however it is currently in the process of finalising the B-BBEE verification process for 2019/20. The certificate will be submitted by 30 September 2019, as legislatively required.

part d: human resource m
anagement
Vineyards, Tulbagh, Western Cape
human resource management
part d
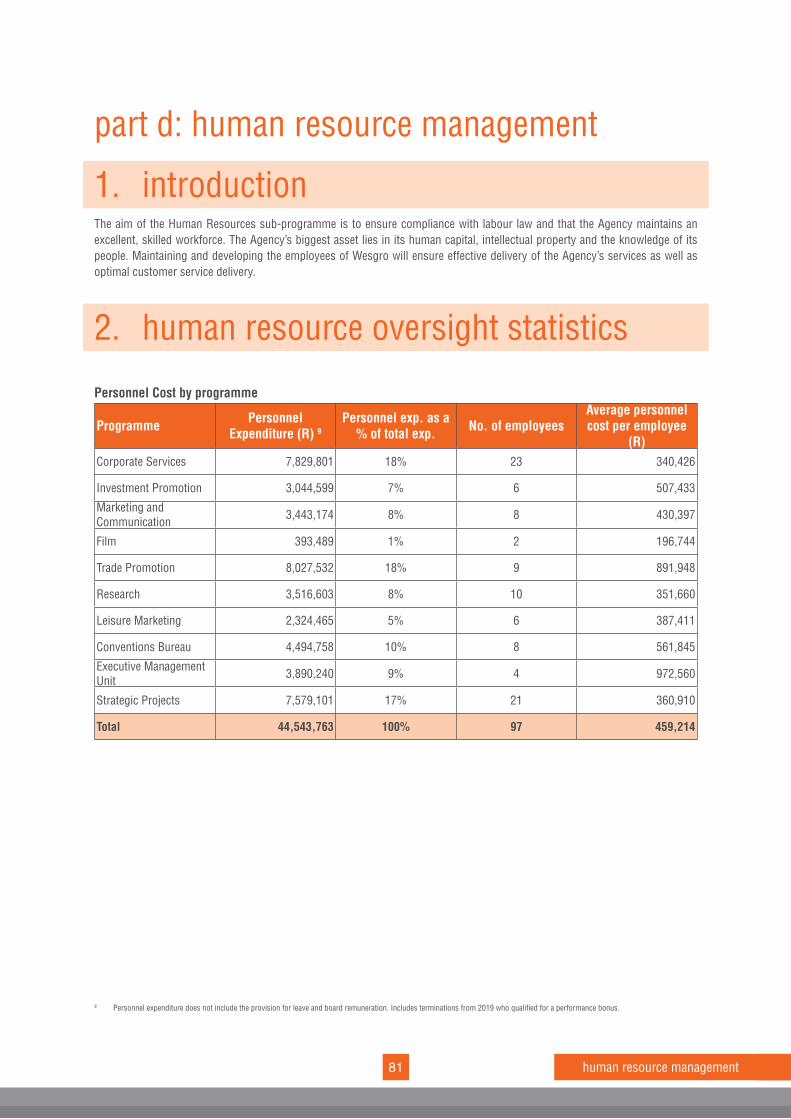
81 human resource management
part d: human resource management
1. introduction The aim of the Human Resources sub-programme is to ensure compliance with labour law and that the Agency maintains an excellent, skilled workforce. The Agency’s biggest asset lies in its human capital, intellectual property and the knowledge of its people. Maintaining and developing the employees of Wesgro will ensure effective delivery of the Agency’s services as well as optimal customer service delivery.
2. human resource oversight statistics
Personnel Cost by programme
Programme Personnel Expenditure (R) 9
Personnel exp. as a % of total exp. No. of employees
Average personnel cost per employee
(R)Corporate Services 7,829,801 18% 23 340,426
Investment Promotion 3,044,599 7% 6 507,433
Marketing and Communication 3,443,174 8% 8 430,397
Film 393,489 1% 2 196,744
Trade Promotion 8,027,532 18% 9 891,948
Research 3,516,603 8% 10 351,660
Leisure Marketing 2,324,465 5% 6 387,411
Conventions Bureau 4,494,758 10% 8 561,845
Executive Management Unit 3,890,240 9% 4 972,560
Strategic Projects 7,579,101 17% 21 360,910
Total 44,543,763 100% 97 459,214
9 Personnel expenditure does not include the provision for leave and board remuneration. Includes terminations from 2019 who qualified for a performance bonus.
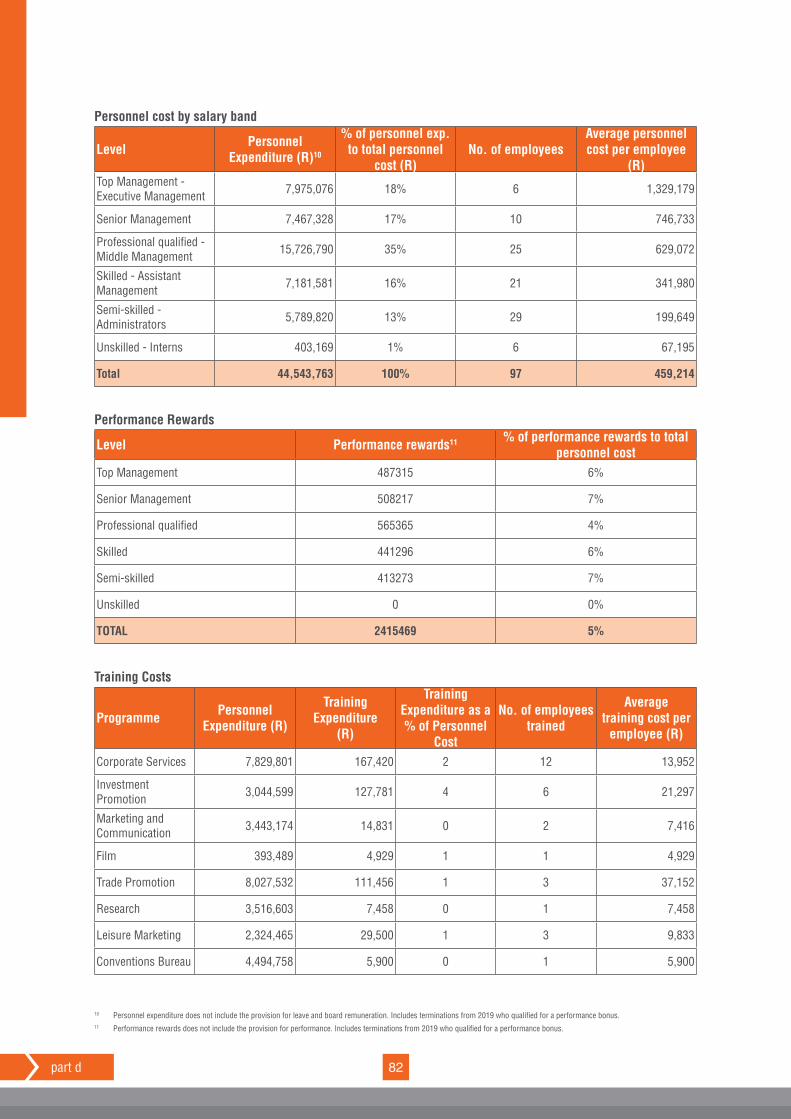
82part d
Personnel cost by salary band
Level Personnel Expenditure (R)10
% of personnel exp. to total personnel
cost (R)No. of employees
Average personnel cost per employee
(R)Top Management - Executive Management 7,975,076 18% 6 1,329,179
Senior Management 7,467,328 17% 10 746,733
Professional qualified - Middle Management 15,726,790 35% 25 629,072
Skilled - Assistant Management 7,181,581 16% 21 341,980
Semi-skilled - Administrators 5,789,820 13% 29 199,649
Unskilled - Interns 403,169 1% 6 67,195
Total 44,543,763 100% 97 459,214
Performance Rewards
Level Performance rewards11 % of performance rewards to total personnel cost
Top Management 487315 6%
Senior Management 508217 7%
Professional qualified 565365 4%
Skilled 441296 6%
Semi-skilled 413273 7%
Unskilled 0 0%
TOTAL 2415469 5%
Training Costs
Programme Personnel Expenditure (R)
Training Expenditure
(R)
Training Expenditure as a % of Personnel
Cost
No. of employees trained
Average training cost per
employee (R)
Corporate Services 7,829,801 167,420 2 12 13,952
Investment Promotion 3,044,599 127,781 4 6 21,297
Marketing and Communication 3,443,174 14,831 0 2 7,416
Film 393,489 4,929 1 1 4,929
Trade Promotion 8,027,532 111,456 1 3 37,152
Research 3,516,603 7,458 0 1 7,458
Leisure Marketing 2,324,465 29,500 1 3 9,833
Conventions Bureau 4,494,758 5,900 0 1 5,900
10 Personnel expenditure does not include the provision for leave and board remuneration. Includes terminations from 2019 who qualified for a performance bonus. 11 Performance rewards does not include the provision for performance. Includes terminations from 2019 who qualified for a performance bonus.
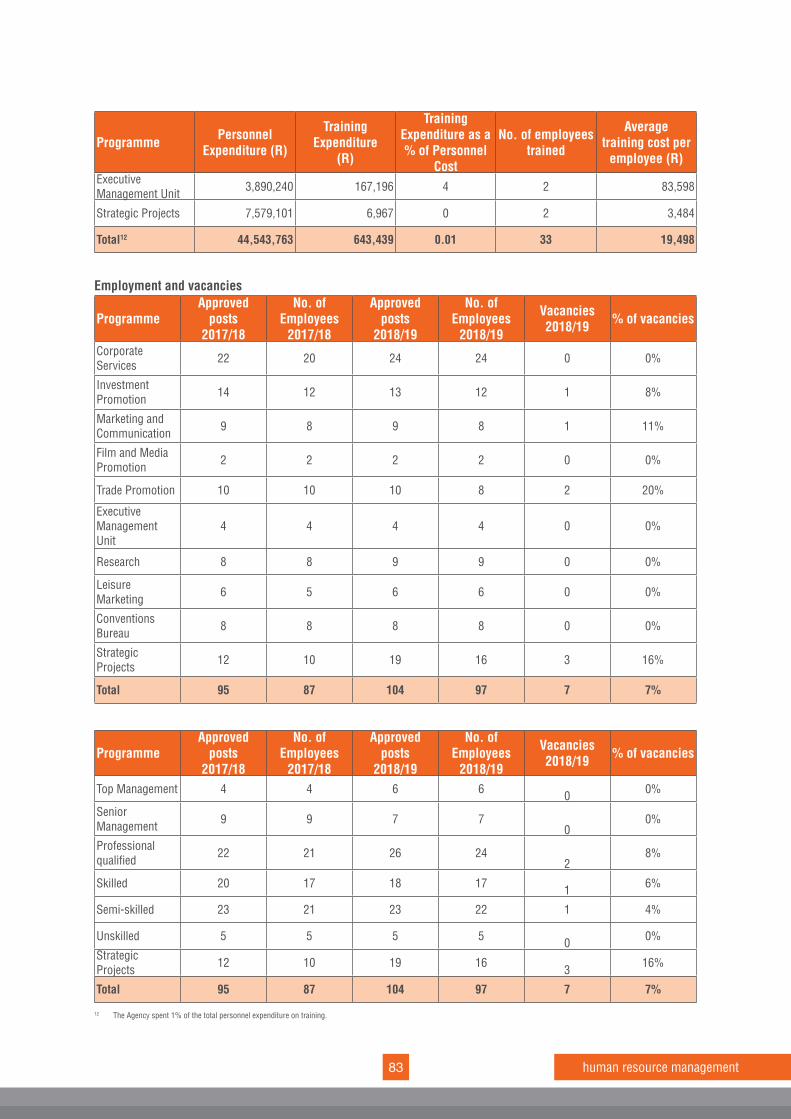
83 human resource management
Programme Personnel Expenditure (R)
Training Expenditure
(R)
Training Expenditure as a % of Personnel
Cost
No. of employees trained
Average training cost per
employee (R) Executive Management Unit 3,890,240 167,196 4 2 83,598
Strategic Projects 7,579,101 6,967 0 2 3,484
Total12 44,543,763 643,439 0.01 33 19,498
Employment and vacancies
ProgrammeApproved
posts2017/18
No. of Employees
2017/18
Approved posts
2018/19
No. of Employees
2018/19
Vacancies 2018/19 % of vacancies
Corporate Services 22 20 24 24 0 0%
Investment Promotion 14 12 13 12 1 8%
Marketing and Communication 9 8 9 8 1 11%
Film and Media Promotion 2 2 2 2 0 0%
Trade Promotion 10 10 10 8 2 20%
Executive Management Unit
4 4 4 4 0 0%
Research 8 8 9 9 0 0%
Leisure Marketing 6 5 6 6 0 0%
Conventions Bureau 8 8 8 8 0 0%
Strategic Projects 12 10 19 16 3 16%
Total 95 87 104 97 7 7%
ProgrammeApproved
posts2017/18
No. of Employees
2017/18
Approved posts
2018/19
No. of Employees
2018/19
Vacancies 2018/19 % of vacancies
Top Management 4 4 6 6 0 0%
Senior Management 9 9 7 7
00%
Professional qualified 22 21 26 24
28%
Skilled 20 17 18 17 1 6%
Semi-skilled 23 21 23 22 1 4%
Unskilled 5 5 5 5 0 0%
Strategic Projects 12 10 19 16 3 16%
Total 95 87 104 97 7 7%
12 The Agency spent 1% of the total personnel expenditure on training.
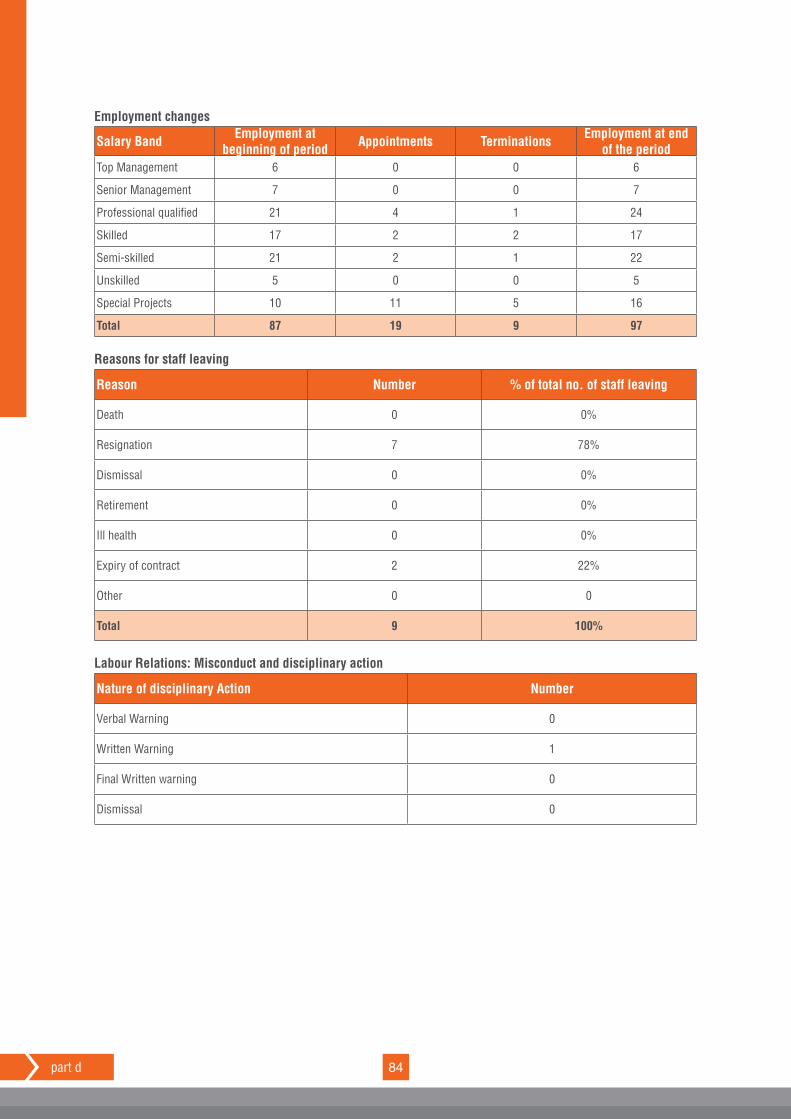
84part d
Employment changes
Salary Band Employment at beginning of period Appointments Terminations Employment at end
of the periodTop Management 6 0 0 6
Senior Management 7 0 0 7
Professional qualified 21 4 1 24
Skilled 17 2 2 17
Semi-skilled 21 2 1 22
Unskilled 5 0 0 5
Special Projects 10 11 5 16
Total 87 19 9 97
Reasons for staff leaving
Reason Number % of total no. of staff leaving
Death 0 0%
Resignation 7 78%
Dismissal 0 0%
Retirement 0 0%
Ill health 0 0%
Expiry of contract 2 22%
Other 0 0
Total 9 100%
Labour Relations: Misconduct and disciplinary action
Nature of disciplinary Action Number
Verbal Warning 0
Written Warning 1
Final Written warning 0
Dismissal 0
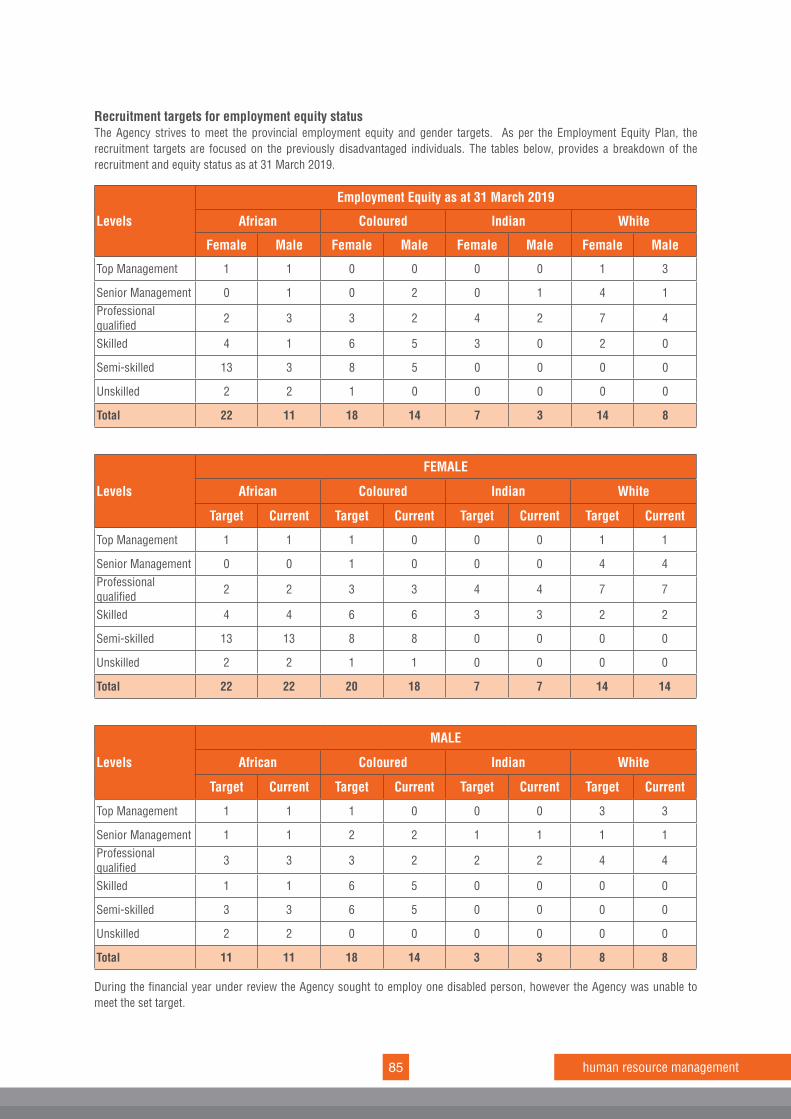
85 human resource management
Recruitment targets for employment equity status The Agency strives to meet the provincial employment equity and gender targets. As per the Employment Equity Plan, the recruitment targets are focused on the previously disadvantaged individuals. The tables below, provides a breakdown of the recruitment and equity status as at 31 March 2019.
Levels
Employment Equity as at 31 March 2019
African Coloured Indian White
Female Male Female Male Female Male Female Male
Top Management 1 1 0 0 0 0 1 3
Senior Management 0 1 0 2 0 1 4 1Professional qualified 2 3 3 2 4 2 7 4
Skilled 4 1 6 5 3 0 2 0
Semi-skilled 13 3 8 5 0 0 0 0
Unskilled 2 2 1 0 0 0 0 0
Total 22 11 18 14 7 3 14 8
Levels
FEMALE
African Coloured Indian White
Target Current Target Current Target Current Target Current
Top Management 1 1 1 0 0 0 1 1
Senior Management 0 0 1 0 0 0 4 4Professional qualified 2 2 3 3 4 4 7 7
Skilled 4 4 6 6 3 3 2 2
Semi-skilled 13 13 8 8 0 0 0 0
Unskilled 2 2 1 1 0 0 0 0
Total 22 22 20 18 7 7 14 14
Levels
MALE
African Coloured Indian White
Target Current Target Current Target Current Target Current
Top Management 1 1 1 0 0 0 3 3
Senior Management 1 1 2 2 1 1 1 1Professional qualified 3 3 3 2 2 2 4 4
Skilled 1 1 6 5 0 0 0 0
Semi-skilled 3 3 6 5 0 0 0 0
Unskilled 2 2 0 0 0 0 0 0
Total 11 11 18 14 3 3 8 8
During the financial year under review the Agency sought to employ one disabled person, however the Agency was unable to meet the set target.
Fishing boats in Doringbaai, West Coast in the Western Cape
part e: financials
financial information
part e
89 financials
general informationfinancial statementsfor the year ended 31 March 2019
Country of incorporation and domicile South Africa
Legal form of entity Listed Schedule 3C Public Entity
Nature of business and principal activities The official tourism, trade and investment promotion agency for the Western Cape.
Non executive directors Prof. Brian Figaji Ian Bartes Paul Bannister David Green Michael Spicer Andrea Bohmert Ashraf Ameen (Resigned 28/02/2019) Ald Marius Koen Ald Helena van Schlicht John van Rooyen Palesa Morudu
Registered office 18th Floor South African Reserve Bank Building 60 St George’s Mall Cape Town, 8001
Business address 18th Floor South African Reserve Bank Building 60 St George’s Mall Cape Town,8001
Postal address P O Box 1678 Cape Town, 8000
Bankers ABSA Bank
Auditors Auditor ‑ General of South Africa Registered Auditors
Board secretary Kendra Stoffberg
Telephone +27 21 487 8600
Email [email protected]
Website www.wesgro.co.za
90part e
indexThe reports and statements set out below comprise the financial statements presented to the provincial legislature:
Index Page
Board’s Responsibilities and Approval 91
Report of the Auditor General 92 – 96
Statement of Financial Position 98
Statement of Financial Performance 99
Statement of Changes in Net Assets 100
Cash Flow Statement 101
Statement of Comparison of Budget and Actual Amounts 102
Accounting Policies 103 – 111
Notes to the Financial Statements 112 – 131
The following supplementary information does not form part of the financial statements and is unaudited:
Annexure A – Deferred Income 132 – 133
91 financials
Board’s Responsibilities and Approvalfor the year ended 31 March 2019
The directors are responsible for the preparation, integrity and fair presentation of the Agency’s annual financial statements and supplementary information included in the annual report.
The financial statements have been prepared in accordance with South African Standards of Generally Recognised Accounting Practices (GRAP) including any interpretations of such Statements issued by the Accounting Standards Board.
In addition, the financial statements have been prepared using appropriate accounting policies, supported by reasonable and prudent judgments and estimates, that conform in all material aspects, taking into account the nature of the business and in the manner required by the Public Finance Management Act No 1 of 1999 (PFMA) as amended. The directors are of the opinion that the annual financial statements fairly present the financial position of the Agency.
The Office of the Auditor‑General is responsible for reporting on these financial statements and has been given unrestricted access to all financial records and transactions and related data which includes minutes of all meetings of the Board of Directors and its committees.
The directors believe that all representations made to the Auditor‑General of South Africa during their audit are valid and appro‑priate. The directors further accept responsibility for the maintenance of accounting records, which may be relied upon in the preparation of the financial statements, as well as adequate systems of internal financial control. Internal financial and operational controls are described in the corporate governance report.
Going Concern
The board has reviewed the entity’s cash flow forecast for the year to 31 March 2020 and, in the light of this review and the current financial position, it is satisfied that the entity has, or has access to, adequate resources to continue in operational existence for the forseeable future.
Subsequent Event
The directors are not aware of any matter or circumstances arising since the end of the reporting period other than raised in note 33.
The financial statements as set out on pages 98 to 131 for the year ended 31 March 2019, were approved by the Board of Directors in terms of section 51 (1) (f) of the PFMA and signed on its behalf by:
Prof. Brian Figaji Tim HarrisChairperson Chief Executive OfficerBoard of Directors Wesgro
92part e
Report of the auditor‑general to the Western Cape Provincial Parliament on the Western Cape Tourism, Trade and Investment Promotion Agency
Report on the audit of the financial statementsOpinion1. I have audited the financial statements of the Western Cape Tourism, Trade and Investment Promotion Agency set out
on pages 98 to 131, which comprise the statement of financial position as at 31 March 2019, the statement of financial performance, the statement of changes in net assets, the cash flow statement and the statement of comparison of budget information with actual information for the year then ended, as well as the notes to the financial statements, including a summary of significant accounting policies.
2. In my opinion, the financial statements present fairly, in all material respects, the financial position of the Western Cape Tourism, Trade and Investment Promotion Agency as at 31 March 2019, and its financial performance and cash flows for the year then ended in accordance with the South African Standards of Generally Recognised Accounting Practice (SA Standards of GRAP) and the requirements of the Public Finance Management Act of South Africa, 1999 (Act no. 1 of 1999) (PFMA).
Basis for opinion3. I conducted my audit in accordance with the International Standards on Auditing (ISAs). My responsibilities under those
standards are further described in the auditor‑general’s responsibilities for the audit of the financial statements section of this auditor’s report.
4. I am independent of the entity in accordance with sections 290 and 291 of the International Ethics Standards Board for Accountants’ Code of ethics for professional accountants, parts 1 and 3 of the International Ethics Standards Board of Accountants’ International code of ethics for professional accounts (including International Independence Standards) (IESBA codes) and the ethical requirements that are relevant to my audit in South Africa. I have fulfilled my other ethical responsibilities in accordance with these requirements and the IESBA codes.
5. I believe that the audit evidence I have obtained is sufficient and appropriate to provide a basis for my opinion.
Emphasis of matters6. I draw attention to the matters below. My opinion is not modified in respect of these matters.
Investments (put option)7. As disclosed in note 8 to the financial statements, a fair value gain of R1,647 million (2018: R2,535 million) was realised
during the year on the entity’s investment through its shares held in the Cape Town Film Studies (Pty) Ltd, bringing the value of the investment to R24,786 million (2018: R23,139 million) as at 31 March 2019.
Deferred income 8. As disclosed in note 12 to the financial statements, the deferred income as at 31 March 2019 was R41,767 million (2018:
R37,986 million), representing the balance of the funding of the various sponsored projects as administered by the entity.
Other matter 9. I draw attention to the matter below. My opinion is not modified in respect of this matter.
Unaudited supplementary schedules10. The supplementary information as indicated in Annexure A to the financial statements, does not form part of the financial
statements and is presented as additional information. The annexure was not audited and therefore no opinion was expressed on it.
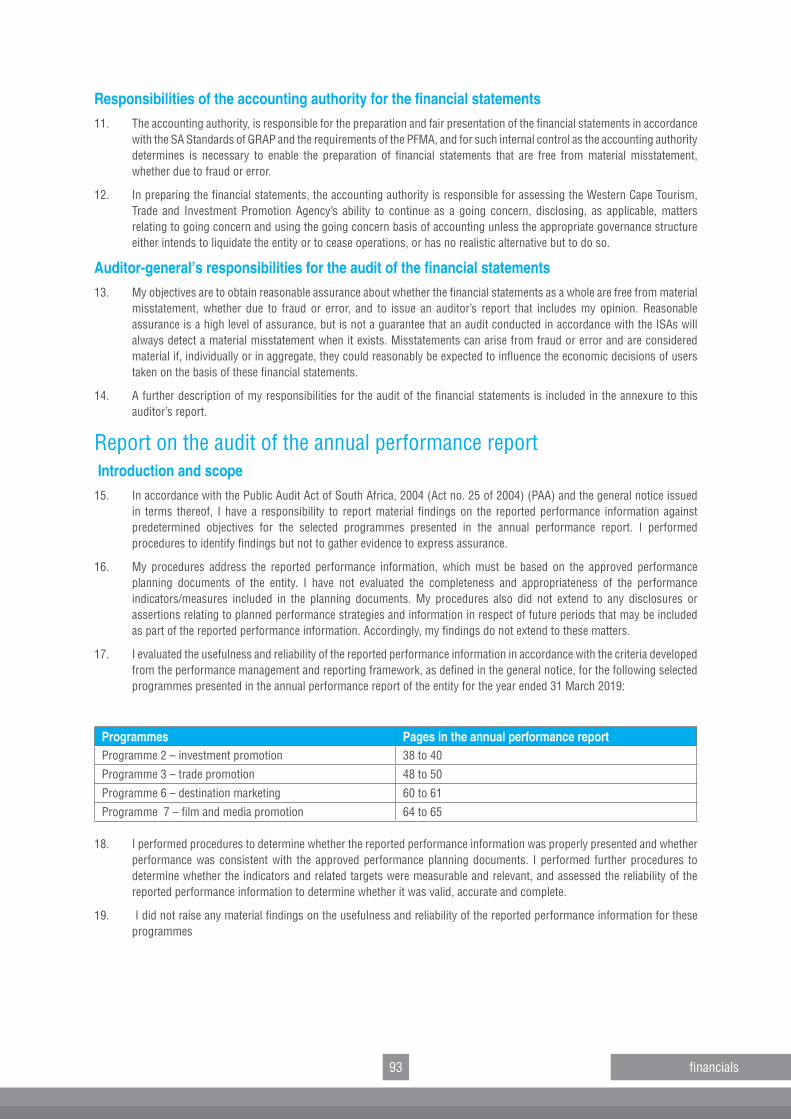
93 financials
Responsibilities of the accounting authority for the financial statements11. The accounting authority, is responsible for the preparation and fair presentation of the financial statements in accordance
with the SA Standards of GRAP and the requirements of the PFMA, and for such internal control as the accounting authority determines is necessary to enable the preparation of financial statements that are free from material misstatement, whether due to fraud or error.
12. In preparing the financial statements, the accounting authority is responsible for assessing the Western Cape Tourism, Trade and Investment Promotion Agency’s ability to continue as a going concern, disclosing, as applicable, matters relating to going concern and using the going concern basis of accounting unless the appropriate governance structure either intends to liquidate the entity or to cease operations, or has no realistic alternative but to do so.
Auditor-general’s responsibilities for the audit of the financial statements13. My objectives are to obtain reasonable assurance about whether the financial statements as a whole are free from material
misstatement, whether due to fraud or error, and to issue an auditor’s report that includes my opinion. Reasonable assurance is a high level of assurance, but is not a guarantee that an audit conducted in accordance with the ISAs will always detect a material misstatement when it exists. Misstatements can arise from fraud or error and are considered material if, individually or in aggregate, they could reasonably be expected to influence the economic decisions of users taken on the basis of these financial statements.
14. A further description of my responsibilities for the audit of the financial statements is included in the annexure to this auditor’s report.
Report on the audit of the annual performance report Introduction and scope15. In accordance with the Public Audit Act of South Africa, 2004 (Act no. 25 of 2004) (PAA) and the general notice issued
in terms thereof, I have a responsibility to report material findings on the reported performance information against predetermined objectives for the selected programmes presented in the annual performance report. I performed procedures to identify findings but not to gather evidence to express assurance.
16. My procedures address the reported performance information, which must be based on the approved performance planning documents of the entity. I have not evaluated the completeness and appropriateness of the performance indicators/measures included in the planning documents. My procedures also did not extend to any disclosures or assertions relating to planned performance strategies and information in respect of future periods that may be included as part of the reported performance information. Accordingly, my findings do not extend to these matters.
17. I evaluated the usefulness and reliability of the reported performance information in accordance with the criteria developed from the performance management and reporting framework, as defined in the general notice, for the following selected programmes presented in the annual performance report of the entity for the year ended 31 March 2019:
Programmes Pages in the annual performance reportProgramme 2 – investment promotion 38 to 40
Programme 3 – trade promotion 48 to 50
Programme 6 – destination marketing 60 to 61
Programme 7 – film and media promotion 64 to 65
18. I performed procedures to determine whether the reported performance information was properly presented and whether performance was consistent with the approved performance planning documents. I performed further procedures to determine whether the indicators and related targets were measurable and relevant, and assessed the reliability of the reported performance information to determine whether it was valid, accurate and complete.
19. I did not raise any material findings on the usefulness and reliability of the reported performance information for these programmes
94part e
• Programme 2 ‑ investment promotion
• Programme 3 ‑ trade promotion
• Programme 6 ‑ destination marketing
• Programme 7 ‑ film and media promotion
Other matters20. I draw attention to the matters below.
Achievement of planned targets21. Refer to the annual performance report on pages 38 to 40, 48 to 50, 60 to 61 and 64 to 65 for information on the
achievement of planned targets for the year and explanations provided for the under/over achievement of a significant number of targets.
Adjustment of material misstatements22. I identified material misstatements in the annual performance report submitted for auditing. These material misstatements
were on the reported performance information of programme 3: trade promotion and programme 6: destination marketing. As management subsequently corrected the misstatements, I did not raise any material findings on the usefulness and reliability of the reported performance information.
Report on the audit of compliance with legislationIntroduction and scope23. In accordance with the PAA and the general notice issued in terms thereof, I have a responsibility to report material
findings on the compliance of the entity with specific matters in key legislation. I performed procedures to identify findings but not to gather evidence to express assurance.
24. I did not raise material findings on compliance with the specific matters in key legislation set out in the general notice issued in terms of the PAA.
Other information25. The accounting authority is responsible for the other information. The other information comprises the information
included in the annual report. The other information does not include the financial statements, the auditor’s report and those selected programmes presented in the annual performance report that have been specifically reported in this auditor’s report.
26. My opinion on the financial statements and findings on the reported performance information and compliance with legislation do not cover the other information and I do not express an audit opinion or any form of assurance conclusion thereon.
27. In connection with my audit, my responsibility is to read the other information and, in doing so, consider whether the other information is materially inconsistent with the financial statements and the selected programmes presented in the annual performance report, or my knowledge obtained in the audit, or otherwise appears to be materially misstated.
28. If, based on the work I have performed, I conclude that there is a material misstatement in this other information, I am required to report that fact.
29. I have nothing to report in this regard.
95 financials
Internal control deficiencies30. I considered internal control relevant to my audit of the financial statements, reported performance information and
compliance with applicable legislation; however, my objective was not to express any form of assurance on it. I did not identify any significant deficiencies in internal control.
Cape Town
31 July 2019
96part e
Annexure – Auditor‑general’s responsibility for the audit1. As part of an audit in accordance with the ISAs, I exercise professional judgement and maintain professional scepticism
throughout my audit of the financial statements, and the procedures performed on reported performance information for selected programmes and on the entity’s compliance with respect to the selected subject matters.
Financial statements2. In addition to my responsibility for the audit of the financial statements as described in this auditor’s report, I also:
• identify and assess the risks of material misstatement of the financial statements whether due to fraud or error, design and perform audit procedures responsive to those risks, and obtain audit evidence that is sufficient and appropriate to provide a basis for my opinion. The risk of not detecting a material misstatement resulting from fraud is higher than for one resulting from error, as fraud may involve collusion, forgery, intentional omissions, misrepresentations, or the override of internal control
• obtain an understanding of internal control relevant to the audit in order to design audit procedures that are appropriate in the circumstances, but not for the purpose of expressing an opinion on the effectiveness of the entity’s internal control
• evaluate the appropriateness of accounting policies used and the reasonableness of accounting estimates and related disclosures made by the accounting authority
• conclude on the appropriateness of the accounting authority’s use of the going concern basis of accounting in the preparation of the financial statements. I also conclude, based on the audit evidence obtained, whether a material uncertainty exists related to events or conditions that may cast significant doubt on the Western Cape Tourism, Trade and Investment Promotion Agency’s ability to continue as a going concern. If I conclude that a material uncertainty exists, I am required to draw attention in my auditor’s report to the related disclosures in the financial statements about the material uncertainty or, if such disclosures are inadequate, to modify the opinion on the financial statements. My conclusions are based on the information available to me at the date of this auditor’s report. However, future events or conditions may cause an entity to cease continuing as a going concern
• evaluate the overall presentation, structure and content of the financial statements, including the disclosures, and whether the financial statements represent the underlying transactions and events in a manner that achieves fair presentation.
Communication with those charged with governance3. I communicate with the accounting authority regarding, among other matters, the planned scope and timing of the audit
and significant audit findings, including any significant deficiencies in internal control that I identify during my audit.
4. I also confirm to the accounting authority that I have complied with relevant ethical requirements regarding independence, and communicate all relationships and other matters that may reasonably be thought to have a bearing on my independence and, where applicable, related safeguards.

97 financials
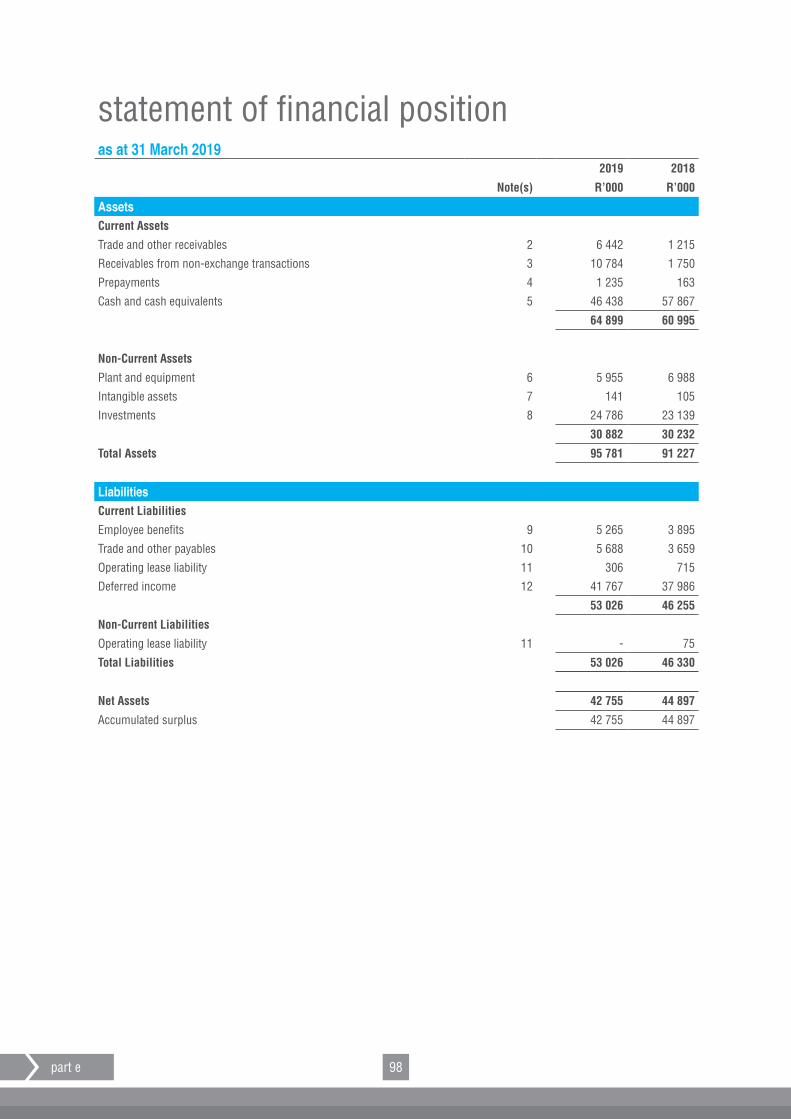
98part e
statement of financial position as at 31 March 2019
2019 2018
Note(s) R’000 R’000
AssetsCurrent Assets
Trade and other receivables 2 6 442 1 215
Receivables from non‑exchange transactions 3 10 784 1 750
Prepayments 4 1 235 163
Cash and cash equivalents 5 46 438 57 867
64 899 60 995
Non‑Current Assets
Plant and equipment 6 5 955 6 988
Intangible assets 7 141 105
Investments 8 24 786 23 139
30 882 30 232
Total Assets 95 781 91 227
LiabilitiesCurrent Liabilities
Employee benefits 9 5 265 3 895
Trade and other payables 10 5 688 3 659
Operating lease liability 11 306 715
Deferred income 12 41 767 37 986
53 026 46 255
Non‑Current Liabilities
Operating lease liability 11 ‑ 75
Total Liabilities 53 026 46 330
Net Assets 42 755 44 897
Accumulated surplus 42 755 44 897
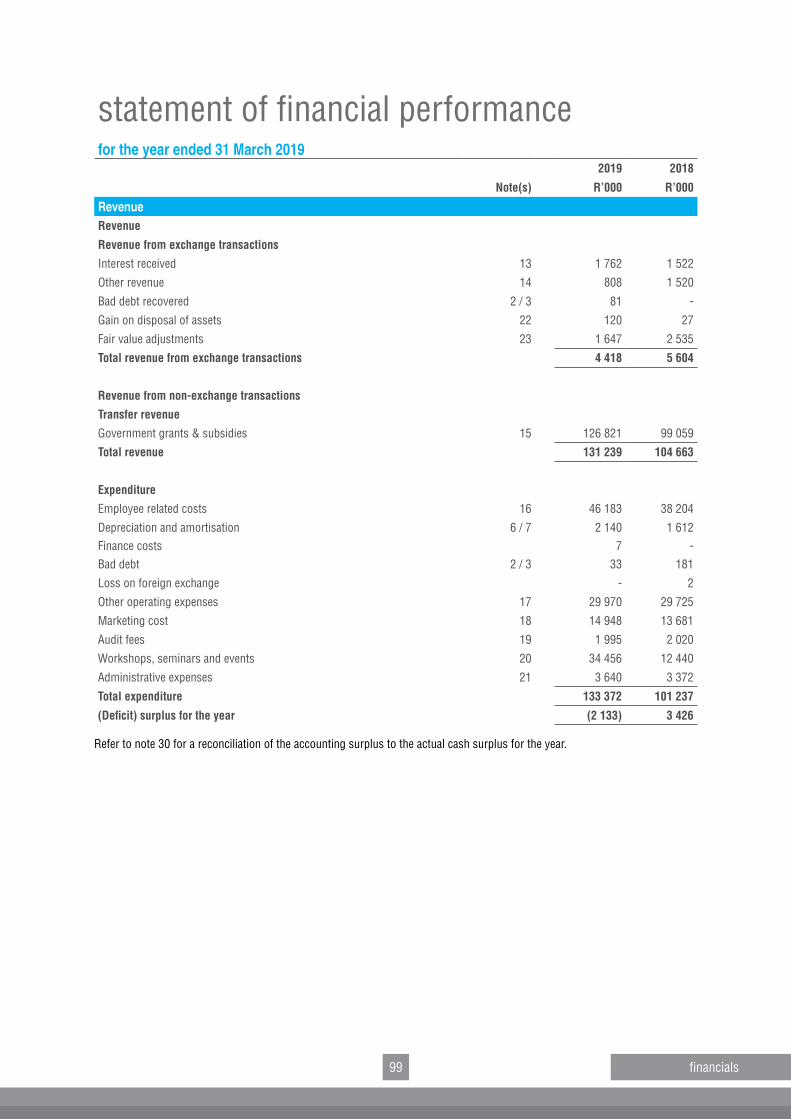
99 financials
statement of financial performancefor the year ended 31 March 2019
2019 2018
Note(s) R’000 R’000
RevenueRevenue
Revenue from exchange transactions
Interest received 13 1 762 1 522
Other revenue 14 808 1 520
Bad debt recovered 2 / 3 81 ‑
Gain on disposal of assets 22 120 27
Fair value adjustments 23 1 647 2 535
Total revenue from exchange transactions 4 418 5 604
Revenue from non‑exchange transactions
Transfer revenue
Government grants & subsidies 15 126 821 99 059
Total revenue 131 239 104 663
Expenditure
Employee related costs 16 46 183 38 204
Depreciation and amortisation 6 / 7 2 140 1 612Finance costs 7 ‑Bad debt 2 / 3 33 181
Loss on foreign exchange ‑ 2
Other operating expenses 17 29 970 29 725
Marketing cost 18 14 948 13 681
Audit fees 19 1 995 2 020
Workshops, seminars and events 20 34 456 12 440
Administrative expenses 21 3 640 3 372
Total expenditure 133 372 101 237
(Deficit) surplus for the year (2 133) 3 426
Refer to note 30 for a reconciliation of the accounting surplus to the actual cash surplus for the year.
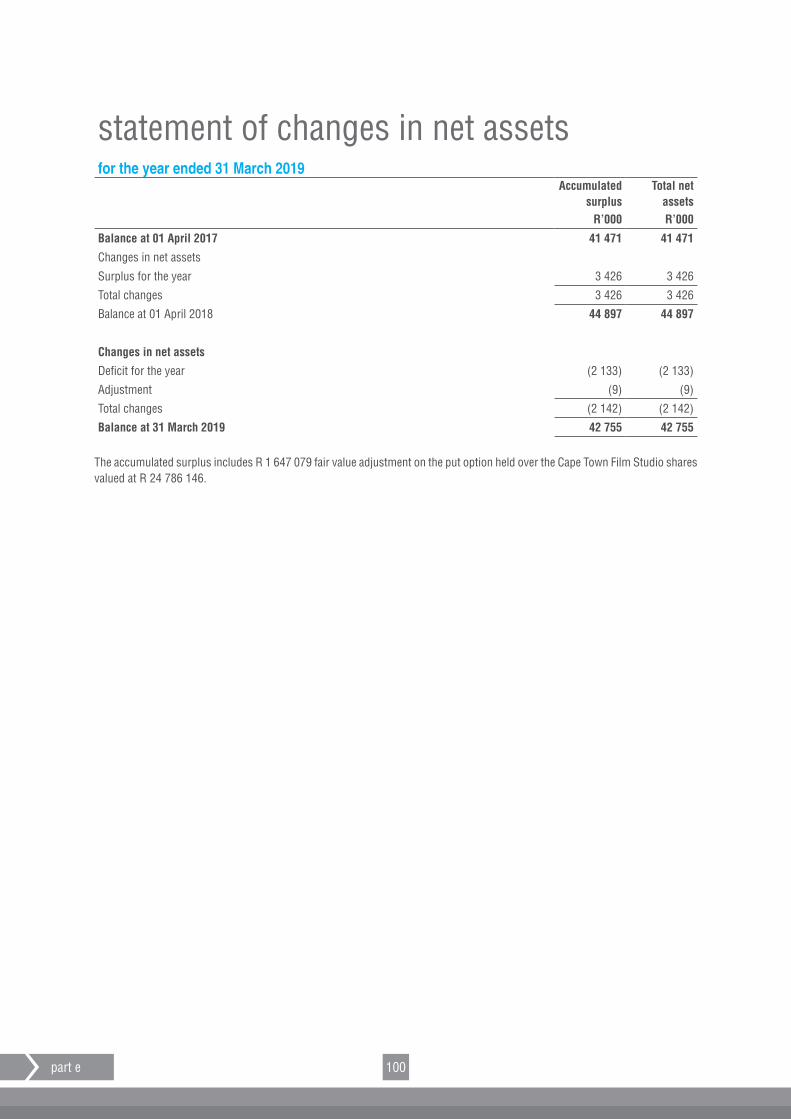
100part e
statement of changes in net assetsfor the year ended 31 March 2019
Accumulated surplus
Total net assets
R’000 R’000
Balance at 01 April 2017 41 471 41 471
Changes in net assets
Surplus for the year 3 426 3 426
Total changes 3 426 3 426
Balance at 01 April 2018 44 897 44 897
Changes in net assets
Deficit for the year (2 133) (2 133)
Adjustment (9) (9)
Total changes (2 142) (2 142)
Balance at 31 March 2019 42 755 42 755
The accumulated surplus includes R 1 647 079 fair value adjustment on the put option held over the Cape Town Film Studio shares valued at R 24 786 146.
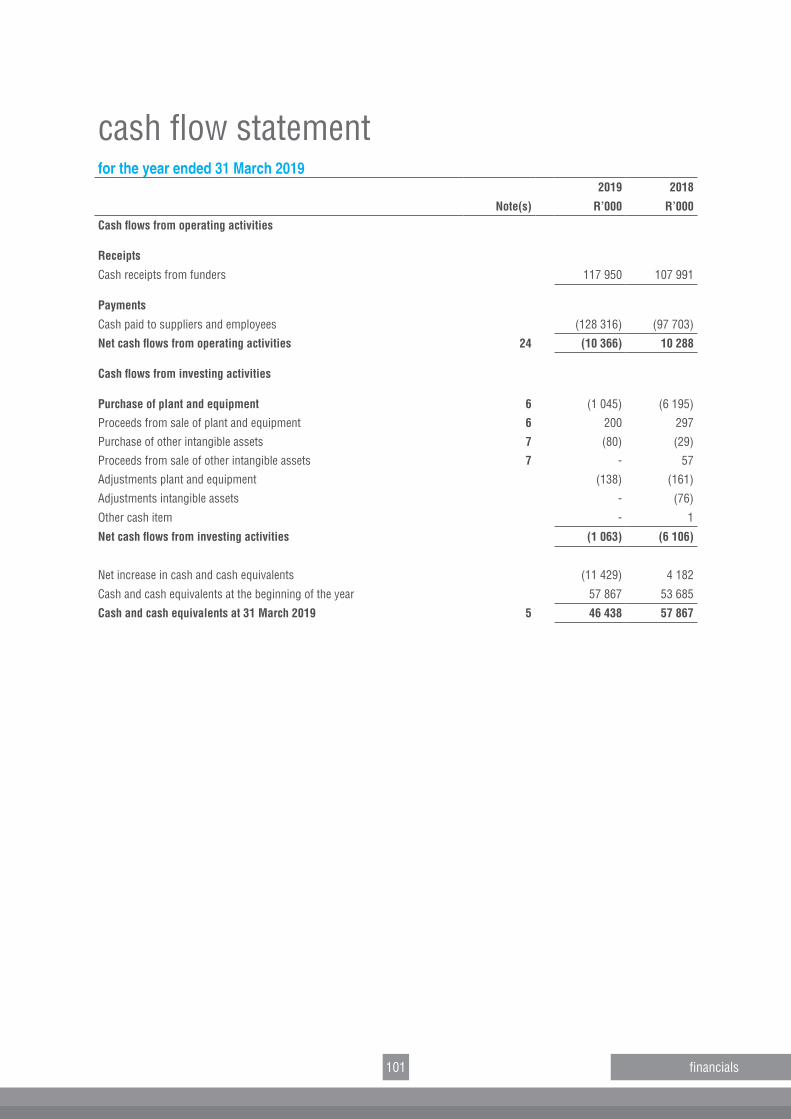
101 financials
cash flow statementfor the year ended 31 March 2019
2019 2018
Note(s) R’000 R’000
Cash flows from operating activities
Receipts
Cash receipts from funders 117 950 107 991
Payments
Cash paid to suppliers and employees (128 316) (97 703)
Net cash flows from operating activities 24 (10 366) 10 288
Cash flows from investing activities
Purchase of plant and equipment 6 (1 045) (6 195)
Proceeds from sale of plant and equipment 6 200 297
Purchase of other intangible assets 7 (80) (29)
Proceeds from sale of other intangible assets 7 ‑ 57
Adjustments plant and equipment (138) (161)
Adjustments intangible assets ‑ (76)
Other cash item ‑ 1
Net cash flows from investing activities (1 063) (6 106)
Net increase in cash and cash equivalents (11 429) 4 182
Cash and cash equivalents at the beginning of the year 57 867 53 685
Cash and cash equivalents at 31 March 2019 5 46 438 57 867
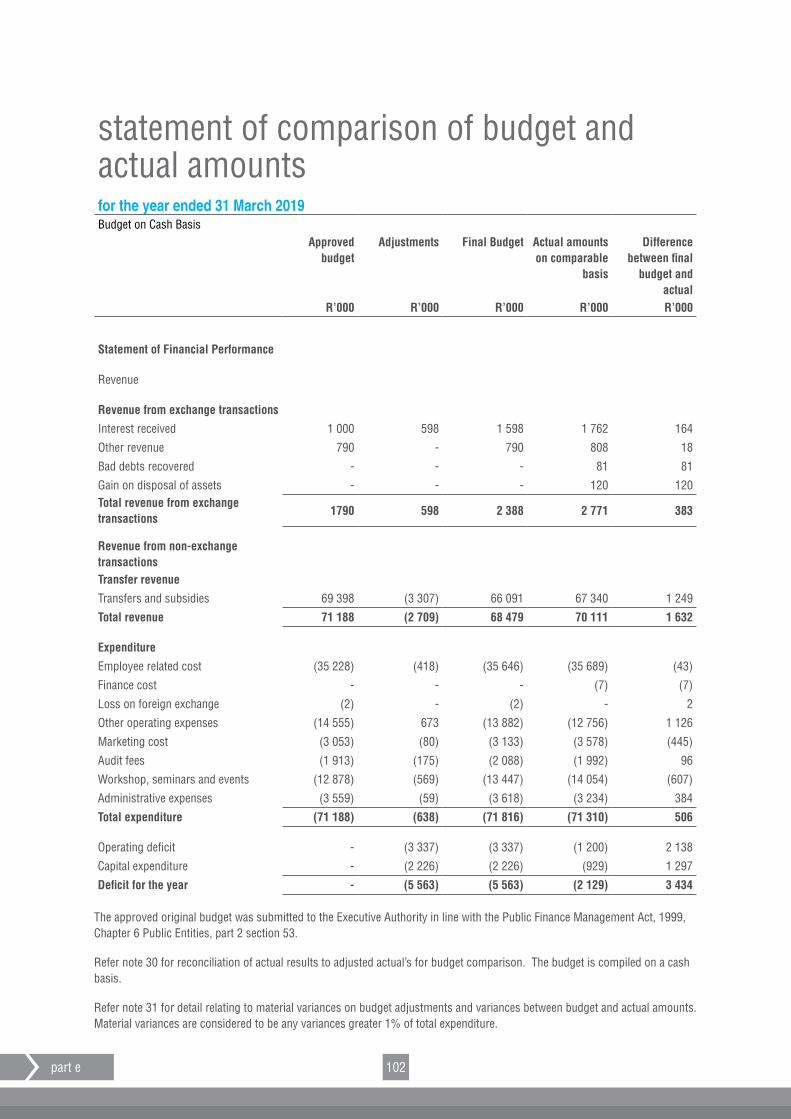
102part e
statement of comparison of budget and actual amountsfor the year ended 31 March 2019Budget on Cash Basis
Approved budget
Adjustments Final Budget Actual amounts on comparable
basis
Difference between final
budget and actual
R’000 R’000 R’000 R’000 R’000
Statement of Financial Performance
Revenue
Revenue from exchange transactions
Interest received 1 000 598 1 598 1 762 164
Other revenue 790 ‑ 790 808 18
Bad debts recovered ‑ ‑ ‑ 81 81
Gain on disposal of assets ‑ ‑ ‑ 120 120Total revenue from exchange transactions
1790 598 2 388 2 771 383
Revenue from non‑exchange transactionsTransfer revenue
Transfers and subsidies 69 398 (3 307) 66 091 67 340 1 249
Total revenue 71 188 (2 709) 68 479 70 111 1 632
Expenditure
Employee related cost (35 228) (418) (35 646) (35 689) (43)
Finance cost ‑ ‑ ‑ (7) (7)
Loss on foreign exchange (2) ‑ (2) ‑ 2
Other operating expenses (14 555) 673 (13 882) (12 756) 1 126
Marketing cost (3 053) (80) (3 133) (3 578) (445)
Audit fees (1 913) (175) (2 088) (1 992) 96
Workshop, seminars and events (12 878) (569) (13 447) (14 054) (607)
Administrative expenses (3 559) (59) (3 618) (3 234) 384
Total expenditure (71 188) (638) (71 816) (71 310) 506
Operating deficit ‑ (3 337) (3 337) (1 200) 2 138
Capital expenditure ‑ (2 226) (2 226) (929) 1 297
Deficit for the year ‑ (5 563) (5 563) (2 129) 3 434
The approved original budget was submitted to the Executive Authority in line with the Public Finance Management Act, 1999, Chapter 6 Public Entities, part 2 section 53.
Refer note 30 for reconciliation of actual results to adjusted actual’s for budget comparison. The budget is compiled on a cash basis.
Refer note 31 for detail relating to material variances on budget adjustments and variances between budget and actual amounts. Material variances are considered to be any variances greater 1% of total expenditure.
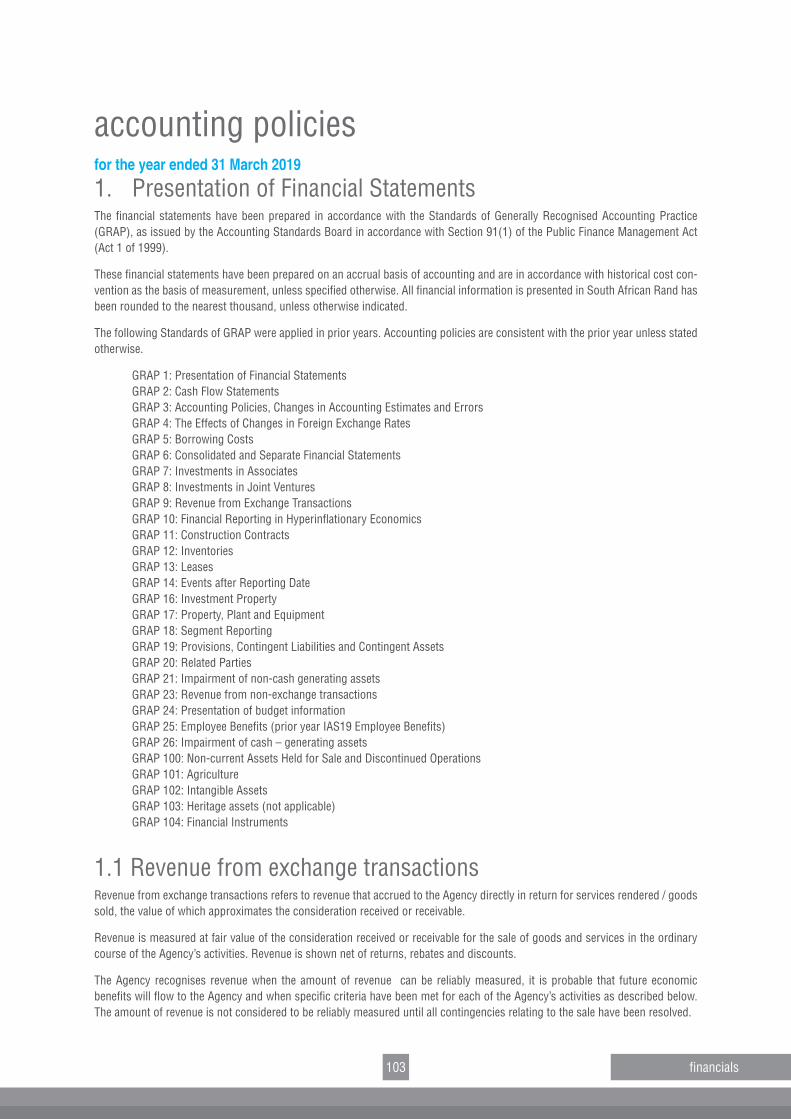
103 financials
accounting policiesfor the year ended 31 March 2019
1. Presentation of Financial StatementsThe financial statements have been prepared in accordance with the Standards of Generally Recognised Accounting Practice (GRAP), as issued by the Accounting Standards Board in accordance with Section 91(1) of the Public Finance Management Act (Act 1 of 1999).
These financial statements have been prepared on an accrual basis of accounting and are in accordance with historical cost con‑vention as the basis of measurement, unless specified otherwise. All financial information is presented in South African Rand has been rounded to the nearest thousand, unless otherwise indicated.
The following Standards of GRAP were applied in prior years. Accounting policies are consistent with the prior year unless stated otherwise.
GRAP 1: Presentation of Financial Statements GRAP 2: Cash Flow Statements GRAP 3: Accounting Policies, Changes in Accounting Estimates and Errors GRAP 4: The Effects of Changes in Foreign Exchange Rates GRAP 5: Borrowing Costs GRAP 6: Consolidated and Separate Financial Statements GRAP 7: Investments in Associates GRAP 8: Investments in Joint Ventures GRAP 9: Revenue from Exchange Transactions GRAP 10: Financial Reporting in Hyperinflationary Economics GRAP 11: Construction Contracts GRAP 12: Inventories GRAP 13: Leases GRAP 14: Events after Reporting Date GRAP 16: Investment Property GRAP 17: Property, Plant and EquipmentGRAP 18: Segment Reporting GRAP 19: Provisions, Contingent Liabilities and Contingent Assets GRAP 20: Related PartiesGRAP 21: Impairment of non‑cash generating assets GRAP 23: Revenue from non‑exchange transactions GRAP 24: Presentation of budget information GRAP 25: Employee Benefits (prior year IAS19 Employee Benefits) GRAP 26: Impairment of cash – generating assets GRAP 100: Non‑current Assets Held for Sale and Discontinued Operations GRAP 101: Agriculture GRAP 102: Intangible Assets GRAP 103: Heritage assets (not applicable) GRAP 104: Financial Instruments
1.1 Revenue from exchange transactions Revenue from exchange transactions refers to revenue that accrued to the Agency directly in return for services rendered / goods sold, the value of which approximates the consideration received or receivable.
Revenue is measured at fair value of the consideration received or receivable for the sale of goods and services in the ordinary course of the Agency’s activities. Revenue is shown net of returns, rebates and discounts.
The Agency recognises revenue when the amount of revenue can be reliably measured, it is probable that future economic benefits will flow to the Agency and when specific criteria have been met for each of the Agency’s activities as described below. The amount of revenue is not considered to be reliably measured until all contingencies relating to the sale have been resolved.
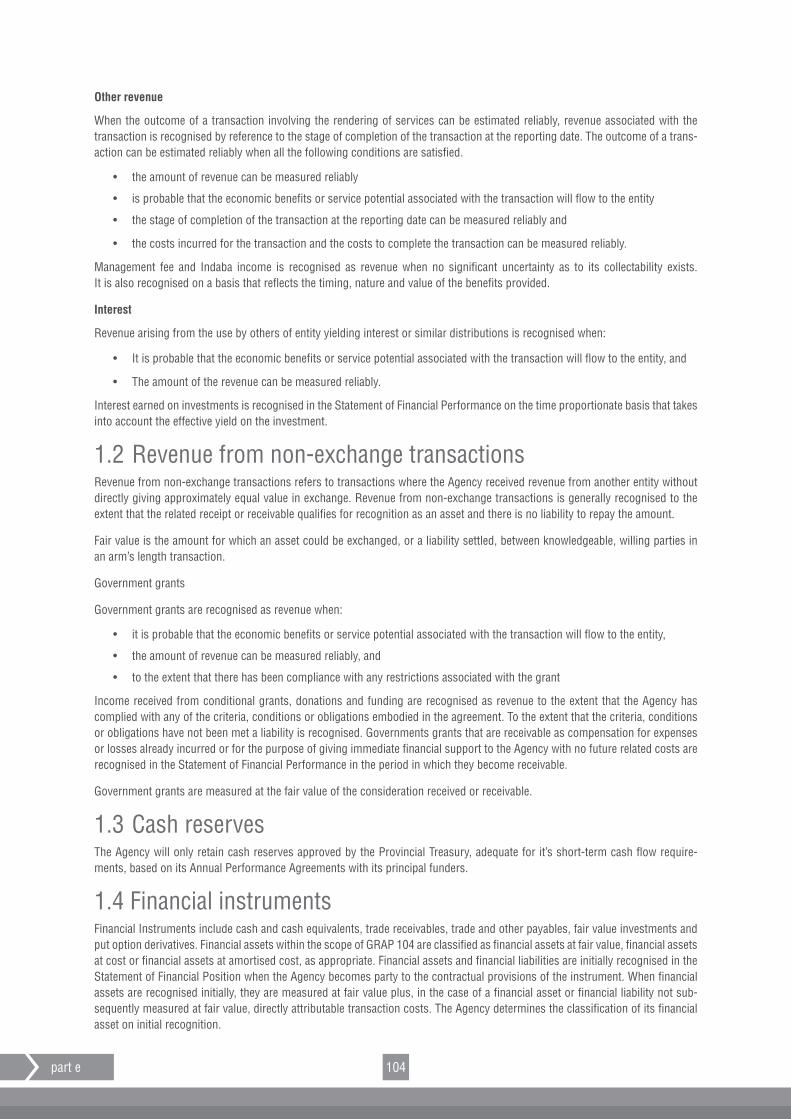
104part e
Other revenue
When the outcome of a transaction involving the rendering of services can be estimated reliably, revenue associated with the transaction is recognised by reference to the stage of completion of the transaction at the reporting date. The outcome of a trans‑action can be estimated reliably when all the following conditions are satisfied.
• the amount of revenue can be measured reliably
• is probable that the economic benefits or service potential associated with the transaction will flow to the entity
• the stage of completion of the transaction at the reporting date can be measured reliably and
• the costs incurred for the transaction and the costs to complete the transaction can be measured reliably.
Management fee and Indaba income is recognised as revenue when no significant uncertainty as to its collectability exists. It is also recognised on a basis that reflects the timing, nature and value of the benefits provided.
Interest
Revenue arising from the use by others of entity yielding interest or similar distributions is recognised when:
• It is probable that the economic benefits or service potential associated with the transaction will flow to the entity, and
• The amount of the revenue can be measured reliably.
Interest earned on investments is recognised in the Statement of Financial Performance on the time proportionate basis that takes into account the effective yield on the investment.
1.2 Revenue from non‑exchange transactionsRevenue from non‑exchange transactions refers to transactions where the Agency received revenue from another entity without directly giving approximately equal value in exchange. Revenue from non‑exchange transactions is generally recognised to the extent that the related receipt or receivable qualifies for recognition as an asset and there is no liability to repay the amount.
Fair value is the amount for which an asset could be exchanged, or a liability settled, between knowledgeable, willing parties in an arm’s length transaction.
Government grants
Government grants are recognised as revenue when:
• it is probable that the economic benefits or service potential associated with the transaction will flow to the entity,
• the amount of revenue can be measured reliably, and
• to the extent that there has been compliance with any restrictions associated with the grant
Income received from conditional grants, donations and funding are recognised as revenue to the extent that the Agency has complied with any of the criteria, conditions or obligations embodied in the agreement. To the extent that the criteria, conditions or obligations have not been met a liability is recognised. Governments grants that are receivable as compensation for expenses or losses already incurred or for the purpose of giving immediate financial support to the Agency with no future related costs are recognised in the Statement of Financial Performance in the period in which they become receivable.
Government grants are measured at the fair value of the consideration received or receivable.
1.3 Cash reservesThe Agency will only retain cash reserves approved by the Provincial Treasury, adequate for it’s short‑term cash flow require‑ments, based on its Annual Performance Agreements with its principal funders.
1.4 Financial instruments Financial Instruments include cash and cash equivalents, trade receivables, trade and other payables, fair value investments and put option derivatives. Financial assets within the scope of GRAP 104 are classified as financial assets at fair value, financial assets at cost or financial assets at amortised cost, as appropriate. Financial assets and financial liabilities are initially recognised in the Statement of Financial Position when the Agency becomes party to the contractual provisions of the instrument. When financial assets are recognised initially, they are measured at fair value plus, in the case of a financial asset or financial liability not sub‑sequently measured at fair value, directly attributable transaction costs. The Agency determines the classification of its financial asset on initial recognition.
105 financials
All regular purchases and sales of financial assets are required on the trade date, which is the date that the Agency commits to purchase the asset. Regular way purchase or sales of financial assets that require delivery of assets within the period generally established by regulation or convention in the marketplace.
Classification
The entity has the following types of financial assets (classes and category) as reflected on the face of the statement of financial position or in the notes thereto:
Class Category
Investments Financial asset measured at fair value through profit and loss
Trade and other receivables Financial asset measured at fair value through profit and loss
Cash and cash equivalents Financial asset measured at amortised costThe entity has the following types of financial liabilities (classes and category) as reflected on the face of the statement of financial position or in the notes thereto:
Class Category
Trade and other payables Financial liability measured at amortised costDerivatives
A derivative is a financial instrument or other contract with all three of the following characteristics:
• Its value changed in response to the change in a specified interest rate, financial instrument price, foreign exchange rate, index of prices or rates, credit rating or credit index, or other variable, provided in the case of a non‑financial variable that the variance is not specific to a party to the contract
• It requires no initial net investment or an initial net investment that is smaller than would be required for other types of contracts that would be expected to have a similar response to changed in market factors; and
• It is settled in a future date
The Agency’s financial assets classified at fair value consists of a put option (derivative) used to hedge against market price risks. Derivatives are carried as financial assets when the fair value is positive and as financial liabilities when the fair value is negative. Any gains or losses arising from changes in fair value on derivatives during the year are taken directly to the statement of financial performance.
Financial instruments at fair value
Financial instruments at fair value comprise financial assets or financial liabilities that are:
• derivatives
• combined instruments that are designated at fair value
• instruments held for trading
• non‑derivative financial assets or financial liabilities with fixed or determinable payments that are designated at fair value at initial recognition; and
• financial instruments that do not meet the definition of financial instruments
Financial instruments at amortised cost
Financial instruments at amortised cost are non‑derivative financial assets or non‑derivative financial liabilities that have fixed or determinable payments, excluding those instruments that the entity designates at fair value at initial recognition or are held for trading. After initial measurement, the instruments are measured at amortised cost using the effective interest method. Gains and losses are recognised in profit and loss when the liabilities are derecognised as well through the amortisation process. Trade receivables, cash and cash equivalents and trade and other payables are classified as financial instruments at amortised cost.
Derecognition
A financial asset or portion of a financial asset is derecognised when: ‑ The rights to receive cash flows from the asset have expired; ‑ The Agency retains the right to receive cash flows from the asset, but has assumed an obligation to pay them in full without any material delay to a third party under a ‘pass‑through’ arrangement; or
106part e
‑ The Agency has transferred its rights to receive cash flows from the asset and either
• Has transferred substantially all the risks and rewards of the asset; or
• Has neither transferred nor retained substantially all the risks and rewards of the asset but has transferred control of the asset.
A financial liability is derecognised when the obligation under the liability is discharged, cancelled or expired
Offsetting of financial instruments
Financial assets and financial liabilities are offset and the net amount reported in the statement of financial position only if there is a currently enforceable legal right to offset the recognised amounts and there is an intention to settle on a net basis, or to realise the assets and settle the liabilities simultaneously.
1.5 Plant and equipment Plant and equipment are stated at cost less accumulated depreciation and accumulated impairment losses. Depreciation is charged so as to write off the cost of assets over their estimated useful lives, using the straightline method, based on the following useful lives:
The cost of an item of plant and equipment is recognised as an asset when:
• it is probable that future economic benefits or service potential associated with the item will flow to the entity; and
• the cost of the item can be measured reliably.
Item Depreciation method Average useful life
Furniture and fittings Straight line 6 years
Vehicles Straight line 5 years
Office equipment Straight line 5 years
Computer equipment Straight line 3 years
Leasehold improvements Straight line Terms of lease
Project assets Straight line *Refer belowCost includes the cost of replacing part of the plant and equipment when that cost is incurred, if the recognition criteria are met. Likewise, when a major inspection is performed, its cost is recognised in the carrying amount of the plant and equipment as a replacement if the recognition criteria are satisfied, All other repair and maintenance cost are recognised in profit or loss as incurred. The assets’ residual values, useful lives and methods of depreciation are reviewed, and adjustment if appropriate, at each financial year end. Any item of plant and equipment is derecognised upon disposal or when no future economic benefits are expected from its use or disposal. Any gain or loss arising on derecognition of the asset(calculated as the difference between the net disposal proceeds and the carrying amount of the asset) it included in profit or loss in the year the asset is derecognised. Useful lives and residual values are assessed annually where applicable.
*Project related assets will be depreciated over the shortest term of either the contract period with the project funder or the useful life stipulated per category of assets as per the accounting policy. Monthly depreciation will be allocated to the project account.
1.6 Intangible assetsComputer software is acquired by Wesgro, which have finite useful lives, and measured at cost less accumulated amortisation and accumulated impairment losses. Useful lives and residual values are assessed annually where applicable.
Subsequent expenditure
Subsequent expenditure is capitalised only when it increases the future economic benefits embodied in the specific asset to which it relates. All other expenditure is recognised in profit or loss as incurred.
Amortisation
Amortisation is recognised in profit or loss on a straight‑line basis over the estimated useful lives of intangible assets from the date they are available for use.Useful lives and residual values are assessed annually where applicable. The estimated useful lives for the current and comparative years are as follows:
107 financials
Item Depreciation method Average useful life
Computer software Straight line 2 years
1.7 Impairment Impairment of financial asset
The Agency assesses at each reporting date whether there is any objective evidence that a cash generating asset, non‑cash generating asset, or group of financial assets is impaired. A financial asset is deemed to be impaired if there is objective evidence of impairment as a result of one or more events that has occurred after the initial recognition of the asset and that loss event have an impact on the estimated future cash flows of the financial assets that can be reliably estimated.
Cash generating assets are assets which are held with the primary objective of generating a commercial return. Non‑cash gener‑ating assets are assets other than cash generating assets.
Assets carried at amortised cost
In relation to trade receivables, a provision for impairment is made when there is objective evidence (such as the probability of insolvency or significant financial difficulties of the debtor) that the Agency will not be able to collect all of the amounts due under the original terms of the invoice. The amount of the loss is measured as the difference between the asset’s carrying amount and the present value of the estimated future cash flows discounted at the financial assets original effective interest rate. The carry‑ing amount of the receivable is reduced through use of an allowance account. Impaired debts are derecognised when they are assessed as uncollectible.
If, in a subsequent period, the amount of the impairment loss decreases and the decrease can be related objectively to an event occurring after the impairment was recognised, the previously recognised impairment loss is reversed, to the extent that the carrying value of the asset does not exceed its amortised cost at the reversal date. Any subsequent reversal of an impairment loss is recognised in profit or loss.
Fair value investments
For fair value through profit and loss investments, the Agency assesses at each reporting date whether there is objective evidence that an investment or a group of investments is impaired. In the case of equity investments classified as fair value investments, objective evidence would include a significant or prolonged decline in the fair value of the investment below its cost.
Impairment of non‑financial assets
The Agency assesses at each reporting date whether there is an indication that an asset or non‑current assets held for sale may be impaired. If such indication exists, or when annual impairment testing for an asset is required, the Agency estimates the asset’s recoverable amount.
An asset’s recoverable amount is the higher of the asset’s or cash generating unit’s fair value less costs to sell and its value in use and is determined for an individual asset. Where an asset does not generate cash inflows that are largely independent of those from other assets or group of assets the recoverable amount of the cash generating unit is assessed.
Where the carrying amount of an asset or cash generating unit exceeds its recoverable amount, the asset is considered impaired and is written down to its recoverable amount. In assessing value in use, the estimated future cash flows are discounted to their present value using a discount rate that reflects current market assessments of the time value of money and the risks specific to the asset. In determining fair value less cost costs to sell, an appropriate valuation model is used.
Recognition and measurement
If the recoverable amount of a cash‑generating asset is less than its carrying amount, the carrying amount of the asset is reduced to its recoverable amount. This reduction is an impairment loss.
An impairment loss is recognised immediately in surplus or deficit.
Any impairment loss of a revalued cash‑generating asset is treated as a revaluation decrease.
When the amount estimated for an impairment loss is greater than the carrying amount of the cash‑generating asset to which it relates, the entity recognises a liability only to the extent that is a requirement in the Standard of GRAP.
108part e
1.8 Cash and cash equivalentsCash and cash equivalents comprise of cash and short‑term (less than three months), liquid investments that are held with ABSA Bank and the Corporation for Public Deposits that are subject to the institution’s interest rates. Cash and cash equivalents are measured at amortised cost.
1.9 Provisions and contingenciesProvisions are recognised when the Agency has a present obligation (legal or constructive) as a result of a past event, it is prob‑able that an outflow of resources embodying economic benefits will be required to settle the obligation and a reliable estimate can be made of the amount of the obligation. Where the Agency expects some or all of a provision to be reimbursed, for example under an insurance contract, the reimbursement is recognised as a separate asset but only when the reimbursement is virtually certain. The expense relating to any provision is presented in profit or loss net of any reimbursement. Provisions are discounted when the time value of money is material. If the effect of the time value of money is material, provisions are discounted using a current rate that reflects, where appropriate, the risks specific to the liability. Where discounting is used, the increase in the provision due to the passage of time is recognised as a finance cost.
Contingent assets and contingent liabilities are not recognised. Contingencies are disclosed in note 25.
1.10 Translation of foreign currenciesForeign currency transactions
Transactions in foreign currency are initially recorded at the functional rate currency rate prevailing at the date of the transaction. Monetary assets and liabilities denominated in foreign currencies are translated at the functional currency spot rate of exchange ruling at the statement of financial position date. All differences are recognised in profit and loss.
1.11 LeasesFinance leases, which transfer to the Agency substantially all the risks and benefits incidental to ownership of the leased item, are capitalised at the commencement of the lease at the fair value of the leased property or, if lower, at the present value of the mini‑mum lease payments are apportioned between the finance charges and reduction of the lease liability so at to achieve a constant rate of interest on the remaining balance of the liability. Finance charges are recognised in the statement of financial performance.
Where the Agency does not transfer substantially all the risks and benefits of ownership of the asset, they are classified as operating leases. Operating lease payments are recognised as an expense on a straight line basis over the lease term.
All incentives for the agreement of a new or renewed operating lease shall be recognised as an integral part of the net considera‑tion agreed for the use of the leased asset, irrespective of the incentive’s nature or form or the timing of payments.
1.12 TaxBeing a provincial public entity as defined in terms of the Public Finance Management Act, 1999, the Agency is exempted from having to pay income tax or declare Value Added Tax.
1.13 Employee benefitsShort‑term employee benefits
The cost of short‑term employee benefits, (those payable within 12 months after the service is rendered, such as paid vacation leave and sick leave, bonuses, and non‑monetary benefits such as medical care), are recognised in the period in which the service is rendered and are not discounted.
The expected cost of compensated absences is recognised as an expense as the employees render services that increase their entitlement or, in the case of non‑accumulating absences, when the absence occurs.
The expected cost of surplus sharing and bonus payments is recognised as an expense when there is a legal or constructive obligation to make such payments as a result of past performance.
109 financials
Defined contribution plans
The Agency makes contributions to a defined contribution scheme. Contributions are recognised as an expense as the obligation to make them accrues.
Payments made to industry‑managed (or state plans) retirement benefit schemes are dealt with as defined contribution plans where the entity’s obligation under the schemes is equivalent to those arising in a defined contribution retirement benefit plan.
The adoption of this standard has not had a material impact on the results of the entity.
1.14 Budget informationSubject to requirements of GRAP 24 paragraph 19, an entity shall present a comparison of budget amounts for which it is held publicly accountable and actual amounts either as a separate additional financial statement or as additional budget columns in the financial statements currently presented in accordance with Standards of GRAP. The comparison of budget and the actual amounts shall present separately for each level of legislative oversight:
• The approved and final budget
• The actual amounts on a comparable basis
• An explanation of material differences between budget
Where the budget and the annual financial statements are prepared on a comparable basis, a separate statement is prepared called ‘Statement of Comparison of Budget and Actual Amounts’. This statement compares the budget amounts with the amounts in the financial statements adjusted to be comparable. A comparable basis means that the budget and annual financial statements:
• Are prepared using the same basis of accounting
• Include the same activities and entities
• Use the same classification system
• Are prepared for the same period
1.15 Segment informationA segment is an activity of an entity:
• that generates economic benefits or service potential (including economic benefits or service potential relating to transactions between activities of the same entity);
• whose results are regularly reviewed by management to make decisions about resources to be allocated to that activity and in assessing its performance; and
• for which separate financial information is available.
Operating segments are reported in a manner consistent with the internal reporting provided to management. Management allocates resources to and assesses the performance of the operating segments of an entity. The Agency operates in the following primary segments:
• Investment and trade promotion
• Destination marketing
• Wesgro support services
1.16 Significant adjustments and sources of estimation uncertaintyThe preparation of the Wesgro’s financial statements requires management to make judgments, estimates and assumptions that affect the reported amounts of revenues, expenses, assets and liabilities, and the disclosure of contingent liabilities, at the reporting date. However, uncertainty about these assumptions and estimates could result in outcomes that require a material adjustment to the carrying amount of the asset or liability affected in future periods.
110part e
Trade and other receivables
The entity assesses its trade receivables and other receivables for impairment at the end of each reporting period. In determining whether an impairment loss should be recorded in surplus or deficit, the agency makes judgments as to whether there is observ‑able data indicating a measurable decrease in the estimated future cash flows from a financial asset.
Plant and equipment
The entity assesses at each reporting date whether there is any indication that the entity expectations about the residual value and the useful life of an asset have changed since the preceding reporting date. If any such indication exists, the entity revises the expected useful life and/or residual value accordingly. The change is accounted for as a change in an accounting estimate.
Fair value of financial instruments
Where the fair value of financial assets and financial liabilities recorded in the balance sheet cannot be derived from active markets, they are determined using valuation techniques including the discounted cash flows model. The inputs to these models are taken from observable markets where possible, but where this is not feasible, a degree of judgemental is required in establishing fair values. The judgments include considerations of inputs such as liquidity risk, credit risk and volatility.
Changes in assumptions about these factors could affect the reported fair value of financial instruments.
Further details are explained in Note 28.
1.17 Related partiesRelated parties are considered to be related if one party has the ability to control or jointly control the other party or exercise significant influence over the other party in making financial and operating decisions. Key management personnel are also regarded as related parties. Key management personnel are those persons having authority and responsibility for planning, directing and controlling the activities of the Agency, directly or indirectly. Entities falling under its Minister/MEC portfolio, irrespective of whether there were any transactions between the entities are also related parties.
Related party transactions are those where a transfer of resources or obligations between related parties occurs, regardless of whether or not a price is charged.
1.18 Irregular, fruitless and wasteful expenditureAll expenditure relating to fruitless and wasteful expenditure is recognised as an expense in the statement of financial performance in the year that the expenditure was incurred. The expenditure is classified in accordance with the nature of the expense, and where recovered, it is subsequently accounted for as revenue in the statement of financial performance.
Irregular expenditure is treated as expenditure in the income statement until such expenditure is condoned by Provincial Treasury. At this point it is treated as a current asset until it is recovered from a third party. Fruitless and wasteful expenditure means expenditure that was made in vain and would have been avoided had reasonable care been exercised. Fruitless and wasteful expenditure is treated as a current asset in the balance sheet until such expenditure is recovered from a third party except for instances that could not be provided for.
1.19 CommitmentsItems are classified as commitments when an entity has committed itself to future transactions that will normally result in the outflow of cash.
Disclosures are required in respect of unrecognised contractual commitments.
Commitments for which disclosure is necessary to achieve a fair presentation should be disclosed in a note to the financial statements, if both the following criteria are met:
• Contracts should be non‑cancellable or only cancellable at significant cost (for example, contracts for computer or building maintenance services); and
• Contracts should relate to something other than the routine, steady, state business of the entity – therefore salary commitments relating to employment contracts or social security benefit commitments are excluded.
111 financials
1.20 PrepaymentsPrepayments are amounts paid in advance for goods and services not yet received by the Agency and fall under a more set time period for fulfilment. A prepayment is initially charged to the balance sheet and the related expense is charged to the income statement in the accounting period in which it is incurred or utilized.
Government grants
Government grants are recognised as revenue when:
• it is probable that the economic benefits or service potential associated with the transaction will flow to the entity,
• the amount of the revenue can be measured reliably, and
• to the extent that there has been compliance with any restrictions associated with the grant.
The entity assesses the degree of certainty attached to the flow of future economic benefits or service potential on the basis of the available evidence. Certain grants payable by one level of government to another are subject to the availability of funds. Revenue from these grants is only recognised when it is probable that the economic benefits or service potential associated with the transaction will flow to the entity. An announcement at the beginning of a financial year that grants may be available for qualifying entities in accordance with an agreed programme may not be sufficient evidence of the probability of the flow. Revenue is then only recognised once evidence of the probability of the flow becomes available.
Restrictions on government grants may result in such revenue being recognised on a time proportion basis. Where there is no restriction on the period, such revenue is recognised on receipt or when the Act becomes effective, which‑ever is earlier.
When government remit grants on a re‑imbursement basis, revenue is recognised when the qualifying expense has been incurred and to the extent that any other restrictions have been complied with.
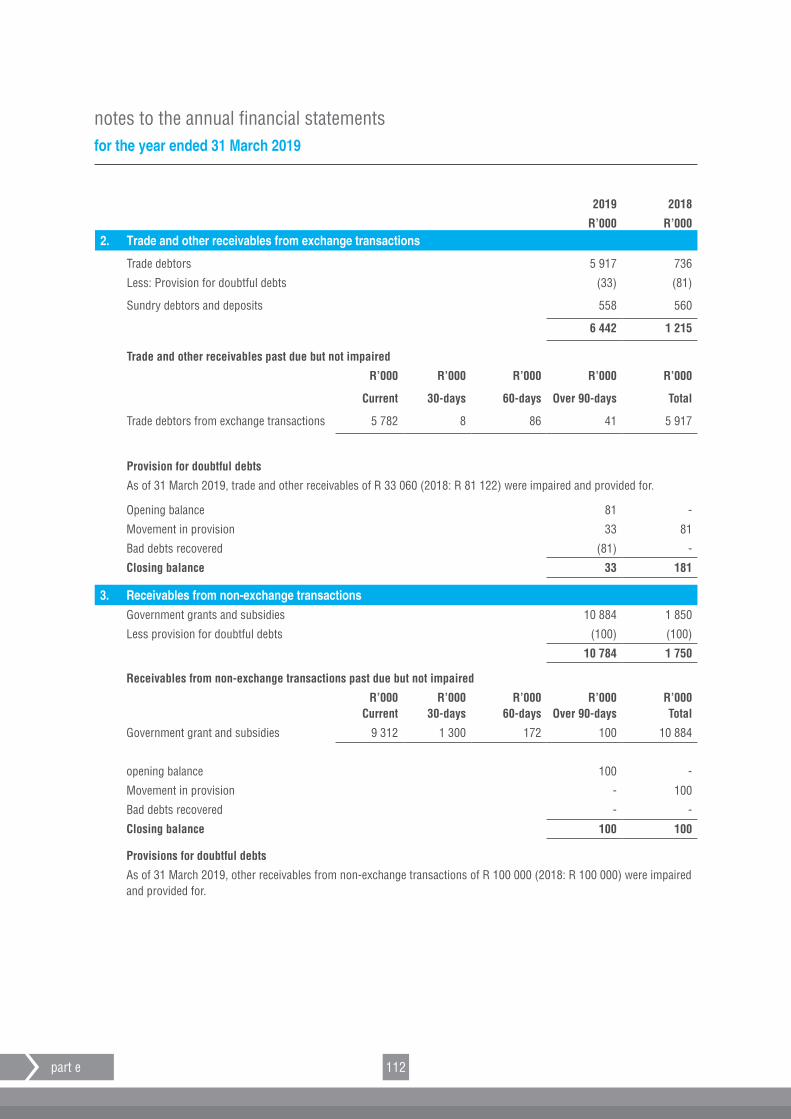
112part e
2019 2018
R’000 R’000
notes to the annual financial statementsfor the year ended 31 March 2019
2. Trade and other receivables from exchange transactions
Trade debtors 5 917 736
Less: Provision for doubtful debts (33) (81)
Sundry debtors and deposits 558 560
6 442 1 215
Trade and other receivables past due but not impaired
R’000 R’000 R’000 R’000 R’000
Current 30‑days 60‑days Over 90‑days Total
Trade debtors from exchange transactions 5 782 8 86 41 5 917
Provision for doubtful debts
As of 31 March 2019, trade and other receivables of R 33 060 (2018: R 81 122) were impaired and provided for.
Opening balance 81 ‑
Movement in provision 33 81
Bad debts recovered (81) ‑
Closing balance 33 181
3. Receivables from non-exchange transactionsGovernment grants and subsidies 10 884 1 850
Less provision for doubtful debts (100) (100)
10 784 1 750
Receivables from non‑exchange transactions past due but not impaired
R’000Current
R’00030‑days
R’00060‑days
R’000Over 90‑days
R’000Total
Government grant and subsidies 9 312 1 300 172 100 10 884
opening balance 100 ‑
Movement in provision ‑ 100
Bad debts recovered ‑ ‑
Closing balance 100 100
Provisions for doubtful debts
As of 31 March 2019, other receivables from non‑exchange transactions of R 100 000 (2018: R 100 000) were impaired and provided for.
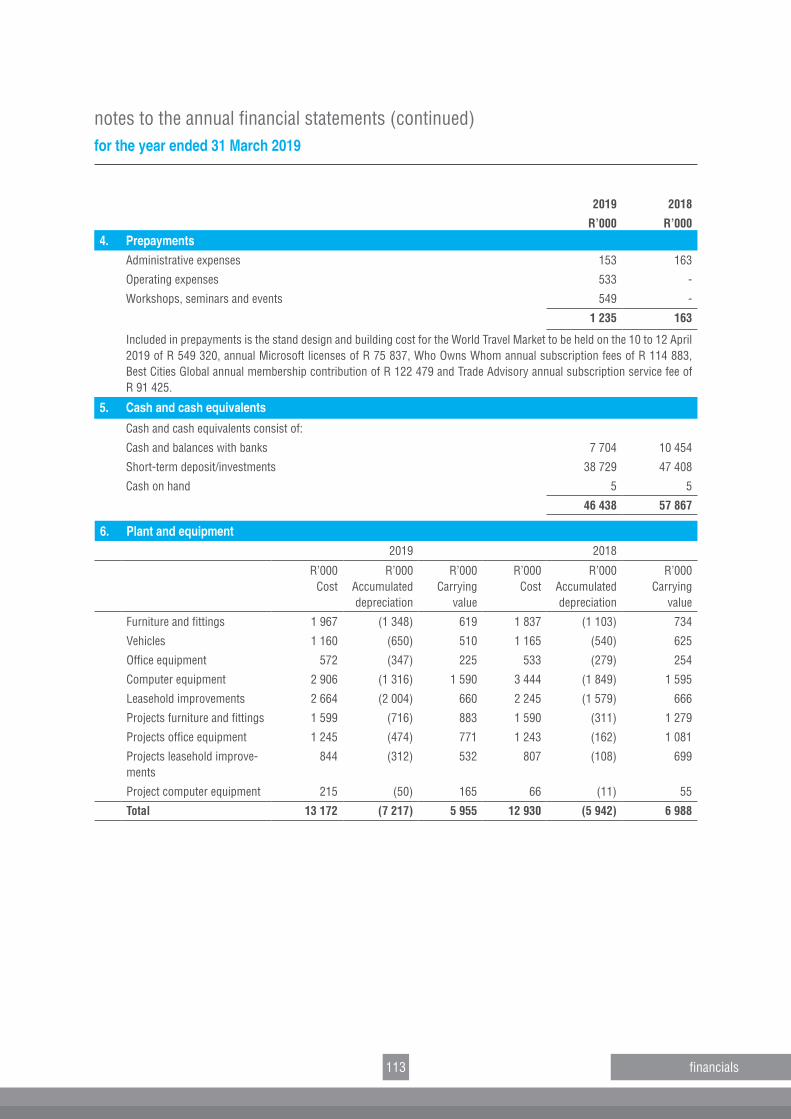
113
notes to the annual financial statements (continued)for the year ended 31 March 2019
financials
2019 2018
R’000 R’0004. Prepayments
Administrative expenses 153 163
Operating expenses 533 ‑
Workshops, seminars and events 549 ‑
1 235 163
Included in prepayments is the stand design and building cost for the World Travel Market to be held on the 10 to 12 April 2019 of R 549 320, annual Microsoft licenses of R 75 837, Who Owns Whom annual subscription fees of R 114 883, Best Cities Global annual membership contribution of R 122 479 and Trade Advisory annual subscription service fee of R 91 425.
5. Cash and cash equivalents
Cash and cash equivalents consist of:
Cash and balances with banks 7 704 10 454
Short‑term deposit/investments 38 729 47 408
Cash on hand 5 5
46 438 57 867
6. Plant and equipment2019 2018
R’000 Cost
R’000 Accumulated depreciation
R’000 Carrying
value
R’000 Cost
R’000Accumulated depreciation
R’000 Carrying
value
Furniture and fittings 1 967 (1 348) 619 1 837 (1 103) 734
Vehicles 1 160 (650) 510 1 165 (540) 625
Office equipment 572 (347) 225 533 (279) 254
Computer equipment 2 906 (1 316) 1 590 3 444 (1 849) 1 595
Leasehold improvements 2 664 (2 004) 660 2 245 (1 579) 666
Projects furniture and fittings 1 599 (716) 883 1 590 (311) 1 279
Projects office equipment 1 245 (474) 771 1 243 (162) 1 081
Projects leasehold improve‑ments
844 (312) 532 807 (108) 699
Project computer equipment 215 (50) 165 66 (11) 55
Total 13 172 (7 217) 5 955 12 930 (5 942) 6 988
20192018
R‘000 R‘000
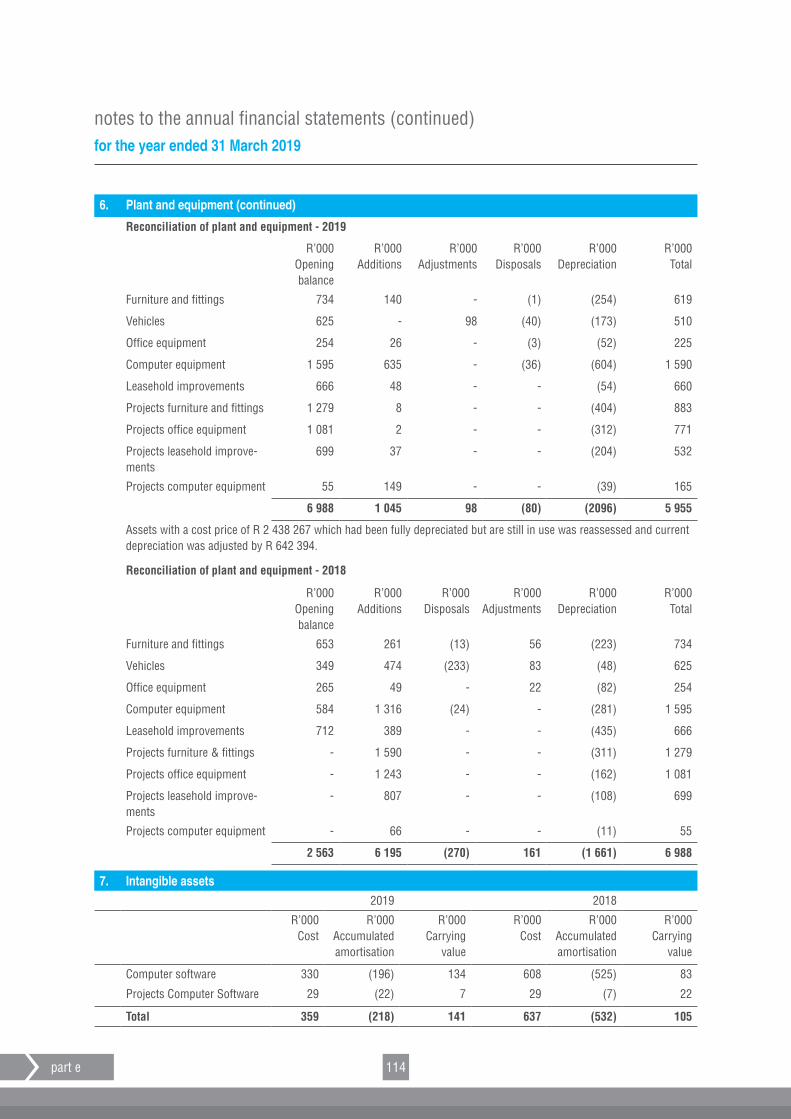
114
notes to the annual financial statements (continued)for the year ended 31 March 2019
part e
6. Plant and equipment (continued)
Reconciliation of plant and equipment ‑ 2019
R’000Opening balance
R’000 Additions
R’000Adjustments
R’000 Disposals
R’000 Depreciation
R’000 Total
Furniture and fittings 734 140 ‑ (1) (254) 619
Vehicles 625 ‑ 98 (40) (173) 510
Office equipment 254 26 ‑ (3) (52) 225
Computer equipment 1 595 635 ‑ (36) (604) 1 590
Leasehold improvements 666 48 ‑ ‑ (54) 660
Projects furniture and fittings 1 279 8 ‑ ‑ (404) 883
Projects office equipment 1 081 2 ‑ ‑ (312) 771
Projects leasehold improve‑ments
699 37 ‑ ‑ (204) 532
Projects computer equipment 55 149 ‑ ‑ (39) 165
6 988 1 045 98 (80) (2096) 5 955
Assets with a cost price of R 2 438 267 which had been fully depreciated but are still in use was reassessed and current depreciation was adjusted by R 642 394.
Reconciliation of plant and equipment ‑ 2018
R’000Opening balance
R’000 Additions
R’000 Disposals
R’000Adjustments
R’000 Depreciation
R’000 Total
Furniture and fittings 653 261 (13) 56 (223) 734
Vehicles 349 474 (233) 83 (48) 625
Office equipment 265 49 ‑ 22 (82) 254
Computer equipment 584 1 316 (24) ‑ (281) 1 595
Leasehold improvements 712 389 ‑ ‑ (435) 666
Projects furniture & fittings ‑ 1 590 ‑ ‑ (311) 1 279
Projects office equipment ‑ 1 243 ‑ ‑ (162) 1 081
Projects leasehold improve‑ments
‑ 807 ‑ ‑ (108) 699
Projects computer equipment ‑ 66 ‑ ‑ (11) 55
2 563 6 195 (270) 161 (1 661) 6 988
7. Intangible assets2019 2018
R’000Cost
R’000Accumulated amortisation
R’000 Carrying
value
R’000Cost
R’000Accumulated amortisation
R’000Carrying
value
Computer software 330 (196) 134 608 (525) 83
Projects Computer Software 29 (22) 7 29 (7) 22
Total 359 (218) 141 637 (532) 105
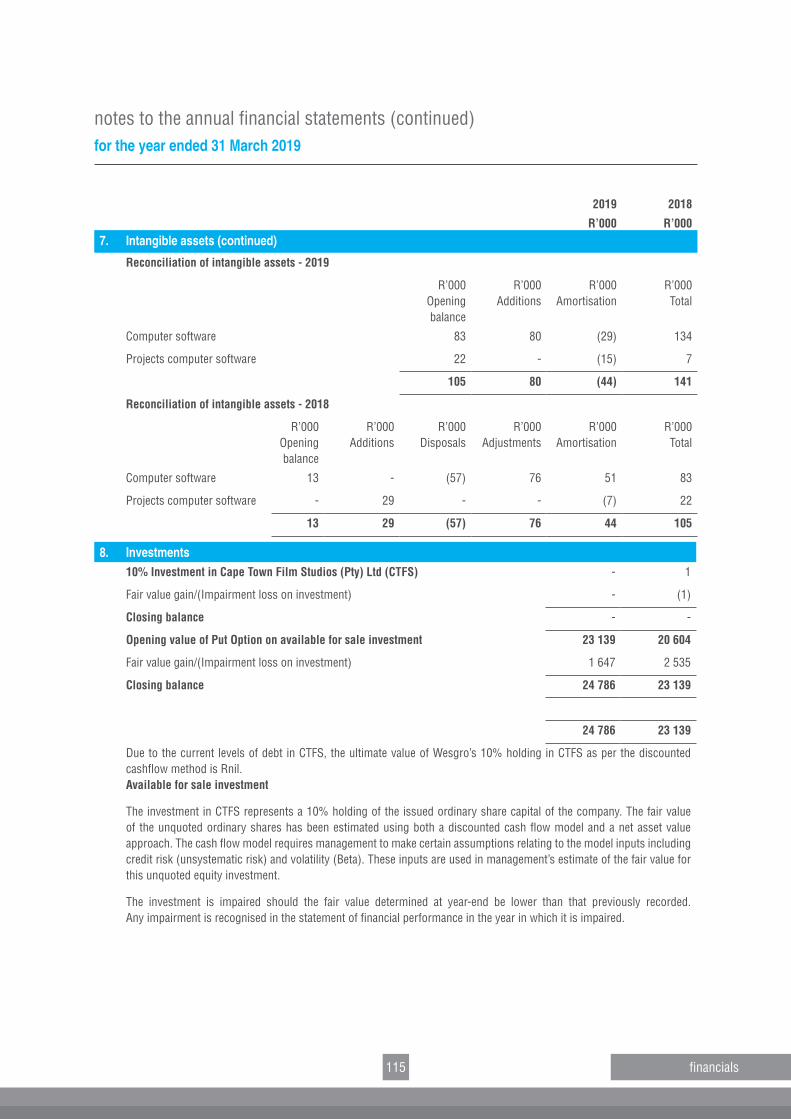
115
notes to the annual financial statements (continued)for the year ended 31 March 2019
financials
2019 2018
R’000 R’0007. Intangible assets (continued)
Reconciliation of intangible assets ‑ 2019
R’000Opening balance
R’000 Additions
R’000 Amortisation
R’000 Total
Computer software 83 80 (29) 134
Projects computer software 22 ‑ (15) 7
105 80 (44) 141
Reconciliation of intangible assets ‑ 2018
R’000Opening balance
R’000 Additions
R’000 Disposals
R’000Adjustments
R’000 Amortisation
R’000 Total
Computer software 13 ‑ (57) 76 51 83
Projects computer software ‑ 29 ‑ ‑ (7) 22
13 29 (57) 76 44 105
8. Investments10% Investment in Cape Town Film Studios (Pty) Ltd (CTFS) ‑ 1
Fair value gain/(Impairment loss on investment) ‑ (1)
Closing balance ‑ ‑
Opening value of Put Option on available for sale investment 23 139 20 604
Fair value gain/(Impairment loss on investment) 1 647 2 535
Closing balance 24 786 23 139
24 786 23 139
Due to the current levels of debt in CTFS, the ultimate value of Wesgro’s 10% holding in CTFS as per the discounted cashflow method is Rnil.Available for sale investment
The investment in CTFS represents a 10% holding of the issued ordinary share capital of the company. The fair value of the unquoted ordinary shares has been estimated using both a discounted cash flow model and a net asset value approach. The cash flow model requires management to make certain assumptions relating to the model inputs including credit risk (unsystematic risk) and volatility (Beta). These inputs are used in management’s estimate of the fair value for this unquoted equity investment.
The investment is impaired should the fair value determined at year‑end be lower than that previously recorded. Any impairment is recognised in the statement of financial performance in the year in which it is impaired.
76
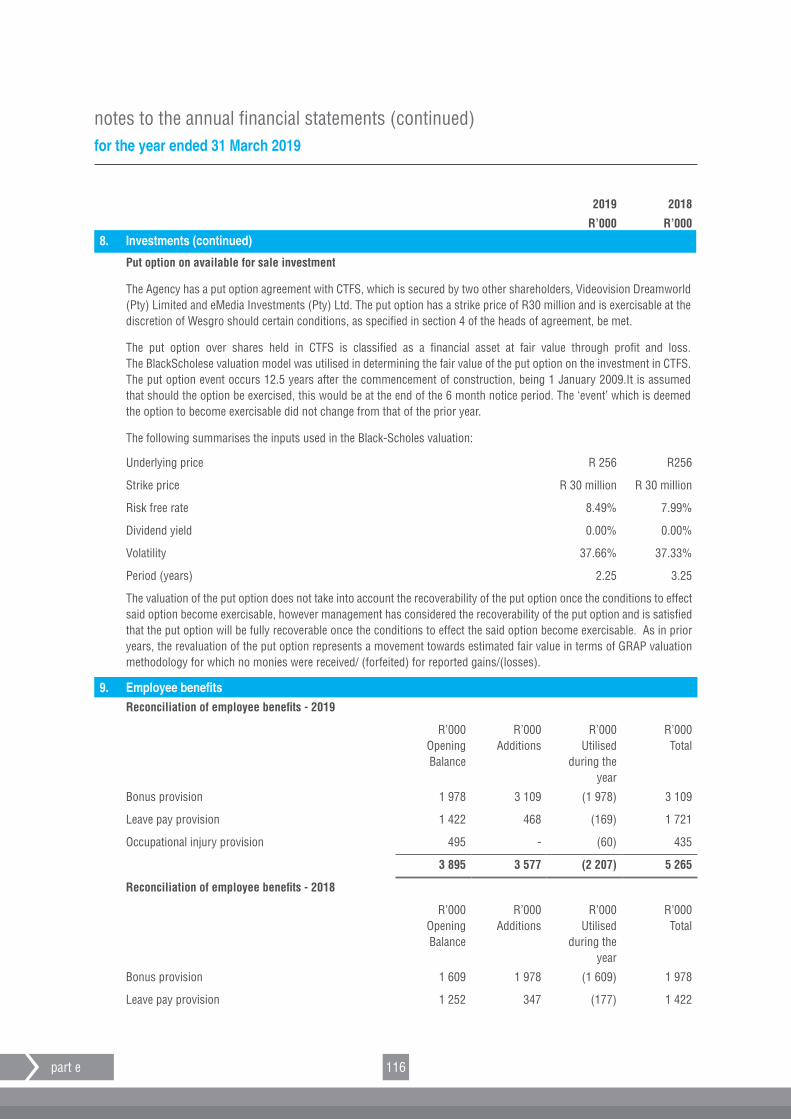
116
notes to the annual financial statements (continued)for the year ended 31 March 2019
part e
2019 2018
R’000 R’0008. Investments (continued)
Put option on available for sale investment
The Agency has a put option agreement with CTFS, which is secured by two other shareholders, Videovision Dreamworld (Pty) Limited and eMedia Investments (Pty) Ltd. The put option has a strike price of R30 million and is exercisable at the discretion of Wesgro should certain conditions, as specified in section 4 of the heads of agreement, be met.
The put option over shares held in CTFS is classified as a financial asset at fair value through profit and loss. The BlackScholese valuation model was utilised in determining the fair value of the put option on the investment in CTFS. The put option event occurs 12.5 years after the commencement of construction, being 1 January 2009.It is assumed that should the option be exercised, this would be at the end of the 6 month notice period. The ‘event’ which is deemed the option to become exercisable did not change from that of the prior year.
The following summarises the inputs used in the Black‑Scholes valuation:
Underlying price R 256 R256
Strike price R 30 million R 30 million
Risk free rate 8.49% 7.99%
Dividend yield 0.00% 0.00%
Volatility 37.66% 37.33%
Period (years) 2.25 3.25
The valuation of the put option does not take into account the recoverability of the put option once the conditions to effect said option become exercisable, however management has considered the recoverability of the put option and is satisfied that the put option will be fully recoverable once the conditions to effect the said option become exercisable. As in prior years, the revaluation of the put option represents a movement towards estimated fair value in terms of GRAP valuation methodology for which no monies were received/ (forfeited) for reported gains/(losses).
9. Employee benefitsReconciliation of employee benefits ‑ 2019
R’000Opening Balance
R’000 Additions
R’000Utilised
during the year
R’000 Total
Bonus provision 1 978 3 109 (1 978) 3 109
Leave pay provision 1 422 468 (169) 1 721
Occupational injury provision 495 ‑ (60) 435
3 895 3 577 (2 207) 5 265
Reconciliation of employee benefits ‑ 2018
R’000Opening Balance
R’000 Additions
R’000Utilised
during the year
R’000 Total
Bonus provision 1 609 1 978 (1 609) 1 978
Leave pay provision 1 252 347 (177) 1 422
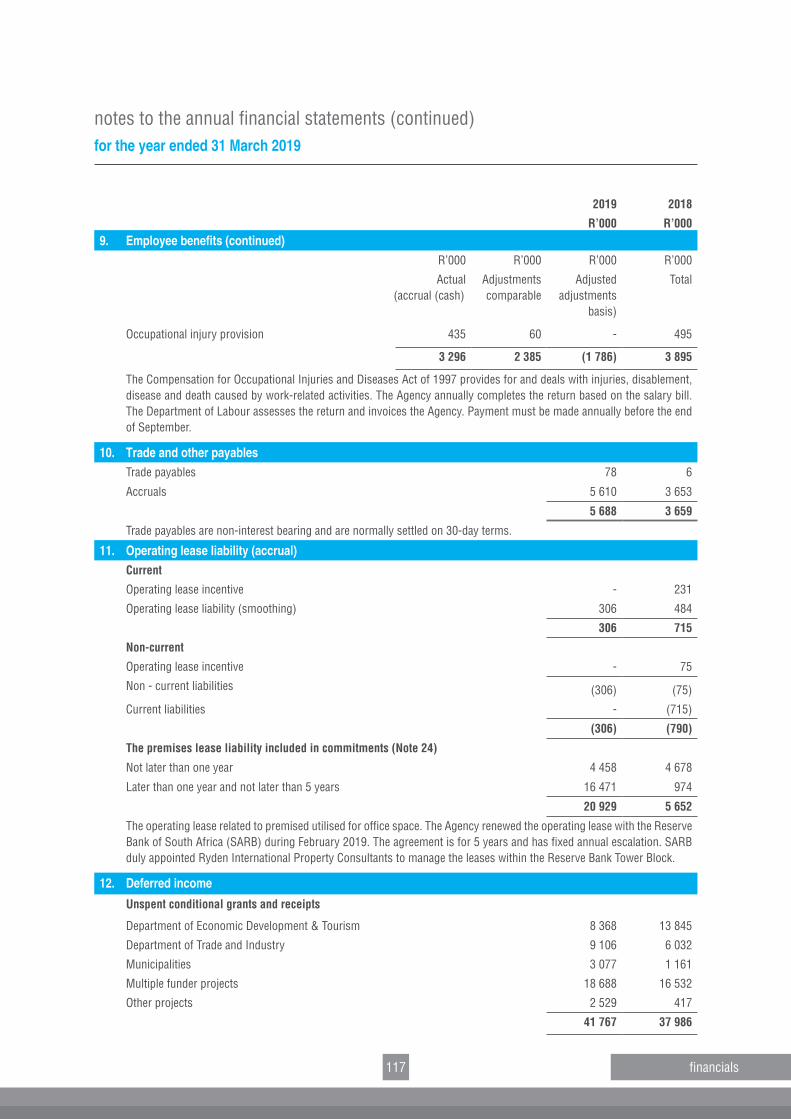
117
notes to the annual financial statements (continued)for the year ended 31 March 2019
financials
2019 2018
R’000 R’000
Occupational injury provision 435 60 ‑ 495
3 296 2 385 (1 786) 3 895
The Compensation for Occupational Injuries and Diseases Act of 1997 provides for and deals with injuries, disablement, disease and death caused by work‑related activities. The Agency annually completes the return based on the salary bill. The Department of Labour assesses the return and invoices the Agency. Payment must be made annually before the end of September.
10. Trade and other payablesTrade payables 78 6
Accruals 5 610 3 653
5 688 3 659
Trade payables are non‑interest bearing and are normally settled on 30‑day terms.
11. Operating lease liability (accrual)Current
Operating lease incentive ‑ 231
Operating lease liability (smoothing) 306 484
306 715
Non‑current
Operating lease incentive ‑ 75
Non ‑ current liabilities (306) (75)
Current liabilities ‑ (715)
(306) (790)
The premises lease liability included in commitments (Note 24)
Not later than one year 4 458 4 678
Later than one year and not later than 5 years 16 471 974
20 929 5 652
The operating lease related to premised utilised for office space. The Agency renewed the operating lease with the Reserve Bank of South Africa (SARB) during February 2019. The agreement is for 5 years and has fixed annual escalation. SARB duly appointed Ryden International Property Consultants to manage the leases within the Reserve Bank Tower Block.
12. Deferred income
Unspent conditional grants and receipts
Department of Economic Development & Tourism 8 368 13 845
Department of Trade and Industry 9 106 6 032
Municipalities 3 077 1 161
Multiple funder projects 18 688 16 532
Other projects 2 529 417
41 767 37 986
9. Employee benefits (continued)R’000 R’000 R’000 R’000
Actual(accrual (cash)
Adjustments comparable
Adjusted adjustments
basis)
Total
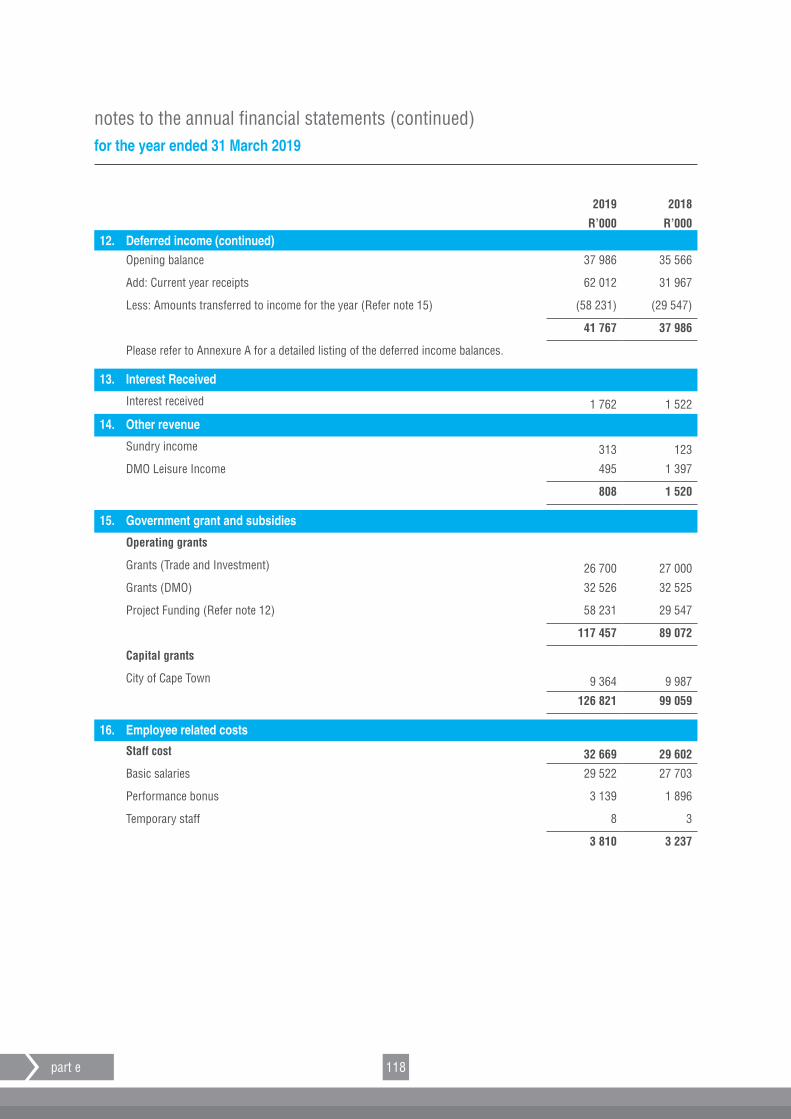
118
notes to the annual financial statements (continued)for the year ended 31 March 2019
part e
Opening balance 37 986 35 566
Add: Current year receipts 62 012 31 967
Less: Amounts transferred to income for the year (Refer note 15) (58 231) (29 547)
41 767 37 986
Please refer to Annexure A for a detailed listing of the deferred income balances.
13. Interest Received
Interest received 1 762 1 522
14. Other revenue
Sundry income 313 123
DMO Leisure Income 495 1 397
808 1 520
15. Government grant and subsidies
Operating grants
Grants (Trade and Investment) 26 700 27 000
Grants (DMO) 32 526 32 525
Project Funding (Refer note 12) 58 231 29 547
117 457 89 072
Capital grants
City of Cape Town 9 364 9 987
126 821 99 059
16. Employee related costs
Staff cost 32 669 29 602
Basic salaries 29 522 27 703
Performance bonus 3 139 1 896
Temporary staff 8 3
3 810 3 237
‘000 R‘000
12. Deferred income (continued)
2019 2018
R’000 R’000
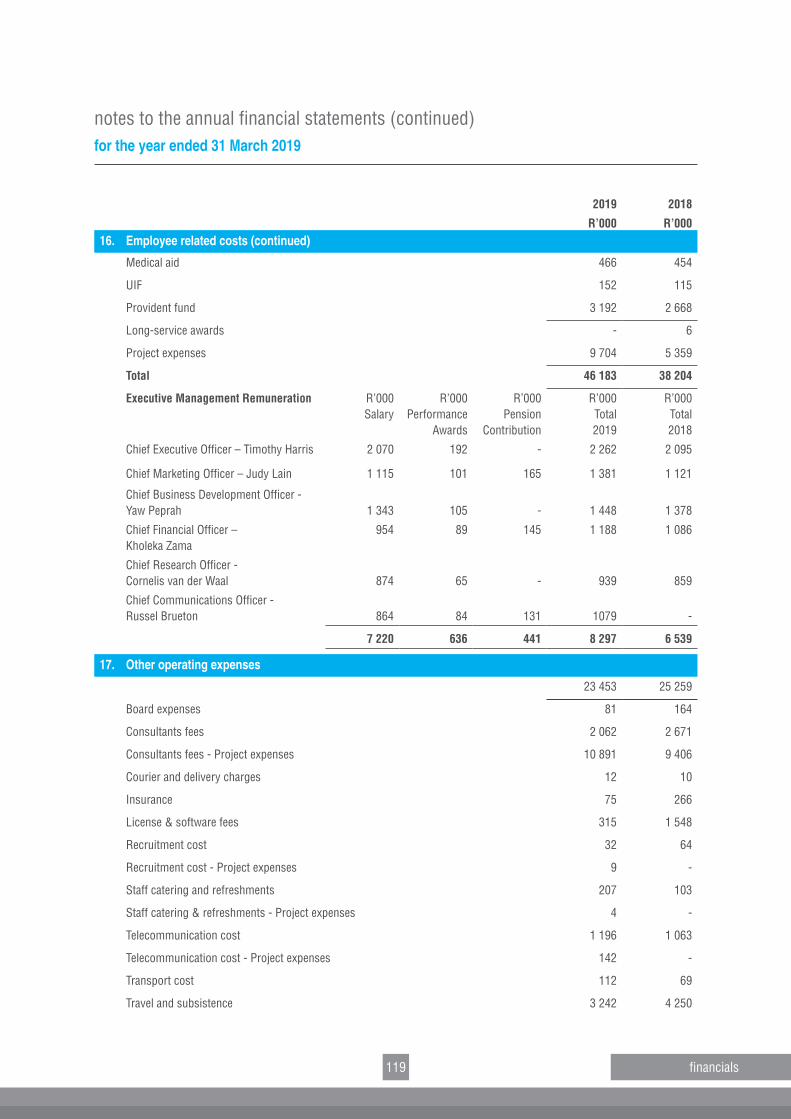
119
notes to the annual financial statements (continued)for the year ended 31 March 2019
financials
2019 2018
R’000 R’00016. Employee related costs (continued)
Medical aid 466 454
UIF 152 115
Provident fund 3 192 2 668
Long‑service awards ‑ 6
Project expenses 9 704 5 359
Total 46 183 38 204
Executive Management Remuneration R’000Salary
R’000Performance
Awards
R’000Pension
Contribution
R’000Total 2019
R’000 Total 2018
Chief Executive Officer – Timothy Harris 2 070 192 ‑ 2 262 2 095
Chief Marketing Officer – Judy Lain 1 115 101 165 1 381 1 121
Chief Business Development Officer ‑ Yaw Peprah 1 343 105 ‑ 1 448 1 378
Chief Financial Officer – Kholeka Zama
954 89 145 1 188 1 086
Chief Research Officer ‑ Cornelis van der Waal 874 65 ‑ 939 859
Chief Communications Officer ‑ Russel Brueton 864 84 131 1079 ‑
7 220 636 441 8 297 6 539
17. Other operating expenses
23 453 25 259
Board expenses 81 164
Consultants fees 2 062 2 671
Consultants fees ‑ Project expenses 10 891 9 406
Courier and delivery charges 12 10
Insurance 75 266
License & software fees 315 1 548
Recruitment cost 32 64
Recruitment cost ‑ Project expenses 9 ‑
Staff catering and refreshments 207 103
Staff catering & refreshments ‑ Project expenses 4 ‑
Telecommunication cost 1 196 1 063
Telecommunication cost ‑ Project expenses 142 ‑
Transport cost 112 69
Travel and subsistence 3 242 4 250
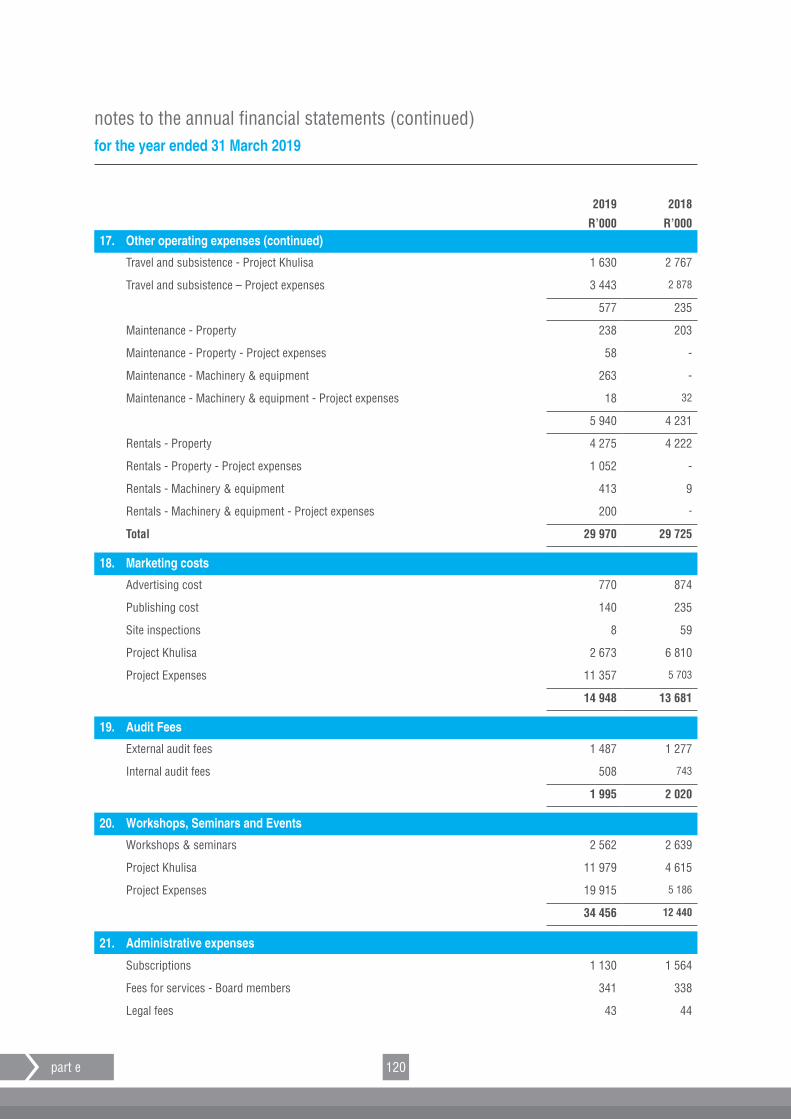
120
notes to the annual financial statements (continued)for the year ended 31 March 2019
part e
2019 2018
R’000 R’00017. Other operating expenses (continued)
Travel and subsistence ‑ Project Khulisa 1 630 2 767
Travel and subsistence – Project expenses 3 443 2 878
577 235
Maintenance ‑ Property 238 203
Maintenance ‑ Property ‑ Project expenses 58 ‑
Maintenance ‑ Machinery & equipment 263 ‑
Maintenance ‑ Machinery & equipment ‑ Project expenses 18 32
5 940 4 231
Rentals ‑ Property 4 275 4 222
Rentals ‑ Property ‑ Project expenses 1 052 ‑
Rentals ‑ Machinery & equipment 413 9
Rentals ‑ Machinery & equipment ‑ Project expenses 200 ‑
Total 29 970 29 725
18. Marketing costs
Advertising cost 770 874
Publishing cost 140 235
Site inspections 8 59
Project Khulisa 2 673 6 810
Project Expenses 11 357 5 703
14 948 13 681
19. Audit Fees
External audit fees 1 487 1 277
Internal audit fees 508 743
1 995 2 020
20. Workshops, Seminars and Events
Workshops & seminars 2 562 2 639
Project Khulisa 11 979 4 615
Project Expenses 19 915 5 186
34 456 12 440
21. Administrative expenses
Subscriptions 1 130 1 564
Fees for services ‑ Board members 341 338
Legal fees 43 44
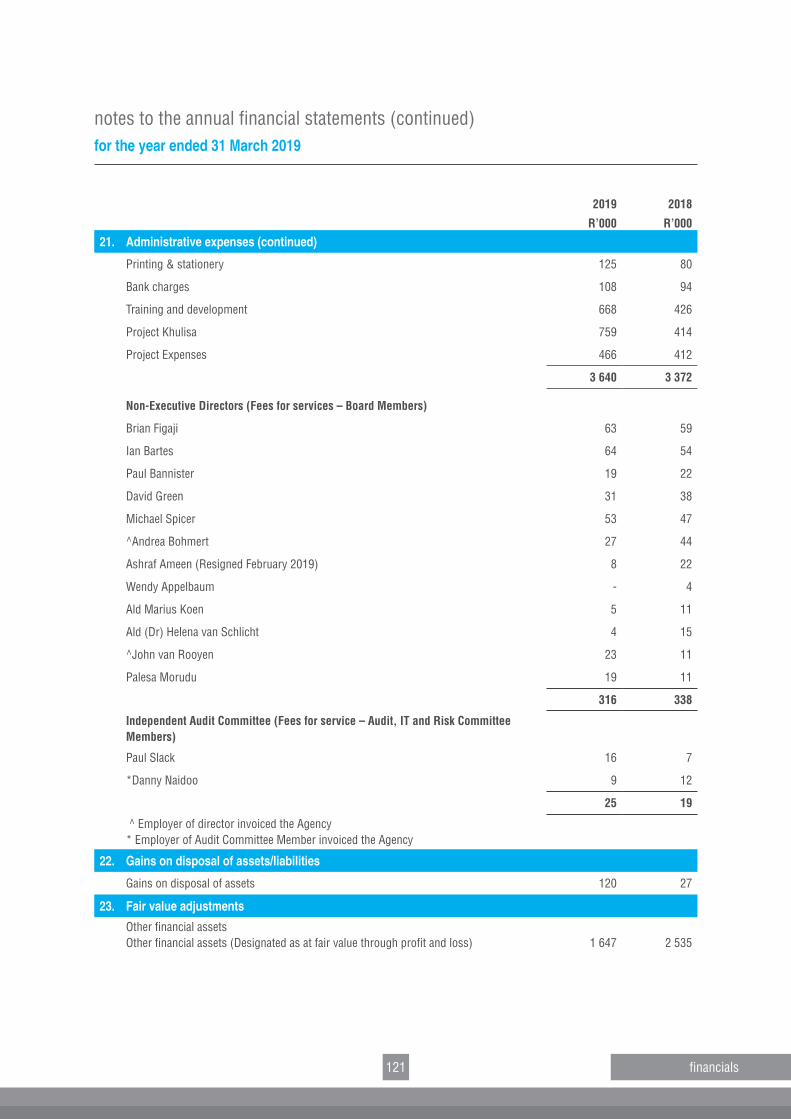
121
notes to the annual financial statements (continued)for the year ended 31 March 2019
financials
2019 2018
R’000 R’000
21. Administrative expenses (continued)
Printing & stationery 125 80
Bank charges 108 94
Training and development 668 426
Project Khulisa 759 414
Project Expenses 466 412
3 640 3 372
Non‑Executive Directors (Fees for services – Board Members)
Brian Figaji 63 59
Ian Bartes 64 54
Paul Bannister 19 22
David Green 31 38
Michael Spicer 53 47
^Andrea Bohmert 27 44
Ashraf Ameen (Resigned February 2019) 8 22
Wendy Appelbaum ‑ 4
Ald Marius Koen 5 11
Ald (Dr) Helena van Schlicht 4 15
^John van Rooyen 23 11
Palesa Morudu 19 11
316 338
Independent Audit Committee (Fees for service – Audit, IT and Risk Committee Members)
Paul Slack 16 7
*Danny Naidoo 9 12
25 19
^ Employer of director invoiced the Agency * Employer of Audit Committee Member invoiced the Agency
22. Gains on disposal of assets/liabilities
Gains on disposal of assets 120 27
23. Fair value adjustments
Other financial assetsOther financial assets (Designated as at fair value through profit and loss) 1 647 2 535
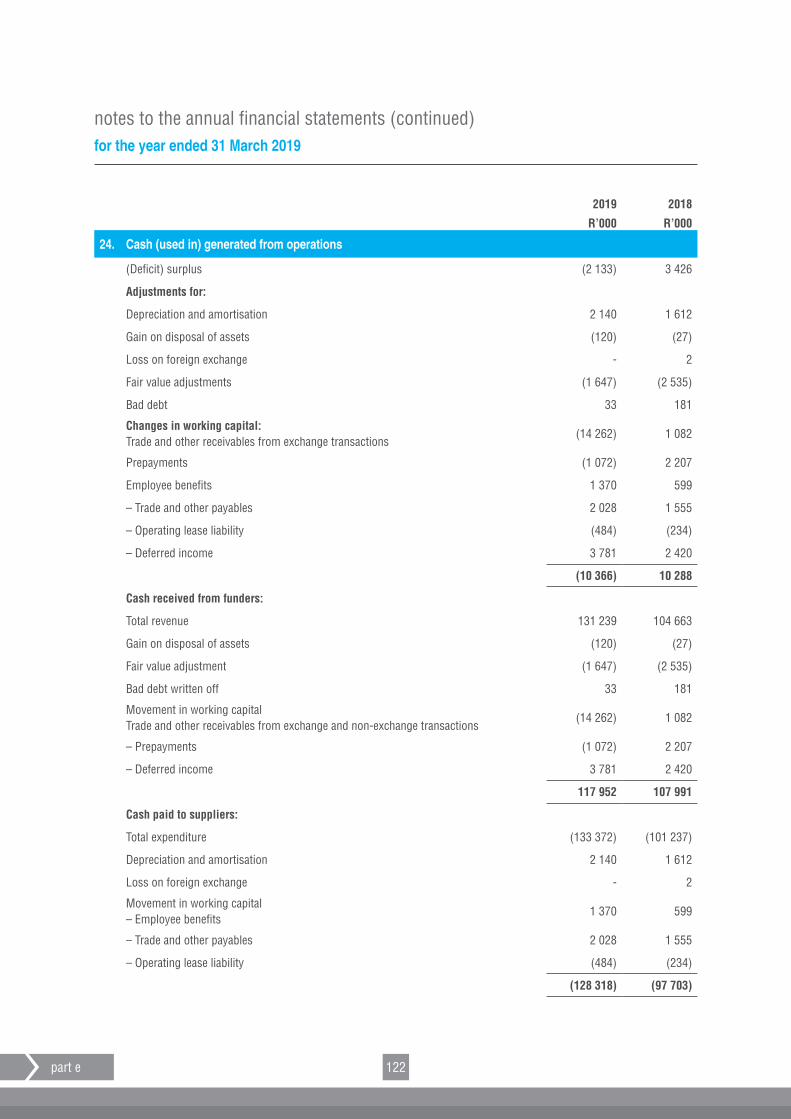
122
notes to the annual financial statements (continued)for the year ended 31 March 2019
part e
2019 2018
R’000 R’000
24. Cash (used in) generated from operations
(Deficit) surplus (2 133) 3 426
Adjustments for:
Depreciation and amortisation 2 140 1 612
Gain on disposal of assets (120) (27)
Loss on foreign exchange ‑ 2
Fair value adjustments (1 647) (2 535)
Bad debt 33 181
Changes in working capital:Trade and other receivables from exchange transactions
(14 262) 1 082
Prepayments (1 072) 2 207
Employee benefits 1 370 599
– Trade and other payables 2 028 1 555
– Operating lease liability (484) (234)
– Deferred income 3 781 2 420
(10 366) 10 288
Cash received from funders:
Total revenue 131 239 104 663
Gain on disposal of assets (120) (27)
Fair value adjustment (1 647) (2 535)
Bad debt written off 33 181
Movement in working capitalTrade and other receivables from exchange and non‑exchange transactions
(14 262) 1 082
– Prepayments (1 072) 2 207
– Deferred income 3 781 2 420
117 952 107 991
Cash paid to suppliers:
Total expenditure (133 372) (101 237)
Depreciation and amortisation 2 140 1 612
Loss on foreign exchange ‑ 2
Movement in working capital– Employee benefits
1 370 599
– Trade and other payables 2 028 1 555
– Operating lease liability (484) (234)
(128 318) (97 703)
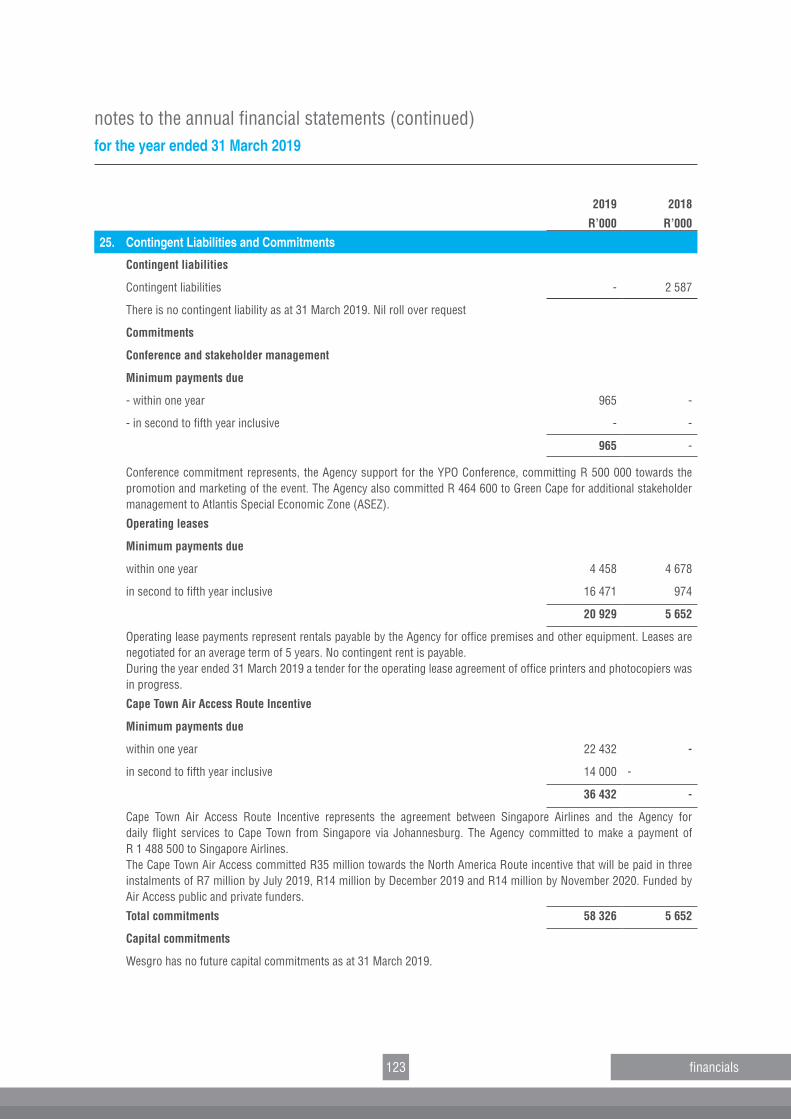
123
notes to the annual financial statements (continued)for the year ended 31 March 2019
financials
2019 2018
R’000 R’000
25. Contingent Liabilities and Commitments
Contingent liabilities
Contingent liabilities ‑ 2 587
There is no contingent liability as at 31 March 2019. Nil roll over request
Commitments
Conference and stakeholder management
Minimum payments due
‑ within one year 965 ‑
‑ in second to fifth year inclusive ‑ ‑
965 ‑
Conference commitment represents, the Agency support for the YPO Conference, committing R 500 000 towards the promotion and marketing of the event. The Agency also committed R 464 600 to Green Cape for additional stakeholder management to Atlantis Special Economic Zone (ASEZ).
Operating leases
Minimum payments due
within one year 4 458 4 678
in second to fifth year inclusive 16 471 974
20 929 5 652
Operating lease payments represent rentals payable by the Agency for office premises and other equipment. Leases are negotiated for an average term of 5 years. No contingent rent is payable.During the year ended 31 March 2019 a tender for the operating lease agreement of office printers and photocopiers was in progress.
Cape Town Air Access Route Incentive
Minimum payments due
within one year 22 432 ‑
in second to fifth year inclusive 14 000 ‑
36 432 ‑
Cape Town Air Access Route Incentive represents the agreement between Singapore Airlines and the Agency for daily flight services to Cape Town from Singapore via Johannesburg. The Agency committed to make a payment of R 1 488 500 to Singapore Airlines.The Cape Town Air Access committed R35 million towards the North America Route incentive that will be paid in three instalments of R7 million by July 2019, R14 million by December 2019 and R14 million by November 2020. Funded by Air Access public and private funders.
Total commitments 58 326 5 652
Capital commitments
Wesgro has no future capital commitments as at 31 March 2019.
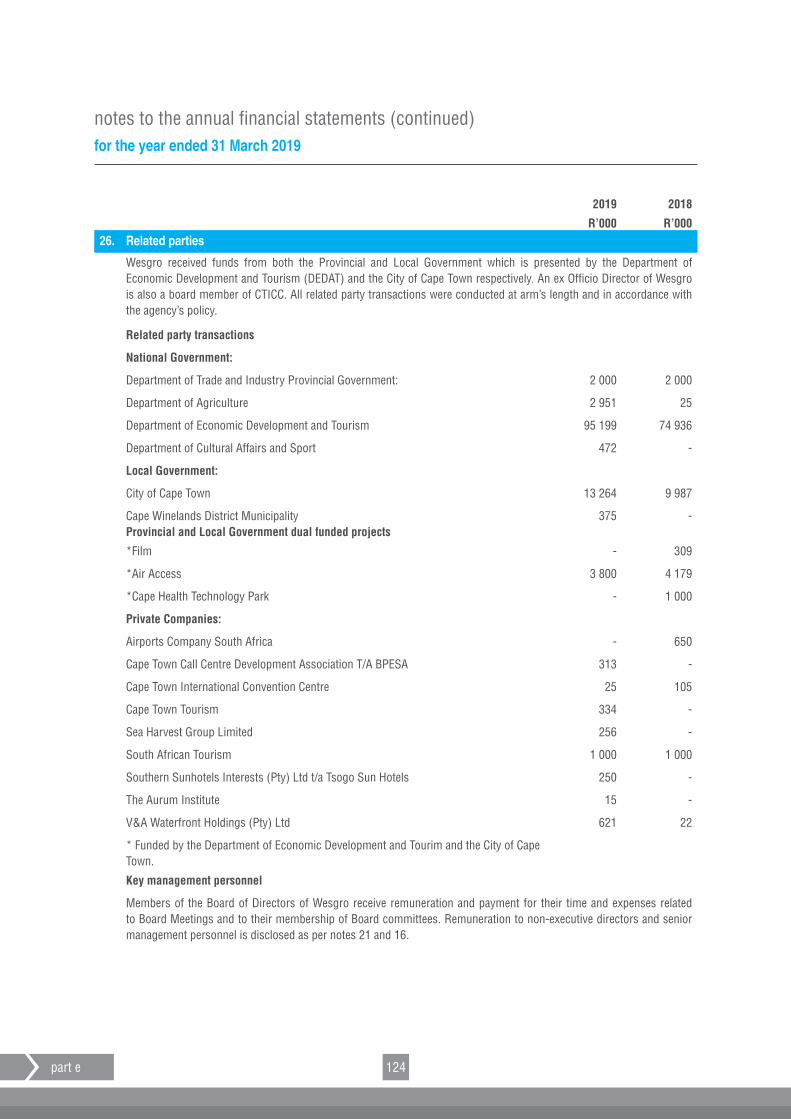
124
notes to the annual financial statements (continued)for the year ended 31 March 2019
part e
2019 2018
R’000 R’00026. Related parties
Wesgro received funds from both the Provincial and Local Government which is presented by the Department of Economic Development and Tourism (DEDAT) and the City of Cape Town respectively. An ex Officio Director of Wesgro is also a board member of CTICC. All related party transactions were conducted at arm’s length and in accordance with the agency’s policy.
Related party transactions
National Government:
Department of Trade and Industry Provincial Government: 2 000 2 000
Department of Agriculture 2 951 25
Department of Economic Development and Tourism 95 199 74 936
Department of Cultural Affairs and Sport 472 ‑
Local Government:
City of Cape Town 13 264 9 987
Cape Winelands District MunicipalityProvincial and Local Government dual funded projects
375 ‑
*Film ‑ 309
*Air Access 3 800 4 179
*Cape Health Technology Park ‑ 1 000
Private Companies:
Airports Company South Africa ‑ 650
Cape Town Call Centre Development Association T/A BPESA 313 ‑
Cape Town International Convention Centre 25 105
Cape Town Tourism 334 ‑
Sea Harvest Group Limited 256 ‑
South African Tourism 1 000 1 000
Southern Sunhotels Interests (Pty) Ltd t/a Tsogo Sun Hotels 250 ‑
The Aurum Institute 15 ‑
V&A Waterfront Holdings (Pty) Ltd 621 22
* Funded by the Department of Economic Development and Tourim and the City of Cape Town.
Key management personnel
Members of the Board of Directors of Wesgro receive remuneration and payment for their time and expenses related to Board Meetings and to their membership of Board committees. Remuneration to non‑executive directors and senior management personnel is disclosed as per notes 21 and 16.
‘000 R‘000
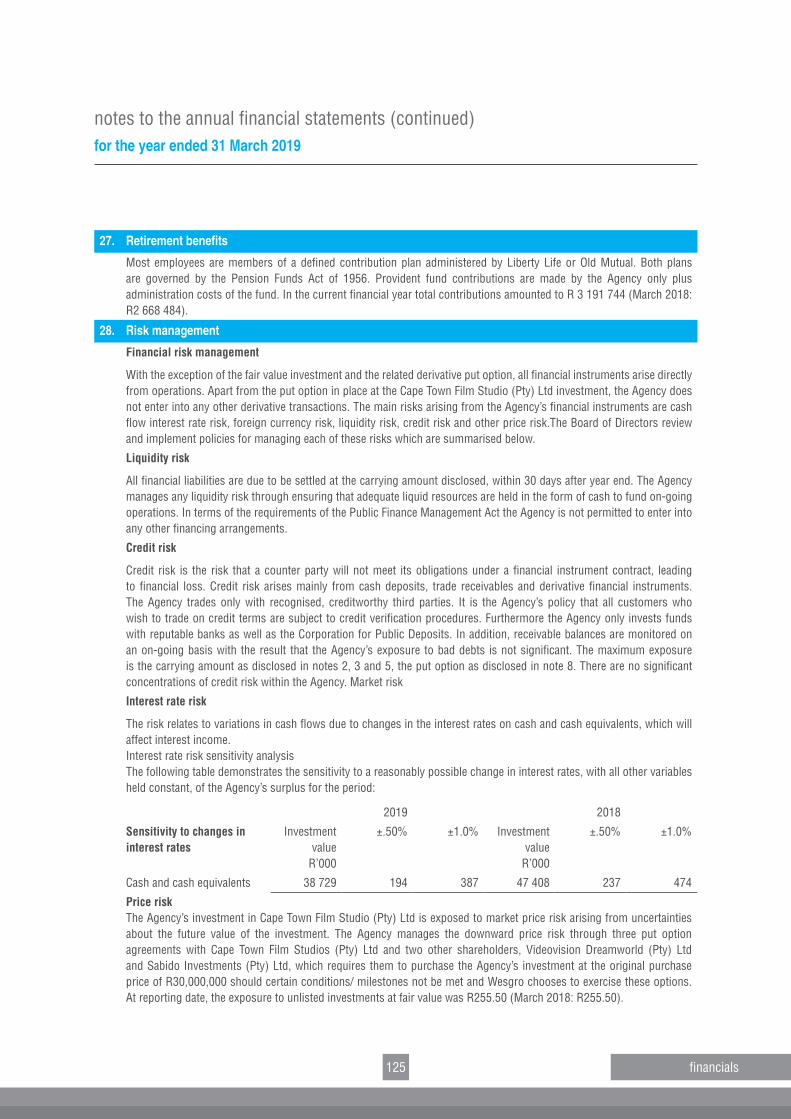
125
notes to the annual financial statements (continued)for the year ended 31 March 2019
financials
27. Retirement benefits
Most employees are members of a defined contribution plan administered by Liberty Life or Old Mutual. Both plans are governed by the Pension Funds Act of 1956. Provident fund contributions are made by the Agency only plus administration costs of the fund. In the current financial year total contributions amounted to R 3 191 744 (March 2018: R2 668 484).
28. Risk management
Financial risk management
With the exception of the fair value investment and the related derivative put option, all financial instruments arise directly from operations. Apart from the put option in place at the Cape Town Film Studio (Pty) Ltd investment, the Agency does not enter into any other derivative transactions. The main risks arising from the Agency’s financial instruments are cash flow interest rate risk, foreign currency risk, liquidity risk, credit risk and other price risk.The Board of Directors review and implement policies for managing each of these risks which are summarised below.
Liquidity risk
All financial liabilities are due to be settled at the carrying amount disclosed, within 30 days after year end. The Agency manages any liquidity risk through ensuring that adequate liquid resources are held in the form of cash to fund on‑going operations. In terms of the requirements of the Public Finance Management Act the Agency is not permitted to enter into any other financing arrangements.
Credit risk
Credit risk is the risk that a counter party will not meet its obligations under a financial instrument contract, leading to financial loss. Credit risk arises mainly from cash deposits, trade receivables and derivative financial instruments. The Agency trades only with recognised, creditworthy third parties. It is the Agency’s policy that all customers who wish to trade on credit terms are subject to credit verification procedures. Furthermore the Agency only invests funds with reputable banks as well as the Corporation for Public Deposits. In addition, receivable balances are monitored on an on‑going basis with the result that the Agency’s exposure to bad debts is not significant. The maximum exposure is the carrying amount as disclosed in notes 2, 3 and 5, the put option as disclosed in note 8. There are no significant concentrations of credit risk within the Agency. Market risk
Interest rate risk
The risk relates to variations in cash flows due to changes in the interest rates on cash and cash equivalents, which will affect interest income. Interest rate risk sensitivity analysisThe following table demonstrates the sensitivity to a reasonably possible change in interest rates, with all other variables held constant, of the Agency’s surplus for the period:
2019 2018
Sensitivity to changes in interest rates
Investment value
R’000
±.50% ±1.0% Investment value
R’000
±.50% ±1.0%
Cash and cash equivalents 38 729 194 387 47 408 237 474
Price riskThe Agency’s investment in Cape Town Film Studio (Pty) Ltd is exposed to market price risk arising from uncertainties about the future value of the investment. The Agency manages the downward price risk through three put option agreements with Cape Town Film Studios (Pty) Ltd and two other shareholders, Videovision Dreamworld (Pty) Ltd and Sabido Investments (Pty) Ltd, which requires them to purchase the Agency’s investment at the original purchase price of R30,000,000 should certain conditions/ milestones not be met and Wesgro chooses to exercise these options. At reporting date, the exposure to unlisted investments at fair value was R255.50 (March 2018: R255.50).
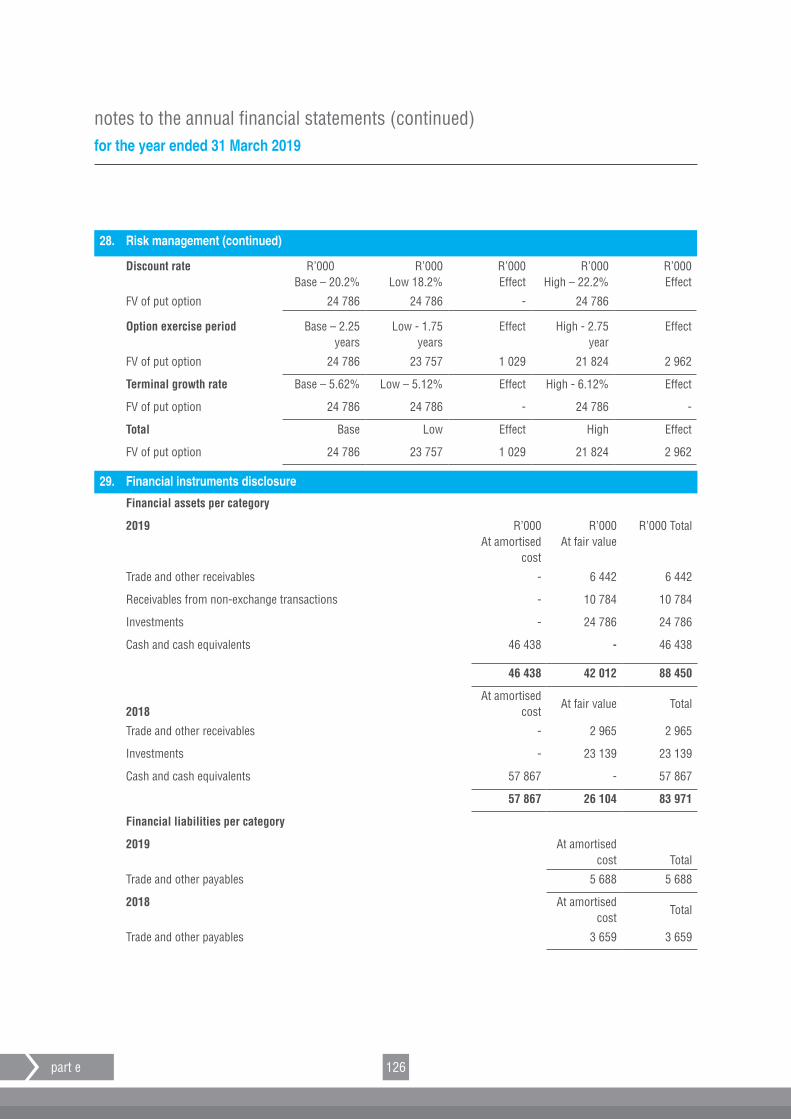
126
notes to the annual financial statements (continued)for the year ended 31 March 2019
part e
28. Risk management (continued)
Discount rate R’000 Base – 20.2%
R’000 Low 18.2%
R’000 Effect
R’000 High – 22.2%
R’000Effect
FV of put option 24 786 24 786 ‑ 24 786
Option exercise period Base – 2.25 years
Low ‑ 1.75 years
Effect High ‑ 2.75 year
Effect
FV of put option 24 786 23 757 1 029 21 824 2 962
Terminal growth rate Base – 5.62% Low – 5.12% Effect High ‑ 6.12% Effect
FV of put option 24 786 24 786 ‑ 24 786 ‑
Total Base Low Effect High Effect
FV of put option 24 786 23 757 1 029 21 824 2 962
29. Financial instruments disclosure
Financial assets per category
2019 R’000At amortised
cost
R’000At fair value
R’000 Total
Trade and other receivables ‑ 6 442 6 442
Receivables from non‑exchange transactions ‑ 10 784 10 784
Investments ‑ 24 786 24 786
Cash and cash equivalents 46 438 ‑ 46 438
46 438 42 012 88 450
2018At amortised
costAt fair value Total
Trade and other receivables ‑ 2 965 2 965
Investments ‑ 23 139 23 139
Cash and cash equivalents 57 867 ‑ 57 867
57 867 26 104 83 971
Financial liabilities per category
2019 At amortised cost Total
Trade and other payables 5 688 5 688
2018 At amortised cost
Total
Trade and other payables 3 659 3 659
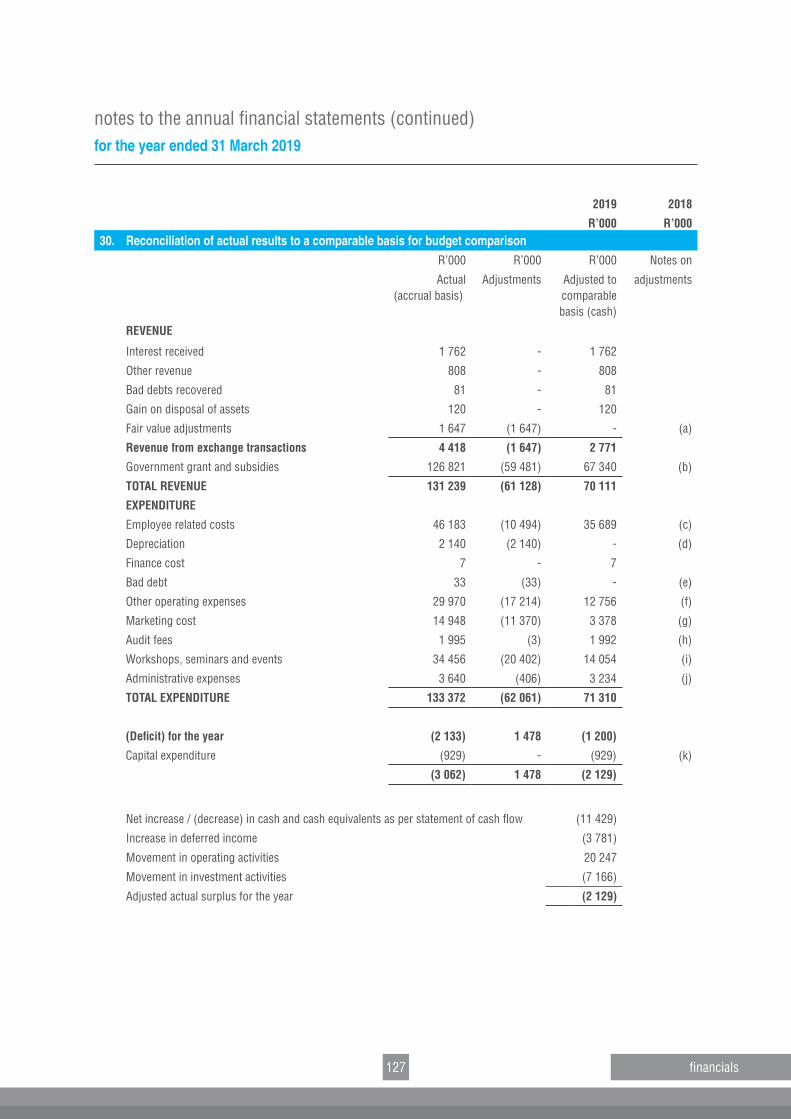
127
notes to the annual financial statements (continued)for the year ended 31 March 2019
financials
2019 2018
R’000 R’00030. Reconciliation of actual results to a comparable basis for budget comparison
R’000 R’000 R’000 Notes on
Actual(accrual basis)
Adjustments Adjusted to comparable basis (cash)
adjustments
REVENUE
Interest received 1 762 ‑ 1 762
Other revenue 808 ‑ 808
Bad debts recovered 81 ‑ 81
Gain on disposal of assets 120 ‑ 120
Fair value adjustments 1 647 (1 647) ‑ (a)
Revenue from exchange transactions 4 418 (1 647) 2 771
Government grant and subsidies 126 821 (59 481) 67 340 (b)
TOTAL REVENUE 131 239 (61 128) 70 111
EXPENDITURE
Employee related costs 46 183 (10 494) 35 689 (c)
Depreciation 2 140 (2 140) ‑ (d)
Finance cost 7 ‑ 7
Bad debt 33 (33) ‑ (e)
Other operating expenses 29 970 (17 214) 12 756 (f)
Marketing cost 14 948 (11 370) 3 378 (g)
Audit fees 1 995 (3) 1 992 (h)
Workshops, seminars and events 34 456 (20 402) 14 054 (i)
Administrative expenses 3 640 (406) 3 234 (j)
TOTAL EXPENDITURE 133 372 (62 061) 71 310
(Deficit) for the year (2 133) 1 478 (1 200)
Capital expenditure (929) ‑ (929) (k)
(3 062) 1 478 (2 129)
Net increase / (decrease) in cash and cash equivalents as per statement of cash flow (11 429)
Increase in deferred income (3 781)
Movement in operating activities 20 247
Movement in investment activities (7 166)
Adjusted actual surplus for the year (2 129)
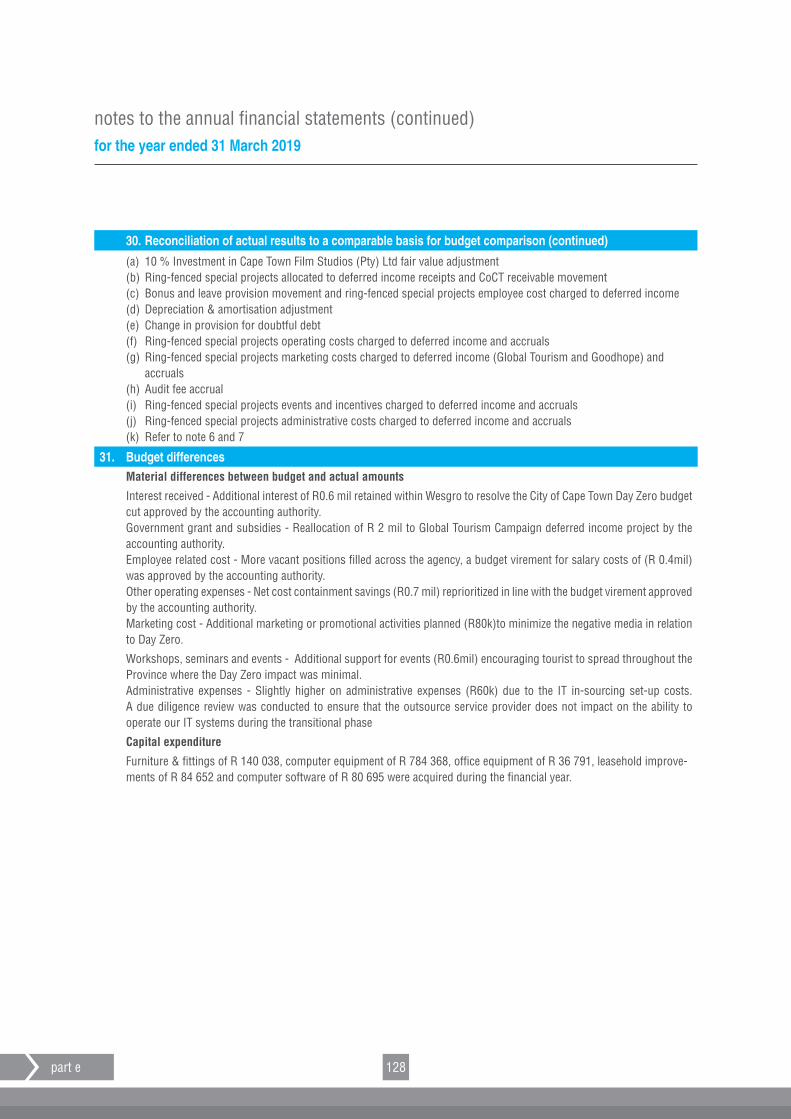
128
notes to the annual financial statements (continued)for the year ended 31 March 2019
part e
(a) 10 % Investment in Cape Town Film Studios (Pty) Ltd fair value adjustment(b) Ring‑fenced special projects allocated to deferred income receipts and CoCT receivable movement(c) Bonus and leave provision movement and ring‑fenced special projects employee cost charged to deferred income(d) Depreciation & amortisation adjustment(e) Change in provision for doubtful debt(f) Ring‑fenced special projects operating costs charged to deferred income and accruals(g) Ring‑fenced special projects marketing costs charged to deferred income (Global Tourism and Goodhope) and
accruals(h) Audit fee accrual(i) Ring‑fenced special projects events and incentives charged to deferred income and accruals(j) Ring‑fenced special projects administrative costs charged to deferred income and accruals(k) Refer to note 6 and 7
31. Budget differencesMaterial differences between budget and actual amounts
Interest received ‑ Additional interest of R0.6 mil retained within Wesgro to resolve the City of Cape Town Day Zero budget cut approved by the accounting authority. Government grant and subsidies ‑ Reallocation of R 2 mil to Global Tourism Campaign deferred income project by the accounting authority.Employee related cost ‑ More vacant positions filled across the agency, a budget virement for salary costs of (R 0.4mil) was approved by the accounting authority.Other operating expenses ‑ Net cost containment savings (R0.7 mil) reprioritized in line with the budget virement approved by the accounting authority.Marketing cost ‑ Additional marketing or promotional activities planned (R80k)to minimize the negative media in relation to Day Zero.
Workshops, seminars and events ‑ Additional support for events (R0.6mil) encouraging tourist to spread throughout the Province where the Day Zero impact was minimal.Administrative expenses ‑ Slightly higher on administrative expenses (R60k) due to the IT in‑sourcing set‑up costs. A due diligence review was conducted to ensure that the outsource service provider does not impact on the ability to operate our IT systems during the transitional phase
Capital expenditure
Furniture & fittings of R 140 038, computer equipment of R 784 368, office equipment of R 36 791, leasehold improve‑ments of R 84 652 and computer software of R 80 695 were acquired during the financial year.
30. Reconciliation of actual results to a comparable basis for budget comparison (continued)
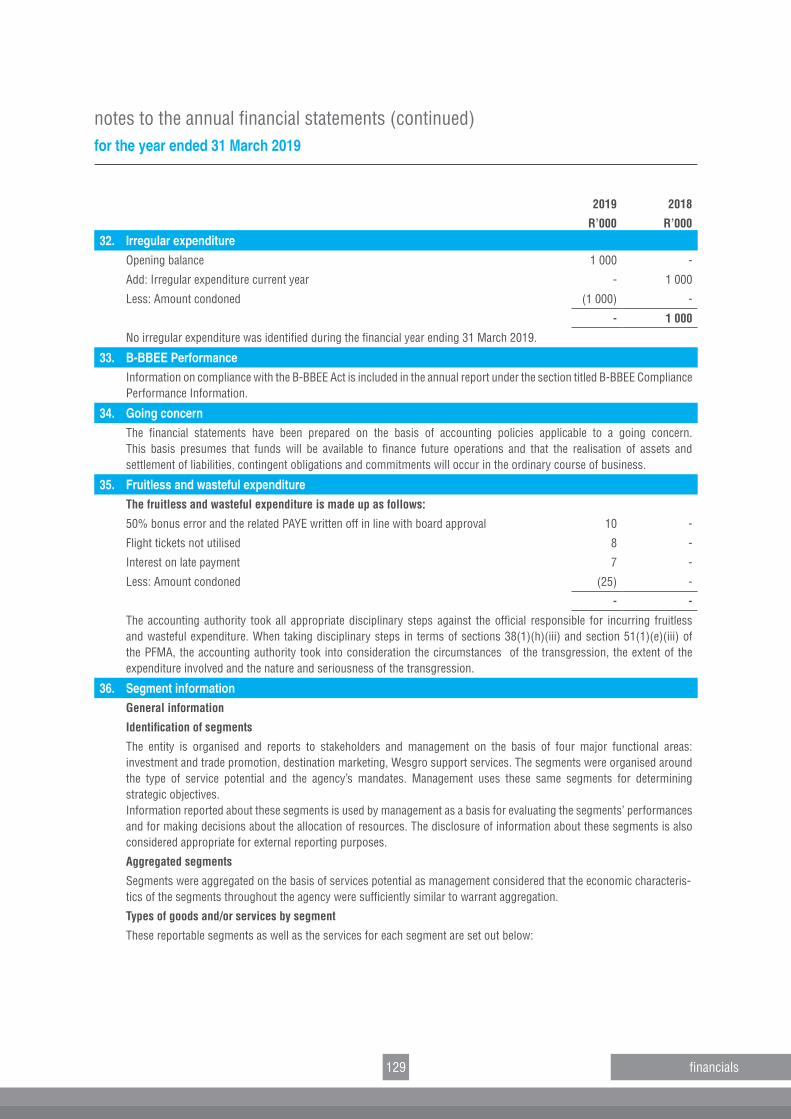
129
notes to the annual financial statements (continued)for the year ended 31 March 2019
financials
2019 2018
R’000 R’00032. Irregular expenditure
Opening balance 1 000 ‑
Add: Irregular expenditure current year ‑ 1 000
Less: Amount condoned (1 000) ‑
‑ 1 000
No irregular expenditure was identified during the financial year ending 31 March 2019.
33. B-BBEE PerformanceInformation on compliance with the B‑BBEE Act is included in the annual report under the section titled B‑BBEE Compliance Performance Information.
34. Going concernThe financial statements have been prepared on the basis of accounting policies applicable to a going concern. This basis presumes that funds will be available to finance future operations and that the realisation of assets and settlement of liabilities, contingent obligations and commitments will occur in the ordinary course of business.
35. Fruitless and wasteful expenditureThe fruitless and wasteful expenditure is made up as follows:
50% bonus error and the related PAYE written off in line with board approval 10 ‑
Flight tickets not utilised 8 ‑
Interest on late payment 7 ‑
Less: Amount condoned (25) ‑
‑ ‑
The accounting authority took all appropriate disciplinary steps against the official responsible for incurring fruitless and wasteful expenditure. When taking disciplinary steps in terms of sections 38(1)(h)(iii) and section 51(1)(e)(iii) of the PFMA, the accounting authority took into consideration the circumstances of the transgression, the extent of the expenditure involved and the nature and seriousness of the transgression.
36. Segment informationGeneral information
Identification of segments
The entity is organised and reports to stakeholders and management on the basis of four major functional areas: investment and trade promotion, destination marketing, Wesgro support services. The segments were organised around the type of service potential and the agency’s mandates. Management uses these same segments for determining strategic objectives.Information reported about these segments is used by management as a basis for evaluating the segments’ performances and for making decisions about the allocation of resources. The disclosure of information about these segments is also considered appropriate for external reporting purposes.
Aggregated segments
Segments were aggregated on the basis of services potential as management considered that the economic characteris‑tics of the segments throughout the agency were sufficiently similar to warrant aggregation.
Types of goods and/or services by segment
These reportable segments as well as the services for each segment are set out below:
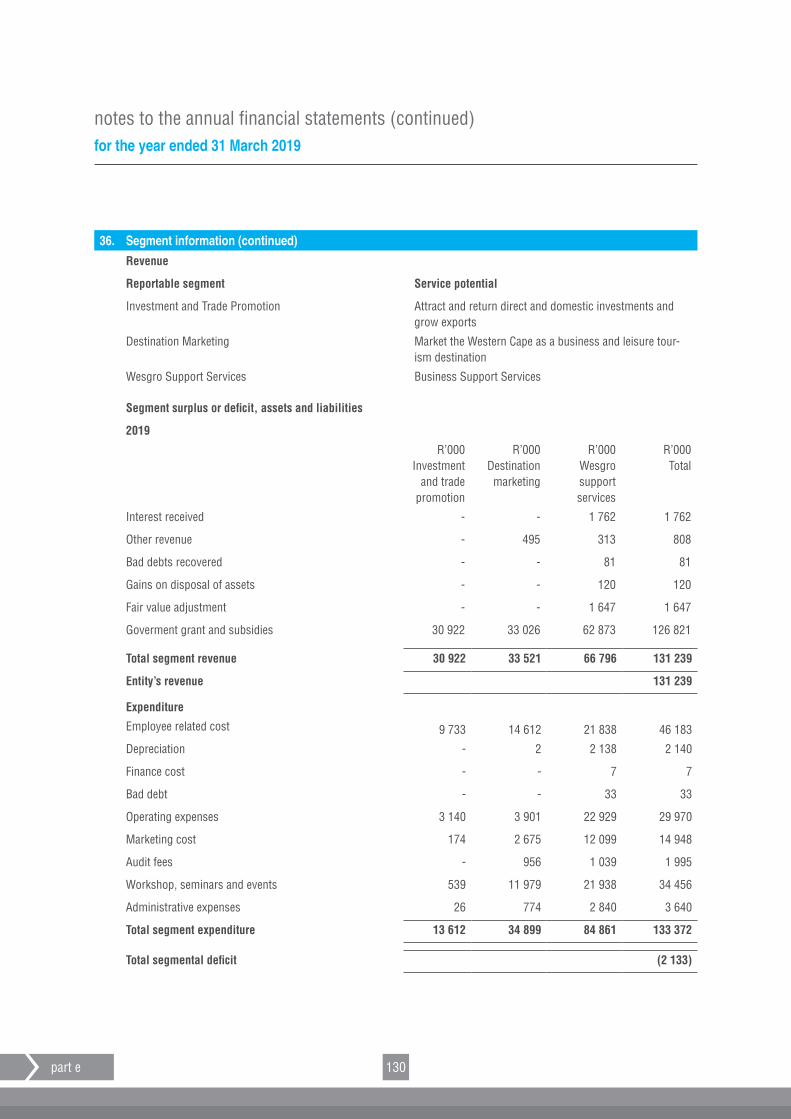
130
notes to the annual financial statements (continued)for the year ended 31 March 2019
part e
Revenue
Reportable segment Service potential
Investment and Trade Promotion Attract and return direct and domestic investments and grow exports
Destination Marketing Market the Western Cape as a business and leisure tour‑ism destination
Wesgro Support Services Business Support Services
Segment surplus or deficit, assets and liabilities
2019
R’000Investment
and trade promotion
R’000Destination marketing
R’000Wesgro support services
R’000 Total
Interest received ‑ ‑ 1 762 1 762
Other revenue ‑ 495 313 808
Bad debts recovered ‑ ‑ 81 81
Gains on disposal of assets ‑ ‑ 120 120
Fair value adjustment ‑ ‑ 1 647 1 647
Goverment grant and subsidies 30 922 33 026 62 873 126 821
Total segment revenue 30 922 33 521 66 796 131 239
Entity’s revenue 131 239
Expenditure
Employee related cost 9 733 14 612 21 838 46 183
Depreciation ‑ 2 2 138 2 140
Finance cost ‑ ‑ 7 7
Bad debt ‑ ‑ 33 33
Operating expenses 3 140 3 901 22 929 29 970
Marketing cost 174 2 675 12 099 14 948
Audit fees ‑ 956 1 039 1 995
Workshop, seminars and events 539 11 979 21 938 34 456
Administrative expenses 26 774 2 840 3 640
Total segment expenditure 13 612 34 899 84 861 133 372
Total segmental deficit (2 133)
36. Segment information (continued)
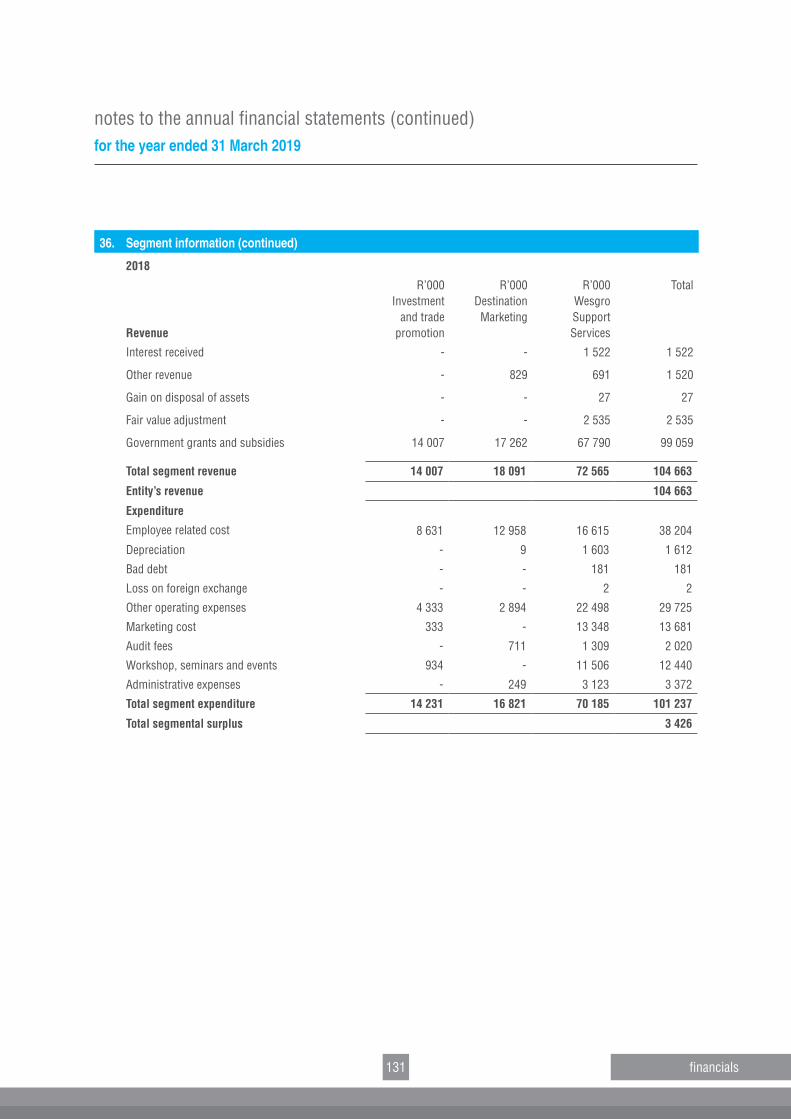
131
notes to the annual financial statements (continued)for the year ended 31 March 2019
financials
36. Segment information (continued)
2018
Revenue
R’000Investment
and trade promotion
R’000DestinationMarketing
R’000WesgroSupportServices
Total
Interest received ‑ ‑ 1 522 1 522
Other revenue ‑ 829 691 1 520
Gain on disposal of assets ‑ ‑ 27 27
Fair value adjustment ‑ ‑ 2 535 2 535
Government grants and subsidies 14 007 17 262 67 790 99 059
Total segment revenue 14 007 18 091 72 565 104 663
Entity’s revenue 104 663
Expenditure
Employee related cost 8 631 12 958 16 615 38 204
Depreciation ‑ 9 1 603 1 612
Bad debt ‑ ‑ 181 181
Loss on foreign exchange ‑ ‑ 2 2
Other operating expenses 4 333 2 894 22 498 29 725
Marketing cost 333 ‑ 13 348 13 681
Audit fees ‑ 711 1 309 2 020
Workshop, seminars and events 934 ‑ 11 506 12 440
Administrative expenses ‑ 249 3 123 3 372
Total segment expenditure 14 231 16 821 70 185 101 237
Total segmental surplus 3 426
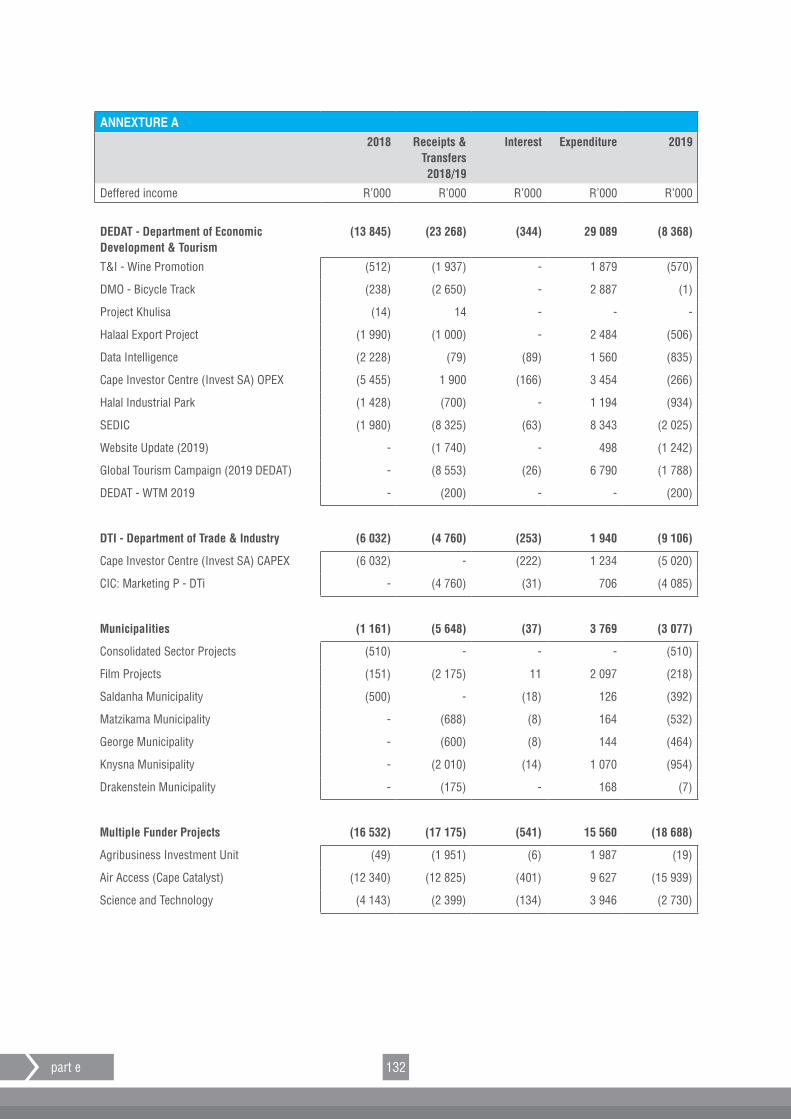
132part e
ANNEXTURE A2018 Receipts &
Transfers 2018/19
Interest Expenditure 2019
Deffered income R’000 R’000 R’000 R’000 R’000
DEDAT ‑ Department of Economic Development & Tourism
(13 845) (23 268) (344) 29 089 (8 368)
T&I ‑ Wine Promotion (512) (1 937) ‑ 1 879 (570)
DMO ‑ Bicycle Track (238) (2 650) ‑ 2 887 (1)
Project Khulisa (14) 14 ‑ ‑ ‑
Halaal Export Project (1 990) (1 000) ‑ 2 484 (506)
Data Intelligence (2 228) (79) (89) 1 560 (835)
Cape Investor Centre (Invest SA) OPEX (5 455) 1 900 (166) 3 454 (266)
Halal Industrial Park (1 428) (700) ‑ 1 194 (934)
SEDIC (1 980) (8 325) (63) 8 343 (2 025)
Website Update (2019) ‑ (1 740) ‑ 498 (1 242)
Global Tourism Campaign (2019 DEDAT) ‑ (8 553) (26) 6 790 (1 788)
DEDAT ‑ WTM 2019 ‑ (200) ‑ ‑ (200)
DTI ‑ Department of Trade & Industry (6 032) (4 760) (253) 1 940 (9 106)
Cape Investor Centre (Invest SA) CAPEX (6 032) ‑ (222) 1 234 (5 020)
CIC: Marketing P ‑ DTi ‑ (4 760) (31) 706 (4 085)
Municipalities (1 161) (5 648) (37) 3 769 (3 077)
Consolidated Sector Projects (510) ‑ ‑ ‑ (510)
Film Projects (151) (2 175) 11 2 097 (218)
Saldanha Municipality (500) ‑ (18) 126 (392)
Matzikama Municipality ‑ (688) (8) 164 (532)
George Municipality ‑ (600) (8) 144 (464)
Knysna Munisipality ‑ (2 010) (14) 1 070 (954)
Drakenstein Municipality ‑ (175) ‑ 168 (7)
Multiple Funder Projects (16 532) (17 175) (541) 15 560 (18 688)
Agribusiness Investment Unit (49) (1 951) (6) 1 987 (19)
Air Access (Cape Catalyst) (12 340) (12 825) (401) 9 627 (15 939)
Science and Technology (4 143) (2 399) (134) 3 946 (2 730)
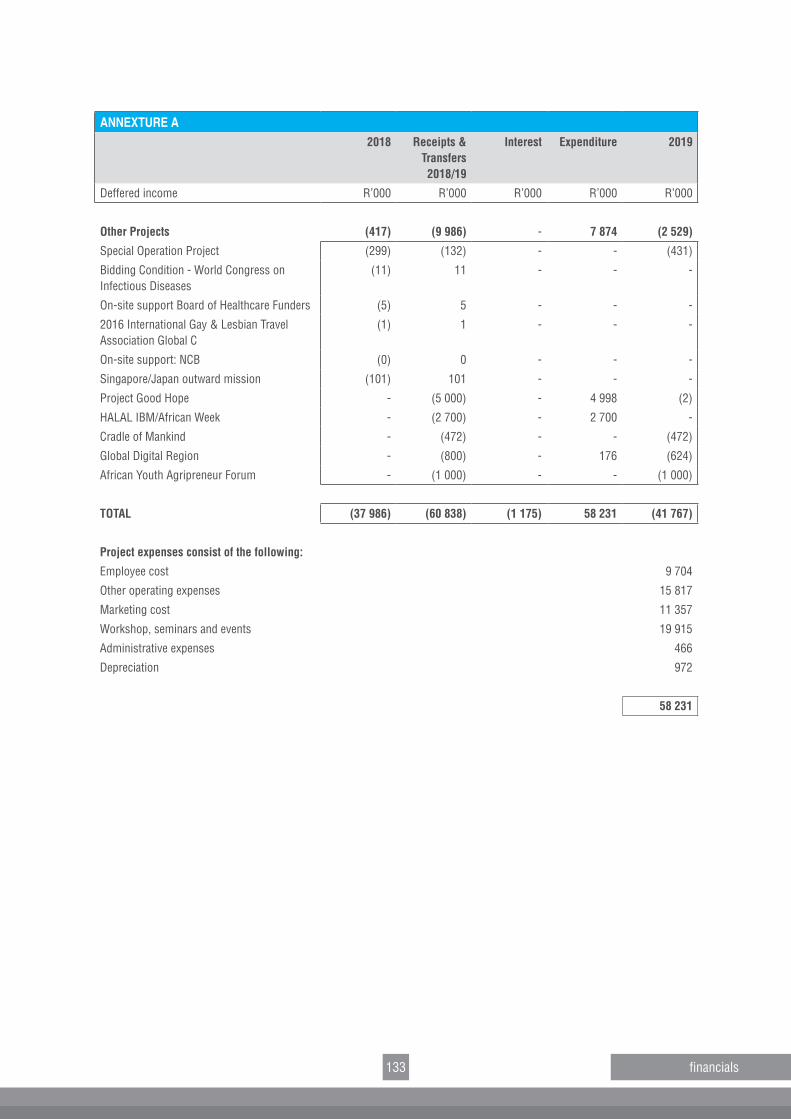
133 financials
ANNEXTURE A2018 Receipts &
Transfers 2018/19
Interest Expenditure 2019
Deffered income R’000 R’000 R’000 R’000 R’000
Other Projects (417) (9 986) ‑ 7 874 (2 529)
Special Operation Project (299) (132) ‑ ‑ (431)
Bidding Condition ‑ World Congress on Infectious Diseases
(11) 11 ‑ ‑ ‑
On‑site support Board of Healthcare Funders (5) 5 ‑ ‑ ‑
2016 International Gay & Lesbian Travel Association Global C
(1) 1 ‑ ‑ ‑
On‑site support: NCB (0) 0 ‑ ‑ ‑
Singapore/Japan outward mission (101) 101 ‑ ‑ ‑
Project Good Hope ‑ (5 000) ‑ 4 998 (2)
HALAL IBM/African Week ‑ (2 700) ‑ 2 700 ‑
Cradle of Mankind ‑ (472) ‑ ‑ (472)
Global Digital Region ‑ (800) ‑ 176 (624)
African Youth Agripreneur Forum ‑ (1 000) ‑ ‑ (1 000)
TOTAL (37 986) (60 838) (1 175) 58 231 (41 767)
Project expenses consist of the following:
Employee cost 9 704
Other operating expenses 15 817
Marketing cost 11 357
Workshop, seminars and events 19 915
Administrative expenses 466
Depreciation 972
58 231

an inspiring place to do business18th floor, reserve bank building | 60 st georges mall, cape town 8001 | p.o. box 1678 cape town 8000 south africa tel: +27 21 487 8600 | e‑mail: [email protected] | website: wesgro.co.za
PR175/2019 | 978‑0‑621‑47448‑0