Embed Size (px)
Citation preview

Annual Report & Accounts 2011-12
Bulk Jetty at Port of Sohar, Oman
LNG Jetty, Kochi
Barakhamba Underground Metro Station, Delhi
Rohtang Pass Tunnel , Manali
ICPR Platform

AFCONS INFRASTRUCTURE LIMITEDA Shapoorji Pallonji Group Company
Mission“ To be a prominent
transnational infrastructure company recognized for business innovations,
focused on total satisfaction and enhanced value creation
for all its stakeholders ”

1
AFCONS INFRASTRUCTURE LIMITEDAFCONS INFRASTRUCTURE LIMITED
CONTENTS
Page Nos.
Directors’ Report 2
Management Discussion Analysis 6
Corporate Governance Report 9
Auditors’ Report 15
Financials 18
Ten Year Financial Highlights 52
Consolidated Financial Statements 53
Financial Information of Subsidiary Companies 84
BOARD OF DIRECTORS
S. P. Mistry - Chairman
N. J. Jhaveri
N. D. Khurody
J. J. Parakh
P. N. Kapadia
B. D. Narang
R. M. Premkumar
U. N. Khanna
K. Subrahmanian - Managing Director
S. Paramasivan - Dy. Managing Director
Audit Committee MembersN. J. Jhaveri - Chairman
J. J. Parakh
P. N. Kapadia
N. D. Khurody
B. D. Narang
COMPANY SECRETARYP. R. Rajendran
AUDITORSDeloitte Haskins & Sells, Chartered Accountants
J. C. Bhatt & Associates, Chartered Accountants
REGISTRARS & SHARE TRANSFER AGENTCameo Corporate Service Limited Subramanian Building,1 Club House Road, Chennai-600002Tel.no.: 044-28460390Fax no.: 044-28460129 Email id.: [email protected]
REGISTERED OFFICE“AFCONS HOUSE”16, Shah Industrial Estate, Veera Desai Road, Azad Nagar P.O.Andheri (West)Mumbai- 400 053
Thirty-Sixth Annual General Meeting on 2 8 t h S e p t e m b e r, 2 0 1 2 a t 4 . 3 0 p . m . at “Afcons House”, 16, Shah Industrial Estate, Veera Desai Road, Andheri (West), Mumbai- 400 053
BANKERS
State Bank of India
UCO Bank
Oriental Bank of Commerce
Axis Bank Ltd.
Bank of India
Dena Bank
BNP Paribas
ING Vysya Bank Ltd.
ICICI Bank Ltd.
Union Bank of India
IDBI Bank Ltd.
Standard Chartered Bank
Yes Bank Ltd.

2
AFCONS INFRASTRUCTURE LIMITEDAFCONS INFRASTRUCTURE LIMITEDDIRECTORS’ REPORTDear Shareholders,Your Directors are pleased to present the Thirty-Sixth Annual Report together with the Audited statement of accounts for the year ended 31st March 2012.1. CONSOLIDATED FINANCIAL RESULTS
(R in Lacs)Particulars 31st March 2012 31st March 2011Total Income 255,192 2,89,548Profi t/(Loss) before Tax 15,056 15,135Provision for Taxation (6,086) (3,207)Excess/(short) provision for tax in respect of earlier years (156) (31)Profi t/(Loss) after Tax 8,814 11,897Minority Interest 639 (18)Balance brought forward from previous years 29,802 17,927Appropriation (11) (4)Balance Carried Forward to Balance Sheet 39,244 29,802
2. OPERATIONS Your Company has achieved total income of R 2,551.92 crores for the year compared to the previous year’s R 2,895.48 crores showing a decrease
of 11.87%.The EBIDTA for the year was R 278.57 crores compared to R 251.53 crores in the previous year resulting in increase by 10.75%.The Consolidated Profi t before Tax for the year was R150.56 crores compared to R 151.35 crores in the previous year resulting in a marginal decrease of 0.52%.The Consolidated Profi t after Tax for the year was R 88.14 crores compared to R 118.97crores in the previous year resulting in decrease by 25.91%.
This year’s decline in top line was mainly due to delay in release of work fronts and technical clearances by the Client for execution of some of the projects leading to Company achieving less than the envisaged progress for these projects. This decline is an aberration and your Company is confi dent of overcoming this in the current year. However, overall market has witnessed a huge slowdown.
With a respectable order book of above R 7,500 crores all throughout FY11-12, it was a well thought strategy to go slow on order procurement (in domestic market), as the market was desperate because of limited available projects.
Due to weak domestic environment, the Company is looking at overseas market in a big way. Over the last 3 years the Company had a sustained revenue share of more than 30% from overseas markets, and the strategy is to increase it to 40% and beyond over the next 2 years, through consolidation of its forays into Middle East and Africa.
During the year under review, the following major works were completed: 1. Construction of A1 Berth at Jamnagar for Reliance Ports & Terminal Ltd, India. 2. Design and supply of fabricated structural steel for Algeria Fertilizer Jetty for Saipem S.A. Energies, France. 3. Construction of Grade Separator at crossing of Road No.56 and G.T.Road near Apsara Border, Delhi for PWD- Delhi, India. 4. Construction of port Sohar–Bulk Jetty for Sohar International Development Company, Oman in Joint Venture with Saipem. 5. Civil Works for two LNG Storage Tanks at Kochi for IHI Corporation, Japan. 6. Civil and erection works forming part of DSO Phase of Iron ore mining for Arcelor Mittal Liberia Ltd.,Liberia. 7. Construction of 3 Level Grade Separator at crossing of NH24 and Road No.56 at Ghazipur on NH-24, Delhi for PWD-Delhi, India.
During the year under review, the Company has secured the following major contracts:
1. Construction of 7 span bridge with 2 lanes carriageway and Underpass with 3 lanes on each side at the Mina Salman Junction Interchange and its associated slip roads for Ministry of Works, Govt. of the Kingdom of Bahrain for BD 24,205,500 (approx. R 29,050 Lacs).
2. Civil & Structural Steel Works of Polypropylene plant of ONGC Petro Additions Limited (OPAL) at Dahej SEZ, Gujarat for Technimont ICB, Mumbai for R 4,830 Lacs.
3. Civil & Structural Steel Works of LLDPE/HDPE (Swing) Plant of ONGC Petro Additions Limited (OPAL) at Dahej SEZ, Gujarat for Technimont ICB, Mumbai for R 7,982 Lacs.
4. Construction of viaduct including related works for 5.16 km length excluding station areas from CH.12570.00 to CH.18630.00 between Nicco Park to CBD-1 in Newgaria–Airport Corridor of Kolkata Metro Railway Line for Rail Vikas Nigam Limited, Kolkata for R 21,254 Lacs.
5. Construction of viaduct including related works for 5.756 km length excluding station areas from CH. 247.00 to CH. 6400.00 between Kavi Subhash (Newgaria) to VIP Bazar in Newgaria–Airport corridor of Kolkata Metro Rail Line for Rail Vikas Nigam Limited, Kolkata for R 23,360 Lacs.
6. Construction Works for Expansion of Vaporization plant of Shell Hazira LNG terminal for Saipem India Projects, Chennai for R 890 Lacs.
3. CREDIT RATING
During the year, CRISIL has reaffi rmed our Long Term Rating of “AA/Stable” which refl ects high safety and short term rating of “A1+” which refl ects highest safety.
ICRA has reaffi rmed the long term rating of “AA/Stable” which signifi es high credit quality and short term rating of “A1+” which refl ects highest credit quality.
Dun & Bradstreet has reaffi rmed rating of “5A2” which signifi es the overall status of the Company is good.

3
AFCONS INFRASTRUCTURE LIMITED4. DIVIDEND The Directors recommend dividend of 0.01% on Convertible Preference Shares of the Company. The dividend, if declared, would involve an outfl ow
of R 4.06 Lacs including R 0.57 Lacs towards dividend tax. In order to plough back the profi t for the growth, the Directors are not proposing dividend on equity shares.
5. SHARE CAPITAL During the year under review, company has allotted 130,770 equity shares to the employees who exercised ESOP option granted to them under the
ESOP Scheme 2006.
6. SUBSIDIARIES i) During the year, the Company has incorporated a subsidiary in Kuwait in the name of Afcons Infrastructures Kuwait for Building, Road & Marine
Contracting WLL. ii) The Consolidated fi nancial statement presented by the Company includes fi nancial statement of the subsidiaries prepared in accordance with
the applicable accounting standards.
iii) Pursuant to the provision of section 212(8) of the Companies Act,1956, the Ministry of Corporate Affairs vide its general circular no. 02/2011 dated 8th February,2011 and circular no.03/2011 dated 21st February, 2011 has granted general exemption from attaching balance sheet, statement of profi t and loss and other documents of the subsidiaries, subject to fulfi lment of conditions stated in the circular. Accordingly, the Balance Sheet, Profi t and Loss account and other documents of the subsidiary companies are not being attached with the Balance sheet of the Company. A statement containing brief fi nancial details of the Company’s subsidiaries for the fi nancial year ended 31st March,2012 is included in the Annual Report.The Company will make available the Annual Accounts of the subsidiary companies and the related detailed information to any member of the Company who may be interested in obtaining the same.The annual accounts of the subsidiary companies will also be kept open for inspection by the members at the registered Offi ce of the Company and that of the respective subsidiary companies on any working day during business hours.
iv) There has been no material change in the nature of business of the subsidiaries.
7. CORPORATE GOVERNANCE Your Company, being a value driven organization, believes in coherent and self-regulatory approach in the conduct of its business to achieve the
highest levels of good corporate governance practices. Therefore the Company in the interest of the Stakeholders voluntarily complies with the requirements of Corporate Governance. A Report on Corporate Governance is attached separately to this Annual Report.
8. MANAGEMENT DISCUSSION AND ANALYSIS REPORT The Management Discussion and Analysis Report for the year under review, is presented in as a separate section which forms part of the Annual Report.
9. DIRECTORS i) Mr.P.S.Mistry, Mr.C.P.Mistry and Mr.A.H.Divanji resigned as Directors of the Company with effect from 6th February 2012, 31st March 2012
and 20th July 2012 respectively. The Board wishes to place on record their sincere appreciation of the valuable contribution of Mr.P.S.Mistry, Mr.C.P.Mistry and Mr.A.H.Divanji to the growth and success of the Company.
ii) Mr.C.P.Mistry stepped down as Chairman of the Company with effect from 23rd March 2012 and Mr.S.P.Mistry was appointed as the Chairman by the Company with effect from that date.
iii) Mr.S.Paramsivan, Whole-time Director of the Company was promoted as Dy.Managing Director of the Company with effect from 1st April 2012. v) Mr.Umesh Khanna was appointed as Director with effect from 22nd August 2012 to fi ll the casual vacancy caused by the resignation of
Mr.A.H.Divanji. vi) Mr.S.P.Mistry, Mr.N.J.Jhaveri and Mr.K.Subrahmanian, Directors of the Company retire by rotation at the ensuing Annual General Meeting of the
Company and being eligible offer themselves for re-appointment. The brief profi le of the Mr.S.P.Mistry, Mr.N.J.Jhaveri and Mr.K.Subrahmanian is annexed to the Notice of the Meeting.
10. DIRECTOR’S RESPONSIBILITY STATEMENT Pursuant to the requirement under Section 217(2AA) of the Companies Act, 1956 with respect to the Directors Responsibility Statement, it is hereby
confi rmed that: (i) in preparation of the annual accounts, the applicable accounting standards have been followed along with a proper explanation relating to any
material departures from the same; (ii) the Directors have selected such accounting policies, applied them consistently, and made judgement and estimates that are reasonable and
prudent so as to give a true and fair view of the state of affairs of the Company as at 31st March 2012 and of the profi t or loss of the Company for the year ended on that date;
(iii) the Directors have taken proper and suffi cient care for the maintenance of adequate accounting records in accordance with the provisions of the Companies Act, 1956 for safeguarding the asset of the Company and for preventing and detecting fraud and other irregularities; and
(iv) the Directors have prepared the annual accounts on a going concern basis.
11. QUALITY, HEALTH, SAFETY & ENVIRONMENT The Company fi rmly believes that the pursuit of excellence is one of the most critical component for a competitive success. With Quality, Health and
Safety Environment being an essential part of the Company’s policy, it strives to deliver services by maintaining the highest level of Quality, Health and Safe working environment.
The policy of the Company is to conduct its construction business through an established Quality Management System, which aims to achieve Customer Satisfaction and in the process improving Company’s competencies and competitiveness.

4
AFCONS INFRASTRUCTURE LIMITED
The Company is certifi ed ISO 9001:2008 for Quality Management System, ISO:14001:2004 for Environment Management System and OHSAS:18001:2007 for Occupation, Health & Safety Management Systems. All the three systems are well established, documented, implemented and maintained.
The Company has a commendable record in terms of safety at our various projects sites and has received awards as well as appreciation letters from our clients, some of which are given below:
● Adani Hazira Port Pvt.Ltd. has issued safety certifi cate for implementation of fairly high safety standards during construction of 2 no of Container Jetty at Hazira during the year 2011-12.
● SP Jammu Udhampur Highway Pvt. Ltd. has issued Appreciation letter to Jammu site for successfully achieving 1 million man hours without lost time accident.
● M/s.IHI Corporation, Japan has issued Best Safety Performer award to LNG site at Kochi with for completing 9 million safety man hours. ● Royal Haskoning has issued Appreciation letter to Aqaba Jordon site on successfully achieving 2 million man hours without lost time accident. ● SNC-Lavalin and Arcelor Mittal has issued Appreciation letter to Liberia Project Site for achieving impeccable milestone of 1.5 million man hours
without lost time injury. ● General Consultant of Chennai Metro Rail Project has issued highest Occupational Health & Safety Performance Certifi cate’s to Transtonnelstroy
– AFCONS JV Project. These milestones are the refl ection of the strict HSE standards followed at the worksite and commitment of AFCONS management towards safety.
12. AWARDS AND RECOGNITIONS i) During the year, the Company received the following awards: ● CIDC Vishwakarma Award 2012 from Construction Industries Development Council for best project award in the category Transportation,
Infrastructure, Power Housing and Urban Development for the Grade Separator Project at Apsara Border, Delhi. ● EPC World Awards 2011 in the category of Outstanding Contribution in Roads & Highways for the 3 Level grade separator project at Ghazipur,
Delhi. ● D&B Axis Bank Infra Awards 2011 in the Railways category for the Vallarpadam Rail bridge project. ● Construction Week Awards 2011 in the Roads and Highway section for the 3 Level grade separator projects at Ghazipur, Delhi. ii) Our Mukarba Chowk project at Delhi received a Commemorative Trophy & Certifi cate and the 3 Level grade separator projects at Ghazipur,
Delhi received Commemorative Medal & Certifi cate. The Company has also been listed among the Top Ten Most Admired Companies for the Sixth year in succession by the Construction World. All these proud achievements are the result of the hard work put in by the entire team of the Company.
13. AUDITORS M/s.Deloitte Haskins & Sells, Chartered Accountants(ICAI Registration no.117366W) and M/s.J.C.Bhatt & Associates, Chartered Accountants(ICAI
Registration no.130923W), the joint statutory auditors of the Company retiring at the ensuing Annual General Meeting and are eligible for re-appointment. As per the provision of section 224(1B) of the Companies Act,1956, the Company has received certifi cate from the Auditors to the effect that their re-appointment, if made, would be in conformity with the limits specifi ed in the said section.
14. AUDITORS REPORTS The Auditor’s Report to the shareholders on the Accounts of the Company for the fi nancial year ended 31st March 2012 does not contain any
qualifi cation. 15. FIXED DEPOSIT Your Company did not invite or accept deposits from the public during the year under review. As on 31st March 2012, 19 deposits pertaining to
previous years aggregating to R 3.75 Lacs remained unclaimed. 16. TRANSFER TO INVESTOR EDUCATION AND PROTECTION FUND (IEPF) Pursuant to the provisions of section 205C of the Companies Act 1956, fi xed deposits accepted for the year 2004-2005 and interest thereon which
remained unclaimed, inspite of reminders to the fi xed deposit holders by the Company, have been transferred during the years, on their due dates, to the Investor Education and Protection Fund (IEPF) established by the Central Government.
17. PARTICULARS OF EMPLOYEES In terms of the provision of section 217 (2A) of the Companies Act, 1956 read with Companies (Particulars of Employees) Rules, 1975 as amended, the names and other particulars of the employees are given in the Annexure to the Directors’ Report.
18. PARTICULARS OF CONSERVATION OF ENERGY, TECHNOLOGY ABSORPTION, FOREIGN EXCHANGE EARNINGS AND OUTGO. This information pursuant to section 217(1) (e) of the companies Act,1956 read with the companies (Disclosure of Particulars in the Report of Board
of Directors) Rules 1988 is given below :
A. CONSERVATION OF ENERGY The Company is converting all major sites from fossil power to grid power thereby minimizing carbon foot print.This has been already implemented
at some sites and is under implementation at the other sites.
B. RESEARCH AND DEVELOPMENT AND TECHNOLOGY ABSORBTION: 1. Automation of Burge through PLC and SCADA View at Dahej Project site. 2. Monitoring of Electrical Parameters as well as HSD consumption while TBM running through SCADA and Web based report at Chennai
Metro Project site. 3. Upgradation and standardization of Software as well as PLC and Panel View / SCADA of all the CP 30 Batching Plant.

5
AFCONS INFRASTRUCTURE LIMITED C. FUTURE ACTION PLAN: 1. Automation of other Burges through PLC and SCADA View. 2. Upgradation and standardisation of Software as well as PLC and Panel View / SCADA of all the M1 Batching Plants.
D. FOREIGN EXCHANGE EARNING AND OUTGO. (Standalone)
(R in Lacs) Current yr. Previous yr. Earnings 87,971 36,929 Outgo 108,983 29,767
19. ACKNOWLEDGEMENT Your Directors would like to acknowledge with gratitude the continued support and co-operation received by the Company from its Clients, Bankers,
Financial Institution, Governments authorities, Employees and its valued Investors.
FOR AND ON BEHALF OF THE BOARD OF DIRECTORS
Place: Mumbai S.P. MISTRY Date: 22nd August, 2012 CHAIRMAN

6
AFCONS INFRASTRUCTURE LIMITEDAFCONS INFRASTRUCTURE LIMITEDMANAGEMENT DISCUSSION AND ANALYSISOVERVIEW OF THE GLOBAL ECONOMYThe year 2011-2012 was abetted by the continuing global volatility and challenges. The growth momentum of the Advance Economies was impacted as the protracted debt crisis in the euro area and fi scal fragilities dampened business and consumer confi dence. The resource rich Middle East and North Africa (MENA) region has been facing signifi cant internal challenges and geopolitical risks. These uncertainties led to widespread risk aversion and adversely affected capital fl ows to new projects.The growth prospects for 2012-2013 remain uncertain, with growth petering out in the euro area and moderating in the emerging markets, while a better-than- expected recovery is shaping up in the US.
OVERVIEW OF THE INDIAN ECONOMY The Indian economy being exposed to global economic environment has been impacted by the global uncertainties. In addition, on the internal front, the economy is facing challenges due to infl ationary pressures, tight monetary conditions, low investments, delays in policy decision and negative perception created due to scams etc.
In 2011-12 the GDP registered a growth of 6.5% driven by sectors like power, tourism, fi nancial services etc. The slowdown in 2011-12 was seen in all the major sectors of the economy as compared with the previous year.The services sector grew by 8.9%, Industry by 3.4% and Agriculture by 2.8% and Construction sector by 4.8% as compared with 9.3%, 7.2%, 7% and 8% respectively in 2010-11. Industrial growth remained subdued due to supply-side bottlenecks, particularly in the mining sector, and moderation in investment demand. The most dismal picture has been presented by capital goods segment which has been in negative, territory during the fi scal. Signifi cantly, slowdown was witnessed in capacity addition as defi ned by capital formation which decelerated to 5.5% in 2011-2012 as against 7.5% achieved in 2010-2011.The resilience of the Indian economy is being tested, but we hope the economy to bounce back in the short term.
INDUSTRY STRUCTURE AND DEVELOPMENTThe Construction industry is an integral part of the Indian economy and accounts for 7.8% of the GDP. It is the second largest employers of skilled and unskilled labour force in the country and is characterized by mix of both organized and unorganized entities.
The infrastructure development story in India has been plagued with issues of implementation. As a result, the pace of growth has been much lower than required to sustain the desired economic growth.
The Eleventh Plan envisaged the importance of investment in Infrastructure for achieving a sustainable and inclusive growth of 9% to 10% in GDP over the next decade. In this context, investment in physical Infrastructure has increased from the level of about 5% of GDP (in 2007) to about 8% of GDP by 2011-12, and is expected to rise to 10% as per the 2012-13 union budget. The cumulative investment in Infrastructure in the Twelfth Five-Year plan (2012-17) is targeted at around $1trillion, with nearly half of it expected to be channelized into construction. Private participation is expected to bring about 50% of the funding required, with the rest coming from public sources.
Towards the same, in the Union Budget 2012-13, the tax free bonds were doubled to R 60,000 crores including R 10,000 crores each for NHAI, IRFC, IIFCL and power sector and R 5,000 crores each for HUDCO, National Housing Bank, SIDBI, and ports. Additionally allocation has been increased to R 25,360 crores towards the National Highways Development Programme, an increase of about 14 % over the previous year.
The Government has been actively encouraging private investment in Infrastructure through Public Private Partnership (PPP) to meet the massive Infrastructure funding requirement. In the course of the Eleventh Plan, the government has taken several initiatives for standardising the documents and processes for structuring and award of PPP projects in a transparent and competitive manner.
However, we fi nd that things in reality have slowed down, while the Government had grandiose plans, implementation mechanism is not well-oiled. Fiscal situation & Infl ation adds further dimension to the growth story.
BUSINESS OVERVIEWDuring the year, the Company has bagged lower orders both in India and abroad. The sectors of key businesses to the Company faced increased level of competitive intensity due to lower number of jobs and increase in competition.The order book position of the Company as on 31st March, 2012 was R 7,005.20 crores.
During last 5 years, the Company has executed projects in, Abu Dhabi, Dubai, Qatar, Mauritius, Madagascar, Oman, Algeria, Liberia and Yemen. Currently, the Company is executing projects in Jordan, Liberia and Bahrain. During the year ended 31st March 2012, the Company achieved 38.28% of its turnover from overseas market.
The growth of the Company has been well diversifi ed across different segments and geographies on the desired line and focus. All the segments are well balanced and there is no over dependence on any one sector or geography and we remain present in all segments with a reasonable signifi cant participation.
CONSOLIDATED FINANCIAL PERFORMANCEYour Company has achieved total income of R 2,551.92 crores for the year compared to the previous year’s R 2,895.48 crores showing a decrease of 11.87%.The EBIDTA for the year was R 278.57 crores compared to R 251.53 crores in the previous year resulting in increase by 10.75%.The Consolidated Profi t before Tax for the year was R 150.56 crores compared to R 151.35 crores in the previous year resulting in a marginal decrease of 0.52%.The Consolidated Profi t after Tax for the year was R 88.14 crores compared to R 118.97crores in the previous year resulting in decrease by 25.91%.
OPPORTUNITIESIn the long-term, India continues to offer considerable opportunities aided by its favourable demographic profi le. Its large consumer market has attracted global companies, many of whom have made India their manufacturing hub. However, in order to harness this potential and achieve sustainable growth, the country needs to push forward critical reforms and build innovative public-private partnerships to deliver rapid and inclusive growth as also provide an enabling environment for upgrading infrastructure.
The Government has announced measures to kick-start key infrastructure development projects and thereby provide a catalyst to revert the economy to a higher growth trajectory.

7
AFCONS INFRASTRUCTURE LIMITEDOverseas MarketThe infrastructure segment in the overseas market, even in the face of uncertain economic conditions, is showing resilience in certain pockets. In view of the visibly strong infrastructure potentials, the Company has identifi ed Middle East and Africa as the key markets. In Middle East, Saudi Arabia and Qatar have projected strong infrastructure investment in the coming years. Countries such as Dubai, Kuwait and Abu Dhabi which saw slowdown post 2008 fi nancial crisis are slowly picking up, but we do not expect them to reach pre 2008 levels in infrastructure investment in the short term. Africa, given the abundance of natural resources such as coal and iron ore, has seen investment in green fi eld mines by global mining corporations and thus mining driven infrastructure opportunities are available in both short and medium term in both railways and marine segments.
South East Asia is another market where opportunities are available. South East Asian economies are slowly reaching sustained GDP growth in excess of 6%, and are now developing infrastructure to sustain the same going forward. Specifi cally countries such as Indonesia, Myanmar and Vietnam with plenty of natural resources and increasingly improving political climate are attracting investments in mining and energy related infrastructure.
Given the favourable environment and our successful execution history in overseas markets, we are increasingly looking at overseas for driving our future growth.
Road:Road has been the key drivers of infrastructure growth in India. Ministry of Roads, Transport and Highways (MORT&H) has prepared a Master Plan for the National Expressways Network for a total length of about 18,637 km. This is in addition to the initiatives taken up under National Highway Development Programme (NHDP). NHDP is being implemented under several phases.
The Working Group on road sector for Twelfth Plan in its report stated that ongoing phases of NHDP - I, II, III and V involving upgradation to four or more lanes of about 32,750 km to be completed within the Twelfth Plan at an estimated fund requirement of R 3,23,774 crores. Further it is proposed that existing National Highway Network of 71,772 km may be increased to about 85,000 km in the Twelfth Plan, for the development of regions which are currently not connected by National Highways.
During the year 2011-12, an ambitious target of awarding 7800 KM was set, of which 6700 KM was awarded. Post this success, the target for the year 2012-13 have been decided at 9500 KM, marking an increase of 21.79 per cent over last year and an increase in investment by 73.6 per cent. Of these, a total of 4,360 km of roads will be awarded for maintenance under the OMT (Operate, Maintain, Transfer) system for the fi rst time. The investment in the current year will hopefully bring in the required acceleration for successful implementation of the twelfth plan.
Railways: The annual Plan of 2012-13 envisages the highest-ever planned investment in the railways at R 60,100 crores. The Indian Railways plans to bring in new technologies and augment the existing infrastructure through High Speed Corridors, Dedicated Freight corridors etc.
MRTS / Urban Infrastructure : The urban population share may reach 50% in 25 year thereby adding 300 to 400 million to the existing population of about 350 million. Urbanisation in India has been relatively slow in past, but is now expected to accelerate. The segment has been showing strong growth. Last year saw commencement of operations on Bengaluru Metro. Also construction was initiated on Jaipur Metro. Delhi Metro has been a success story and is in its 3rd phase of expansion.The Government is encouraging private sector participation in major urban transport projects. We expect the segment to remain strong and be a continuous source of opportunities.
Ports : As per the data provided by Indian Ports Association, cargo handled at major ports decreased by 1.7% in the year 2011-12, for the fi rst time in 12 years, primarily due to reduction in iron ore exports. The rate of addition of new capacity is expected to be higher in minor ports relative to major ports, and private investment is expected to drive the same. Ministry of Shipping has broadly identifi ed 42 projects valued at R 14,500 crores to be awarded in the current fi scal. The target includes development of two new ports on east coast.
The Maritime Agenda 2020 envisages investments worth over R 1,48,500 crores in the maritime sector. The agenda aims to create a port capacity of around 3,200 MT to handle the expected traffi c of about 2,500 MT by 2020. A majority of the projects will be implemented through the public-private participation (PPP) model. The Private investments in the port sector have increased signifi cantly over the years. Power:The capacity addition in eleventh Five year plan is estimated to be ~55GW as against an original target of 78GW, with about 60% being added in last two years. The execution has been slow due to concerns on fuel availability, land, environmental issues and long term fi nancing.
In the twelfth fi ve year plan a target of 62GW of capacity addition has been defi ned, which would require an investment of R 6,38,600 crores in power generation RISK AND CONCERNSA. Global Events
India being now connected with the global economy is not insulated from the events impacting the global economy. Political and economic events which may have an impact on Indian economy could be as under:• Economic instability in European Union, with some countries still impacted deeply by recession• Political instability in Middle East & North Africa, leading to slowdown in investment in infrastructure, at least in the short term.
B. Domestic Events:Despite the Construction Industry in India witnessing growth in comparison to other emerging economies and developed economies in the last year, the developments on the economic front cast constraints and challenges on the prospect of the industry mainly due to the following:• Change in government policies, priorities and its budgetary allocation for infrastructure development.• Infl ationary pressures, leading to sustained high interest rate, leading to a sustained stress of tightening Liquidity position and interest rate risks.• Delay in award of contract and releasing work fronts and technical clearances for execution of projects. • Availability of skilled manpower and high attrition levels of employees in the industry.

8
AFCONS INFRASTRUCTURE LIMITED• Dispute resolution mechanism is time consuming resulting into signifi cant blockage of working capital.• Increasing competitive intensity across segments, due to mushrooming of competition in the last few years, and slowdown in award of projects.• Negative perceptions on the domestic front (various scams, high infl ationary levels, etc.), there is a possibility of capital moving out of India.Your Company’s presence in projects across various segments of construction business both in India as well as abroad has helped to mitigate the above constraints and also ensure long term sustainable growth with profi tability.
OUTLOOKThe Company has diversifi ed in segments and geographies since 2008, and is continuing in the same direction for driving its growth. Apart from consolidating its business in Marine and Transportation segment, the Company intends to scale up its presence in oil & gas and hydro & tunnelling construction.
Geographically, the Company would enhance its overseas presence. Over the last 3 years the Company had a sustained revenue share of 30% from overseas markets, and the strategy is to increase it to 40% and beyond over the next 2 years, through consolidation of its forays into Middle East and Africa.
The Company would continue to maintain its status as a prominent Transnational Infrastructure Company recognized for its business innovation, focused on Total Satisfaction and creating enhanced value for all our stakeholders.
INTERNAL CONTROL SYSTEMS AND THEIR ADEQUACIES The Company has in place an adequate Internal control system. The fi nancial control operates through continuous Internal Audit and distribution of functional responsibilities. Internal Auditors conduct audits of sites of the Company throughout the year to test the adequacy of the internal systems and suggest continual improvements. Internal Audit reports and adequacy of internal controls are reviewed by the Board’s Audit Committee on a regular basis. The operational control exist through well laid out system of checks and balances and hierarchy of reporting from site level to central management groups to the senior management and the Directors.
HUMAN RESOURCES DEVELOPMENTAt AFCONS, employees are a part of the performance raising team in professionalism, opportunity, responsibility, belongingness and accomplishment with Company’s vision. Our employees are considered the most valuable asset and the Company is committed to enable employees to maximize their contribution to the company, while also maintaining effectiveness between their work and personal lives. By creating a framework for managing Work/ Life effectiveness, the Company enhances our ability to develop and retain our employees and demonstrate our commitment to creating a great place to work in the AFCONS Innovative Culture.
The Company HR Policy focuses on the following key areas: • Talent Acquisition through a defi ned talent management strategy in alignment with business goal and targets.• Imparting Learning and Development to employees and prepare them for their current and future roles. • Adequate Compensation Package coupled with Incentives, rewards and recognitions. • Culture building focus on building a culture of innovation and creativity in construction process.
The Company has taken many initiatives towards effective training and development for the employees at various levels. Some of the innovative initiatives of the Company includes Anugam-HR Induction program initiated through E-Learning platform, Whole Wellness Program, focused training sessions and workshops to continuously improve the skill sets of the employees. The Classroom @ site and Classroom @ H.O. program has been very successful.
Your Company endeavour to provide its employees a professional, congenial, safe work environment coupled with opportunities for personal growth and development.
For the sixth consecutive year, Construction World has rated us as one of the best companies to work for in the Construction and Infrastructure sector.
CAUTIONARY STATEMENTThe statement in Management Discussions and Analysis describing the Company’s operations and expectations are “forward looking statements”. Actual results may differ owing to environmental dynamics.
9
AFCONS INFRASTRUCTURE LIMITEDAFCONS INFRASTRUCTURE LIMITEDREPORT ON CORPORATE GOVERNANCEI. CORPORATE GOVERNANCE PHILOSOPHY The Company subscribes fully to the principles and spirit of sound Corporate Governance and embodies the principles of fairness, transparency,
accountability and responsibility into the value systems driving the Company. It has been the constant endeavor of the company to create an environment for effi cient conduct of the business and to enable management to meet its obligation to all its stakeholders, including amongst other, shareholders, customer, employees and the community in which the Company operates.
II. BOARD OF DIRECTORS (a) Composition As on 31st March, 2012 the Board of Directors of the Company comprised of 10 Directors out of which 2 are Executive Directors and the remaining
8 are Non-Executive Directors. The Chairman of the Board is the Non Executive Director and the Board consists of 6 Independent Directors. All the Directors posses the requisite qualifi cation & experience in Industry, Management, Finance, Research, Law and other allied fi elds enabling
them to contribute effectively in their capacity as Directors of the Company.
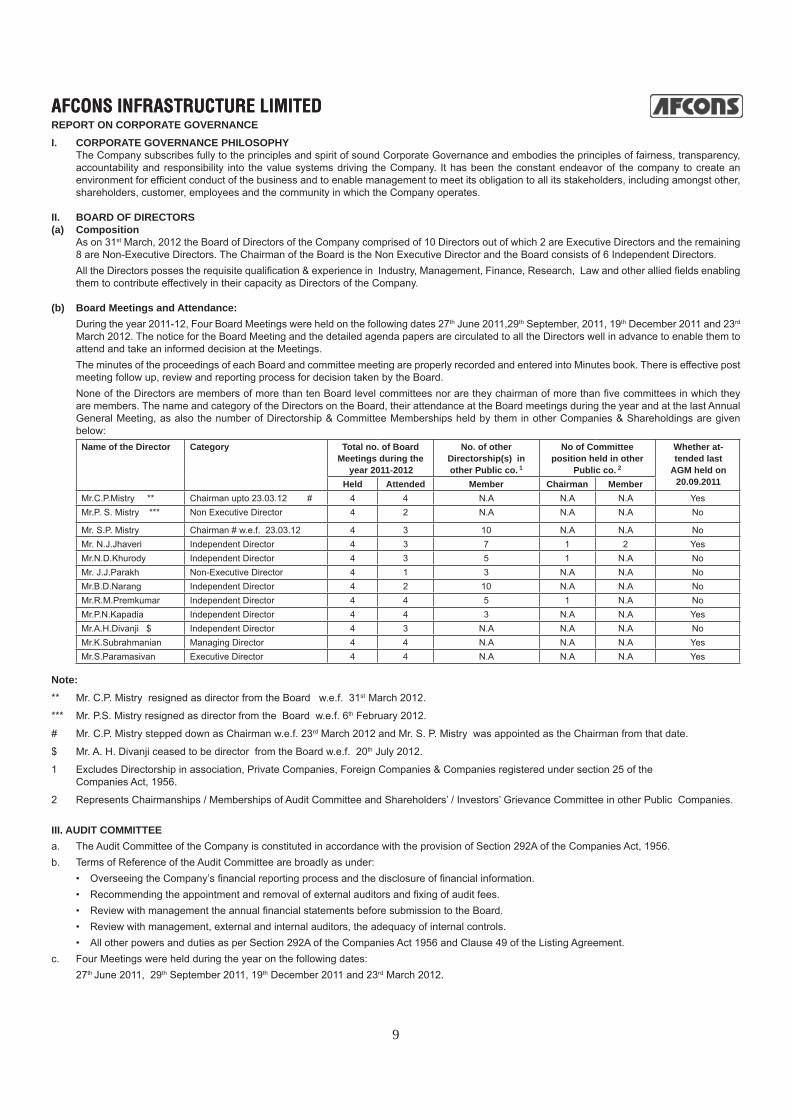
(b) Board Meetings and Attendance: During the year 2011-12, Four Board Meetings were held on the following dates 27th June 2011,29th September, 2011, 19th December 2011 and 23rd
March 2012. The notice for the Board Meeting and the detailed agenda papers are circulated to all the Directors well in advance to enable them to attend and take an informed decision at the Meetings.
The minutes of the proceedings of each Board and committee meeting are properly recorded and entered into Minutes book. There is effective post meeting follow up, review and reporting process for decision taken by the Board.
None of the Directors are members of more than ten Board level committees nor are they chairman of more than fi ve committees in which they are members. The name and category of the Directors on the Board, their attendance at the Board meetings during the year and at the last Annual General Meeting, as also the number of Directorship & Committee Memberships held by them in other Companies & Shareholdings are given below:
Name of the Director Category Total no. of Board Meetings during the
year 2011-2012
No. of other Directorship(s) in other Public co. 1
No of Committee position held in other
Public co. 2
Whether at-tended last
AGM held on 20.09.2011Held Attended Member Chairman Member
Mr.C.P.Mistry ** Chairman upto 23.03.12 # 4 4 N.A N.A N.A YesMr.P. S. Mistry *** Non Executive Director 4 2 N.A N.A N.A No
Mr. S.P. Mistry Chairman # w.e.f. 23.03.12 4 3 10 N.A N.A NoMr. N.J.Jhaveri Independent Director 4 3 7 1 2 YesMr.N.D.Khurody Independent Director 4 3 5 1 N.A NoMr. J.J.Parakh Non-Executive Director 4 1 3 N.A N.A NoMr.B.D.Narang Independent Director 4 2 10 N.A N.A NoMr.R.M.Premkumar Independent Director 4 4 5 1 N.A NoMr.P.N.Kapadia Independent Director 4 4 3 N.A N.A YesMr.A.H.Divanji $ Independent Director 4 3 N.A N.A N.A NoMr.K.Subrahmanian Managing Director 4 4 N.A N.A N.A YesMr.S.Paramasivan Executive Director 4 4 N.A N.A N.A Yes
Note:** Mr. C.P. Mistry resigned as director from the Board w.e.f. 31st March 2012.
*** Mr. P.S. Mistry resigned as director from the Board w.e.f. 6th February 2012.
# Mr. C.P. Mistry stepped down as Chairman w.e.f. 23rd March 2012 and Mr. S. P. Mistry was appointed as the Chairman from that date.
$ Mr. A. H. Divanji ceased to be director from the Board w.e.f. 20th July 2012.
1 Excludes Directorship in association, Private Companies, Foreign Companies & Companies registered under section 25 of the Companies Act, 1956.
2 Represents Chairmanships / Memberships of Audit Committee and Shareholders’ / Investors’ Grievance Committee in other Public Companies.
III. AUDIT COMMITTEEa. The Audit Committee of the Company is constituted in accordance with the provision of Section 292A of the Companies Act, 1956.b. Terms of Reference of the Audit Committee are broadly as under: • Overseeing the Company’s fi nancial reporting process and the disclosure of fi nancial information. • Recommending the appointment and removal of external auditors and fi xing of audit fees. • Review with management the annual fi nancial statements before submission to the Board. • Review with management, external and internal auditors, the adequacy of internal controls. • All other powers and duties as per Section 292A of the Companies Act 1956 and Clause 49 of the Listing Agreement.c. Four Meetings were held during the year on the following dates: 27th June 2011, 29th September 2011, 19th December 2011 and 23rd March 2012.

10
AFCONS INFRASTRUCTURE LIMITEDAFCONS INFRASTRUCTURE LIMITED
d. As on 31st March, 2012 Composition of Audit Committee and particulars of meetings attended by the members of the Audit Committee are given below:
Name of the Director Category No. of Meetings
Held AttendedMr. N.J.Jhaveri Independent Director - Chairman 4 3Mr. N.D.Khurody Independent Director 4 3
Mr. P.N. Kapadia Independent Director 4 4Mr. J.J. Parakh Non-Executive Director 4 1
IV. REMUNERATION COMMITTEEa. The broad terms of reference of the remuneration committee are as under: The Remuneration Committee shall have powers and authorities as provided under the provisions of Schedule XIII of the Companies Act, 1956 and
any amendment thereof, if any, granting the approval of remuneration to the Wholetime Directors and the Managing Director of the Company.b. One meeting of the remuneration committee was held during the year i.e.29th September, 2011.c. The Composition of remuneration committee was as under:
Name of the Director Category No. of Meetings
Held AttendedMr.N.J.Jhaveri Independent Director - Chairman 1 1
Mr.N.D.Khurody Independent Director 1 -
Mr.P.N.Kapadia Independent Director 1 1 d. Remuneration Policy Remuneration to executive directors has been decided based on the years of experience and contribution made by the respective executive
directors and is consistent with the industrial practice. As regards payment of sitting fees to non-executive directors, the same has been within the limit allowed in terms of the Companies Act,1956.
e. Details of Remuneration paid to Directors during the fi nancial year 2011-12: i. Remuneration paid/payable to the executive directors for the fi nancial year ended 31st March 2012:
(R p.a.)Name of Director Basic Salary PF / SA Perquisites Total
RemunerationMr.K.Subrahmanian 28,50,000 7,69,500 1,38,80,401 1,74,99,901
Mr.S.Paramasivan 22,95,000 6,19,650 1,02,10,287 1,31,24,937
51,45,000 13,89,150 2,40,90,688 3,06,24,838
The number of stock options granted till date to the Executive Directors is as under: Name of the Director Stock options granted till dateMr.K.Subrahmanian 35,040Mr.S.Paramasivan 26,280
ii Remuneration paid/payable to the non-executive directors for the year ended 31st March 2012 is as under:
The Non-Executive directors were not paid any remuneration except sitting fees for attending the meetings of the board of directors and /or committees thereof .The details of the sitting fees paid to the Non-Executive directors are as under:
Name of the Director Sitting Fees ( R )
Shareholding in the Company
No. of Shares % holding Mr.C.P.Mistry 80,000 -Mr.P.S.Mistry 20,000 -Mr. S.P.Mistry 30,000 -Mr. J.J.Parakh 70,000 6,619 0.009Mr A.H.Divanji 30,000 14,220 0.020Mr. N.J.Jhaveri 1,00,000 17,749 0.025Mr.P.N.Kapadia 1,30,000 - -Mr.N.D.Khurody 90,000 - -Mr.B.D.Narang 20,000 - -Mr.R.M.Premkumar 40,000 - -Total 6,10,000 38,588 0.054
The Company does not have any material pecuniary relation or transactions with its non-executive directors.

11
AFCONS INFRASTRUCTURE LIMITEDAFCONS INFRASTRUCTURE LIMITEDV. SHAREHOLDERS/ INVESTOR’S GREVIANCES CUM SHARE TRANSFER CUM ESOP SHARE ALLOTMENT COMMITTEE:
a. The Shareholders / Investor’s Grievances Cum Share Transfer Committee was constituted on 28th November 2006.The Board of Director at its
meeting held on 24th September 2008 renamed the said Committee as Shareholders / Investor’s Grievance Cum Share Transfer cum ESOP Share Allotment Committee.
b. The broad terms of reference of Shareholders / Investor’s Grievance Cum Share Transfer cum ESOP Share Allotment Committee are as under:
• To look into matters pertaining to the redressal of shareholders and investors complaints like transfer of shares, non-receipt of balance sheet, non-receipt of declared dividends etc.
• to approve transfer of the Equity and Preference Shares of the Company and further delegate such powers to the Registrar for the Transfer of Shares of the Company.
• to investigate into any matter in relation to areas specifi ed above or referred to it by the Board of Directors and for this purpose will have full access to information contained in the records of the Company.
• to allot equity shares to the employees exercising the ESOP options granted under the ESOP Scheme 2006 of the Company.c. Four meetings were held during the year on the following dates: 27th June, 2011, 21st October, 2011, 13th February, 2012 and 15th March, 2012.d. Composition, Meetings and Attendance. The Composition and attendance of members at the meetings of the Shareholders / Investor’s Grievance Cum Share Transfer Cum ESOP Share
Allotment Committee was as under:
Name of the Director Category No. Of MeetingsHeld Attended
Mr.P.N.Kapadia Independent Director - Chairman 4 4
Mr.J.J.Parakh Non-Executive Director 4 4
Mr.S.Paramasivan Executive Director 4 4
e. Name and Designation of the Compliance Offi cer Mr.P.R.Rajendran, Company Secretary is the Compliance offi cer of the Company.
f. Status of Investor’s Complaints During the fi nancial year all the letter/complaints received by the Registrar and Share Transfer Agent have been redressed and there were no
complaints pending with the Company/Registrar and Share Transfer Agent. All the valid share transfers requests received during the year were duly attended to and processed in time. There was no valid request pending for share transfer as on 31st March 2012.
VI. OTHER COMMITTEES OF THE BOARDA. COMMITTEE OF DIRECTORS
i. The Committee of Directors was constituted for reviewing the various aspects of business including Operations, Finance, Business Development and to recommend to the Board the strategies for creating better value for the Organisation from all angles.
ii. Four meeting were held during the year on the following dates: 27th June 2011, 29th September, 2011, 19th December 2011 and 23rd March 2012
iii The Composition, Meetings and Attendance of the Committee of Directors meetings was as under:
B. FCP COMMITTEE
i. The Company with the object of raising fund through Private Placement by issuing Fully Convertible, Non- Cumulative, Non-Participatory Preference Shares (“FCPs”) constituted a Committee of Directors named as “FCPs Committee” and delegated to such Committee the following powers: a. To fi nalise all terms and conditions for subscription agreement, call option agreement and such other agreements incidental or ancillary to
the issue and allotment of Fully Convertible, Non-Cumulative, Non-Participatory Preference Shares (“FCPs”) convertible into Equity Shares (“FCPs”).
b. To convene Extraordinary General Meeting of the Company to obtain shareholders consent to amend the Articles of Association of the Company in relation to the issue of FCPs;
c. To make applications to such authorities as may be required and to accept on behalf of the Board such conditions and modifi cations as may be prescribed or imposed by any of them while granting such approvals, permissions and sanctions as may be required;
d. To accept application money, open bank account for receiving the application money from allottees and to issue them share certifi cates in accordance with the relevant rules;
e. To make application to authorities for dematerialisation of FCPs allotted to the allottees.f. To authorize and approve the incurring of expenditure and payment of fees in connection with the issue and allotment of FCPs; g. To do all such acts, deeds, matters and things and execute all such other documents as it may, in its absolute discretion, deem necessary or
desirable for such purpose, and to settle all questions, diffi culties or doubts that may arise in regard to such issues or allotment and matters incidental thereto as it may, in its absolute discretion deem fi t;
h. To engage services of professionals including merchant bankers, lawyers, Chartered Accountants and Valuers.i. To exercise such powers and to do all such act, deed, matters and things in connection with the issue and allotment of FCPs as the FCPs
Committee deems fi t and proper.j. To sub-delegate any of the said powers and authorities to any one of the Committee Members and/or to any other person as the FCPs
Committee deems fi t. k. The FCPs Committee may pass any resolution by circulation.

12
AFCONS INFRASTRUCTURE LIMITED
ii. During the year under review, no meeting was held.
iii. Composition of the Committee
Name of the Member Category
Mr. P.N.Kapadia Independent Director –Chairman
Mr.J.J.Parakh Non-Executive Director
Mr. K.Subrahmanian Managing Director
Mr.S.Paramasivan Executive Director
C. COMPENSATION (ESOP) COMMITTEE
i. The Compensation (ESOP) Committee was constituted for implementation, administration and superintendence of the ESOP Schemes and to formulate the detailed terms and conditions of the ESOP Scheme.
ii. During the year under review, No meeting was held.iii. Composition of the Committee
Name of the Member Category
Mr.N.J.Jhaveri Independent Director -Chairman
Mr. P.N.Kapadia Independent Director
Mr. K.Subrahmanian Managing Director
VII. GENERAL BODY MEETINGS
a. The details of the Annual General Meetings (AGMs) held in the last 3 years:
For Financial Year ended Location Date of AGM Time
31.03.2011 Registered Offi ce of the Company 29.09.2011 4.30 p.m
31.03.2010 Registered Offi ce of the Company 20.09.2010 4.30 p.m
31.03.2009 Registered Offi ce of the Company 30.09.2009 4.30 p.m. b. Details of the special resolutions passed at the Annual General Meeting in the previous 3 years: AGM:
35th AGM dtd.29.09.2011 Consent of the Company to make/give loan(s) / advances / commercial papers / deposits / make investments and to give guarantees / provide securities, in excess of the limits under section 372A, to direct / indirect subsidiary company of the Company set up / likely to be set up in Kuwait.
34th AGM dtd.20.09.2010 Consent of the Company to make / give loan(s) / advances / deposits / make investments and to give guarantees / provide securities, in excess of the limits under section 372A, to Afcons Offshore and Marine Service Private Limited and to direct / indirect subsidiary of the Company to be set up in Kingdom of Saudi Arabia.
33rd AGM dtd.30.09.2009 NIL
c. During the year no resolution was passed through Postal Ballot.

13
AFCONS INFRASTRUCTURE LIMITED
VIII. DISCLOSURES
a. There were no materially signifi cant related party transactions during the fi nancial year 2011-12 that may have potential confl ict with the interests of the Company at large. The detail of the related party transactions as per AS-18 are included in the notes to accounts forming part of the Annual Report.
b. Although the Company is not listed with any stock Exchange, it voluntarily complies with Corporate Governance requirement of the Listing Agreement.
IX. MEANS OF COMMUNICATION:
a. The Company has its own website and all the vital information relating to the Company is displayed on the website. Address of the website is www.afcons.com.
b. Annual Report containing inter alia, Audited Annual Report, Financial Statements, Directors Report, Auditors Report and other important information
is circulated to the members and others entitled thereto.
X. GENERAL SHAREHOLDERS INFORMATION a. AGM Date : 28th September, 2012 Time : 4.30 pm Venue : “Afcons House”,16, Shah Industrial Estate, Veera Desai Road, Azad Nagar P.O., Andheri (West), Mumbai-400053
b. Financial Year : 1st April to March 31st c. Date of Book Closure : 22nd September, 2012 to 28th September, 2012 (both days inclusive) d. ISIN No. : INE101I01011 e. Registrar & Share Transfer Agent : Cameo Corporate Service Limited Subramanian Building, 1 Club House Road, Chennai-600002 Tel.no. : 044-28460390 Fax no. : 044-28460129 Email id. : [email protected]
XI. SHAREHOLDING PATTERN AS ON 31ST MARCH, 2012.
Sr. No. Category No. of Shares % of total
1 Promoter’s holding
Indian Promoters –Bodies Corporate 6,97,69,312 96.94
Sub total (1) 6,97,69,312 96.94
2 Non Promoters Holding
Companies / Bodies Corporate 50,000 0.07
Employees / Retired Employees / General Public 7,42,501 1.03
Directors & their Relatives 2,17,055 0.30
Employees Trust 11,91,370 1.66
Sub total (2) 22,00,926 3.06
Total (1+2) 7,19,70,238 100.00

14
AFCONS INFRASTRUCTURE LIMITED
XII. DISTRIBUTION OF SHAREHOLDING AS ON 31ST MARCH, 2012
Number of Shares Shareholders Shares Number % of Total Number % of Total1 to 100 71 12.1580 5,781 0.0084
101 to 500 321 54.9657 86,168 0.1197
501 to 1000 38 6.5068 29,364 0.0408
1001 to 2000 32 5.4794 49,397 0.0686
2001 to 3000 18 3.0821 45,179 0.0627
3001 to 4000 12 2.0547 42,611 0.0592
4001 to 5000 7 1.1986 32,525 0.0451
5001 to 10000 41 7.0205 2,81,512 0.3911
10001 & above 44 7.5342 7,13,97,701 99.2044
Total 584 100.0000 7,19,70,238 100.0000 XIII Address for Correspondence: Afcons Infrastructure Limited Afcons House,16 Shah Industrial Estate, Veera Desai Road, Andheri (W), Mumbai – 400053 Tel.no.: 67191000,Fax.no.: 26730027/26731031 Website: www.afcons.com

15
AFCONS INFRASTRUCTURE LIMITEDAFCONS INFRASTRUCTURE LIMITEDAUDITORS’ REPORT
To, the Members of Afcons Infrastructure Limited
1. We have audited the attached Balance Sheet of Afcons Infrastructure Limited (“the Company”) as at 31st March, 2012, the Statement of Profi t and Loss and the Cash Flow Statement of the Company for the year ended on that date, both annexed thereto. These fi nancial statements are the responsibility of the Company’s Management. Our responsibility is to express an opinion on these fi nancial statements based on our audit.
2. We conducted our audit in accordance with the auditing standards generally accepted in India. Those Standards require that we plan and perform the audit to obtain reasonable assurance about whether the fi nancial statements are free of material misstatements. An audit includes examining, on a test basis, evidence supporting the amounts and disclosures in the fi nancial statements. An audit also includes assessing the accounting principles used and signifi cant estimates made by the Management, as well as evaluating the overall fi nancial statement presentation. We believe that our audit provides a reasonable basis for our opinion.
3. As required by the Companies (Auditor’s Report) Order, 2003 (CARO) issued by the Central Government in terms of Section 227 (4A) of the Companies Act, 1956, we enclose in the Annexure a statement on the matters specifi ed in paragraphs 4 and 5 of the said Order.
4. Further to our comments in the Annexure referred to in paragraph 3 above, we report as follows: (a) we have obtained all the information and explanations which to the best of our knowledge and belief were necessary for the purposes of our
audit; (b) in our opinion, proper books of account as required by law have been kept by the Company so far as appears from our examination of those
books; (c) the Balance Sheet, the Statement of Profi t and Loss and the Cash Flow Statement dealt with by this report are in agreement with the books
of account; (d) in our opinion, the Balance Sheet, the Statement of Profi t and Loss and the Cash Flow Statement dealt with by this report are in compliance
with the Accounting Standards referred to in Section 211 (3C) of the Companies Act, 1956; (e) in our opinion and to the best of our information and according to the explanations given to us, the said accounts give the information required
by the Companies Act, 1956 in the manner so required and give a true and fair view in conformity with the accounting principles generally accepted in India:
(i) in the case of the Balance Sheet, of the state of affairs of the Company as at 31st March, 2012; (ii) in the case of the Statement of Profi t and Loss, of the profi t of the Company for the year ended on that date; and (iii) in the case of the Cash Flow Statement, of the cash fl ows of the Company for the year ended on that date.
5. On the basis of the written representations received from the Directors as on 31st March, 2012 taken on record by the Board of Directors, we report that none of the Directors is disqualifi ed as on 31st March, 2012 from being appointed as a director in terms of Section 274(1)(g) of the Companies Act, 1956.
For Deloitte Haskins & Sells For J. C. Bhatt & Associates Chartered Accountants Chartered Accountants (Registration No. 117366W) (Registration No. 130923W)
R. Laxminarayan J. C. Bhatt Partner Partner
Membership No.33023 Membership No.10977 Place : Mumbai Dated : 22nd August, 2012 ANNEXURE TO THE AUDITORS’ REPORTReferred to in paragraph 3 of our report of even date on the accounts for the year ended 31st March, 2012 of Afcons Infrastructure Limited (“ the Company”)(i) Having regard to the nature of the Company’s business, clauses (xiii) and (xiv) of CARO are not applicable. (ii) In respect of its fi xed assets: (a) The Company has maintained proper records showing full particulars, including quantitative details and situation of the fi xed assets. (b) The fi xed assets were physically verifi ed during the year by the Management in accordance with a regular programme of verifi cation which,
in our opinion, provides for physical verifi cation of all the fi xed assets at reasonable intervals. According to the information and explanations given to us, no material discrepancies were noticed on such verifi cation.
(c) The fi xed assets disposed off during the year, in our opinion, do not constitute a substantial part of the fi xed assets of the Company and such disposal has, in our opinion, not affected the going concern status of the Company.
(iii) In respect of its inventory: (a) As explained to us, the inventories were physically verifi ed during the year by the Management at reasonable intervals. (b) In our opinion and according to the information and explanation given to us, the procedures of physical verifi cation of inventories followed by
the Management were reasonable and adequate in relation to the size of the Company and the nature of its business. (c) In our opinion and according to the information and explanations given to us, the Company has maintained proper records of its inventories
and no material discrepancies were noticed on physical verifi cation.

16
AFCONS INFRASTRUCTURE LIMITED(iv) The Company has not granted any loans, secured or unsecured, to companies, fi rms or other parties listed in the Register maintained under
Section 301 of the Companies Act, 1956. In respect of loans, secured or unsecured, taken by the Company from companies, fi rms or other parties covered in the Register maintained under
Section 301 of the Companies Act, 1956, according to the information and explanations given to us: (a) The Company had taken loans aggregating to R 90.00 Lacs from one party during the earlier years. At the year-end, the outstanding balance
of such loans taken aggregated to R 90.00 Lacs and the maximum amount involved during the year was R 90.00 Lacs. (b) The rate of interest and other terms and conditions of such loans are, in our opinion, prima facie not prejudicial to the interest of the Company. (c) The principal amounts have not fallen due for repayment during the year and payment of interest in respect of such loans have been regular.(v) In our opinion and according to the information and explanations given to us, there is an adequate internal control system commensurate with the
size of the Company and the nature of its business with regard to purchase of fi xed assets and for the sale of goods and services. During the course of our audit, we have not observed any major weakness in such internal control system.
(vi) In respect of contracts or arrangements entered in the Register maintained in pursuance of Section 301 of the Companies Act, 1956, to the best of our knowledge and belief and according to the information and explanations given to us:
(a) The particulars of contracts or arrangements referred to in Section 301 that needed to be entered in the Register maintained under the said Section have been so entered.
(b) Where each of such transaction is in excess of R 5 lakhs in respect of any party, the transactions have been made at prices which are prima facie reasonable having regard to the prevailing market prices at the relevant time.
(vii) According to the information and explanations given to us, the Company has not accepted any deposit from the public during the year. In respect of unclaimed deposits, the Company has complied with the provisions of Sections 58A & 58AA or any other relevant provisions of the Companies Act, 1956. We are informed that no Order has been passed by the Company Law Board or Reserve Bank of India or any Court or any other Tribunal.
(viii) In our opinion, the internal audit functions carried out during the year by a fi rm of Chartered Accountants appointed by the Management have been commensurate with the size of the Company and the nature of its business.
(ix) We have broadly reviewed the cost records maintained by the Company pursuant to the Companies (Cost Accounting Records) Rules, 2011 prescribed by the Central Government under Section 209(1)(d) of the Companies Act, 1956 and are of the opinion that prima facie the prescribed cost records have been maintained. We have, however, not made a detailed examination of the cost records with a view to determine whether they are accurate or complete.
(x) According to the information and explanations given to us in respect of statutory dues: (a) The Company has generally been regular in depositing undisputed dues, including Provident Fund, Investor Education and Protection Fund,
Employees’ State Insurance, Income-tax, Sales Tax, Wealth Tax, Service Tax, Custom Duty, Excise Duty, Cess and other material statutory dues applicable to it with the appropriate authorities.
(b) There were no undisputed amounts payable in respect of Income-tax, Wealth Tax, Custom Duty, Excise Duty, Cess and other material statutory dues in arrears as at 31st March, 2012 for a period of more than six months from the date they became payable.
(c) Details of dues of Income-tax, Sales Tax, Service Tax, Custom Duty, Excise Duty and Cess which have not been deposited as on 31st March, 2012 on account of disputes, if any, are given below:
Statute Nature of
Dues
Forum where Dispute is pending
Period to which the amount relates
Amount (Rs. in Lacs)
Amount Paid / Adjusted
(Rs. In Lacs)
Net Balance(Rs. in Lacs)
Assam General Sales Tax Act 1993
Sales Tax
Dy. Commissioner of Taxes (Appeal), Guwahati
2007-08 26.89
14.85 12.04
Andhra Pradesh General Sales Tax Act 1957
Sales Tax
Sales Tax appellate Tribunal, Hyderabad
1995-96, 1996-97, 1997-98
16.39 - 16.39
Andhra Pradesh General Sales Tax Act 1957
Sales Tax
Appellate Dy. Commissioner of Commercial taxes, Hyderabad
1997-98 0.75
0.56
0.19
Delhi Sales Tax on Works Contract Act 1957
Sales Tax
Addl. Commissioner (Appeals)
2003-04, 2004-05
698.05
528.56
169.49
Delhi Value Added Tax Act, 2004
Sales Tax
Addl. Commissioner (Appeals)
2007-08, 2008-09
266.51
25.06
241.45
Madhya Pradesh General Sales Tax Act 1958
Sales Tax
Dy. Commissioner 1985-86 15.09
5.18
9.91
Madhya Pradesh General Sales Tax Act 1958
Sales Tax
Addl. Commissioner 1987-88, 1988-89, 1989-90
15.48 2.00 13.48
The Maharashtra Sales Tax on Transfer of property in goods involved in Execution of Works Contract (Re-enacted) Act, 1989
Sales Tax
Asst. Commissioner of Sales Tax, Mumbai
1997-98 13.99 13.99 -

17
AFCONS INFRASTRUCTURE LIMITEDStatute Nature
of Dues
Forum where Dispute is pending
Period to which the amount relates
Amount (Rs. in Lacs)
Amount Paid / Adjusted
(Rs. In Lacs)
Net Balance(Rs. in Lacs)
Orissa Sales Tax Act, 1947 Sales Tax
Appellate Tribunal of Sales Tax, Cuttak
1998-99 206.74 183.96 22.78
Orissa Sales Tax Act, 1947 Sales Tax
Addn. Commissioner of Sales Tax, Cuttak
1998-99 194.75 151.63 43.12
Orissa Sales Tax Act, 1947 Sales Tax
High Court, Orissa 1999-00 184.07 153.44 30.63
Orissa Sales Tax Act, 1947 Sales Tax
Addn. Commissioner of Sales Tax, Behrampur
2000-01 109.84 107.74 2.10
Orissa Sales Tax Act, 1947 Sales Tax
Addn. Commissioner of Sales Tax, Bhubaneshwar
2004-05 43.82 28.45 15.37
Tamilnadu General Sales Tax Act, 1959
Sales Tax
Dy. Commissioner Of Commercial Taxes, Chennai
1992-93, 1994-951995-96, 1996-97
13.47
12.47
1.00
West Bengal Sales Tax Act, 1954
Sales Tax
Sales Tax Appellate Tribunal, Kolkatta
1987-88, 1988-89
11.24 5.32 5.92
West Bengal Sales Tax Act, 1954
Sales Tax
Dy. Commissioner of Commercial Taxes, Durgapur
1994-95, 1996-97
32.42 21.39 11.03
Central Excise Act, 1944 Excise Duty
CESTAT, New Delhi 2009-10 145.02 - 145.02
Central Excise Act, 1944 Service Tax
Commissioner of Service Tax 2007-08 2.84 - 2.84
Income Tax Act, 1961 Income Tax
Deputy Commissioner of Income Tax
2005-06 913.58 913.58 -
(xi) The company does not have accumulated losses as at the end of the year. The company has not incurred cash losses during the fi nancial year covered by our audit and in the immediately preceding fi nancial year.
(xii) In our opinion and according to the information and explanations given to us, the Company has not defaulted in the repayment of dues to banks, and fi nancial institutions.
(xiii) In our opinion and according to the information and explanations given to us, the Company has not granted any loans and advances on the basis of security by way of pledge of shares, debentures and other securities.
(xiv) In our opinion and according to the information and explanations given to us, the terms and conditions of the guarantees given by the Company for loans taken by others from banks and fi nancial institutions are not prima facie prejudicial to the interests of the Company.
(xv) In our opinion and according to the information and explanations given to us, the term loans have been applied for the purposes for which they were obtained, other than temporary deployment pending application.
(xvi) In our opinion and according to the information and explanations given to us and on an overall examination of the Balance Sheet, we report that funds raised on short-term basis have not been used during the year for long- term investment.
(xvii) According to the information and explanations given to us, the Company has not made preferential allotment of shares to parties and companies covered in the Register maintained under Section 301 of the Companies Act, 1956. Hence, clause (xviii) regarding preferential allotment of shares of paragraph 4 of the Order is not applicable to the Company for the year.
(xviii) The Company has not issued any debentures during the year. Hence, the requirement of reporting on creation of security in respect of debentures issued under clause (xix) of the order does not arise.
(xix) The Company has not raised any money by public issue during the year.(xx) To the best of our knowledge and according to the information and explanations given to us, no fraud by the Company and no material fraud on
the Company has been noticed or reported during the year.
For Deloitte Haskins & Sells For J.C. Bhatt & AssociatesChartered Accountants Chartered Accountants(Registration No. 117366W) (Registration No. 130923W)
R. Laxminarayan J. C. BhattPartner PartnerMembership No. 33023 Membership No. 10977
Place : MumbaiDated :22nd August, 2012
AFCONS INFRASTRUCTURE LIMITED

18
AFCONS INFRASTRUCTURE LIMITEDBALANCE SHEET AS AT 31ST MARCH, 2012
Note As at As at No. 31st March,2012 31st March,2011 R in Lacs R in LacsA. EQUITY AND LIABILITIES1. Shareholders’ funds (a) Share capital 3 42,197.02 42,183.95 (b) Reserves and surplus 4 32,989.46 24,459.48 75,186.48 66,643.43 2. Non-current liabilities (a) Long-term borrowings 5 26,369.85 18,685.88 (b) Deferred tax liabilities (net) 6 7,626.97 5,760.42 (c) Other long-term liabilities 7 5,501.88 2,474.07 (d) Long-term provisions 8 689.18 574.88 40,187.88 27,495.25 3. Current liabilities (a) Short-term borrowings 9 41,441.59 43,119.82 (b) Trade payables 10 42,459.07 21,222.25 (c) Other current liabilities 11 55,665.56 39,816.78 (d) Short-term provisions 12 312.29 507.78 139,878.51 104,666.63 TOTAL 255,252.87 198,805.31
B. ASSETS 1. Non-current assets (a) Fixed assets (i) Tangible assets 13A 54,173.52 41,686.62 (ii) Intangible assets 13B 480.05 102.60 (iii) Capital work-in-progress 13C 31,497.24 472.64 86,150.81 42,261.86 (b) Non-current investments 14 391.98 296.76 (c) Long-term loans and advances 15 11,417.19 3,736.98 (d) Other non-current assets 16 32,134,59 41,031.59 130,094.57 87,327.19 2. Current assets (a) Inventories 17 51,241.13 37,006.57 (b) Trade receivables 18 36,666.29 25,831.54 (c) Cash and cash equivalents 19 3,584.55 16,004.87 (d) Short-term loans and advances 20 33,494.38 28,992.64 (e) Other current assets 21 171.95 3,642.50 125,158.30 111,478.12 TOTAL 255,252.87 198,805.31
See accompanying notes 1 to 46 forming part of the fi nancial statements
In terms of our report attached For and on Behalf of the Board of Directors For DELOITTE HASKINS & SELLS For J.C. BHATT & ASSOCIATES S.P.MISTRY K.SUBRAHMANIAN CHARTERED ACCOUNTANTS CHARTERED ACCOUNTANTS Chairman Managing Director R. LAXMINARAYAN J.C.BHATT S.PARAMASIVAN P.R.RAJENDRANPartner Partner Deputy Managing Director Company Secretary
Place: MumbaiDate: 22nd August, 2012

19
AFCONS INFRASTRUCTURE LIMITEDSTATEMENT OF PROFIT AND LOSS FOR THE YEAR ENDED 31ST MARCH, 2012 Note For the Year ended For the Year ended No. 31st March,2012 31st March,2011 R in Lacs R in Lacs 1. Revenue from operations 22 155,348.24 107,996.42 2. Other income 23 9,411.65 6,355.59
3. Total revenue (1 + 2) 164,759.89 114,352.01 4. Expenses (a) Cost of construction 24 100,851.47 64,309.76 (b) Cost of traded Goods 25 794.99 - (c) Employee benefi ts expense 26 21,287.18 16,971.12 (d) Finance costs 27 11,342.51 7,212.00 (e) Depreciation and amortisation expense 13D 3,789.21 3,243.11 (f) Other expenses 28 15,546.63 13,732.23 Total expenses 153,611.99 105,468.22 5. Profi t before tax (3 - 4) 11,147.90 8,883.79 6. Tax expense: (a) Tax expense for current year 3,145.40 1,660.20 (b) (Less): MAT credit (1,323.04) - (c) Deferred tax 1,866.55 1,323.78 (d) Tax expense relating to prior years (including MAT R 485.15 Lacs) (1,128.15) 31.59 2,560.76 3,015.57 7. Profi t for the year from continuing operations (5 - 6) 8,587.14 5,868.22 8. Earnings per share (of R 10/- each): 41 (a) Basic 11.94 8.18 (b) Diluted 2.55 1.74 See accompanying notes 1 to 46 forming part of the fi nancial statements In terms of our report attached For and on Behalf of the Board of Directors For DELOITTE HASKINS & SELLS For J.C. BHATT & ASSOCIATES S.P.MISTRY K.SUBRAHMANIAN CHARTERED ACCOUNTANTS CHARTERED ACCOUNTANTS Chairman Managing Director R. LAXMINARAYAN J.C.BHATT S.PARAMASIVAN P.R.RAJENDRANPartner Partner Deputy Managing Director Company Secretary
Place: MumbaiDate: 22nd August, 2012
20
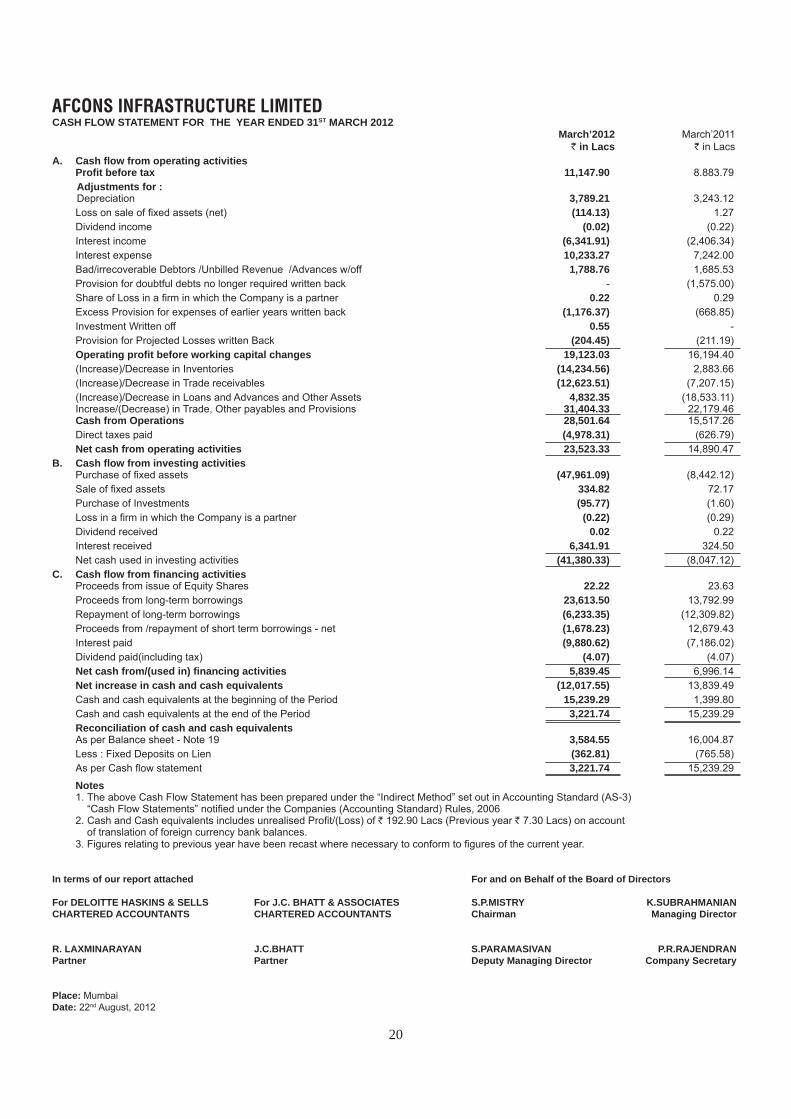
AFCONS INFRASTRUCTURE LIMITEDCASH FLOW STATEMENT FOR THE YEAR ENDED 31ST MARCH 2012 March’2012 March’2011 R in Lacs R in Lacs A. Cash fl ow from operating activities Profi t before tax 11,147.90 8.883.79 Adjustments for : Depreciation 3,789.21 3,243.12 Loss on sale of fi xed assets (net) (114.13) 1.27 Dividend income (0.02) (0.22) Interest income (6,341.91) (2,406.34) Interest expense 10,233.27 7,242.00 Bad/irrecoverable Debtors /Unbilled Revenue /Advances w/off 1,788.76 1,685.53 Provision for doubtful debts no longer required written back - (1,575.00) Share of Loss in a fi rm in which the Company is a partner 0.22 0.29 Excess Provision for expenses of earlier years written back (1,176.37) (668.85) Investment Written off 0.55 - Provision for Projected Losses written Back (204.45) (211.19) Operating profi t before working capital changes 19,123.03 16,194.40 (Increase)/Decrease in Inventories (14,234.56) 2,883.66 (Increase)/Decrease in Trade receivables (12,623.51) (7,207.15) (Increase)/Decrease in Loans and Advances and Other Assets 4,832.35 (18,533.11) Increase/(Decrease) in Trade, Other payables and Provisions 31,404.33 22,179.46 Cash from Operations 28,501.64 15,517.26 Direct taxes paid (4,978.31) (626.79) Net cash from operating activities 23,523.33 14,890.47 B. Cash fl ow from investing activities Purchase of fi xed assets (47,961.09) (8,442.12) Sale of fi xed assets 334.82 72.17 Purchase of Investments (95.77) (1.60) Loss in a fi rm in which the Company is a partner (0.22) (0.29) Dividend received 0.02 0.22 Interest received 6,341.91 324.50 Net cash used in investing activities (41,380.33) (8,047.12) C. Cash fl ow from fi nancing activities Proceeds from issue of Equity Shares 22.22 23.63 Proceeds from long-term borrowings 23,613.50 13,792.99 Repayment of long-term borrowings (6,233.35) (12,309.82) Proceeds from /repayment of short term borrowings - net (1,678.23) 12,679.43 Interest paid (9,880.62) (7,186.02) Dividend paid(including tax) (4.07) (4.07) Net cash from/(used in) fi nancing activities 5,839.45 6,996.14 Net increase in cash and cash equivalents (12,017.55) 13,839.49 Cash and cash equivalents at the beginning of the Period 15,239.29 1,399.80 Cash and cash equivalents at the end of the Period 3,221.74 15,239.29 Reconciliation of cash and cash equivalents As per Balance sheet - Note 19 3,584.55 16,004.87 Less : Fixed Deposits on Lien (362.81) (765.58) As per Cash fl ow statement 3,221.74 15,239.29
Notes 1. The above Cash Flow Statement has been prepared under the “Indirect Method” set out in Accounting Standard (AS-3) “Cash Flow Statements” notifi ed under the Companies (Accounting Standard) Rules, 2006 2. Cash and Cash equivalents includes unrealised Profi t/(Loss) of R 192.90 Lacs (Previous year R 7.30 Lacs) on account of translation of foreign currency bank balances. 3. Figures relating to previous year have been recast where necessary to conform to fi gures of the current year.
In terms of our report attached For and on Behalf of the Board of Directors For DELOITTE HASKINS & SELLS For J.C. BHATT & ASSOCIATES S.P.MISTRY K.SUBRAHMANIAN CHARTERED ACCOUNTANTS CHARTERED ACCOUNTANTS Chairman Managing Director R. LAXMINARAYAN J.C.BHATT S.PARAMASIVAN P.R.RAJENDRANPartner Partner Deputy Managing Director Company Secretary
Place: MumbaiDate: 22nd August, 2012
21
AFCONS INFRASTRUCTURE LIMITEDNotes forming part of the fi nancial statements for the year ended 31st March, 2012
1 Corporate information Afcons Infrastructure Limited is an unlisted Public Limited company domiciled in India and incorporated under the provisions of the Companies Act, 1956.
Afcons is a part of the Shapoorji Pallonji Group. Afcons has a presence in almost the entire spectrum of infrastructure activities in India and Overseas. The Company is engaged in Marine Works, Highways, Bridges, Metro Works, Power Houses, Tunnels, Oil & Gas, LNG Tanks and other general Civil Engineering Projects both in India and Overseas.
2 Signifi cant accounting policies 2.1 Basis of Accounting The Accounts are prepared on accrual basis under the historical cost convention and to comply in all material aspects with applicable accounting
principles in India, the accounting standards notifi ed under the Companies (Accounting Standards) Rules, 2006 and the relevant provisions of the Companies Act, 1956 as amended from time to time.
2.2 Use of estimates The preparation of fi nancial statements in conformity with GAAP requires that the management of the company makes estimates and assumptions
that affect the reported amounts of income and expenses of the period, the reported balances of assets and liabilities and the disclosures relating to contingent liabilities as of the date of the fi nancial statements. The estimates and assumptions used in the accompanying fi nancial statements are based upon Management’s evaluation of the relevant facts and circumstances as on the date of fi nancial statements. All information on key policies and the basis of the estimates and the major sources of uncertainities have been disclosed along with the respective note. Examples of such estimates include the useful lives of fi xed assets, provision for doubtful debts / advances, future obligations in respect of retirement benefi t plans, etc. Difference between actual results and estimates are recognised in the period in which the results are known / materialise.
2.3 Cash fl ow statement Cash fl ows are reported using the indirect method, whereby profi t / (loss) before extraordinary items and tax is adjusted for the effects of transactions
of non-cash nature and any deferrals or accruals of past or future cash receipts or payments. The cash fl ows from operating, investing and fi nancing activities of the Company are segregated based on the available information.
Cash comprises cash on hand and demand deposits with banks. Cash equivalents are short-term (with an original maturity of three months or less from the date of acquisition), highly liquid investments that are readily convertible into known amounts of cash and which are subject to insignifi cant risk of changes in value.
2.4 Tangible Fixed Assets Tangible Fixed assets are stated at cost of acquisition/construction; inclusive of inward freight, duties, taxes, installation expenses and any expenses
directly attributable to the assets to bring them to site and in working condition for its intended use; or book value and include amounts added on revaluation less accumulated depreciation (refer note 13(2)) and impairment loss, if any.
Leasehold improvements have been capitalized and are written off over the primary lease term not exceeding fi ve years.2.5 Intangible Fixed Assets Intangible assets are recognized as per the criteria specifi ed in Accounting Standard (AS) 26 – “Intangible Assets”.2.6 Depreciation & Amortisation Depreciation on fi xed assets (including revalued assets) is provided on the straight-line basis in accordance with the provisions of the Companies Act,
1956, at the rates and in the manner specifi ed in schedule XIV to the Act. Capital spares consumed are capitalized and amortized over a period of four years. The difference between depreciation on revalued cost and original cost has been withdrawn from Revaluation Reserve and credited to the statement
of Profi t and Loss. Cost of the Intangible Assets viz computer software is amortized over a period of fi ve years.2.7 Impairment An asset is treated as impaired when the carrying cost of the asset exceeds its recoverable value. Recoverable amount is the higher of an asset’s net
selling price and its value in use. Value in use is the present value of estimated future cash fl ows expected to arise from the continuing use of the asset and from its disposal at the end of its useful life. Net selling price is the amount obtainable from sale of the asset in an arm’s length transaction between knowledgeable, willing parties, less the costs of disposal. An impairment loss is charged to the Profi t & Loss in the year in which an asset is identifi ed as impaired. The impaired loss recognised in prior accounting periods is reversed if there has been a change in the estimate of the recoverable value.
2.8 Investments Current investments are carried at lower of cost and fair value. Long-term investments are carried at cost. However, when there is
a decline, other than temporary in the value of the long term investment, the carrying amount is reduced to recognize the decline.Investment in shares of the subsidiaries registered outside India, are stated at cost by converting at the rate of exchange prevalent at the time of acquisition thereof.
2.9 Inventoriesa) Construction materials, stores and spare parts are valued at lower of cost and net realizable value. Cost is determined on the basis of weighted
average method. Cost of shuttering materials (included in construction materials), issued to jobs, is charged off equally over a period of four years.b) Construction Work in Progress : Work done remaining to be certifi ed / billed is treated as Construction Work in Progress in the accounts. The same
is valued at the realizable value. Site Mobilisation Advance is stated at cost.2.10 Retention monies Amounts retained by the clients until satisfactory completion of the contract(s) are recognised in the fi nancial statements as receivables. Where such
retention monies have been released by the clients against submission of bank guarantees, the amounts so released are adjusted against receivables from these clients.

22
AFCONS INFRASTRUCTURE LIMITED
2.11 Foreign currency transactions Transactions in foreign currency, including in respect of branch operations integral in nature, are recorded at the average rates of exchange in force for
the period. At the year end, monetary items, including those of branch operations integral in nature, denominated in foreign currency are reported using the closing rates of exchange. Exchange differences arising thereon and on realization/ payment of foreign exchange are accounted for in the relevant year as income or expense.
2.12 Revenue recognition on contracts a. Contract revenue and expenses are recognized, when outcome can be estimated reliably, on the basis of percentage completion method.
Percentage of completion is determined based on the nature of contracts, either in proportion of contract costs incurred upto the reporting date to the estimated total cost or on the basis of physical proportion of the contract work completed.
b. Contract revenue in case of ‘Cost Plus’ contracts is determined by adding the aggregate cost plus proportionate margin as agreed with the customer.
c. Variations (in contracts) and amounts in respect thereof are recognized only when it is probable that the customer(s) will approve them and amounts can be measured reliably.
d. Claims and amounts in respect thereof are recognized only when negotiations have advanced to a stage where it is probable that the customer(s) will accept them and amounts can be reliably measured. In the case of Arbitration Awards (the “Awards”) which are granted unanimously in favor of the Company, the claims awarded, are accounted in the year the Awards are received. The interest granted on such claims is recognised as per terms of the Awards.
e. Revenue is recognised only when no signifi cant uncertainties exist regarding its measurement and collectability.2.13 Export Benefi ts: Export benefi ts in the form of duty credit entitlement licenses granted by the Government of India under the “Served from India” scheme, on the basis
of export realizations made are recognised on the basis and to the extent of actual utilisation and management’s estimate of their likely utilisation.2.14 Provision for Estimated Losses Estimated losses, if any, in respect of contracts in progress are provided for based upon current estimates of cost to completion.2.15 Employee benefi ts
i) Gratuity Company’s liability towards gratuity is determined by actuarial valuation carried out by the independent actuary as at each balance sheet date.
The actuarial valuation method used for measuring the liability is the Projected Unit Credit method.ii) Superannuation
The trustees of Afcons Infrastructure Limited Superannuation Scheme Trust have taken a Group Superannuation policy from the LIC. Provision for superannuation is made on the basis of premium payable in respect of the aforesaid policy.
iii) Provident fund Contribution as required under the statute/ rules is made to the Government Provident Fund.iv) Compensated absences The liability for compensated absences is determined by actuarial valuation carried out by the independent actuary as at each balance sheet date
and provided for as incurred in the period in which services are rendered by employees. The actuarial valuation method used for measuring the liability is the Projected Unit Credit method.
v) Other Benefi ts The undiscounted amount of short-term employee benefi ts expected to be paid in exchange for the services rendered by the employees is
recognized during the period when the employee renders the service.vi) Actuarial gains and losses The actuarial gains and losses are recognised immediately in the statement of Profi t and Loss Account.
2.16 Borrowing costs Borrowing costs that are attributable to the acquisition, construction or production of qualifying assets are capitalized as a part of the cost of such assets.
A qualifying asset is one that necessarily takes a substantial period of time to get ready for its intended use or sale. All other borrowing costs are charged to revenue.
2.17 Segment Reporting The following accounting policies have been followed for segment reporting:
i. Segment Revenue includes income directly identifi able with / allocable to the segment. ii. Expenses that are directly identifi able with / allocable to segments are considered for determining the Segment Results. The expenses which
relate to the Group as a whole and not allocable to segments are included under Unallocable expenses.iii. Segment assets and liabilities include those directly identifi able with the respective segments.
2.18 Leases Assets leased out under operating leases are capitalised. Rental Income is recognised on straight line basis over the lease term.
Assets acquired on lease where signifi cant portions of the risks and rewards incidental to ownership are retained by the lessors are classifi ed as operating leases. Lease rentals are charged to the statement of Profi t & Loss on straight line basis over the lease term.
2.19 Doubtful debts and advances Provision is made in the accounts for debts and advances which in the opinion of the management are considered doubtful of recovery.

23
AFCONS INFRASTRUCTURE LIMITED
2.20 Taxation Income taxes are accounted for in accordance with Accounting Standard (AS-22) “Accounting for taxes on income”, notifi ed under the Companies
(Accounting Standards) Rules, 2006. Income tax comprises both current and deferred tax. Current tax is measured on the basis of estimated taxable income and tax credits computed in accordance with the provisions of the Income Tax Act, 1961.
The tax effect of the timing differences that result between taxable income and accounting income and are capable of reversal in one or more subsequent periods are recorded as a deferred tax asset or deferred tax liability. They are measured using substantially enacted tax rates and tax regulations as of the Balance Sheet date.
Deferred tax assets arising mainly on account of brought forward losses and unabsorbed depreciation under tax laws, are recognized, only if there is virtual certainty of its realization, supported by convincing evidence. Deferred tax assets on account of other timing differences are recognized only to the extent there is a reasonable certainty of its realisation.
2.21 Interest Income Interest income is accounted on accrual basis.2.22 Provisions, Contingent Liabilities and Contingent Assets Provisions are recognized when the Company has a legal and constructive obligation as a result of a past event, for which it is probable that cash
outfl ow will be required and a reliable estimate can be made of the amount of the obligation. Contingent liabilities are disclosed when the Company has a possible or present obligation where it is not probable that an outfl ow of resources will be required to settle it. Contingent assets are neither recognized nor disclosed.

24
AFCONS INFRASTRUCTURE LIMITEDNotes forming part of the fi nancial statements for the year ended 31st March, 2012
Particulars As at 31st March 2012 As at 31st March 2011 Number of R in Lacs Number of R in Lacs Shares Shares 3. SHARE CAPITAL a) Authorised : Equity Shares of R10 each 350,000,000 35,000.00 350,000,000 35,000.00 Preference Shares of R 10 each 650,000,000 65,000.00 650,000,000 65,000.00 TOTAL 1,000,000,000 100,000.00 1,000,000,000 100,000.00
b) Issued,Subscribed And Fully Paid-up : Equity Shares of R 10 each (Refer Note 1 below) 71,970,238 7,197.02 71,839,468 7,183.95 0.01% Non Cumulative and Non Profi t Participatory Convertible Preference Shares of R 10 each (Refer Note 2 below) 100,000,000 10,000.00 100,000,000 10,000.00 0.01% Fully and Compulsorily Convertible Non-Cumulative, Non Participatory Preference shares (“Subscriber Perference Shares”) of R 10 each. (Refer Note 3 below) 250,000,000 25,000.00 250,000,000 25,000.00 TOTAL 421,970,238 42,197.02 421,839,468 42,183.95
3.1 Rights, preferences and restrictions attached to Equity Shares:
(a) Rights to receive dividend as may be approved by the Board / Annual General Meeting
(b) The Equity shares are not repayable except in the case of a buy back, reduction of capital or winding up in terms of the provision of the Companies Act, 1956.
(c) Every member of the company holding equity shares has right to attend the General Meeting of the company and has a right to speak and on a show of hands, has one vote if he is present in person and on a poll shall have the right to vote in proportion to his share of the paid-up capital of the company.
3.2 Rights, preferences and restrictions attached to 0.01% Non Cumulative and Non Profi t Participatory Convertible Preference Shares:
(a) The Preference Shares shall be non- cumulative and non profi t participating convertible Preference Shares carrying a fi xed rate of dividend of 0.01% per annum to be paid in priority to the holders of any other class of shares.
(b) The Preference Shares shall be deemed to be converted into common equity shares of the Company at a price of R 68.25 per equity share (consisting of par of R 10 and a premium of R 58.25) immediately, automatically and without any further act of the parties in the event of conversion of the Preference Shares mentioned in note 3.3 (b) below.
(c) Every member of the Company holding preference shares has a right to vote in the General Meeting of the Company on resolution placed before the Company which directly affects the rights attached to his preference shares.
3.3 Rights, preferences and restrictions attached to 0.01% Fully and Compulsorily Convertible Non-Cumulative, Non Participatory Preference shares: (a) The Subscriber Preference Shares shall be entitled to non-cumulative preferential dividend at a fi xed rate of 0.01% per annum to be paid in
priority to the holders of any other class of shares.
(b) The Subscriber Preference Shares shall be fully automatically and mandatorily converted in to equity shares on the Mandatory Conversion date (i.e. 13th January, 2013 being the 5th year from the date of issue viz. 14th January, 2008) at a value to be determined at the time of Conversion.
(c) The Subscriber Preference Shares shall rank senior to all types of shares issued or to be issued by the Company.
(d) The Company to obtained prior consent of the holder of Subscriber Preference Shares (either at meeting or by way of a consent letter) before (i) issue of further Preference Shares of the same or any other class; (ii) issue of Ordinary Shares which will result in a change of control; (iii) issue of securities entitling holders to acquire any shares of and / or voting rights in the Company; (iv) amendment of Memorandum of Association and Article of Association of the Company; (v) variation of rights of Subscriber Preference Shares.

25
AFCONS INFRASTRUCTURE LIMITEDNotes forming part of the fi nancial statements for the year ended 31st March, 2012
3.4 Reconciliation of the number of shares outstanding at the beginning and at the end of the year:
Particulars As at 31st March 2012 As at 31st March 2011 Number of R in Lacs Number of R in Lacs Shares Shares Equity shares outstanding at the beginning of the year 71,839,468 7,183.94 71,700,514 7,170.05 Add : Shares issued during the year under ESOP 130,770 13.08 138,954 13.90Equity shares outstanding at the end of the year 71,970,238 7,197.02 71,839,468 7,183.95
0.01% Non Cumulative and Non Profi t Participatory Convertible Preference Shares at the beginning of the year 100,000,000 10,000.00 100,000,000 10,000.00
Preference shares outstanding at the end of the year 100,000,000 10,000.00 100,000,000 10,000.00 0.01% Fully and Compulsorily Convertible Non-Cumulative Non Participatory Preference shares at the beginning of the year 250,000,000 25,000.00 250,000,000 25,000.00Preference shares outstanding at the end of the year 250,000,000 25,000.00 250,000,000 25,000.00
3.5 Details of shares held by the holding company, the ultimate holding company, their subsidiaries and associates: Particulars As at 31st March, 2012 As at 31st March, 2011 Equity 0.01% Non Equity 0.01% Non Shares Cumulative and Shares Cumulative and Non Profi t Non Profi t Participatory Participatory Convertible Convertible Preference Preference Shares Shares
Number of shares
Shapoorji Pallonji & Co. Ltd., the holding company 48,720,883 - 48,165,838 -
Subsidiaries of the holding company:
Floreat Investments Limited (FIL) 13,015,929 100,000,000 13,015,929 100,000,000
Renaissance Commerce Pvt.Limited 4,016,250 - 4,016,250 - Hermes Commerce Ltd. 4,016,250 - 4,016,250 - 3.6 Details of shares held by each shareholder holding more than 5% of shares of the Company:
Class of shares / Name of shareholder As at 31st March, 2012 As at 31st March, 2011 Number of % holding Number of % holding shares held shares held
Equity sharesShapoorji Pallonji & Co. Ltd. 48,720,883 67.70% 48,165,838 67.05%Floreat Investments Limited 13,015,929 18.09% 13,015,929 18.12%Renaissance Commerce Pvt. Ltd. 4,016,250 5.58% 4,016,250 5.59%Hermes Commerce Ltd. 4,016,250 5.58% 4,016,250 5.59%0.01% Non Cumulative and Non Profi t Participatory Convertible Preference Shares Floreat Investments Limited 100,000,000 100.00% 100,000,000 100.00%
0.01% Fully and Compulsorily Convertible Non-Cumulative Non Participatory Preference sharesIndia Infrastructure AIL (Mauritius) 250,000,000 100.00% 250,000,000 100.00%

26
AFCONS INFRASTRUCTURE LIMITEDNotes forming part of the fi nancial statements for the year ended 31st March, 2012 As at As at 31st March,2012 31st March,2011 R in Lacs R in Lacs4. Reserves and surplus (a) Capital reserve
Opening balance 19.13 19.13 Closing balance 19.13 19.13
(b) Capital redemption reserve
Opening balance 12.50 12.50 Closing balance 12.50 12.50
(c) Securities premium account
Opening balance 1,018.85 1,009.12 Add : Premium on shares issued during the year 9.15 9.73 Closing balance 1,028.00 1,018.85
(d) Revaluation reserve Opening balance 161.70 239.10 Less: Utilised for set off against depreciation (62.24) (77.40) Closing balance 99.46 161.70
(e) Contingencies reserve Opening balance 800.00 800.00 Closing balance 800.00 800.00
(f) General reserve Opening balance 5,552.16 5,552.16 Closing balance 5,552.16 5,552.16
(g) Surplus in Statement of Profi t and Loss Opening balance 16,895.14 11,030.99 Add: Profi t for the year 8,587.14 5,868.22 Less: Appropriations Proposed Dividend on Preference Shares (r.0.001 per share) 3.50 3.50 Tax on proposed dividend 0.57 0.57 Closing balance 25,478.21 16,895.14
Total 32,989.46 24,459.48
As at As at 31st March,2012 31st March,2011 R in Lacs R in Lacs5. Long-term borrowings (a) Working Capital loans (Unsecured)
From banks 7,500.00 15,000.00 (b) Equipment Loan (Secured)
From banks :
Rupee Loan 4,015.28 2,375.77 Foreign Currency Loan 10,174.00 -
(c) Other loans and advances
Foreign Currency Loan (Secured)
From banks 4,680.57 1,310.11 Total 26,369.85 18,685.88

27
AFCONS INFRASTRUCTURE LIMITEDAFCONS INFRASTRUCTURE LIMITEDNotes forming part of the fi nancial statements for the year ended 31st March, 2012 5. Long-term borrowings (Contd.)
Notes: (i) Details of terms of repayment of long-term borrowings and security provided in respect thereof: Particulars Terms of As at 31st March,2012 As at 31st March,2011 repayment Secured Unsecured Secured Unsecured and security R in Lacs R in Lacs R in Lacs R in Lacs
Working Capital loans from banksOriental Bank of Commerce - - - 5,000.00Allahabad Bank Refer Note (i) - - - 5,000.00Bank of India below - 7,500.00 - 5,000.00 Total - Term Loan - 7,500.00 - 15,000.00
Equipment Loan from banksRupee Loan:Indian Overseas Bank 693.97 - 830.40 - Oriental Bank of Commerce Refer Note (ii) 3,321.31 - 1,545.37 - belowForeign Currency Loan:DBS Bank Ltd 10,174.00 - - - Total - Equipment Loan 14,189.28 - 2,375.77 -
Other Loans and Advances from banks - Buyer’s Credit Foreign Currency Loans
State Bank of India Refer Note (iii) 3,902.26 - 1,310.11 - HSBC Bank below 778.31 - - - Total - Other loans and advances 4,680.57 - 1,310.11 - Total Long-term Borrowings 18,869.85 7,500.00 3,685.88 15,000.00
Notes: (i) Unsecured Working Capital loans from Banks carry interest ranging from 10% per annum to 11% per annum payable monthly. The repayment schedule of the loans are as follows.
Bank Name Loan Amount Repayment Repayment ( R in Lacs) in 2013-14 in 2014-15 ( R in Lacs) ( R in Lacs)
Bank of India 7,500.00 2 installments of 1 installment of R 2500.00 each R 2500.00 each
Previous Year
Bank Name Loan Amount Repayment Repayment ( R in Lacs) in 2012-13 in 2013-14 (R in Lacs) ( R in Lacs)
Oriental Bank of Commerce 5,000.00 1 installment of - R 5000.00
Allahabad Bank 5,000.00 1 installment of - R 5000.00
Bank of India 5,000.00 1 installment of 1 installment of R 2,500.00 R 2,500.00

28
AFCONS INFRASTRUCTURE LIMITEDNotes forming part of the fi nancial statements for the year ended 31st March, 2012
5. Long-term borrowings (Contd.)
(ii) Secured by fi rst charge by way of hypothecation of the equipments fi nanced. The Rupee loans carry interest ranging from 11% per annum to 12% per annum and Foreign currency loan carry interest @ Libor + 2.35%. The repayment schedule of the loans are as follows.Bank Name Loan Amount Repayment Repayment Repayment Repayment (r in Lacs) in 2013-14 in 2014-15 in 2015-16 in 2016-17 (r in Lacs) (r in Lacs) (r in Lacs) (r in Lacs)Rupee Loan:Indian Overseas Bank 693.97 2 installments of 2 installments of 2 installments of 1 installment of r 99.14 each r 99.14 each r 99.14 each r 99.13
Oriental Bank of Commerce 384.38 2 installments of - - - r 312.50 and r 71.88
Oriental Bank of Commerce 2,936.93 2 installments of 2 installments of 1 installments of - r 625.00 each r 625.00 each r 436.93Foreign Currency Loan:DBS Bank Ltd 10,174.00 - 3 installments of 4 installments of 3 installments of r 1,017.40 each r 1,017.40 each r 1,017.40 eachPrevious Year
Bank Name Loan Amount Repayment Repayment Repayment Repayment (r in Lacs) in 2012-13 in 2013-14 in 2014-15 in 2015-16 (r in Lacs) (r in Lacs) (r in Lacs) (r in Lacs)Rupee Loan:Indian Overseas Bank 830.40 4 installments of - - - r 185.00 each and 1 installment of r 90.40Oriental Bank of Commerce 1,545.37 2 installments of 1 installment of - - r 625.00 each r 295.37
(iii) The Loans carry interest @ Libor + 2.00%. State Bank of India loan are secured by a fi rst charge on the immovable properties of the Company situated in Andheri, Mumbai and Nagpur on a
pari-passu basis with other banks. It is further secured by hypothecation of the Company’s stocks of construction materials, stores and work in progress, and all other movable properties, plant and machinery and book debts on a pari-passu basis and also by goods covered under Letters of Credit.
HSBC Bank loan secured by fi rst charge by way of hypothecation of equipment fi nance. The repayment schedule of the loans are as follows:
Bank Name Loan Amount Repayment Repayment (R in Lacs) in 2013-14 in 2014-15 (R in Lacs) (R in Lacs)
State Bank of India 3,902.26 3 installments of 2 installments of R 727.95, R 755.42 & R 254.62, & R 1,763.88 R 400.39
HSBC Bank 778.31 - 1 installment of R 778.31Previous Year
Bank Name Loan Amount Repayment Repayment (R in Lacs) in 2013-14 in 2014-15 (R in Lacs) (R in Lacs)State Bank of India 1,310.11 2 installments of - R 636.99 and R 673.12
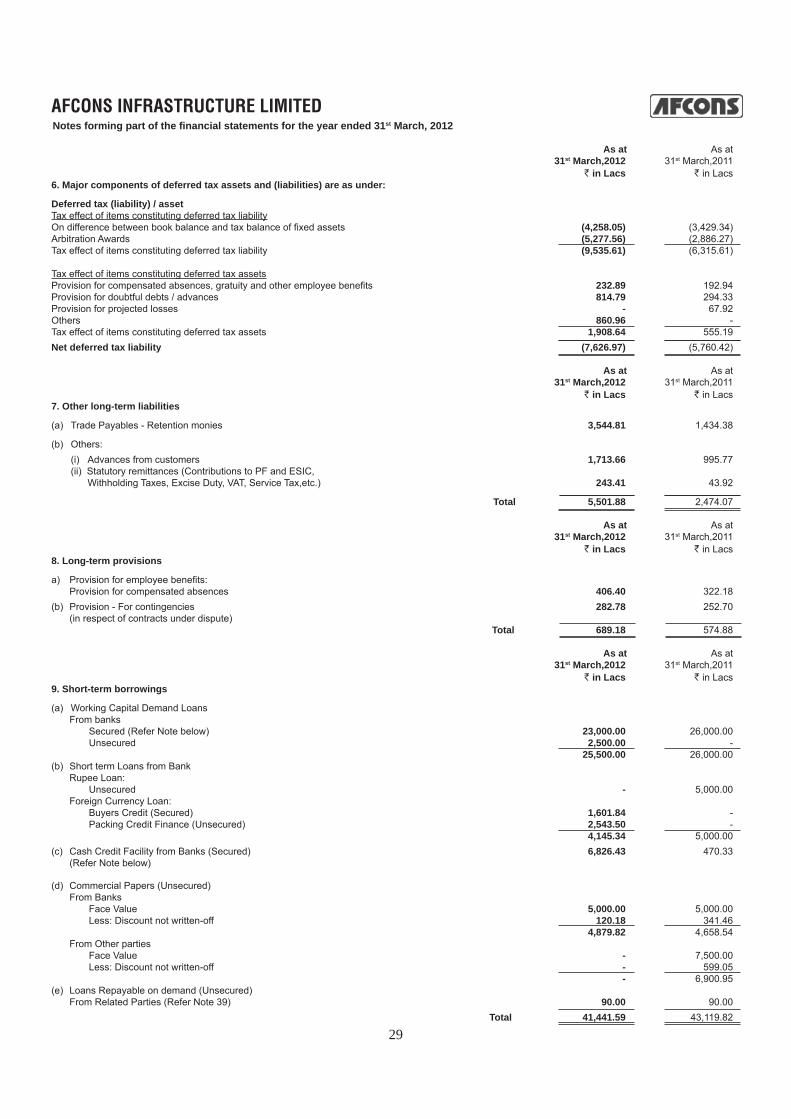
29
AFCONS INFRASTRUCTURE LIMITEDNotes forming part of the fi nancial statements for the year ended 31st March, 2012 As at As at 31st March,2012 31st March,2011 R in Lacs R in Lacs6. Major components of deferred tax assets and (liabilities) are as under:
Deferred tax (liability) / asset Tax effect of items constituting deferred tax liability On difference between book balance and tax balance of fi xed assets (4,258.05) (3,429.34)Arbitration Awards (5,277.56) (2,886.27)Tax effect of items constituting deferred tax liability (9,535.61) (6,315.61)
Tax effect of items constituting deferred tax assetsProvision for compensated absences, gratuity and other employee benefi ts 232.89 192.94Provision for doubtful debts / advances 814.79 294.33Provision for projected losses - 67.92Others 860.96 - Tax effect of items constituting deferred tax assets 1,908.64 555.19 Net deferred tax liability (7,626.97) (5,760.42)
As at As at 31st March,2012 31st March,2011 R in Lacs R in Lacs7. Other long-term liabilities
(a) Trade Payables - Retention monies 3,544.81 1,434.38
(b) Others: (i) Advances from customers 1,713.66 995.77 (ii) Statutory remittances (Contributions to PF and ESIC, Withholding Taxes, Excise Duty, VAT, Service Tax,etc.) 243.41 43.92
Total 5,501.88 2,474.07
As at As at 31st March,2012 31st March,2011 R in Lacs R in Lacs8. Long-term provisions
a) Provision for employee benefi ts: Provision for compensated absences 406.40 322.18(b) Provision - For contingencies 282.78 252.70 (in respect of contracts under dispute) Total 689.18 574.88 As at As at 31st March,2012 31st March,2011 R in Lacs R in Lacs9. Short-term borrowings
(a) Working Capital Demand Loans From banks Secured (Refer Note below) 23,000.00 26,000.00 Unsecured 2,500.00 - 25,500.00 26,000.00 (b) Short term Loans from Bank Rupee Loan: Unsecured - 5,000.00 Foreign Currency Loan: Buyers Credit (Secured) 1,601.84 - Packing Credit Finance (Unsecured) 2,543.50 - 4,145.34 5,000.00(c) Cash Credit Facility from Banks (Secured) 6,826.43 470.33 (Refer Note below)
(d) Commercial Papers (Unsecured) From Banks Face Value 5,000.00 5,000.00 Less: Discount not written-off 120.18 341.46 4,879.82 4,658.54 From Other parties Face Value - 7,500.00 Less: Discount not written-off - 599.05 - 6,900.95 (e) Loans Repayable on demand (Unsecured) From Related Parties (Refer Note 39) 90.00 90.00 Total 41,441.59 43,119.82

30
AFCONS INFRASTRUCTURE LIMITEDAFCONS INFRASTRUCTURE LIMITEDNotes forming part of the fi nancial statements for the year ended 31st March, 2012
9. Short-term borrowings (Contd.) Note: Details of security for the secured short-term borrowings: Particulars Terms of As at As at repayment 31st March,2012 31st March,2011 and security R in Lacs R in Lacs
Working Capital Demand Loans From banks: State Bank of India 15,000.00 18,000.00 Oriental Bank of Commerce 5,000.00 - IDBI Bank Refer Note below 3,000.00 - ING Vysya Bank - 4,500.00 Axis Bank - 3,500.00 Total - from banks 23,000.00 26,000.00 Short Term Loans from BankForeign Currency Loan Buyers Credit (Secured) Refer Note below 1,601.84 - Cash Credit Facility Refer Note below 6,826.43 470.33
Note: Secured by a fi rst charge on the immovable properties of the Company situated in Andheri, Mumbai and Nagpur on a pari-passu basis. It is further secured by hypothecation of the Company’s stocks of construction materials, stores and work in progress, and all other movable properties, plant and machinery and book debts on a pari-passu basis. Working Capital Demand Loans from banks carry interest ranging from 11.10% per annum to 11.25% per annum. Buyers Credit loans carry interest @ Libor +2.00% and Cash Credit Facility from Banks carry interest ranging from 11.50% per annum to 13.45% per annum.
As at As at 31st March,2012 31st March,2011 R in Lacs R in Lacs10. Trade payables Acceptances 668.05 425.31 Other than Acceptances (i) Total outstanding dues to micro,medium and small 107.69 0.96 enterprises (Refer Note 30) (ii) Total outstanding dues other than micro, medium and 41,683.33 20,795.98 small enterprises Total 42,459.07 21,222.25

31
AFCONS INFRASTRUCTURE LIMITEDNotes forming part of the fi nancial statements for the year ended 31st March, 2012
As at As at 31st March,2012 31st March,2011 R in Lacs R in Lacs 11. Other current liabilities
(a) Current maturities of long-term debt (Refer Note (i) below) 15,929.55 6,233.37(b) Interest accrued but not due on borrowings 209.36 562.01(c) Income received in advance (Unearned revenue) 115.61 12.75(d) Unpaid matured deposits and interest accrued thereon (Refer Note (ii) below) 5.08 6.50(e) Advance from Related Parties (Refer Note 39) From Joint Ventures 20,410.99 17,210.55 (f) Other payables (i) Statutory remittances (Contributions to PF and ESIC, Withholding Taxes, 4,293.71 2,754.38 Excise Duty, VAT, Service Tax, etc.) (ii) Interest accrued on advance from customers 361.89 78.79 (iii) Trade / security deposits received 12.80 6.87 (iv) Advances from customers 14,326.47 12,920.66 (v) Others 0.10 30.90 Total 55,665.56 39,816.78
Notes: (i) Refer Notes (ii) and (iii) in Note 5 - Long-term borrowings for details of security.
As at As at 31st March,2012 31st March,2011 R in Lacs R in Lacs(a) Working capital loans From banks (Unsecured) 12,500.00 2,500.00(b) Equipment Loan (Secured) 3,429.55 3,733.37 Total 15,929.55 6,233.37
(ii) This does not include any amount due and outstanding to be credited to the Investor Education and Protection Fund.
As at As at 31st March,2012 31st March,2011 R in Lacs R in Lacs12. Short-term provisions
(a) Provision for employee benefi ts: (i) Provision for compensated absences 40.60 50.17 (ii) Provision for gratuity (Refer Note 37) 267.12 208.47 307.72 258.64 (b) Provision - Others: (i) Provision for tax (net of advance tax R 138.90 Lacs (As 0.50 40.62 at 31 March, 2011 R 2606.95 Lacs) (ii) Provision for estimated losses on onerous contracts - 204.45 (iii) Proposed dividend on Preference shares 3.50 3.50 (iv) Tax on proposed dividend 0.57 0.57 4.57 249.14 Total 312.29 507.78

32
AFCONS INFRASTRUCTURE LIMITED
AFCO
NS
INFR
ASTR
UCT
UR
E LI
MIT
EDN
otes
form
ing
part
of t
he fi
nanc
ial s
tate
men
ts fo
r the
yea
r end
ed 3
1st M
arch
, 201
213
. FIX
ED A
SSET
S
(R in
Lac
s)
A.
TAN
GIB
LE A
SSET
S
G R
O S
S
B L
O C
KD
E P
R E
C I
A T
I O N
/ A
M O
R T
I S
A T
I O N
N
E T
B L
O C
K
Bal
ance
A
s at
1st A
pril,
20
11
Add
ition
sD
ispo
sals
Bal
ance
A
s at
31st M
arch
, 20
12
Bal
ance
A
s at
1st A
pril,
20
11
Depr
eciat
ion/
amor
tisati
onex
pens
e for
th
e yea
r
Adj
ustm
ents
Elim
inat
ed
on d
ispo
sal
of a
sset
s
Bal
ance
A
s at
31st M
arch
, 20
12
Bal
ance
As
at31
st M
arch
, 20
12
Bal
ance
As
at
31st M
arch
, 20
11
(a) L
and
Free
hold
1
.58
- -
1.5
8 -
- -
- -
1.5
8 1
.58
Leas
ehol
d 1
6.58
-
- 1
6.58
0
.48
0.1
6 -
- 0
.64
15.
94
16.
10
(b) B
uild
ings
1
,853
.54
- -
1,8
53.5
4 1
,229
.58
61.
75
- -
1,2
91.3
3 5
62.2
1 6
23.9
6
(c) P
lant
and
Equ
ipm
ent
55,
026.
02
15,
394.
18
(1,0
06.7
2) 6
9,41
3.48
1
8,71
8.33
3
,021
.02
- (8
83.0
0) 2
0,85
6.35
4
8,55
7.13
3
6,30
7.69
(d) F
urni
ture
and
Fix
ture
s 2
99.6
6 4
35.2
4 (1
6.79
) 7
18.1
1 8
7.87
4
5.87
-
(0.8
8) 1
32.8
6 5
85.2
5 2
11.7
9
(e) V
ehic
les
333
.09
287
.20
(66.
18)
554
.11
69.
32
30.
90
- (1
8.26
) 8
1.96
4
72.1
5 2
63.7
7
(f) O
ffi ce
Equ
ipm
ents
1
,641
.27
227
.42
(15.
16)
1,8
53.5
3 5
50.3
9 1
47.8
9 -
(4.2
5) 6
94.0
3 1
,159
.50
1,0
90.8
8
(g) L
ease
hold
impr
ovem
ents
279
.22
- -
279
.22
279
.22
- -
- 2
79.2
2 -
-
(h) F
loat
ing
Equ
ipm
ents
5
,031
.24
93.
22
(54.
44)
5,0
70.0
2 1
,905
.88
422
.08
- (3
2.21
) 2
,295
.75
2,7
74.2
7
3,1
25.3
6
(i) L
abor
ator
y E
quip
men
ts 8
5.45
- -
85.
45
39.
96
- -
- 3
9.96
4
5.49
45
.49
Tota
l 6
4,56
7.65
1
6,43
7.26
(1
,159
.29)
79,
845.
62
22,
881.
03
3,72
9.67
-
(9
38.6
0) 2
5,67
2.10
5
4,17
3.52
4
1,68
6.62
Pre
viou
s Ye
ar59
,068
.56
8,05
7.76
(2,5
58.6
7)64
,567
.65
22,0
77.1
73,
289.
09(3
9.51
)(2
,445
.72)
22,8
81.0
341
,686
.62
Not
es:
(1
) S
ome
of th
e Fi
xed
asse
ts v
iz.,
Pla
nt &
Equ
ipm
ent,
(incl
udin
g ce
rtain
item
s fu
lly w
ritte
n of
f in
prev
ious
yea
rs) L
abor
ator
y E
quip
men
t, B
arge
s (F
loat
ing
equi
pmen
ts),
New
& O
ld
W
orks
hop
and
Offi
ce B
uild
ing
as o
n 1st
Apr
il, 1
990
wer
e re
valu
ed o
n th
e ba
sis
of th
e va
luat
ion
mad
e by
the
exte
rnal
val
uers
resu
lting
in n
et in
crea
se o
f R 4
,551
.21
Lacs
bei
ng s
urpl
us
on re
valu
atio
n.
(2
) R
eval
ued
amou
nts
subs
titut
ed fo
r His
toric
al C
ost a
s at
1st A
pril,
199
0 an
d in
clud
ed u
nder
Gro
ss B
lock
are
as
unde
r :
i)
Pla
nt &
Equ
ipm
ent R
4,2
61.4
8 La
cs
ii)
Lab
orat
ory
Equ
ipm
ents
R 1
24.4
5 La
cs
iii)
Wor
ksho
p &
God
own
R 46
6.02
Lac
s
iv)
Bui
ldin
gs R
1,2
60.0
0 La
cs
v)
Bar
ges
(Flo
atin
g E
quip
men
ts)
R 89
9.78
Lac
s
(3
) P
lant
and
Equ
ipm
ent i
nclu
des
asse
ts fo
r a G
ross
Val
ue R
7,5
47.4
9 La
cs a
nd W
DV
R 6
,753
.89
Lacs
hyp
othe
cate
d in
favo
ur o
f Che
nnai
Met
ro R
ail L
td. o
n be
half
of T
rans
tonn
elst
roy
-
A
fcon
s Jo
int V
entu
re.
(4
) P
lant
and
Equ
ipm
ent i
nclu
des
asse
ts le
ased
to A
fcon
s G
unan
usa
Join
t Ven
ture
- G
ross
Val
ue R
Nil
(pre
viou
s ye
ar R
62.
87 L
acs)
, W
DV
R N
il (p
revi
ous
year
R 6
1.14
Lac
s)

33
AFCONS INFRASTRUCTURE LIMITED
AFCO
NS
INFR
ASTR
UCT
UR
E LI
MIT
EDN
otes
form
ing
part
of t
he fi
nanc
ial s
tate
men
ts fo
r the
yea
r end
ed 3
1st M
arch
, 201
213
. FIX
ED A
SSET
S
R in
Lac
s
BIn
tang
ible
ass
ets
G
R O
S S
B
L O
C K
D E
P R
E C
I A
T I O
N /
A M
O R
T I
S A
T I O
N
N E
T B
L O
C K
Bal
ance
A
s at
1st A
pril,
20
11
Add
ition
sD
ispo
sals
Bal
ance
A
s at
31st M
arch
, 20
12
Bal
ance
A
s at
1st A
pril,
20
11
Depr
eciat
ion/
amor
tisati
onex
pens
e for
th
e yea
r
Adj
ustm
ents
Elim
inat
ed
on d
ispo
sal
of a
sset
s
Bal
ance
A
s at
31st M
arch
, 20
12
Bal
ance
As
at31
st M
arch
, 20
12
Bal
ance
As
at
31st M
arch
, 20
11
Com
pute
r sof
twar
e -
Acq
uire
d17
2.73
499
.23
-67
1.96
70.1
312
1.78
--
191.
9148
0.05
102.
60
Pre
viou
s ye
ar
169
.20
3.53
-
172
.73
38.7
1 3
1.42
-
- 70
.13
102.
60
C.
Cap
ital W
ork
in P
rogr
ess
- Pla
nt a
nd e
quip
men
ts u
nder
inst
alla
tion
r 31
,497
.24
Lacs
(Pre
viou
s ye
ar r
472
.64
Lacs
)
D.
Dep
reci
atio
n an
d am
ortis
atio
n
Part
icul
ars
For t
he y
ear e
nded
Fo
r the
yea
r end
ed
31
st M
arch
,201
2 31
st M
arch
,201
1
R in
Lac
s
R in
Lac
s
Dep
reci
atio
n an
d am
ortis
atio
n fo
r the
yea
r on
tang
ible
ass
ets
as p
er (a
) abo
ve
3,
729.
67
3,2
89.0
9
D
epre
ciat
ion
and
amor
tisat
ion
for t
he y
ear o
n in
tang
ible
ass
ets
as p
er (b
) abo
ve
1
21.7
8
31.
42
3,
851.
45
3,3
20.5
1
Le
ss: U
tilis
ed fr
om re
valu
atio
n re
serv
e
62.2
4 77
.40
D
epre
ciat
ion
and
amor
tisat
ion
as p
er s
tate
men
t of P
rofi t
and
Los
s
3,7
89.2
1
3,2
43.1
1

34
AFCONS INFRASTRUCTURE LIMITEDNotes forming part of the fi nancial statements for the year ended 31st March, 2012 As at 31st March,2012 As at 31st March,2011 Face Value Quantity Amount Quantity Amount R in Lacs R in Lacs14. Non-current investments
A. Trade (Fully paid, at cost): (a) Investment in equity instruments (Unquoted) : (i) of subsidiaries Hazarat & Co. Ltd. R 10 202,610 20.26 202,610 20.26 Afcons Offshore & Marine Services Pvt. Ltd. R 10 100,000 25.50 100,000 25.50 Afcons Corrosion Protection Pvt. Ltd. R 10 80000 6.40 80,000 6.40 Afcons Infrastructure International Ltd. Euro 1 20,000 12.51 20,000 12.51 Afcons Construction Mideast LLC.* AED 1 147 17.65 147 17.65 Afcons Infrastructures Kuwait for Building,Road KD 1200 49 95.67 - - & Marine Contracting WLL
(ii) of associates Afcons (Mideast) Constructions & R 10 1 - 1 - Investments Pvt. Ltd.# 177.99 82.32
* Subsidiary on the basis of control on the composition of the Board of Directors. # denotes value less than rupees one thousand
(b) Investment in partnership fi rms : (Refer Note (iv) below) Afcons Pauling Joint Venture 174.00 174.00 174.00 174.00
Total - Trade (A) 351.99 256.32 B. Other investments (Fully paid, at cost):
(a) Investment in equity instruments (Quoted) Hindustan Oil Exploration Co. Ltd. R 10 40,072 29.34 40,072 29.34 Hindustan Construction Co. Ltd. R 1 1,000 0.03 1,000 0.03 Simplex Infrastructures Ltd. R 2 500 0.04 500 0.04 ITD Cementation India Ltd. R 1 100 0.42 100 0.42 Gammon India Ltd. R 2 250 0.06 250 0.06 29.89 29.89 (b) Investment in equity instruments (Unquoted) Simar Port Private Ltd. R 10 1,000 0.10 - - (c) Investment in government securities : R 0.55 - 0.55 (d) Investment in mutual funds (Unquoted): SBI Infrastructure Fund R 10 50,000 5.00 50,000 5.00 UTI Infrastructure Fund - Growth Plan R 10 12,731 5.00 12,731 5.00 10.00 10.00
Total - Other investments (B) 39.99 40.44
Total (A+B) 391.98 296.76 Notes:(i) Aggregate amount of quoted investments 29.89 29.89 (ii) Aggregate market value of quoted investments 46.58 83.33 (iii) Aggregate amount of unquoted investments 362.09 266.87(iv) Other details relating to investment in partnership fi rms
As at 31 March, 2012 As at 31 March, 2011
Name of the fi rm Names of Total capital Share of Names of Total capital Share of partners in (e in Lacs) each partners in (e in Lacs) each the fi rm partner in the fi rm partner in the profi ts the profi ts of the fi rm of the fi rm
Afcons Pauling Joint Venture Afcons Afcons Infrastructure 174.00 95.00% Infrastructure 174.00 95.00% Limited Limited
Pauling Plc - 5.00% Pauling Plc - 5.00%

35
AFCONS INFRASTRUCTURE LIMITEDNotes forming part of the fi nancial statements for the year ended 31st March, 2012 As at As at 31st March,2012 31st March,2011 R in Lacs R in Lacs15. Long-term loans and advances (Unsecured, considered good unless otherwise specifi ed)
(a) Capital advances 2,881.81 1,589.64
(b) Security deposits Unsecured, considered good 604.50 165.30 Doubtful 37.92 37.92 642.42 203.22 Less: Provision for doubtful deposits 37.92 37.92 604.50 165.30
(c) Prepaid expenses 249.73 6.21
(d) Advance income tax(net of provisions R 2,645.33 Lacs (As at 31 March, 2011 R 1,870.30 Lacs) 2,455.92 20.13
(e) MAT credit entitlement 1,877.28 69.09
(f) Balances with government authorities (i) VAT credit receivable 3,342.19 1,880.62 (ii) Other Deposits 5.76 5.99 3,347.95 1,886.61 Total 11,417.19 3,736.98
As at As at 31st March,2012 31st March,2011 R in Lacs R in Lacs16. Other non-current assets
(a) Long-term trade receivables - Under arbitration and Retention monies Unsecured, considered good 7,666.24 13,343.25 Doubtful 2,134.55 509.65 9,800.79 13,852.90 Less: Provision for doubtful trade receivables 2,134.55 509.65 7,666.24 13,343.25
(b) Construction work-in-progress - Under arbitration Unsecured, considered good 24,468.35 28,201.72 Doubtful 234.56 234.56 24,702.91 28,436.28 Less: Advances received - 513.38 Less: Provision for doubtful trade receivables 234.56 234.56 24,468.35 27,688.34
(c) Other Loans and Advances (Doubtful) 103.81 103.81 Less: Provision for other doubtful loans and advances 103.81 103.81 - -
(d) Other Bank Balances * 17.51 17.51 Less : Provision 17.51 17.51 - - Total 32,134.59 41,031.59
* The balances in these bank accounts are subject to exchange control restrictions for repatriation.

36
AFCONS INFRASTRUCTURE LIMITEDNotes forming part of the fi nancial statements for the year ended 31st March, 2012 As at As at 31st March,2012 31st March,2011 R in Lacs R in Lacs17. Inventories(At lower of cost and net realisable value)(a) Construction Materials Steel 4,832.64 3,446.09 Cement 303.35 202.62 Aggregate 1,798.38 497.54 Bitumen 34.06 - Shuttering Material 2,595.52 2,794.41 Sand 114.95 202.00 Other Construction Material 1,393.47 689.60 11,072.37 7,832.26
(b) Stores and spares 5,327.48 4,029.90
(c) Construction Work-in-Progress
At estimated realisable value 45,018.81 31,126.99 Less: Advances received 10,177.53 5,982.58 34,841.28 25,144.41
Total 51,241.13 37,006.57
As at As at 31st March,2012 31st March,2011 R in Lacs R in Lacs18. Trade receivablesTrade receivables outstanding for a period exceeding six months from the date they were due for payment Unsecured, considered good 10,435.88 12,735.30 Other Trade receivables Unsecured, considered good 26,230.41 13,096.24 Total 36,666.29 25,831.54
As at As at 31st March,2012 31st March,2011 R in Lacs R in Lacs19. Cash and Cash Equivalents
(a) Cash on hand 43.85 53.40 (b) Balances with banks (i) In current accounts 3,174.49 8,782.49 (ii) In deposit accounts (Refer Note (ii) below) 3.40 6,403.40 (iii) In earmarked accounts - Balances held as margin money or security against borrowings, guarantees and Other commitments (Refer Note (ii) below) 6.92 131.43
- Other earmarked accounts (Refer Note (i) below) 355.89 634.15 Total 3,584.55 16,004.87 Of the above, the balances that meet the defi nition of Cash and cash equivalents as per AS 3 Cash Flow Statements is 3,221.74 15,239.29
Notes: (i) Includes deposits R 335.11 Lacs (Previous Year R 335.11 Lacs) over which Banks and Clients have lien and R 20.78 Lacs (Previous year R 299.04 Lacs)
placed as Earnest Money Deposit with various authorities. (ii) Includes deposits amounting to R 3.40 Lacs (As at 31 March, 2011 R 3.40 Lacs) and margin monies amounting to R 6.92 Lacs (As at 31st March, 2011
R 6.92 Lacs) which have an original maturity of more than 12 months.

37
AFCONS INFRASTRUCTURE LIMITEDNotes forming part of the fi nancial statements for the year ended 31st March, 2012 As at As at 31st March,2012 31st March,2011 R in Lacs R in Lacs20. Short-term loans and advances (Unsecured, considered good)
(a) Loans and advances to related parties (Refer Note 39) To Subsidiaires 118.06 2,772.67 To Joint Ventures 22,194.51 12,302.46 To Partnership Firm 699.07 699.29 23,011.64 15,774.42 (b) Security deposits 219.51 429.50(c) Loans and advances to employees 77.73 54.97(d) Prepaid expenses 905.41 740.47(e) Balances with government authorities (i) CENVAT credit receivable - 55.00 (ii) VAT credit receivable 668.04 2,202.20 (iii) Service Tax credit receivable 11.58 60.41 (iv) Other Deposits 0.90 0.90 680.52 2,318.51 (f) Others - Advance to vendors and others 8,599.57 9,674.77 Total 33,494.38 28,992.64
As at As at 31st March,2012 31st March,2011 R in Lacs R in Lacs21. Other current assets
(a) Accruals (i) Interest accrued on bank deposits 32.95 30.23 (b) Others (i) Insurance claims 16.93 2.44 (ii) Duty Credit receivable 122.07 3,609.83 Total 171.95 3,642.50
For the year ended For the year ended 31st March,2012 31st March,2011 R in Lacs R in Lacs22. Revenue from operations
(a) Sale of products (Refer Note (i) below) 888.87 - (b) Sale of services (Refer Note (ii) below) 149,021.23 95,819.74 (c) Other operating revenues (Refer Note (iii) below) 5,438.14 12,176.68 Total 155,348.24 107,996.42
For the year ended For the year ended 31st March,2012 31st March,2011 R in Lacs R in Lacs(i) Sale of products comprises: Construction Materials 888.87 - Total - Sale of products 888.87 -(ii) Sale of services comprises: Construction Revenue 152,519.12 99,792.32 Less : Value added tax 3,497.89 3,972.58 Total - Sale of services 149,021.23 95,819.74 (iii) Other operating revenues comprise: Project Management Fees 1,329.02 5,296.71 Sale of scrap 800.79 756.36 Duty Scrip credit availed 2,349.02 3,426.26 Equipment Hire Charges 216.08 1,997.83 Service Charges 50.23 699.52 Distribution of Profi ts from a Joint Venture 693.00 - Total - Other operating revenues 5,438.14 12,176.68

38
AFCONS INFRASTRUCTURE LIMITEDNotes forming part of the fi nancial statements for the year ended 31st March, 2012 For the year ended For the year ended 31st March,2012 31st March,2011 R in Lacs R in Lacs23. Other Income
(a) Interest income (Refer Note (i) below) 6,341.91 2,567.27
(b) Dividend income: From non trade,non current investments 0.02 0.22
(c) Other non-operating income (Refer Note (ii) below) 3,069.72 3,788.10 Total 9,411.65 6,355.59
For the year ended For the year ended 31st March,2012 31st March,2011 R in Lacs R in Lacs(i) Interest income comprises: Interest from banks deposits 118.99 64.35 Interest on loans and advances 950.43 278.88 Interest on Arbitration awards 5,258.92 2,062.61 Interest income from non current investments 1.65 0.50 Interest on income tax refund 11.92 160.93 Total - Interest income 6,341.91 2,567.27 (ii) Other non-operating income comprises: Profi t on sale of fi xed assets 114.13 - Liabilities / provisions no longer required written back 1,176.37 2,243.85 Insurance Claim received 245.91 581.65 Net Gain on foreign currency transactions and translation 797.65 - Provision for Projected Loss written back 204.45 211.19 Miscellaneous income 531.21 751.41 Total - Other non-operating income 3,069.72 3,788.10
For the year ended For the year ended 31st March,2012 31st March,2011 R in Lacs R in Lacs24. Cost of construction Cost of Construction Materials consumed 19,856.24 29,642.81 Other Construction Expenses: Consumption of stores and spare parts 8,374.20 1,642.38 Subcontracting 60,914.22 20,695.43 Site Installation 1,170.07 1,656.78 Technical Consultancy 2,788.95 3,023.72 Power and fuel 3,915.26 2,705.29 Freight and forwarding 4,301.55 5,458.51 101,320.49 64,824.92
Less: Recovery of Expenses (Refer Note 45) (469.02) (515.16) Total 100,851.47 64,309.76
For the year ended For the year ended 31st March,2012 31st March,2011 R in Lacs R in Lacs25. Cost of traded goods Construction Materials 794.99 - Total 794.99 -
For the year ended For the year ended 31st March,2012 31st March,2011 R in Lacs R in Lacs26. Employee benefi ts expense
Salaries and wages 18,873.22 16,501.61 Contributions to provident and other funds (Refer Note 37) 1,271.36 1,070.24 Staff welfare expenses 1,516.72 1,315.29 21,661.30 18,887.14 Less: Recovery of Expenses (Refer Note 45) (374.12) (1,916.02) Total 21,287.18 16,971.12

39
AFCONS INFRASTRUCTURE LIMITEDNotes forming part of the fi nancial statements for the year ended 31st March, 2012 For the year ended For the year ended 31st March,2012 31st March,2011 R in Lacs R in Lacs27. Finance costs(a) Interest expense on: (i) Borrowings 7,822.59 5,419.45 (ii) Advance from Clients 283.11 218.68 (iii) Interest on delayed / deferred payment of income tax 0.03 0.03 (iv) Interest on Advances from Joint Ventures 2,040.54 659.71 (v) Others 87.00 149.57
(b) Other borrowing costs (i) Bank Guaratnee Commission including Bank Charges 690.47 684.18 (ii) L/c charges & Processing Fees 492.92 184.68 11,416.66 7,316.30 Less: Recovery of Expenses (Refer Note 45) (74.15) (104.30) Total 11,342.51 7,212.00
For the year ended For the year ended 31st March,2012 31st March,2011 R in Lacs R in Lacs28. Other expenses Water and Electricity 203.16 185.42 Rent (Refer Note 40) 1,136.85 1,303.98 Repairs and maintenance - Buildings 0.31 3.18 Repairs and maintenance - Machinery 303.23 226.00 Repairs and maintenance - Others 887.15 1,104.90 Insurance 1,309.91 1,330.04 Rates and taxes 1,381.32 1,945.96 Communication 342.82 371.67 Travelling and conveyance 2,780.71 2,644.33 Security Charges 574.39 542.03 Donations and contributions 59.53 24.57 Legal and professional 3,461.33 2,714.56 Payments to auditors (Refer Note below) 55.63 52.94 Provision for bad trade and other receivables 1,624.91 1,685.53 Duty Scrip / Advances written off 163.85 - Net loss on foreign currency transactions and translation - 481.27 Directors Fees 6.10 6.90 Loss on sale of fi xed assets - 1.27 Share of Loss from partnership fi rm 0.22 0.29 Expenses of jobs completed in earlier year 30.08 30.00 Miscellaneous expenses 1,226.62 1,301.95 15,548.12 15,956.79 Less: Recovery of Expenses (Refer Note 45) (1.49) (2,224.56) Total 15,546.63 13,732.23 Note: For the year ended For the year ended 31st March,2012 31st March,2011 R in Lacs R in Lacs (i) Payments to the auditors comprises *
As auditors - statutory audit 25.50 26.50 For taxation matters 6.50 3.00 For other services 18.00 17.50 Reimbursement of expenses - 1.00 For Service tax 5.63 4.94 Total 55.63 52.94 * excludes payment of r 41.12 Lacs (Previous Year r 24.22 Lacs) for taxation matters to an affi lliated fi rm of one of the joint auditors covered by a networking arrangement which is registered with the institute of Chartered Accountants of India.

40
AFCONS INFRASTRUCTURE LIMITEDNotes forming part of the fi nancial statements for the year ended 31st March, 2012
29. Contingent liabilities and commitments (to the extent not provided for) R in Lacs
Sr. No.
Particulars As at 31st
March,2012As at 31st
March,2011
(i)a.
Contingent liabilitiesClaims against the Company not acknowledged as debts i) Differences with sub-contractors in regard to rates and quantity of materials. ii) Labour and other matters. The above claims are pending before various courts. The Company is confi dent that the cases will be successfully contested.
171.90 1.00
420.33 1.00
b. Guarantees i) Bank Guarantees given on behalf of Subsidiaries and Joint Ventures. ii) Corporate Guarantees given on behalf of Subsidiaries and Joint Ventures.
141,543.60 80,324.20
130,634.9871,599.84
c. Sales Tax and Entry TaxRepresents demands raised by Sales Tax Authorities in matters of disallowance of labour and service charges, consumables etc. for which appeal is pending before various appellate authorities. The Company is confi dent that the cases will be successfully contested.
1,947.27 1,924.55
d. Excise Duty Represents demands raised by Central Excise Department for Excisability of girders. The Company is confi dent that the cases will be successfully contested.
145.02 145.02
e. Service Tax Represents demand confi rmed by the Asst. Commissioner of Service Tax for disallowance of Cenvat Credit, since abatement claimed by the Company. The Company has appealed against the said order with Commissioner of Service Tax Mumbai and is confi dent that Cenvat Credit will be allowed as it is project specifi c and abatement has not been availed on the same, by the Company.
229.27 2.84
f. Income Tax Represents notices u/s 201(1) and 201(1A) received from Income Tax Dept in respect of Non compliance of TDS. Company has fi led Appeals before the Appellate Authority & management is confi dent that the outcome of the appeals will be decided in company’s favor and the demand raised will be set aside.
- 913.58
Note:- In respect of items mentioned under Paragraphs (a), (c), (d), (e) and (f) above, till the matters are fi nally decided, the fi nancial effect cannot be ascertained.
(ii) Commitments
a. Estimated amount of contracts remaining to be executed on capital account and not provided for
4,113.88
4,295.36
30. Disclosures required under Section 22 of the Micro, Small and Medium Enterprises Development Act, 2006
R in Lacs
Particulars As at 31st
March,2012As at 31st
March,2011
(i) Principal amount remaining unpaid to any supplier as at the end of the accounting year 106.68 0.90
(ii) Interest due thereon remaining unpaid to any supplier as at the end of the accounting year 1.05 0.06
(iii) The amount of interest paid along with the amounts of the payment made to the supplier beyond the appointed day
- -
(iv) The amount of interest due and payable for the year - -
(v) The amount of interest accrued and remaining unpaid at the end of the accounting year 1.05 0.06
(vi) The amount of further interest due and payable even in the succeeding year, until such date when the interest dues as above are actually paid
- -
Dues to Micro and Small Enterprises have been determined to the extent such parties have been identifi ed on the basis of information collected by the Management. This has been relied upon by the auditors.

41
AFCONS INFRASTRUCTURE LIMITEDNotes forming part of the fi nancial statements for the year ended 31st March, 2012
31. Details on derivatives instruments and unhedged foreign currency exposures
Secured Loans taken in foreign currency as at the balance sheet date not covered by forward contracts are USD 32,913,427.60 and EURO 3,325,600 equivalent to r 16,743.06 Lacs and r 2,256.85 Lacs respectively (as on 31st March,2011 USD 2,916,000 equivalent to r 1,310.11 Lacs.) Receivables and Payables in foreign currency as at the balance sheet date not covered by forward contracts are r 20,943.91 Lacs (as at March 2011 r 17,961.13 Lacs) and r 23,759.52 Lacs (as at March 2011 r 18,843.84 Lacs) respectively as given below.
As at 31 March, 2012 As at 31 March, 2011
Receivable / (Payable)(r in Lacs)
Receivable / (Payable)in Foreign currency
Receivable / (Payable)(r in Lacs)
Receivable / (Payable)in Foreign currency
7.11 QR 50,831.77 28.43 QR 232,100
(34.54) (QR 247,074.60) (92.29) (QR 753,399)
1,142.76 OMR 862,627.41 3,096.38 OMR 2,629,175
(107.88) (OMR 81,433.47) (601.03) (OMR 510,342)
583.68 MAUR 32,000,172.7 730.29 MAUR 45,930,492
(458.32) (MAUR 25,127,319.08) (500.75) (MAUR 31,493,952)
4,950.07 UAED 35,743,157 8,345.33 UAED 67,628,242
(135.64) (UAED 979,365.49) (248.50) (UAED 2,013,779)
5,041.46 USD 9,910,466.33 1,985.82 USD 4,379,839
(7,502.20) (USD 14,747,788.07) (3,763.70) (USD 8,301,055)
1,094.93 EURO 1,613,451.95 74.11 EURO 112,516
(726.39) (EURO 1,070,379.05) (29.92) (EURO 47,449)
4,493.32 JOD 6,238,734.59 3,700.77 JOD 5,789,686
(12,050.68) (JOD 16,731,708.76) (13,607.65) (JOD 21,288,567)
3,465.62 BHD 2,552,038.65 - -
(2,738.45) (BHD 2,016,562.69) - -
0.96 KWD 525 - -
(0.31) (KWD 171.24) - -
163.92 JPY 26,740,665.71 - -
0.08 SDG 201.87 - -
(5.10) (GBP 6,271.93) - -
20,943.91 (23,759.52)
17,961.13(18,843.84)
QR- Qatari Riyal, OMR – Omani Riyal, MAUR - Mauritian Rupee, UAED- UAE Dirham, JOD- Jordanian Dinar, USD – United States Dollars, GBP- Great Britian Pound, SDG- Singapore Dollar, JPY- Japanese Yen, BHD- Bahraini Dinar, KWD- Kuwaiti Dinar.
32. Value of imports calculated on CIF basis
For the year ended For the year ended 31st March,2012 31st March,2011 R in Lacs R in Lacs
Components 2,611.77 3,402.16Capital goods 34,204.58 716.89 Total 36,816.35 4,119.05

42
AFCONS INFRASTRUCTURE LIMITEDNotes forming part of the fi nancial statements for the year ended 31st March, 2012
For the year ended For the year ended 31st March,2012 31st March,2011 R in Lacs R in Lacs
33. Expenditure in foreign currency
Construction materials consumed 10,512.86 7,788.21Sub – Contract and Hire Charges 48,116.09 7,031.83Technical consultancy fees 1,584.18 1,357.56Professional Fees 1,858.13 198.19Rent 402.85 341.44Salaries, Wages & Bonus 3,879.95 1,519.19Tax 351.97 203.16Freight & Transportation 1,892.44 3,539.71Traveling Expenses 671.00 486.46Staff Welfare Expenses 710.84 1,220.18Insurance 317.59 284.35Clearing Charges for imported spares 229.70 17.40Bank Guarantee Commission 354.75 349.56Repairs and Maintenance 187.97 271.93Others 1,095.92 1,039.05 Total 72,166.24 25,648.22
For the year ended For the year ended 31st March,2012 31st March,2011 R in Lacs R in Lacs34. Earnings in foreign currency
Value of work executed 87,101.23 31,950.53Sale of Scrap 40.83 73.73Insurance Claim Received 22.81 378.33Interest and Other Income 612.61 2,204.95Equipment Hire Charges 144.12 698.92Service Charges 49.63 1,622.67 Total 87,971.23 36,929.13
35. Expenses capitalized during the year on fabrication/ improvement of equipment that has resulted in increased future benefi ts beyond their previously assessed standard of performance are as under :
For the year ended For the year ended 31st March,2012 31st March,2011 R in Lacs R in LacsConstruction materials consumed 317.05 300.41Stores and spares consumed 143.77 86.37Repairs 83.54 176.35Others 84.07 31.60 Total 628.43 594.73
For the year ended For the year ended 31st March,2012 31st March,2011 R in Lacs R in Lacs36. Disclosure in accordance with Accounting Standard - 7 (Revised)Details of contract revenue and costs a) Contract Revenue 152,519.12 99,792.32 b) Disclosure for contracts in progress: (i) Aggregate amount of costs incurred 294,622.94 210,734.13 (ii) Recognized profi ts (less recognized losses) 68,344.05 59,594.03 (iii) Advances Received 25,622.14 19,865.73 (iv) Retention Money 3,071.72 2,761.11 c) Gross amount due from customers for contract work 40,743.61 13,270.98 d) Gross amount due to customers for contract work - 16,419.46

43
AFCONS INFRASTRUCTURE LIMITEDNotes forming part of the fi nancial statements for the year ended 31st March, 2012
37. The company has accounted liability for gratuity and compensated absences as per the Accounting Standard (AS- 15 Revised) on “Employee Benefi ts”. Reconciliation of opening and closing balance of the present value of the defi ned benefi t obligation for gratuity and long term compensated absences is given below: a) Gratuity (Funded)
A. Assumptions Current Year 31st March, 2011
Discount Rate 8.50% 8.25%
Rate of Return on Plan Assets 8.60% 8.00%
Salary Escalation 4.50% 4.50%
Mortality Table LIC (1994-96)Ultimate
LIC (1994-96)Ultimate
R in Lacs
B. Changes in the Benefi t Obligation Current Year 31st March, 2011
Liability at the Beginning of the current year 1,044.40 889.99
Interest Cost 86.16 73.42
Current Service Cost 90.96 92.21
Past Service Cost - -
Benefi t Paid (77.55) (119.57)
Actuarial Loss/ (Gain) on obligations 87.36 108.35
Liability at the end of the current year 1,231.33 1,044.40
C. Fair Value of the Plan Asset Current Year 31st March, 2011
Fair Value of Plan Asset at the beginning of the year 835.94 643.10
Expected Return on Plan Asset 66.88 51.45
Contributions 124.38 247.56
Benefi t paid (77.55) (119.57)
Actuarial Gain/ (Loss) on Plan Assets 14.57 13.40
Fair value of Plan Assets at the end of the year 964.21 835.94
Total Actuarial Loss to be Recognized (72.79) (94.95)
D. Actual Return on Plan Assets: Current Year 31st March, 2011
Expected Return on Plan Assets 66.88 51.45
Actuarial Gain/ (Loss) on Plan Assets 14.57 13.40
Actual Return on Plan Assets 81.45 64.85
E. Amount Recognized in the Balance Sheet: Current Year 31st March, 2011
Liability at the end of the year 1,231.33 1,044.40
Fair Value of Plan Assets at the end of the year 964.21 835.94
Unrecognized Past Service Cost - -
Amount recognized in the Balance Sheet (267.12) (208.46)

44
AFCONS INFRASTRUCTURE LIMITEDNotes forming part of the fi nancial statements for the year ended 31st March, 2012
R in Lacs
F. Expense Recognized in the Profi t and Loss Account: Current Year 31st March, 2011
Current Service Cost 90.96 92.21
Interest Cost 86.16 73.42
Expected Return on Plan Assets (66.88) (51.44)
Past Service Cost - -
Net Actuarial Gain / Loss to be recognized 72.79 94.95
Expense recognized in the Profi t and Loss Account under staff expenses 183.03 209.14
G. Reconciliation of the Liability recognized in the Balance Sheet: Current Year 31st March, 2011
Opening Net Liability 208.47 246.89
Expense recognized 183.03 209.14
Employers Contribution (124.38) (247.56)
Amount recognized in the Balance Sheet under “Provision for Retirement Benefi ts” 267.12 208.47
H. Major category of plan assets as percentage of total plan assets: (%) (%)
Insured Managed funds 100 100
(b) Compensated Absences (Non funded) :
Actuarial Assumptions Current Year 31st March, 2011
Mortality Table LIC (1994-1996) Ultimate
LIC (1994-1996) Ultimate
Discount Rate 8.50% 8.25%
Salary Escalation 4.50% 4.50%
Withdrawal Rate 2.00% 2.00%
Experience adjustments
Actuarial Assumptions 2011-2012 2010- 2011 2009- 2010 2008- 2009 2007- 2008
Gratuity
Present value of DBO 1,231.33 1,044.40 889.99 800.38 629.02
Fair value of plan assets 964.22 835.94 643.10 581.22 491.61
Funded status [Surplus / (Defi cit)] (267.12) (208.46) (246.89) (219.16) (137.41)
Experience gain / (loss) adjustments on planliabilities
(107.95) (108.35) (44.48) * *
Experience gain / (loss) adjustments on planassets
14.57 13.40 2.78 (0.98) (2.52)
* As per note iii The Company makes Provident Fund and Superannuation Fund contributions to defi ned contribution plans for qualifying employees. Under the Schemes,
the Company is required to contribute a specifi ed percentage of the payroll costs to fund the benefi ts. The Company recognised r 1251.87 Lacs (Year ended 31st March, 2011 r 489.05 Lacs) for Provident Fund contributions and r 475.00 Lacs (Year ended 31st March, 2011 r 349.29 Lacs ) for Superannuation Fund contributions in the Statement of Profi t and Loss. The contributions payable to these plans by the Company are at rates specifi ed in the rules of the schemes.
Note : i) Premium is paid to LIC under Group Gratuity Scheme of LIC. ii) The estimates of future salary increases, considered in actuarial valuation, take account of infl ation, seniority, promotion and other relevant factors such
as supply and demand in the employment market. The above information is certifi ed by the actuary and relied upon by the Auditors. iii) The details of experience adjustments on account of Plan Liability and Plan Asset as required by Para 120 (n) (ii) of AS-15 is r107.95 Lacs (loss) and
r 14.57 Lacs (gain) respectively. However, as the details of experience adjustments on account of Plan Liability and fot the year ened 31st March 2008 and 2009 are not readily available in valuation reports and hence not furnished.
iv) Contributions expected to be paid to the plan during the annual period beginning after the Balance Sheet date is r 348.53 Lacs. v) The expected return on plan assets is determined considering several applicable factors which includes mainly the composition of plan assets held,
assessed risks of asset management and historical result of the return on plan asset.
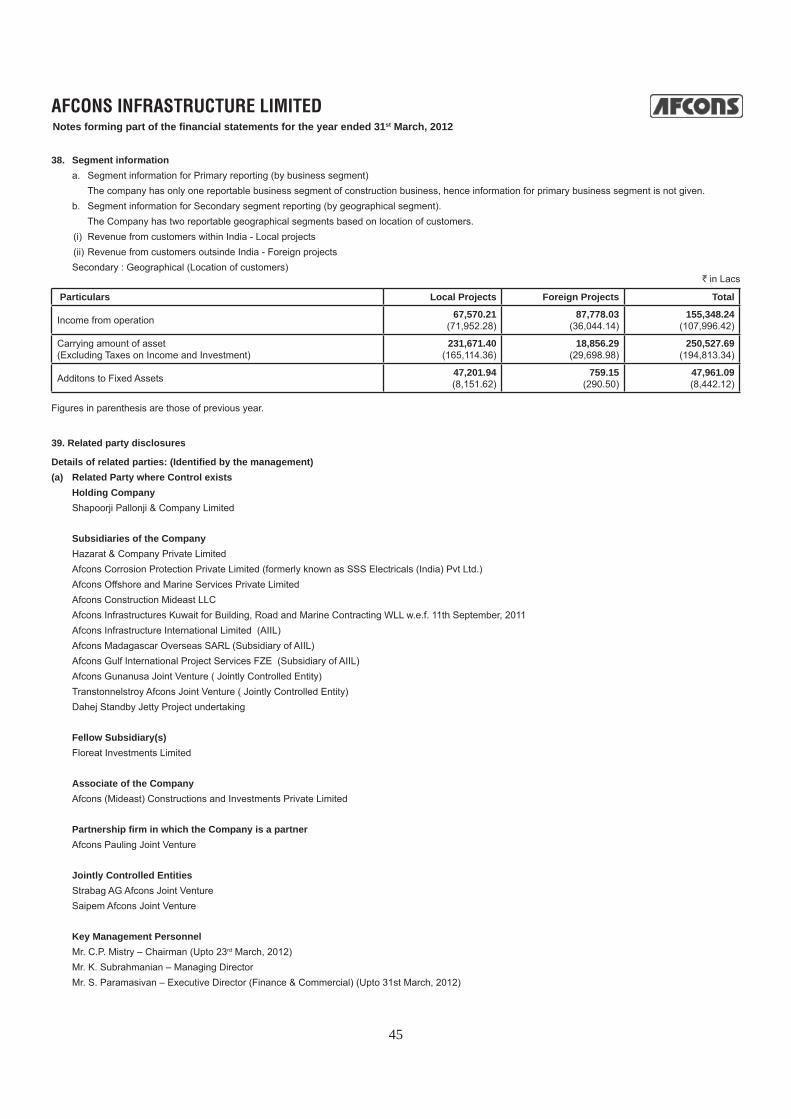
45
AFCONS INFRASTRUCTURE LIMITEDNotes forming part of the fi nancial statements for the year ended 31st March, 2012
38. Segment information a. Segment information for Primary reporting (by business segment) The company has only one reportable business segment of construction business, hence information for primary business segment is not given. b. Segment information for Secondary segment reporting (by geographical segment). The Company has two reportable geographical segments based on location of customers. (i) Revenue from customers within India - Local projects (ii) Revenue from customers outsinde India - Foreign projects Secondary : Geographical (Location of customers)
r in Lacs
Particulars Local Projects Foreign Projects Total
Income from operation 67,570.21(71,952.28)
87,778.03 (36,044.14)
155,348.24 (107,996.42)
Carrying amount of asset (Excluding Taxes on Income and Investment)
231,671.40 (165,114.36)
18,856.29 (29,698.98)
250,527.69 (194,813.34)
Additons to Fixed Assets 47,201.94 (8,151.62)
759.15 (290.50)
47,961.09 (8,442.12)
Figures in parenthesis are those of previous year.
39. Related party disclosures
Details of related parties: (Identifi ed by the management)(a) Related Party where Control exists Holding Company Shapoorji Pallonji & Company Limited Subsidiaries of the Company Hazarat & Company Private Limited Afcons Corrosion Protection Private Limited (formerly known as SSS Electricals (India) Pvt Ltd.) Afcons Offshore and Marine Services Private Limited Afcons Construction Mideast LLC Afcons Infrastructures Kuwait for Building, Road and Marine Contracting WLL w.e.f. 11th September, 2011 Afcons Infrastructure International Limited (AIIL) Afcons Madagascar Overseas SARL (Subsidiary of AIIL) Afcons Gulf International Project Services FZE (Subsidiary of AIIL) Afcons Gunanusa Joint Venture ( Jointly Controlled Entity) Transtonnelstroy Afcons Joint Venture ( Jointly Controlled Entity) Dahej Standby Jetty Project undertaking
Fellow Subsidiary(s) Floreat Investments Limited Associate of the Company Afcons (Mideast) Constructions and Investments Private Limited
Partnership fi rm in which the Company is a partner Afcons Pauling Joint Venture
Jointly Controlled Entities Strabag AG Afcons Joint Venture Saipem Afcons Joint Venture
Key Management Personnel Mr. C.P. Mistry – Chairman (Upto 23rd March, 2012) Mr. K. Subrahmanian – Managing Director Mr. S. Paramasivan – Executive Director (Finance & Commercial) (Upto 31st March, 2012)
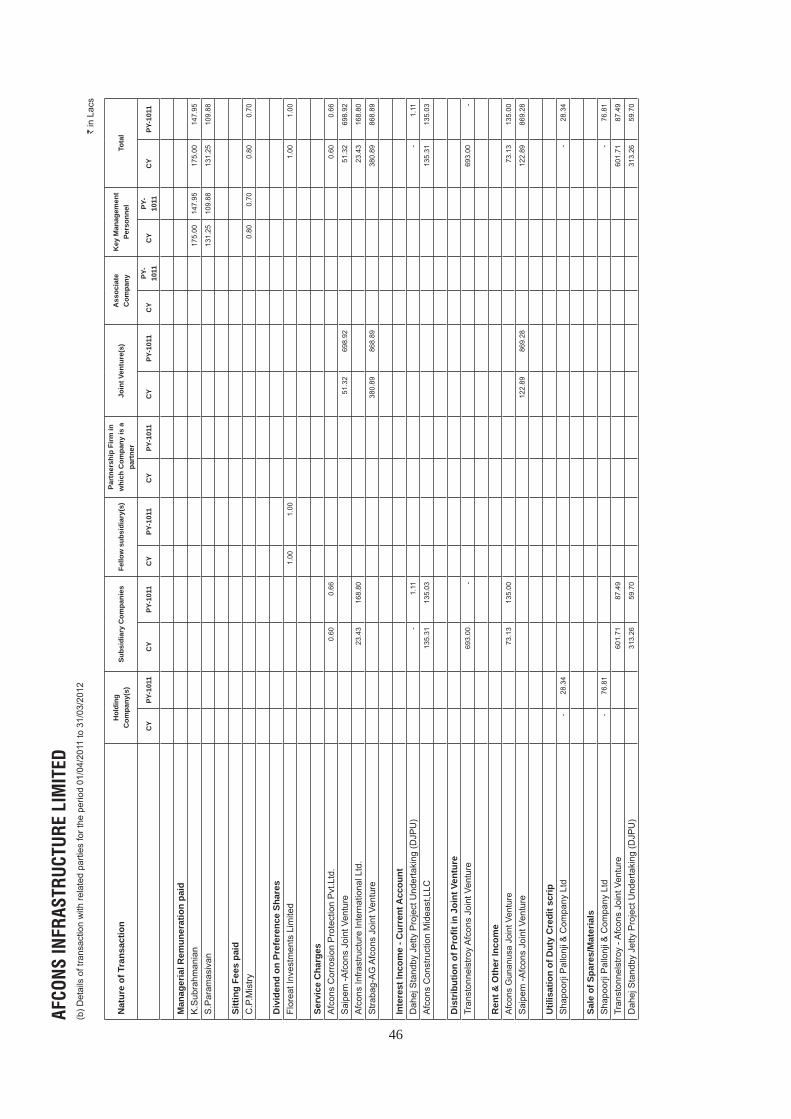
46
AFCONS INFRASTRUCTURE LIMITED
AFCO
NS
INFR
ASTR
UCT
UR
E LI
MIT
ED(b
) Det
ails
of t
rans
actio
n w
ith re
late
d pa
rties
for t
he p
erio
d 01
/04/
2011
to 3
1/03
/201
2 s
in L
acs
Nat
ure
of T
rans
actio
nH
oldi
ng
Com
pany
(s)
Subs
idia
ry C
ompa
nies
Fello
w s
ubsi
diar
y(s)
Part
ners
hip
Firm
in
whi
ch C
ompa
ny is
a
part
ner
Join
t Ven
ture
(s)
Ass
ocia
te
Com
pany
Key
Man
agem
ent
Pers
onne
lTo
tal
CY
PY-1
011
CY
PY-1
011
CY
PY-1
011
CY
PY-1
011
CY
PY-1
011
CY
PY-
1011
CY
PY-
1011
CY
PY-1
011
Man
ager
ial R
emun
erat
ion
paid
K.S
ubra
hman
ian
175.
00
147.
95
175
.00
147
.95
S.P
aram
asiv
an13
1.25
10
9.88
1
31.2
5 1
09.8
8
Sitti
ng F
ees
paid
C.P
.Mis
try0.
80
0.70
0.8
0
0.7
0
Div
iden
d on
Pre
fere
nce
Shar
esFl
orea
t Inv
estm
ents
Lim
ited
1.00
1.
00
1.0
0 1
.00
Serv
ice
Cha
rges
Afc
ons
Cor
rosi
on P
rote
ctio
n P
vt.L
td.
0.60
0.
66
0
.60
0.6
6
Sai
pem
-Afc
ons
Join
t Ven
ture
51.3
2 69
8.92
5
1.32
6
98.9
2
Afc
ons
Infra
stru
ctur
e In
tern
atio
nal L
td.
23.4
3 16
8.80
2
3.43
1
68.8
0
Stra
bag-
AG
Afc
ons
Join
t Ven
ture
380.
89 8
68.8
9 3
80.8
9 8
68.8
9
Inte
rest
Inco
me
- Cur
rent
Acc
ount
Dah
ej S
tand
by J
etty
Pro
ject
Und
erta
king
(DJP
U)
- 1
.11
- 1
.11
Afc
ons
Con
stru
ctio
n M
idea
st,L
LC13
5.31
13
5.03
1
35.3
1 1
35.0
3
Dis
trib
utio
n of
Pro
fi t in
Joi
nt V
entu
reTr
anst
onne
lstro
y A
fcon
s Jo
int V
entu
re69
3.00
-69
3.00
-
Ren
t & O
ther
Inco
me
Afc
ons
Gun
anus
a Jo
int V
entu
re73
.13
135.
00
73.
13
135
.00
Sai
pem
-Afc
ons
Join
t Ven
ture
122.
89
869
.28
122
.89
869
.28
Util
isat
ion
of D
uty
Cre
dit s
crip
S
hapo
orji
Pal
lonj
i & C
ompa
ny L
td-
28.3
4 -
28.
34
Sale
of S
pare
s/M
ater
ials
Sha
poor
ji P
allo
nji &
Com
pany
Ltd
- 76
.81
- 7
6.81
Tran
ston
nels
troy
- Afc
ons
Join
t Ven
ture
601.
71
87.
49
601
.71
87.
49
Dah
ej S
tand
by J
etty
Pro
ject
Und
erta
king
(DJP
U)
313.
26
59.
70
313
.26
59.
70

47
AFCONS INFRASTRUCTURE LIMITEDN
atur
e of
Tra
nsac
tion
Hol
ding
C
ompa
ny(s
)Su
bsid
iary
Com
pani
esFe
llow
sub
sidi
ary(
s)Pa
rtne
rshi
p Fi
rm in
w
hich
Com
pany
is a
pa
rtne
rJo
int V
entu
re(s
)A
ssoc
iate
C
ompa
nyK
ey M
anag
e-m
ent P
erso
nnel
Tota
l
CY
PY-1
011
CY
PY-1
011
CY
PY-1
011
CY
PY-1
011
CY
PY-1
011
CY
PY-
1011
CY
PY-
1011
CY
PY-1
011
Loan
Adv
ance
Giv
en /
(Rec
eive
d)A
fcon
s C
onst
ruct
ion
Mid
east
,LLC
(2,6
36.9
1)
4,8
61.6
4 (
2,63
6.91
) 4
,861
.64
Tran
ston
nels
troy
- Afc
ons
Join
t Ven
ture
(7,3
99.2
8)(5
,604
.03)
(7,3
99.2
8) (5
,604
.03)
Afc
ons
Gun
anus
a Jo
int V
entu
re12
,492
.31
2,39
0.47
1
2,49
2.31
2
,390
.47
Dah
ej S
tand
by J
etty
Pro
ject
Und
erta
king
(DJP
U)
(2,1
98.9
1) 5
,135
.60)
(
2,19
8.91
) (5
,135
.60)
Subc
ontr
act I
ncom
eA
fcon
s C
onst
ruct
ion
Mid
east
,LLC
- 1
,617
.62
- 1
,617
.62
Dah
ej S
tand
by J
etty
Pro
ject
Und
erta
king
2,4
58.7
0 -
2,4
58.7
0 -
Hire
Inco
me
Sha
poor
ji P
allo
nji &
Com
pany
Ltd
6.88
32
3.85
6
.88
323
.85
Sai
pem
-Afc
ons
Join
t Ven
ture
44.1
7 1,
622.
67
44.
17
1,6
22.6
7
Proj
ect M
anag
emen
t Con
sulta
ncy
Serv
ice
Inco
me
Afc
ons
Gun
anus
a Jo
int V
entu
re50
5.91
2,
729.
53
505
.91
2,7
29.5
3
Sai
pem
-Afc
ons
Join
t Ven
ture
442.
22
1,69
8.29
442
.22
1,6
98.2
9
Profi
t /(L
oss)
of s
hare
in p
artn
ersh
ip fi
rmA
fcon
s P
aulin
g Jo
int V
entu
re(0
.22)
(0.2
9) (
0.22
) (
0.29
)
Ren
t Exp
ense
Haz
arat
& C
ompa
ny P
vt.L
td.
1.20
1.
20
1.2
0 1
.20
Expe
nses
incu
rred
by
/ (on
beh
alf o
f) A
fcon
sA
fcon
s C
orro
sion
Pro
tect
ion
Priv
ate
Lim
ited
0.03
(0
.75)
0
.03
(0.7
5)
Haz
arat
& C
ompa
ny P
rivat
e Li
mite
d-
(0.1
1)
- (
0.11
)
Afc
ons
Offs
hore
& M
arin
e S
ervi
ces
Priv
ate
Lim
ited
0.9
5 (0
.22)
0.9
5 (0
.22)
Afc
ons
Con
stru
ctio
n M
idea
st, L
LC(8
2.75
)(1
,831
.22)
(82.
75)
(1,8
31.2
2)
Afc
ons
(Mid
east
) Con
stru
ctio
ns a
nd In
vest
men
ts P
rivat
e Li
mite
d0.
06(0
.66)
0.06
(0.6
6)
Tran
ston
nels
troy
Afc
ons
Join
t Ven
ture
2,29
8.99
2
,744
.00
2,29
8.99
2
,744
.00
Dah
ej S
tand
by J
etty
Pro
ject
Und
erta
king
4,35
6.48
3
33.4
0 4
,356
.48
333
.40
Stra
bag
AG
Afc
ons
Join
t Ven
ture
161.
0516
.71
161
.05
16.7
1
Afc
ons
Gun
anus
a Jo
int V
entu
re39
2.14
-
392.
14-
Inte
rest
exp
ense
Afc
ons
(Mid
east
) Con
stru
ctio
ns a
nd In
vest
men
ts P
vt.L
td.
5.85
5.85
(5.8
5) (5
.85)
Tran
ston
nels
troy
Afc
ons
Join
t Ven
ture
(1,5
74.5
9) (6
59.7
1)
(
1,57
4.59
) (
659.
71)
Dah
ej S
tand
by J
etty
Pro
ject
Und
erta
king
(465
.95)
- (
465.
95)
-
AFCO
NS
INFR
ASTR
UCT
UR
E LI
MIT
ED(b
) Det
ails
of t
rans
actio
n w
ith re
late
d pa
rties
for t
he p
erio
d 01
/04/
2011
to 3
1/03
/201
2 (C
ontd
.)
s
in L
acs

48
AFCONS INFRASTRUCTURE LIMITEDN
atur
e of
Tra
nsac
tion
Hol
ding
C
ompa
ny(s
)Su
bsid
iary
Com
pani
esFe
llow
su
bsid
iary
(s)
Part
ners
hip
Firm
in
whi
ch C
ompa
ny is
a
part
ner
Join
t Ven
ture
(s)
Ass
ocia
te
Com
pany
Key
Man
age-
men
t Per
sonn
elTo
tal
CY
PY-1
011
CY
PY-1
011
CY
PY-1
011
CY
PY-1
011
CY
PY-1
011
CY
PY-
1011
CY
PY-
1011
CY
PY-1
011
Purc
hase
of S
hare
s-
1.60
Afc
ons
Cor
rosi
on P
rote
ctio
n P
rivat
e Li
mite
d-
1.60
Purc
hase
of A
sset
s / M
ater
ial
Afc
ons
Con
stru
ctio
n M
idea
st, L
LC(6
2.53
)11
6.39
(62.
53)
116.
39
Dah
ej S
tand
by J
etty
Pro
ject
Und
erta
king
(29.
21)
-(2
9.21
) -
Gua
rant
ees
Giv
en fo
r/ (R
elea
sed)
Afc
ons
Cor
rosi
on P
rote
ctio
n P
vt.L
td.
13.3
1 (1
7.85
) 1
3.31
(
17.8
5)
Afc
ons
Gun
anus
a Jo
int V
entu
re 2
0,51
2.81
-
20,
512.
81
-
Stra
bag-
AG
Afc
ons
Join
t Ven
ture
(306
.15)
8,
108.
47
(30
6.15
) 8
,108
.47
Tran
ston
nels
troy
- Afc
ons
Join
t Ven
ture
2,35
8.21
38
,167
.08
2,3
58.2
1 3
8,16
7.08
Dah
ej S
tand
by J
etty
Pro
ject
Und
erta
king
- 1
0,69
7.02
-
10,
697.
02
Out
stan
ding
am
ount
of g
uara
ntee
giv
en/ (
take
n)A
fcon
s C
orro
sion
Pro
tect
ion
Pvt
.Ltd
.27
.26
13.9
5 2
7.26
1
3.95
Afc
ons
Con
stru
ctio
n M
idea
st,L
LC 8
0,32
4.20
71
,599
.84
80,
324.
20
71,
599.
84
Afc
ons
Gun
anus
a Jo
int V
entu
re39
,160
.83
18,8
11.6
2 3
9,16
0.83
1
8,81
1.62
Stra
bag-
AG
Afc
ons
Join
t Ven
ture
21,4
05.3
2 23
,388
.56
21,
405.
32
23,
388.
56
Tran
ston
nels
troy
- Afc
ons
Join
t Ven
ture
61,2
84.4
5 58
,926
.24
61,
284.
45
58,
926.
24
Sai
pem
-Afc
ons
Join
t Ven
ture
4,88
7.68
12
,638
.06
4,8
87.6
8 1
2,63
8.06
Dah
ej S
tand
by J
etty
Pro
ject
Und
erta
king
(DJP
U)
10,9
01.6
1 1
0,69
7.02
1
0,90
1.61
1
0,69
7.02
Out
stan
ding
Am
ount
Dr/
(Cr)
Sha
poor
ji P
allo
nji &
Com
pany
Ltd
.5.
91
197.
14 5
.91
197
.14
Afc
ons
Cor
rosi
on P
rote
ctio
n P
vt. L
td.
0.0
3 -
0.0
3 -
Afc
ons
Offs
hore
& M
arin
e S
ervi
ces
Pvt
.Ltd
. 0
.95
- 0
.95
-
Afc
ons
Infra
stru
ctur
e In
tern
atio
nal L
td.
1.52
29
.46
1.5
2 2
9.46
Afc
ons
Con
stru
ctio
n M
idea
st,L
LC4,
980.
41
11,0
79.5
3 4
,980
.41
11,
079.
53
Afc
ons
Gun
anus
a Jo
int V
entu
re20
,438
.73
6,97
9.48
2
0,43
8.73
6
,979
.48
Stra
bag-
AG
Afc
ons
Join
t Ven
ture
1,55
4.79
1,
012.
85
1,5
54.7
9 1
,012
.85
Afc
ons
(Mid
east
) Con
stru
ctio
ns a
nd In
vest
men
ts P
vt.L
td.
(89.
94)
(90.
00)
(89
.94)
(9
0.00
)
Dah
ej S
tand
by J
etty
Pro
ject
Und
erta
king
(2
,719
.13)
(4,7
41.4
0)
(2,
719.
13)
(4,7
41.4
0)
Tran
ston
nels
troy
- Afc
ons
Join
t Ven
ture
(17,
691.
86)
(12,
469.
15)
(17,
691.
86)
(12,
469.
15)
Sai
pem
-Afc
ons
Join
t Ven
ture
200.
99
5,17
9.03
2
00.9
9 5
,179
.03
Afc
ons
Pau
ling
Join
t Ven
ture
1,46
1.65
1,
461.
87
1,4
61.6
5 1
,461
.87
Not
e : T
here
are
no
prov
isio
ns fo
r dou
btfu
l deb
ts o
r am
ount
s w
ritte
n of
f or w
ritte
n ba
ck d
urin
g th
e ye
ar fo
r deb
ts d
ue fr
om/ t
o re
late
d pa
rties
.
AFCO
NS
INFR
ASTR
UCT
UR
E LI
MIT
ED(b
) Det
ails
of t
rans
actio
n w
ith re
late
d pa
rties
for t
he p
erio
d 01
/04/
2011
to 3
1/03
/201
2 (C
ontd
.)
s
in L
acs

49
AFCONS INFRASTRUCTURE LIMITEDNotes forming part of the fi nancial statements for the year ended 31st March, 2012
For the year ended For the year ended 31st March,2012 31st March,2011 R in Lacs R in Lacs40. Details of leasing arrangements
As Lessor (i) The company has let out one of the premises under operating lease. The lease is cancelable and is renewable by mutual consent on mutually agreeable terms.(ii) The lease income of the premises recognised in the Statement of Profi t and Loss under ‘Miscellaneous Income’ in Note 23 73.13 135.00 (iii) The lease income of equipments recognised in the Statement of Profi t and Loss under Operating Revenve’s in Note 22 216.08 1,997.83
As Lessee(i) The company has taken various offi ces, residential and godown premises under operating lease or leave and licence agreements. These are generally cancelable and range between 11 months and 3 years under leave and licence agreement and are renewable by mutual consent on mutually agreeable terms.(ii) Lease payments recognised in the Statement of Profi t and Loss under ‘Rent’ in Note 28 1,136.85 1,303.98(iii) Lease payments for equipments are recognised in the statement of Profi t and Loss under ‘Subcontracting’ in Note 24 2,103.90 2,066.11
For the year ended For the year ended 31st March,2012 31st March,2011 R in Lacs R in Lacs41. Earnings per share (EPS)
(EPS) is calculated by dividing the profi t attributable to the equity shareholders by the weighted average number of equity shares outstanding during the year, as under :
Profi t after tax 8,587.14 5,868.22Less: Dividend on 0.01% Convertible Non Cumulative Non Participatory Preference 4.07 4.07shares (including dividend tax) Profi t for the year attributable to equity shareholders 8,583.07 5,864.15
Weighted average number of shares outstanding during the year Numbers Numbers For basic EPS 71,869,956 71,721,291For diluted EPS (refer note below) 336,521,970 336,373,305
Earnings per share r in Lacs r in LacsBasic 11.94 8.18 Diluted 2.55 1.74 Nominal value per share 10.00 10.00 Note :Weighted average number of shares outstanding during the year- for Diluted EPS: Numbers Numbers Weighted average number of shares outstanding during the year – for calculating basic EPS (numbers) 71,869,956 71,721,291Add: Potential equity shares that could arise on conversion of 0.01%.Fully and Compulsorily convertible Non-cumulative, Non Participatory Preference shares at r 10 each (Refer Note below) 250,000,000 250,000,000Add: Potential equity shares that could arise on conversion of 0.01% Non-cumulative, Non-Participatory Convertible Preference shares at r 68.25 (converted into Non-cumulative 14,652,014 14,652,014
336,521,970 336,373,305Note:For the purpose of calculating Diluted Earnings per share above preference shares are treated as convertible into equity shares at par

50
AFCONS INFRASTRUCTURE LIMITEDNotes forming part of the fi nancial statements for the year ended 31st March, 2012
42. Interest in joint ventures :
The Company has interests in the following jointly controlled entities: (r in Lacs)
Name of companies and country ofincorporation
% of Shareholding
Amount of interest based on accounts for the year ended 31 March, 2012
Assets Liabilities Income Expenditure Contingentliabilities
Capital commitments
Saipem Afcons Joint Venture , Oman (unaudited) 50% 2,238.60
(9,608.28) 2,238.60 (9,608.28)
6,986.75(39,413.16)
4,791.03(39,629.16)
(-) (-)
(-) (-)
Strabag AG Afcons Joint Venture, India (audited) 40% 15,111.40
(18,069.16) 15,111.40
(18,069.16)6,760.28
(6,374.17)5,799.91
(6,132.54) (-) (-)
(-) (-)
Note: Figures in brackets relate to the previous year
43. Disclosures on Employee share based payments: Employee Stock Option Plan. On 22nd December, 2006, the Company has granted 721,150 Stock options to its eligible employees at a price of r 17/- per option in terms of Employees
Stock Option Scheme 2006 of the Company as approved by the Share holders at the Extra Ordinary General meeting held on 22nd December, 2006. a) The particulars of the Options distributed under ESOP 2006 are as follows:
Particulars ESOP 2006
Eligibility Employees and Directors of the Company and its subsidiaries and its holding Company.
Vesting period for options granted during the year
Not less than One year and not more than Five years from the date of grant.
Exercise Period Three years beginning from date of vesting
Method of Settlement Equity Shares
Exercise Price The Exercise price shall be equal to the fair market value of the shares as determined by the independent valuer.
No. of Options Granted 721,150.00
(b) The particulars of number of options granted, exercised and lapsed and the Price of Stock Options for ESOP 2006 are as follows:
Current year As at 31st March 2011
Particulars Quantity Quantity
Authorised to be Granted 1,785,000 1,785,000
Granted and Outstanding at the beginning of the year
130,770 303460
Granted during the year Nil Nil
Forfeited during the year Nil Nil
Exercised during the year 1,30,770 138,954
Lapsed during the year Nil 33,736
Granted and outstanding at the end of the year Nil 130,770
Fair value of the ESOP on the date of Grant r 9.41 r 9.41
c) The Company has followed the intrinsic value-based method of accounting for stock options granted based on Guidance Note on Accounting on Employee Share-based Payments, issued by the Institute of Chartered Accountants of India. The exercise price of the option granted is based on the fair value of the Company’s share as on the date of the Grant. The Fair Value of the Share has been calculated by an independent valuer by applying Rule 1D of the Wealth Tax Rules, 1957. As the exercise price of the option granted is based on the fair value as on the date of the Grant, the intrinsic value of the option is NIL.
Fair value of Options calculated by external valuer using Black Scholes Model is lower than the exercise price and hence the options are considered to be anti-dilutive in nature and the effect of this is ignored in calculating diluted earnings per share in accordance with Accounting Standard 20 viz. Earnings Per Share issued by Charted Accountants of India.
Had the company followed fair value method for accounting the stock option, compensation expenses would have been higher by NIL (Previous year r 12.31 Lacs). Consequently profi t after tax would have been lower by like amount and Basic Earning per share would have been lower by NIL (Previous year r 0.02) per share and Diluted Earnings per share would have been lower by NIL (Previous year r 0.0049) per share.

51
AFCONS INFRASTRUCTURE LIMITEDNotes forming part of the fi nancial statements for the year ended 31st March, 2012
d) The Method and signifi cant assumptions used to estimate the Fair Value of the Options are as under: The Fair value of Options has been calculated by an independent valuer. The valuation has been done using the Black-Scholes model based on the
assumptions given by the management, which are as under:
(i) Expected Life of the Options: These stock options will vest in the following proportion from the date of grant and can be exercised during a period of four years from the date of
vesting.
Year 1 from the date of Grant - 20% of the Options Granted; Year 2 from the date of Grant - 25% of the Options Granted; Year 3 from the date of Grant - 25% of the Options Granted; Year 4 from the date of Grant - 30% of the Options Granted
(ii) Risk free interest rate: This rate has been assumed at 8%.
(iii) Share price: Share price of s 17/- is treated as fair value as on 22nd December, 2006 the date of grant.
(iv) Volatility: Volatility is calculated based on historical volatility in the stock of similar comparable companies over the previous 4 years at 0.63.
(v) Expected dividend yield:Nil
44. During the year the Company has fi led a revised return of income for the fi nancial year ended 31st March, 2010 in terms of the provision of Income Tax Act, 1961, considering that the management fees of s 3,141.00 Lacs received from a Joint Venture where the Company is a Joint Venture partner, are not chargable to Tax in the hands of the Company and are considered as disallowable expenditure in the hands of the Joint Venture under the provisions of the Income Tax Act. This revision has resulted in an excess provision for Income Tax of s 1,128.15 Lacs in the books of the Company, which has been disclosed as write back of Tax expense relating to prior year in the statement of Profi t and Loss.
45. Recovery of Expenses in Note 24, Note 26, Note 27, and Note 28 are amounts recovered from group/other companies towards the value of cost apportioned
of the Company’s employees and facilities in accordance with the agreements on allocation of expenses with the companies.
46. The Revised Schedule VI has become effective from 1 April, 2011 for the preparation of fi nancial statements. This has signifi cantly impacted the disclosure and presentation made in the fi nancial statements. Previous year’s fi gures have been regrouped / reclassifi ed wherever necessary to correspond with the current year’s classifi cation / disclosure.
For and on Behalf of the Board of Directors
S.P.MISTRY K.SUBRAHMANIAN Chairman Managing Director S.PARAMASIVAN P.R.RAJENDRAN Deputy Managing Director Company Secretary
Place: MumbaiDate: 22nd August, 2012

52
AFCONS INFRASTRUCTURE LIMITED
AFCO
NS
INFR
ASTR
UCT
UR
E LI
MIT
EDFI
NA
NC
IAL
HIG
HLI
GH
TS
s in
Lac
s
REV
ENU
E A
CC
OU
NTS
CA
PITA
L A
CC
OU
NTS
EAR
NIN
GS
&
PAYO
UT
YE
AR
TOTA
L IN
CO
ME
DE
PR
EC
IATI
ON
(LO
SS
)/ P
RO
FIT
BE
FOR
E
TAX
ES
&
RE
SE
RV
ES
TAX
SH
AR
E
CA
PIT
AL
RE
SE
RV
ES
(EX
CLU
DIN
G
RE
VALU
ATIO
N
RE
SE
RV
E)
BO
RR
OW
ING
SG
RO
SS
B
LOC
KC
UM
- D
EP
RE
CIA
TI
ON
NE
T B
LOC
KE
AR
NIN
GS
PE
R
EQ
UIT
Y S
HA
RE
OF
s 10
2002
-03
4408
788
125
811
551
4055
2014
908
1751
390
8784
26(0
.95)
2003
-04
4563
110
9928
115
971
4056
4220
555
1987
410
133
9741
0.39
2004
-05
5539
113
1834
214
012
140
5845
2797
521
954
1152
210
432
0.64
2005
-06
6862
914
9114
9091
717
153
4610
3483
826
490
1481
111
679
1.85
2006
-07
1074
1118
0825
1611
2817
153
6065
5714
436
785
1666
120
124
2.15
2007
-08
1749
4424
0066
4722
4442
152
9841
5164
448
512
1844
530
067
6.16
2008
-09
2088
6729
6275
0825
7342
140
1477
269
051
5892
520
789
3813
66.
91
2009
-10
1510
2832
2155
9819
6242
170
1842
453
876
5923
822
116
3712
25.
08
2010
-11
1141
0632
4388
8530
1642
184
2429
768
039
6474
022
951
4178
98.
18
2011
-12
1647
6037
8911
148
2561
4219
732
890
8374
180
518
2586
454
654
11.9
4

53
CONSOLIDATED FINANCIAL STATEMENT OF AFCONS INFRASTRUCTURE LIMITED AND ITS SUBSIDIARIES,ASSOCIATES AND JOINT VENTURES (AFCONS GROUP)
AUDITORS’ REPORT TO THE BOARD OF DIRECTORS OF AFCONS INFRASTRUCTURE LIMITED
1. We have audited the attached Consolidated Balance Sheet of AFCONS INFRASTRUCTURE LIMITED (“the Company”), its subsidiaries and jointly controlled entities (the Company, its subsidiaries and jointly controlled entities constitute “the Group”) as at 31st March, 2012, the Consolidated Statement of Profi t and Loss and the Consolidated Cash Flow Statement of the Group for the year ended on that date, both annexed thereto. The Consolidated Financial Statements include investments in associates accounted on the equity method in accordance with Accounting Standard 23 (Accounting for Investments in Associates in Consolidated Financial Statements) and the jointly controlled entities accounted in accordance with Accounting Standard 27 (Financial Reporting of Interests in Joint Ventures) as notifi ed under the Companies (Accounting Standards) Rules, 2006. These fi nancial statements are the responsibility of the Company’s Management and have been prepared on the basis of the separate fi nancial statements and other fi nancial information regarding components. Our responsibility is to express an opinion on these Consolidated Financial Statements based on our audit.
2. We conducted our audit in accordance with the auditing standards generally accepted in India. Those Standards require that we plan and perform the audit to obtain reasonable assurance about whether the fi nancial statements are free of material misstatements. An audit includes examining, on a test basis, evidence supporting the amounts and the disclosures in the fi nancial statements. An audit also includes assessing the accounting principles used and the signifi cant estimates made by the Management, as well as evaluating the overall fi nancial statement presentation. We believe that our audit provides a reasonable basis for our opinion.
3. We did not jointly audit the fi nancial statements of certain subsidiaries and joint ventures, whose fi nancial statements refl ect total assets of R 46,652.13 Lacs, as at 31st March, 2012, total revenues of R 41,591.25 Lacs and net cash out fl ows amounting to R 16,108.18 Lacs for the year ended on that date as considered in the Consolidated Financial Statements. These fi nancial statements have been audited by either of us in our individual capacity or by other auditors, whose reports have been furnished to us and our opinion in so far as it relates to the amounts included in respect of those subsidiaries and joint ventures is based solely on the reports of the respective auditors.
4. In the case of subsidiaries viz. Afcons Madagascar Overseas SARL, Afcons Construction Mideast LLC, Afcons Infrastructure International Limited, Afcons Gulf Financial Services FZE and Afcons Infrastructures Kuwait for Building, Road and Marine Contracting WLL, and a Joint Venture viz. Saipem Afcons Joint Venture, our opinion is based on the unaudited separate fi nancial statements prepared by the subsidiaries and the joint venture and included in the consolidated fi nancial statements. The unaudited Financial Statements of these subsidiaries and the joint venture refl ect total Assets of R 21,289.50 Lacs as at 31st March, 2012, total revenues of R 6,110.19 Lacs and total cash fl ows of R 328.86 Lacs for the year ended on that date as considered in the Consolidated Financial Statements.
5. We report that the Consolidated Financial Statements have been prepared by the Company in accordance with the requirements of Accounting Standard 21 (Consolidated Financial Statements), Accounting Standard 23 (Accounting for Investment in Associates in Consolidated Financial Statements) and Accounting Standard 27 (Financial Reporting of Interests in Joint Ventures) as notifi ed under the Companies (Accounting Standards) Rules, 2006.
6. Subject to the foregoing paragraph 4, based on our audit and on consideration of the separate audit reports on individual fi nancial statements of the Company, its subsidiaries, joint ventures and associates, as referred in paragraph 3 above, and to the best of our information and according to the explanations given to us, in our opinion, the Consolidated Financial Statements give a true and fair view in conformity with the accounting principles generally accepted in India:
(i) in the case of the Consolidated Balance Sheet, of the state of affairs of the Group as at 31st March, 2012; (ii) in the case of the Consolidated Statement of Profi t and Loss, of the profi t of the Group for the year ended on that date; and (iii) in the case of the Consolidated Cash Flow Statement, of the cash fl ows of the Group for the year ended on that date.
For Deloitte Haskins & Sells For J. C. Bhatt & Associates Chartered Accountants Chartered Accountants (Registration No. 117366W) (Registration No. 130923W)
R. Laxminarayan J. C. Bhatt Partner Partner
Membership No.33023 Membership No.10977
Place : Mumbai Dated : 22nd August, 2012

54
CONSOLIDATED FINANCIAL STATEMENT OF AFCONS INFRASTRUCTURE LIMITED AND ITS SUBSIDIARIES,ASSOCIATES AND JOINT VENTURES (AFCONS GROUP)
Consolidated Balance Sheet as at 31st March, 2012
Note As at As at No. 31st March,2012 31st March,201 R in Lacs R in LacsA. EQUITY AND LIABILITIES1. Shareholders’ funds (a) Share capital 3 42,197.02 42,183.95 (b) Reserves and surplus 4 48,210.38 37,514.46 90,407.40 79,698.41 2. Minority Interest (net) (102.42) 424.06 3. Non-current liabilities (a) Long-term borrowings 5 26,369.85 18,685.88 (b) Deferred tax liabilities (net) 6A 7,660.82 5,767.94 (c) Other long-term liabilities 7 26,377.34 28,985.79 (d) Long-term provisions 8 692.78 578.20 61,100.79 54,017.81 4. Current liabilities (a) Short-term borrowings 9 41,441.59 43,119.82 (b) Trade payables 10 72,497.98 67,196.87 (c) Other current liabilities 11 49,914.13 36,155.82 (d) Short-term provisions 12 629.24 664.73 164,482.94 147,137.24 TOTAL 315,888.71 281,277.52 B. ASSETS 1. Non-current assets (a) Fixed assets (i) Tangible assets 13A 59,235.56 45,934.03 (ii) Intangible assets 13B 500.05 122.60 (iii) Capital work-in-progress 33,894.05 1,518.31 93,629.66 47,574.94 (b) Goodwill on Consolidation 13.90 13.90 (c) Non-current investments 14 40.10 40.55 (d) Deferred tax asset (net) 6B 16.06 - (e) Long-term loans and advances 15 19,929.67 9,287.43 (f) Other non-current assets 16 32,134.59 41,031.60 145,763.98 97,948.42 2. Current assets (a) Inventories 17 86,989.37 66,819.22 (b) Trade receivables 18 51,280.02 47,531.34 (c) Cash and cash equivalents 19 17,512.21 45,729.93 (d) Short-term loans and advances 20 13,818.75 19,379.62 (e) Other current assets 21 524.38 3,868.99 170,124.73 183,329.10 TOTAL 315,888.71 281,277.52
See accompanying notes 1 to 41 forming part of the fi nancial statements
In terms of our report attached For and on Behalf of the Board of Directors For DELOITTE HASKINS & SELLS For J.C. BHATT & ASSOCIATES K.SUBRAHMANIAN S.PARAMASIVAN CHARTERED ACCOUNTANTS CHARTERED ACCOUNTANTS Managing Director Deputy Managing Director R. LAXMINARAYAN J.C.BHATT P.R.RAJENDRANPartner Partner Company Secretary
Place: MumbaiDate: 22nd August, 2012

55
CONSOLIDATED FINANCIAL STATEMENT OF AFCONS INFRASTRUCTURE LIMITED AND ITS SUBSIDIARIES,ASSOCIATES AND JOINT VENTURES (AFCONS GROUP) Consolidated Statement of Profi t and Loss for the year ended 31st March, 2012
Note For the year ended For the year ended No. 31st March,2012 31st March,2011 R in Lacs R in Lacs1. Revenue from operations 22 246,426.71 283,303.52
2. Other income 23 8,765.55 6,244.44
3. Total revenue (1 + 2) 255,192.26 289,547.96
4. Expenses
(a) Cost of construction 24 170,595.18 213,189.77 (b) Employee benefi ts expense 25 30,612.87 26,322.47 (c) Finance costs 26 10,544.17 7,579.23 (d) Depreciation and amortisation expense 13D 4,245.95 3,900.77 (e) Other expenses 27 24,137.62 23,420.55
Total expenses 240,135.79 274,412.79
5. Profi t before tax ( 3 - 4 ) 15,056.47 15,135.17
6. Tax expense: (a) Tax expense for current year 5,533.86 1,883.35 (b) (Less): MAT credit (1,324.65) (0.92) (c) Deferred tax 1,876.82 1,324.37 (d) Tax expense relating to prior years (net) 156.04 31.59 6,242.07 3,238.39 7. Profi t for the year from continuing operations before Minority interest ( 5-6 ) 8,814.40 11,896.78 8. Minority Interest 638.79 (18.15)9. Profi t / (Loss) for the year (7 + 8) 9,453.19 11,878.63
10. Earnings per share (of r 10/- each): 36
(a) Basic 13.15 16.56 (b) Diluted 2.81 3.53 See accompanying notes 1 to 41 forming part of the fi nancial statements
In terms of our report attached For and on Behalf of the Board of Directors For DELOITTE HASKINS & SELLS For J.C. BHATT & ASSOCIATES K.SUBRAHMANIAN S.PARAMASIVAN CHARTERED ACCOUNTANTS CHARTERED ACCOUNTANTS Managing Director Deputy Managing Director R. LAXMINARAYAN J.C.BHATT P.R.RAJENDRANPartner Partner Company Secretary
Place: MumbaiDate: 22nd August, 2012

56
CONSOLIDATED FINANCIAL STATEMENT OF AFCONS INFRASTRUCTURE LIMITED AND ITS SUBSIDIARIES,ASSOCIATES AND JOINT VENTURES (AFCONS GROUP) Consolidated Cash Flow Statement for the year ended 31st March, 2012 March’2012 March’2011 R in Lacs R in Lacs A. Cash fl ow from operating activities Profi t before tax 15,056.47 15,135.17 Adjustments for : Depreciation 4,245.95 3,900.77 Loss on sale of fi xed assets (net) (114.13) 18.88 Dividend income (0.02) (0.22) Interest income (6,591.51) (2,586.10) Interest expense 10,692.47 7,609.23 Bad/irrecoverable Debtors /Unbilled Revenue /Advances w/off 1,624.91 1,685.53 Provision for doubtful debts no longer required written back - (1,575.00) Excess Provision for expenses of earlier years written back (1,176.41) (668.85) Investment Written off 0.55 - Provision for Projected Losses written back (204.45) (211.19)Operating profi t before working capital changes 23,533.83 23,308.22 (Increase)/Decrease in Inventories (20,170.15) (17,041.53) (Increase)/Decrease in Trade receivables (5,373.59) 1,788.64 (Increase)/Decrease in Loans and Advances and Other Assets 12,952.38 (9,486.12) Increase/(Decrease) in Trade, Other payables and Provisions 7,753.31 39,676.58 Cash from Operations 18,695.78 38,245.79 Direct taxes paid (8,338.94) (3,682.79)Net cash from operating activities 10,356.84 34,563.00
B. Cash fl ow from investing activities Purchase of fi xed assets (51,391.72) (13,711.69) Sale of fi xed assets 1,142.94 213.98 Purchase of Investments (95.77) - Dividend received 0.02 - Interim distribution of profi t to JV partner (7.00) - Interest received 6,591.51 366.90 Net cash used in investing activities (43,760.02) (13,130.81)
C. Cash fl ow from fi nancing activities Proceeds from issue of Equity Shares 22.22 23.63 Proceeds from long-term borrowings 23,613.50 12,482.88 Repayment of long-term borrowings (6,233.35) (14,268.92) Proceeds from /repayment of short term borrowings - net (1,678.23) 15,231.70 Interest paid (10,339.82) (7,553.25) Dividend paid(including tax) (4.07) (4.07) Net cash from/(used in) fi nancing activities 5,380.25 5,911.97
Net increase in cash and cash equivalents (28,022.93) 27,344.16 Cash and cash equivalents at the beginning of the Year 44,964.35 17,620.19 Add: Cash received on acquisition of subsidiary 220.21 - Less : Exchange difference on translation of Foreign currency of Cash and Cash equivalents. (12.23) - Cash and cash equivalents at the end of the Year 17,149.40 44,964.35
Reconciliation of cash and cash equivalents As per Balance sheet - Note 19 17,512.21 45,729.93 Less : Fixed Deposits on Lien (362.81) (765.58) As per Cash fl ow statement 17,149.40 44,964.35
Notes 1. The above Cash Flow Statement has been prepared under the “Indirect Method” set out in Accounting Standard (AS-3) “Cash Flow Statements” notifi ed under the Companies (Accounting Standard) Rules, 2006 2. Cash and Cash equivalents includes unrealised Profi t/(Loss) of R 192.90 Lacs (Previous year R 7.30 Lacs) on account of translation of foreign currency bank balances. 3. Figures relating to previous year have been recast where necessary to conform to fi gures of the current year.
In terms of our report attached For and on Behalf of the Board of Directors For DELOITTE HASKINS & SELLS For J.C. BHATT & ASSOCIATES K.SUBRAHMANIAN S.PARAMASIVAN CHARTERED ACCOUNTANTS CHARTERED ACCOUNTANTS Managing Director Deputy Managing Director R. LAXMINARAYAN J.C.BHATT P.R.RAJENDRANPartner Partner Company Secretary
Place: MumbaiDate: 22nd August, 2012

57
CONSOLIDATED FINANCIAL STATEMENT OF AFCONS INFRASTRUCTURE LIMITED AND ITS SUBSIDIARIES,ASSOCIATES AND JOINT VENTURES (AFCONS GROUP)Notes forming part of the consolidated fi nancial statements for the year ended on 31st March, 2012
1 Signifi cant accounting policies1.1 Principles of Consolidation: The Consolidated Financial Statements relate to Afcons Infrastructure Limited (the “Company”), its subsidiaries and jointly controlled entities
(the Company, its subsidiaries and jointly controlled entities constitute the “Group”) which have been prepared in accordance with the Accounting Standards on Consolidated Financial Statements (AS) 21 and Financial Reporting of Interests in Joint Ventures (AS) 27 prescribed under section 211(3C) of the Companies Act, 1956. Further the Consolidated Financial Statements include investments in associates accounted for using equity method in accordance with the Accounting Standard on Accounting for Investments in Associates in Consolidated Financial Statements (AS) 23 prescribed under section 211 (3C) of the Companies Act, 1956. The consolidated fi nancial statements have been prepared on the following basis :
1.1.1 The fi nancial statements of the Company and its subsidiaries are combined on a line-by-line basis by adding together the book values of like items of assets, liabilities, income and expenses, after fully eliminating intra-group balances and intra-group transactions resulting in unrealised profi ts or losses in accordance with Accounting Standard (AS- 21) “Consolidated Financial Statements” notifi ed under the Companies (Accounting Standards) Rules, 2006.
1.1.2 The difference between the costs of investment in the subsidiaries, over the net assets at the time of acquisition of shares in the subsidiaries is recognized in the fi nancial statements as Goodwill or Capital Reserve as the case may be.
1.1.3 The difference between the proceeds from disposal of investment in a subsidiary and the carrying amount of its assets less liabilities as of the date of disposal is recognized in the consolidated statement of Profi t and Loss as the profi t or loss on sale of investment in subsidiary.
1.1.4 Minority Interest’s share of net profi t of consolidated subsidiaries for the year is identifi ed and adjusted against the income of the group in order to arrive at the net income attributable to shareholders of the Company.
1.1.5 Minority Interest’s share of net assets of consolidated subsidiaries is identifi ed and presented in the consolidated balance sheet separate from liabilities and the equity of the Company’s shareholders.
1.1.6 In case of associates, where the Company directly or indirectly through subsidiaries holds more than 20% of equity or exercises signifi cant infl uence over the investee, investments are accounted for using equity method in accordance with Accounting Standard (AS-23) “Accounting for Investments in Associates in consolidated fi nancial statements” notifi ed under the Companies (Accounting Standards) Rules, 2006.
1.1.7 The difference between the cost of investment in the associate and the share of net assets at the time of acquisition of shares in the associate is recognised in the fi nancial statements as Goodwill or Capital Reserve as the case may be.
1.1.8 The Company’s interest in Jointly Controlled Entities are consolidated on a proportionate consolidation basis by adding together the proportionate book values of assets, liabilities, income and expenses and eliminating the unrealised profi ts/losses on intra-group transactions.
1.1.9 As far as possible, the consolidated fi nancial statements are prepared using uniform accounting policies for like transactions and other events in similar circumstances and appropriate adjustments are made to the fi nancial statements of subsidiaries when they are used in preparing the consolidated fi nancial statements that are presented in the same manner as the Company’s separate fi nancial statements.
1.1.10 The accounts of the Indian subsidiaries have been prepared in compliance with the Accounting Standards referred to in Section 211(3C) and other requirements of the Companies Act, 1956 and those of the foreign subsidiaries have been prepared in compliance with the local laws and applicable Accounting Standards. In the opinion of the Management, based on the analysis of the signifi cant transactions of those subsidiaries, no material adjustments are required to be made to comply with group accounting policies / Indian GAAP.
1.2 As required by Accounting Standard (AS-23) “Accounting for Investments in Associates on consolidated fi nancial statements” notifi ed under the Companies (Accounting Standards) Rules, 2006, the carrying amounts of investments in Associates is adjusted for post acquisition change in the Company’s share in the net assets of the associates after eliminating unrealised profi ts or losses, if any.
1.3 The list of the subsidiaries of the Company which are included in the consolidation and the Group’s holding therein are as under:
Name of Subsidiary Country of Incorporation Percentage Holding-Share
Hazarat and Company Private Limited. India 100%
Afcons Corrosion Protection Pvt. Ltd (Formerly SSS Electricals (India) Private Limited). India 100%
Afcons Offshore and Marine Services Pvt. Limited. India 100%
Afcons Infrastructures Kuwait for Building, Road and Marine Contracting WLL* (w.e.f 11/09/2011)
Kuwait 49%
Afcons Construction Mideast LLC* U.A.E 49%
Afcons Infrastructure International Limited Mauritius 100%
Afcons Madagascar Overseas SARL # Madagascar 100%
Afcons Gulf International Projects Services FZE # U.A.E. 100%
Afcons Pauling Joint Venture India 95%
Afcons Gunanusa Joint Venture (a Jointly Controlled Entity) India 80%
Transtonnelstroy Afcons Joint Venture (a Jointly Controlled Entity) India 99%
Dahej Standby Jetty Project Undertaking (a Jointly Controlled Entity) India 100%
* It is accounted based on control exercised by the Company on the composition of Board of Directors.
# Step down subsidiaries of Afcons Infrastructure International Limited.

58
CONSOLIDATED FINANCIAL STATEMENT OF AFCONS INFRASTRUCTURE LIMITED AND ITS SUBSIDIARIES,ASSOCIATES AND JOINT VENTURES (AFCONS GROUP)Notes forming part of the consolidated fi nancial statements for the year ended on 31st March, 2012
1.4 The associate of the Group which is included in the consolidation and the Group’s holdings therein is as under:
Name of the Associate Country of Incorporation Percentage Holding-Share
Afcons (Mideast) Constructions and Investments Private Limited* India Less than 1%
* It is accounted based on signifi cant infl uence by the Company on the composition of Board of Directors.
1.5 The list of the joint ventures of the group that are included in the consolidation and the Group’s holding therein are as under:
Name of the Joint Ventures Percentage Holding – ShareStrabag AG Afcons Joint Venture, India 40%
Saipem Afcons Joint Venture, Oman 50%
2. Basis of Accounting
2.1 The Accounts are prepared on accrual basis under the historical cost convention and to comply in all material aspects with applicable accounting principles in India, the accounting standards notifi ed under the Companies (Accounting Standards) Rules, 2006 and the relevant provisions of the Companies Act, 1956 as amended from time to time.
2.2 Use of Estimates
The preparation of fi nancial statements in conformity with GAAP requires that the management of the company makes estimates and assumptions that affect the reported amounts of income and expenses of the period, the reported balances of assets and liabilities and the disclosures relating to contingent liabilities as of the date of the fi nancial statements. The estimates and assumptions used in the accompanying fi nancial statements are based upon Management’s evaluation of the relevant facts and circumstances as on the date of fi nancial statements. All information on key policies and the basis of the estimates and the major sources of uncertainties have been disclosed along with the respective note. Examples of such estimates include the useful lives of fi xed assets, provision for doubtful debts / advances, future obligations in respect of retirement benefi t plans, etc. Difference between actual results and estimates are recognised in the period in which the results are known / materialise.
2.3 Cash fl ow statement
Cash fl ows are reported using the indirect method, whereby profi t / (loss) before extraordinary items and tax is adjusted for the effects of transactions of non-cash nature and any deferrals or accruals of past or future cash receipts or payments. The cash fl ows from operating, investing and fi nancing activities of the Company are segregated based on the available information.
Cash comprises cash on hand and demand deposits with banks. Cash equivalents are short-term (with an original maturity of three months or less from the date of acquisition) highly liquid investments that are readily convertible into known amounts of cash and which are subject to insignifi cant risk of changes in value.
2.4 Tangible Fixed Assets
Tangible Fixed assets are stated at cost of acquisition/construction, inclusive of inward freight, duties, taxes, installation expenses and any expenses directly attributable to the assets to bring them to site and in working condition for its intended use; or book value and include amounts added on revaluation less accumulated depreciation (refer note 13(2)) and impairment loss, if any.
Leasehold improvements have been capitalized and are written off over the primary lease term not exceeding fi ve years.
2.5 Intangible Fixed Assets
Intangible assets are recognized as per the criteria specifi ed in Accounting Standard (AS) 26 – “Intangible Assets”.
2.6 Depreciation
Depreciation on fi xed assets (including revalued assets) is provided on the straight-line basis in accordance with the provisions of the Companies Act, 1956, at the rates and in the manner specifi ed in schedule XIV to the Act.
Capital spares consumed are capitalized and amortized over a period of four years.
The difference between depreciation on revalued cost and original cost has been withdrawn from Revaluation Reserve and credited to the Statement of Profi t and Loss.
Cost of the Intangible Assets viz computer software is amortized over a period of fi ve years.
2.7 Impairment
An asset is treated as impaired when the carrying cost of the asset exceeds its recoverable value. Recoverable amount is the higher of an asset’s net selling price and its value in use. Value in use is the present value of estimated future cash fl ows expected to arise from the continuing use of the asset and from its disposal at the end of its useful life. Net selling price is the amount obtainable from sale of the asset in an arm’s length transaction between knowledgeable, willing parties, less the costs of disposal. An impairment loss is charged to the Profi t & Loss in the year in which an asset is identifi ed as impaired. The impaired loss recognised in prior accounting periods is reversed if there has been a change in the estimate of the recoverable value.
59
CONSOLIDATED FINANCIAL STATEMENT OF AFCONS INFRASTRUCTURE LIMITED AND ITS SUBSIDIARIES,ASSOCIATES AND JOINT VENTURES (AFCONS GROUP)Notes forming part of the consolidated fi nancial statements for the year ended on 31st March, 2012
2.8 Investments
Current investments are carried at lower of cost and fair value. Long-term investments are carried at cost. However, when there is a decline, other than temporary in the value of the long term investment, the carrying amount is reduced to recognize the decline.
Investment in shares of the subsidiaries registered outside India, are stated at cost by converting at the rate of exchange prevalent at the time of acquisition thereof.
2.9 Inventories
a) Construction materials, stores and spare parts are valued at lower of cost and net realizable value. Cost is determined on the basis of weighted average method. Cost of shuttering materials (included in construction materials), issued to jobs, is charged off equally over a period of four years.
b) Work done remaining to be certifi ed / billed is treated as Construction Work in Progress in the accounts. The same is valued at the realizable value. Site Mobilisation Advance is stated at cost.
2.10 Retention monies
Amounts retained by the clients until satisfactory completion of the contract(s) are recognised in the fi nancial statements as receivables.Where such retention monies have been released by the clients against submission of bank guarantees, the amounts so released are adjusted against receivables from these clients.
2.11 Foreign currency transactions
Transactions in foreign currency, including in respect of branch operations integral in nature, are recorded at the average rates of exchange in force for the period. At the year end, monetary items, including those of branch operations integral in nature, denominated in foreign currency are reported using the closing rates of exchange. Exchange differences arising thereon and on realization/ payment of foreign exchange are accounted for in the relevant year as income or expense.
2.12 Revenue recognition on contracts
a) Contract revenue and expenses are recognized, when outcome can be estimated reliably, on the basis of percentage completion method. Percentage of completion is determined based on the nature of contracts, either in proportion of contract costs incurred upto the reporting date to the estimated total cost or on the basis of physical proportion of the contract work completed.
b) Contract revenue in case of ‘Cost Plus’ contracts is determined by adding the aggregate cost plus proportionate margin as agreed with the customer.
c) Variations (in contracts) and amounts in respect thereof are recognized only when it is probable that the customer(s) will approve them and amounts can be measured reliably.
d) Claims and amounts in respect thereof are recognized only when negotiations have advanced to a stage where it is probable that the customer(s) will accept them and amounts can be reliably measured. In the case of Arbitration Awards (the “Awards”) which are granted unanimously in favor of the Company, the claims awarded, are accounted in the year the Awards are received. The interest granted on such claims is recognised as per terms of the Awards.
e) Revenue is recognised only when no signifi cant uncertainties exist regarding its measurement and collectability.
2.13 Export Benefi ts
Export benefi ts in the form of duty credit entitlement licenses granted by the Government of India under the “Served from India” scheme, on the basis of export realizations made are recognised on the basis and to the extent of actual utilisation and management’s estimate of their likely utilisation.
2.14 Government grants /subsidies
Benefi t under Deemed Export scheme are recognised when there is a reasonable assurance that the Benefi t will be received and all attaching conditions will be complied with.
2.15 Provision for Estimated Losses
Estimated losses, if any, in respect of contracts in progress are provided for based upon current estimates of cost to completion.
2.16 Employee benefi ts
i) Gratuity
Company’s liability towards gratuity is determined by actuarial valuation carried out by the independent actuary as at each balance sheet date. The actuarial valuation method used for measuring the liability is the Projected Unit Credit method.
ii) Superannuation
The trustees of Afcons Infrastructure Limited Superannuation Scheme Trust have taken a Group Superannuation policy from the LIC. Provision for superannuation is made on the basis of premium payable in respect of the aforesaid policy.
iii) Provident fund
Contribution as required under the statute/ rules is made to the Government Provident Fund.

60
CONSOLIDATED FINANCIAL STATEMENT OF AFCONS INFRASTRUCTURE LIMITED AND ITS SUBSIDIARIES,ASSOCIATES AND JOINT VENTURES (AFCONS GROUP)Notes forming part of the consolidated fi nancial statements for the year ended on 31st March, 2012
iv) Compensated absences
The liability for compensated absences is determined by actuarial valuation carried out by the independent actuary as at each balance sheet date and provided for as incurred in the period in which services are rendered by employees. The actuarial valuation method used for measuring the liability is the Projected Unit Credit method.
v) Other Benefi ts
The undiscounted amount of short-term employee benefi ts expected to be paid in exchange for the services rendered by the employees is recognized during the period when the employee renders the service.
vi) Actuarial gains and losses
The actuarial gains and losses are recognised immediately in the statement of Profi t and Loss.
2.17 Borrowing costs
Borrowing costs that are attributable to the acquisition, construction or production of qualifying assets are capitalized as a part of the cost of such assets. A qualifying asset is one that necessarily takes a substantial period of time to get ready for its intended use or sale. All other borrowing costs are charged to revenue.
2.18 Segment Reporting: The following accounting policies have been followed for segment reporting:
i) Segment Revenue includes income directly identifi able with / allocable to the segment.
ii) Expenses that are directly identifi able with / allocable to segments are considered for determining the Segment Results. The expenses which relate to the Group as a whole and not allocable to segments are included under Unallocable expenses.
iii) Segment assets and liabilities include those directly identifi able with the respective segments.
2.19 Leases
Assets leased out under operating leases are capitalised. Rental Income is recognised on straight line basis over the lease term.
Assets acquired on lease where signifi cant portions of the risks and rewards incidental to ownership are retained by the lessors are classifi ed as operating leases. Lease rentals are charged to Statement of Profi t & Loss on straight line basis over the lease term.
2.20 Doubtful debts and advances Provision is made in the accounts for debts and advances which in the opinion of the management are considered doubtful of recovery.
2.21 Taxation
Income taxes are accounted for in accordance with Accounting Standard (AS-22) “Accounting for taxes on income”, notifi ed under the Companies ( Accounting Standards) Rules, 2006. Income tax comprises both current and deferred tax.
Current tax is measured on the basis of estimated taxable income and tax credits computed in accordance with the provisions of the Income Tax Act, 1961.
The tax effect of the timing differences that result between taxable income and accounting income and are capable of reversal in one or more subsequent periods are recorded as a deferred tax asset or deferred tax liability. They are measured using substantially enacted tax rates and tax regulations as of the Balance Sheet date.
Deferred tax assets arising mainly on account of brought forward losses and unabsorbed depreciation under tax laws, are recognized, only if there is virtual certainty of its realization, supported by convincing evidence. Deferred tax assets on account of other timing differences are recognized only to the extent there is a reasonable certainty of its realisation.
2.22 Interest Income
Interest income is accounted on accrual basis.
2.23 Accounting for joint ventures: Accounting for joint ventures has been done as follows :-
Type of Joint Venture : Jointly Controlled Entity Accounting treatment :
Interests in jointly controlled entities comprise of the share of the Group’s interest in a company in which the Group has acquired joint control over its economic activities by contractual agreement.
Interests in jointly controlled entities are included in the consolidated fi nancial statements of the Group from the point in time at which the joint control is transferred to the Group and are no longer included in the consolidated fi nancial statements from the point in time at which the joint control ceases. Interests in joint ventures are aggregated in the consolidated fi nancial statements by using the proportionate consolidation method, which means that the Group’s share in book values of like items of assets, liabilities, income and expenses are aggregated after eliminating the intra-Group balances and transactions to the extent of the proportionate share of the Group in the joint venture.
2.24 Provisions, Contingent Liabilities and Contingent Assets
Provisions are recognized when the Company has a legal and constructive obligation as a result of a past event, for which it is probable that cash outfl ow will be required and a reliable estimate can be made of the amount of the obligation. Contingent liabilities are disclosed when the Company has a possible or present obligation where it is not probable that an outfl ow of resources will be required to settle it. Contingent assets are neither recognized nor disclosed.

61
CONSOLIDATED FINANCIAL STATEMENT OF AFCONS INFRASTRUCTURE LIMITED AND ITS SUBSIDIARIES,ASSOCIATES AND JOINT VENTURES (AFCONS GROUP)Notes forming part of the consolidated fi nancial statements for the year ended on 31st March, 2012
As at 31st March 2012 As at 31st March 2011 Particulars Number of Number of Shares s in Lacs Shares s in Lacs 3. SHARE CAPITAL (a) AUTHORISED : Equity Shares of s 10 each 350,000,000 35,000.00 350,000,000 35,000.00 Preference Shares of s 10 each 650,000,000 65,000.00 650,000,000 65,000.00 TOTAL 1,000,000,000 100,000.00 1,000,000,000 100,000.00
(b) ISSUED,SUBSCRIBED AND FULLY PAID-UP : Equity Shares of s 10 each (Refer Note 1 below) 71,970,238 7,197.02 71,839,468 7,183.95 0.01% Non Cumulative and Non Profi t Participatory Convertible Preference Shares of s 10 each (Refer Note 2 below) 100,000,000 10,000.00 100,000,000 10,000.00 0.01% Fully and Compulsorily Convertible Non-Cumulative, Non Participatory Preference shares (“Subscriber Preference Shares”) of s 10 each. (Refer Note 3 below) 250,000,000 25,000.00 250,000,000 25,000.00 TOTAL 421,970,238 42,197.02 421,839,468 42,183.95
3.1 Rights, preferences and restrictions attached to Equity Shares: (a) Rights to receive dividend as may be approved by the Board / Annual General Meeting.
(b) The Equity shares are not repayable except in the case of a buy back, reduction of capital or winding up in terms of the provision of the Companies Act, 1956.
(c) Every member of the company holding equity shares has right to attend the General Meeting of the company and has a right to speak and on a show of hands, has one vote if he is present in person and on a poll shall have the right to vote in proportion to his share of the paid-up capital of the company.
3.2 Rights, preferences and restrictions attached to 0.01% Non Cumulative and Non Profi t Participatory Convertible Preference Shares:
(a) The Preference Shares shall be non- cumulative and non profi t participating convertible Preference Shares carrying a fi xed rate of dividend of 0.01% per annum to be paid in priority to the holders of any other class of shares.
(b) The Preference Shares shall be deemed to be converted into common equity shares of the Company at a price of R 68.25 per equity share (consisting of par of R 10 and a premium of R 58.25) immediately, automatically and without any further act of the parties in the event of conversion of the Preference Shares mentioned in note 3.3 (b) below.
(c) Every member of the Company holding preference shares has a right to vote in the General Meeting of the Company on resolution placed before the Company which directly affects the rights attached to his preference shares.
3.3 Rights, preferences and restrictions attached to 0.01% Fully and Compulsorily Convertible Non-Cumulative, Non Participatory Preference shares: (a) The Subscriber Preference Shares shall be entitled to non-cumulative preferential dividend at a fi xed rate of 0.01% per annum to be paid in
priority to the holders of any other class of shares.
(b) The Subscriber Preference Shares shall be fully automatically and mandatorily converted in to equity shares on the Mandatory Conversion date (i.e. 13th January, 2013 being the 5th year from the date of issue viz. 14th January, 2008) at a value to be determined at the time of Conversion.
(c) The Subscriber Preference Shares shall rank senior to all types of shares issued or to be issued by the Company.
(d) The Company to obtain prior consent of the holder of Subscriber Preference Shares (either at meeting or by way of a consent letter) before (i) issue of further Preference Shares of the same or any other class; (ii) issue of Ordinary Shares which will result in a change of control; (iii) issue of securities entitling holders to acquire any shares of and / or voting rights in the Company; (iv) amendment of Memorandum of Association and Article of Association of the Company; (v) variation of rights of Subscriber Preference Shares.

62
CONSOLIDATED FINANCIAL STATEMENT OF AFCONS INFRASTRUCTURE LIMITED AND ITS SUBSIDIARIES,ASSOCIATES AND JOINT VENTURES (AFCONS GROUP)Notes forming part of the consolidated fi nancial statements for the year ended on 31st March, 20123. SHARE CAPITAL (Contd.)3.4 Reconciliation of the number of shares outstanding at the beginning and at the end of the year:
As at 31st March 2012 As at 31st March 2011 Particulars Number of Number of Shares s in Lacs Shares s in LacsEquity shares outstanding at the beginning of the year 71,839,468 7,183.94 71,700,514 7,170.05 Add : Shares issued during the year under ESOP 130,770 13.08 138,954 13.90Equity shares outstanding at the end of the year 71,970,238 7,197.02 71,839,468 7,183.95
0.01% Non Cumulative and Non Profi t Participatory Convertible Preference Shares at the beginning of the year 100,000,000 10,000.00 100,000,000 10,000.00Preference shares outstanding at the end of the year 100,000,000 10,000.00 100,000,000 10,000.00 0.01% Fully and Compulsorily Convertible Non-Cumulative Non Participatory Preference shares at the beginning of the year 250,000,000 25,000.00 250,000,000 25,000.00Preference shares outstanding at the end of the year 250,000,000 25,000.00 250,000,000 25,000.00
3.5 Details of shares held by the holding company, the ultimate holding company, their subsidiaries and associates:
As at 31st March, 2012 As at 31st March, 2011 Equity 0.01% Non Equity 0.01% Non Shares Cumulative and Shares Cumulative and Non Profi t Non Profi t Particulars Participatory Participatory Convertible Convertible Preference Preference Shares Shares
Number of shares
Shapoorji Pallonji and Company Limited, the holding company 48,720,883 - 48,165,838 -
Subsidiaries of the holding company: Floreat Investments Limited (FIL) 13,015,929 100,000,000 13,015,929 100,000,000 Renaissance Commerce Pvt.Limited 4,016,250 - 4,016,250 - Hermes Commerce Ltd 4,016,250 - 4,016,250 - 3.6 Details of shares held by each shareholder holding more than 5% of shares of the Company:
As at 31st March, 2012 As at 31st March, 2011Class of shares / Name of shareholder Number of % holding Number of % holding shares held shares held
Equity shares Shapoorji Pallonji & Co. Ltd. 48,720,883 67.70% 48,165,838 67.05% Floreat Investments Limited 13,015,929 18.09% 13,015,929 18.12% Renaissance Commerce Pvt. Ltd. 4,016,250 5.58% 4,016,250 5.59% Hermes Commerce Ltd. 4,016,250 5.58% 4,016,250 5.59%
0.01% Non Cumulative and Non Profi t Participatory Convertible Preference Shares Floreat Investments Limited 100,000,000 100.00% 100,000,000 100.00%
0.01% Fully and Compulsorily Convertible Non-Cumulative Non Participatory Preference shares India Infrastructure AIL (Mauritius) 250,000,000 100.00% 250,000,000 100.00%

63
CONSOLIDATED FINANCIAL STATEMENT OF AFCONS INFRASTRUCTURE LIMITED AND ITS SUBSIDIARIES,ASSOCIATES AND JOINT VENTURES (AFCONS GROUP)Notes forming part of the consolidated fi nancial statements for the year ended on 31st March, 2012
As at As at 31st March,2012 31st March,2011 R in Lacs R in Lacs4. Reserves and surplus(a) Capital reserve Opening balance 83.78 43.93 Add: Additions during the year - 39.85 Closing balance 83.78 83.78 (b) Capital redemption reserve Opening balance 12.50 12.50 Closing balance 12.50 12.50 (c) Securities premium account Opening balance 1,018.85 1,009.12 Add : Premium on shares issued during the year 9.15 9.73 Closing balance 1,028.00 1,018.85 (d) Revaluation reserve Opening balance 161.70 239.10 Less: Utilised for set off against depreciation (62.24) (77.40) Closing balance 99.46 161.70 (e) Contingencies reserve Opening balance 800.00 800.00 Closing balance 800.00 800.00 (f) General reserve Opening balance 5,557.09 5,557.09 Closing balance 5,557.09 5,557.09 (g) Foreign currency translation reserve Opening balance 79.12 144.22 Add / (Less): Effect of foreign exchange rate variations during the year 1,306.89 (65.10) Closing balance 1,386.01 79.12 (h) Surplus in Statement of Profi t and Loss Opening balance 29,801.42 17,926.86 Add: Profi t for the year 9,453.19 11,878.63 Less: Appropriations Proposed Dividend on Preference Shares (R 0.001 per share) 3.50 3.50 Tax on dividend 0.57 0.57 Interim distribution of profi t to a Joint Venture partner 7.00 - Closing balance 39,243.54 29,801.42
Total 48,210.38 37,514.46
As at As at 31st March,2012 31st March,2011 R in Lacs R in Lacs5. Long-term borrowings
(a) Working Capital loans (Unsecured) From banks 7,500.00 15,000.00
(b) Equipment Loan (Secured) From banks : Rupee Loan 4,015.28 2,375.77 Foreign Currency Loan 10,174.00 -
(c) Other loans and advances Foreign Currency Loan (Secured) From banks 4,680.57 1,310.11
Total 26,369.85 18,685.88

64
CONSOLIDATED FINANCIAL STATEMENT OF AFCONS INFRASTRUCTURE LIMITED AND ITS SUBSIDIARIES,ASSOCIATES AND JOINT VENTURES (AFCONS GROUP)Notes forming part of the consolidated fi nancial statements for the year ended on 31st March, 2012
5. Long-term borrowings (Contd.) Notes: (i) Details of terms of repayment of long-term borrowings and security provided in respect thereof:
Terms of As at 31st March,2012 As at 31st March,2011 Particulars repayment Secured Unsecured Secured Unsecured and security R in Lacs R in Lacs R in Lacs R in Lacs Working Capital loans from banksOriental Bank of Commerce 5,000.00 Allahabad Bank Refer Note (i) - - - 5,000.00Bank of India below - 7,500.00 - 5,000.00 Total - Term Loan - 7,500.00 - 15,000.00
Equipment Loan from banksRupee Loan:Indian Overseas Bank Refer Note (ii) 693.97 - 830.40 - Oriental Bank of Commerce below 3,321.31 - 1,545.37 -
Foreign Currency Loan:DBS Bank Ltd 10,174.00 - - - Total - Equipment Loan 14,189.28 - 2,375.77 -
Other Loans and Advances from banks - Buyer’s Credit Foreign Currency Loans
State Bank of India Refer Note (iii) 3,902.26 - 1,310.11 - HSBC Bank below 778.31 - - - Total - Other loans and advances 4,680.57 - 1,310.11 - Total Long-term Borrowings 18,869.85 7,500.00 3,685.88 15,000.00
Notes: (i) Unsecured Working Capital loans from Banks carry interest ranging from 10% per annaum to 11% per annum payable monthly. The repayment schedule
of the loans are as follows.
Loan Amount Repayment Repayment Bank Name ( R in Lacs) in 2013-14 in 2014-15 ( R in Lacs) ( R in Lacs)
Bank of India 7,500.00 2 installments of 1 installment of R 2500.00 each R 2500.00
Previous Year
Bank Name Loan Amount Repayment Repayment ( R in Lacs) in 2012-13 in 2013-14 (R in Lacs) ( R in Lacs)
Oriental Bank of Commerce 5,000.00 1 installment of R 5000.00
Allahabad Bank 5,000.00 1 installment of R 5000.00
Bank of India 5,000.00 1 installment of 1 installment of R 2500.00 R 2500.00

65
CONSOLIDATED FINANCIAL STATEMENT OF AFCONS INFRASTRUCTURE LIMITED AND ITS SUBSIDIARIES,ASSOCIATES AND JOINT VENTURES (AFCONS GROUP)Notes forming part of the consolidated fi nancial statements for the year ended on 31st March, 2012
5. Long-term borrowings (Contd.)
ii.) Secured by fi rst charge by way of hypothecation of the equipments fi nanced. The Rupee loans carry interest ranging from 11% per annum to 12% per annum and Foreign currency loan carry interest @ Libor + 2.35%. The repayment schedule of the loans are as follows.
Bank Name Loan Amount Repayment Repayment Repayment Repayment (r in Lacs) in 2013-14 in 2014-15 in 2015-16 in 2016-17 (r in Lacs) (r in Lacs) (r in Lacs) (r in Lacs)
Rupee Loan:Indian Overseas Bank 693.97 2 installments of 2 installments of 2 installments of 1 installment of r 99.14 each r 99.14 each r 99.14 each r 99.13
Oriental Bank of Commerce 384.38 2 installments of - - - r 312.50 and r 71.88
Oriental Bank of Commerce 2,936.93 2 installments of 2 installments of 1 installment of - r 625.00 each r 625.00 each r 436.93
Foreign Currency Loan:DBS Bank Ltd 10,174.00 - 3 installments of 4 installments of 3 installments of r 1,017.40 each r 1,017.40 each r 1,017.40 each
Previous Year
Bank Name Loan Amount Repayment Repayment Repayment Repayment (r in Lacs) in 2012-13 in 2013-14 in 2014-15 in 2015-16 (r in Lacs) (r in Lacs) (r in Lacs) (r in Lacs)
Rupee Loan:Indian Overseas Bank 830.40 4 installments of - - - r 185.00 each and 1 installment of r 90.40
Oriental Bank of Commerce 1,545.37 2 installments of 1 installments of - - r 625.00 each r 295.37
(iii) The Loans carry interest @ Libor + 2.00%. State Bank of India loan is secured by a fi rst charge on the immovable properties of the Company situated in Andheri, Mumbai and Nagpur on a pari-passu
basis with other banks. It is further secured by hypothecation of the Company’s stocks of construction materials, stores and work in progress, and all other movable properties, plant and machinery and book debts on a pari-passu basis and also by goods covered under Letters of Credit.
HSBC Bank loan is secured by fi rst charge by way of hypothecation of equipment fi nance. The repayment schedule of the loans are as follows:
Bank Name Loan Amount Repayment Repayment (R in Lacs) in 2013-14 in 2014-15 (R in Lacs) (R in Lacs)
State Bank of India 3,902.26 3 installments of 2 installments of R 727.95 R 254.62 and R 755.42 R 400.39 R 1,763.88
HSBC Bank 778.31 - 1 installment of R 778.31 Previous Year
Bank Name Loan Amount Repayment Repayment (R in Lacs) in 2013-14 in 2014-15 (R in Lacs) (R in Lacs)
State Bank of India 1,310.11 2 installments of - R 636.99 and R 673.12

66
CONSOLIDATED FINANCIAL STATEMENT OF AFCONS INFRASTRUCTURE LIMITED AND ITS SUBSIDIARIES,ASSOCIATES AND JOINT VENTURES (AFCONS GROUP)Notes forming part of the consolidated fi nancial statements for the year ended on 31st March, 2012
As at As at 31st March,2012 31st March,2011 R in Lacs R in Lacs6.A Major components of deferred tax (liabilities) are as under:
Deferred tax (liability)
Tax effect of items constituting deferred tax liabilityOn difference between book balance and tax balance of fi xed assets (4,291.90) (3,436.86)Arbitration Awards (5,277.56) (2,886.27)Tax effect of items constituting deferred tax liability (9,569.46) (6,323.13)
Tax effect of items constituting deferred tax assetsProvision for compensated absences, gratuity and other employee benefi ts 232.89 69.25Provision for doubtful debts / advances 814.79 294.33 Others 860.96 191.61 Tax effect of items constituting deferred tax assets 1,908.64 555.19 Net deferred tax liability (7,660.82) (5,767.94)
As at As at 31st March,2012 31st March,2011 R in Lacs R in Lacs6.B Major components of deferred tax assets are as under:
Deferred tax asset Tax effect of items constituting deferred tax liabilityOn difference between book balance and tax balance of fi xed assets (0.97) - Tax effect of items constituting deferred tax liability (0.97) - Tax effect of items constituting deferred tax assetsOthers 17.03 - Tax effect of items constituting deferred tax assets 17.03 - Net deferred tax asset 16.06 -
As at As at 31st March,2012 31st March,2011 R in Lacs R in Lacs7. Other long-term liabilities
(a) Trade Payables - Retention monies 3,545.10 1,434.67
(b) Others: (i) Advances from customers 22,588.83 27,507.20 (ii) Statutory remittances (Contributions to PF and ESIC, Withholding Taxes, Excise Duty, VAT, Service Tax,etc.) 243.41 43.92 Total 26,377.34 28,985.79
As at As at 31st March,2012 31st March,2011 R in Lacs R in Lacs8. Long-term provisions
(a) Provision for employee benefi ts: (i) Provision for compensated absences 406.40 322.18 (ii) Provision for gratuity (Refer Note 32) 3.60 3.32
(b) Provision - For contingencies 282.78 252.70 (in respect of contracts under dispute) Total 692.78 578.20

67
CONSOLIDATED FINANCIAL STATEMENT OF AFCONS INFRASTRUCTURE LIMITED AND ITS SUBSIDIARIES,ASSOCIATES AND JOINT VENTURES (AFCONS GROUP)Notes forming part of the consolidated fi nancial statements for the year ended on 31st March, 2012
As at As at 31st March,2012 31st March,2011 R in Lacs R in Lacs9. Short-term borrowings
(a) Working Capital Demand Loans From banks Secured (Refer Note below) 23,000.00 26,000.00 Unsecured 2,500.00 - 25,500.00 26,000.00 (b) Short term Loans from Bank Rupee Loan: Unsecured - 5,000.00
Foreign Currency Loan: Buyers Credit (Secured) 1,601.84 - Packing Credit Finance (Unsecured) 2,543.50 - 4,145.34 5,000.00
(c) Cash Credit Facility from Banks (Secured) 6,826.43 470.33 (Refer Note below)
(d) Commercial Papers (Unsecured)
From Banks Face Value 5,000.00 5,000.00 Less: Discount not written-off 120.18 341.46 4,879.82 4,658.54 From Other parties Face Value - 7,500.00 Less: Discount not written-off - 599.05 - 6,900.95 (e) Loans Repayable on demand (Unsecured) From Related Parties (Refer Note 34) 90.00 90.00 Total 41,441.59 43,119.82Notes:(i) Details of security for the secured short-term borrowings:
Terms of repayment As at As at and security 31st March,2012 31st March,2011 R in Lacs R in LacsWorking Capital Demand Loans
From banks:State Bank of India 15,000.00 18,000.00Oriental Bank of Commerce 5,000.00 - IDBI Bank 3,000.00 - ING Vysya Bank Refer Below - 4,500.00 Axis Bank - 3,500.00 Total - from banks 23,000.00 26,000.00
Short Term Loans from BankForeign Currency Loan Buyers Credit (Secured) Refer Below 1,601.84 -
Cash Credit Facility Refer Below 6,826.43 470.33
Note: Secured by a fi rst charge on the immovable properties of the Company situated in Andheri, Mumbai and Nagpur on a pari-passu basis. It is further secured by hypothecation of the Company’s stocks of construction materials, stores and work in progress, and all other movable properties, plant and machinery and book debts on a pari-passu basis. Working Capital Demand Loans from banks carry interest ranging from 11.10% per annum to 11.25% per annum. Buyers Credit loans carry interest @ Libor +2.00% and Cash Credit Facility from Banks carry interest ranging from 11.50% per annum to 13.45% per annum.
As at As at 31st March,2012 31st March,2011 R in Lacs R in Lacs10. Trade payables
Acceptances 4,679.27 11,914.78 Other than Acceptances 67,818.71 55,282.09
Total 72,497.98 67,196.87
}

68
CONSOLIDATED FINANCIAL STATEMENT OF AFCONS INFRASTRUCTURE LIMITED AND ITS SUBSIDIARIES,ASSOCIATES AND JOINT VENTURES (AFCONS GROUP)Notes forming part of the consolidated fi nancial statements for the year ended on 31st March, 2012
As at As at 31st March,2012 31st March,2011 R in Lacs R in Lacs11. Other current liabilities
(a) Current maturities of long-term debt (Refer Note (i) below) 15,929.55 6,233.37 (b) Interest accrued but not due on borrowings 209.36 562.01 (c) Income received in advance (Unearned revenue) 115.61 12.75 (d) Unpaid matured deposits and interest accrued thereon (Refer Note (ii) below) 5.08 6.50 (e) Other payables (i) Statutory remittances (Contributions to PF and ESIC, Withholding Taxes, 4,628.26 3,446.83 Excise Duty, VAT, Service Tax, etc.) (ii) Interest accrued on advance from customers 361.89 78.79 (iii) Trade / security deposits received 14.30 6.87 (iv) Advances from customers 26,616.11 21,934.00 (v) Advances from Others 2,026.87 3,841.95 (vi) Others 7.10 32.75 Total 49,914.13 36,155.82
Note : (i) Refer Notes (ii) and (iii) in Note 5 - Long-term borrowings for details of security. (a) Working capital loans From banks (Unsecured) 12,500.00 2,500.00 (b) Equipment Loan (Secured) 3,429.55 3,733.37 Total 15,929.55 6,233.37
(ii) This does not include any amount due and outstanding to be credited to the Investor Education and Protection Fund.
As at As at 31st March,2012 31st March,2011 R in Lacs R in Lacs12. Short-term provisions
(a) Provision for employee benefi ts:
(i) Provision for compensated absences 83.81 82.41 (ii) Provision for gratuity (Refer Note 32) 267.25 208.47 351.06 290.88
(b) Provision - Others: (i) Provision for tax (net of advance tax R 1,523.57 Lacs (As at 31st March, 2011 R 2,605.95 Lacs) 274.11 165.33 (ii) Provision for estimated losses on onerous contracts - 204.45 (iii) Provision for proposed preference dividend 3.50 3.50 (iv) Provision for tax on proposed dividends 0.57 0.57 278.18 373.85 Total 629.24 664.73

69
CON
SOLI
DAT
ED F
INAN
CIAL
STA
TEM
ENT
OF
AFCO
NS
INFR
ASTR
UCT
UR
E LI
MIT
ED A
ND
ITS
SUBS
IDIA
RIE
S,AS
SOCI
ATES
AN
D J
OIN
T VE
NTU
RES
(AFC
ON
S G
RO
UP)
Not
es fo
rmin
g pa
rt of
the
cons
olid
ated
fi na
n c
ial s
tate
men
ts fo
r the
yea
r end
ed o
n 31
st M
arch
, 201
2
13. F
IXED
ASS
ETS
R
in L
acs
ATA
NG
IBLE
ASS
ETS
G
R O
S S
B
L O
C K
D E
P R
E C
I A
T I O
N /
A M
O R
T I
S A
T I O
N
N E
T B
L O
C K
Bal
ance
A
s at
1st A
pril,
20
11
Add
ition
sD
ispo
sals
Bal
ance
A
s at
31st M
arch
, 20
12
Bal
ance
A
s at
1st A
pril,
20
11
Depr
eciat
ion/
amor
tisati
onex
pens
e for
th
e yea
r
Adj
ustm
ents
Elim
inat
ed
on d
ispo
sal
of a
sset
s
Bal
ance
A
s at
31st M
arch
, 20
12
Bal
ance
As
at31
st M
arch
, 20
12
Bal
ance
As
at
31st M
arch
, 20
11
(a) L
and
Fr
eeho
ld
1.5
8 -
- 1
.58
- -
- -
- 1
.58
1.5
8
Le
aseh
old
16.
58
- -
16.
58
0.4
8 0
.16
- -
0.6
4 1
5.94
1
6.10
(b) B
uild
ings
1
,857
.54
- -
1,8
57.5
4 1
,229
.58
61.
75
- -
1,2
91.3
3 5
66.2
1 6
27.9
6
(c) P
lant
and
Equ
ipm
ent
59,
042.
08
16,
837.
35
(2,1
48.7
4)73
,730
.69
19,
296.
73
3,3
14.4
5 -
(1,3
01.4
4) 2
1,30
9.74
5
2,42
0.95
3
9,74
5.35
(d) F
urni
ture
and
Fix
ture
s 5
82.3
0 7
15.4
8 (1
24.4
3) 1
,173
.35
229.
37
95.
81
- (9
0.49
) 2
34.7
5 9
38.6
0 3
52.9
3
(e) V
ehic
les
758
.82
436
.29
(103
.52)
1,0
91.5
9 1
35.1
5 7
7.69
-
(31.
08)
181
.76
909
.83
623
.67
(f) O
ffi ce
Equ
ipm
ents
2
,002
.53
431
.48
(101
.84)
2,3
32.1
7 6
33.0
6 2
10.5
7 3
.25
(52.
19)
794
.69
1,5
37.4
8 1
,369
.47
(g) L
ease
hold
impr
ovem
ents
279
.22
- -
279
.22
279
.22
- -
- 2
79.2
2 -
-
(h) F
loat
ing
Equ
ipm
ents
5
,031
.24
93.
22
(54.
44)
5,0
70.0
2 1
,905
.89
422
.08
- (3
2.21
) 2
,295
.76
2,7
74.2
6
3,1
25.3
5
(i) L
abor
ator
y E
quip
men
ts 1
44.8
12.
93
- 1
47.7
4 7
3.19
3
.84
- -
77.
03
70.7
1 71
.62
Tota
l 6
9,71
6.70
1
8,51
6.75
(2
,532
.97)
85,
700.
48 2
3,78
2.67
4,
186.
41
3.2
5
(1,5
07.4
1) 2
6,46
4.92
5
9,23
5.56
4
5,93
4.03
Pre
viou
s Ye
ar60
,226
.93
12,2
84.0
3(2
,794
.26)
69,7
16.7
022
,394
.12
3,93
8.28
(44.
45)
(2,5
05.2
8)23
,782
.67
45,9
34.0
3N
otes
:
(1
) S
ome
of th
e Fi
xed
asse
ts v
iz.,
Pla
nt &
Equ
ipm
ent,
(incl
udin
g ce
rtain
item
s fu
lly w
ritte
n of
f in
prev
ious
yea
rs) L
abor
ator
y E
quip
men
t, B
arge
s (F
loat
ing
equi
pmen
ts),
New
& O
ld
W
orks
hop
and
Offi
ce B
uild
ing
as o
n 1s
t Apr
il, 1
990
wer
e re
valu
ed o
n th
e ba
sis
of th
e va
luat
ion
mad
e by
the
exte
rnal
val
uers
resu
lting
in n
et in
crea
se o
f R 4
,551
.21
Lacs
bei
ng s
urpl
us
on re
valu
atio
n.
(2
) R
eval
ued
amou
nts
subs
titut
ed fo
r His
toric
al C
ost a
s at
1st
Apr
il, 1
990
and
incl
uded
und
er G
ross
Blo
ck a
re a
s un
der :
i)
P
lant
& E
quip
men
t R 4
,261
.48
Lacs
ii)
L
abor
ator
y E
quip
men
ts R
124
.45
Lacs
iii
) W
orks
hop
& G
odow
n R
466.
02 L
acs
iv
) B
uild
ings
R 1
,260
.00
Lacs
v)
B
arge
s (F
loat
ing
Equ
ipm
ents
) R
899.
78 L
acs

70
CON
SOLI
DAT
ED F
INAN
CIAL
STA
TEM
ENT
OF
AFCO
NS
INFR
ASTR
UCT
UR
E LI
MIT
ED A
ND
ITS
SUBS
IDIA
RIE
S,AS
SOCI
ATES
AN
D J
OIN
T VE
NTU
RES
(AFC
ON
S G
RO
UP)
Not
es fo
rmin
g pa
rt of
the
cons
olid
ated
fi na
ncia
l sta
tem
ents
for t
he y
ear e
nded
on
31st M
arch
, 201
2
13. F
IXED
ASS
ETS
(Con
td.)
R in
Lac
s
B.
Inta
ngib
le a
sset
s
G R
O S
S
B L
O C
KD
E P
R E
C I
A T
I O N
/ A
M O
R T
I S
A T
I O N
N
E T
B L
O C
K
Bal
ance
A
s at
1st A
pril,
20
11
Add
ition
sD
ispo
sals
Bal
ance
A
s at
31st M
arch
, 20
12
Bal
ance
A
s at
1st A
pril,
20
11
Depr
eciat
ion/
amor
tisati
onex
pens
e for
th
e yea
r
Adj
ustm
ents
Elim
inat
ed
on d
ispo
sal
of a
sset
s
Bal
ance
A
s at
31st M
arch
, 20
12
Bal
ance
As
at31
st M
arch
, 20
12
Bal
ance
As
at
31st M
arch
, 20
11
(a) C
ompu
ter s
oftw
are
-
A
cqui
red
172.
74 4
99.2
3 -
671.
9770
.14
121.
78-
-19
1.92
480.
0510
2.60
(b) G
oodw
ill -
Acq
uire
d20
.00
--
20.0
0-
--
--
20.0
020
.00
Tota
l19
2.74
499.
23-
691.
9770
.14
121.
78-
-19
1.92
500.
0512
2.60
Pre
viou
s ye
ar
192
.21
3.53
(3
.00)
1
92.7
4 40
.52
39.
89
(10.
27)
- 70
.14
122
.60
-
C.
Cap
ital W
ork
in P
rogr
ess
- Pla
nt a
nd e
quip
men
ts u
nder
inst
alla
tion
r 33
,894
.05
Lacs
(Pre
viou
s ye
ar r
1,5
18.3
1 La
cs)
D.
Dep
reci
atio
n an
d am
ortis
atio
n
Part
icul
ars
For t
he y
ear e
nded
Fo
r the
yea
r end
ed
31
st M
arch
,201
2 31
st M
arch
,201
1
R in
Lac
s
R in
Lac
s
Dep
reci
atio
n an
d am
ortis
atio
n fo
r the
yea
r on
tang
ible
ass
ets
as p
er (a
) abo
ve
4,
186.
41
3,9
38.2
8
D
epre
ciat
ion
and
amor
tisat
ion
for t
he y
ear o
n in
tang
ible
ass
ets
as p
er (b
) abo
ve
1
21.7
8
39.
89
4,
308.
19
3,9
78.1
7
Le
ss: U
tilis
ed fr
om re
valu
atio
n re
serv
e
62.2
4 77
.40
D
epre
ciat
ion
and
amor
tisat
ion
as p
er s
tate
men
t of P
rofi t
and
Los
s
4,2
45.9
5
3,9
00.7
7
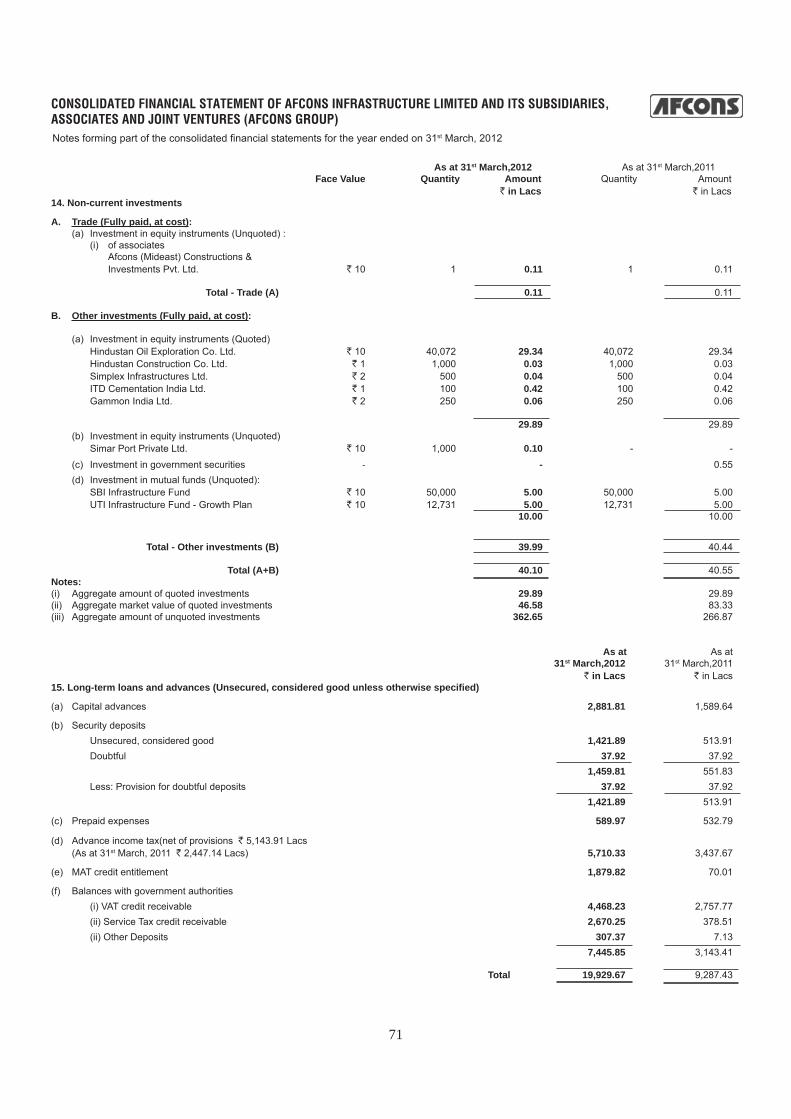
71
CONSOLIDATED FINANCIAL STATEMENT OF AFCONS INFRASTRUCTURE LIMITED AND ITS SUBSIDIARIES,ASSOCIATES AND JOINT VENTURES (AFCONS GROUP)Notes forming part of the consolidated fi nancial statements for the year ended on 31st March, 2012
As at 31st March,2012 As at 31st March,2011 Face Value Quantity Amount Quantity Amount R in Lacs R in Lacs14. Non-current investments
A. Trade (Fully paid, at cost): (a) Investment in equity instruments (Unquoted) : (i) of associates Afcons (Mideast) Constructions & Investments Pvt. Ltd. R 10 1 0.11 1 0.11 Total - Trade (A) 0.11 0.11 B. Other investments (Fully paid, at cost):
(a) Investment in equity instruments (Quoted) Hindustan Oil Exploration Co. Ltd. R 10 40,072 29.34 40,072 29.34 Hindustan Construction Co. Ltd. R 1 1,000 0.03 1,000 0.03 Simplex Infrastructures Ltd. R 2 500 0.04 500 0.04 ITD Cementation India Ltd. R 1 100 0.42 100 0.42 Gammon India Ltd. R 2 250 0.06 250 0.06 29.89 29.89 (b) Investment in equity instruments (Unquoted) Simar Port Private Ltd. R 10 1,000 0.10 - - (c) Investment in government securities - - 0.55 (d) Investment in mutual funds (Unquoted): SBI Infrastructure Fund R 10 50,000 5.00 50,000 5.00 UTI Infrastructure Fund - Growth Plan R 10 12,731 5.00 12,731 5.00 10.00 10.00
Total - Other investments (B) 39.99 40.44
Total (A+B) 40.10 40.55Notes:(i) Aggregate amount of quoted investments 29.89 29.89 (ii) Aggregate market value of quoted investments 46.58 83.33 (iii) Aggregate amount of unquoted investments 362.65 266.87
As at As at 31st March,2012 31st March,2011 R in Lacs R in Lacs15. Long-term loans and advances (Unsecured, considered good unless otherwise specifi ed)
(a) Capital advances 2,881.81 1,589.64
(b) Security deposits Unsecured, considered good 1,421.89 513.91 Doubtful 37.92 37.92 1,459.81 551.83 Less: Provision for doubtful deposits 37.92 37.92 1,421.89 513.91
(c) Prepaid expenses 589.97 532.79
(d) Advance income tax(net of provisions R 5,143.91 Lacs (As at 31st March, 2011 R 2,447.14 Lacs) 5,710.33 3,437.67
(e) MAT credit entitlement 1,879.82 70.01
(f) Balances with government authorities (i) VAT credit receivable 4,468.23 2,757.77 (ii) Service Tax credit receivable 2,670.25 378.51 (ii) Other Deposits 307.37 7.13 7,445.85 3,143.41
Total 19,929.67 9,287.43

72
CONSOLIDATED FINANCIAL STATEMENT OF AFCONS INFRASTRUCTURE LIMITED AND ITS SUBSIDIARIES,ASSOCIATES AND JOINT VENTURES (AFCONS GROUP)Notes forming part of the consolidated fi nancial statements for the year ended on 31st March, 2012 As at As at 31st March,2012 31st March,2011 R in Lacs R in Lacs16. Other non-current assets
(a) Long-term trade receivables - Under arbitration and Retention monies Unsecured, considered good 7,666.24 13,343.25 Doubtful 2,134.55 509.65 9,800.79 13,852.90 Less: Provision for doubtful trade receivables 2,134.55 509.65 7,666.24 13,343.25
(b) Construction work-in-progress - Under arbitration Unsecured, considered good 24,468.35 28,201.73 Doubtful 234.56 234.56 24,702.91 28,436.29 Less: Advances received - 513.38 Less: Provision for doubtful trade receivables 234.56 234.56 24,468.35 27,688.35
(c) Other Loans and Advances (Doubtful) 103.81 103.81 Less: Provision for other doubtful loans and advances 103.81 103.81 - -
(d) Other Bank Balances * 17.51 17.51 Less : Provision 17.51 17.51 - - Total 32,134.59 41,031.60 * The balances in these bank accounts are subject to exchange control restrictions for repatriation.
As at As at 31st March,2012 31st March,2011 R in Lacs R in Lacs17. Inventories
(a) Construction Materials - at lower of cost and net realisable value Steel 12,399.35 3,705.46 Cement 356.10 221.30 Aggregate 1,965.68 516.38 Bitumen 34.17 - Shuttering Material 2,996.91 2,798.41 Sand 155.44 206.73 Other Construction Material 3,577.64 1,105.00 21,485.29 8,553.28
(b) Stores and spares - at lower of cost and net realisable value 7,769.37 4,961.05 7,769.37 4,961.05 (c) Construction Work-in-Progress At estimated realisable value 85,312.48 62,842.93 Less: Advances received 27,577.77 9,538.04 57,734.71 53,304.89 Total 86,989.37 66,819.22
As at As at 31st March,2012 31st March,2011 R in Lacs R in Lacs18. Trade receivables
Trade receivables outstanding for a period exceeding six months from the date they were due for payment
Unsecured, considered good 19,819.28 21,854.19
Other Trade receivables Unsecured, considered good 31,460.74 25,677.15 Total 51,280.02 47,531.34

73
CONSOLIDATED FINANCIAL STATEMENT OF AFCONS INFRASTRUCTURE LIMITED AND ITS SUBSIDIARIES,ASSOCIATES AND JOINT VENTURES (AFCONS GROUP)Notes forming part of the consolidated fi nancial statements for the year ended on 31st March, 2012 As at As at 31st March,2012 31st March,2011 R in Lacs R in Lacs19. Cash and cash equivalents
(a) Cash on hand 57.18 75.67 (b) Balances with banks (i) In current accounts 5,941.82 13,330.29 (ii) In EEFC accounts 32.57 11,417.34 (iii) In deposit accounts (Refer Note (ii) below) 11,117.83 20,141.05 (iv) In earmarked accounts - Balances held as margin money or security against 6.92 131.43 borrowings, guarantees and Other commitments (Refer Note (ii) below) - Other earmarked accounts (Refer Note (i) below) 355.89 634.15
Total 17,512.21 45,729.93 Of the above, the balances that meet the defi nition of Cash and 17,149.40 44,964.35 cash equivalents as per AS 3 Cash Flow Statements is
Notes: (i) Includes deposits r 335.11 Lacs (Previous Year r 335.11 Lacs) over which Banks and Clients have lien and r 20.78 Lacs (Previous year r 299.04 Lacs)
placed as Earnest Money Deposit with various authorities. (ii) Includes deposits amounting to r 3.40 Lacs (As at 31st March, 2011 r 3.40 Lacs) and margin monies amounting to r 6.92 Lacs (As at 31st March, 2011 r 6.92
Lacs) which have an original maturity of more than 12 months.
As at As at 31st March,2012 31st March,2011 R in Lacs R in Lacs20. Short-term loans and advances (Unsecured, considered good)
(a) Loans and advances to related parties (Refer Note 39)
To Joint Ventures 1,033.36 2,675.89
(b) Security deposits 370.34 476.43
(c) Loans and advances to employees 126.48 96.42
(d) Prepaid expenses 1,811.73 1,701.59
(e) Balances with government authorities (i) CENVAT credit receivable - 55.00 (ii) VAT credit receivable 746.84 2,221.79 (iii) Service Tax credit receivable 11.58 60.41 (iv) Other Deposits 0.90 0.90 759.32 2,338.10
(f) Others - Advance to vendors and others 9,717.52 12,091.19
Total 13,818.75 19,379.62
As at As at 31st March,2012 31st March,2011 R in Lacs R in Lacs21. Other current assets(a) Accruals (i) Interest accrued on bank deposits 83.39 208.65
(b) Others (i) Insurance claims 16.93 50.51 (ii) Deemed export receivable 301.99 - (iii) Duty Credit receivable 122.07 3,609.83
Total 524.38 3,868.99

74
CONSOLIDATED FINANCIAL STATEMENT OF AFCONS INFRASTRUCTURE LIMITED AND ITS SUBSIDIARIES,ASSOCIATES AND JOINT VENTURES (AFCONS GROUP)Notes forming part of the consolidated fi nancial statements for the year ended on 31st March, 2012
For the year ended For the year ended 31st March,2012 31st March,2011 R in Lacs R in Lacs22. Revenue from operations
(a) Sale of products (Refer Note (i) below) 14.93 2.81
(b) Sale of services (Refer Note (ii) below) 242,298.07 276,097.37
(c) Other operating revenues (Refer Note (iii) below) 4,113.71 7,203.34 Total 246,426.71 283,303.52
Note: For the year ended For the year ended 31st March,2012 31st March,2011 R in Lacs R in Lacs(i) Sale of products comprises: Construction Materials 14.93 2.81 Total - Sale of products 14.93 2.81(ii) Sale of services comprises: Construction Revenue 247,354.37 280,069.95 Less : Value added tax 5,056.30 3,972.58 Total - Sale of services 242,298.07 276,097.37 (iii) Other operating revenues comprise: Project Management Fees - 1,370.47 Sale of scrap 1,520.63 870.72 Duty Scrip credit availed 2,375.12 3,426.26 Equipment Hire Charges 193.99 1,186.49 Service Charges 23.97 349.40 Total - Other operating revenues 4,113.71 7,203.34
For the year ended For the year ended 31st March,2012 31st March,2011 R in Lacs R in Lacs23. Other Income
(a) Interest income (Refer Note (i) below) 6,591.51 2,747.02
(b) Dividend income: From non trade,non current investments 0.02 0.22
(c) Other non-operating income (Refer Note (ii) below) 2,174.02 3,497.20 Total 8,765.55 6,244.44
Note: For the year ended For the year ended 31st March,2012 31st March,2011 R in Lacs R in Lacs(i) Interest income comprises: Interest from banks deposits 502.60 376.64 Interest on loans and advances 815.12 85.47 Interest on Arbitration awards 5,258.92 2,062.61 Interest income from long term investments 1.65 1.74 Interest on income tax refund 12.60 160.93 Other Interest 0.62 59.63 Total - Interest income 6,591.51 2,747.02 (ii) Other non-operating income comprises: Profi t on sale of fi xed assets 114.13 - Liabilities / provisions no longer required written back 1,176.41 2,261.40 Insurance Claim received 245.91 630.16 Provision for Projected Loss written back 204.45 211.19 Miscellaneous income 433.12 394.45 Total - Other non-operating income 2,174.02 3,497.20

75
CONSOLIDATED FINANCIAL STATEMENT OF AFCONS INFRASTRUCTURE LIMITED AND ITS SUBSIDIARIES,ASSOCIATES AND JOINT VENTURES (AFCONS GROUP)
Notes forming part of the consolidated fi nancial statements for the year ended on 31st March, 2012 For the year ended For the year ended 31st March,2012 31st March,2011 R in Lacs R in Lacs24. Cost of construction Cost of Construction Materials consumed 46,330.83 100,546.52Other Construction Expenses:Consumption of stores and spare parts 13,908.31 3,481.43Subcontracting 86,027.45 80,058.41 Site Installation 3,557.94 4,026.40 Technical Consultancy 9,578.06 12,576.67 Power and fuel 6,129.55 4,137.67 Freight and forwarding 5,532.06 8,877.83 124,733.37 113.158.41Less: Recovery of Expenses (Refer Note 40) (469.02) (515.16) Total 170,595.18 213,189.77
For the year ended For the year ended 31st March,2012 31st March,2011 R in Lacs R in Lacs25. Employee benefi ts expenseSalaries and wages 26,973.76 24,983.00 Contributions to provident and other funds 1,541.18 1,114.12 Staff welfare expenses 2,472.05 2,141.37 30,986.99 28,238.49 Less: Recovery of Expenses (Refer Note 40) (374.12) (1,916.02)
Total 30,612.87 26,322.47
For the year ended For the year ended 31st March,2012 31st March,2011 R in Lacs R in Lacs26. Finance costs(a) Interest expense on : (i) Borrowings 7,823.60 5,548.88 (ii) Advance from Clients 283.11 218.68 (iii) Interest on delayed / deferred payment of income tax 303.43 0.03 (iv) Others 259.01 349.58 (b) Other borrowing costs : (i) Bank Guarantee Commission including Bank Charges 1,451.80 1,381.68 (ii) L/c charges & Processing Fees 497.37 184.68 10,618.32 7,683.53 Less: Recovery of Expenses (Refer Note 40) (74.15) (104.30) Total 10,544.17 7,579.23
For the year ended For the year ended 31st March,2012 31st March,2011 R in Lacs R in Lacs27. Other expensesWater and Electricity 331.92 292.00 Rent (Refer Note 35) 2,580.17 2,098.57 Repairs and maintenance - Buildings 2.64 3.18 Repairs and maintenance - Machinery 326.65 226.00 Repairs and maintenance - Others 1,162.76 1,182.55 Insurance 2,496.69 2,170.41 Rates and taxes 2,229.90 3,158.97 Communication 548.17 562.49 Travelling and conveyance 4,515.73 4,273.92 Security Charges 979.67 586.12 Donations and contributions 63.20 26.35 Legal and professional 5,511.04 6,267.08 Payments to auditors 68.41 59.56 Provision for bad trade and other receivables 1,624.91 1,685.53 Duty Scrip / Advances written off 163.85 - Net loss on foreign currency transactions and translation 53.98 42.99 Directors Fees 6.10 6.90 Loss on sale of fi xed assets 225.85 18.88 Expenses of jobs completed in earlier year 30.08 30.00 Miscellaneous expenses 1,217.39 2,953.61 24,139.11 25,645.11Less: Recovery of Expenses (Refer Note 40) (1.49) (2,224.56) Total 24,137.62 23,420.55
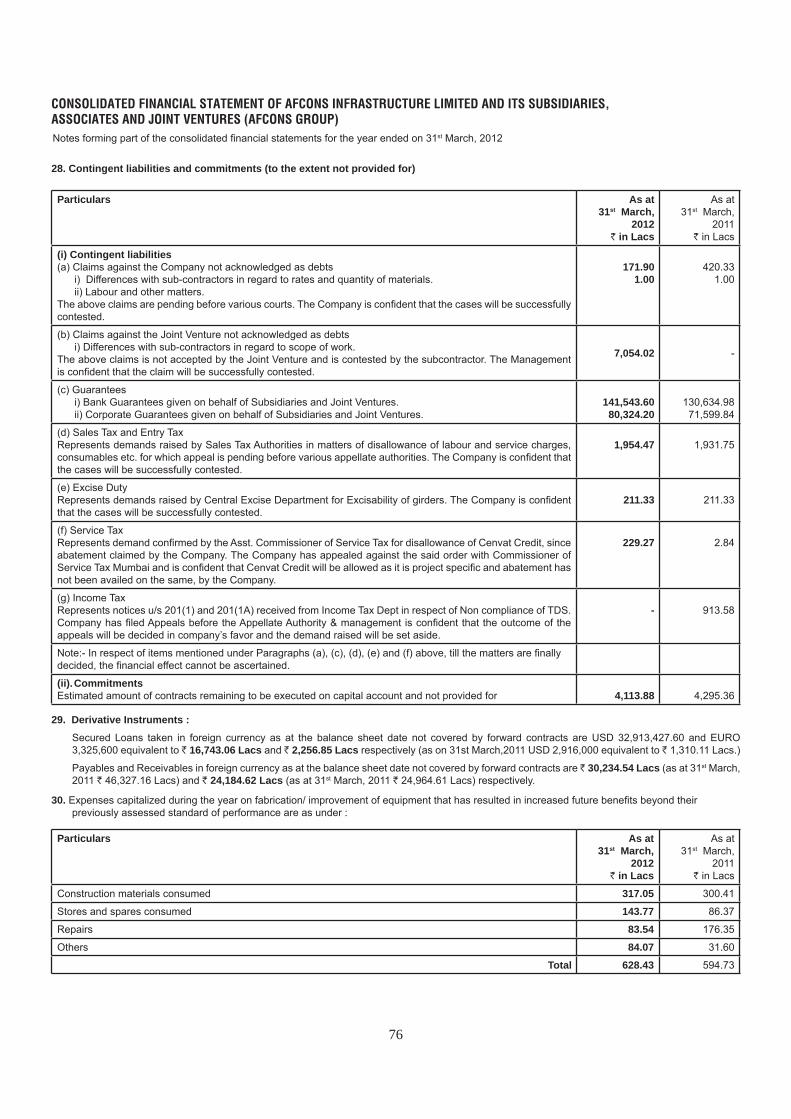
76
CONSOLIDATED FINANCIAL STATEMENT OF AFCONS INFRASTRUCTURE LIMITED AND ITS SUBSIDIARIES,ASSOCIATES AND JOINT VENTURES (AFCONS GROUP)Notes forming part of the consolidated fi nancial statements for the year ended on 31st March, 2012
28. Contingent liabilities and commitments (to the extent not provided for)
Particulars As at 31st March,
2012R in Lacs
As at 31st March,
2011R in Lacs
(i) Contingent liabilities(a) Claims against the Company not acknowledged as debts i) Differences with sub-contractors in regard to rates and quantity of materials. ii) Labour and other matters.The above claims are pending before various courts. The Company is confi dent that the cases will be successfully contested.
171.90 1.00
420.33 1.00
(b) Claims against the Joint Venture not acknowledged as debts i) Differences with sub-contractors in regard to scope of work.The above claims is not accepted by the Joint Venture and is contested by the subcontractor. The Management is confi dent that the claim will be successfully contested.
7,054.02 -
(c) Guarantees i) Bank Guarantees given on behalf of Subsidiaries and Joint Ventures. ii) Corporate Guarantees given on behalf of Subsidiaries and Joint Ventures.
141,543.60 80,324.20
130,634.98 71,599.84
(d) Sales Tax and Entry Tax Represents demands raised by Sales Tax Authorities in matters of disallowance of labour and service charges, consumables etc. for which appeal is pending before various appellate authorities. The Company is confi dent that the cases will be successfully contested.
1,954.47 1,931.75
(e) Excise Duty Represents demands raised by Central Excise Department for Excisability of girders. The Company is confi dent that the cases will be successfully contested.
211.33 211.33
(f) Service Tax Represents demand confi rmed by the Asst. Commissioner of Service Tax for disallowance of Cenvat Credit, since abatement claimed by the Company. The Company has appealed against the said order with Commissioner of Service Tax Mumbai and is confi dent that Cenvat Credit will be allowed as it is project specifi c and abatement has not been availed on the same, by the Company.
229.27 2.84
(g) Income TaxRepresents notices u/s 201(1) and 201(1A) received from Income Tax Dept in respect of Non compliance of TDS. Company has fi led Appeals before the Appellate Authority & management is confi dent that the outcome of the appeals will be decided in company’s favor and the demand raised will be set aside.
- 913.58
Note:- In respect of items mentioned under Paragraphs (a), (c), (d), (e) and (f) above, till the matters are fi nally decided, the fi nancial effect cannot be ascertained.
(ii). CommitmentsEstimated amount of contracts remaining to be executed on capital account and not provided for 4,113.88 4,295.36
29. Derivative Instruments : Secured Loans taken in foreign currency as at the balance sheet date not covered by forward contracts are USD 32,913,427.60 and EURO
3,325,600 equivalent to r 16,743.06 Lacs and r 2,256.85 Lacs respectively (as on 31st March,2011 USD 2,916,000 equivalent to r 1,310.11 Lacs.)
Payables and Receivables in foreign currency as at the balance sheet date not covered by forward contracts are r 30,234.54 Lacs (as at 31st March, 2011 r 46,327.16 Lacs) and r 24,184.62 Lacs (as at 31st March, 2011 r 24,964.61 Lacs) respectively.
30. Expenses capitalized during the year on fabrication/ improvement of equipment that has resulted in increased future benefi ts beyond their previously assessed standard of performance are as under :
Particulars As at 31st March,
2012R in Lacs
As at 31st March,
2011R in Lacs
Construction materials consumed 317.05 300.41
Stores and spares consumed 143.77 86.37
Repairs 83.54 176.35
Others 84.07 31.60
Total 628.43 594.73

77
31. Disclosure in accordance with Accounting Standard - 7 (Revised)
Particulars As at 31st March, 2012
R in Lacs
As at 31st March, 2011
R in Lacs
Details of contract revenue and costs
a) Contract Revenue 247,354.37 280,069.95
b) Disclosure for contracts in progress:
(i) Aggregate amount of costs incurred 591,766.75 490,946.63
(ii) Recognized profi ts (less recognized losses) 74,610.37 70,952.68
(iii) Advances Received 61,688.36 51,137.43
(iv) Retention Money 5,035.29 6,480.05
c) Gross amount due from customers for contract work 79,749.23 40,175.01
d) Gross amount due to customers for contract work 4,930.39 19,864.51
32. The company has accounted liability for gratuity and compensated absences as per the Accounting Standard (AS- 15 Revised) on “Employee Benefi ts”. Reconciliation of opening and closing balance of the present value of the defi ned benefi t obligation for gratuity and long term compensated absences is given below:
A. Assumptions Current Year 31st March, 2011
Discount Rate 8.50% 8.25%
Rate of Return on Plan Assets 8.60% 8.00%
Salary Escalation 4.50% 4.50%
Mortality Table LIC (1994-96)Ultimate LIC (1994-96)Ultimate
(r. in Lacs)
B. Changes in the Defi ned Benefi t Obligation Current Year 31st March, 2011
Liability at the Beginning of the current year 1047.71 892.43
Interest Cost 86.43 73.62
Current Service Cost 91.36 92.58
Past Service Cost - -
Benefi t Paid (77.55) (119.57)
Actuarial Loss/ (Gain) on obligations 87.10 108.65
Liability at the end of the current year 1,235.05 1,047.71
C. Fair Value of the Plan Asset Current Year 31st March, 2011
Fair Value of Plan Asset at the beginning of the year 835.94 643.10
Expected Return on Plan Asset 66.88 51.45
Contributions 124.38 247.56
Benefi t paid (77.55) (119.57)
Actuarial Gain/ (Loss) on Plan Assets 14.57 13.40
Fair value of Plan Assets at the end of the year 964.20 835.94
Total Actuarial Loss to be Recognized (72.53) (95.25)
D. Actual Return on Plan Assets: Current Year 31st March, 2011
Expected Return on Plan Assets 66.88 51.45
Actuarial Gain/ (Loss) on Plan Assets 14.57 13.40
Actual Return on Plan Assets 81.45 64.85
CONSOLIDATED FINANCIAL STATEMENT OF AFCONS INFRASTRUCTURE LIMITED AND ITS SUBSIDIARIES,ASSOCIATES AND JOINT VENTURES (AFCONS GROUP)Notes forming part of the consolidated fi nancial statements for the year ended on 31st March, 2012

78
r in Lacs
E. Amount Recognized in the Balance Sheet: Current Year 31st March, 2011
Liability at the end of the year 1235.05 1047.71
Fair Value of Plan Assets at the end of the year 964.20 835.94
Unrecognized Past Service Cost - -
Amount recognized in the Balance Sheet (270.85) (211.78)
F. Expense Recognized in the Profi t and Loss Account: Current Year 31st March, 2011
Current Service Cost 91.36 92.58
Interest Cost 86.43 73.62
Expected Return on Plan Assets (66.88) (51.44)
Past Service Cost - -
Net Actuarial Gain / Loss to be recognized 72.53 95.25
Expense recognized in the Profi t and Loss Account under staff expenses 183.44 210.01
G. Reconciliation of the Liability recognized in the Balance Sheet: Current Year 31st March, 2011
Opening Net Liability 211.78 249.33
Expense recognized 183.44 210.01
Employers Contribution (124.38) (247.56)
Amount recognized in the Balance Sheet under “Provision for Gratuity” 270.85 211.78
H. Major category of plan assets as percentage of total plan assets: Current Year 31st March, 2011
Insured Managed funds 100% 100%(b) Compensated Absences (Non funded) :
Actuarial Assumptions Current Year 31st March, 2011
Mortality Table LIC (1994-1996) Ultimate
LIC (1994-1996) Ultimate
Discount Rate 8.50% 8.25%
Salary Escalation 4.50% 4.50%
Withdrawal Rate 2.00% 2.00%
Experience adjustments
A. Assumptions 2011-2012 2010-2011 2009-2010 2008-2009 2007-2008Present value of DBO 1235.05 1047.71 892.43 802.57 630.26
Fair value of plan assets 964.20 835.94 643.10 581.22 491.61
Funded status [Surplus / (Defi cit)] (270.85) (211.78) (249.33) (221.35) (138.65)
Experience gain / (loss) adjustments on plan liabilities
(107.95) (108.35) (44.48) * *
Experience gain / (loss) adjustments on plan assets
14.57 13.40 2.78 (0.98) (2.52)
The Company makes Provident Fund and Superannuation Fund contributions to defi ned contribution plans for qualifying employees. Under the Schemes, the Company is required to contribute a specifi ed percentage of the payroll costs to fund the benefi ts. The Company recognised r 1,251.87 Lacs (Year ended 31st March, 2011 r 489.05 Lacs) for Provident Fund contributions and r 475.00 Lacs (Year ended 31st March, 2011 r 349.29 Lacs ) for Superannuation Fund contributions in the Statement of Profi t and Loss. The contributions payable to these plans by the Company are at rates specifi ed in the rules of the schemes.
Note : i) Premium is paid to LIC under Group Gratuity Scheme of LIC. ii) The estimates of future salary increases, considered in actuarial valuation, take account of infl ation, seniority, promotion and other relevant factor
such as supply and demand in the employment market. The above information is certifi ed by the actuary and relied upon by the Auditors. iii) The details of experience adjustments on account of Plan Liability and Plan Asset as required by Para 120 (n) (ii) of AS-15 is r 107.95 Lacs (loss)
and r 14.57 Lacs (gain) respectively. However, as the details of experience adjustments on account of Plan Liability for the year ended 31st March 2008 and 2009 are not readily available in valuation report and hence not furnished.
iv) Contributions expected to be paid to the plan during the annual period beginning after the Balance Sheet date is r 348.53 Lacs. v) The expected return on plan assets is determined considering several applicable factors which includes mainly the composition of plan assets held,
assessed risks of asset management and historical result of the return on plan asset.
CONSOLIDATED FINANCIAL STATEMENT OF AFCONS INFRASTRUCTURE LIMITED AND ITS SUBSIDIARIES,ASSOCIATES AND JOINT VENTURES (AFCONS GROUP)Notes forming part of the consolidated fi nancial statements for the year ended on 31st March, 2012

79
CONSOLIDATED FINANCIAL STATEMENT OF AFCONS INFRASTRUCTURE LIMITED AND ITS SUBSIDIARIES,ASSOCIATES AND JOINT VENTURES (AFCONS GROUP)Notes forming part of the consolidated fi nancial statements for the year ended on 31st March, 2012 33. Segment information : a. Segment information for Primary reporting (by business segment) The company has only one reportable business segment of construction business, hence information for primary business segment is not given.
b. Segment information for Secondary segment reporting (by geographical segment).
The Company has two reportable geographical segments based on location of customers.
(i) Revenue from customers within India - Local projects (ii) Revenue from customers outside India - Foreign projects Secondary : Geographical (Location of customers) r in Lacs
Particulars Local Projects Foreign Projects Total
Income from operation 153,170.62 (198,688.22)
93,256.09 (84,615.30)
246,426.71 (283,303.52)
Carrying amount of asset 273,318.32(208,030.31)
34,910.18(56,130.87)
308,228.50(264,161.18)
Additons to Fixed Assets 50,632.42 (12,327.46)
759.30 (1,384.23)
51,391.72 (13,711.69)
Figures in parenthesis are those of previous year.
34. Related Party Disclosure
Details of related parties:(a) Related Party where Control exists
Ultimate Holding Company
Shapoorji Pallonji & Company Limited
Fellow Subsidiary(s)
Floreat Investments Limited
Associate of the Company
Afcons (Mideast) Constructions and Investments Private Limited
Jointly Controlled Entity
Strabag AG Afcons Joint Venture
Saipem Afcons Joint Venture
Key Management Personnel
Mr. C.P. Mistry – Chairman (upto 23rd March, 2012)
Mr. K. Subrahmanian – Managing Director
Mr. S. Paramasivan – Executive Director (Finance & Commercial) (upto 31st March 2012)

80
CONSOLIDATED FINANCIAL STATEMENT OF AFCONS INFRASTRUCTURE LIMITED AND ITS SUBSIDIARIES,ASSOCIATES AND JOINT VENTURES (AFCONS GROUP) Notes forming part of the consolidated fi nancial statements for the year ended on 31st March, 2012
34. Related Party Disclosure (Contd.)
(b) Details of transactions with related parties during the year R in Lacs
Ultimate Holding Company
Joint Venture(s) Associate Company
Key Management Personnel
Fellow Subsidairy Total
Managerial Remuneration paid
-
(-)
-
(-)
-
(-)
306.25
(257.82)
-
(-)
306.25
(257.82)
Sitting Fees -
(-)
-
(-)
-
(-)
0.80
(0.70)
-
(-)
0.80
(0.70)
Dividend on Preference Shares
-
(-)
-
(-)
-
(-)
-
(-)
1.00
(1.00)
1.00
(1.00)
Service charges -
(-)
178.02
(697.02)
-
(-)
-
(-)
-
(-)
178.02
(697.02)
Rent & Other Income -
(-)
61.45
(434.64)
-
(-)
-
(-)
-
(-)
61.45
(434.64)
Utilisation of Duty Credit Scrip
-
(28.34)
-
(-)
-
(-)
-
(-)
-
(-)
-
(28.34)
Sale of Spares/ Materials -
(76.81)
-
(-)
-
(-)
-
(-)
-
(-) (76.81)
Hire Income 6.88
(323.85)
22.09
(811.33)
-
(-)
-
(-)
-
(-)
28.97
(1,135.18)
Project Management Consultancy Service
-
(-)
221.11
(849.15)
-
(-)
-
(-)
-
(-)
221.11
(849.15)
Interest paid on loan -
(-)
-
(-)
5.85
(5.85)
-
(-)
-
(-)
5.85
(5.85)
Guarantees Given for/ (Released)
-
(-)
(306.15)
(8,108.47)
-
(-)
-
(-)
-
(-)
(306.15)
(8,108.47)
Outstanding amount of guarantee given/ (taken)
-
(-)
26,293.00
(36,026.62)
-
(-)
-
(-)
-
-
26,293.00
(36,026.62)
Outstanding amount Dr/(Cr)
5.91
(197.14)
722.41
(2,994.65)
(89.94)
(-90.00)
-
(-)
-
(-)
638.38
(3101.79)
Figures in parenthesis are those of the year ended 31st March, 2011.
35. Details of Leasing Arrangements
Particulars For the year ended 31st March, 2012
(r in Lacs)
For the year ended 31st March, 2011
(r in Lacs)
As Lessor(i) The company has let out one of the premises under operating lease. The lease is cancellable and is renewable by mutual consent on mutually agreeable terms.(ii) The lease income of equipments recognised in the Statement of Profi t and Loss under ‘Other Operating Income’ in Note 22 94.04 1,186.49 As Lessee(i) The company has taken various offi ces, residential and godown premises under operating lease or leave and licence agreements. These are generally cancelable and range between 11 months and 3 years under leave and licence agreement and are renewable by mutual consent on mutually agreeable terms.(ii) Lease payments recognised in the Statement of Profi t and Loss under ‘Rent’ in Note 27. (iii) Lease payments for equipments are recognised in the Statement of Profi t and Loss under ‘Subcontracting’ in Note 24.
2,580.179,868.67
2,098.5712,461.30

81
CONSOLIDATED FINANCIAL STATEMENT OF AFCONS INFRASTRUCTURE LIMITED AND ITS SUBSIDIARIES,ASSOCIATES AND JOINT VENTURES (AFCONS GROUP) Notes forming part of the consolidated fi nancial statements for the year ended on 31st March, 2012
36. Earnings per share (EPS)(EPS) is calculated by dividing the profi t attributable to the equity shareholders by the weighted average number of equity shares outstanding during the year, as under
Particulars For the year ended 31st March, 2012
(r in Lacs)
For the year ended 31st March, 2011
(r in Lacs)
Profi t after tax and minority interestLess: Dividend on 0.01% Convertible Non Cumulative Non Participatory Preference shares (including dividend tax)Profi t for the year attributable to equity shareholders
9,453.19 4.07
9,449.12
11,878.634.07
11,874.56
Weighted average number of shares outstanding during the year Numbers Numbers
For basic EPSFor diluted EPS (refer note below)
71,869,956 336,521,970
71,721,291336,373,305
Earnings per share r in Lacs r in Lacs
BasicDilutedNominal value per share
13.152.81
10.00
16.563.53
10.00
Note:
Weighted average number of shares outstanding during the year- for Diluted EPS: Numbers Numbers
Weighted average number of shares outstanding during the year – for calculating basic EPS (numbers)Add: Potential equity shares that could arise on conversion of 0.01%.Fully and Compulsorily convertible Non-cumulative, Non Participatory Preference shares at R10 each (Refer Note below)Add: Potential equity shares that could arise on conversion of 0.01% Non-cumulative, Non-Participatory Convertible Preference shares at R 68.25.
Note:For the purpose of calculating Diluted Earnings per share above preference shares are treated as convertible into equity shares at par
71,869,956
250,000,000
14,652,014336,521,970
71,721,291
250,000,000
14,652,014336,373,305

82
CONSOLIDATED FINANCIAL STATEMENT OF AFCONS INFRASTRUCTURE LIMITED AND ITS SUBSIDIARIES,ASSOCIATES AND JOINT VENTURES (AFCONS GROUP) Notes forming part of the consolidated fi nancial statements for the year ended on 31st March, 2012
37. Disclosures on Employee share based paymentsEmployee Stock Option Plan. On 22nd December, 2006, the Company has granted 721,150 Stock options to its eligible employees at a price of r 17/- per option in terms of Employees Stock Option Scheme 2006 of the Company as approved by the Share holders at the Extra Ordinary General meeting held on 22nd December, 2006. a) The particulars of the Options distributed under ESOP 2006 are as follows:
Particulars ESOP 2006Eligibility Employees and Directors of the Company and its subsidiaries and its
holding Company.
Vesting period for options granted during the year Not less than One year and not more than Five years from the date of grant.
Exercise Period Three years beginning from date of vesting
Method of Settlement Equity Shares
Exercise Price The Exercise price shall be equal to the fair market value of the shares as determined by the independent valuer.
No. of Options Granted 721,150.00
(b) The particulars of number of options granted , exercised and lapsed and the Price of Stock Options for ESOP 2006 are as follows:
Current Year As at 31st March, 2011
Particulars Quantity Quantity
Authorised to be Granted 1,785,000 1,785,000
Granted and Outstanding at the beginning of the year 1,30,770 303,460
Granted during the year Nil Nil
Forfeited during the year Nil Nil
Exercised during the year 1,30,770 138,954
Lapsed during the year Nil 33,736
Granted and outstanding at the end of the year Nil 130,770
Fair value of the ESOP on the date of Grant r 9.41 r 9.41
c) The Company has followed the intrinsic value-based method of accounting for stock options granted based on Guidance Note on Accounting on Employee Share-based Payments, issued by the Institute of Chartered Accountants of India. The exercise price of the option granted is based on the fair value of the Company’s share as on the date of the Grant. The Fair Value of the Share has been calculated by an independent valuer by applying Rule 1D of the Wealth Tax Rules, 1957. As the exercise price of the option granted is based on the fair value as on the date of the Grant, the intrinsic value of the option is NIL.
Fair value of Options calculated by external valuer using Black Scholes Model is lower than the exercise price and hence the options are considered to be anti-dilutive in nature and the effect of this is ignored in calculating diluted earnings per share in accordance with Accounting Standard 20 viz. Earnings Per Share issued by Charted Accountants of India.
Had the company followed fair value method for accounting the stock option, compensation expenses would have been higher by NIL (Previous year r 12.31 Lacs). Consequently profi t after tax would have been lower by like amount and Basic Earning per share would have been lower by NIL (Previous year r 0.02) per share and Diluted Earnings per share would have been lower by NIL (Previous year r 0.0049) per share.
d) The Method and signifi cant assumptions used to estimate the Fair Value of the Options are as under: The Fair value of Options has been calculated by an independent valuer. The valuation has been done using the Black-Scholes model based on
the assumptions given by the management, which are as under: (i) Expected Life of the Options: These stock options will vest in the following proportion from the date of grant and can be exercised during a period of four years from the
date of vesting. Year 1 from the date of Grant - 20% of the Options Granted; Year 2 from the date of Grant - 25% of the Options Granted; Year 3 from the date of Grant - 25% of the Options Granted; Year 4 from the date of Grant - 30% of the Options Granted (ii) Risk free interest rate: This rate has been assumed at 8%. (iii) Share price: Share price of r 17/- is treated as fair value as on 22nd December, 2006 the date of grant. (iv) Volatility: Volatility is calculated based on historical volatility in the stock of similar comparable companies over the previous 4 years at 0.63.
(v) Expected dividend yield: Nil

83
CONSOLIDATED FINANCIAL STATEMENT OF AFCONS INFRASTRUCTURE LIMITED AND ITS SUBSIDIARIES,ASSOCIATES AND JOINT VENTURES (AFCONS GROUP)
Notes forming part of the consolidated fi nancial statements for the year ended on 31st March, 2012
38. The following are details of the investment in associate made by the Company.R in Lacs
Name of the Associate Original Cost of the Investment
Amount of Capital Reserve
Accumulated Profi t / (Loss)
Carrying Amount of Investment as at
31st March, 2011Afcons (Mideast) Constructions and Investments Private Limited
-
(-)
-
(-)
0.11
(0.11)
0.11
(0.11)
Figures in parenthesis are those of the previous year.
39. Following subsidiary of the Company has provided depreciation on all the fi xed assets on written down value method, which is in variance to the method adopted by the Company. The value of such items is as under :
R in Lacs
Name of the Subsidiary Gross Value of Fixed AssetsAfcons Corrosion Protection Pvt. Ltd (Formerly SSS Electricals (India) Private Ltd). 72.22
(67.58)
Figures in parenthesis are those of the previous year.
40. Recovery of Expenses in Note 24, Note 25, Note 26, and Note 27 are amounts recovered from other entities towards the value of cost apportioned of the Company’s employees and facilities in accordance with the agreements on allocation of expenses with the companies.
41. The Revised Schedule VI has become effective from 1 April, 2011 for the preparation of fi nancial statements. This has signifi cantly impacted the disclosure and presentation made in the fi nancial statements. Previous year’s fi gures have been regrouped / reclassifi ed wherever necessary to correspond with the current year’s classifi cation / disclosure.
For and on Behalf of the Board of Directors
K. Subrahmanian S. Paramasivan Managing Director Deputy Managing Director
P. R. Rajendran Company Secretary
Place: Mumbai Dated: 22nd August, 2012

84
AFCO
NS
INFR
ASTR
UCT
UR
E LI
MIT
EDFi
nanc
ial D
etai
ls o
f Sub
sidi
ary
Com
pani
es fo
r the
yea
r end
ed 3
1st M
arch
201
2
r in
Lac
s
Sr.
No
Nam
e of
the
Sub
sidi
ary
Com
pany
& C
ount
ry o
f In
corp
orat
ion
Fina
ncia
l Yea
r en
ding
R
ate
of
Exc
hang
eS
hare
C
apita
lR
eser
ves
and
Sur
plus
Tota
l
Ass
ets
Tota
l Li
abili
ties
Det
ails
of I
nves
tmen
ts
(e
xcep
t in
case
of i
nves
tmen
t in
subs
idia
ries)
Turn
over
(In
cl.
Oth
er
Inco
me)
Profi t
/(L
oss)
be
fore
Ta
x
Pro
visi
on
for
Cur
rent
&
Def
erre
d Ta
x
Profi t
/(L
oss)
af
ter
Tax
Pro
pose
d D
ivid
end
Shar
esM
utua
l Fu
nds
Tota
l of
Inve
stm
ents
1H
azar
at &
Com
pany
Priv
ate
Ltd.
In
dia
31st M
arch
201
2 -
20.2
6 0
.23
20.
69
20.
69
-
-
-
1.2
0 0
.09
(0.0
3) 0
.06
-
2A
fcon
s C
orro
sion
Pro
tect
ion
Priv
ate
Ltd.
(for
mer
ly S
SS
E
lect
rical
s (In
dia)
Pvt
. Ltd
.), In
dia
31st M
arch
201
2 -
8.00
117
.30
161
.15
161
.15
-
-
-
199
.82
10.
20
(6.8
4) 3
.36
-
3A
fcon
s O
ffsho
re a
nd M
arin
e S
ervi
ces
Pvt
. Ltd
, Ind
ia
31
st M
arch
201
2 -
10.0
0 7
5.30
9
4.62
9
4.62
-
-
-
9
.18
8.4
6 -
8
.46
-
4A
fcon
s C
onst
ruct
ion
Mid
east
LL
C D
ubai
, UA
E31
st D
ecem
ber 2
011
14.8
115
44.4
3 1
,222
.99
15,0
04.5
3 15
,004
.53
-
-
-
4,7
43.7
0 9
75.3
0 -
9
75.3
0 -
5A
fcon
s In
frast
ruct
ure
Inte
rnat
iona
l Lt
d. (A
IIL),
Mau
ritiu
s
31st D
ecem
ber 2
011
54.4
026
15.1
4 8
,556
.69
8,5
77.7
2 8
,577
.72
-
-
-
854
.02
167
.34
(8.4
4) 1
58.9
1 -
6A
fcon
s M
adag
asca
r Ove
rsea
s S
AR
L (1
00 %
sub
sida
iry o
f AIIL
), M
adag
asca
r
31st D
ecem
ber 2
011
0.02
440.
49 7
8.19
8
5.07
8
5.07
-
-
-
1
1.96
(1
6.76
) -
(1
6.76
) -
7A
fcon
s G
ulf I
nter
natio
nal
Pro
ject
s S
ervi
ces
FZE
(100
%
subs
idai
ry o
f AIIL
), Fu
jaira
h
31st D
ecem
ber 2
011
14.8
115
148.
12 1
,165
.91
1,3
57.5
2 1
,357
.52
-
-
-
1,1
85.9
6 1,
162.
69
-
1,16
2.69
-
8A
fcon
s In
frast
ruct
ures
Kuw
ait f
or
Bui
ldin
g, R
oads
and
Mar
ine
Con
tract
ing
WLL
, K
uwai
t**
--
- -
- -
- -
- -
- -
- -
** N
ew C
ompa
ny fo
rmed
on
12th S
epte
mbe
r, 20
11 a
nd th
e ac
coun
ts h
ave
not b
een
prep
ared
.N
ote
: Ind
ian
rupe
e eq
uiva
lent
of t
he fi
gure
s gi
ven
in fo
reig
n cu
rren
cies
in th
e ac
coun
ts o
f the
sub
sidi
ary
com
pani
es, a
re b
ased
on
the
exch
ange
rate
s as
on
31st D
ecem
ber,
2011
.

LNG Tanks, Kochi
Grade Separator at Ghazipur, Delhi
Longest (4.6 Km) railway bridge at Kochi

AFCONS INFRASTRUCTURE LIMITEDA Shapoorji Pallonji Group Company
“Afcons House”16, Shah Industrial Estate, Veera Desai Road, Azad Nagar P. O., Andheri (West), Mumbai - 400 053
RVNL Vallarpadam Rail Bridge, Kochi
Grade Separator at Mukharba Chowk, Delhi
New Phosphate Rock Terminal In Aqaba, Jordan
Iron Ore Mining Project, LiberiaElevated viaduct DMRC, Delhi
A1 Berth for Reliance LNG Tanks, Kochi
Rohtang Pass, Manali