Embed Size (px)
Citation preview

HSBC Bank Malta p.l.c. Annual Report and Accounts 2011
HSBC Bank Malta p.l.c. is a member of the HSBC Group, whose ultimate parent company is HSBC Holdings plc. Headquartered in London, HSBC Holdings plc is one of the largest banking and financial services organisations in the world. The HSBC Group’s international network comprises around 7,500 offices in over 80 countries and territories in Europe, the Asia-Pacific region, the Americas, the Middle East and Africa.
The HSBC Group
HSBC Bank Malta p.l.c.Registered in Malta: number C3177Registered Office and Head Office: 116 Archbishop StreetValletta VLT 1444Malta Telephone: 356 2597 0000Customer Service: 356 2380 2380Facsimile: 356 2380 4923www.hsbc.com.mt
HSBC Holdings plcRegistered Office and Group Management Office:8 Canada SquareLondon E14 5HQUnited KingdomTelephone: 44 020 7991 8888Facsimile: 44 020 7992 4880www.hsbc.com
1
H S B C B A N K M A L T A P . L . C .
Contents
1
2 Chairman’sStatement
5 ChiefExecutiveOfficer’sReview
10 BoardofDirectors
12 FinancialReview
14 ReportoftheDirectors
18 StatementofCompliancewiththePrinciplesofGoodCorporateGovernance
26 RemunerationReport
28 Directors’ResponsibilitiesStatement
29 IncomeStatements
30 StatementsofComprehensiveIncome
31 StatementsofFinancialPosition
32 StatementsofChangesinEquity
34 StatementsofCashFlows
35 NotesontheFinancialStatements
91 IndependentAuditors’ReporttotheMembersofHSBCBankMaltap.l.c.
93 GroupIncomeStatementsandStatementsofComprehensiveIncome:Five-YearComparison
94 GroupStatementsofFinancialPosition:Five-YearComparison
95 GroupStatementsofCashFlows:Five-YearComparison
96 GroupAccountingRatios:Five-YearComparison
97 GroupFinancialHighlightsinUSdollars
98 BranchesandOffices
2
H S B C B A N K M A L T A P . L . C .
Chairman’s Statement
2
Iampleasedtoadvisethat2011wasagoodyearforHSBC BankMalta p.l.c. during which it delivered asolidperformance inspiteofverychallengingmarketconditions.
Results
Profit before taxation was §88m, representing anincrease of 6% over prior year. On a like for likebasis,excludingone-offitemsin2010and2011,profitbefore taxwas up 1%.Against the current economicbackdrop,theworstinlivingmemory,thisrepresentsacredibleperformanceandwasunderpinnedbypositivecontributionsbyallbusinesslines.
Bybeingprudent,yetproactive,HSBCBankMaltahas managed to navigate successfully through thesetroubledwaters.Particularnoteshouldbetakenoftheexcellentworkduring2011toreduceriskonthebank’sinvestmentportfolio.Thebankhascontinuedtogrowits loan book and retains its position as the leadinginternationalbankinMalta.
Profitattributabletoshareholders increasedby7%to §58m. On the basis of these results the Board isrecommending a final gross ordinary dividend of 7.2centpershare.Togetherwiththeinterimgrossdividendof8.2centpershare(5.3centnetoftax)paidinAugust2011,thetotaldividendfortheyearis15.4cent.
During2011,thenumberofthebank’sshareholdersstoodataround10,400,manyofwhichhaveremainedloyalovertheyears.Astestimonytoourcommitmentto communicate better and more frequently with ourshareholders we launched a new bilingual onlinepublication,L-Azzjonist.Thiseco-friendlypublicationis available in the Investor Relations section of theHSBCBankMaltawebsiteandhasalreadyprovedtobepopularwithinvestorsofthebank.
HSBCBankMaltap.l.c.isasubsidiaryofLondon-basedHSBCHoldingsplc,oneoftheworld’sleadingfinancialservicesorganisations,andremainsthelargestcompany listed on theMalta Stock Exchange with amarketcapitalisationofaround§750m.
Strategy
2011 was the first year of implementing the HSBCgroup approved four-year Medium Term Outlook(MTO). This is the bank’s strategic plan for theperiod 2011-2014 which establishes a clear directionof thebank’sfutureanddevelopmentopportunities inMaltaand thestrategic imperativesneeded toachievesustainablegrowth.
The overall strategy is based on building thebusiness organically and consolidating the bank’smarket position by sustaining its strong domesticfranchise and growing internationally by leveragingitsglobalreachthroughtheHSBCGroup’sworldwidenetwork and internationally recognised brand. Byplaying to its strengths and focusing on its naturalcompetitive advantages as a global organisation, thebankwill seek to capitalise on the increasingmarketopportunitiesandplayaleadingroleinMalta’sgrowthasaninternationalfinancialservicescentre.
During the year under review, the bank hascontinuedtotransformtheorganisationinlinewiththeMTO by focusing on its segmentation strategy in itsprincipal customer groups, generating efficiencies bystreamliningprocessesandoperations,makinggreateruse of Regional Centres of Excellence, investing intechnology and automated channels and deliveringan unrivalled customer experience. Furthermore, thebank has been very active in facilitating cross-bordercommercial activity through its leading internationalbusinessstrategyandplayingamoreactiveroleintheareaofglobalbankingandmarkets.
3
Reflecting customer behavioural trends of lowerteller activity and theneed for continuedproductivityand cost effectiveness, the bank has announced an§11mrestructuringcharge thatwillseea reduction inits staff complement and the closure of six branches.This restructuring is necessary to achieve long-termgoals and will not involve any staff compulsoryredundancies.Displacedemployeeswillberedeployedelsewhere within the organisation or may chooseto apply for a voluntary redundancy/early voluntaryretirementschemethathasbeenmadeavailable.
Against this backdrop, it is worth noting that thebank remains committed to its substantial investmentprogrammeinMalta.During2011thebankimplementedanewstate-of-the-artcorebankingsystemwithacapitalinvestmentof §10m. In addition to this,HSBCMaltacontinues the roll out of its §11m project to upgradeitsbranchnetworkinlinewithGroupglobalstandardsand introduce next-generation ATMs with increasedfunctionalityforgreatercustomerconvenience.
In December the bank sold its card acquiringbusiness to Global Payments Inc. for a considerationof §11m. This is in line with HSBC Group strategyof exiting this part of the business around theworld.GlobalPayments is a recognisedworldwide leader inpayments processing and together with HSBC BankMaltawillcontinuetoprovidecustomerswiththecardacceptanceflexibility,convenience,serviceandsupporttheyneed.ThenewacquiringbusinesswillcontinuetotradeundertheHSBCbrandforthetimebeingandwillbecalledHSBCMerchantServicesLtd.
Corporate Sustainability
ThekeyforHSBCBankMaltaand theHSBCGroupremains long term corporate sustainability. As suchthe bank recognises the importance of continuing itsprogrammeofinvestmentsintheMaltesecommunity.Theprincipalfocusareasare:
•Environment•Education,inparticulardisadvantagedchildren,and•Heritage
The HSBC Malta Foundation is the bank’s mainchannel for corporate sustainability activity. In 2011the Foundation supported a wide range of activitiesaroundMalta.Someofthekeyeventsincluded:
Environment
The afforestation project at Ta˙t Chambray in GozoThe projectwill cost §200,000 and itwill be equallyfinancedbytheFoundationandtheMalteseGovernment.HSBChasbeenasponsoroftheafforestationprojectinMaltafromthestartandhassofarplantedover25,000treesaspartofthisnationalprogramme.
Eco-SchoolsTheHSBCMaltaFoundationhasbeensupportingtheEco-Schools Programme for the past 6 years. Over40,000studentshaveparticipatedinthisprogrammeandsofaratleast20schoolshavesecuredtheInternationalGreenFlagAward,aprestigiousaccreditationfortheirenvironmentalpracticesatschool.
Education
Young EnterpriseHSBChasbeenthesponsoroftheJuniorAchievementYoung Enterprise Malta for the past 11 years. Theprogrammeoffersahigh-qualityeducationprogrammethat teaches students entrepreneurship and businessskillsinapracticalway.
Caritas MaltaTheFoundationisalong-timesupporterofCaritasMaltain running its educational programme in primary andsecondaryschoolswiththeaimofinstillingsoundvaluesandpromotingpreventionagainstsubstanceabuse.
Heritage
Support for Casa Rocca Piccola’s celebration of laceTheFoundationisproudtobeassociatedwithauniqueMalteselacecompetitionheldannuallyatCasaRoccaPiccola inValletta. In2011thecompetitionhonoured58traditionallacemakers,includingfourchildren.
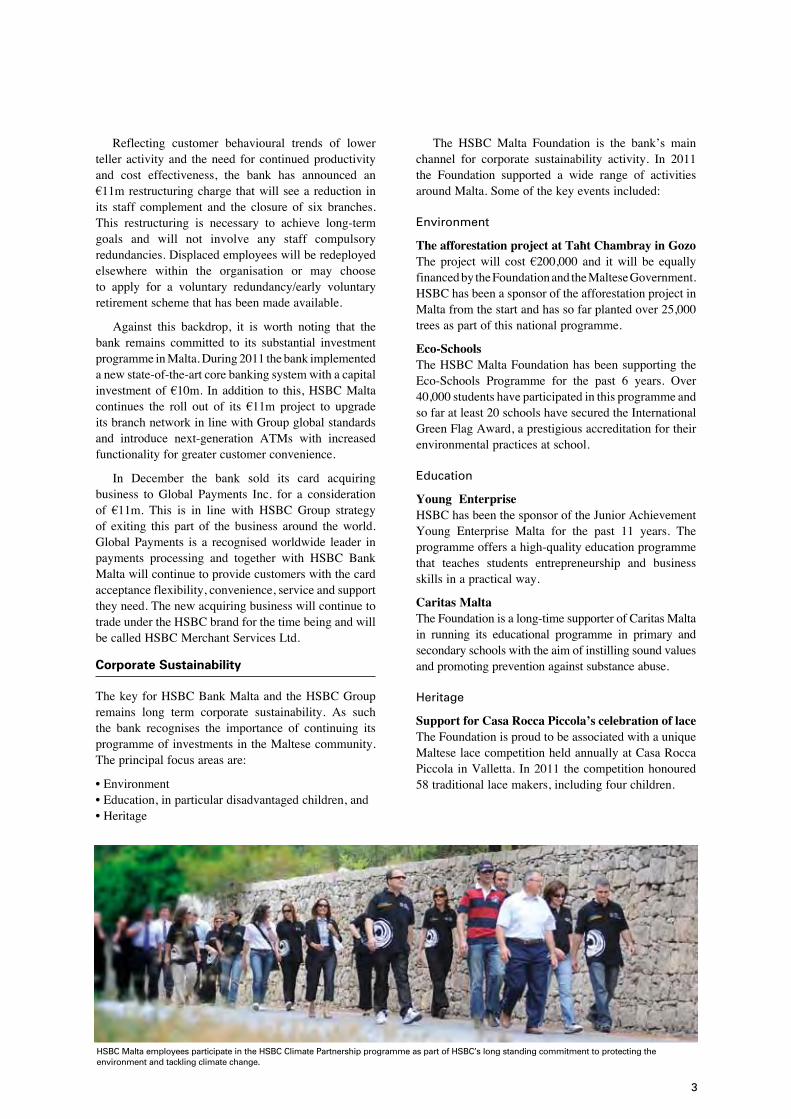
HSBC Malta employees participate in the HSBC Climate Partnership programme as part of HSBC’s long standing commitment to protecting the environment and tackling climate change.
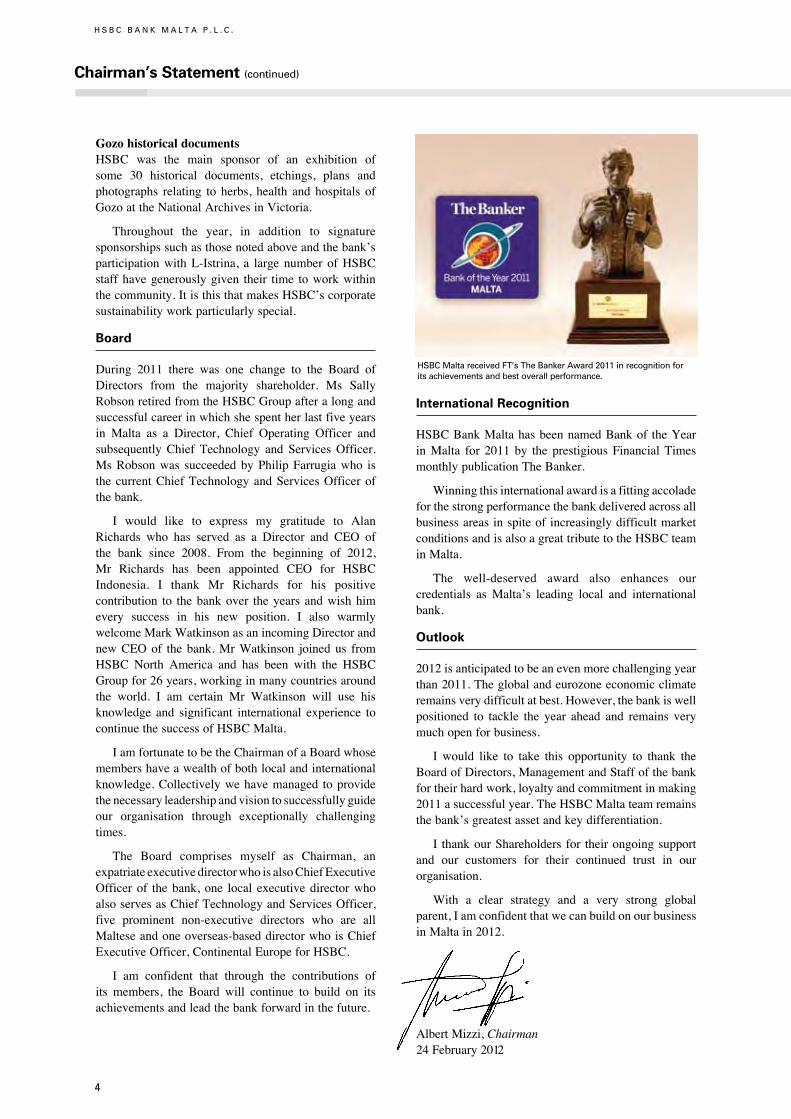
HSBC Malta received FT’s The Banker Award 2011 in recognition for its achievements and best overall performance.
Gozo historical documents HSBC was the main sponsor of an exhibition ofsome 30 historical documents, etchings, plans andphotographs relating to herbs, health and hospitals ofGozoattheNationalArchivesinVictoria.
Throughout the year, in addition to signaturesponsorshipssuchasthosenotedaboveandthebank’sparticipationwithL-Istrina, a large number ofHSBCstaffhavegenerouslygiven their time toworkwithinthecommunity.ItisthisthatmakesHSBC’scorporatesustainabilityworkparticularlyspecial.
Board
During 2011 there was one change to the Board ofDirectors from the majority shareholder. Ms SallyRobsonretiredfromtheHSBCGroupafteralongandsuccessfulcareerinwhichshespentherlastfiveyearsin Malta as a Director, Chief Operating Officer andsubsequentlyChief Technology and ServicesOfficer.MsRobsonwas succeededbyPhilipFarrugiawho isthecurrentChiefTechnologyandServicesOfficerofthebank.
I would like to express my gratitude to AlanRichards who has served as a Director and CEO ofthe bank since 2008. From the beginning of 2012,Mr Richards has been appointed CEO for HSBCIndonesia. I thank Mr Richards for his positivecontribution to thebankover theyears andwishhimevery success in his new position. I also warmlywelcomeMarkWatkinsonasanincomingDirectorandnewCEOof thebank.MrWatkinson joinedus fromHSBC North America and has been with the HSBCGroupfor26years,workinginmanycountriesaroundthe world. I am certain Mr Watkinson will use hisknowledge and significant international experience tocontinuethesuccessofHSBCMalta.
IamfortunatetobetheChairmanofaBoardwhosemembershaveawealthofbothlocalandinternationalknowledge.Collectivelywehavemanaged toprovidethenecessaryleadershipandvisiontosuccessfullyguideour organisation through exceptionally challengingtimes.
The Board comprises myself as Chairman, anexpatriateexecutivedirectorwhoisalsoChiefExecutiveOfficer of thebank, one local executivedirectorwhoalsoservesasChiefTechnologyandServicesOfficer,five prominent non-executive directors who are allMalteseandoneoverseas-baseddirectorwhoisChiefExecutiveOfficer,ContinentalEuropeforHSBC.
I am confident that through the contributions ofits members, the Board will continue to build on itsachievementsandleadthebankforwardinthefuture.
International Recognition
HSBCBankMaltahasbeennamedBankof theYearinMalta for 2011 by the prestigiousFinancialTimesmonthlypublicationTheBanker.
WinningthisinternationalawardisafittingaccoladeforthestrongperformancethebankdeliveredacrossallbusinessareasinspiteofincreasinglydifficultmarketconditionsandisalsoagreattributetotheHSBCteaminMalta.
The well-deserved award also enhances ourcredentials asMalta’s leading local and internationalbank.
Outlook
2012isanticipatedtobeanevenmorechallengingyearthan2011.Theglobalandeurozoneeconomicclimateremainsverydifficultatbest.However,thebankiswellpositioned to tackle the year ahead and remains verymuchopenforbusiness.
I would like to take this opportunity to thank theBoardofDirectors,ManagementandStaffofthebankfortheirhardwork,loyaltyandcommitmentinmaking2011asuccessfulyear.TheHSBCMaltateamremainsthebank’sgreatestassetandkeydifferentiation.
I thankourShareholders for theirongoingsupportand our customers for their continued trust in ourorganisation.
With a clear strategy and a very strong globalparent,IamconfidentthatwecanbuildonourbusinessinMaltain2012.
AlbertMizzi,Chairman 24February2012
Chairman’s Statement (continued)
4
H S B C B A N K M A L T A P . L . C .
5
H S B C B A N K M A L T A P . L . C .
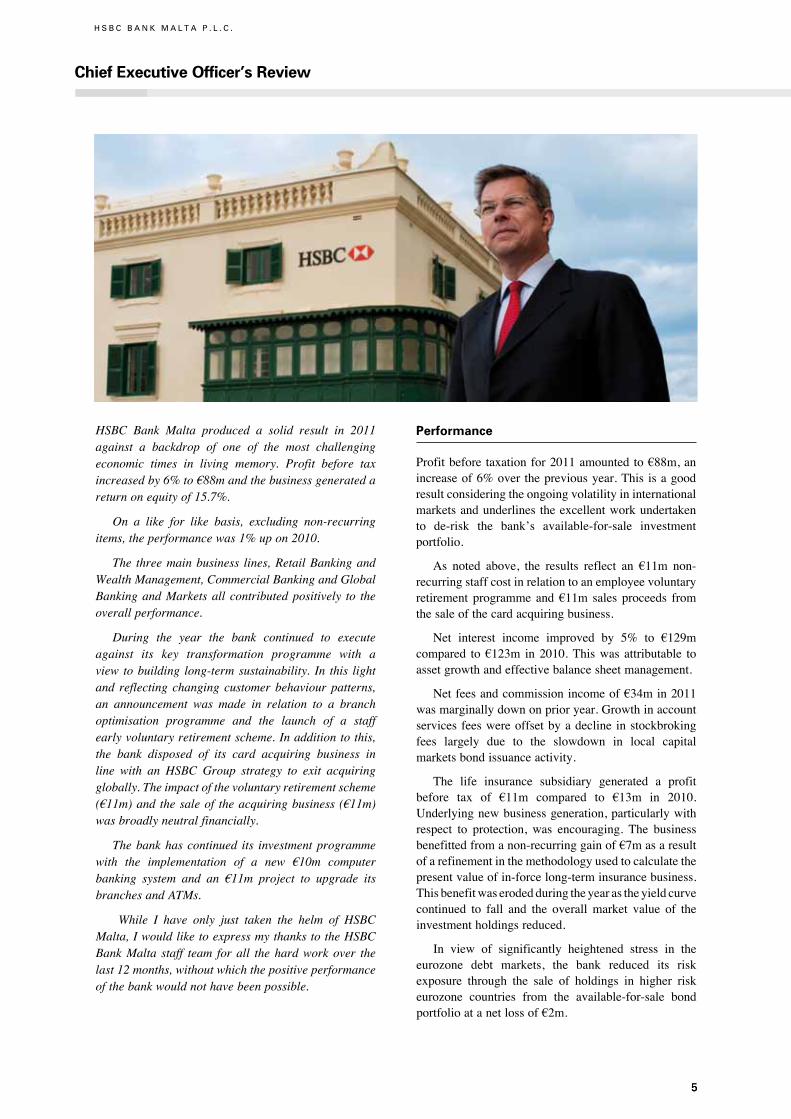
Chief Executive Officer’s Review
HSBC Bank Malta produced a solid result in 2011against a backdrop of one of the most challengingeconomic times in living memory. Profit before taxincreasedby6%to§88mandthebusinessgeneratedareturnonequityof15.7%.
On a like for like basis, excluding non-recurringitems,theperformancewas1%upon2010.
The threemainbusiness lines,RetailBankingandWealthManagement,CommercialBankingandGlobalBankingandMarketsall contributedpositively to theoverallperformance.
During the year the bank continued to executeagainst its key transformation programme with aview tobuilding long-termsustainability. In this lightand reflecting changing customerbehaviourpatterns,an announcement was made in relation to a branchoptimisation programme and the launch of a staffearlyvoluntaryretirementscheme.Inadditiontothis,the bank disposed of its card acquiring business inline with an HSBC Group strategy to exit acquiringglobally.Theimpactofthevoluntaryretirementscheme(§11m)and thesaleof theacquiringbusiness(§11m)wasbroadlyneutralfinancially.
Thebankhascontinued its investmentprogrammewith the implementation of a new §10m computerbanking system and an §11m project to upgrade itsbranchesandATMs.
While I have only just taken the helm of HSBCMalta,IwouldliketoexpressmythankstotheHSBCBankMalta staff team forall thehardworkover thelast12months,withoutwhichthepositiveperformanceofthebankwouldnothavebeenpossible.
Performance
Profitbefore taxationfor2011amountedto§88m,anincreaseof6%over thepreviousyear.This isagoodresultconsideringtheongoingvolatilityininternationalmarketsandunderlines theexcellentworkundertakento de-risk the bank’s available-for-sale investmentportfolio.
As noted above, the results reflect an §11m non-recurringstaffcostinrelationtoanemployeevoluntaryretirement programme and §11m sales proceeds fromthesaleofthecardacquiringbusiness.
Net interest income improved by 5% to §129mcompared to§123m in2010.Thiswas attributable toassetgrowthandeffectivebalancesheetmanagement.
Netfeesandcommissionincomeof§34min2011wasmarginallydownonprioryear.Growthinaccountservicesfeeswereoffsetbyadecline instockbrokingfees largely due to the slowdown in local capitalmarketsbondissuanceactivity.
The life insurance subsidiary generated a profitbefore tax of §11m compared to §13m in 2010.Underlyingnewbusinessgeneration,particularlywithrespect to protection, was encouraging. The businessbenefittedfromanon-recurringgainof§7masaresultofarefinementinthemethodologyusedtocalculatethepresentvalueofin-forcelong-terminsurancebusiness.Thisbenefitwaserodedduringtheyearastheyieldcurvecontinued to fall and the overallmarket value of theinvestmentholdingsreduced.
In view of significantly heightened stress in theeurozone debt markets, the bank reduced its riskexposure through the sale of holdings in higher riskeurozone countries from the available-for-sale bondportfolioatanetlossof§2m.
5
Netotheroperatingincomeincreasedsignificantly,from§5min2010to§24min2011.Therisewasdrivenbytheabovenotedsaleofthecardacquiringbusinessand the non-recurring gain in the Life insurancesubsidiaryrelatingtoamethodologychange.
Operating expenses of §98m were §11m or 12%higher compared to the previous yearwith a cost-to-income ratio of 50.4% compared to 49.7% in 2010.Costsincreasedprincipallyduetothepreviouslynotedemployeevoluntaryretirementprovisionof§11mandduetohighercostsrelatingtoutilities,regulatoryfeesandcompliance.
Ataconsolidatedlevel,netimpairmentsrosefrom§5m to §8m in 2011. This was principally due to a§4mprovisiontakenonGreekGovernmentbondsheldby the Life insurance subsidiary. The Life insurancesubsidiaryexposuretoGreekdebtiscurrentlyminimalandstandsat§2m.
Other than the above exposure and investments inMalteseGovernmentdebt, thegrouphasnoexposuretosouthernEuropeangovernmentdebt.
Thegroup’savailable-for-saleinvestmentsportfolioremainswelldiversifiedandconservative.
At a bank level, while there was a marginaldeterioration in non-performing loans from 4% to5%, in general asset quality remains good and loanimpairments declined to §4m (11 basis points of theoverallloanbook)against§5min2010.
Net loansandadvances to customers increasedby§54m to §3,344m. Mortgage market share remainedstable. Gross new lending to customers amounted to§656mwhichreflects thebank’scontinuedsupport tothelocaleconomy.
Liabilitiesroseby§142mduringtheyearandstoodat§5,458mat theyearend.The increase in liabilitiesreflectedariseinplacementswiththebankandasmallfallincustomerdeposits.
Thebank’sliquiditypositionremainsstrongwithanadvancestodepositsratioof76%,comparedwith74%at31December2010.
The bank strengthened its capital ratio by 140basis points during the year and this now stands at11.6%. This is well in excess of the 8% minimumregulatory requirement. The bank intends tomaintainaconservativeapproachtocapitalandwillcontinuetobuildcapitalwhereappropriate.
Basedon theresults theBoard is recommendingafinalgrossordinarydividendof7.2centpershare.
Retail Banking and Wealth Management
During2011,RetailBankingandWealthManagementcontinued to provide customerswith the high qualityservice and brand experience for which HSBC isrenowned.
The focus in Premier was to deepen existingrelationships with our valued customer base. During2011thenewLifeStageToolwaslaunchedtoprovidecustomers with a user friendly way tomap their lifestages and wealth management needs against theproductsandservicesofferedbyHSBC.Furthermore,anexcitingrangeofnewdiscountsandprivilegesweremadeavailabletoPremiercustomersandbenefitswereextendedtofamilymembers.
Thebank’sFinancialPlanningAdvisorsandPrivateClient Managers have access to an unrivalled rangeof both HSBC and third party investment solutionsincluding life protection and retirement planning. In2011,inviewofthevolatileglobalmarkets,thefocuswasondevelopingstructuredinvestmentproductsthatprovide capital protection to give customers peace ofmind.
HSBC’s Trust business continues to provide ahighly bespoke service to our customer base. Groupreferralsfromotheroverseasofficesremainspositive.
Shareshop provides access to international stockexchanges and facilitates the buying and selling ofbondsandequitiesforourretailcustomers.
The bank remains very active in the domesticmortgage sector and during 2011 saw a growth inbusiness both from first time buyers and those whowerelookingforasecondproperty.
HSBCGlobalAssetManagementMaltahadanothersolid year despite difficult market conditions. Thebusiness registered stable performance in the levelof assets under management driven by institutionalbusinessandretailfunds.
Underlying insurance sales, particularly relatingto protection, were strong. The overall result of thebusiness,however,washamperedbymarketvolatilityonitsinvestmentportfolioalthoughthiswasoffsetbybeneficialchangesinthemethodologyforrecognisingtheemergenceofinsurancemanufacturingprofits.
HSBC Insurance Management Services (Europe)Limitedwasestablishedtocarryoutregulatedinsurancemanagement activities for otherHSBCentities acrossthe wider Group. In addition to support our ownlocal insurance manufacturing business, insuranceadministration services are already being provided toHSBCLife (Europe)LtdoperatingoutofDublinandZurich.
Chief Executive Officer’s Review (continued)
6
H S B C B A N K M A L T A P . L . C .
an important tradingroutebetweenEuropeandNorthAfrica,gaininghugelyfromitslocationwithinEuropeandalsoitsproximitytothekeymarketsoftheMiddleEast.
TwosuccessfulHSBCTradeSummitswereheldinShanghaiandHamburgandwereattendedbyanumberof key customers from Malta with an internationalfocus. Feedback from the events was very positiveandenabledthecustomersconcernedtonetworkwithpotentialclientsandsuppliersfromaroundtheworld.
For thesecondconsecutiveyear,HSBCsponsoredthe European Business Awards. Malta InternationalAirportplc andCamilleriHoldingsLtdwonaRuband’Honneur prize and represented the very best ofMaltesebusinessesattheevent.
For our small and medium local businesses welaunched the Knowledge Centre information facility,a free resource, offering our business customerspracticalinformationtohelprunorstartanewventure.Our Business Banking Direct proposition was alsointroduced to highlight the bank’s online and callcentrecapabilitiesforsmallerbusinesses.
In 2011, a group of bank “business advisors”coached a Young Enterprise team. The youngentrepreneursinvolvedwentontowintheMaltaFinalsandsubsequentlyparticipate in theEuropeanfinals inOslo,Norway.
Global Banking and Markets
Despiteincreasingfinancialstressacrosstheeurozone,GlobalBankingandMarketshascontinued todeliverabove plan results. This has been achieved throughprudent management of the bank’s investments andmarkets risks, whilst also re-positioning all businessunitstoplayaleadingroleindrivingMalta’sgrowthasahubforinternationalfinancialservices.
Fromaninsuranceregulatoryperspective,workonSolvencyIIimplementationcontinueswithsignificantprogressmadeonallaspectsofadoptingthefutureriskbasedmethodologies.
Commercial Banking
TheCommercialBankingbusinessdelivered a strongperformanceduring2011inspiteoftheglobaleconomicheadwinds and political turmoil inNorthAfrica. Thelendingbookremainshealthyandwellsecuredandthe2012pipelineispositive.
Customer service remains a key focus of thecommercialbankingstrategy.Duringtheyearwehaveremained close to our customers to better understandtheir requirements and to provide them with supportwhere necessary in an increasingly challengingeconomicenvironment.
During 2011 we continued to concentrate onthe Leading International Business strategy. This isprovingtobeaverysuccessfulpartofourcommercialbanking business.We have participated in a numberof business delegations and overseas networkingevents leveraging HSBC’s international reach. Apartner support agreementwas signedwith theMaltaChamber of Commerce, Enterprise and Industry tohelpthoseenterpriseswantingtoexpandtheirbusinessinternationally.AnagreementwasalsosignedwiththeMaltese-Chinese Chamber of Commerce to supportentrepreneurs from both countries. This follows thelaunch of theRenminbi trade settlement account thatestablishedHSBCasthefirstbankinMaltatoenableMaltese companies to directly trade in the Chinesecurrency, thus facilitating trade and investment withChinesecounterparts.
The HSBC Trade Connections quarterly forecastanticipates that trade inMalta will continue to growover thenext12months.Malta isexpected toremain
7
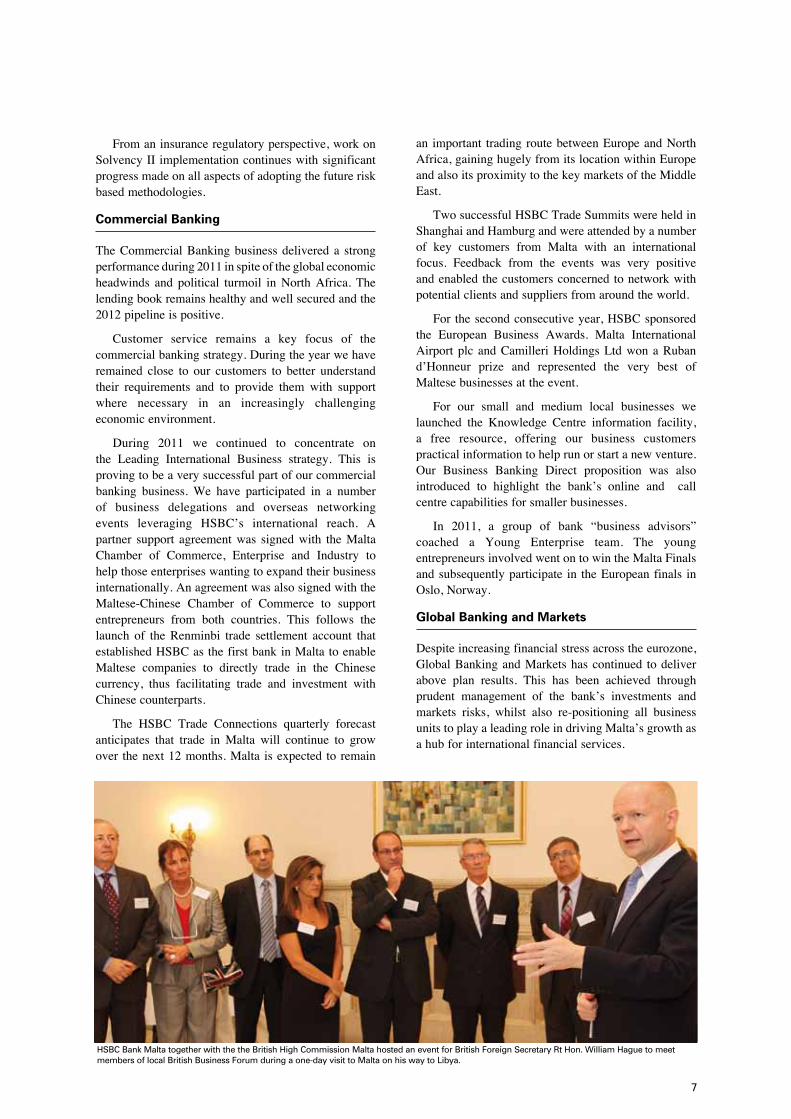
HSBC Bank Malta together with the the British High Commission Malta hosted an event for British Foreign Secretary Rt Hon. William Hague to meet members of local British Business Forum during a one-day visit to Malta on his way to Libya.

8
H S B C B A N K M A L T A P . L . C .
Overall, theGlobalBanking andMarkets businesshas become an important contributor to the bank’sbottomlineandplaysapivotalroleintheimplementationofourstrategy.
Technology and Services
During2011webroughttofruitionvarioustechnologicaland services projects with the aim of enhancingcustomerexperience,improvingoperationalefficiency,andreducingoperationalcosts.
Thebiggestsingleinitiativein2011wastheupgradeofourcorebankingcomputersystemwithaninvestmentofover§10m.ThisnewHSBCGroupsystemenabledus to standardise our banking systems, our processesand our products to meet the ever-changing needs ofour customers, and to make it easier for them to dobusiness with the bank from anywhere in the world.The implementation of this project was carried outseamlesslyandefficientlywithoutaffectingthenormaldailyservicestoourcustomers.
Investmentswerealsomadeinworkflowprocessesand imaging systems, whilst further standardisedprocessesweremigratedtoGroupandRegionalCentresof Excellence, thereby enabling the bank to improveinternalefficiencyandfreemoreresourcesforutilisationinmoreprofitableareas.
We have continued our branch refurbishingprogrammeandcompletedanotherfivebranchestoaddtothefourrenovatedin2010.ThesebranchesarenowinlinewiththehighestHSBCGroupstandardsaroundtheworldandreflectthechangingbehaviourpatternofourcustomerswhoincreasinglylookformortgageandwealth management advice in branches but prefer totransacteitheronlineorthroughoneofourcallcentres.
InkeepingwithHSBCGroup’spolicyofpro-activerisk management, the Global Markets team sold thebank’sinvestmentsinperipheralEuropeandebtduringthe year. The current book of high quality assets hasbenefittedfromtheanticipated‘flight toquality’.Thishas resulted in a positive adjustment to reserves. Theadoptionofaprudentinvestmentapproachandtheuseof sophisticated risk management techniques boostednetinterestincomein2011.
TheGlobalMarkets teamhas seena40% increasein foreignexchangeactivity as it leverages theHSBCGroup’sglobalnetworktoprovidebestinclassservicestoourinternationalcorporateandinstitutionalcustomers.Wehavealsoseenasignificantincreaseinthesalesofcapitalprotected investmentproducts, tailored tomeetour retail customers’ needs, in partnershipwithRetailBankingandWealthManagement.HSBCStockbrokerscontinues to be the largest broker on theMalta StockExchange.
InordertosupportthegrowthofthefinancialservicessectorinMaltaandtoprovideanattractivepropositiontofinancialinstitutionssettinguporrelocatingtoMalta,we established a dedicated Financial Institutions teamduring the year. The team is comprised of both localandinternationalstaffandoffersmarketleadingadviceand services. Coupled with this initiative the fundadministration and custody business was restructuredtodrivehigher customer service levels and toprepareforanincreasinglychallenginginternationalregulatoryenvironment.
HSBC Securities Services (HSS) made goodprogressduring theyearandgeneratedaprofitbeforetaxof§1.5m.HSSremainsakeyarea for investment.Wehavelaunchedagovernanceprogrammetooverseea number of significant initiatives to enhance theinternationalpropositionofthebusiness.
Chief Executive Officer’s Review (continued)
HSBC Malta is investing §11 million to upgrade its branches and ATMs. The new branches are designed to give more privacy and space to customers visiting HSBC to plan their financial future and manage their wealth.
9
Outlook
TheMaltese economy has performed reasonablywellover the last twelvemonths and showed considerableresiliencesincetheglobaltroublesbeganinlate2008.The economy has registered above-average EU andeurozone GDP growth in both 2010 and 2011. Thebankingsystemremainsrobustandtheeconomyhasnotsufferedfromahousingorsovereigndebtcrisis.
GDPgrowthislikelytoremainpositivein2012butlowerthan2011.Thecontinuedtravailsoftheeurozoneand economic uncertainty will weigh on confidence.Bank and domestic corporate profitabilitywill remainunder pressure and companies will focus on drivingoperational efficiencies and sustainable costs savingswhile real growth is hard to achieve. Nevertheless,we remain cautiously optimistic as the key banksin the market remain well capitalised and open forbusiness,touristnumberscontinuetogrow,thehousingmarket while soft has not declined significantly, thelocal regulatory atmosphere is pro-business and realgrowth and opportunity is seen asMalta develops itsinternationalfinancialservicesplatform.
HSBCBankMalta remainswellpositioned for thechallengingyearahead.Thebalancesheetisstrong,thestrategy is clear and key transformation programmesarewellunderway.Thefocuswillremainoninvestinginour local franchise and leveragingour internationalcompetitive advantage through our parent, HSBCHoldings, one of the world’s largest and strongestfinancialorganisations.
MarkWatkinson,ChiefExecutiveOfficer24February2012
A Commercial Banking Contact Centre wasestablished during the year to provide a high qualityand efficient telephone service to our commercialcustomers.
Another important initiative was the upgrade andincreaseofourATMnetworkacrosstheisland.Atotalof 14next-generationATMswere installed invariouslocalities, offering instant value for cash deposits tocustomers, with cheque deposit functionality to beprovidedlaterin2012.
Customerbehaviourischanging.During2011telleractivityinourbranchnetworkdroppedby14%whilsttheuseofInternetBankingincreasedby13%andcardusageatpointofsaleby11%.Itis,therefore,importantthatwecontinuetoinvestinprovidingmoreandbetterself-service facilities to satisfy the changing needs ofourcustomers.
Asaresultofbetterpropertymanagement,thebankdisposed of vacant freehold and leasehold propertiesincluding a significant part of its ex-Head Office inRepublicStreet,Valletta.
People
Our people remain our greatest strength and it needsto be recognised that only through our talented andprofessionalworkforcecouldourgoodresults in2011havebeenachieved.
During2011wesignednewCollectiveAgreementsthatprovideforimprovedworkingconditions,benefitsandopportunitiesforallstaff.
Wecontinuetoinvestinourpeoplethroughtraining,professionaldevelopmentandtalentmanagement.
A number of staff benefitted from overseasprogrammesrunbytheHSBCGroupandwecontinueto look for and promote international attachment/secondmentopportunitiesforkeytalent.
AsInotedearlier,duringtheyearthebankannouncedanearlyvoluntaryretirementschemeforitsemployeesas part of the continued transformation programmeof the business. Such programmes remain entirelyvoluntarybutattheoptionofthebank.
In 2012 we will continue to introducemore staff-related initiatives and invest to maintain the higheststandardsofprofessionalism.
10
H S B C B A N K M A L T A P . L . C .
Board of Directors
10
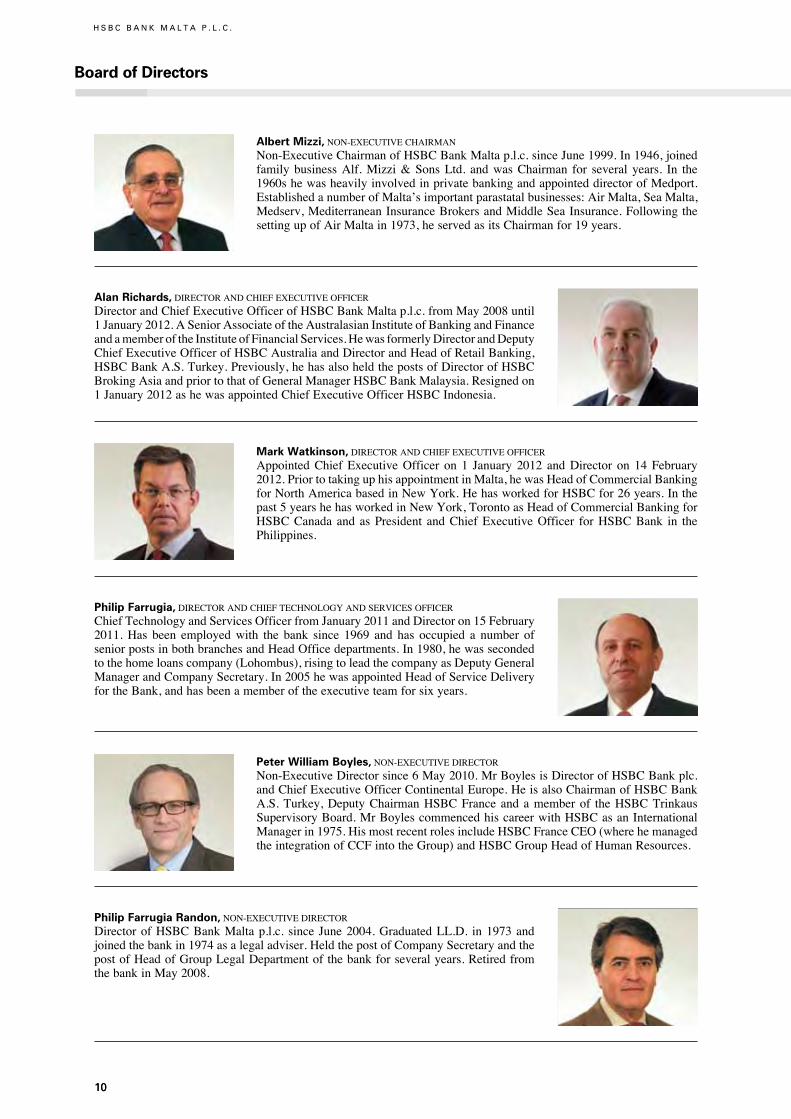
Albert Mizzi,NON-EXECUTIVECHAIRMAN
Non-ExecutiveChairmanofHSBCBankMaltap.l.c.sinceJune1999.In1946,joinedfamily businessAlf.Mizzi&SonsLtd. andwasChairman for several years. In the1960shewasheavilyinvolvedinprivatebankingandappointeddirectorofMedport.EstablishedanumberofMalta’simportantparastatalbusinesses:AirMalta,SeaMalta,Medserv,MediterraneanInsuranceBrokersandMiddleSeaInsurance.FollowingthesettingupofAirMaltain1973,heservedasitsChairmanfor19years.
Mark Watkinson,DIRECTORANDCHIEFEXECUTIVEOFFICERAppointedChiefExecutiveOfficer on 1 January 2012 andDirector on 14February2012.PriortotakinguphisappointmentinMalta,hewasHeadofCommercialBankingforNorthAmericabasedinNewYork.HehasworkedforHSBCfor26years.Inthepast5yearshehasworkedinNewYork,TorontoasHeadofCommercialBankingforHSBCCanada and asPresident andChiefExecutiveOfficer forHSBCBank in thePhilippines.
Peter William Boyles,NON-EXECUTIVEDIRECTORNon-ExecutiveDirectorsince6May2010.MrBoylesisDirectorofHSBCBankplc.andChiefExecutiveOfficerContinentalEurope.HeisalsoChairmanofHSBCBankA.S.Turkey,DeputyChairmanHSBCFranceandamemberof theHSBCTrinkausSupervisoryBoard.MrBoylescommencedhiscareerwithHSBCasanInternationalManagerin1975.HismostrecentrolesincludeHSBCFranceCEO(wherehemanagedtheintegrationofCCFintotheGroup)andHSBCGroupHeadofHumanResources.
Alan Richards,DIRECTORANDCHIEFEXECUTIVEOFFICERDirectorandChiefExecutiveOfficerofHSBCBankMaltap.l.c.fromMay2008until1January2012.ASeniorAssociateoftheAustralasianInstituteofBankingandFinanceandamemberoftheInstituteofFinancialServices.HewasformerlyDirectorandDeputyChiefExecutiveOfficerofHSBCAustraliaandDirectorandHeadofRetailBanking,HSBCBankA.S.Turkey.Previously,hehasalsoheldthepostsofDirectorofHSBCBrokingAsiaandpriortothatofGeneralManagerHSBCBankMalaysia.Resignedon1January2012ashewasappointedChiefExecutiveOfficerHSBCIndonesia.
Philip Farrugia,DIRECTORANDCHIEFTECHNOLOGYANDSERVICESOFFICERChiefTechnologyandServicesOfficerfromJanuary2011andDirectoron15February2011.Has been employedwith the bank since 1969 and has occupied a number ofseniorpostsinbothbranchesandHeadOfficedepartments.In1980,hewassecondedtothehomeloanscompany(Lohombus),risingtoleadthecompanyasDeputyGeneralManagerandCompanySecretary.In2005hewasappointedHeadofServiceDeliveryfortheBank,andhasbeenamemberoftheexecutiveteamforsixyears.
Philip Farrugia Randon,NON-EXECUTIVEDIRECTORDirectorofHSBCBankMaltap.l.c. since June2004.GraduatedLL.D. in1973andjoinedthebankin1974asalegaladviser.HeldthepostofCompanySecretaryandthepostofHeadofGroupLegalDepartmentofthebankforseveralyears.RetiredfromthebankinMay2008.

11
Charles John Farrugia,NON-EXECUTIVEDIRECTORDirectorofHSBCBankMaltap.l.c.sinceNovember2004.Joinedthebankin1975.Was appointedChiefDealer in 1995,Group Senior TreasuryManager in 1999 andManagingDirectorofHSBCStockbrokers(Malta)Limitedin2001.HeldthepostofHeadofGlobalBanking andMarkets ofHSBCBankMalta p.l.c. for several years.RetiredfromthebankJanuary2010.
Saviour sive Sonny Portelli,NON-EXECUTIVEDIRECTORAppointedDirector ofHSBCBankMalta p.l.c. on9October 2006.MrPortelli is aseniorMaltesebusinessmanwhoiscurrentlytheChairmanofTheMaltaCouncilforEconomicandSocialDevelopment.MrPortellihadanearlycareerintheMaltaCivilServicewhichhelefttojointheTouristSector.BesidesbeingaMarketingSpecialisthesitsasnon-executivedirectorontheboardsofvariousMaltesecompanies.
George Brancaleone,COMPANYSECRETARY
CompanySecretaryofHSBCBankMaltap.l.c. since June2004. Joined thebank in1980andgraduatedLL.D.in1988.CompanySecretaryofvariousHSBCsubsidiariesinMaltasince2001.PresentlyholdsthepostofSeniorManageratAudit,ComplianceandLegalDepartmentofHSBCBankMaltap.l.c.
Peter Paul Testaferrata Moroni Viani,NON-EXECUTIVEDIRECTORNon-ExecutiveDirectorofHSBCBankMaltap.l.c.sinceMarch2001.HoldsvariousexecutivepositionsanddirectorshipswithintheTestaferrataGroupofcompanies.
James Dunbar Cousin,NON-EXECUTIVEDIRECTORAppointed Director of the Bank on 1 April 2009. Joined Barclays Bank D.C.O. in1968.OccupiedvariousmanagerialroleswithinthebranchnetworkofMid-MedBankLtd. Subsequently, he occupied the roles of Executive Manager and later Head ofCommercialBankingofthebank.MrDunbarCousinretiredfromthebankattheendof2008.
12
H S B C B A N K M A L T A P . L . C .
Financial Review
Summary of Financial Performance
Group profitAgainst a backdrop of very challenging economicconditionsinEurope,HSBCBankMaltap.l.c.deliveredagoodperformancein2011.Thereportedprofitbeforetaxof§88mincreasedby6%,or§5mcomparedto2010drivenprimarilybyanimprovedlevelofrevenues.
Profit attributable to shareholders was §58m, anincreaseof§4moverprioryearfigure.
Netoperatingincomeof§195mincreasedby§19mcompared with §176m in 2010. Net interest incomeincreasedby§6mto§129m.
Operating expenses were §98m, an increase of§11m over prior year but this included restructuringcostsof§11m.
Thegroup’scosttoincomeratiois50.4%comparedtoaprioryearratioof49.7%.
Shareholder ratiosEarningspershareof19.7centcomparedto18.4centforthesameperiodin2010,withthepre-taxreturnonshareholders’ funds at 24.1% compared to 24.9% in2010.
The Directors propose a final gross dividend of7.2 cent per share. This follows on the gross interimdividendof8.2centpaidinAugust2011.
Net interest incomeNetinterestincomeimprovedby5%to§129mcomparedto §123m last year attributable to asset growth andeffectivebalancesheetmanagement.However,liabilitymargins remain under pressure given the low interestrateenvironment.
Non-interest incomeNon-interestincomeincreasedsignificantlyfrom§53min 2010 to §66m in 2011 benefiting from net gainsof §10m arising from the sale of our card acquiringbusiness toGlobalPayments Incand increase in lifeinsurancepresentvalueofin-forcelong-terminsurancebusiness. Underlying performance of the bank’s corebusinessremainedsatisfactorygiventhevolatilemarketconditionswith investmentactivity impactedbyweakinvestorsentiment.
Netfeesandcommissionincomeof§34min2011was marginally down on 2010. Growth in accountservicesfeeswereoffsetbyadecline instockbrokingfees largely due to the slow-down in local capitalmarketsbondissuanceactivity.
Trading profits of §8m increased by 22% or §1mcomparedto§7min2010duetogoodgrowthinforeignexchangevolumes.
The second half of 2011 was dominated bythe continuing volatility in the global markets andspecificallythesignificantdeteriorationintheeurozonesovereign crisis.Thebank anticipated this in the firsthalf of the year and positioned the balance sheet tosignificantlyreducemarketriskatanetlossof§2masat31December2011.
The life insurance subsidiary generated a profitbefore tax of §11m compared to §13m in 2010.Underlying new business performance generationparticularlywithrespecttoprotectionwasencouraging.The business benefited from a non-recurring gain of§7m as a result of a refinement in the methodologyusedtocalculatethepresentvalueofin-forcelong-terminsurancebusiness.Thisbenefitwaserodedduringtheyearas theEuroswapcurvecontinuedtofallandtheoverallmarketvalueofinvestmentholdingsreduced.
Operating expensesOperatingexpensesof§98mwere§11mor12%highercompared to the previous yearwith a cost to incomeratio of 50.4% compared to 49.7% in 2010. Costsincreased,principallyduetostaffvoluntaryretirementscheme provision of §11m reported in Employeecompensation and benefits and due to higher costsrelatingtoutilitiesandcompliancecosts.
General and administrative expenses increased by§3m to §33m as a result of investment in channelmigration,offshoring,improvingsystemsaswellasthecostofhigherutilitiesandcompliancecosts.
Depreciation and amortisation charges of §6mdecreasedby§0.7mcomparedtothepreviousyear.
Net impairment Netimpairmentof§8mincludedanimpairmentof§4mrelating to the available-for-sale Greek governmentbondsheldbytheLifeinsurancesubsidiary.
At a bank level, while there was a marginaldeteriorationinnon-performingloansfrom4%to5%,thegeneralassetqualityremainsgoodandimpairmentsdeclinedto§4m(11basispointsofoverallloanbook)against§5min2010.
Impairment reversals contributed §5m toprofitability.Newimpairmentallowancesof§7mwereraisedandbaddebtwrite-offsof§1mwereeffected.
13
TaxationThe2011effectiverateoftaxwas34.8%percent.Taxexpensefor2011amountedto§31m.
AssetsTotal assetsamounted to§5,825m,3%higher thanat31December2010.Themainincreaseswerereportedin debt securities investments as part of the bank’sliquiditymanagement.
BalanceswithCentralBankofMalta,TreasuryBillsandcashholdingsreducedfromaprioryearendlevelof§380mtoayearendlevelof§233m.
Net loansandadvances tocustomers increasedby§54m to §3,344m supportedmainly by growth in thepersonalsector.
The bank’s liquidity position remains strong withadvances todeposit ratioof76%comparedwith74%at31December2010.
The balance sheet remains well diversified andconservative with negligible exposure to sovereigndebtintheperipheraleurozonecountriesfollowingthesaleofholdings in thehigher risk eurozonecountriesduring2011.
The available-for-sale investment portfolioincreasedby§246mto§937m.Afairvaluegainof§1mwasreportedduringtheyear.Themark-upwascreditedtorevaluationreserve,netoftax.
Life insurance business assets, are primarilydesignated as financial assets at fair value throughprofit or loss. This portfolio increased by §64m to§370mfromaprioryearendlevelof§306m.
LiabilitiesTotal liabilities increased by §142m to §5,458m atyearend.The increase in liabilities reflecteda rise inplacementswiththebankandasmallfallincustomerliabilities.
Customer deposits of §4,403mas at 31December2011reducedby§60mcomparedto31December2010reflecting the levels of volatility of deposits from theinstitutionalsector.Retaildepositswerebroadlystabledespite continuing competitive pressures for depositsincludingfromlocalgovernmentbondissuances.
Funds undermanagement by the group reached ayearendclosinglevelof§694million.
Liabilities under insurance contracts issuedincreasedby§26mduringtheyeartoreachayearendlevelof§437m.
Shareholders’ fundsEquity totaled §366m at year end following dividendpaymentsof§30mduring2011.
The number of shareholders as at 31 December2011stoodat10,366.
Thecapitaladequacyratioat11.6%iswellaboveregulatorycapitalrequirements.
14
H S B C B A N K M A L T A P . L . C .
Report of the Directors
Results for 2011
Thegroup reportedaprofitonordinaryactivitiesbefore taxof§88mfor theyearunder review.Thegroup’sprofitattributabletoshareholdersofthebankwas§58m.
Agrossinterimordinarydividendof8.2centwaspaidon24August2011.TheDirectorshaveproposedagrossfinaldividendof7.2centperordinaryshare.Thefinaldividendwillbepayabletoshareholdersonthebank’sregisterasat19March2012.
Furtherinformationabouttheresultsisprovidedinthegroupincomestatementandthestatementofcomprehensiveincomeonpages29and30.
Principal activities
Principal activities of parent companyThebankisauthorisedtocarryonthebusinessofbankingunder theBankingAct,1994asacredit institution.It isalsoanauthoriseddealerintermsoftheExchangeControlActandalicensedfinancialintermediaryintermsoftheFinancialMarketsAct,1990.ThebankalsoholdsCategory3andCategory4InvestmentServiceslicensesissuedbytheMaltaFinancialServicesAuthorityintermsoftheInvestmentServicesAct,1994.Theselicensesauthorisethebanktoprovidebothinvestmentservicestothirdpartiesandtrusteeorcustodianservicesforcollectiveinvestmentschemes.
Thebankprovidesacomprehensiverangeofbankingandfinancialrelatedservices.
Thegrouphadthefollowingsubsidiariesat31December2011:HSBCLifeAssurance(Malta)Ltd,HSBCGlobalAssetManagement(Malta)Limited,HSBCSecuritiesServices(Malta)Limited,HSBCStockbrokers(Malta)LimitedandHSBCInsuranceManagementServices(Europe)Limited.
Principal activities of subsidiariesHSBCLifeAssurance (Malta)Ltd is authorised by theMaltaFinancial ServicesAuthority to carry on business ofinsurance inMaltaunder the InsuranceBusinessAct,1998.HSBCBankMaltap.l.c. isenrolledasa tied insuranceintermediaryforHSBCLifeAssurance(Malta)LtdundertheInsuranceIntermediariesAct2006.On28April2011,HSBC Life established a new subsidiary HSBC InsuranceManagement Services (Europe) Limited with the mainobjectiveofprovidingoperationalsupporttoHSBCGroupInsuranceCompanies.IthasalreadyenteredintotwoformalagreementsfortheprovisionofinsuranceoperationalandadministrativeservicestoHSBCLifeAssurance(Malta)LtdandHSBCLife(Europe)LtdbasedinDublin.Beyondthesetwoinitialappointments,thiscompanywillbemarketedwithintheHSBCGroupasaCentreofExcellenceforInsuranceOperationalsupportandadministrativeservicesseekingsimilarappointmentsfromotherGroupInsuranceCompanies.
HSBCGlobalAssetManagement (Malta)Limited is the investmentmanagementarmof thebank. Itmanagesarangeofdomesticand international funds,specialising in thedevelopmentofstructuredcapitalsecured investmentsproducts,andintheprovisionof tailor-madediscretionaryportfoliomanagementservices.ThecompanyoffersbothOpenandCloseendedtypesoffundsandinvestments.
HSBCSecuritiesServices(Malta)LimitedislicensedundertheInvestmentServicesAct,1994anditsmainbusinessactivityistheprovisionoffundadministrationservicestoproprietaryandthirdpartyinvestmentfunds.Italsoprovidesbackofficesupport toHSBCBankMaltap.l.c. in thedistributionof thirdparty investment funds through thebanknetwork.
HSBC Stockbrokers (Malta) Limited is a member of the Malta Stock Exchange and is regulated under theInvestment ServicesAct, 1994 by theMalta Financial ServicesAuthority. The company is principally engaged inprovidingstockbrokingbusinessontheMaltaStockExchangeandtoarrange/supportthelistingofstocksandsharesontheExchange.
Business review
Areviewofthebusinessofthebankanditssubsidiariesduringtheyearunderreviewandanindicationoflikelyfuturedevelopmentsaregiveninthe‘ChiefExecutiveOfficer’sReview’onpages5to9.
Shareholder Register Information
Directors’interestinthesharecapitalofthecompanyorinrelatedcompaniesat31December2010:
AlbertMizzi 8,000sharesSavioursiveSonnyPortelli 4,860sharesPhilipFarrugiaRandon 6,400shares
MrCharlesJohnFarrugiahasanon-beneficialinterestof7,511,587ordinarysharesinHSBCBankMaltap.l.c.through the shareholding held by Amalgamated Investments Sicav p.l.c. and a non-beneficial interest of 15,000ordinarysharesthroughtheshareholdingheldbyIndustrialManagementLtd.
MrPeterPaulTestaferrataMoroniVianihasabeneficialinterestof58,800ordinarysharesinHSBCBankMaltap.l.c.throughtheshareholdingofTestaferrataMoroniViani(Holdings)Limited,40,000ordinarysharesthroughtheshareholdingofCappsLtd, 40,000ordinary shares through the shareholdingofVianiLimited and5,000ordinarysharesthroughtheshareholdingofSalesandLettingLimited.
Healsohasanon-beneficialinterestof130,680ordinarysharesinHSBCBankMaltap.l.c.throughtheshareholdingofSantumasShareholdingsp.l.c.underCustodianshipHSBCBankMaltap.l.c.
TherewerenochangestoDirectors’interestfrom31December2010to31January2011.
Shareholdersholdingfivepercent(5%)ormoreoftheequitycapitalat31January2011:
HSBCEuropeB.V. 70.03%
Numberofshareholdersat31January2011:
Oneclassofshares 10,434shareholders(Allshareshaveequalvotingrights)

15
Transactions in own shares
Thebankholdsunitsinamutualfundwhichinvestsinthebank’sshares.Duringtheyear,thebankindirectlyacquired25,838additionalownsharesbringingthetotalnumberofsharesindirectlyheldat31December2011to61,455.
Shareholder Register Information pursuant to Listing Rule 5.64
HSBCBankMaltap.l.c.(the‘bank’)authorisedsharecapitalis§141,000,000.Theissuedandfullypaidupcapitalis§87,552,000dividedinto291,840,000OrdinarySharesofanominalvalueof30.0centeach.Theissuedsharecapitalconsistsofoneclassofordinaryshareswithequalvotingrightsattachedandfreelytransferable.
HSBCEuropeB.V.holds70.03%ofthebank’sshares.
Thelargestsingleshareholderofthebank,provideditholdsatleastthirtythreepercent(33%)oftheordinaryissuedsharecapitalofthebank,shallbeentitledtoappointtheChairmanfromamongsttheDirectorsappointedorelectedtotheBoard.
Everyshareholderowningelevenpercent(11%)oftheordinaryissuedsharecapital,shallbeentitledtoappointoneDirectorforeachandeveryelevenpercent(11%)oftheordinaryissuedsharecapitalofthebankownedbysuchshareholder.AnyfractionalshareholdingnotsoutilisedintheappointmentofDirector(s)shallbeentitledtoparticipateinthevotingfortheelectionoffurtherDirectors.
There isanAchievementShares scheme inexistencewherebyemployees in theGCB3gradeandhighercanbeawardedsharesinHSBCHoldingsplc,dependingontheirperformance.Shareawardswillbereleasedtotheindividualafter3years,providedtheparticipantremainscontinuouslyemployedwithintheGroup.Duringthe3-yearperiodtheemployeehasnovotingrightswhatsoever.
TherulesgoverningtheappointmentofBoardmembersarecontainedinArticles77to80ofthebank’sArticlesofAssociation.AnextraordinaryresolutionapprovedbytheshareholdersinthegeneralmeetingisrequiredtoamendtheArticlesofAssociation.
ThepowersoftheDirectorsareoutlinedinArticles73,74and85ofthebank’sArticlesofAssociation.IntermsofArticle12ofthesaidArticlesofAssociation,thebankmay,subjecttotheprovisionsoftheCompaniesAct1995,acquireorholdanyofitsshares.
TheCollectiveAgreement regulates redundancies,early retirement, resignationor terminationofemploymentofemployees.TherearenocontractsbetweenthebankandtheDirectorsonthebank’sBoard.
Itisherebydeclaredthat,asat31December2011,therequirementspursuanttoListingRules5.64.7and5.64.10didnotapplytothebank.
Shareholder Register Information
Directors’interestinthesharecapitalofthecompanyorinrelatedcompaniesat31December2011:
AlbertMizzi 8,000sharesPhilipFarrugiaRandon 6,400sharesSavioursiveSonnyPortelli 4,700shares
MrCharles JohnFarrugiahasanon-beneficial interestof7,511,587ordinary shares inHSBCBankMaltap.l.c.throughtheshareholdingheldbyAmalgamatedInvestmentsSicavp.l.c.andanon-beneficialinterestof15,000ordinarysharesthroughtheshareholdingheldbyIndustrialManagementLtd.
MrPeterPaulTestaferrataMoroniVianihasabeneficialinterestof58,800ordinarysharesinHSBCBankMaltap.l.c. throughtheshareholdingofTestaferrataMoroniViani(Holdings)Limited,40,000ordinarysharesthroughtheshareholdingofTestaferrataMoroniVianiLimited,40,000ordinarysharesthroughtheshareholdingofVianiLimitedand5,000ordinarysharesthroughtheshareholdingofSalesandLettingLimited.
Shareholder Register Information
Directors’interestinthesharecapitalofthecompanyorinrelatedcompaniesat31December2010:
AlbertMizzi 8,000sharesSavioursiveSonnyPortelli 4,860sharesPhilipFarrugiaRandon 6,400shares
MrCharlesJohnFarrugiahasanon-beneficialinterestof7,511,587ordinarysharesinHSBCBankMaltap.l.c.through the shareholding held by Amalgamated Investments Sicav p.l.c. and a non-beneficial interest of 15,000ordinarysharesthroughtheshareholdingheldbyIndustrialManagementLtd.
MrPeterPaulTestaferrataMoroniVianihasabeneficialinterestof58,800ordinarysharesinHSBCBankMaltap.l.c.throughtheshareholdingofTestaferrataMoroniViani(Holdings)Limited,40,000ordinarysharesthroughtheshareholdingofCappsLtd, 40,000ordinary shares through the shareholdingofVianiLimited and5,000ordinarysharesthroughtheshareholdingofSalesandLettingLimited.
Healsohasanon-beneficialinterestof130,680ordinarysharesinHSBCBankMaltap.l.c.throughtheshareholdingofSantumasShareholdingsp.l.c.underCustodianshipHSBCBankMaltap.l.c.
TherewerenochangestoDirectors’interestfrom31December2010to31January2011.
Shareholdersholdingfivepercent(5%)ormoreoftheequitycapitalat31January2011:
HSBCEuropeB.V. 70.03%
Numberofshareholdersat31January2011:
Oneclassofshares 10,434shareholders(Allshareshaveequalvotingrights)
Report of the Directors (continued)
16
H S B C B A N K M A L T A P . L . C .
Healsohasanon-beneficialinterestof130,680ordinarysharesinHSBCBankMaltap.l.c.throughtheshareholdingofSantumasShareholdingsp.l.c.underCustodianshipofHSBCBankMaltap.l.c.
TherewerenochangestoDirectors’interestfrom31December2011to31January2012.
Shareholdersholdingfivepercent(5%)ormoreoftheequitycapitalat31January2012:
HSBCEuropeB.V. 70.03%
Numberofshareholdersat31January2012:
Oneclassofshares 10,356shareholders(Allshareshaveequalvotingrights)
Number of shareholders analysed by range 16Fe31January20122009 ___________________________________________
Rangeofshareholding Totalshareholders Shares
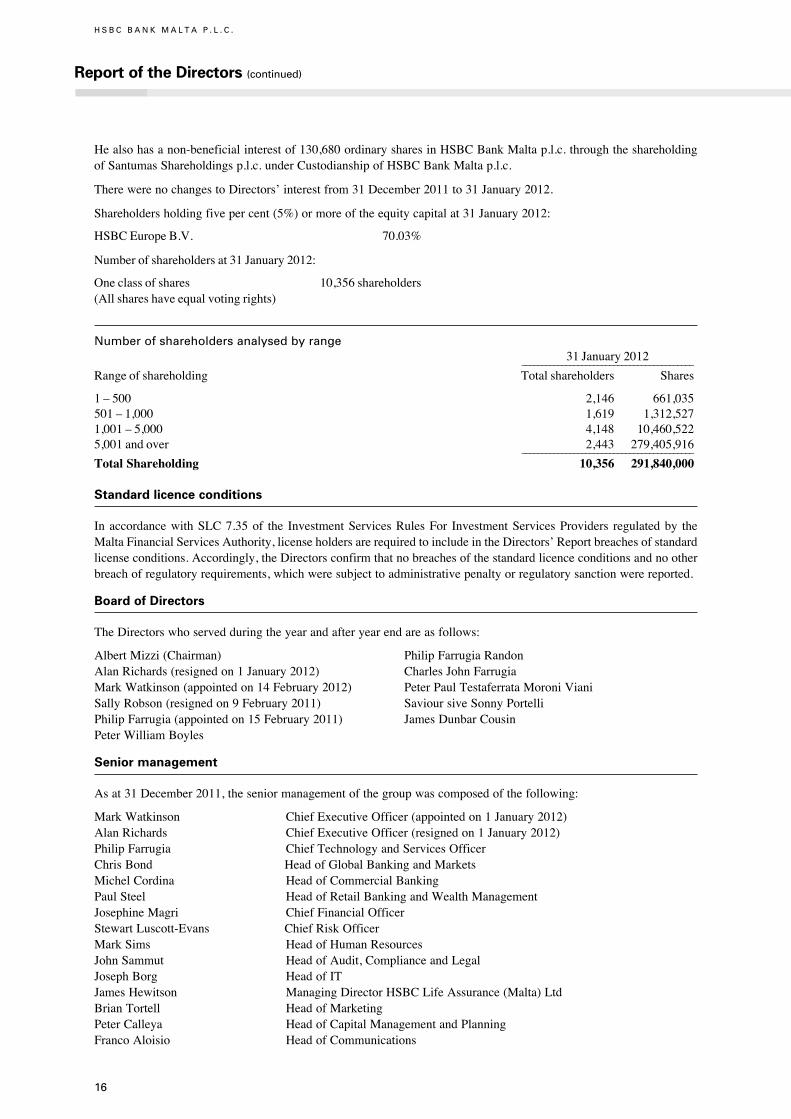
1–500 2,146 661,035501–1,000 1,619 1,312,5271,001–5,000 4,148 10,460,5225,001andover 2,443 279,405,916 ___________________________________________
Total Shareholding 10,356 291,840,000 Standard licence conditions
In accordancewithSLC7.35of the InvestmentServicesRulesFor InvestmentServicesProviders regulatedby theMaltaFinancialServicesAuthority,licenseholdersarerequiredtoincludeintheDirectors’Reportbreachesofstandardlicenseconditions.Accordingly,theDirectorsconfirmthatnobreachesofthestandardlicenceconditionsandnootherbreachofregulatoryrequirements,whichweresubjecttoadministrativepenaltyorregulatorysanctionwerereported.
Board of Directors
TheDirectorswhoservedduringtheyearandafteryearendareasfollows:
AlbertMizzi(Chairman) PhilipFarrugiaRandonAlanRichards(resignedon1January2012) CharlesJohnFarrugiaMarkWatkinson(appointedon14February2012) PeterPaulTestaferrataMoroniVianiSallyRobson(resignedon9February2011) SavioursiveSonnyPortelliPhilipFarrugia(appointedon15February2011) JamesDunbarCousinPeterWilliamBoyles
Senior management
Asat31December2011,theseniormanagementofthegroupwascomposedofthefollowing:
MarkWatkinson ChiefExecutiveOfficer(appointedon1January2012)AlanRichards ChiefExecutiveOfficer(resignedon1January2012)PhilipFarrugia ChiefTechnologyandServicesOfficerChrisBond HeadofGlobalBankingandMarketsMichelCordina HeadofCommercialBankingPaulSteel HeadofRetailBankingandWealthManagementJosephineMagri ChiefFinancialOfficerStewartLuscott-Evans ChiefRiskOfficerMarkSims HeadofHumanResourcesJohnSammut HeadofAudit,ComplianceandLegalJosephBorg HeadofITJamesHewitson ManagingDirectorHSBCLifeAssurance(Malta)LtdBrianTortell HeadofMarketingPeterCalleya HeadofCapitalManagementandPlanningFrancoAloisio HeadofCommunications
17
Auditors
KPMGhaveexpressedtheirwillingnesstocontinueinoffice.AresolutionproposingthereappointmentofKPMGasauditorsofthebankwillbesubmittedattheforthcomingAnnualGeneralMeeting.
Going Concern
AsrequiredbyListingRule5.62,upondueconsiderationofthebank’sprofitabilityandstatementoffinancialposition,capitaladequacyandsolvency,theDirectorsconfirmthebank’sabilitytocontinueoperatingasagoingconcernfortheforeseeablefuture.
Statement by the Directors pursuant to Listing Rule 5.70.1
Pursuant to Listing Rule 5.70.1 there were no material contracts to which the bank, or anyone of its subsidiaryundertakings,waspartytoandinwhichanyoneoftheDirectorswasdirectlyorindirectlyinterested.
Statement by the Directors pursuant to Listing Rule 5.68
We,theundersigned,declarethattothebestofourknowledge,thefinancialstatementspreparedinaccordancewiththerequirementsofInternationalFinancialReportingStandardsasadoptedbytheEUgiveatrueandfairviewoftheassets,liabilities,financialpositionandprofitorlossofthebankanditssubsidiariesincludedintheconsolidationtakenasawholeandthatthisreportincludesafairreviewofthedevelopmentandperformanceofthebusinessandthepositionofthebankanditssubsidiariesincludedintheconsolidationtakenasawhole,togetherwithadescriptionoftheprincipalrisksanduncertaintiesthattheyface.
SignedonbehalfoftheBoardon24February2012by:
AlbertMizzi,Chairman MarkWatkinson,ChiefExecutiveOfficer
18
H S B C B A N K M A L T A P . L . C .
PursuanttotheMaltaFinancialServicesAuthorityListingRules,HSBCBankMaltap.l.c.(the‘bank’)asacompanywhoseequitysecuritiesarelistedonaregulatedmarketendeavourstoadopttheCodeofPrinciplesofGoodCorporateGovernance (the ‘Principles’) embodied inAppendix 5.1 toChapter 5 of theListingRules. The bank is obliged intermsofListingRule5.94toprepareareportexplaininghowithascompliedwiththeprovisionsof thesaidCode.ThebankherebyincludesaStatementdividedintwosections:thefirstpartdetailingtheeffectivemeasuresadoptedbythebanktoensurecompliancewiththePrinciplesandthesecondpartexplainingthereasonsbehindinstancesofnon-compliance.
Although the Principles are not mandatory, the Board of Directors (the ‘Board’) of the bank believes in theiradoption, and has endorsed them except where there exist particular circumstances that warrant non-adherencethereto.TheBoardbelievesthatadherencetothePrincipleshasbeenandwillremainatoppriorityforthebankandconsidersittobearesponsibilitywhichstartswiththeBoardandpermeatesdownthroughoutthebank.TheBoardisproudofthefactthatthebankhasagoodcorporategovernanceframeworkthatensuresthatdirectorsworkcollectivelythroughaneffectiveBoard,overseethemanagementofthebusiness,setthetonefromthetop,ensuretheintegrityoffinancialreporting,setariskmanagement framework for thebankandcommunicatewithshareholders.TheBoardfirmlybelievesthatadherencetothePrinciplesiscrucialtoensuremoretransparentgovernancestructures,increasedaccountabilityandimprovedrelationswithinthemarketwhichshouldenhancemarketintegrityandconfidence.
Compliance with the Code
Principle 1: The BoardThe bank is headed by an effective Board which leads and controls the bank. All the Directors, individually andcollectively, are of the appropriate calibre, with the necessary skills and experience to assist them in providingleadership,integrityandjudgementindirectingthebank.Theintegrity,honestyanddiligenceoftheDirectorsguaranteethatthebankadherestoHSBCGroup’shighethicalbusinessvalues.
Boardmembersareaccountablefortheirperformanceandthatoftheirdelegates.Besideshavingabroadknowledgeofthebank’sbusinesstheyarealsoconversantwiththestatutoryandregulatoryrequirementsregulatingthisbusiness.
TheBoarddetermines thebank’sstrategicaimsandorganizationalstructuresandregularlyreviewsmanagementperformance.Itensuresthatthebankhastheappropriatefinancialandhumanresourcestomeetitsobjectives.
The Board delegates specific responsibilities to a number of committees, notably the Audit Committee, theRemunerationCommittee,theExecutiveCommittee,theAssetandLiabilityManagementCommittee,theGroupRiskManagementCommitteeandtheCreditRiskManagementCommittee.
FurtherdetailinrelationtotheCommitteesandtheresponsibilitiesoftheirrespectiveboardscanbefoundunderPrinciple8ofthisStatement.
Principle 2: Chairman and Chief Executive OfficerThepositionoftheChairmanandthatoftheChiefExecutiveOfficerareoccupiedbydifferentindividuals.ThereisacleardivisionofresponsibilitiesbetweentherunningoftheboardandtheChiefExecutiveOfficer’sresponsibilityin managing the bank’s business. This separation of roles of the Chairman and Chief Executive Officer avoidsconcentrationofauthorityandpowerinoneindividualanddifferentiatesleadershipoftheboardfromtherunningofthebusiness.
The Chairman exercises independent judgement even though he is appointed by the majority shareholder. HeleadstheBoard,setstheagendaandensuresthattheDirectorsreceiveprecise,timelyandobjectiveinformationandat the same time ensures effective communication with shareholders. During Board meetings, he leads the Boardandencourages active engagementby all boardmembers for thediscussionof complexandcontentious issues andstimulatesconstructivechallengeofseniormanagement.
On the other hand, the Chief Executive Officer is Chairman of most of the Board Committees and subsidiarycompanies.Hismainroleandresponsibilityistoexecuteagreedstrategyandmanagethebusiness.
Statement of Compliance with the Code of Principles of Good Corporate Governance

19
Principle 3: Composition of the Board TheBoardconsidersthatthesizeoftheBoardisthemostappropriatetoensureaneffectivemanagementandoversightoverthebank’soperationsasdemonstratedthroughouttheyears.
TheBoardiscomposedofindividualswhohavearangeofskills,competence,knowledgeandexperiencethatenablethemtofulfiltheirrolesdiligentlyandarecapableofunderstandingandfullyappreciatingthebusinessriskissuesandkeyperformanceindicators.
InlinewithPrinciple3,theBoardiscomposedofanon-executiveChairman,twoexecutiveDirectors,threenon-executiveDirectorsandthreeindependentnon-executiveDirectors.
Theindependentnon-executiveDirectorsarethefollowing:
MrSavioursiveSonnyPortelli
MrPeterPaulTestaferrataMoroniViani
MrJamesDunbarCousin
IndeterminingtheindependenceorotherwiseofitsDirectors,theBoardhasconsidered,interalia,theprinciplesrelatingtoindependenceembodiedinthecode,theGroup’sownpracticeaswellasgeneralgoodpracticeprinciples.
TheBoardconsidersthat thefact thatoneof theDirectorsisaformeremployeeof thebankandtheotherhasasignificantbusiness relationshipwith thebankdonotundermine the saidDirectors’ ability to exercise independentjudgementwhenconsideringtheissuesbroughtbeforetheBoard.Moreover,thesetwoDirectorswerenominatedbytheminorityshareholders.
IntermsofPrinciple3.4eachnon-executiveDirectorhasconfirmedinwritingtotheBoardthatheundertook:
a)tomaintaininallcircumstanceshisindependenceofanalysis,decisionandaction;
b)nottoseekoracceptanyunreasonableadvantagesthatcouldbeconsideredascompromisinghisindependence;and
c)toclearlyexpresshisoppositionintheeventthathefindsthatadecisionoftheBoardmayharmthebank.
Principle 4: The Responsibilities of the BoardTheBoardconcentratesprimarilyonstrategy,policysetting,businessplansandfinancialinformation.Itreviewsandevaluatescorporatestrategy,majoroperationalandfunctionalplans,riskpolicyandfinancialperformanceobjectives.Italsomonitorsimplementationofsuchobjectivesandcorporateperformancewithintheparametersofallrelevantlaws,regulationsandcodesofbestpractice.Theboardensuresthatabalanceismaintainedbetweenenterpriseandcontrol.
TheBoard’sinformedassessmentofmanagement’sperformanceresultsfromaclearinternalandexternalreportingsystem. The Board continuously assesses and monitors the bank’s present and future operations, opportunities,threatsandrisksintheexternalenvironmentandcurrentandfuturestrengthsandweaknesses.Theevaluationofthemanagement’simplementationofcorporatestrategyandfinancialobligationsisbasedontheuseofkeyperformanceindicators enabling the bank to adopt expedient corrective measures. These key business risks and performanceindicatorsarebenchmarkedagainstindustrynormssoastoensurethatthebank’sperformanceiseffectivelyevaluated.
TheBoardensuresthatthebankhasappropriatepoliciesandproceduresinplacethatguaranteethatthebankanditsemployeesmaintainthehigheststandardsofcorporateconductandcompliancewiththeapplicablelaws,regulations,businessandethicalstandards.
20
H S B C B A N K M A L T A P . L . C .
Principle 5: Board MeetingsTheBoardmeetsonaquarterlybasis,unlessfurthermeetingsarerequiredtodischargeitsdutieseffectively.
TheChairmanensures thatall relevant issuesareon theagenda,supportedbyall theavailable information.Theagendastrikesabalancebetweenlong-termstrategicobjectivesandshorter-termperformanceissues.NoticeofthedatesofBoardmeetingstogetherwithsupportingmaterialsarecirculatedtotheDirectorswellinadvanceofthemeetings.
DuringBoardmeetingsminutesareprepared that records faithfullyattendance,discussedmatters anddecisions.TheseminutesaresubsequentlycirculatedtoalltheDirectorsassoonaspracticableafterthemeeting.
Directors’AttendanceatBoardMeetings:
Members Attended
AlbertMizzi 4
AlanRichards* 4
PeterW.Boyles 3
PhilipFarrugia 4
CharlesJohnFarrugia 4
PhilipFarrugiaRandon 4
PeterPaulTestaferrataMoroniViani 4
SavioursiveSonnyPortelli 4
JamesDunbarCousin 4
*MrAlanRichardsresignedfromthepostofDirectorandChiefExecutiveoftheBank,witheffectfrom1January2012.MrMarkWatkinsonwasappointedChiefExecutiveOfficerwitheffectfrom1January2012anddirectorwitheffectfrom14February2012.
Principle 6: Information And Professional DevelopmentTheBoardappointstheChiefExecutiveOfficerofthebankuponguidanceandrecommendationfromtheHSBCGroup.Thisenablesthebanktoavailitselfofthevastwealthofcompetence,talentandexperiencefoundacrosstheGroup.
Upon joining theBoard, aDirector is providedwith a handbook containing themain provisions of law,whichregulate his office.TheDirector also attends a presentationmade by the functional heads on the activities of theirrespectivebusinessunitsinthebank.TheDirectorsalsoreceiveupdatesonchanges,ifany,totheGroup’sshorttermstrategicandoperationalplansandquarterlyupdatesbytheChiefTechnologyandServicesOfficer,ChiefFinancialOfficer,theChiefRiskOfficerandbytheHeadsofRetailBankingandWealthManagement,CommercialBanking,GlobalBankingandMarketsandMarketing.
DirectorsalsohaveaccesstotheadviceandservicesoftheCompanySecretarywhoisresponsibleforadherencetoBoardproceduresaswellaseffectiveinformationflowswithintheBoard,itsCommitteesandwithseniormanagement.The Company Secretary also directs Board members to seminars or conferences which serve as professionaldevelopmentforDirectors.Moreover,Directorshaveaccesstoindependentprofessionaladvice,atthebank’sexpense.
The Chairman of the Board and the Chairman of the Audit committee attend on an annual basis the GroupChairman’sNon-ExecutiveDirectors’ForumandtheAuditCommitteeChairmenForumwheretheyareupdatedonthelatestGroup’sstrategyandglobalfinancialandeconomicdevelopments.
AspartofthesuccessionplanningandtalentmanagementtheBoardandtheChiefExecutiveOfficerensurethatthebankimplementsappropriateschemestorecruit,retainandmotivatehighqualityexecutiveofficers,toencouragemembersofmanagementtomovetothehigherrankswithintheorganisationandtomaintainhighmoraleamongstthebank’sstaff.
Statement of Compliance with the Code of Principles of Good Corporate Governance (continued)
21
Principle 7: Evaluation of the Board PerformanceTheBoardundertookanevaluationofitsownperformance,theChairman’sperformanceandthatofitsCommittees.TheBoarddidnotappointanadhoccommitteetocarryoutthisperformanceevaluationbuttheevaluationexercisewasconductedthroughaBoardEffectivenessQuestionnairebytheCompanySecretaryinliaisonwiththeChairmanmodelledonaBoardEffectivenessQuestionnaireusedbytheGroup.
AlthoughnomaterialchangesresultedfromananalysisoftheresponsestothisBoardEffectivenessQuestionnairecertainminorchangeswereimplementedinordertoincreasetheBoard’seffectiveness.
Principle 8: CommitteesThe Board delegates specific responsibilities to Committees, which operate under their respective formal terms ofreference.TheBoardhasestablishedthefollowingCommittees:
Audit CommitteeTheAuditCommitteemetfivetimesduringthisyear.ItsTermsofReferencewereoriginallymodelledmainlyontherecommendationsintheCadburyReport,theUKWalkerReviewandarecompliantwiththeListingRules.ThisyeartheseTermsofReferencehavebeenamendedinordertoincreasetheAuditCommittee’soversightonriskfactors.
TheprimarypurposeofthisCommitteeistoprotecttheinterestsofthebank’sshareholdersandassisttheDirectorsinconductingtheirroleeffectivelysothatthebank’sdecision-makingcapabilityandtheaccuracyofitsreportingandfinancialresultsaremaintainedatahighlevelatalltimes.
TheAuditCommitteealsoscrutinisesandapprovesrelatedpartytransactions.Itconsidersthematerialityandthenatureoftherelatedpartytransactioncarriedoutbythebanktoensurethatthearms’lengthprincipleisadheredtoatalltimes.
ThemembersoftheAuditCommitteeareMessrsSavioursiveSonnyPortelli(Chairman)andPeterPaulTestaferrataMoroni Viani who are independent non-executive directors and Dr Philip Farrugia Randon LL.D. who is a non-executivedirector.ExecutivesofthebankareinvitedtoattendanyofthemeetingsasdirectedbytheCommittee.TheChiefExecutiveOfficer,theChiefTechnologyandServicesOfficer,theChiefRiskOfficerandarepresentativeoftheexternalauditorsattendthemeetings.InlinewithListingRule5.131,theHeadofInternalAuditisalwayspresentforitsmeetingsandhasarightofdirectaccesstotheChairmanoftheCommitteeatalltimes.TheHeadofContinentalEuropeGroupAuditsometimesattendsthesemeetings.
MrSavioursiveSonnyPortelliwasappointedbytheBoardasthedirectorwhoisindependentandcompetentinaccountingand/orauditingintermsofListingRule5.117onthebasisthathehasalonganddistinguishedcareerinbothpubliccompaniesandprivateenterprise.Presently,MrPortelliisalsoChairmanoftheMaltaCouncilforEconomicand Social Development.Mr Portelli has served on the Bank’s Board of Directors since October 2006 where hiscontributionshavedemonstratedthatheishighlycompetentinaccountingandaucourantwithaccountingstandardsandpracticesandthathealsopossessesthequalitiesandexperiencerequiredtodischargehisdutiesasChairmanofthisCommittee.
As Chairman of the Audit Committee Mr Portelli attends the Group’s annual Audit Committee Chairmen’sForum.ThisprovidestheChairmanwiththelatestupdatesonkeyconsiderations,prioritiesandchallengesfacingtheCommittee.
IntermsofListingRule5.127.7,theAuditCommitteeisresponsiblefordevelopingandimplementingapolicyontheengagementoftheexternalauditortosupplynon-auditservices.SinceHSBCHoldingsplcisaSecuritiesExchangeCommission(SEC)registeredcompany,non-auditservicesprovidedbytheexternalauditorareregulatedintermsoftheSECrules.
Remuneration Committee (REMCO)TheRemunerationCommitteeisdealtwithundertheRemunerationReportonpages26and27,whichalsoincludestheRemunerationStatementintermsofCodeProvisions8.A.3and8.A.4.
Executive Committee (EXCO)TheExecutiveCommitteemeets on amonthly basis to oversee the overall day-to-daymanagement of the bank inaccordancewith such policies and directions as theBoardmay from time to time determine. TheChief ExecutiveOfficerchairsthisCommitteewhichiscomposedoftheChiefTechnologyandServicesOfficertogetherwiththetopmanagementofthebank.
22
H S B C B A N K M A L T A P . L . C .
Statement of Compliance with the Code of Principles of Good Corporate Governance (continued)
Asset And Liability Management Committee (ALCO)ThisCommitteereviewsthefinancialrisksofthegroupinMaltaandensurestheirprudentmanagement:interestraterisk,liquidityandfundingrisk,foreignexchangerisk,capitalsolvency,marketsectorriskandcountryrisk.Furthermore,ALCOmonitors the external environment andmeasures the impact on profitability of factors such as interest ratevolatility,marketliquidity,exchangeratevolatility,monetaryandfiscalpoliciesandcompetitorbanksactivity.
TheChiefExecutiveOfficer has primary responsibility for ensuring efficient development of asset and liabilitymanagement. Membership consists of senior executives with responsibility for the following functions: corporatebanking,retailbanking,treasury,financialcontrol,marketing,andcredit.TheALCO,whichischairedbytheChiefExecutiveOfficeranddeputisedbytheChiefTechnologyandServicesOfficer,meetsonceamonth.
Credit Risk Management CommitteeThiscommitteereviewsthecreditriskmanagementissuesofthegroupinMalta.ItmeetsonamonthlybasisandischairedbytheChiefExecutiveOfficer.Membershipconsistsofseniorexecutiveswithresponsibilityforthefollowingfunctions: credit and riskmanagement, corporatebanking, retail banking, treasury, consumer finance and audit andcompliance.
Group Risk Management CommitteeThisCommitteereviewstheoperationalrisksofthegroupinMalta:theidentification,measurement,monitoringandcontrollingoperationalbusinessrisksanddeterminesandagreesstrategiesandpoliciestomitigatetheserisks.
ThisCommitteewhichmeetsonaquarterlybasisischairedbytheChiefRiskOfficerandiscomposedoftheChiefTechnologyandServicesOfficer,theChiefRiskOfficer,theHeadofAudit,ComplianceandLegal,HeadofSecurityandFraudandbyotherBusinessandFunctionalHeadsandManagingDirectorsofsomeoftheSubsidiaryCompanies.
Principles 9 and 10: Relations With Shareholders And With The Market, and Institutional ShareholdersThebankmaintainsongoingcommunicationwithitsshareholdersandthemarketonitsstrategyandperformanceinordertoenhancetrustandconfidenceinthebank.Duringtheperiodunderreviewthebankhasissuedvariouscompanyannouncementsandmedia releases toexplainongoingcorporatedevelopmentsandmaterialeventsand transactionswhichhavetakenplaceandtheirimpactonthefinancialpositionofthebank.
TheprincipalcontactwithshareholderstakesplacethroughtheAnnualGeneralMeeting(furtherdetailisprovidedunder the section regardingGeneralMeetings) and ExtraordinaryGeneralMeetings when necessary. Furthermore,communicationwithshareholderstakesplacethroughtheAnnualReportandAccountsbeingsenttoeveryshareholder,whicharephysicallydeliveredtotheshareholdersandwhichcanbeaccessedbyshareholdersthroughthebank’swebsite,primarilytheInvestorRelations’section,andaspecificperiodicalshareholderpublicationentitled“L-Azzjonist”.
Thebankalsoholdsmeetingsforstockbrokers,financialintermediariesandthemediatoexplainthesalientfeaturesoftheinterimandannualfinancialresults.
The bankmaintains an open channel of communicationwith its shareholders through the Company SecretarialOfficeandthroughtheHeadofCommunications.
TheChairmanensures that theviewsofshareholdersarecommunicated to theBoardasawhole.Moreover, theChairmanarrangesforallDirectorstoattendtheAnnualGeneralMeetingandfortheChairmenoftheAuditCommitteeandtheRemunerationCommitteetobeavailabletoanswerquestions.Theconductofthemeetingisconducivetovaliddiscussionandappropriatedecisionmaking.
In termsof thebank’sArticlesofAssociation theDirectorsshallon the requisitionofmembersof thecompanyholdingnotlessthanone-tenthofthepaidupsharecapitalproceeddulytoconveneanExtraordinaryGeneralMeetingofthebank.MinorityshareholdersarenotprohibitedfromformallypresentinganissuetotheBoardofDirectors.
23
Principle 11: Conflicts of InterestsDirectorsareawarethattheirprimaryresponsibilityisalwaystoactintheinterestofthebankanditsshareholdersasawholeirrespectiveofwhoappointedthemtotheBoard.Thisentailsthattheyavoidconflictsofinterestatalltimesandthattheirpersonalinterestsnevertakeprecedenceoverthoseofthebankanditsshareholders.
Byvirtueofthebank’sArticlesofAssociationadirectorisboundnottovoteataBoardmeetingonanycontractorarrangementoranyotherproposalinwhichhehasamaterialinterest,eitherdirectlyorindirectly.
OnjoiningtheBoardandregularlythereafter,DirectorsareinformedandremindedoftheirobligationsondealinginsecuritiesofthebankwithintheparametersoflawandtheListingRules.AproperprocedureofreportingadvancenoticestotheChairmanbyadirectorwhointendstodealinthebank’sshareshasbeenendorsedbytheBoardinlinewiththePrinciples,theListingRulesandtheinternalcodeofdealing.
Principle 12: Corporate SustainabilityHSBC’sCorporateSustainability(CS)activitiestakeplacewithinthecontextoftheGroupwidestrategy.InMaltathebankfulfilstheGroup’sCSstrategyprimarilythroughtheHSBCMaltaFoundation.
ThischaritableFoundationiscommittedtoinvestinginthelocalcommunityandlookstobringaboutlastingbenefittosociety.Itdealswithissuesthatconcernthepublicingeneralbysupervisingprojectsinrelationtodisadvantagedchildren,theenvironmentandMalta’snationalheritage.TheseactivitieshaveasignificantimpactonalargemajorityofMaltesecitizenswhichshowsthebank’sstrongcommitmenttowardssocialinvestment.
Non-Compliance with the Code
Principle 4 (Code Provision 4.2.7)CodeProvision4.2.7.recommends“thedevelopmentofasuccessionpolicyforthefuturecompositionoftheBoardofDirectorsandparticularlytheexecutivecomponentthereof,forwhichtheChairmanshouldholdkeyresponsibility”.
InviewofthefactthatappointmentofDirectorsisamatterreservedexclusivelytothebank’sshareholders(exceptwhere theneedarises to fillacasualvacancy) thebankdoesnotconsider itappropriate toadoptsuchasuccessionpolicy.However,asexplainedunderPrinciple6 thebankcontinuestopursueanactivesuccessionpolicyforseniorexecutive positions, especially by seeking to post local senior staff members abroadwithin the Group in order toenhancetheirinternationalbankingexperience.
Principle 8B (Nomination Committee)TheMemorandumofAssociationofthebankspecificallyregulatestheappointmentofDirectors.TheBoardconsistsofnotmorethannineDirectorswhoareappointed/electedbytheshareholders.Unlessappointedforashorterorlongerperiodbutnotexceedingthreeyears,aDirectorshallholdofficefromtheendofoneAnnualGeneralMeetingtotheendofthenext.Everyshareholderowning11%oftheordinarysharecapitalisentitledtoappointoneDirectorforeach11%shareholding.ThemajorityshareholderthereforehastherighttoappointsixDirectors.Furthermore,anyexcessfractional shareholdingnot soutilisedmaybeused toparticipate in thevoting for theelectionof furtherDirectors.Shareholderswhoownless than11%of theordinarysharecapitalparticipate in theelectionof theremaining threeDirectors.
Thelargestsingleshareholder(subjecttoaminimum33%holdingoftheordinaryissuedsharecapitalofthebank),is entitled to appoint aChairman fromamongst theDirectors appointedor elected to theBoard.Everypoll for theelectionofDirectorsisoverseenbythebank’sexternalauditors.
Withinthiscontext,theBoarddoesnotdeemitnecessarytoappointaNominationCommittee.
Principle 9 (Code Provision 9.2)This Code Provision recommends the bank to have in place a mechanism to resolve conflicts between minorityshareholdersandcontrollingshareholders.Althoughthebankdoesnothavesuchmechanisminplacethereisongoingopendialoguebetweenthebank’sseniormanagementandthenon-executivesdirectorstoensurethatnosuchconflictsarise.
24
H S B C B A N K M A L T A P . L . C .
Statement of Compliance with the Code of Principles of Good Corporate Governance (continued)
Internal Control
TheBoardisultimatelyresponsibleforthebank’ssystemofinternalcontrolandforreviewingitseffectiveness.Suchproceduresaredesignedtomanageratherthantoeliminatetheriskoffailure,toachievebusinessobjectivesandcanonlyprovidereasonableandnotabsoluteassuranceagainstmaterialerror,lossesorfraud.
Thebankhasdelegatedspecific,clearandunequivocalauthoritytotheChiefExecutiveOfficertomanageactivitiesofthebankwithinthelimitssetbyit.Functional,operatingandfinancialreportingstandardsareapplicablewithinallentitiesoftheHSBCGroup.Thesearesupplementedbyoperatingstandardssetbythebank’smanagement,asrequired.
Systemsandproceduresareinplaceinthebanktoidentify,controlandtoreportonthemajorrisksincludingcredit,changesinthemarketpricesoffinancialinstruments,liquidity,operationalerrorandfraud.ExposuretotheserisksismonitoredbytheAssetandLiabilityManagementCommittee,CreditRiskManagementCommitteeandbytheGroupRiskManagementCommittee.
Comprehensiveannual financialplansareprepared, reviewedandapprovedby theBoard.Resultsaremonitoredand reports on progress comparedwith plan are preparedmonthly. Financial accounting and reporting and certainmanagementreportingstandardshavebeenestablished.Centralisedfunctionalcontrolisexercisedoverallcomputersystemdevelopmentsandoperations.Commonsystemsareemployedwherepossibleforsimilarbusinessprocesses.
Responsibilitiesforfinancialperformanceagainstplansandforcapitalexpenditure,creditexposuresandmarketriskexposuresaredelegatedwithlimitstolinemanagement.Inaddition,functionalmanagementinthebankhasbeengiventheresponsibilitytoimplementHSBCpolicies,proceduresandstandardsintheareasoffinance;legalandregulatorycompliance;internalaudit;humanresources;creditrisk;marketrisk;operationalrisk;computersystemsandoperations;propertymanagement;andforcertainHSBCGroupbusinessandproductlines.
TheChiefRiskOfficerisresponsibleforthemanagementofspecificriskswithintheBankincludingcreditriskinthewholesaleandretailportfolios,marketsriskandoperationalrisk.RisksaremonitoredviaregularRiskManagementCommitteesandthroughreportingtotheExecutiveCommitteeandtheBoard.
Theinternalauditfunctionmonitorscompliancewithpoliciesandstandardsandtheeffectivenessofinternalcontrolstructureswithinthebankanditssubsidiaries.Theworkoftheinternalauditfunctionfocusesonareasofgreatestriskasdeterminedbyariskmanagementapproach.
Thebank’sComplianceDepartmentensuresthatHSBCBankMaltagroupanditsemployeesmaintainthehigheststandards of corporate conduct including compliancewith all the local and international regulatory obligations andHSBCGroupethicalstandardsandregulations.
ThroughtheAuditCommittee,theBoardreviewstheprocessesandprocedurestoensuretheeffectivenessofthesystemofinternalcontrolofthebankanditssubsidiaries,whicharemonitoredbyinternalaudit.
Listing Rule 5.97.5TheinformationrequiredbythisListingruleisfoundintheDirectors’Reportonpages14to17.
25
General Meetings
TheGeneralMeetingisthehighestdecisionmakingbodyofthebank.AGeneralMeetingiscalledbytwenty-onedays’noticeanditisconductedinaccordancewiththeArticlesofAssociationofthebank.
TheAnnualGeneralMeetingdealswithwhatistermedas“ordinarybusiness”,namelythereceivingoradoptionof theannual financial statements, thedeclarationof adividend, theappointmentof theBoard (whichmayormaynotinvolveanelection),theappointmentoftheexternalauditorsandthegrantoftheauthoritytotheBoardtofixtheexternal auditors’ emoluments.Otherbusinesswhichmaybe transactedat aGeneralMeetingwill bedealtwith asSpecialBusiness.
Allshareholdersregistered in theshareholders’Registeron therecorddateasdefined in theListingRules,havetheright toattend,participateandvote in theGeneralMeeting.Ashareholderorshareholdersholdingnot less than5%innominalvalueofallthesharesentitledtovoteattheGeneralMeetingmayrequestthebanktoincludeitemsontheagendaofaGeneralMeetingand/ortabledraftresolutionsforitemsincludedintheagendaofageneralmeeting.Suchrequestsaretobereceivedbythebankatleastfortysixdaysbeforethedatesetfortherelativegeneralmeeting.
AshareholderwhocannotparticipateintheGeneralMeetingcanappointaproxybywrittenorelectronicnotificationtothebank.EveryshareholderrepresentedinpersonorbyproxyisentitledtoaskquestionswhicharepertinentandrelatedtoitemsontheagendaoftheGeneralMeetingandtohavesuchquestionsansweredbytheDirectororsuchpersonsastheDirectorsmaydelegateforthatpurpose.
26
H S B C B A N K M A L T A P . L . C .
Remuneration Report
1. Terms of Reference and Membership
TheRemunerationCommittee(theCommittee)isprimarilyresponsibletomakerecommendationsontherewardpolicy,onfixedandvariablepayandforensuringtheirimplementation.
TheCommittee’smembershipconsistsofanindependentchairmanandtwoindependentnon-executiveDirectors.DuringtheperiodunderreviewtheCommitteewascomposedofMrAlbertMizziasChairmanandDrPhilipFarrugiaRandonandMrPeterPaulTestaferrataMoroniVianiasmemberswhoarenon-executivedirectors.MrSonnyPortellireplacedMrAlbertMizziasChairmanoftheCommitteeon4November2011.
TheCommitteeisauthorisedtoobtainsuchlegal,remunerationorotherprofessionaladviceasitdeemsappropriate.
2. Meetings
TwomeetingswereheldbytheCommitteeduring2011andattendancewasasfollows:
MrAlbertMizzi(Chairman) (1outof1)MrSavioursiveSonnyPortelli(Chairman) (1outof1)DrPhilipFarrugiaRandon (2outof2)MrPeterPaulTestaferrataMoroniViani (2outof2)
MrAlanRichards,CEOandMrMarkSims,HeadofHRwereinattendanceatthetwomeetings.
3. Activities
TheCommitteeconsideredvariousmattersincludingthefollowing:-
•TotalVariablePayspendforPerformanceYear2011•FixedandVariablePayforSeniorManagement(i.e.BusinessHeads)•FixedandVariablePayforMiddleManagement•FixedandVariablePayforJuniorManagersandClericalemployees•VariablePayforGlobalMarkets•Retentionofkeysenioremployeesbydevisingappropriateremunerationpackages•UpdateonCollectiveAgreementnegotiations
Indeterminingremunerationlevelsforperformanceyear2011theCommitteeappliedHSBCGroup’sremunerationstrategyandpolicy,takingintoaccounttheinterestsoftheshareholdersandthebroaderexternalcontext.
4. Remuneration Statement
4.1 Reward Policy TherewardpolicywhichformalisedtheBank’spreviouspracticeandpolicieswasapprovedbytheBoardintheyearunderreview.Nochangestothispolicyarebeingenvisagedduring2012.
Thebank’srewardpolicywasformulatedinaccordancewiththeBankingRuleBR/12,theCapitalRequirementsDirectiveandtheGroup’srewardstrategy.Thisstrategyprovidesarewardframeworkandincludeskeyelementssuchas:
a.anassessmentofrewardwithreferencetoclearandrelevantobjectives.
b.afocusontotalcompensation(fixedpay,variablepayandthevalueoflongtermincentives)withvariablepay(namelybonusandthevalueoflongtermincentives)differentiatedbycompanyandindividualperformance;and
c.atotalremunerationpackage(salary,bonus,longtermincentiveawardsandotherbenefits)whichiscompetitiveinrelationtocomparableorganisationsinthelocalmarket.
TheCommitteeconsidersthetotalvariablepayspendrelativetothebank’sperformancewiththekeydriverbeingProfitbeforeTax.OtherkeymeasuresaretakenintoaccountsuchasEfficiencyRatio,CostTarget,RevenueTargetandReturnonRiskWeightedAssets.
For clerical employees and juniormanagers fixedpay is determinedby aCollectiveAgreement and awards aredifferentiatedbyindividualperformanceandgrade.TheCommitteeconsiderstheallocationofvariablepaytothispartoftheworkforcecollectivelytakingaccountofcompanyprofitabilityandkeymeasuresmentionedabove.

27
SeniorandMiddleManagementareeligibleforanannualfixedpayreviewandvariablepayaward.AFixedpaypoolisdeterminedbytheCommitteebasedonapercentageofthetotalsalarycostsoftheSeniorandMiddleManagers.ThevariablepayisalsoestablishedbytheCommitteeanddeterminedbycompanyandindividualperformanceoftheSeniorandMiddleManagers.
The determination of the variable pay spend forGlobalMarkets takes account of the local performance of thefunctionaswellastheoverallprofitabilityoftheGlobalMarketsfunctionacrosstheworld.
TheChiefExecutiveOfficer’srewardpackageisalsoreviewedandapprovedbytheHSBCGroupRemunerationCommittee.
4.2 Code Provision 8.A.5
Emoluments of Senior Executives
FixedRemuneration VariableRemuneration ShareOptions Others
§452,271 §201,932 §78,280 §267,452
Referenceto‘SeniorExecutives’shallmeantheChiefExecutiveOfficerandtheChiefTechnologyandServicesOfficerwhoarealsoexecutiveDirectors.
Emoluments of Directors
FixedRemuneration VariableRemuneration ShareOptions Others
§163,964 None None None
DetailsofDirectors’feesforthefinancialyearunderreviewwereasfollows:
§
AlbertMizzi 36,954SavioursiveSonnyPortelli 37,537PeterPaulTestaferrataMoroniViani 26,842PhilipFarrugiaRandon 28,007JamesDunbarCousin 17,312CharlesJohnFarrugia 17,312 ____________
Total 163,964 _______FeespayabletoDirectorsorCommitteememberswhoarenotemployeesofthebankaresetbyreferencetomarket
practice, taking into account the time commitment and complexity of the work undertaken and relative fees paidthroughouttheHSBCGroup.
TheDirectors’feesareapprovedinaggregatebytheshareholdersattheAnnualGeneralMeeting.ThoseDirectorswhoareemployedwiththebankarenotpaidanyfeesfortheirdirectorship.
28
H S B C B A N K M A L T A P . L . C .
Directors’ Responsibilities Statement
TheCompaniesAct,1995requirestheDirectorsofHSBCBankMaltap.l.c.(the‘bank’)topreparefinancialstatementsforeachfinancialperiodwhichgiveatrueandfairviewofthefinancialpositionofthebankandthegroupasattheendofthefinancialperiodandoftheprofitorlossofthebankandthegroupforthatperiodinaccordancewiththerequirementsofInternationalFinancialReportingStandardsasadoptedbytheEU.
TheDirectorsareresponsibleforkeepingproperaccountingrecordswhichdisclosewithreasonableaccuracy,atanytime,thefinancialpositionofthebankandthegroupandtoenablethemtoensurethatthefinancialstatementshavebeenproperlypreparedinaccordancewiththeprovisionsoftheCompaniesAct,1995andtheBankingAct,1994.
TheDirectorsarealsoresponsibleforsafeguardingtheassetsofthegroupandhencefortakingreasonablestepsforthepreventionanddetectionoffraudandotherirregularities.
TheDirectors, through oversight ofmanagement, are responsible to ensure that the bank establishes andmaintainsinternalcontroltoprovidereasonableassurancewithregardtoreliabilityoffinancialreporting,effectivenessandefficiencyofoperationsandcompliancewithapplicablelawsandregulations.
Managementisresponsible,withoversightfromtheDirectors,toestablishacontrolenvironmentandmaintainpoliciesandprocedurestoassistinachievingtheobjectiveofensuring,asfaraspossible,theorderlyandefficientconductofthegroup’sbusiness.Thisresponsibilityincludesestablishingandmaintainingcontrolspertainingtothebank’sobjectiveofpreparingfinancialstatementsasrequiredbytheCompaniesAct,1995andmanagingrisksthatmaygiverisetomaterialmisstatements in those financial statements. In determining which controls to implement to prevent and detect fraud,managementconsiderstherisksthatthefinancialstatementsmaybemateriallymisstatedasaresultoffraud.
SignedonbehalfoftheBoardofDirectorsby:
AlbertMizzi,Chairman MarkWatkinson,ChiefExecutiveOfficer
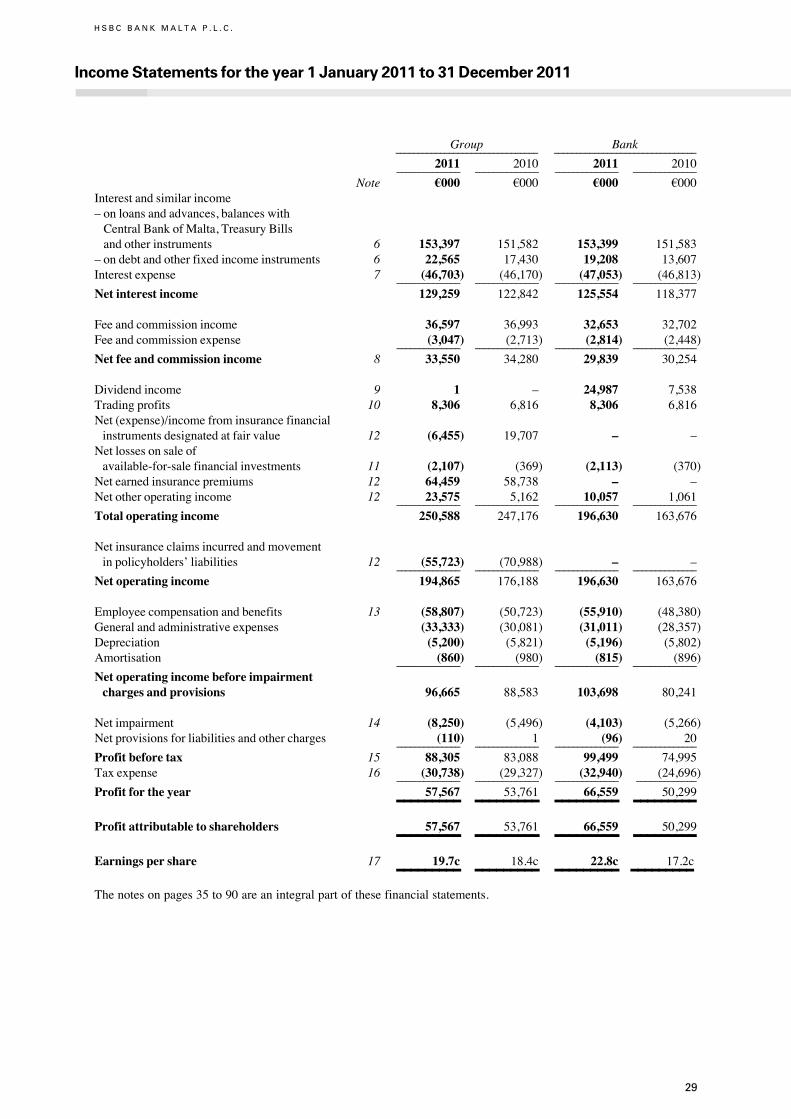
29
H S B C B A N K M A L T A P . L . C .
Income Statements for the year 1 January 2011 to 31 December 2011
Group Bank ________________________________ ________________________________ 2011 2010 2011 2010 ______________ ______________ ______________ ______________
Note §000 §000 §000 §000Interestandsimilarincome–onloansandadvances,balanceswith CentralBankofMalta,TreasuryBills andotherinstruments 6 153,397 151,582 153,399 151,583–ondebtandotherfixedincomeinstruments 6 22,565 17,430 19,208 13,607Interestexpense 7 (46,703) (46,170) (47,053) (46,813) ______________ ______________ ______________ ______________
Net interest income 129,259 122,842 125,554 118,377
Feeandcommissionincome 36,597 36,993 32,653 32,702Feeandcommissionexpense (3,047) (2,713) (2,814) (2,448) ______________ ______________ ______________ ______________
Net fee and commission income 8 33,550 34,280 29,839 30,254
Dividendincome 9 1 – 24,987 7,538Tradingprofits 10 8,306 6,816 8,306 6,816Net(expense)/incomefrominsurancefinancialinstrumentsdesignatedatfairvalue 12 (6,455) 19,707 – –Netlossesonsaleofavailable-for-salefinancialinvestments 11 (2,107) (369) (2,113) (370)Netearnedinsurancepremiums 12 64,459 58,738 – –Netotheroperatingincome 12 23,575 5,162 10,057 1,061 ______________ ______________ ______________ ______________
Total operating income 250,588 247,176 196,630 163,676
Netinsuranceclaimsincurredandmovementinpolicyholders’liabilities 12 (55,723) (70,988) – – ______________ ______________ ______________ ______________
Net operating income 194,865 176,188 196,630 163,676
Employeecompensationandbenefits 13 (58,807) (50,723) (55,910) (48,380)Generalandadministrativeexpenses (33,333) (30,081) (31,011) (28,357)Depreciation (5,200) (5,821) (5,196) (5,802)Amortisation (860) (980) (815) (896) ______________ ______________ ______________ ______________
Net operating income before impairment charges and provisions 96,665 88,583 103,698 80,241
Netimpairment 14 (8,250) (5,496) (4,103) (5,266)Netprovisionsforliabilitiesandothercharges (110) 1 (96) 20 ______________ ______________ ______________ ______________
Profit before tax 15 88,305 83,088 99,499 74,995Taxexpense 16 (30,738) (29,327) (32,940) (24,696) ______________ ______________ ______________ _____________
Profit for the year 57,567 53,761 66,559 50,299 _________ _________ _________ _________Profit attributable to shareholders 57,567 53,761 66,559 50,299 _________ _________ _________ _________Earnings per share 17 19.7c 18.4c 22.8c 17.2c _________ _________ _________ _________Thenotesonpages35to90areanintegralpartofthesefinancialstatements.
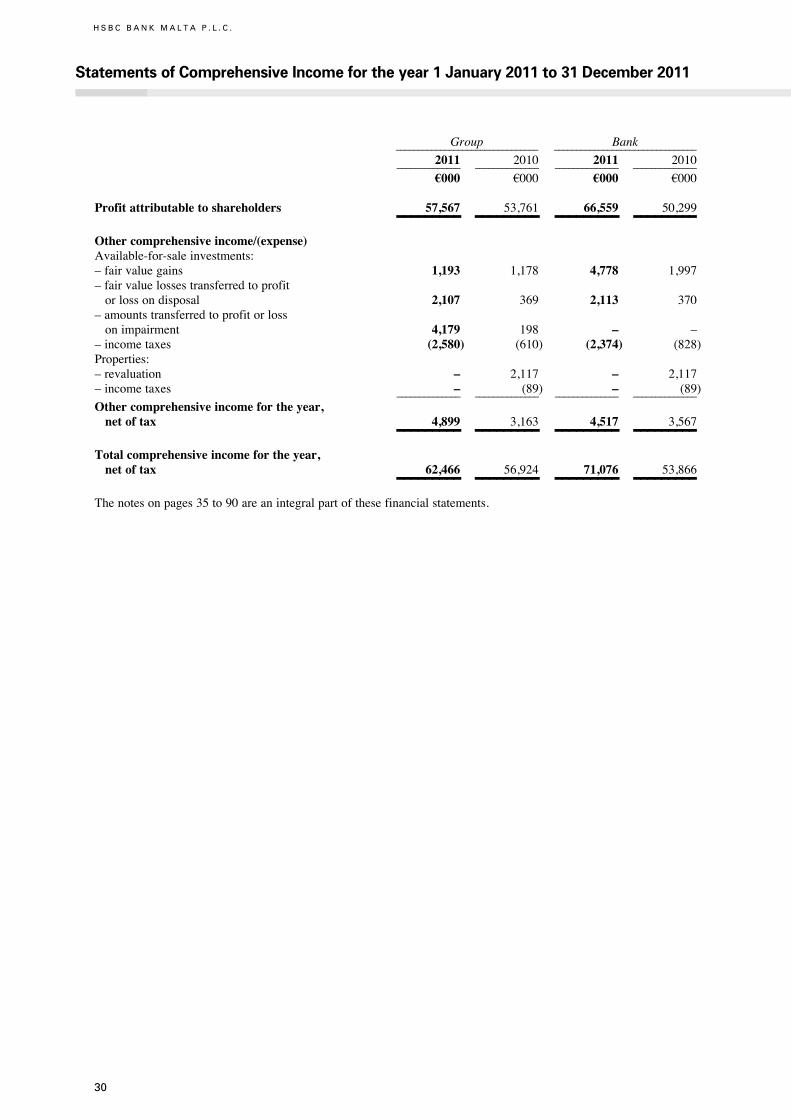
30
H S B C B A N K M A L T A P . L . C .
Statements of Comprehensive Income for the year 1 January 2011 to 31 December 2011
Group Bank ________________________________ ________________________________ 2011 2010 2011 2010 ______________ ______________ ______________ ______________
§000 §000 §000 §000
Profit attributable to shareholders 57,567 53,761 66,559 50,299 _________ _________ _________ _________Other comprehensive income/(expense)Available-for-saleinvestments:–fairvaluegains 1,193 1,178 4,778 1,997–fairvaluelossestransferredtoprofitorlossondisposal 2,107 369 2,113 370–amountstransferredtoprofitorlossonimpairment 4,179 198 – ––incometaxes (2,580) (610) (2,374) (828)Properties:–revaluation – 2,117 – 2,117–incometaxes – (89) – (89) ______________ ______________ ______________ ______________
Other comprehensive income for the year, net of tax 4,899 3,163 4,517 3,567 _________ _________ _________ _________Total comprehensive income for the year, net of tax 62,466 56,924 71,076 53,866 _________ _________ _________ _________Thenotesonpages35to90areanintegralpartofthesefinancialstatements.
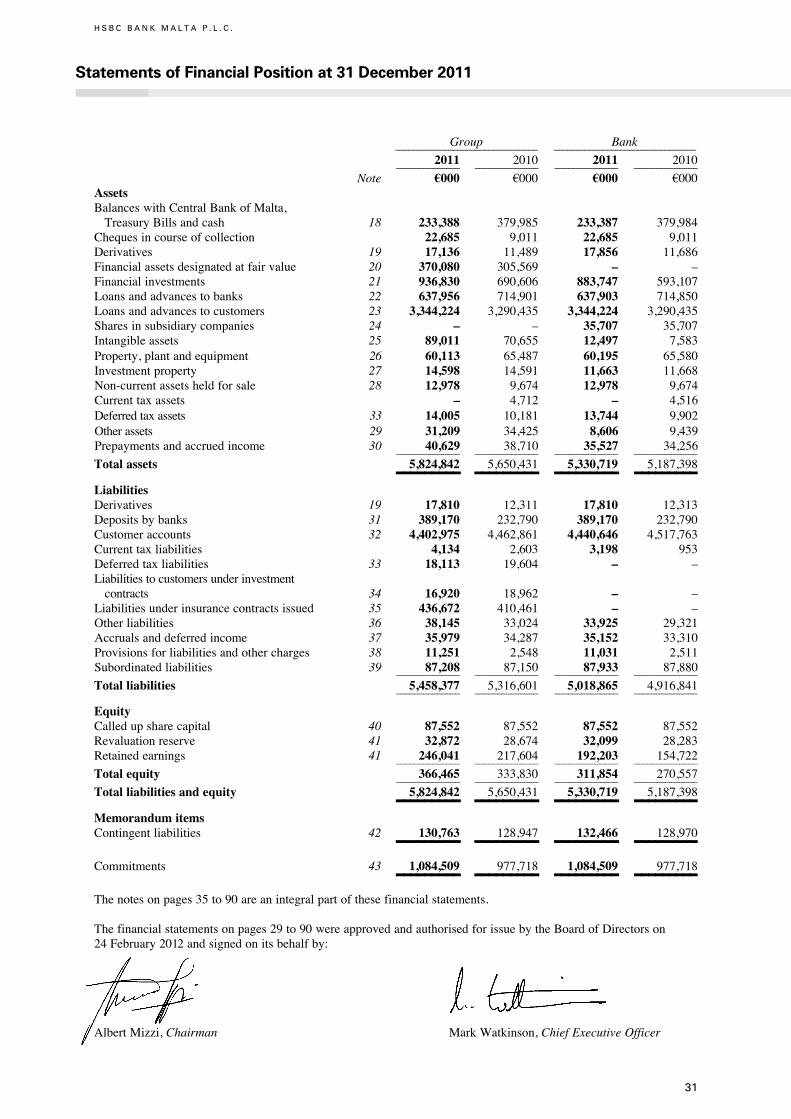
31
H S B C B A N K M A L T A P . L . C .
Statements of Financial Position at 31 December 2011
Group Bank ________________________________ ________________________________ 2011 2010 2011 2010 ______________ ______________ ______________ ______________
Note §000 §000 §000 §000AssetsBalanceswithCentralBankofMalta,TreasuryBillsandcash 18 233,388 379,985 233,387 379,984Chequesincourseofcollection 22,685 9,011 22,685 9,011Derivatives 19 17,136 11,489 17,856 11,686Financialassetsdesignatedatfairvalue 20 370,080 305,569 – –Financialinvestments 21 936,830 690,606 883,747 593,107Loansandadvancestobanks 22 637,956 714,901 637,903 714,850Loansandadvancestocustomers 23 3,344,224 3,290,435 3,344,224 3,290,435Sharesinsubsidiarycompanies 24 – – 35,707 35,707Intangibleassets 25 89,011 70,655 12,497 7,583Property,plantandequipment 26 60,113 65,487 60,195 65,580Investmentproperty 27 14,598 14,591 11,663 11,668Non-currentassetsheldforsale 28 12,978 9,674 12,978 9,674Currenttaxassets – 4,712 – 4,516Deferredtaxassets 33 14,005 10,181 13,744 9,902Otherassets 29 31,209 34,425 8,606 9,439Prepaymentsandaccruedincome 30 40,629 38,710 35,527 34,256 ______________ ______________ ______________ ______________
Total assets 5,824,842 5,650,431 5,330,719 5,187,398 _________ _________ _________ _________LiabilitiesDerivatives 19 17,810 12,311 17,810 12,313Depositsbybanks 31 389,170 232,790 389,170 232,790Customeraccounts 32 4,402,975 4,462,861 4,440,646 4,517,763Currenttaxliabilities 4,134 2,603 3,198 953Deferredtaxliabilities 33 18,113 19,604 – –Liabilitiestocustomersunderinvestment contracts 34 16,920 18,962 – –Liabilitiesunderinsurancecontractsissued 35 436,672 410,461 – –Otherliabilities 36 38,145 33,024 33,925 29,321Accrualsanddeferredincome 37 35,979 34,287 35,152 33,310Provisionsforliabilitiesandothercharges 38 11,251 2,548 11,031 2,511Subordinatedliabilities 39 87,208 87,150 87,933 87,880 ______________ ______________ ______________ ______________
Total liabilities 5,458,377 5,316,601 5,018,865 4,916,841 ______________ ______________ ______________ ______________
EquityCalledupsharecapital 40 87,552 87,552 87,552 87,552Revaluationreserve 41 32,872 28,674 32,099 28,283Retainedearnings 41 246,041 217,604 192,203 154,722 ______________ ______________ ______________ ______________
Total equity 366,465 333,830 311,854 270,557 ______________ ______________ ______________ ______________
Total liabilities and equity 5,824,842 5,650,431 5,330,719 5,187,398 _________ _________ _________ _________Memorandum itemsContingentliabilities 42 130,763 128,947 132,466 128,970 _________ _________ _________ _________Commitments 43 1,084,509 977,718 1,084,509 977,718 _________ _________ _________ _________Thenotesonpages35to90areanintegralpartofthesefinancialstatements.
Thefinancialstatementsonpages29to90wereapprovedandauthorisedforissuebytheBoardofDirectorson24February2012andsignedonitsbehalfby:
AlbertMizzi,Chairman MarkWatkinson,ChiefExecutiveOfficer
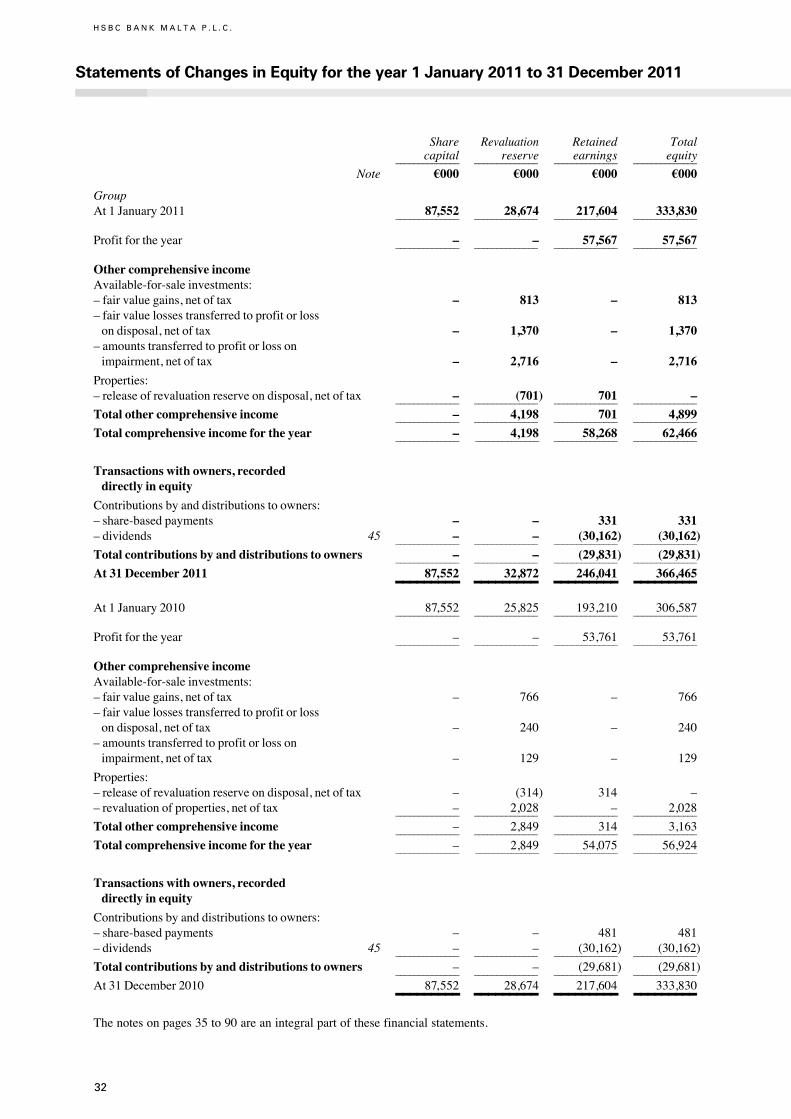
32
H S B C B A N K M A L T A P . L . C .
Statements of Changes in Equity for the year 1 January 2011 to 31 December 2011
Share Revaluation Retained Total capital reserve earnings equity ______________ ______________ ______________ ______________
Note §000 §000 §000 §000
GroupAt1January2011 87,552 28,674 217,604 333,830 ______________ ______________ ______________ ______________
Profitfortheyear – – 57,567 57,567 ______________ ______________ ______________ ______________
Other comprehensive income Available-for-saleinvestments: –fairvaluegains,netoftax – 813 – 813–fairvaluelossestransferredtoprofitorlossondisposal,netoftax – 1,370 – 1,370–amountstransferredtoprofitorlossonimpairment,netoftax – 2,716 – 2,716
Properties: –releaseofrevaluationreserveondisposal,netoftax – (701) 701 – ______________ ______________ ______________ ______________
Total other comprehensive income – 4,198 701 4,899 ______________ ______________ ______________ ______________
Total comprehensive income for the year – 4,198 58,268 62,466 ______________ ______________ ______________ ______________
Transactions with owners, recorded directly in equity
Contributionsbyanddistributionstoowners:–share-basedpayments – – 331 331–dividends 45 – – (30,162) (30,162) ______________ ______________ ______________ ______________
Total contributions by and distributions to owners – – (29,831) (29,831) ______________ ______________ ______________ ______________
At 31 December 2011 87,552 32,872 246,041 366,465 _________ _________ _________ _________At1January2010 87,552 25,825 193,210 306,587 ______________ ______________ ______________ ______________
Profitfortheyear – – 53,761 53,761 ______________ ______________ ______________ ______________
Other comprehensive income Available-for-saleinvestments: –fairvaluegains,netoftax – 766 – 766–fairvaluelossestransferredtoprofitorlossondisposal,netoftax – 240 – 240–amountstransferredtoprofitorlossonimpairment,netoftax – 129 – 129
Properties: –releaseofrevaluationreserveondisposal,netoftax – (314) 314 ––revaluationofproperties,netoftax – 2,028 – 2,028 ______________ ______________ ______________ ______________
Total other comprehensive income – 2,849 314 3,163 ______________ ______________ ______________ ______________
Total comprehensive income for the year – 2,849 54,075 56,924 ______________ ______________ ______________ ______________
Transactions with owners, recorded directly in equity
Contributionsbyanddistributionstoowners:–share-basedpayments – – 481 481–dividends 45 – – (30,162) (30,162) ______________ ______________ ______________ ______________
Total contributions by and distributions to owners – – (29,681) (29,681) ______________ ______________ ______________ ______________
At31December2010 87,552 28,674 217,604 333,830 _________ _________ _________ _________Thenotesonpages35to90areanintegralpartofthesefinancialstatements.
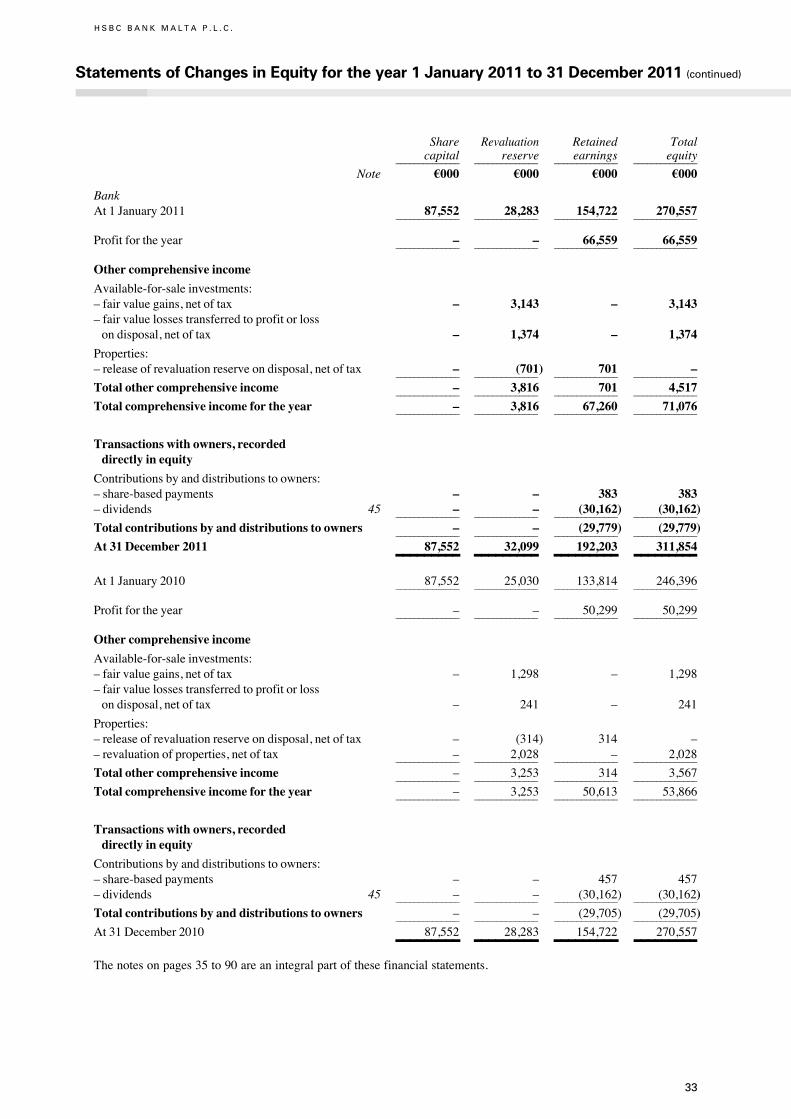
33
H S B C B A N K M A L T A P . L . C .
Share Revaluation Retained Total capital reserve earnings equity ______________ ______________ ______________ ______________
Note §000 §000 §000 §000
BankAt1January2011 87,552 28,283 154,722 270,557 ______________ ______________ ______________ ______________
Profitfortheyear – – 66,559 66,559 ______________ ______________ ______________ ______________
Other comprehensive income
Available-for-saleinvestments: –fairvaluegains,netoftax – 3,143 – 3,143–fairvaluelossestransferredtoprofitorlossondisposal,netoftax – 1,374 – 1,374
Properties: –releaseofrevaluationreserveondisposal,netoftax – (701) 701 – ______________ ______________ ______________ ______________
Total other comprehensive income – 3,816 701 4,517 ______________ ______________ ______________ ______________
Total comprehensive income for the year – 3,816 67,260 71,076 ______________ ______________ ______________ ______________
Transactions with owners, recorded directly in equity
Contributionsbyanddistributionstoowners:–share-basedpayments – – 383 383–dividends 45 – – (30,162) (30,162) ______________ ______________ ______________ ______________
Total contributions by and distributions to owners – – (29,779) (29,779) ______________ ______________ ______________ ______________
At 31 December 2011 87,552 32,099 192,203 311,854 _________ _________ _________ _________At1January2010 87,552 25,030 133,814 246,396 ______________ ______________ ______________ ______________
Profitfortheyear – – 50,299 50,299 ______________ ______________ ______________ ______________
Other comprehensive income
Available-for-saleinvestments: –fairvaluegains,netoftax – 1,298 – 1,298–fairvaluelossestransferredtoprofitorlossondisposal,netoftax – 241 – 241
Properties: –releaseofrevaluationreserveondisposal,netoftax – (314) 314 ––revaluationofproperties,netoftax – 2,028 – 2,028 ______________ ______________ ______________ ______________
Total other comprehensive income – 3,253 314 3,567 ______________ ______________ ______________ ______________
Total comprehensive income for the year – 3,253 50,613 53,866 ______________ ______________ ______________ ______________
Transactions with owners, recorded directly in equity
Contributionsbyanddistributionstoowners:–share-basedpayments – – 457 457–dividends 45 – – (30,162) (30,162) ______________ ______________ ______________ ______________
Total contributions by and distributions to owners – – (29,705) (29,705) ______________ ______________ ______________ ______________
At31December2010 87,552 28,283 154,722 270,557 _________ _________ _________ _________Thenotesonpages35to90areanintegralpartofthesefinancialstatements.
Statements of Changes in Equity for the year 1 January 2011 to 31 December 2011 (continued)

34
H S B C B A N K M A L T A P . L . C .
Statements of Cash Flows for the year 1 January 2011 to 31 December 2011
Group Bank ________________________________ ________________________________ 2011 2010 2011 2010 ______________ ______________ ______________ ______________
Note §000 §000 §000 §000Cash flows from/(used in) operating activities Interest,commissionandpremiumreceipts 266,521 254,711 196,076 187,992Interest,commissionandclaimspayments (76,988) (70,799) (49,450) (48,109)Paymentstoemployeesandsuppliers (83,774) (81,139) (77,701) (75,101) ______________ ______________ ______________ ______________
Operatingprofitbeforechangesinoperatingassets/liabilities 105,759 102,773 68,925 64,782
(Increase)/decreaseinoperatingassets:Tradinginstruments (76,592) (43,064) – –ReservedepositwithCentralBankofMalta (956) (8,335) (956) (8,335)Loansandadvancestocustomersandbanks (63,014) (104,527) (63,013) (104,591)TreasuryBills 167,308 (202,915) 170,555 (197,099)Otherreceivables (13,582) (21,249) (15,965) 3,173
(Decrease)/increaseinoperatingliabilities:Customeraccountsanddepositsbybanks (59,710) 374,995 (76,971) 370,291Otherpayables 3,212 32,313 7,325 7,573 ______________ ______________ ______________ ______________
Netcashfromoperatingactivitiesbeforetax 62,425 129,991 89,900 135,794Taxpaid (32,653) (26,840) (25,597) (25,183) ______________ ______________ ______________ ______________
Netcashfromoperatingactivities 29,772 103,151 64,303 110,611 ______________ ______________ ______________ ______________
Cash flows from/(used in) investing activitiesDividendsreceived 785 281 17,950 6,650Interestreceivedfromfinancialinvestments 34,624 25,575 24,403 16,036Purchaseoffinancialinvestments (599,079) (307,715) (599,079) (307,688)Proceedsfromsaleandmaturityoffinancialinvestments 344,079 94,246 302,557 94,246Purchaseofproperty,plantandequipment,investmentpropertyandintangibleassets (9,031) (11,038) (8,986) (10,998)Proceedsonsaleofproperty,plantandequipmentandintangibleassets 2,094 453 2,094 412Proceedsondisposalofcardacquiringbusiness 11,075 – 11,075 – ______________ ______________ ______________ ______________
Netcashflowsusedininvestingactivities (215,453) (198,198) (249,986) (201,342) ______________ ______________ ______________ ______________
Cash flows used in financing activitiesDividendspaid (30,162) (30,162) (30,162) (30,162) ______________ ______________ ______________ ______________
Cashusedinfinancingactivities (30,162) (30,162) (30,162) (30,162) ______________ ______________ ______________ ______________
Decrease in cash and cash equivalents (215,843) (125,209) (215,845) (120,893) _________ _________ _________ _________Effectofexchangeratechangesoncashandcashequivalents 17,485 31,624 17,485 31,624Netdecreaseincashandcashequivalents (233,328) (156,833) (233,330) (152,517) ______________ ______________ ______________ ______________
(215,843) (125,209) (215,845) (120,893)Cashandcashequivalentsatbeginningofyear 423,606 548,815 423,554 544,447 ______________ ______________ ______________ ______________
Cash and cash equivalents at end of year 46 207,763 423,606 207,709 423,554 _________ _________ _________ _________ Thenotesonpages35to90areanintegralpartofthesefinancialstatements.
35
H S B C B A N K M A L T A P . L . C .
Notes on the Financial Statements
1 Reporting entity
HSBCBankMaltap.l.c.(the‘bank’)isalimitedliabilitycompanydomiciledandincorporatedinMalta.
Theconsolidatedfinancialstatementsofthebankasatandfortheyearended31December2011comprisethebankanditssubsidiaries(togetherreferredtoasthe‘group’andindividuallyas‘groupentities’).
2 Basis of preparation
a Statementofcompliance
ThesefinancialstatementshavebeenpreparedandpresentedinaccordancewithInternationalFinancialReportingStandardsasadoptedbytheEU(‘theapplicableframework’).AllreferencesinthesefinancialstatementstoIAS,IFRSorSIC/IFRICinterpretationsrefertothoseadoptedbytheEU.
TheyhavealsobeendrawnupinaccordancewiththeprovisionsoftheBankingAct,1994andtheCompaniesAct,1995,enactedinMalta.
b Basisofmeasurement
Assetsandliabilitiesaremeasuredathistoricalcostexceptforcertainintangibleassetsmeasuredatthepresentvalueofin-forcelong-terminsurancebusiness,andthefollowingthataremeasuredatfairvalue:
–Derivatives;
– Financialinstrumentsdesignatedatfairvaluethroughprofitorloss;
–Available-for-salefinancialinvestments;and
– Property.
c Functionalandpresentationcurrency
Thefinancialstatementsarepresentedineuro(§),whichisthegroup’sfunctionalcurrency.
d Useofestimatesandassumptions
ThepreparationoffinancialstatementsinconformitywithIFRSsrequirestheuseofestimatesandassumptionsaboutfutureconditions.Theuseofavailableinformationandapplicationofjudgementareinherentintheformationofestimates,actualresultsinthefuturemaydifferfromthosereported.
Estimatesandunderlyingassumptionsarereviewedonanongoingbasis.Revisionstoaccountingestimatesarerecognisedintheperiodinwhichtheestimateisrevisedandinanyfutureperiodsaffected.
Informationaboutsignificantareasofestimation,uncertaintyandcriticaljudgmentsinapplyingaccountingpoliciesthathavethemostsignificanteffectontheamountrecognisedinthefinancialstatementsaredescribedinnotes4,25and53.
3 Significant accounting policies
Theaccountingpoliciessetoutbelowhavebeenappliedconsistentlytoallperiodspresentedinthesefinancialstatements,andhavebeenappliedconsistentlybygroupentities.
a Basisofconsolidation
i Subsidiaries
Subsidiaries are entities controlled by the bank. The financial statements of subsidiaries are included in theconsolidatedfinancialstatementsfromthedatethatcontrolcommencesuntilthedatethatcontrolceases.
ii Transactionseliminatedonconsolidation
Intra-groupbalancesandincomeandexpensesarisingfromintra-grouptransactions,areeliminatedinpreparingtheconsolidatedfinancialstatements.Unrealisedlossesareeliminatedinthesamewayasunrealisedgains,butonlytotheextentthatthereisnoevidenceofimpairment.

Notes on the Financial Statements (continued)
36
H S B C B A N K M A L T A P . L . C .
3 Significant accounting policies (continued)
b Financialinstruments
i Non-derivativefinancialinstruments
Non-derivative financial instruments are recognised on trade date when the group enters into contractualarrangements with counterparties. These financial instruments are recognised initially at fair value plus, forinstrumentsnotatfairvaluethroughprofitorloss,anydirectlyattributabletransactioncosts.Subsequenttoinitialrecognitionnon-derivativefinancialinstrumentsaremeasuredasdescribedbelow:
Cashandcashequivalents
Cash and cash equivalents comprise cash balances and deposits with contractualmaturity of less than threemonths. Loans and advances to banks andAmounts owed to banks that are repayable on demand or have acontractualmaturityofthreemonthsorlessandwhichformanintegralpartofthegroup’scashmanagementareincludedasacomponentofcashandcashequivalentsforthepurposeoftheStatementofCashFlows.Subsequenttoinitialrecognitioncashandcashequivalentsaremeasuredatamortisedcost.
Tradingassetsandtradingliabilities
TreasuryBills,debtsecurities,equitysharesandshortpositionsinsecuritiesareclassifiedasheldfortradingiftheyhavebeenacquiredprincipallyforthepurposeofsellingorrepurchasinginthenearterm,ortheyformpartofaportfolioofidentifiedfinancialinstrumentsthataremanagedtogetherandforwhichthereisevidenceofarecentpatternofshort-termprofit-taking.Subsequenttoinitialrecognition,theirfairvaluesareremeasured,andallgainsandlossesfromchangesthereinarerecognisedinprofitorlossinTradingprofitsastheyarise.
Financialinstrumentsdesignatedatfairvalue
Financialinstruments,otherthanthoseheldfortrading,areclassifiedinthiscategoryiftheymeetoneormoreofthecriteriasetoutbelow,andaresodesignatedbymanagement.Thegroupdesignatesfinancialinstrumentsatfairvaluewhenthedesignation:
– eliminatesorsignificantlyreducesvaluationor recognition inconsistencies thatwouldotherwisearise frommeasuringfinancialassetsorfinancialliabilities,orrecognisinggainsandlossesonthem,ondifferentbasis.Under thiscriterion, theonlyclassof financial instrumentsdesignatedby thegroup is financial assetsandfinancialliabilitiesunderinvestmentcontracts.
Liabilities tocustomersunder linkedcontractsaredeterminedbasedon the fairvalueof theassetsheld inthe linked funds, with changes recognised in profit or loss. Liabilities to customers under other types ofinvestmentcontractswouldbemeasuredatamortisedcost.Ifnodesignationwasmadefortheassetsrelatingtothecustomerliabilitiestheywouldbeclassifiedasavailable-for-saleandthechangesinfairvaluewouldberecordeddirectlyinothercomprehensiveincome.Thesefinancialinstrumentsaremanagedonafairvaluebasisandmanagement information isalsopreparedon thisbasis.Designationat fairvalueof the financialassetsandliabilitiesunderinvestmentcontractsallowsthechangesinfairvaluestoberecordedinprofitorlossandpresentedinthesameline.
– appliestogroupsoffinancialassets,financialliabilitiesorcombinationsthereofthataremanaged,andtheirperformanceevaluated,onafairvaluebasisinaccordancewithadocumentedriskmanagementorinvestmentstrategy,andwhereinformationaboutthegroupsoffinancialinstrumentsisreportedtomanagementonthatbasis.Under this criterioncertain financial assetsheld tomeet liabilitiesunder insurancecontracts are themainclassoffinancialinstrumentssodesignated.Thegrouphasdocumentedriskmanagementandinvestmentstrategiesdesignedtomanagesuchassetsatfairvalue,takingintoconsiderationtherelationshipofassetstoliabilitiesinawaythatmitigatesmarketrisks.Reportsareprovidedtomanagementonthefairvalueoftheassets.
The fair value designation, once made, is irrevocable. Subsequent to initial recognition, the fair values areremeasured,andgainsandlossesfromchangesthereinarerecognisedinNetincomefrominsurancefinancialinstrumentsdesignatedatfairvaluethroughprofitorloss.
37
3 Significant accounting policies (continued)
b Financialinstruments(continued)
i Non-derivativefinancialinstruments(continued)
Available-for-sale
TreasuryBills, debt securities and equity shares intended to be held on a continuing basis, other than thosedesignatedatfairvalue,areclassifiedasavailable-for-sale.
Available-for-salefinancialinvestmentsaresubsequentlyremeasuredatfairvalue,andchangesthereinarerecognisedinothercomprehensiveincomeuntilthefinancialassetsareeithersoldorbecomeimpaired.Whenavailable-for-salefinancialinvestmentsaresold,cumulativegainsorlossespreviouslyrecognisedinothercomprehensiveincomearerecognisedinprofitorlossasNet(losses)/gainsonsaleofavailable-for-salefinancialinvestments.
Loansandadvancestobanksandcustomers
Loansandadvancestobanksandcustomersarenon-derivativefinancialassetswithfixedordeterminablepaymentsthatarenotquotedinanactivemarket.Loansandadvancesarerecognisedwhenthecashisadvancedtotheborrowers.Theyaresubsequentlymeasuredatamortisedcostusingtheeffectiveinterestmethod,lessimpairmentlosses.
ii Derivativefinancialinstruments
Derivatives are recognised initially and are subsequently remeasured at fair value.Fair valuesof exchange tradedderivatives are obtained from quotedmarket prices. Fair value of over-the-counter derivatives are obtained usingvaluationtechniques,includingdiscountedcashflowmodelsandoptionpricingmodels.Allderivativesareclassifiedasassetswhentheirfairvalueispositiveorasliabilitieswhentheirfairvalueisnegative.
Derivativesmaybeembeddedonotherfinancialinstruments.Embeddedderivativesaretreatedasseparatederivativeswhentheireconomiccharacteristicsandrisksarenotclearlyandcloselyrelatedtothoseofthehostcontract;thetermsoftheembeddedderivativewouldmeetthedefinitionofastand-alonederivativeiftheywerecontainedinaseparatecontact;andthecombinedcontactisnotheldfortradingordesignatedatfairvalue.Theseembeddedderivativesaremeasuredatfairvaluewithchangesthereinrecognisedinprofitorloss.
Themethodof recognising fairvaluegains and lossesdependsonwhetherderivatives areheld for tradingor aredesignatedashedginginstruments,andifthelatter,thenatureoftherisksbeinghedged.
Derivativesthatdonotqualifyforhedgeaccounting
All gains and losses from changes in the fair values of derivatives that do not qualify for hedge accounting arerecognised immediately in profit or loss. These gains and losses are reported in Trading profits, except wherederivativesaremanagedinconjunctionwithfinancial instrumentsdesignatedatfairvalueinwhichcasegainsandlossesarereportedinNetincomefrominsurancefinancialinstrumentsdesignatedatfairvaluethroughprofitorloss.
Hedgeaccounting
Whenderivativesaredesignatedashedges,thebankclassifiesthemaseither:
–hedgesofthechangeinfairvalueofrecognisedassetsorliabilitiesorfirmcommitments(‘fairvaluehedges’);or
–hedgesofthevariabilityinhighlyprobablefuturecashflowsattributabletoarecognisedassetorliability,oraforecasttransaction(‘cashflowhedges’).
Hedge accounting is applied to derivatives designated as hedging instruments in a fair value or cash flow hedgeprovidedcertaincriteriaaremet.
Attheinceptionofahedgingrelationship,thebankdocumentstherelationshipbetweenthehedginginstrumentsandthehedgeditems,itsriskmanagementobjectiveanditsstrategyforundertakingthehedge.Thebankalsorequiresadocumentedassessment,bothathedgeinceptionandonanongoingbasis,ofwhetherornotthehedginginstruments, primarily derivatives, that are used in hedging transactions are highly effective in offsetting thechangesattributabletothehedgingrisksinthefairvalueofthehedgeditems.InterestondesignatedqualifyinghedgesisincludedinNetinterestincome.
Changesinthefairvalueofderivativesthataredesignatedandqualifyasfairvaluehedginginstrumentsarerecordedinprofitorloss,alongwithchangesinthefairvalueofthehedgeditemsorgroupthereofthatareattributabletothehedgedrisk.
Notes on the Financial Statements (continued)
38
H S B C B A N K M A L T A P . L . C .
3 Significant accounting policies (continued)
b Financialinstruments(continued)
ii Derivativefinancialinstruments(continued)
Ifahedgingrelationshipnolongermeetsthecriteriaforhedgeaccounting,thecumulativeadjustmenttothecarryingamountofthehedgeditemisamortisedtoprofitorlossbasedonarecalculatedeffectiveinterestrateovertheresidualperiod tomaturity, unless the hedged item has been derecognised, in which case, it is released to profit or lossimmediately.
Hedgeeffectivenesstesting
Toqualifyforhedgeaccounting,thebankrequiresthatattheinceptionofthehedgeandthroughoutitslife,eachhedgemustbeexpectedtobehighlyeffective(prospectiveeffectiveness),anddemonstrateactualeffectiveness(retrospectiveeffectiveness)onanongoingbasis.
Thedocumentationofeachhedgingrelationshipsetsouthowtheeffectivenessofthehedgeisassessed.Themethodadoptedbythegrouptoassesshedgeeffectivenesswilldependonitsriskmanagementstrategy.
For prospective effectiveness, the hedging instrument must be expected to be highly effective in offsettingchanges in fair value or cash flows attributable to the hedged risk during the period forwhich the hedge isdesignated.Foractualeffectivenesstobeachieved,thechangesinfairvalueorcashflowsmustoffseteachotherintherangeof80.0percentto125.0percent.
HedgeineffectivenessisrecognisedinprofitorlossinTradingprofits.
iiiDerecognitionoffinancialassetsandliabilities
Financialassetsarederecognisedwhentherighttoreceivecashflowsfromtheassetshasexpiredorwhenthegrouphastransferreditscontractualrighttoreceivethecashflowsofthefinancialassets,andeither
– substantiallyalltherisksandrewardsofownershiphavebeentransferred;or
– substantiallyalltherisksandrewardshaveneitherbeenretainednortransferredbutcontrolisnotretained.
Financial liabilities are derecognised when they are extinguished, that is when the obligation is discharged,cancelledorexpires.
ivOffsettingfinancialassetsandfinancialliabilities
Financial assets and financial liabilities are offset and the net amount reported in the statement of financialpositionwhenthereisalegallyenforceablerighttooffsettherecognisedamountsandthereisanintentiontosettleonanetbasis,orrealisetheassetandsettletheliabilitysimultaneously.
v Repurchasetransactions
Thegroupentersintopurchasesofinvestmentsunderagreementtoresellsubstantiallyidenticalinvestmentsatacertaindateinthefutureatafixedprice.Investmentspurchasedsubject tocommitmentstoresellatfuturedatesarenotrecognised.Theamountspaidarerecognisedinloansandadvancestoeitherbanksorcustomers.The receivables are shown as collateralised by the underlying security. Investments sold under repurchaseagreementscontinuetoberecognisedinthestatementoffinancialpositionandaremeasuredinaccordancewiththeaccountingpolicyforeitherassetsheldfortradingoravailable-for-saleasappropriate.Theproceedsfromsaleoftheinvestmentsarereportedasliabilitiestoeitherbanksorcustomers.
Thedifferencebetweenthesaleandrepurchaseconsiderationisrecognisedusingtheeffectiveinterestmethodovertheperiodofthetransactionsandisincludedininterest.
c Investmentinsubsidiaries
Investmentinsubsidiariesisshownintheseparatestatementoffinancialpositionatcostlessanyimpairmentlosses.Dividendincomeisrecognisedinprofitorlossonthedatethatthebank’srighttoreceivepaymentisestablished.
d Intangibleassets
Intangibleassetsincludesoftwareandthepresentvalueofin-forcelong-terminsurancebusiness.
Softwareacquiredbythegroupisinitiallymeasuredatcostandsubsequentlystatednetofaccumulatedamortisationandanyimpairmentlosses.Subsequentexpenditureiscapitalisedonlywhenitincreasesthefutureeconomicbenefitsembodiedinthespecificassettowhichitrelates.Allotherexpenditureisrecognisedinprofitorlossasincurred.
39
3 Significant accounting policies (continued)
d Intangibleassets(continued)
Amortisationisrecognisedinprofitorlossonastraight-linebasisovertheestimatedusefullifeofsoftware,fromthedateitisavailableforuse.Theestimatedusefullifeofsoftwarerangesbetween3–5years.
Fortheaccountingpolicygoverningthepresentvalueofin-forcelong-terminsurancebusinessseenote3i(iv).
e Propertyandequipment
i Ownedassets
Propertyandequipmentareinitiallymeasuredatcost.Freeholdandlongleaseholdpropertiesareremeasuredtofairvalueonthebasisoftheirexistinguse.Revaluationsareperformedbyaprofessionallyqualifiedarchitectwithsufficientregularitysuchthatthecarryingamountdoesnotdiffermateriallyfromthatwhichwouldbedeterminedusingfairvaluesatthereportingdate.Anysurplusesarisingonrevaluationarecreditedtoarevaluationreserve,netofdeferredtax.Anydeficienciesresultingfromdecreasesinvaluearedeductedfromthisreservetotheextentthatitissufficienttoabsorbthem,withanyexcesschargedtoprofitorloss.
Itemsofpropertyandequipmentarestatednetofaccumulateddepreciationandanyimpairmentlosses.
GainsandlossesondisposalofanitemofpropertyandequipmentaredeterminedbycomparingtheproceedsfromdisposalwiththecarryingamountofpropertyandequipmentandarerecognisednetinprofitorlosswithinNetotheroperatingincomeorexpense.Whenrevaluedassetsaresold,theamountsincludedintherevaluationsurplusreservearetransferredtoretainedearnings.
ii Financeandoperatingleases
Leasesintermsofwhichthegroupassumessubstantiallyalltherisksandrewardsofownershipareclassifiedasfinanceleases.
Whenthegroupisalesseeunderfinanceleases,theleasedassetsarecapitalisedandincludedinPropertyandEquipmentandthecorrespondingliabilitytothelessorisincludedinOtherliabilities.Afinanceleaseanditscorrespondingliabilityarerecognisedinitiallyatthefairvalueoftheassetor,iflower,thepresentvalueoftheminimumleasepayments.Financechargespayableare recognised inNet interest incomeover theperiodoftheleasebasedontheinterestrateimplicitintheleasesoastogiveaconstantrateofinterestontheremainingbalanceoftheliability.
Allotherleasesareclassifiedasoperatingleases.Whenthegroupisthelessee,leasedassetsarenotrecognisedonthestatementoffinancialposition.Rentalspayableandreceivableunderoperatingleasesareaccountedforonastraight-linebasisovertheperiodsoftheleasesandareincludedinGeneralandadministrativeexpensesandNetotheroperatingincomeorexpenserespectively.
iiiSubsequentcosts
Thecostofreplacingacomponentofanitemofpropertyandequipmentisrecognisedinthecarryingamountoftheitemifitisprobablethatthefutureeconomicbenefitsembodiedwithinthepartwillflowtothegroupanditscostcanbemeasuredreliably.Thecarryingamountofthereplacedpartisderecognised.Thecostsoftheday-to-dayservicingofpropertyandequipmentarerecognisedinprofitorlossasincurred.
ivDepreciation
Depreciation is recognised in profit or loss on a straight-line basis over the estimated useful lives of eachcomponentofan itemofpropertyandequipment.Land isnotdepreciated.Theestimateduseful lives for thecurrentandcomparativeperiodareasfollows:
– longleaseholds,freeholdbuildingsandimprovements 50years
– shortleaseholdsandimprovementstorentedproperty overtermoflease
– equipment,furnitureandfittings 3–10years
Depreciationmethods,usefullivesandresidualvaluesarereviewedateachreportingdateandadjustedifappropriate.
f Investmentproperty
Propertyheldforlong-termrentalyieldsorforcapitalappreciationorboththatisnotoccupiedbythegroupisclassifiedasinvestmentproperty.
Notes on the Financial Statements (continued)
40
H S B C B A N K M A L T A P . L . C .
3 Significant accounting policies (continued)
f Investmentproperty(continued)
Investmentpropertiesareincludedinthestatementoffinancialpositionatfairvaluewithchangesthereinrecognisedinprofitorlossintheperiodofchange.Fairvaluesaredeterminedbyprofessionalvaluerswhoapplyrecognisedvaluationtechniques.
g Impairment
i Financialassetsnotatfairvaluethroughprofitorloss
Ateachreportingdateanassessmentismadeofwhetherthereisanyobjectiveevidenceofimpairmentinthevalueofafinancialasset.Afinancialassetisconsideredtobeimpairedifobjectiveevidenceindicatesthatoneormoreeventshavehadanegativeeffectontheestimatedfuturecashflowsofthatasset.
An impairment loss in respect of a financial assetmeasured at amortised cost is calculated as the differencebetweenitscarryingamountandthepresentvalueoftheestimatedfuturecashflowsdiscountedattheoriginaleffectiveinterestrate.Animpairmentlossinrespectofanavailable-for-salefinancialinvestmentiscalculatedas the difference between the financial investment’s acquisition cost (net of any principal repayments andamortisation)andthecurrentfairvalue(lessanypreviousimpairmentlossrecognisedinprofitorloss).
Allimpairmentlossesarerecognisedinprofitorloss.Anycumulativelossinrespectofanavailable-for-salefinancialinvestmentrecognisedpreviouslyinequityisremovedfromothercomprehensiveincomeandtransferredtoprofitorloss.
Lossesforimpairedloansarerecognisedpromptlywhenthereisobjectiveevidencethatimpairmentofaloanorportfolioofloanshasoccurred.
Thereare twobasicmethodsofcalculating impairment losses, thosecalculatedon individual loansand thoselossesassessedonacollectivebasis.Impairmentlossesarerecordedaschargestoprofitorloss.Thecarryingamount of impaired loans on the statement of financial position is reduced through the use of impairmentallowancesaccounts.Lossesexpectedasaresultoffutureevents,nomatterhowlikely,arenotrecognisedinprofitorloss.
ii Calculationofrecoverableamount
Ateachreportingdate,thegroupassessesonacase-by-casebasiswhetherthereisanyobjectiveevidencethataloanisimpaired.Thisprocedureisappliedtoallaccountsthatareconsideredindividuallysignificant.Indeterminingimpairmentlossesontheseloans,thefollowingfactorsareconsidered:
– thegroup’saggregateexposuretothecustomer;
– the viability of the customer’s business model and their capability to trade successfully out of financial difficultiesandgeneratesufficientcashflowtoservicedebtobligations;
– theamountandtimingofexpectedreceiptsandrecoveries;
– theextentofothercreditors’commitmentsrankingaheadof,orparipassuwith,thegroupandthelikelihood ofothercreditorscontinuingtosupportthecustomer;
– the complexity of determining the aggregate amount and ranking of all creditor claims and the extent to whichlegalandinsuranceuncertaintiesareevident;
– therealisablevalueofsecurity(orothercreditriskmitigants)andlikelihoodofsuccessfulrepossession;and
– thelikelydeductionofanycostsinvolvedinrecoveryofamountsoutstanding.
Impairmentlossesarecalculatedbydiscountingtheexpectedfuturecashflowsofaloanatitsoriginaleffectiveinterestrate,andcomparingtheresultantpresentvaluewiththeloan’scarryingamount.
Impairmentisassessedonacollectivebasisintwocircumstances:
– to cover losseswhich have been incurred but have not yet been identified on loans subject to individual assessment;and
– forhomogeneousgroupsofloansthatarenotconsideredindividuallysignificant.
Individuallyassessedloansforwhichnoevidenceoflosshasbeenspecificallyidentifiedonanindividualbasisaregroupedtogetheraccordingtotheircreditriskcharacteristicsforthepurposeofcalculatinganestimatedcollectiveloss.Thisreflectsimpairmentlossesincurredatthereportingdatewhichwillonlybeindividuallyidentifiedinthefuture.
Thecollectiveimpairmentallowanceisdeterminedaftertakingintoaccount:
– historical lossexperience inportfoliosofsimilar riskcharacteristics (forexample,by industrysector, loan gradeorproduct);
41
3 Significant accounting policies (continued)
g Impairment(continued)
ii Calculationofrecoverableamount(continued)
– the estimated period between impairment occurring and the loss being identified and evidenced by the establishmentofanappropriateallowanceagainstthelossonanindividualloan;and
– management’sexperiencedjudgementastowhetherthecurrenteconomicandcreditconditionsaresuchthat theactuallevelofinherentlossesislikelytobegreaterorlessthanthatsuggestedbyhistoricalexperience.
Theperiodbetweenalossoccurringanditsidentificationisidentifiedbylocalmanagementforeachidentifiedportfolio.
Forhomogeneousgroupsofloansthatarenotconsideredindividuallysignificant,twoalternativemethodsareusedtocalculateallowancesonaportfoliobasis:
– When appropriate empirical information is available, the group utilises roll rate methodology. This methodology employs a statistical analysis of historical trends of delinquency and default to estimate the likelihood that loans will progress through the various stages of delinquency and ultimately prove irrecoverable.Theestimatedlossisthedifferencebetweenthepresentvalueofexpectedfuturecashflows, discountedat theoriginaleffective interest rateof theportfolio, and thecarryingamountof theportfolio. Currenteconomicconditionsarealsoevaluatedwhencalculatingtheappropriatelevelofallowancerequired tocoverinherentloss.
– Inothercases,whentheportfoliosizeissmallorwheninformationisinsufficientornotsufficientlyreliable toadoptarollratemethodology,thegroupadoptsaformulaicapproachwhichallocatesprogressivelyhigher percentagelossratesthelongeracustomer’sloanisoverdue.Lossratesarecalculatedfromthediscounted expectedfuturecashflowsfromaportfolio.
In normal circumstances, historical experienceprovides themost objective and relevant information from which to assess inherent loss within each portfolio. In certain circumstances, historical loss experience provides less relevant information about the inherent loss in a given portfolio at the reporting date,forexample,wheretherehavebeenchangesineconomic,regulatoryorbehaviouralconditions,suchthat themost recent trends in theportfolioriskfactorsarenot fullyreflected in thestatisticalmodels. In these circumstances,suchriskfactorsaretakenintoaccountwhencalculatingtheappropriatelevelofimpairment allowancesbyadjustingtheimpairmentallowancesderivedsolelyfromhistoricallossexperience.
Rollrates,lossratesandtheexpectedtimingoffuturerecoveriesareregularlybenchmarkedagainstactual outcomestoensuretheyremainappropriate.
iiiNon-financialassets
Thecarryingamountsofthegroup’snon-financialassets,otherthaninvestmentpropertyanddeferredtaxassets,are reviewed at each reporting date to determine whether there is any indication of impairment. If any suchindicationexists,thentheasset’srecoverableamountisestimated.
Animpairmentlossisrecognisedifthecarryingamountofanassetoritscash-generatingunitexceedsitsestimatedrecoverableamount.Impairmentlossesarerecognisedinprofitorloss.
Impairmentlossesrecognisedinpriorperiodsareassessedateachreportingdateforanyindicationsthatthelosshasdecreasedornolongerexists.
Therecoverableamountofnon-financialassetsisthegreateroftheirnetsellingpriceandvalueinuse.Inassessingvalueinuse,theestimatedfuturecashflowsarediscountedtotheirpresentvalueusingapre-taxdiscountratethatreflectscurrentmarketassessmentsofthetimevalueofmoneyandtherisksspecifictotheasset.
ivReversalsofimpairment
Animpairmentlossisreversedifthereversalcanberelatedobjectivelytoaneventoccurringaftertheimpairmentlosswasrecognised.
Iftheamountofanimpairmentlossdecreasesinasubsequentperiod,andthedecreasecanberelatedobjectivelyto an event occurring after the impairment was recognised, the excess is written back by reducing the loanimpairmentallowanceaccountaccordingly.Forfinancialassetsmeasuredatamortisedcostandavailable-for-salefinancialinvestmentsthataredebtsecurities, thereversalisrecognisedinprofitorloss.Foravailable-for-salefinancialinvestmentsthatareequitysecurities,thereversalisrecogniseddirectlyinothercomprehensiveincome.
Notes on the Financial Statements (continued)
42
H S B C B A N K M A L T A P . L . C .
3 Significant accounting policies (continued)
g Impairment(continued)
ivReversalsofimpairment(continued)
Animpairmentlossonnon-financialassetsisreversediftherehasbeenachangeintheestimatesusedtodeterminetherecoverableamount.Animpairmentlossisreversedonlytotheextentthattheasset’scarryingamountdoesnot exceed the carrying amount thatwould have been determined, net of depreciation or amortisation, if noimpairmentlosshadbeenrecognised.
v Loanwrite-offs
Loans(andtherelatedimpairmentallowanceaccounts)arenormallywrittenoff,eitherpartiallyorinfull,whenthereisnorealisticprospectofrecoveryoftheseamountsand,forcollateralisedloans,whentheproceedsfromrealisingthesecurityhavebeenreceived.
h Non-currentassetsheldforsale
Non-currentassetsthatareexpectedtoberecoveredprimarilythroughsaleratherthanthroughcontinuinguseareclassifiedasheldforsale.Immediatelybeforeclassificationasheldforsale,theassetsareremeasuredinaccordancewiththegroup’saccountingpolicies.Thereaftergenerallytheassetsaremeasuredattheloweroftheircarryingamountandfairvaluelesscosttosell.Impairmentlossesoninitialclassificationasheldforsaleandsubsequentgainsorlossesonremeasurementarerecognisedinprofitorloss.Gainsarenotrecognisedinexcessofanycumulativeimpairmentloss.
i Insuranceandinvestmentcontracts
Through its insurance subsidiary, the group issues contracts to customers that contain insurance risk, financialriskoracombination thereof.Acontractunderwhich thegroupaccepts significant insurance risk fromanotherpartybyagreeingtocompensatethatpartyontheoccurrenceofaspecifieduncertainfutureevent,isclassifiedasaninsurancecontract.Aninsurancecontractmayalsotransferfinancialrisk,butisaccountedforasaninsurancecontractiftheinsuranceriskissignificant.
Insurancecontractsareaccountedforasfollows:
i Premiums
Premiumsforlifeinsurancecontractsareaccountedforwhenreceivable,exceptinunit-linkedbusinesswherepremiumsareaccountedforwhenliabilitiesareestablished.
Reinsurancepremiumsareaccountedforinthesameaccountingperiodasthepremiumsforthedirectinsurancecontractstowhichtheyrelate.
iiClaimsandreinsurancerecoveries
Grossinsuranceclaimsforlifeinsurancecontractsreflectthetotalcostofclaimsarisingduringtheyear,includingclaimhandlingcostsandanypolicyholderbonusesallocatedinanticipationofabonusdeclaration.Claimsarisingduring theyear includematurities, surrendersanddeathclaims.Maturityclaimsare recognisedwhendue forpayment.Surrendersarerecognisedwhenpaidoratanearlierdateonwhich,followingnotification,thepolicyceasestobeincludedwithinthecalculationoftherelatedinsuranceliabilities.Deathclaimsarerecognisedwhennotified.
Reinsurancerecoveriesareaccountedforinthesameperiodastherelatedclaims.
iiiLiabilitiesunderinsurancecontracts
Liabilitiesundernon-linkedlifeinsurancecontractsarecalculatedbasedonactuarialprinciples.
Liabilitiesunderunit-linkedlifeinsurancecontractsareatleastequivalenttothesurrenderortransfervaluewhichiscalculatedbyreferencetothevalueoftherelevantunderlyingfundsorindices.
Aliabilityadequacytestiscarriedoutoninsuranceliabilitiestoensurethatthecarryingamountoftheliabilitiesissufficientinthelightofcurrentestimatesoffuturecashflows.Whenperformingtheliabilityadequacytest,allcontractualcashflowsarediscountedandcomparedagainstthecarryingvalueoftheliability.Whereashortfallisidentifieditischargedimmediatelytoprofitorloss.
43
3 Significant accounting policies (continued)
i Insuranceandinvestmentcontracts(continued)
ivPresentvalueofin-forcelong-terminsurancebusiness
Thevalueplacedoninsurancecontractsthatareclassifiedaslong-terminsurancebusiness,andareinforceatthereportingdateisrecognisedasanasset.
The present value of in-force long-term insurance business is determined by discounting future cash flowsexpected to emerge frombusiness currently in force,usingappropriate assumptions in assessing factors suchas futuremortality, lapse rates and levels of expenses and a risk discount rate that reflects the risk premiumattributabletotherespectivelong-terminsurancebusiness.Movementsinthepresentvalueofin-forcelong-terminsurancebusinessareincludedinNetotheroperatingincomeonagrossoftaxbasis.
v Investmentcontracts
Investmentcontractsarethosecontractswherethereisnosignificantinsurancerisk.
Customerliabilitiesunderunit-linkedinvestmentcontractsandthelinkedfinancialassetsaredesignatedatfairvaluethroughprofitorloss,andthemovementsinfairvaluearerecognisedinprofitorlossinNetincomefrominsurancefinancialinstrumentsdesignatedatfairvaluethroughprofitorloss.
Premiumsreceivableandamountswithdrawnareaccountedforasincreases/decreasesintheliabilityrecordedinrespectofinvestmentcontracts.
Liabilitiesunderunit-linkedinvestmentcontractsareatleastequivalenttothesurrenderortransfervaluewhichiscalculatedbyreferencetothevalueoftherelevantunderlyingfundsorindices.
InvestmentmanagementfeesreceivablearerecognisedinprofitorlossovertheperiodoftheprovisionoftheinvestmentmanagementservicesinNetfeeandcommissionincome.
The incremental costs directly related to the acquisition of new investment contracts or renewal of existinginvestmentcontractsaredeferredandamortisedovertheperiodoftheprovisionoftheinvestmentmanagementservices.
j Provisions
Provisionsarerecognisedwhenitisprobablethatanoutflowofeconomicbenefitswillberequiredtosettleacurrentlegalorconstructiveobligationasaresultofpastevents,andareliableestimatecanbemadeoftheamountoftheobligation.Iftheeffectismaterial,provisionsaredeterminedbydiscountingtheexpectedfuturecashflowsatapre-taxratethatreflectscurrentmarketassessmentsofthetimevalueofmoneyand,whereappropriate,therisksspecifictotheliability.
Restructuring
Aprovisionforrestructuringisrecognisedwhenthegrouphasapprovedadetailedandformalrestructuringplanandtherestructuringeitherhascommencedorhasbeenannouncedpublicly.Futureoperatinglossesarenotprovidedfor.
k Financialguaranteecontracts
Financialguaranteesarecontractsthatrequirethegrouptomakespecifiedpaymentstoreimbursetheholderforalossitincursbecauseaspecifieddebtorfailstomakepaymentwhendueinaccordancewiththetermsofadebtinstrument.
Financialguaranteeliabilitiesareinitiallyrecognisedattheirfairvalue,andtheinitialfairvalueisamortisedoverthe life of the financial guarantee.The financial guarantee liability is subsequently carried at the higher of thisamortisedamountandthepresentvalueofanyexpectedpaymentwhenapaymentundertheguaranteehasbecomeprobable.Financialguaranteesareincludedwithincustomeraccounts.
l Interestincomeandexpense
Interestincomeandexpenseforallinterest-bearingfinancialinstrumentsexceptthoseclassifiedasheldfortradingordesignatedatfairvaluethroughprofitorlossarerecognisedinInterestreceivableandInterestpayableinprofitorlossusingtheeffectiveinterestmethod.Theeffectiveinterestmethodisawayofcalculatingtheamortisedcostofafinancialassetorafinancialliability(orgroupsoffinancialassetsorfinancialliabilities)andofallocatingtheInterestreceivableorInterestpayableovertherelevantperiod.
Notes on the Financial Statements (continued)
44
H S B C B A N K M A L T A P . L . C .
3 Significant accounting policies (continued)
l Interestincomeandexpense(continued)
Thecalculationoftheeffectiveinterestrateincludesallfeespaidorreceived,transactioncosts,anddiscountsorpremiumsthatareanintegralpartoftheeffectiveinterestrate.Transactioncostsareincrementalcoststhataredirectlyattributabletotheacquisition,issueordisposalofafinancialassetorliability.
Interestonimpairedfinancialassetsisrecognisedusingtheoriginaleffectiveinterestrate.
m Non-interestincome
i Netfeeandcommissionincome
Feeincomeisrecognisedasfollows:
– ontheexecutionofasignificantactwhenthesignificantacthasbeencompleted;and
– astheservicesareprovidedexceptwherethefeeischargedtocoverthecostofacontinuingserviceto,orriskbornefor,thecustomer,orisinterestinnature.Inthesecases,thefeeisrecognisedonanappropriatebasisovertherelevantperiod.
IncomewhichformsanintegralpartoftheeffectiveinterestrateofafinancialinstrumentisrecognisedasanadjustmenttotheeffectiveinterestrateandrecordedinNetinterestincome.
Otherfeeandcommissionexpense,whichrelatesmainlytotransactionandservicefeesareexpensedastheservicesarereceived.
ii Dividendincome
Dividendincomeisrecognisedonthedatetheentity’srighttoreceiveincomeisestablishedwhichinthecaseofquotedsecuritiesisusuallytheex-dividenddate.
iiiNetincomefrominsurancefinancialinstrumentsdesignatedatfairvalue
Netincomefromfinancialinstrumentsdesignatedatfairvalueincludes:
– allgainsandlossesfromchangesinthefairvalueoffinancialassetsandfinancialliabilitiesdesignatedatfairvaluethroughprofitorloss;and
– interestincomeandexpenseanddividendincomearisingonthesefinancialinstruments.
n Employeebenefits
i Definedcontributionplan
Thegroupcontributes towards theStatepensiondefinedcontributionplan inaccordancewith local legislationandtowhichithasnocommitmentbeyondthepaymentoffixedcontributions.Obligationsforcontributionsarerecognisedasanemployeebenefitinprofitorlossintheperiodsduringwhichservicesarerenderedbyemployees.
ii Terminationbenefits
Terminationbenefitsarerecognisedasanexpensewhenthegroupisdemonstrablycommitted,withoutrealisticpossibilityofwithdrawal,toaformaldetailedplantoeitherterminateemploymentbeforethenormalretirementdate, or to provide termination benefits as a result of an offer made to encourage voluntary redundancy.Terminationbenefits forvoluntary redundanciesare recognisedasanexpense if thegrouphasmadeanofferencouragingvoluntaryredundancy,itisprobablethattheofferwillbeaccepted,andthenumberofacceptancescanbeestimated reliably. Ifbenefits arepayablemore than12monthsafter the reportingdate, then theyarediscountedtotheirpresentvalue.
iiiShare-basedpaymenttransactions
Share-basedpaymentarrangements inwhich thegroup receivesgoodsor servicesasconsideration for equityinstrumentsintheultimateparentcompanyareaccountedforasequity-settledshare-basedpaymenttransactions.
Thegrantdate fairvalueof share-basedpaymentawardsgranted toemployees is recognisedasanemployeeexpense,withacorresponding increase inequity,over theperiod that theemployeesunconditionallybecomeentitledtotheawards.Theamountrecognisedasanexpenseisadjustedtoreflectthenumberofawardsforwhichtherelatedserviceandnon-marketvestingconditionsareexpectedtobemet,suchthat theamountultimatelyrecognised as an expense is basedon thenumberof awards that domeet the related service andnon-marketperformanceconditionsatthevestingdate.
45
3 Significant accounting policies (continued)
o Foreigncurrencies
Transactionsinforeigncurrenciesarerecordedinthefunctionalcurrencyatthespotrateofexchangeprevailingonthedateoftransaction.Monetaryassetsandliabilitiesdenominatedinforeigncurrenciesaretranslatedintothefunctionalcurrencyattherateofexchangerulingatthereportingdate.Non-monetaryassetsandliabilitiesthataremeasuredatfairvalueinaforeigncurrencyaretranslatedintothefunctionalcurrencyusingtherateofexchangeatthedatethefairvaluewasdetermined.Non-monetaryassetsandliabilitiesthataremeasuredintermsofhistoricalcostinaforeigncurrencyaretranslatedusingtheexchangerateatthedateofthetransaction.Foreigncurrencydifferencesarisingonretranslationarerecognisedinprofitorlossexceptfordifferencesarisingonretranslationofavailable-for-saleequityinstruments,whicharerecogniseddirectlyinequity.
p Incometax
Incometaxexpensecomprisescurrentanddeferredtaxwhicharerecognisedinprofitorlossexcepttotheextentthatitrelatestoitemsrecogniseddirectlyinequityorinothercomprehensiveincome.
Currenttaxistheexpectedtaxpayableonthetaxableincomefortheyear,usingtaxratesenactedorsubstantivelyenactedatthereportingdate,andanyadjustmenttotaxpayableinrespectofpreviousyears.
Deferredtaxisrecognisedinrespectoftemporarydifferencesbetweenthecarryingamountsofassetsandliabilitiesforfinancialreportingpurposesandtheamountsusedfortaxationpurposes.Deferredtaxismeasuredatthetaxratesthatareexpectedtobeappliedtotemporarydifferenceswhentheyreverse,basedonthelawsthathavebeenenactedorsubstantivelyenactedbythereportingdate.
Adeferredtaxassetisrecognisedforunusedtaxlossesanddeductibletemporarydifferences,totheextentthatitisprobablethatfuturetaxableprofitswillbeavailableagainstwhichtheycanbeutilised.Deferredtaxassetsarereviewedateachreportingdateandarereducedtotheextentthatitisnolongerprobablethattherelatedtaxbenefitwillberealised.
q Operatingsegments
Thegroup’soperatingsegmentsareorganisedintothreecustomergroups,RetailBankingandWealthManagement(RBWM),CommercialBanking(CMB)andGlobalBankingandMarkets(GBM).Thegroup’schiefdecisionmakerregularly reviewsoperating activityby customergroup.Thegroup’soperating segmentsweredetermined tobecustomergroupsbecausethechiefdecisionmakerusesinformationoncustomergroupsegmentsinordertomakedecisionsaboutresourceallocationandassessingperformanceassessment.Thegroup’schiefdecisionmakeristheExecutivecommittee.
Measurement of segment assets, liabilities, income and expenses is based on the group’s accounting policies.Segment incomeandexpenses include transfersbetweensegments.Sharedcostsare included insegmenton thebasisoftheactualrechargesmade.
r Newstandardsandinterpretationsnotadopted
Anumberofnewstandards,amendmentstostandardsandinterpretationsareeffectiveforannualperiodsbeginningafter1January2011,andhavenotbeenappliedinpreparingthesefinancialstatements.Noneoftheseisexpectedtohaveasignificanteffectonthesefinancialstatements.
4 Financial instruments and risk management
a Useoffinancialinstruments
Thenatureof thegroup’scorebankingoperations implies that financial instrumentsareextensivelyused in thecourseofitsroutinebusiness.Thegroup’sfinancialinstrumentsconsistofprimaryinstrumentsandincludecashbalanceswithbanks,loansandadvancestocustomers,securitiesandamountsduetobanksandcustomers.
Thegroupisexposedtoamixedblendofrisksandhenceoperatesariskmanagementstrategywiththeobjectiveofcontrollingandminimisingtheirimpactongroupfinancialperformanceandposition.
Theprincipalcategoriesofriskarecreditrisk,marketriskandliquidityrisk.Thesecategoriesofriskinrelationtolifeinsurancebusinessaredescribedinnote4(e)andexcludedfromgroupfiguresdisclosedinnotes4(b)to4(c).
Notes on the Financial Statements (continued)
46
H S B C B A N K M A L T A P . L . C .
4 Financial instruments and risk management (continued)
b Creditrisk
i Creditriskmanagement
Creditriskistheriskoffinanciallossifacustomerorcounterpartyfailstomeetanobligationunderacontract.It arises principally from lending, trade finance and treasury business. It also arises when issuers of debtsecurities are downgraded and as a result the value of group's holdings of these assets fall. The group hasstandards,policiesandproceduresdedicatedtocontrolandmonitortheriskarisingfromallsuchactivities.
Within the overall framework of the group policy, the group has an established risk management processencompassing credit approvals, the control of exposures, credit policy direction to business units and themonitoringandreportingofexposuresbothonanindividualandaportfoliobasiswhichincludesthemanagementofadversetrends.Managementisresponsibleforthequalityofitscreditportfoliosandfollowsacreditprocessinvolvingdelegatedapprovalauthoritiesandcreditprocedures,theobjectiveofwhichistobuildandmaintainriskassetsofhighquality.Regularreviewsareundertakentoassessandevaluatelevelsofriskconcentrationsbymarketsectorandproduct.
Specialattentionispaidtoproblemloans.Specialistunitsareestablishedbythegrouptoprovidecustomerswithsupportinordertohelpthemavoiddefaultwhereverpossible.
a Collateralandothercreditenhancements
Collateralcanbeanimportantmitigantofcreditrisk.Nevertheless,itisgroup’spolicytoestablishthatloansarewithinthecustomer’scapacitytorepayratherthantooverrelyonsecurity.Incertaincases,dependingonthecustomer’sstandingandthetypeofproduct,facilitiesmaybeunsecured.
Thegroupisrequiredtoimplementguidelinesontheacceptabilityofspecificclassesofcollateralorcreditriskmitigation,anddeterminesuitablevaluationparameters.Suchparametersareexpectedtobeconservative,reviewedregularlyandsupportedbyempiricalevidence.Securitystructuresandlegalcovenantsarerequiredtobesubjecttoregularreviewtoensurethattheycontinuetofulfiltheirintendedpurposeandremaininlinewithlocalmarketpractice.
Atthereportingdatetheprincipaltypeofcollateralheldconsistedofimmovableproperties.Collateralheldassecurityforfinancialassetsotherthanloansandadvancesisdeterminedbythenatureoftheinstrument.Financialinvestmentsaregenerallyunsecured.
b Creditqualityofloansandadvances
Group’scredit risk ratingprocessesaredesigned tohighlightexposureswhich requireclosermanagementattentionbecauseoftheirgreaterprobabilityofdefaultandpotentialloss.Riskratingsarereviewedregularlyand amendments, where necessary, are implemented promptly. The credit quality of unimpaired loans isassessedbyreferencetotheGroup’sstandardcreditratingsystem.
ii Creditexposure
Thegroup’smaximumexposure to credit riskon financial instruments,whether recognisedorunrecognised,before taking account of any collateral held or other credit enhancements can be classified in the followingcategories:
– RecognisedfinancialassetscompriseBalanceswithCentralBankofMalta,TreasuryBillsandcash,Chequesincourseofcollection,Financialassetsatfairvaluethroughprofitorloss,Financialinvestments,loansandadvancesandacceptancesandendorsements.Themaximumexposureofthesefinancialassetstocreditrisk,equalstheircarryingamount.
– Financialguaranteesgranted.Themaximumexposuretocreditriskisthefullamountthatthegroupwouldhavetopayiftheguaranteesarecalledupon.
– Loancommitmentsandothercreditrelatedcommitmentsthatareirrevocableoverthelifeoftherespectivefacilities.Themaximumexposuretocreditriskisthefullamountofthecommittedfacilities.
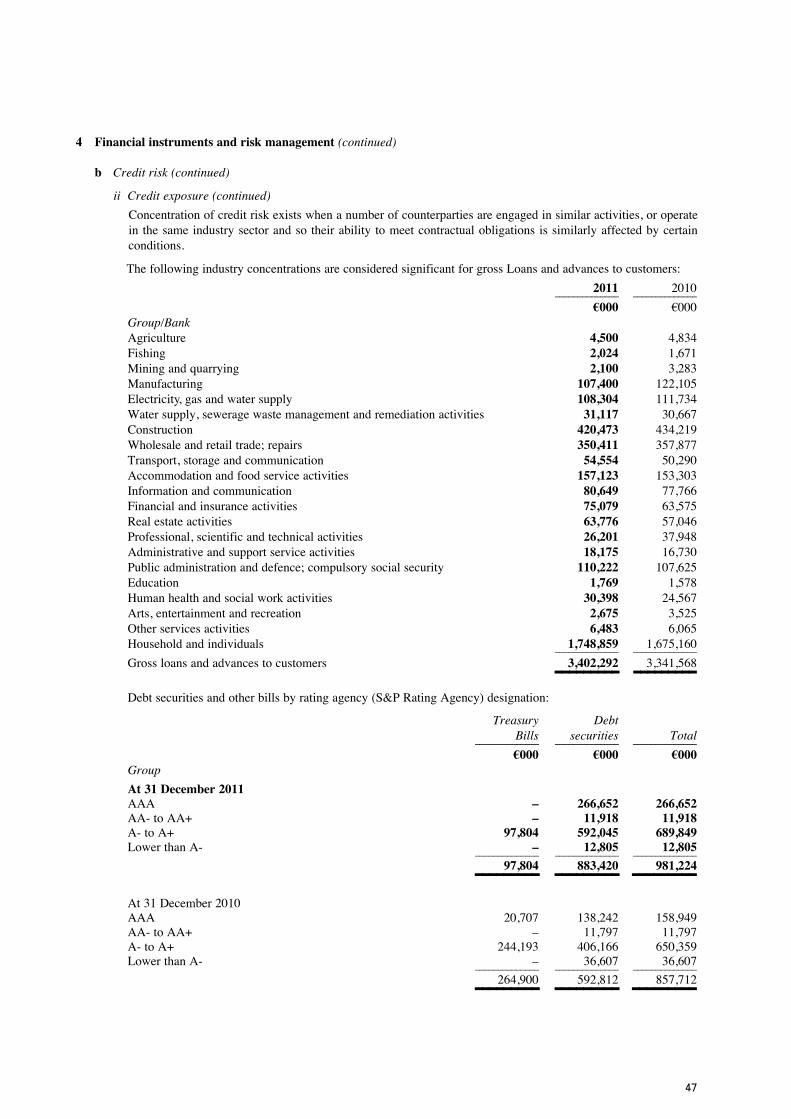
47
4 Financial instruments and risk management (continued)
b Creditrisk(continued)
ii Creditexposure(continued)
Concentrationofcreditriskexistswhenanumberofcounterpartiesareengagedinsimilaractivities,oroperatein thesameindustrysectorandsotheirability tomeetcontractualobligations issimilarlyaffectedbycertainconditions.
ThefollowingindustryconcentrationsareconsideredsignificantforgrossLoansandadvancestocustomers:
2011 2010 ______________ ______________
§000 §000Group/BankAgriculture 4,500 4,834Fishing 2,024 1,671Miningandquarrying 2,100 3,283Manufacturing 107,400 122,105Electricity,gasandwatersupply 108,304 111,734Watersupply,seweragewastemanagementandremediationactivities 31,117 30,667Construction 420,473 434,219Wholesaleandretailtrade;repairs 350,411 357,877Transport,storageandcommunication 54,554 50,290Accommodationandfoodserviceactivities 157,123 153,303Informationandcommunication 80,649 77,766Financialandinsuranceactivities 75,079 63,575Realestateactivities 63,776 57,046Professional,scientificandtechnicalactivities 26,201 37,948Administrativeandsupportserviceactivities 18,175 16,730Publicadministrationanddefence;compulsorysocialsecurity 110,222 107,625Education 1,769 1,578Humanhealthandsocialworkactivities 30,398 24,567Arts,entertainmentandrecreation 2,675 3,525Otherservicesactivities 6,483 6,065Householdandindividuals 1,748,859 1,675,160 ______________ ______________
Grossloansandadvancestocustomers 3,402,292 3,341,568 _________ _________Debtsecuritiesandotherbillsbyratingagency(S&PRatingAgency)designation:
Treasury Debt Bills securities Total ______________ ______________ ______________
§000 §000 §000Group
At 31 December 2011AAA – 266,652 266,652AA-toAA+ – 11,918 11,918A-toA+ 97,804 592,045 689,849LowerthanA- – 12,805 12,805 ______________ ______________ ______________ 97,804 883,420 981,224 _________ _________ _________At31December2010AAA 20,707 138,242 158,949AA-toAA+ – 11,797 11,797A-toA+ 244,193 406,166 650,359LowerthanA- – 36,607 36,607 ______________ ______________ ______________ 264,900 592,812 857,712 _________ _________ _________
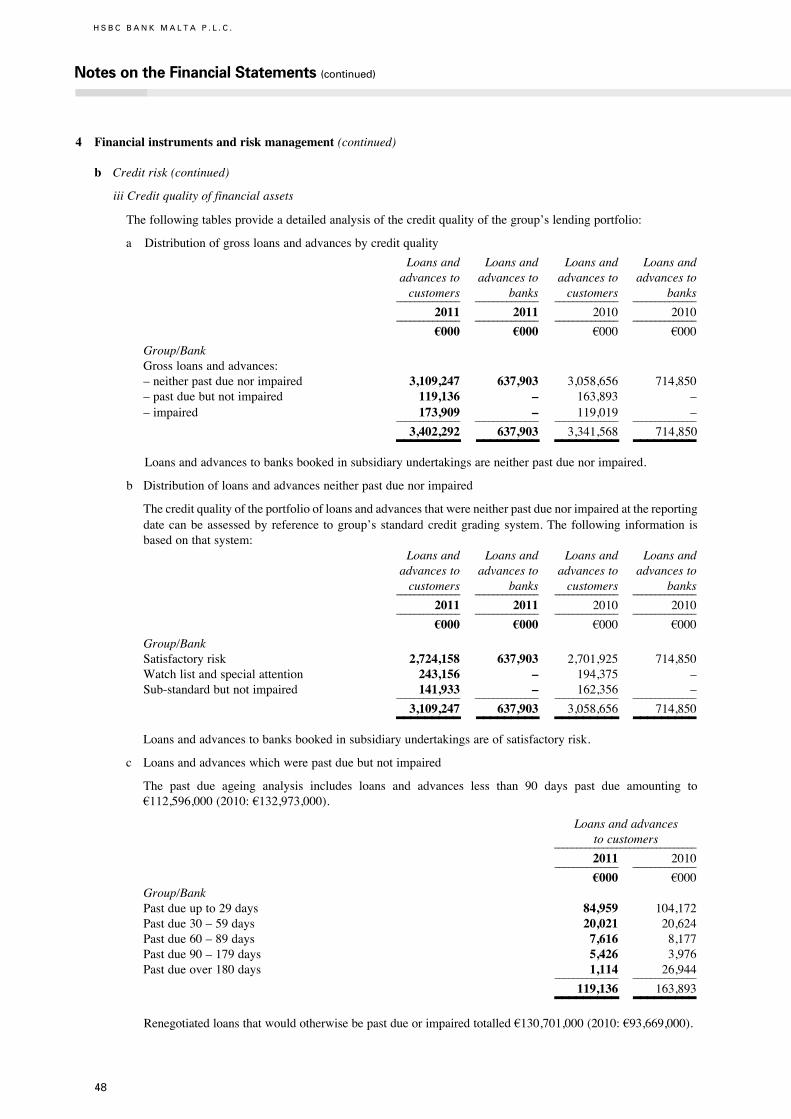
Notes on the Financial Statements (continued)
48
H S B C B A N K M A L T A P . L . C .
4 Financial instruments and risk management (continued)
b Creditrisk(continued)
iiiCreditqualityoffinancialassets
Thefollowingtablesprovideadetailedanalysisofthecreditqualityofthegroup’slendingportfolio:
a Distributionofgrossloansandadvancesbycreditquality
Loansand Loansand Loansand Loansand advancesto advancesto advancesto advancesto customers banks customers banks ______________ ______________ ______________ ______________
2011 2011 2010 2010 ______________ ______________ ______________ ______________
§000 §000 §000 §000
Group/Bank Grossloansandadvances:–neitherpastduenorimpaired 3,109,247 637,903 3,058,656 714,850–pastduebutnotimpaired 119,136 – 163,893 ––impaired 173,909 – 119,019 – ______________ ______________ ______________ ______________
3,402,292 637,903 3,341,568 714,850 _________ _________ _________ _________ Loansandadvancestobanksbookedinsubsidiaryundertakingsareneitherpastduenorimpaired.
b Distributionofloansandadvancesneitherpastduenorimpaired
Thecreditqualityoftheportfolioofloansandadvancesthatwereneitherpastduenorimpairedatthereportingdatecanbeassessedby reference togroup’sstandardcreditgradingsystem.The following information isbasedonthatsystem:
Loansand Loansand Loansand Loansand advancesto advancesto advancesto advancesto customers banks customers banks ______________ ______________ ______________ ______________
2011 2011 2010 2010 ______________ ______________ ______________ ______________
§000 §000 §000 §000
Group/BankSatisfactoryrisk 2,724,158 637,903 2,701,925 714,850Watchlistandspecialattention 243,156 – 194,375 –Sub-standardbutnotimpaired 141,933 – 162,356 – ______________ ______________ ______________ ______________
3,109,247 637,903 3,058,656 714,850 _________ _________ _________ _________ Loansandadvancestobanksbookedinsubsidiaryundertakingsareofsatisfactoryrisk.
c Loansandadvanceswhichwerepastduebutnotimpaired
The past due ageing analysis includes loans and advances less than 90 days past due amounting to§112,596,000(2010:§132,973,000).
Loansandadvances tocustomers ________________________________
2011 2010 ______________ ______________
§000 §000Group/Bank Pastdueupto29days 84,959 104,172Pastdue30–59days 20,021 20,624Pastdue60–89days 7,616 8,177Pastdue90–179days 5,426 3,976Pastdueover180days 1,114 26,944 ______________ ______________ 119,136 163,893 _________ _________Renegotiatedloansthatwouldotherwisebepastdueorimpairedtotalled§130,701,000(2010:§93,669,000).

49
4 Financial instruments and risk management (continued)
b Creditrisk(continued)
iiiCreditqualityoffinancialassets(continued)
d Individuallyimpairedgrossloansbysegment
Loansandadvances tocustomers ________________________________ 2011 2010 ______________ ______________
§000 §000Group/BankPersonalbanking 43,092 28,369Commercialandcorporate 123,831 83,614Other 6,986 7,036 ______________ ______________
173,909 119,019 _________ _________iv Movementinallowanceaccountsforloansandadvancestocustomers
Individually Individually assessed Collective assessed Collective allowances allowances allowances allowances ______________ ______________ ______________ ______________
2011 2011 2010 2010 ______________ ______________ ______________ ______________
§000 §000 §000 §000Group/BankChangeinallowancesforuncollectability:At1January 38,365 12,768 32,529 12,425Additions 13,483 (168) 11,909 343Reversals (4,497) – (4,503) –Discountunwind (1,883) – (1,570) – ______________ ______________ ______________ ______________
At31December 45,468 12,600 38,365 12,768 _________ _________ _________ _________v Settlementrisk
Thegroup’sactivitiesmaygiverisetoriskatthetimeofsettlementoftransactionsandtrades.Settlementriskistheriskoflossduetofailureofacounterpartytohonouritsobligationstodelivercash,securitiesorotherassetsascontractuallyagreed.
Forcertain typesof transactions thegroupmitigates this riskbyconductingsettlements throughasettlement/clearingagenttoensurethatatradeissettledonlywhenbothpartieshavefulfilledtheircontractualsettlementobligations.
c Liquidityrisk
Liquidityriskistheriskthatthegroupdoesnothavesufficientfinancialresourcestomeetitsfinancialobligationswhentheyfalldueorwillhavetodosoatexcessivecost.Thisriskcanarisefrommismatchesintimingofcashflows.
Theobjectiveofthegroup’sliquidityandfundingmanagementistoensurethatallforeseeablefundingcommitmentsanddepositwithdrawalscanbemetwhendue.Itisthegroup’sobjectivetomaintainadiversifiedandstablefundingbasewiththeobjectiveofenablingthegrouptorespondquicklyandsmoothlytounforeseenliquidityrequirements.
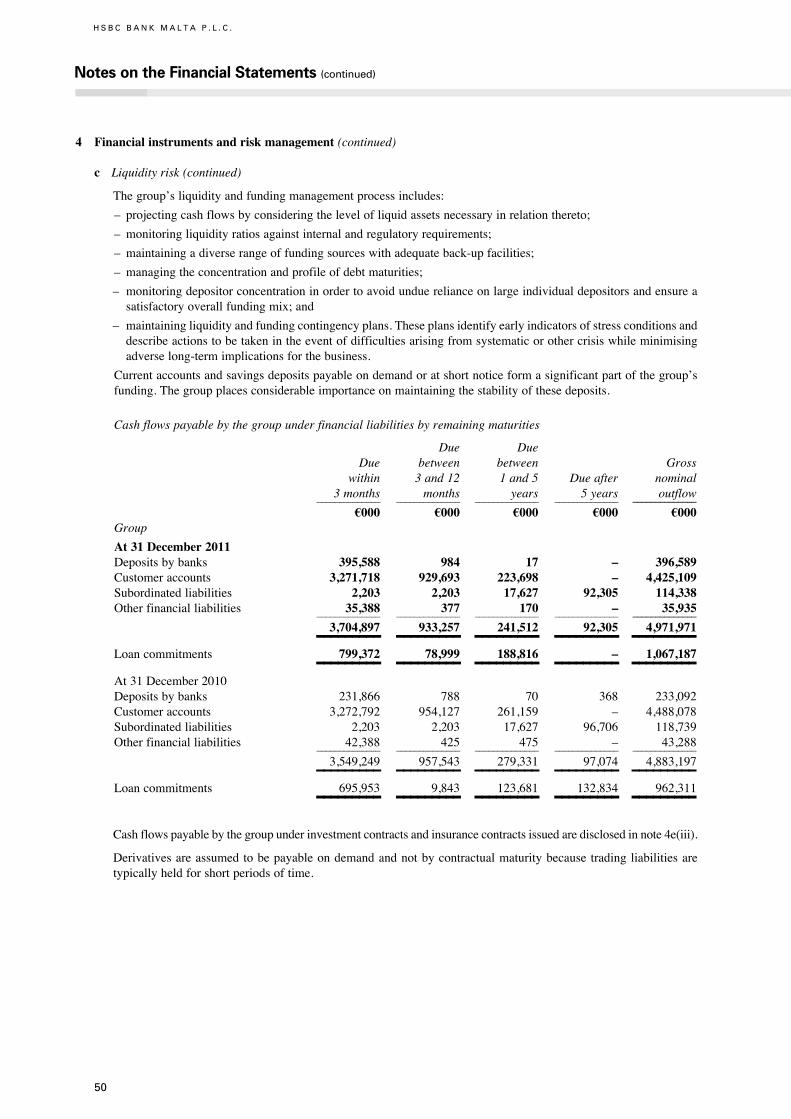
Notes on the Financial Statements (continued)
50
H S B C B A N K M A L T A P . L . C .
4 Financial instruments and risk management (continued)
c Liquidityrisk(continued)
Thegroup’sliquidityandfundingmanagementprocessincludes:
–projectingcashflowsbyconsideringthelevelofliquidassetsnecessaryinrelationthereto;
–monitoringliquidityratiosagainstinternalandregulatoryrequirements;
–maintainingadiverserangeoffundingsourceswithadequateback-upfacilities;
–managingtheconcentrationandprofileofdebtmaturities;
–monitoringdepositorconcentrationinordertoavoidunduerelianceonlargeindividualdepositorsandensureasatisfactoryoverallfundingmix;and
–maintainingliquidityandfundingcontingencyplans.Theseplansidentifyearlyindicatorsofstressconditionsanddescribeactionstobetakenintheeventofdifficultiesarisingfromsystematicorothercrisiswhileminimisingadverselong-termimplicationsforthebusiness.
Currentaccountsandsavingsdepositspayableondemandoratshortnoticeformasignificantpartofthegroup’sfunding.Thegroupplacesconsiderableimportanceonmaintainingthestabilityofthesedeposits.
Cashflowspayablebythegroupunderfinancialliabilitiesbyremainingmaturities
Due Due Due between between Gross within 3and12 1and5 Dueafter nominal 3months months years 5years outflow ______________ ______________ ______________ ______________ ______________
§000 §000 §000 §000 §000Group
At 31 December 2011Depositsbybanks 395,588 984 17 – 396,589Customeraccounts 3,271,718 929,693 223,698 – 4,425,109Subordinatedliabilities 2,203 2,203 17,627 92,305 114,338Otherfinancialliabilities 35,388 377 170 – 35,935 ______________ ______________ ______________ ______________ ______________
3,704,897 933,257 241,512 92,305 4,971,971 _________ _________ _________ _________ _________Loancommitments 799,372 78,999 188,816 – 1,067,187 _________ _________ _________ _________ _________At31December2010Depositsbybanks 231,866 788 70 368 233,092Customeraccounts 3,272,792 954,127 261,159 – 4,488,078Subordinatedliabilities 2,203 2,203 17,627 96,706 118,739Otherfinancialliabilities 42,388 425 475 – 43,288 ______________ ______________ ______________ ______________ ______________
3,549,249 957,543 279,331 97,074 4,883,197 _________ _________ _________ _________ _________Loancommitments 695,953 9,843 123,681 132,834 962,311 _________ _________ _________ _________ _________Cashflowspayablebythegroupunderinvestmentcontractsandinsurancecontractsissuedaredisclosedinnote4e(iii).
Derivativesareassumedtobepayableondemandandnotbycontractualmaturitybecausetradingliabilitiesaretypicallyheldforshortperiodsoftime.
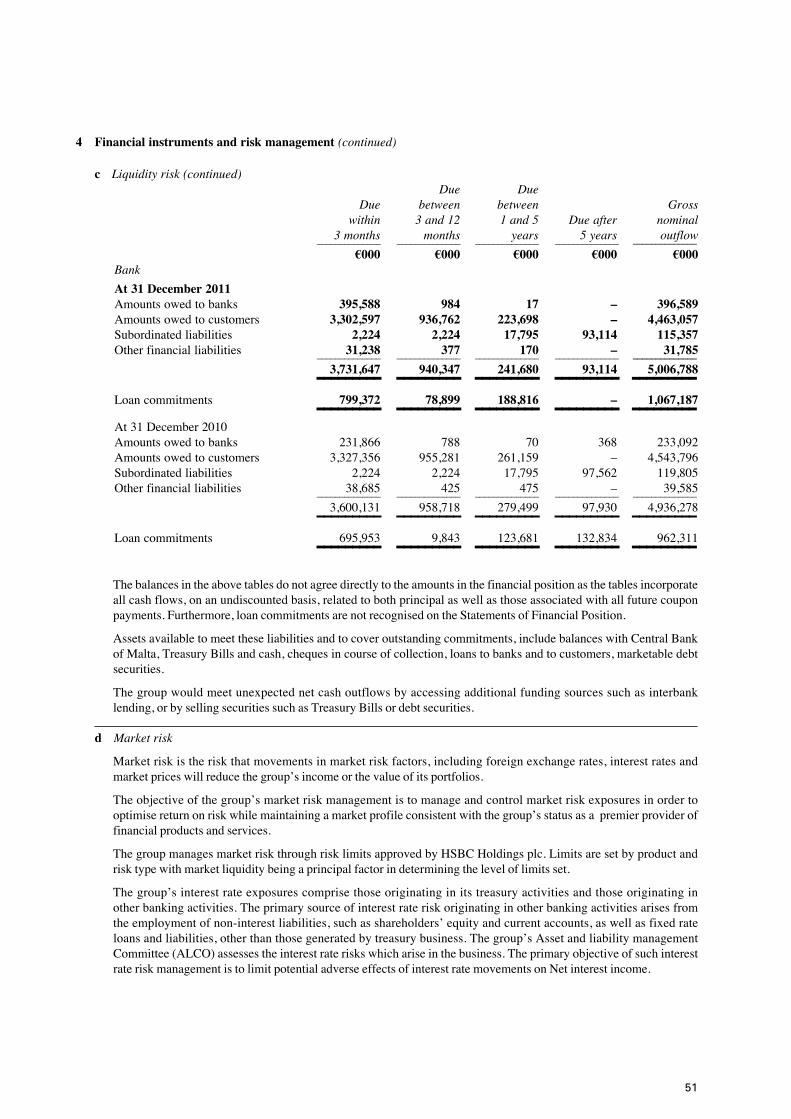
51
4 Financial instruments and risk management (continued)
c Liquidityrisk(continued) Due Due Due between between Gross within 3and12 1and5 Dueafter nominal 3months months years 5years outflow ______________ ______________ ______________ ______________ ______________
§000 §000 §000 §000 §000Bank
At 31 December 2011Amountsowedtobanks 395,588 984 17 – 396,589Amountsowedtocustomers 3,302,597 936,762 223,698 – 4,463,057Subordinatedliabilities 2,224 2,224 17,795 93,114 115,357Otherfinancialliabilities 31,238 377 170 – 31,785 ______________ ______________ ______________ ______________ ______________
3,731,647 940,347 241,680 93,114 5,006,788 _________ _________ _________ _________ _________Loancommitments 799,372 78,899 188,816 – 1,067,187 _________ _________ _________ _________ _________At31December2010Amountsowedtobanks 231,866 788 70 368 233,092Amountsowedtocustomers 3,327,356 955,281 261,159 – 4,543,796Subordinatedliabilities 2,224 2,224 17,795 97,562 119,805Otherfinancialliabilities 38,685 425 475 – 39,585 ______________ ______________ ______________ ______________ ______________
3,600,131 958,718 279,499 97,930 4,936,278 _________ _________ _________ _________ _________Loancommitments 695,953 9,843 123,681 132,834 962,311 _________ _________ _________ _________ _________Thebalancesintheabovetablesdonotagreedirectlytotheamountsinthefinancialpositionasthetablesincorporateallcashflows,onanundiscountedbasis,relatedtobothprincipalaswellasthoseassociatedwithallfuturecouponpayments.Furthermore,loancommitmentsarenotrecognisedontheStatementsofFinancialPosition.
Assetsavailabletomeettheseliabilitiesandtocoveroutstandingcommitments,includebalanceswithCentralBankofMalta,TreasuryBillsandcash,chequesincourseofcollection,loanstobanksandtocustomers,marketabledebtsecurities.
Thegroupwouldmeetunexpectednetcashoutflowsbyaccessingadditionalfundingsourcessuchasinterbanklending,orbysellingsecuritiessuchasTreasuryBillsordebtsecurities.
d Marketrisk
Marketriskistheriskthatmovementsinmarketriskfactors,includingforeignexchangerates,interestratesandmarketpriceswillreducethegroup’sincomeorthevalueofitsportfolios.
Theobjectiveofthegroup’smarketriskmanagementistomanageandcontrolmarketriskexposuresinordertooptimisereturnonriskwhilemaintainingamarketprofileconsistentwiththegroup’sstatusasapremierprovideroffinancialproductsandservices.
ThegroupmanagesmarketriskthroughrisklimitsapprovedbyHSBCHoldingsplc.Limitsaresetbyproductandrisktypewithmarketliquiditybeingaprincipalfactorindeterminingtheleveloflimitsset.
Thegroup’sinterestrateexposurescomprisethoseoriginatinginitstreasuryactivitiesandthoseoriginatinginotherbankingactivities.Theprimarysourceofinterestrateriskoriginatinginotherbankingactivitiesarisesfromtheemploymentofnon-interestliabilities,suchasshareholders’equityandcurrentaccounts,aswellasfixedrateloansandliabilities,otherthanthosegeneratedbytreasurybusiness.Thegroup’sAssetandliabilitymanagementCommittee(ALCO)assessestheinterestrateriskswhichariseinthebusiness.TheprimaryobjectiveofsuchinterestrateriskmanagementistolimitpotentialadverseeffectsofinterestratemovementsonNetinterestincome.
Notes on the Financial Statements (continued)
52
H S B C B A N K M A L T A P . L . C .
4 Financial instruments and risk management (continued)
d Marketrisk(continued) i Fairvalueandpriceverificationcontrol
Wherecertainfinancialinstrumentsaremeasuredatfairvalue,thevaluationandtherelatedpriceverificationprocesses are subject to independent validations. The determination of fair values is therefore a significantelementinthereportingofthegroup’sglobalmarketactivities.
Certainofthegroup’sfinancialassetsandliabilitiesarecarriedatcostoramortisedcostandnotatfairvalue.
a Investments–Equityandothernon-fixedincomeinstrumentsavailable-for-sale
Certainunlistedequity investmentsarecarriedatcostandamount to§354,000(2010:§354,000).There isnomarket for these investmentsandno recent transactions thatprovideevidenceof thecurrent fairvalue.Discountedcashflowtechniquesdonotprovideareliablemeasureofthefairvalueoftheseinvestments.
b Loansandadvancestobanksandcustomers
Thiscategoryofassetisreportednetofimpairmentallowancestoreflecttheestimatedrecoverableamounts.Asat31December2011thegroup’scarryingamountwas§3,982,180,000(2010:§4,005,336,000),andthebank’scarryingamountwas§3,982,127,000(2010:§4,005,285,000)
Theloansandadvancestocustomerscategoryofassetamountsto§3,344,224,000(2010:§3,290,435,000).This carrying value approximates to fair value in the case of loans which are repriceable at the group’sdiscretion.Theseloansconstituteasignificantelementofthetotalloanportfolio.
Theloansandadvancestobankscategoryofassetamountsto§637,956,000(2010:§714,901,0000)forthegroupand§637,903,000(2010:§714,850,000) for thebank.For loansandadvances tobankswithin the‘lessthanoneyear’maturityband,fairvalueistakentobetheamountcarriedatthereportingdate.Asat31December2011,86%ofloansandadvancestobankshadacontractualrepricingwithinthe‘lessthanthreemonths’band.Interestratesontheseloansandadvancesreflectcurrentmarketrates,andthereforethecarryingamountapproximatestofairvalue.
c Non-currentassetsheldforsale
Assetsacquiredinsatisfactionofdebtamountingto§11,108,000asat31December2011(2010:§7,662,000)consistmainlyofrepossessedimmovablepropertymeasuredatthelowerofcostandtheirforced-salevalue.
d Amountsowedtobanksandcustomers
Thiscategoryofliabilityiscarriedatamortisedcostandasat31December2011amountsto§4,792,145,000(2010: §4,695,651,000) for the group and §4,829,816,000 (2010: §4,750,553,000) for the bank. Of thisliability, 65% has contractual repricing with the ‘less than three months’ band, 10% reprices within the‘betweenthreemonthsandoneyear’bandwhilst25%repriceswithinthe‘betweenoneyearandfiveyears’band.Fordemanddepositsanddepositsmaturingwithinoneyear,fairvalueistakentobetheamountpayableondemandatthereportingdate.
e Subordinatedliabilities
This category of liability is carried at amortised cost. Fair value based on quoted market prices at thereportingdatewithoutdeductionfortransactioncostsamountsto§90,788,000asat31December2011(2010:§91,631,000).
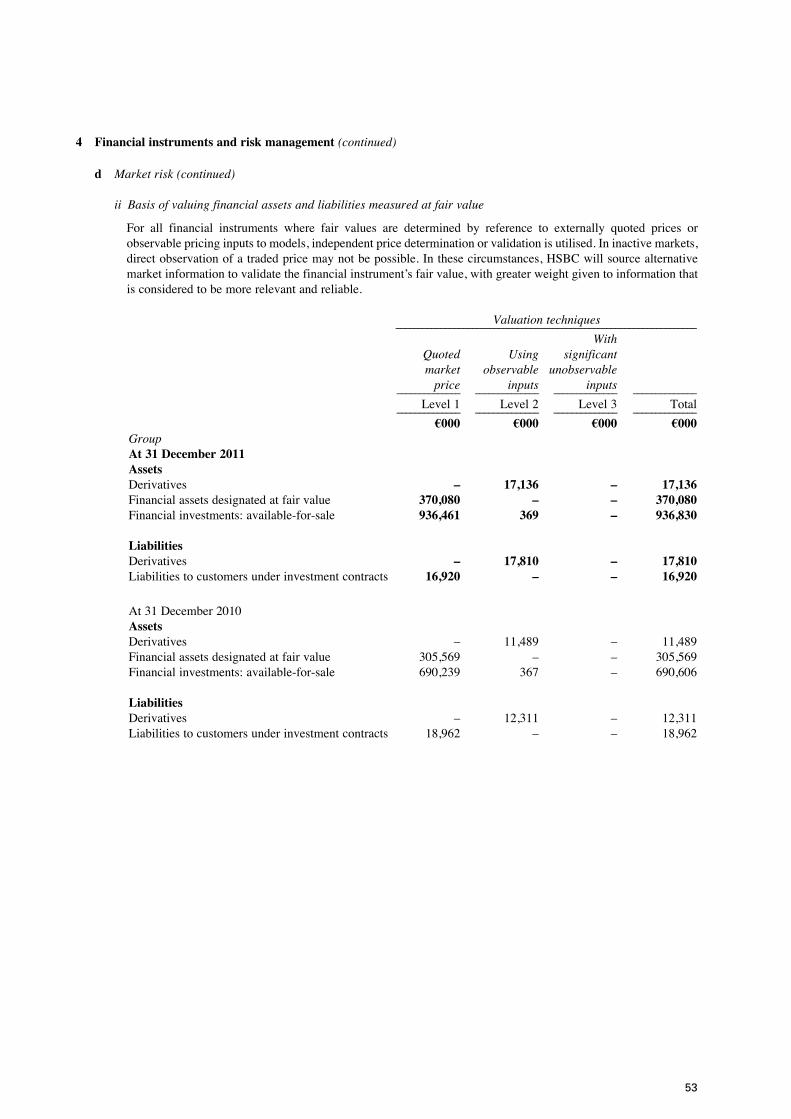
53
4 Financial instruments and risk management (continued)
d Marketrisk(continued) ii Basisofvaluingfinancialassetsandliabilitiesmeasuredatfairvalue
For all financial instruments where fair values are determined by reference to externally quoted prices orobservablepricinginputstomodels,independentpricedeterminationorvalidationisutilised.Ininactivemarkets,directobservationofatradedpricemaynotbepossible.Inthesecircumstances,HSBCwillsourcealternativemarketinformationtovalidatethefinancialinstrument’sfairvalue,withgreaterweightgiventoinformationthatisconsideredtobemorerelevantandreliable.
Valuationtechniques ___________________________________________________________________
With Quoted Using significant
market observable unobservable price inputs inputs ______________ ______________ ______________ ______________
Level1 Level2 Level3 Total ______________ ______________ ______________ ______________
§000 §000 §000 §000GroupAt 31 December 2011AssetsDerivatives – 17,136 – 17,136Financialassetsdesignatedatfairvalue 370,080 – – 370,080Financialinvestments:available-for-sale 936,461 369 – 936,830
LiabilitiesDerivatives – 17,810 – 17,810Liabilitiestocustomersunderinvestmentcontracts 16,920 – – 16,920
At31December2010AssetsDerivatives – 11,489 – 11,489Financialassetsdesignatedatfairvalue 305,569 – – 305,569Financialinvestments:available-for-sale 690,239 367 – 690,606
LiabilitiesDerivatives – 12,311 – 12,311Liabilitiestocustomersunderinvestmentcontracts 18,962 – – 18,962
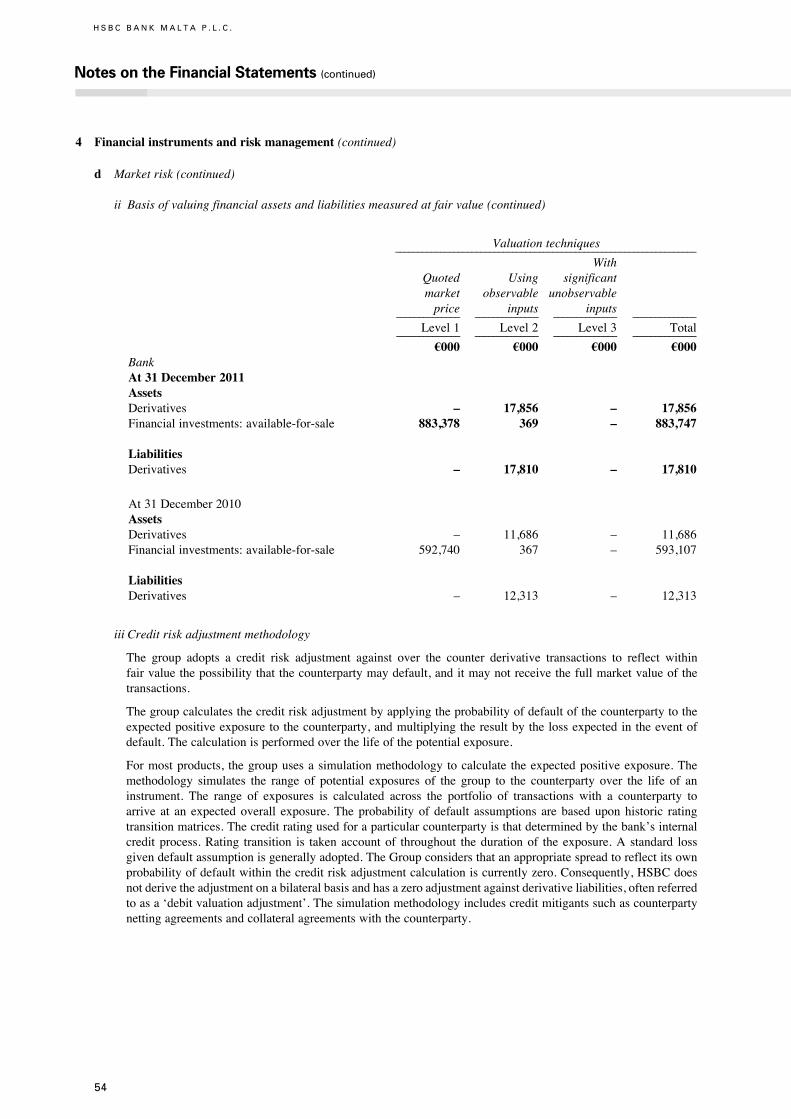
Notes on the Financial Statements (continued)
54
H S B C B A N K M A L T A P . L . C .
4 Financial instruments and risk management (continued)
d Marketrisk(continued) ii Basisofvaluingfinancialassetsandliabilitiesmeasuredatfairvalue(continued)
Valuationtechniques ___________________________________________________________________
With Quoted Using significant
market observable unobservable price inputs inputs ______________ ______________ ______________ ______________
Level1 Level2 Level3 Total ______________ ______________ ______________ ______________
§000 §000 §000 §000BankAt 31 December 2011AssetsDerivatives – 17,856 – 17,856Financialinvestments:available-for-sale 883,378 369 – 883,747
LiabilitiesDerivatives – 17,810 – 17,810
At31December2010AssetsDerivatives – 11,686 – 11,686Financialinvestments:available-for-sale 592,740 367 – 593,107
LiabilitiesDerivatives – 12,313 – 12,313
iiiCreditriskadjustmentmethodology
The group adopts a credit risk adjustment against over the counter derivative transactions to reflect withinfairvaluethepossibilitythatthecounterpartymaydefault,anditmaynotreceivethefullmarketvalueofthetransactions.
Thegroupcalculatesthecreditriskadjustmentbyapplyingtheprobabilityofdefaultofthecounterpartytotheexpectedpositiveexposuretothecounterparty,andmultiplyingtheresultbythelossexpectedintheeventofdefault.Thecalculationisperformedoverthelifeofthepotentialexposure.
Formostproducts, thegroupusesasimulationmethodology tocalculate theexpectedpositiveexposure.Themethodology simulates the range of potential exposures of the group to the counterparty over the life of aninstrument. The range of exposures is calculated across the portfolio of transactions with a counterparty toarrive at an expected overall exposure.The probability of default assumptions are based uponhistoric ratingtransitionmatrices.Thecreditratingusedforaparticularcounterpartyisthatdeterminedbythebank’sinternalcredit process.Rating transition is taken accountof throughout thedurationof the exposure.A standard lossgivendefaultassumptionisgenerallyadopted.TheGroupconsidersthatanappropriatespreadtoreflectitsownprobabilityofdefaultwithinthecreditriskadjustmentcalculationiscurrentlyzero.Consequently,HSBCdoesnotderivetheadjustmentonabilateralbasisandhasazeroadjustmentagainstderivativeliabilities,oftenreferredtoasa‘debitvaluationadjustment’.Thesimulationmethodologyincludescreditmitigantssuchascounterpartynettingagreementsandcollateralagreementswiththecounterparty.

55
4 Financial instruments and risk management (continued)
d Marketrisk(continued) ivValueatrisk(VAR)
One of the principal tools used by the group tomonitor and limitmarket risk exposure is VAR.VAR is atechniquethatestimatespotentiallossesthatcouldoccuronriskpositionsasaresultofmovementsinmarketratesandpricesoveraspecifiedtimehorizonandtoagivenlevelofconfidence.
TheVARmodelsusedbythegrouparepredominantlybasedonhistoricalsimulation.Thehistoricalsimulationmodels derive plausible future scenarios from historical market rate time series, taking account of inter-relationshipsbetweendifferentmarketsandrates,forexample,betweeninterestratesandforeignexchangerates.
Thehistoricalsimulationmodelsusedbythegroupincorporatethefollowingfeatures:
– potentialmarketmovementsarecalculatedwithreferencetodatafromthelasttwoyears;
– historicalmarketratesandpricesarecalculatedwithreferencetoforeignexchangeratesandcommodity prices,interestrates,equitypricesandtheassociatedvolatilities;
– VARiscalculatedtoa99.0percentconfidencelevel;and
– VARiscalculatedforaone-dayholdingperiod.
Althoughavaluableguidetorisk,VARshouldalwaysbeviewedinthecontextofitslimitations,forexample:
– the use of historical data as a proxy for estimating future events may not encompass all potential events,particularlythosewhichareextremeinnature;
– theuseofaone-dayholdingperiodassumesthatallpositionscanbeliquidatedorhedgedinoneday.This maynotfullyreflectthemarketriskarisingattimesofsevereilliquidity,whenaone-dayholdingperiodmay beinsufficienttoliquidateorhedgeallpositionsfully;
– theuseofa99.0percentconfidencelevel,bydefinition,doesnottakeintoaccountlossesthatmightoccur beyondthislevelofconfidence;and
– VAR is calculated on the basis of exposures outstanding at the close of business and therefore does not necessarilyreflectintra-dayexposures.
Thegrouprecognises these limitationsbyaugmenting itsVARlimitswithotherpositionandsensitivity limitstructures.
TheVARforthegroupwasasfollows: 2011 2010 ______________ ______________
§000 §000
At31December 2,367 1,074Average 1,827 1,082Minimum 1,056 825Maximum 2,480 1,610
ThemajorcauseoftheincreaseinVARasat31December2011incomparisonwith31December2010wasanincreaseintheinvestmentportfolioaspartoftheassetandliabilitymanagementstrategy.
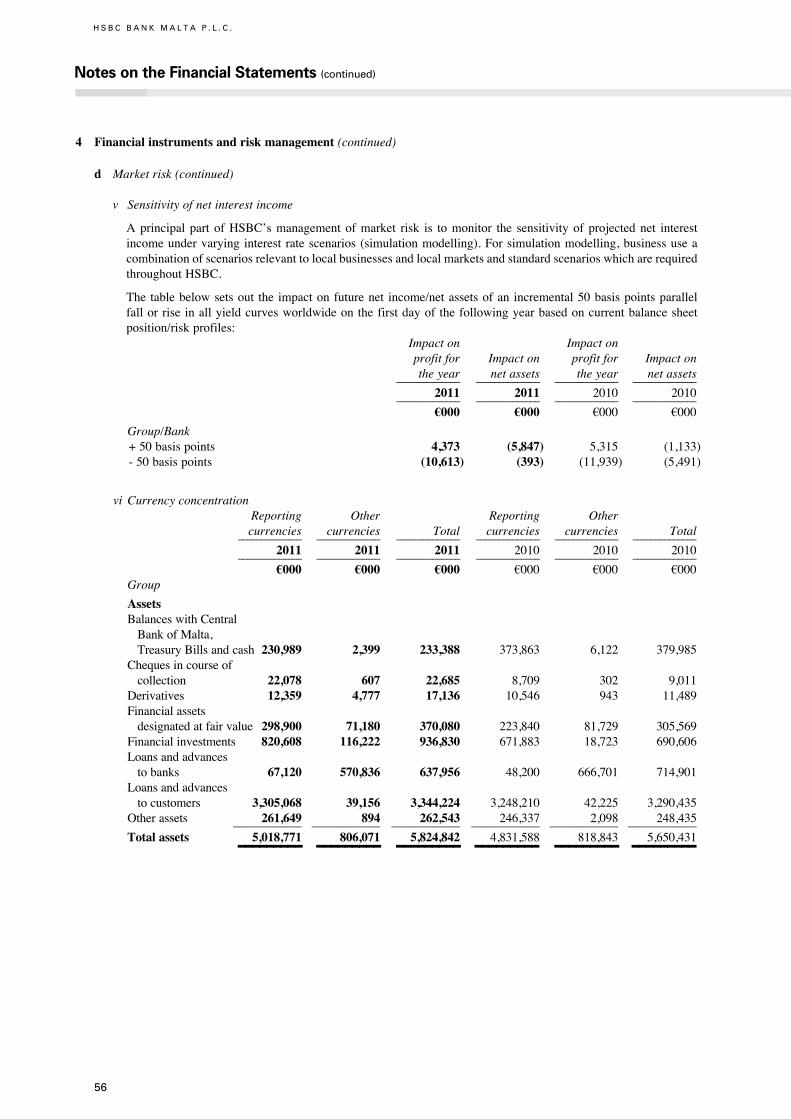
Notes on the Financial Statements (continued)
56
H S B C B A N K M A L T A P . L . C .
4 Financial instruments and risk management (continued)
d Marketrisk(continued) v Sensitivityofnetinterestincome
Aprincipal part ofHSBC’smanagementofmarket risk is tomonitor the sensitivityof projectednet interestincomeundervaryinginterest ratescenarios(simulationmodelling).Forsimulationmodelling,businessuseacombinationofscenariosrelevanttolocalbusinessesandlocalmarketsandstandardscenarioswhicharerequiredthroughoutHSBC.
Thetablebelowsetsout the impactonfuturenet income/netassetsofan incremental50basispointsparallelfallorriseinallyieldcurvesworldwideonthefirstdayof thefollowingyearbasedoncurrentbalancesheetposition/riskprofiles:
Impacton Impacton profitfor Impacton profitfor Impacton theyear netassets theyear netassets ______________ ______________ ______________ ______________
2011 2011 2010 2010 ______________ ______________ ______________ ______________
§000 §000 §000 §000
Group/Bank+50basispoints 4,373 (5,847) 5,315 (1,133)-50basispoints (10,613) (393) (11,939) (5,491)
vi Currencyconcentration Reporting Other Reporting Other currencies currencies Total currencies currencies Total ______________ ______________ ______________ ______________ ______________ ______________
2011 2011 2011 2010 2010 2010 ______________ ______________ ______________ ______________ ______________ ______________
§000 §000 §000 §000 §000 §000 Group
Assets BalanceswithCentral BankofMalta, TreasuryBillsandcash 230,989 2,399 233,388 373,863 6,122 379,985 Chequesincourseof collection 22,078 607 22,685 8,709 302 9,011 Derivatives 12,359 4,777 17,136 10,546 943 11,489 Financialassets designatedatfairvalue 298,900 71,180 370,080 223,840 81,729 305,569 Financialinvestments 820,608 116,222 936,830 671,883 18,723 690,606 Loansandadvances tobanks 67,120 570,836 637,956 48,200 666,701 714,901 Loansandadvances tocustomers 3,305,068 39,156 3,344,224 3,248,210 42,225 3,290,435 Otherassets 261,649 894 262,543 246,337 2,098 248,435 ______________ ______________ ______________ ______________ ______________ ______________
Total assets 5,018,771 806,071 5,824,842 4,831,588 818,843 5,650,431 _________ _________ _________ _________ _________ _________
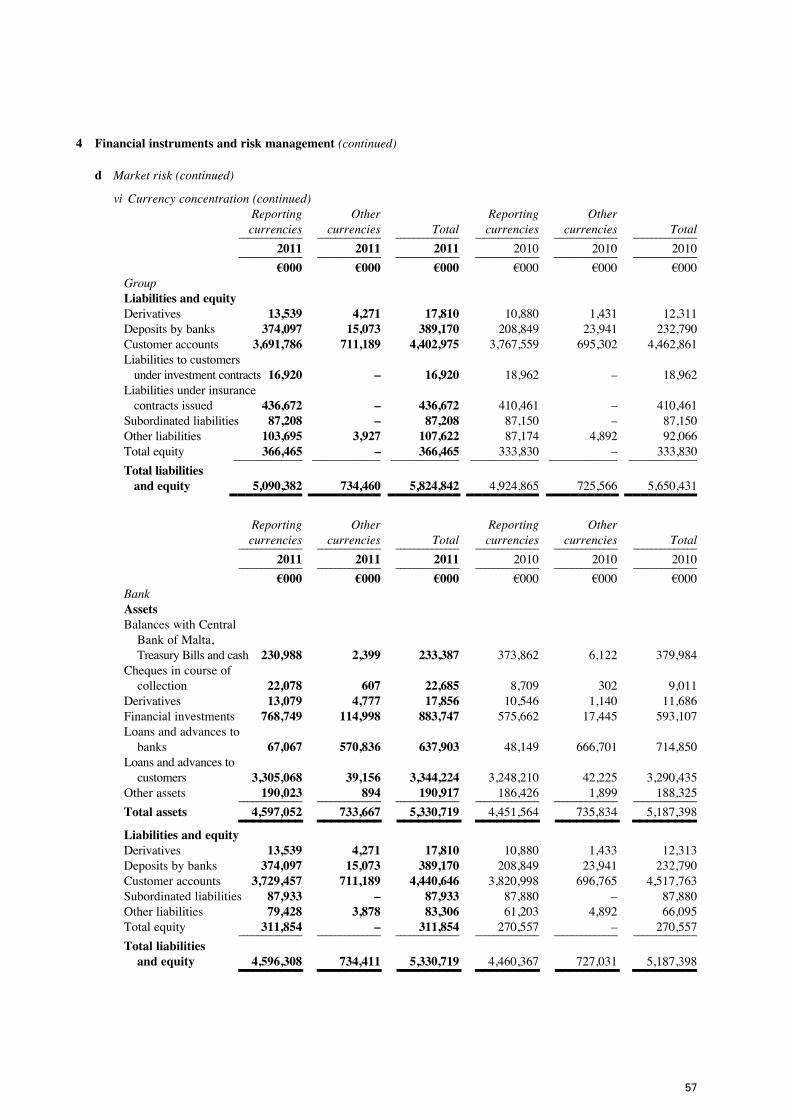
57
4 Financial instruments and risk management (continued)
d Marketrisk(continued)
vi Currencyconcentration(continued) Reporting Other Reporting Other currencies currencies Total currencies currencies Total ______________ ______________ ______________ ______________ ______________ ______________
2011 2011 2011 2010 2010 2010 ______________ ______________ ______________ ______________ ______________ ______________
§000 §000 §000 §000 §000 §000 Group Liabilitiesand equity Derivatives 13,539 4,271 17,810 10,880 1,431 12,311 Depositsbybanks 374,097 15,073 389,170 208,849 23,941 232,790 Customeraccounts 3,691,786 711,189 4,402,975 3,767,559 695,302 4,462,861 Liabilitiestocustomers underinvestmentcontracts 16,920 – 16,920 18,962 – 18,962 Liabilitiesunderinsurance contractsissued 436,672 – 436,672 410,461 – 410,461 Subordinatedliabilities 87,208 – 87,208 87,150 – 87,150 Otherliabilities 103,695 3,927 107,622 87,174 4,892 92,066 Totalequity 366,465 – 366,465 333,830 – 333,830 ______________ ______________ ______________ ______________ ______________ ______________
Total liabilities and equity 5,090,382 734,460 5,824,842 4,924,865 725,566 5,650,431 _________ _________ _________ _________ _________ _________
Reporting Other Reporting Other currencies currencies Total currencies currencies Total ______________ ______________ ______________ ______________ ______________ ______________
2011 2011 2011 2010 2010 2010 ______________ ______________ ______________ ______________ ______________ ______________
§000 §000 §000 §000 §000 §000 Bank Assets BalanceswithCentral BankofMalta, TreasuryBillsandcash 230,988 2,399 233,387 373,862 6,122 379,984 Chequesincourseof collection 22,078 607 22,685 8,709 302 9,011 Derivatives 13,079 4,777 17,856 10,546 1,140 11,686 Financialinvestments 768,749 114,998 883,747 575,662 17,445 593,107 Loansandadvancesto banks 67,067 570,836 637,903 48,149 666,701 714,850 Loansandadvancesto customers 3,305,068 39,156 3,344,224 3,248,210 42,225 3,290,435 Otherassets 190,023 894 190,917 186,426 1,899 188,325 ______________ ______________ ______________ ______________ ______________ ______________
Total assets 4,597,052 733,667 5,330,719 4,451,564 735,834 5,187,398 _________ _________ _________ _________ _________ _________ Liabilitiesand equity Derivatives 13,539 4,271 17,810 10,880 1,433 12,313 Depositsbybanks 374,097 15,073 389,170 208,849 23,941 232,790 Customeraccounts 3,729,457 711,189 4,440,646 3,820,998 696,765 4,517,763 Subordinatedliabilities 87,933 – 87,933 87,880 – 87,880 Otherliabilities 79,428 3,878 83,306 61,203 4,892 66,095 Totalequity 311,854 – 311,854 270,557 – 270,557 ______________ ______________ ______________ ______________ ______________ ______________
Total liabilities and equity 4,596,308 734,411 5,330,719 4,460,367 727,031 5,187,398 _________ _________ _________ _________ _________ _________
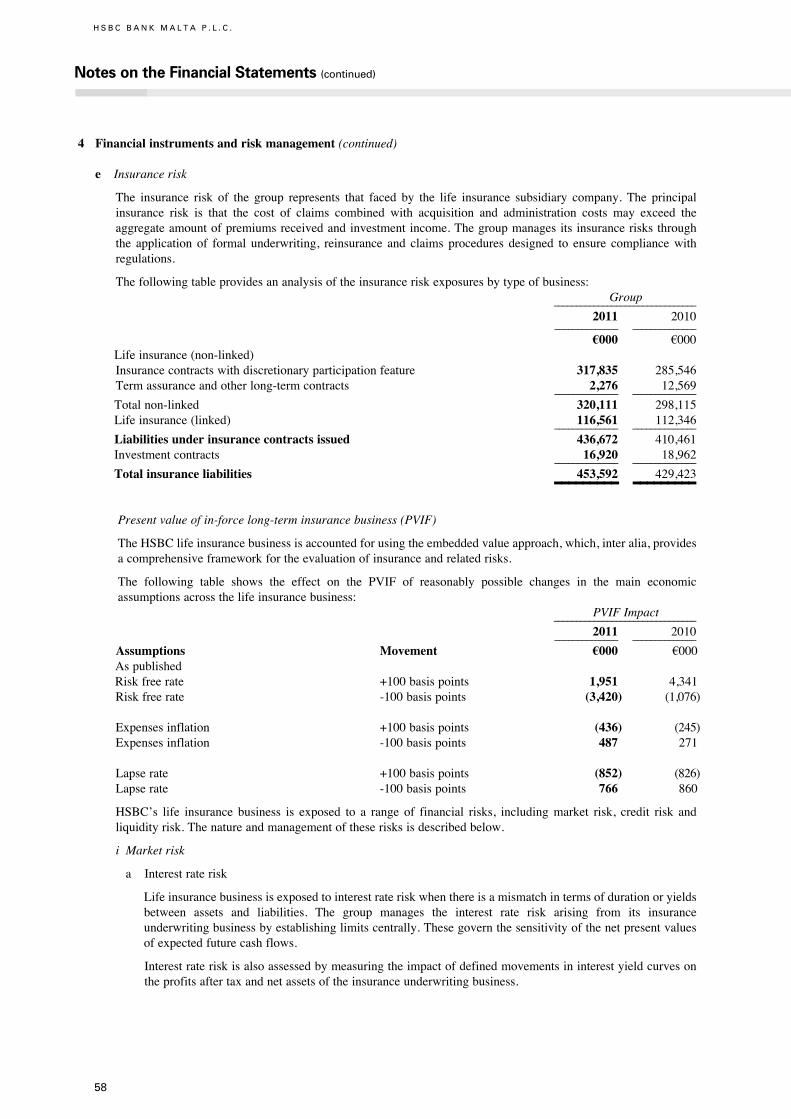
Notes on the Financial Statements (continued)
58
H S B C B A N K M A L T A P . L . C .
4 Financial instruments and risk management (continued)
e Insurancerisk
The insurance risk of the group represents that faced by the life insurance subsidiary company. The principalinsurance risk is that the cost of claims combined with acquisition and administration costs may exceed theaggregateamountofpremiumsreceivedandinvestmentincome.Thegroupmanagesitsinsurancerisksthroughthe application of formal underwriting, reinsurance and claims procedures designed to ensure compliancewithregulations.
Thefollowingtableprovidesananalysisoftheinsuranceriskexposuresbytypeofbusiness: Group ________________________________
2011 2010 ______________ ______________
§000 §000 Lifeinsurance(non-linked)
Insurancecontractswithdiscretionaryparticipationfeature 317,835 285,546Termassuranceandotherlong-termcontracts 2,276 12,569 ______________ ______________
Totalnon-linked 320,111 298,115 Lifeinsurance(linked) 116,561 112,346 ______________ ______________
Liabilities under insurance contracts issued 436,672 410,461 Investmentcontracts 16,920 18,962 ______________ ______________
Total insurance liabilities 453,592 429,423 _________ _________
Presentvalueofin-forcelong-terminsurancebusiness(PVIF)
TheHSBClifeinsurancebusinessisaccountedforusingtheembeddedvalueapproach,which,interalia,provides acomprehensiveframeworkfortheevaluationofinsuranceandrelatedrisks.
The following table shows the effect on the PVIF of reasonably possible changes in the main economic assumptionsacrossthelifeinsurancebusiness: PVIFImpact ________________________________
2011 2010 ______________ ______________
Assumptions Movement §000 §000 Aspublished Riskfreerate +100basispoints 1,951 4,341
Riskfreerate -100basispoints (3,420) (1,076)
Expensesinflation +100basispoints (436) (245)Expensesinflation -100basispoints 487 271
Lapserate +100basispoints (852) (826)Lapserate -100basispoints 766 860
HSBC’s life insurance business is exposed to a range of financial risks, includingmarket risk, credit risk andliquidityrisk.Thenatureandmanagementoftheserisksisdescribedbelow.
i Marketrisk
a Interestraterisk
Lifeinsurancebusinessisexposedtointerestrateriskwhenthereisamismatchintermsofdurationoryieldsbetween assets and liabilities. The group manages the interest rate risk arising from its insuranceunderwritingbusinessbyestablishinglimitscentrally.Thesegovernthesensitivityofthenetpresentvaluesofexpectedfuturecashflows.
Interestrateriskisalsoassessedbymeasuringtheimpactofdefinedmovementsininterestyieldcurveson theprofitsaftertaxandnetassetsoftheinsuranceunderwritingbusiness.

59
4 Financial instruments and risk management (continued)
e Insurancerisk(continued)
i Marketrisk(continued)
b Equityrisk
Thegroupmanagestheequityriskarisingfromitsholdingsofequitysecuritiescentrallybysettinglimitsonthemaximummarketvalueofequitiesthattheinsuranceunderwritingbusinessmayhold.Equityriskisalsomonitoredbyestimatingtheeffectofpredeterminedmovementsinequitypricesontheprofitfortheyearandtotalnetassetsoftheinsuranceunderwritingbusiness.
An immediate and permanentmovement in interest yield curves as at the reporting date would have thefollowingimpactontheprofitfortheyearandnetassetsatthatdate:
2011 2010 ________________________________ ________________________________
Impacton Impacton profitfor Impacton profitfor Impacton theyear netassets theyear netassets ______________ ______________ ______________ ______________
§000 §000 §000 §000
+100basispointsshiftinyieldcurves (2,342) (2,342) (642) (642)
-100basispointsshiftinyieldcurves 1,047 1,047 (817) (817)
+10percentincreaseinequityprices 614 614 182 182
-10percentincreaseinequityprices (742) (742) (719) (719)
iiCreditrisk
HSBC’s life insurance underwriting business is exposed to credit risk in respect of its investment portfoliosandreinsurancetransactions.TheInvestmentCommitteeisresponsibleforthequalityandperformanceoftheinvestmentportfoliosandfollowsacreditprocessinvolvingdelegatedapprovalauthoritiesandcreditprocedures,theobjectiveofwhichistobuildandmaintainriskassetsofhighquality.
Thefollowingtablepresentstheanalysisofdebtsecuritieswithininsurancebusinessbyratingagency(S&PRatingAgency):
Treasury Debt Bills securities Total ______________ ______________ ______________
§000 §000 §000
At 31 December 2011 AAA – 65,914 65,914 AA-toAA+ – 41,978 41,978 A-toA+ 3,248 130,417 133,665 LowerthanA- – 12,799 12,799 Unrated – 13,958 13,958 ______________ ______________ ______________
3,248 265,066 268,314 _________ _________ _________ At31December2010 AAA – 37,085 37,085 AA-toAA+ – 30,871 30,871 A-toA+ 7,460 129,818 137,278 LowerthanA- – 19,373 19,373 Unrated – 13,508 13,508 ______________ ______________ ______________
7,460 230,655 238,115 _________ _________ _________
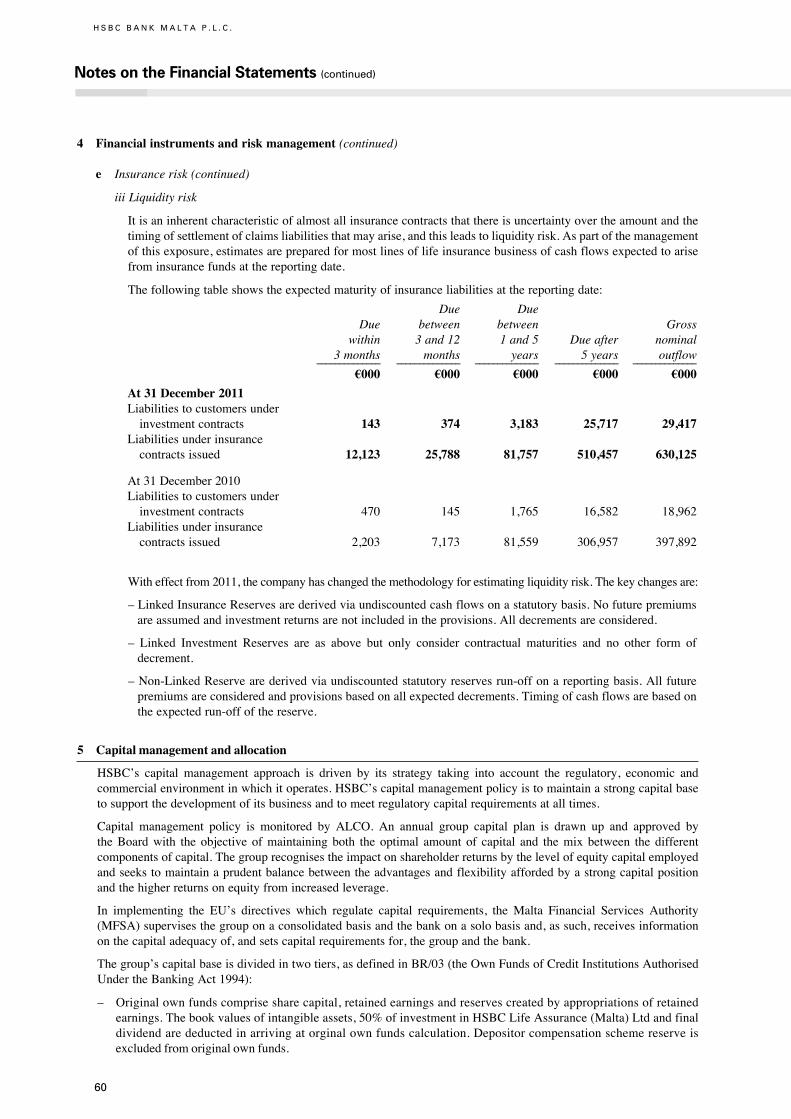
Notes on the Financial Statements (continued)
60
H S B C B A N K M A L T A P . L . C .
4 Financial instruments and risk management (continued)
e Insurancerisk(continued)
iiiLiquidityrisk
Itisaninherentcharacteristicofalmostallinsurancecontractsthatthereisuncertaintyovertheamountandthetimingofsettlementofclaimsliabilitiesthatmayarise,andthisleadstoliquidityrisk.Aspartofthemanagementofthisexposure,estimatesarepreparedformostlinesoflifeinsurancebusinessofcashflowsexpectedtoarisefrominsurancefundsatthereportingdate.
Thefollowingtableshowstheexpectedmaturityofinsuranceliabilitiesatthereportingdate:
Due Due Due between between Gross within 3and12 1and5 Dueafter nominal 3months months years 5years outflow ______________ ______________ ______________ ______________ ______________
§000 §000 §000 §000 §000
At 31 December 2011Liabilitiestocustomersunder investmentcontracts 143 374 3,183 25,717 29,417Liabilitiesunderinsurance contractsissued 12,123 25,788 81,757 510,457 630,125
At31December2010Liabilitiestocustomersunder investmentcontracts 470 145 1,765 16,582 18,962Liabilitiesunderinsurance contractsissued 2,203 7,173 81,559 306,957 397,892
Witheffectfrom2011,thecompanyhaschangedthemethodologyforestimatingliquidityrisk.Thekeychangesare:
–LinkedInsuranceReservesarederivedviaundiscountedcashflowsonastatutorybasis.Nofuturepremiumsareassumedandinvestmentreturnsarenotincludedintheprovisions.Alldecrementsareconsidered.
– Linked Investment Reserves are as above but only consider contractual maturities and no other form ofdecrement.
–Non-LinkedReservearederivedviaundiscountedstatutoryreservesrun-offonareportingbasis.Allfuturepremiumsareconsideredandprovisionsbasedonallexpecteddecrements.Timingofcashflowsarebasedontheexpectedrun-offofthereserve.
5 Capital management and allocation
HSBC’s capital management approach is driven by its strategy taking into account the regulatory, economic andcommercialenvironmentinwhichitoperates.HSBC’scapitalmanagementpolicyistomaintainastrongcapitalbasetosupportthedevelopmentofitsbusinessandtomeetregulatorycapitalrequirementsatalltimes.
Capital management policy is monitored by ALCO. An annual group capital plan is drawn up and approved bytheBoardwith the objective ofmaintaining both the optimal amount of capital and themix between the differentcomponentsofcapital.Thegrouprecognisestheimpactonshareholderreturnsbythelevelofequitycapitalemployedandseekstomaintainaprudentbalancebetweentheadvantagesandflexibilityaffordedbyastrongcapitalpositionandthehigherreturnsonequityfromincreasedleverage.
In implementing the EU’s directives which regulate capital requirements, the Malta Financial Services Authority(MFSA)supervisesthegrouponaconsolidatedbasisandthebankonasolobasisand,assuch,receivesinformationonthecapitaladequacyof,andsetscapitalrequirementsfor,thegroupandthebank.
Thegroup’scapitalbaseisdividedintwotiers,asdefinedinBR/03(theOwnFundsofCreditInstitutionsAuthorisedUndertheBankingAct1994):
– Originalownfundscomprisesharecapital,retainedearningsandreservescreatedbyappropriationsofretainedearnings.Thebookvaluesofintangibleassets,50%ofinvestmentinHSBCLifeAssurance(Malta)Ltdandfinaldividendaredeductedinarrivingatorginalownfundscalculation.Depositorcompensationschemereserveisexcludedfromoriginalownfunds.

61
5 Capital management and allocation (continued)
– Additionalownfundscomprisequalifyingsubordinatedloancapital,collectiveimpairmentallowances,andunrealisedgainsarisingonthefairvaluationoffinancialinvestmentsheldasavailable-for-sale.Additionalownfundsalsoincludereservesarisingfromtherevaluationofproperties.Theremaining50%ofthebookvalueoftheinvestmentinHSBCLifeAssurance(Malta)Ltdisdeductedinarrivingatadditionalownfundscalculation.
Thegroup’sriskandcapitalmanagementpolicyisbasedontheBaselIIframeworkwhichisstructuredonthreepillars.ThesehavebeenadoptedbytheMFSAbywayofbankingrulesasfollows:
– Pillar1–BR/04(CapitalRequirementsofCreditInstitutionsAuthorisedUndertheBankingAct1994)definestheminimumcapitalresoucesrequirementsforcredit,counterparty,marketandoperationalrisks.TheriskisexpressedinRiskWeightedAssets(RWAs)terms.ThegrouphasadoptedtheStandardisedApproachindeterminingthematerialrisksonitsbankingoperationsandoperationalrisk.
Bankingoperationsarecategorisedaseithertradingbookorbankingbookandrisk-weightedassetsaredeterminedaccordingly.Bankingbookrisk-weightedassetsaremeasuredbymeansofahierarchyofriskweightingsclassifiedaccordingtothenatureofeachassetandcounterparty,takingintoaccountanyeligiblecollateralorguarantees.Bankingbookcontingentliabilitiesandcommitmentsgivingrisetocredit,foreignexchangeorinterestrateriskareassignedweightsappropriatetothecategoryofthecounterparty,takingintoaccountanyeligiblecollateralorguarantees.Tradingbookrisk-weightedassetsaredeterminedbytakingintoaccountmarketrelatedriskssuchasforeignexchange,interestrateandequitypositionrisksandcounterpartyrisk.
– Pillar2–BR/12(TheSupervisoryReviewProcessofCreditInstitutionsAuthorisedUndertheBankingAct1994)involvesboththecreditinstitutionandtheregulatorinassessingwhethertheinstitutionshouldholdadditionalcapitalagainstrisksnotcoveredunderpillar1.Anintegralpartofpillar2istheInternalCapitalAdequacyAssessmentProcess(ICAAP)whichistheinstitutions’sself-assessmentofthelevelsofcapitalitneedstohold.AnICAAPwasundertakenduringthefirsthalfoftheyear.ThisdocumentwasapprovedbyALCO,EXCOandsubsequentlybytheBoardon29July2011andpresentedtotheMFSAforreview.TheICAAPisperformedannuallyandisbaseduponapillar1plusapproachwherebythepillar1capitalrequirementsforcreditandoperationalrisksaresupplementedbyanassessmentofothermaterialrisksnotfullyaddressedunderpillar1.TherisksconsideredforICAAPincludeconcentration,liquidity,reputationalandstrategicrisks,interestrateriskinthebankingbookandrisksarsingfromthemacroeconomicenvironment.Thegroupassessescreditriskbyutilisingtheembeddedoperationalinfrastructureforthepillar1capitalcalculationtogetherwithanadditionalsuiteofmodelsthattakeintoaccounttheinternalassessmentofdiversificationofrisks,withinourportfoliosandsimilarly,anyconcentrationsofriskthatarise.Thebankmaintainsaprudencestanceofcapitalcoverage,ensuringthatanymodelriskismitigatged.InterestrateriskintheBankingbook(IRRBB)isdefinedastheexposureofnon-tradingproductstointerestrates.IRRBBecnomiccapitalismeasuredastheamountofcapitalnecessarytocoveranunexpectedlossinthevalueofournon-tradingproductsoveroneyeartoa99.0%levelofconfidence.
FollowingtheICAAPsubmission,theregulatorcarriesouttheSupervisoryReviewEvaluationProcess(SREP)andentersintodiscussionwiththebankontheappropriatelevelofcapitaladequacytocoverpillar2risks.Thesediscussionsareongoing.
– Stressandscenariotesting
Stresstestingformspartofthegroup’sriskandcapitalframeworkandisanintegralcomponentofICAAP.Asakeyriskmanagementtool,stresstestinghighlightstoseniormanagementpotentialadverseunexpectedoutcomesrelatedtoamixtureofrisksandprovidesanindicationofhowmuchcapitalmightberequiredtoabsorblosses,shouldadversescenariosoccur.Stresstestingisusedtoassessriskconcentrations,estimatetheimpactofstressedearnings,impairmentsandwrite-downsontheoverallcapitaladequacyunderavarietyofadversescenarios.
Macroeconomicstresstestingconsiderstheimpactonbothearningsandcapitalforarangeofscenarios.Itentailsmulti-yearsystemicshockstoassessthegroup’sabilitytomeetitscapitalrequirementsandliabilitiesastheyfalldueunderadownturninthebusinesscycleand/ormacroeconomicenvironment.
Theprincipalbusinessbenefitsofthestresstestingframeworkinclude:understandingtheimpactofrecessionaryscenarios;assessingmaterialriskconcentrations;andforecastingtheimpactofmarketstressandscenariosonthegroup’sbalancesheetliquidity.
Atgrouplevel,aseriesofstresseventsaremonitoredonaregularbasistoassessthepotentialimpactofanextremeyetplausibleeventonthegroup.Asaresult,seniormanagementarecontinuouslyenhancinginternalcontrolstomonitor the situationonanongoingbasis. In an adverse scenario, thegroupalsohas at its disposal a rangeofmitigatingactionsitcanuse.ThelatteralsoformpartoftheICAAPdocument.

Notes on the Financial Statements (continued)
62
H S B C B A N K M A L T A P . L . C .
5 Capital management and allocation (continued)
– Pillar3–BR/07(PublicationofAnnualReportandAuditedFinancialStatementsofCreditInstitutionsAuthorisedundertheBankingAct1994)isrelatedtomarketdisciplineandaimstomakeinstitutionsmoretransparentbyrequiringthemtopublishspecificdisclosuresontheinstitutions’sriskandcapitalmanagementundertheBaselIIframework.ThegroupisconsideredasasignificantlocalsubsidiaryofHSBCHoldingsplcandisthereforeexemptintermsofarticle23ofBR/07fromfullriskdisclosurerequirementsunderPillar3.HSBCHoldingsplcpublishesPillar3disclosuresasaseparatedocumentontheGroupInvestorRelationswebsite.
Group Bank __________________________________________________ __________________________________________________
Exposure Capital Exposure Capital value RWA Required value RWA Required ______________ ______________ ______________ ______________ ______________ ______________
2011 2011 2011 2011 2011 2011 ______________ ______________ ______________ ______________ ______________ ______________
§000 §000 §000 §000 §000 §000Exposures under the standardised approachCentralgovernmentandcentralbanks 949,217 – – 949,217 – –Institutions 830,915 151,990 12,159 830,915 151,990 12,159Publicsector 223,722 41,995 3,360 223,722 41,995 3,360Corporates 393,833 356,742 28,539 392,209 355,119 28,409Retail 297,053 204,610 16,369 297,053 204,610 16,369Securedonrealestateproperty 2,368,998 1,364,584 109,167 2,368,998 1,364,584 109,167Pastdueitems 148,602 208,082 16,647 148,602 208,082 16,647Otheritems 315,398 250,561 20,044 322,907 258,072 20,646 _________ _________ _________ _________ _________ _________Credit andcounterparty risk 5,527,738 2,578,564 206,285 5,533,623 2,584,452 206,757 _________ _________ _________ _________ _________ _________Operational risk XXX,XXX 276,697 22,136 XXX,XXX 276,697 22,136 _________ _________ _________ _________Equityrisk XXX,XXX 4,689 375 XXX,XXX 4,689 375Foreignexchangerisk XXX,XXX 5,362 429 XXX,XXX 5,362 429 ______________ ______________ ______________ ______________ ______________
Market risk XXX,XXX 10,051 804 XXX,XXX 10,051 804 _________ _________ _________ _________Total risk weighted assetsand capital required XXX,XXX 2,865,312 229,225 XXX,XXX 2,871,200 229,697 _________ _________ _________ _________ Group Bank ________________________________ ____________________________________
Face Weighted Face Weighted value amount value amount ______________ ______________ ______________ ______________
2011 2011 2011 2011 ______________ ______________ ______________ ______________
§000 §000 §000 §000Assets BalanceswithCentralBankofMalta,TreasuryBillsandcash 233,387 – 233,387 –Chequesincourseofcollection 22,685 4,537 22,685 4,537Financialinvestmants 885,413 26,402 883,747 24,778Loansandadvancestobanks 637,903 127,581 637,903 127,581Loansandadvancestocustomers 3,377,135 2,095,142 3,377,135 2,095,142Sharesinsubsidiarycompanies – – 7,129 7,129Property,plantandequipmentandinvestmentproperty 71,777 71,777 71,858 71,858Otherassets 52,725 37,201 53,184 37,920Prepaymentsandaccruedincome 35,694 35,285 35,527 34,868 ______________ ______________ ______________ ______________
5,316,719 2,397,925 5,322,555 2,403,813 _________ _________Contingentliabilities,commitmentsandother 1,233,486 180,639 1,235,189 180,639 _________ ______________ _________ ______________
Credit and counter party risk 2,578,564 2,584,452
Operational risk 276,697 276,697Market risk 10,051 10,051 ______________ ______________
Total risk weighted assets 2,865,312 2,871,200 _________ _________
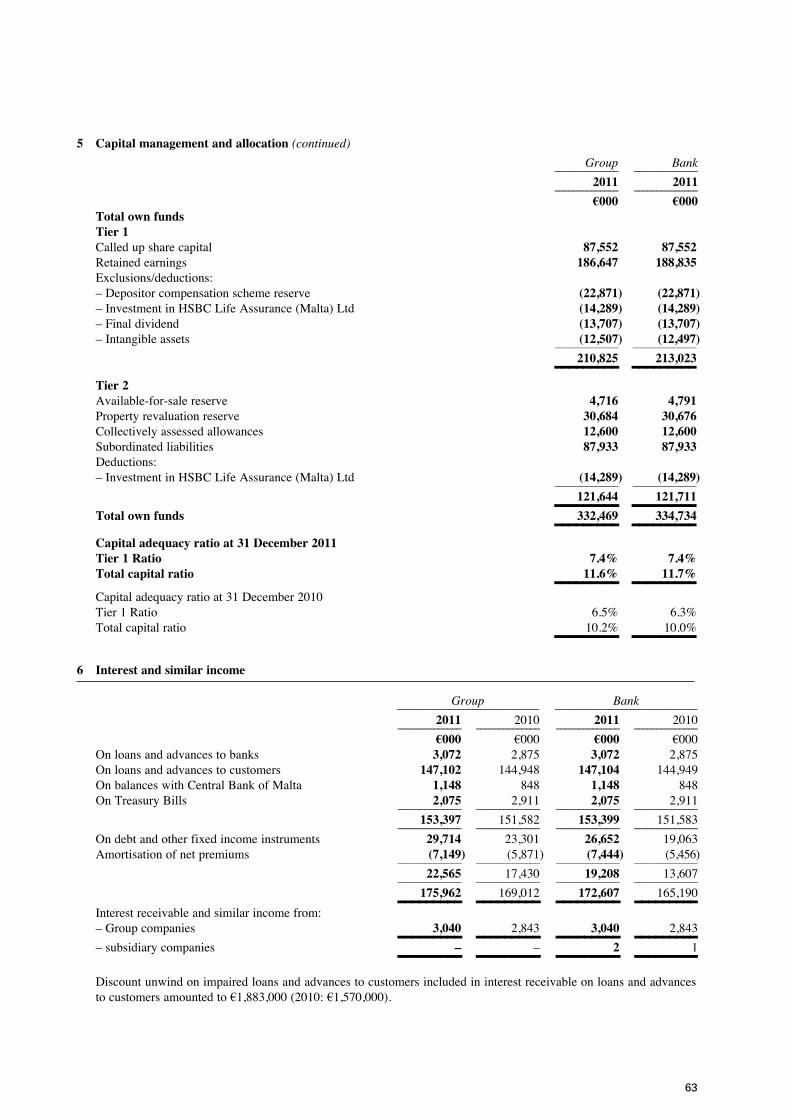
63
5 Capital management and allocation (continued)
Group Bank ______________ ______________
2011 2011 ______________ ______________
§000 §000Total own funds Tier 1 Calledupsharecapital 87,552 87,552Retainedearnings 186,647 188,835Exclusions/deductions:–Depositorcompensationschemereserve (22,871) (22,871)–InvestmentinHSBCLifeAssurance(Malta)Ltd (14,289) (14,289)–Finaldividend (13,707) (13,707)–Intangibleassets (12,507) (12,497) ______________ ______________
210,825 213,023 _________ _________ Tier 2Available-for-salereserve 4,716 4,791Propertyrevaluationreserve 30,684 30,676Collectivelyassessedallowances 12,600 12,600Subordinatedliabilities 87,933 87,933Deductions:–InvestmentinHSBCLifeAssurance(Malta)Ltd (14,289) (14,289) ______________ ______________
121,644 121,711 _________ _________Total own funds 332,469 334,734 _________ _________ Capital adequacy ratio at 31 December 2011 Tier 1 Ratio 7.4% 7.4%Total capital ratio 11.6% 11.7% _________ _________ Capitaladequacyratioat31December2010 Tier1Ratio 6.5% 6.3%Totalcapitalratio 10.2% 10.0% _________ _________
6 Interest and similar income
Group Bank ________________________________ ________________________________
2011 2010 2011 2010 ______________ ______________ ______________ ______________
§000 §000 §000 §000Onloansandadvancestobanks 3,072 2,875 3,072 2,875Onloansandadvancestocustomers 147,102 144,948 147,104 144,949OnbalanceswithCentralBankofMalta 1,148 848 1,148 848OnTreasuryBills 2,075 2,911 2,075 2,911 ______________ ______________ ______________ ______________
153,397 151,582 153,399 151,583 ______________ ______________ ______________ ______________
Ondebtandotherfixedincomeinstruments 29,714 23,301 26,652 19,063Amortisationofnetpremiums (7,149) (5,871) (7,444) (5,456) ______________ ______________ ______________ ______________
22,565 17,430 19,208 13,607 ______________ ______________ ______________ ______________
175,962 169,012 172,607 165,190 _________ _________ _________ _________Interestreceivableandsimilarincomefrom:–Groupcompanies 3,040 2,843 3,040 2,843 _________ _________ _________ _________–subsidiarycompanies – – 2 1 _________ _________ _________ _________Discountunwindonimpairedloansandadvancestocustomersincludedininterestreceivableonloansandadvancestocustomersamountedto§1,883,000(2010:§1,570,000).
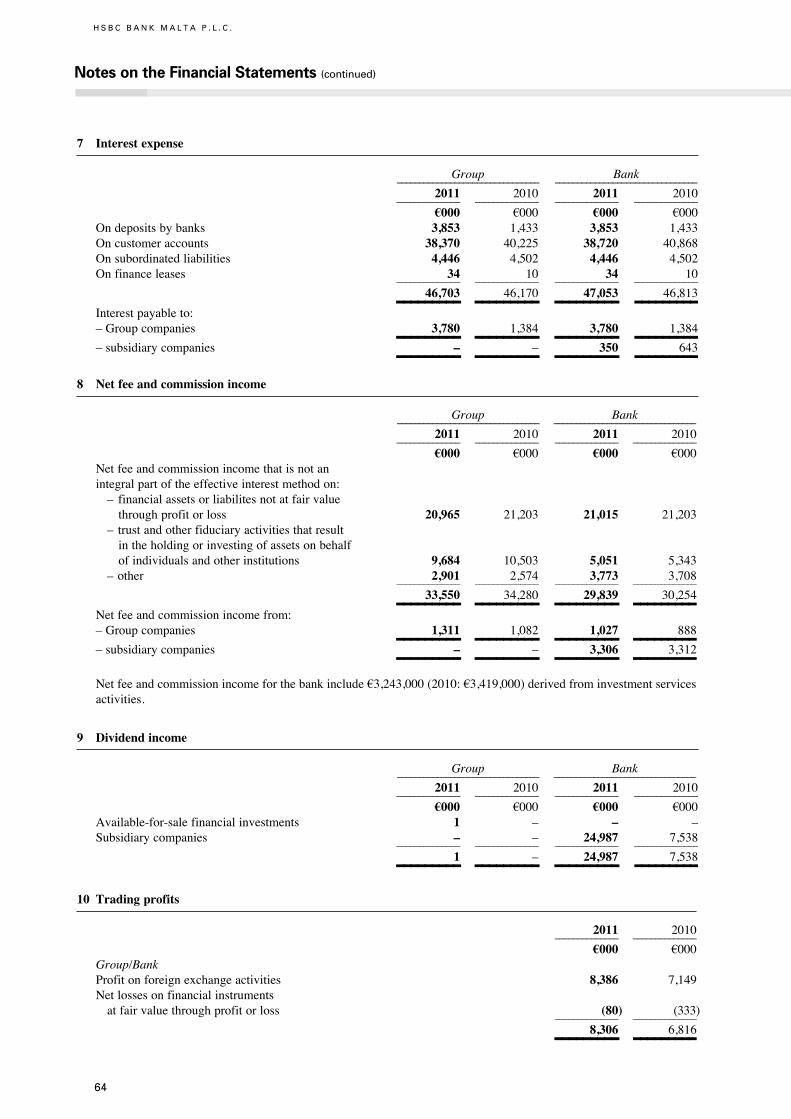
64
H S B C B A N K M A L T A P . L . C .
Notes on the Financial Statements (continued)
7 Interest expense
Group Bank ________________________________ ________________________________
2011 2010 2011 2010 ______________ ______________ ______________ ______________
§000 §000 §000 §000Ondepositsbybanks 3,853 1,433 3,853 1,433Oncustomeraccounts 38,370 40,225 38,720 40,868Onsubordinatedliabilities 4,446 4,502 4,446 4,502Onfinanceleases 34 10 34 10 ______________ ______________ ______________ ______________
46,703 46,170 47,053 46,813 _________ _________ _________ _________Interestpayableto:–Groupcompanies 3,780 1,384 3,780 1,384 _________ _________ _________ _________–subsidiarycompanies – – 350 643 _________ _________ _________ _________
8 Net fee and commission income
Group Bank ________________________________ ________________________________
2011 2010 2011 2010 ______________ ______________ ______________ ______________
§000 §000 §000 §000Netfeeandcommissionincomethatisnotanintegralpartoftheeffectiveinterestmethodon:– financialassetsorliabilitesnotatfairvalue throughprofitorloss 20,965 21,203 21,015 21,203– trustandotherfiduciaryactivitiesthatresult intheholdingorinvestingofassetsonbehalf ofindividualsandotherinstitutions 9,684 10,503 5,051 5,343–other 2,901 2,574 3,773 3,708 ______________ ______________ ______________ ______________
33,550 34,280 29,839 30,254 _________ _________ _________ _________Netfeeandcommissionincomefrom:–Groupcompanies 1,311 1,082 1,027 888 _________ _________ _________ _________–subsidiarycompanies – – 3,306 3,312 _________ _________ _________ _________Netfeeandcommissionincomeforthebankinclude§3,243,000(2010:§3,419,000)derivedfrominvestmentservicesactivities.
9 Dividend income
Group Bank ________________________________ ________________________________
2011 2010 2011 2010 ______________ ______________ ______________ ______________
§000 §000 §000 §000Available-for-salefinancialinvestments 1 – – –Subsidiarycompanies – – 24,987 7,538 ______________ ______________ ______________ ______________
1 – 24,987 7,538 _________ _________ _________ _________10 Trading profits
2011 2010 ______________ ______________
§000 §000Group/BankProfitonforeignexchangeactivities 8,386 7,149Netlossesonfinancialinstrumentsatfairvaluethroughprofitorloss (80) (333) ______________ ______________
8,306 6,816 _________ _________
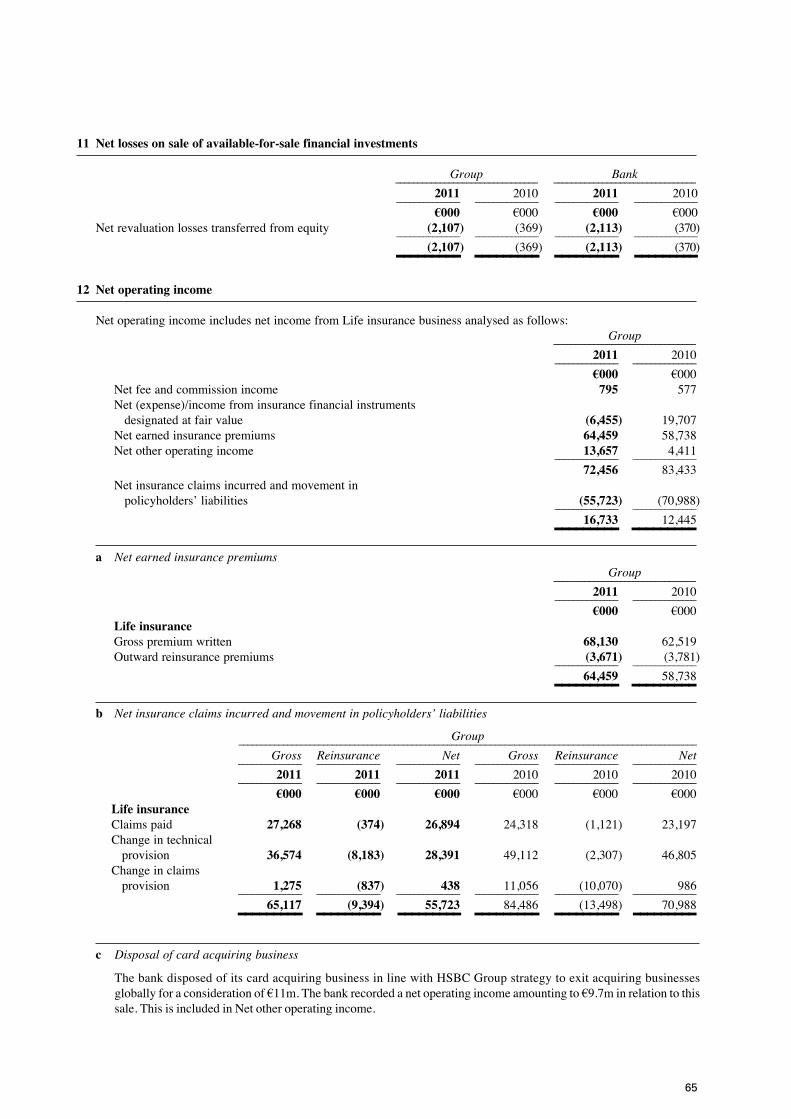
65
11 Net losses on sale of available-for-sale financial investments
Group Bank ________________________________ ________________________________
2011 2010 2011 2010 ______________ ______________ ______________ ______________
§000 §000 §000 §000Netrevaluationlossestransferredfromequity (2,107) (369) (2,113) (370) ______________ ______________ ______________ ______________
(2,107) (369) (2,113) (370) _________ _________ _________ _________12 Net operating income
NetoperatingincomeincludesnetincomefromLifeinsurancebusinessanalysedasfollows: Group ________________________________
2011 2010 ______________ ______________
§000 §000Netfeeandcommissionincome 795 577Net(expense)/incomefrominsurancefinancialinstrumentsdesignatedatfairvalue (6,455) 19,707Netearnedinsurancepremiums 64,459 58,738Netotheroperatingincome 13,657 4,411 ______________ ______________
72,456 83,433Netinsuranceclaimsincurredandmovementinpolicyholders’liabilities (55,723) (70,988) ______________ ______________
16,733 12,445 _________ _________a Netearnedinsurancepremiums Group ________________________________
2011 2010 ______________ ______________
§000 §000Life insurance Grosspremiumwritten 68,130 62,519Outwardreinsurancepremiums (3,671) (3,781) ______________ ______________
64,459 58,738 _________ _________b Netinsuranceclaimsincurredandmovementinpolicyholders’liabilities
Group ___________________________________________________________________________________________________
Gross Reinsurance Net Gross Reinsurance Net ______________ ______________ ______________ ______________ ______________ ______________
2011 2011 2011 2010 2010 2010 ______________ ______________ ______________ ______________ ______________ ______________
§000 §000 §000 §000 §000 §000Life insuranceClaimspaid 27,268 (374) 26,894 24,318 (1,121) 23,197Changeintechnicalprovision 36,574 (8,183) 28,391 49,112 (2,307) 46,805Changeinclaimsprovision 1,275 (837) 438 11,056 (10,070) 986 ______________ ______________ ______________ ______________ ______________ ______________
65,117 (9,394) 55,723 84,486 (13,498) 70,988 _________ _________ _________ _________ _________ _________c Disposalofcardacquiringbusiness
ThebankdisposedofitscardacquiringbusinessinlinewithHSBCGroupstrategytoexitacquiringbusinessesgloballyforaconsiderationof§11m.Thebankrecordedanetoperatingincomeamountingto§9.7minrelationtothissale.ThisisincludedinNetotheroperatingincome.
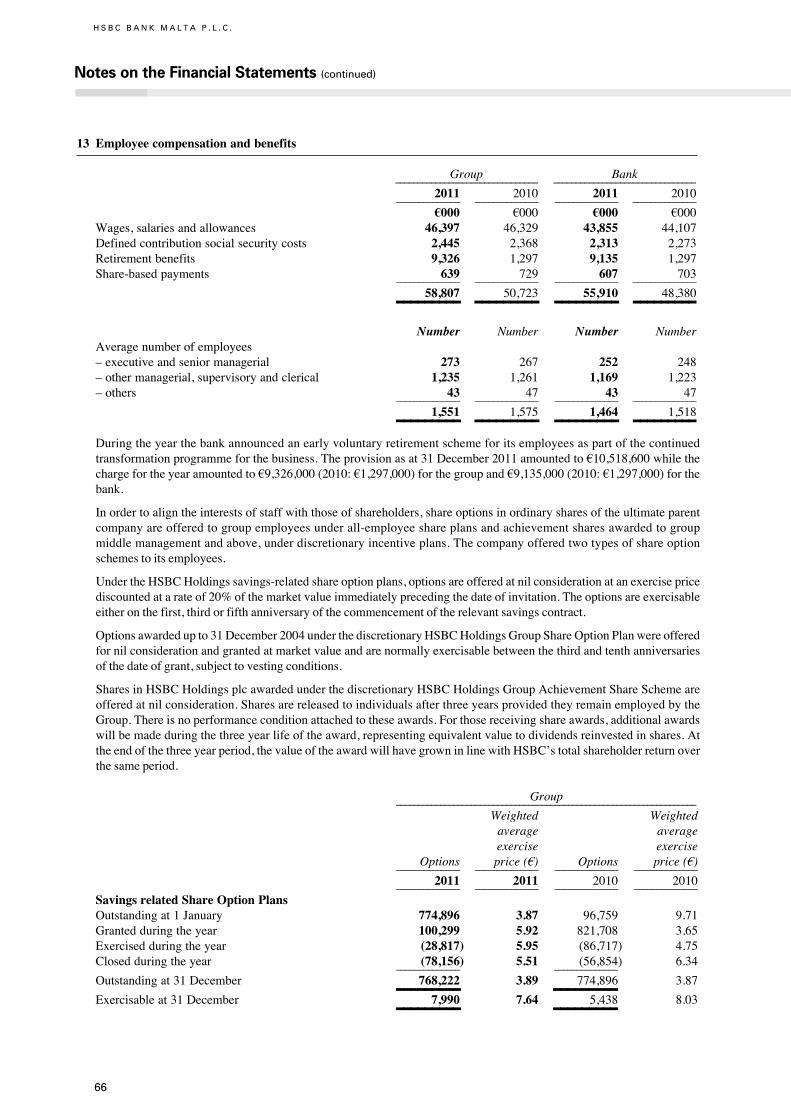
66
H S B C B A N K M A L T A P . L . C .
Notes on the Financial Statements (continued)
13 Employee compensation and benefits
Group Bank ________________________________ ________________________________
2011 2010 2011 2010 ______________ ______________ ______________ ______________
§000 §000 §000 §000Wages,salariesandallowances 46,397 46,329 43,855 44,107Definedcontributionsocialsecuritycosts 2,445 2,368 2,313 2,273Retirementbenefits 9,326 1,297 9,135 1,297Share-basedpayments 639 729 607 703 ______________ ______________ ______________ ______________
58,807 50,723 55,910 48,380 _________ _________ _________ _________ Number Number Number NumberAveragenumberofemployees–executiveandseniormanagerial 273 267 252 248–othermanagerial,supervisoryandclerical 1,235 1,261 1,169 1,223–others 43 47 43 47 ______________ ______________ ______________ ______________
1,551 1,575 1,464 1,518 _________ _________ _________ _________ Duringtheyearthebankannouncedanearlyvoluntaryretirementschemeforitsemployeesaspartofthecontinuedtransformationprogrammeforthebusiness.Theprovisionasat31December2011amountedto§10,518,600whilethechargefortheyearamountedto§9,326,000(2010:§1,297,000)forthegroupand§9,135,000(2010:§1,297,000)forthebank.
Inordertoaligntheinterestsofstaffwiththoseofshareholders,shareoptionsinordinarysharesoftheultimateparentcompanyareofferedtogroupemployeesunderall-employeeshareplansandachievementsharesawardedtogroupmiddlemanagementandabove,underdiscretionaryincentiveplans.Thecompanyofferedtwotypesofshareoptionschemestoitsemployees.
UndertheHSBCHoldingssavings-relatedshareoptionplans,optionsareofferedatnilconsiderationatanexercisepricediscountedatarateof20%ofthemarketvalueimmediatelyprecedingthedateofinvitation.Theoptionsareexercisableeitheronthefirst,thirdorfifthanniversaryofthecommencementoftherelevantsavingscontract.
Optionsawardedupto31December2004underthediscretionaryHSBCHoldingsGroupShareOptionPlanwereofferedfornilconsiderationandgrantedatmarketvalueandarenormallyexercisablebetweenthethirdandtenthanniversariesofthedateofgrant,subjecttovestingconditions.
SharesinHSBCHoldingsplcawardedunderthediscretionaryHSBCHoldingsGroupAchievementShareSchemeareofferedatnilconsideration.SharesarereleasedtoindividualsafterthreeyearsprovidedtheyremainemployedbytheGroup.Thereisnoperformanceconditionattachedtotheseawards.Forthosereceivingshareawards,additionalawardswillbemadeduringthethreeyearlifeoftheaward,representingequivalentvaluetodividendsreinvestedinshares.Attheendofthethreeyearperiod,thevalueoftheawardwillhavegrowninlinewithHSBC’stotalshareholderreturnoverthesameperiod.
Group ____________________________________________________________________
Weighted Weighted average average exercise exercise Options price(§) Options price(§) ______________ ______________ ______________ ______________
2011 2011 2010 2010 ______________ ______________ ______________ ______________
Savings related Share Option PlansOutstandingat1January 774,896 3.87 96,759 9.71Grantedduringtheyear 100,299 5.92 821,708 3.65Exercisedduringtheyear (28,817) 5.95 (86,717) 4.75Closedduringtheyear (78,156) 5.51 (56,854) 6.34 ______________ ______________
Outstandingat31December 768,222 3.89 774,896 3.87 _________ _________Exercisableat31December 7,990 7.64 5,438 8.03 _________ _________
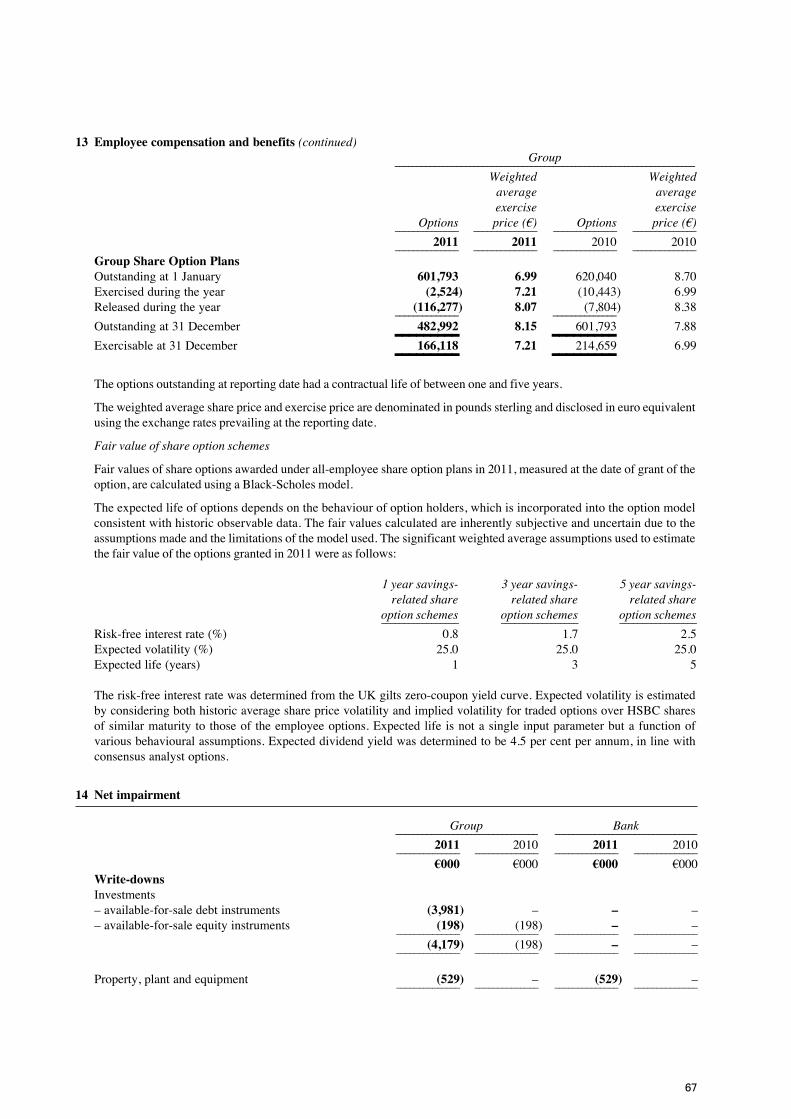
67
13 Employee compensation and benefits (continued) Group ____________________________________________________________________
Weighted Weighted average average exercise exercise Options price(§) Options price(§) ______________ ______________ ______________ ______________
2011 2011 2010 2010 ______________ ______________ ______________ ______________
Group Share Option PlansOutstandingat1January 601,793 6.99 620,040 8.70Exercisedduringtheyear (2,524) 7.21 (10,443) 6.99Releasedduringtheyear (116,277) 8.07 (7,804) 8.38 ______________ ______________
Outstandingat31December 482,992 8.15 601,793 7.88 _________ _________Exercisableat31December 166,118 7.21 214,659 6.99 _________ _________ Theoptionsoutstandingatreportingdatehadacontractuallifeofbetweenoneandfiveyears.
Theweightedaveragesharepriceandexercisepricearedenominatedinpoundssterlinganddisclosedineuroequivalentusingtheexchangeratesprevailingatthereportingdate.
Fairvalueofshareoptionschemes
Fairvaluesofshareoptionsawardedunderall-employeeshareoptionplansin2011,measuredatthedateofgrantoftheoption,arecalculatedusingaBlack-Scholesmodel.
Theexpectedlifeofoptionsdependsonthebehaviourofoptionholders,whichisincorporatedintotheoptionmodelconsistentwithhistoricobservabledata.Thefairvaluescalculatedareinherentlysubjectiveanduncertainduetotheassumptionsmadeandthelimitationsofthemodelused.Thesignificantweightedaverageassumptionsusedtoestimatethefairvalueoftheoptionsgrantedin2011wereasfollows:
1yearsavings- 3yearsavings- 5yearsavings- relatedshare relatedshare relatedshare optionschemes optionschemes optionschemes _________________ _________________ _________________
Risk-freeinterestrate(%) 0.8 1.7 2.5Expectedvolatility(%) 25.0 25.0 25.0Expectedlife(years) 1 3 5
Therisk-freeinterestratewasdeterminedfromtheUKgiltszero-couponyieldcurve.ExpectedvolatilityisestimatedbyconsideringbothhistoricaveragesharepricevolatilityandimpliedvolatilityfortradedoptionsoverHSBCsharesofsimilarmaturitytothoseof theemployeeoptions.Expectedlife isnotasingleinputparameterbutafunctionofvariousbehaviouralassumptions.Expecteddividendyieldwasdeterminedtobe4.5percentperannum,inlinewithconsensusanalystoptions.
14 Net impairment
Group Bank ________________________________ ________________________________
2011 2010 2011 2010 ______________ ______________ ______________ ______________
§000 §000 §000 §000Write-downsInvestments–available-for-saledebtinstruments (3,981) – – ––available-for-saleequityinstruments (198) (198) – – ______________ ______________ ______________ ______________ (4,179) (198) – – ______________ ______________ ______________ ______________
Property,plantandequipment (529) – (529) – ______________ ______________ ______________ ______________
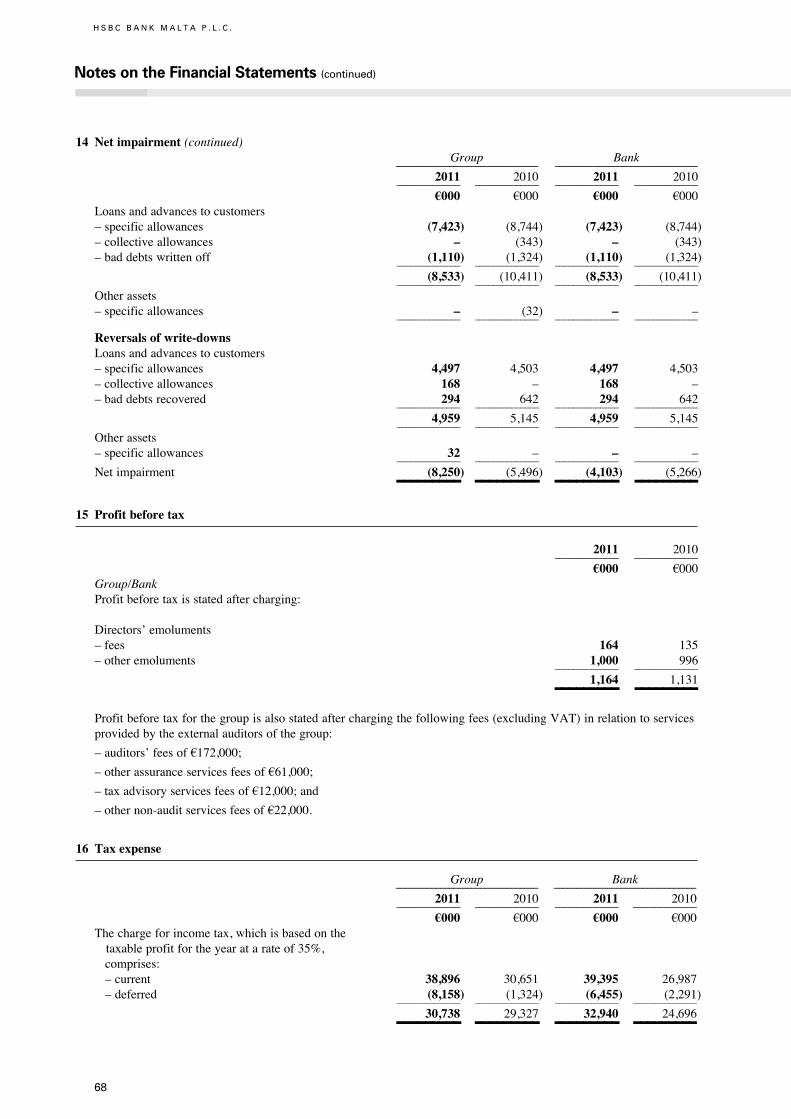
68
H S B C B A N K M A L T A P . L . C .
Notes on the Financial Statements (continued)
14 Net impairment (continued) Group Bank ________________________________ ________________________________
2011 2010 2011 2010 ______________ ______________ ______________ ______________
§000 §000 §000 §000Loansandadvancestocustomers–specificallowances (7,423) (8,744) (7,423) (8,744)–collectiveallowances – (343) – (343)–baddebtswrittenoff (1,110) (1,324) (1,110) (1,324) ______________ ______________ ______________ ______________
(8,533) (10,411) (8,533) (10,411) ______________ ______________ ______________ ______________
Otherassets–specificallowances – (32) – – ______________ ______________ ______________ ______________
Reversals of write-downsLoansandadvancestocustomers–specificallowances 4,497 4,503 4,497 4,503–collectiveallowances 168 – 168 ––baddebtsrecovered 294 642 294 642 ______________ ______________ ______________ ______________
4,959 5,145 4,959 5,145 ______________ ______________ ______________ ______________
Otherassets–specificallowances 32 – – – ______________ ______________ ______________ ______________
Netimpairment (8,250) (5,496) (4,103) (5,266) _________ _________ _________ _________15 Profit before tax
2011 2010 ______________ ______________
§000 §000Group/BankProfitbeforetaxisstatedaftercharging:
Directors’emoluments–fees 164 135–otheremoluments 1,000 996 ______________ ______________
1,164 1,131 _________ _________Profitbeforetaxforthegroupisalsostatedafterchargingthefollowingfees(excludingVAT)inrelationtoservicesprovidedbytheexternalauditorsofthegroup:
–auditors’feesof§172,000;
–otherassuranceservicesfeesof§61,000;
–taxadvisoryservicesfeesof§12,000;and
–othernon-auditservicesfeesof§22,000.
16 Tax expense
Group Bank ________________________________ ________________________________
2011 2010 2011 2010 ______________ ______________ ______________ ______________
§000 §000 §000 §000Thechargeforincometax,whichisbasedonthe taxableprofitfortheyearatarateof35%,comprises:–current 38,896 30,651 39,395 26,987–deferred (8,158) (1,324) (6,455) (2,291) ______________ ______________ ______________ ______________
30,738 29,327 32,940 24,696 _________ _________ _________ _________
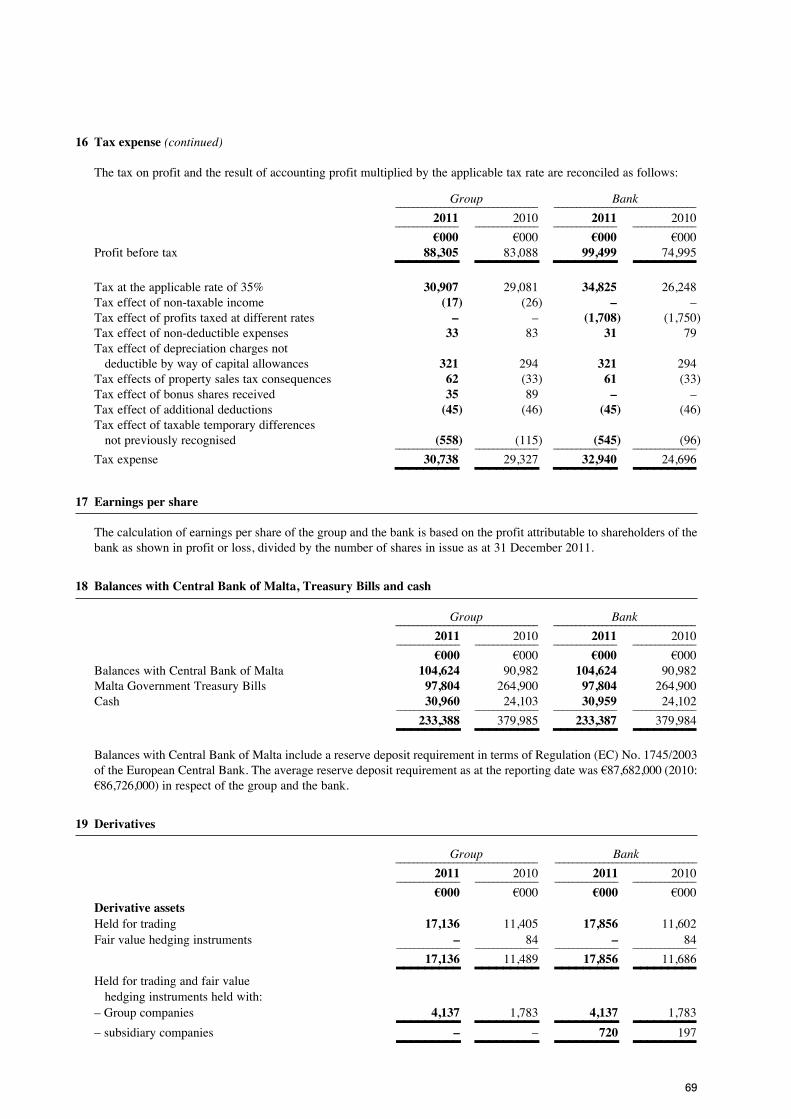
69
16 Tax expense (continued)
Thetaxonprofitandtheresultofaccountingprofitmultipliedbytheapplicabletaxratearereconciledasfollows:
Group Bank ________________________________ ________________________________
2011 2010 2011 2010 ______________ ______________ ______________ ______________
§000 §000 §000 §000Profitbeforetax 88,305 83,088 99,499 74,995 _________ _________ _________ _________Taxattheapplicablerateof35% 30,907 29,081 34,825 26,248Taxeffectofnon-taxableincome (17) (26) – –Taxeffectofprofitstaxedatdifferentrates – – (1,708) (1,750)Taxeffectofnon-deductibleexpenses 33 83 31 79Taxeffectofdepreciationchargesnotdeductiblebywayofcapitalallowances 321 294 321 294Taxeffectsofpropertysalestaxconsequences 62 (33) 61 (33)Taxeffectofbonussharesreceived 35 89 – –Taxeffectofadditionaldeductions (45) (46) (45) (46)Taxeffectoftaxabletemporarydifferencesnotpreviouslyrecognised (558) (115) (545) (96) ______________ ______________ ______________ ______________
Taxexpense 30,738 29,327 32,940 24,696 _________ _________ _________ _________17 Earnings per share
Thecalculationofearningspershareofthegroupandthebankisbasedontheprofitattributabletoshareholdersofthebankasshowninprofitorloss,dividedbythenumberofsharesinissueasat31December2011.
18 Balances with Central Bank of Malta, Treasury Bills and cash
Group Bank ________________________________ ________________________________
2011 2010 2011 2010 ______________ ______________ ______________ ______________
§000 §000 §000 §000BalanceswithCentralBankofMalta 104,624 90,982 104,624 90,982MaltaGovernmentTreasuryBills 97,804 264,900 97,804 264,900Cash 30,960 24,103 30,959 24,102 ______________ ______________ ______________ ______________
233,388 379,985 233,387 379,984 _________ _________ _________ _________BalanceswithCentralBankofMaltaincludeareservedepositrequirementintermsofRegulation(EC)No.1745/2003oftheEuropeanCentralBank.Theaveragereservedepositrequirementasatthereportingdatewas§87,682,000(2010:§86,726,000)inrespectofthegroupandthebank.
19 Derivatives
Group Bank ________________________________ ________________________________
2011 2010 2011 2010 ______________ ______________ ______________ ______________
§000 §000 §000 §000Derivative assetsHeldfortrading 17,136 11,405 17,856 11,602Fairvaluehedginginstruments – 84 – 84 ______________ ______________ ______________ ______________
17,136 11,489 17,856 11,686 _________ _________ _________ _________Heldfortradingandfairvaluehedginginstrumentsheldwith:–Groupcompanies 4,137 1,783 4,137 1,783 _________ _________ _________ _________–subsidiarycompanies – – 720 197 _________ _________ _________ _________

70
H S B C B A N K M A L T A P . L . C .
Notes on the Financial Statements (continued)
19 Derivatives (continued) Group Bank ________________________________ ________________________________
2011 2010 2011 2010 ______________ ______________ ______________ ______________
§000 §000 §000 §000Derivative liabilitiesHeldfortrading 17,810 12,311 17,810 12,313 _________ _________ _________ _________Heldfortradinginstrumentsheldwith:–Groupcompanies 12,972 9,951 12,972 9,951 _________ _________ _________ _________–subsidiarycompanies – – – 2 _________ _________ _________ _________a Derivativesheldfortrading
Fairvalue Fairvalue Fairvalue Fairvalue Notional assets liabilities Notional assets liabilities ______________ ______________ ______________ ______________ ______________ ______________
2011 2011 2011 2010 2010 2010 ______________ ______________ ______________ ______________ ______________ ______________
§000 §000 §000 §000 §000 §000 Group
Interest rate derivativesOverthecounterproducts–interestrateswapspurchased 177,888 11,134 – 182,488 9,103 ––interestrateswapswritten 177,888 – 11,716 182,488 – 9,585Currency derivativesOverthecounterproducts–foreignexchangecontracts 128,494 2,973 2,949 92,156 935 1,357–foreignexchangeoptionspurchased 11,322 1,148 142 9,424 148 ––foreignexchangeoptionswritten 11,322 26 1,148 9,424 – 150Equity derivativesOverthecounterproducts–equityindexoptionspurchased 12,768 1,855 – 19,573 1,219 ––equityindexoptionswritten 12,768 – 1,855 19,573 – 1,219 ______________ ______________ ______________ ______________ 17,136 17,810 11,405 12,311 _________ _________ _________ _________
BankInterest rate derivativesOverthecounterproducts–interestrateswapspurchased 177,888 11,134 – 182,488 9,103 ––interestrateswapswritten 177,888 – 11,716 182,488 – 9,585Currency derivativesOverthecounterproducts–foreignexchangecontracts 138,468 3,693 2,949 101,772 1,132 1,359–foreignexchangeoptionspurchased 11,322 1,148 142 9,424 148 ––foreignexchangeoptionswritten 11,322 26 1,148 9,424 – 150Equity derivativesOverthecounterproducts–equityindexoptionspurchased 12,768 1,855 – 19,573 1,219 ––equityindexoptionswritten 12,768 – 1,855 19,573 – 1,219 ______________ ______________ ______________ ______________
17,856 17,810 11,602 12,313 _________ _________ _________ _________

71
19 Derivatives (continued)
b Fairvaluehedginginstruments
Fairvalue Fairvalue Fairvalue Fairvalue Notional assets liabilities Notional assets liabilities ______________ ______________ ______________ ______________ ______________ ______________
2011 2011 2011 2010 2010 2010 ______________ ______________ ______________ ______________ ______________ ______________
§000 §000 §000 §000 §000 §000 Group/Bank
Fair value hedging instrumentsOverthecounterproducts–interestrateswapspurchased – – – 66,042 84 – _________ _________ _________ _________
Thegroupusesinterestrateswapstohedgeitsexposuretochangesinfairvalueofcertainfixedratedepositliabilitiesattributabletochangesinmarketsectorinterestrates.Therewerenodesignatedhedginginstrumentsasat31December2011.
20 Financial assets designated at fair value
Group ________________________________
2011 2010 ______________ ______________
§000 §000Debt,TreasuryBillsandotherfixedincomeinstruments 216,172 141,547Equityandothernon-fixedincomeinstruments 153,908 164,022 ______________ ______________
370,080 305,569 _________ _________
a Debt,TreasuryBillsandotherfixedincomeinstruments Group ________________________________
2011 2010 ______________ ______________
§000 §000 Issuedbypublicbodies –localgovernment 57,468 54,599 –foreigngovernment 70,559 45,188
Issuedbyotherissuers –localbanks 3,184 1,948
–foreignbanks 27,702 9,230–otherslocal 3,860 4,710–othersforeign 53,399 25,872 ______________ ______________
216,172 141,547 _________ _________Listingstatus–listedontheMaltaStockExchange 64,512 62,015–listedelsewhere 151,660 79,532 ______________ ______________
216,172 141,547 _________ _________ At1January 141,547 100,373
Exchangeadjustments 34 (49)Additions 157,258 66,654Disposals/Redemptions (81,304) (24,781)Changesinfairvalue (1,363) (650) ______________ ______________
At31December 216,172 141,547 _________ _________
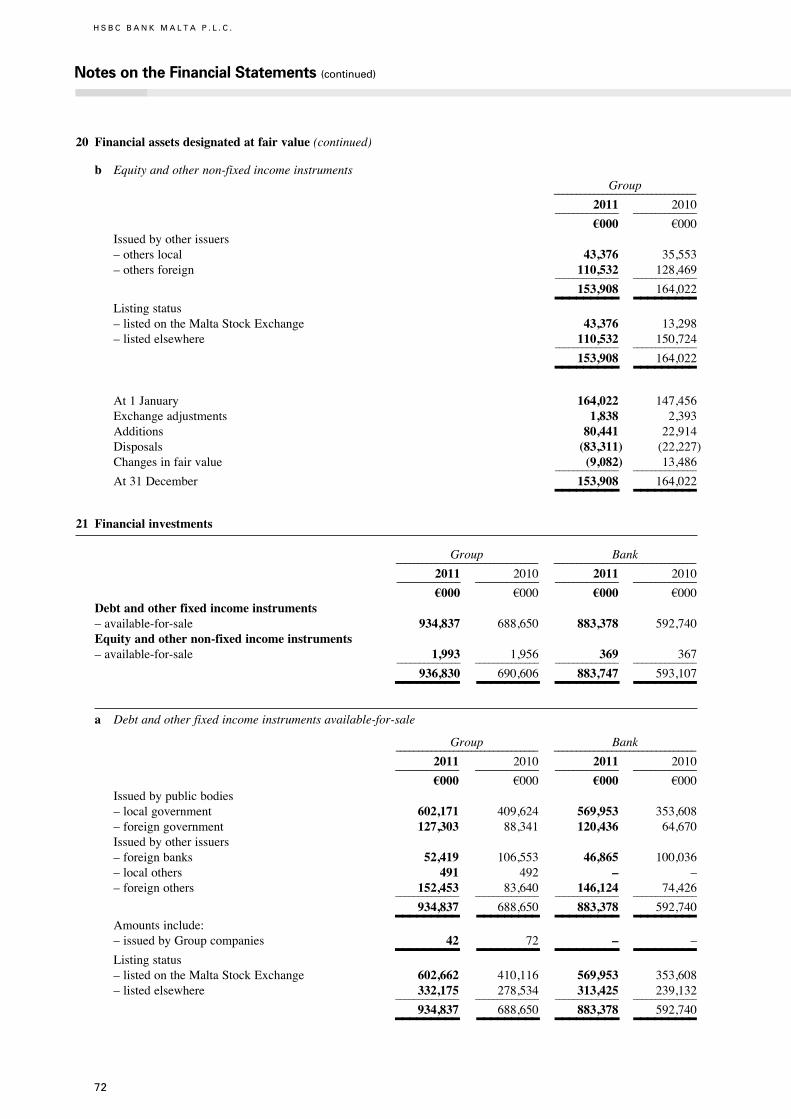
72
H S B C B A N K M A L T A P . L . C .
Notes on the Financial Statements (continued)
20 Financial assets designated at fair value (continued)
b Equityandothernon-fixedincomeinstruments Group ________________________________
2011 2010 ______________ ______________
§000 §000Issuedbyotherissuers–otherslocal 43,376 35,553–othersforeign 110,532 128,469 ______________ ______________
153,908 164,022 _________ _________Listingstatus–listedontheMaltaStockExchange 43,376 13,298–listedelsewhere 110,532 150,724 ______________ ______________
153,908 164,022 _________ _________
At1January 164,022 147,456Exchangeadjustments 1,838 2,393Additions 80,441 22,914Disposals (83,311) (22,227)Changesinfairvalue (9,082) 13,486 ______________ ______________
At31December 153,908 164,022 _________ _________21 Financial investments
Group Bank ________________________________ ________________________________
2011 2010 2011 2010 ______________ ______________ ______________ ______________
§000 §000 §000 §000Debt and other fixed income instruments–available-for-sale 934,837 688,650 883,378 592,740Equity and other non-fixed income instruments–available-for-sale 1,993 1,956 369 367 ______________ ______________ ______________ ______________
936,830 690,606 883,747 593,107 _________ _________ _________ _________
a Debtandotherfixedincomeinstrumentsavailable-for-sale
Group Bank ________________________________ ________________________________
2011 2010 2011 2010 ______________ ______________ ______________ ______________
§000 §000 §000 §000Issuedbypublicbodies–localgovernment 602,171 409,624 569,953 353,608–foreigngovernment 127,303 88,341 120,436 64,670Issuedbyotherissuers–foreignbanks 52,419 106,553 46,865 100,036–localothers 491 492 – ––foreignothers 152,453 83,640 146,124 74,426 ______________ ______________ ______________ ______________
934,837 688,650 883,378 592,740 _________ _________ _________ _________Amountsinclude:–issuedbyGroupcompanies 42 72 – – _________ _________ _________ _________Listingstatus–listedontheMaltaStockExchange 602,662 410,116 569,953 353,608–listedelsewhere 332,175 278,534 313,425 239,132 ______________ ______________ ______________ ______________
934,837 688,650 883,378 592,740 _________ _________ _________ _________
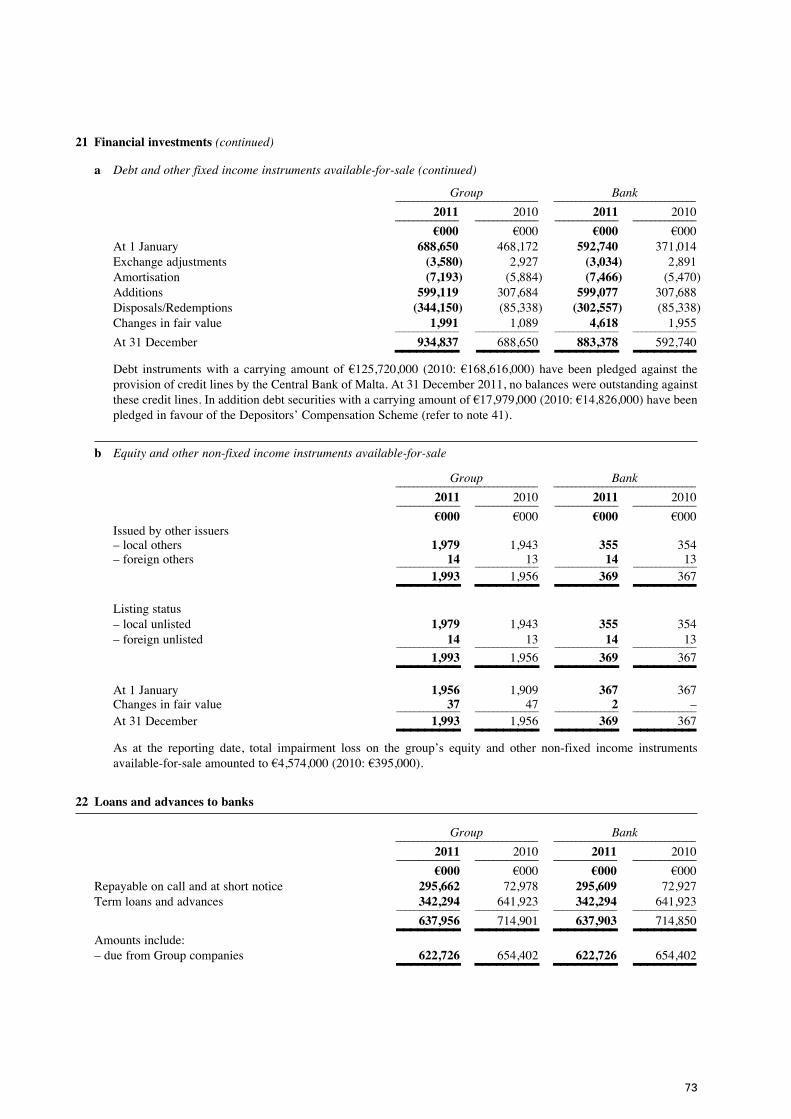
73
21 Financial investments (continued)
a Debtandotherfixedincomeinstrumentsavailable-for-sale (continued)
Group Bank ________________________________ ________________________________
2011 2010 2011 2010 ______________ ______________ ______________ ______________
§000 §000 §000 §000At1January 688,650 468,172 592,740 371,014Exchangeadjustments (3,580) 2,927 (3,034) 2,891Amortisation (7,193) (5,884) (7,466) (5,470)Additions 599,119 307,684 599,077 307,688Disposals/Redemptions (344,150) (85,338) (302,557) (85,338)Changesinfairvalue 1,991 1,089 4,618 1,955 ______________ ______________ ______________ ______________
At31December 934,837 688,650 883,378 592,740 _________ _________ _________ _________Debt instrumentswith a carrying amount of §125,720,000 (2010: §168,616,000) have been pledged against theprovisionofcreditlinesbytheCentralBankofMalta.At31December2011,nobalanceswereoutstandingagainstthesecreditlines.Inadditiondebtsecuritieswithacarryingamountof§17,979,000(2010:§14,826,000)havebeenpledgedinfavouroftheDepositors’CompensationScheme(refertonote41).
b Equityandothernon-fixedincomeinstrumentsavailable-for-sale
Group Bank ________________________________ ________________________________
2011 2010 2011 2010 ______________ ______________ ______________ ______________
§000 §000 §000 §000Issuedbyotherissuers–localothers 1,979 1,943 355 354–foreignothers 14 13 14 13 ______________ ______________ ______________ ______________ 1,993 1,956 369 367 _________ _________ _________ _________Listingstatus–localunlisted 1,979 1,943 355 354–foreignunlisted 14 13 14 13 ______________ ______________ ______________ ______________
1,993 1,956 369 367 _________ _________ _________ _________At1January 1,956 1,909 367 367Changesinfairvalue 37 47 2 – ______________ ______________ ______________ ______________At31December 1,993 1,956 369 367 _________ _________ _________ _________As at the reporting date, total impairment loss on the group’s equity and other non-fixed income instrumentsavailable-for-saleamountedto§4,574,000(2010:§395,000).
22 Loans and advances to banks
Group Bank ________________________________ ________________________________
2011 2010 2011 2010 ______________ ______________ ______________ ______________
§000 §000 §000 §000Repayableoncallandatshortnotice 295,662 72,978 295,609 72,927Termloansandadvances 342,294 641,923 342,294 641,923 ______________ ______________ ______________ ______________
637,956 714,901 637,903 714,850 _________ _________ _________ _________Amountsinclude:–duefromGroupcompanies 622,726 654,402 622,726 654,402 _________ _________ _________ _________
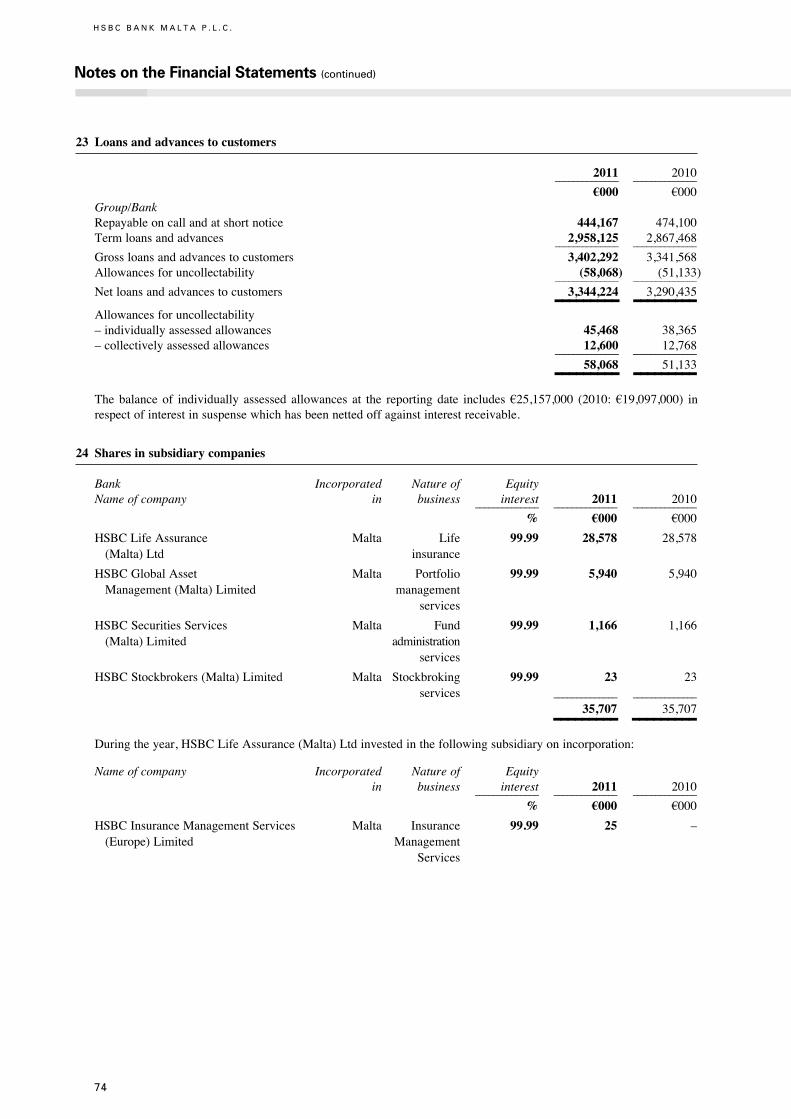
74
H S B C B A N K M A L T A P . L . C .
Notes on the Financial Statements (continued)
23 Loans and advances to customers
2011 2010 ______________ ______________
§000 §000Group/BankRepayableoncallandatshortnotice 444,167 474,100Termloansandadvances 2,958,125 2,867,468 ______________ ______________
Grossloansandadvancestocustomers 3,402,292 3,341,568Allowancesforuncollectability (58,068) (51,133) ______________ ______________
Netloansandadvancestocustomers 3,344,224 3,290,435 _________ _________Allowancesforuncollectability–individuallyassessedallowances 45,468 38,365–collectivelyassessedallowances 12,600 12,768 ______________ ______________
58,068 51,133 _________ _________Thebalance of individually assessed allowances at the reporting date includes §25,157,000 (2010: §19,097,000) inrespectofinterestinsuspensewhichhasbeennettedoffagainstinterestreceivable.
24 Shares in subsidiary companies
Bank Incorporated Natureof EquityNameofcompany in business interest 2011 2010 ______________ ______________ ______________
% §000 §000
HSBCLifeAssurance Malta Life 99.99 28,578 28,578(Malta)Ltd insurance
HSBCGlobalAsset Malta Portfolio 99.99 5,940 5,940Management(Malta)Limited management services
HSBCSecuritiesServices Malta Fund 99.99 1,166 1,166(Malta)Limited administration services
HSBCStockbrokers(Malta)Limited Malta Stockbroking 99.99 23 23 services ______________ ______________
35,707 35,707 _________ _________Duringtheyear,HSBCLifeAssurance(Malta)Ltdinvestedinthefollowingsubsidiaryonincorporation:
Nameofcompany Incorporated Natureof Equity in business interest 2011 2010 ______________ ______________ ______________
% §000 §000
HSBCInsuranceManagementServices Malta Insurance 99.99 25 –(Europe)Limited Management Services
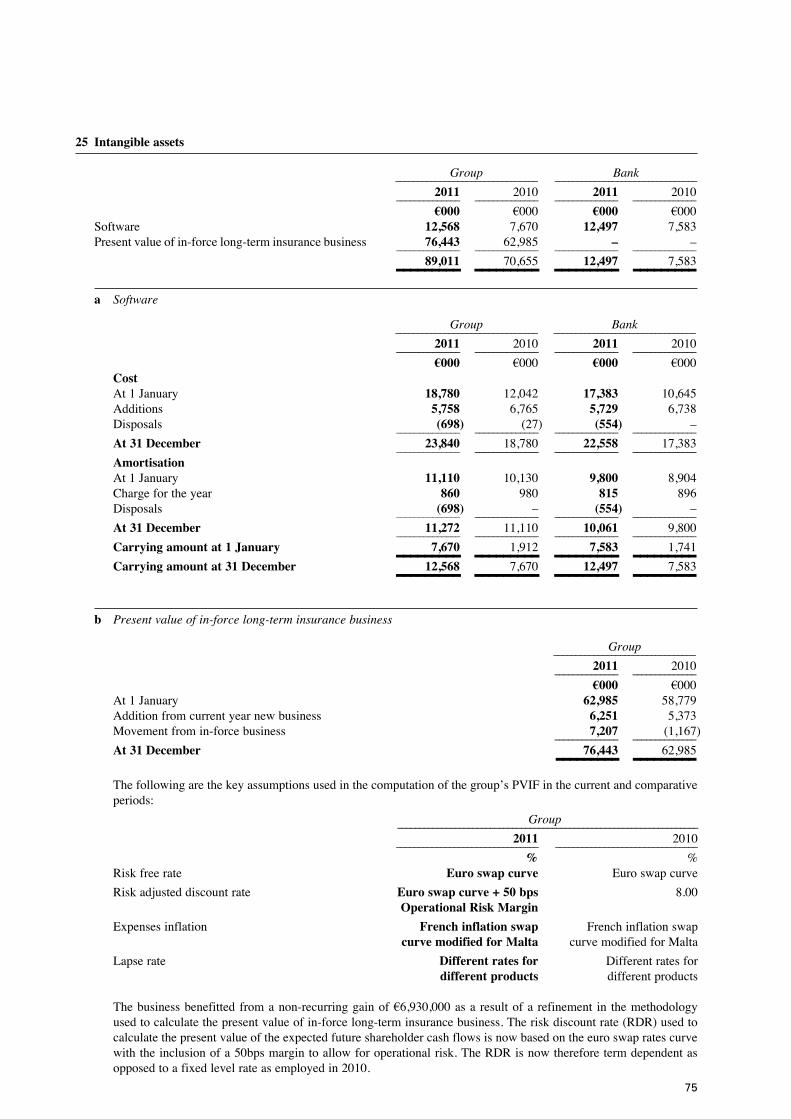
75
25 Intangible assets
Group Bank ________________________________ ________________________________
2011 2010 2011 2010 ______________ ______________ ______________ ______________
§000 §000 §000 §000Software 12,568 7,670 12,497 7,583Presentvalueofin-forcelong-terminsurancebusiness 76,443 62,985 – – ______________ ______________ ______________ ______________
89,011 70,655 12,497 7,583 _________ _________ _________ _________a Software
Group Bank ________________________________ ________________________________
2011 2010 2011 2010 ______________ ______________ ______________ ______________
§000 §000 §000 §000CostAt1January 18,780 12,042 17,383 10,645Additions 5,758 6,765 5,729 6,738Disposals (698) (27) (554) – ______________ ______________ ______________ ______________
At 31 December 23,840 18,780 22,558 17,383 ______________ ______________ ______________ ______________
AmortisationAt1January 11,110 10,130 9,800 8,904Chargefortheyear 860 980 815 896Disposals (698) – (554) – ______________ ______________ ______________ ______________
At 31 December 11,272 11,110 10,061 9,800 ______________ ______________ ______________ ______________
Carrying amountat 1 January 7,670 1,912 7,583 1,741 _________ _________ _________ _________Carrying amount at 31 December 12,568 7,670 12,497 7,583 _________ _________ _________ _________
b Presentvalueofin-forcelong-terminsurancebusiness Group ________________________________
2011 2010 ______________ ______________
§000 §000At1January 62,985 58,779Additionfromcurrentyearnewbusiness 6,251 5,373Movementfromin-forcebusiness 7,207 (1,167) ______________ ______________
At 31 December 76,443 62,985 _________ _________Thefollowingarethekeyassumptionsusedinthecomputationofthegroup’sPVIFinthecurrentandcomparativeperiods:
Group ____________________________________________________________________
2011 2010 ________________________________ ________________________________
% %Riskfreerate Euro swap curve Euroswapcurve
Riskadjusteddiscountrate Euro swap curve + 50 bps 8.00 Operational Risk Margin
Expensesinflation French inflation swap Frenchinflationswap curve modified for Malta curvemodifiedforMalta
Lapserate Different rates for Differentratesfor different products differentproducts
Thebusinessbenefitted fromanon-recurringgainof§6,930,000asa resultofa refinement in themethodologyusedtocalculatethepresentvalueofin-forcelong-terminsurancebusiness.Theriskdiscountrate(RDR)usedtocalculatethepresentvalueoftheexpectedfutureshareholdercashflowsisnowbasedontheeuroswapratescurvewiththeinclusionofa50bpsmargintoallowforoperationalrisk.TheRDRisnowthereforetermdependentasopposedtoafixedlevelrateasemployedin2010.
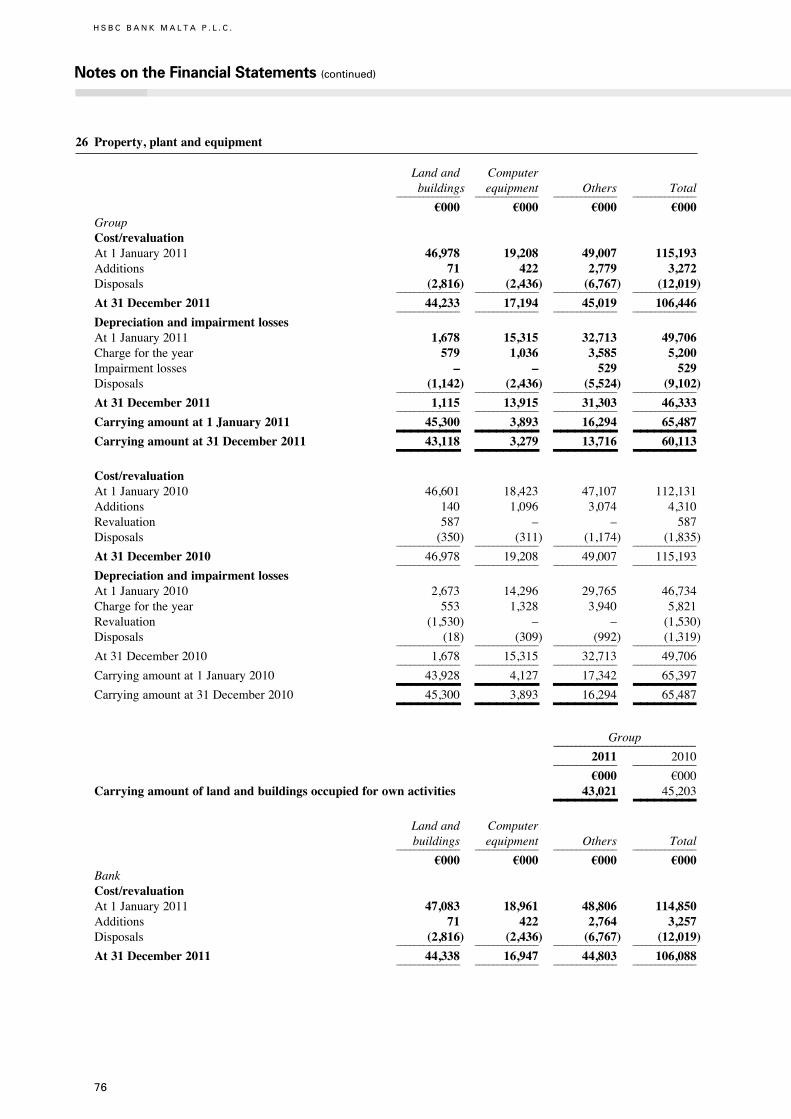
76
H S B C B A N K M A L T A P . L . C .
Notes on the Financial Statements (continued)
26 Property, plant and equipment
Landand Computer buildings equipment Others Total ______________ ______________ ______________ ______________
§000 §000 §000 §000GroupCost/revaluationAt1January2011 46,978 19,208 49,007 115,193Additions 71 422 2,779 3,272Disposals (2,816) (2,436) (6,767) (12,019) ______________ ______________ ______________ ______________
At 31 December 2011 44,233 17,194 45,019 106,446 ______________ ______________ ______________ ______________
Depreciation and impairment lossesAt1January2011 1,678 15,315 32,713 49,706Chargefortheyear 579 1,036 3,585 5,200Impairmentlosses – – 529 529Disposals (1,142) (2,436) (5,524) (9,102) ______________ ______________ ______________ ______________
At 31 December 2011 1,115 13,915 31,303 46,333 ______________ ______________ ______________ ______________
Carrying amount at 1 January 2011 45,300 3,893 16,294 65,487 _________ _________ _________ _________Carrying amount at 31 December 2011 43,118 3,279 13,716 60,113 _________ _________ _________ _________Cost/revaluationAt1January2010 46,601 18,423 47,107 112,131Additions 140 1,096 3,074 4,310Revaluation 587 – – 587Disposals (350) (311) (1,174) (1,835) ______________ ______________ ______________ ______________
At 31 December 2010 46,978 19,208 49,007 115,193 ______________ ______________ ______________ ______________
Depreciation and impairment lossesAt1January2010 2,673 14,296 29,765 46,734Chargefortheyear 553 1,328 3,940 5,821Revaluation (1,530) – – (1,530)Disposals (18) (309) (992) (1,319) ______________ ______________ ______________ ______________
At31December2010 1,678 15,315 32,713 49,706 ______________ ______________ ______________ ______________
Carryingamountat1January2010 43,928 4,127 17,342 65,397 _________ _________ _________ _________Carryingamountat31December2010 45,300 3,893 16,294 65,487 _________ _________ _________ _________ Group ________________________________
2011 2010 ______________ ______________
§000 §000Carrying amount of land and buildings occupied for own activities 43,021 45,203 _________ _________ Landand Computer buildings equipment Others Total ______________ ______________ ______________ ______________
§000 §000 §000 §000BankCost/revaluationAt1January2011 47,083 18,961 48,806 114,850Additions 71 422 2,764 3,257Disposals (2,816) (2,436) (6,767) (12,019) ______________ ______________ ______________ ______________
At 31 December 2011 44,338 16,947 44,803 106,088 ______________ ______________ ______________ ______________

77
26 Property, plant and equipment (continued)
Landand Computer buildings equipment Others Total ______________ ______________ ______________ ______________
§000 §000 §000 §000BankDepreciation and impairment lossesAt1January2011 1,678 15,069 32,523 49,270Chargefortheyear 579 1,035 3,582 5,196Impairmentlosses – – 529 529Disposals (1,142) (2,436) (5,524) (9,102) ______________ ______________ ______________ ______________
At 31 December 2011 1,115 13,668 31,110 45,893 ______________ ______________ ______________ ______________
Carrying amount at 1 January 2011 45,405 3,892 16,283 65,580 _________ _________ _________ _________Carrying amountat 31 December 2011 43,223 3,279 13,693 60,195 _________ _________ _________ _________Cost/revaluationAt1January2010 46,706 18,175 46,906 111,787Additions 140 1,096 3,074 4,310Revaluation 587 – – 587Disposals (350) (310) (1,174) (1,834) ______________ ______________ ______________ ______________
At31December2010 47,083 18,961 48,806 114,850 ______________ ______________ ______________ ______________
Depreciation and impairment lossesAt1January2010 2,673 14,082 29,562 46,317Chargefortheyear 553 1,372 3,877 5,802Revaluation (1,530) – – (1,530)Disposals (18) (385) (916) (1,319) ______________ ______________ ______________ ______________
At31December2010 1,678 15,069 32,523 49,270 ______________ ______________ ______________ ______________
Carryingamountat1January2010 44,033 4,093 17,344 65,470 _________ _________ _________ _________Carryingamountat31December2010 45,405 3,892 16,283 65,580 _________ _________ _________ _________ Bank ________________________________
2011 2010 ______________ ______________
§000 §000Carrying amount of land and buildings occupied for own activities 43,223 45,405 _________ _________Thecarryingamountoflandandbuildingsthatwouldhavebeenincludedinthefinancialstatementshadtheseassetsbeencarriedatcostlessdepreciationis§14,672,000(2010:§15,995,000)forthegroupandthebank.
LandandbuildingswererevaluedinSeptember2010.
27 Investment property
FairValue Cost FairValue Cost ______________ ______________ ______________ ______________
2011 2011 2010 2010 ______________ ______________ ______________ ______________
§000 §000 §000 §000GroupFreehold land and buildingsAsat1January 14,591 8,574 14,588 8,571Additions 19 19 3 3Fairvalueadjustments (12) – – – ______________ ______________ ______________ ______________
At31December 14,598 8,593 14,591 8,574 _________ _________ _________ _________
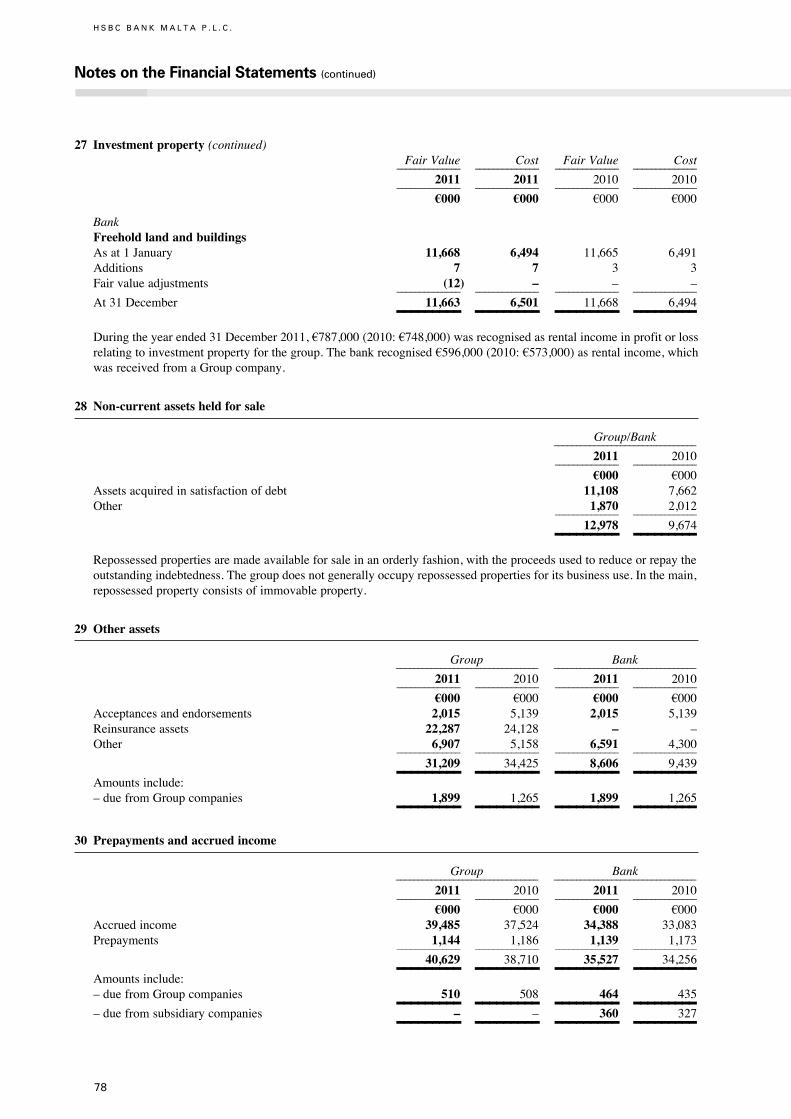
78
H S B C B A N K M A L T A P . L . C .
Notes on the Financial Statements (continued)
27 Investment property (continued) FairValue Cost FairValue Cost ______________ ______________ ______________ ______________
2011 2011 2010 2010 ______________ ______________ ______________ ______________
§000 §000 §000 §000
BankFreehold land and buildingsAsat1January 11,668 6,494 11,665 6,491Additions 7 7 3 3Fairvalueadjustments (12) – – – ______________ ______________ ______________ ______________
At31December 11,663 6,501 11,668 6,494 _________ _________ _________ _________Duringtheyearended31December2011,§787,000(2010:§748,000)wasrecognisedasrentalincomeinprofitorlossrelatingtoinvestmentpropertyforthegroup.Thebankrecognised§596,000(2010:§573,000)asrentalincome,whichwasreceivedfromaGroupcompany.
28 Non-current assets held for sale
Group/Bank ________________________________
2011 2010 ______________ ______________
§000 §000Assetsacquiredinsatisfactionofdebt 11,108 7,662Other 1,870 2,012 ______________ ______________
12,978 9,674 _________ _________Repossessedpropertiesaremadeavailableforsaleinanorderlyfashion,withtheproceedsusedtoreduceorrepaytheoutstandingindebtedness.Thegroupdoesnotgenerallyoccupyrepossessedpropertiesforitsbusinessuse.Inthemain,repossessedpropertyconsistsofimmovableproperty.
29 Other assets
Group Bank ________________________________ ________________________________
2011 2010 2011 2010 ______________ ______________ ______________ ______________
§000 §000 §000 §000Acceptancesandendorsements 2,015 5,139 2,015 5,139Reinsuranceassets 22,287 24,128 – –Other 6,907 5,158 6,591 4,300 ______________ ______________ ______________ ______________
31,209 34,425 8,606 9,439 _________ _________ _________ _________Amountsinclude:–duefromGroupcompanies 1,899 1,265 1,899 1,265 _________ _________ _________ _________
30 Prepayments and accrued income
Group Bank ________________________________ ________________________________
2011 2010 2011 2010 ______________ ______________ ______________ ______________
§000 §000 §000 §000Accruedincome 39,485 37,524 34,388 33,083Prepayments 1,144 1,186 1,139 1,173 ______________ ______________ ______________ ______________
40,629 38,710 35,527 34,256 _________ _________ _________ _________Amountsinclude:–duefromGroupcompanies 510 508 464 435 _________ _________ _________ _________–duefromsubsidiarycompanies – – 360 327 _________ _________ _________ _________
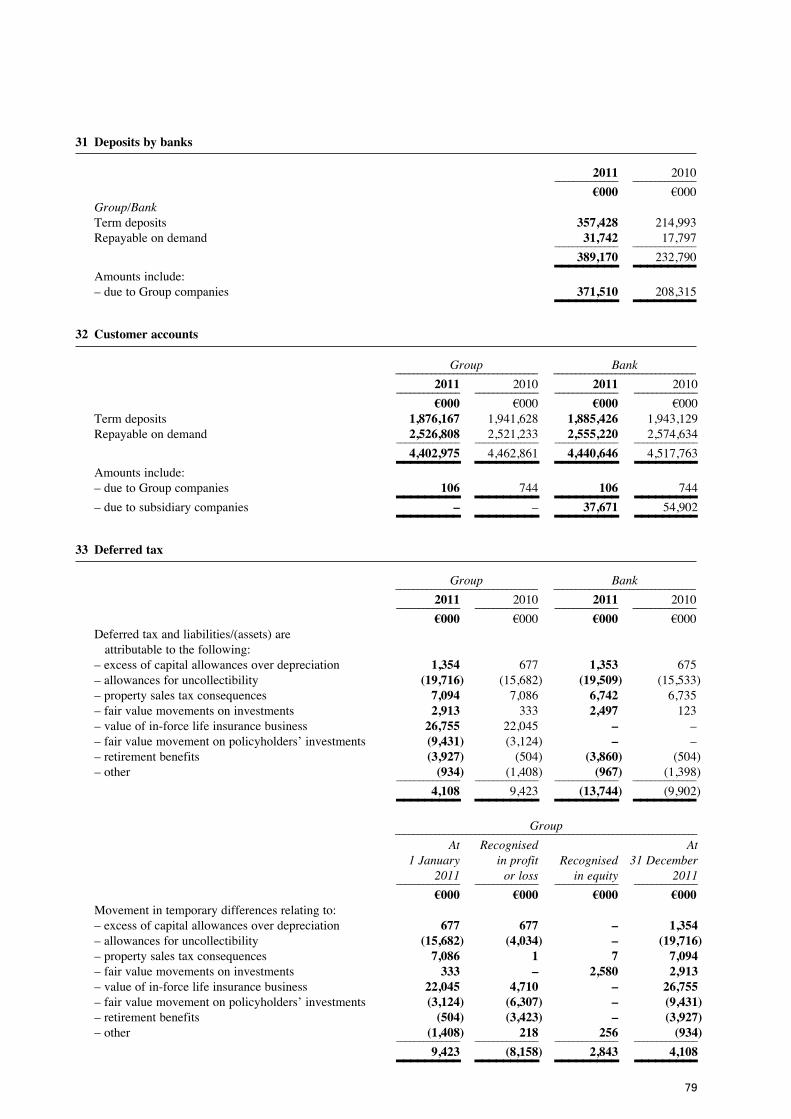
79
31 Deposits by banks
2011 2010 ______________ ______________
§000 §000Group/BankTermdeposits 357,428 214,993Repayableondemand 31,742 17,797 ______________ ______________
389,170 232,790 _________ _________Amountsinclude:–duetoGroupcompanies 371,510 208,315 _________ _________
32 Customer accounts
Group Bank ________________________________ ________________________________
2011 2010 2011 2010 ______________ ______________ ______________ ______________
§000 §000 §000 §000Termdeposits 1,876,167 1,941,628 1,885,426 1,943,129Repayableondemand 2,526,808 2,521,233 2,555,220 2,574,634 ______________ ______________ ______________ ______________
4,402,975 4,462,861 4,440,646 4,517,763 _________ _________ _________ _________Amountsinclude:–duetoGroupcompanies 106 744 106 744 _________ _________ _________ _________–duetosubsidiarycompanies – – 37,671 54,902 _________ _________ _________ _________
33 Deferred tax
Group Bank ________________________________ ________________________________
2011 2010 2011 2010 ______________ ______________ ______________ ______________
§000 §000 §000 §000Deferredtaxandliabilities/(assets)areattributabletothefollowing:–excessofcapitalallowancesoverdepreciation 1,354 677 1,353 675–allowancesforuncollectibility (19,716) (15,682) (19,509) (15,533)–propertysalestaxconsequences 7,094 7,086 6,742 6,735–fairvaluemovementsoninvestments 2,913 333 2,497 123–valueofin-forcelifeinsurancebusiness 26,755 22,045 – ––fairvaluemovementonpolicyholders’investments (9,431) (3,124) – ––retirementbenefits (3,927) (504) (3,860) (504)–other (934) (1,408) (967) (1,398) ______________ ______________ ______________ ______________
4,108 9,423 (13,744) (9,902) _________ _________ _________ _________ Group ____________________________________________________________________
At Recognised At 1January inprofit Recognised 31December 2011 orloss inequity 2011 ______________ ______________ ______________ ______________
§000 §000 §000 §000Movementintemporarydifferencesrelatingto:–excessofcapitalallowancesoverdepreciation 677 677 – 1,354–allowancesforuncollectibility (15,682) (4,034) – (19,716)–propertysalestaxconsequences 7,086 1 7 7,094–fairvaluemovementsoninvestments 333 – 2,580 2,913–valueofin-forcelifeinsurancebusiness 22,045 4,710 – 26,755–fairvaluemovementonpolicyholders’investments (3,124) (6,307) – (9,431)–retirementbenefits (504) (3,423) – (3,927)–other (1,408) 218 256 (934) ______________ ______________ ______________ ______________
9,423 (8,158) 2,843 4,108 _________ _________ _________ _________
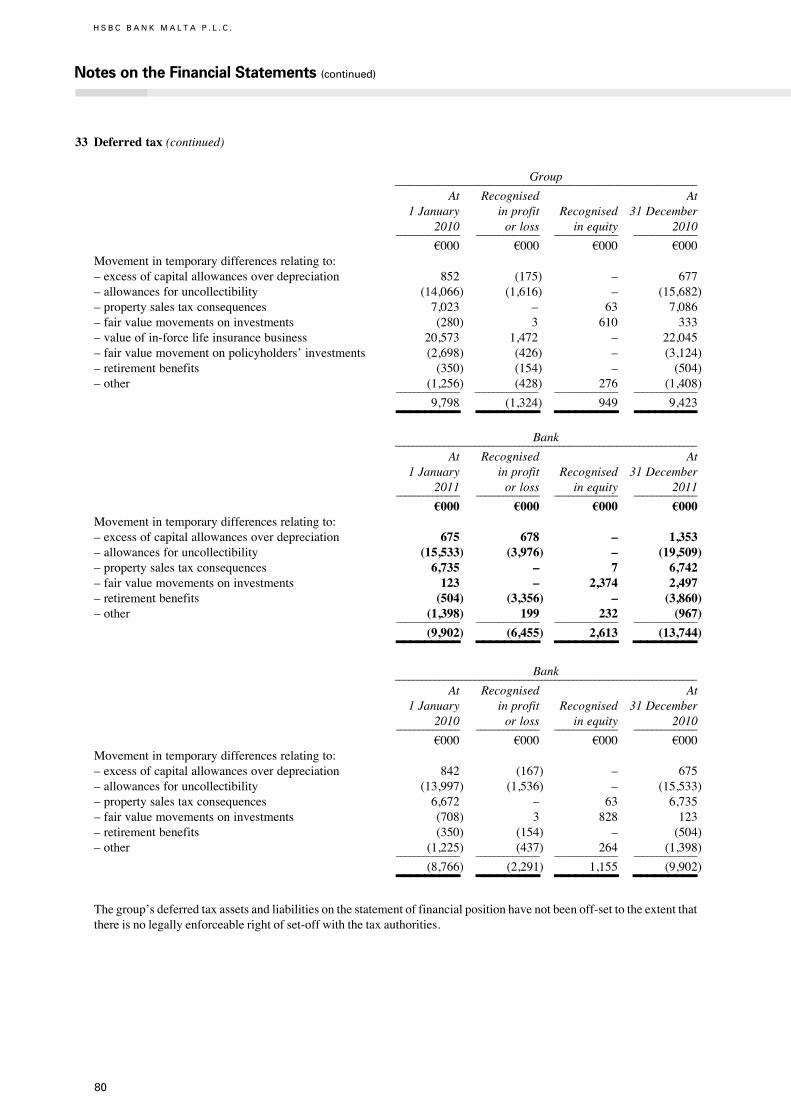
80
H S B C B A N K M A L T A P . L . C .
Notes on the Financial Statements (continued)
33 Deferred tax (continued)
Group ____________________________________________________________________
At Recognised At 1January inprofit Recognised 31December 2010 orloss inequity 2010 ______________ ______________ ______________ ______________
§000 §000 §000 §000Movementintemporarydifferencesrelatingto:–excessofcapitalallowancesoverdepreciation 852 (175) – 677–allowancesforuncollectibility (14,066) (1,616) – (15,682)–propertysalestaxconsequences 7,023 – 63 7,086–fairvaluemovementsoninvestments (280) 3 610 333–valueofin-forcelifeinsurancebusiness 20,573 1,472 – 22,045–fairvaluemovementonpolicyholders’investments (2,698) (426) – (3,124)–retirementbenefits (350) (154) – (504)–other (1,256) (428) 276 (1,408) ______________ ______________ ______________ ______________
9,798 (1,324) 949 9,423 _________ _________ _________ _________ Bank ____________________________________________________________________
At Recognised At 1January inprofit Recognised 31December 2011 orloss inequity 2011 ______________ ______________ ______________ ______________
§000 §000 §000 §000Movementintemporarydifferencesrelatingto:–excessofcapitalallowancesoverdepreciation 675 678 – 1,353–allowancesforuncollectibility (15,533) (3,976) – (19,509)–propertysalestaxconsequences 6,735 – 7 6,742–fairvaluemovementsoninvestments 123 – 2,374 2,497–retirementbenefits (504) (3,356) – (3,860)–other (1,398) 199 232 (967) ______________ ______________ ______________ ______________
(9,902) (6,455) 2,613 (13,744) _________ _________ _________ _________ Bank ____________________________________________________________________
At Recognised At 1January inprofit Recognised 31December 2010 orloss inequity 2010 ______________ ______________ ______________ ______________
§000 §000 §000 §000Movementintemporarydifferencesrelatingto:–excessofcapitalallowancesoverdepreciation 842 (167) – 675–allowancesforuncollectibility (13,997) (1,536) – (15,533)–propertysalestaxconsequences 6,672 – 63 6,735–fairvaluemovementsoninvestments (708) 3 828 123–retirementbenefits (350) (154) – (504)–other (1,225) (437) 264 (1,398) ______________ ______________ ______________ ______________
(8,766) (2,291) 1,155 (9,902) _________ _________ _________ _________Thegroup’sdeferredtaxassetsandliabilitiesonthestatementoffinancialpositionhavenotbeenoff-settotheextentthatthereisnolegallyenforceablerightofset-offwiththetaxauthorities.

81
34 Liabilities to customers under investment contracts
Group ______________________________
2011 2010 ______________ ______________
§000 §000At1January 18,962 16,853Premiumsreceived 552 1,653Amountspaidonsurrenderandotherterminationduringtheyear (1,381) (1,236)Changesinunitpricesandothermovements (1,213) 1,692 ______________ ______________
At31December 16,920 18,962 _________ _________35 Liabilities under insurance contracts issued
Group ______________________________
Gross Gross ______________ ______________
2011 2010 ______________ ______________
§000 §000Life insurance (non-linked)Provisionsforpolicyholders 317,835 285,546Outstandingclaims 2,212 12,156 ______________ ______________
Total non-linked 320,047 297,702 _________ _________Life insurance (linked)Provisionsforpolicyholders 116,561 112,346Outstandingclaims 64 413 ______________ ______________
Total linked 116,625 112,759 _________ _________Total liabilities under insurance contracts 436,672 410,461 _________ _________ Group _____________________________________________________________________
Non-linked Linked business business Allbusiness __________________ __________________ __________________
Provisions Provisions forpolicy- forpolicy- Outstanding holders holders claims Total __________________ __________________ __________________ __________________
2011 2011 2011 2011 __________________ __________________ __________________ __________________
§000 §000 §000 §000At1January 285,546 112,346 12,569 410,461Claimsinrespect ofnewbusiness – 28,288 2,251 30,539Movementfortheyear 32,289 (24,073) (891) 7,325Previousyearclaimspaid – – (11,653) (11,653) __________________ __________________ __________________ __________________
At31December 317,835 116,561 2,276 436,672 ______________ ______________ ______________ ______________ __________________ __________________ __________________ __________________
2010 2010 2010 2010 __________________ __________________ __________________ __________________
§000 §000 §000 §000At1January 260,187 88,572 2,754 351,513Claimsinrespectofnewbusiness – 333 12,988 13,321Movementfortheyear 25,359 23,532 (1,897) 46,994Previousyearclaimspaid – (91) (1,276) (1,367) __________________ __________________ __________________ __________________
At31December 285,546 112,346 12,569 410,461 ______________ ______________ ______________ ______________

82
H S B C B A N K M A L T A P . L . C .
Notes on the Financial Statements (continued)
36 Other liabilities
Group Bank ________________________________ ________________________________
2011 2010 2011 2010 ______________ ______________ ______________ ______________
§000 §000 §000 §000Billspayable 21,775 12,189 21,775 12,189Cashcollateralforcommitments 190 136 190 136Obligationsunderfinanceleases 67 136 67 136Acceptancesandendorsements 2,015 5,139 2,015 5,139Other 14,098 15,424 9,878 11,721 ______________ ______________ ______________ ______________
38,145 33,024 33,925 29,321 _________ _________ _________ _________37 Accruals and deferred income
Group Bank ________________________________ ________________________________
2011 2010 2011 2010 ______________ ______________ ______________ ______________
§000 §000 §000 §000Accruedinterest 18,553 18,432 18,670 18,570Other 17,426 15,855 16,482 14,740 ______________ ______________ ______________ ______________
35,979 34,287 35,152 33,310 _________ _________ _________ _________Amountsinclude:–duetoGroupcompanies 3,723 2,582 3,296 2,213 _________ _________ _________ _________–duetosubsidiarycompanies – – 117 138 _________ _________ _________ _________
38 Provisions for liabilities and other charges
Group Bank ________________________________ ________________________________
2011 2010 2011 2010 ______________ ______________ ______________ ______________
§000 §000 §000 §000At1January 2,548 577 2,511 514Provisionsmadeduringtheyear 10,832 2,036 10,627 2,017Provisionsreversedduringtheyear (1,704) (20) (1,704) (20)Provisionsutilisedduringtheyear (425) (45) (403) – ______________ ______________ ______________ ______________
At31December 11,251 2,548 11,031 2,511 _________ _________ _________ _________Provisions for liabilities and other charges include amounts raised in relation to litigations and early voluntaryretirementscheme.
The bank is a party to legal actions arising from normal business operations.Management believes that adequateprovisionshavebeenmadeagainsttheselitigations,basedonlegaladvice,onthetimingandamountofthepossibleeconomicoutflows.
Refertonote13fordetailsoftheearlyvoluntaryretirementschemeprovision.
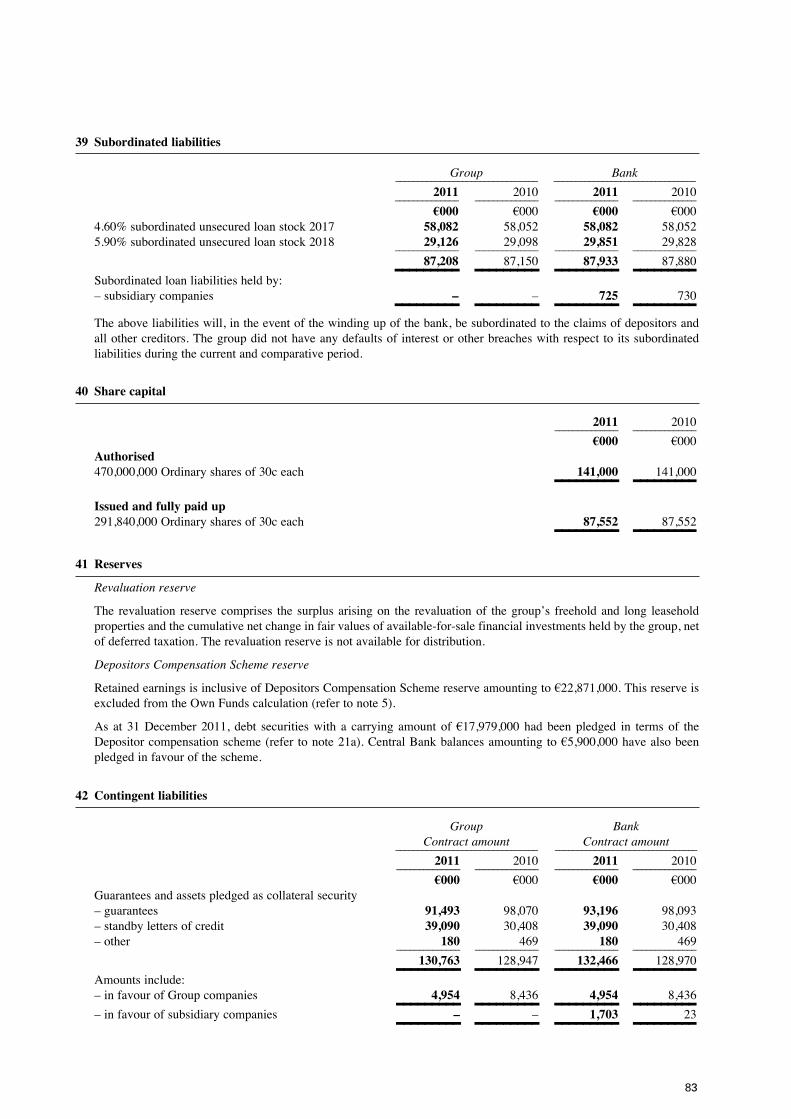
83
39 Subordinated liabilities
Group Bank ________________________________ ________________________________
2011 2010 2011 2010 ______________ ______________ ______________ ______________
§000 §000 §000 §0004.60%subordinatedunsecuredloanstock2017 58,082 58,052 58,082 58,0525.90%subordinatedunsecuredloanstock2018 29,126 29,098 29,851 29,828 ______________ ______________ ______________ ______________
87,208 87,150 87,933 87,880 _________ _________ _________ _________Subordinatedloanliabilitiesheldby:–subsidiarycompanies – – 725 730 _________ _________ _________ _________Theaboveliabilitieswill,intheeventofthewindingupofthebank,besubordinatedtotheclaimsofdepositorsandallothercreditors.Thegroupdidnothaveanydefaultsof interestorotherbreacheswithrespect toitssubordinatedliabilitiesduringthecurrentandcomparativeperiod.
40 Share capital
2011 2010 ______________ ______________
§000 §000Authorised470,000,000Ordinarysharesof30ceach 141,000 141,000 _________ _________Issued and fully paid up291,840,000Ordinarysharesof30ceach 87,552 87,552 _________ _________
41 Reserves
Revaluationreserve
The revaluation reservecomprises the surplus arisingon the revaluationof thegroup’s freeholdand long leaseholdpropertiesandthecumulativenetchangeinfairvaluesofavailable-for-salefinancialinvestmentsheldbythegroup,netofdeferredtaxation.Therevaluationreserveisnotavailablefordistribution.
DepositorsCompensationSchemereserve
RetainedearningsisinclusiveofDepositorsCompensationSchemereserveamountingto§22,871,000.ThisreserveisexcludedfromtheOwnFundscalculation(refertonote5).
As at 31December 2011, debt securitieswith a carrying amount of §17,979,000 had been pledged in terms of theDepositorcompensationscheme(refer tonote21a).CentralBankbalancesamounting to§5,900,000havealsobeenpledgedinfavourofthescheme.
42 Contingent liabilities
Group Bank Contractamount Contractamount ________________________________ ________________________________
2011 2010 2011 2010 ______________ ______________ ______________ ______________
§000 §000 §000 §000Guaranteesandassetspledgedascollateralsecurity–guarantees 91,493 98,070 93,196 98,093–standbylettersofcredit 39,090 30,408 39,090 30,408–other 180 469 180 469 ______________ ______________ ______________ ______________
130,763 128,947 132,466 128,970 _________ _________ _________ _________Amountsinclude:–infavourofGroupcompanies 4,954 8,436 4,954 8,436 _________ _________ _________ _________–infavourofsubsidiarycompanies – – 1,703 23 _________ _________ _________ _________
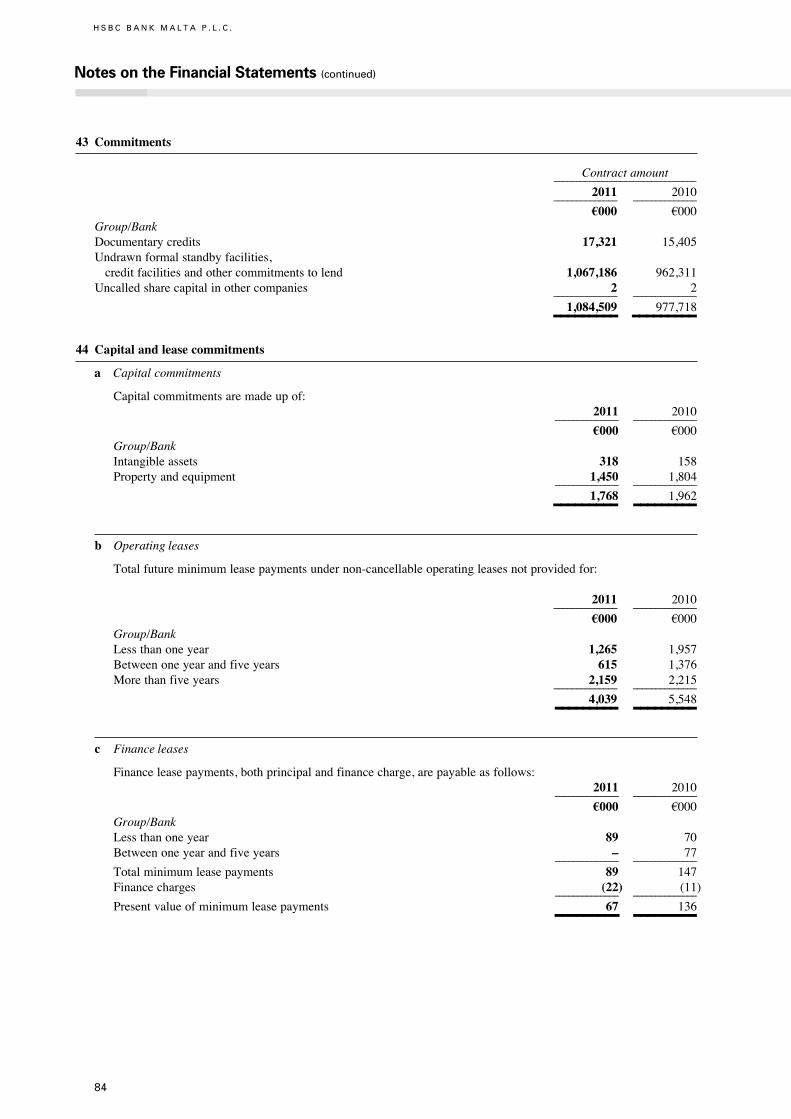
84
H S B C B A N K M A L T A P . L . C .
Notes on the Financial Statements (continued)
43 Commitments
Contractamount ________________________________
2011 2010 ______________ ______________
§000 §000Group/BankDocumentarycredits 17,321 15,405Undrawnformalstandbyfacilities,creditfacilitiesandothercommitmentstolend 1,067,186 962,311Uncalledsharecapitalinothercompanies 2 2 ______________ ______________
1,084,509 977,718 _________ _________ 44 Capital and lease commitments
a Capitalcommitments
Capitalcommitmentsaremadeupof: 2011 2010 ______________ ______________
§000 §000Group/BankIntangibleassets 318 158Propertyandequipment 1,450 1,804 ______________ ______________
1,768 1,962 _________ _________b Operatingleases
Totalfutureminimumleasepaymentsundernon-cancellableoperatingleasesnotprovidedfor:
2011 2010 ______________ ______________
§000 §000Group/BankLessthanoneyear 1,265 1,957Betweenoneyearandfiveyears 615 1,376Morethanfiveyears 2,159 2,215 ______________ ______________
4,039 5,548 _________ _________c Financeleases
Financeleasepayments,bothprincipalandfinancecharge,arepayableasfollows: 2011 2010 ______________ ______________
§000 §000Group/BankLessthanoneyear 89 70Betweenoneyearandfiveyears – 77 ______________ ______________
Totalminimumleasepayments 89 147Financecharges (22) (11) ______________ ______________
Presentvalueofminimumleasepayments 67 136 _________ _________
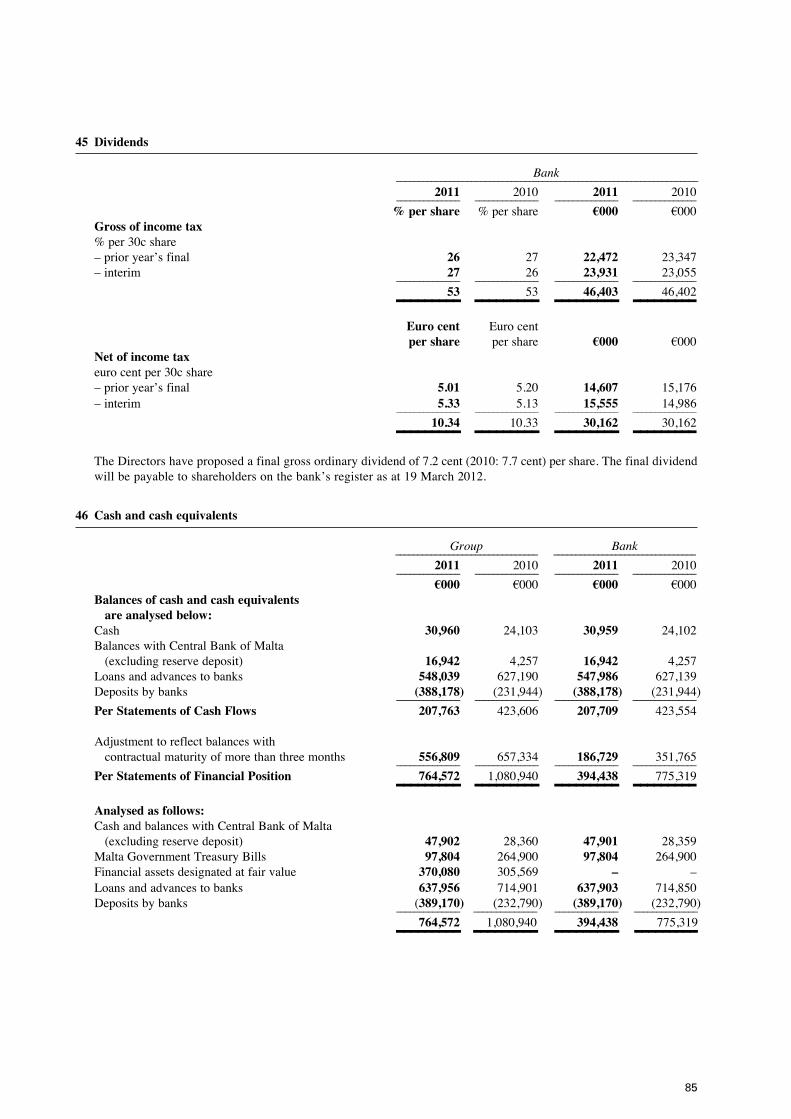
85
45 Dividends
Bank ____________________________________________________________________
2011 2010 2011 2010 ______________ ______________ ______________ ______________
% per share %pershare §000 §000Gross of income tax%per30cshare–prioryear’sfinal 26 27 22,472 23,347–interim 27 26 23,931 23,055 ______________ ______________ ______________ ______________
53 53 46,403 46,402 _________ _________ _________ _________ Euro cent Eurocent per share pershare §000 §000Net of income taxeurocentper30cshare–prioryear’sfinal 5.01 5.20 14,607 15,176–interim 5.33 5.13 15,555 14,986 ______________ ______________ ______________ ______________
10.34 10.33 30,162 30,162 _________ _________ _________ _________TheDirectorshaveproposedafinalgrossordinarydividendof7.2cent(2010:7.7cent)pershare.Thefinaldividendwillbepayabletoshareholdersonthebank’sregisterasat19March2012.
46 Cash and cash equivalents
Group Bank ________________________________ ________________________________
2011 2010 2011 2010 ______________ ______________ ______________ ______________
§000 §000 §000 §000Balances of cash and cash equivalents are analysed below:Cash 30,960 24,103 30,959 24,102BalanceswithCentralBankofMalta(excludingreservedeposit) 16,942 4,257 16,942 4,257Loansandadvancestobanks 548,039 627,190 547,986 627,139Depositsbybanks (388,178) (231,944) (388,178) (231,944) ______________ ______________ ______________ ______________
Per Statements of Cash Flows 207,763 423,606 207,709 423,554
Adjustmenttoreflectbalanceswithcontractualmaturityofmorethanthreemonths 556,809 657,334 186,729 351,765 ______________ ______________ ______________ ______________
Per Statements of Financial Position 764,572 1,080,940 394,438 775,319 _________ _________ _________ _________Analysed as follows:CashandbalanceswithCentralBankofMalta(excludingreservedeposit) 47,902 28,360 47,901 28,359MaltaGovernmentTreasuryBills 97,804 264,900 97,804 264,900Financialassetsdesignatedatfairvalue 370,080 305,569 – –Loansandadvancestobanks 637,956 714,901 637,903 714,850Depositsbybanks (389,170) (232,790) (389,170) (232,790) ______________ ______________ ______________ ______________
764,572 1,080,940 394,438 775,319 _________ _________ _________ _________
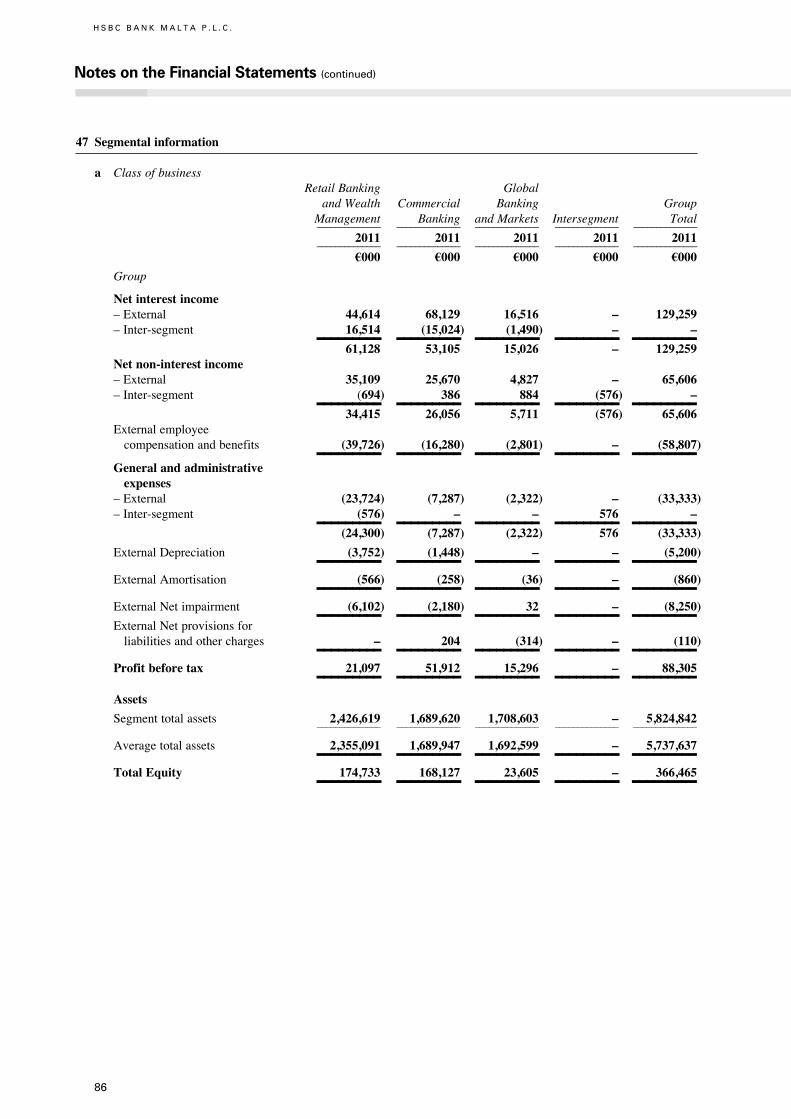
86
H S B C B A N K M A L T A P . L . C .
Notes on the Financial Statements (continued)
47 Segmental information
a Classofbusiness RetailBanking Global andWealth Commercial Banking Group Management Banking andMarkets Intersegment Total ______________ ______________ ______________ ______________ ______________
2011 2011 2011 2011 2011 ______________ ______________ ______________ ______________ ______________
§000 §000 §000 §000 §000
Group
Net interest income–External 44,614 68,129 16,516 – 129,259–Inter-segment 16,514 (15,024) (1,490) – – _________ _________ _________ _________ _________ 61,128 53,105 15,026 – 129,259Net non-interest income–External 35,109 25,670 4,827 – 65,606–Inter-segment (694) 386 884 (576) – _________ _________ _________ _________ _________ 34,415 26,056 5,711 (576) 65,606Externalemployeecompensationandbenefits (39,726) (16,280) (2,801) – (58,807) _________ _________ _________ _________ _________General and administrative expenses–External (23,724) (7,287) (2,322) – (33,333)–Inter-segment (576) – – 576 – _________ _________ _________ _________ _________ (24,300) (7,287) (2,322) 576 (33,333)
ExternalDepreciation (3,752) (1,448) – – (5,200) _________ _________ _________ _________ _________ExternalAmortisation (566) (258) (36) – (860) _________ _________ _________ _________ _________ExternalNetimpairment (6,102) (2,180) 32 – (8,250) _________ _________ _________ _________ _________ExternalNetprovisionsforliabilitiesandothercharges – 204 (314) – (110) _________ _________ _________ _________ _________Profit before tax 21,097 51,912 15,296 – 88,305 _________ _________ _________ _________ _________Assets
Segmenttotalassets 2,426,619 1,689,620 1,708,603 – 5,824,842 ______________ ______________ ______________ ______________ ______________
Averagetotalassets 2,355,091 1,689,947 1,692,599 – 5,737,637 _________ _________ _________ _________ _________Total Equity 174,733 168,127 23,605 – 366,465 _________ _________ _________ _________ _________
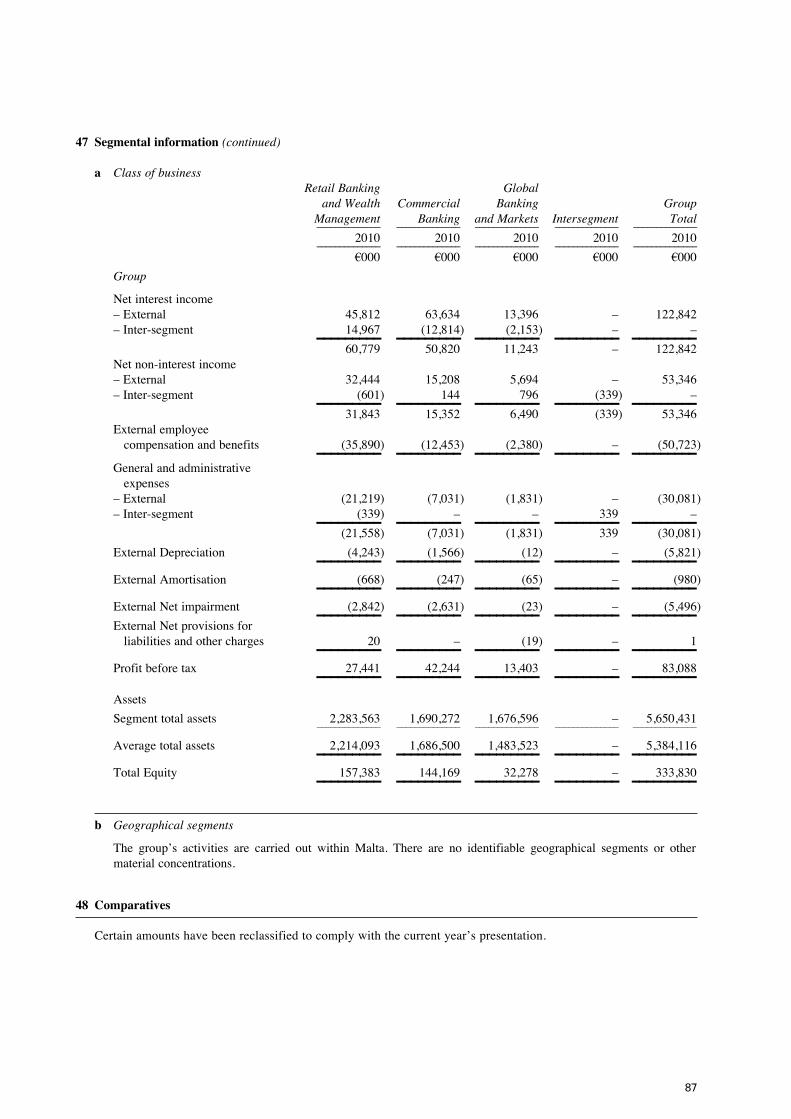
87
47 Segmental information (continued)
a Classofbusiness RetailBanking Global andWealth Commercial Banking Group Management Banking andMarkets Intersegment Total ______________ ______________ ______________ ______________ ______________
2010 2010 2010 2010 2010 ______________ ______________ ______________ ______________ ______________
§000 §000 §000 §000 §000
Group
Netinterestincome–External 45,812 63,634 13,396 – 122,842–Inter-segment 14,967 (12,814) (2,153) – – _________ _________ _________ _________ _________ 60,779 50,820 11,243 – 122,842Netnon-interestincome–External 32,444 15,208 5,694 – 53,346–Inter-segment (601) 144 796 (339) – _________ _________ _________ _________ _________ 31,843 15,352 6,490 (339) 53,346Externalemployeecompensationandbenefits (35,890) (12,453) (2,380) – (50,723) _________ _________ _________ _________ _________Generalandadministrativeexpenses–External (21,219) (7,031) (1,831) – (30,081)–Inter-segment (339) – – 339 – _________ _________ _________ _________ _________ (21,558) (7,031) (1,831) 339 (30,081)
ExternalDepreciation (4,243) (1,566) (12) – (5,821) _________ _________ _________ _________ _________ExternalAmortisation (668) (247) (65) – (980) _________ _________ _________ _________ _________ExternalNetimpairment (2,842) (2,631) (23) – (5,496) _________ _________ _________ _________ _________ExternalNetprovisionsforliabilitiesandothercharges 20 – (19) – 1 _________ _________ _________ _________ _________Profitbeforetax 27,441 42,244 13,403 – 83,088 _________ _________ _________ _________ _________Assets
Segmenttotalassets 2,283,563 1,690,272 1,676,596 – 5,650,431 ______________ ______________ ______________ ______________ ______________
Averagetotalassets 2,214,093 1,686,500 1,483,523 – 5,384,116 _________ _________ _________ _________ _________TotalEquity 157,383 144,169 32,278 – 333,830 _________ _________ _________ _________ _________
b Geographicalsegments
The group’s activities are carried out within Malta. There are no identifiable geographical segments or othermaterialconcentrations.
48 Comparatives
Certainamountshavebeenreclassifiedtocomplywiththecurrentyear’spresentation.
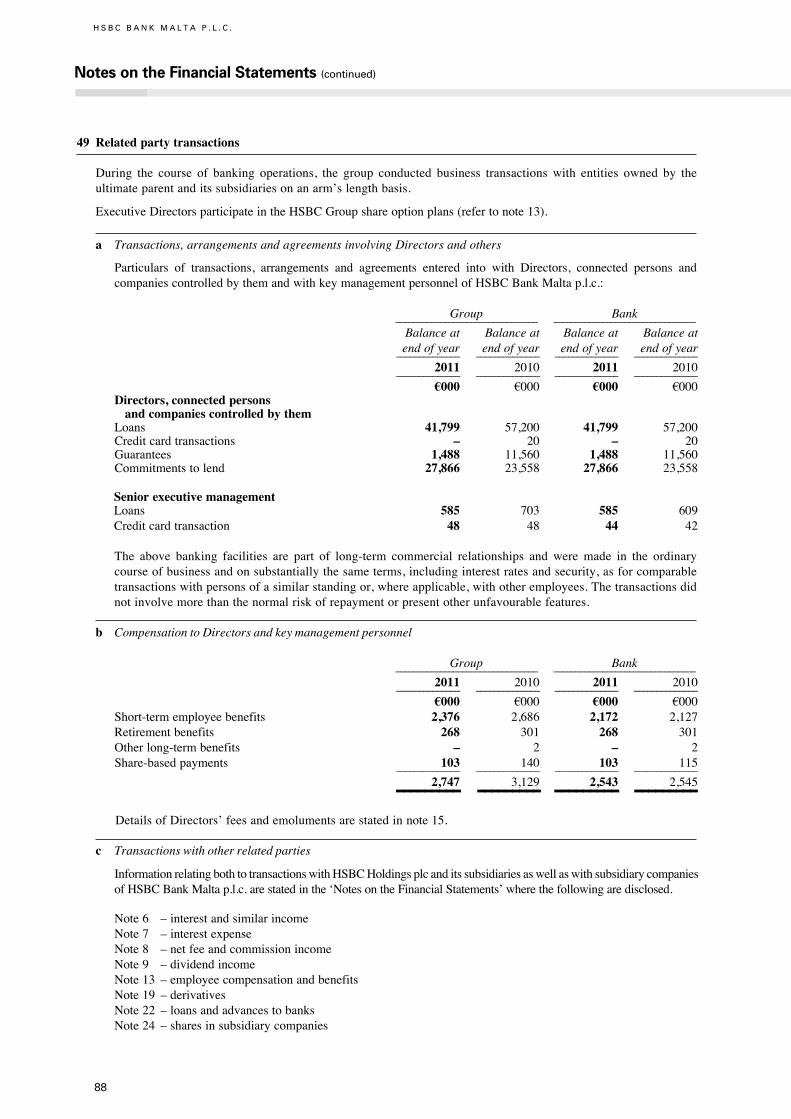
88
H S B C B A N K M A L T A P . L . C .
Notes on the Financial Statements (continued)
49 Related party transactions
During the course of banking operations, the group conducted business transactions with entities owned by theultimateparentanditssubsidiariesonanarm’slengthbasis.
ExecutiveDirectorsparticipateintheHSBCGroupshareoptionplans(refertonote13).
a Transactions,arrangementsandagreementsinvolvingDirectorsandothers
Particulars of transactions, arrangements and agreements entered into with Directors, connected persons andcompaniescontrolledbythemandwithkeymanagementpersonnelofHSBCBankMaltap.l.c.:
Group Bank ________________________________ ________________________________
Balanceat Balanceat Balanceat Balanceat endofyear endofyear endofyear endofyear ______________ ______________ ______________ ______________
2011 2010 2011 2010 ______________ ______________ ______________ ______________
§000 §000 §000 §000Directors, connected persons and companies controlled by them Loans 41,799 57,200 41,799 57,200Creditcardtransactions – 20 – 20Guarantees 1,488 11,560 1,488 11,560Commitmentstolend 27,866 23,558 27,866 23,558
Senior executive management Loans 585 703 585 609 Creditcardtransaction 48 48 44 42
The above banking facilities are part of long-term commercial relationships and were made in the ordinarycourseofbusinessandonsubstantiallythesameterms,includinginterestratesandsecurity,asforcomparabletransactionswithpersonsofasimilarstandingor,whereapplicable,withotheremployees.Thetransactionsdidnotinvolvemorethanthenormalriskofrepaymentorpresentotherunfavourablefeatures.
b CompensationtoDirectorsandkeymanagementpersonnel
Group Bank ________________________________ ________________________________
2011 2010 2011 2010 ______________ ______________ ______________ ______________
§000 §000 §000 §000Short-termemployeebenefits 2,376 2,686 2,172 2,127Retirementbenefits 268 301 268 301Otherlong-termbenefits – 2 – 2Share-basedpayments 103 140 103 115 ______________ ______________ ______________ ______________
2,747 3,129 2,543 2,545 _________ _________ _________ _________ DetailsofDirectors’feesandemolumentsarestatedinnote15.
c Transactionswithotherrelatedparties
InformationrelatingbothtotransactionswithHSBCHoldingsplcanditssubsidiariesaswellaswithsubsidiarycompaniesofHSBCBankMaltap.l.c.arestatedinthe‘NotesontheFinancialStatements’wherethefollowingaredisclosed.
Note6 –interestandsimilarincomeNote7 –interestexpenseNote8 –netfeeandcommissionincomeNote9 –dividendincomeNote13 –employeecompensationandbenefitsNote19 –derivativesNote22 –loansandadvancestobanksNote24 –sharesinsubsidiarycompanies
89
49 Related party transactions (continued)
c Transactionswithotherrelatedparties(continued)
Note27 –investmentpropertyNote29 –otherassetsNote30 –prepaymentsandaccruedincomeNote31 –depositsbybanksNote32 –customeraccountsNote37 –accrualsanddeferredincomeNote39 –subordinatedliabilitiesNote42 –contingentliabilitiesNote43 –commitments
Included in Interest and similar income (refer to note 6) and in Interest expense (refer to note 7), the grouprecognisedinterestamountingto§2,880,000(2010:§2,832,000)and§256,000(2010:§199,000)respectively,onadvancesanddepositsplacedwithanintermediateparent.
Included inNet fee and commission income (refer to note 8), the group recognised commission amounting to§997,000(2010:§898,000)receivedfromanintermediateparent.
Furthermore, expenditure relating to transactions with HSBC Holdings plc and its subsidiaries amounting to§2,838,000 (2010: §3,249,000) for the group and §2,634,000 (2010: §2,618,000) for the bank is included inEmployee compensation andbenefits and§10,539,000 (2010: §7,952,000) for thegroup and§9,578,000 (2010:§7,071,000)forthebankisincludedwithinGeneralandadministrativeexpenses.
50 Trust and custody activities
The group provides trust and custody services to individuals, trusts, retirement benefit plans and other institutions,wherebyitholdsandmanagesassetsorinvestsfundsreceivedinvariousfinancialinstrumentsatthedirectionofthecustomer.Thegroupreceivesfeeincomeforprovidingtheseservices.Trustassetsandassetsheldincustodyarenotassetsofthegroupandarenotrecognisedinthestatementsoffinancialposition.Thegroupisnotexposedtoanycreditriskrelatingtosuchplacements,asitdoesnotguaranteetheseinvestments.
At 31 December 2011, the total assets held by the group on behalf of customers were §4,036,218,000 (2010:§2,588,033,000).
51 Registered office and ultimate parent company
The addresses of the registered and principal offices of the bank and its subsidiary companies included in theconsolidatedfinancialstatementscanbefoundinaseparatestatementwhichisfiledattheRegistrarofCompaniesinaccordancewiththeprovisionsoftheFourthScheduletotheCompaniesAct,1995.
TheultimateparentcompanyofHSBCBankMaltap.l.c.isHSBCHoldingsplc,whichisincorporatedandregisteredinEngland.Theregisteredaddressis8CanadaSquare,LondonE145HQ,UnitedKingdom.CopiesoftheHSBCHoldingsplcAnnualReview2011andAnnualReportandAccounts2011maybeobtainedfromitsregisteredoffice,from30March2012orviewedonwww.hsbc.comfrom27February2012.
52 Investor compensation scheme
InaccordancewiththeprovisionsoftheInvestorCompensationSchemeRegulations,2003issuedundertheInvestmentServicesAct,1994,licenceholdersarerequiredtotransferavariablecontributiontoanInvestorCompensationSchemeReserveandplacetheequivalentamountwithabank,pledgedinfavouroftheScheme.AlternativelylicenceholderscanelecttopaytheamountofvariablecontributiondirectlytotheScheme.
HSBCBankMaltap.l.c.andHSBCStockbrokers(Malta)LimitedhaveelectedtopaytheamountofthevariablecontributiondirectlytotheScheme.
90
H S B C B A N K M A L T A P . L . C .
Notes on the Financial Statements (continued)
53 Accounting estimates and judgements
Inadditiontodisclosuressetoutinnotes4and25,theDirectorsconsideredthedevelopment,selectionanddisclosureofthegroup’scriticalaccountingpoliciesandestimatesandtheapplicationofthesepoliciesandestimates.Estimatesandjudgementsarecontinuallyevaluatedandarebasedonhistoricalandotherfactors,includingexpectationsoffutureeventsthatarebelievedtobereasonableunderthecircumstances.
Criticalaccountingjudgementinapplyingaccountingpolicies
i Impairmentlossesonloansandadvances
Thegroupreviewsitsloanportfoliotoassessimpairmentonanongoingbasisasrelevantgenericdataisobservedconcerningrisksassociatedwithgroupsofloanswithsimilarriskcharacteristics(refertonote3(g)(i)).Asaresult,the group makes judgements as to whether there is any observable data indicating that there is a measurabledecrease in the estimated future cash flows from a portfolio of loans, before the decrease is actually identifiedwithanindividualloaninthatportfolio.Theevidencemayincludeobservabledataindicatingthattherehasbeenan adverse change in the relative economic situationof an asset groupor in the credit status of borrowers in agroup.Management uses estimates based on historical loss experience for assetswith credit risk characteristicsandobjectiveevidenceofimpairmentsimilartothoseintheportfoliowhenschedulingitsfuturecashflows.Themethodologyandassumptionsusedforestimatingboththeamountandtimingoffuturecashflowsarereviewedregularlytoreduceanydifferencesbetweenlossestimatesandactuallossexperience.
ii Policyholderclaimsandbenefits
The determination of the liabilities under long-term insurance contracts is dependent on estimatesmade by thegroup.Estimatesaremadeastotheexpectednumberofdeathsforeachoftheyearsinwhichthegroupisexposedtorisk.Thegroupbasestheseestimatesonstandardindustryandnationalmortalitytablesthatreflectrecenthistoricalmortalityexperience,adjustedwhereappropriatetoreflectthegroup’sownexperience.Theestimatednumberofdeathsdeterminesthevalueofthebenefitpaymentsandthevalueofthevaluationpremiums.ThemainsourceofuncertaintyisthatepidemicssuchasAIDS,SARS,pandemicflu,swinefluandwide-ranginglifestylechanges,suchasineating,smokingandexercisehabits,couldresultinfuturemortalitybeingsignificantlyworsethaninthepastfortheagegroupsinwhichthegrouphassignificantexposuretomortalityrisk.
Estimates are also made as to future investment income arising from the assets backing long-term insurancecontracts.Theseestimatesarebasedoncurrentmarketreturnsaswellasexpectationsaboutfutureeconomicandfinancialdevelopments.
For long-term insurancecontractswith fixedandguaranteed termsandwithdiscretionaryparticipation features,estimatesoffuturedeaths,investmentreturnsandadministrativeexpensesformtheassumptionsusedforcalculatingtheliabilitiesduringthelifeofthecontract.Amarginforriskanduncertaintyisaddedtotheseassumptions.Newestimatesaremadeeachsubsequentyeartoreflectthecurrentlong-termoutlook.
iii Fairvalueofderivatives
The fair value of financial instruments that are not quoted in activemarkets are determinedby using valuationtechniques.Wherevaluationtechniques(forexamplemodels)areusedtodeterminefairvalues,theyarevalidatedandperiodicallyreviewedbyqualifiedpersonnelindependentoftheareathatcreatedthem.Allmodelsarecertifiedbeforetheyareused,andmodelsarecalibratedtoensurethatoutputsreflectactualdataandcomparativemarketprices.Totheextentpractical,modelsuseonlyobservabledata,howeverareassuchascreditrisk(bothownandcounterparty),volatilitiesandcorrelationsrequiremanagementtomakeestimates.Changesinassumptionsaboutthesefactorscouldaffectreportedfairvalueoffinancialinstruments.
iv Impairmentofavailable-for-saleequityinstruments
Thegroupdeterminesthatavailable-for-saleequityinvestmentsareimpairedwhentherehasbeenasignificantorprolongeddeclineinthefairvaluebelowitscost.Thisdeterminationofwhatissignificantorprolongedrequiresjudgement.Inmakingthisjudgement,thegroupevaluatesamongotherfactors,thenormalvolatilityinshareprice.Inaddition,impairmentmaybeappropriatewhenthereisevidenceofdeteriorationinthefinancialhealthoftheinvestee,industryandsectorperformance,changesintechnology,andoperationalandfinancialcashflows.
91
H S B C B A N K M A L T A P . L . C .
Independent Auditors’ Report to the Members of HSBC Bank Malta p.l.c.
Report on the financial statements
WehaveauditedthefinancialstatementsofHSBCBankMaltap.l.c.(the“bank”)andofthegroupofwhichthebankistheparent,assetoutonpages29to90,whichcomprisethestatementsoffinancialpositionasat31December2011andtheincomestatementsandstatementsofcomprehensiveincome,changesinequityandcashflowsfortheyearthenended,andnotes,comprisingasummaryofsignificantaccountingpoliciesandotherexplanatoryinformation.
Directors’ responsibility for the financial statements
AsexplainedmorefullyintheDirectors’ResponsibilitiesStatementsetoutonpage28,thedirectorsareresponsiblefor thepreparationof financial statements that give a true and fair view in accordancewith InternationalFinancialReportingStandardsasadoptedbytheEU,theCompaniesAct,1995(Chapter386,LawsofMalta)(the“Act”),andtheBankingAct,1994(Chapter371,LawsofMalta),and,asregardsthefinancialstatementsoftheGroup,Article4oftheIASRegulation,andforsuchinternalcontrolasthedirectorsdeterminearenecessarytoenablethepreparationoffinancialstatementsthatarefreefrommaterialmisstatement,whetherduetofraudorerror.
Auditors’ responsibility
Ourresponsibilityistoexpressanopiniononthesefinancialstatementsbasedonouraudit.Thisreport,includingtheopinion,hasbeenpreparedforandonlyfortheCompany’smembersasabodyinaccordancewithArticle179oftheAct,andArticle31oftheBankingAct,1994(Chapter371,LawsofMalta),andmaynotbeappropriateforanyotherpurpose.
Inaddition,wereadtheotherinformationcontainedintheAnnualReport2011andconsiderwhetheritisconsistentwiththeauditedfinancialstatements.Weconsidertheimplicationsforourreportifwebecomeawareofanyapparentmaterialmisstatementsoffactormaterialinconsistencieswiththefinancialstatements.
WeconductedourauditinaccordancewithInternationalStandardsonAuditing.Thosestandardsrequirethatwecomplywith ethical requirements andplanandperform theaudit toobtain reasonable assuranceaboutwhether thefinancialstatementsarefreefrommaterialmisstatement.
Anauditinvolvesperformingprocedurestoobtainauditevidenceabouttheamountsanddisclosuresinthefinancialstatements. The procedures selected depend on our judgement, including the assessment of the risks of materialmisstatementofthefinancialstatements,whetherduetofraudorerror.Inmakingthoseriskassessments,weconsiderinternalcontrol relevant to theentity’spreparationof financial statements thatgivea trueand fairview inorder todesignauditproceduresthatareappropriateinthecircumstances,butnotforthepurposeofexpressinganopinionontheeffectivenessoftheentity’sinternalcontrol.Anauditalsoincludesevaluatingtheappropriatenessofaccountingpoliciesusedandthereasonablenessofaccountingestimatesmadebymanagement,aswellasevaluatingtheoverallpresentationofthefinancialstatements.
Webelievethattheauditevidencewehaveobtainedissufficientandappropriatetoprovideabasisforourauditopinion.
Opinion on financial statements
Inouropinion,thefinancialstatements:
– give a true and fairviewof thegroup’s and thebank’s financialpositionas at31December2011, andof theirfinancial performance and their cash flows for the year then ended in accordance with International FinancialReportingStandardsasadoptedbytheEU;and
– have been properly prepared in accordance with the Companies Act, 1995 (Chapter 386, Laws of Malta), theBankingAct,1994(Chapter371,LawsofMalta),and,asregardsthefinancialstatementsofthegroup,Article4oftheIASRegulation.
92
Report on other legal and regulatory requirements
Matters on which we are required to report by the Banking Act, 1994 (Chapter 371, Laws of Malta)
Inouropinion:
– wehaveobtainedalltheinformationandexplanationswhich,tothebestofourknowledgeandbelief,werenecessaryforthepurposeofouraudit;
– properbooksofaccounthavebeenkeptbythebanksofarasappearsfromourexaminationthereof;
– thebank’sfinancialstatementsareinagreementwiththebooksofaccount;and
– tothebestofourknowledgeandbeliefand,onthebasisoftheexplanationsgiventous,thefinancialstatementsgivetheinformationrequiredbylawinforceinthemannersorequired.
Matters on which we are required to report by exception by the Companies Act, 1995 (Chapter 386, Laws of Malta) (the “Act”), other than those reported upon above
WehavenothingtoreportinrespectofthefollowingmatterswheretheActrequiresustoreporttoyouif,inouropinion:
– the informationgiven in theReportof theDirectors for the financialyear forwhich the financial statementsarepreparedisnotconsistentwiththefinancialstatements;or
– certaindisclosuresofdirectors’remunerationspecifiedbytheActarenotmade.
Report required by Listing Rule 5.98 issued by the Listing Authority in Malta on the Directors’ Statement of Compliance with the Code of Principles of Good Corporate Governance (the “Principles”) outlined in Appendix 5.1 to Chapter 5 (Continuing Obligations) of the Listing Rules (the “Appendix”)
ListingRule5.97requiresanIssuerwhosesecuritiesareadmittedtotradingonaRegulatedMarketoperatinginMaltatoprepareacorporategovernancestatement.Inaddition,asanIssuerregisteredinMalta,ListingRule5.94requiresthattheIssuerendeavourstoadoptthePrinciplesandtoprepareareportexplaininghowithascompliedwiththeprovisionsoftheAppendix.
Ourresponsibilityasindependentauditorsofthebank,islaiddownbyListingRule5.98,whichrequiresustoissueareportontheDirectors’StatementofCompliancewiththePrinciples,whichissetoutonpages18to25.
WereviewtheDirectors’StatementofCompliance,andreportastowhetherthisStatementprovidesthedisclosuresrequiredbyListingRule5.97.Wearenot required to, andwedonot, considerwhether theBoard’s statements oninternal control and riskmanagement systems cover all the risks and controls in relation to the financial reportingprocess,orformanopinionontheeffectivenessofthegroup’scorporategovernanceproceduresoritsrisksandcontrolprocedures,norontheabilityofthegrouptocontinueinoperationalexistence.
Inouropinion,theDirectors’StatementofCompliancesetoutonpages18to25providesthedisclosuresrequiredbyListingRule5.97issuedbytheListingAuthorityofMalta.
NoelMizzi(Partner)forandonbehalfof
KPMGRegisteredAuditorsPorticoBuildingMarinaStreetPietàPTA9044Malta
24February2012
Independent Auditors’ Report to the Members of HSBC Bank Malta p.l.c. (continued)
H S B C B A N K M A L T A P . L . C .
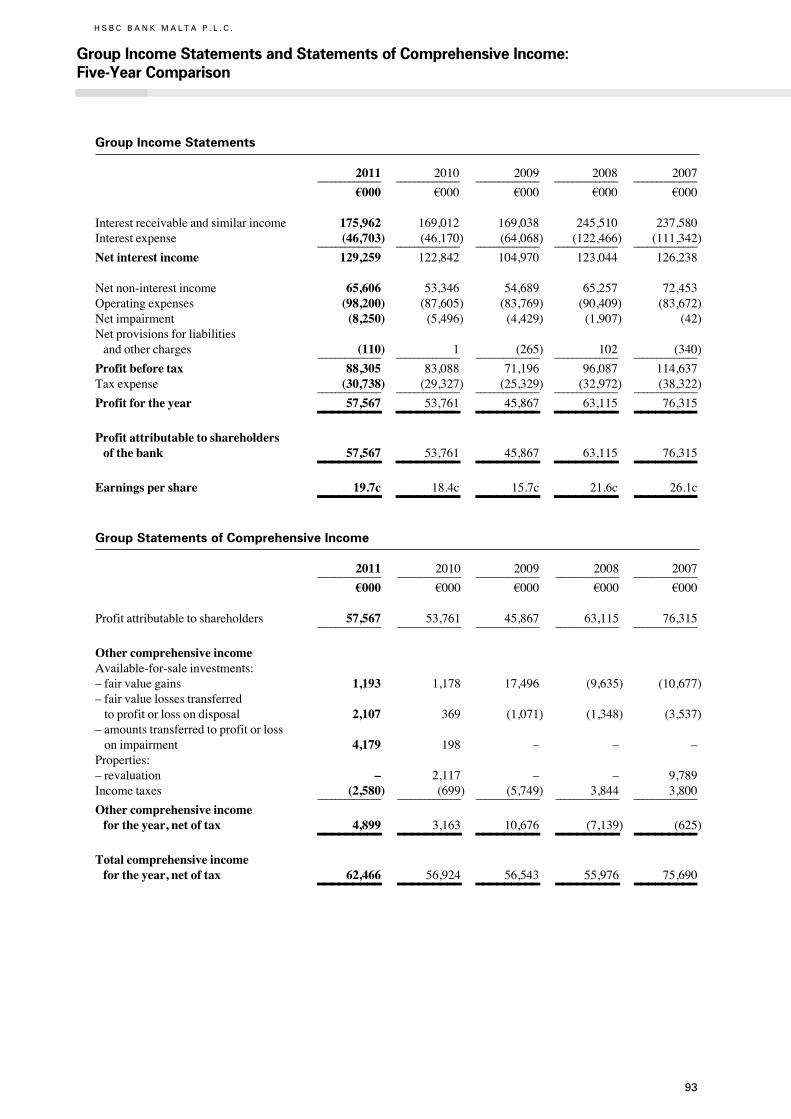
93
H S B C B A N K M A L T A P . L . C .
Group Income Statements
2011 2010 2009 2008 2007 ______________ ______________ ______________ ______________ ______________
§000 §000 §000 §000 §000
Interestreceivableandsimilarincome 175,962 169,012 169,038 245,510 237,580Interestexpense (46,703) (46,170) (64,068) (122,466) (111,342) ______________ ______________ ______________ ______________ ______________
Net interest income 129,259 122,842 104,970 123,044 126,238
Netnon-interestincome 65,606 53,346 54,689 65,257 72,453Operatingexpenses (98,200) (87,605) (83,769) (90,409) (83,672)Netimpairment (8,250) (5,496) (4,429) (1,907) (42)Netprovisionsforliabilitiesandothercharges (110) 1 (265) 102 (340) ______________ ______________ ______________ ______________ ______________
Profit before tax 88,305 83,088 71,196 96,087 114,637Taxexpense (30,738) (29,327) (25,329) (32,972) (38,322) ______________ ______________ ______________ ______________ ______________Profit for the year 57,567 53,761 45,867 63,115 76,315 _________ _________ _________ _________ _________Profit attributable to shareholders of the bank 57,567 53,761 45,867 63,115 76,315 _________ _________ _________ _________ _________Earnings per share 19.7c 18.4c 15.7c 21.6c 26.1c _________ _________ _________ _________ _________Group Statements of Comprehensive Income
2011 2010 2009 2008 2007 ______________ ______________ ______________ ______________ ______________
§000 §000 §000 §000 §000
Profitattributabletoshareholders 57,567 53,761 45,867 63,115 76,315 ______________ ______________ ______________ ______________ ______________
Other comprehensive incomeAvailable-for-saleinvestments:–fairvaluegains 1,193 1,178 17,496 (9,635) (10,677)–fairvaluelossestransferredtoprofitorlossondisposal 2,107 369 (1,071) (1,348) (3,537)–amountstransferredtoprofitorlossonimpairment 4,179 198 – – –Properties:–revaluation – 2,117 – – 9,789Incometaxes (2,580) (699) (5,749) 3,844 3,800 ______________ ______________ ______________ ______________ ______________
Other comprehensive income for the year, net of tax 4,899 3,163 10,676 (7,139) (625) _________ _________ _________ _________ _________Total comprehensive income for the year, net of tax 62,466 56,924 56,543 55,976 75,690 _________ _________ _________ _________ _________
Group Income Statements and Statements of Comprehensive Income: Five-Year Comparison
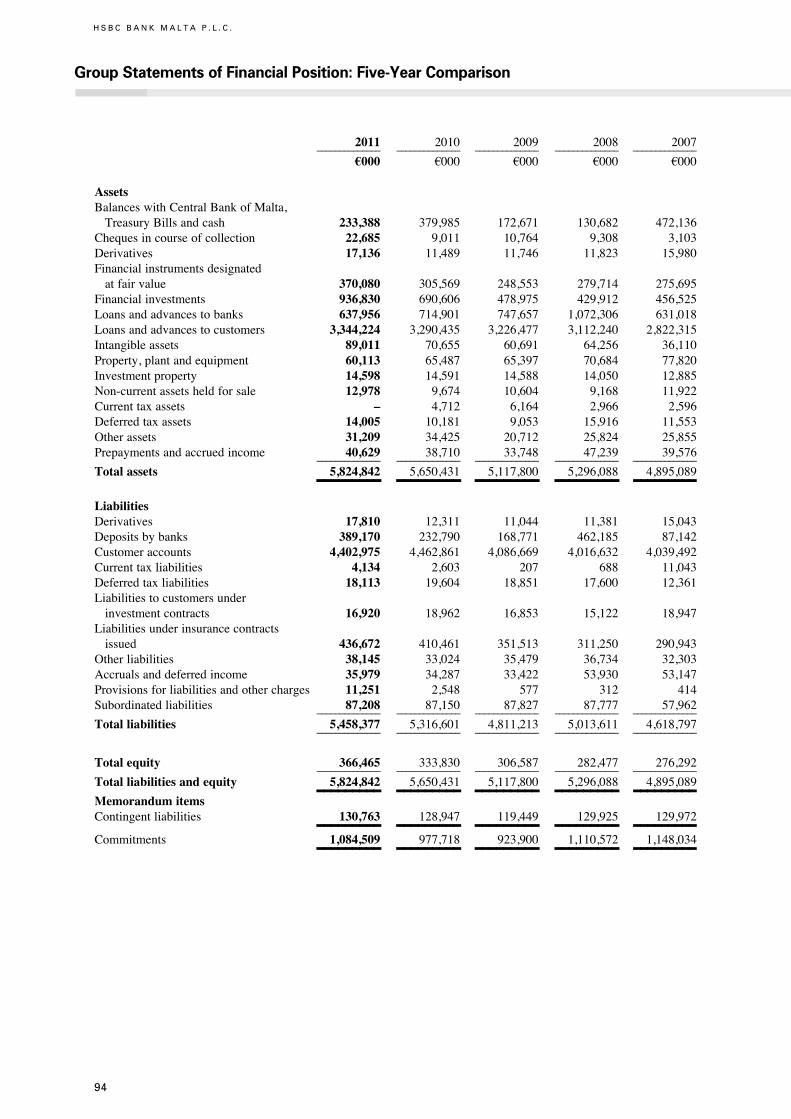
94
H S B C B A N K M A L T A P . L . C .
Group Statements of Financial Position: Five-Year Comparison
2011 2010 2009 2008 2007 ______________ ______________ ______________ ______________ ______________
§000 §000 §000 §000 §000
AssetsBalanceswithCentralBankofMalta,TreasuryBillsandcash 233,388 379,985 172,671 130,682 472,136Chequesincourseofcollection 22,685 9,011 10,764 9,308 3,103Derivatives 17,136 11,489 11,746 11,823 15,980Financialinstrumentsdesignatedatfairvalue 370,080 305,569 248,553 279,714 275,695Financialinvestments 936,830 690,606 478,975 429,912 456,525Loansandadvancestobanks 637,956 714,901 747,657 1,072,306 631,018Loansandadvancestocustomers 3,344,224 3,290,435 3,226,477 3,112,240 2,822,315Intangibleassets 89,011 70,655 60,691 64,256 36,110Property,plantandequipment 60,113 65,487 65,397 70,684 77,820Investmentproperty 14,598 14,591 14,588 14,050 12,885Non-currentassetsheldforsale 12,978 9,674 10,604 9,168 11,922Currenttaxassets – 4,712 6,164 2,966 2,596Deferredtaxassets 14,005 10,181 9,053 15,916 11,553Otherassets 31,209 34,425 20,712 25,824 25,855Prepaymentsandaccruedincome 40,629 38,710 33,748 47,239 39,576 ______________ ______________ ______________ ______________ ______________
Total assets 5,824,842 5,650,431 5,117,800 5,296,088 4,895,089 _________ _________ _________ _________ _________LiabilitiesDerivatives 17,810 12,311 11,044 11,381 15,043Depositsbybanks 389,170 232,790 168,771 462,185 87,142Customeraccounts 4,402,975 4,462,861 4,086,669 4,016,632 4,039,492Currenttaxliabilities 4,134 2,603 207 688 11,043Deferredtaxliabilities 18,113 19,604 18,851 17,600 12,361Liabilitiestocustomersunderinvestmentcontracts 16,920 18,962 16,853 15,122 18,947Liabilitiesunderinsurancecontractsissued 436,672 410,461 351,513 311,250 290,943Otherliabilities 38,145 33,024 35,479 36,734 32,303Accrualsanddeferredincome 35,979 34,287 33,422 53,930 53,147Provisionsforliabilitiesandothercharges 11,251 2,548 577 312 414Subordinatedliabilities 87,208 87,150 87,827 87,777 57,962 ______________ ______________ ______________ ______________ ______________
Total liabilities 5,458,377 5,316,601 4,811,213 5,013,611 4,618,797 ______________ ______________ ______________ ______________ ______________
Total equity 366,465 333,830 306,587 282,477 276,292 ______________ ______________ ______________ ______________ ______________
Total liabilities and equity 5,824,842 5,650,431 5,117,800 5,296,088 4,895,089 _________ _________ _________ _________ _________Memorandum itemsContingentliabilities 130,763 128,947 119,449 129,925 129,972 _________ _________ _________ _________ _________Commitments 1,084,509 977,718 923,900 1,110,572 1,148,034 _________ _________ _________ _________ _________
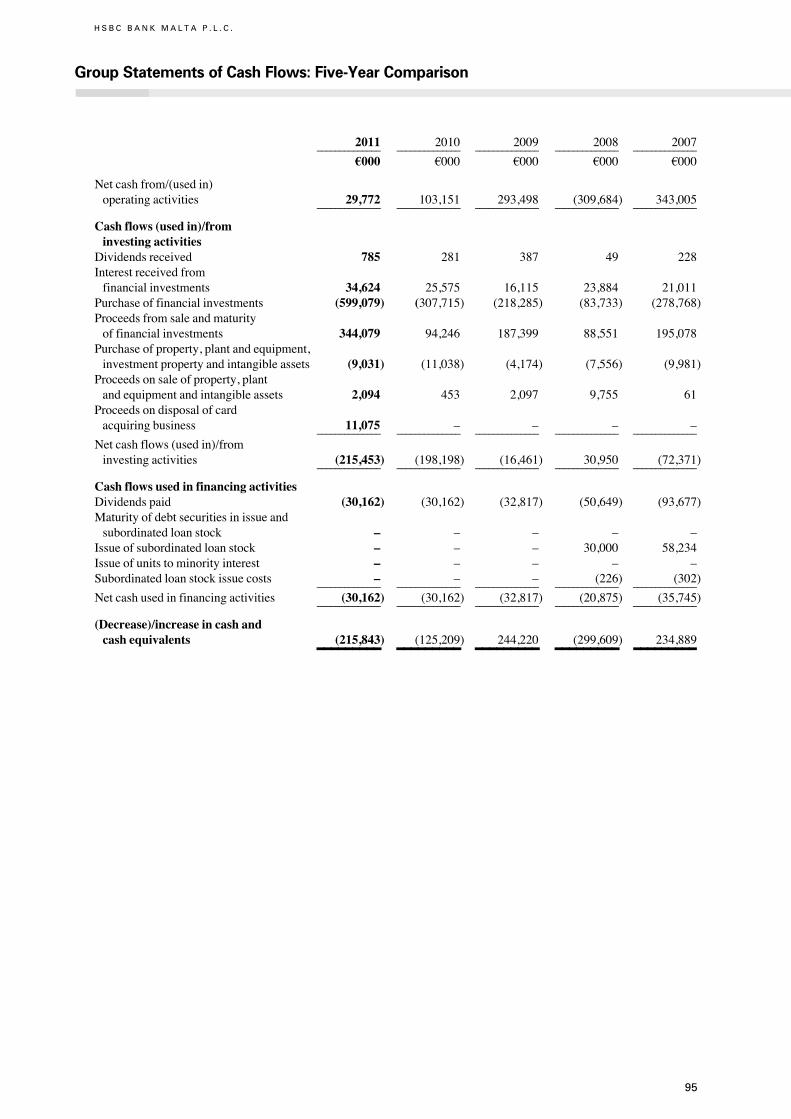
95
H S B C B A N K M A L T A P . L . C .
Group Statements of Cash Flows: Five-Year Comparison
2011 2010 2009 2008 2007 ______________ ______________ ______________ ______________ ______________
§000 §000 §000 §000 §000
Netcashfrom/(usedin)operatingactivities 29,772 103,151 293,498 (309,684) 343,005 ______________ ______________ ______________ ______________ ______________
Cash flows (used in)/from investing activitiesDividendsreceived 785 281 387 49 228Interestreceivedfromfinancialinvestments 34,624 25,575 16,115 23,884 21,011Purchaseoffinancialinvestments (599,079) (307,715) (218,285) (83,733) (278,768)Proceedsfromsaleandmaturityoffinancialinvestments 344,079 94,246 187,399 88,551 195,078Purchaseofproperty,plantandequipment,investmentpropertyandintangibleassets (9,031) (11,038) (4,174) (7,556) (9,981)Proceedsonsaleofproperty,plantandequipmentandintangibleassets 2,094 453 2,097 9,755 61Proceedsondisposalofcardacquiringbusiness 11,075 – – – – ______________ ______________ ______________ ______________ ______________
Netcashflows(usedin)/frominvestingactivities (215,453) (198,198) (16,461) 30,950 (72,371) ______________ ______________ ______________ ______________ ______________
Cash flows used in financing activitiesDividendspaid (30,162) (30,162) (32,817) (50,649) (93,677)Maturityofdebtsecuritiesinissueandsubordinatedloanstock – – – – –Issueofsubordinatedloanstock – – – 30,000 58,234Issueofunitstominorityinterest – – – – –Subordinatedloanstockissuecosts – – – (226) (302) ______________ ______________ ______________ ______________ ______________
Netcashusedinfinancingactivities (30,162) (30,162) (32,817) (20,875) (35,745) ______________ ______________ ______________ ______________ ______________
(Decrease)/increase in cash and cash equivalents (215,843) (125,209) 244,220 (299,609) 234,889 _________ _________ _________ _________ _________
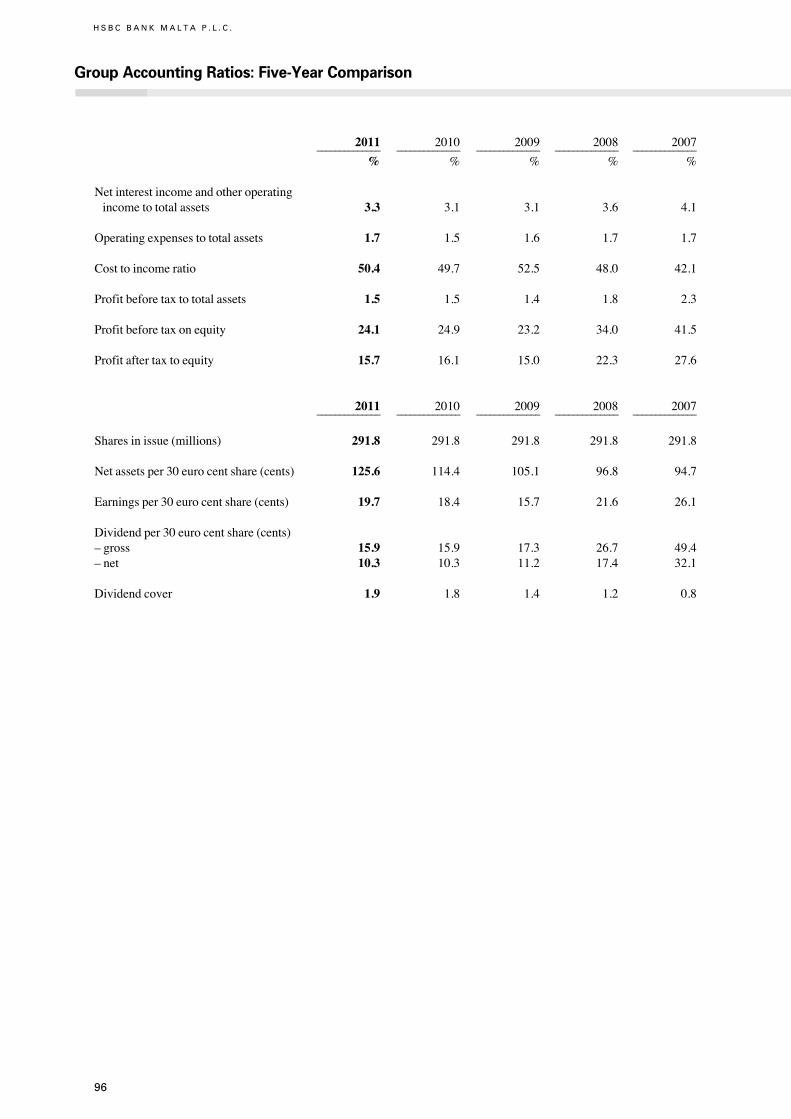
96
H S B C B A N K M A L T A P . L . C .
Group Accounting Ratios: Five-Year Comparison
2011 2010 2009 2008 2007 ______________ ______________ ______________ ______________ ______________
% % % % %
Netinterestincomeandotheroperatingincometototalassets 3.3 3.1 3.1 3.6 4.1
Operatingexpensestototalassets 1.7 1.5 1.6 1.7 1.7
Costtoincomeratio 50.4 49.7 52.5 48.0 42.1Profitbeforetaxtototalassets 1.5 1.5 1.4 1.8 2.3
Profitbeforetaxonequity 24.1 24.9 23.2 34.0 41.5
Profitaftertaxtoequity 15.7 16.1 15.0 22.3 27.6
2011 2010 2009 2008 2007 ______________ ______________ ______________ ______________ ______________
Sharesinissue(millions) 291.8 291.8 291.8 291.8 291.8
Netassetsper30eurocentshare(cents) 125.6 114.4 105.1 96.8 94.7
Earningsper30eurocentshare(cents) 19.7 18.4 15.7 21.6 26.1
Dividendper30eurocentshare(cents)–gross 15.9 15.9 17.3 26.7 49.4–net 10.3 10.3 11.2 17.4 32.1
Dividendcover 1.9 1.8 1.4 1.2 0.8
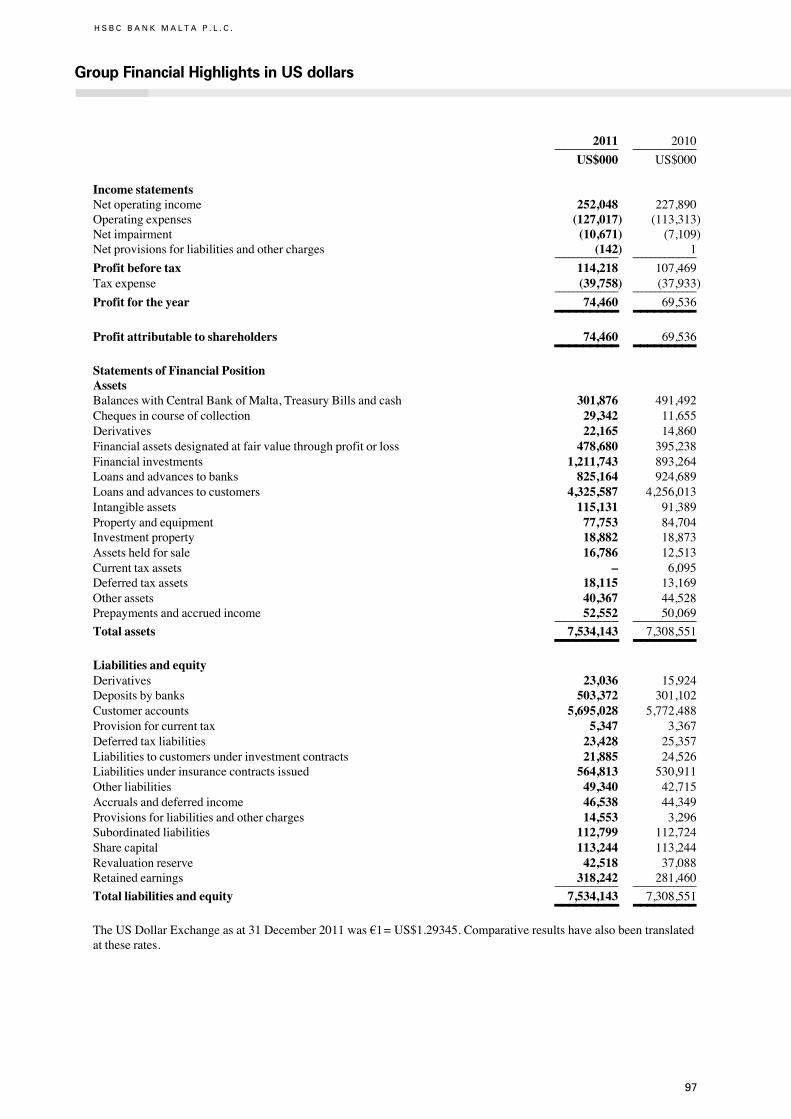
97
H S B C B A N K M A L T A P . L . C .
Group Financial Highlights in US dollars
2011 2010 ______________ ______________
US$000 US$000
Income statementsNetoperatingincome 252,048 227,890Operatingexpenses (127,017) (113,313)Netimpairment (10,671) (7,109)Netprovisionsforliabilitiesandothercharges (142) 1 ______________ ______________
Profit before tax 114,218 107,469Taxexpense (39,758) (37,933) ______________ ______________
Profit for the year 74,460 69,536 _________ _________Profit attributable to shareholders 74,460 69,536 _________ _________Statements of Financial PositionAssetsBalanceswithCentralBankofMalta,TreasuryBillsandcash 301,876 491,492Chequesincourseofcollection 29,342 11,655Derivatives 22,165 14,860Financialassetsdesignatedatfairvaluethroughprofitorloss 478,680 395,238Financialinvestments 1,211,743 893,264Loansandadvancestobanks 825,164 924,689Loansandadvancestocustomers 4,325,587 4,256,013Intangibleassets 115,131 91,389Propertyandequipment 77,753 84,704Investmentproperty 18,882 18,873Assetsheldforsale 16,786 12,513Currenttaxassets – 6,095Deferredtaxassets 18,115 13,169Otherassets 40,367 44,528Prepaymentsandaccruedincome 52,552 50,069 ______________ ______________
Total assets 7,534,143 7,308,551 _________ _________Liabilities and equityDerivatives 23,036 15,924Depositsbybanks 503,372 301,102Customeraccounts 5,695,028 5,772,488Provisionforcurrenttax 5,347 3,367Deferredtaxliabilities 23,428 25,357Liabilitiestocustomersunderinvestmentcontracts 21,885 24,526Liabilitiesunderinsurancecontractsissued 564,813 530,911Otherliabilities 49,340 42,715Accrualsanddeferredincome 46,538 44,349Provisionsforliabilitiesandothercharges 14,553 3,296Subordinatedliabilities 112,799 112,724Sharecapital 113,244 113,244Revaluationreserve 42,518 37,088Retainedearnings 318,242 281,460 ______________ ______________
Total liabilities and equity 7,534,143 7,308,551 _________ _________TheUSDollarExchangeasat31December2011was§1=US$1.29345.Comparativeresultshavealsobeentranslatedattheserates.
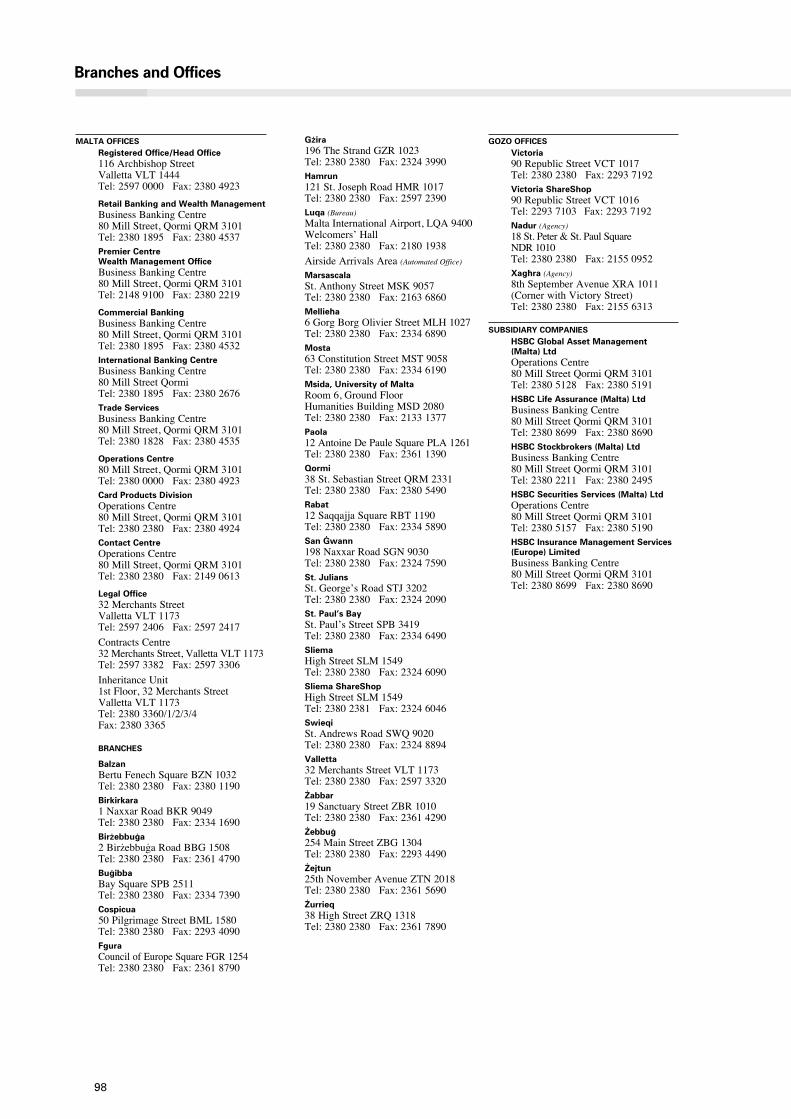
98
Branches and Offices
MALTA OFFICESRegistered Office/Head Office116ArchbishopStreetVallettaVLT1444Tel:25970000Fax:23804923
Retail Banking and Wealth ManagementBusinessBankingCentre80MillStreet,QormiQRM3101Tel:23801895Fax:23804537Premier Centre Wealth Management OfficeBusinessBankingCentre80MillStreet,QormiQRM3101Tel:21489100Fax:23802219
Commercial BankingBusinessBankingCentre80MillStreet,QormiQRM3101Tel:23801895Fax:23804532International Banking CentreBusinessBankingCentre80MillStreetQormiTel:23801895Fax:23802676Trade ServicesBusinessBankingCentre80MillStreet,QormiQRM3101Tel:23801828Fax:23804535
Operations Centre80MillStreet,QormiQRM3101Tel:23800000Fax:23804923Card Products DivisionOperationsCentre80MillStreet,QormiQRM3101Tel:23802380Fax:23804924Contact CentreOperationsCentre80MillStreet,QormiQRM3101Tel:23802380Fax:21490613
Legal Office32MerchantsStreetVallettaVLT1173Tel:25972406Fax:25972417ContractsCentre32MerchantsStreet,VallettaVLT1173Tel:25973382Fax:25973306InheritanceUnit1stFloor,32MerchantsStreetVallettaVLT1173Tel:23803360/1/2/3/4Fax:23803365
BRANCHES
BalzanBertuFenechSquareBZN1032Tel:23802380Fax:23801190Birkirkara1NaxxarRoadBKR9049Tel:23802380Fax:23341690BirΩebbu©a2BirΩebbu©aRoadBBG1508Tel:23802380Fax:23614790Bu©ibbaBaySquareSPB2511Tel:23802380Fax:23347390Cospicua50PilgrimageStreetBML1580Tel:23802380Fax:22934090FguraCouncilofEuropeSquareFGR1254Tel:23802380Fax:23618790
GΩira196TheStrandGZR1023Tel:23802380Fax:23243990Óamrun121St.JosephRoadHMR1017Tel:23802380Fax:25972390Luqa (Bureau)MaltaInternationalAirport,LQA9400Welcomers’HallTel:23802380Fax:21801938AirsideArrivalsArea(AutomatedOffice)MarsascalaSt.AnthonyStreetMSK9057Tel:23802380Fax:21636860Mellie˙a6GorgBorgOlivierStreetMLH1027Tel:23802380Fax:23346890Mosta63ConstitutionStreetMST9058Tel:23802380Fax:23346190Msida, University of MaltaRoom6,GroundFloorHumanitiesBuildingMSD2080Tel:23802380Fax:21331377Paola12AntoineDePauleSquarePLA1261Tel:23802380Fax:23611390Qormi38St.SebastianStreetQRM2331Tel:23802380Fax:23805490Rabat 12SaqqajjaSquareRBT1190Tel:23802380Fax:23345890San Ìwann198NaxxarRoadSGN9030Tel:23802380Fax:23247590St. JuliansSt.George’sRoadSTJ3202Tel:23802380Fax:23242090St. Paul’s BaySt.Paul’sStreetSPB3419Tel:23802380Fax:23346490SliemaHighStreetSLM1549Tel:23802380Fax:23246090Sliema ShareShopHighStreetSLM1549Tel:23802381Fax:23246046SwieqiSt.AndrewsRoadSWQ9020Tel:23802380Fax:23248894Valletta32MerchantsStreetVLT1173Tel:23802380Fax:25973320Ûabbar19SanctuaryStreetZBR1010Tel:23802380Fax:23614290Ûebbu©254MainStreetZBG1304Tel:23802380Fax:22934490Ûejtun25thNovemberAvenueZTN2018Tel:23802380Fax:23615690Ûurrieq38HighStreetZRQ1318Tel:23802380Fax:23617890
GOzO OFFICESVictoria90RepublicStreetVCT1017Tel:23802380Fax:22937192Victoria ShareShop90RepublicStreetVCT1016Tel:22937103 Fax:22937192Nadur (Agency)18St.Peter&St.PaulSquareNDR1010Tel:23802380Fax:21550952Xag˙ra (Agency)8thSeptemberAvenueXRA1011(CornerwithVictoryStreet)Tel:23802380Fax:21556313
SUBSIDIARY COMPANIESHSBC Global Asset Management (Malta) LtdOperationsCentre80MillStreetQormiQRM3101Tel:23805128Fax:23805191HSBC Life Assurance (Malta) LtdBusinessBankingCentre80MillStreetQormiQRM3101Tel:23808699Fax:23808690HSBC Stockbrokers (Malta) LtdBusinessBankingCentre80MillStreetQormiQRM3101Tel:23802211Fax:23802495HSBC Securities Services (Malta) LtdOperationsCentre80MillStreetQormiQRM3101Tel:23805157Fax:23805190HSBC Insurance Management Services (Europe) LimitedBusinessBankingCentre80MillStreetQormiQRM3101Tel:23808699Fax:23808690
© Copyright HSBC Bank Malta p.l.c. 2012All rights reserved
No part of this publication may be reproduced, stored in a retrieval system, or transmitted, in any form or by any means, electronic, mechanical, photocopying, recording, or otherwise, without the prior written permission of HSBC Bank Malta p.l.c.
Published by HSBC Bank Malta p.l.c., Valletta
Cover designed by Black Sun Plc, London; text pages designed by Group Communications (Asia), The Hongkong and Shanghai Banking Corporation Limited, Hong Kong
Printed by Gutenberg Press, Gudja Malta on Lenza Green paper using vegetable oil based inks. Made in Austria, the paper comprises 100% post-consumer waste. Pulps used are totally chlorine-free.
ISSN 1811-7570ISBN 978-99932-12-13-3
PhotographyPages 2, 4, 5 and 8: Zone V Co. Ltd.Pages 3 and 7: Domenic AquilinaPages 10 and 11: Zone V Co. Ltd., Allen Venables and HSBC Bank plc

HSBC Bank Malta p.l.c. 116 Archbishop Street Valletta VLT 1444MaltaTelephone: 356 2597 0000www.hsbc.com.mt