Embed Size (px)
Citation preview

HSBC Bank CanadaAnnual Report and Accounts 2012
HS
BC
Ban
k Can
ada
An
nu
al Rep
ort an
d A
ccou
nts 2012


1
Corporate Profile
HSBC Bank Canada, a subsidiary of HSBC Holdings plc, is the leading international bank in Canada. With around 6,600 offices in 81 countries and territories and assets of US$2,693 billion at 31 December 2012, the HSBC Group is one of the world’s largest banking and financial services organizations.
Table of Contents
1 Corporate Profile 2 Shareholder Information 2 Caution Concerning Forward-Looking Statements 3 Message from the President and Chief Executive Officer 4 Management’s Discussion and Analysis 4 Five Year Financial Summary 5 Basis of Preparation of Financial Information 5 Use of Non-IFRS Financial Measures 6 Overview 6 The HSBC Group 7 Our Strategic Direction and Main Achievements for 2012 10 Economic Outlook for 2013 10 Analysis of Financial Results for 2012 18 Analysis of Financial Results for the Fourth Quarter 2012 24 Quarterly Summary of Condensed Consolidated Statements of Income 25 Critical Accounting Policies and Impacts of Estimates and Judgements 28 Accounting and Reporting Changes in 2012 28 Off-Balance Sheet Arrangements 29 Disclosure Controls and Procedures and Internal Control over Financial Reporting 30 Related Party Transactions 30 Dividends 31 Credit Ratings 31 Risk Management 61 Consolidated Financial Statements 62 Statement of Management’s Responsibility for Financial Information 63 Independent Auditors’ Report 69 Notes on the Consolidated Financial Statements 130 HSBC Group International Network 130 HSBC Bank Canada Subsidiaries 131 Executive Committee 131 Board of Directors
H S B C B A N K C A N A D A
Dividend record and payable dates in 2013 for our preferred shares, subject to approval by our Board of Directors, are:
Record Date Payable DateMarch 15 March 31June 14 June 30September 13 September 30December 13 December 31
Distribution dates on our HSBC HaTS™ are June 30 and December 31.
Designation of Eligible DividendsFor the purposes of the Income Tax Act, Canada, and any similar provincial legisla-tion, HSBC Bank Canada advises that all of its dividends paid to Canadian residents in 2006 and subsequent years are eligible dividends unless indicated otherwise.
This document contains forward-looking information, including statements regarding the business and anticipated actions of the bank. These statements can be identified by the fact that they do not pertain strictly to historical or current facts. Forward-looking statements often include words such as “anticipates,” “estimates,” “expects,” “projects,” “intends,” “plans,” “believes” and words and terms of similar substance in connection with discussions of future operating or financial per-formance. Examples of forward-looking statements in this document include, but are not limited, to statements made in “Message from the President and Chief Executive Officer” on page 3, “Economic Outlook for 2013” on page 10, and “Em-ployee future benefits” on page 27. By their very nature, these statements require us to make a number of assumptions and are subject to a number of inherent risks and uncertainties that may cause actual results to differ materially from those con-templated by the forward-looking statements. We caution you to not place undue reliance on these statements as a number of risk factors could cause our actual results to differ materially from the expectations expressed in such forward-looking statements. These risk factors – many of which are beyond our control and the effects of which are difficult to predict – that could cause such differences include: capital management, credit, liquidity and funding, market, structural, and operational risks all of which are discussed in the Risk Management section of the 2012 MD&A. Additional risk factors include: the im-pact of changes in laws and regulations including relating to the Dodd-Frank Wall Street Reform and Consumer Protection Act and the regulations issued and to be issued thereunder, the Basel Committee on Banking Supervision’s global standards for capital and liquidity reform, over-the-counter derivatives reform in Canada; technological changes and security; global capital market activity; the effects of changes in government monetary and economic policies; changes in prevailing interest rates; inflation levels; and the general business and economic market conditions in Canada and in geographic areas where the bank operates. Canada is an extremely competitive banking environment, and pressures on our net interest margin may arise from actions taken by individual banks or other financial institutions acting alone. Varying economic conditions may also affect equity and foreign exchange markets, which could also have an impact on our revenues. We caution you that the risk factors disclosed above are not exhaustive, and there could be other uncertainties and potential risk factors not considered here which may adversely affect our results and financial condition. Any forward-looking statements in this document speak only as of the date of this document. We do not undertake any obligation to, and expressly disclaim any obligation to, update or alter our forward-looking statements, whether as a result of new information, subsequent events or otherwise, except as required under applicable securities legislation.
Caution Concerning Forward-Looking Statements
H S B C B A N K C A N A D A
2
Shareholder Information
PrInCIPaL addreSSeS:
Vancouver:HSBC Bank Canada885 West Georgia StreetVancouver, British ColumbiaCanada V6C 3E8Tel: (604) 685-1000Fax: (604) 641-3098
Toronto:HSBC Bank Canada70 York StreetToronto, OntarioCanada M5J 1S9Tel: (416) 868-8000Fax: (416) 868-3800
Media enquiries:Vancouver (English) (604) 641-2973Toronto (English) (416) 868-3878Toronto (French) (416) 868-8282
WebSITe:
www.hsbc.ca
HSbC bank Canada SeCurITIeS are LISTed on THe ToronTo SToCk eXCHanGe:
HSBC Bank Canada Class 1 Preferred Shares – Series C (HSB.PR.C)Class 1 Preferred Shares – Series D (HSB.PR.D)Class 1 Preferred Shares – Series E (HSB.PR.E)
TranSFer aGenT and reGISTrar:
Computershare Investor Services Inc.Shareholder Service Department9th Floor, 100 University AvenueToronto, OntarioCanada M5J 2Y1Tel: 1 (800) 564-6253
SHareHoLder ConTaCT:
For change of address, shareholders are requested to write to the bank’s transfer agent, Computershare Investor Services Inc., at their mailing address.
Other shareholder inquiries may be directed to our Shareholder Relations De-partment by writing to:
HSBC Bank CanadaShareholder Relations4th Floor2910 Virtual WayVancouver, British ColumbiaCanada V5M 0B2
Shareholder relations:Chris Young (604) 642-4389Harry Krentz (604) 641-1013

H S B C B A N K C A N A D A
I am very pleased to report that in 2012, after over 30 years serving Canadians, HSBC Bank Canada reached an important milestone, for the first time reporting profit before tax of over $1 billion.
Over the course of the last two years, HSBC Bank Canada has been refocusing our business to use our significant strengths to better serve our core clients, internationally minded businesses and individuals. Despite a challenging operating environment and many changes to our business, HSBC continued to deliver strong results. I attribute this in large part to the calibre of the Canadian staff. There is a strong spirit of collaboration, team work and commitment to delivery and execution of the HSBC strategy and they clearly demonstrate the HSBC values of being open, dependable and connected.
While this work has involved a large team of committed and talented individuals, I would be remiss if I did not recognize the leadership of Lindsay Gordon, who retired as President and CEO of HSBC Bank Canada on 5 January 2013 after 9 years in the role and 25 years with HSBC. As Lindsay moves on to a new phase in his life, he leaves behind a bank well positioned for future growth.
As part of the HSBC Group, with operations in over 80 countries around the world, HSBC Bank Canada’s deep understanding of the key issues, trends and challenges facing Canadian companies doing business abroad and international companies doing business in Canada enables us to provide them unique support.
Commercial Banking and Global Banking and Markets continued to leverage their strengths, increasing cross selling between the two businesses and leveraging our unique international footprint and capabilities to serve our core clients.
A key example of that support is our suite of foreign currency savings accounts – the largest suite of such products offered by a major financial institution in Canada – which was expanded to include a Renminbi account this year.
We were also pleased that HSBC Bank Canada was named Best Domestic Cash Management Bank in Canada by Euromoney for the second year and HSBC InvestDirect received top ranking in Dalbar’s 2012 Service Award for direct brokerages.
HSBC continued to be the fastest growing bank-owned fund company in Canada in 2012, with 17.7% growth in net assets at year end. And we invested in our retail banking business, refreshing and upgrading our branch network and training our staff to better serve the complex needs of our internationally minded customers.
In 2012, HSBC moved 1,200 staff into Broadway Green a new state-of-the art, environmentally sustainable Vancouver location. With this move, roughly 40% of our Canadian work force is now housed in premises that meet the Leadership in Energy Efficient Design (LEED) Gold Standard. And we were also pleased to be included in the Corporate Knights 2012 list of Best Corporate Citizens in Canada.
Canada is one of the priority growth markets for the HSBC Group. We expect the Canadian economy to continue to be resilient in 2013 as a result of growing trade and capital flows with emerging markets, partially offset by cautious consumer spending. As the leading international bank operating in Canada, HSBC is very well positioned to capture the growth opportunities available in this market.
I am honoured to lead the HSBC team in Canada and excited with the prospects for the coming year.
Paulo MaiaPresident and Chief Executive OfficerHSBC Bank Canada
Vancouver, Canada27 February 2013
H S B C B A N K C A N A D A
Message from the President and Chief executive officer
3
H S B C B A N K C A N A D AH S B C B A N K C A N A D A
Management’s discussion and analysis (continued)
4
Five Year Financial Summary
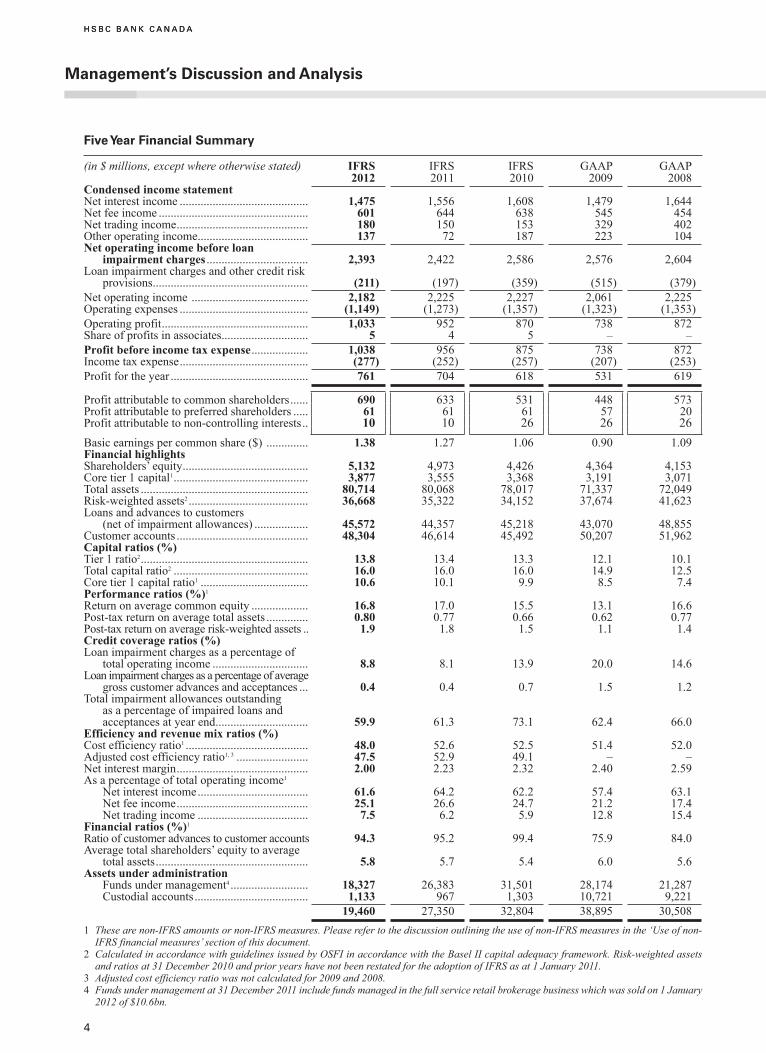
(in $ millions, except where otherwise stated) IFRS IFRS IFRS GAAP GAAP2012 2011 2010 2009 2008
Condensed income statement Net interest income ........................................... 1,475 1,556 1,608 1,479 1,644 Net fee income .................................................. 601 644 638 545 454Net trading income ............................................ 180 150 153 329 402 Other operating income ..................................... 137 72 187 223 104Net operating income before loan
impairment charges .................................. 2,393 2,422 2,586 2,576 2,604 Loan impairment charges and other credit risk
provisions .................................................... (211) (197 ) (359 ) (515 ) (379 )Net operating income ....................................... 2,182 2,225 2,227 2,061 2,225 Operating expenses ........................................... (1,149) (1,273 ) (1,357 ) (1,323 ) (1,353 )Operating profit ................................................. 1,033 952 870 738 872 Share of profits in associates ............................. 5 4 5 – –Profit before income tax expense ................... 1,038 956 875 738 872 Income tax expense ........................................... (277) (252 ) (257 ) (207 ) (253 )Profit for the year .............................................. 761 704 618 531 619
Profit attributable to common shareholders ...... 690 633 531 448 573 Profit attributable to preferred shareholders ..... 61 61 61 57 20 Profit attributable to non-controlling interests .. 10 10 26 26 26 Basic earnings per common share ($) .............. 1.38 1.27 1.06 0.90 1.09 Financial highlightsShareholders’ equity .......................................... 5,132 4,973 4,426 4,364 4,153 Core tier 1 capital1 ............................................. 3,877 3,555 3,368 3,191 3,071Total assets ........................................................ 80,714 80,068 78,017 71,337 72,049Risk-weighted assets2 ........................................ 36,668 35,322 34,152 37,674 41,623 Loans and advances to customers
(net of impairment allowances) .................. 45,572 44,357 45,218 43,070 48,855 Customer accounts ............................................ 48,304 46,614 45,492 50,207 51,962 Capital ratios (%)Tier 1 ratio2 ........................................................ 13.8 13.4 13.3 12.1 10.1Total capital ratio2 ............................................. 16.0 16.0 16.0 14.9 12.5Core tier 1 capital ratio1 .................................... 10.6 10.1 9.9 8.5 7.4Performance ratios (%)1
Return on average common equity ................... 16.8 17.0 15.5 13.1 16.6 Post-tax return on average total assets .............. 0.80 0.77 0.66 0.62 0.77Post-tax return on average risk-weighted assets .. 1.9 1.8 1.5 1.1 1.4Credit coverage ratios (%)Loan impairment charges as a percentage of
total operating income ................................ 8.8 8.1 13.9 20.0 14.6Loan impairment charges as a percentage of average
gross customer advances and acceptances ... 0.4 0.4 0.7 1.5 1.2Total impairment allowances outstanding
as a percentage of impaired loans and acceptances at year end ............................... 59.9 61.3 73.1 62.4 66.0
Efficiency and revenue mix ratios (%)Cost efficiency ratio1 ......................................... 48.0 52.6 52.5 51.4 52.0Adjusted cost efficiency ratio1, 3 ........................ 47.5 52.9 49.1 – –Net interest margin ............................................ 2.00 2.23 2.32 2.40 2.59As a percentage of total operating income1
Net interest income ..................................... 61.6 64.2 62.2 57.4 63.1 Net fee income ............................................ 25.1 26.6 24.7 21.2 17.4 Net trading income ..................................... 7.5 6.2 5.9 12.8 15.4Financial ratios (%)1
Ratio of customer advances to customer accounts 94.3 95.2 99.4 75.9 84.0Average total shareholders’ equity to average
total assets ................................................... 5.8 5.7 5.4 6.0 5.6Assets under administration Funds under management4 .......................... 18,327 26,383 31,501 28,174 21,287 Custodial accounts ...................................... 1,133 967 1,303 10,721 9,221
19,460 27,350 32,804 38,895 30,508 1 These are non-IFRS amounts or non-IFRS measures. Please refer to the discussion outlining the use of non-IFRS measures in the ‘Use of non-
IFRS financial measures’ section of this document.2 Calculated in accordance with guidelines issued by OSFI in accordance with the Basel II capital adequacy framework. Risk-weighted assets
and ratios at 31 December 2010 and prior years have not been restated for the adoption of IFRS as at 1 January 2011. 3 Adjusted cost efficiency ratio was not calculated for 2009 and 2008. 4 Funds under management at 31 December 2011 include funds managed in the full service retail brokerage business which was sold on 1 January
2012 of $10.6bn.

5
basis of Preparation of Financial Information
HSBC Bank Canada’s (‘the bank’, ‘we’, ‘our’) is an indirectly wholly-owned subsidiary of HSBC Holdings plc (‘HSBC Holdings’). Throughout the Management’s Discussion and Analysis (‘MD&A’), the HSBC Holdings Group is defined as the ‘HSBC Group’ or the ‘Group’. The MD&A is dated 27 February 2013, the date that our consolidated financial statements and MD&A for the year ended 31 December 2012 were approved by our Board of Directors (‘the Board’).
From 1 January 2011, the bank has prepared its consolidated financial statements in accordance with International Financial Reporting Standards (‘IFRS’) and accounting guidelines as issued by the Office of the Superintendent of Financial Institutions (‘OSFI’), as required under Section 308(4) of the Bank Act. Comparative data relating to 2010 have been restated on an IFRS basis. Prior to the adoption of IFRS, our consolidated financial statements were prepared in accordance with Canadian generally accepted accounting principles (‘GAAP’). Comparative data relating to 2009 and prior periods have been presented under GAAP. The information in this MD&A is derived from our consolidated financial statements or from the information used to prepare them. The abbreviations ‘$m’ and ‘$bn’ represent millions and billions of Canadian dollars, respectively. All tabular amounts are in millions of dollars except where otherwise stated.
The sections on risk management included in this MD&A where indicated form an integral part of the consolidated financial statements and should be read in conjunction with the audited consolidated financial statements for the year ended 31 December 2012.
The reference to ‘notes’ throughout this MD&A refer to notes on the audited consolidated financial statements for the year ended 31 December 2012.
Other available information. We file all of our news releases regarding material matters, interim and annual consolidated financial statements, interim and annual MD&A, Annual Reports, Annual Information Form, certifications by our Chief Executive Officer (‘CEO’) and Chief Financial Officer (‘CFO’), as well as other continuous disclosure documents, with SEDAR. Copies of these documents can be obtained from SEDAR’s website: sedar.com and our website: hsbc.ca.
Outstanding securities data. Note 27 contains details of the number of preferred and common shares issued and outstanding at 31 December 2012. Note 28(a) contains details of the number of HSBC Canada Asset Trust Securities (‘HSBC HaTS™’) outstanding at 31 December 2012. Subsequent to that date and up to the date of this MD&A, there have been no issues of any form of securities.
use of non-IFrS Financial Measures
The bank uses both IFRS and non-IFRS financial measures to assess performance. Securities regulators require that companies caution readers that earnings and other measures that have been adjusted to a basis other than IFRS do not have any standardized meaning under IFRS and are therefore unlikely to be comparable to similar measures used by other issuers. The non-IFRS measures that are used in this MD&A which are regularly monitored by management are:
– Return on average common equity – Profit attributable to common shareholders divided by average common equity, which is calculated using month-end balances of common equity for the year.
– Post-tax return on average assets – Profit attributable to common shareholders divided by average assets, which is calculated using average daily balances for the year.
– Post-tax return on average risk-weighted assets – Profit attributable to common shareholders divided by the average monthly balances of risk-weighted assets for the year. Risk-weighted assets are calculated using guidelines issued by OSFI in accordance with the Basel II capital adequacy framework.
– Cost efficiency ratio – Calculated as total operating expenses for the year divided by net operating income before loan impairment charges and other credit risk provisions for the year.
– Adjusted cost efficiency ratio – Cost efficiency ratio adjusted to exclude gains and losses from financial instruments designated at fair value from net operating income before loan impairment charges and other credit risk provisions.
– Net interest income, net fee income and net trading income as a percentage of total operating income – Net interest income, net fee income and net trading income for the year divided by net operating income before loan impairment charges and other credit risk provisions for the year.
– Ratio of customer advances to customer accounts – Loans and advances to customers divided by customer accounts, using year-end balances.
– Average total shareholders’ equity to average total assets – average shareholders’ equity is calculated using month-end balances of total shareholders’ equity for the year and average total assets are calculated using average daily balances for the year.
– Core tier 1 capital – Tier 1 capital less non-controlling interests and preferred shares.
– Core tier 1 capital ratio – Core tier 1 capital as a percentage of risk-weighted assets.
overview
In Canada, HSBC is the leading international bank and seventh largest bank overall with operations across the country and total assets of $80.7bn at 31 December 2012. Originally established in 1981, with our head office located in Vancouver, British Columbia, we have grown organically and through certain strategic acquisitions, to become an integrated financial services organization. Our financial strength, premium customer base and ability to leverage our brand and global network ensured that the bank remained strong and profitable over the past year. We offer a comprehensive range of products and services including broking, underwriting and credit facilities, trade finance, credit cards, sales of investment products, and funds under management.
The HSbC Group
We are a member of the HSBC Group, whose parent company HSBC Holdings is headquartered in London, UK. The HSBC Group is one of the largest banking and financial services organizations in the world, with an international network in Europe, the Asia-Pacific region, the Americas, the Middle East and Africa. Shares in HSBC Holdings are listed on the London, Hong Kong, New York, Paris and Bermuda stock exchanges. The shares are traded in New York in the form of American Depositary Receipts.
Through an international network linked by advanced technology, the HSBC Group provides a comprehensive range of financial services through three business lines: Retail Banking and Wealth Management, Commercial Banking and Global Banking and Markets.
Complete financial and operational information for HSBC Holdings and the HSBC Group can be obtained from its website, www.hsbc.com, including copies of HSBC Holdings 2012 Annual Review and its 2012 Annual Report and Accounts.
For over 150 years the HSBC Group has been where the growth is, connecting customers to opportunities. We enable businesses to thrive and economies to prosper, helping people fulfil their hopes and dreams and realize their ambitions. This is our role and purpose.
The role of the HSBC Group values in daily operating practice is fundamental to its culture in the context of the financial services sector and the wider economy. This is particularly so in the light of developments and changes in regulatory policy, investor confidence and society’s view of the role of banks. The HSBC Group expects its executives and employees to act with courageous integrity in the execution of their duties by being:
– dependable and doing the right thing;
– open to different ideas and cultures; and
– connected with our customers, communities, regulators and each other.
The HSBC Group continues to enhance its values-led culture by embedding HSBC Group values into how it conducts its business and in the selection, assessment, recognition and learning provided to staff.
H S B C B A N K C A N A D A
Management’s discussion and analysis (continued)
6

7
The overall HSBC Group strategy is to be the world’s leading international bank. HSBC is one of the few truly international banks and its advantage lies in its network of markets relevant for international financial flows, its access and exposure to high growth markets and businesses, and its strong balance sheet generating a resilient stream of earnings.
The HSBC Group strategy has two parts:
– Network of businesses connecting the world HSBC is ideally positioned to capture growing international financial flows. HSBC’s franchise puts it in a privileged position to serve corporate clients as they grow from small enterprises into large and international corporates, and personal clients as they become more affluent. Access to local retail funding and its international product capabilities allows HSBC to offer distinctive solutions to these clients in a profitable manner.
– Wealth management and retail with local scale HSBC will leverage its position in faster-growing markets to capture social mobility and wealth creation through its Wealth Management and Global Private Banking businesses. HSBC will only invest in retail businesses in markets where it can achieve profitable scale.
our Strategic direction and Main achievements for 2012
Products and servicesWe manage and report our operations around the following global businesses: Retail Banking and Wealth Management, Commercial Banking, Global Banking and Markets and Consumer Finance. We have built a culture that delivers integrated service ensuring customer needs are met across products and subsidiaries, and internationally through the HSBC Group’s extensive and unparalleled worldwide network.
Commercial Banking We segment our Commercial Banking business into Corporate, to serve both Corporate and Mid-Market companies with more sophisticated financial needs, and Business Banking, which serves the small and medium-sized enterprises sector. This enables the development of tailored customer propositions while adopting a broader view of the entire commercial banking sector, from sole proprietors to large corporations. It also allows us to provide continuous support to companies as they expand both domestically and internationally, and ensures a clear focus on the business banking segments that are typically the key to innovation and growth in market economies.
The Commercial Banking business continued to focus on its position as the leading international bank for business by strengthening our cross border capabilities, particularly through our investment to grow our presence in central Canada and focus on helping Canadian businesses expand to other markets where HSBC has presence.
We place particular emphasis on international connectivity to meet our business customers’ needs.
– Financing: we offer a broad range of financing, both domestic and cross border, including overdrafts, receivables finance, term loans and leasing.
– Payment and cash management: we are a leading provider of domestic and cross border payments and collections, liquidity management and account services worldwide, delivered through our e-platform, HSBCnet.
– International trade: we provide various international trade products and services, to both buyers and suppliers such as export finance, guarantees, documentary collections and forfeiting to improve efficiency and help mitigate risk throughout the supply chain.
– Treasury: Commercial Banking customers are volume users of our foreign exchange, derivatives and structured products.
– Capital markets and advisory: capital raising on debt and equity markets and advisory services are available as required.
– Commercial cards: card issuing helps customers enhance cash management, credit control and purchasing.
– Direct channels: these include online and direct banking offerings such as telephone banking, HSBCnet and Business Internet Banking.
Business developments and achievements for 2012 include:
– Best Bank for Cash Management – The 2012 Euromoney Cash Management survey, an annual survey of cash managers, treasurers and financial officers worldwide, named HSBC Bank Canada the Best Domestic Cash Manager for 2012, and named HSBC Global capabilities Best International money Manager for 2012.
– International Business – We continued to strengthen our cross border capabilities and international connectivity through the HSBC Group’s worldwide international banking centres. The number of successful international customer referrals in and out of Canada grew over 25 per cent year on year.
– New Products and capabilities launched in 2012 – Several products and campaigns were launched in 2012, prominent among them being our market leading Renminbi currency capabilities in Trade and Payments and Cash Management to further enhance HSBC’s capabilities of helping Canadian businesses do business in China.
Global Banking and Markets Global Banking and Markets provides tailored financial solutions to major government, corporate and institutional clients and private investors worldwide. Managed as a global business, Global Banking and Markets operate a long-term relationship management approach to build a full understanding of clients’ financial requirements. Sector-focused client service teams, comprising relationship managers and product specialists, develop financial solutions to meet individual client needs. With dedicated offices in over 65 countries and access to HSBC’s worldwide presence and capabilities, this business serves our largest global clients internationally.
The Global Banking and Markets business continued to focus on being the international bank of choice by building a client-driven franchise serving the global needs of our core clients, delivering global products to Canadian clients and Canadian products to global clients.
Global Banking and Markets is managed as two principal business lines, Global Markets and Global Banking. This structure allows us to focus on relationships and sectors that best fit the HSBC Group’s footprint and facilitate seamless delivery of our products and services to clients.
– Global Markets operations consist of treasury and capital markets services. Products include foreign exchange, currency, interest rate, bond, credit, equity, energy and other derivatives; government and non-government fixed income and money market instruments; precious metals and exchange-traded futures; equity services and distribution of capital markets instruments.
– Global Banking offers financing, advisory and transaction services. Products include:
– Capital raising, advisory services, bilateral and syndicated lending, leveraged and acquisition finance, structured and project finance, lease finance and non-retail deposit taking; and
– International, regional and domestic payments and cash management services; and trade services for large corporate clients.
Business developments and achievements for 2012 include:
– Global Markets – a focus on enhanced connectivity with our internal and external clients – domestically and globally resulted in a significant increase in the number of clients with which HSBC dealt across all Global Markets products.
– Global Banking – leveraging the global network, building relationships with target clients in our focus sectors –resources, energy, infrastructure and financial institutions – and expanding our resources and capabilities in those areas. Our international capabilities and joined up approach resulted in HSBC playing a leading role in a number of key cross border transactions for major Canadian corporations and pension plans. We continued to be active in significant debt and equity capital markets transactions for our key clients as well as cross border advisory activity and we maintained a leading position in cross border debt financing for Canadian public sector and corporate clients.
H S B C B A N K C A N A D A
Management’s discussion and analysis (continued)
8

9
Retail Banking and Wealth Management Retail Banking and Wealth Management is strategically focused on developing world class wealth management for retail banking consumers, leveraging global expertise in retail banking and driving superior returns through portfolio management. We will continue to build on the strength and success of our HSBC Premier brand, delivering world class retail banking and wealth management expertise and products through a globally consistent standardized business model. Our goal remains to be the leading international premium bank in Canada, offering internationally-minded premium customers innovative products and services aligned with their financial needs and aspirations.
Our approach is simple. We cultivate long-term and mutually valuable relationships with our customers, providing needs-driven retail banking and wealth management expertise, products and services. Our global propositions – HSBC Premier and HSBC Advance – are for mass affluent and emerging affluent customers who value our unique global reach and scale. For customers with everyday banking requirements, we offer a full range of banking products and services aligned with their domestic needs.
Customer offerings include personal banking products (current and savings accounts, mortgages and personal loans, credit cards, debit cards and local and international payment services) and wealth management services (investment products and financial planning services).
– HSBC Premier provides preferential banking services and global recognition to our high net worth customers and their immediate families with a dedicated relationship manager, specialist wealth advice and tailored solutions. Customers can access emergency travel assistance, priority telephone banking and online ‘global view’ of their HSBC Premier accounts around the world with free money transfers between them.
– HSBC Advance provides a range of preferential products and services customized for emerging, mass affluent customers. With a dedicated telephone service, access to wealth advice and online tools to support financial planning, it gives customers an online ‘global view’ of their HSBC Advance accounts with money transfers between them.
– Wealth Solutions & Financial Planning: a financial planning process designed around individual customer needs to help our clients to protect, grow and manage their wealth through best-in-class investment products manufactured by in-house partners (Global Asset Management and Global Markets).
– Customers can transact with the bank via a range of channels such as face to face, internet banking, telephone service centres and self-service terminals.
Business developments and achievements for 2012 include:
– HSBC Premier – Our HSBC Premier customers enjoy seamless global banking through more than 6,000 HSBC Premier branches and 250 HSBC Premier Tier 1 centres in 46 countries.
– HSBC Advance – We grew our HSBC Advance customer base by 24.7%.
– Wealth management – HSBC Bank Canada ranks fifth in mutual fund sales vis-a-vis domestic banks, with total net sales of $1.3bn, significantly outselling the competition relative to our size, and demonstrating our customers’ appetite for global investment opportunities. Our mutual fund business has grown at 17.7% through 2012; and versus 2.7% for the industry overall.
– HSBC offers Premium series pricing across the entire mutual fund range, an initiative designed to support growth in both fund sales and assets amongst affluent/high net worth Premier investors. Following the launch of the HSBC Emerging Markets Debt Fund in Oct 2011, we now have one of the broadest emerging market fund ranges in Canada. The emerging markets debt fund category in Canada has seen a 159.5% growth in assets from last year and more than three times the net sales of any other emerging market category in Canada. The HSBC Emerging Markets Debt Fund is the second largest emerging markets debt fund in Canada, with $178m in assets. HSBC Chinese Equity Fund is the largest Chinese equity fund in Canada, and the HSBC Indian Equity Fund continues to be the top selling fund in its category.
– Product innovations – 2012 was a year of re-engineering, simplification and modernization in order to deliver higher quality products and services, and to improve the customer experience. We continued to enhance our branch network, and launched a new personal internet banking platform. In November 2012, we launched a Premier World MasterCard™ with an improved rewards program. In addition, we added two airlines – British Airways and Jet Airways – to expand our Premier reward for miles program. We also integrated HSBC credit card online services with personal internet and mobile banking, so that our customers can access their credit card account using a single sign-on.
– Service Awards – HSBC InvestDirect ranks first in DALBAR 2012 service award for outstanding client services.
Consumer Finance In March 2012, HSBC Financial Corporation Limited, the bank’s wholly-owned subsidiary, announced the wind-down of its consumer finance business in Canada and, except for existing commitments, ceased origination of loans. The primary focus of HSBC Financial Corporation Limited is the orderly wind-down of its consumer finance receivables.
economic outlook For 2013
We expect the Canadian economy to show modest but continued improvement through 2013 with greater growth in the second half over the first. The pace of growth in the Canadian economy is expected to be moderate, with consumers turning cautious amid elevated levels of household debt, and a slow pace of job creation. With inflation to remain well below the Bank of Canada’s target rate of two percent, we expect the bank to leave interest rates unchanged in 2013. Another factor likely to keep the Bank of Canada on hold is that the Federal Reserve has recently launched another round of asset purchases. This will leave the Bank of Canada conscious of the impact on the Canadian dollar of lifting rates well before the Federal Reserve.
We anticipate the regulatory environment to intensify, particularly due to global changes. With our continued focus on our key principles of a strong capital base, a diversified income stream and strong liquidity, we intend to position the bank to maximize opportunities and to stay focused on our ‘right to win’ strategy in core business segments.
Since the credit and liquidity crisis of 2008, Canada has emerged as a relative safe haven by virtue of being one of the few remaining AAA-rated nations. Hence, during periods of economic and financial stress, a flight-to-quality supports the Canadian dollar. This could further erode export competitiveness. The most notable potential external risks are a hard landing in an emerging market, a disorderly outturn to sovereign debt issues in Europe, or a sharp fiscal contraction in the US that would result in lower demand for Canada’s goods exports.
analysis of Financial results for 2012
Highlights
– Profit before income tax expense for 2012 was $1,038m, an increase of $81m, or 8.6% compared with $956m for 2011.
– Profit for 2012 was $761m, an increase of $57m, or 8.1% compared with $704m for 2011.
– Profit attributable to common shareholders for 2012 was $690m, an increase of $57m, or 9.0% compared with $633m for 2011.
– Return on average common equity for 2012 was 16.8%, compared with 17.0% for 2011.
– The cost efficiency ratio for 2012 was 48.0%, compared with 52.6% for 2011.
– Total assets were $80.7bn at 31 December 2012, an increase of $0.6bn, or 0.7%, from $80.1bn at 31 December 2011.
– Total assets under administration were $19.5bn at 31 December 2012, a decrease of $7.9bn, or 28.8%, from $27.4bn at 31 December 2011.
– Tier 1 capital ratio and the total capital ratio were 13.8% and 16.0% respectively at 31 December 2012 compared with 13.4% and 16.0% respectively at 31 December 2011.
H S B C B A N K C A N A D A
Management’s discussion and analysis (continued)
10
11
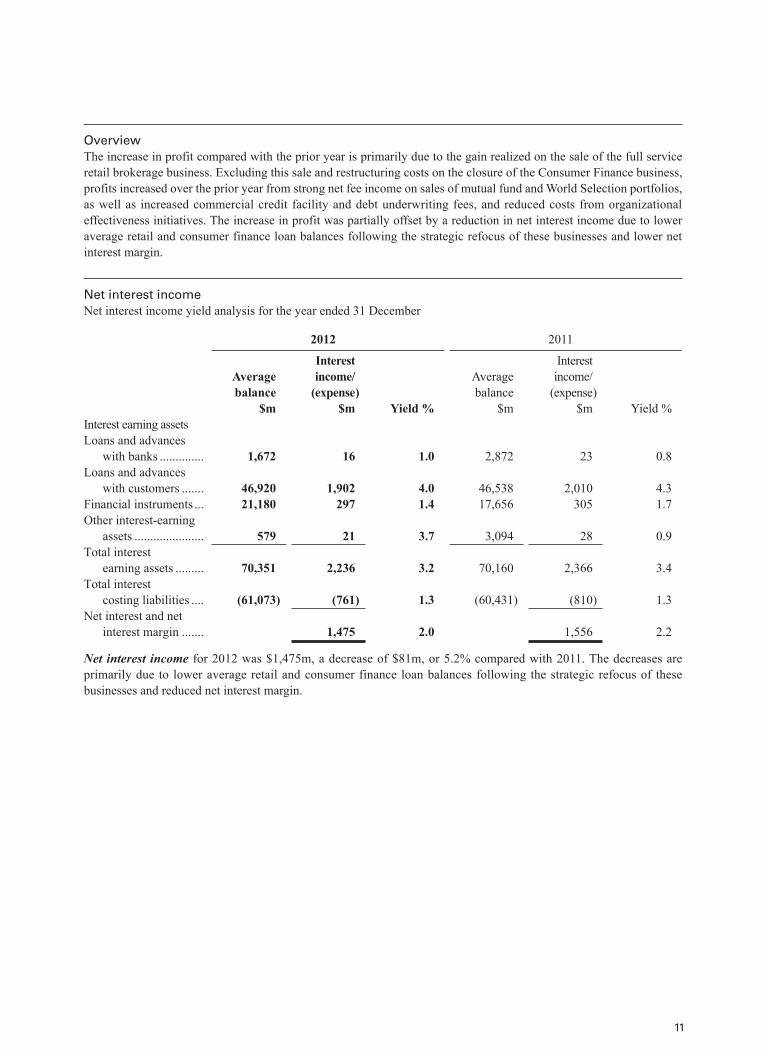
OverviewThe increase in profit compared with the prior year is primarily due to the gain realized on the sale of the full service retail brokerage business. Excluding this sale and restructuring costs on the closure of the Consumer Finance business, profits increased over the prior year from strong net fee income on sales of mutual fund and World Selection portfolios, as well as increased commercial credit facility and debt underwriting fees, and reduced costs from organizational effectiveness initiatives. The increase in profit was partially offset by a reduction in net interest income due to lower average retail and consumer finance loan balances following the strategic refocus of these businesses and lower net interest margin.
Net interest incomeNet interest income yield analysis for the year ended 31 December
2012 2011
Average balance
$m
Interest income/
(expense $m
)Yield %
Average balance
$m
Interest income/
(expense $m
)Yield %
Interest earning assetsLoans and advances
with banks .............. 1,672 16 1.0 2,872 23 0.8Loans and advances
with customers ....... 46,920 1,902 4.0 46,538 2,010 4.3Financial instruments ... 21,180 297 1.4 17,656 305 1.7Other interest-earning
assets ...................... 579 21 3.7 3,094 28 0.9Total interest
earning assets ......... 70,351 2,236 3.2 70,160 2,366 3.4Total interest
costing liabilities .... (61,073) (761) 1.3 (60,431) (810) 1.3Net interest and net
interest margin ....... 1,475 2.0 1,556 2.2
Net interest income for 2012 was $1,475m, a decrease of $81m, or 5.2% compared with 2011. The decreases are primarily due to lower average retail and consumer finance loan balances following the strategic refocus of these businesses and reduced net interest margin.
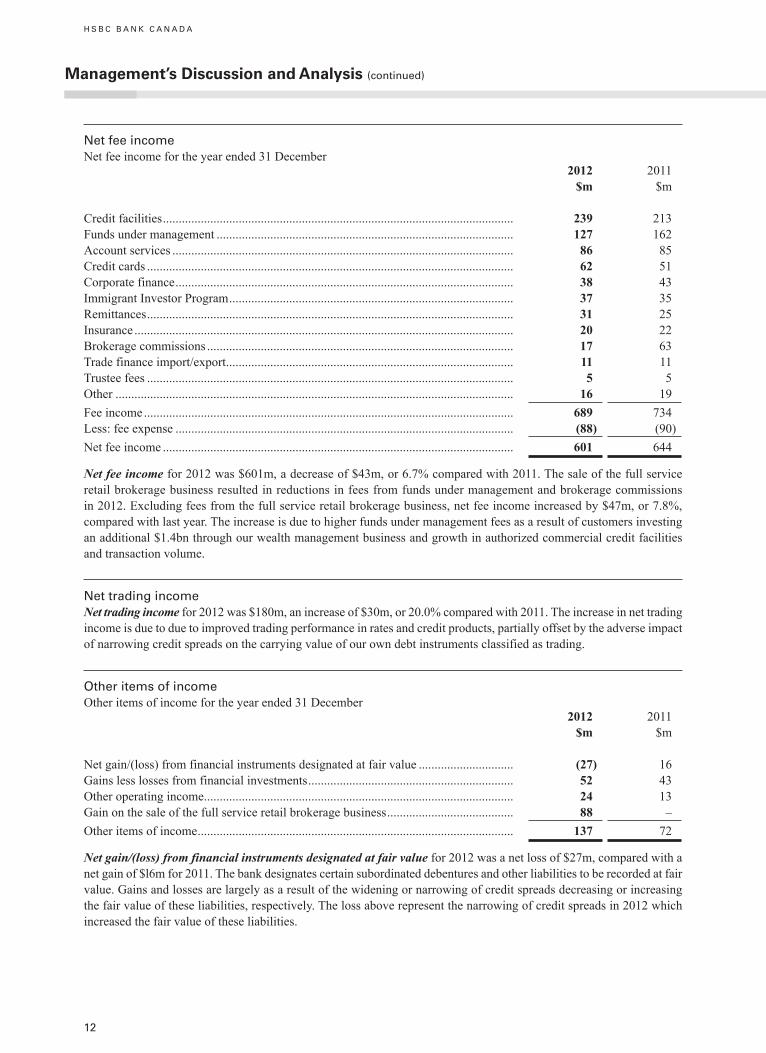
Net fee incomeNet fee income for the year ended 31 December
2012 $m
2011 $m
Credit facilities ............................................................................................................... 239 213Funds under management .............................................................................................. 127 162Account services ............................................................................................................ 86 85Credit cards .................................................................................................................... 62 51Corporate finance ........................................................................................................... 38 43Immigrant Investor Program .......................................................................................... 37 35Remittances .................................................................................................................... 31 25Insurance ........................................................................................................................ 20 22Brokerage commissions ................................................................................................. 17 63Trade finance import/export ........................................................................................... 11 11Trustee fees .................................................................................................................... 5 5Other .............................................................................................................................. 16 19Fee income ..................................................................................................................... 689 734Less: fee expense ........................................................................................................... (88) (90)Net fee income ............................................................................................................... 601 644
Net fee income for 2012 was $601m, a decrease of $43m, or 6.7% compared with 2011. The sale of the full service retail brokerage business resulted in reductions in fees from funds under management and brokerage commissions in 2012. Excluding fees from the full service retail brokerage business, net fee income increased by $47m, or 7.8%, compared with last year. The increase is due to higher funds under management fees as a result of customers investing an additional $1.4bn through our wealth management business and growth in authorized commercial credit facilities and transaction volume.
Net trading incomeNet trading income for 2012 was $180m, an increase of $30m, or 20.0% compared with 2011. The increase in net trading income is due to due to improved trading performance in rates and credit products, partially offset by the adverse impact of narrowing credit spreads on the carrying value of our own debt instruments classified as trading.
Other items of incomeOther items of income for the year ended 31 December
2012 $m
2011 $m
Net gain/(loss) from financial instruments designated at fair value .............................. (27) 16Gains less losses from financial investments ................................................................. 52 43Other operating income .................................................................................................. 24 13Gain on the sale of the full service retail brokerage business ........................................ 88 –Other items of income .................................................................................................... 137 72
Net gain/(loss) from financial instruments designated at fair value for 2012 was a net loss of $27m, compared with a net gain of $l6m for 2011. The bank designates certain subordinated debentures and other liabilities to be recorded at fair value. Gains and losses are largely as a result of the widening or narrowing of credit spreads decreasing or increasing the fair value of these liabilities, respectively. The loss above represent the narrowing of credit spreads in 2012 which increased the fair value of these liabilities.
H S B C B A N K C A N A D A
Management’s discussion and analysis (continued)
12
13
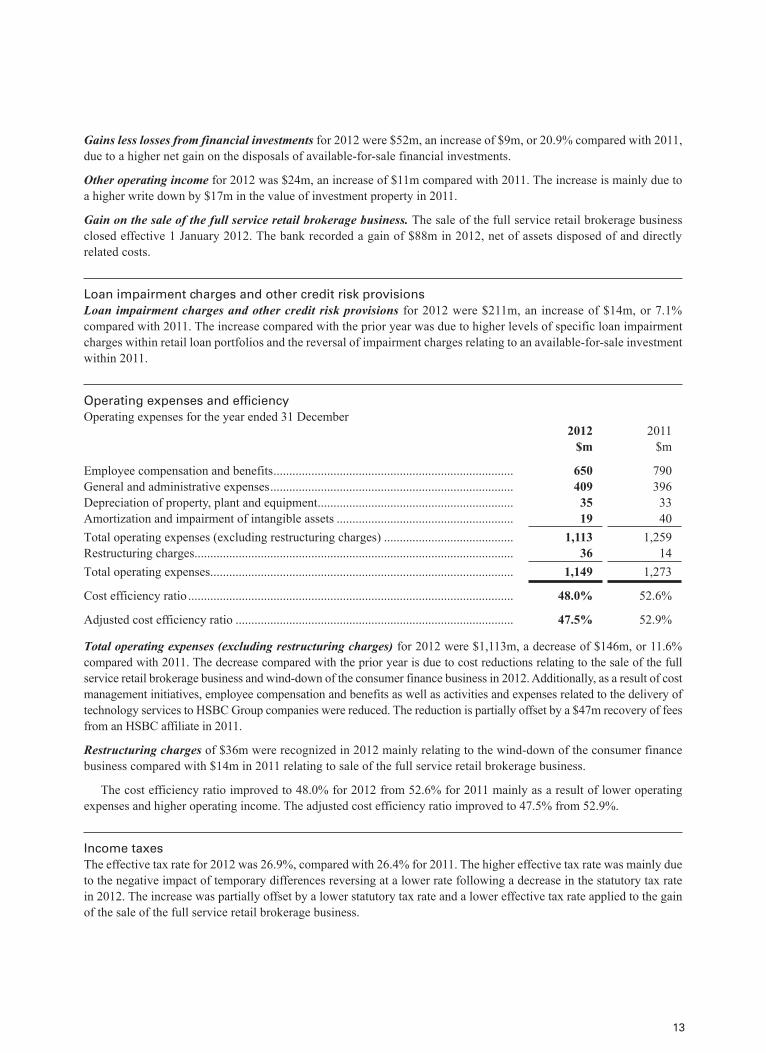
Gains less losses from financial investments for 2012 were $52m, an increase of $9m, or 20.9% compared with 2011, due to a higher net gain on the disposals of available-for-sale financial investments.
Other operating income for 2012 was $24m, an increase of $11m compared with 2011. The increase is mainly due to a higher write down by $17m in the value of investment property in 2011.
Gain on the sale of the full service retail brokerage business. The sale of the full service retail brokerage business closed effective 1 January 2012. The bank recorded a gain of $88m in 2012, net of assets disposed of and directly related costs.
Loan impairment charges and other credit risk provisionsLoan impairment charges and other credit risk provisions for 2012 were $211m, an increase of $14m, or 7.1% compared with 2011. The increase compared with the prior year was due to higher levels of specific loan impairment charges within retail loan portfolios and the reversal of impairment charges relating to an available-for-sale investment within 2011.
Operating expenses and efficiencyOperating expenses for the year ended 31 December
2012 $m
2011 $m
Employee compensation and benefits ............................................................................ 650 790General and administrative expenses ............................................................................. 409 396Depreciation of property, plant and equipment .............................................................. 35 33Amortization and impairment of intangible assets ........................................................ 19 40Total operating expenses (excluding restructuring charges) ......................................... 1,113 1,259Restructuring charges ..................................................................................................... 36 14Total operating expenses ................................................................................................ 1,149 1,273
Cost efficiency ratio ....................................................................................................... 48.0% 52.6%
Adjusted cost efficiency ratio ........................................................................................ 47.5% 52.9%
Total operating expenses (excluding restructuring charges) for 2012 were $1,113m, a decrease of $146m, or 11.6% compared with 2011. The decrease compared with the prior year is due to cost reductions relating to the sale of the full service retail brokerage business and wind-down of the consumer finance business in 2012. Additionally, as a result of cost management initiatives, employee compensation and benefits as well as activities and expenses related to the delivery of technology services to HSBC Group companies were reduced. The reduction is partially offset by a $47m recovery of fees from an HSBC affiliate in 2011.
Restructuring charges of $36m were recognized in 2012 mainly relating to the wind-down of the consumer finance business compared with $14m in 2011 relating to sale of the full service retail brokerage business.
The cost efficiency ratio improved to 48.0% for 2012 from 52.6% for 2011 mainly as a result of lower operating expenses and higher operating income. The adjusted cost efficiency ratio improved to 47.5% from 52.9%.
Income taxesThe effective tax rate for 2012 was 26.9%, compared with 26.4% for 2011. The higher effective tax rate was mainly due to the negative impact of temporary differences reversing at a lower rate following a decrease in the statutory tax rate in 2012. The increase was partially offset by a lower statutory tax rate and a lower effective tax rate applied to the gain of the sale of the full service retail brokerage business.
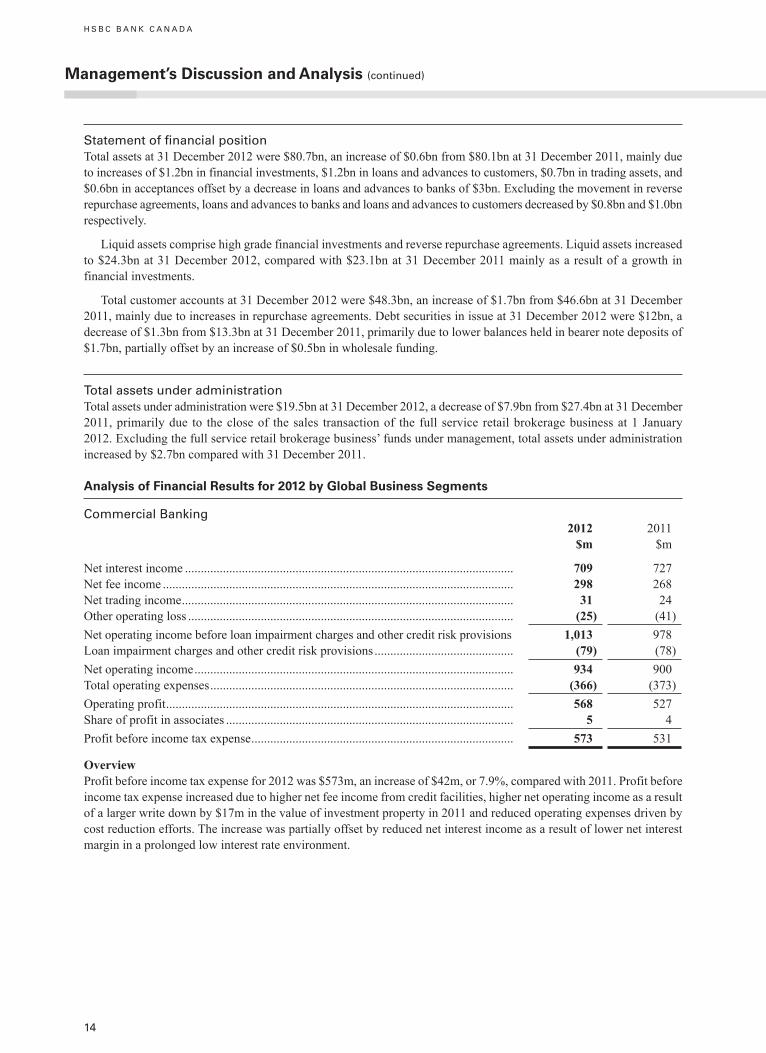
Statement of financial positionTotal assets at 31 December 2012 were $80.7bn, an increase of $0.6bn from $80.1bn at 31 December 2011, mainly due to increases of $1.2bn in financial investments, $1.2bn in loans and advances to customers, $0.7bn in trading assets, and $0.6bn in acceptances offset by a decrease in loans and advances to banks of $3bn. Excluding the movement in reverse repurchase agreements, loans and advances to banks and loans and advances to customers decreased by $0.8bn and $1.0bn respectively.
Liquid assets comprise high grade financial investments and reverse repurchase agreements. Liquid assets increased to $24.3bn at 31 December 2012, compared with $23.1bn at 31 December 2011 mainly as a result of a growth in financial investments.
Total customer accounts at 31 December 2012 were $48.3bn, an increase of $1.7bn from $46.6bn at 31 December 2011, mainly due to increases in repurchase agreements. Debt securities in issue at 31 December 2012 were $12bn, a decrease of $1.3bn from $13.3bn at 31 December 2011, primarily due to lower balances held in bearer note deposits of $1.7bn, partially offset by an increase of $0.5bn in wholesale funding.
Total assets under administrationTotal assets under administration were $19.5bn at 31 December 2012, a decrease of $7.9bn from $27.4bn at 31 December 2011, primarily due to the close of the sales transaction of the full service retail brokerage business at 1 January 2012. Excluding the full service retail brokerage business’ funds under management, total assets under administration increased by $2.7bn compared with 31 December 2011.
analysis of Financial results for 2012 by Global business Segments
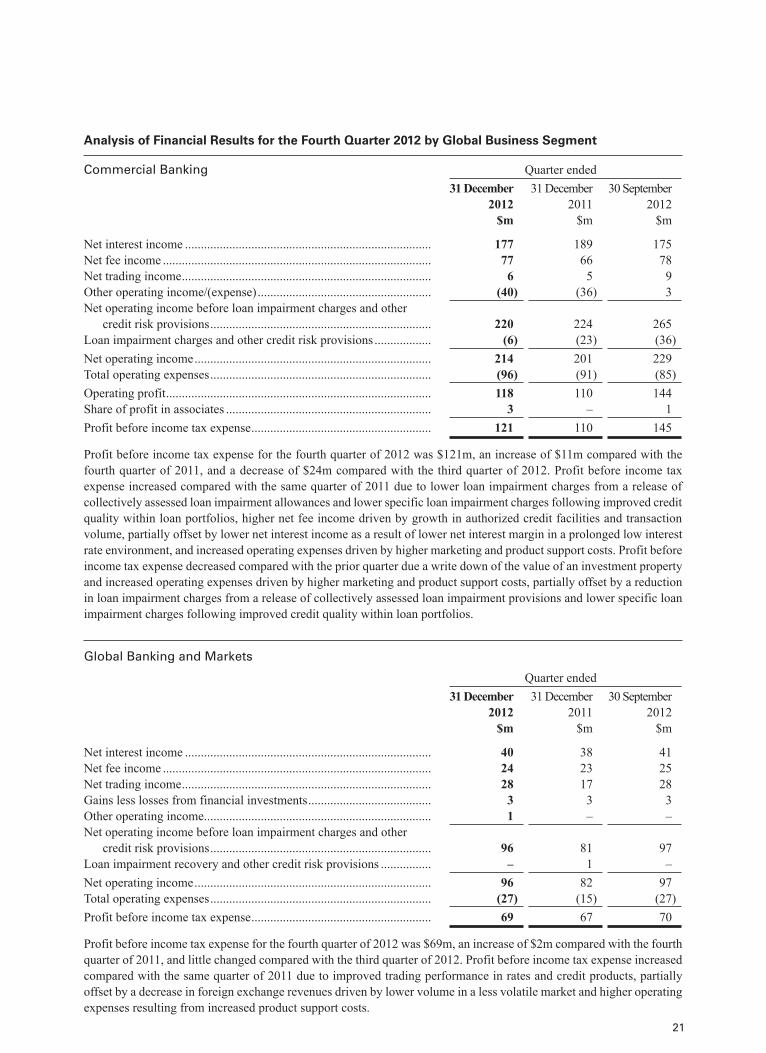
Commercial Banking2012
$m2011
$m
Net interest income ........................................................................................................ 709 727Net fee income ............................................................................................................... 298 268Net trading income ......................................................................................................... 31 24Other operating loss ....................................................................................................... (25) (41)Net operating income before loan impairment charges and other credit risk provisions 1,013 978Loan impairment charges and other credit risk provisions ............................................ (79) (78)Net operating income ..................................................................................................... 934 900Total operating expenses ................................................................................................ (366) (373)Operating profit .............................................................................................................. 568 527Share of profit in associates ........................................................................................... 5 4Profit before income tax expense ................................................................................... 573 531
OverviewProfit before income tax expense for 2012 was $573m, an increase of $42m, or 7.9%, compared with 2011. Profit before income tax expense increased due to higher net fee income from credit facilities, higher net operating income as a result of a larger write down by $17m in the value of investment property in 2011 and reduced operating expenses driven by cost reduction efforts. The increase was partially offset by reduced net interest income as a result of lower net interest margin in a prolonged low interest rate environment.
H S B C B A N K C A N A D A
Management’s discussion and analysis (continued)
14
15
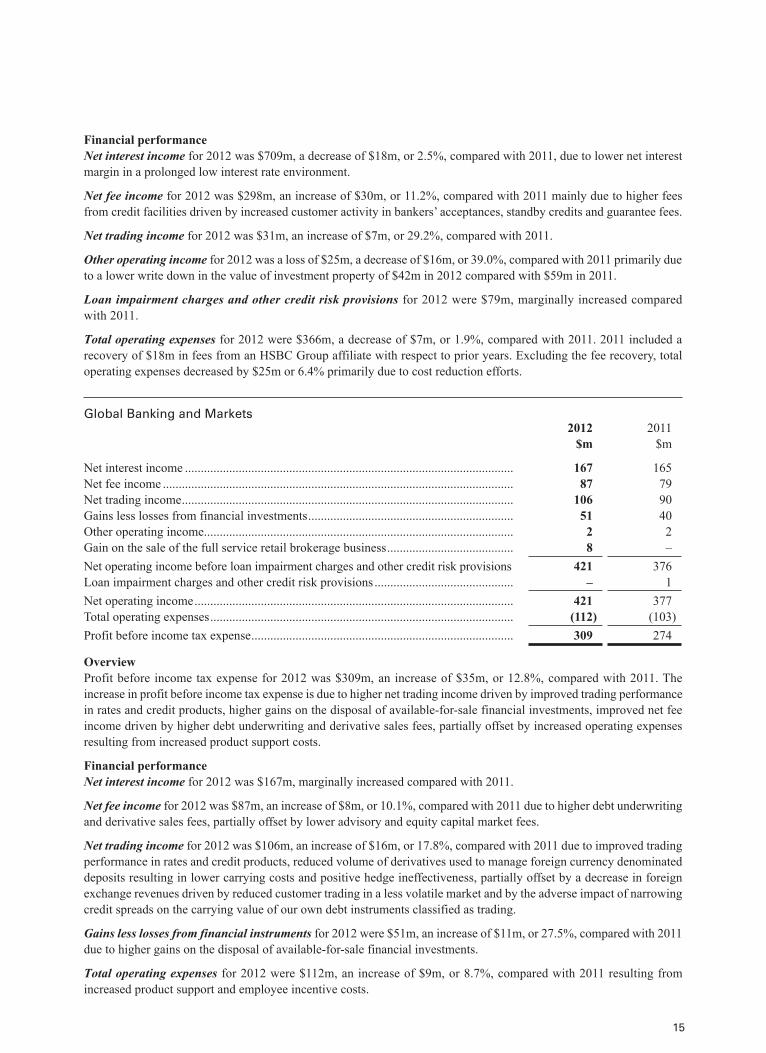
Financial performanceNet interest income for 2012 was $709m, a decrease of $18m, or 2.5%, compared with 2011, due to lower net interest margin in a prolonged low interest rate environment.
Net fee income for 2012 was $298m, an increase of $30m, or 11.2%, compared with 2011 mainly due to higher fees from credit facilities driven by increased customer activity in bankers’ acceptances, standby credits and guarantee fees.
Net trading income for 2012 was $31m, an increase of $7m, or 29.2%, compared with 2011.
Other operating income for 2012 was a loss of $25m, a decrease of $16m, or 39.0%, compared with 2011 primarily due to a lower write down in the value of investment property of $42m in 2012 compared with $59m in 2011.
Loan impairment charges and other credit risk provisions for 2012 were $79m, marginally increased compared with 2011.
Total operating expenses for 2012 were $366m, a decrease of $7m, or 1.9%, compared with 2011. 2011 included a recovery of $18m in fees from an HSBC Group affiliate with respect to prior years. Excluding the fee recovery, total operating expenses decreased by $25m or 6.4% primarily due to cost reduction efforts.
Global Banking and Markets2012
$m2011
$m
Net interest income ........................................................................................................ 167 165Net fee income ............................................................................................................... 87 79Net trading income ......................................................................................................... 106 90Gains less losses from financial investments ................................................................. 51 40Other operating income .................................................................................................. 2 2Gain on the sale of the full service retail brokerage business ........................................ 8 –Net operating income before loan impairment charges and other credit risk provisions 421 376Loan impairment charges and other credit risk provisions ............................................ – 1Net operating income ..................................................................................................... 421 377Total operating expenses ................................................................................................ (112) (103)Profit before income tax expense ................................................................................... 309 274
OverviewProfit before income tax expense for 2012 was $309m, an increase of $35m, or 12.8%, compared with 2011. The increase in profit before income tax expense is due to higher net trading income driven by improved trading performance in rates and credit products, higher gains on the disposal of available-for-sale financial investments, improved net fee income driven by higher debt underwriting and derivative sales fees, partially offset by increased operating expenses resulting from increased product support costs.
Financial performanceNet interest income for 2012 was $167m, marginally increased compared with 2011.
Net fee income for 2012 was $87m, an increase of $8m, or 10.1%, compared with 2011 due to higher debt underwriting and derivative sales fees, partially offset by lower advisory and equity capital market fees.
Net trading income for 2012 was $106m, an increase of $16m, or 17.8%, compared with 2011 due to improved trading performance in rates and credit products, reduced volume of derivatives used to manage foreign currency denominated deposits resulting in lower carrying costs and positive hedge ineffectiveness, partially offset by a decrease in foreign exchange revenues driven by reduced customer trading in a less volatile market and by the adverse impact of narrowing credit spreads on the carrying value of our own debt instruments classified as trading.
Gains less losses from financial instruments for 2012 were $51m, an increase of $11m, or 27.5%, compared with 2011 due to higher gains on the disposal of available-for-sale financial investments.
Total operating expenses for 2012 were $112m, an increase of $9m, or 8.7%, compared with 2011 resulting from increased product support and employee incentive costs.
Retail Banking and Wealth Management 2012
$m2011
$m
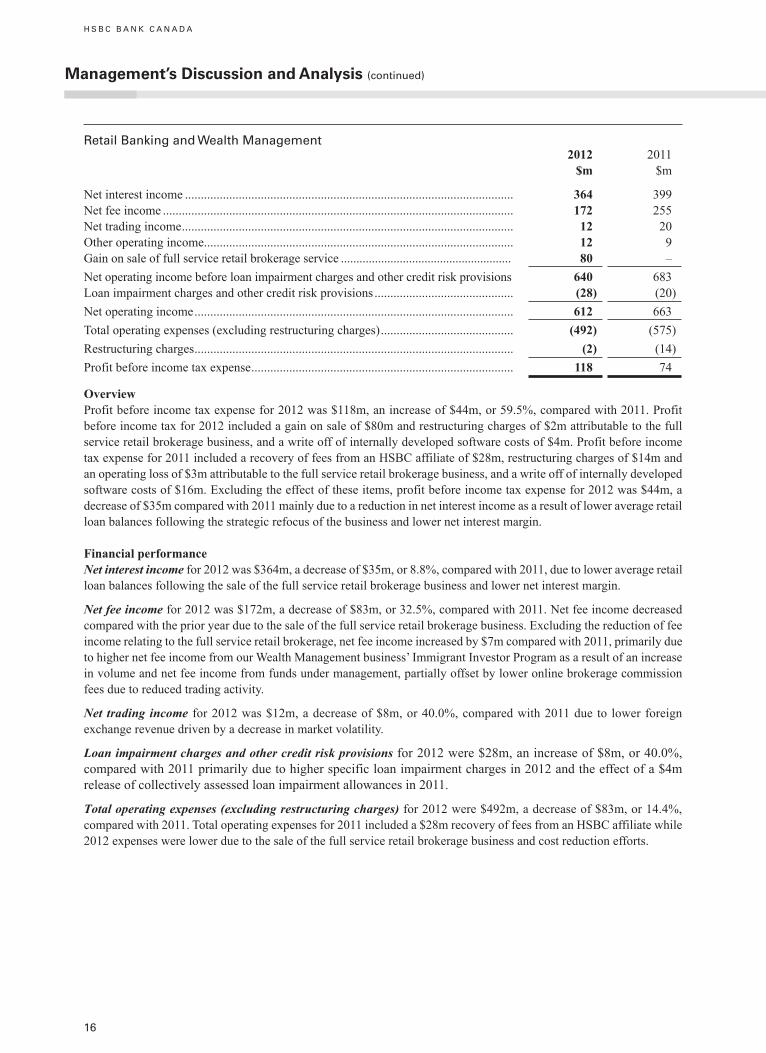
Net interest income ........................................................................................................ 364 399Net fee income ............................................................................................................... 172 255Net trading income ......................................................................................................... 12 20Other operating income .................................................................................................. 12 9Gain on sale of full service retail brokerage service ....................................................... 80 –Net operating income before loan impairment charges and other credit risk provisions 640 683Loan impairment charges and other credit risk provisions ............................................ (28) (20)Net operating income ..................................................................................................... 612 663Total operating expenses (excluding restructuring charges) .......................................... (492) (575)Restructuring charges ..................................................................................................... (2) (14)Profit before income tax expense ................................................................................... 118 74
OverviewProfit before income tax expense for 2012 was $118m, an increase of $44m, or 59.5%, compared with 2011. Profit before income tax for 2012 included a gain on sale of $80m and restructuring charges of $2m attributable to the full service retail brokerage business, and a write off of internally developed software costs of $4m. Profit before income tax expense for 2011 included a recovery of fees from an HSBC affiliate of $28m, restructuring charges of $14m and an operating loss of $3m attributable to the full service retail brokerage business, and a write off of internally developed software costs of $16m. Excluding the effect of these items, profit before income tax expense for 2012 was $44m, a decrease of $35m compared with 2011 mainly due to a reduction in net interest income as a result of lower average retail loan balances following the strategic refocus of the business and lower net interest margin.
Financial performanceNet interest income for 2012 was $364m, a decrease of $35m, or 8.8%, compared with 2011, due to lower average retail loan balances following the sale of the full service retail brokerage business and lower net interest margin.
Net fee income for 2012 was $172m, a decrease of $83m, or 32.5%, compared with 2011. Net fee income decreased compared with the prior year due to the sale of the full service retail brokerage business. Excluding the reduction of fee income relating to the full service retail brokerage, net fee income increased by $7m compared with 2011, primarily due to higher net fee income from our Wealth Management business’ Immigrant Investor Program as a result of an increase in volume and net fee income from funds under management, partially offset by lower online brokerage commission fees due to reduced trading activity.
Net trading income for 2012 was $12m, a decrease of $8m, or 40.0%, compared with 2011 due to lower foreign exchange revenue driven by a decrease in market volatility.
Loan impairment charges and other credit risk provisions for 2012 were $28m, an increase of $8m, or 40.0%, compared with 2011 primarily due to higher specific loan impairment charges in 2012 and the effect of a $4m release of collectively assessed loan impairment allowances in 2011.
Total operating expenses (excluding restructuring charges) for 2012 were $492m, a decrease of $83m, or 14.4%, compared with 2011. Total operating expenses for 2011 included a $28m recovery of fees from an HSBC affiliate while 2012 expenses were lower due to the sale of the full service retail brokerage business and cost reduction efforts.
H S B C B A N K C A N A D A
Management’s discussion and analysis (continued)
16
17
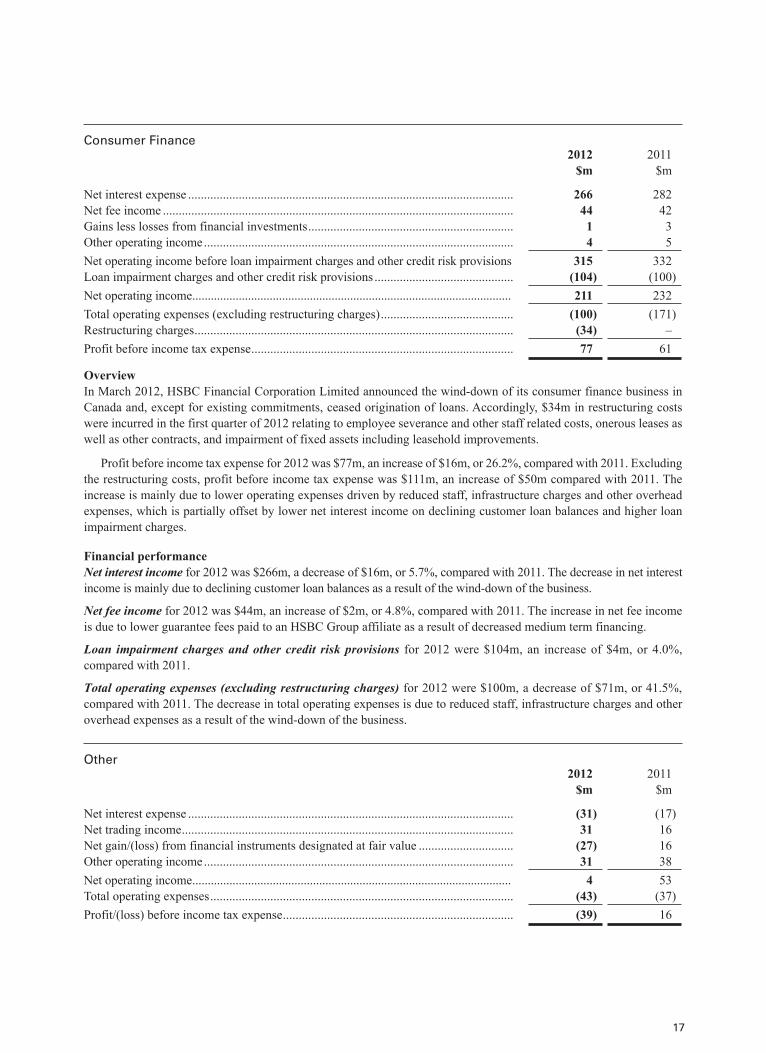
Consumer Finance2012
$m2011
$m
Net interest expense ....................................................................................................... 266 282Net fee income ............................................................................................................... 44 42Gains less losses from financial investments ................................................................. 1 3Other operating income .................................................................................................. 4 5Net operating income before loan impairment charges and other credit risk provisions 315 332Loan impairment charges and other credit risk provisions ............................................ (104) (100)Net operating income ....................................................................................................... 211 232Total operating expenses (excluding restructuring charges) .......................................... (100) (171)Restructuring charges ..................................................................................................... (34) –Profit before income tax expense ................................................................................... 77 61
OverviewIn March 2012, HSBC Financial Corporation Limited announced the wind-down of its consumer finance business in Canada and, except for existing commitments, ceased origination of loans. Accordingly, $34m in restructuring costs were incurred in the first quarter of 2012 relating to employee severance and other staff related costs, onerous leases as well as other contracts, and impairment of fixed assets including leasehold improvements.
Profit before income tax expense for 2012 was $77m, an increase of $16m, or 26.2%, compared with 2011. Excluding the restructuring costs, profit before income tax expense was $111m, an increase of $50m compared with 2011. The increase is mainly due to lower operating expenses driven by reduced staff, infrastructure charges and other overhead expenses, which is partially offset by lower net interest income on declining customer loan balances and higher loan impairment charges.
Financial performanceNet interest income for 2012 was $266m, a decrease of $16m, or 5.7%, compared with 2011. The decrease in net interest income is mainly due to declining customer loan balances as a result of the wind-down of the business.
Net fee income for 2012 was $44m, an increase of $2m, or 4.8%, compared with 2011. The increase in net fee income is due to lower guarantee fees paid to an HSBC Group affiliate as a result of decreased medium term financing.
Loan impairment charges and other credit risk provisions for 2012 were $104m, an increase of $4m, or 4.0%, compared with 2011.
Total operating expenses (excluding restructuring charges) for 2012 were $100m, a decrease of $71m, or 41.5%, compared with 2011. The decrease in total operating expenses is due to reduced staff, infrastructure charges and other overhead expenses as a result of the wind-down of the business.
Other2012
$m2011
$m
Net interest expense ....................................................................................................... (31) (17)Net trading income ......................................................................................................... 31 16Net gain/(loss) from financial instruments designated at fair value .............................. (27) 16Other operating income .................................................................................................. 31 38Net operating income ....................................................................................................... 4 53Total operating expenses ................................................................................................ (43) (37)Profit/(loss) before income tax expense ......................................................................... (39) 16
Activities or transactions which do not relate directly to the above global business segments are reported in Other. The main items reported under Other include gains and losses from the impact of changes in credit spreads on our own debt designated at fair value, revenue and expense related to information technology services provided to HSBC Group companies on an arm’s length basis. Profit before income tax expense for 2012 was a loss of $39m, compared with a profit of $16m for 2011. The variances from comparative periods are primarily due to the impact of the items noted above.
analysis of Financial results for the Fourth Quarter 2012
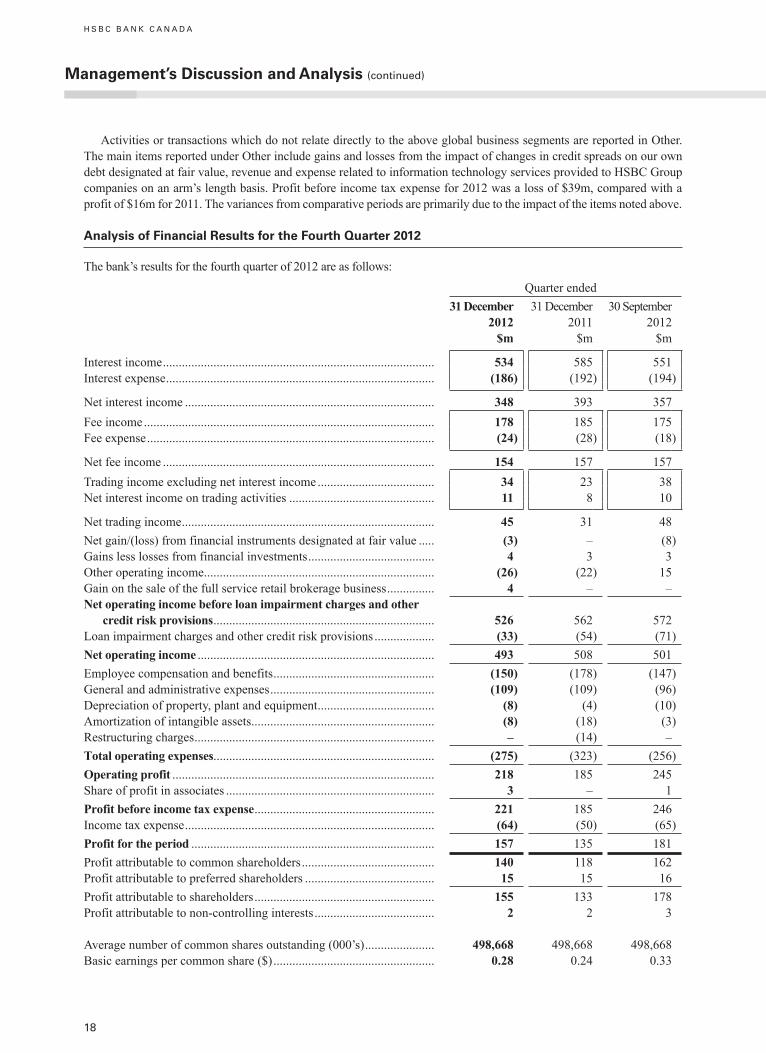
The bank’s results for the fourth quarter of 2012 are as follows:
Quarter ended31 December
2012 $m
31 December 2011
$m
30 September 2012
$m
Interest income ...................................................................................... 534 585 551Interest expense ..................................................................................... (186) (192) (194)
Net interest income ............................................................................... 348 393 357Fee income ............................................................................................ 178 185 175Fee expense ........................................................................................... (24) (28) (18)
Net fee income ...................................................................................... 154 157 157Trading income excluding net interest income ..................................... 34 23 38Net interest income on trading activities .............................................. 11 8 10
Net trading income ................................................................................ 45 31 48Net gain/(loss) from financial instruments designated at fair value ..... (3) – (8)Gains less losses from financial investments ........................................ 4 3 3Other operating income ......................................................................... (26) (22) 15Gain on the sale of the full service retail brokerage business ............... 4 – –Net operating income before loan impairment charges and other
credit risk provisions ...................................................................... 526 562 572Loan impairment charges and other credit risk provisions ................... (33) (54) (71)Net operating income ........................................................................... 493 508 501Employee compensation and benefits ................................................... (150) (178) (147)General and administrative expenses .................................................... (109) (109) (96)Depreciation of property, plant and equipment ..................................... (8) (4) (10)Amortization of intangible assets .......................................................... (8) (18) (3)Restructuring charges ............................................................................ – (14) –Total operating expenses...................................................................... (275) (323) (256)Operating profit ................................................................................... 218 185 245Share of profit in associates .................................................................. 3 – 1Profit before income tax expense ......................................................... 221 185 246Income tax expense ............................................................................... (64) (50) (65)Profit for the period ............................................................................. 157 135 181Profit attributable to common shareholders .......................................... 140 118 162Profit attributable to preferred shareholders ......................................... 15 15 16Profit attributable to shareholders ......................................................... 155 133 178Profit attributable to non-controlling interests ...................................... 2 2 3
Average number of common shares outstanding (000’s) ...................... 498,668 498,668 498,668Basic earnings per common share ($) ................................................... 0.28 0.24 0.33
H S B C B A N K C A N A D A
Management’s discussion and analysis (continued)
18
19
Overview Profit for the fourth quarter of 2012 was $157m, an increase of $22m, or 16.3%, compared with the fourth quarter of 2011, and a decrease of $24m, or 13.3%, compared with the third quarter of 2012. Profit attributable to common shareholders was $140m for the fourth quarter of 2012, an increase of $22m, or 18.6%, compared with the fourth quarter of 2011, and a decrease of $22m or 13.6%, compared with the third quarter of 2012. The increase in profit compared with the same quarter of 2011 is mainly due to lower operating expenses as a result of the sale of the full service retail brokerage business and wind-down of the consumer finance business, lower loan impairment charges from a release of collectively assessed loan impairment allowances and lower specific loan impairment charges and higher net trading income from rates and credit products. The increase in profit was partially offset by a reduction in net interest income resulting from a decrease in average loan balances and lower net interest margin. The decrease compared with the prior quarter is mainly due to lower operating income as a result of a write down in the value of investment property, higher operating expenses driven by the write off of internally developed software costs, and a reduction in net interest income resulting from a decrease in average loan balances and lower net interest margin. The decrease was partially offset by lower loan impairment charges from a release of collectively assessed loan impairment allowances and lower specific loan impairment charges.
Net interest income for the fourth quarter of 2012 was $348m, a decrease of $45m, or 11.5%, compared with the fourth quarter of 2011, and a decrease of $9m, or 2.5%, compared with the third quarter of 2012. The decreases are primarily due to lower average retail and consumer finance loan balances following the strategic refocus of these businesses and reduced net interest margin.
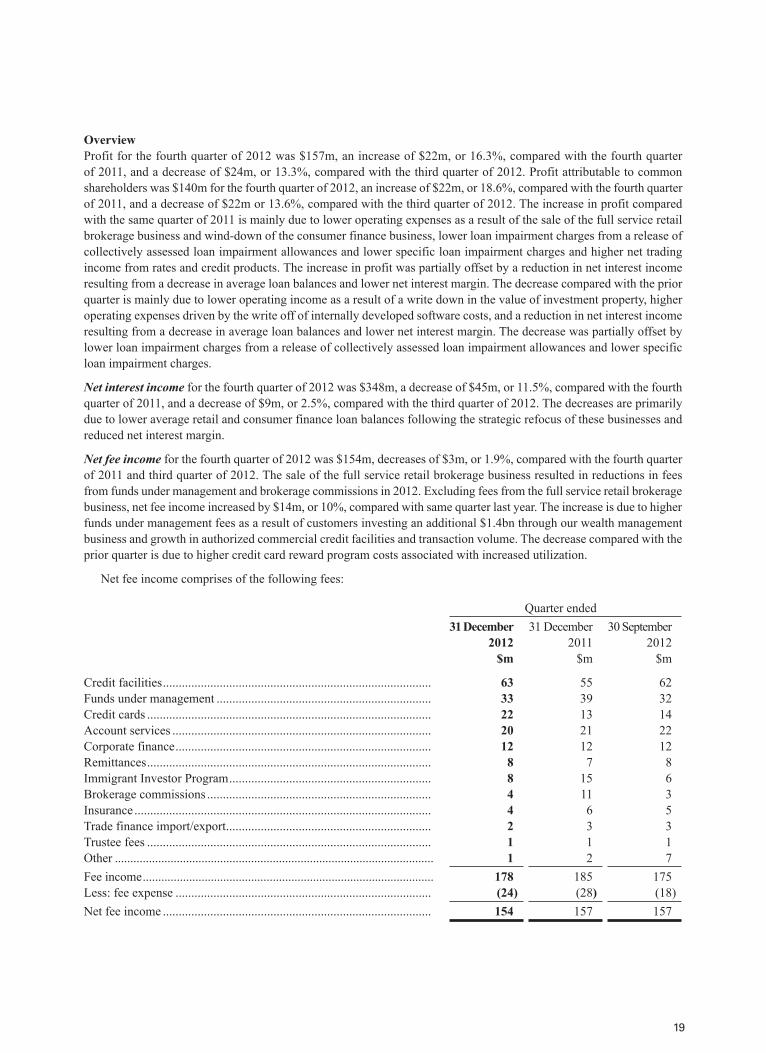
Net fee income for the fourth quarter of 2012 was $154m, decreases of $3m, or 1.9%, compared with the fourth quarter of 2011 and third quarter of 2012. The sale of the full service retail brokerage business resulted in reductions in fees from funds under management and brokerage commissions in 2012. Excluding fees from the full service retail brokerage business, net fee income increased by $14m, or 10%, compared with same quarter last year. The increase is due to higher funds under management fees as a result of customers investing an additional $1.4bn through our wealth management business and growth in authorized commercial credit facilities and transaction volume. The decrease compared with the prior quarter is due to higher credit card reward program costs associated with increased utilization.
Net fee income comprises of the following fees:
Quarter ended31 December
2012 $m
31 December2011
$m
30 September2012
$m
Credit facilities ..................................................................................... 63 55 62Funds under management .................................................................... 33 39 32Credit cards .......................................................................................... 22 13 14Account services .................................................................................. 20 21 22Corporate finance ................................................................................. 12 12 12Remittances .......................................................................................... 8 7 8Immigrant Investor Program ................................................................ 8 15 6Brokerage commissions ....................................................................... 4 11 3Insurance .............................................................................................. 4 6 5Trade finance import/export ................................................................. 2 3 3Trustee fees .......................................................................................... 1 1 1Other ....................................................................................................... 1 2 7Fee income .............................................................................................. 178 185 175Less: fee expense ................................................................................. (24) (28) (18)Net fee income ..................................................................................... 154 157 157

Net trading income for the fourth quarter of 2012 was $45m, an increase of $14m, or 45.2%, compared with the fourth quarter of 2011, and a decrease of $3m, or 6.3%, compared with the third quarter of 2012. The increase compared with the same quarter last year is due to improved trading performance in rates and credit, partially offset by a decrease in foreign exchange revenues on lower volume in a less volatile market.
Net gain/(loss) from financial instruments designated at fair value for the fourth quarter of 2012 was a net loss of $3m, compared with $nil for the fourth quarter of 2011, and compared with a net loss of $8m for the third quarter of 2012. The bank designates certain subordinated debentures and other liabilities to be recorded at fair value. Gains and losses are largely as a result of the widening or narrowing of credit spreads decreasing or increasing the fair value of these liabilities, respectively. The losses represent the narrowing of credit spreads in 2012 which increased the fair value of these liabilities.
Gains less losses from financial investments for the fourth quarter of 2012 was $4m, marginally higher compared with the fourth quarter of 2011 and the third quarter of 2012.
Other operating income for the fourth quarter of 2012 was a loss of $26m, compared with a loss of $22m for the fourth quarter of 2011, and compared with an income of $15m for the third quarter of 2012. The decrease in other operating income compared with the prior quarter is due to a write down in the value of investment property of $42m in the fourth quarter of 2012.
Gain on the sale of the full service retail brokerage business. The sale of the full service retail brokerage business closed effective 1 January 2012. The bank recorded a gain of $84m in the first quarter of 2012, net of assets disposed of and directly related costs. In the fourth quarter of 2012, the bank satisfied certain conditions relating to the sale which allowed the recognition of a further amount of $4m.
Loan impairment charges and other credit risk provisions for the fourth quarter of 2012 were $33m, a decrease of $21m, or 38.9% compared with the fourth quarter of 2011, and a decrease of $38m, or 53.5%, compared with the third quarter for 2012. The decreases in loan impairment charges and other credit risk provisions compared with the same quarter last year and the prior quarter was mainly due to a release of collectively assessed loan impairment allowances due to improved credit quality. Also contributing to the decrease compared with the prior quarter were lower levels of specific loan impairment charges within the commercial loan portfolio.
Total operating expenses for the fourth quarter of 2012 were $275m, a decrease of $48m, or 14.9%, compared with the fourth quarter of 2011, and an increase of $19m, or 7.4% compared with the third quarter of 2012. The decrease compared with the same quarter last year is mainly due to cost reductions relating to the sale of the full service retail brokerage business and wind-down of the bank’s consumer finance business in 2012. Additionally, as a result of cost management initiatives, employee compensation and benefits as well as activities and expenses related to the delivery of technology services to HSBC Group companies were reduced. The increase compared with the prior quarter is mainly due to a write off of internally developed software costs of $5m and product support costs in the fourth quarter of 2012.
Restructuring charges of $14m were recognized in the fourth quarter of 2011 relating to sale of the full service retail brokerage business.
Income tax expense. The effective tax rate for the fourth quarter of 2012 was 29.5%, compared with 27.0% for the fourth quarter of 2011 and 26.4% for the third quarter of 2012. The higher effective tax rate in the fourth quarter of 2012 was mainly due to the negative impact of temporary differences reversing at a lower rate following a decrease in the statutory tax rate in 2012.
H S B C B A N K C A N A D A
Management’s discussion and analysis (continued)
20
21
analysis of Financial results for the Fourth Quarter 2012 by Global business Segment
Commercial Banking Quarter ended31 December
2012 $m
31 December 2011
$m
30 September 2012
$m
Net interest income .............................................................................. 177 189 175Net fee income ..................................................................................... 77 66 78Net trading income ............................................................................... 6 5 9Other operating income/(expense) ....................................................... (40) (36) 3Net operating income before loan impairment charges and other
credit risk provisions ...................................................................... 220 224 265Loan impairment charges and other credit risk provisions .................. (6) (23) (36)Net operating income ........................................................................... 214 201 229Total operating expenses ...................................................................... (96) (91) (85)Operating profit .................................................................................... 118 110 144Share of profit in associates ................................................................. 3 – 1Profit before income tax expense ......................................................... 121 110 145
Profit before income tax expense for the fourth quarter of 2012 was $121m, an increase of $11m compared with the fourth quarter of 2011, and a decrease of $24m compared with the third quarter of 2012. Profit before income tax expense increased compared with the same quarter of 2011 due to lower loan impairment charges from a release of collectively assessed loan impairment allowances and lower specific loan impairment charges following improved credit quality within loan portfolios, higher net fee income driven by growth in authorized credit facilities and transaction volume, partially offset by lower net interest income as a result of lower net interest margin in a prolonged low interest rate environment, and increased operating expenses driven by higher marketing and product support costs. Profit before income tax expense decreased compared with the prior quarter due a write down of the value of an investment property and increased operating expenses driven by higher marketing and product support costs, partially offset by a reduction in loan impairment charges from a release of collectively assessed loan impairment provisions and lower specific loan impairment charges following improved credit quality within loan portfolios.
Global Banking and Markets
Quarter ended31 December
2012 $m
31 December 2011
$m
30 September 2012
$m
Net interest income .............................................................................. 40 38 41Net fee income ..................................................................................... 24 23 25Net trading income ............................................................................... 28 17 28Gains less losses from financial investments ....................................... 3 3 3Other operating income ........................................................................ 1 – –Net operating income before loan impairment charges and other
credit risk provisions ...................................................................... 96 81 97Loan impairment recovery and other credit risk provisions ................ – 1 –Net operating income ........................................................................... 96 82 97Total operating expenses ...................................................................... (27) (15) (27)Profit before income tax expense ......................................................... 69 67 70
Profit before income tax expense for the fourth quarter of 2012 was $69m, an increase of $2m compared with the fourth quarter of 2011, and little changed compared with the third quarter of 2012. Profit before income tax expense increased compared with the same quarter of 2011 due to improved trading performance in rates and credit products, partially offset by a decrease in foreign exchange revenues driven by lower volume in a less volatile market and higher operating expenses resulting from increased product support costs.

Retail Banking and Wealth Management
Quarter ended31 December
2012 $m
31 December 2011
$m
30 September 2012
$m
Net interest income .............................................................................. 82 98 85Net fee income ..................................................................................... 44 57 42Net trading income ............................................................................... 3 4 3Other operating income ........................................................................ 4 3 3Gains on sale of the full service retail brokerage business .................. 4 – –Net operating income before loan impairment charges and other
credit risk provisions ...................................................................... 137 162 133Loan impairment charges and other credit risk provisions .................. (8) (7) (7)Net operating income ........................................................................... 129 155 126Total operating expenses (including restructuring charges) ................ (125) (148) (112)Restructuring charges ........................................................................... – (14) –Profit/(loss) before income tax expense ............................................... 4 (7) 14
Profit before income tax expense for the fourth quarter of 2012 was $4m, an increase of $11m compared with the fourth quarter of 2011, and a decrease of $10m compared with the third quarter of 2012. Profit before income tax expense increased compared with the same quarter of 2011 due to the inclusion of a $14m restructuring provision for the sale of the full service retail brokerage business in the fourth quarter of 2011. The increase in profit was offset by lower net interest income as a result of lower net interest margin in a prolonged low interest rate environment and higher net interest income and net fee income in the fourth quarter of 2011 attributable to the full service retail brokerage business. Profit before income tax expense decreased compared with the prior quarter primarily as a result of a $5m write off of internally developed software costs.
Consumer Finance
Quarter ended31 December
2012 $m
31 December 2011
$m
30 September 2012
$m
Net interest income .............................................................................. 57 74 64Net fee income ..................................................................................... 9 11 12Gains less losses from financial investments ....................................... 1 – –Other operating income ........................................................................ 1 – 1Net operating income before loan impairment charges and other
credit risk provisions ...................................................................... 68 85 77Loan impairment charges and other credit risk provisions .................. (19) (25) (28)Net operating income ........................................................................... 49 60 49Total operating expenses ...................................................................... (19) (43) (21)Profit before income tax expense ......................................................... 30 17 28
Profit before income tax expense was $30m for the fourth quarter of 2012, an increase of $13m, or 76.5%, compared with the fourth quarter of 2011 and an increase of $2m, or 7.1%, compared with the third quarter of 2012. Profit before income tax expense increased compared with the same quarter of 2011 mainly as a result of lower operating expenses driven by the wind-down of the business including reduced staff, infrastructure charges and other overhead expenses and lower loan impairment charges, partially offset by lower net interest income on declining customer loan balances. Profit before income tax expense increased compared with the prior quarter mainly due to reduced loan impairment charges driven by an improvement in credit quality, offset by lower net interest income and net fee income as a result of declining customer loan balances and diminishing business activity.
H S B C B A N K C A N A D A
Management’s discussion and analysis (continued)
22
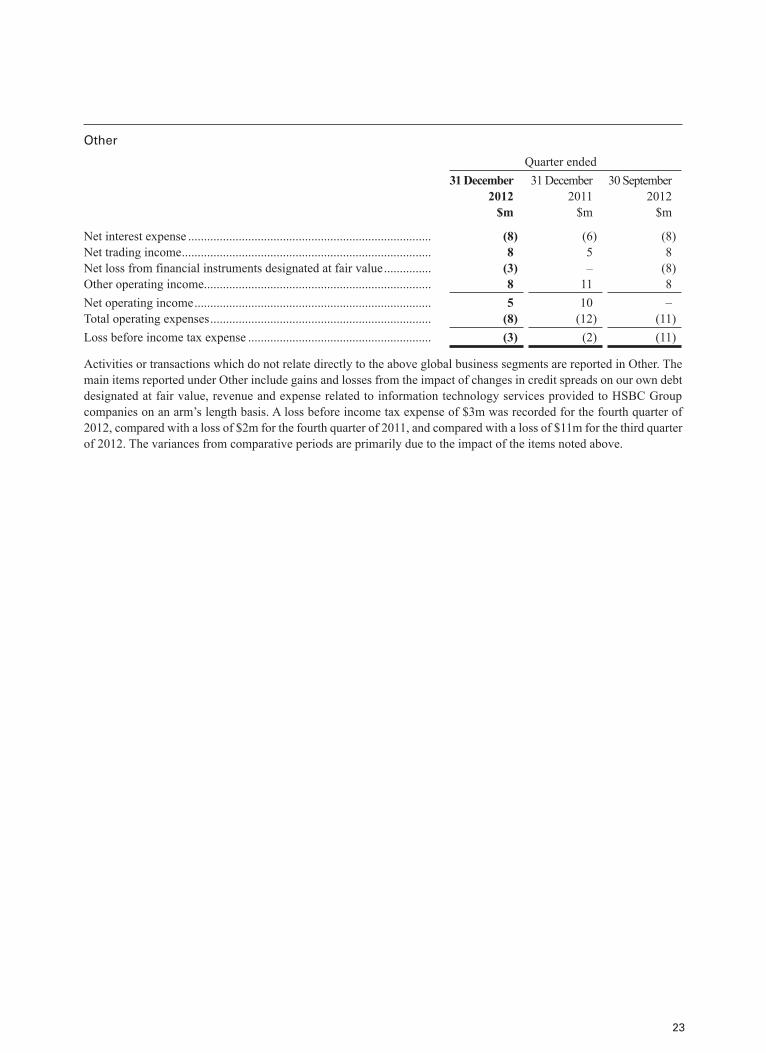
23
Other
Quarter ended31 December
2012 $m
31 December 2011
$m
30 September 2012
$m
Net interest expense ............................................................................. (8) (6) (8)Net trading income ............................................................................... 8 5 8Net loss from financial instruments designated at fair value ............... (3) – (8)Other operating income ........................................................................ 8 11 8Net operating income ........................................................................... 5 10 –Total operating expenses ...................................................................... (8) (12) (11)Loss before income tax expense .......................................................... (3) (2) (11)
Activities or transactions which do not relate directly to the above global business segments are reported in Other. The main items reported under Other include gains and losses from the impact of changes in credit spreads on our own debt designated at fair value, revenue and expense related to information technology services provided to HSBC Group companies on an arm’s length basis. A loss before income tax expense of $3m was recorded for the fourth quarter of 2012, compared with a loss of $2m for the fourth quarter of 2011, and compared with a loss of $11m for the third quarter of 2012. The variances from comparative periods are primarily due to the impact of the items noted above.
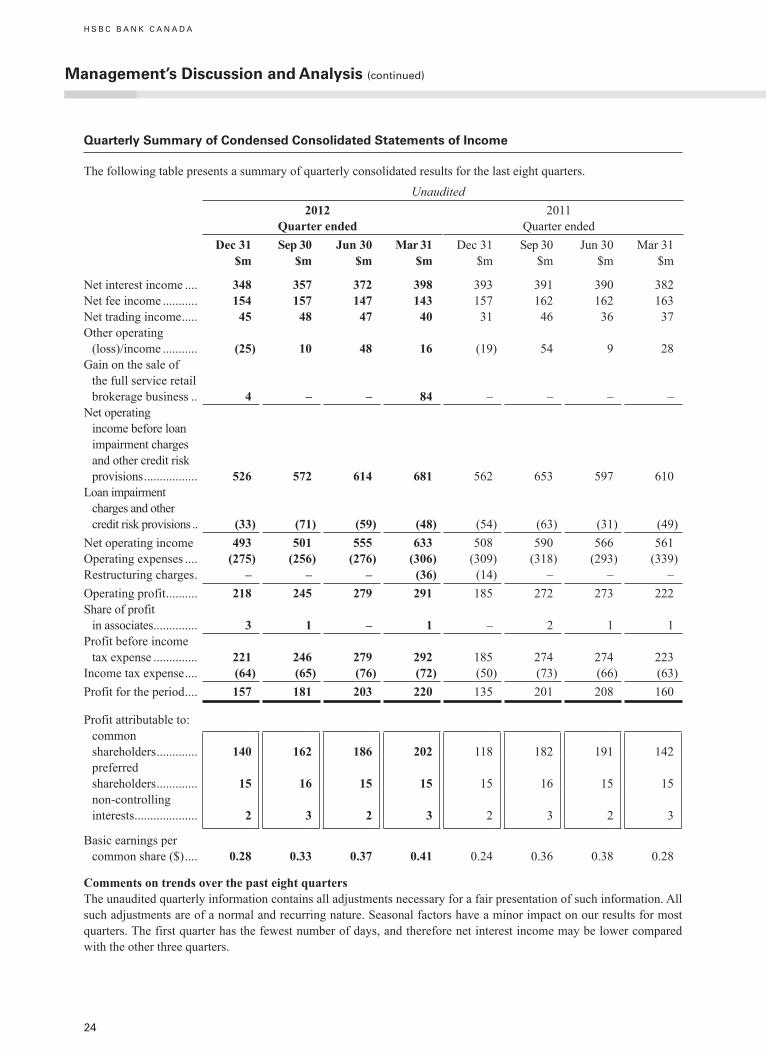
H S B C B A N K C A N A D A
Management’s discussion and analysis (continued)
24
Quarterly Summary of Condensed Consolidated Statements of Income
The following table presents a summary of quarterly consolidated results for the last eight quarters.Unaudited
2012 2011Quarter ended Quarter ended
Dec 31 $m
Sep 30 $m
Jun 30 $m
Mar 31 $m
Dec 31 $m
Sep 30 $m
Jun 30 $m
Mar 31 $m
Net interest income .... 348 357 372 398 393 391 390 382Net fee income ........... 154 157 147 143 157 162 162 163Net trading income ..... 45 48 47 40 31 46 36 37Other operating
(loss)/income ........... (25) 10 48 16 (19) 54 9 28Gain on the sale of
the full service retail brokerage business .. 4 – – 84 – – – –
Net operating income before loan impairment charges and other credit risk provisions ................. 526 572 614 681 562 653 597 610
Loan impairment charges and other credit risk provisions .. (33) (71) (59) (48) (54) (63) (31) (49)
Net operating income 493 501 555 633 508 590 566 561Operating expenses .... (275) (256) (276) (306) (309) (318) (293) (339)Restructuring charges . – – – (36) (14) – – –Operating profit .......... 218 245 279 291 185 272 273 222Share of profit
in associates .............. 3 1 – 1 – 2 1 1Profit before income
tax expense .............. 221 246 279 292 185 274 274 223Income tax expense .... (64) (65) (76) (72) (50) (73) (66) (63)Profit for the period .... 157 181 203 220 135 201 208 160
Profit attributable to:common shareholders ............. 140 162 186 202 118 182 191 142preferred shareholders ............. 15 16 15 15 15 16 15 15non-controlling interests .................... 2 3 2 3 2 3 2 3
Basic earnings per common share ($) .... 0.28 0.33 0.37 0.41 0.24 0.36 0.38 0.28
Comments on trends over the past eight quartersThe unaudited quarterly information contains all adjustments necessary for a fair presentation of such information. All such adjustments are of a normal and recurring nature. Seasonal factors have a minor impact on our results for most quarters. The first quarter has the fewest number of days, and therefore net interest income may be lower compared with the other three quarters.
25
Net interest income for the first quarter of 2012 included refund interest from the Canada Revenue Agency. Excluding the refund, net interest income gradually declined through 2012 mainly as a result of lower average retail and consumer finance loan balances following the strategic refocus of these businesses and lower net interest margin.
Net fee income declined in the first quarter of 2012 as a result of reductions in fees from funds under management and brokerage commissions driven by the sale of the full service retail brokerage business on 1 January 2012. However, net fee income increased throughout 2012 due to higher funds under management fees driven by customers investing an additional $1.4bn through our wealth management business and growth in authorized commercial credit facilities and transaction volume.
Net trading income increased from the first quarter of 2012 onwards due to improved trading performance in rates and credit products.
Operating expenses continue to decrease from the first quarter of 2012, mainly due to cost reductions relating to the sale of the full service retail brokerage business, wind-down of the bank’s consumer finance business, and as a result of continued cost reduction initiatives.
Critical accounting Policies and Impact of estimates and Judgements
The results of the bank are sensitive to the accounting policies, assumptions and estimates that underlie the preparation of its consolidated financial statements. The significant accounting policies used in the preparation of the consolidated financial statements are described in detail in note 2.
The accounting policies that are deemed critical to the bank’s results and financial position, in terms of the materiality of the items to which the policy is applied, or which involve a high degree of judgement including the use of assumptions and estimates, are disclosed below.
We set out details of how we apply certain accounting policies, including changes, in note 1. The following discussion sets out areas where we believe the selection and application of our accounting policies and the use of estimates and the application of judgement could have a material impact on our reported results. We believe that our estimates are appropriate in the circumstances where applied.
Loan impairment charges and other credit risk provisionsThe bank’s accounting policy for losses arising from the impairment of customer loans and advances is described in note 2(f). Loan impairment allowances represent management’s best estimate of losses incurred in the loan portfolios at the statement of financial position date.
Management is required to exercise judgement in making assumptions and estimates when calculating loan impairment allowances on both individually and collectively assessed loans and advances. The most significant judgement area is the calculation of collective impairment allowances.
The methods used to calculate collective impairment allowances on homogeneous groups of loans that are not considered individually significant are disclosed in note 2(f). They are subject to estimation uncertainty, in part because it is not practicable to identify losses on an individual loan basis because of the large number of individually insignificant loans in the portfolio.
The methods involve the use of statistically assessed historical information supplemented with management judgement to assess whether current economic and credit conditions are such that the actual level of inherent losses is likely to be greater or less than that suggested by historical experience. In normal circumstances historical experience provides the most objective and relevant information from which to assess inherent loss within each portfolio. In certain circumstances, historical loss experience provides less relevant information about the inherent loss in a given portfolio at the statement of financial position date, for example, where there have been changes in economic, regulatory or behavioural conditions such that the most recent trends in the portfolio risk factors are not fully reflected in the statistical models. In these circumstances, such risk factors are taken into account when calculating the appropriate levels of impairment allowances, by adjusting the impairment allowances derived solely from historical loss experience.
Risk factors include loan portfolio growth, product mix, unemployment rates, bankruptcy trends, geographic concentrations, loan product features, economic conditions such as national and local trends in housing markets, the level of interest rates, portfolio seasoning, account management policies and practices, changes in laws and regulations, and other factors that can affect customer payment patterns. The methodology and the assumptions used in calculating impairment losses are reviewed regularly in light of differences between loss estimates and actual loss experience. For example, roll rates, loss rates, and the expected timing of future recoveries are regularly benchmarked against actual outcomes to ensure they remain appropriate.
The calculation of the collective impairment allowance to cover losses which have been incurred but not yet been identified on loans subject to individual assessment utilizes underlying credit metrics, including the probability of default, loss given default and exposure at default and for each customer are derived from the bank’s internal rating systems as a basis for determining the collective impairment allowance. Management amends these metrics for some or all borrowers where they consider that the rating system metrics do not fully reflect incurred losses. This judgemental adjustment employs an established framework and references both internal and external indicators of credit quality.
The level of the collective impairment allowance is reassessed each quarter and may fluctuate as a result of changes in portfolio volumes, concentrations and risk; analysis of developing trends in probability of loss, severity of loss and exposure at default factors; and management’s current assessment of indicators that may have affected the condition of the portfolio. The balance of the collective impairment allowance is also analyzed as a function of risk-weighted assets and is also referenced to applicable industry data.
Many of the factors have a high degree of interdependency and there is no one single factor to which the bank’s loan impairment allowances as a whole are sensitive. It is possible that the outcomes in the next financial year could be different from the assumptions built into the models, resulting in a material adjustment to the carrying amount of loans and advances.
Valuation of financial instrumentsThe bank’s accounting policy for valuation of financial instruments is described in note 2(d). The best evidence of fair value is a quoted price in an actively traded market. In the event that the market for a financial instrument is not active, a valuation technique is used. The majority of valuation techniques employ only observable market data, and so the reliability of the fair value measurement is high. However, certain financial instruments are valued on a basis of valuation techniques that feature one or more significant inputs that are unobservable. Valuation techniques that rely to a greater extent on unobservable inputs require a higher level of management judgement to calculate a fair value than those based wholly on observable inputs.
The main assumptions and estimates which management considers when applying a model with valuation techniques are:
– the likelihood and expected timing of future cash flows on the instrument. These cash flows are usually governed by the terms of the instrument, although management judgement may be required when the ability of the counterparty to service the instrument in accordance with the contractual terms is in doubt. Future cash flows may be sensitive to changes in market rates. In selecting an appropriate discount rate for the instrument, management bases the determination of an appropriate discount rate for the instrument, on its assessment of what a market participant would regard as the appropriate spread of the rate for the instrument over the appropriate risk-free rate; and
– judgement to determine what model to use to calculate the fair value in areas where the choice of valuation model is particularly subjective, for example, when used for valuing complex derivative products.
When applying a model with unobservable inputs, estimates are made to reflect uncertainties in fair values resulting from lack of market data inputs, for example, as a result of illiquidity in the market. For these instruments, the fair value measurement is less reliable. Inputs into valuations based on unobservable data are inherently uncertain because there are little or no current market data available from which to determine the level at which an arm’s length transaction would occur under normal business conditions. However, in most cases there are some market data available on which to base a determination of fair value, for example historical data, and the fair values of most financial instruments will be based on some market observable inputs even where the unobservable inputs are significant. Assumptions and methodologies used in our models are continually reviewed and revised to arrive at better estimates of fair value.
H S B C B A N K C A N A D A
Management’s discussion and analysis (continued)
26
27
Given the uncertainty and subjective nature of establishing fair value for financial instruments applying models with unobservable inputs, it is possible that financial instruments may be realized at materially different amounts than carried on the statement of financial position.
Employee future benefits As part of employee compensation, the bank provides employees with pension and other post-retirement benefits, such as extended health care, to be paid after employees retire. All new employees participate in a defined contribution pension plan; therefore, there is a lower sensitivity toward adverse economic factors than might be the case for a defined benefit only plan. In certain cases, the amount of the final benefit may not be determined until some years into the future, particularly for defined benefit pensions, where the payment is based on a proportion of final salary and years of service. Although we contribute to several pension plans to provide for employee entitlements, the actual amount of assets required depends upon a variety of factors including the actual investment return on plan assets, the rate of employee pay raises, and the number of years over which the ultimate pension is to be paid. All defined benefit pension plans are funded and other post-retirement benefits are unfunded.
Due to the long-term nature of the contribution and payment periods for defined benefit pension plans and other post-retirement benefit, changes in long-term rates could have a material impact on reported other comprehensive income. After consultation with our actuaries, we make certain assumptions regarding the long-term rate of investment return on pension plan assets, the discount rate applied to accrued benefit obligations, the rates of future compensation increases and the trends in health care costs. The assumptions we use and an analysis of the sensitivity of those assumptions on our benefits expense and accrued benefit obligations are set out in note 4.
Funding requirements for the bank’s defined benefit pension plans are based on formal actuarial valuations, which determine the cost of earnings benefits in a year, and any additional bank contributions that are required to eliminate past service deficits over time. As a result of legislative changes, with the exception of one small plan, the bank’s pension plans are subject to formal annual actuarial valuation. Funding requirements for the bank’s defined benefit pension plans are based on these valuations, which determine the ‘cost of earnings benefits’ in a year, and any additional bank contributions that are required to eliminate past service deficits over time.
On 1 January 2013, the bank has adopted the revised IAS 19 Employee Benefits. For more information on the changes in accounting and estimated financial impact refer to the section on future accounting developments in note 1. The most significant impact is a change in the discount rate applied to accrued benefit obligations. Under current accounting standards, the discount rate to be applied is a long-term bond rate rather than the estimated future performance of plan assets.
Income taxes In establishing the income tax provision and the amount of the net future income tax asset recorded in our consolidated financial statements, we estimate the rates at which our income will be taxed in a variety of jurisdictions in Canada as well as expectations regarding dates of reversal of temporary differences. If the actual amounts, timing, or rates differ from the estimates or our interpretations of the tax legislation differ from those of the federal and provincial tax authorities, adjustments may be necessary. Details of our income tax provision and net future income tax asset are set out in note 6.
Goodwill and intangible assetsWe review goodwill and intangible assets, including internally developed computer software, for impairment at least annually, to ensure that the fair values are in excess of carrying values. In determining the fair value of goodwill and intangible assets, we use a variety of factors such as market comparisons, discount rates, price/earnings ratios and income estimates. The determination of values requires management judgement in the assumptions used as well as an appropriate method for determination of fair value. Any impairment in goodwill or intangible assets is charged to non-interest expense in the consolidated income statements. Although there were indicators of continuing market weakness during 2012, the carrying amount of our goodwill was not impacted by these weaknesses.
Intangibles are reviewed on a regular basis and tested as to estimates of remaining useful life as well as effectiveness of intangible assets such as software development. As a result of a review of software under development in 2011, we concluded that certain applications under development would not be deployed and consequently were written down.
accounting and reporting Changes in 2012
There have been no significant changes to the bank’s accounting policies for 2012 as disclosed in note 2.
The bank provides services or enters into transactions with HSBC Group regarding the sharing of costs of development by Canadian employees for certain technology platforms used by HSBC around the world. In previous periods, we have shown the salary and related direct expenses for these employees and the recovery of these expenditures on a gross basis as part of ‘General and administrative expenses’ and ‘Other operating income’ respectively. Effective for 2012, the bank has reported the impact of these transactions on a net basis by reclassifying the recovery of these expenditures from ‘Other operating income’ to ‘General and administrative expenses’. This change in presentation only affects transactions for which there is no arm’s length mark-up on costs. Comparative data has been reclassified to conform with the current presentation. As a result, the impact of this change is a reduction in ‘Other operating income’ and ‘General and administrative expenses’ of $58m (2011: $75m).
The bank records a collective allowance on all items with credit risk including off-balance sheet credit instruments such as guarantees and credit commitments. In previous years, the collective allowance related to all credit instruments has been recorded as a deduction from ‘Loans and advances to customers’. Effective for 2012, the bank has reclassified the portion of the collective allowance related to off-balance sheet credit instruments into ‘Other liabilities’. Comparative data has been reclassified to conform with the current presentation. As a result, the impact of this change is an increase in ‘Loans and advances to customers’ and ‘Other liabilities’ of $80m (2011: $73m).
The bank operates a call center which exclusively services the global Commercial Banking business. In prior periods, expenses and related recharge income from other HSBC Group companies were included in ‘Total operating expenses’ and ‘Other operating income’ respectively, within the ‘Other’ global business segment. Effective for the third quarter of 2012, the call center expenses and related recharge income have been reclassified from the ‘Other’ global business segment to the ‘Commercial Banking’ global business segment in order to more appropriately reflect these transactions within the global business segment benefitting from these services. Comparative data has been reclassified to conform with current presentation. Accordingly, expenses included in ‘Total operating expenses’ of $4m and $15m for the quarter ended 31 December 2011 and for the year ended 31 December 2011 respectively, were reclassified. In addition, recharge income included in ‘Other operating income’ of $4m and $14m for the quarter ended 31 December 2011 and for the year ended 31 December 2011 respectively, was reclassified.
The above reclassifications don’t have an impact on the consolidated income statement or shareholders’ equity.
The bank has implemented enhanced disclosure requirements under IFRS 7 relating to transfers not qualifying for derecognition in note 15.
off-balance Sheet arrangements
As part of our banking operations, we enter into a number of off-balance sheet financial transactions that have a financial impact, but may not be recognized in our consolidated balance sheets. These types of arrangements are contingent and may not necessarily, but in certain circumstances could, involve us incurring a liability in excess of amounts recorded in our consolidated balance sheets. These arrangements also include financial and performance guarantees, documentary and commercial letters of credit, and derivative financial instruments.
Guarantees and letters of creditWe routinely issue financial and performance guarantees and documentary and commercial letters of credit on behalf of our customers to meet their banking needs. Guarantees are often provided on behalf of customers’ contractual obligations, particularly providing credit facilities for customers’ overseas trading transactions and in construction financings. Letters of credit are often used as part of the payment and documentation process in international trade arrangements. Although guarantees and letters of credit are financial instruments, they are considered contingent obligations and the notional amounts are not included in our consolidated financial statements, as there are no actual advances of funds. Any payments actually made under these obligations are recorded as loans to our customers. In accordance with accounting standards for financial instruments, we record the fair value of guarantees made on behalf of customers.
H S B C B A N K C A N A D A
Management’s discussion and analysis (continued)
28
29
For credit risk management purposes, we consider guarantees and letters of credit to be part of our clients’ credit facilities, which are subject to appropriate risk management procedures. Guarantees and letters of credit are considered to be part of our overall credit exposure, as set out in the analysis of our loan portfolio on page 41 of the MD&A.
Derivative financial instrumentsAs part of our overall risk management strategy, we enter into a variety of derivatives to manage or reduce our risks in certain areas. Derivatives are also offered as part of our product suite to meet the needs of our customers.
Forward foreign exchange transactions are transactions where we agree to exchange foreign currencies with our counterparties at a fixed rate on a future date. Interest rate swaps are agreements to exchange cash flows of differing interest rate characteristics. Other derivatives comprised equity, energy, commodity and other foreign exchange and interest rate based transactions.
We use derivatives to limit our exposure to interest rate risk on loans and deposits with differing maturity dates, or foreign currency assets and liabilities of differing amounts. Mismatches in currency or maturity dates could expose us to significant financial risks if there are adverse changes in interest rates or foreign exchange rates. The use of derivatives is subject to strict monitoring and internal control procedures as set out in our risk management section of the MD&A.
Our accounting policies on recording the impact of derivatives are set out in note 2(k). Quantitative information on our derivative instruments is set out in note 11.
disclosure Controls and Procedures and Internal Control over Financial reporting
Management’s responsibility for financial information contained in our Annual Report is set out on page 62.
Disclosure controls and proceduresDisclosure controls and procedures are designed to provide reasonable assurance that all relevant information required to be disclosed in reports filed or submitted under Canadian securities laws is recorded, processed, summarized and reported within the time periods specified under those laws. These include controls and procedures that are designed to ensure that information is accumulated and communicated to management, including the CEO and the CFO, to allow timely decisions regarding required disclosure.
As of 31 December 2012, management evaluated, under the supervision and with the participation of the CEO and the CFO, the effectiveness of our disclosure controls and procedures as defined by the Canadian securities regulatory authorities under National Instrument 52-109. Based on that evaluation, the CEO and the CFO have concluded that the design and operation of these disclosure controls and procedures are effective as of 31 December 2012.
Internal control over financial reporting
Internal control over financial reporting is designed to provide reasonable assurance regarding the reliability of financial reporting and preparation of the consolidated financial statements in accordance with IFRS. Management is responsible for establishing and maintaining adequate internal control over financial reporting. These controls include those policies and procedures that: pertain to the maintenance of records that in reasonable detail accurately and fairly reflect the transactions and dispositions of the assets of the bank; provide reasonable assurance that transactions are recorded as necessary to permit preparation of the consolidated financial statements in accordance with IFRS, and that receipts and expenditures of the bank are being made only in accordance with authorizations of management and directors of the bank; and provide reasonable assurance regarding prevention or timely detection of unauthorized acquisition, use or disposition of the bank’s assets that could have a material effect on the consolidated financial statements. Because of the inherent limitations, internal control over financial reporting may not prevent or detect misstatements on a timely basis. Furthermore, projections of any evaluation of the effectiveness of internal control over financial reporting to future periods are subject to the risk that the controls may become inadequate because of changes in conditions, or that the degree of compliance with the policies or procedures may deteriorate.
Management has evaluated, under the supervision of and with the participation of the CEO and the CFO, the design and effectiveness of the internal control over financial reporting as required by the Canadian securities regulatory authorities under National Instrument 52-109. This evaluation was performed using the framework and criteria established in Internal Control – Integrated Framework issued by the Committee of Sponsoring Organizations of the Treadway Commission. Based on this evaluation, management has concluded that internal control over financial reporting was effective as at 31 December 2012.
Changes in internal control over financial reportingThere were no changes in our internal control over financial reporting during the year ended 31 December 2012 that have materially affected, or are reasonably likely to materially affect, our internal control over financial reporting.
related Party Transactions
We enter into transactions with other HSBC affiliates as part of the normal course of business, such as banking and operational services. In particular, as a member of one of the world’s largest financial services organizations, we share in the expertise and economies of scale provided by the HSBC Group. We provide and receive services or enter into transactions with a number of HSBC Group companies, including sharing in the cost of development for technology platforms used around the world and benefit from worldwide contracts for advertising, marketing research, training and other operational areas. These related party transactions are on terms similar to those offered to non-related parties and are subject to formal approval procedures that have been approved by the bank’s Conduct Review Committee.
Further details can be found in note 32.
HSBC Group companies hold certain of our debentures, preferred shares and common shares. For further information refer to notes 24 and 27.
dividends
Dividends on our shares declared and paid, and distributions per unit on our HSBC HaTS™ in each of the last three years were as follows:
2012 2011 2010Preferred Shares Class 1 ($ per share) Series C .......................................................................................... 1.275 1.275 1.275 Series D .......................................................................................... 1.250 1.250 1.250 Series E .......................................................................................... 1.650 1.650 1.650Preferred Shares Class 2 ($ per share) Series B .......................................................................................... 0.310 0.310 0.310
HSBC HaTS™ ($ per unit) Series 20101 .................................................................................... – – 77.80 Series 2015 ..................................................................................... 51.50 51.50 51.50
Common Shares ($ millions) ............................................................... 330 300 280
1 Units were redeemed on 31 December 2010.
H S B C B A N K C A N A D A
Management’s discussion and analysis (continued)
30

31
Credit ratings
Standard & Poor’s (‘S&P’) and DBRS® maintain credit ratings of our debt and securities. The ratings are made within the rating agencies’ normal classification system for each type of debt or security.
Our credit ratings influence our ability to secure cost-efficient wholesale funding. Our investment grade ratings were confirmed by S&P in December 2012 and amended downward one notch by DBRS in February 2013 concurrent with similar rating actions on our ultimate parent, HSBC Holdings. Our investment grade ratings are comparable to those assigned to Canadian banks.
Our credit ratings are as follows:
S&P DBRS®
Short-term instruments ........................................................................................ A-1+ R-1 (middle)Deposits and senior debt ..................................................................................... AA– AA (low)Subordinated debt ............................................................................................... A A (high)Preferred shares ................................................................................................... P-1 (Low)1 Pfd-2HSBC HaTS™ ...................................................................................................... P-1 (Low)1 BBB (high)
1 Based on S&P’s Canadian national preferred share scale. Ratings are ‘A–’ on S&P global preferred share scale.
risk Management (Certain information within this section, where indicated, forms an integral part of the audited consolidated financial statements)
All of our business activities involve the measurement, evaluation, acceptance and management of some degree of risk, or combinations of risks. Risk management is the identification, analysis, evaluation and management of the factors that could adversely affect our resources, operations, reputation and financial results. The most important risk categories that we are exposed to are capital management, credit, liquidity and funding, market, structural, operational, regulatory, reputational and strategic risks. The management of these risk categories is discussed below.
The approach to risk management is based on our clearly defined risk management framework, the purpose of which is to allow us to balance the level of risk taken with our business objectives in order to achieve consistent and sustainable performance over the long term, while remaining within our risk appetite.
Overview (Audited)Due to the breadth and depth of our business activities, our customer segments, our regulatory requirements and the competitive landscape, effective risk identification and management are essential to the bank’s ongoing success. By establishing an effective and comprehensive enterprise-wide risk management framework, the bank identifies, assesses measures, mitigates and monitors its risk exposure and its complex interdependencies to ensure appropriate balance between risk and reward in order to maximize shareholder return.
The bank’s enterprise-wide risk management framework consists of three key elements:
– Risk Governance and Oversight;
– Risk Appetite; and
– Risk-Based Capital Management.
The bank’s risk governance structure ensures full independence from our lines of business and our operations. It allows for three distinct lines of defence. The first line consists of the lines of business that are accountable for effective risk management covering all risks to which the operation is exposed in day-to-day activities. The lines of business are responsible for implementing processes to identify, mitigate and monitor risks within a control environment that is in line with the bank’s established risk appetite. The second line consists of control functions and/or risk sub-committees who provide independent oversight and monitor the effectiveness of risk management policies and procedures designed to ensure the bank’s risk appetite is observed. The second line of defence is responsible for establishing and implementing a framework for risk identification, measurement and control, formulates policies and monitors material risks using key indicators and exception reporting against defined risk appetite and tolerances. Internal Audit serves as the third line of defence by providing independent assurance regarding the effectiveness of the first and second lines of defence in fulfilling their mandates and managing risk accordingly.
The risk appetite framework consists of our Risk Appetite Statement and supporting key risk metrics and is used to describe and set the quantum and types of risk that the bank is prepared to take on the basis of its core values, strategy, and risk management competencies by relating the level of risk the bank decides to take to the level of capital required to support it. The fundamental objective of the risk appetite is to introduce a more explicit and consistent consideration of risk and capital into the bank’s strategy formulation, business planning process, and associated target setting, execution, measurement, and reporting processes.
The bank’s capital management framework is used to assess the amount of capital considered adequate to cover all current and future risks. Within it the bank uses risk-based capital methodologies, models, tools and measures to determine regulatory capital requirements, economic capital and scenario analysis and stress testing. These risk management tools are also used to manage risk relative to expected losses that may impact net income. While these processes are underpinned by policies and standards covering model development, approval and ongoing review, expert panels provide sound judgement to challenge these processes with the aim of avoiding excessive reliance on quantitative risk methodologies and models.
We continue to leverage HSBC Group resources to enhance our risk management infrastructure, to strengthen capabilities, to examine proactively the regulatory landscape and to benchmark against best practices, allowing us to keep abreast with current and future challenges.
Risk Governance and Oversight (Audited)The bank has established a risk governance framework that clearly defines the risks faced by the organization, the appetite levels for those risks, and appropriate mechanisms for monitoring them.
Risk governance is positioned at the uppermost level of the bank. The Board oversees a strong risk culture that is conservative yet competitive. Through the Executive Risk Management Committee (‘RMC’) and the Audit and Risk Committee (‘ARC’), the Board of Directors provides the risk discipline and structure necessary to achieve business objectives that align with risk strategy. Extensive and timely communication between the Board and executive management ensures that key risks are identified and key information is shared regularly.
Executive Management Committees (Audited)The bank maintains an effective committee structure as defined by corporate governance best practices. Each committee has specific, clear and attainable objectives. Representation on committees is designed to achieve efficiency and avoid overlap and duplication. Business and support functions provide the committees with timely and comprehensive information regarding their respective risk management initiatives and activities. The Chief Risk Officer participates on all committees, providing strategic direction, a singular point of accountability and a centralized channel for the identification and management of current and emerging risks across all areas.
Risk Management Committee Established by the ARC of the Board of Directors, the RMC provides enterprise-wide risk governance and management and assurance regarding the soundness and effectiveness of overall risk management initiatives. It ensures the following:
– That risk identification, assessment and mitigation mechanisms are in place and effective;
– That the bank has a balanced risk-return profile; and
– That the bank’s capital is adequate to support risks.
The RMC mandate includes:
– Identifying and measuring emerging risks;
– Developing appropriate risk management policies and procedures to identify, assess and control material risks on an enterprise-wide basis, including business continuity planning;
– Providing direction regarding our overall risk philosophy and appetite, including the acceptability of new, modified or unusual risk and ensuring risk appetite is appropriately aligned with local, regional and global conditions;
– Ensuring business risk is balanced against economic return;
Management’s discussion and analysis (continued)
32
H S B C B A N K C A N A D A

33
– Monitoring adherence to risk management policies and procedures;
– Reporting policy or major practice changes, unusual situations, significant exceptions, and new strategy or products to our Executive Committee and, where appropriate, to the ARC and, where required, the Board of Directors for review, ratification and/or approval; and
– Maintaining strategic oversight of policies and limits associated with credit and market risks.
To assist the RMC in fulfilling its mandate, responsibility for the bank’s inherent risk stemming from significant business activities are assigned to the following key sub-committees for direct management and oversight:
– Asset & Liability Committee (‘ALCO’)
– Operational Risk and Internal Control Committee (‘ORICC’)
– Model Oversight Committee (‘MOC’)
Asset & Liability CommitteeA sub-committee of the RMC, ALCO’s focus is the management of interest rate and liquidity risk to ensure the bank meets asset and liability management objectives such as the efficient allocation and utilization of resources, enhancement of economic profit and management of all balance sheet risks.
Operational Risk & Internal Control CommitteeORICC’s mandate is to provide governance and strategic oversight of the operational risk framework, including the identification, assessment and monitoring of all operational risks. ORICC challenges risk limitation and control strategies proposed by the business through the review of business level operational risk management activity. ORICC is responsible for making specific recommendations to ensure that the bank maintains an effective operational risk program that meets both internal and regulatory standards and is independent from day-to-day operations.
Model Oversight CommitteeThe MOC was created to support a robust model governance process for key bank models in light of growing reliance on financial modelling and increased attention to model governance by regulators. The MOC was established to provide effective and independent challenge of models and assumptions upon which they are based.
Risk Management Group (Audited)The Risk Management Group provides an independent, enterprise wide, forward-looking Risk Management Framework to effectively manage the risk which are inherent to the bank’s activities. The Chief Risk Officer (‘CRO’) is responsible for leading the group and reports to the RMC and the ARC of the Board of Directors on the risk profile of the organization and its performance relative to risk appetite at least quarterly.
The Risk Management Group is responsible for:
– Ongoing development of processes and systems to identify, measure, track, report, evaluate and actively manage the broad spectrum of risks to which the bank is exposed;
– Setting of Risk appetite thresholds and policies in line with the bank’s strategy and capabilities and the macro-economic and financial environment with consideration of the impact of potential stress scenarios; and.
– Monitoring adherence to standards and risk appetite thresholds.
Internal Audit (Audited)The mission of the Internal Audit department is to provide independent, objective assurance and consulting services designed to add value and improve the organization’s operations in accordance with guidelines established in the HSBC Group Audit Standards Manual. Its scope is to ensure that:
– Risks are identified and managed;
– Information is accurate, reliable, and timely;
– Information is compliant with policies, standards, and procedures; and,
– Laws and regulatory issues impacting the organization are recognized and addressed appropriately.
Risk Appetite (Audited) Risk Appetite is a key component of our management of risk and describes the type and level of risk we are prepared to accept in delivering our strategy. Embedding the statement into our decision making processes and the related monitoring and reporting framework is an area of continued focus.
The core philosophy behind our risk appetite includes the maintenance of:
– A strong balance sheet, financial results and capital position;
– Conservative liquidity management, with a diversified funding structure;
– Strong brand and accountability towards our shareholders; and
– Strong risk management, where risk must be commensurate with returns.
Our enterprise-wide risk appetite defines the risk levels and types of risk the bank is willing to accept given our strategic objectives, risk principles and capital capacity. We utilize quantitative and qualitative measures across strategic and operational dimensions to establish key metrics and a rational risk assessment of the bank.
With regular monitoring and evaluation of our risk appetite, our framework provides:
– Enhanced confidence in the appropriateness of the bank’s risk profile;
– Improved executive management control and coordination of risk-taking and risk-mitigating activities given the capital consumption across various businesses;
– Reinforcement of the alignment of risk policies and resources with business objectives; and
– Enhancement of the effectiveness of our risk governance structure through monitoring of business performance using the risk appetite metrics.
With the risk appetite integrated into our planning process, and providing the framework for subjecting new business initiatives to a risk review, moving forward it will promote further alignment of risk and return and transparency around risk measures.
Risk-Based Capital Management (Audited) The bank has adopted and implemented the Basel II framework, which is structured around three pillars:
– Pillar 1 relates to minimum regulatory capital requirements.
– Pillar 2 refers to the internal capital adequacy assessment process (‘ICAAP’), which is subject to the Supervisory Review and Evaluation Process carried out by OSFI.
– Pillar 3 relates to market discipline by publishing capital and risk management practices.
Objectives, policies and procedures (Audited)Our objective in managing our financial capital resources include: generating shareholder value while supporting business activities including the asset base and risk positions; providing prudent depositor security; and exceeding applicable regulatory requirements and long-term internal targets.
The bank’s capital management principles and related policies define the ICAAP by which management examines the bank’s risk profile from both regulatory and economic capital viewpoints and ensures that the level of capital:
– Supports our risk profile and outstanding commitments;
– Exceeds our formal, minimum regulatory capital requirements by an agreed margin;
– Withstands a severe economic downturn stress scenario; and
– Remains consistent with our strategic and operational goals, and shareholder and rating agency expectations.
Our approach includes using appropriate risk and financial metrics and targets in assessing capital adequacy in the context of its current position and various possible scenarios. In addition in order to maintain the most cost effective capital structure, we redeem or issue capital instruments as deemed necessary.
Management’s discussion and analysis (continued)
34
H S B C B A N K C A N A D A

35
Capital managed and capital adequacy regulations and ratios (Audited)Total capital comprises both Tier 1 and Tier 2 capital. Tier 1 capital is the permanent capital of the bank, comprising common shareholder’s equity, qualifying non-cumulative preferred shares, qualifying innovative capital instruments, contributed surplus, retained earnings and certain other adjustments. Tier 2 capital includes subordinated debentures together with certain other adjustments. There are restrictions on the amount of Tier 2 capital as a percentage of total capital that qualifies in the calculation of capital adequacy.
OSFI regulates capital adequacy for Canadian federally incorporated financial institutions including banks. OSFI’s regulations are based on international standards set by the Bank for International Settlements. Although the Bank for International Settlements sets minimum limits for financial institutions to maintain 4% and 8% Tier 1 and total capital ratios (as a percentage of risk-weighted assets), respectively, OSFI recommends Canadian banks maintain minimum Tier 1 and total capital ratios of 7% and 10%, respectively. The bank maintained ratios that satisfied these requirements in both 2012 and 2011.
Minimum regulatory capital requirements (Audited)The bank calculates its minimum capital requirements in accordance with the Basel II framework, which aligns regulatory capital requirements with the risk profile of the bank. Of the various approaches available in the framework, the bank has adopted the Advanced Internal Ratings Based (‘AIRB’) approach for calculating capital requirements for credit risk. The AIRB approach allows the bank to use internal estimates for certain risk measures, including probability of default (‘PD’), loss given default (‘LGD’), exposure at default (‘EAD’) and effective maturity for calculating risk-weighted assets for credit risk. For operational risk, the bank has adopted the Standardized approach. Operational risk capital is required to cover the risk of loss resulting from inadequate or failed internal processes, people and systems or from external events. Under the Standardized approach, the capital required is calculated by applying a specific factor, ranging from 12% to 18%, to the gross income of specific business lines.
Capital requirements for credit risk for HSBC Financial Corporation Limited are calculated using the Standardized approach. Under this approach, risk weightings prescribed by OSFI are used to calculate risk-weighted assets for credit exposures.
Introduction of Basel III capital and liquidity rules (Unaudited)In December 2010, the Basel Committee on Banking Supervision issued two framework documents detailing new regulatory standards for bank capital adequacy and management of liquidity risk, which together are commonly referred to as ‘Basel III’. In February 2011, OSFI endorsed the implementation of both frameworks in Canada commencing 1 January 2013. The goal of the reforms is to strengthen the banking sector by improving its ability to absorb losses, enhancing its risk management and governance, as well as strengthening its transparency and disclosure.
Refer to the liquidity and funding risk section for a discussion of the liquidity framework.
The capital framework significantly revises the definitions of regulatory capital and introduces the requirement that all regulatory capital must be able to absorb losses in a failed financial institution. Capital instruments issued prior to 1 January 2013 that do not meet the new requirements will be phased out as regulatory capital over a ten year period commencing 1 January 2013. Certain other regulatory adjustments will be phased in from 2014 to 2018. The framework also emphasizes common equity as the predominant component of Tier 1 capital by adding a minimum common equity to risk-weighted assets (‘CET1’) ratio. The Basel III rules also call for the implementation of a capital conservation buffer, which could be drawn upon in periods of stress, as well as countercyclical capital buffer. In guidance issued in December 2012, OSFI has set targets for capital ratios of 7.0% for CET1 by the first quarter of 2013, and 8.5% for total tier 1 and 10.5% for total capital by the first quarter of 2014.
Based on our interpretation, capital ratios at 31 December 2012 calculated under the Basel III framework were 10.8% for CET1, 13.8% for Tier 1 and 15.8% for Total capital.
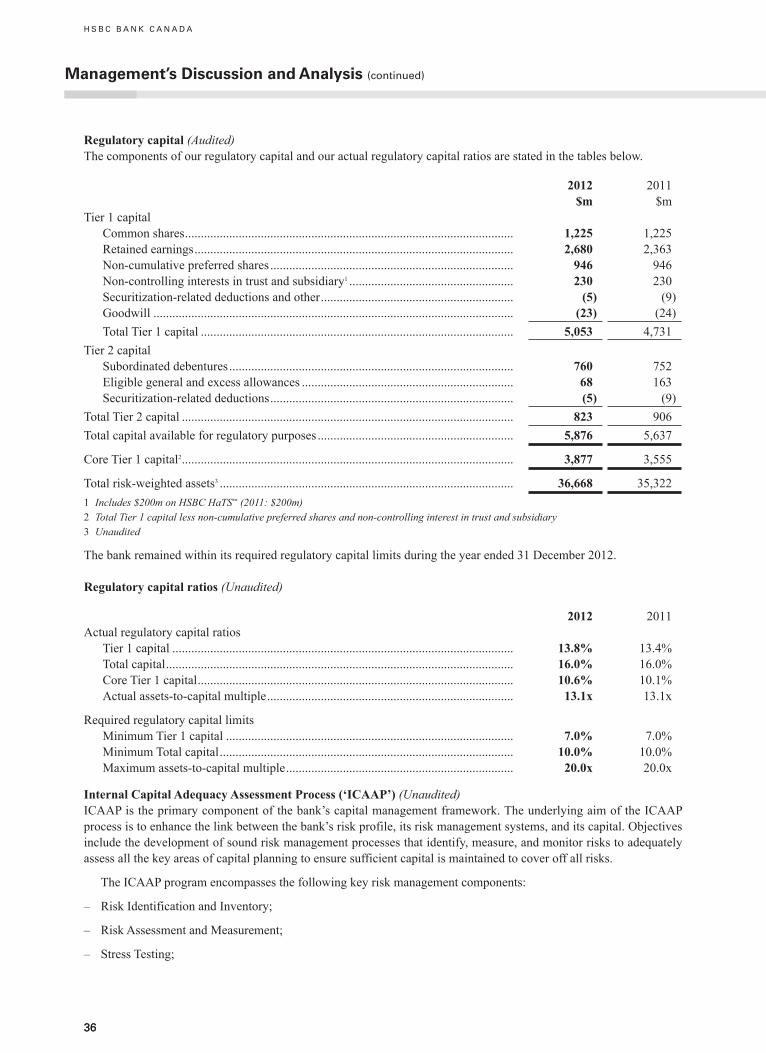
36
Regulatory capital (Audited)The components of our regulatory capital and our actual regulatory capital ratios are stated in the tables below.
2012 $m
2011 $m
Tier 1 capital Common shares ........................................................................................................ 1,225 1,225 Retained earnings ..................................................................................................... 2,680 2,363 Non-cumulative preferred shares ............................................................................. 946 946 Non-controlling interests in trust and subsidiary1 .................................................... 230 230 Securitization-related deductions and other ............................................................. (5) (9) Goodwill .................................................................................................................. (23) (24) Total Tier 1 capital ................................................................................................... 5,053 4,731Tier 2 capital Subordinated debentures .......................................................................................... 760 752 Eligible general and excess allowances ................................................................... 68 163 Securitization-related deductions ............................................................................. (5) (9)Total Tier 2 capital ......................................................................................................... 823 906Total capital available for regulatory purposes .............................................................. 5,876 5,637
Core Tier 1 capital2 ......................................................................................................... 3,877 3,555
Total risk-weighted assets3 ............................................................................................. 36,668 35,3221 Includes $200m on HSBC HaTS™ (2011: $200m)2 Total Tier 1 capital less non-cumulative preferred shares and non-controlling interest in trust and subsidiary3 Unaudited
The bank remained within its required regulatory capital limits during the year ended 31 December 2012.
Regulatory capital ratios (Unaudited)
2012 2011Actual regulatory capital ratios Tier 1 capital ............................................................................................................ 13.8% 13.4% Total capital .............................................................................................................. 16.0% 16.0% Core Tier 1 capital .................................................................................................... 10.6% 10.1% Actual assets-to-capital multiple .............................................................................. 13.1x 13.1x
Required regulatory capital limits Minimum Tier 1 capital ........................................................................................... 7.0% 7.0% Minimum Total capital ............................................................................................. 10.0% 10.0% Maximum assets-to-capital multiple ........................................................................ 20.0x 20.0x
Internal Capital Adequacy Assessment Process (‘ICAAP’) (Unaudited)ICAAP is the primary component of the bank’s capital management framework. The underlying aim of the ICAAP process is to enhance the link between the bank’s risk profile, its risk management systems, and its capital. Objectives include the development of sound risk management processes that identify, measure, and monitor risks to adequately assess all the key areas of capital planning to ensure sufficient capital is maintained to cover off all risks.
The ICAAP program encompasses the following key risk management components:
– Risk Identification and Inventory;
– Risk Assessment and Measurement;
– Stress Testing;
Management’s discussion and analysis (continued)
H S B C B A N K C A N A D A
36
37
– Capital Planning and Management; and
– Risk Monitoring and Reporting.
Risk Identification and InventoryIdentifying current and emerging risks is fundamental to risk management. It is important for the organization to understand and be aware of all risks that it currently or could potentially face in its day-to-day operations.
Risk Assessment and MeasurementRisk and capital are closely linked. Two types of capital include Regulatory Capital, which is the capital the bank is required to hold as determined by the rules established by international and local regulators. The second type is Economic Capital, which the bank defines as the resources necessary to cover unexpected losses arising from any risk, which it accepts in the form of discretionary or non-discretionary risk through its operations. This is at the core of the ICAAP process and is essential to ensure that the bank is sufficiently capitalized to mitigate all risk types that it has identified and measured on a quantitative or qualitative basis in order to arrive at a test of capital sufficiency. The principal quantitative technique used to measure risk in ICAAP is the use of economic capital models, which are calibrated to a common confidence interval on a loss distribution and measured over a one-year time horizon.
Stress TestingA key principle under Pillar 2 of the Basel II framework includes an expectation that banks be able to demonstrate how they will meet their capital requirement through a three-to-five year period including the possibility of a severe economic downturn or business event occurring. Stress testing is a risk management technique used to evaluate the potential effects on an institution’s financial condition, on a set of specified changes in risk factors corresponding to extreme but plausible events. Stress testing allows senior management to formulate management action in advance of conditions starting to reflect the stress scenarios identified. The bank’s enterprise-wide stress testing exercise must determine the impact of common scenarios on an enterprise-wide basis, including the potential impact on all risk types, and on the financial results of the bank including income statement, balance sheet, capital ratios and liquidity.
Capital Planning and ManagementThe bank maintains a capital management policy, which is approved annually by the ARC and HSBC Holdings. This policy places significant reliance on the linkage between the internal assessment of risk, the strategic business planning process and the management of capital. The principles and policies which guide the bank’s internal capital planning and management activities are:
– To exceed at all times applicable regulatory capital requirements and long-term targets;
– To generate shareholder value through the efficient allocation of economic capital to support business activities including the asset base and risk positions;
– To remain consistent with our strategic and operational goals, as well as with expectations of shareholders and rating agencies;
– To provide prudent depositor security;
– To maintain a capital position commensurate with the overall risk profile and control environment; and
– To be capable of withstanding a severe economic downturn stress scenario.
As noted above, ALCO has overall responsibility for capital management. It is chaired by our CFO and includes the CEO, Chief Operating Officer, and our senior executives responsible for credit, risk management, treasury and capital management. The Capital Governance Group, also chaired by the CFO, reports to ALCO and is responsible for managing the formal governance over the bank’s ICAAP.
Our Finance and Treasury departments manage compliance with our policies daily, with monthly monitoring by ALCO.
In order to maintain the most cost effective capital structure, we redeem or issue capital instruments as deemed necessary.
Risk Monitoring and ReportingThrough the governance structure, senior management and the ARC regularly receive reports to monitor the bank’s risk exposures and processes to ensure that business activities are operating within approved limits or guidelines, and are aligned to its risk appetite. These reports also provide a clear statement of the amounts, types, and sensitivities of the various risks in the bank’s portfolios.
37

38
Market Discipline (Unaudited)The Pillar 3 framework provides market discipline by providing a set of risk disclosure schedules which allow market participants to assess key pieces of information on the bank’s capital, risk exposures and risk assessment processes. The disclosures are made quarterly on the bank’s website for the benefit of the market. These disclosures complement the minimum capital requirements (Pillar 1) and the ICAAP and supervisory review process (Pillar 2).
Credit risk (Audited)Credit risk is the risk of financial loss if a customer or counterparty fails to meet its contractual obligations. It arises principally from direct lending, trade finance and the leasing business, but also from certain off-balance sheet products such as guarantees and counterparty credit risk on derivatives, and from our holdings of certain types of securities, particularly debt securities.
The bank’s credit risk management objectives are to:
– Maintain a strong culture of responsible lending, supported by a robust risk policy and control framework;
– Partner and challenge business originators effectively in defining and implementing risk appetite and its re-evaluation under actual and scenario conditions; and
– Ensure independent, expert scrutiny and approval of credit risks, their costs and their mitigation.
Credit Culture (Audited)The bank has a strong and established credit culture and discipline that enables it to achieve and maintain high quality assets. We are dedicated to managing our credit risk exposure while enhancing risk-adjusted returns.
The pillars of our credit culture are:
− Clearpoliciesandguidelines;
− Approvalandcontrols;
− Creditdiscipline;
− Capitaldiscipline;and
− Creditsystemsandmethodologies.
Across all levels, the bank has established clear credit principles, policies, procedures and guidance that direct our credit activities. Credit risk management is appropriately independent from business line management. Our thorough adjudication process ensures right and timely credit decisions made through adherence to approvals and limits as well as feedback and concurrent controls.
The bank adopts a proactive approach to manage and monitor our credit portfolio through:
− Theregularreviewoffacilities;
− Theimplementationofaframeworkfortheconsistentarticulationofriskappetite;
− Centralmonitoringandmanagementofcreditconcentrationsasitrelatestoindustries/sectors,products,customersand customer groups; and
− Continualdevelopmentanddeploymentofimprovedtechniquesformeasuringandevaluatingriskandforoptimizingrisk-adjusted return on capital.
Credit risk is managed in accordance with the bank’s credit policy, which is established in consultation with HSBC Group and approved by the ARC. Risk limits and credit authorities are delegated to senior credit management staff. Credit risk exposures in excess of certain levels or other specific risk attributes are referred for concurrence to HSBC Group to ensure they remain within HSBC Group’s global risk limits.
Management’s discussion and analysis (continued)
H S B C B A N K C A N A D A
38
39
The bank places the highest importance on the integrity and quality of its credit portfolio and has stringent policies to avoid undue concentration of risk. Our RMC and ARC meet quarterly to review portfolio credit quality, geographic, product and industry distributions, large customer concentrations, adequacy of loan impairment allowances and rating system performance. Policies relating to large customer limits and industry, product and geographic concentration are approved by the ARC, in line with HSBC Group policy. All new and renewed major authorized facilities, derivative exposures, “watch-list” exposures and impaired facilities are also reported quarterly to the ARC. The appetite for credit risk is expressed through portfolio level limits on specific segments, e.g. commercial real estate, as well as through Commercial and Personal Lending Guidelines that conform with HSBC Group guidelines. These are disseminated throughout our business along with various credit manuals. The ARC is advised of any material changes in guidelines through the quarterly monitoring process noted above.
Beginning in 2013, business line lending limits will be withdrawn and our Credit Department will review and adjudicate all credit risk to strengthen our portfolio management. We have a disciplined approach to managing credit risk through ongoing monitoring of all credit exposures at branches, with weaker quality credits being reviewed at more frequent time intervals. Problem and impaired loans are identified at an early stage and are actively managed by a separate dedicated Special Credit Management unit which possesses the relevant expertise and experience.
Exposure to banks and financial institutions involves consultation with a dedicated unit within the HSBC Group that controls and manages these exposures on a global basis. Similarly, cross border risk is also controlled globally by this unit through the imposition of country limits.
A review of all credit matters undertaken by our branch and head office credit managers is completed regularly by our internal auditors to ensure all our policies, guidelines, practices, conditions and terms are followed.
We manage real estate lending within well-defined parameters, with an emphasis on relationship and project sponsorship for all new transactions. We are actively managing the exposure level and composition of this portfolio given its concentration in our credit portfolio. Where we are dependent upon third parties for establishing asset values, consistent and transparent valuations are ensured through maintaining a list of approved professionals that meet our standards.
Credit risk rating framework (Audited)Under Basel II, two principal approaches are available for measuring credit risk: AIRB and Standardized. Most of the bank’s credit risk exposure is measured using the AIRB approach.
Under the AIRB approach, the bank’s credit risk rating framework incorporates PD of an obligor and loss severity expressed in terms of EAD and LGD. These measures are used to calculate expected loss and minimum capital requirements. They are also used in conjunction with other inputs to inform rating assessments and other risk management decisions.
All estimates are subject to pre-implementation and post-implementation validation and/or monitoring, including a variety of tests designed to ensure the ongoing accuracy and validity of the data used.
For wholesale business (bank, sovereign and corporate), obligor PD is estimated using a 23-grade Customer Risk Rating scale, of which 21 are non-default ratings representing varying degrees of strength of financial condition, and two are default ratings. Scores generated by models and/or scorecards for individual obligors are reviewed by credit approvers. The final approved customer risk ratings are mapped to a PD value range of which the ‘mid-point’ is used in the regulatory capital calculation.
Models for LGD/EAD estimation for wholesale business (bank, sovereign and corporate) were developed within HSBC Group’s framework of basic principles, which permits flexibility in the application of parameters by HSBC’s operating entities to suit conditions in their own jurisdictions. EAD is estimated to a 12-month horizon and is, broadly speaking, the sum of current exposure and, where applicable, an estimate for future increases in the exposure. LGD is expressed as a percentage of EAD.
39
40
For all retail business, exposures are segmented into homogeneous pools of accounts with similar risk characteristics. PD, LGD and EAD parameters are estimated for each pool based on observed historical loss data. The segmentation of exposures into different pools is carried out every month based on the characteristics associated with the exposures at the time of monthly review while the risk measures applied to the exposures are based on the measures associated with the pools that have been derived using data over an entire economic cycle.
HSBC Financial applies the simplified Standardized approach with the Basel II framework to calculate the risk weighting of credit exposures.
Stress testing and sensitivity analysis (Unaudited)In order to estimate both expected and unexpected losses under extreme, but plausible scenarios, we have established a framework for conducting stress testing around our credit portfolios. These scenarios are used to inform management about risks in the portfolio and implications for both capital requirements and income statement impacts. Stress testing also plays an important role in the ICAAP process.
Scenarios considered may be wide ranging, such as macroeconomic stresses or focused on particular industry or other portfolio issues. While there are a wide range of techniques that can be employed in such stress testing, our aim is to produce an estimate of potential outcomes and their likelihood of occurrence. Therefore a combination of quantitative and qualitative approaches is employed. There is naturally a significant degree of interpretation in these stress tests and therefore a range of outcomes is typically provided for management’s review.
H S B C B A N K C A N A D A
40
Management’s discussion and analysis (continued)
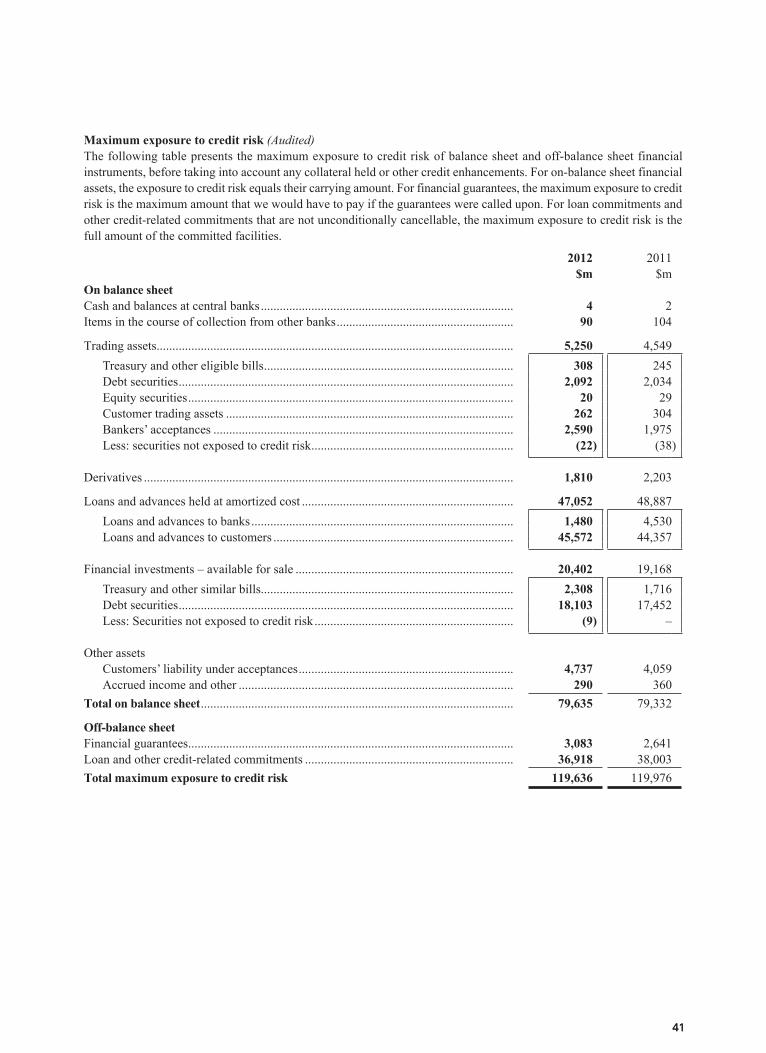
41
Maximum exposure to credit risk (Audited)The following table presents the maximum exposure to credit risk of balance sheet and off-balance sheet financial instruments, before taking into account any collateral held or other credit enhancements. For on-balance sheet financial assets, the exposure to credit risk equals their carrying amount. For financial guarantees, the maximum exposure to credit risk is the maximum amount that we would have to pay if the guarantees were called upon. For loan commitments and other credit-related commitments that are not unconditionally cancellable, the maximum exposure to credit risk is the full amount of the committed facilities.
2012 $m
2011 $m
On balance sheetCash and balances at central banks ................................................................................ 4 2Items in the course of collection from other banks ........................................................ 90 104
Trading assets ................................................................................................................. 5,250 4,549 Treasury and other eligible bills ............................................................................... 308 245 Debt securities .......................................................................................................... 2,092 2,034 Equity securities ....................................................................................................... 20 29 Customer trading assets ........................................................................................... 262 304 Bankers’ acceptances ............................................................................................... 2,590 1,975 Less: securities not exposed to credit risk ................................................................ (22) (38)
Derivatives ..................................................................................................................... 1,810 2,203
Loans and advances held at amortized cost ................................................................... 47,052 48,887 Loans and advances to banks ................................................................................... 1,480 4,530 Loans and advances to customers ............................................................................ 45,572 44,357
Financial investments – available for sale ..................................................................... 20,402 19,168 Treasury and other similar bills................................................................................ 2,308 1,716 Debt securities .......................................................................................................... 18,103 17,452 Less: Securities not exposed to credit risk ............................................................... (9) –
Other assets Customers’ liability under acceptances .................................................................... 4,737 4,059 Accrued income and other ....................................................................................... 290 360Total on balance sheet ................................................................................................... 79,635 79,332
Off-balance sheetFinancial guarantees ....................................................................................................... 3,083 2,641Loan and other credit-related commitments .................................................................. 36,918 38,003Total maximum exposure to credit risk 119,636 119,976
41

42
Collateral and other credit enhancements (Audited)Our lending policy assesses the customer’s capacity to repay, rather than relying excessively on the underlying collateral security. Depending on the customer’s standing and the type of product, some facilities may be unsecured. Nevertheless, collateral is an important mitigant of credit risk.
The principal collateral types are as follows:
– in the personal sector, mortgages over residential properties or charges over other personal assets being financed;
– in the commercial and industrial sector, charges over business assets such as land, buildings and equipment, inventory and receivables;
– in the commercial real estate sector, charges over the properties being financed; and
– in the financial sector, charges over financial instruments such as debt and equity securities in support of trading facilities.
Our credit risk management policies include appropriate guidelines on the acceptability of specific classes of collateral or credit risk mitigation. Valuation parameters are updated periodically depending on the nature of the collateral. Full covering corporate guarantees as well as bank and sovereign guarantees are recognized as credit mitigants for capital purposes.
The bank does not disclose the fair value of collateral held as security or other credit enhancements on loans past due but not impaired or individually assessed impaired loans, as it is not practical to do so.
Collateral held as security for financial assets other than loans is determined by the nature of the instrument. Government and other debt securities, including money market instruments, are generally unsecured, with the exception of asset-backed securities and similar instruments, which are secured by pools of financial assets.
The bank has policies in place to monitor the existence of undesirable concentration of the collateral supporting our credit exposures.
Management’s discussion and analysis (continued)
H S B C B A N K C A N A D A
42
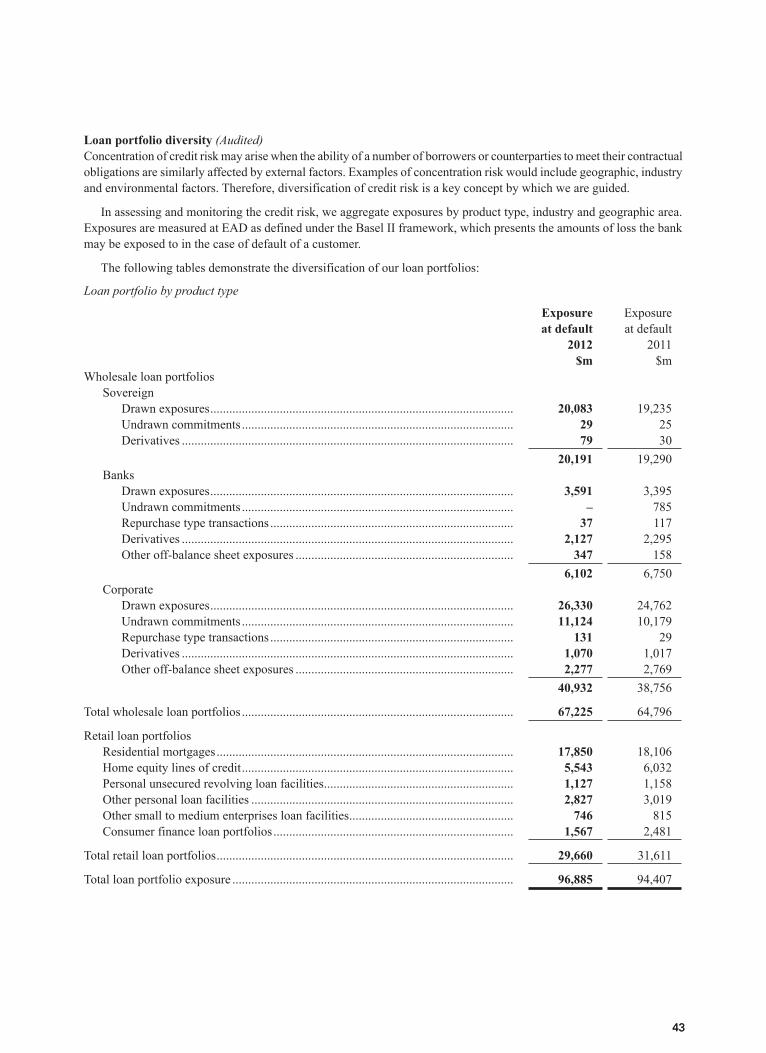
43
Loan portfolio diversity (Audited)Concentration of credit risk may arise when the ability of a number of borrowers or counterparties to meet their contractual obligations are similarly affected by external factors. Examples of concentration risk would include geographic, industry and environmental factors. Therefore, diversification of credit risk is a key concept by which we are guided.
In assessing and monitoring the credit risk, we aggregate exposures by product type, industry and geographic area. Exposures are measured at EAD as defined under the Basel II framework, which presents the amounts of loss the bank may be exposed to in the case of default of a customer.
The following tables demonstrate the diversification of our loan portfolios:
Loan portfolio by product type
Exposure at default
2012$m
Exposure at default
2011 $m
Wholesale loan portfolios Sovereign Drawn exposures ................................................................................................ 20,083 19,235 Undrawn commitments ...................................................................................... 29 25 Derivatives ......................................................................................................... 79 30
20,191 19,290 Banks Drawn exposures ................................................................................................ 3,591 3,395 Undrawn commitments ...................................................................................... – 785 Repurchase type transactions ............................................................................. 37 117 Derivatives ......................................................................................................... 2,127 2,295 Other off-balance sheet exposures ..................................................................... 347 158
6,102 6,750 Corporate Drawn exposures ................................................................................................ 26,330 24,762 Undrawn commitments ...................................................................................... 11,124 10,179 Repurchase type transactions ............................................................................. 131 29 Derivatives ......................................................................................................... 1,070 1,017 Other off-balance sheet exposures ..................................................................... 2,277 2,769
40,932 38,756
Total wholesale loan portfolios ...................................................................................... 67,225 64,796
Retail loan portfolios Residential mortgages .............................................................................................. 17,850 18,106 Home equity lines of credit ...................................................................................... 5,543 6,032 Personal unsecured revolving loan facilities ............................................................ 1,127 1,158 Other personal loan facilities ................................................................................... 2,827 3,019 Other small to medium enterprises loan facilities .................................................... 746 815 Consumer finance loan portfolios ............................................................................ 1,567 2,481
Total retail loan portfolios .............................................................................................. 29,660 31,611
Total loan portfolio exposure ......................................................................................... 96,885 94,407
43
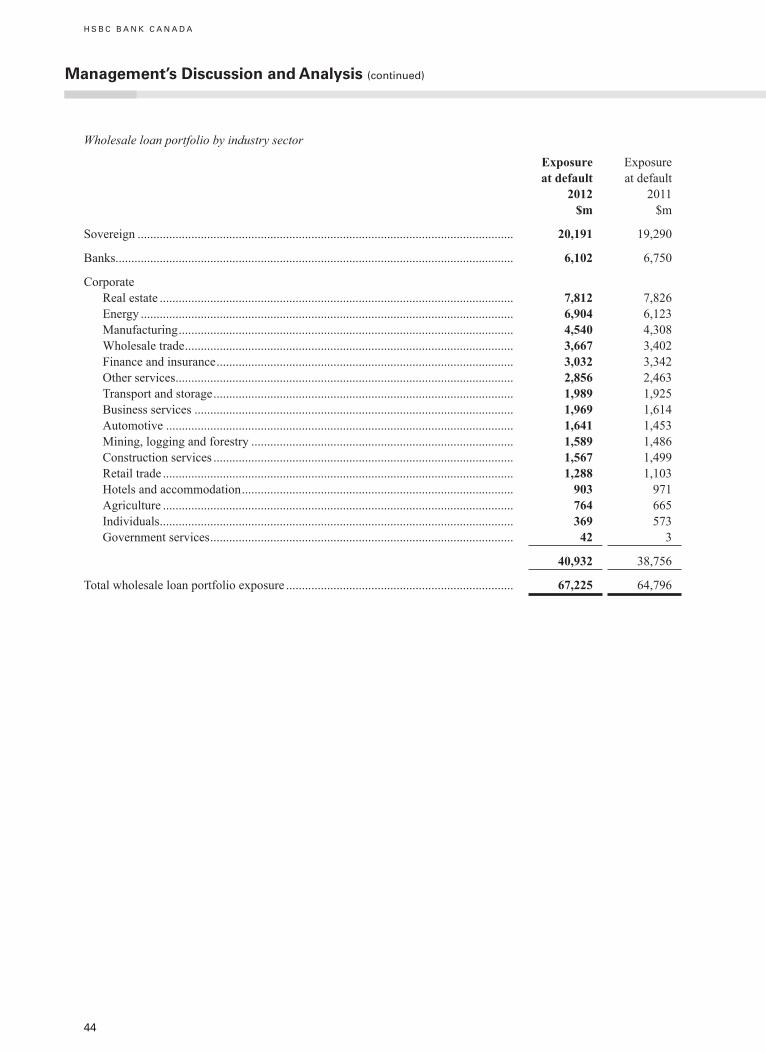
Wholesale loan portfolio by industry sector
Exposure at default
2012$m
Exposure at default
2011 $m
Sovereign ....................................................................................................................... 20,191 19,290
Banks.............................................................................................................................. 6,102 6,750
Corporate Real estate ................................................................................................................ 7,812 7,826 Energy ...................................................................................................................... 6,904 6,123 Manufacturing .......................................................................................................... 4,540 4,308 Wholesale trade ........................................................................................................ 3,667 3,402 Finance and insurance .............................................................................................. 3,032 3,342 Other services ........................................................................................................... 2,856 2,463 Transport and storage ............................................................................................... 1,989 1,925 Business services ..................................................................................................... 1,969 1,614 Automotive .............................................................................................................. 1,641 1,453 Mining, logging and forestry ................................................................................... 1,589 1,486 Construction services ............................................................................................... 1,567 1,499 Retail trade ............................................................................................................... 1,288 1,103 Hotels and accommodation ...................................................................................... 903 971 Agriculture ............................................................................................................... 764 665 Individuals ................................................................................................................ 369 573 Government services ................................................................................................ 42 3
40,932 38,756
Total wholesale loan portfolio exposure ........................................................................ 67,225 64,796
Management’s discussion and analysis (continued)
H S B C B A N K C A N A D A
44
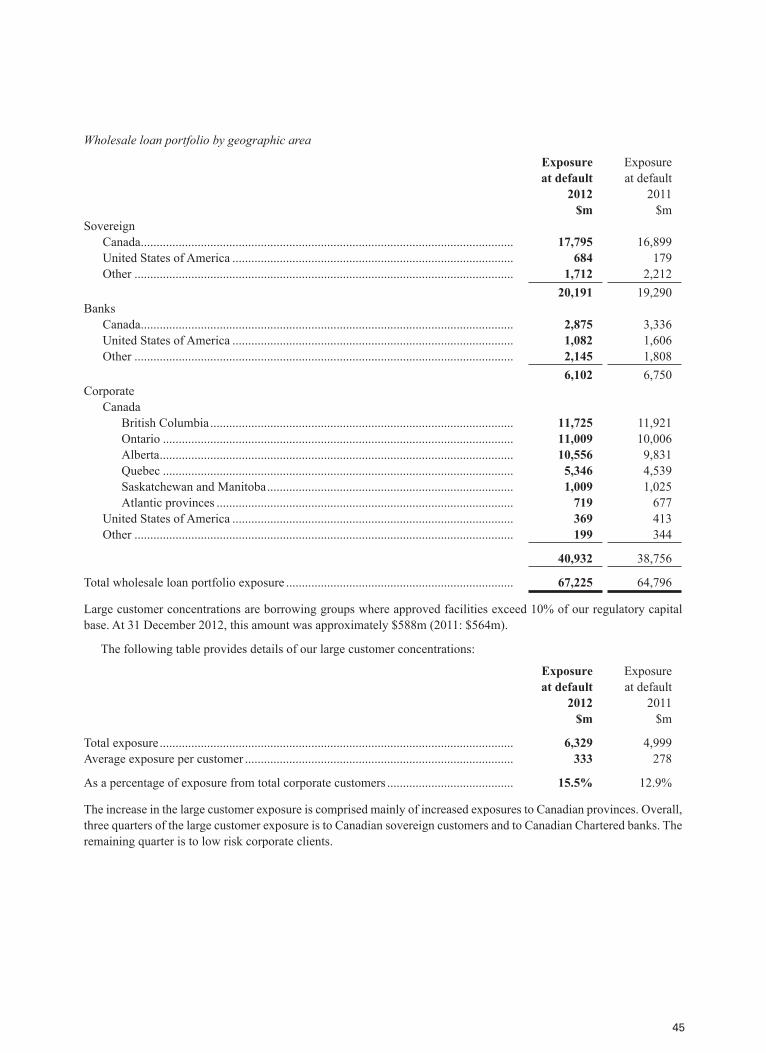
Wholesale loan portfolio by geographic area
Exposure at default
2012$m
Exposure at default
2011 $m
Sovereign Canada ...................................................................................................................... 17,795 16,899 United States of America ......................................................................................... 684 179 Other ........................................................................................................................ 1,712 2,212
20,191 19,290Banks Canada ...................................................................................................................... 2,875 3,336 United States of America ......................................................................................... 1,082 1,606 Other ........................................................................................................................ 2,145 1,808
6,102 6,750Corporate Canada British Columbia ................................................................................................ 11,725 11,921 Ontario ............................................................................................................... 11,009 10,006 Alberta ................................................................................................................ 10,556 9,831 Quebec ............................................................................................................... 5,346 4,539 Saskatchewan and Manitoba .............................................................................. 1,009 1,025 Atlantic provinces .............................................................................................. 719 677 United States of America ......................................................................................... 369 413 Other ........................................................................................................................ 199 344
40,932 38,756
Total wholesale loan portfolio exposure ........................................................................ 67,225 64,796
Large customer concentrations are borrowing groups where approved facilities exceed 10% of our regulatory capital base. At 31 December 2012, this amount was approximately $588m (2011: $564m).
The following table provides details of our large customer concentrations:
Exposure at default
2012$m
Exposure at default
2011$m
Total exposure ................................................................................................................ 6,329 4,999Average exposure per customer ..................................................................................... 333 278
As a percentage of exposure from total corporate customers ........................................ 15.5% 12.9%
The increase in the large customer exposure is comprised mainly of increased exposures to Canadian provinces. Overall, three quarters of the large customer exposure is to Canadian sovereign customers and to Canadian Chartered banks. The remaining quarter is to low risk corporate clients.
45
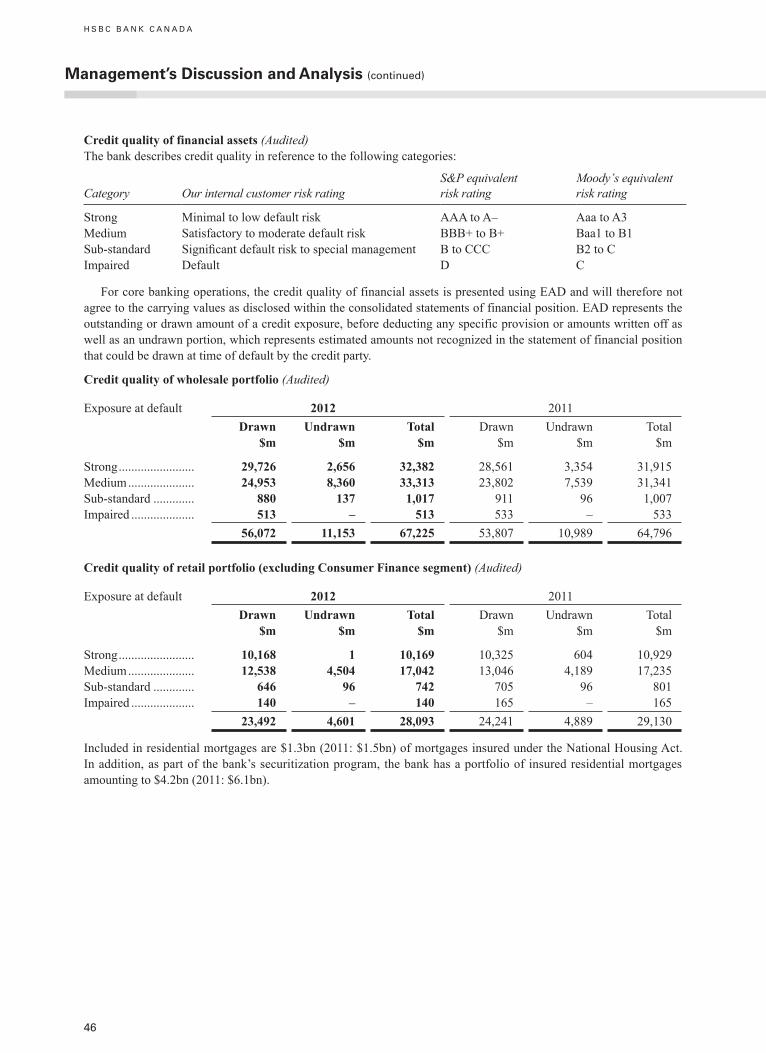
H S B C B A N K C A N A D A
46
Management’s discussion and analysis (continued)
Credit quality of financial assets (Audited)The bank describes credit quality in reference to the following categories:
Category Our internal customer risk ratingS&P equivalent risk rating
Moody’s equivalent risk rating
Strong Minimal to low default risk AAA to A– Aaa to A3Medium Satisfactory to moderate default risk BBB+ to B+ Baa1 to B1Sub-standard Significantdefaultrisktospecialmanagement B to CCC B2 to CImpaired Default D C
For core banking operations, the credit quality of financial assets is presented using EAD and will therefore not agree to the carrying values as disclosed within the consolidated statements of financial position. EAD represents the outstanding or drawn amount of a credit exposure, before deducting any specific provision or amounts written off as well as an undrawn portion, which represents estimated amounts not recognized in the statement of financial position that could be drawn at time of default by the credit party.
Credit quality of wholesale portfolio (Audited)
Exposure at default 2012 2011Drawn
$m Undrawn
$mTotal
$mDrawn
$mUndrawn
$mTotal
$m
Strong ........................ 29,726 2,656 32,382 28,561 3,354 31,915Medium ..................... 24,953 8,360 33,313 23,802 7,539 31,341Sub-standard ............. 880 137 1,017 911 96 1,007Impaired .................... 513 – 513 533 – 533
56,072 11,153 67,225 53,807 10,989 64,796
Credit quality of retail portfolio (excluding Consumer Finance segment) (Audited)
Exposure at default 2012 2011Drawn
$m Undrawn
$mTotal
$mDrawn
$mUndrawn
$mTotal
$m
Strong ........................ 10,168 1 10,169 10,325 604 10,929Medium ..................... 12,538 4,504 17,042 13,046 4,189 17,235Sub-standard ............. 646 96 742 705 96 801Impaired .................... 140 – 140 165 – 165
23,492 4,601 28,093 24,241 4,889 29,130
Included in residential mortgages are $1.3bn (2011: $1.5bn) of mortgages insured under the National Housing Act. In addition, as part of the bank’s securitization program, the bank has a portfolio of insured residential mortgages amounting to $4.2bn (2011: $6.1bn).
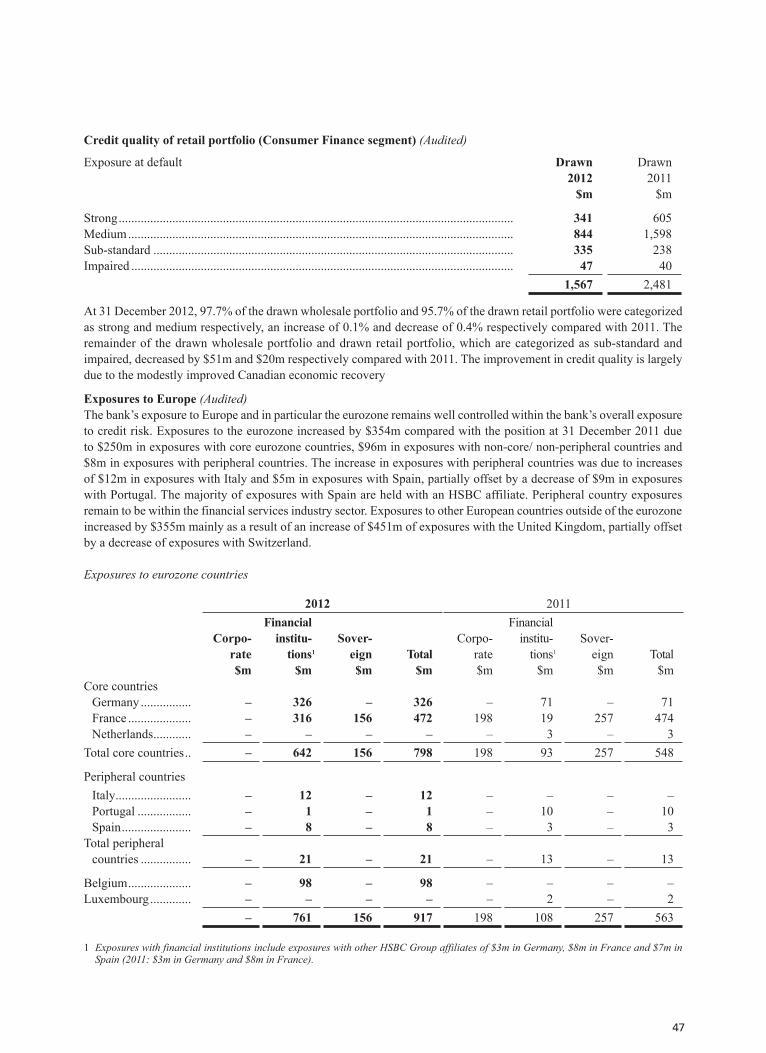
47
Credit quality of retail portfolio (Consumer Finance segment) (Audited)
Exposure at default Drawn 2012
$m
Drawn 2011
$m
Strong ............................................................................................................................. 341 605Medium .......................................................................................................................... 844 1,598Sub-standard .................................................................................................................. 335 238Impaired ......................................................................................................................... 47 40
1,567 2,481
At 31 December 2012, 97.7% of the drawn wholesale portfolio and 95.7% of the drawn retail portfolio were categorized as strong and medium respectively, an increase of 0.1% and decrease of 0.4% respectively compared with 2011. The remainder of the drawn wholesale portfolio and drawn retail portfolio, which are categorized as sub-standard and impaired, decreased by $51m and $20m respectively compared with 2011. The improvement in credit quality is largely due to the modestly improved Canadian economic recovery
Exposures to Europe (Audited)The bank’s exposure to Europe and in particular the eurozone remains well controlled within the bank’s overall exposure to credit risk. Exposures to the eurozone increased by $354m compared with the position at 31 December 2011 due to $250m in exposures with core eurozone countries, $96m in exposures with non-core/ non-peripheral countries and $8m in exposures with peripheral countries. The increase in exposures with peripheral countries was due to increases of $12m in exposures with Italy and $5m in exposures with Spain, partially offset by a decrease of $9m in exposures with Portugal. The majority of exposures with Spain are held with an HSBC affiliate. Peripheral country exposures remain to be within the financial services industry sector. Exposures to other European countries outside of the eurozone increased by $355m mainly as a result of an increase of $451m of exposures with the United Kingdom, partially offset by a decrease of exposures with Switzerland.
Exposures to eurozone countries
2012 2011
Corpo-rate$m
Financial institu-
tions$m
1
Sover-eign $m
Total $m
Corpo-rate$m
Financial institu-
tions$m
1
Sover-eign $m
Total $m
Core countries Germany ................ – 326 – 326 – 71 – 71 France .................... – 316 156 472 198 19 257 474 Netherlands ............ – – – – – 3 – 3Total core countries .. – 642 156 798 198 93 257 548
Peripheral countries Italy ........................ – 12 – 12 – – – – Portugal ................. – 1 – 1 – 10 – 10 Spain ...................... – 8 – 8 – 3 – 3Total peripheral
countries ................ – 21 – 21 – 13 – 13
Belgium .................... – 98 – 98 – – – –Luxembourg ............. – – – – – 2 – 2
– 761 156 917 198 108 257 563
1 Exposures with financial institutions include exposures with other HSBC Group affiliates of $3m in Germany, $8m in France and $7m in Spain (2011: $3m in Germany and $8m in France).
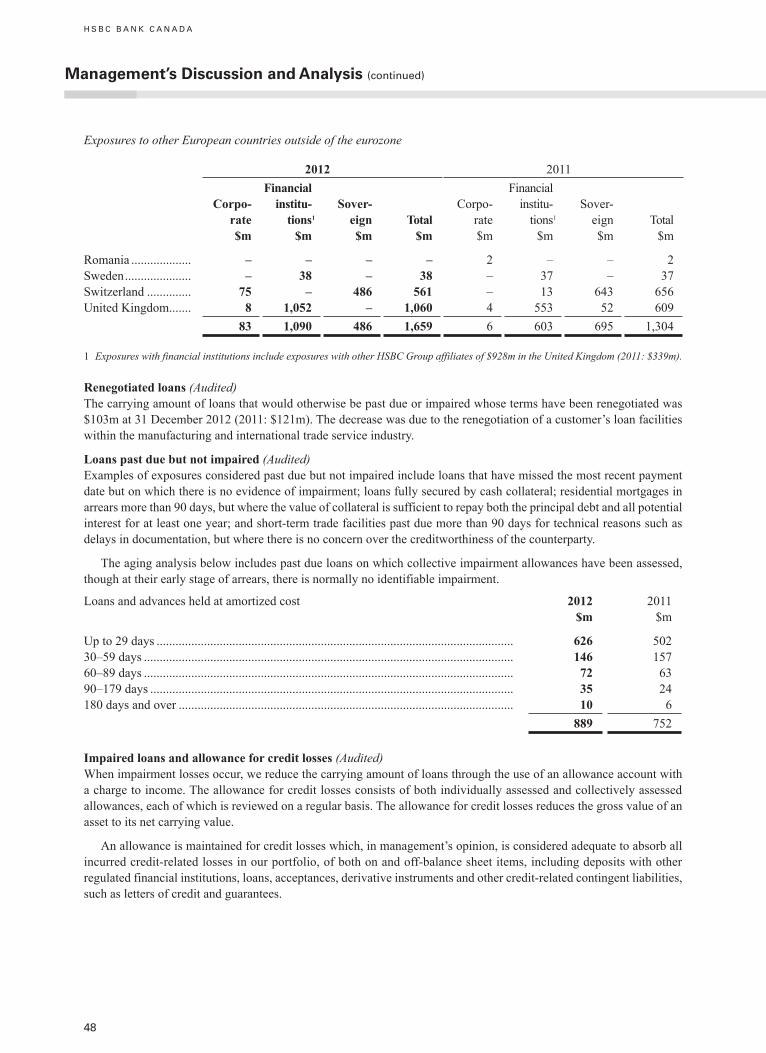
H S B C B A N K C A N A D A
48
Management’s discussion and analysis (continued)
Exposures to other European countries outside of the eurozone
2012 2011
Corpo-rate$m
Financial institu-
tions$m
1
Sover-eign $m
Total $m
Corpo-rate$m
Financial institu-
tions$m
1
Sover-eign $m
Total $m
Romania ................... – – – – 2 – – 2Sweden ..................... – 38 – 38 – 37 – 37Switzerland .............. 75 – 486 561 – 13 643 656United Kingdom ....... 8 1,052 – 1,060 4 553 52 609
83 1,090 486 1,659 6 603 695 1,304
1 Exposures with financial institutions include exposures with other HSBC Group affiliates of $928m in the United Kingdom (2011: $339m).
Renegotiated loans (Audited)The carrying amount of loans that would otherwise be past due or impaired whose terms have been renegotiated was $103m at 31 December 2012 (2011: $121m). The decrease was due to the renegotiation of a customer’s loan facilities within the manufacturing and international trade service industry.
Loans past due but not impaired (Audited)Examples of exposures considered past due but not impaired include loans that have missed the most recent payment date but on which there is no evidence of impairment; loans fully secured by cash collateral; residential mortgages in arrears more than 90 days, but where the value of collateral is sufficient to repay both the principal debt and all potential interest for at least one year; and short-term trade facilities past due more than 90 days for technical reasons such as delays in documentation, but where there is no concern over the creditworthiness of the counterparty.
The aging analysis below includes past due loans on which collective impairment allowances have been assessed, though at their early stage of arrears, there is normally no identifiable impairment.
Loans and advances held at amortized cost 2012 $m
2011 $m
Up to 29 days ................................................................................................................. 626 50230–59 days ..................................................................................................................... 146 15760–89 days ..................................................................................................................... 72 6390–179 days ................................................................................................................... 35 24180 days and over .......................................................................................................... 10 6
889 752
Impaired loans and allowance for credit losses (Audited)When impairment losses occur, we reduce the carrying amount of loans through the use of an allowance account with a charge to income. The allowance for credit losses consists of both individually assessed and collectively assessed allowances, each of which is reviewed on a regular basis. The allowance for credit losses reduces the gross value of an asset to its net carrying value.
An allowance is maintained for credit losses which, in management’s opinion, is considered adequate to absorb all incurred credit-related losses in our portfolio, of both on and off-balance sheet items, including deposits with other regulated financial institutions, loans, acceptances, derivative instruments and other credit-related contingent liabilities, such as letters of credit and guarantees.

49
Assessing the adequacy of the allowance for credit losses is inherently subjective as it requires making estimates that may be susceptible to significant change. This includes the amount and timing of expected future cash flows and incurred losses for loans that are not individually identified as being impaired.
Individually significant accounts are treated as impaired as soon as there is objective evidence that an impairment loss has been incurred. The criteria used by us to determine that there is such objective evidence include:
– known cash flow difficulties experienced by the borrower;
– past due contractual payments of either principal or interest;
– breach of loan covenants or conditions;
– the probability that the borrower will enter bankruptcy or other financial realization; and
– a significant downgrading in credit rating by an external credit rating agency.
Individually assessed impairment allowances are recorded on these individual accounts on an account-by-account basis to reduce their carrying value to estimated realizable amount.
The collectively assessed impairment allowance is our best estimate of incurred losses in the portfolio for those individually significant accounts for which no evidence of impairment has been individually identified or for high-volume groups of homogeneous loans that are not considered individually significant. In determining an appropriate level of collectively assessed impairment, we apply the following methodologies:
Business and government – For these loans, the underlying credit metrics including PD, LGD and EAD, for each customer are derived from the bank’s internal rating system as a basis for the collectively assessed impairment allowance. The bank incorporates a quantitatively supported management judgement framework which includes both internal and external indicators, to establish an overall collective impairment allowance consistent with recent loss experience and uncertainties in the environment.
Residential mortgages – Historic average loss rates are used to determine the general provision for these portfolios. Management may consider other current information should they believe that these historic loss rates do not fully reflect incurred losses in these portfolios.
Consumer Finance and other consumer loans – Analysis of historical delinquency movements by product type is used as the basis for the collectively assessed impairment allowance for these loan portfolios. By tracking delinquency movement among pools of homogeneous loans, an estimate of incurred losses in each pool is determined. These estimates can be amended should management believe they do not fully reflect incurred losses. This judgemental adjustment employs an established framework and references both internal and external indicators of credit quality.
In addition to the methodologies outlined above, the balance of the collectively assessed impairment allowance is also analyzed as a function of risk-weighted assets and is also referenced to the allowances held by our peer group.
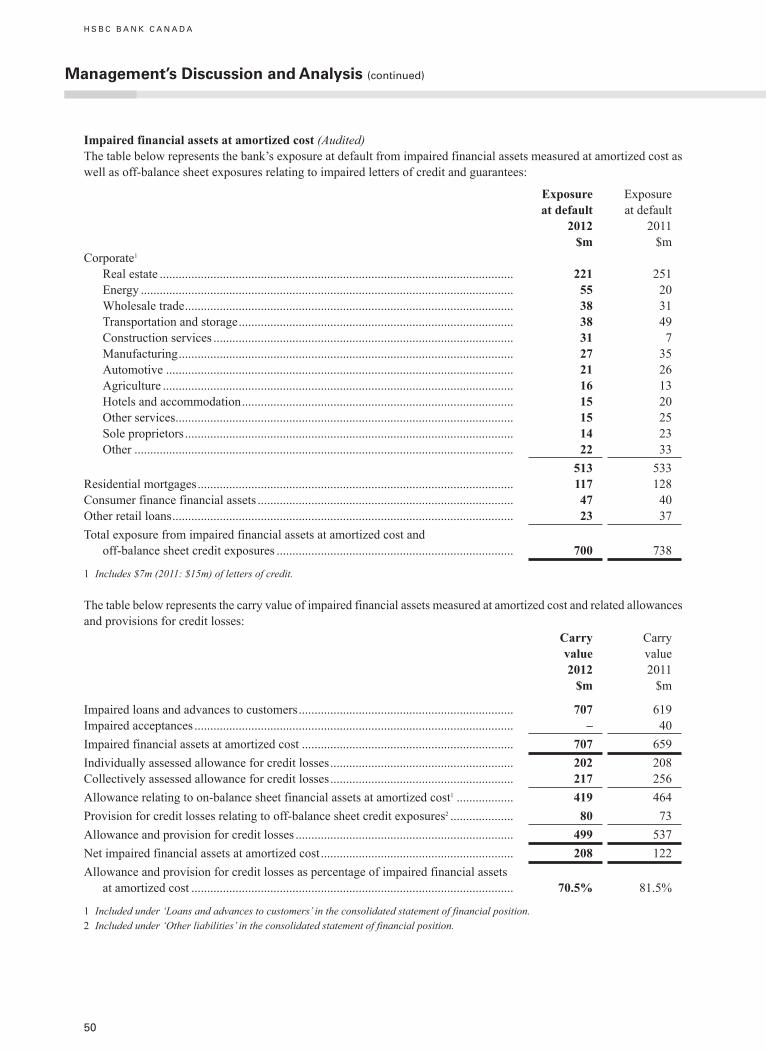
H S B C B A N K C A N A D A
50
Impaired financial assets at amortized cost (Audited)The table below represents the bank’s exposure at default from impaired financial assets measured at amortized cost as well as off-balance sheet exposures relating to impaired letters of credit and guarantees:
Exposure at default
2012 $m
Exposure at default
2011 $m
Corporate1
Real estate ................................................................................................................ 221 251 Energy ...................................................................................................................... 55 20 Wholesale trade ........................................................................................................ 38 31 Transportation and storage ....................................................................................... 38 49 Construction services ............................................................................................... 31 7 Manufacturing .......................................................................................................... 27 35 Automotive .............................................................................................................. 21 26 Agriculture ............................................................................................................... 16 13 Hotels and accommodation ...................................................................................... 15 20 Other services ........................................................................................................... 15 25 Sole proprietors ........................................................................................................ 14 23 Other ........................................................................................................................ 22 33
513 533Residential mortgages .................................................................................................... 117 128Consumer finance financial assets ................................................................................. 47 40Other retail loans ............................................................................................................ 23 37Total exposure from impaired financial assets at amortized cost and
off-balance sheet credit exposures ........................................................................... 700 738
1 Includes $7m (2011: $15m) of letters of credit.
The table below represents the carry value of impaired financial assets measured at amortized cost and related allowances and provisions for credit losses:
Carry value 2012
$m
Carry value 2011
$m
Impaired loans and advances to customers .................................................................... 707 619Impaired acceptances ..................................................................................................... – 40Impaired financial assets at amortized cost ................................................................... 707 659Individually assessed allowance for credit losses .......................................................... 202 208Collectively assessed allowance for credit losses .......................................................... 217 256Allowance relating to on-balance sheet financial assets at amortized cost1 .................. 419 464Provision for credit losses relating to off-balance sheet credit exposures2 .................... 80 73Allowance and provision for credit losses ..................................................................... 499 537Net impaired financial assets at amortized cost ............................................................. 208 122Allowance and provision for credit losses as percentage of impaired financial assets
at amortized cost ...................................................................................................... 70.5% 81.5%
1 Included under ‘Loans and advances to customers’ in the consolidated statement of financial position.2 Included under ‘Other liabilities’ in the consolidated statement of financial position.
Management’s discussion and analysis (continued)
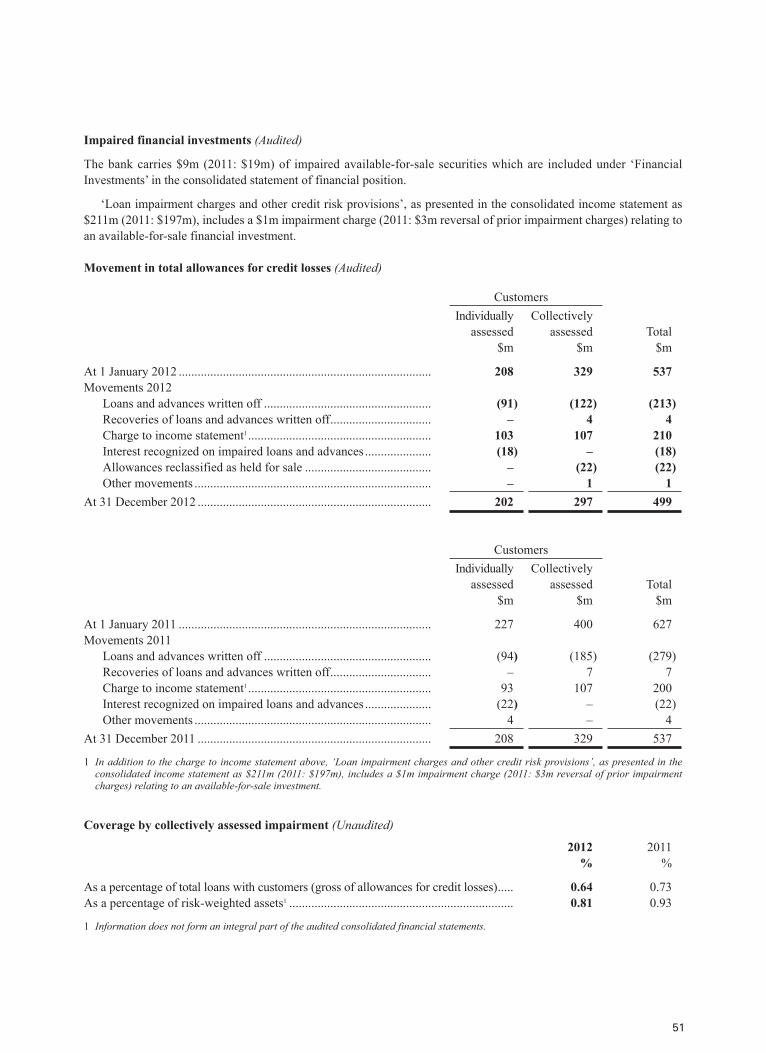
51
Impaired financial investments (Audited)
The bank carries $9m (2011: $19m) of impaired available-for-sale securities which are included under ‘Financial Investments’ in the consolidated statement of financial position.
‘Loan impairment charges and other credit risk provisions’, as presented in the consolidated income statement as $211m (2011: $197m), includes a $1m impairment charge (2011: $3m reversal of prior impairment charges) relating to an available-for-sale financial investment.
Movement in total allowances for credit losses (Audited)
CustomersIndividually
assessed $m
Collectively assessed
$mTotal
$m
At 1 January 2012 ................................................................................ 208 329 537Movements 2012 Loans and advances written off ..................................................... (91) (122) (213) Recoveries of loans and advances written off ................................ – 4 4 Charge to income statement1 .......................................................... 103 107 210 Interest recognized on impaired loans and advances ..................... (18) – (18) Allowances reclassified as held for sale ........................................ – (22) (22) Other movements ........................................................................... – 1 1At 31 December 2012 .......................................................................... 202 297 499
CustomersIndividually
assessed $m
Collectively assessed
$mTotal
$m
At 1 January 2011 ................................................................................ 227 400 627Movements 2011 Loans and advances written off ..................................................... (94) (185) (279) Recoveries of loans and advances written off ................................ – 7 7 Charge to income statement1 .......................................................... 93 107 200 Interest recognized on impaired loans and advances ..................... (22) – (22) Other movements ........................................................................... 4 – 4At 31 December 2011 .......................................................................... 208 329 537
1 In addition to the charge to income statement above, ‘Loan impairment charges and other credit risk provisions’, as presented in the consolidated income statement as $211m (2011: $197m), includes a $1m impairment charge (2011: $3m reversal of prior impairment charges) relating to an available-for-sale investment.
Coverage by collectively assessed impairment (Unaudited)
2012%
2011%
As a percentage of total loans with customers (gross of allowances for credit losses) ..... 0.64 0.73As a percentage of risk-weighted assets1 ....................................................................... 0.81 0.93
1 Information does not form an integral part of the audited consolidated financial statements.

H S B C B A N K C A N A D A
52
Management’s discussion and analysis (continued)
Loan impairment charges and other credit risk provisions (Audited)2012
$m2011
$m
Loan impairment charges for individually assessed loans and advances Wholesale loans and advances ................................................................................. 90 87 Retail loans and advances ........................................................................................ 13 6
103 93Loan impairment charges for collectively assessed loans and advances Wholesale loans and advances ................................................................................. (20) (11) Retail loans and advances ........................................................................................ 17 14 Consumer finance loans and advances .................................................................... 102 104 Off-balance sheet credit exposures .......................................................................... 8 – 107 107Loan impairment charges ............................................................................................... 210 200Financial investment impairment charges...................................................................... 1 (3)Loan impairment charges and other credit risk provisions ............................................ 211 197Loan loss ratio1 ............................................................................................................... 0.40% 0.37%
1 Loan loss ratio is defined as loan impairment charges divided by the average loans and acceptances, net of allowance for credit losses.
The loan loss ratio increased marginally to 0.40% compared with 0.37% in 2011 mainly as a result of higher specific loan impairment charges and an increase in the provision for off-balance sheet credit exposures, partially offset by a higher release in collective wholesale loan allowance.
Derivative portfolio (Audited)The credit equivalent amount of derivative exposure comprises the current replacement cost of positions plus an allowance for potential future fluctuation of interest rate or foreign exchange rate derivative contracts. We enter into derivatives primarily to support our customers’ requirements and to assist us in the management of assets and liabilities, particularly relating to interest and foreign exchange rate risks as noted above.
The credit equivalent amount of our derivative portfolio by product type is as follows:
2012 $m
2011 $m
Interest rate contracts ..................................................................................................... 1,101 1,292Foreign exchange contracts ............................................................................................ 2,080 2,014Commodity contracts ..................................................................................................... 94 35Net credit equivalent amount ......................................................................................... 3,275 3,341A more detailed analysis of our derivative portfolios is presented in note 11.

53
Liquidity and funding risk (Audited)Liquidity risk is the risk that we do not have sufficient financial resources to meet our obligations as they fall due or will have to obtain such resources at an excessive cost. This risk arises from mismatches in the timing of cash flows. Funding risk, a form of liquidity risk, arises when the necessary liquidity to fund illiquid asset positions cannot be obtained at the expected terms and when required.
The objective of our liquidity and funding management strategy is to ensure that all foreseeable funding commitments, including deposit withdrawals, can be met when due, and that access to the wholesale markets is coordinated and cost-effective.
Governance, policies and procedures (Audited)The ARC is responsible for defining the bank’s liquidity risk tolerances. In setting liquidity tolerances, the ARC has regard for the HSBC Group liquidity risk framework which mandates that each site manage its liquidity and funding on a self-sustaining basis. The ARC also reviews and approves the bank’s liquidity and funding policy and is responsible for its oversight.
ALCO is responsible for the development of policies, and practices to manage liquidity risk. Its mandate is established by HSBC Group policy, the ARC, and the bank’s RMC.
ALCO monitors liquidity risk on an ongoing basis. ALCO is responsible for the oversight of the liquidity and funding risk management, establishing liquidity risk parameters, and monitoring metrics against risk appetite, funding costs, and early warning indicators of a liquidity stress. ALCO is also responsible for ensuring the operational effectiveness of the bank’s liquidity contingency plan.
The management of liquidity and funding is carried out by our Balance Sheet Management group in accordance with practices and limits approved by ALCO, the ARC and HSBC Holdings. Compliance with policies is monitored by ALCO.
Our liquidity and funding management process includes:
– projecting cash flows under various stress scenarios and considering the level of liquid assets necessary in relation thereto;
– monitoring statement of financial position liquidity ratios against internal measures;
– maintaining a diverse range of funding sources;
– managing the concentration and profile of debt maturities;
– managing contingent liquidity commitment exposures within predetermined caps;
– maintaining debt financing plans;
– monitoring depositor concentration in order to avoid undue reliance on large individual depositors and ensuring a satisfactory overall funding mix; and
– maintaining liquidity and funding contingency plans.
Liquidity regulation (Unaudited)In December 2010, the Basel Committee on Banking Supervision published the ‘International framework for liquidity risk measurement, standards and monitoring’. The framework comprises two liquidity metrics: the liquidity coverage ratio and the net stable funding ratio. The ratios are subject to an observation period and are expected to become established standards by 2015 and 2018, respectively.
A significant level of interpretation is required in determining how to apply the definitions as currently drafted. It is therefore likely that the ratios will be subject to further change as requirements are finalized.
In 2012, OSFI released a significant update to its Guideline B-6 ‘Liquidity Principles’. In addition to the incorporation of Basel III principles, the Guideline requires regulatory liquidity monitoring and stress testing. Accordingly, the bank has submitted regular Net Cumulative Cash Flow reports during 2012.

54
H S B C B A N K C A N A D A
Management’s discussion and analysis (continued)
Liquidity and funding risk management framework (Unaudited)The objective of our liquidity framework is to allow us to withstand very severe liquidity stresses. It is designed to be adaptable to changing business models, markets, and regulations.
Our liquidity and funding risk management framework requires:
– liquidity to be managed on a stand-alone basis with no implicit reliance on the HSBC Group or central banks;
– compliance with the limit for the advances to core funding ratio; and
– maintaining cumulative positive cash flows in each time band within the specified time horizons in respect of idiosyncratic and market-wide stress scenarios, respectively.
Advances to core funding (Unaudited)The bank emphasizes the importance of core current accounts and savings accounts as a source of funds to finance lending to customers, and discourages reliance on short-term professional funding. This is achieved by placing limits to restrict the bank’s ability to increase loans and advances to customers without corresponding growth in current accounts and savings accounts. This measure is referred to as the ‘advances to core funding’ ratio.
The ratio describes loans and advances to customers as a percentage of the total of core customer current and savings accounts and term funding with a remaining term to maturity in excess of one year. Loans and advances to customers which are part of reverse repurchase arrangements, and where the bank receives securities which are deemed to be liquid, are excluded from the advances to core funding ratio, as are current accounts and savings accounts from customers deemed to be ‘non-core’. The categorization of customer deposits into core and non-core takes into account the nature of the customer and the size and pricing of the deposit.
The distinction between core and non-core deposits generally means that the bank’s measure of advances to core funding is more restrictive than that which could be inferred from the published financial statements.
Advances to core funding ratio
2012%
2011%
Year-end ......................................................................................................................... 96 96Maximum ....................................................................................................................... 96 96Minimum........................................................................................................................ 90 88Average .......................................................................................................................... 94 90
The advances to core funding ratio is reviewed and monitored by ALCO.
Primary sources of funding (Audited)Current accounts and savings deposits payable on demand or on short notice form a significant part of our funding. We place considerable importance on maintaining the stability and growth of these deposits, which provide a diversified pool of funds.
We also access professional markets in order to maintain a presence in local money markets and to optimize the funding of asset maturities not naturally matched by core deposit funding. As part of our wholesale funding arrangements, we have a number of programs for fundraising activities, so that undue reliance is not placed on any one source of funding.
No reliance is placed on unsecured money market wholesale funding as source of core funding. Only wholesale funding with a residual term to maturity of one year or greater is counted towards the core funding base. In addition, our stress testing assumptions require an equivalent amount of liquid assets to be held against wholesale funding maturing within the relevant stress testing horizon.
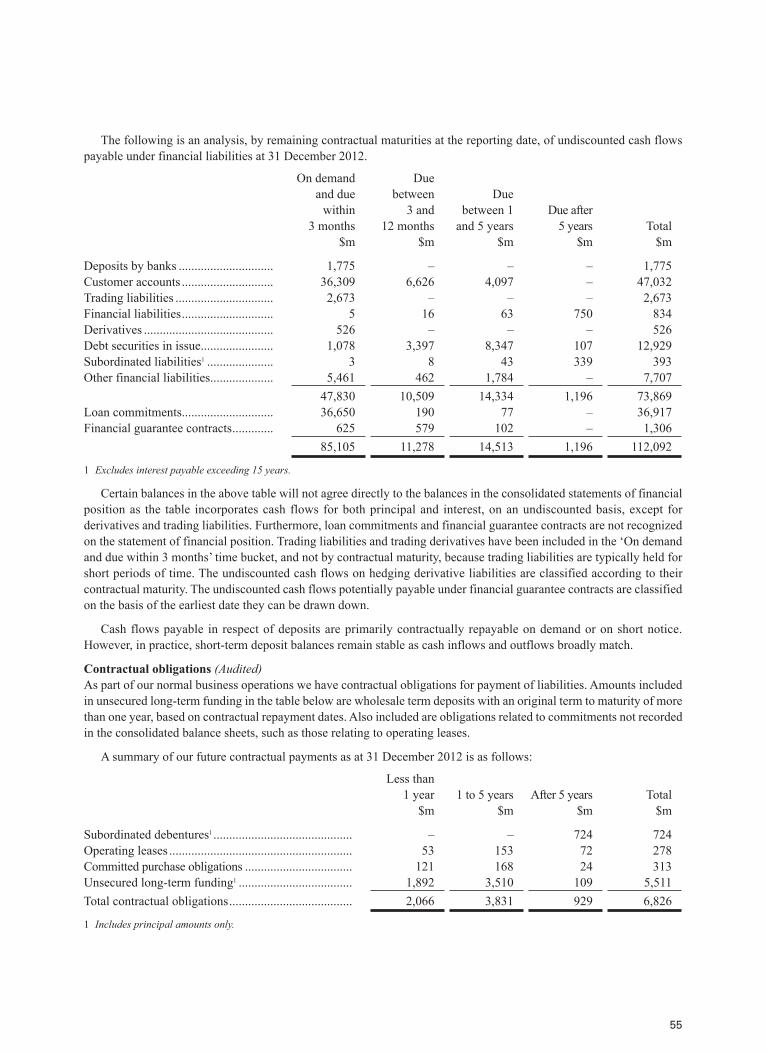
The following is an analysis, by remaining contractual maturities at the reporting date, of undiscounted cash flows payable under financial liabilities at 31 December 2012.
On demand and due
within 3 months
$m
Due between
3 and 12 months
$m
Due between 1
and 5 years $m
Due after 5 years
$mTotal
$m
Deposits by banks .............................. 1,775 – – – 1,775Customer accounts ............................. 36,309 6,626 4,097 – 47,032Trading liabilities ............................... 2,673 – – – 2,673Financial liabilities ............................. 5 16 63 750 834Derivatives ......................................... 526 – – – 526Debt securities in issue ....................... 1,078 3,397 8,347 107 12,929Subordinated liabilities1 ..................... 3 8 43 339 393Other financial liabilities .................... 5,461 462 1,784 – 7,707
47,830 10,509 14,334 1,196 73,869Loan commitments ............................. 36,650 190 77 – 36,917Financial guarantee contracts ............. 625 579 102 – 1,306
85,105 11,278 14,513 1,196 112,092
1 Excludes interest payable exceeding 15 years.
Certain balances in the above table will not agree directly to the balances in the consolidated statements of financial position as the table incorporates cash flows for both principal and interest, on an undiscounted basis, except for derivatives and trading liabilities. Furthermore, loan commitments and financial guarantee contracts are not recognized on the statement of financial position. Trading liabilities and trading derivatives have been included in the ‘On demand and due within 3 months’ time bucket, and not by contractual maturity, because trading liabilities are typically held for short periods of time. The undiscounted cash flows on hedging derivative liabilities are classified according to their contractual maturity. The undiscounted cash flows potentially payable under financial guarantee contracts are classified on the basis of the earliest date they can be drawn down.
Cash flows payable in respect of deposits are primarily contractually repayable on demand or on short notice. However, in practice, short-term deposit balances remain stable as cash inflows and outflows broadly match.
Contractual obligations (Audited)As part of our normal business operations we have contractual obligations for payment of liabilities. Amounts included in unsecured long-term funding in the table below are wholesale term deposits with an original term to maturity of more than one year, based on contractual repayment dates. Also included are obligations related to commitments not recorded in the consolidated balance sheets, such as those relating to operating leases.
A summary of our future contractual payments as at 31 December 2012 is as follows:
Less than 1 year
$m1 to 5 years
$mAfter 5 years
$mTotal
$m
Subordinated debentures1 ............................................ – – 724 724Operating leases .......................................................... 53 153 72 278Committed purchase obligations .................................. 121 168 24 313Unsecured long-term funding1 .................................... 1,892 3,510 109 5,511Total contractual obligations ....................................... 2,066 3,831 929 6,826
1 Includes principal amounts only.
55
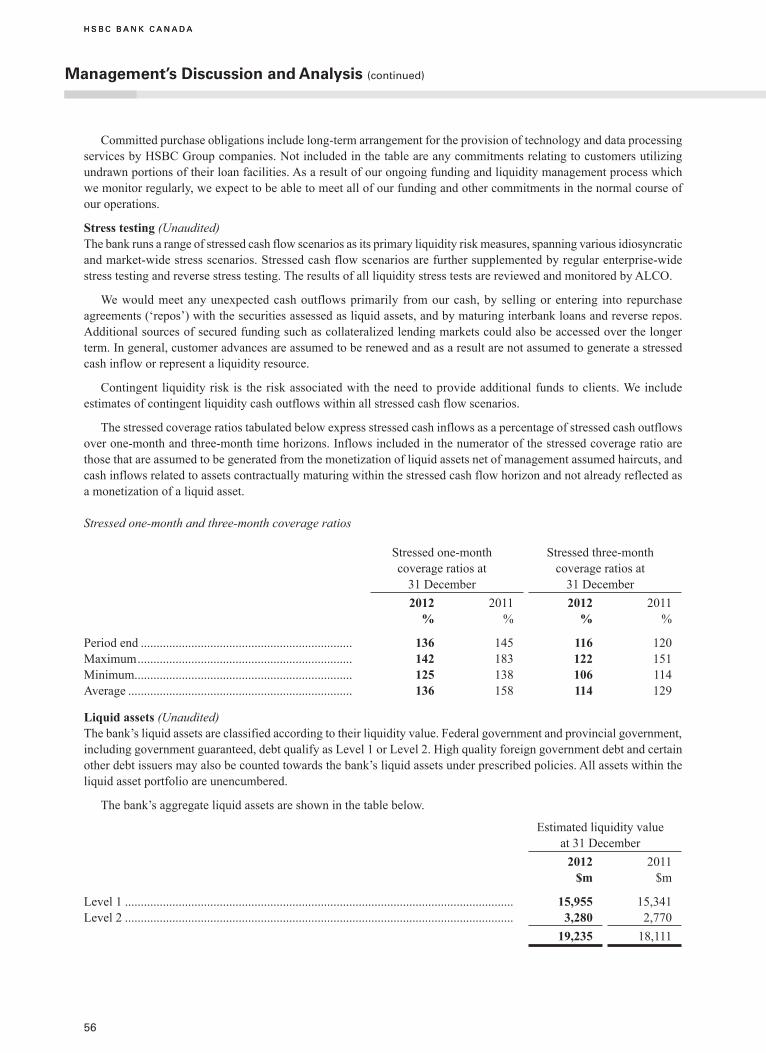
H S B C B A N K C A N A D A
56
Committed purchase obligations include long-term arrangement for the provision of technology and data processing services by HSBC Group companies. Not included in the table are any commitments relating to customers utilizing undrawn portions of their loan facilities. As a result of our ongoing funding and liquidity management process which we monitor regularly, we expect to be able to meet all of our funding and other commitments in the normal course of our operations.
Stress testing (Unaudited)The bank runs a range of stressed cash flow scenarios as its primary liquidity risk measures, spanning various idiosyncratic and market-wide stress scenarios. Stressed cash flow scenarios are further supplemented by regular enterprise-wide stress testing and reverse stress testing. The results of all liquidity stress tests are reviewed and monitored by ALCO.
We would meet any unexpected cash outflows primarily from our cash, by selling or entering into repurchase agreements (‘repos’) with the securities assessed as liquid assets, and by maturing interbank loans and reverse repos. Additional sources of secured funding such as collateralized lending markets could also be accessed over the longer term. In general, customer advances are assumed to be renewed and as a result are not assumed to generate a stressed cash inflow or represent a liquidity resource.
Contingent liquidity risk is the risk associated with the need to provide additional funds to clients. We include estimates of contingent liquidity cash outflows within all stressed cash flow scenarios.
The stressed coverage ratios tabulated below express stressed cash inflows as a percentage of stressed cash outflows over one-month and three-month time horizons. Inflows included in the numerator of the stressed coverage ratio are those that are assumed to be generated from the monetization of liquid assets net of management assumed haircuts, and cash inflows related to assets contractually maturing within the stressed cash flow horizon and not already reflected as a monetization of a liquid asset.
Stressed one-month and three-month coverage ratios
Stressed one-month coverage ratios at
31 December
Stressed three-month coverage ratios at
31 December
2012
%2011
%2012
%2011
%
Period end ................................................................... 136 145 116 120Maximum .................................................................... 142 183 122 151Minimum..................................................................... 125 138 106 114Average ....................................................................... 136 158 114 129
Liquid assets (Unaudited)The bank’s liquid assets are classified according to their liquidity value. Federal government and provincial government, including government guaranteed, debt qualify as Level 1 or Level 2. High quality foreign government debt and certain other debt issuers may also be counted towards the bank’s liquid assets under prescribed policies. All assets within the liquid asset portfolio are unencumbered.
The bank’s aggregate liquid assets are shown in the table below.
Estimated liquidity value at 31 December
2012 $m
2011 $m
Level 1 ........................................................................................................................... 15,955 15,341Level 2 ........................................................................................................................... 3,280 2,770
19,235 18,111
H S B C B A N K C A N A D A
Management’s discussion and analysis (continued)

Encumbered assets (Unaudited)In the normal course of business, the bank will pledge or otherwise encumber assets. The pledging of assets will occur to meet the bank’s payments and settlement system obligations, as security in a repurchase transaction, or as margining requirements. Limits are in place to control such pledging.
The bank actively monitors its pledging positions. Encumbered assets are not counted towards the bank’s liquid assets used for internal stress testing scenarios. We further estimate the impact of credit rating downgrade triggers, and exclude the estimated impact from liquid assets within the bank’s liquidity stress testing scenarios.
Market risk (Audited)Market risk is the risk that movements in market risk factors, including foreign exchange rates and commodity prices, interest rates, credit spreads and equity prices, will reduce our income or the value of our portfolios.
The objective of market risk management is to identify, measure and control market risk exposures in order to optimize return on risk and to remain within the bank’s risk appetite.
We separate exposures to market risk into trading and non-trading portfolios. Trading portfolios include those positions arising from market-making, proprietary position-taking and other positions designated as held-for-trading.
Policies and procedures (Audited)Market risk is managed through strategies in accordance with policies and risk limits set out by ALCO and approved by the Board as well as centrally by HSBC Group Risk Management. We set risk limits for each of our trading operations dependent upon the size, financial and capital resources of the operations, market liquidity of the instruments traded, business plan, experience and track record of management and dealers, internal audit ratings, support function resources and support systems. Risk limits are reviewed and set by ALCO on an annual basis at a minimum.
We use a range of tools to monitor and limit market risk exposures. These include: present value of a basis point, Value at Risk (‘VaR’), foreign exchange exposure limits, maximum loss limits, options premium paid limits, and product and issuance limits.
Value at risk (Audited)VaR is a technique that estimates the potential losses that could occur on risk positions as a result of movements in market rates and prices over a specified time horizon and to a given level of confidence.
The VaR models used are predominantly based on historical simulation. These models derive plausible future scenarios from past series of recorded market rates and prices, taking account of inter-relationships between different markets and rates such as interest rates and foreign exchange rates. The models also incorporate the effect of option features on the underlying exposures.
The historical simulation models used incorporate the following features:
– potential market movements are calculated with reference to data from the past two years;
– historical market rates and prices are calculated with reference to foreign exchange rates and commodity prices, interest rates, equity prices and the associated volatilities;
– VaR is calculated to a 99 % confidence level; and
– VaR is calculated for a one-day holding period.
57

H S B C B A N K C A N A D A
58
Management’s discussion and analysis (continued)
Statistically, we would expect to see losses in excess of VaR only one % of the time over a one-year period. Although a valuable guide to risk, VaR should always be viewed in the context of its limitations:
– the use of historical data as a proxy for estimating future events may not encompass all potential events, particularly those which are extreme in nature;
– the use of a one-day holding period assumes that all positions can be liquidated or hedged in one day, which may not fully reflect the market risk arising at times of severe illiquidity, when a one day holding period may be insufficient to liquidate or hedge all positions fully;
– the use of a 99 % confidence level, by definition, does not take into account losses that might occur beyond this level of confidence;
– VaR is calculated on the basis of exposures outstanding at the close of business and therefore does not necessarily reflect intra-day exposures; and
– VaR is unlikely to reflect loss potential on exposures that only arise under significant market moves.
VaR disclosed in the table and graph below is the bank’s total VaR for both trading and non-trading financial instruments. The information presented below does not include the results of HSBC Financial because the subsidiary employs other methods to measure and manage market risk.
Summary value at risk information (Audited)2012
$m2011
$m
End of year ..................................................................................................................... 9 16Average .......................................................................................................................... 14 16Minimum........................................................................................................................ 9 10Maximum ....................................................................................................................... 18 29
Q12011
Q22011
Q32011
Q42011
Q12012
Q22012
Q32012
Q42012
$m
30
28
26
24
22
20
18
16
14
12
10
8
6
4
2
0
Risk appetite is determined by the level of interest rate, foreign exchange, credit, and equity sensitivities. The decrease in VaR during 2012 was mainly driven by the reduction of credit spread sensitivities and swap spread risk caused by the tightening of credit spreads and widening of swaps spreads. The bank has taken a long position in bonds as a result of rates increasing.
HBCA VaR levels remained within the approved 2012 market risk limits.
59
Structural risk (Audited)Structural risk is the impact of interest rate and foreign exchange rate risks on assets and liabilities included in the banking book, including those in our consolidated statements of financial position. We value instruments included in the banking book at cost plus accrued interest (the effective interest rate method) and changes in rates and prices will not directly impact earnings. However, to the extent that assets and liabilities are not directly matched either by interest or exchange rates, any changes in the mix of assets or liabilities will affect earnings.
Interest rate risk (Audited)Interest rate risk arises primarily out of differences in the term to maturity or repricing of our assets and liabilities both on and off-balance sheet. These interest rate risk exposures, or ‘gaps’, are monitored by ALCO against prescribed limits. The gap position measures assets and liabilities based on contractual repricing data as well as incorporating assumptions on customer behaviour on products with a degree of optionality as to prepayment, redemption or repricing (such as redeemable deposit products and mortgages with prepayment options). These assumptions, which are based on historical behavioural patterns, are periodically reviewed by ALCO.
We believe in a conservative approach in setting limits on these mismatched positions. Limits are established based on the impact on the present value of all net cash flows of an immediate and parallel upward shift in all relevant yield curves of 0.01%. We also have established limits on these mismatched positions in terms of Dollars at Risk and VaR. Net interest income is forecasted using various interest rate and statement of financial position growth scenarios to provide a comprehensive analysis of spread earnings at risk.
We use a variety of cash and derivative instruments, principally interest rate swaps, to manage our interest rate risk. We use derivatives to modify the interest rate characteristics of related statement of financial position instruments and to hedge anticipated exposures when market conditions are considered beneficial.
In managing interest rate risk, we rely primarily upon our contractual interest rate sensitivity position adjusted for assumptions regarding customer behaviour. Adjustments made include assumptions relating to early repayment of consumer loans and residential mortgages and customer preferences for demand, notice and redeemable deposits. Based upon these adjustments made to our contractual positions, it is estimated that an immediate and sustained parallel increase in interest rates of 1% across all currencies and maturities would increase net interest income by $50m (2011: $61m) over the next twelve months assuming no additional hedging is undertaken.
Foreign exchange risk (Audited)We are exposed to foreign exchange risk on our foreign currency-denominated asset and liability positions. We buy and sell currencies in the spot, forward, futures and options markets, on behalf of our customers and for our own account, to manage our own currency exposures arising from assets and liabilities denominated in currencies other than the Canadian dollar. Limits have been established as to the magnitude of the exposure on a currency-by-currency basis as well as maximum loss limits on any position held.
Operational risk (Audited)Operational risk is the risk of loss to us resulting from inadequate or failed internal processes and systems, human error or external events. This type of risk includes fraud, unauthorized activities, errors, and settlement risk arising from the large number of daily banking transactions occurring in the normal course of business. Also, there are a wide variety of business and event risks inherent in all business activities.
We have policies for managing operational risk and aim to minimize loss through a framework requiring all business units to identify, assess, monitor and control operational risk, including the Operational Risk and Internal Control Committee, as described above in the Risk Management section.
We manage operational risk through disciplined application and evaluation of internal controls, appropriate segregation of duties, independent authorization of transactions, and regular, systematic reconciliation and monitoring of transactions. We have a dedicated function that proactively manages our compliance process, and we maintain high ethical standards. These processes together with our control structure help ensure that our exposure to operational risk is managed. This control structure is complemented by independent and periodic reviews by our Internal Audit department.

H S B C B A N K C A N A D A
60
Management’s discussion and analysis (continued)
As part of the enterprise-wide risk management process, we have established business continuity and event management practices so we can continue to service our customers’ needs in the event of major business disruption. Back-up facilities in various cities across North America increase our recovery capabilities for key businesses.
In common with other HSBC Group companies, as well as other Canadian banks and large organizations, we have business continuity plans in place to deal with events that could impact banking operations, from health concerns to weather related events to power outages and beyond. We monitor emerging issues and review, test and upgrade plans to prepare for foreseen and unforeseen events.

61
H S B C B A N K C A N A D A
Table of Contents
62 Statement of Management’s Responsibility for Financial Information63 Independent Auditors’ Report
Consolidated Financial Statements
64 Consolidated income statement65 Consolidated statement of comprehensive income66 Consolidated statement of financial position67 Consolidated statement of cash flows68 Consolidated statement of changes in equity
notes on the Consolidated Financial Statements
69 Note 1 Basis of preparation72 Note 2 Summary of significant accounting policies85 Note 3 Net operating income85 Note 4 Employee compensation and benefits92 Note 5 Share-based payments93 Note 6 Tax expense95 Note 7 Dividends95 Note 8 Segment analysis99 Note 9 Analysis of financial assets and liabilities by measurement basis101 Note 10 Trading assets101 Note 11 Derivatives107 Note 12 Financial investments108 Note 13 Business disposals109 Note 14 Interest rate sensitivity111 Note 15 Transfers of financial assets not qualifying for derecognition 111 Note 16 Property, plant and equipment112 Note 17 Investments in subsidiaries112 Note 18 Other assets113 Note 19 Goodwill and intangible assets113 Note 20 Trading liabilities113 Note 21 Debt securities in issue114 Note 22 Financial liabilities designated at fair value114 Note 23 Other liabilities114 Note 24 Subordinated liabilities115 Note 25 Fair values of financial instruments120 Note 26 Assets charged as security for liabilities and collateral accepted as security for assets121 Note 27 Share capital 122 Note 28 Non-controlling interest in trust and subsidiary123 Note 29 Notes on the statement of cash flows124 Note 30 Contingent liabilities, contractual commitments and guarantees125 Note 31 Lease commitments126 Note 32 Related party transactions129 Note 33 Restructuring charges129 Note 34 Events after the reporting period
Consolidated Financial Statements

62
H S B C B A N K C A N A D A
Statement of Management’s responsibility for Financial Information
The presentation and preparation of the annual consolidated financial statements, Management’s Discussion and Analysis (‘MD&A’) and all other information in the Annual Report is the responsibility of the management of HSBC Bank Canada (‘the bank’). The consolidated financial statements have been prepared in accordance with International Financial Reporting Standards. The consolidated financial statements and information in the MD&A necessarily include amounts based on informed judgements and estimates of the expected effects of current events and transactions with appropriate consideration to materiality.
In meeting its responsibility for the reliability of financial information, management relies on comprehensive internal accounting, operating and system controls. The bank’s overall controls include: an organizational structure providing for effective segregation of responsibilities, delegation of authority and personal accountability; written communication of policies and procedures of corporate conduct throughout the bank, and careful selection and training of personnel; regular updating and application of written accounting and administrative policies and procedures necessary to ensure adequate internal control over transactions, assets and records; and a continuing program of extensive internal audit covering all aspects of the bank’s operations. These controls are designed to provide reasonable assurance that financial records are reliable for preparing the consolidated financial statements and maintaining accountability for assets, that assets are safeguarded against unauthorized use or disposition and that the bank is in compliance with all regulatory requirements.
At least once a year, the Office of the Superintendent of Financial Institutions Canada (‘OSFI’), makes such examination and enquiry into the affairs of the bank as deemed necessary to ensure that the provisions of the Bank Act, having reference to the rights and interests of the depositors and the creditors of the bank, are being complied with and that the bank is in a sound financial position.
The bank’s Board of Directors oversees management’s responsibilities for financial reporting through the Audit and Risk Committee, which is composed of directors who are not officers or employees of the bank. The Audit and Risk Committee reviews the bank’s interim and annual consolidated financial statements and MD&A and recommends them for approval by the Board of Directors. Other key responsibilities of the Audit and Risk Committee include monitoring the bank’s system of internal control, monitoring its compliance with legal and regulatory requirements, considering the appointment of the Shareholders’ auditors and reviewing the qualifications, independence and performance of Shareholders’ auditors and internal auditors.
As at 31 December 2012, we, the bank’s Chief Executive Officer and Chief Financial Officer, have certified the effectiveness of our internal control over financial reporting as defined by the Canadian Securities Administrators under National Instrument 52-109 (Certification of Disclosure in Issuer’s Annual and Interim Filings).
The Shareholders’ auditors, the bank’s Chief Auditor and OSFI have full and free access to the Board of Directors and its committees to discuss audit, financial reporting and related matters.
Paulo MaiaPresident and Chief Executive Officer
Jacques FleurantChief Financial Officer
Vancouver, Canada27 February 2013

63
H S B C B A N K C A N A D A
Independent auditors’ report
To the Shareholders of HSbC bank Canada
We have audited the accompanying consolidated financial statements of HSBC Bank Canada, which comprise the consolidated statements of financial position as at 31 December 2012 and 31 December 2011, the consolidated income statement and statements of comprehensive income, changes in equity and cash flows for the years then ended, and notes, comprising a summary of significant accounting policies and other explanatory information.
Management’s responsibility for the Consolidated Financial Statements
Management is responsible for the preparation and fair presentation of these consolidated financial statements in accordance with International Financial Reporting Standards, and for such internal control as management determines is necessary to enable the preparation of consolidated financial statements that are free from material misstatement, whether due to fraud or error.
auditors’ responsibility
Our responsibility is to express an opinion on these consolidated financial statements based on our audits. We conducted our audits in accordance with Canadian generally accepted auditing standards. Those standards require that we comply with ethical requirements and plan and perform the audit to obtain reasonable assurance about whether the consolidated financial statements are free from material misstatement.
An audit involves performing procedures to obtain audit evidence about the amounts and disclosures in the consolidated financial statements. The procedures selected depend on our judgment, including the assessment of the risks of material misstatement of the consolidated financial statements, whether due to fraud or error. In making those risk assessments, we consider internal control relevant to the entity’s preparation and fair presentation of the consolidated financial statements in order to design audit procedures that are appropriate in the circumstances, but not for the purpose of expressing an opinion on the effectiveness of the entity’s internal control. An audit also includes evaluating the appropriateness of accounting policies used and the reasonableness of accounting estimates made by management, as well as evaluating the overall presentation of the consolidated financial statements.
We believe that the audit evidence we have obtained in our audits is sufficient and appropriate to provide a basis for our audit opinion.
opinion
In our opinion, the consolidated financial statements present fairly, in all material respects, the consolidated financial position of HSBC Bank Canada as at 31 December 2012 and 31 December 2011, and its consolidated financial performance and its consolidated cash flows for the years then ended in accordance with International Financial Reporting Standards.
Chartered Accountants
Vancouver, Canada27 February 2013
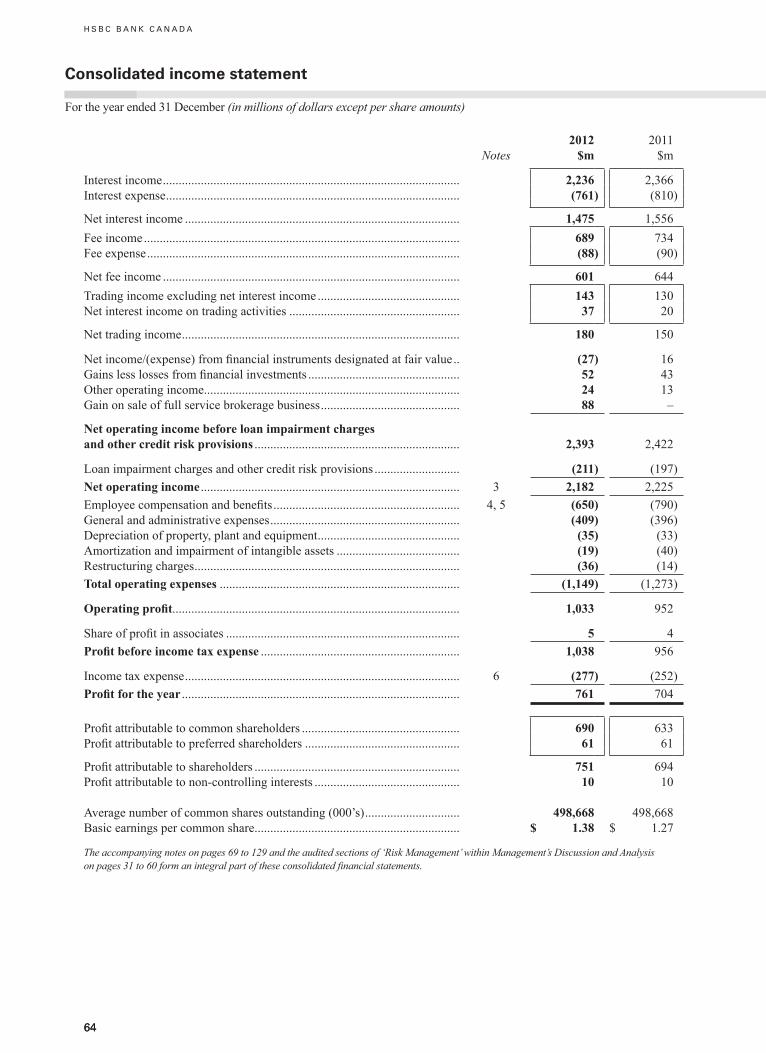
6464
H S B C B A N K C A N A D A
Consolidated income statement
For the year ended 31 December (in millions of dollars except per share amounts)
Notes2012
$m2011
$m
Interest income .............................................................................................. 2,236 2,366Interest expense ............................................................................................. (761) (810)
Net interest income ....................................................................................... 1,475 1,556Fee income .................................................................................................... 689 734Fee expense ................................................................................................... (88) (90)
Net fee income .............................................................................................. 601 644Trading income excluding net interest income ............................................. 143 130Net interest income on trading activities ...................................................... 37 20
Net trading income ........................................................................................ 180 150
Netincome/(expense)fromfinancialinstrumentsdesignatedatfairvalue .. (27) 16Gainslesslossesfromfinancialinvestments ................................................ 52 43Other operating income ................................................................................. 24 13Gain on sale of full service brokerage business ............................................ 88 –
Net operating income before loan impairment charges and other credit risk provisions ................................................................. 2,393 2,422
Loan impairment charges and other credit risk provisions ........................... (211) (197)Net operating income .................................................................................. 3 2,182 2,225Employeecompensationandbenefits ........................................................... 4, 5 (650) (790)General and administrative expenses ............................................................ (409) (396)Depreciation of property, plant and equipment ............................................. (35) (33)Amortization and impairment of intangible assets ....................................... (19) (40)Restructuring charges .................................................................................... (36) (14)Total operating expenses ............................................................................ (1,149) (1,273)
Operating profit........................................................................................... 1,033 952
Shareofprofitinassociates .......................................................................... 5 4Profit before income tax expense ............................................................... 1,038 956
Income tax expense ....................................................................................... 6 (277) (252)Profit for the year ........................................................................................ 761 704
Profitattributabletocommonshareholders .................................................. 690 633Profitattributabletopreferredshareholders ................................................. 61 61
Profitattributabletoshareholders ................................................................. 751 694Profitattributabletonon-controllinginterests .............................................. 10 10
Average number of common shares outstanding (000’s) .............................. 498,668 498,668Basic earnings per common share ................................................................. $ 1.38 $ 1.27
The accompanying notes on pages 69 to 129 and the audited sections of ‘Risk Management’ within Management’s Discussion and Analysis on pages 31 to 60 form an integral part of these consolidated financial statements.
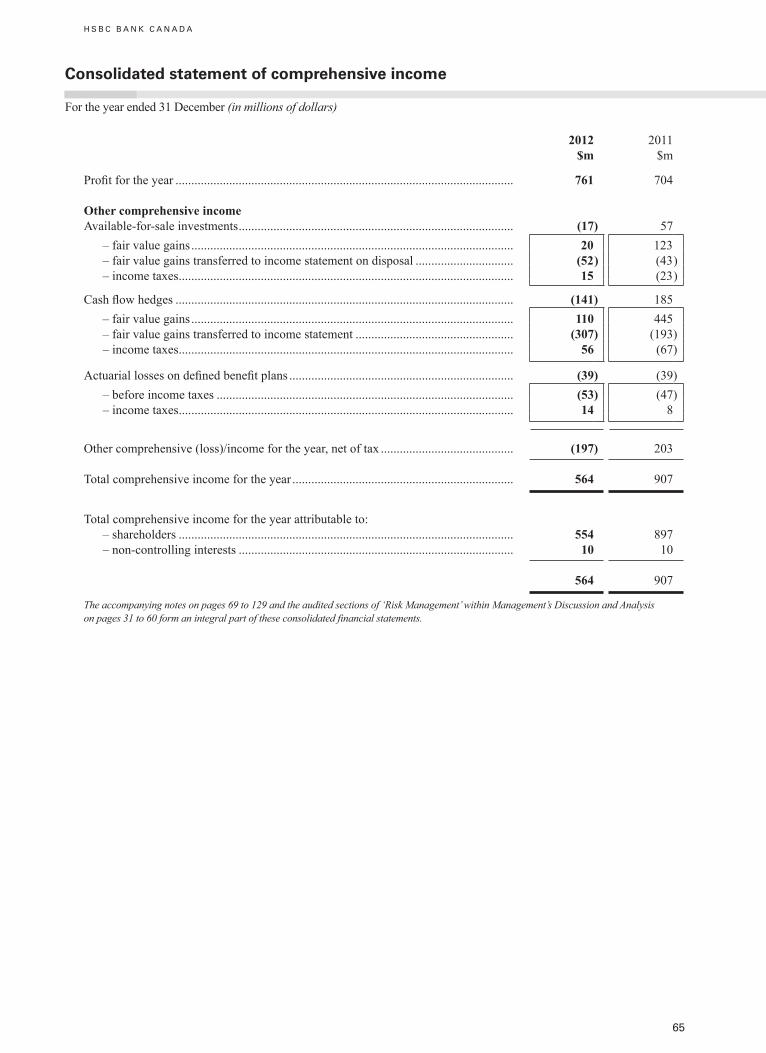
65
2012 $m
2011 $m
Profitfortheyear ........................................................................................................... 761 704
Other comprehensive incomeAvailable-for-sale investments ....................................................................................... (17) 57 – fair value gains ...................................................................................................... 20 123 – fair value gains transferred to income statement on disposal ............................... (52) (43) – income taxes .......................................................................................................... 15 (23)
Cashflowhedges ........................................................................................................... (141) 185 – fair value gains ...................................................................................................... 110 445 – fair value gains transferred to income statement .................................................. (307) (193) – income taxes .......................................................................................................... 56 (67)
Actuariallossesondefinedbenefitplans ....................................................................... (39) (39) – before income taxes .............................................................................................. (53) (47) – income taxes .......................................................................................................... 14 8
Other comprehensive (loss)/income for the year, net of tax .......................................... (197) 203
Total comprehensive income for the year ...................................................................... 564 907
Total comprehensive income for the year attributable to: – shareholders .......................................................................................................... 554 897 – non-controlling interests ....................................................................................... 10 10
564 907
The accompanying notes on pages 69 to 129 and the audited sections of ‘Risk Management’ within Management’s Discussion and Analysis on pages 31 to 60 form an integral part of these consolidated financial statements.
H S B C B A N K C A N A D A
Consolidated statement of comprehensive income
For the year ended 31 December (in millions of dollars)
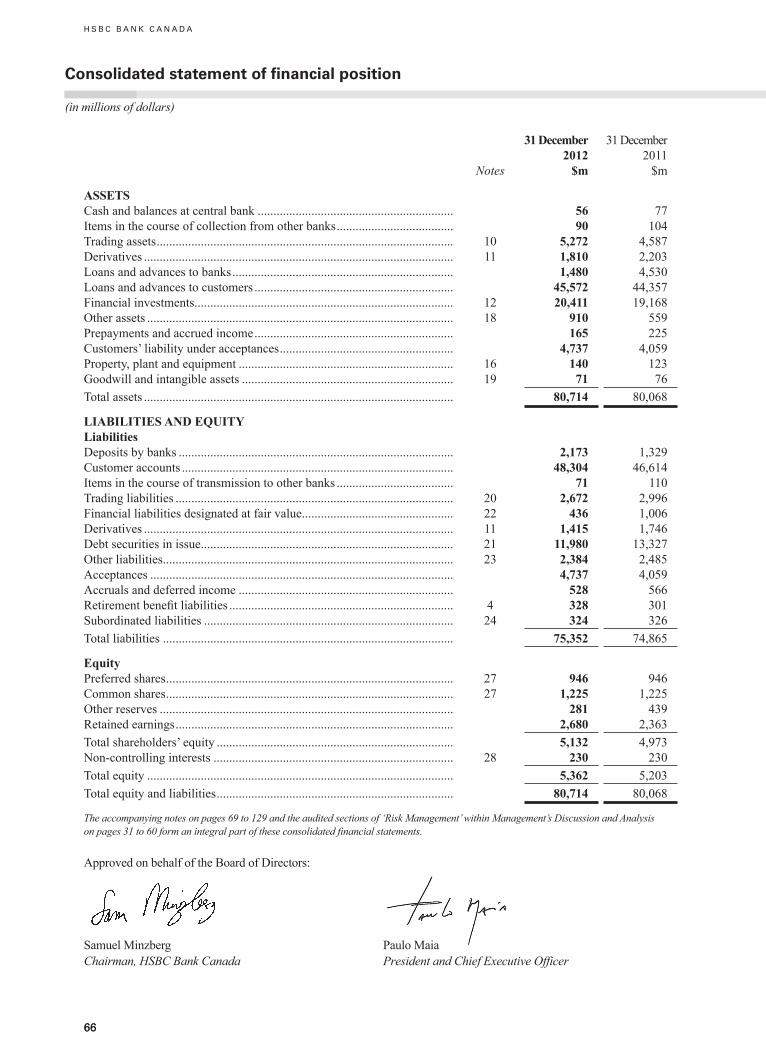
6666
H S B C B A N K C A N A D A
Consolidated statement of financial position
(in millions of dollars)
Notes
31 December 2012
$m
31 December2011
$m
ASSETSCash and balances at central bank .............................................................. 56 77Items in the course of collection from other banks ..................................... 90 104Trading assets .............................................................................................. 10 5,272 4,587Derivatives .................................................................................................. 11 1,810 2,203Loans and advances to banks ...................................................................... 1,480 4,530Loans and advances to customers ............................................................... 45,572 44,357Financial investments .................................................................................. 12 20,411 19,168Other assets ................................................................................................. 18 910 559Prepayments and accrued income ............................................................... 165 225Customers’ liability under acceptances ....................................................... 4,737 4,059Property, plant and equipment .................................................................... 16 140 123Goodwill and intangible assets ................................................................... 19 71 76Total assets .................................................................................................. 80,714 80,068
LIABILITIES AND EQUITYLiabilitiesDeposits by banks ....................................................................................... 2,173 1,329Customer accounts ...................................................................................... 48,304 46,614Items in the course of transmission to other banks ..................................... 71 110Trading liabilities ........................................................................................ 20 2,672 2,996Financial liabilities designated at fair value ................................................ 22 436 1,006Derivatives .................................................................................................. 11 1,415 1,746Debt securities in issue ................................................................................ 21 11,980 13,327Other liabilities ............................................................................................ 23 2,384 2,485Acceptances ................................................................................................ 4,737 4,059Accruals and deferred income .................................................................... 528 566Retirementbenefitliabilities ....................................................................... 4 328 301Subordinated liabilities ............................................................................... 24 324 326Total liabilities ............................................................................................ 75,352 74,865
EquityPreferred shares ........................................................................................... 27 946 946Common shares ........................................................................................... 27 1,225 1,225Other reserves ............................................................................................. 281 439Retained earnings ........................................................................................ 2,680 2,363Total shareholders’ equity ........................................................................... 5,132 4,973Non-controlling interests ............................................................................ 28 230 230Total equity ................................................................................................. 5,362 5,203Total equity and liabilities ........................................................................... 80,714 80,068
The accompanying notes on pages 69 to 129 and the audited sections of ‘Risk Management’ within Management’s Discussion and Analysis on pages 31 to 60 form an integral part of these consolidated financial statements.
Approved on behalf of the Board of Directors:
Samuel Minzberg Paulo MaiaChairman, HSBC Bank Canada President and Chief Executive Officer
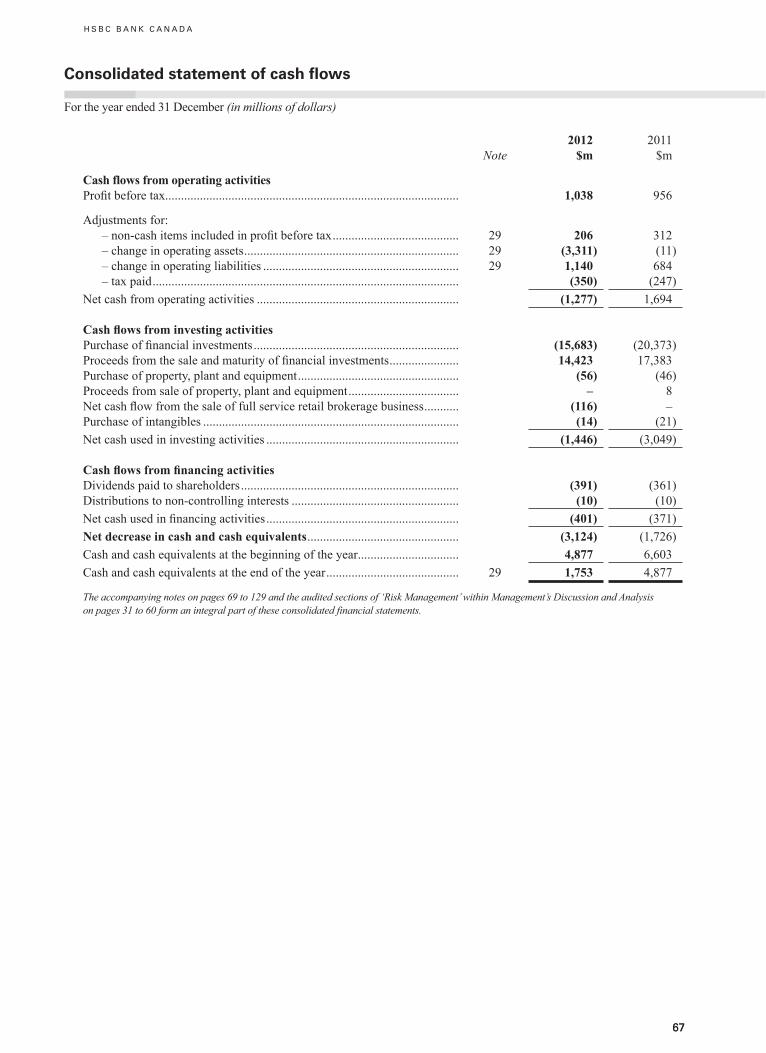
6767
H S B C B A N K C A N A D A
Consolidated statement of cash flows
For the year ended 31 December (in millions of dollars)
Note2012
$m2011
$m
Cash flows from operating activitiesProfitbeforetax ............................................................................................. 1,038 956
Adjustments for: –non-cashitemsincludedinprofitbeforetax ........................................ 29 206 312 – change in operating assets .................................................................... 29 (3,311) (11) – change in operating liabilities .............................................................. 29 1,140 684 – tax paid ................................................................................................. (350) (247)Net cash from operating activities ................................................................ (1,277) 1,694
Cash flows from investing activitiesPurchaseoffinancialinvestments ................................................................. (15,683) (20,373)Proceedsfromthesaleandmaturityoffinancialinvestments ...................... 14,423 17,383Purchase of property, plant and equipment ................................................... (56) (46)Proceeds from sale of property, plant and equipment ................................... – 8Netcashflowfromthesaleoffullserviceretailbrokeragebusiness ........... (116) –Purchase of intangibles ................................................................................. (14) (21)Net cash used in investing activities ............................................................. (1,446) (3,049)
Cash flows from financing activitiesDividends paid to shareholders ..................................................................... (391) (361)Distributions to non-controlling interests ..................................................... (10) (10)Netcashusedinfinancingactivities ............................................................. (401) (371)Net decrease in cash and cash equivalents ................................................ (3,124) (1,726)Cash and cash equivalents at the beginning of the year ................................ 4,877 6,603Cash and cash equivalents at the end of the year .......................................... 29 1,753 4,877
The accompanying notes on pages 69 to 129 and the audited sections of ‘Risk Management’ within Management’s Discussion and Analysis on pages 31 to 60 form an integral part of these consolidated financial statements.
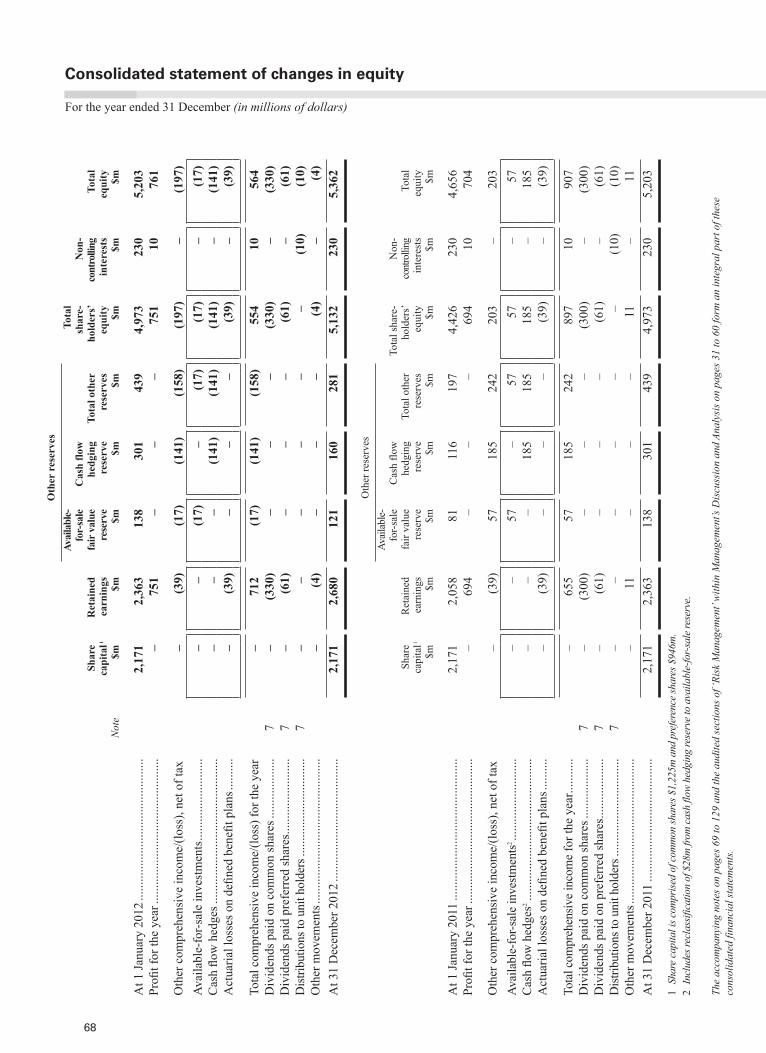
68
Consolidated statement of changes in equity
For the year ended 31 December (in millions of dollars)
Oth
er r
eser
ves
Not
e
Shar
e ca
pita
l $m
1
Ret
aine
d ea
rnin
gs
$m
Avai
labl
e-fo
r-sa
le
fair
val
ue
rese
rve
$m
Cas
h flo
w
hedg
ing
rese
rve
$m
Tota
l oth
er
rese
rves
$m
Tota
l sh
are-
hold
ers’
equi
ty
$m
Non
-co
ntro
lling
in
tere
sts
$m
Tota
l eq
uity
$m
At 1
Janu
ary
2012
......
......
......
......
......
......
......
...2,
171
2,36
313
830
143
94,
973
230
5,20
3Profitfortheyear
.....
......
......
......
......
......
......
.....
–75
1–
––
751
1076
1
Oth
er c
ompr
ehen
sive
inco
me/
(loss
), ne
t of t
ax
–(3
9)(1
7)(1
41)
(158
)(1
97)
–(1
97)
Avai
labl
e-fo
r-sal
e in
vest
men
ts ...
......
......
......
.....
––
(17)
–(1
7)(1
7)–
(17)
Cashflowhedges .
......
......
......
......
......
......
......
...–
––
(141
)(1
41)
(141
)–
(141
)Actuariallosseso
ndefinedbenefitplans
......
....
–(3
9)–
––
(39)
–(3
9)
Tota
l com
preh
ensiv
e in
com
e/(lo
ss) f
or th
e ye
ar–
712
(17)
(141
)(1
58)
554
1056
4D
ivid
ends
pai
d on
com
mon
shar
es ..
......
......
.....
7–
(330
)–
––
(330
)–
(330
)D
ivid
ends
pai
d pr
efer
red
shar
es ...
......
......
......
...7
–(6
1)–
––
(61)
–(6
1)D
istrib
utio
ns to
uni
t hol
ders
.....
......
......
......
......
..7
––
––
––
(10)
(10)
Oth
er m
ovem
ents
......
......
......
......
......
......
......
....
–(4
)–
––
(4)
–(4
)A
t 31
Dec
embe
r 201
2 ....
......
......
......
......
......
.....
2,17
12,
680
121
160
281
5,13
223
05,
362
Oth
er re
serv
es
Shar
e ca
pita
l $m
1
Ret
aine
d ea
rnin
gs
$m
Avai
labl
e-fo
r-sal
e fa
ir va
lue
rese
rve
$m
Cas
h flo
w
hedg
ing
rese
rve
$m
Tota
l oth
er
rese
rves
$m
Tota
l sha
re-
hold
ers’
equi
ty
$m
Non
-co
ntro
lling
in
tere
sts
$m
Tota
l eq
uity
$m
At 1
Janu
ary
2011
.....
......
......
......
......
......
......
....
2,17
12,
058
8111
619
74,
426
230
4,65
6Profitfortheyear
.....
......
......
......
......
......
......
.....
–69
4–
––
694
1070
4
Oth
er c
ompr
ehen
sive
inco
me/
(loss
), ne
t of t
ax
–(3
9)57
185
242
203
–20
3Av
aila
ble-
for-s
ale
inve
stmen
ts2 .....
......
......
......
...–
–57
–57
57–
57Cashflowhedges2 .
......
......
......
......
......
......
......
..–
––
185
185
185
–18
5Actuariallosseso
ndefinedbenefitplans
......
....
–(3
9)–
––
(39)
–(3
9)
Tota
l com
preh
ensiv
e in
com
e fo
r the
yea
r.....
......
–65
557
185
242
897
1090
7D
ivid
ends
pai
d on
com
mon
shar
es ..
......
......
.....
7–
(300
)–
––
(300
)–
(300
)D
ivid
ends
pai
d on
pre
ferr
ed sh
ares
......
......
......
.7
–(6
1)–
––
(61)
–(6
1)D
istrib
utio
ns to
uni
t hol
ders
.....
......
......
......
......
..7
––
––
––
(10)
(10)
Oth
er m
ovem
ents
......
......
......
......
......
......
......
....
–11
––
–11
–11
At 3
1 D
ecem
ber 2
011
......
......
......
......
......
......
...2,
171
2,36
313
830
143
94,
973
230
5,20
3
1 Sh
are
capi
tal i
s com
prise
d of
com
mon
shar
es $
1,22
5m a
nd p
refe
renc
e sh
ares
$94
6m.
2 In
clud
es re
clas
sific
atio
n of
$28
m fr
om c
ash
flow
hedg
ing
rese
rve
to a
vaila
ble-
for-
sale
rese
rve.
The
acco
mpa
nyin
g no
tes o
n pa
ges 6
9 to
129
and
the
audi
ted
sect
ions
of ‘
Risk
Man
agem
ent’
with
in M
anag
emen
t’s D
iscu
ssio
n an
d An
alys
is o
n pa
ges 3
1 to
60
form
an
inte
gral
par
t of t
hese
co
nsol
idat
ed fi
nanc
ial s
tate
men
ts.
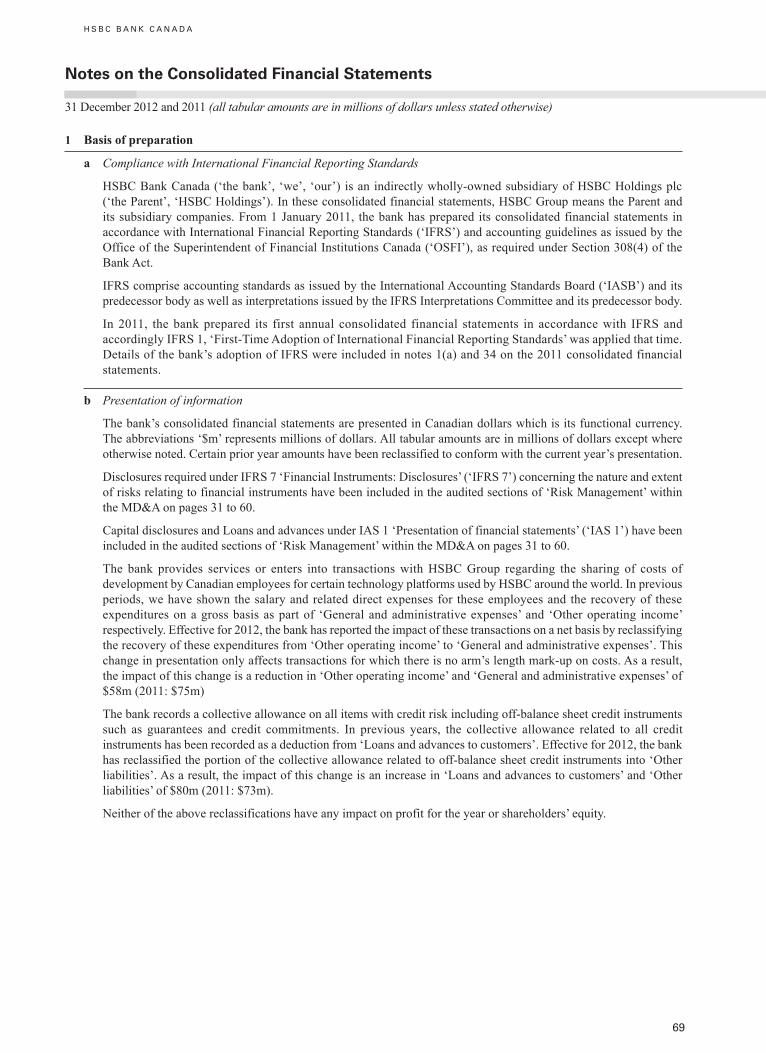
H S B C B A N K C A N A D A
69
notes on the Consolidated Financial Statements
31 December 2012 and 2011 (all tabular amounts are in millions of dollars unless stated otherwise)
1 Basis of preparation
a Compliance with International Financial Reporting Standards
HSBC Bank Canada (‘the bank’, ‘we’, ‘our’) is an indirectly wholly-owned subsidiary of HSBC Holdings plc (‘the Parent’, ‘HSBC Holdings’). In these consolidated financial statements, HSBC Group means the Parent and its subsidiary companies. From 1 January 2011, the bank has prepared its consolidated financial statements in accordance with International Financial Reporting Standards (‘IFRS’) and accounting guidelines as issued by the Office of the Superintendent of Financial Institutions Canada (‘OSFI’), as required under Section 308(4) of the Bank Act.
IFRS comprise accounting standards as issued by the International Accounting Standards Board (‘IASB’) and its predecessor body as well as interpretations issued by the IFRS Interpretations Committee and its predecessor body.
In 2011, the bank prepared its first annual consolidated financial statements in accordance with IFRS and accordingly IFRS 1, ‘First-Time Adoption of International Financial Reporting Standards’ was applied that time. Details of the bank’s adoption of IFRS were included in notes 1(a) and 34 on the 2011 consolidated financial statements.
b Presentation of information
The bank’s consolidated financial statements are presented in Canadian dollars which is its functional currency. The abbreviations ‘$m’ represents millions of dollars. All tabular amounts are in millions of dollars except where otherwise noted. Certain prior year amounts have been reclassified to conform with the current year’s presentation.
Disclosures required under IFRS 7 ‘Financial Instruments: Disclosures’ (‘IFRS 7’) concerning the nature and extent of risks relating to financial instruments have been included in the audited sections of ‘Risk Management’ within the MD&A on pages 31 to 60.
Capital disclosures and Loans and advances under IAS 1 ‘Presentation of financial statements’ (‘IAS 1’) have been included in the audited sections of ‘Risk Management’ within the MD&A on pages 31 to 60.
The bank provides services or enters into transactions with HSBC Group regarding the sharing of costs of development by Canadian employees for certain technology platforms used by HSBC around the world. In previous periods, we have shown the salary and related direct expenses for these employees and the recovery of these expenditures on a gross basis as part of ‘General and administrative expenses’ and ‘Other operating income’ respectively. Effective for 2012, the bank has reported the impact of these transactions on a net basis by reclassifying the recovery of these expenditures from ‘Other operating income’ to ‘General and administrative expenses’. This change in presentation only affects transactions for which there is no arm’s length mark-up on costs. As a result, the impact of this change is a reduction in ‘Other operating income’ and ‘General and administrative expenses’ of $58m (2011: $75m)
The bank records a collective allowance on all items with credit risk including off-balance sheet credit instruments such as guarantees and credit commitments. In previous years, the collective allowance related to all credit instruments has been recorded as a deduction from ‘Loans and advances to customers’. Effective for 2012, the bank has reclassified the portion of the collective allowance related to off-balance sheet credit instruments into ‘Other liabilities’. As a result, the impact of this change is an increase in ‘Loans and advances to customers’ and ‘Other liabilities’ of $80m (2011: $73m).
Neither of the above reclassifications have any impact on profit for the year or shareholders’ equity.

H S B C B A N K C A N A D A
1 Basis of preparation (continued)
c Use of estimates and assumptions
The preparation of financial information requires the use of estimates and assumptions about future conditions. The use of available information and the application of judgement are inherent in the formation of estimates. Actual results in the future may differ from estimates upon which financial information is prepared. Management believes that the bank’s critical accounting policies where judgement is necessarily applied are those which relate to impairment of loans and advances and the valuation of financial instruments as described within the MD&A.
d Consolidation
The consolidated financial statements of the bank comprise the financial statements of the bank and its subsidiaries. Subsidiaries are consolidated from the date that the bank gains control. The acquisition method of accounting is used when subsidiaries are acquired by the bank. The cost of an acquisition is measured at the fair value of the consideration, including contingent consideration, given at the date of exchange. Acquisition-related costs are recognized as an expense in the income statement in the period in which they are incurred. The acquired identifiable assets, liabilities and contingent liabilities are measured at their fair values at the date of acquisition. Goodwill is measured as the excess of the aggregation of the consideration transferred, the amount of non-controlling interest and the fair value of the acquirer’s previously held equity interest, if any, over the net of the amounts of identifiable assets acquired and liabilities assumed. The amount of non-controlling interest is measured either at fair value or at the non-controlling interest’s proportionate share of the acquiree’s identifiable net assets. Changes in a parent’s ownership interest in a subsidiary that do not result in a loss of control are treated as transactions between equity holders and are reported in equity.
Entities that are controlled by the bank are consolidated until the date that control ceases.
In the context of Special Purpose Entities (‘SPE’), the following circumstances may indicate a relationship which, in substance, the bank controls and consequently consolidates an SPE:
– the activities of the SPE are being conducted on behalf of the bank according to its specific business needs so that the bank obtains the benefits from the SPE’s operation;
– the bank has the decision-making powers to obtain the majority of the benefits of the activities of the SPE or, by setting up an ‘autopilot’ mechanism, the bank has delegated these decision-making powers;
– the bank has rights to obtain the majority of the benefits of the SPE and therefore may be exposed to risks incidental to the activities of the SPE; or
– the bank retains the majority of the residual or ownership risks related to the SPE or its assets in order to obtain benefits from its activities.
The bank performs a re-assessment of consolidation whenever there is a change in the substance of the relationship between the bank and an SPE.
All inter-company transactions are eliminated on consolidation.
The consolidated financial statements of the bank also include the attributable share of the results and reserves of associates.
e Changes in accounting policy during 2012
There were no changes in accounting policy in 2012.
70
notes on the Consolidated Financial Statements (continued)
December 31, 2009 and 2008 (all tabular amounts are in millions of dollars unless stated otherwise)

71
1 Basis of preparation (continued)
f Future accounting developments
At 31 December 2012, a number of standards and interpretations, and amendments thereto, had been issued by the IASB, which are not effective for these consolidated financial statements. The IASB is continuing to work on projects on insurance, revenue recognition and lease accounting, which together with the standards described below, represent widespread and significant changes to accounting requirements from 2013.
Standards applicable in 2013
In May 2011, the IASB issued IFRS 10 ‘Consolidated Financial Statements’ (‘IFRS 10’), and IFRS 12 ‘Disclosure of Interests in Other Entities’ (‘IFRS 12’). In June 2012, the IASB issued amendments to IFRS 10 and IFRS 12 ‘Transition Guidance’. The standards and amendments are effective for annual periods beginning on or after 1 January 2013. IFRS 10 is to be applied retrospectively.
Under IFRS 10, there will be one approach for determining consolidation for all entities, based on the concept of power, variability of returns and their linkage. This will replace the current approach which emphasizes legal control or exposure to risks and rewards, depending on the nature of the entity. IFRS 12 includes the disclosure requirements for subsidiaries and associates and introduces new requirements for unconsolidated structured entities.
Based on our initial assessment, we do not expect IFRS 10 and 12 to have a material impact on the bank’s financial statements as there will be no change to the entities presently consolidated by the bank.
In May 2011, the IASB also issued IFRS 13 ‘Fair Value Measurement’ (‘IFRS 13’). This standard is effective for annual periods beginning on or after 1 January 2013 and will be applied prospectively. The disclosure requirements of IFRS 13 do not require comparative information to be provided for periods prior to initial application.
IFRS 13 establishes a single source of guidance for all fair value measurements required or permitted by IFRS. The standard clarifies the definition of fair value as an exit price, which is defined as a price at which an orderly transaction to sell the asset or to transfer the liability would take place between market participants at the measurement date under current market conditions, and enhances disclosures about fair value measurement. Based on our initial assessment, we do not expect the adoption of IFRS 13 to have a material impact on the bank’s consolidated financial statements.
In June 2011, the IASB issued amendments to IAS 19 ‘Employee Benefits’ (‘IAS 19 revised’). The revised standard is effective for annual periods beginning on or after 1 January 2013 and will be applied retrospectively.
The most significant impact for the bank is the replacement of interest cost and expected return on plan assets by a finance cost component comprising the net interest on the net defined benefit liability or asset. This finance cost component is determined by applying the same discount rate used to measure the defined benefit obligation to the net defined benefit liability or asset. The difference between the actual return on plan assets and the return included in the finance cost component in the income statement will be presented in other comprehensive income. The effect of this change is to increase the pension expense by the difference between the current expected return on plan assets and the return calculated by applying the relevant discount rate.
In addition, unvested amounts related to past service events are no longer amortized and recognized in the income statement over the vesting period, but recognized in full on the date of the past service event as a charge or a credit to income.
The estimated effect of the adoption of this standard is an increase in total operating expenses for fiscal 2013 of approximately $10m. In addition, as the standard is to be applied retrospectively, there is an increase in retained earnings on 1 January 2013 of $14m net of income taxes relating to past service gains recorded in previous years that are currently deferred.
In December 2011, the IASB issued amendments to IFRS 7 ‘Disclosures – Offsetting Financial Assets and Financial Liabilities’ which requires the disclosures about the effect or potential effects of offsetting financial assets and financial liabilities and related arrangements on an entity’s financial position. The amendments are effective for annual periods beginning on or after 1 January 2013 and interim periods within those annual periods. The amendments are required to be applied retrospectively.
71
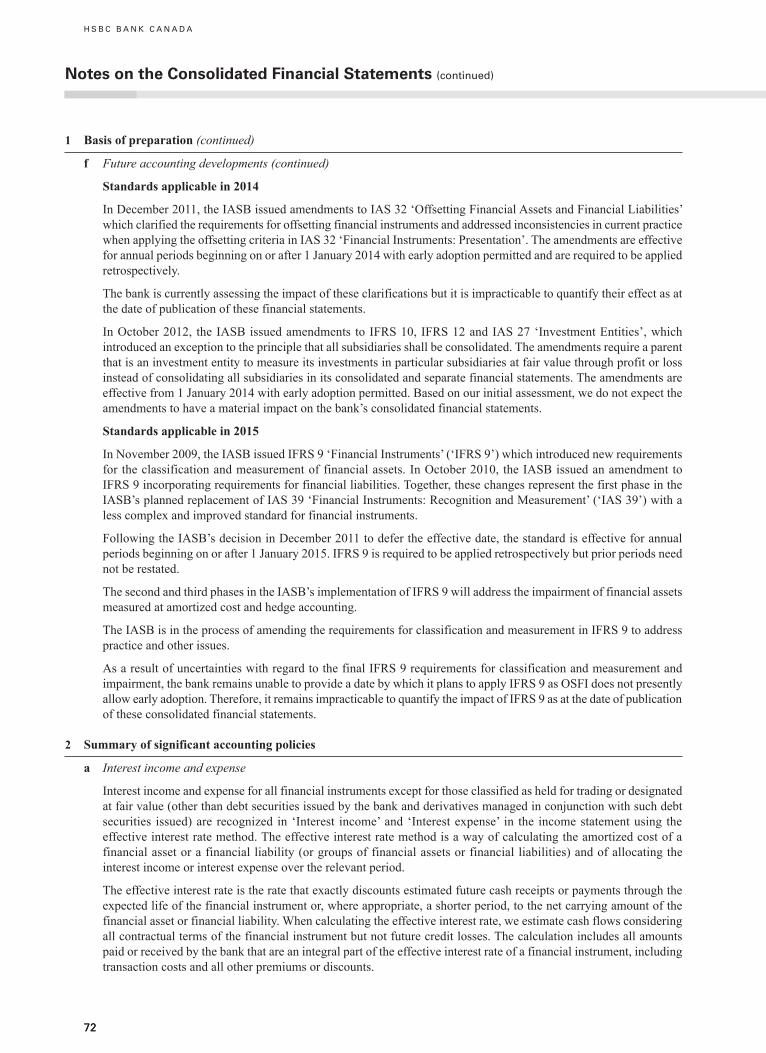
72
H S B C B A N K C A N A D A
notes on the Consolidated Financial Statements (continued)
December 31, 2009 and 2008 1 Basis of preparation (continued)
f Future accounting developments (continued)
Standards applicable in 2014
In December 2011, the IASB issued amendments to IAS 32 ‘Offsetting Financial Assets and Financial Liabilities’ which clarified the requirements for offsetting financial instruments and addressed inconsistencies in current practice when applying the offsetting criteria in IAS 32 ‘Financial Instruments: Presentation’. The amendments are effective for annual periods beginning on or after 1 January 2014 with early adoption permitted and are required to be applied retrospectively.
The bank is currently assessing the impact of these clarifications but it is impracticable to quantify their effect as at the date of publication of these financial statements.
In October 2012, the IASB issued amendments to IFRS 10, IFRS 12 and IAS 27 ‘Investment Entities’, which introduced an exception to the principle that all subsidiaries shall be consolidated. The amendments require a parent that is an investment entity to measure its investments in particular subsidiaries at fair value through profit or loss instead of consolidating all subsidiaries in its consolidated and separate financial statements. The amendments are effective from 1 January 2014 with early adoption permitted. Based on our initial assessment, we do not expect the amendments to have a material impact on the bank’s consolidated financial statements.
Standards applicable in 2015
In November 2009, the IASB issued IFRS 9 ‘Financial Instruments’ (‘IFRS 9’) which introduced new requirements for the classification and measurement of financial assets. In October 2010, the IASB issued an amendment to IFRS 9 incorporating requirements for financial liabilities. Together, these changes represent the first phase in the IASB’s planned replacement of IAS 39 ‘Financial Instruments: Recognition and Measurement’ (‘IAS 39’) with a less complex and improved standard for financial instruments.
Following the IASB’s decision in December 2011 to defer the effective date, the standard is effective for annual periods beginning on or after 1 January 2015. IFRS 9 is required to be applied retrospectively but prior periods need not be restated.
The second and third phases in the IASB’s implementation of IFRS 9 will address the impairment of financial assets measured at amortized cost and hedge accounting.
The IASB is in the process of amending the requirements for classification and measurement in IFRS 9 to address practice and other issues.
As a result of uncertainties with regard to the final IFRS 9 requirements for classification and measurement and impairment, the bank remains unable to provide a date by which it plans to apply IFRS 9 as OSFI does not presently allow early adoption. Therefore, it remains impracticable to quantify the impact of IFRS 9 as at the date of publication of these consolidated financial statements.
2 Summary of significant accounting policies
a Interest income and expense
Interest income and expense for all financial instruments except for those classified as held for trading or designated at fair value (other than debt securities issued by the bank and derivatives managed in conjunction with such debt securities issued) are recognized in ‘Interest income’ and ‘Interest expense’ in the income statement using the effective interest rate method. The effective interest rate method is a way of calculating the amortized cost of a financial asset or a financial liability (or groups of financial assets or financial liabilities) and of allocating the interest income or interest expense over the relevant period.
The effective interest rate is the rate that exactly discounts estimated future cash receipts or payments through the expected life of the financial instrument or, where appropriate, a shorter period, to the net carrying amount of the financial asset or financial liability. When calculating the effective interest rate, we estimate cash flows considering all contractual terms of the financial instrument but not future credit losses. The calculation includes all amounts paid or received by the bank that are an integral part of the effective interest rate of a financial instrument, including transaction costs and all other premiums or discounts.
72
73
2 Summary of significant accounting policies (continued)
a Interest income and expense (continued)
Interest on impaired financial assets is recognized using the rate of interest used to discount the future cash flows for the purpose of measuring the impairment loss.
b Non-interest income
Fee income is earned from a diverse range of services provided by the bank to its customers. Fee income is accounted for as follows:
– income earned on the execution of a significant act is recognized as revenue when the act is completed (for example, fees arising from negotiating, or participating in the negotiation of, a transaction for a third party, such as an arrangement for the acquisition of shares or other securities);
– income earned from the provision of services is recognized as revenue as the services are provided (for example, asset management, portfolio and other management advisory and service fees); and
– income which forms an integral part of the effective interest rate of a financial instrument is recognized as an adjustment to the effective interest rate (for example, certain loan commitment fees) and recorded in ‘Interest income’ (note 2(a)).
Net trading income comprises all gains and losses from changes in the fair value of financial assets and financial liabilities held for trading, together with related interest income, expense and dividends.
Net income from financial instruments designated at fair value includes all gains and losses from changes in the fair value of financial assets and financial liabilities designated at fair value through profit or loss. Interest income and expense and dividend income arising on those financial instruments are also included in ‘Net income from financial instruments designated at fair value’, except for interest arising from debt securities issued, and derivatives managed in conjunction with debt securities, which is recognized in ‘Interest expense’.
Dividend income is recognized when the right to receive payment is established.
c Segment reporting
Operations are managed according to the main customer groups of the HSBC Group: Retail Banking and Wealth Management, Commercial Banking, Global Banking and Markets and Consumer Finance. Measurement of segment assets, liabilities, income and expenses is based on the bank’s accounting policies. Segment income and expenses include transfers between segments and these transfers are conducted on arm’s length terms and conditions. Shared costs are included in segments on the basis of the actual recharges made.
d Valuation of financial instruments
All financial instruments are recognized initially at fair value. In the normal course of business, the fair value of a financial instrument on initial recognition is the transaction price (that is, the fair value of the consideration given or received). In certain circumstances, however, the fair value will be based on other observable current market transactions in the same instrument, without modification or repackaging, or on a valuation technique whose variables include only data from observable markets, such as interest rate yield curves, option volatilities and currency rates. When such evidence exists, the bank recognizes a trading gain or loss on inception of the financial instrument. When unobservable market data have a significant impact on the valuation of financial instruments, the entire initial difference in fair value indicated by the valuation model from the transaction price is not recognized immediately in the income statement but is recognized over the life of the transaction on an appropriate basis, or when the inputs become observable, or the transaction matures or is closed out, or when the bank enters into an offsetting transaction.
73
74
2 Summary of significant accounting policies (continued)
d Valuation of financial instruments (continued)
Subsequent to initial recognition, the fair values of financial instruments measured at fair value that are quoted in active markets are based on bid prices for assets held and offer prices for liabilities issued. When independent prices are not available, fair values are determined by using valuation techniques which refer to observable market data. These include comparison with similar instruments where market observable prices exist, discounted cash flow analysis, option pricing models and other valuation techniques commonly used by market participants. Fair values of financial instruments may be determined in whole or in part using valuation techniques based on assumptions that are not supported by prices from current market transactions or observable market data, where current prices or observable market data are not available.
Valuation techniques incorporate assumptions about factors that other market participants would use in their valuation, including interest rate yield curves, prepayment and default rates, volatilities and exchange rates. If there are additional factors that are not incorporated within the valuation model but would be considered by market participants, further fair value adjustments may be applied. These fair value adjustments include adjustments for bid-offer spread, model uncertainty, credit risk and model limitation.
If the fair value of a financial asset measured at fair value becomes negative, the financial instrument is recorded as a financial liability until its fair value becomes positive, at which time the financial instrument is recorded as a financial asset.
The fair values of financial liabilities are measured using quoted market prices where available or using valuation techniques. These fair values include market participants’ assessments of the appropriate credit spread to apply to the bank’s liabilities. The amount of change during the period, and cumulatively, in the fair value of designated financial liabilities that is attributable to changes in their credit spread is determined as the amount of change in the fair value that is not attributable to changes in market conditions that give rise to market risk.
e Loans and advances to banks and customers
Loans and advances to banks and customers include loans and advances originated by the bank. Loans and advances are recognized when cash is advanced to borrowers. They are derecognized when either the borrower repays their obligations, or the loans are sold or written off, or substantially all the risks and rewards of ownership are transferred. They are initially recorded at fair value plus any directly attributable transaction costs and are subsequently measured at amortized cost using the effective interest rate method, less impairment losses. Where exposures are hedged by derivatives designated and qualifying as fair value hedges, the carrying value of the loans and advances so hedged includes a fair value adjustment for the hedged risk only.
The bank may commit to underwrite loans on fixed contractual terms for specified periods of time, where the drawdown of the loan is contingent upon certain future events outside the control of the bank.
f Impairment of loans and advances
Losses for impairment are recognized when there is objective evidence that impairment of a loan or portfolio of loans has occurred as a result of a loss event and where the loss event has an impact on the estimated future cash flows of the loan or portfolio of loans. Impairment losses are calculated on individual loans and on groups of loans assessed collectively. Impairment losses are recorded as charges to the income statement. The carrying amount of impaired loans on the statement of financial position is reduced through the use of impairment allowance accounts. Losses expected from future events are not recognized.
Individually assessed loans and advances
The factors considered in determining that a loan is individually significant for the purposes of assessing impairment include:
– the size of the loan;
– the number of loans in the portfolio;
– the importance of the individual loan relationship, and how this is managed; and
– whether the volumes of defaults and losses are sufficient to enable a collective assessment methodology to be applied.
notes on the Consolidated Financial Statements (continued)
H S B C B A N K C A N A D A
74

75
2 Summary of significant accounting policies (continued)
f Impairment of loans and advances (continued)
For all loans that are considered individually significant, the bank assesses on a case-by-case basis at each reporting date whether there is any objective evidence that a loan is impaired. The criteria used by the bank to determine that there is such objective evidence include:
– known cash flow difficulties experienced by the borrower;
– past due contractual payments of either principal or interest;
– breach of loan covenants or conditions;
– the probability that the borrower will enter bankruptcy or other financial realization; and
– a significant downgrading in credit rating by an external credit rating agency.
For those loans where objective evidence of impairment exists, impairment losses are determined by considering the following factors:
– the bank’s aggregate exposure to the customer;
– the viability of the customer’s business model and its capability to trade successfully out of financial difficulties and generate sufficient cash flow to service its debt obligations;
– the amount and timing of expected receipts and recoveries;
– the likely dividend available on liquidation or bankruptcy;
– the extent of other creditors’ commitments ranking ahead of, or pari passu with, the bank and the likelihood of other creditors continuing to support the company;
– the complexity of determining the aggregate amount and ranking of all creditor claims and the extent to which legal and insurance uncertainties are evident;
– the realizable value of security (or other credit mitigants) and likelihood of successful repossession;
– the likely deduction of any costs involved in recovery of amounts outstanding; and
– when available, the secondary market price of the debt.
Impairment losses are calculated by discounting the expected future cash flows of a loan at its original effective interest rate, and comparing the resultant present value with the loan’s current carrying amount. The impairment allowances on individually significant accounts are reviewed at least quarterly and more regularly when circumstances require. This normally encompasses re-assessment of the enforceability of any collateral held and the timing and amount of actual and anticipated receipts. Individually assessed impairment allowances are only released when there is reasonable and objective evidence of a reduction in the established loss estimate.
Collectively assessed loans and advances
Impairment is assessed on a collective basis in two circumstances:
– to cover losses which have been incurred but have not yet been identified on loans subject to individual assessment; and
– for homogeneous groups of loans that are not considered individually significant.
For business and government loans, for which evidence of loss has been specifically identified on an individual basis, the underlying credit metrics, including probability of default, loss given default and exposure at default, for each customer is derived from the bank’s internal rating systems as a basis for determining the collective allowance. Management amends these metrics for some or all borrowers where they consider that the rating system metrics do not fully reflect incurred losses. This judgemental adjustment employs an established framework and references both internal and external indicators of credit quality.
For consumer loans, residential mortgages and credit cards, expected losses are estimated through analysis of historical losses, delinquency migration and write-off trends, supplemented by judgemental adjustments that employ an established framework and reference both internal and external indicators of credit quality.
75
H S B C B A N K C A N A D A
76
2 Summary of significant accounting policies (continued)
f Impairment of loans and advances (continued)
The level of the collective allowance is reassessed each quarter and may fluctuate as a result of changes in portfolio volumes, concentrations and risk; analysis of developing trends in probability of loss, severity of loss and exposure at default factors; and management’s current assessment of indicators that may have affected the condition of the portfolio. The balance of the collective allowance is also analyzed as a function of risk-weighted assets and is also referenced to applicable industry data.
Collective allowances relating to off balance sheet credit instruments such as guarantees and credit commitments are included in other liabilities.
The loan impairment charges and other credit risk provisions is charged to income and comprises the amounts written off during the year, net of recoveries on amounts written off in prior years, and changes in provisions.
Write-off of loans and advances
Loans (and the related impairment allowance accounts) are normally written off, either partially or in full, when there is no realistic prospect of recovery. Where loans are secured, this is generally after receipt of any proceeds from the realization of security. In circumstances where the net realizable value of any collateral has been determined and there is no reasonable expectation of further recovery, write-off may be earlier.
Reversals of impairment
If the amount of an impairment loss decreases in a subsequent period, and the decrease can be related objectively to an event occurring after the impairment was recognized, the excess is written back by reducing the loan impairment allowance account accordingly. The write-back is recognized in the income statement.
Assets acquired in exchange for loans
Non-financial assets acquired in exchange for loans as part of an orderly realization are reported in ‘Other assets’ and at the lower of the carrying amount of the loan (net of any impairment allowance) and its net realizable value at the date of exchange. Any subsequent write-down of the acquired asset to its net realizable value is recognized in the income statement, in ‘Other operating income’. Any subsequent increase in the net realizable value, to the extent this does not exceed the cumulative write-down, is also recognized in ‘Other operating income’, together with any realized gains or losses on disposal. Foreclosed assets that are expected to be held for longer than one year are recorded in accordance with the bank’s accounting policy for such assets.
Renegotiated loans
Loans subject to collective impairment assessment whose terms have been renegotiated are no longer considered past due, but are treated as new loans for measurement purposes once the minimum numbers of payments required under the new arrangements have been received. These renegotiated loans are segregated from other parts of the loan portfolio for the purpose of collective impairment assessment, to reflect their risk profile. Loans subject to individual impairment assessment, whose terms have been renegotiated, are subject to ongoing review to determine whether they remain impaired or should be considered past due.
g Trading assets and trading liabilities
Treasury bills, debt securities, equity shares, acceptances, deposits, debt securities in issue, and short positions in securities are classified as held for trading if they have been acquired principally for the purpose of selling or repurchasing in the near term, or they form part of a portfolio of identified financial instruments that are managed together. These financial assets or financial liabilities are recognized on trade date, when the bank enters into contractual arrangements with counterparties to purchase or sell financial instruments, and are normally derecognized when either sold (assets) or extinguished (liabilities). Measurement is initially at fair value, with transaction costs taken to the income statement. Subsequently their fair values are re-measured, and gains and losses from changes therein are recognized in the income statement in ‘Net trading income’.
notes on the Consolidated Financial Statements (continued)
H S B C B A N K C A N A D A
76
77
2 Summary of significant accounting policies (continued)
h Financial instruments designated at fair value
Financial instruments, other than those held for trading, are classified in this category if they meet the necessary criteria and are so designated by management. The bank may designate financial instruments at fair value when the designation eliminates or significantly reduces measurement or recognition inconsistencies that would otherwise arise from measuring financial assets or financial liabilities, or recognizing gains and losses on them, on different bases. Under this criterion, the main classes of financial instruments designated by the bank are debt securities issued and subordinated debt. The interest payable on certain fixed rate long-term debt securities issued have been matched with the interest on ‘receive fixed/pay variable’ interest rate swaps as part of a documented interest rate risk management strategy. An accounting mismatch would arise if the debt securities issued were accounted for at amortized cost, because the related derivatives are measured at fair value with changes in the fair value recognized in the income statement. By designating the long-term debt at fair value, the movement in the fair value of the long-term debt will also be recognized in the income statement.
The fair value designation, once made, is irrevocable. Designated financial assets and financial liabilities are recognized when the bank enters into the contractual provisions of the arrangements with counterparties, which is generally on trade date, and are normally derecognized when sold (assets) or extinguished (liabilities). Measurement is initially at fair value, with transaction costs taken directly to the income statement. Subsequently, the fair values are re-measured, and gains and losses from changes therein are recognized in ‘Net income from financial instruments designated at fair value’.
i Financial investments
Treasury bills, debt securities and equity shares intended to be held on a continuing basis, other than those designated at fair value, are classified as available-for-sale. Financial investments are recognized on trade date, when the bank enters into contractual arrangements with counterparties to purchase securities, and are normally derecognized when either the securities are sold or the borrowers repay their obligations.
Available-for-sale financial assets are initially measured at fair value plus direct and incremental transaction costs. They are subsequently re-measured at fair value, and changes therein are recognized in other comprehensive income in ‘Available-for-sale investments – fair value gains/(losses)’ until the financial assets are either sold or become impaired. When available-for-sale financial assets are sold, cumulative gains or losses previously recognized in other comprehensive income are recognized in the income statement as ‘Gains less losses from financial investments’.
Interest income is recognized on available-for-sale debt securities using the effective interest rate method, calculated over the asset’s expected life. Premiums and/or discounts arising on the purchase of dated investment securities are included in the calculation of their effective interest rates. Dividends are recognized in the income statement when the right to receive payment has been established.
At each reporting date an assessment is made of whether there is any objective evidence of impairment in the value of a financial asset. Impairment losses are recognized if, and only if, there is objective evidence of impairment as a result of one or more events that occurred after the initial recognition of the financial asset (a ‘loss event’) and that loss event (or events) has an impact on the estimated future cash flows of the financial asset that can be reliably estimated.
If the available-for-sale financial asset is impaired, the difference between the financial asset’s acquisition cost (net of any principal repayments and amortization) and the current fair value, less any previous impairment loss recognized in the income statement, is removed from other comprehensive income and recognized in the income statement.
Impairment losses for available-for-sale debt securities are recognized within ‘Loan impairment charges and other credit risk provisions’ in the income statement and impairment losses for available-for-sale equity securities are recognized within ‘Gains less losses from financial investments’ in the income statement.
77
H S B C B A N K C A N A D A
78
2 Summary of significant accounting policies (continued)
i Financial investments (continued)
Once an impairment loss has been recognized on an available-for-sale financial asset, the subsequent accounting treatment for changes in the fair value of that asset differs depending on the nature of the available-for-sale financial asset concerned:
– for an available-for-sale debt security, a subsequent decline in the fair value of the instrument is recognized in the income statement when there is further objective evidence of impairment as a result of further decreases in the estimated future cash flows of the financial asset. Where there is no further objective evidence of impairment, the decline in fair value of the financial asset is recognized in other comprehensive income. If the fair value of the debt security increases in a subsequent period, and the increase can be objectively related to an event occurring after the impairment loss was recognized in the income statement, the impairment loss is reversed through the income statement to the extent of the increase in fair value.
– for an available-for-sale equity security, all subsequent increases in the fair value of the instrument are treated as a revaluation and are recognized directly in other comprehensive income. Impairment losses recognized on the equity security are not reversed through the income statement. Subsequent decreases in the fair value of the available-for-sale equity security are recognized in the income statement, to the extent that further cumulative impairment losses have been incurred in relation to the acquisition cost of the equity security.
j Sale and repurchase agreements (including stock lending and borrowing)
When securities are sold subject to a commitment to repurchase them at a predetermined price (‘repos’), they remain in the statement of financial position and a liability is recorded in respect of the consideration received. Securities purchased under commitments to sell (‘reverse repos’) are not recognized in the statement of financial position and the consideration paid is recorded in ‘Loans and advances to banks’ or ‘Loans and advances to customers’ as appropriate. The difference between the sale and repurchase price is treated as interest and recognized over the life of the agreement.
Securities lending and borrowing transactions are generally secured, with collateral taking the form of securities or cash advanced or received. The transfer of securities to counterparties under these agreements is not normally reflected in the statement of financial position. Cash collateral advanced or received is recorded as an asset or a liability, respectively.
Securities borrowed are not recognized on the statement of financial position.
k Derivatives and hedge accounting
Derivatives are recognized initially, and are subsequently re-measured, at fair value. Fair values of exchange-traded derivatives are obtained from quoted market prices. Fair values of over-the-counter derivatives are obtained using valuation techniques, including discounted cash flow and option pricing models.
Derivatives are classified as assets when their fair value is positive or as liabilities when their fair value is negative.
The method of recognizing fair value gains or losses depends on whether derivatives are held for trading or are designated as hedging instruments, and if the latter, the nature of the risks being hedged. All gains and losses from changes in the fair value of derivatives held for trading are recognized in the income statement. When derivatives are designated as hedges, the bank classifies them as either: (i) hedges of the change in fair value of recognized assets or liabilities or firm commitments (‘fair value hedges’); or (ii) hedges of the variability in highly probable future cash flows attributable to a recognized asset or liability, or a forecast transaction (‘cash flow hedges’). Hedge accounting is applied to derivatives designated as hedging instruments in a fair value or cash flow hedge provided certain criteria are met.
Hedge accounting
At the inception of a hedging relationship, the bank documents the relationship between the hedging instruments and hedged items, its risk management objective and its strategy for undertaking the hedge. The bank also requires a documented assessment, both at hedge inception and on an ongoing basis, of whether or not the hedging instruments, primarily derivatives, that are used in hedging transactions are highly effective in offsetting the changes attributable to the hedged risks in the fair values or cash flow of the hedged items. Interest on designated qualifying hedges is included in ‘Net interest income’.
notes on the Consolidated Financial Statements (continued)
H S B C B A N K C A N A D A
78

79
2 Summary of significant accounting policies (continued)
k Derivatives and hedge accounting (continued)
Hedge accounting (continued)
Fair value hedge
Changes in the fair value of derivatives that are designated and qualify as fair value hedging instruments are recorded in the income statement, along with changes in the fair value of the hedged assets, liabilities or bank thereof that are attributable to the hedged risk.
If a hedging relationship no longer meets the criteria for hedge accounting, the cumulative adjustment to the carrying amount of the hedged item is amortized to the income statement based on a recalculated effective interest rate over the residual period to maturity, unless the hedged item has been derecognized, in which case it is released to the income statement immediately.
Cash flow hedge
The effective portion of changes in the fair value of derivatives that are designated and qualify as cash flow hedges is recognized in other comprehensive income within the ‘Cash flow hedging reserve’. Any gain or loss in fair value relating to an ineffective portion is recognized immediately in the income statement. The accumulated gains and losses recognized in other comprehensive income are reclassified to the income statement in the periods in which the hedged item will affect profit or loss.
When a hedging instrument expires or is sold, or when a hedge no longer meets the criteria for hedge accounting, any cumulative gain or loss existing in other comprehensive income at that time remains separately in equity until the forecast transaction is eventually recognized in the income statement. When a forecasted transaction is no longer expected to occur, the cumulative gain or loss that was reported in other comprehensive income is immediately reclassified to the income statement.
Hedge effectiveness testing
To qualify for hedge accounting, the bank requires that, at the inception of the hedge and throughout its life, each hedge must be expected to be highly effective (prospective effectiveness) and demonstrate actual effectiveness (retrospective effectiveness) on an ongoing basis.
The documentation of each hedging relationship sets out how the effectiveness of the hedge is assessed. The method the bank adopts for assessing hedge effectiveness will depend on its risk management strategy.
For prospective effectiveness the hedging instrument must be expected to be highly effective in offsetting changes in fair value or cash flows attributable to the hedged risk during the period for which the hedge is designated. For actual effectiveness to be achieved, the changes in fair value or cash flows must offset each other in the range of 80% to 125%.
Hedge ineffectiveness is recognized in the income statement in ‘Net trading income’.
Derivatives that do not qualify for hedge accounting
All gains and losses from changes in the fair values of derivatives that do not qualify for hedge accounting are recognized immediately in the income statement. These gains and losses are reported in ‘Net trading income’, except where derivatives are managed in conjunction with financial instruments designated at fair value (other than derivatives managed in conjunction with debt securities issued by the bank), in which case gains and losses are reported in ‘Net income from financial instruments designated at fair value’. The interest on derivatives managed in conjunction with debt securities issued by the bank which are designated at fair value is recognized in ‘Interest expense’. All other gains and losses on these derivatives are reported in ‘Net income from financial instruments designated at fair value’.
79
H S B C B A N K C A N A D A
80
2 Summary of significant accounting policies (continued)
l Derecognition of financial assets and liabilities
Financial assets are derecognized when the contractual right to receive cash flows from the assets has expired; or when the bank has transferred its contractual right to receive the cash flows of the financial assets, and either:
– substantially all the risks and rewards of ownership have been transferred; or
– the bank has neither retained nor transferred substantially all the risks and rewards, but has not retained control.
Financial liabilities are derecognized when they are extinguished, that is when the obligation is discharged, cancelled or expires.
m Offsetting financial assets and financial liabilities
Financial assets and financial liabilities are offset and the net amount reported in the statement of financial position when there is a legally enforceable right to offset the recognized amounts and there is an intention to settle on a net basis, or realize the asset and settle the liability simultaneously.
n Associates
The bank classifies investments in entities over which it has significant influence, but does not control, as associates. For the purpose of determining this classification, control is considered to be the power to govern the financial and operating policies of an entity so as to obtain benefits from its activities.
Investments in associates are recognized using the equity method. Under this method, such investments are initially stated at cost, including attributable goodwill, and are adjusted thereafter for the post-acquisition change in the bank’s share of net assets, less dividends or distributions received.
Profits on transactions between the bank and its associates are eliminated to the extent of the bank’s interest in the respective associates. Losses are also eliminated to the extent of the bank’s interest in the associates unless the transaction provides evidence of an impairment of the asset transferred.
o Goodwill and intangible assets
i) Goodwill arises on acquisition of subsidiaries, when the aggregate of the fair value of the consideration transferred, the amount of any non-controlling interest and the fair value of any previously held equity interest in the acquiree exceeds the amounts of identifiable assets and liabilities acquired. If they do not exceed the amounts of the identifiable assets and liabilities of an acquired business, the difference is recognized immediately in the income statement.
Intangible assets are recognized separately from goodwill when they are separable or arise from contractual or other legal rights, and their fair value can be measured reliably.
Goodwill is allocated to cash-generating units for the purpose of impairment testing, which is undertaken at the lowest level at which goodwill is monitored for internal management purposes. Impairment testing is performed at least annually, and whenever there is an indication that the cash-generating unit may be impaired, by comparing the recoverable amount from a cash-generating unit with the carrying amount of its net assets, including attributable goodwill. The recoverable amount of an asset is the higher of its fair value less cost to sell, and its value in use. Value in use is the present value of the expected future cash flows from a cash-generating unit. If the recoverable amount is less than carrying value, an impairment loss is charged to the income statement. Goodwill is stated at cost less accumulated impairment losses.
At the date of disposal of a business, attributable goodwill is included in the bank’s share of net assets in the calculation of the gain or loss on disposal.
notes on the Consolidated Financial Statements (continued)
H S B C B A N K C A N A D A
80

81
2 Summary of significant accounting policies (continued)
o Goodwill and intangible assets (continued)
ii) The bank’s intangible assets are comprised of internally generated computer software and purchased software with finite useful lives. The cost of internally generated software comprises all directly attributable costs necessary to create, produce and prepare the software to be capable of operating in the manner intended by management. Costs incurred in the ongoing maintenance of software are expensed immediately as incurred.
Intangible assets are subject to impairment review if there are events or circumstances that indicate the carrying amount may not be recoverable. Intangible assets that have an indefinite useful life, or are not yet ready for use, are tested for impairment annually. This impairment test may be performed at any time during the year, provided it is performed at the same time every year. An intangible asset recognized during the current period is tested before the end of the current year. Intangible assets that have a finite useful life are stated at cost less amortization and accumulated impairment losses and are amortized over their estimated useful lives. Intangible assets with finite useful lives are amortized, generally on a straight-line basis, over their useful lives as follows:
– internally generated software between 3 and 5 years
– purchased software between 3 and 5 years
p Property, plant and equipment
Land and buildings are stated at historical cost or fair value at the Parent’s date of transition to IFRS (‘deemed cost’), less any impairment losses and depreciation calculated to write off the assets over their estimated useful lives as follows:
– land is not depreciated;
– buildings are depreciated over their estimated useful lives (between 20 and 40 years); and
– leasehold improvements are depreciated over the shorter of their lease term or over their estimated remaining useful lives.
Equipment, fixtures and fittings (including equipment on operating leases where the bank is the lessor) are stated at cost less any impairment losses and depreciation calculated on a straight-line basis to write off the assets over their useful lives, which are generally between 3 and 5 years.
Property, plant and equipment is subject to an impairment review if there are events or changes in circumstances which indicate that the carrying amount may not be recoverable.
Gains and losses on disposal are recorded in ‘Other operating income’ in the year of disposal.
Investment properties are included in the statement of financial position at fair value with changes therein recognized in the income statement in the period of change. Fair values are determined by independent professional valuators who apply recognized valuation techniques.
q Finance and operating leases
Agreements which transfer to counterparties substantially all the risks and rewards incidental to the ownership of assets, but not necessarily legal title, are classified as finance leases. When the bank is a lessor under finance leases the amounts due under the leases, after deduction of unearned charges, are included in ‘Loans and advances to banks’ or ‘Loans and advances to customers’, as appropriate. The finance income receivable is recognized in ‘Net interest income’ over the periods of the leases so as to give a constant rate of return on the net investment in the leases.
All other leases are classified as operating leases. When acting as lessor, the bank includes the assets subject to operating leases in ‘Property, plant and equipment’ and accounts for them accordingly. Impairment losses are recognized to the extent that residual values are not fully recoverable and the carrying value of the assets is thereby impaired. When the bank is the lessee, leased assets are not recognized on the statement of financial position. Rentals payable and receivable under operating leases are accounted for on a straight-line basis over the periods of the leases and are included in ‘General and administrative expenses’ and ‘Other operating income’ respectively.
81
H S B C B A N K C A N A D A
82
2 Summary of significant accounting policies (continued)
r Income tax
Income tax comprises current tax and deferred tax. Income tax is recognized in the income statement except to the extent that it relates to items recognized in other comprehensive income or directly in equity, in which case it is recognized in the same statement in which the related item appears.
Current tax is the tax expected to be payable on the taxable profit for the year, calculated using tax rates enacted or substantively enacted by the reporting date, and any adjustment to tax payable in respect of previous years. Current tax assets and liabilities are offset when the bank intends to settle on a net basis and the legal right to offset exists.
Deferred tax is recognized on temporary differences between the carrying amounts of assets and liabilities in the statement of financial position and the amounts attributed to such assets and liabilities for tax purposes. Deferred tax liabilities are generally recognized for all taxable temporary differences and deferred tax assets are recognized to the extent that it is probable that future taxable profits will be available against which deductible temporary differences can be utilized.
Deferred tax is calculated using the tax rates expected to apply in the periods in which the assets will be realized or the liabilities settled based on tax rates and laws enacted, or substantively enacted, by the reporting date. Deferred tax assets and liabilities are offset when they arise in the same tax reporting entity and relate to income taxes levied by the same taxation authority, and when the bank has a legal right to offset.
Deferred tax relating to actuarial gains and losses on post-employment benefits is recognized directly in other comprehensive income. Deferred tax relating to fair value re-measurement of available-for-sale investments and cash flow hedging instruments are charged or credited directly to other comprehensive income, and are subsequently recognized in the income statement when the deferred fair value gain or loss is recognized in the income statement.
s Pension and other post-employment benefits
The bank operates a number of pension and other post-employment benefit plans. These plans include both defined benefit and defined contribution plans and various other post-employment benefits such as post employment healthcare. The post-retirement plans include supplemental pension arrangements that provide pension benefits in excess of the benefits provided by the pension plans, and post-retirement, non-pension arrangements that provide certain benefits in retirement. The pension plans are funded by contributions from the bank or its employees, while the supplemental pension arrangements are not funded.
Payments to defined contribution plans are charged as an expense as they fall due.
The defined benefit pension costs and the present value of defined benefit obligations are calculated on the reporting date by the scheme’s actuaries using the projected unit credit method. The net charge to the income statement mainly comprises the current service cost, plus the unwinding of the discount rate on plan liabilities, less the expected return on plan assets, and is presented in operating expenses. Past service costs are charged immediately to the income statement to the extent that the benefits have vested, and are otherwise recognized on a straight-line basis over the average period until the benefits vest. Actuarial gains and losses comprise experience adjustments (the effects of differences between the previous actuarial assumptions and what has actually occurred), as well as the effects of changes in actuarial assumptions. Actuarial gains and losses are recognized in other comprehensive income in the period in which they arise.
The defined benefit liability recognized in the statement of financial position represents the present value of defined benefit obligations adjusted for unrecognized past service costs and reduced by the fair value of plan assets. Any net defined benefit surplus is limited to unrecognized past service costs plus the present value of available refunds and reductions in future contributions to the plan.
The costs of obligations arising from other defined post-employment benefits plans, such as defined benefit healthcare plans, are accounted for on the same basis as defined benefit pension plans.
notes on the Consolidated Financial Statements (continued)
H S B C B A N K C A N A D A
82
83
2 Summary of significant accounting policies (continued)
t Share-based payments
The cost of share-based payment arrangements with employees is measured by reference to the fair value of equity instruments on the date they are granted, and recognized as an expense on a straight-line basis over the vesting period, with a corresponding credit to retained earnings. The vesting period is the period during which all the specified vesting conditions of a share-based payment arrangement are to be satisfied. The fair value of equity instruments that are made available immediately, with no vesting period attached to the award, are expensed immediately.
Fair value is determined by using appropriate valuation models, taking into account the terms and conditions upon which the equity instruments were granted. Vesting conditions include service conditions and performance conditions. Market performance conditions are taken into account when estimating the fair value of equity instruments at the date of grant, so that an award is treated as vesting irrespective of whether the market performance condition or non-vesting condition is satisfied, provided all other conditions are satisfied.
Vesting conditions, other than market performance conditions, are not taken into account in the initial estimate of the fair value at the grant date. They are taken into account by adjusting the number of equity instruments included in the measurement of the transaction, so that the amount recognized for services received as consideration for the equity instruments granted shall be based on the number of equity instruments that eventually vest.
Where an award has been modified, as a minimum the expense of the original award continues to be recognized as if it had not been modified. Where the effect of a modification is to increase the fair value of an award or increase the number of equity instruments, the incremental fair value of the award or incremental fair value of the extra equity instruments is recognized in addition to the expense of the original grant, measured at the date of modification, over the modified vesting period.
A cancellation that occurs during the vesting period is treated as an acceleration of vesting, and recognized immediately for the amount that would otherwise have been recognized for services over the vesting period.
HSBC Holdings is the grantor of its equity instruments for all share awards and share options across the group. The credit to ‘Retained earnings’ on expensing an award represents the effective capital contribution from HSBC Holdings. To the extent the bank will be, or has been, required to fund a share-based payment arrangement, this capital contribution is reduced and the fair value of shares expected to be released to employees is recorded within ‘Other liabilities’.
u Foreign currencies
Transactions in foreign currencies are recorded in the functional currency at the rate of exchange prevailing on the date of the transaction. Monetary assets and liabilities denominated in foreign currencies are translated into the functional currency at the rate of exchange in effect at the statement of financial position date. Any resulting exchange differences are included in the income statement.
Non-monetary assets and liabilities measured at fair value in a foreign currency are translated into the functional currency using the rate of exchange at the date the fair value was determined. Any exchange component of a gain or loss on a non-monetary item is recognized in other comprehensive income if the gain or loss on the non-monetary item is recognized in other comprehensive income. Any exchange component of a gain or loss on a non-monetary item is recognized in the income statement if the gain or loss on the non-monetary item is recognized in the income statement.
v Provisions
Provisions are recognized when it is probable that an outflow of economic benefits will be required to settle a current legal or constructive obligation, which has arisen as a result of past events, and for which a reliable estimate can be made of the amount of the obligation.
Contingent liabilities, which include certain guarantees and letters of credit pledged as collateral security, are possible obligations that arise from past events whose existence will be confirmed only by the occurrence, or non-occurrence, of one or more uncertain future events not wholly within the control of the bank; or are present obligations that have arisen from past events but are not recognized because it is not probable that settlement will require outflow of economic benefits, or because the amount of the obligations cannot be reliably measured. Contingent liabilities are not recognized in the financial statements but are disclosed unless the probability of settlement is remote.
83

H S B C B A N K C A N A D A
84
2 Summary of significant accounting policies (continued)
w Financial guarantee contracts
Liabilities under financial guarantee contracts are recorded initially at their fair value, which is generally the fee received or receivable. Subsequently, the financial guarantee liabilities are measured at the higher of the initial fair value, less cumulative amortization, and the best estimate of the expenditure required to settle the obligations.
x Debt securities in issue and deposits by customers and banks
Financial liabilities are recognized when the bank enters into the contractual provisions of the arrangements with counterparties, which is generally on trade date, and initially measured at fair value, which are normally the proceeds received net of directly attributable transaction costs incurred. Subsequent measurement of financial liabilities, other than those measured at fair value through profit or loss and financial guarantees, is at amortized cost, using the effective interest rate method to amortize the difference between proceeds received, net of directly attributable transaction costs incurred, and the redemption amount over the expected life of the instrument.
Debt securities issued are debts for which transferable certificates have been issued. Debt securities in issue also include secured borrowings arising from securitization transactions.
y Share capital and other equity instruments
Shares are classified as equity when there is no contractual obligation to transfer cash or other financial assets.
z Cash and cash equivalents
For the purpose of the statement of cash flows, cash and cash equivalents include highly liquid investments that are readily convertible to known amounts of cash and which are subject to an insignificant risk of change in value. Such investments are normally those with less than three months’ maturity from the date of acquisition, and include cash and balances at central bank, debt securities, loans and advances to banks, items in the course of collection from or in transmission to other banks and certificates of deposit.
notes on the Consolidated Financial Statements (continued)
H S B C B A N K C A N A D A
84
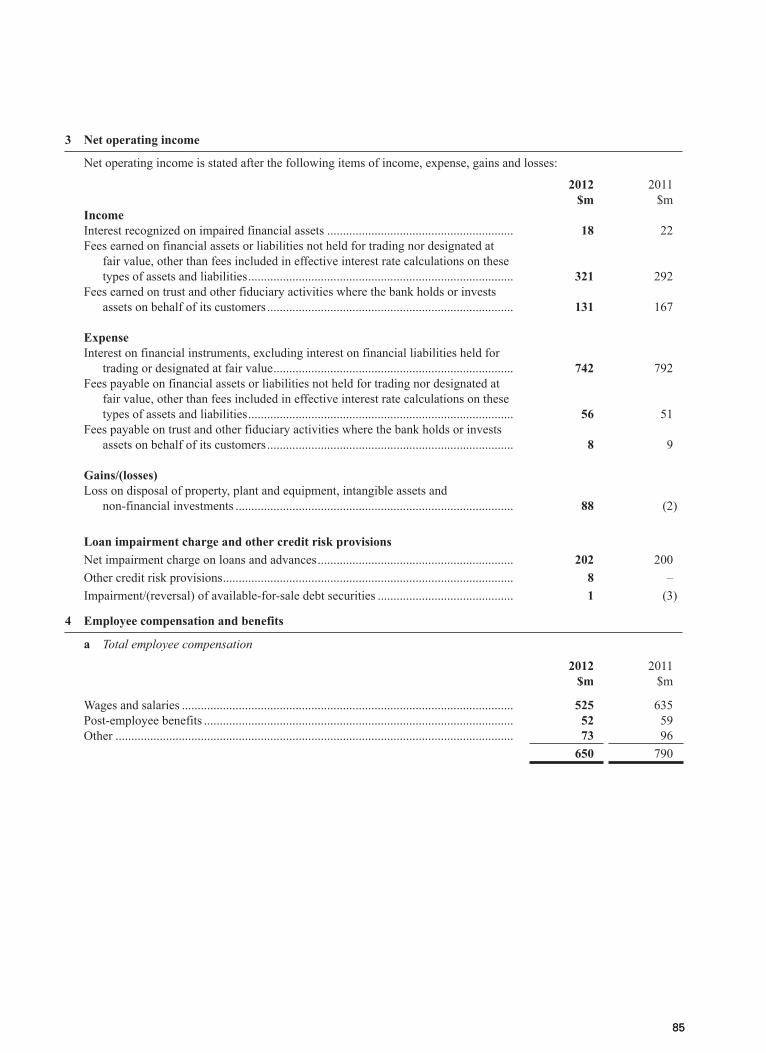
85
3 Net operating income
Net operating income is stated after the following items of income, expense, gains and losses:
2012 $m
2011 $m
IncomeInterest recognized on impaired financial assets ........................................................... 18 22Fees earned on financial assets or liabilities not held for trading nor designated at
fair value, other than fees included in effective interest rate calculations on these types of assets and liabilities .................................................................................... 321 292
Fees earned on trust and other fiduciary activities where the bank holds or invests assets on behalf of its customers .............................................................................. 131 167
ExpenseInterest on financial instruments, excluding interest on financial liabilities held for
trading or designated at fair value ............................................................................ 742 792Fees payable on financial assets or liabilities not held for trading nor designated at
fair value, other than fees included in effective interest rate calculations on these types of assets and liabilities .................................................................................... 56 51
Fees payable on trust and other fiduciary activities where the bank holds or invests assets on behalf of its customers .............................................................................. 8 9
Gains/(losses)Loss on disposal of property, plant and equipment, intangible assets and
non-financial investments ........................................................................................ 88 (2)
Loan impairment charge and other credit risk provisionsNet impairment charge on loans and advances .............................................................. 202 200Other credit risk provisions ............................................................................................ 8 –Impairment/(reversal) of available-for-sale debt securities ........................................... 1 (3)
4 Employee compensation and benefits
a Total employee compensation
2012 $m
2011 $m
Wages and salaries ......................................................................................................... 525 635Post-employee benefits .................................................................................................. 52 59Other .............................................................................................................................. 73 96
650 790
85
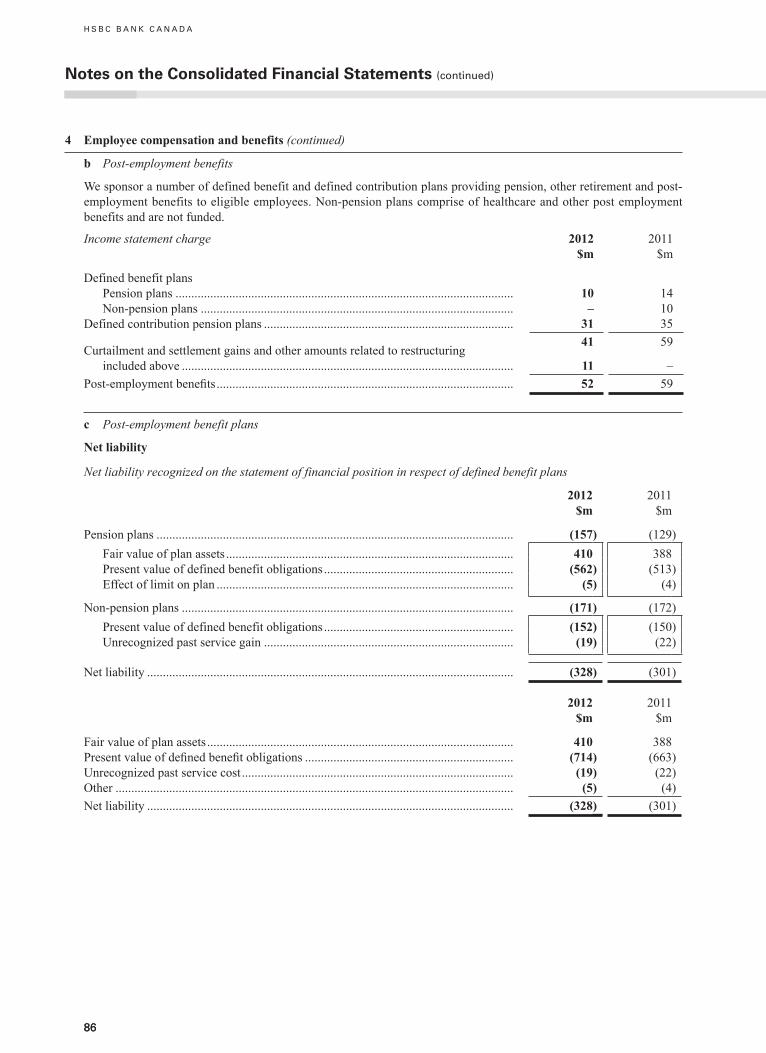
86
4 Employee compensation and benefits (continued)
b Post-employment benefits
We sponsor a number of defined benefit and defined contribution plans providing pension, other retirement and post-employment benefits to eligible employees. Non-pension plans comprise of healthcare and other post employment benefits and are not funded.
Income statement charge 2012 $m
2011 $m
Defined benefit plans Pension plans ........................................................................................................... 10 14 Non-pension plans ................................................................................................... – 10Defined contribution pension plans ............................................................................... 31 35
41 59Curtailment and settlement gains and other amounts related to restructuring
included above ......................................................................................................... 11 –Post-employmentbenefits .............................................................................................. 52 59
c Post-employment benefit plans
Net liability
Net liability recognized on the statement of financial position in respect of defined benefit plans
2012 $m
2011 $m
Pension plans ................................................................................................................. (157) (129) Fair value of plan assets ........................................................................................... 410 388 Present value of defined benefit obligations ............................................................ (562) (513) Effect of limit on plan .............................................................................................. (5) (4)
Non-pension plans ......................................................................................................... (171) (172) Present value of defined benefit obligations ............................................................ (152) (150) Unrecognized past service gain ............................................................................... (19) (22)
Net liability .................................................................................................................... (328) (301)
2012 $m
2011 $m
Fair value of plan assets ................................................................................................. 410 388Presentvalueofdefinedbenefitobligations .................................................................. (714) (663)Unrecognized past service cost ...................................................................................... (19) (22)Other .............................................................................................................................. (5) (4)Net liability .................................................................................................................... (328) (301)
notes on the Consolidated Financial Statements (continued)
H S B C B A N K C A N A D A
86
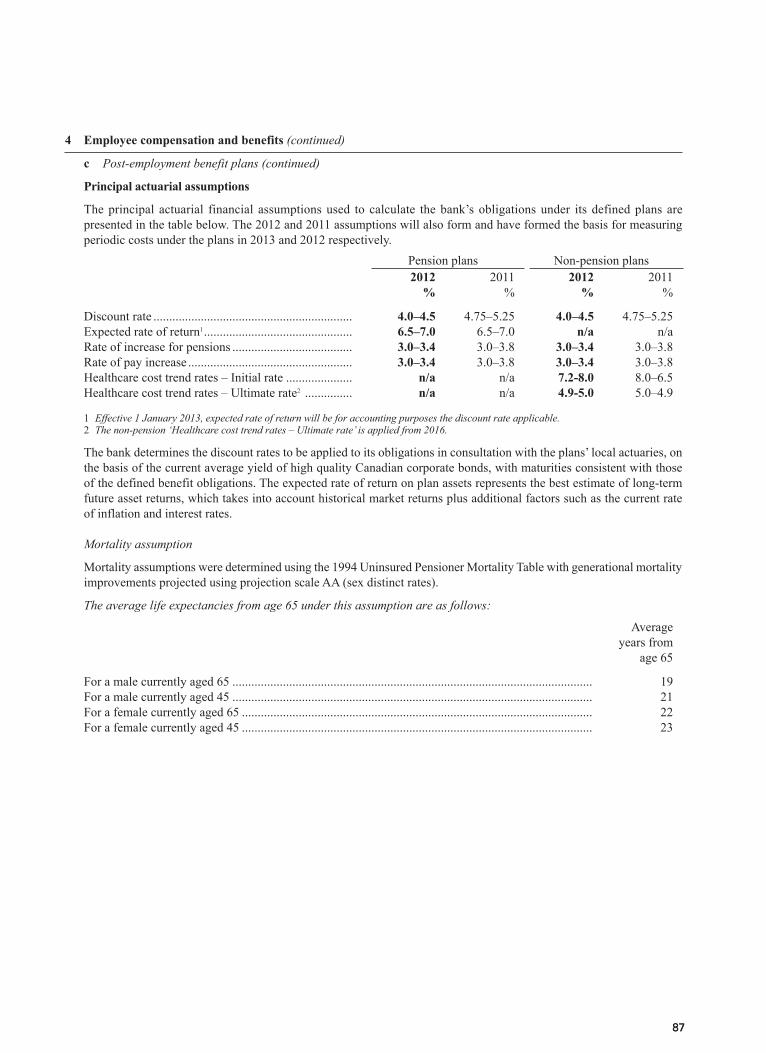
87
4 Employee compensation and benefits (continued)
c Post-employment benefit plans (continued)
Principal actuarial assumptions
The principal actuarial financial assumptions used to calculate the bank’s obligations under its defined plans are presented in the table below. The 2012 and 2011 assumptions will also form and have formed the basis for measuring periodic costs under the plans in 2013 and 2012 respectively.
Pension plans Non-pension plans2012
%2011
%2012
%2011
%
Discount rate ............................................................... 4.0–4.5 4.75–5.25 4.0–4.5 4.75–5.25Expected rate of return1 ............................................... 6.5–7.0 6.5–7.0 n/a n/aRate of increase for pensions ...................................... 3.0–3.4 3.0–3.8 3.0–3.4 3.0–3.8Rate of pay increase .................................................... 3.0–3.4 3.0–3.8 3.0–3.4 3.0–3.8Healthcare cost trend rates – Initial rate ..................... n/a n/a 7.2-8.0 8.0–6.5Healthcare cost trend rates – Ultimate rate2 ............... n/a n/a 4.9-5.0 5.0–4.9
1 Effective 1 January 2013, expected rate of return will be for accounting purposes the discount rate applicable.2 The non-pension ‘Healthcare cost trend rates – Ultimate rate’ is applied from 2016.
The bank determines the discount rates to be applied to its obligations in consultation with the plans’ local actuaries, on the basis of the current average yield of high quality Canadian corporate bonds, with maturities consistent with those of the defined benefit obligations. The expected rate of return on plan assets represents the best estimate of long-term future asset returns, which takes into account historical market returns plus additional factors such as the current rate of inflation and interest rates.
Mortality assumption
Mortality assumptions were determined using the 1994 Uninsured Pensioner Mortality Table with generational mortality improvements projected using projection scale AA (sex distinct rates).
The average life expectancies from age 65 under this assumption are as follows:
Average years from
age 65
For a male currently aged 65 .................................................................................................................. 19For a male currently aged 45 .................................................................................................................. 21For a female currently aged 65 ............................................................................................................... 22For a female currently aged 45 ............................................................................................................... 23
87
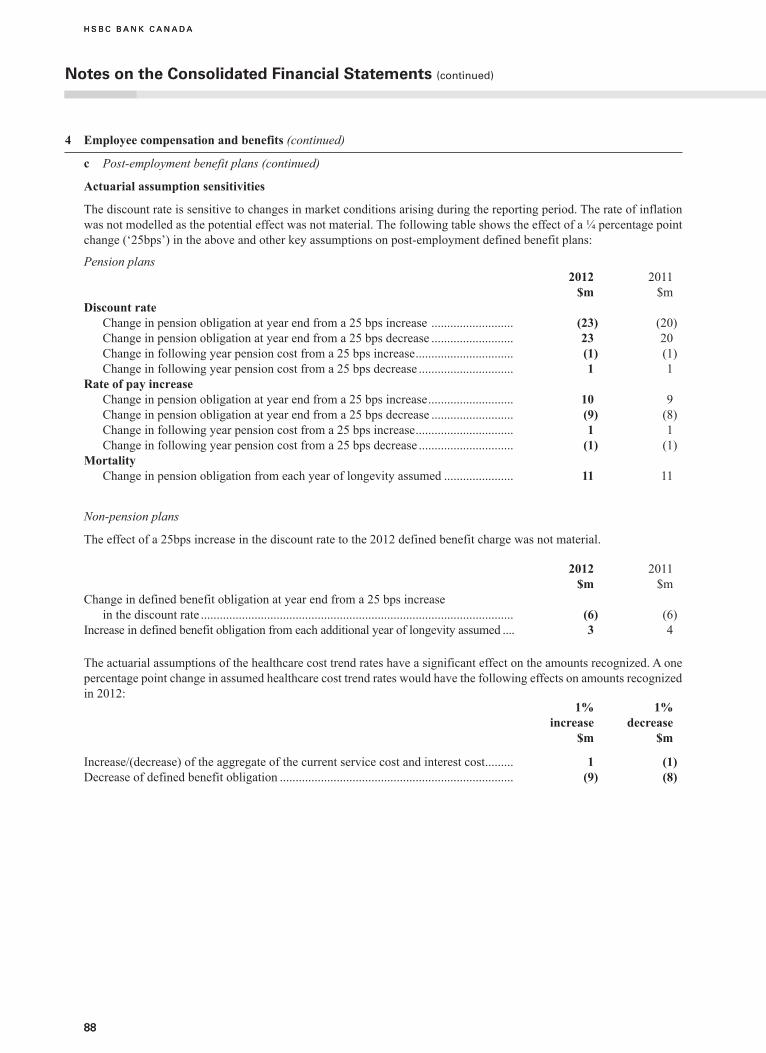
H S B C B A N K C A N A D A
88
4 Employee compensation and benefits (continued)
c Post-employment benefit plans (continued)
Actuarial assumption sensitivities
The discount rate is sensitive to changes in market conditions arising during the reporting period. The rate of inflation was not modelled as the potential effect was not material. The following table shows the effect of a ¼ percentage point change (‘25bps’) in the above and other key assumptions on post-employment defined benefit plans:
Pension plans 2012
$m2011
$mDiscount rate Change in pension obligation at year end from a 25 bps increase .......................... (23) (20) Change in pension obligation at year end from a 25 bps decrease .......................... 23 20 Change in following year pension cost from a 25 bps increase ............................... (1) (1) Change in following year pension cost from a 25 bps decrease .............................. 1 1Rate of pay increase
Change in pension obligation at year end from a 25 bps increase ........................... 10 9Change in pension obligation at year end from a 25 bps decrease .......................... (9) (8)Change in following year pension cost from a 25 bps increase ............................... 1 1Change in following year pension cost from a 25 bps decrease .............................. (1) (1)
MortalityChange in pension obligation from each year of longevity assumed ...................... 11 11
Non-pension plans
The effect of a 25bps increase in the discount rate to the 2012 defined benefit charge was not material.
2012 $m
2011 $m
Change in defined benefit obligation at year end from a 25 bps increase in the discount rate ................................................................................................... (6) (6)
Increase in defined benefit obligation from each additional year of longevity assumed .... 3 4
The actuarial assumptions of the healthcare cost trend rates have a significant effect on the amounts recognized. A one percentage point change in assumed healthcare cost trend rates would have the following effects on amounts recognized in 2012:
1% increase
$m
1% decrease
$m
Increase/(decrease) of the aggregate of the current service cost and interest cost ......... 1 (1)Decrease of defined benefit obligation .......................................................................... (9) (8)
notes on the Consolidated Financial Statements (continued)
H S B C B A N K C A N A D A
88
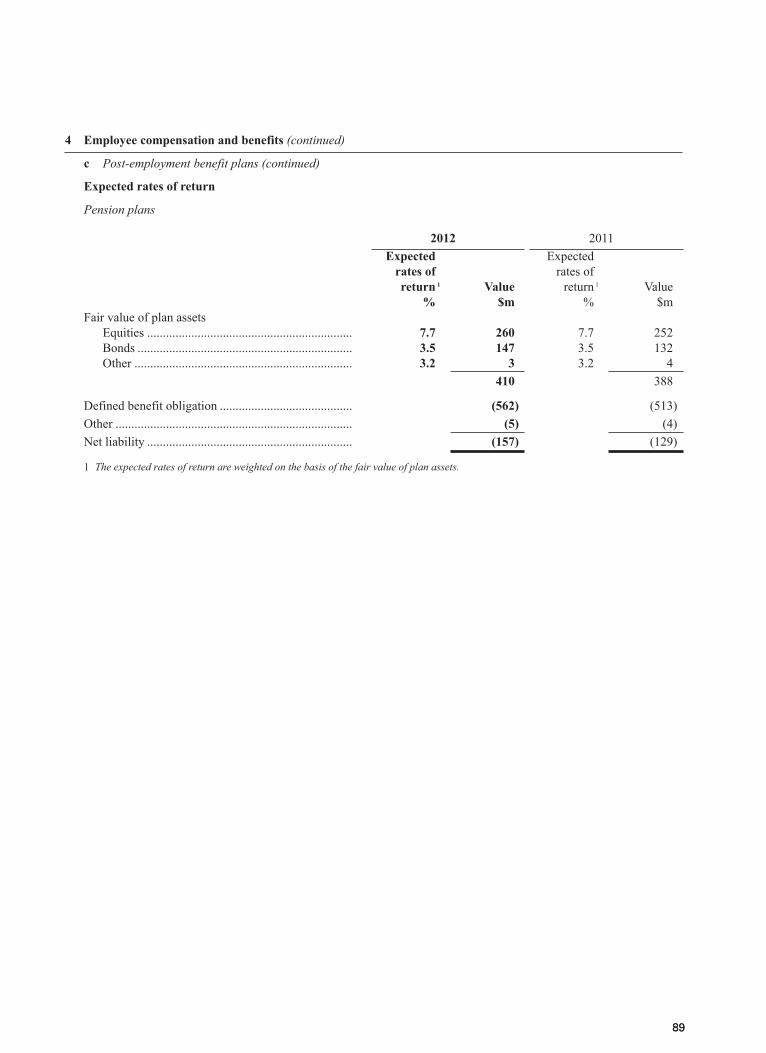
89
4 Employee compensation and benefits (continued)
c Post-employment benefit plans (continued)
Expected rates of return
Pension plans
2012 2011Expected
rates of return 1 Value
Expected rates of
return 1 Value% $m % $m
Fair value of plan assetsEquities ................................................................. 7.7 260 7.7 252Bonds .................................................................... 3.5 147 3.5 132Other ..................................................................... 3.2 3 3.2 4
410 388
Defined benefit obligation .......................................... (562) (513)Other ........................................................................... (5) (4)Net liability ................................................................. (157) (129)
1 The expected rates of return are weighted on the basis of the fair value of plan assets.
89
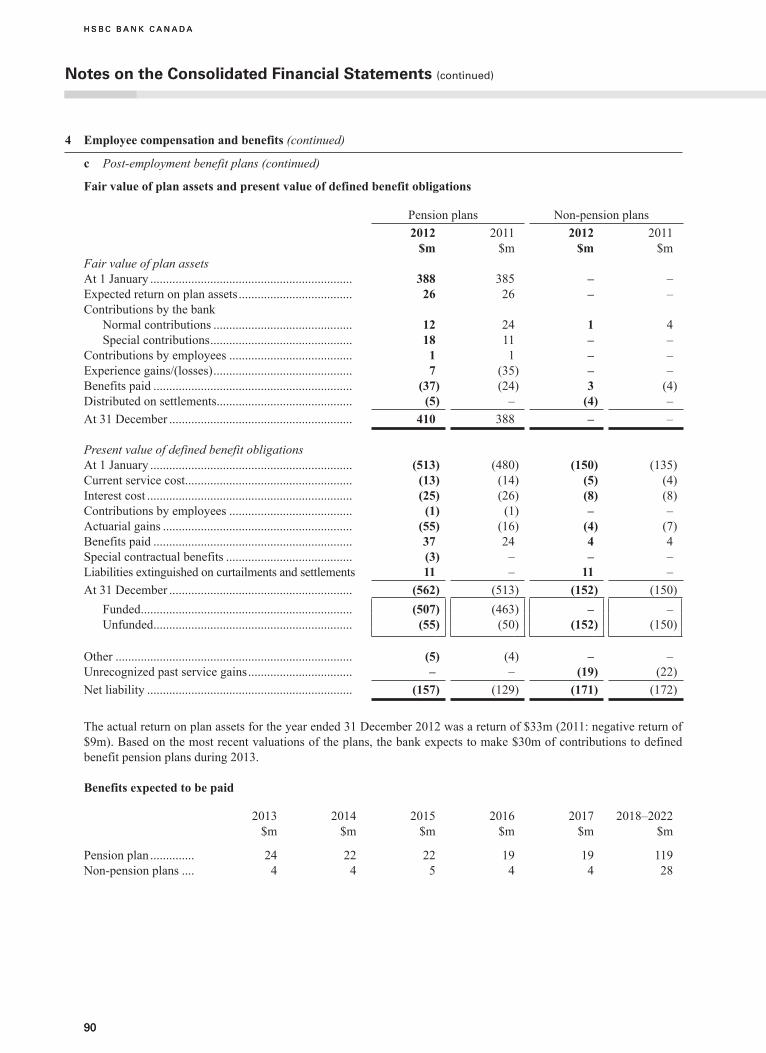
H S B C B A N K C A N A D A
90
4 Employee compensation and benefits (continued)
c Post-employment benefit plans (continued)
Fair value of plan assets and present value of defined benefit obligations
Pension plans Non-pension plans2012
$m2011
$m2012
$m2011
$mFair value of plan assetsAt 1 January ................................................................ 388 385 – –Expected return on plan assets .................................... 26 26 – –Contributions by the bank
Normal contributions ............................................ 12 24 1 4Special contributions ............................................. 18 11 – –
Contributions by employees ....................................... 1 1 – –Experience gains/(losses) ............................................ 7 (35) – –Benefits paid ............................................................... (37) (24) 3 (4)Distributed on settlements ........................................... (5) – (4) –At 31 December .......................................................... 410 388 – –
Present value of defined benefit obligationsAt 1 January ................................................................ (513) (480) (150) (135)Current service cost ..................................................... (13) (14) (5) (4)Interest cost ................................................................. (25) (26) (8) (8)Contributions by employees ....................................... (1) (1) – –Actuarial gains ............................................................ (55) (16) (4) (7)Benefits paid ............................................................... 37 24 4 4Special contractual benefits ........................................ (3) – – –Liabilities extinguished on curtailments and settlements 11 – 11 –At 31 December .......................................................... (562) (513) (152) (150)
Funded ................................................................... (507) (463) – –Unfunded ............................................................... (55) (50) (152) (150)
Other ........................................................................... (5) (4) – –Unrecognized past service gains ................................. – – (19) (22)Net liability ................................................................. (157) (129) (171) (172)
The actual return on plan assets for the year ended 31 December 2012 was a return of $33m (2011: negative return of $9m). Based on the most recent valuations of the plans, the bank expects to make $30m of contributions to defined benefit pension plans during 2013.
Benefits expected to be paid
2013 $m
2014 $m
2015 $m
2016 $m
2017 $m
2018–2022 $m
Pension plan .............. 24 22 22 19 19 119Non-pension plans .... 4 4 5 4 4 28
notes on the Consolidated Financial Statements (continued)
H S B C B A N K C A N A D A
90
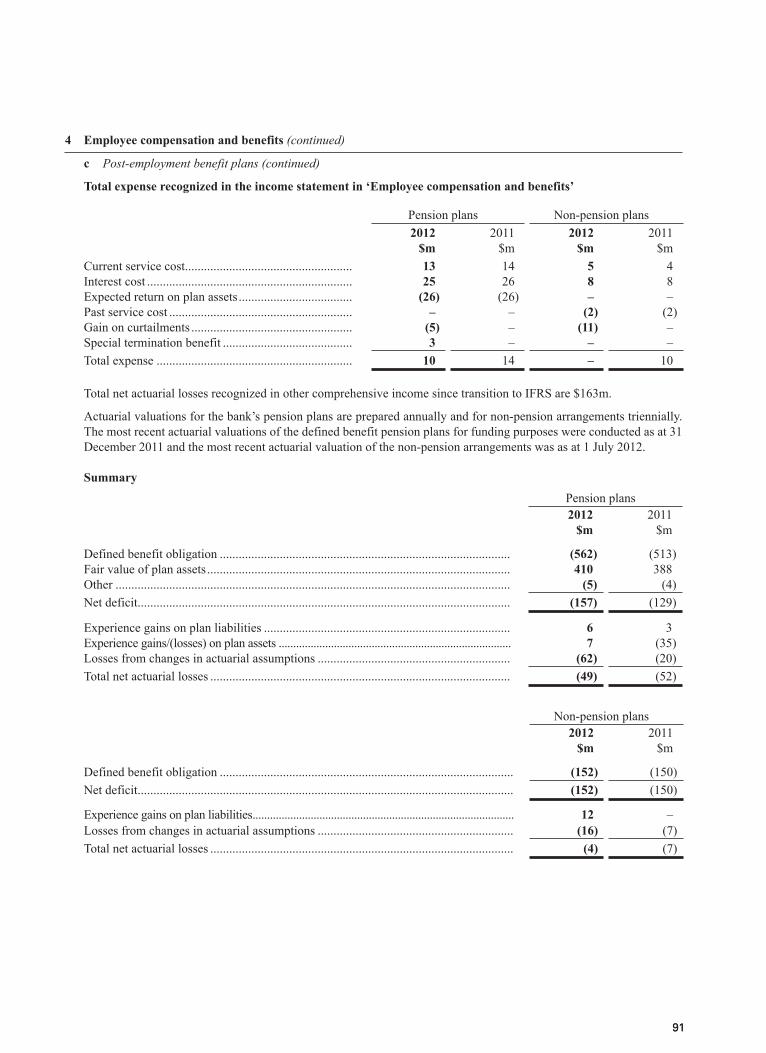
91
4 Employee compensation and benefits (continued)
c Post-employment benefit plans (continued)
Total expense recognized in the income statement in ‘Employee compensation and benefits’
Pension plans Non-pension plans2012
$m2011
$m2012
$m2011
$mCurrent service cost ..................................................... 13 14 5 4Interest cost ................................................................. 25 26 8 8Expected return on plan assets .................................... (26) (26) – –Past service cost .......................................................... – – (2) (2)Gain on curtailments ................................................... (5) – (11) –Special termination benefit ......................................... 3 – – –Total expense .............................................................. 10 14 – 10
Total net actuarial losses recognized in other comprehensive income since transition to IFRS are $163m.
Actuarial valuations for the bank’s pension plans are prepared annually and for non-pension arrangements triennially. The most recent actuarial valuations of the defined benefit pension plans for funding purposes were conducted as at 31 December 2011 and the most recent actuarial valuation of the non-pension arrangements was as at 1 July 2012.
SummaryPension plans2012
$m2011
$m
Defined benefit obligation ............................................................................................ (562) (513)Fair value of plan assets ................................................................................................ 410 388Other ............................................................................................................................. (5) (4)Net deficit ...................................................................................................................... (157) (129)
Experience gains on plan liabilities .............................................................................. 6 3Experience gains/(losses) on plan assets ................................................................................ 7 (35)Losses from changes in actuarial assumptions ............................................................. (62) (20)Total net actuarial losses ............................................................................................... (49) (52)
Non-pension plans2012
$m2011
$m
Defined benefit obligation ............................................................................................. (152) (150)Net deficit ....................................................................................................................... (152) (150)
Experience gains on plan liabilities .......................................................................................... 12 –Losses from changes in actuarial assumptions .............................................................. (16) (7)Total net actuarial losses ................................................................................................ (4) (7)
91
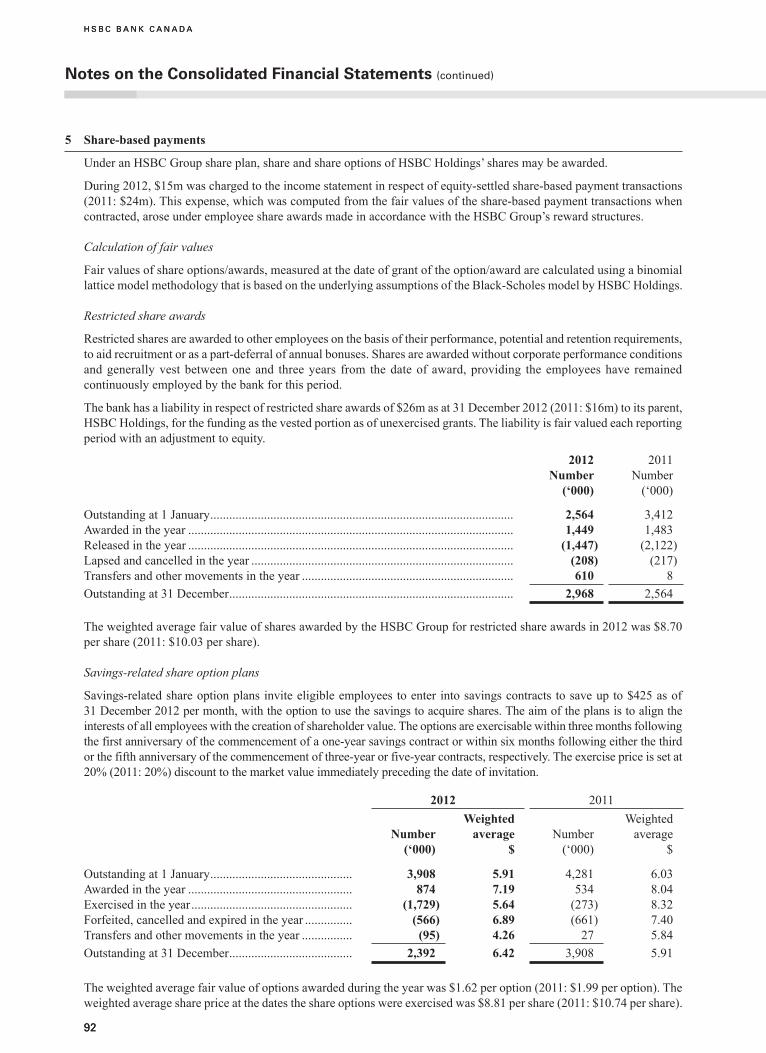
H S B C B A N K C A N A D A
92
5 Share-based payments
Under an HSBC Group share plan, share and share options of HSBC Holdings’ shares may be awarded.
During 2012, $15m was charged to the income statement in respect of equity-settled share-based payment transactions (2011: $24m). This expense, which was computed from the fair values of the share-based payment transactions when contracted, arose under employee share awards made in accordance with the HSBC Group’s reward structures.
Calculation of fair values
Fair values of share options/awards, measured at the date of grant of the option/award are calculated using a binomial lattice model methodology that is based on the underlying assumptions of the Black-Scholes model by HSBC Holdings.
Restricted share awards
Restricted shares are awarded to other employees on the basis of their performance, potential and retention requirements, to aid recruitment or as a part-deferral of annual bonuses. Shares are awarded without corporate performance conditions and generally vest between one and three years from the date of award, providing the employees have remained continuously employed by the bank for this period.
The bank has a liability in respect of restricted share awards of $26m as at 31 December 2012 (2011: $16m) to its parent, HSBC Holdings, for the funding as the vested portion as of unexercised grants. The liability is fair valued each reporting period with an adjustment to equity.
2012 Number
(‘000)
2011 Number
(‘000)
Outstanding at 1 January ................................................................................................ 2,564 3,412Awarded in the year ....................................................................................................... 1,449 1,483Released in the year ....................................................................................................... (1,447) (2,122)Lapsed and cancelled in the year ................................................................................... (208) (217)Transfers and other movements in the year ................................................................... 610 8Outstanding at 31 December .......................................................................................... 2,968 2,564 The weighted average fair value of shares awarded by the HSBC Group for restricted share awards in 2012 was $8.70 per share (2011: $10.03 per share).
Savings-related share option plans
Savings-related share option plans invite eligible employees to enter into savings contracts to save up to $425 as of 31 December 2012 per month, with the option to use the savings to acquire shares. The aim of the plans is to align the interests of all employees with the creation of shareholder value. The options are exercisable within three months following the first anniversary of the commencement of a one-year savings contract or within six months following either the third or the fifth anniversary of the commencement of three-year or five-year contracts, respectively. The exercise price is set at 20% (2011: 20%) discount to the market value immediately preceding the date of invitation.
2012 2011
Number (‘000)
Weighted average
$Number
(‘000)
Weighted average
$
Outstanding at 1 January ............................................. 3,908 5.91 4,281 6.03Awarded in the year .................................................... 874 7.19 534 8.04Exercised in the year ................................................... (1,729) 5.64 (273) 8.32Forfeited, cancelled and expired in the year ............... (566) 6.89 (661) 7.40Transfers and other movements in the year ................ (95) 4.26 27 5.84Outstanding at 31 December ....................................... 2,392 6.42 3,908 5.91
The weighted average fair value of options awarded during the year was $1.62 per option (2011: $1.99 per option). The weighted average share price at the dates the share options were exercised was $8.81 per share (2011: $10.74 per share).
notes on the Consolidated Financial Statements (continued)
H S B C B A N K C A N A D A
92
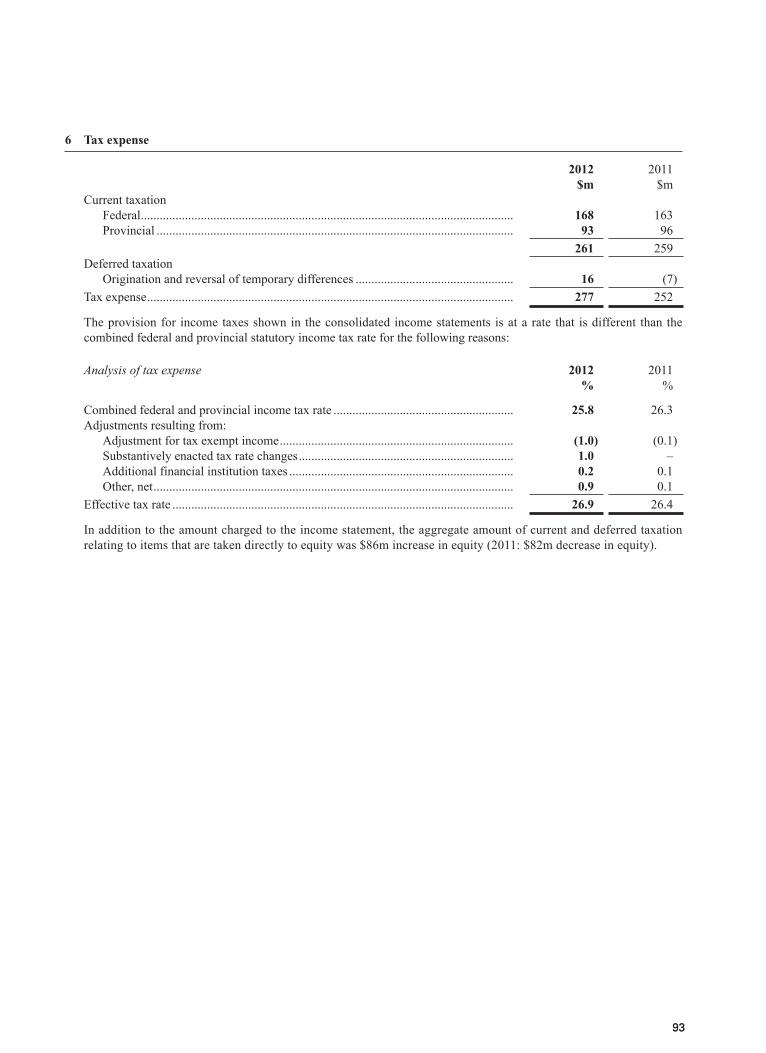
93
6 Tax expense
2012 $m
2011 $m
Current taxation Federal ...................................................................................................................... 168 163 Provincial ................................................................................................................. 93 96
261 259Deferred taxation Origination and reversal of temporary differences .................................................. 16 (7)Tax expense .................................................................................................................... 277 252
The provision for income taxes shown in the consolidated income statements is at a rate that is different than the combined federal and provincial statutory income tax rate for the following reasons:
Analysis of tax expense 2012%
2011%
Combined federal and provincial income tax rate ......................................................... 25.8 26.3Adjustments resulting from: Adjustment for tax exempt income .......................................................................... (1.0) (0.1) Substantively enacted tax rate changes .................................................................... 1.0 – Additional financial institution taxes ....................................................................... 0.2 0.1 Other, net .................................................................................................................. 0.9 0.1Effective tax rate ............................................................................................................ 26.9 26.4
In addition to the amount charged to the income statement, the aggregate amount of current and deferred taxation relating to items that are taken directly to equity was $86m increase in equity (2011: $82m decrease in equity).
93
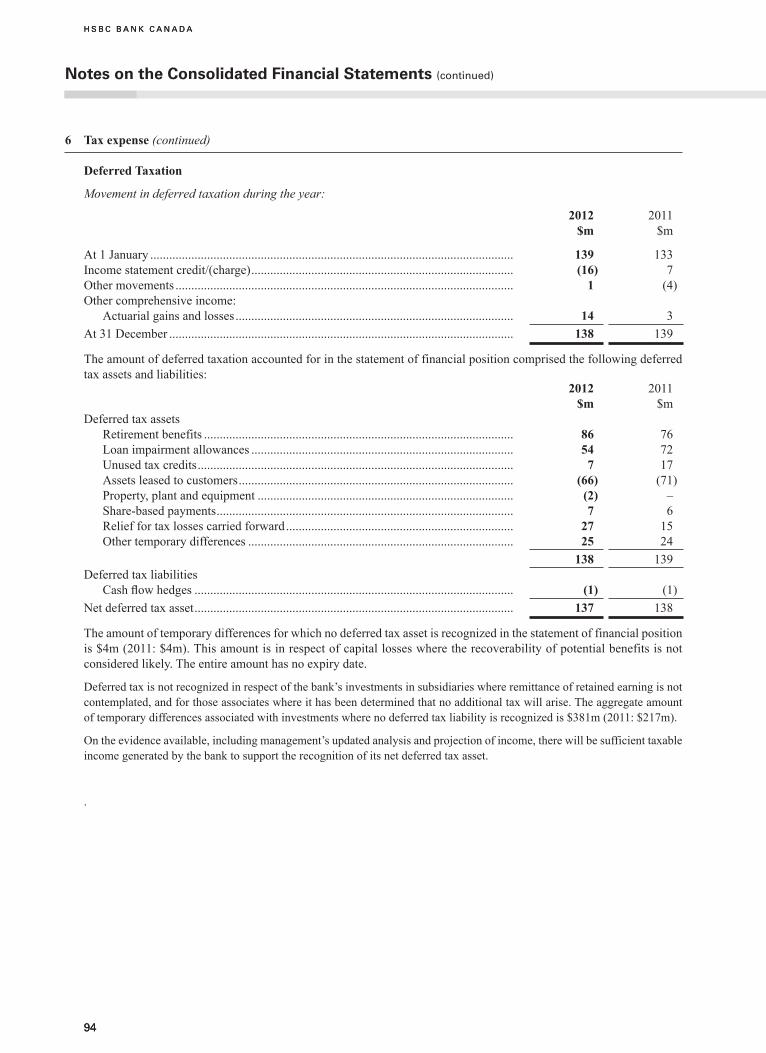
H S B C B A N K C A N A D A
94
6 Tax expense (continued)
Deferred Taxation
Movement in deferred taxation during the year:
2012 $m
2011 $m
At 1 January ................................................................................................................... 139 133Income statement credit/(charge) ................................................................................... (16) 7Other movements ........................................................................................................... 1 (4)Other comprehensive income: Actuarial gains and losses ........................................................................................ 14 3At 31 December ............................................................................................................. 138 139
The amount of deferred taxation accounted for in the statement of financial position comprised the following deferred tax assets and liabilities:
2012 $m
2011 $m
Deferred tax assets Retirement benefits .................................................................................................. 86 76 Loan impairment allowances ................................................................................... 54 72 Unused tax credits .................................................................................................... 7 17 Assets leased to customers ....................................................................................... (66) (71) Property, plant and equipment ................................................................................. (2) – Share-based payments .............................................................................................. 7 6 Relief for tax losses carried forward ........................................................................ 27 15 Other temporary differences .................................................................................... 25 24
138 139Deferred tax liabilities Cashflowhedges ..................................................................................................... (1) (1)Net deferred tax asset ..................................................................................................... 137 138
The amount of temporary differences for which no deferred tax asset is recognized in the statement of financial position is $4m (2011: $4m). This amount is in respect of capital losses where the recoverability of potential benefits is not considered likely. The entire amount has no expiry date.
Deferred tax is not recognized in respect of the bank’s investments in subsidiaries where remittance of retained earning is not contemplated, and for those associates where it has been determined that no additional tax will arise. The aggregate amount of temporary differences associated with investments where no deferred tax liability is recognized is $381m (2011: $217m).
On the evidence available, including management’s updated analysis and projection of income, there will be sufficient taxable income generated by the bank to support the recognition of its net deferred tax asset.
.
notes on the Consolidated Financial Statements (continued)
H S B C B A N K C A N A D A
94
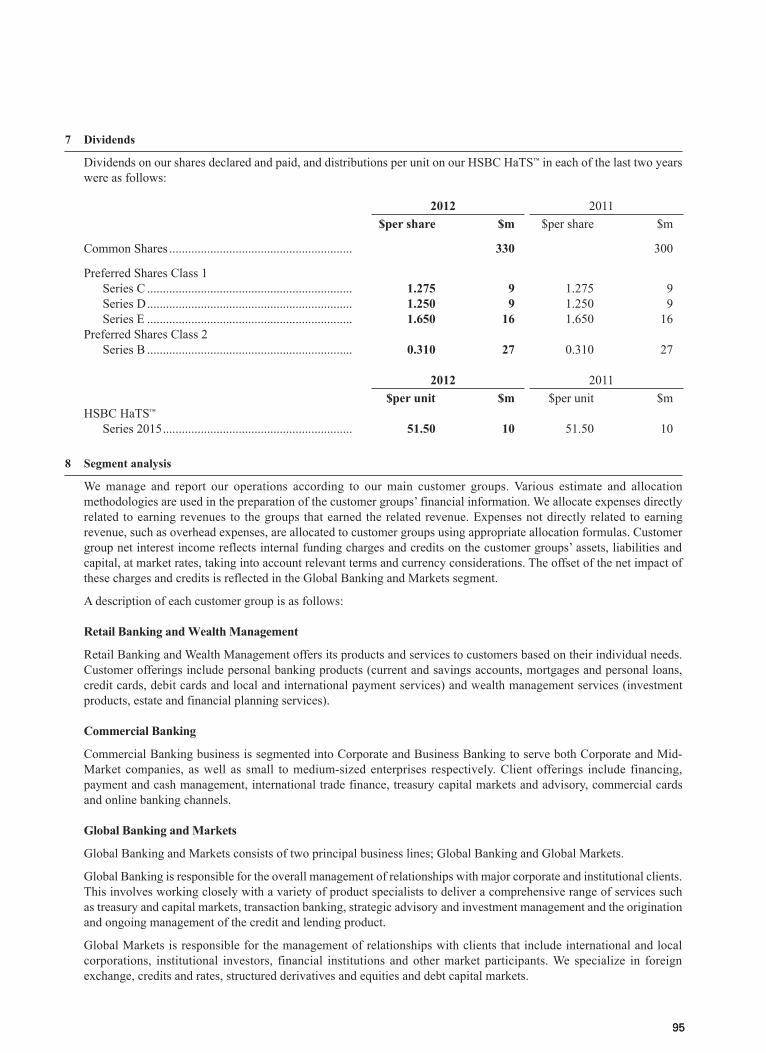
95
7 Dividends
Dividends on our shares declared and paid, and distributions per unit on our HSBC HaTS™ in each of the last two years were as follows:
2012 2011$per share $m $per share $m
Common Shares .......................................................... 330 300
Preferred Shares Class 1 Series C ................................................................. 1.275 9 1.275 9 Series D ................................................................. 1.250 9 1.250 9 Series E ................................................................. 1.650 16 1.650 16Preferred Shares Class 2 Series B ................................................................. 0.310 27 0.310 27
2012 2011$per unit $m $per unit $m
HSBC HaTS™
Series 2015 ............................................................ 51.50 10 51.50 10
8 Segment analysis
We manage and report our operations according to our main customer groups. Various estimate and allocation methodologies are used in the preparation of the customer groups’ financial information. We allocate expenses directly related to earning revenues to the groups that earned the related revenue. Expenses not directly related to earning revenue, such as overhead expenses, are allocated to customer groups using appropriate allocation formulas. Customer group net interest income reflects internal funding charges and credits on the customer groups’ assets, liabilities and capital, at market rates, taking into account relevant terms and currency considerations. The offset of the net impact of these charges and credits is reflected in the Global Banking and Markets segment.
A description of each customer group is as follows:
Retail Banking and Wealth Management
Retail Banking and Wealth Management offers its products and services to customers based on their individual needs. Customer offerings include personal banking products (current and savings accounts, mortgages and personal loans, credit cards, debit cards and local and international payment services) and wealth management services (investment products, estate and financial planning services).
Commercial Banking
Commercial Banking business is segmented into Corporate and Business Banking to serve both Corporate and Mid-Market companies, as well as small to medium-sized enterprises respectively. Client offerings include financing, payment and cash management, international trade finance, treasury capital markets and advisory, commercial cards and online banking channels.
Global Banking and Markets
Global Banking and Markets consists of two principal business lines; Global Banking and Global Markets.
Global Banking is responsible for the overall management of relationships with major corporate and institutional clients. This involves working closely with a variety of product specialists to deliver a comprehensive range of services such as treasury and capital markets, transaction banking, strategic advisory and investment management and the origination and ongoing management of the credit and lending product.
Global Markets is responsible for the management of relationships with clients that include international and local corporations, institutional investors, financial institutions and other market participants. We specialize in foreign exchange, credits and rates, structured derivatives and equities and debt capital markets.
95
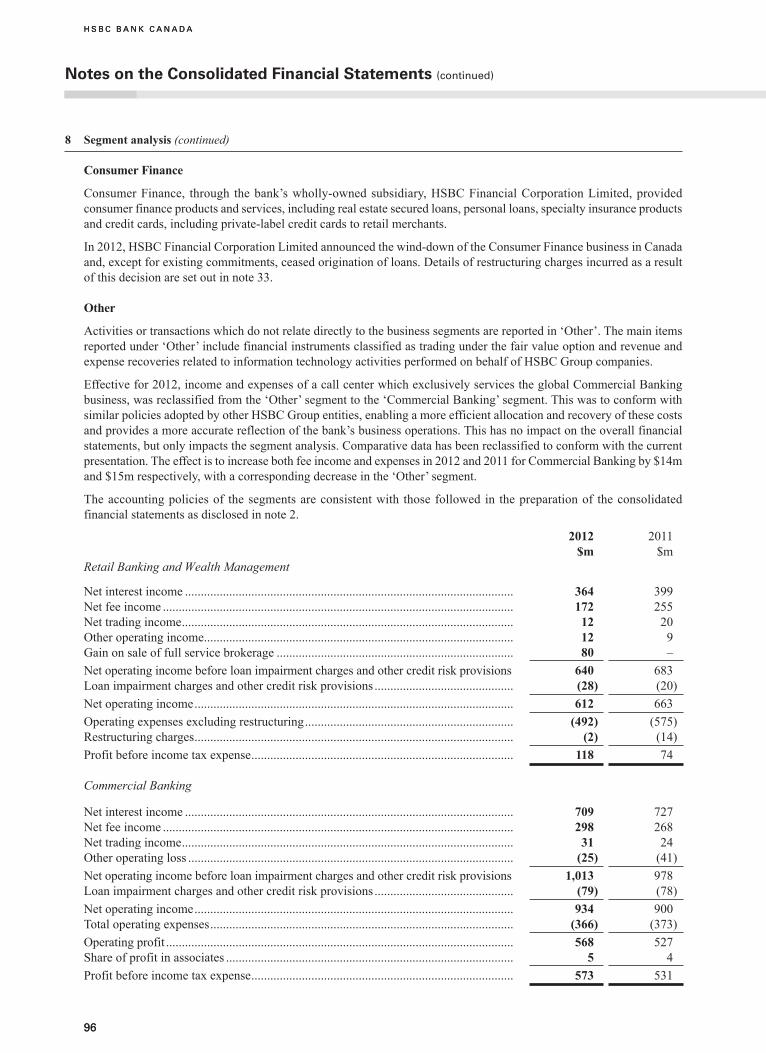
H S B C B A N K C A N A D A
96
8 Segment analysis (continued)
Consumer Finance
Consumer Finance, through the bank’s wholly-owned subsidiary, HSBC Financial Corporation Limited, provided consumer finance products and services, including real estate secured loans, personal loans, specialty insurance products and credit cards, including private-label credit cards to retail merchants.
In 2012, HSBC Financial Corporation Limited announced the wind-down of the Consumer Finance business in Canada and, except for existing commitments, ceased origination of loans. Details of restructuring charges incurred as a result of this decision are set out in note 33.
Other
Activities or transactions which do not relate directly to the business segments are reported in ‘Other’. The main items reported under ‘Other’ include financial instruments classified as trading under the fair value option and revenue and expense recoveries related to information technology activities performed on behalf of HSBC Group companies.
Effective for 2012, income and expenses of a call center which exclusively services the global Commercial Banking business, was reclassified from the ‘Other’ segment to the ‘Commercial Banking’ segment. This was to conform with similar policies adopted by other HSBC Group entities, enabling a more efficient allocation and recovery of these costs and provides a more accurate reflection of the bank’s business operations. This has no impact on the overall financial statements, but only impacts the segment analysis. Comparative data has been reclassified to conform with the current presentation. The effect is to increase both fee income and expenses in 2012 and 2011 for Commercial Banking by $14m and $15m respectively, with a corresponding decrease in the ‘Other’ segment.
The accounting policies of the segments are consistent with those followed in the preparation of the consolidated financial statements as disclosed in note 2.
2012 $m
2011 $m
Retail Banking and Wealth Management
Net interest income ........................................................................................................ 364 399Net fee income ............................................................................................................... 172 255Net trading income ......................................................................................................... 12 20Other operating income .................................................................................................. 12 9Gain on sale of full service brokerage ........................................................................... 80 –Net operating income before loan impairment charges and other credit risk provisions 640 683Loan impairment charges and other credit risk provisions ............................................ (28) (20)Net operating income ..................................................................................................... 612 663Operating expenses excluding restructuring .................................................................. (492) (575)Restructuring charges ..................................................................................................... (2) (14)Profit before income tax expense ................................................................................... 118 74
Commercial Banking
Net interest income ........................................................................................................ 709 727Net fee income ............................................................................................................... 298 268Net trading income ......................................................................................................... 31 24Other operating loss ....................................................................................................... (25) (41)Net operating income before loan impairment charges and other credit risk provisions 1,013 978Loan impairment charges and other credit risk provisions ............................................ (79) (78)Net operating income ..................................................................................................... 934 900Total operating expenses ................................................................................................ (366) (373)Operating profit .............................................................................................................. 568 527Share of profit in associates ........................................................................................... 5 4Profit before income tax expense ................................................................................... 573 531
notes on the Consolidated Financial Statements (continued)
H S B C B A N K C A N A D A
96
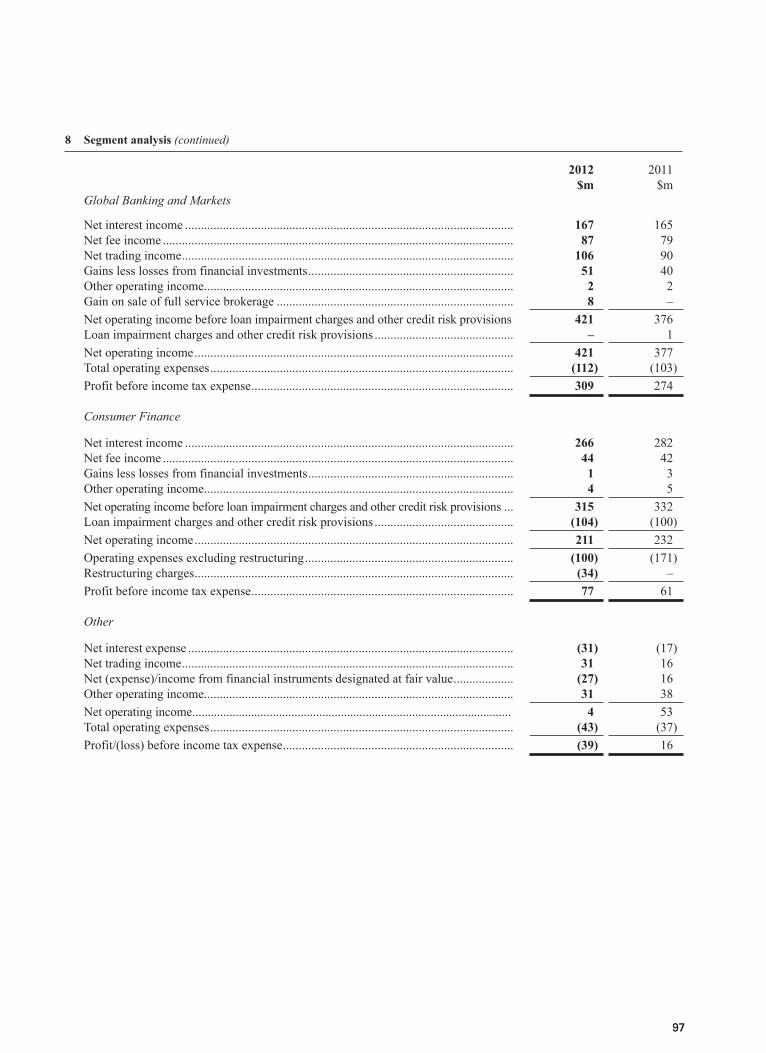
97
8 Segment analysis (continued)
2012 $m
2011 $m
Global Banking and Markets
Net interest income ........................................................................................................ 167 165Net fee income ............................................................................................................... 87 79Net trading income ......................................................................................................... 106 90Gains less losses from financial investments ................................................................. 51 40Other operating income .................................................................................................. 2 2Gain on sale of full service brokerage ........................................................................... 8 –Net operating income before loan impairment charges and other credit risk provisions 421 376Loan impairment charges and other credit risk provisions ............................................ – 1Net operating income ..................................................................................................... 421 377Total operating expenses ................................................................................................ (112) (103)Profit before income tax expense ................................................................................... 309 274
Consumer Finance
Net interest income ........................................................................................................ 266 282Net fee income ............................................................................................................... 44 42Gains less losses from financial investments ................................................................. 1 3Other operating income .................................................................................................. 4 5Net operating income before loan impairment charges and other credit risk provisions ... 315 332Loan impairment charges and other credit risk provisions ............................................ (104) (100)Net operating income ..................................................................................................... 211 232Operating expenses excluding restructuring .................................................................. (100) (171)Restructuring charges ..................................................................................................... (34) –Profit before income tax expense ................................................................................... 77 61
Other
Net interest expense ....................................................................................................... (31) (17)Net trading income ......................................................................................................... 31 16Net (expense)/income from financial instruments designated at fair value ................... (27) 16Other operating income .................................................................................................. 31 38Net operating income ....................................................................................................... 4 53Total operating expenses ................................................................................................ (43) (37)Profit/(loss) before income tax expense ......................................................................... (39) 16
97
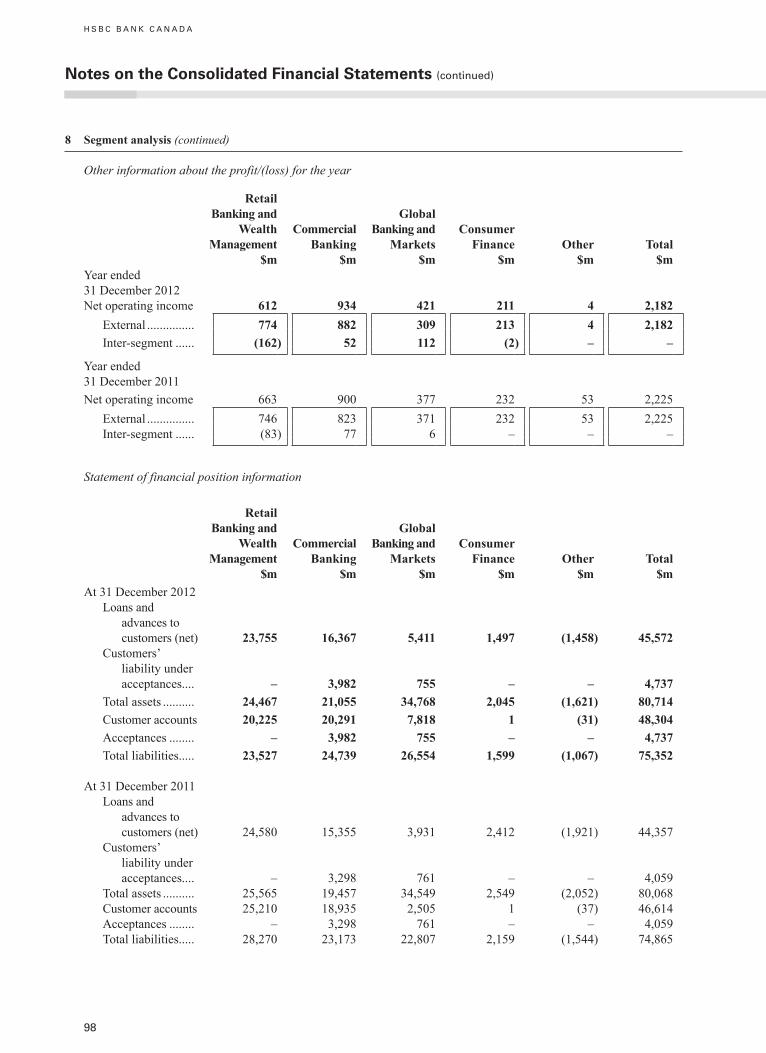
8 Segment analysis (continued)
Other information about the profit/(loss) for the year
Retail Banking and
Wealth Management
$m
Commercial Banking
$m
Global Banking and
Markets $m
Consumer Finance
$mOther
$mTotal
$mYear ended31 December 2012Net operating income 612 934 421 211 4 2,182 External ............... 774 882 309 213 4 2,182 Inter-segment ...... (162) 52 112 (2) – –
Year ended31 December 2011Net operating income 663 900 377 232 53 2,225 External ............... 746 823 371 232 53 2,225 Inter-segment ...... (83) 77 6 – – –
Statement of financial position information
Retail Banking and
Wealth Management
$m
Commercial Banking
$m
Global Banking and
Markets $m
Consumer Finance
$mOther
$mTotal
$mAt 31 December 2012
Loans and advances to customers (net) 23,755 16,367 5,411 1,497 (1,458) 45,572
Customers’ liability under acceptances.... – 3,982 755 – – 4,737
Total assets .......... 24,467 21,055 34,768 2,045 (1,621 ) 80,714Customer accounts 20,225 20,291 7,818 1 (31) 48,304Acceptances ........ – 3,982 755 – – 4,737Total liabilities..... 23,527 24,739 26,554 1,599 (1,067) 75,352
At 31 December 2011Loans and
advances to customers (net) 24,580 15,355 3,931 2,412 (1,921) 44,357
Customers’ liability under acceptances.... – 3,298 761 – – 4,059
Total assets .......... 25,565 19,457 34,549 2,549 (2,052) 80,068Customer accounts 25,210 18,935 2,505 1 (37) 46,614Acceptances ........ – 3,298 761 – – 4,059Total liabilities..... 28,270 23,173 22,807 2,159 (1,544) 74,865
notes on the Consolidated Financial Statements (continued)
H S B C B A N K C A N A D A
98
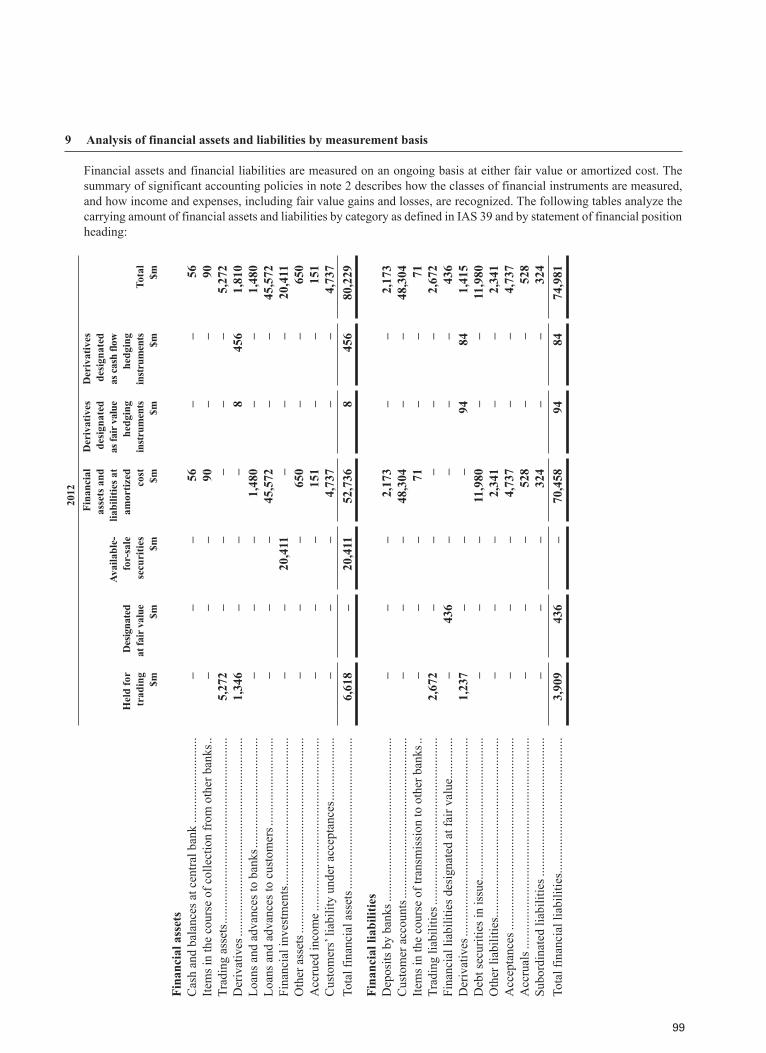
9 Analysis of financial assets and liabilities by measurement basis
Financial assets and financial liabilities are measured on an ongoing basis at either fair value or amortized cost. The summary of significant accounting policies in note 2 describes how the classes of financial instruments are measured, and how income and expenses, including fair value gains and losses, are recognized. The following tables analyze the carrying amount of financial assets and liabilities by category as defined in IAS 39 and by statement of financial position heading:
2012
Hel
d fo
r tr
adin
g $m
D
esig
nate
d at
fair
val
ue
$m
Avai
labl
e-fo
r-sa
le
secu
ritie
s $m
Fina
ncia
l as
sets
and
lia
bilit
ies a
t am
ortiz
ed
cost
$m
Der
ivat
ives
de
sign
ated
as
fair
valu
e he
dgin
g in
stru
men
ts
$m
Der
ivat
ives
de
sign
ated
as
cash
flow
he
dgin
g in
stru
men
ts
$mTo
tal
$m
Fina
ncia
l ass
ets
Cas
h an
d ba
lanc
es a
t cen
tral b
ank
......
......
......
......
...–
––
56–
–56
Item
s in
the
cour
se o
f col
lect
ion
from
oth
er b
anks
..–
––
90–
–90
Trad
ing
asse
ts ...
......
......
......
......
......
......
......
......
......
..5,
272
––
––
–5,
272
Der
ivat
ives
......
......
......
......
......
......
......
......
......
......
...1,
346
––
–8
456
1,81
0Lo
ans a
nd a
dvan
ces t
o ba
nks .
......
......
......
......
......
....
––
–1,
480
––
1,48
0Lo
ans a
nd a
dvan
ces t
o cu
stom
ers .
......
......
......
......
...–
––
45,5
72–
–45
,572
Fina
ncia
l inv
estm
ents
......
......
......
......
......
......
......
.....
––
20,4
11–
––
20,4
11O
ther
ass
ets .
......
......
......
......
......
......
......
......
......
......
.–
––
650
––
650
Acc
rued
inco
me .
......
......
......
......
......
......
......
......
......
––
–15
1–
–15
1C
usto
mer
s’ lia
bilit
y un
der a
ccep
tanc
es ...
......
......
.....
––
–4,
737
––
4,73
7To
tal f
inan
cial
ass
ets .
......
......
......
......
......
......
......
.....
6,61
8–
20,4
1152
,736
845
680
,229
Fina
ncia
l lia
bilit
ies
Dep
osits
by
bank
s ....
......
......
......
......
......
......
......
......
––
–2,
173
––
2,17
3C
usto
mer
acc
ount
s ....
......
......
......
......
......
......
......
.....
––
–48
,304
––
48,3
04Ite
ms i
n th
e co
urse
of t
rans
mis
sion
to o
ther
ban
ks ..
––
–71
––
71Tr
adin
g lia
bilit
ies .
......
......
......
......
......
......
......
......
....
2,67
2–
––
––
2,67
2Fi
nanc
ial l
iabi
litie
s des
igna
ted
at fa
ir va
lue .
......
......
–43
6–
––
–43
6D
eriv
ativ
es ...
......
......
......
......
......
......
......
......
......
......
1,23
7–
––
9484
1,41
5D
ebt s
ecur
ities
in is
sue .
......
......
......
......
......
......
......
..–
––
11,9
80–
–11
,980
Oth
er li
abili
ties ..
......
......
......
......
......
......
......
......
......
.–
––
2,34
1–
–2,
341
Acc
epta
nces
.....
......
......
......
......
......
......
......
......
......
..–
––
4,73
7–
–4,
737
Acc
rual
s ....
......
......
......
......
......
......
......
......
......
......
...–
––
528
––
528
Subo
rdin
ated
liab
ilitie
s ....
......
......
......
......
......
......
....
––
–32
4–
–32
4To
tal f
inan
cial
liab
ilitie
s.....
......
......
......
......
......
......
..3,
909
436
–70
,458
9484
74,9
81
99
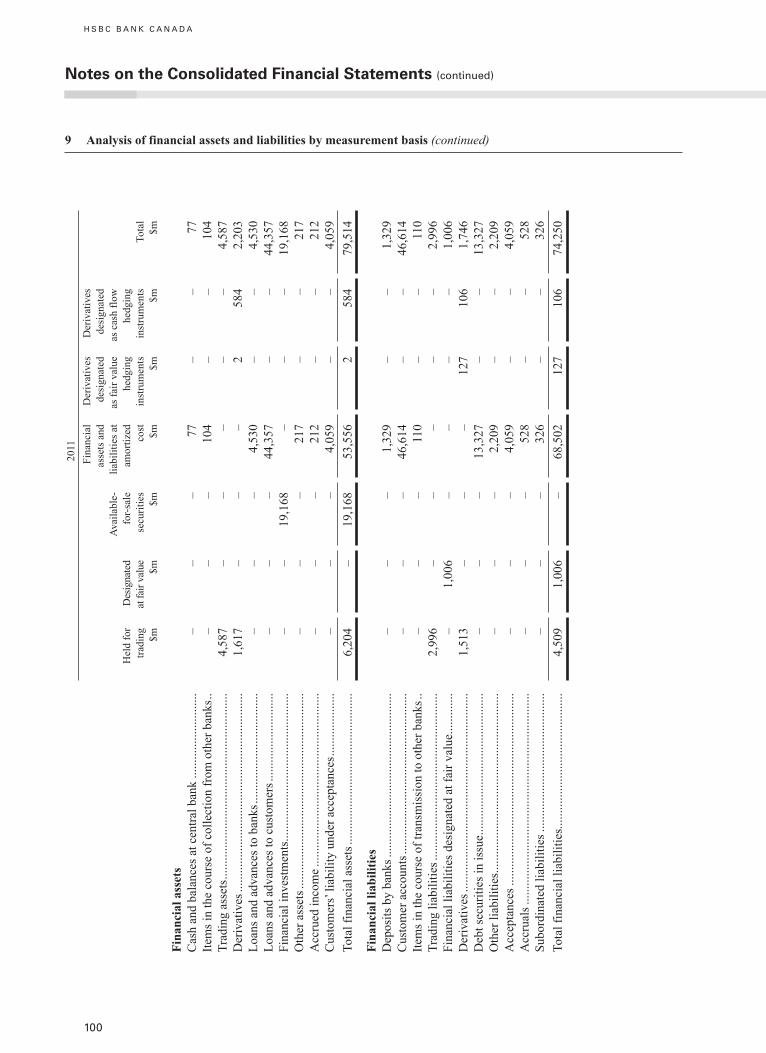
notes on the Consolidated Financial Statements (continued)
H S B C B A N K C A N A D A
100
9 Analysis of financial assets and liabilities by measurement basis (continued)
2011
Hel
d fo
r tra
ding
$m
D
esig
nate
d at
fair
valu
e $m
Avai
labl
e-fo
r-sal
e se
curit
ies
$m
Fina
ncia
l as
sets
and
lia
bilit
ies a
t am
ortiz
ed
cost
$m
Der
ivat
ives
de
sign
ated
as
fair
valu
e he
dgin
g in
stru
men
ts
$m
Der
ivat
ives
de
sign
ated
as
cas
h flo
w
hedg
ing
inst
rum
ents
$m
Tota
l $m
Fina
ncia
l ass
ets
Cas
h an
d ba
lanc
es a
t cen
tral b
ank
......
......
......
......
...–
––
77–
–77
Item
s in
the
cour
se o
f col
lect
ion
from
oth
er b
anks
..–
––
104
––
104
Trad
ing
asse
ts ...
......
......
......
......
......
......
......
......
......
..4,
587
––
––
–4,
587
Der
ivat
ives
......
......
......
......
......
......
......
......
......
......
...1,
617
––
–2
584
2,20
3Lo
ans a
nd a
dvan
ces t
o ba
nks .
......
......
......
......
......
....
––
–4,
530
––
4,53
0Lo
ans a
nd a
dvan
ces t
o cu
stom
ers .
......
......
......
......
...–
––
44,3
57–
–44
,357
Fina
ncia
l inv
estm
ents
......
......
......
......
......
......
......
.....
––
19,1
68–
––
19,1
68O
ther
ass
ets .
......
......
......
......
......
......
......
......
......
......
.–
––
217
––
217
Acc
rued
inco
me .
......
......
......
......
......
......
......
......
......
––
–21
2–
–21
2C
usto
mer
s’ lia
bilit
y un
der a
ccep
tanc
es ...
......
......
.....
––
–4,
059
––
4,05
9To
tal f
inan
cial
ass
ets .
......
......
......
......
......
......
......
.....
6,20
4–
19,1
6853
,556
258
479
,514
Fina
ncia
l lia
bilit
ies
Dep
osits
by
bank
s ....
......
......
......
......
......
......
......
......
––
–1,
329
––
1,32
9C
usto
mer
acc
ount
s ....
......
......
......
......
......
......
......
.....
––
–46
,614
––
46,6
14Ite
ms i
n th
e co
urse
of t
rans
mis
sion
to o
ther
ban
ks ..
––
–11
0–
–11
0Tr
adin
g lia
bilit
ies .
......
......
......
......
......
......
......
......
....
2,99
6–
––
––
2,99
6Fi
nanc
ial l
iabi
litie
s des
igna
ted
at fa
ir va
lue .
......
......
–1,
006
––
––
1,00
6D
eriv
ativ
es ...
......
......
......
......
......
......
......
......
......
......
1,51
3–
––
127
106
1,74
6D
ebt s
ecur
ities
in is
sue .
......
......
......
......
......
......
......
..–
––
13,3
27–
–13
,327
Oth
er li
abili
ties ..
......
......
......
......
......
......
......
......
......
.–
––
2,20
9–
–2,
209
Acc
epta
nces
.....
......
......
......
......
......
......
......
......
......
..–
––
4,05
9–
–4,
059
Acc
rual
s ....
......
......
......
......
......
......
......
......
......
......
...–
––
528
––
528
Subo
rdin
ated
liab
ilitie
s ....
......
......
......
......
......
......
....
––
–32
6–
–32
6To
tal f
inan
cial
liab
ilitie
s.....
......
......
......
......
......
......
..4,
509
1,00
6–
68,5
0212
710
674
,250
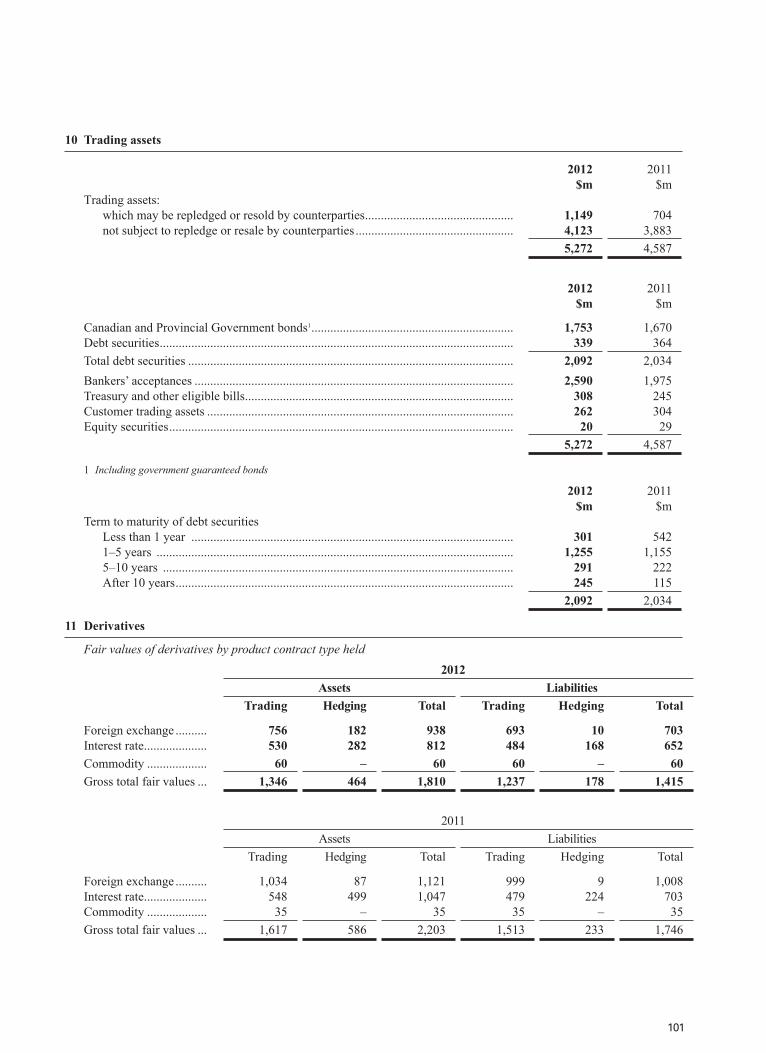
10 Trading assets
2012 $m
2011 $m
Trading assets: which may be repledged or resold by counterparties ............................................... 1,149 704 not subject to repledge or resale by counterparties .................................................. 4,123 3,883
5,272 4,587
2012 $m
2011 $m
Canadian and Provincial Government bonds1 ................................................................ 1,753 1,670Debt securities ................................................................................................................ 339 364Total debt securities ....................................................................................................... 2,092 2,034Bankers’ acceptances ..................................................................................................... 2,590 1,975Treasury and other eligible bills ..................................................................................... 308 245Customer trading assets ................................................................................................. 262 304Equity securities ............................................................................................................. 20 29
5,272 4,587
1 Including government guaranteed bonds
2012 $m
2011 $m
Term to maturity of debt securities Less than 1 year ...................................................................................................... 301 542 1–5 years ................................................................................................................. 1,255 1,155 5–10 years ............................................................................................................... 291 222 After 10 years ........................................................................................................... 245 115
2,092 2,034
11 Derivatives
Fair values of derivatives by product contract type held2012
Assets LiabilitiesTrading Hedging Total Trading Hedging Total
Foreign exchange .......... 756 182 938 693 10 703Interest rate .................... 530 282 812 484 168 652Commodity ................... 60 – 60 60 – 60Gross total fair values ... 1,346 464 1,810 1,237 178 1,415
2011Assets Liabilities
Trading Hedging Total Trading Hedging Total
Foreign exchange .......... 1,034 87 1,121 999 9 1,008Interest rate .................... 548 499 1,047 479 224 703Commodity ................... 35 – 35 35 – 35Gross total fair values ... 1,617 586 2,203 1,513 233 1,746
101
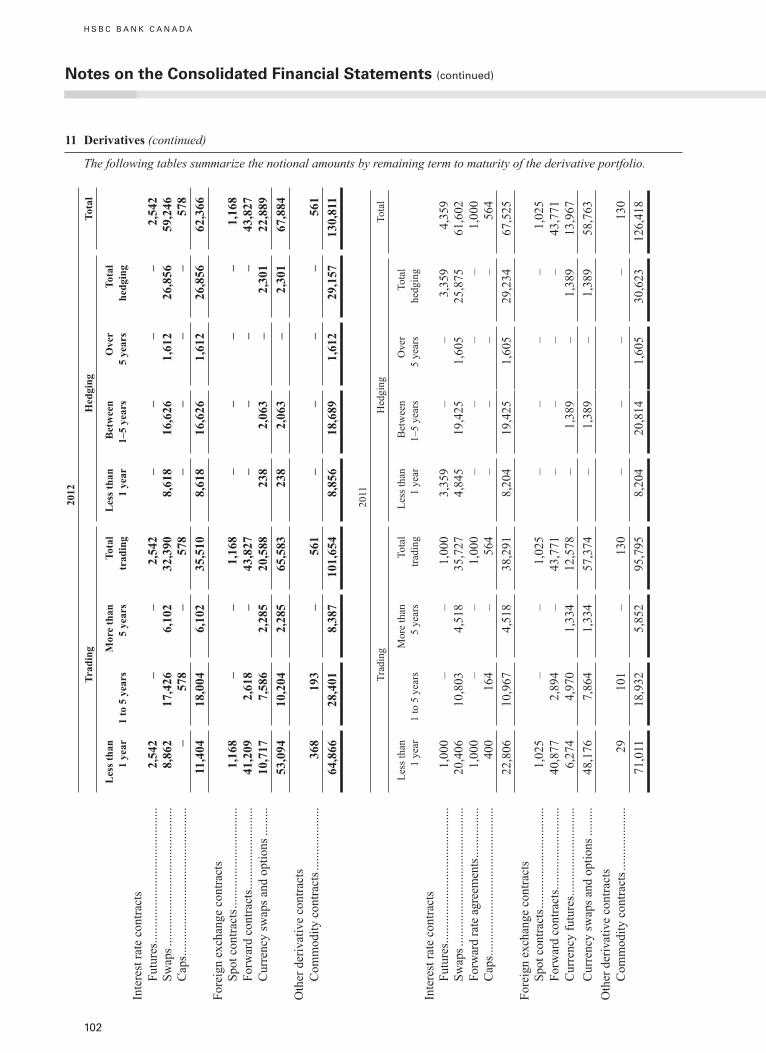
11 Derivatives (continued)
The following tables summarize the notional amounts by remaining term to maturity of the derivative portfolio.
2012
Trad
ing
Hed
ging
Tota
l
Les
s tha
n 1
year
1 to
5 y
ears
Mor
e th
an
5 ye
ars
Tota
l tr
adin
gL
ess t
han
1 ye
arB
etw
een
1–5
year
sO
ver
5 ye
ars
Tota
l he
dgin
gIn
tere
st ra
te c
ontra
cts
Fu
ture
s .....
......
......
......
......
......
......
..2,
542
––
2,54
2–
––
–2,
542
Sw
aps .
......
......
......
......
......
......
......
.8,
862
17,4
266,
102
32,3
908,
618
16,6
261,
612
26,8
5659
,246
C
aps ..
......
......
......
......
......
......
......
...–
578
–57
8–
––
–57
811
,404
18,0
046,
102
35,5
108,
618
16,6
261,
612
26,8
5662
,366
Fore
ign
exch
ange
con
tract
s
Spot
con
tract
s ....
......
......
......
......
....
1,16
8–
–1,
168
––
––
1,16
8
Forw
ard
cont
ract
s .....
......
......
......
...41
,209
2,61
8–
43,8
27–
––
–43
,827
C
urre
ncy
swap
s and
opt
ions
.....
....
10,7
177,
586
2,28
520
,588
238
2,06
3–
2,30
122
,889
53,0
9410
,204
2,28
565
,583
238
2,06
3–
2,30
167
,884
Oth
er d
eriv
ativ
e co
ntra
cts
C
omm
odity
con
tract
s ....
......
......
....
368
193
–56
1–
––
–56
164
,866
28,4
018,
387
101,
654
8,85
618
,689
1,61
229
,157
130,
811
2011
Trad
ing
Hed
ging
Tota
l
Less
than
1
year
1 to
5 y
ears
Mor
e th
an
5 ye
ars
Tota
l tra
ding
Less
than
1
year
Bet
wee
n 1–
5 ye
ars
Ove
r 5
year
sTo
tal
hedg
ing
Inte
rest
rate
con
tract
s
Futu
res ..
......
......
......
......
......
......
.....
1,00
0–
–1,
000
3,35
9–
–3,
359
4,35
9
Swap
s ....
......
......
......
......
......
......
....
20,4
0610
,803
4,51
835
,727
4,84
519
,425
1,60
525
,875
61,6
02
Forw
ard
rate
agr
eem
ents
......
......
....
1,00
0–
–1,
000
––
––
1,00
0
Cap
s .....
......
......
......
......
......
......
......
400
164
–56
4–
––
–56
422
,806
10,9
674,
518
38,2
918,
204
19,4
251,
605
29,2
3467
,525
Fore
ign
exch
ange
con
tract
s
Spot
con
tract
s ....
......
......
......
......
....
1,02
5–
–1,
025
––
––
1,02
5
Forw
ard
cont
ract
s .....
......
......
......
...40
,877
2,89
4–
43,7
71–
––
–43
,771
C
urre
ncy
futu
res ..
......
......
......
......
..6,
274
4,97
01,
334
12,5
78–
1,38
9–
1,38
913
,967
C
urre
ncy
swap
s and
opt
ions
.....
....
48,1
767,
864
1,33
457
,374
–1,
389
–1,
389
58,7
63O
ther
der
ivat
ive
cont
ract
s
Com
mod
ity c
ontra
cts .
......
......
......
.29
101
–13
0–
––
–13
071
,011
18,9
325,
852
95,7
958,
204
20,8
141,
605
30,6
2312
6,41
8
notes on the Consolidated Financial Statements (continued)
H S B C B A N K C A N A D A
102
103
11 Derivatives (continued)
Use of derivatives
The bank utilizes derivatives for three primary purposes: to create risk management solutions for clients, for proprietary trading purposes, and to manage and hedge the bank’s own risks. Derivatives (except for derivatives which are designated as effective hedging instruments as defined in IAS 39) are held for trading. The held for trading classification includes two types of derivatives: those used in sales and trading activities, and those used for risk management purposes but which for various reasons do not qualify for hedge accounting. The second category includes derivatives managed in conjunction with financial instruments designated at fair value. These activities are described more fully below.
The bank’s derivative activities give rise to significant open positions in portfolios of derivatives. These positions are managed constantly to ensure that they remain within acceptable risk levels in accordance with the bank’s approved risk management policies, with matching deals being used to achieve this where necessary. When entering into derivative transactions, the bank employs the same credit risk management procedures that are used for traditional lending to assess and approve potential credit exposures.
Trading derivatives
Most of the bank’s derivative transactions relate to sales and trading activities. Sales activities include the structuring and marketing of derivative products to customers to enable them to take, transfer, modify or reduce current or expected risks.Tradingactivitiesinderivativesareenteredintoprincipallyforthepurposeofgeneratingprofitsfromshort-termfluctuationsinpriceormargin.Positionsmaybetradedactivelyorbeheldoveraperiodoftimetobenefitfromexpectedchanges in currency rates, interest rates, equity prices or other market parameters. Trading includes market-making, positioning and arbitrage activities. Market-making entails quoting bid and offer prices to other market participants for the purpose of generating revenues based on spread and volume; positioning means managing market risk positions in theexpectationofbenefitingfromfavourablemovementsinprices,ratesorindices;arbitrageinvolvesidentifyingandprofitingfrompricedifferentialsbetweenmarketsandproducts.
Asmentioned above, other derivatives classified as held for trading include non-qualifying hedging derivatives,ineffective hedging derivatives and the components of hedging derivatives that are excluded from assessing hedge effectiveness. Non-qualifying hedging derivatives are entered into for risk management purposes but do not meet the criteriaforhedgeaccounting.Theseincludederivativesmanagedinconjunctionwithfinancialinstrumentsdesignatedat fair value.
Gains and losses from changes in the fair value of derivatives, including the contractual interest, that do not qualify for hedgeaccountingarereportedin‘Nettradingincome’,exceptforderivativesmanagedinconjunctionwithfinancialinstrumentsdesignatedatfairvalue,wheregainsandlossesarereportedin‘Netincomefromfinancialinstrumentsdesignated at fair value’, together with the gains and losses on the hedged items. Where the derivatives are managed with debt securities in issue, the contractual interest is shown in ‘interest expense’ together with the interest payable on the issued debt.
103

H S B C B A N K C A N A D A
104
11 Derivatives (continued)
An analysis of the derivative portfolio and related credit exposure
2012 2011
Notional amount
$m 1
Credit equivalent
amount $m
2
Risk-weighted
balance $m
3
Notional amount
$m 1
Credit equivalent
amount $m
2
Risk-weighted
balance $m
3
Interest rate contracts Future .................. 2,542 – – 4,359 – – Swaps .................. 59,246 1,094 382 61,602 1,285 346
Forward rate agreements .... – – – 1,000 – –
Caps ..................... 578 7 1 564 7 162,366 1,101 383 67,525 1,292 347
Foreign exchange contracts
Spot contracts ...... 1,168 – – 1,025 12 1 Forward contracts 43,827 888 126 43,771 1,123 148 Currency futures .. – – – – – –
Currency swaps and options .... 22,889 1,192 333 13,967 879 247
67,884 2,080 459 58,763 2,014 396Other derivative
contractsCommodity
contracts ........ 561 94 23 130 35 8130,811 3,275 865 126,418 3,341 751
1 Notional amounts are the contract amounts used to calculate the cash flows to be exchanged. They are a common measure of the volume of outstanding transactions, but do not represent credit or market risk exposure.
2 Credit equivalent amount is the current replacement cost plus an amount for future credit exposure associated with the potential for future changes in currency and interest rates. The future credit exposure is calculated using a formula prescribed by OSFI in its capital adequacy guidelines.
3 Risk-weighted balance represents a measure of the amount of regulatory capital required to support the derivative activities. It is estimated by risk weighting the credit equivalent amounts according to the credit worthiness of the counterparties using factors prescribed by OSFI in its capital adequacy guidelines.
Interest rate and currency futures are exchange-traded. All other contracts are over-the-counter. The notional or contractual amounts of these instruments indicate the nominal value of transactions outstanding at the reporting date; they do not represent amounts at risk.
Hedging instruments
The bank uses derivatives (principally interest rate swaps) for hedging purposes in the management of its own asset and liability portfolios and structural positions. This enables the bank to optimize the overall cost to the bank of accessing debt capital markets, and to mitigate the market risk which would otherwise arise from structural imbalances in the maturity and other profiles of its assets and liabilities.
Fair value hedges
The bank’s fair value hedges principally consist of interest rate swaps that are used to protect against changes in the fair value of fixed-rate long-term financial instruments due to movements in market interest rates. For qualifying fair value hedges, all changes in the fair value of the derivative and in the fair value of the item in relation to the risk being hedged are recognized in the income statement. If the hedge relationship is terminated, the fair value adjustment to the hedged item continues to be reported as part of the basis of the item and is amortized to the income statement as a yield adjustment over the remainder of the hedging period.
notes on the Consolidated Financial Statements (continued)
H S B C B A N K C A N A D A
104
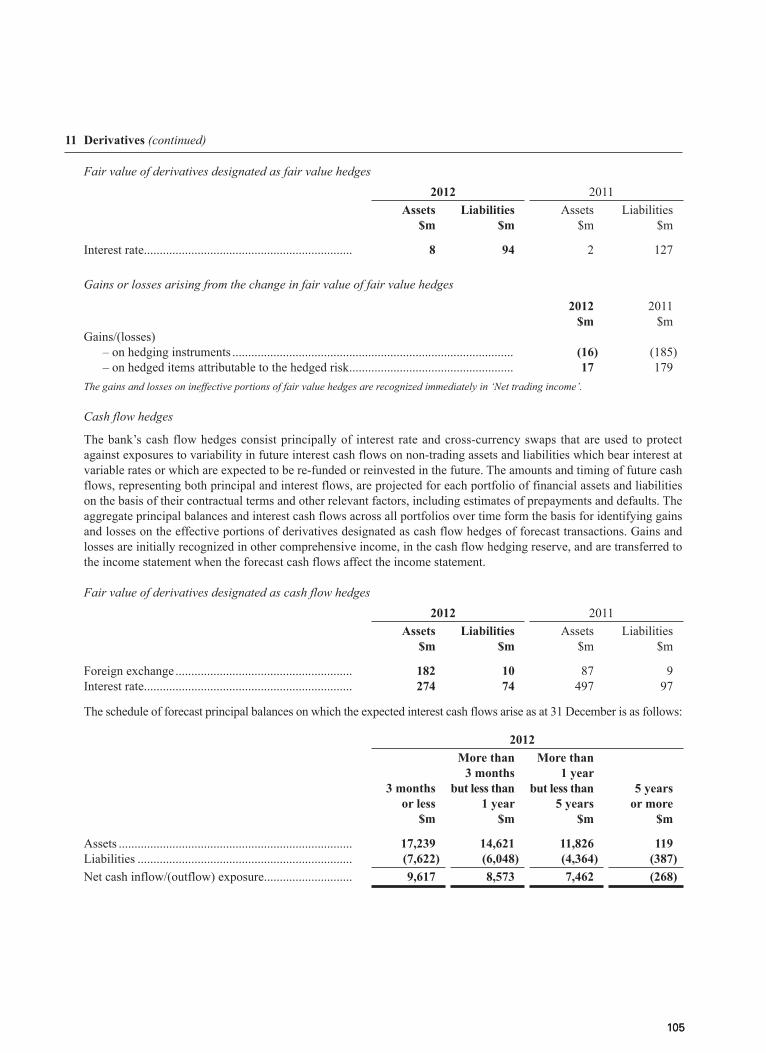
105
11 Derivatives (continued)
Fair value of derivatives designated as fair value hedges2012 2011
Assets $m
Liabilities $m
Assets $m
Liabilities $m
Interest rate .................................................................. 8 94 2 127
Gains or losses arising from the change in fair value of fair value hedges
2012 $m
2011 $m
Gains/(losses) – on hedging instruments ......................................................................................... (16) (185) – on hedged items attributable to the hedged risk .................................................... 17 179The gains and losses on ineffective portions of fair value hedges are recognized immediately in ‘Net trading income’.
Cash flow hedges
The bank’s cash flow hedges consist principally of interest rate and cross-currency swaps that are used to protect against exposures to variability in future interest cash flows on non-trading assets and liabilities which bear interest at variable rates or which are expected to be re-funded or reinvested in the future. The amounts and timing of future cash flows, representing both principal and interest flows, are projected for each portfolio of financial assets and liabilities on the basis of their contractual terms and other relevant factors, including estimates of prepayments and defaults. The aggregate principal balances and interest cash flows across all portfolios over time form the basis for identifying gains and losses on the effective portions of derivatives designated as cash flow hedges of forecast transactions. Gains and losses are initially recognized in other comprehensive income, in the cash flow hedging reserve, and are transferred to the income statement when the forecast cash flows affect the income statement.
Fair value of derivatives designated as cash flow hedges2012 2011
Assets $m
Liabilities $m
Assets $m
Liabilities $m
Foreign exchange ........................................................ 182 10 87 9Interest rate .................................................................. 274 74 497 97
The schedule of forecast principal balances on which the expected interest cash flows arise as at 31 December is as follows:
2012
3 months or less
$m
More than 3 months
but less than 1 year
$m
More than 1 year
but less than 5 years
$m
5 years or more
$m
Assets .......................................................................... 17,239 14,621 11,826 119Liabilities .................................................................... (7,622) (6,048) (4,364) (387)Net cash inflow/(outflow) exposure ............................ 9,617 8,573 7,462 (268)
105
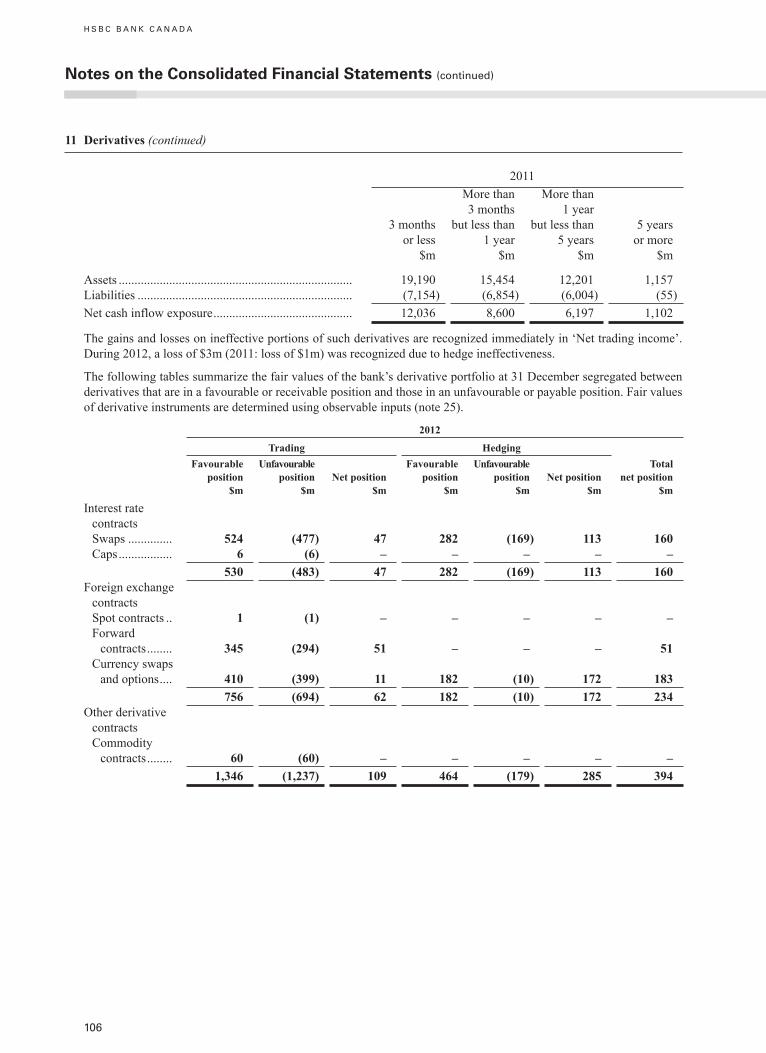
H S B C B A N K C A N A D A
11 Derivatives (continued)
2011
3 months or less
$m
More than 3 months
but less than 1 year
$m
More than 1 year
but less than 5 years
$m
5 years or more
$m
Assets .......................................................................... 19,190 15,454 12,201 1,157Liabilities .................................................................... (7,154) (6,854) (6,004) (55)Net cash inflow exposure ............................................ 12,036 8,600 6,197 1,102
The gains and losses on ineffective portions of such derivatives are recognized immediately in ‘Net trading income’. During 2012, a loss of $3m (2011: loss of $1m) was recognized due to hedge ineffectiveness.
The following tables summarize the fair values of the bank’s derivative portfolio at 31 December segregated between derivatives that are in a favourable or receivable position and those in an unfavourable or payable position. Fair values of derivative instruments are determined using observable inputs (note 25).
2012
Trading HedgingFavourable
position $m
Unfavourable position
$mNet position
$m
Favourable position
$m
Unfavourable position
$mNet position
$m
Total net position
$m
Interest rate contracts
Swaps .............. 524 (477) 47 282 (169) 113 160 Caps ................. 6 (6) – – – – –
530 (483) 47 282 (169) 113 160Foreign exchange
contracts Spot contracts .. 1 (1) – – – – –
Forward contracts ........ 345 (294) 51 – – – 51
Currency swaps and options .... 410 (399) 11 182 (10) 172 183
756 (694) 62 182 (10) 172 234Other derivative
contractsCommodity
contracts ........ 60 (60) – – – – –1,346 (1,237) 109 464 (179) 285 394
notes on the Consolidated Financial Statements (continued)
106

11 Derivatives (continued)
2011
Trading HedgingFavourable
position $m
Unfavourable position
$mNet position
$m
Favourable position
$m
Unfavourable position
$mNet position
$m
Totalnet position
$m
Interest rate contractsSwaps .............. 547 (477) 70 499 (224) 275 345Forward rate
agreements .... – (3) (3) –
– – (3)Caps ................. 1 1 2 – – – 2
548 (479) 69 499 (224) 275 344Foreign exchange
contractsSpot contracts .. 2 – 2 – – – 2Forward
contracts ........ 568 (592) (24) – – – (24)Currency swaps
and options .... 464 (407) 57 87 (9) 78 1351,034 (999) 35 87 (9) 78 113
Other derivative contractsCommodity
contracts ........ 35 (35) – – – – –1,617 (1,513) 104 586 (233) 353 457
12 Financial investments
Financial investments comprise the following:
2012 $m
2011 $m
Financial investments Which may be repledged or resold by counterparties .............................................. 750 107 Not subject to repledge or resale by counterparties ................................................. 19,661 19,061 20,411 19,168
Available-for-sale Canadian and Provincial Government bonds1 .......................................................... 13,429 13,743 Treasury bills and other eligible bills ....................................................................... 2,308 1,716 International Government bonds1 ............................................................................. 2,999 2,410 Other debt securities issued by banks and other financial institutions .................... 1,666 1,271 Other debt securities ................................................................................................ 9 28
20,411 19,168
1 Includes government guaranteed bonds.
107
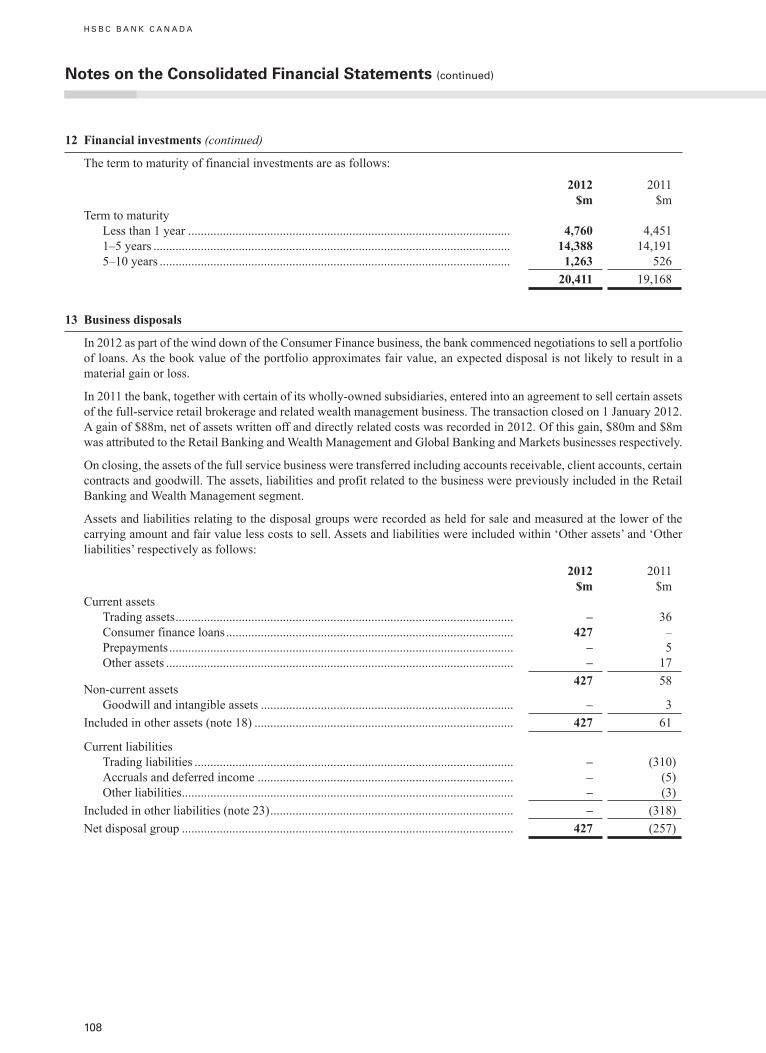
H S B C B A N K C A N A D A
12 Financial investments (continued)
The term to maturity of financial investments are as follows:
2012 $m
2011 $m
Term to maturity Less than 1 year ...................................................................................................... 4,760 4,451 1–5 years ................................................................................................................. 14,388 14,191 5–10 years ............................................................................................................... 1,263 526
20,411 19,168
13 Business disposals
In 2012 as part of the wind down of the Consumer Finance business, the bank commenced negotiations to sell a portfolio of loans. As the book value of the portfolio approximates fair value, an expected disposal is not likely to result in a material gain or loss.
In 2011 the bank, together with certain of its wholly-owned subsidiaries, entered into an agreement to sell certain assets of the full-service retail brokerage and related wealth management business. The transaction closed on 1 January 2012. A gain of $88m, net of assets written off and directly related costs was recorded in 2012. Of this gain, $80m and $8m was attributed to the Retail Banking and Wealth Management and Global Banking and Markets businesses respectively.
On closing, the assets of the full service business were transferred including accounts receivable, client accounts, certain contracts and goodwill. The assets, liabilities and profit related to the business were previously included in the Retail Banking and Wealth Management segment.
Assets and liabilities relating to the disposal groups were recorded as held for sale and measured at the lower of the carrying amount and fair value less costs to sell. Assets and liabilities were included within ‘Other assets’ and ‘Other liabilities’ respectively as follows:
2012 $m
2011 $m
Current assets Trading assets ........................................................................................................... – 36 Consumer finance loans ........................................................................................... 427 – Prepayments ............................................................................................................. – 5 Other assets .............................................................................................................. – 17
427 58Non-current assets Goodwill and intangible assets ................................................................................ – 3Included in other assets (note 18) .................................................................................. 427 61
Current liabilities Trading liabilities ..................................................................................................... – (310) Accruals and deferred income ................................................................................. – (5) Other liabilities ......................................................................................................... – (3)Included in other liabilities (note 23) ............................................................................. – (318)Net disposal group ......................................................................................................... 427 (257)
notes on the Consolidated Financial Statements (continued)
108

109
14 Interest rate sensitivity
The following table provides an analysis of the interest rate sensitivity position based on contractual repricing dates of assets and liabilities.
2012
Floa
ting
rate
$m
With
in
3 m
onth
s $m
3–12
m
onth
s $m
Aver
age
inte
rest
ra
te
%1–
5 ye
ars
$m
Aver
age
inte
rest
ra
te %
Gre
ater
th
an
5 ye
ars
$m
Aver
age
inte
rest
ra
te
%
Non
-in
tere
st
sens
itive
$m
Tota
l $m
Cas
h an
d ba
lanc
es a
t cen
tral
bank
......
......
......
......
......
...–
––
––
5656
Item
s in
the
cour
se o
f co
llect
ion
from
oth
er
bank
s ....
......
......
......
......
...–
––
––
9090
Trad
ing
asse
ts ...
......
......
......
...2,
682
2,54
149
1.2
––
–5,
272
Der
ivat
ives
......
......
......
......
....
––
––
–1,
810
1,81
0Lo
ans a
nd a
dvan
ces t
o ba
nks
–1,
282
–1.
3–
–19
81,
480
Loan
s and
adv
ance
s to
cus
tom
ers .
......
......
......
.27
,183
8,88
52,
505
3.4
6,62
54.
079
4.9
295
45,5
72Fi
nanc
ial i
nves
tmen
ts ...
......
...–
743
4,01
71.
514
,388
1.6
1,26
32.
3–
20,4
11A
ccep
tanc
es ..
......
......
......
......
––
––
–4,
737
4,73
7O
ther
ass
ets .
......
......
......
......
.. –
–
–
–
–
1,28
6 1,
286
Tota
l ass
ets .
......
......
......
......
...29
,865
13
,451
6,
571
21,0
13
1,34
2
8,
472
80,7
14
Dep
osits
by
bank
s ....
......
......
.–
1,55
61
0.9
––
616
2,17
3C
usto
mer
acc
ount
s ....
......
......
23,5
015,
982
6,54
11.
04,
045
2.7
–2.
18,
235
48,3
04Ite
ms i
n th
e co
urse
of
trans
mis
sion
to o
ther
ba
nks .
......
......
......
......
......
––
––
–71
71Tr
adin
g lia
bilit
ies .
......
......
.....
2,54
6–
–1.
0–
–12
62,
672
Fina
ncia
l lia
bilit
ies
desi
gnat
ed a
t fai
r val
ue ..
.–
––
436
4.8
––
436
Der
ivat
ives
......
......
......
......
....
––
––
–1,
415
1,41
5D
ebt s
ecur
ities
in is
sue .
......
...–
2,93
12,
836
2.3
6,12
03.
093
4.1
–11
,980
Acc
epta
nces
.....
......
......
......
...–
––
––
4,73
74,
737
Subo
rdin
ated
liab
ilitie
s ....
.....
–40
–1.
628
43.
9–
–32
4O
ther
liab
ilitie
s .....
......
......
.....
––
––
–3,
240
3,24
0Sh
areh
olde
rs’ e
quity
......
......
..–
2265
600
5.6
–4,
445
5,13
2N
on c
ontro
lling
inte
rest
.....
...–
––
200
–30
230
Tota
l lia
bilit
ies a
nd
shar
ehol
ders
’ equ
ity ..
......
26,0
4710
,531
9,44
311
,685
9322
,915
80,7
14O
n-ba
lanc
e sh
eet g
ap ...
......
...3,
818
2,92
0(2
,872
)9,
328
1,24
9(1
4,44
3)–
Off-
bala
nce
shee
t pos
ition
s ...
– (2
,907
)94
43,
160
(1,1
97)
––
Tota
l int
eres
t rat
e ga
p ....
......
..3,
818
13(1
,928
)12
,488
52(1
4,44
3)–
109
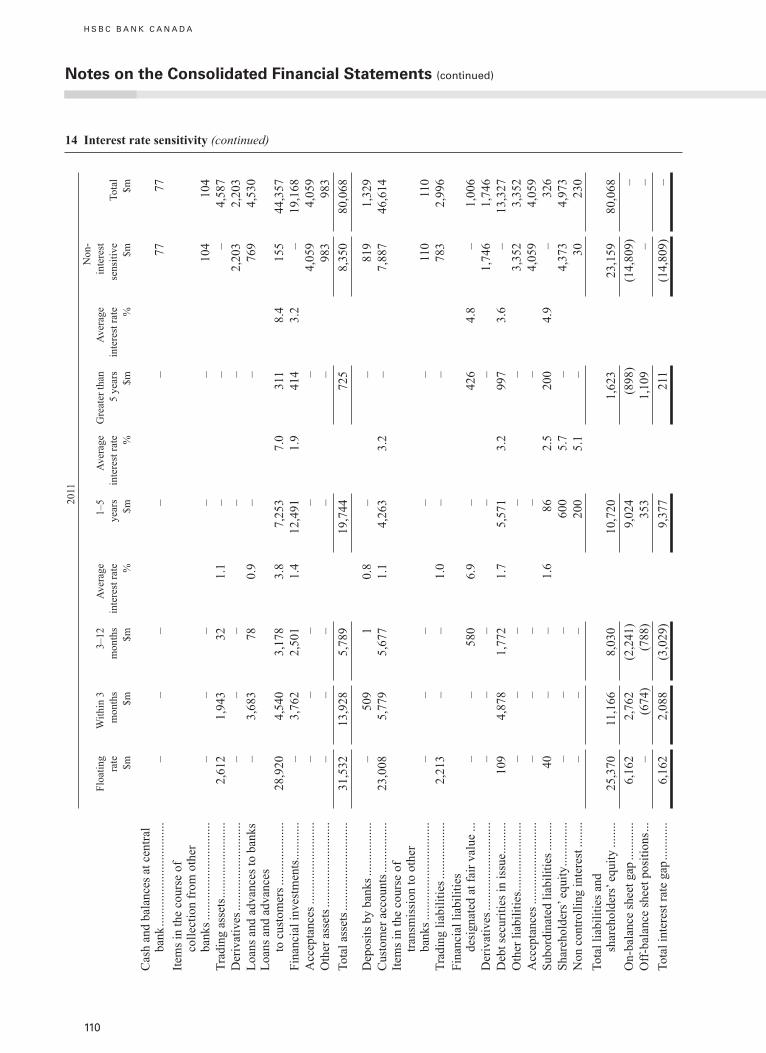
H S B C B A N K C A N A D A
14 Interest rate sensitivity (continued)
2011
Floa
ting
rate
$m
With
in 3
m
onth
s $m
3–12
m
onth
s $m
Aver
age
inte
rest
rate
%
1–5
year
s $m
Aver
age
inte
rest
rate
%
Gre
ater
than
5
year
s $m
Aver
age
inte
rest
rate
%
Non
-in
tere
st
sens
itive
$m
Tota
l $m
Cas
h an
d ba
lanc
es a
t cen
tral
bank
......
......
......
......
......
...–
––
––
7777
Item
s in
the
cour
se o
f co
llect
ion
from
oth
er
bank
s ....
......
......
......
......
...–
––
––
104
104
Trad
ing
asse
ts ...
......
......
......
...2,
612
1,94
332
1.1
––
–4,
587
Der
ivat
ives
......
......
......
......
....
––
––
–2,
203
2,20
3Lo
ans a
nd a
dvan
ces t
o ba
nks
–3,
683
780.
9–
–76
94,
530
Loan
s and
adv
ance
s to
cus
tom
ers .
......
......
......
.28
,920
4,54
03,
178
3.8
7,25
37.
031
18.
415
544
,357
Fina
ncia
l inv
estm
ents
......
......
–3,
762
2,50
11.
412
,491
1.9
414
3.2
–19
,168
Acc
epta
nces
.....
......
......
......
...–
––
––
4,05
94,
059
Oth
er a
sset
s ....
......
......
......
.....
––
––
–98
398
3To
tal a
sset
s ....
......
......
......
......
31,5
3213
,928
5,78
919
,744
725
8,35
080
,068
Dep
osits
by
bank
s ....
......
......
.–
509
10.
8–
–81
91,
329
Cus
tom
er a
ccou
nts .
......
......
...23
,008
5,77
95,
677
1.1
4,26
33.
2–
7,88
746
,614
Item
s in
the
cour
se o
f tra
nsm
issi
on to
oth
er
bank
s ....
......
......
......
......
...–
––
––
110
110
Trad
ing
liabi
litie
s ....
......
......
..2,
213
––
1.0
––
783
2,99
6Fi
nanc
ial l
iabi
litie
s de
sign
ated
at f
air v
alue
...
––
580
6.9
–42
64.
8–
1,00
6D
eriv
ativ
es ...
......
......
......
......
.–
––
––
1,74
61,
746
Deb
t sec
uriti
es in
issu
e ....
......
109
4,87
81,
772
1.7
5,57
13.
299
73.
6–
13,3
27O
ther
liab
ilitie
s .....
......
......
.....
––
––
–3,
352
3,35
2A
ccep
tanc
es ..
......
......
......
......
––
––
–4,
059
4,05
9Su
bord
inat
ed li
abili
ties .
......
..40
––
1.6
862.
520
04.
9–
326
Shar
ehol
ders
’ equ
ity ...
......
.....
––
–60
05.
7–
4,37
34,
973
Non
con
trolli
ng in
tere
st ..
......
– –
–20
05.
1–
3023
0To
tal l
iabi
litie
s and
sh
areh
olde
rs’ e
quity
.....
...25
,370
11,1
668,
030
10,7
201,
623
23,1
5980
,068
On-
bala
nce
shee
t gap
......
......
6,16
22,
762
(2,2
41)
9,02
4(8
98)
(14,
809)
–O
ff-ba
lanc
e sh
eet p
ositi
ons .
..–
(674
)(7
88)
353
1,10
9–
–To
tal i
nter
est r
ate
gap .
......
.....
6,16
22,
088
(3,0
29)
9,37
721
1(1
4,80
9)–
notes on the Consolidated Financial Statements (continued)
110
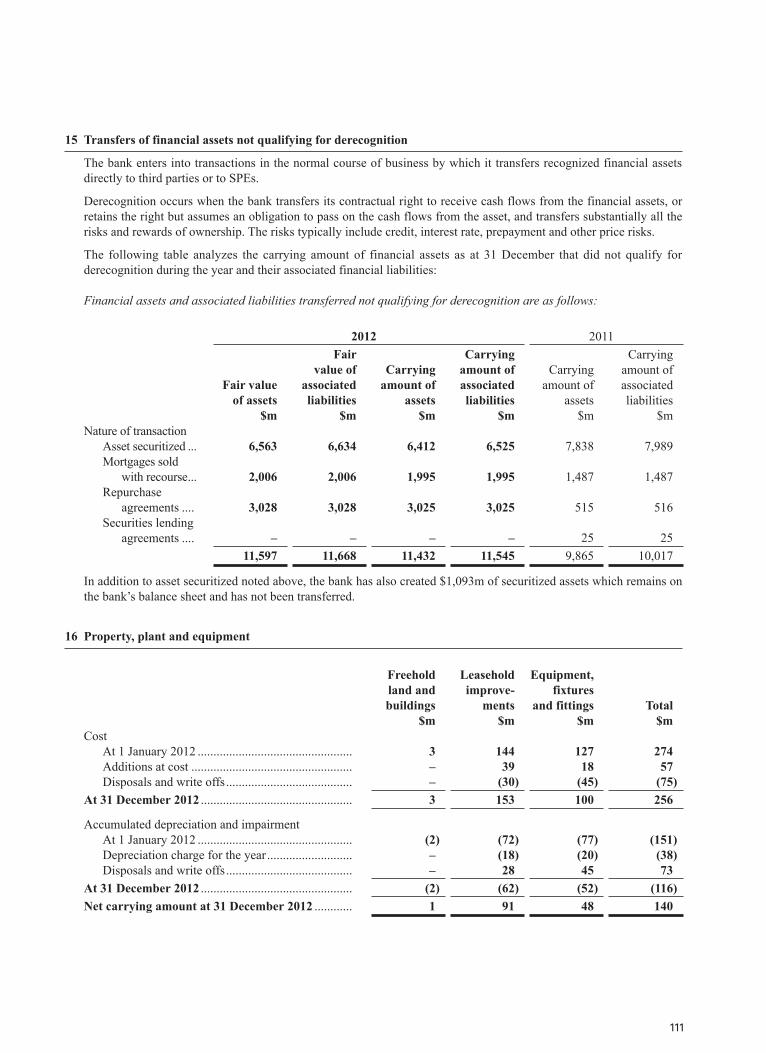
15 Transfers of financial assets not qualifying for derecognition
The bank enters into transactions in the normal course of business by which it transfers recognized financial assets directly to third parties or to SPEs.
Derecognition occurs when the bank transfers its contractual right to receive cash flows from the financial assets, or retains the right but assumes an obligation to pass on the cash flows from the asset, and transfers substantially all the risks and rewards of ownership. The risks typically include credit, interest rate, prepayment and other price risks.
The following table analyzes the carrying amount of financial assets as at 31 December that did not qualify for derecognition during the year and their associated financial liabilities:
Financial assets and associated liabilities transferred not qualifying for derecognition are as follows:
2012 2011
Fair value of assets
$m
Fair value of
associated liabilities
$m
Carrying amount of
assets $m
Carrying amount of associated liabilities
$m
Carrying amount of
assets $m
Carrying amount of associated liabilities
$mNature of transaction Asset securitized ... 6,563 6,634 6,412 6,525 7,838 7,989
Mortgages sold with recourse ... 2,006 2,006 1,995 1,995 1,487 1,487
Repurchase agreements .... 3,028 3,028 3,025 3,025 515 516
Securities lending agreements .... – – – – 25 25
11,597 11,668 11,432 11,545 9,865 10,017
In addition to asset securitized noted above, the bank has also created $1,093m of securitized assets which remains on the bank’s balance sheet and has not been transferred.
16 Property, plant and equipment
Freehold land and buildings
$m
Leasehold improve-
ments $m
Equipment, fixtures
and fittings $m
Total $m
Cost At 1 January 2012 ................................................. 3 144 127 274 Additions at cost ................................................... – 39 18 57 Disposals and write offs ........................................ – (30) (45) (75)At 31 December 2012 ................................................ 3 153 100 256
Accumulated depreciation and impairment At 1 January 2012 ................................................. (2) (72) (77) (151) Depreciation charge for the year ........................... – (18) (20) (38) Disposals and write offs ........................................ – 28 45 73At 31 December 2012 ................................................ (2) (62) (52) (116)Net carrying amount at 31 December 2012 ............ 1 91 48 140
111
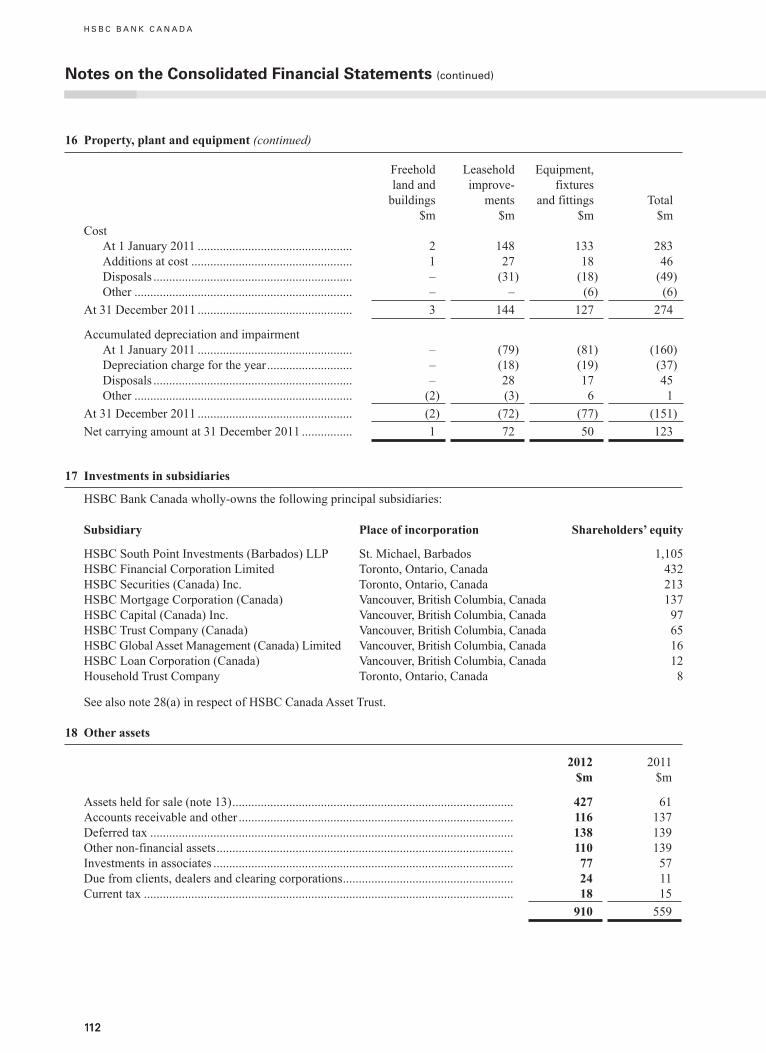
H S B C B A N K C A N A D A
112
16 Property, plant and equipment (continued)
Freehold land and
buildings $m
Leasehold improve-
ments $m
Equipment, fixtures
and fittings $m
Total $m
Cost At 1 January 2011 ................................................. 2 148 133 283 Additions at cost ................................................... 1 27 18 46 Disposals ............................................................... – (31) (18) (49) Other ..................................................................... – – (6) (6)At 31 December 2011 ................................................. 3 144 127 274
Accumulated depreciation and impairment At 1 January 2011 ................................................. – (79) (81) (160) Depreciation charge for the year ........................... – (18) (19) (37) Disposals ............................................................... – 28 17 45 Other ..................................................................... (2) (3) 6 1At 31 December 2011 ................................................. (2) (72) (77) (151)Net carrying amount at 31 December 2011 ................ 1 72 50 123
17 Investments in subsidiaries
HSBC Bank Canada wholly-owns the following principal subsidiaries:
Subsidiary Place of incorporation Shareholders’ equity
HSBC South Point Investments (Barbados) LLP St. Michael, Barbados 1,105HSBC Financial Corporation Limited Toronto, Ontario, Canada 432HSBC Securities (Canada) Inc. Toronto, Ontario, Canada 213HSBC Mortgage Corporation (Canada) Vancouver, British Columbia, Canada 137HSBC Capital (Canada) Inc. Vancouver, British Columbia, Canada 97HSBC Trust Company (Canada) Vancouver, British Columbia, Canada 65HSBC Global Asset Management (Canada) Limited Vancouver, British Columbia, Canada 16HSBC Loan Corporation (Canada) Vancouver, British Columbia, Canada 12Household Trust Company Toronto, Ontario, Canada 8
See also note 28(a) in respect of HSBC Canada Asset Trust.
18 Other assets
2012 $m
2011 $m
Assets held for sale (note 13) ......................................................................................... 427 61Accounts receivable and other ....................................................................................... 116 137Deferred tax ................................................................................................................... 138 139Other non-financial assets .............................................................................................. 110 139Investments in associates ............................................................................................... 77 57Due from clients, dealers and clearing corporations ...................................................... 24 11Current tax ..................................................................................................................... 18 15
910 559
notes on the Consolidated Financial Statements (continued)
112
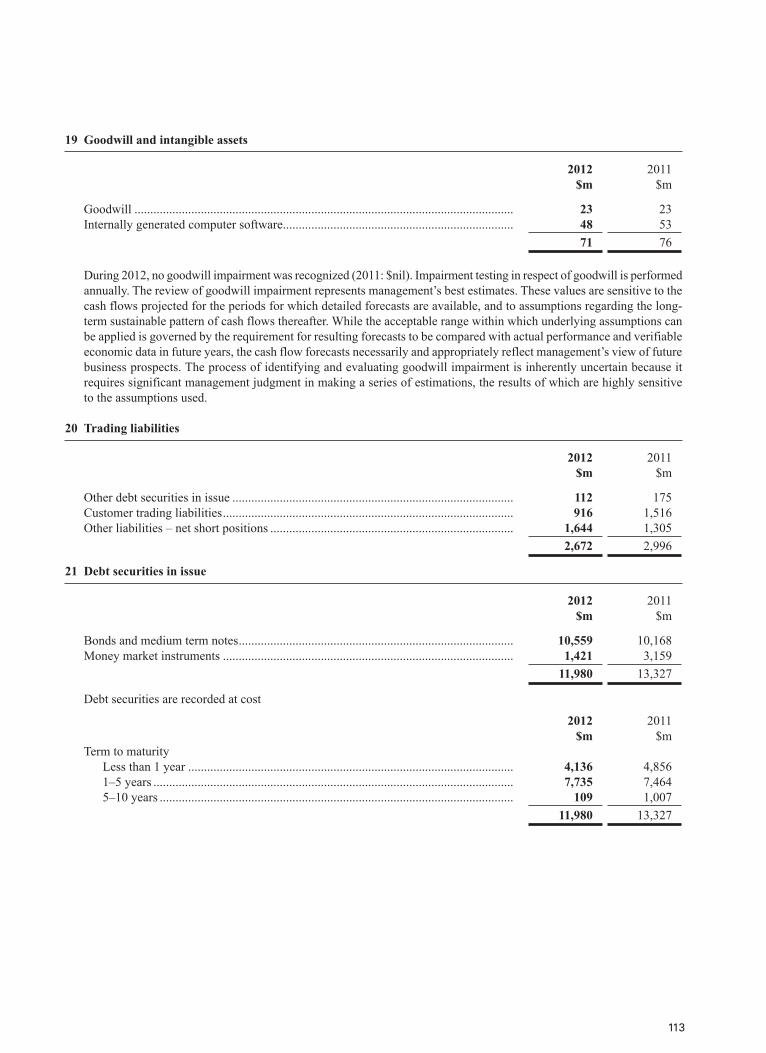
19 Goodwill and intangible assets
2012 $m
2011 $m
Goodwill ........................................................................................................................ 23 23Internally generated computer software ......................................................................... 48 53
71 76
During 2012, no goodwill impairment was recognized (2011: $nil). Impairment testing in respect of goodwill is performed annually. The review of goodwill impairment represents management’s best estimates. These values are sensitive to the cash flows projected for the periods for which detailed forecasts are available, and to assumptions regarding the long-term sustainable pattern of cash flows thereafter. While the acceptable range within which underlying assumptions can be applied is governed by the requirement for resulting forecasts to be compared with actual performance and verifiable economic data in future years, the cash flow forecasts necessarily and appropriately reflect management’s view of future business prospects. The process of identifying and evaluating goodwill impairment is inherently uncertain because it requires significant management judgment in making a series of estimations, the results of which are highly sensitive to the assumptions used.
20 Trading liabilities
2012 $m
2011 $m
Other debt securities in issue ......................................................................................... 112 175Customer trading liabilities ............................................................................................ 916 1,516Other liabilities – net short positions ............................................................................. 1,644 1,305
2,672 2,996
21 Debt securities in issue
2012 $m
2011 $m
Bonds and medium term notes ....................................................................................... 10,559 10,168Money market instruments ............................................................................................ 1,421 3,159
11,980 13,327
Debt securities are recorded at cost
2012 $m
2011 $m
Term to maturity Less than 1 year ....................................................................................................... 4,136 4,856 1–5 years .................................................................................................................. 7,735 7,464 5–10 years ................................................................................................................ 109 1,007
11,980 13,327
113
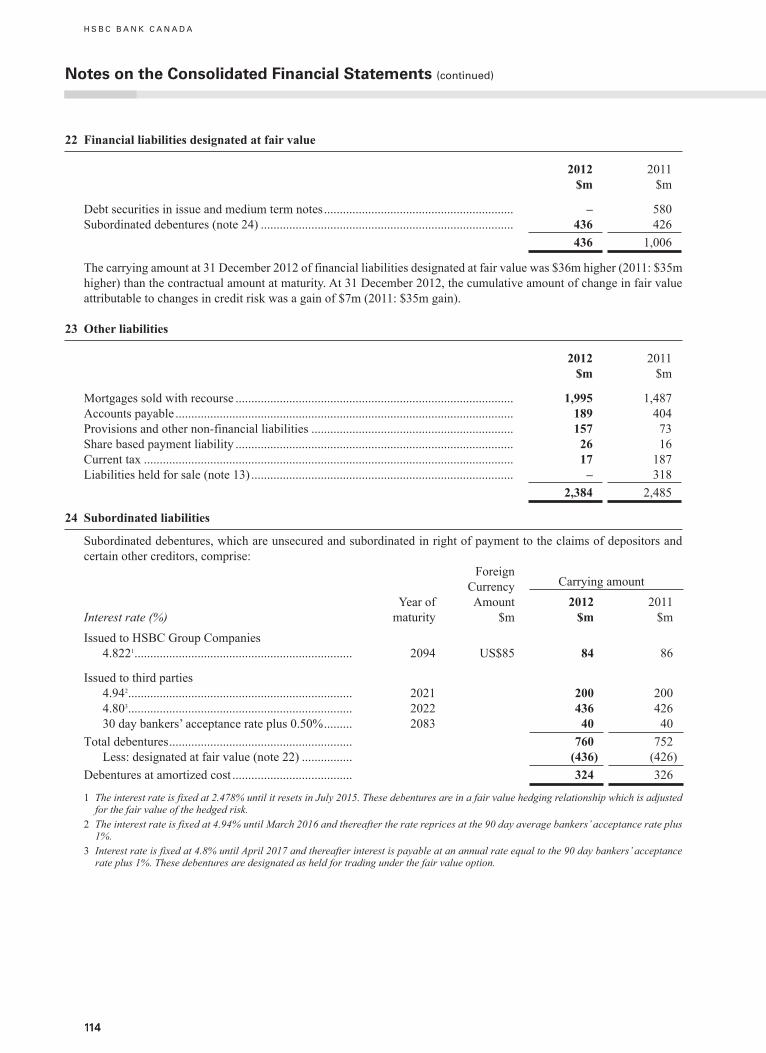
H S B C B A N K C A N A D A
114
22 Financial liabilities designated at fair value
2012 $m
2011 $m
Debt securities in issue and medium term notes ............................................................ – 580Subordinated debentures (note 24) ................................................................................ 436 426
436 1,006
The carrying amount at 31 December 2012 of financial liabilities designated at fair value was $36m higher (2011: $35m higher) than the contractual amount at maturity. At 31 December 2012, the cumulative amount of change in fair value attributable to changes in credit risk was a gain of $7m (2011: $35m gain).
23 Other liabilities
2012 $m
2011 $m
Mortgages sold with recourse ........................................................................................ 1,995 1,487Accounts payable ........................................................................................................... 189 404Provisions and other non-financial liabilities ................................................................ 157 73Share based payment liability ........................................................................................ 26 16Current tax ..................................................................................................................... 17 187Liabilities held for sale (note 13) ................................................................................... – 318
2,384 2,485
24 Subordinated liabilities
Subordinated debentures, which are unsecured and subordinated in right of payment to the claims of depositors and certain other creditors, comprise:
Year of maturity
Foreign Currency Amount
$m
Carrying amount
Interest rate (%)2012
$m2011
$mIssued to HSBC Group Companies 4.8221 ..................................................................... 2094 US$85 84 86
Issued to third parties 4.942 ....................................................................... 2021 200 200 4.803 ....................................................................... 2022 436 426 30 day bankers’ acceptance rate plus 0.50% ......... 2083 40 40Total debentures .......................................................... 760 752 Less: designated at fair value (note 22) ................ (436) (426)Debentures at amortized cost ...................................... 324 326
1 The interest rate is fixed at 2.478% until it resets in July 2015. These debentures are in a fair value hedging relationship which is adjusted for the fair value of the hedged risk.
2 The interest rate is fixed at 4.94% until March 2016 and thereafter the rate reprices at the 90 day average bankers’ acceptance rate plus 1%.
3 Interest rate is fixed at 4.8% until April 2017 and thereafter interest is payable at an annual rate equal to the 90 day bankers’ acceptance rate plus 1%. These debentures are designated as held for trading under the fair value option.
notes on the Consolidated Financial Statements (continued)
114
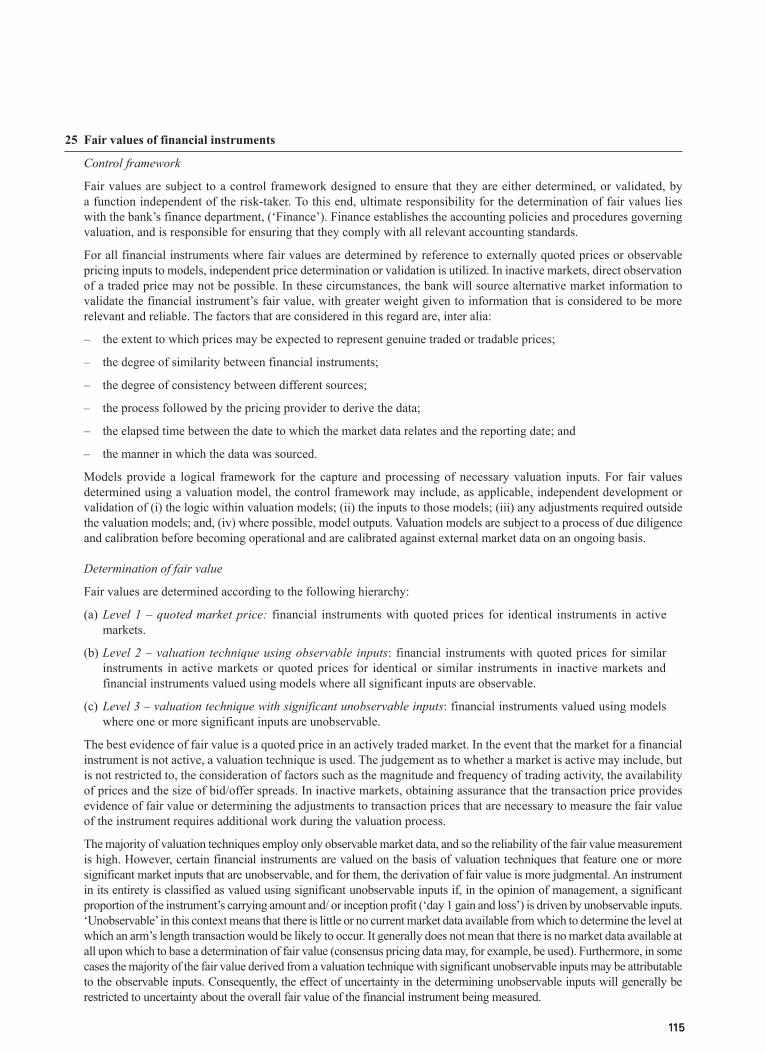
115
25 Fair values of financial instruments
Control framework
Fair values are subject to a control framework designed to ensure that they are either determined, or validated, by a function independent of the risk-taker. To this end, ultimate responsibility for the determination of fair values lies with the bank’s finance department, (‘Finance’). Finance establishes the accounting policies and procedures governing valuation, and is responsible for ensuring that they comply with all relevant accounting standards.
For all financial instruments where fair values are determined by reference to externally quoted prices or observable pricing inputs to models, independent price determination or validation is utilized. In inactive markets, direct observation of a traded price may not be possible. In these circumstances, the bank will source alternative market information to validate the financial instrument’s fair value, with greater weight given to information that is considered to be more relevant and reliable. The factors that are considered in this regard are, inter alia:
– the extent to which prices may be expected to represent genuine traded or tradable prices;
– the degree of similarity between financial instruments;
– the degree of consistency between different sources;
– the process followed by the pricing provider to derive the data;
– the elapsed time between the date to which the market data relates and the reporting date; and
– the manner in which the data was sourced.
Models provide a logical framework for the capture and processing of necessary valuation inputs. For fair values determined using a valuation model, the control framework may include, as applicable, independent development or validation of (i) the logic within valuation models; (ii) the inputs to those models; (iii) any adjustments required outside the valuation models; and, (iv) where possible, model outputs. Valuation models are subject to a process of due diligence and calibration before becoming operational and are calibrated against external market data on an ongoing basis.
Determination of fair value
Fair values are determined according to the following hierarchy:
(a) Level 1 – quoted market price: financial instruments with quoted prices for identical instruments in active markets.
(b) Level 2 – valuation technique using observable inputs: financial instruments with quoted prices for similar instruments in active markets or quoted prices for identical or similar instruments in inactive markets and financial instruments valued using models where all significant inputs are observable.
(c) Level 3 – valuation technique with significant unobservable inputs: financial instruments valued using models where one or more significant inputs are unobservable.
The best evidence of fair value is a quoted price in an actively traded market. In the event that the market for a financial instrument is not active, a valuation technique is used. The judgement as to whether a market is active may include, but is not restricted to, the consideration of factors such as the magnitude and frequency of trading activity, the availability of prices and the size of bid/offer spreads. In inactive markets, obtaining assurance that the transaction price provides evidence of fair value or determining the adjustments to transaction prices that are necessary to measure the fair value of the instrument requires additional work during the valuation process.
The majority of valuation techniques employ only observable market data, and so the reliability of the fair value measurement is high. However, certain financial instruments are valued on the basis of valuation techniques that feature one or more significant market inputs that are unobservable, and for them, the derivation of fair value is more judgmental. An instrument in its entirety is classified as valued using significant unobservable inputs if, in the opinion of management, a significant proportion of the instrument’s carrying amount and/ or inception profit (‘day 1 gain and loss’) is driven by unobservable inputs. ‘Unobservable’ in this context means that there is little or no current market data available from which to determine the level at which an arm’s length transaction would be likely to occur. It generally does not mean that there is no market data available at all upon which to base a determination of fair value (consensus pricing data may, for example, be used). Furthermore, in some cases the majority of the fair value derived from a valuation technique with significant unobservable inputs may be attributable to the observable inputs. Consequently, the effect of uncertainty in the determining unobservable inputs will generally be restricted to uncertainty about the overall fair value of the financial instrument being measured.
115
H S B C B A N K C A N A D A
116
notes on the Consolidated Financial Statements (continued)
25 Fair value of financial instruments (continued)
Determination of fair value (continued)
In certain circumstances, primarily where debt is hedged with interest rate derivatives or structured notes issued, the bank uses fair value to measure the carrying value of its own debt in issue. The bank records its own debt in issue at fair value, based on quoted prices in an active market for the specific instrument concerned, if available. When quoted market prices are unavailable, the own debt in issue is valued using valuation techniques, the inputs for which are either based upon quoted prices in an inactive market for the instrument, or are estimated by comparison with quoted prices in an active market for similar instruments. In both cases, the fair value includes the effect of applying the credit spread which is appropriate to the bank’s liabilities. For all issued debt securities, discounted cash flow modelling is used to separate the change in fair value that may be attributed to the bank’s credit spread movements from movements in other market factors such as benchmark interest rates or foreign exchange rates. Specifically, the change in fair value of issued debt securities attributable to the bank’s own credit spread is computed as follows: for each security at each reporting date, an externally verifiable price is obtained or a price is derived using credit spreads for similar securities for the same issuer. Then, using discounted cash flow, each security is valued using a risk-free discount curve. The difference in the valuations is attributable to the bank’s own credit spread. This methodology is applied consistently across all securities.
Structured notes issued and certain other hybrid instrument liabilities are included within trading liabilities and are measured at fair value. The credit spread applied to these instruments is derived from the spreads at which the bank issues structured notes. These market spreads are significantly smaller than credit spreads observed for plain vanilla debt or in the credit default swap markets.
Gains and losses arising from changes in the credit spread of liabilities issued by the bank reverse over the contractual life of the debt, provided that the debt is not repaid early. All net positions in non-derivative financial instruments, and all derivative portfolios, are valued at bid or offer prices as appropriate. Long positions are marked at bid prices; short positions are marked at offer prices.
The fair value of a portfolio of financial instruments quoted in an active market is calculated as the product of the number of units and its quoted price and no block discounts are made.
Transaction costs are not included in the fair value calculation, nor are the future costs of administering the over the counter derivative portfolio. These, along with trade origination costs such as brokerage fees and post-trade costs, are included either in ‘Fee expense’ or in ‘Total operating expenses’.
A detailed description of the valuation techniques applied to instruments of particular interest follows:
– Private equity
The bank’s private equity positions are generally classified as available-for-sale and are not traded in active markets. In the absence of an active market, an investment’s fair value is estimated on the basis of an analysis of the investee’s financial position and results, risk profile, prospects and other factors, as well as by reference to market valuations for similar entities quoted in an active market, or the price at which similar companies have changed ownership. The exercise of judgment is required because of uncertainties inherent in estimating fair value for private equity investments.
– Debt securities, treasury and other eligible bills, and equities
The fair value of these instruments is based on quoted market prices from an exchange, dealer, broker, industry group or pricing service, when available. When unavailable, the fair value is determined by reference to quoted market prices for similar instruments, adjusted as appropriate for the specific circumstances of the instruments.
Illiquidity and a lack of transparency in the market for asset- backed securities has resulted in less observable data being available. While quoted market prices are generally used to determine the fair value of these securities, valuation models are used to substantiate the reliability of the limited market data available and to identify whether any adjustments to quoted market prices are required.
In the absence of quoted market prices, fair value is determined using valuation techniques based on the calculation of the present value of expected future cash flows of the assets. The inputs to these valuation techniques are derived from observable market data and, where relevant, assumptions in respect of unobservable inputs. In respect of asset-backed securities and mortgages, the assumptions may include prepayment speeds, default rates and loss severity based on collateral type, and performance as appropriate. The valuation output is benchmarked for consistency against observable data for securities of a similar nature.
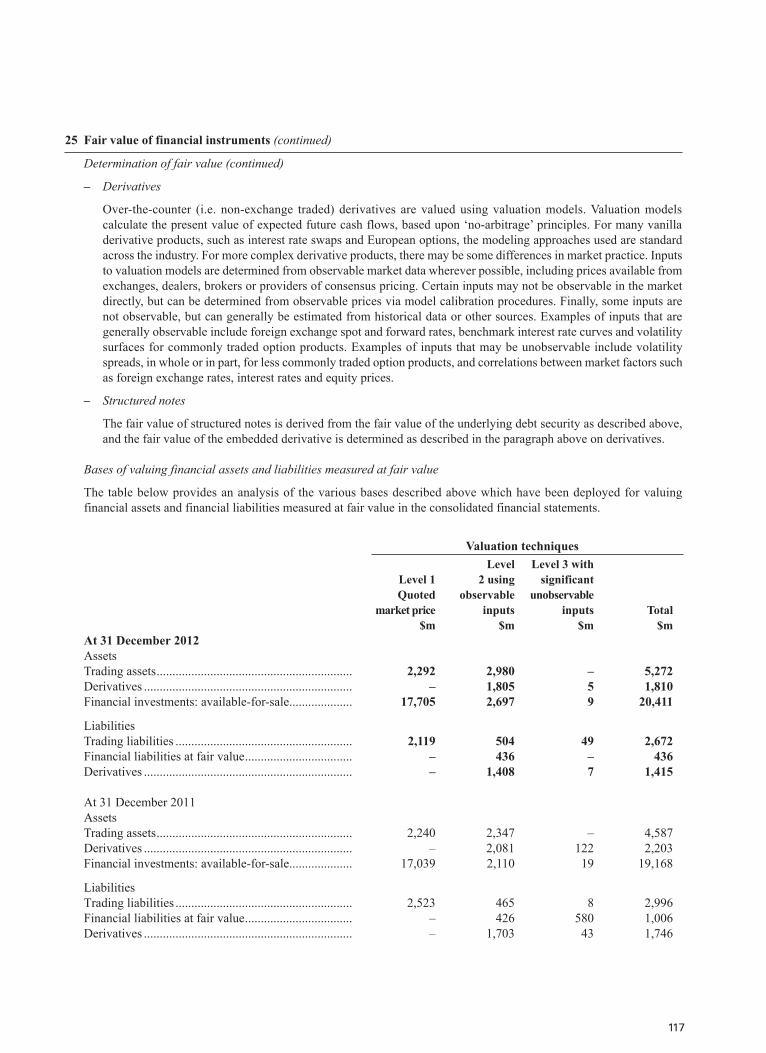
117
25 Fair value of financial instruments (continued)
Determination of fair value (continued)
– Derivatives
Over-the-counter (i.e. non-exchange traded) derivatives are valued using valuation models. Valuation models calculate the present value of expected future cash flows, based upon ‘no-arbitrage’ principles. For many vanilla derivative products, such as interest rate swaps and European options, the modeling approaches used are standard across the industry. For more complex derivative products, there may be some differences in market practice. Inputs to valuation models are determined from observable market data wherever possible, including prices available from exchanges, dealers, brokers or providers of consensus pricing. Certain inputs may not be observable in the market directly, but can be determined from observable prices via model calibration procedures. Finally, some inputs are not observable, but can generally be estimated from historical data or other sources. Examples of inputs that are generally observable include foreign exchange spot and forward rates, benchmark interest rate curves and volatility surfaces for commonly traded option products. Examples of inputs that may be unobservable include volatility spreads, in whole or in part, for less commonly traded option products, and correlations between market factors such as foreign exchange rates, interest rates and equity prices.
– Structured notes
The fair value of structured notes is derived from the fair value of the underlying debt security as described above, and the fair value of the embedded derivative is determined as described in the paragraph above on derivatives.
Bases of valuing financial assets and liabilities measured at fair value
The table below provides an analysis of the various bases described above which have been deployed for valuing financial assets and financial liabilities measured at fair value in the consolidated financial statements.
Valuation techniques
Level 1 Quoted
market price $m
Level 2 using
observable inputs
$m
Level 3 with significant
unobservable inputs
$mTotal
$mAt 31 December 2012AssetsTrading assets .............................................................. 2,292 2,980 – 5,272Derivatives .................................................................. – 1,805 5 1,810Financial investments: available-for-sale.................... 17,705 2,697 9 20,411
LiabilitiesTrading liabilities ........................................................ 2,119 504 49 2,672Financial liabilities at fair value .................................. – 436 – 436Derivatives .................................................................. – 1,408 7 1,415
At 31 December 2011AssetsTrading assets .............................................................. 2,240 2,347 – 4,587Derivatives .................................................................. – 2,081 122 2,203Financial investments: available-for-sale.................... 17,039 2,110 19 19,168
LiabilitiesTrading liabilities ........................................................ 2,523 465 8 2,996Financial liabilities at fair value .................................. – 426 580 1,006Derivatives .................................................................. – 1,703 43 1,746
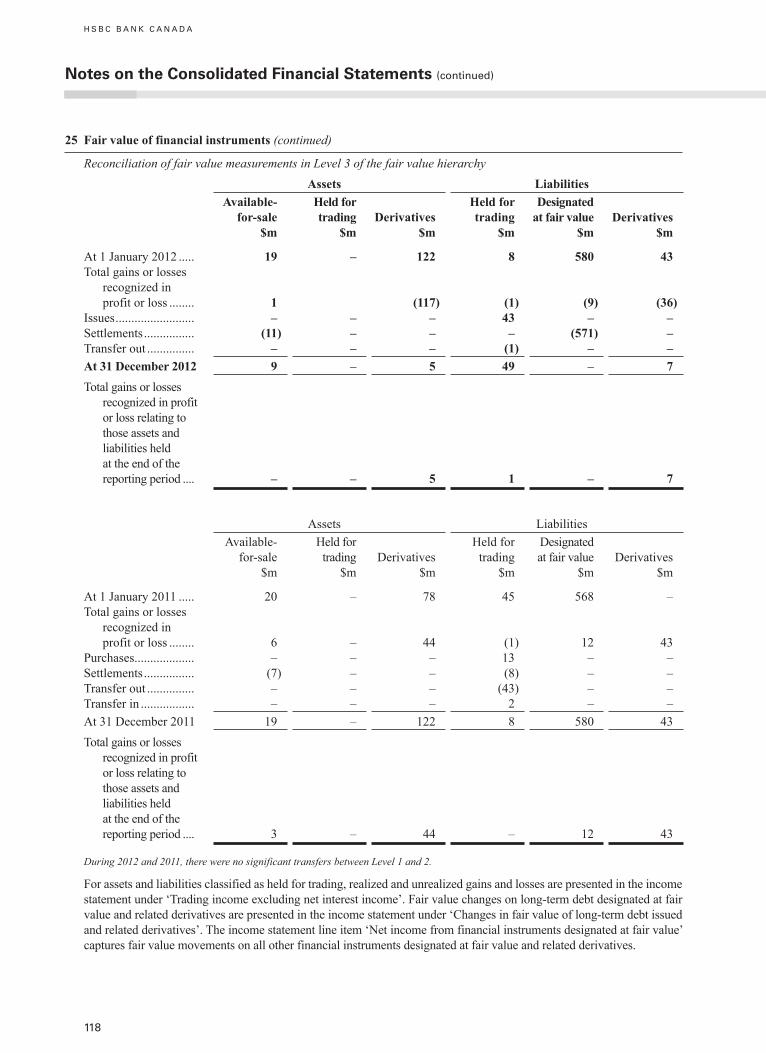
H S B C B A N K C A N A D A
118
25 Fair value of financial instruments (continued)
Reconciliation of fair value measurements in Level 3 of the fair value hierarchy Assets Liabilities
Available-for-sale
$m
Held for trading
$mDerivatives
$m
Held for trading
$m
Designated at fair value
$mDerivatives
$m
At 1 January 2012 ..... 19 – 122 8 580 43Total gains or losses
recognized in profit or loss ........ 1 (117) (1) (9) (36)
Issues ......................... – – – 43 – –Settlements ................ (11) – – – (571) –Transfer out ............... – – – (1) – –At 31 December 2012 9 – 5 49 – 7Total gains or losses
recognized in profit or loss relating to those assets and liabilities held at the end of the reporting period .... – – 5 1 – 7
Assets LiabilitiesAvailable-
for-sale $m
Held for trading
$mDerivatives
$m
Held for trading
$m
Designated at fair value
$mDerivatives
$m
At 1 January 2011 ..... 20 – 78 45 568 –Total gains or losses
recognized in profit or loss ........ 6 – 44 (1) 12 43
Purchases ................... – – – 13 – –Settlements ................ (7) – – (8) – –Transfer out ............... – – – (43) – –Transfer in ................. – – – 2 – –At 31 December 2011 19 – 122 8 580 43Total gains or losses
recognized in profit or loss relating to those assets and liabilities held at the end of the reporting period .... 3 – 44 – 12 43
During 2012 and 2011, there were no significant transfers between Level 1 and 2.
For assets and liabilities classified as held for trading, realized and unrealized gains and losses are presented in the income statement under ‘Trading income excluding net interest income’. Fair value changes on long-term debt designated at fair value and related derivatives are presented in the income statement under ‘Changes in fair value of long-term debt issued and related derivatives’. The income statement line item ‘Net income from financial instruments designated at fair value’ captures fair value movements on all other financial instruments designated at fair value and related derivatives.
notes on the Consolidated Financial Statements (continued)

119
25 Fair value of financial instruments (continued)
Reconciliation of fair value measurements in Level 3 of the fair value hierarchy (continued)
Realized gains and losses from available-for-sale securities are presented under ‘Gains less losses from financial investments’ in the income statement while unrealized gains and losses are presented in ‘Fair value gains’ taken to equity within ‘Available-for-sale investments’ in other comprehensive income.
Fair values of financial instruments not carried at fair value
Fair values at the balance sheet date of the assets and liabilities set out below are estimated for the purpose of disclosure at follows:
i) Loans and advances to banks and customers
The fair value of loans and advances is based on observable market transactions, where available. In the absence of observable market transactions, fair value is estimated using discounted cash flow models. Performing loans are grouped, as far as possible, into homogeneous pools segregated by maturity and coupon rates. In general, contractual cash flows are discounted using the bank’s estimate of the discount rate that a market participant would use in valuing instruments with similar maturity, repricing and credit risk characteristics.
The fair value of a loan portfolio reflects both loan impairments at the reporting date and estimates of market participants’ expectations of credit losses over the life of the loans. For impaired loans, fair value is estimated by discounting the future cash flows over the time period in which they are expected to be recovered.
ii) Deposits by banks and customer accounts
For the purposes of estimating fair value, deposits by banks and customer accounts are grouped by residual maturity. Fair values are estimated using discounted cash flows, applying current rates offered for deposits of similar remaining maturities. The fair value of a deposit repayable on demand is assumed to be the amount payable on demand at the reporting date.
iii) Debt securities in issue and subordinated liabilities
Fair values are determined using quoted market prices at the reporting date where available, or by reference to quoted market prices for similar instruments.
The fair values in this note are stated at a specific date and may be significantly different from the amounts which will actually be paid on the maturity or settlement dates of the instruments. In many cases, it would not be possible to realize immediately the estimated fair values given the size of the portfolios measured. Accordingly, these fair values do not represent the value of these financial instruments to the bank as a going concern.
For all classes of financial instruments, fair value represents the product of the value of a single instrument, multiplied by the number of instruments held.
The following table lists financial instruments whose carrying amount is a reasonable approximation of fair value because, for example, they are short-term in nature or reprice to current market rates frequently:
Assets Liabilities
Cash and balances at central bank Items in the course of transmission to other banksItems in the course of collection from other banks Acceptances Customers’ liability under acceptances Short-term payables within ‘Other liabilities’Short-term receivables within ‘Other assets’ AccrualsAccrued income
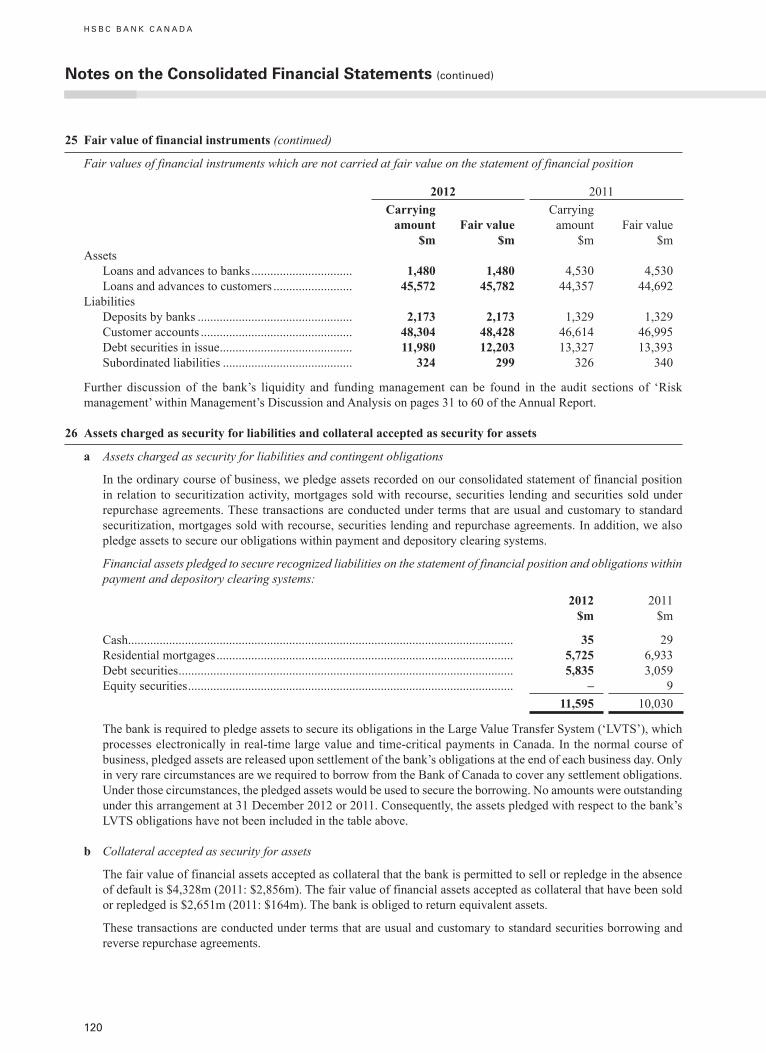
H S B C B A N K C A N A D A
120
notes on the Consolidated Financial Statements (continued)
25 Fair value of financial instruments (continued)
Fair values of financial instruments which are not carried at fair value on the statement of financial position
2012 2011Carrying
amount $m
Fair value $m
Carrying amount
$mFair value
$mAssets Loans and advances to banks ................................ 1,480 1,480 4,530 4,530 Loans and advances to customers ......................... 45,572 45,782 44,357 44,692Liabilities Deposits by banks ................................................. 2,173 2,173 1,329 1,329 Customer accounts ................................................ 48,304 48,428 46,614 46,995 Debt securities in issue .......................................... 11,980 12,203 13,327 13,393 Subordinated liabilities ......................................... 324 299 326 340
Further discussion of the bank’s liquidity and funding management can be found in the audit sections of ‘Risk management’ within Management’s Discussion and Analysis on pages 31 to 60 of the Annual Report.
26 Assets charged as security for liabilities and collateral accepted as security for assets
a Assets charged as security for liabilities and contingent obligations
In the ordinary course of business, we pledge assets recorded on our consolidated statement of financial position in relation to securitization activity, mortgages sold with recourse, securities lending and securities sold under repurchase agreements. These transactions are conducted under terms that are usual and customary to standard securitization, mortgages sold with recourse, securities lending and repurchase agreements. In addition, we also pledge assets to secure our obligations within payment and depository clearing systems.
Financial assets pledged to secure recognized liabilities on the statement of financial position and obligations within payment and depository clearing systems:
2012 $m
2011 $m
Cash.......................................................................................................................... 35 29Residential mortgages .............................................................................................. 5,725 6,933Debt securities .......................................................................................................... 5,835 3,059Equity securities ....................................................................................................... – 9
11,595 10,030
The bank is required to pledge assets to secure its obligations in the Large Value Transfer System (‘LVTS’), which processes electronically in real-time large value and time-critical payments in Canada. In the normal course of business, pledged assets are released upon settlement of the bank’s obligations at the end of each business day. Only in very rare circumstances are we required to borrow from the Bank of Canada to cover any settlement obligations. Under those circumstances, the pledged assets would be used to secure the borrowing. No amounts were outstanding under this arrangement at 31 December 2012 or 2011. Consequently, the assets pledged with respect to the bank’s LVTS obligations have not been included in the table above.
b Collateral accepted as security for assets
The fair value of financial assets accepted as collateral that the bank is permitted to sell or repledge in the absence of default is $4,328m (2011: $2,856m). The fair value of financial assets accepted as collateral that have been sold or repledged is $2,651m (2011: $164m). The bank is obliged to return equivalent assets.
These transactions are conducted under terms that are usual and customary to standard securities borrowing and reverse repurchase agreements.
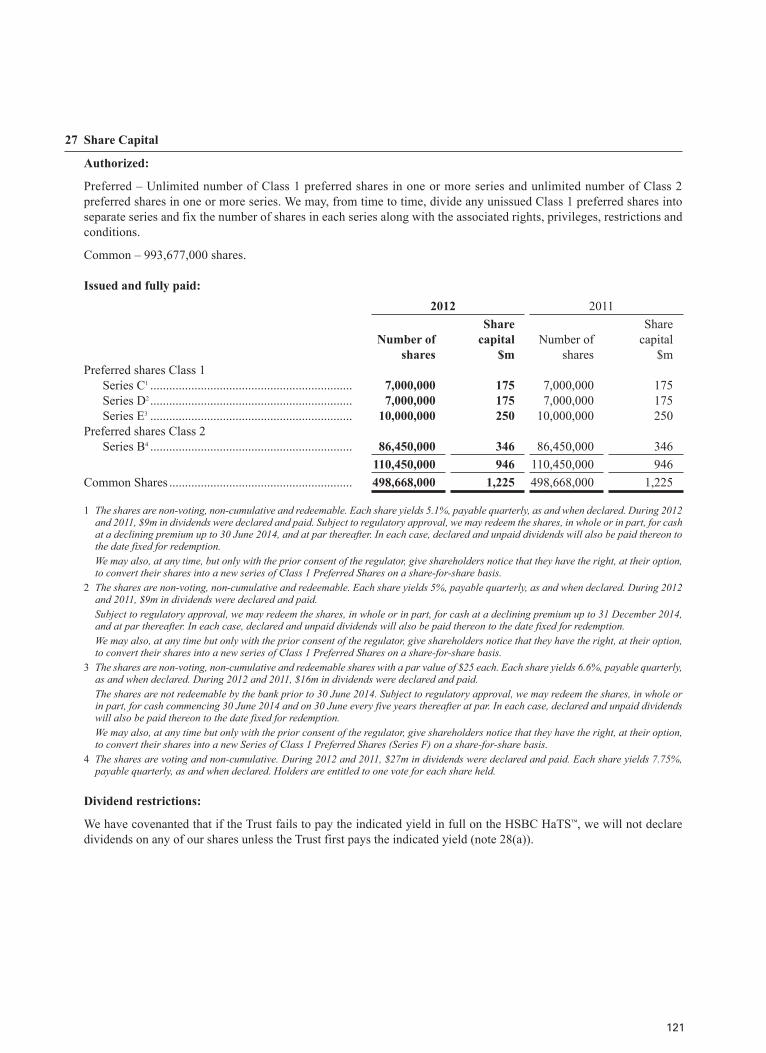
121
27 Share Capital
Authorized:
Preferred – Unlimited number of Class 1 preferred shares in one or more series and unlimited number of Class 2 preferred shares in one or more series. We may, from time to time, divide any unissued Class 1 preferred shares into separate series and fix the number of shares in each series along with the associated rights, privileges, restrictions and conditions.
Common – 993,677,000 shares.
Issued and fully paid:2012 2011
Number ofshares
Share capital
$mNumber of
shares
Share capital
$mPreferred shares Class 1 Series C1 ................................................................ 7,000,000 175 7,000,000 175 Series D2 ................................................................ 7,000,000 175 7,000,000 175 Series E3 ................................................................ 10,000,000 250 10,000,000 250Preferred shares Class 2 Series B4 ................................................................ 86,450,000 346 86,450,000 346
110,450,000 946 110,450,000 946Common Shares .......................................................... 498,668,000 1,225 498,668,000 1,225
1 The shares are non-voting, non-cumulative and redeemable. Each share yields 5.1%, payable quarterly, as and when declared. During 2012 and 2011, $9m in dividends were declared and paid. Subject to regulatory approval, we may redeem the shares, in whole or in part, for cash at a declining premium up to 30 June 2014, and at par thereafter. In each case, declared and unpaid dividends will also be paid thereon to the date fixed for redemption.
We may also, at any time, but only with the prior consent of the regulator, give shareholders notice that they have the right, at their option, to convert their shares into a new series of Class 1 Preferred Shares on a share-for-share basis.
2 The shares are non-voting, non-cumulative and redeemable. Each share yields 5%, payable quarterly, as and when declared. During 2012 and 2011, $9m in dividends were declared and paid.
Subject to regulatory approval, we may redeem the shares, in whole or in part, for cash at a declining premium up to 31 December 2014, and at par thereafter. In each case, declared and unpaid dividends will also be paid thereon to the date fixed for redemption.
We may also, at any time but only with the prior consent of the regulator, give shareholders notice that they have the right, at their option, to convert their shares into a new series of Class 1 Preferred Shares on a share-for-share basis.
3 The shares are non-voting, non-cumulative and redeemable shares with a par value of $25 each. Each share yields 6.6%, payable quarterly, as and when declared. During 2012 and 2011, $16m in dividends were declared and paid.
The shares are not redeemable by the bank prior to 30 June 2014. Subject to regulatory approval, we may redeem the shares, in whole or in part, for cash commencing 30 June 2014 and on 30 June every five years thereafter at par. In each case, declared and unpaid dividends will also be paid thereon to the date fixed for redemption.
We may also, at any time but only with the prior consent of the regulator, give shareholders notice that they have the right, at their option, to convert their shares into a new Series of Class 1 Preferred Shares (Series F) on a share-for-share basis.
4 The shares are voting and non-cumulative. During 2012 and 2011, $27m in dividends were declared and paid. Each share yields 7.75%, payable quarterly, as and when declared. Holders are entitled to one vote for each share held.
Dividend restrictions:
We have covenanted that if the Trust fails to pay the indicated yield in full on the HSBC HaTS™, we will not declare dividends on any of our shares unless the Trust first pays the indicated yield (note 28(a)).
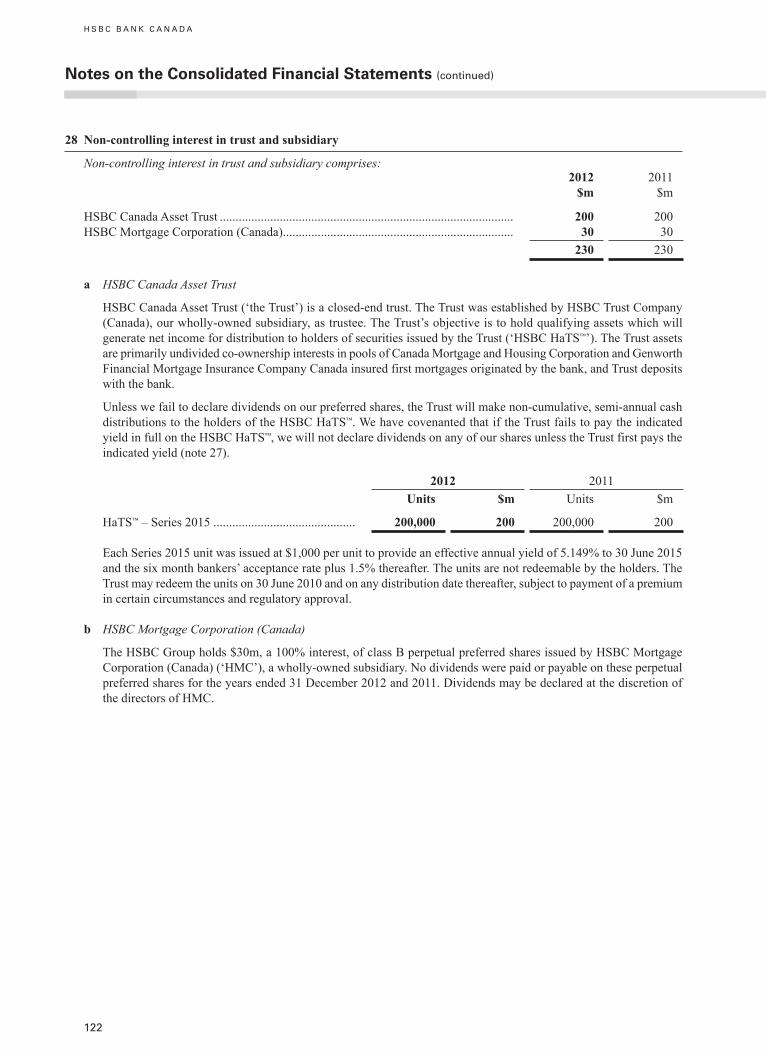
H S B C B A N K C A N A D A
122
notes on the Consolidated Financial Statements (continued)
28 Non-controlling interest in trust and subsidiary
Non-controlling interest in trust and subsidiary comprises:2012
$m2011
$m
HSBC Canada Asset Trust ............................................................................................. 200 200HSBC Mortgage Corporation (Canada) ......................................................................... 30 30
230 230
a HSBC Canada Asset Trust
HSBC Canada Asset Trust (‘the Trust’) is a closed-end trust. The Trust was established by HSBC Trust Company (Canada), our wholly-owned subsidiary, as trustee. The Trust’s objective is to hold qualifying assets which will generate net income for distribution to holders of securities issued by the Trust (‘HSBC HaTS™’). The Trust assets are primarily undivided co-ownership interests in pools of Canada Mortgage and Housing Corporation and Genworth Financial Mortgage Insurance Company Canada insured first mortgages originated by the bank, and Trust deposits with the bank.
Unless we fail to declare dividends on our preferred shares, the Trust will make non-cumulative, semi-annual cash distributions to the holders of the HSBC HaTS™. We have covenanted that if the Trust fails to pay the indicated yield in full on the HSBC HaTS™, we will not declare dividends on any of our shares unless the Trust first pays the indicated yield (note 27).
2012 2011Units $m Units $m
HaTS™ – Series 2015 ............................................. 200,000 200 200,000 200
Each Series 2015 unit was issued at $1,000 per unit to provide an effective annual yield of 5.149% to 30 June 2015 and the six month bankers’ acceptance rate plus 1.5% thereafter. The units are not redeemable by the holders. The Trust may redeem the units on 30 June 2010 and on any distribution date thereafter, subject to payment of a premium in certain circumstances and regulatory approval.
b HSBC Mortgage Corporation (Canada)
The HSBC Group holds $30m, a 100% interest, of class B perpetual preferred shares issued by HSBC Mortgage Corporation (Canada) (‘HMC’), a wholly-owned subsidiary. No dividends were paid or payable on these perpetual preferred shares for the years ended 31 December 2012 and 2011. Dividends may be declared at the discretion of the directors of HMC.
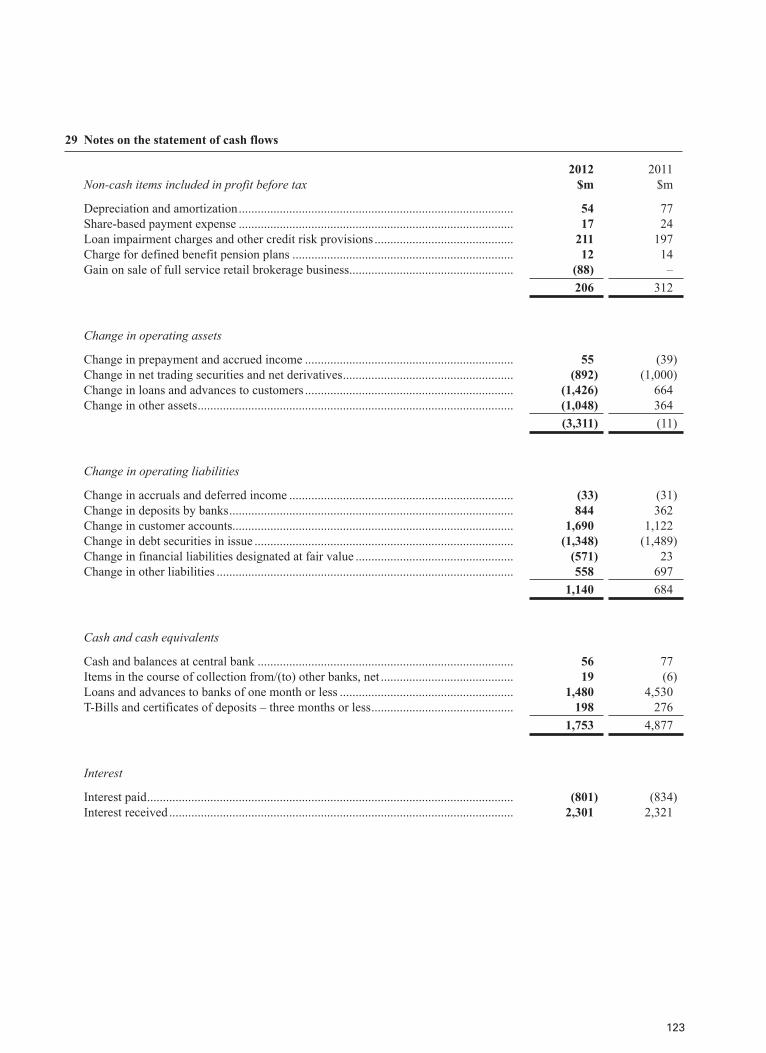
123
29 Notes on the statement of cash flows
Non-cash items included in profit before tax2012
$m2011
$m
Depreciation and amortization ....................................................................................... 54 77Share-based payment expense ....................................................................................... 17 24Loan impairment charges and other credit risk provisions ............................................ 211 197Charge for defined benefit pension plans ...................................................................... 12 14Gain on sale of full service retail brokerage business .................................................... (88) –
206 312
Change in operating assets
Change in prepayment and accrued income .................................................................. 55 (39)Change in net trading securities and net derivatives ...................................................... (892) (1,000)Change in loans and advances to customers .................................................................. (1,426) 664Change in other assets .................................................................................................... (1,048) 364
(3,311) (11)
Change in operating liabilities
Change in accruals and deferred income ....................................................................... (33) (31)Change in deposits by banks .......................................................................................... 844 362Change in customer accounts ......................................................................................... 1,690 1,122Change in debt securities in issue .................................................................................. (1,348) (1,489)Change in financial liabilities designated at fair value .................................................. (571) 23Change in other liabilities .............................................................................................. 558 697
1,140 684
Cash and cash equivalents
Cash and balances at central bank ................................................................................. 56 77Items in the course of collection from/(to) other banks, net .......................................... 19 (6)Loans and advances to banks of one month or less ....................................................... 1,480 4,530T-Bills and certificates of deposits – three months or less ............................................. 198 276
1,753 4,877
Interest
Interest paid .................................................................................................................... (801) (834)Interest received ............................................................................................................. 2,301 2,321
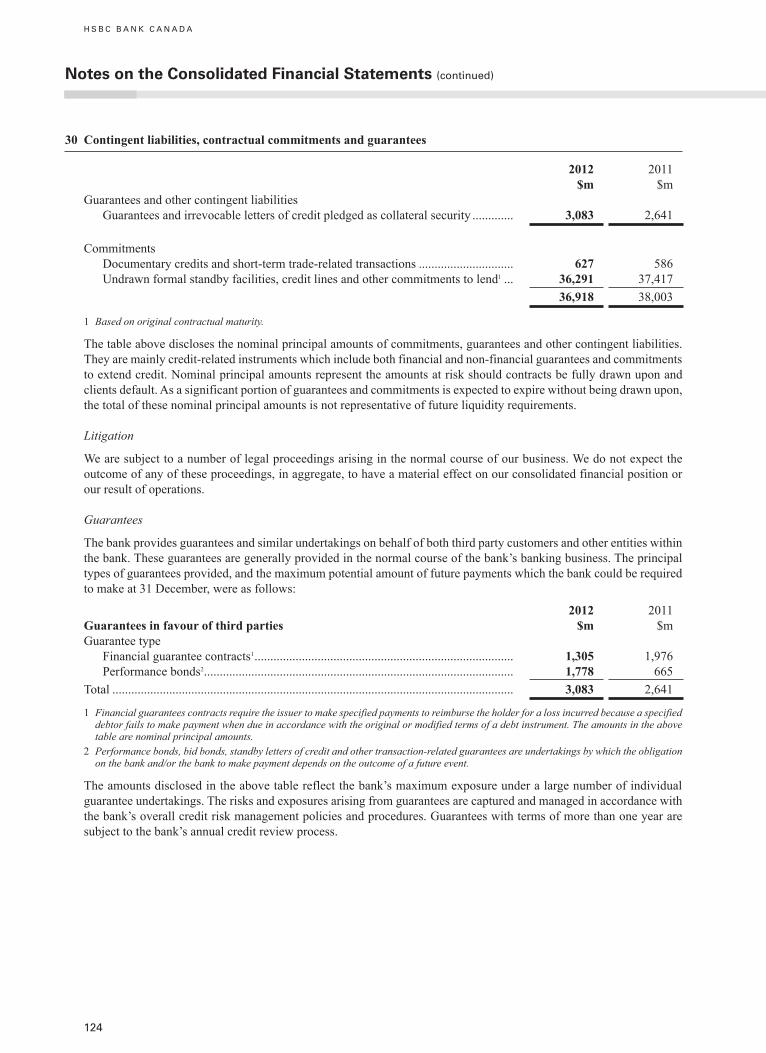
H S B C B A N K C A N A D A
124
30 Contingent liabilities, contractual commitments and guarantees
2012 $m
2011 $m
Guarantees and other contingent liabilities Guarantees and irrevocable letters of credit pledged as collateral security ............. 3,083 2,641
Commitments Documentary credits and short-term trade-related transactions .............................. 627 586 Undrawn formal standby facilities, credit lines and other commitments to lend1 ... 36,291 37,417
36,918 38,003
1 Based on original contractual maturity.
The table above discloses the nominal principal amounts of commitments, guarantees and other contingent liabilities. They are mainly credit-related instruments which include both financial and non-financial guarantees and commitments to extend credit. Nominal principal amounts represent the amounts at risk should contracts be fully drawn upon and clients default. As a significant portion of guarantees and commitments is expected to expire without being drawn upon, the total of these nominal principal amounts is not representative of future liquidity requirements.
Litigation
We are subject to a number of legal proceedings arising in the normal course of our business. We do not expect the outcome of any of these proceedings, in aggregate, to have a material effect on our consolidated financial position or our result of operations.
Guarantees
The bank provides guarantees and similar undertakings on behalf of both third party customers and other entities within the bank. These guarantees are generally provided in the normal course of the bank’s banking business. The principal types of guarantees provided, and the maximum potential amount of future payments which the bank could be required to make at 31 December, were as follows:
Guarantees in favour of third parties2012
$m2011
$mGuarantee type Financial guarantee contracts1 .................................................................................. 1,305 1,976 Performance bonds2 .................................................................................................. 1,778 665Total ............................................................................................................................... 3,083 2,641
1 Financial guarantees contracts require the issuer to make specified payments to reimburse the holder for a loss incurred because a specified debtor fails to make payment when due in accordance with the original or modified terms of a debt instrument. The amounts in the above table are nominal principal amounts.
2 Performance bonds, bid bonds, standby letters of credit and other transaction-related guarantees are undertakings by which the obligation on the bank and/or the bank to make payment depends on the outcome of a future event.
The amounts disclosed in the above table reflect the bank’s maximum exposure under a large number of individual guarantee undertakings. The risks and exposures arising from guarantees are captured and managed in accordance with the bank’s overall credit risk management policies and procedures. Guarantees with terms of more than one year are subject to the bank’s annual credit review process.
notes on the Consolidated Financial Statements (continued)

125
30 Contingent liabilities, contractual commitments and guarantees (continued)
Backstop liquidity facilities
Backstop liquidity facilities are provided to asset-backed commercial paper conduit programs (‘programs’) administered by the bank and third parties, as an alternate source of financing in the event that such programs are unable to access commercial paper markets, or in limited circumstances, when predetermined performance measures of the financial assets owned by these programs are not met. Generally, these facilities have a term for up to one year. The terms of the backstop liquidity facilities do not require us to advance money to these programs in the event of bankruptcy or to purchase non-performing or defaulted assets. None of the backstop liquidity facilities provided to programs administered by the bank have been drawn upon. No amounts were drawn on liquidity facilities provided to programs administered by third parties at 31 December 2012 or 2011. Undrawn commitments in respect of backstop liquidity facilities are included in the amounts above.
Credit enhancements
The bank provides partial program-wide credit enhancements to the multi-seller conduit program administered by it to protect commercial paper investors in the event that the collections on the underlying assets and any draws on the transaction specific credit enhancement and liquidity backstop facilities are insufficient to repay the maturing asset-backed commercial paper issued by such multi-seller conduit program. Each of the assets pools funded by this multi-seller conduit program is structured to achieve a high investment grade credit profile through the provision of transaction specific credit enhancement provided by the seller of each asset pool to this multi-seller conduit program. The term of this program-wide credit enhancement is 12 months.
31 Lease commitments
Operating lease commitments
At 31 December 2012, the bank was obligated under a number of non-cancellable operating leases for land and buildings for which the future minimum lease payments extend over a number of years, with an option to renew after that period. Base rents are increased as according to the terms stated in the lease.
Land and buildings2012
$m2011
$mFuture minimum lease payments under non-cancellable operating leases expiring No later than one year .............................................................................................. 53 57 Later than one year and no later than five years ...................................................... 153 183 Later than five years ................................................................................................. 72 89
278 329
In 2012, $50m (2011: $78m) was charged to ‘General and administrative expenses’ in respect of lease and sublease agreements, all of which related to minimum lease payments.
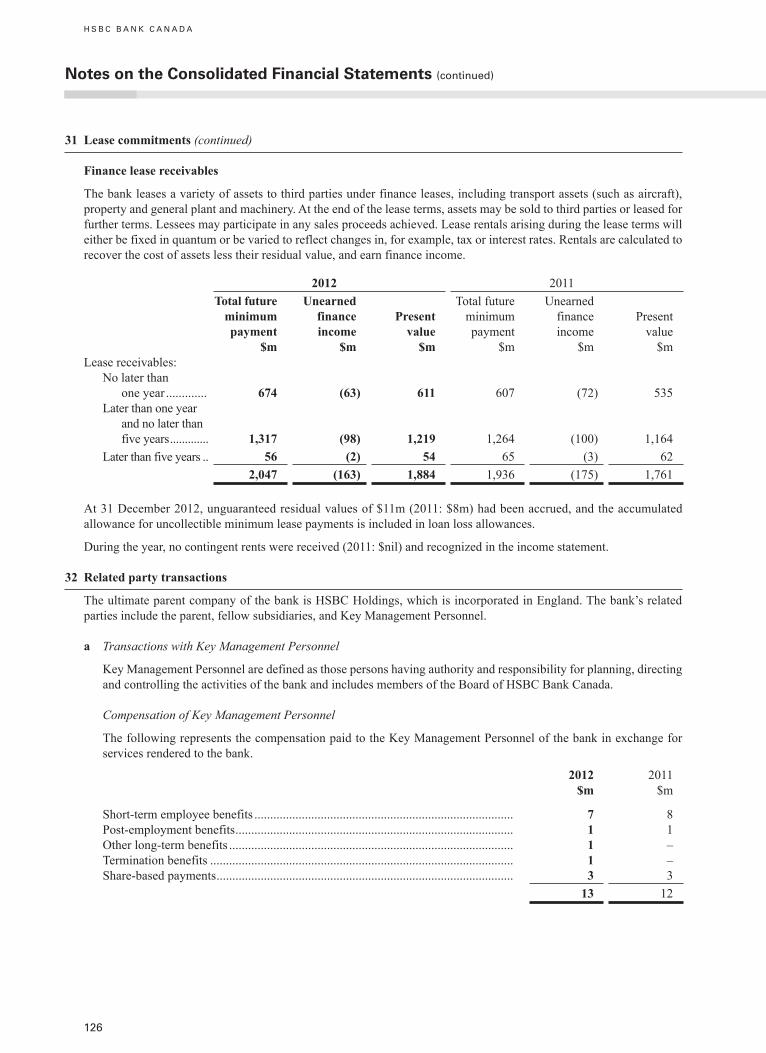
H S B C B A N K C A N A D A
126
31 Lease commitments (continued)
Finance lease receivables
The bank leases a variety of assets to third parties under finance leases, including transport assets (such as aircraft), property and general plant and machinery. At the end of the lease terms, assets may be sold to third parties or leased for further terms. Lessees may participate in any sales proceeds achieved. Lease rentals arising during the lease terms will either be fixed in quantum or be varied to reflect changes in, for example, tax or interest rates. Rentals are calculated to recover the cost of assets less their residual value, and earn finance income.
2012 2011Total future
minimum payment
$m
Unearned finance income
$m
Present value
$m
Total future minimum payment
$m
Unearned finance income
$m
Present value
$mLease receivables:
No later than one year ............. 674 (63) 611 607 (72) 535
Later than one year and no later than five years ............. 1,317 (98) 1,219 1,264 (100) 1,164
Later than five years .. 56 (2) 54 65 (3) 622,047 (163) 1,884 1,936 (175) 1,761
At 31 December 2012, unguaranteed residual values of $11m (2011: $8m) had been accrued, and the accumulated allowance for uncollectible minimum lease payments is included in loan loss allowances.
During the year, no contingent rents were received (2011: $nil) and recognized in the income statement.
32 Related party transactions
The ultimate parent company of the bank is HSBC Holdings, which is incorporated in England. The bank’s related parties include the parent, fellow subsidiaries, and Key Management Personnel.
a Transactions with Key Management Personnel
Key Management Personnel are defined as those persons having authority and responsibility for planning, directing and controlling the activities of the bank and includes members of the Board of HSBC Bank Canada.
Compensation of Key Management Personnel
The following represents the compensation paid to the Key Management Personnel of the bank in exchange for services rendered to the bank.
2012 $m
2011 $m
Short-term employee benefits .................................................................................. 7 8Post-employment benefits ........................................................................................ 1 1Other long-term benefits .......................................................................................... 1 –Termination benefits ................................................................................................ 1 –Share-based payments .............................................................................................. 3 3
13 12
notes on the Consolidated Financial Statements (continued)
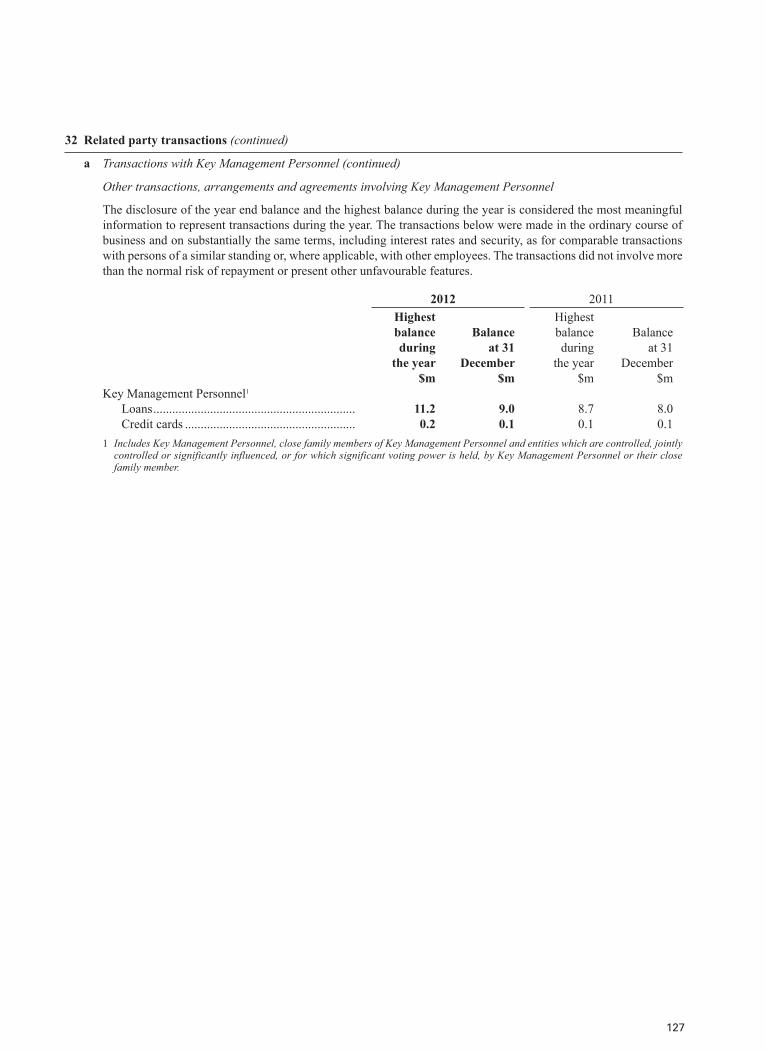
127
32 Related party transactions (continued)
a Transactions with Key Management Personnel (continued)
Other transactions, arrangements and agreements involving Key Management Personnel
The disclosure of the year end balance and the highest balance during the year is considered the most meaningful information to represent transactions during the year. The transactions below were made in the ordinary course of business and on substantially the same terms, including interest rates and security, as for comparable transactions with persons of a similar standing or, where applicable, with other employees. The transactions did not involve more than the normal risk of repayment or present other unfavourable features.
2012 2011Highest balance during
the year $m
Balance at 31
December $m
Highest balance during
the year $m
Balance at 31
December $m
Key Management Personnel1
Loans ................................................................ 11.2 9.0 8.7 8.0 Credit cards ...................................................... 0.2 0.1 0.1 0.11 Includes Key Management Personnel, close family members of Key Management Personnel and entities which are controlled, jointly
controlled or significantly influenced, or for which significant voting power is held, by Key Management Personnel or their close family member.
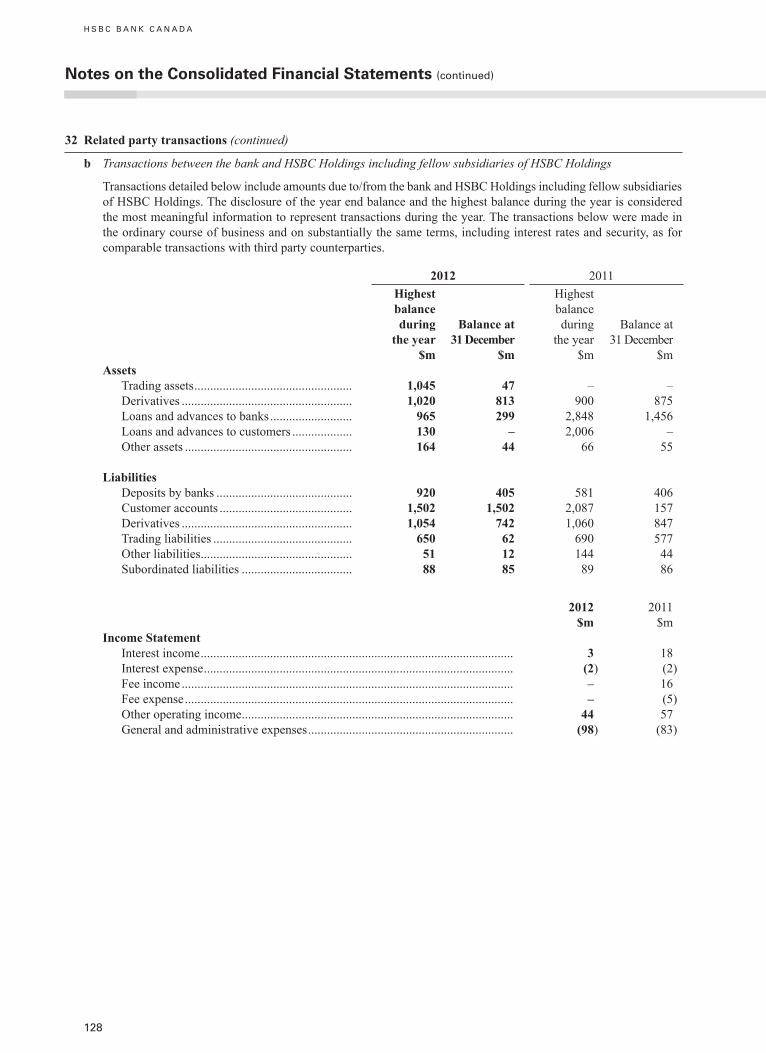
H S B C B A N K C A N A D A
128
notes on the Consolidated Financial Statements (continued)
32 Related party transactions (continued)
b Transactions between the bank and HSBC Holdings including fellow subsidiaries of HSBC Holdings
Transactions detailed below include amounts due to/from the bank and HSBC Holdings including fellow subsidiaries of HSBC Holdings. The disclosure of the year end balance and the highest balance during the year is considered the most meaningful information to represent transactions during the year. The transactions below were made in the ordinary course of business and on substantially the same terms, including interest rates and security, as for comparable transactions with third party counterparties.
2012 2011Highest balance during
the year $m
Balance at 31 December
$m
Highest balance during
the year $m
Balance at 31 December
$mAssets Trading assets .................................................. 1,045 47 – – Derivatives ...................................................... 1,020 813 900 875 Loans and advances to banks .......................... 965 299 2,848 1,456 Loans and advances to customers ................... 130 – 2,006 – Other assets ..................................................... 164 44 66 55
Liabilities Deposits by banks ........................................... 920 405 581 406 Customer accounts .......................................... 1,502 1,502 2,087 157 Derivatives ...................................................... 1,054 742 1,060 847 Trading liabilities ............................................ 650 62 690 577 Other liabilities ................................................ 51 12 144 44 Subordinated liabilities ................................... 88 85 89 86
2012 $m
2011 $m
Income Statement Interest income ................................................................................................... 3 18 Interest expense .................................................................................................. (2) (2) Fee income ......................................................................................................... – 16 Fee expense ........................................................................................................ – (5) Other operating income ...................................................................................... 44 57 General and administrative expenses ................................................................. (98) (83)

129
33 Restructuring charges
Certain restructuring costs were incurred relating to the sale of the full service retail brokerage business which closed on 1 January 2012 as reported in note 13. In 2012, HSBC Finance Corporation Limited announced the wind-down of the Consumer Finance business in Canada and, except for existing commitments, ceased origination of loans. Accordingly restructuring costs were incurred relating to employee severance, pension curtailment and changes in benefits plans, uneconomic contracts, onerous leases and impairment of assets.
An analysis of the restructuring charges by expense type is set out below:
Consumer Finance
2012 $m
2011 $m
Employee severance and related compensation and benefits charges, net .................... 17 –General and administrative expenses, including onerous lease provisions ................... 14 –Impairment of property plant and equipment ................................................................ 3 –
34 –
Full service retail brokerage businessEmployee severance and related compensation and benefits charges ........................... 2 6General and administrative expenses, including onerous lease provisions ................... – 4Impairment of property plant and equipment ................................................................ – 4
2 14Total 36 14
34 Events after the reporting period
There have been no material events after the reporting period which would require disclosure or adjustment to the 31 December 2012 financial statements.
These accounts were approved by the Board of Directors on 27 February 2013 and authorized for issue.

H S B C B A N K C A N A D A
130
HSbC Group International network*
Services are provided by around 6,600 offices in 81 countries and territories:
HSbC bank Canada Subsidiaries*
HSbC Capital (Canada) Inc.(604) 631–8089www.hsbc.ca/capital
HSbC Global asset Management (Canada) Limited1 (888) 390-3333www.hsbc.ca
HSbC Investment Funds (Canada) Inc.1 (800) 830–8888www.hsbc.ca/funds
HSbC Securities (Canada) Inc.1 (800) 760-1180www.hsbc.ca/securities
HSbC Trust Company (Canada)1 (888) 887–3388www.hsbc.ca/trust
For more information, or to find the HSBC Bank Canada branch nearest you, call 1 (888) 310-4722 or visit our website at www.hsbc.ca
europe Offices
Armenia 9Austria 1Belgium 2Channel Islands 31Czech Republic 2France 409Germany 14Greece 17Ireland 4Isle of Man 2Italy 3Kazakhstan 6Luxembourg 7Malta 38Monaco 3Netherlands 1Poland 6Russia 3Spain 3Sweden 2Switzerland 16Turkey 328United Kingdom 1,201
asia-Pacific Offices
Australia 38Bangladesh 13Brunei Darussalam 11China 221Cook Islands 1Hong Kong Special
Administrative Region 250India 102Indonesia 144Japan 5Korea, Republic of 14Macau Special
Administrative Region 7Malaysia 75Maldives 1New Zealand 10Pakistan 13Philippines 18Singapore 20Sri Lanka 17Taiwan 54Thailand 1Vietnam 19
americas Offices
Argentina 164Bahamas 4Bermuda 10Brazil 1,356British Virgin Islands 2Canada 163Cayman Islands 7Chile 3Colombia 23Guatemala 1Mexico 1,062Nicaragua 1Panama 64Paraguay 7Peru 21United States of America 265Uruguay 13Venezuela 1
Middle east and africa Offices
Algeria 3Angola 1Bahrain 5Egypt 80Iraq 10Israel 1Jordan 4Kenya 1Kuwait 1Lebanon 5Libya 1Mauritius 12Nigeria 1Oman 89Palestinian Autonomous Area 1Qatar 3Saudi Arabia 82South Africa 5United Arab Emirates 16
Associated companies are included in the network of offices.
* As at 4 March 2013
130

H S B C B A N K C A N A D A
executive Committee*
Paulo MaiaPresident and Chief Executive Officer
Vancouver
Sandra StuartChief Operating OfficerVancouver
Jason HendersonExecutive Vice President and Managing Director, Head of Global Markets and Treasurer
Toronto
betty MiaoExecutive Vice President, Head of Retail Banking and Wealth Management
Vancouver
Linda SeymourExecutive Vice President, Commercial Banking and Regional President, Central and Eastern Canada
Toronto
Jacques FleurantChief Financial OfficerVancouver
ralph HiltonChief Risk OfficerVancouver
Michael WebbSenior Vice President, Human Resources
Vancouver
board of directors*
Samuel MinzbergChairmanHSBC Bank Canada and Senior PartnerDavies Ward Phillips and Vineberg
Caleb ChanPresidentBurrard International Holdings Inc.
John FlintGroup Managing Director and Chief Executive Retail Banking and Wealth Management
HSBC Holdings plc
Michael GrandinCorporate Director
beth HorowitzCorporate Director
nancy Hughes anthonyCorporate Director
Paulo MaiaPresident and Chief Executive Officer
HSBC Bank Canada
nancy MckinstryCorporate Director
Timothy PriceChairmanBrookfield Funds
Sandra StuartChief Operating OfficerHSBC Bank Canada
* As at 4 March 2013
HSbC Group International network*
131


© Copyright HSBC Bank Canada 2013 All rights reserved
No part of this publication may be reproduced, stored in a retrieval system, or transmitted, in any form or by any means, electronic, mechanical, photocopying, recording, or otherwise, without the prior written permission of HSBC Bank Canada.
Form number 1040146 (03/13). Published by Corporate Affairs, HSBC Bank Canada, Vancouver
Cover designed by Black Sun Plc, London; text pages designed by Group Communications (Asia). The Hongkong and Shanghai Banking Corporation Limited, Hong Kong
Printed by Hemlock printers, Burnaby, BC, Canada, on Rolland Opaque 50 paper using vegetable oil-based inks. Made in the USA, the paper comprises 50% virgin fibre which is elemental chlorine-free and 50% post-consumer waste.

HSBC Bank Canada885 West Georgia StreetVancouver, British ColumbiaCanada V6C 3E8Telephone: 1 604 685 1000www.hsbc.ca