Embed Size (px)
Citation preview

ANNUAL REPORT
2012
Report and Statement of Accounts for the
Year Ended 31 December 2012

ANNUAL REPORT
2012
Report and Statement of Accounts for the
Year Ended 31 December 2012
© 2013 Bank of JamaicaNethersole Place
KingstonJamaica
Telephone: (876) 922 0750-9Fax: (876) 967 4265
Email: [email protected]: www.boj.org.jm
ISSN 0067 3668
Printed in Jamaica

Mission Statement
The mission of the Bank of Jamaica
is to formulate and implement
monetary and regulatory policies
to safeguard the value of the domestic
currency and to ensure the soundness
and development of the financial system
by being a strong and efficient
organisation with highly motivated
and professional employees
working for the benefit of
the people of Jamaica.


BANK OF JAMAICA
PRINCIPAL OFFICERSAs at 31 December 2012
GOVERNOR & SUPERVISOR OF BANKS Mr. Brian Wynter
SENIOR DEPUTY GOVERNOR Mrs. Myrtle Halsall, OD
DEPUTY GOVERNORS Mrs. Gayon Hosin - Financial Institutions Supervisory Division
Mr. John Robinson - Research & Economic Programming Division
Mr. Livingstone Morrison - Administration & Technical Services and Finance and Technology Division
Mr. Robin Sykes - Corporate Secretary’s Office
DIVISION CHIEFS Mr. Calvin Brown - Administration & Technical Services Division
Ms. Maurene Simms - Financial Institutions Supervisory Division
Mrs. Natalie Haynes - Banking & Market Operations Division
Dr. Wayne Robinson - Research & Economic Programming Division
Mr. Herbert Hylton - Finance & Technology Division
Ms. Angela Foote - Internal Audit Division

Abbreviations
Foreword by the Governor
1. Bank of Jamaica: Our Role and Function 1
2. The Economy and Monetary Policy Review 32.1 Economic Overview 3 2.2 International Economic Developments 62.3 Balance of Payments 122.4 Foreign Exchange Market 162.5 Prices 202.6 Money and Credit 282.7 Production 372.8 The Stock Market 452.9 Public Finance 492.10 Monetary Policy and Interest Rates 582.11 Economic Outlook 63
3. Financial System Surveillance and Policy 653.1 Supervision of Deposit-taking Institutions (DTIs) 653.2 Supervision of Cambios and Remittance Companies 823.3 Financial System Stability Assessment of DTIs 863.4 Financial Legislation 95
4. Financial Market Operations 99 4.1 Open Market Operations 994.2 International Reserves 1034.3 Reserve Management 106
5. Payment System Oversight 111
6. Banking Services 115
7. Currency Operations 121
8. Administration 125
9. Governance 129
10. Community Outreach 131
11. Bank of Jamaica’s Strategic Objectives 2012-2015 133
12. Calendar of Monetary Policy Developments 137
Final Accounts for the Year Ended 31 December 2012 i Appendices xlvii
CONTENTS

ABBREVIATIONS
ABM Automated Banking MachinesACH Automated Clearing HouseACP African, Pacific and Caribbean (countries)AFI Approved Financial InstitutionAML Anti-money Laundering ARP Average Realized PriceASBA Association of Banking Supervisors of the Americas BCBS Basel Committee on Banking SupervisionBCP Basel Core Principle BIS Bank for International SettlementsBMI Benchmark Investment InstrumentsBN BillionBOE Bank of EnglandBOJ Bank of JamaicaBoJ Bank of JapanBOP Balance of Paymentsbps basis points
CAD Canadian Dollar CAPE Caribbean Advanced Proficiency ExaminationCAR Capital Adequacy RatioCARICOM Caribbean CommunityCCPS Central CounterpartiesCCMB Capital & Credit Merchant BankCD Certificate of DepositCDB Caribbean Development BankCFATF Caribbean Financial Action Task ForceCPC Chief Parliamentary CounselCFT Counter-Financing of TerrorismCGBS Caribbean Group of Banking Supervisorsc.i.f. Cost, insurance and freightCIFTS Customer Inquiry Funds Transfer SystemCOM CommunicationCPI Consumer Price IndexCPI-AF Consumer Price Index excluding Agriculture and FuelCPI-FF Consumer Price Index excluding Food and FuelCRA Credit Reporting ActCRR Cash Reserve RequirementCSD Central Securities DepositoryCTMS Central Treasury Management SystemC&WJCCUL Communications and Other Workers of Jamaica Cooperative Credit Union
Limited

DBJ Development Bank of JamaicaDJIA Dow Jones Industrial IndexDNFBP Designated Non-Financial Businesses & ProffessionsDSGE Dynamic Stochastic General EquilibriumDTI Deposit-taking InstitutionsDVBP Dollar Value of a Basis PointDvP Delivery versus PaymentDVPP Dollar Value of a Percentage Point
EBIS Enterprise Business Intelligence SystemECI Export Credit InsuranceEPA Economic Partnership AgreementEU European UnionEWS Early Warning System EXIM National Export-Import Bank of Jamaica
FATCA Foreign Accoount Tax Compliance ActFATF Financial Action Task ForceFed Federal Reserve (US)FIA Financial Institutions ActFID Financial Investigations DivisionFIDA Financial Investigations Division ActFINSTAB Financial Stability DepartmentFISD Financial Institutions Supervisory DivisionFIU Financial Intelligence UnitFNB Food and Non-alcoholic Beveragesf.o.b. Free on boardFRF Fiscal Responsibility FrameworkFSAP Financial Sector Assessment ProgrammeFSC Financial Services CommissionFSSF Financial Sector Support FundFX Foreign ExchangeFY Fiscal Year
GBP Great Britain PoundGCT General Consumption TaxGDP Gross Domestic ProductGFA Gross Foreign AssetsGKMA Greater Kingston Metropolitan AreaGOJ Government of JamaicaGSDA Government Securities Dematerialization Act
HEART Human Employment and Resource TrainingHMF Honourable Minister of FinanceHWEG Housing, Water, Electricity, Gas and Other Fuels

IDB Inter-American Development BankIBRD International Bank for Reconstruction and Development (World Bank)ICBS International Conference of Banking SupervisorsIFC International Finance CorporationIFPAS Inflation Forecast & Policy Assessment SystemIFRS International Financial Reporting StandardsIMAJ Incorporated Master Builders Associations of JamaicaIMF International Monetary FundIMF-SBA International Monetary Fund – Stand-By ArrangementIPCP Index of Primary Commodity PricesIPDF Insurance Policy Discounting FacilityIPI Import Price Index
JBA Jamaica Bankers AssociationJBDC Jamaica Business Development CentreJCCUL Jamaica Cooperative Credit Union LeagueJCSD Jamaica Central Securities DepositoryJDX Jamaica Debt ExchangeJEEP Jamaica Emergency Employment ProgrammeJGA Jamaica Guild of ArtistsJMMB Jamaica Money Market BrokersJNBS Jamaica National Building SocietyJSE Jamaica Stock ExchangeJTB Jamaica Tourist Board
KYC Know Your CustomerLAR Liquid Assets RequirementLIBOR London Inter-bank Offer RateLRS Local Registered StockLTRO Long-Term Refinancing Operations
MaFI Macro-Financial IndexMFIs Multilateral Financial InstitutionsMOF Ministry of Finance MOU Memorandum of UnderstandingMN MillionMPI Micro-prudential IndexMUG Market User Group
NCTVET National Council on Technical and Vocational Education and TrainingNDA Net Domestic AssetsNHT National Housing TrustNIM Net Interest MarginNIR Net International ReservesNOP Net Open Position NPCB National People’s Cooperative Bank of JamaicaNPL Non-Performing LoansNPS National Payment SystemNROCC National Road Operating & Construction Company

OMO Open Market OperationsOMT Outright Monetary TransactionOPBs Other Public BodiesOPEC Organization of Petroleum Exporting CountriesOUC Other Urban Centres
PAYE Pay As You Earn (income tax)PBOC People’s Bank of ChinaPBMA Public Bodies Management and Accountability PCB People’s Cooperative BankPCMB PanCaribbean Merchant Bank PD Primary DealersPDA Primary Dealers AssociationPFMIs Principles for Financial Market InfrastructuresPL Performing LoansPOCA Proceeds of Crime ActPOS Point of SalePPP Production & Productivity Programmepps Percentage pointsPSCA Payments Clearing and Settlement ActPSE Public Sector Entity
R&A Restaurants AccommodationR&C Recreation & CultureRADA The Rural Agricultural Development AgencyREER Real Effective Exchange RateROAA Return on Average AssetsRSP Remittance Service ProviderRTGS Real Time Gross SettlementRWCA Risk Weighted Capital Adequacy
SCT Special Consumption TaxSDR Special Drawing RightsSIFIs Systemically Important Financial InstitutionsSIPS Systemically Important Payments SystemSME Small and Medium Sized EnterprisesSPBS Selected Public BodiesSRC Scientific Research CouncilSSM Special Safeguard MechanismSTATIN Statistical Institute of JamaicaSWIPS System-wide Important Payment System
TCI Trade Credit InsuranceTPA Terrorism Prevention ActTRAN Transport
UK United KingdomUN United NationsUR Unemployment RateUSA United States of AmericaUSD US Dollar
VAT Value Added TaxVMBS Victoria Mutual Building SocietyVR Variable Rate
WASR Weighted Average Selling RateWATBY Weighted Average Treasury Bill YieldWTI West Texas Intermediate (crude oil)WTO World Trade Organization
YOY Year Over Year


FOREWORD by the governor
The Bank continued to operate in a challenging environment character-
ised by uncertainties in both the domestic and international economies.
Within the domestic economy, investor concerns about the nature and
timing of a funding arrangement with the International Monetary Fund
(IMF) resulted in uncertainties in the financial markets. For the global
economy, the protracted fiscal crisis in Europe continued to have a debili-
tating impact on world trade and growth.
In the context of the uncertainty in the domestic economy, there was a
reduction in net private capital inflows which contributed to increased
instability in the foreign exchange market, reflected in a faster pace of depreciation of the exchange rate
relative to 2011. In this regard, the Bank intervened in the foreign exchange market on several occasions and
in the December quarter offered three special variable rate instruments to primary dealers and commercial
banks. The Bank also maintained its policy rate throughout the year in a context where the outlook for inflation
remained within the targeted range.
Inflation for 2012 was 8.0 per cent, relative to 6.0 per cent in 2011. The higher out-turn was against the
background of adverse weather conditions, the implementation of tax measures and an acceleration in the
rate of depreciation of the domestic currency. However, persistently weak domestic demand conditions, lower
crude oil prices and a significant reduction in communication costs moderated the impact of inflationary
impulses. Against the background of weak demand and the uncertainties, the domestic economy is estimated
to have contracted by 0.3 per cent in 2012. This weak demand reflected the impact of increased unemployment,
declining real wages, reduced pace of growth in remittances and deterioration in both consumer and business
sentiments.
In spite of the uncertain environment the financial system remained stable. In particular, deposit-taking
institutions (DTIs) were largely resilient to macro-prudential stress tests due to strong capital positions and
improved loan quality. In relation to credit, interest rate and foreign exchange stress tests, the results showed
that the system was resilient to these hypothetical shocks, with the post shock capital adequacy ratios (CARs)
generally remaining above the 10.0 per cent minimum benchmark. The assessment of the Bank’s macro-
financial index, which assesses the vulnerability of the financial sector to the changes in the macroeconomy,
also reflected an improvement. Similarly, the DTIs generally recorded a better performance in the micro-
prudential index (MiPI) due to improvements in balance sheet and asset quality indicators.
While no new legislation for the financial sector was passed in 2012 , the Bank continued work on developing
and refining bills to effectively carry out its mandate of financial stability. A major focus was the development of
the ‘Omnibus Banking Bill’ for which the Bank released a Consultation Paper on “Proposals for Enhancement
of the Legislative Framework for the Deposit-taking Sector” in December 2012. The proposed legislation will
strengthen the Bank’s oversight of the deposit-taking financial sector and achieve greater conformity with
the Basel Core Principles as well as other global best practice standards. Additionally, the Omnibus Banking
Bill will consolidate the three deposit-taking statutes into a single piece of legislation to provide for easier
updating of the regulatory framework and eliminate existing inconsistencies and arbitrage opportunities.
In an effort to achieve greater financial inclusion and access to financial services, the Bank pursued amend-
ments to Jamaica’s legal and regulatory framework to allow banks to partner with non-bank third parties to
offer banking services, as agents. These amendments will allow banking customers to conduct banking trans-
actions such as cash deposits and withdrawals within certain size limits from third-party locations. Such agent
activities will also enable banking customers to perform a range of other transactions electronically, including
funds transfers between accounts and balance inquiries.
During 2012, the Bank continued to provide banking and payment services to its clients in the most efficient
and secure way. In this regard, the Bank facilitated the training of the Government’s staff and granted them
access to the JamClear Real Time Gross Settlement (RTGS) system. There were efficiency gains from this
training as the Government, the single most significant initiator of large value transactions, was able to create
its own files in the system, taking full responsibility for verifying the accuracy and timeliness of payments.
Further, the Bank lowered the Automated Clearing House value threshold to $3.0 million from $5.0 million as
part of its risk mitigation strategy of having all large value transactions settled in the RTGS. In addition, the
Bank improved the efficiency of its currency operations by using more durable substrates in the production of
four Bank notes. The $1000, $500 and $50 notes were printed on pre- and post-print varnished cotton while
the $100 note was printed on a composite material of protective polyester film layered around a cotton fibre
core known as Hybrid®.
The Bank continued the investment in its human resources in 2012 through exposure to various seminars,
conferences and workshops both locally and abroad. To this end, the training function was re-launched under
the theme “Vision 2015: Targeted Training-Creating a New Generation of Central Bankers”, aimed at creating
a cadre of central bankers equipped to function in several areas of the Bank. With regard to the physical
infrastructure, the Bank intensified its efforts in 2012 to optimize the use of its physical plant and equipment,
advance its energy management programme as well as implement environmentally friendly initiatives. The key
strategies included the development and implementation of Phase 3 of its Energy Management programme
and the completion of the Glass Fenestration System project. Of note, the Bank achieved a reduction of 12.0
per cent in energy consumption which exceeded its projected savings of 5.0 per cent to 10.0 per cent for the
year.
During the year, the Bank continued its outreach programmes, including the School Education Programme
and the Economic Seminar Series. The Bank also hosted the 2nd G. Arthur Brown Memorial Lecture which

was presented by former Prime Minister, the Most Hon P.J. Patterson on the topic “Stimulating the Flow
of Our Creative Potential”. The Bank remains committed to maintain and enhance its current outreach
programmes while being open to the possibility of new projects aimed at adding value to the employee and
visitor experience.
While economic activity was subdued, the year 2012 was special for Jamaica as it marked the country’s 50th
anniversary of independence. In observance of the anniversary, the Bank issued a series of commemorative
banknotes and coins. Additionally, the Bank’s Lunch Hour Concerts highlighted performances that were
selected to display Jamaican talent over the 50 years. As a mark of the country’s achievement at the Olympic
Games, the Bank released gold and silver commemorative coins in honour of the eight athletes who won
individual Olympic gold medals since Jamaica began participating in 1948.
During 2012, the Bank played a key role in negotiations with the IMF for a borrowing programme. The
engagement with the IMF began with the Article IV consultations which set the stage for discussion on a new
borrowing programme. As the lead member of the country’s negotiating team, I want to express my gratitude
for the outstanding service that was delivered by my staff, particularly those who went beyond the call of duty
at great personal sacrifice. At a time when remuneration has been frozen for all staff members it would be
remiss of me not to recognise in words the commitment and hard work of all members of staff. I am also very
grateful for the contributions of members of the Board of Directors of the Bank during this challenging year.
In 2012, there were changes in the composition of the Board of the Bank due to the resignation of some of
its members and appointments to fill the vacancies. Specifically, there were resignations from Dr. Wesley
Hughes, Dr. Celia Brown-Blake, Dr. Nigel Clarke, Mr. Rohan Barnett and Mr. Mark Myers. On behalf of the
Bank, I want to express my gratitude to these persons for their dedicated service and to wish them well in their
future endeavours. I am also pleased to welcome as their replacements, Mr. Devon Rowe, the new Financial
Secretary and ex officio member, Mr. Christopher Bicknell, Dr. Christine Clarke, Dr. Vincent Lawrence, Miss
Janice Holness and Mr. Dennis Morrison.
The Bank recognizes that there will be continuing challenges for the economy in 2013. Foremost among these
is the successful conclusion of an agreement with the IMF and the subsequent adherence to the performance
targets under the medium-term macroeconomic programme. The signing of this agreement is anticipated
to lead to an improvement in Jamaica’s economic environment in 2013 due to reduced uncertainties, The
Board and management of the Bank are confident that with the professionalism and high standards of the
staff, the Bank will be able to confront the challenges of 2013 and beyond. The Bank’s strategic focus in this
regard involves enhancing the monetary policy framework to achieve the inflation objective, strengthening
the Bank’s institutional framework for maintaining financial system stability and aligning the Bank’s human
resources, processes, technology and organizational structure to support the attainment of the Bank’s strategic
objectives. Brian Wynter
GovernorBank of Jamaica
- 1 -
1. Bank of Jamaica: Our Role & Function
Bank of Jamaica (BOJ), established by the
Bank of Jamaica Act (1960), is responsible for
the implementation of sound and consistent
monetary policies, while ensuring financial
system stability through robust supervisory
and regulatory policies. The achievement of
these objectives is critical to the attainment of
sustainable growth in the Jamaican economy.
The two-fold nature of the Bank’s operations is
captured in its mission statement:
The mission of the Bank of Jamaica is to
formulate and implement monetary and
regulatory policies to safeguard the value of the
domestic currency and to ensure the soundness
and development of the financial system by
being a strong and efficient organization with
highly motivated and professional employees
working for the benefit of the people of Jamaica.
Bank of Jamaica conducts monetary policy
with the aim of achieving inflation in line with
that of our major trading partners. While not
operating an explicit inflation targeting regime,
on BOJ’s recommendation, the inflation target
range for the current fiscal year is announced
by the Minister of Finance at the beginning
of each year. In formulating monetary policy
to achieve this target, the Bank takes into
consideration all prevailing and prospective
developments in the macro economy, fiscal
operations, external sector as well as relevant
market information. A decision to change the
stance of monetary policy can be reflected in a
number of adjustments. These include changes
in the rates paid on the Bank’s certificates of
deposit and adjustments to the liquid asset and
cash reserve ratios.
In fulfilling its mandate to maintain financial
system stability, the BOJ has supervisory and
regulatory oversight of commercial banks and
other licensed deposit-taking institutions.
The BOJ routinely monitors institutions’
compliance with all the relevant legislation
and regulations to ensure the highest level of
prudence and integrity in the management
of such organizations. The Bank’s overall
responsibility for financial stability is supported
by micro- and macro-prudential assessments,
which are underpinned by the results from
early warning systems and risk models.
The Bank’s responsibilities also include:
• oversightoftheoperationofthepayments
system and the foreign exchange market;
• theissueandredemptionofcurrency;
• the provision of banking services to the
Government and commercial banks
as well as fiscal agency services to the
Government; and
•management of the external reserves of
Jamaica.


- 3 -
2. The Economy & Monetary Policy Review
2. The Financial Systemthese inflationary impulses was, however,
moderated by a reduction in crude oil prices,
lower communication cost and generally weak
demand conditions.
The Jamaican economy recorded an estimated
marginal contraction of 0.3 per cent in 2012,
following growth of 1.3 per cent in 2011. The
decline in economic activity was influenced by
weak external and domestic demand, elevated
levels of uncertainty throughout the year as well
as the effects of adverse weather conditions.
External demand from major trading partners
remained sluggish against the backdrop of
slower growth in the world economy relative
to 2011. Consumer demand was also adversely
affected by a reduction in real wages, an
increase in unemployment and a reduced
pace of growth in remittances. In addition,
uncertainty about the Government’s pending
agreement with the IMF had an adverse impact
on investor sentiment.
The decline in economic activity for the year
reflected a contraction in the tradable industries,
as value added in the non-tradable industries
remained flat. The contraction for 2012 was
primarily reflected in Mining & Quarrying,
Construction and Transport, Storage &
Communication. However, there was a partly
offsetting impact from growth in Agriculture,
Forestry & Fishing, Hotels & Restaurants and
Finance & Insurance Services.
2.1. Economic OverviewThe Bank of Jamaica (BOJ) maintained
its monetary policy stance in 2012 in the
context of continued weak domestic demand
which tempered the impact of inflationary
impulses as well as uncertainties within the
local and international economies. Within the
domestic economy, uncertainty surrounding
the timing and content of an agreement with
the International Monetary Fund (IMF) on
a new medium-term economic programme
contributed to instability in the foreign
exchange market and delays in investment
projects. Uncertainty in the global economy
was largely related to developments in the Euro
Area and its impact on international financial
and commodity markets.
Headline inflation, as measured by the point-
to-point change in the All Jamaica Consumer
Price Index (CPI), was 8.0 per cent for 2012,
relative to 6.0 per cent for 2011. The outturn
for 2012 was influenced by the implementation
of tax measures announced in the FY2012/13
budget as well as shortages in the supplies
of several agriculture items, due to the
impact of drought conditions in the first half
of the year and the passage of Hurricane
Sandy in October. Inflationary pressures also
emanated from a rise in international grains
prices and the pass-through of exchange rate
depreciation during the year. The impact of

- 4 -The Economy & Monetary Policy Review
Bank of Jamaica
money supply (M3J) decelerated to 0.6 per
cent from 10.5 per cent in 2011 and was well
below the average growth of 8.7 per cent for the
last five years. This marginal increase in 2012,
occurred in the context of the contraction of the
domestic economy, declining real incomes and
marked deceleration in remittance inflows to
Jamaica.
Jamaica’s balance of payments is estimated
to have improved in 2012, largely reflecting
a reduction in the value of imports associated
with weak global and domestic demand
conditions. The weakness in the global economy
contributed to a decline in some commodity
prices, particularly crude oil. In this regard,
the current account deficit is estimated to have
narrowed to 12.7 per cent of GDP from 14.6
per cent in 2011. This improvement reflected
a narrowing in the deficits on the Goods and
Income sub-accounts, the impact of which was
partly offset by lower surpluses on the Services
and Current Transfers sub-accounts. Net
Private and Official Investment inflows were
insufficient to finance the deficits on the capital
and current accounts. Consequently, the NIR
of the Bank fell by US$840.5 million to US$1
125.6 million at end-2012, with gross reserves
representing 13.2 weeks of projected goods and
services imports.
During the period April to December 2012,
public sector performance was affected by the
weak domestic economy which was exacerbated
by uncertainty related to an agreement with
The foreign exchange market in 2012 was
characterized by periods of heightened demand
and reduced private capital and official inflows
relative to 2011. The reduction in inflows was
associated with the uncertainties among the
public surrounding the finalisation of a new
medium-term programme and the adequacy of
the net international reserves (NIR). Against
this background, the Jamaica Dollar reflected
a point-to-point depreciation of 6.9 per cent
against the US dollar for 2012, relative to
depreciation of 0.9 per cent for 2011.
Interest rates on the Bank’s 30-day Certificate
of Deposit (CD) and overnight instrument were
maintained at 6.25 per cent and 0.25 per cent,
respectively, throughout 2012. Additionally,
the domestic cash reserve and liquid assets
requirements were maintained at 12.0 per cent
and 26.0 per cent, respectively. However, in
the context of excess Jamaica Dollar liquidity,
the Bank introduced three variable rate
instruments which were offered to Primary
Dealers and commercial banks between 31
October and 05 November 2012.
In the context of these developments, the
monetary base expanded by 6.5 per cent for
2012, relative to 7.8 per cent for 2011, and
largely reflected net currency issue. The
expansion in the monetary base was facilitated
by an increase in the net domestic assets of the
Central Bank as there was a decline in the NIR.
Concurrent with the slower expansion in the
monetary base, growth in broad Jamaica Dollar

- 5 -
Annual Report 2012
The Economy & Monetary Policy Review
the IMF. This delay resulted in the non-
receipt of some loan and grant flows from
multilateral financial institutions, which led to
postponement of project spending, particularly
by public bodies, consolidating to a build-up in
surplus balances by these entities by end-2012.
With respect to Central Government, revenues
grew by 4.7 per cent for the period, relative to
growth of 6.1 per cent for the corresponding
period in 2011. As a consequence of the
lower revenues, expenditure was curtailed
as the Central Government sought to meet
its fiscal deficit and primary surplus targets
for FY2012/13. In addition, in the context of
the investor uncertainty, the Government was
unable to extend the maturity profile of the debt
stock and increase the proportion of fixed rate
issues, consistent with the debt strategy.
Jamaica’s economic environment is anticipated
to improve in 2013 in the context of reduced
uncertainties consequent on the signing of an
IMF agreement as well as continued global
growth. The economy is expected to expand
in the range of 0.5 per cent to 1.5 per cent in
2013, in contrast to the contraction in 2012.
Most industries are expected to grow in 2013
with the major contributors being Agriculture,
Forestry & Fishing, Construction and Mining
& Quarrying. However, despite the overall
expected expansion in output, domestic
demand conditions are anticipated to remain
weak due to significant fiscal consolidation.
Notwithstanding the relatively weak demand
conditions, headline inflation for 2013 could
exceed the rate recorded in 2012 in the context
of higher import prices and further exchange
rate pass-through. In that context, the Bank will
continue to manage inflation expectations to
obtain the objectives outlined in the medium-
term macroeconomic programme.

- 6 -The Economy & Monetary Policy Review
Bank of Jamaica
2.2. International Economic
Developments
2.2.1. Overview
Global growth continued to decelerate in 2012
reflecting weak economic activity in most
advanced and emerging market economies.
In particular, the impact of austerity measures
in the Euro Area, stemming from the region’s
sovereign debt crisis, resulted in a contraction in
economic activity in that economy for the year.
As a result, some Euro Area economies were
characterized by heightened unemployment
rates and reduced consumer spending during
the year. This had spill-over effects on the
United Kingdom (UK) as well as some emerging
markets such as China. However, there was
increased domestic demand in the USA.
During 2012, a number of central banks in both
advanced and emerging market economies
implemented additional expansionary
monetary policy measures in an attempt to spur
growth. In spite of the expansionary monetary
policies, global inflation decelerated in the
context of continued weak demand and lower
commodity prices.
2.2.2. Output
The pace of economic growth in the global
economy is estimated to have moderated to 3.2
per cent in 2012, following an expansion of 3.9
per cent in 2011. This outturn reflected slower
growth rates in both advanced and developing
economies. In particular, advanced economies
recorded growth of 1.3 per cent in 2012, relative
to an expansion of 1.6 per cent in 2011 while
growth for the developing countries slowed to
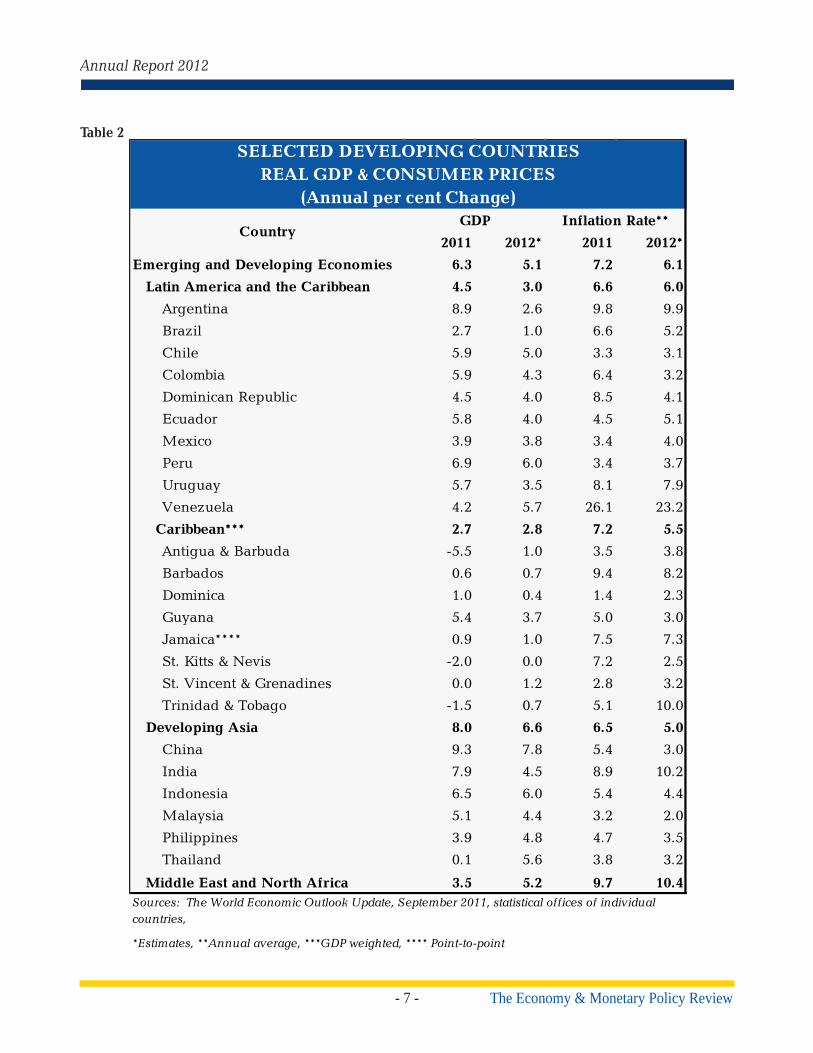
5.1 per cent from 6.3 per cent in 2011 (see Table
1 & Table 2). Among the larger developing
economies, China recorded the fastest output
growth in 2012, albeit at a slower rate (see
Table 2).
Table 1
2011 2012* 2011 2012* 2011 2012* 2011 2012*
Advanced Economies 1.6 1.3 7.9 8.0 2.7 2.0 n/a n/a
of which
USA 1.8 2.2 9.0 8.2 3.1 2.0 0.0 - 0.25 0.0 - 0.25
UK 0.9 -0.2 8.0 8.1 4.5 2.7 0.5 0.5
Euro Area 1.4 -0.4 10.2 11.2 2.7 2.3 1.0 0.75
Canada 2.6 2.0 7.5 7.3 2.9 1.8 1.0 1.0
Japan -0.6 2.0 4.6 4.5 -0.3 0.0 0.1 0.1
Source: IMF World Economic Outlook Update: September 2011; January 2012 , International Labour Office, statistical agencies of individual countries
*Estimates ** Annual average *** End-of-period
INDUSTRIAL ECONOMIESReal GDP, Consumer Prices and Unemployment Rates
(Annual percentage change and per cent of labour force)
Country GDPUnemployment
RateInflation Rate**
Central Bank Target
Interest Rates***
- 7 -
Annual Report 2012
The Economy & Monetary Policy Review
Table 2
2011 2012* 2011 2012*
Emerging and Developing Economies 6.3 5.1 7.2 6.1
Latin America and the Caribbean 4.5 3.0 6.6 6.0
Argentina 8.9 2.6 9.8 9.9
Brazil 2.7 1.0 6.6 5.2
Chile 5.9 5.0 3.3 3.1
Colombia 5.9 4.3 6.4 3.2
Dominican Republic 4.5 4.0 8.5 4.1
Ecuador 5.8 4.0 4.5 5.1
Mexico 3.9 3.8 3.4 4.0
Peru 6.9 6.0 3.4 3.7
Uruguay 5.7 3.5 8.1 7.9
Venezuela 4.2 5.7 26.1 23.2
Caribbean*** 2.7 2.8 7.2 5.5
Antigua & Barbuda -5.5 1.0 3.5 3.8
Barbados 0.6 0.7 9.4 8.2
Dominica 1.0 0.4 1.4 2.3
Guyana 5.4 3.7 5.0 3.0
Jamaica**** 0.9 1.0 7.5 7.3
St. Kitts & Nevis -2.0 0.0 7.2 2.5
St. Vincent & Grenadines 0.0 1.2 2.8 3.2
Trinidad & Tobago -1.5 0.7 5.1 10.0
Developing Asia 8.0 6.6 6.5 5.0
China 9.3 7.8 5.4 3.0
India 7.9 4.5 8.9 10.2
Indonesia 6.5 6.0 5.4 4.4
Malaysia 5.1 4.4 3.2 2.0
Philippines 3.9 4.8 4.7 3.5
Thailand 0.1 5.6 3.8 3.2
Middle East and North Africa 3.5 5.2 9.7 10.4Sources: The World Economic Outlook Update, September 2011, statistical offices of individual countries,
*Estimates, **Annual average, ***GDP weighted, **** Point-to-point
SELECTED DEVELOPING COUNTRIESREAL GDP & CONSUMER PRICES
(Annual per cent Change)
CountryGDP Inflation Rate**

- 8 -The Economy & Monetary Policy Review
Bank of Jamaica
Growth among the advanced economies
was constrained by the impact of various
austerity measures implemented by European
governments in an effort to contain the region’s
sovereign debt crisis. However, the impact
of these measures was partially offset by
improvements in consumption and investment
expenditure associated with additional
monetary easing in the Euro Area, the USA and
Japan. Economic growth in Japan recovered in
2012, following the impact of the natural disaster
in the preceding year. For the developing
countries, growth in economic output continued
to decelerate due to the impact of weak global
demand which negatively influenced external
trade. Notwithstanding the overall outturn, the
Middle East and North Africa region recorded
an increase in output to 5.2 per cent in 2012
from 3.5 per cent in 2011. This reflected the
impact of export-led growth in the context of
higher oil prices in the first half of the year.
2.2.3. Monetary Policy
The central banks of selected advanced
economies maintained an expansionary
monetary policy stance in 2012 in an effort to
counter the effects of weak demand conditions
that characterized the year. In the USA, for
example, the Federal Reserve Board (Fed)
extended its “Operation Twist” programme,
involving the purchase of Treasury securities
to end-2012 from June 2012. It also launched
a third round of quantitative easing (QE3) in
September 2012, which involved the monthly
purchase of US$40 billion of mortgage-backed
securities for an unlimited period. Following
the launch of QE3 the Fed increased its
monthly purchase of Treasury securities by
US$45 billion in December 2012 in an effort to
maintain downward pressures on longer-term
interest rates. In order to reduce uncertainty
regarding its monetary policy stance, the Fed
pledged to maintain target interest rates within
the range of 0.0 per cent to 0.25 per cent until
the unemployment rate fall below 6.5 per cent
and projected inflation for one and two years
ahead, remaining below 2.5 per cent.
Similarly, the European Central Bank (ECB)
employed a second round of Longer-Term
Refinancing Operations (LTRO) in February
2012, lowered its target interest rates in
July and implemented Outright Monetary
Transactions (OMT) in September. The Bank
of England (BoE) also increased the size of its
asset purchase programme by £100.0 billion to
£375.0 billion in 2012 but halted its third round
of quantitative easing as it shifted its focus to
the Funding for Lending scheme. In an effort
to achieve an inflation target of 1.0 per cent,
the Bank of Japan (BoJ) also expanded its asset
purchase programme; by approximately ¥46.0
trillion to ¥101.0 trillion during 2012.
The central banks of some large emerging
market countries also employed monetary
easing in 2012. This was primarily effected
through the reduction in policy rates. In
particular, the People’s Bank of China (PBoC),
in May 2012 lowered the reserve requirement

- 9 -
Annual Report 2012
The Economy & Monetary Policy Review
for deposit-taking financial institutions by 50
bps to 20.0 per cent for large banks and 18.0 per
cent for small banks. The PBoC later reduced
its benchmark lending rate by 56 bps to 6.0 per
cent in July 2012. The Reserve Bank of India
reduced its target repo rate by 50 bps to 8.0 per
cent while the Central Bank of Brazil lowered
its Selic rate by 325 bps to 7.25 per cent. These
monetary policy initiatives were implemented
in an effort to inject additional liquidity into the
financial system. Conversely, the Central Bank
of the Russian Federation tightened monetary
policy in September 2012, by increasing its
policy rate by 25 bps to 8.25 per cent in an effort
to curb inflationary pressures.
2.2.4. Global Inflation
Global inflation decelerated in 2012. For the
advanced economies, the annual average
inflation rate decelerated to 2.0 per cent in 2012
from 2.7 per cent in 2011. The same measure of
inflation among the developing countries also
fell by 1.1 percentage points to 6.1 per cent in
2012 (see Table 1 & Table 2). The deceleration
reflected a decline in overall commodity prices.
In particular, the prices of non-fuel commodities
fell during the year while there was a significant
moderation in the rate of increase in energy
costs. These price movements were mainly
associated with weak demand conditions in both
advanced and emerging market economies.
However, significantly lower fuel prices in the
second half of the year partly offset the impact
of higher prices in the first half of 2012.
2.2.5. Selected Exchange Rates
Selected international currencies such as the
Euro, Canadian dollar, Great Britain Pound and
the Japanese Yen all depreciated against the
US dollar (USD) during the year (see Table 3).
The depreciation of these currencies primarily
reflected the impact of the slowdown in global
economic activity stemming from uncertainties
in the Euro Area throughout the year. However,
there was a strengthening of the Euro in the
last quarter of 2012 due to the impact of the
implementation of debt sustainability measures
in Greece. In addition, the concerns regarding
Table 3
2011 2012 2011 2012
Canadian Dollar 1.01 1.00 4.2 -1.0
Japanese Yen/1 79.73 79.83 -9.0 0.1
Great Britain Pound 1.60 1.59 3.7 -0.6
Euro 1.39 1.29 4.9 -7.2
Source: Bloomberg
1. Expressed as local currency per unit of US dollars (in accordance with international convention)
Annual Per cent Change
Advanced Economies: Exchange Rates(Annual Average)
US Dollars per Unit of National Currency

- 10 -The Economy & Monetary Policy Review
Bank of Jamaica
the finalisation of the US 2013 fiscal budget
led to a weakening of the USD against selected
currencies in the final quarter of the year.
2.2.6. Commodity Markets
Commodity prices generally declined in 2012,
relative to the previous year, in the context of
lower demand associated with global economic
weakness, particularly during the second half
of the year. Additionally, increased supplies
of some commodities, amid record production
in key-producing regions, had a dampening
impact on prices. In this regard, the IMF’s Index
of Primary Commodity Prices (IPCP) registered
a decline of 3.1 per cent in 2012 relative to an
increase of 26.3 per cent in 2011 (see Table 4).
The decline in the IPCP reflected a contraction
in Non-fuel Commodities, the impact of which
was partly offset by a mild expansion in Energy.
Lower Non-fuel Commodities primarily
reflected reduced prices for Industrial Inputs,
including agricultural raw materials and
metals. The marginal increase in Energy
reflected higher prices during the first half of
the year, associated with geo-political tensions.
The impact was largely offset by the effects of
weak global demand on prices in the second
half of the year.
Table 4
2011 2012/1
All Primary Commodities 26.3 - 3.1
1. Non-fuel Commodities 17.8 - 9.8
1.1 Edibles 19.4 - 3.7
(a) Food 19.7 - 1.8
(b) Beverages 16.6 - 18.6
1.2 Industrial Inputs 16.4 - 15.5(a) Agricultural Raw Materials 22.7 - 12.6
(b) Metals 13.5 - 16.8
2. Energy 31.8 0.7
Petroleum/2 31.6 1.0
(a) WTI 19.6 - 1.0
(b) Brent 39.3 0.9
(c) Dubai 35.8 2.7
SUMMARY OF WORLD COMMODITY PRICESAnnual Average Per Cent Change
Source: IMF1/ Provisional2/ Simple Average of West Texas Intermediate (WTI), Brent and Dubai Crude oil prices
- 11 -
Annual Report 2012
The Economy & Monetary Policy Review
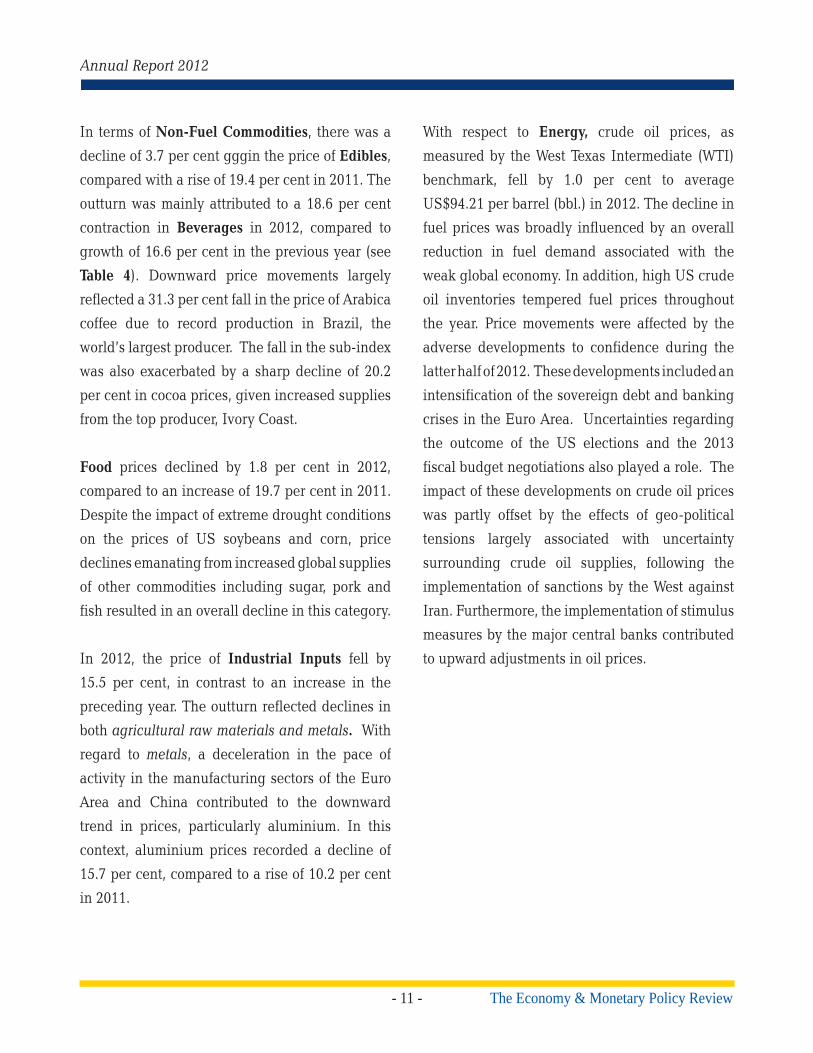
In terms of Non-Fuel Commodities, there was a
decline of 3.7 per cent gggin the price of Edibles,
compared with a rise of 19.4 per cent in 2011. The
outturn was mainly attributed to a 18.6 per cent
contraction in Beverages in 2012, compared to
growth of 16.6 per cent in the previous year (see
Table 4). Downward price movements largely
reflected a 31.3 per cent fall in the price of Arabica
coffee due to record production in Brazil, the
world’s largest producer. The fall in the sub-index
was also exacerbated by a sharp decline of 20.2
per cent in cocoa prices, given increased supplies
from the top producer, Ivory Coast.
Food prices declined by 1.8 per cent in 2012,
compared to an increase of 19.7 per cent in 2011.
Despite the impact of extreme drought conditions
on the prices of US soybeans and corn, price
declines emanating from increased global supplies
of other commodities including sugar, pork and
fish resulted in an overall decline in this category.
In 2012, the price of Industrial Inputs fell by
15.5 per cent, in contrast to an increase in the
preceding year. The outturn reflected declines in
both agricultural raw materials and metals. With
regard to metals, a deceleration in the pace of
activity in the manufacturing sectors of the Euro
Area and China contributed to the downward
trend in prices, particularly aluminium. In this
context, aluminium prices recorded a decline of
15.7 per cent, compared to a rise of 10.2 per cent
in 2011.
With respect to Energy, crude oil prices, as
measured by the West Texas Intermediate (WTI)
benchmark, fell by 1.0 per cent to average
US$94.21 per barrel (bbl.) in 2012. The decline in
fuel prices was broadly influenced by an overall
reduction in fuel demand associated with the
weak global economy. In addition, high US crude
oil inventories tempered fuel prices throughout
the year. Price movements were affected by the
adverse developments to confidence during the
latter half of 2012. These developments included an
intensification of the sovereign debt and banking
crises in the Euro Area. Uncertainties regarding
the outcome of the US elections and the 2013
fiscal budget negotiations also played a role. The
impact of these developments on crude oil prices
was partly offset by the effects of geo-political
tensions largely associated with uncertainty
surrounding crude oil supplies, following the
implementation of sanctions by the West against
Iran. Furthermore, the implementation of stimulus
measures by the major central banks contributed
to upward adjustments in oil prices.

- 12 -The Economy & Monetary Policy Review
Bank of Jamaica
2.3. Balance of Payments
2.3.1. Overview
Provisional data indicate that Jamaica’s
balance of payments (BOP) improved in 2012,
largely reflecting a reduction in the value
of imports associated with weak global and
domestic demand conditions. The weakness
in the global economy contributed to a decline
in select commodity prices, particularly oil
(see International Economic Developments
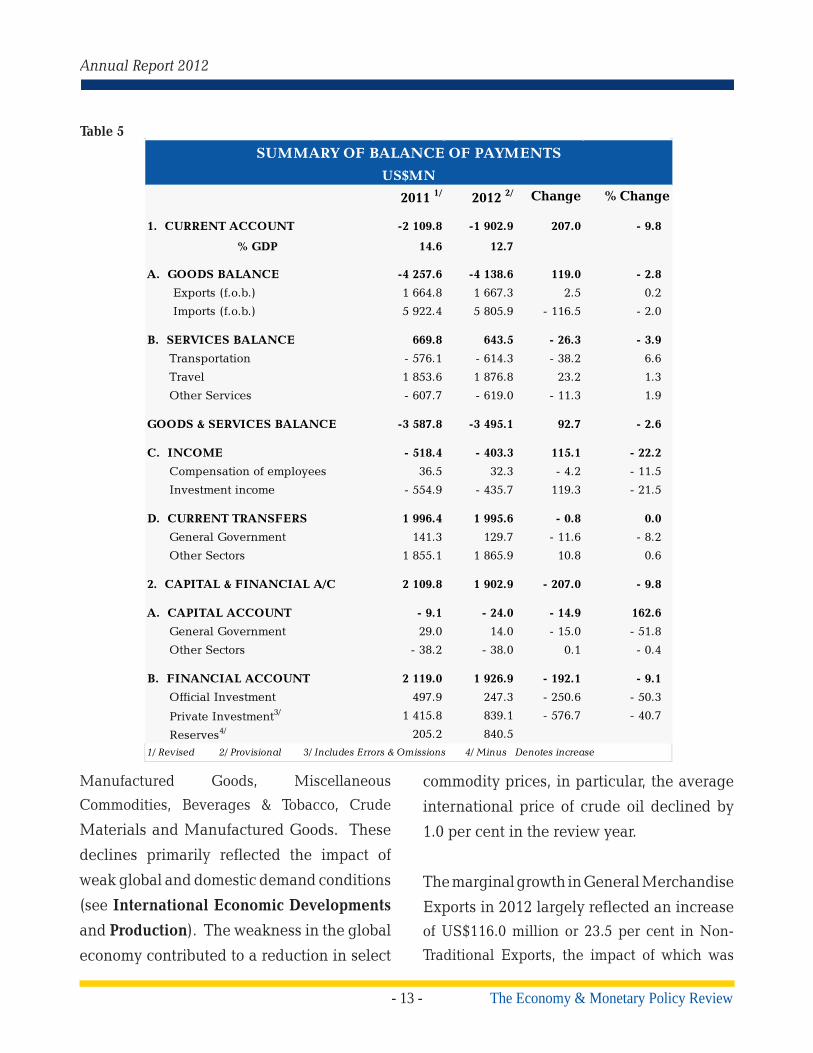
and Production). The current account deficit
for the year is estimated to have narrowed by
US$207.0 million to US$1 902.9 million or 12.7
per cent of GDP relative to 2011 (see Chart 1 and
Table 5). This improvement reflected declines
in the deficits on the Goods and Income sub-
accounts, the impact of which was partly offset
by reductions in the surpluses on the Services
and Current Transfers sub-accounts.
Net Private and Official Investment inflows
were insufficient to finance the deficits on the
capital and current accounts. Consequently,
the NIR of the Bank fell by US$840.5 million
to US$1 125.6 million at end-2012, with gross
reserves representing 13.2 weeks of projected
goods and services imports.
2.3.2. Merchandise Trade
In 2012, the merchandise trade deficit narrowed
by US$119.0 million relative to the deficit for
2011 (see Table 5). This improvement was
mainly driven by a decline of US$116.5 million
or 2.0 per cent in the value of imports (f.o.b.)
and a marginal increase of US$2.5 million or
0.2 per cent in earnings from exports.
The estimated contraction in imports was due
primarily to a reduction of US$113.0 million
or 4.6 per cent in spending on Mineral Fuels.
There were also declines in all other categories
of imports, with the exception of Miscellaneous
Chart 1
9.9
15.9
20.4
9.3 7.0
14.612.7
0.0
5.0
10.0
15.0
20.0
25.0
2006 2007 2008 2009 2010 2011 2012
Per c
ent o
f GDP
Year
Jamaica: Current Account Deficit to GDP
- 13 -
Annual Report 2012
The Economy & Monetary Policy Review
Manufactured Goods, Miscellaneous
Commodities, Beverages & Tobacco, Crude
Materials and Manufactured Goods. These
declines primarily reflected the impact of
weak global and domestic demand conditions
(see International Economic Developments
and Production). The weakness in the global
economy contributed to a reduction in select
commodity prices, in particular, the average
international price of crude oil declined by
1.0 per cent in the review year.
The marginal growth in General Merchandise
Exports in 2012 largely reflected an increase of US$116.0 million or 23.5 per cent in Non-
Traditional Exports, the impact of which was
Table 5
2011 1/ 2012 2/ Change % Change
1. CURRENT ACCOUNT -2 109.8 -1 902.9 207.0 - 9.8
% GDP 14.6 12.7
A. GOODS BALANCE -4 257.6 -4 138.6 119.0 - 2.8
Exports (f.o.b.) 1 664.8 1 667.3 2.5 0.2
Imports (f.o.b.) 5 922.4 5 805.9 - 116.5 - 2.0
B. SERVICES BALANCE 669.8 643.5 - 26.3 - 3.9
Transportation - 576.1 - 614.3 - 38.2 6.6
Travel 1 853.6 1 876.8 23.2 1.3
Other Services - 607.7 - 619.0 - 11.3 1.9
GOODS & SERVICES BALANCE -3 587.8 -3 495.1 92.7 - 2.6
C. INCOME - 518.4 - 403.3 115.1 - 22.2
Compensation of employees 36.5 32.3 - 4.2 - 11.5
Investment income - 554.9 - 435.7 119.3 - 21.5
D. CURRENT TRANSFERS 1 996.4 1 995.6 - 0.8 0.0
General Government 141.3 129.7 - 11.6 - 8.2
Other Sectors 1 855.1 1 865.9 10.8 0.6
2. CAPITAL & FINANCIAL A/C 2 109.8 1 902.9 - 207.0 - 9.8
A. CAPITAL ACCOUNT - 9.1 - 24.0 - 14.9 162.6
General Government 29.0 14.0 - 15.0 - 51.8
Other Sectors - 38.2 - 38.0 0.1 - 0.4
B. FINANCIAL ACCOUNT 2 119.0 1 926.9 - 192.1 - 9.1
Official Investment 497.9 247.3 - 250.6 - 50.3
Private Investment3/ 1 415.8 839.1 - 576.7 - 40.7
Reserves4/ 205.2 840.5
SUMMARY OF BALANCE OF PAYMENTS
1/ Revised 2/ Provisional 3/ Includes Errors & Omissions 4/ Minus Denotes increase
US$MN

- 14 -The Economy & Monetary Policy Review
Bank of Jamaica
partly offset by a decline in alumina exports.
With regard to Non-Traditional Exports, the
increase largely reflected higher receipts from
chemicals, primarily ethanol. Lower alumina
export earnings reflected a contraction of
11.0 per cent in export volumes as well as a
decline of 8.5 per cent in the average realised
price (ARP) of the commodity. The decline in
export volumes resulted from reduced capacity
utilisation at the JAMALCO alumina plant
which experienced production problems during
the first half of the year.
2.3.3. Services
Net earnings from Services declined by an
estimated 3.9 per cent to US$643.5 million in
2012, this reflecting increases in the deficits
on Transportation and Other Services. The
widening of the deficit on the Transportation
sub-account mainly reflected lower gross
inflows by US$59.2 million, relative to 2011,
due to declining activity at the country’s
ports. With regard to the Other Services the
worsening in the deficit was due largely to an
increase of US$10.8 million or 1.2 per cent in
payments for Insurance and Other Business
Services. The impact of the worsened deficits
in Transportation and Other Services was
partly offset by growth of 1.3 per cent in net
travel inflows relative to 2011 (see Table 5).
This improvement primarily reflected a rise of
1.8 per cent in stop-over visitor arrivals and
an expansion of 17.4 per cent in cruise visitor
arrivals.
2.3.4. Income
For 2012, the deficit on the income sub-account
narrowed by US$115.1 million or 22.2 per
cent to US$403.3 million. This improvement
principally reflected a decline of US$80.4
million or 71.9 per cent in the imputed profit
repatriated by the direct investment companies
and a fall of US$40.1 million or 8.6 per cent in
interest payments by the Central Government.
The impact of this improvement was partly
offset by a decline of US$4.2 million or 11.5 per
cent in Compensation of Employees, resulting
from higher outflows from foreigners working
in Jamaica (see Table 5).
2.3.5. Current Transfers
The surplus on the Current Transfers sub-
account fell marginally in 2012, reflecting a
decline of US$11.6 million or 8.2 per cent in
Government Grants, the impact of which was
partly offset by growth of US$10.8 million or
0.6 per cent in net Private Transfers. Of note,
Gross Private Transfer inflows increased by 0.8
per cent for 2012, relative to the expansion of
2.5 per cent in 2011. The slower pace of growth
in private inflows may have been influenced
by weakness in major developed countries as
well as institutional changes in the remittance
industry during the year.
2.3.6. Capital and Financial Account
The deficit on the Capital Account expanded by
US$14.9 million to US$24.0 million for 2012,
while the surplus on the Financial Account
narrowed by US$192.1 million to US$1 926.9

- 15 -
Annual Report 2012
The Economy & Monetary Policy Review
million. This deterioration in the Financial
Account largely reflected respective declines
of US$576.7 million and US$250.6 million in
net Private and Official Investment inflows (see
Table 5).
The decline in Net Official Investments
stemmed from a fall of US$623.1 million in
gross official inflows (see Table 6). Lower
Official inflows were largely underpinned
by a reduction of US$445.5 million in Other
Assistance, which was related to the government
not accessing the international market in 2012.
In addition, there was a decline of US$177.6
million in Project Loans, following exceptional
disbursements in 2011. The impact of these
weaker inflows was partly offset by a decline in
Gross Official Outflows, which was related to a
lower level of amortization of government debt
as well as a reduction in trade suppliers’ credit.
Net private and official investments were insuf-
ficient to finance the deficits on the capital and
current accounts. As a result, the NIR of the
Bank fell by US$840.5 million to US$1125.6
million at end-2012. Gross Foreign Assets at
end-2012 were valued at US$1 980.80 million,
representing 13.2 weeks of projected goods and
services imports.
Table 6
20111/ 20122/ ChangeGROSS OFFICIAL INFLOWS 1 670.5 1 047.5 - 623.1
Project Loan 310.1 132.5 - 177.6
Other Assistance 1 360.4 915.0 - 445.5
GROSS OFFICIAL OUTFLOWS 1 172.6 800.2 - 372.4
Government Direct 690.1 569.4 - 120.7
Bank of Jamaica 177.0 66.0 - 110.9
OtherOfficial 305.6 164.8 - 140.8
NET OFFICIAL INVESTMENTS 497.9 247.3 - 250.61/ Revised2/ Provisional
OFFICIAL INVESTMENT FLOWS (US$MN)
- 16 -The Economy & Monetary Policy Review
Bank of Jamaica
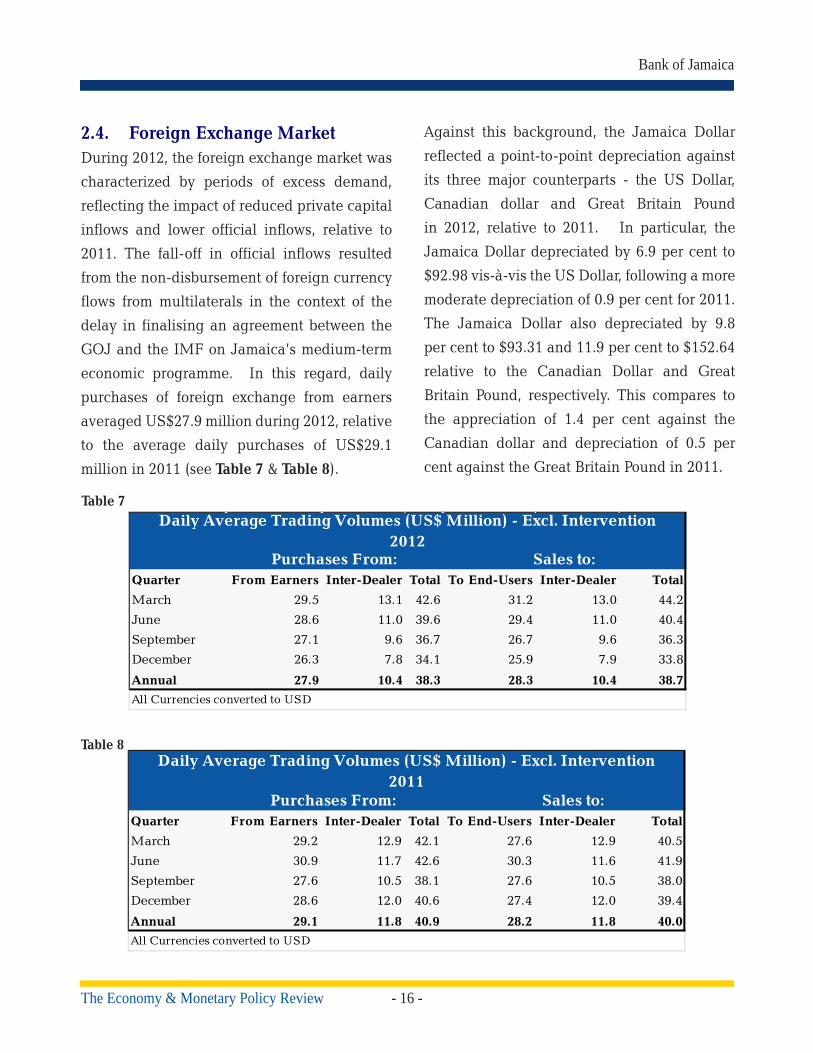
2.4. Foreign Exchange Market During 2012, the foreign exchange market was
characterized by periods of excess demand,
reflecting the impact of reduced private capital
inflows and lower official inflows, relative to
2011. The fall-off in official inflows resulted
from the non-disbursement of foreign currency
flows from multilaterals in the context of the
delay in finalising an agreement between the
GOJ and the IMF on Jamaica’s medium-term
economic programme. In this regard, daily
purchases of foreign exchange from earners
averaged US$27.9 million during 2012, relative
to the average daily purchases of US$29.1
million in 2011 (see Table 7 & Table 8).
Against this background, the Jamaica Dollar
reflected a point-to-point depreciation against
its three major counterparts - the US Dollar,
Canadian dollar and Great Britain Pound
in 2012, relative to 2011. In particular, the
Jamaica Dollar depreciated by 6.9 per cent to
$92.98 vis-à-vis the US Dollar, following a more
moderate depreciation of 0.9 per cent for 2011.
The Jamaica Dollar also depreciated by 9.8
per cent to $93.31 and 11.9 per cent to $152.64
relative to the Canadian Dollar and Great
Britain Pound, respectively. This compares to
the appreciation of 1.4 per cent against the
Canadian dollar and depreciation of 0.5 per
cent against the Great Britain Pound in 2011.
Table 7
Quarter From Earners Inter-Dealer Total To End-Users Inter-Dealer Total
March 29.5 13.1 42.6 31.2 13.0 44.2
June 28.6 11.0 39.6 29.4 11.0 40.4
September 27.1 9.6 36.7 26.7 9.6 36.3
December 26.3 7.8 34.1 25.9 7.9 33.8
Annual 27.9 10.4 38.3 28.3 10.4 38.7
Daily Average Trading Volumes (US$ Million) - Excl. Intervention 2012
Purchases From: Sales to:
All Currencies converted to USD
Table 8
Quarter From Earners Inter-Dealer Total To End-Users Inter-Dealer Total
March 29.2 12.9 42.1 27.6 12.9 40.5
June 30.9 11.7 42.6 30.3 11.6 41.9
September 27.6 10.5 38.1 27.6 10.5 38.0
December 28.6 12.0 40.6 27.4 12.0 39.4
Annual 29.1 11.8 40.9 28.2 11.8 40.0
Daily Average Trading Volumes (US$ Million) - Excl. Intervention 2011
Purchases From: Sales to:
All Currencies converted to USD

- 17 -
Annual Report 2012
The Economy & Monetary Policy Review
In the March 2012 quarter, foreign exchange
market conditions were stable in the context of
fairly ample US Dollar supply. In this regard,
earner inflows averaged US$29.5 million daily
compared with average daily earner inflows of
US$29.2 million for the corresponding quarter
in 2011. However, daily average sales to
end users increased to US$31.2 million from
US$27.6 million for the March 2011 quarter.
Consequently, the weighted average sale rate
(WASR) depreciated by 0.8 per cent in the
March quarter, albeit the slowest quarterly pace
of adjustment in the currency for the calendar
year.
By the middle of the June quarter, market
conditions were adversely affected by the
protracted negotiations between the GOJ
and the IMF on the country’s medium-term
economic programme. This was manifested in
a reduction in earner supply to a daily average
of US$28.6 million from US$30.9 million for
the June 2011 quarter, while average daily
sales was relatively unchanged. Against this
background, the Jamaica Dollar depreciated
by 1.6 per cent in the June 2012 quarter,
relative to a fairly moderate depreciation of
0.2 per cent for the corresponding period in
2011. For the first half of 2012, the Jamaica
Dollar therefore depreciated by 2.4 per cent,
compared with depreciation of 0.1 per cent for
the corresponding period in 2011.
Market conditions remained overwrought
during the second half of 2012, given the
uncertainty about the country’s fiscal outlook.
In particular, there were concerns about the
financing plans for the GOJ Eurobond that was
due to mature in the September quarter. In this
context, the Jamaica Dollar recorded a faster
pace of depreciation, relative to the first half
of the year. The point-to-point depreciation
was 4.6 per cent relative to the first half of the
year, reflecting depreciation of 1.4 per cent and
3.3 per cent for the September and December
quarters, respectively.
The sharp depreciation in the WASR during
the second half of the year coincided with a
trend decline in foreign currency inflows from
earners. In particular, per diem inflows from
earners fell to an average of US$26.7 million for
the second half of the year from an average of
US$29.1 million for the first half of 2012. This
tightening in US dollar supply during the year
was also manifested in the progressive decline
in inter-dealer transactions (see Table 7 & Table
8). Similarly the average per diem sales to end
users fell to US$26.3 million for the second half
of the year from US$30.3 million for the first
half.
In the context of the instability in the foreign
market during the year, the Bank intervened on
several occasions. This resulted in net foreign
currency sale of US$524.6 million, in contrast
to net foreign currency purchase of US$331.3
million for 2011 (see Chart 2). Whilst the
Bank’s frequency of intervention was moderate
during the March quarter, there was a marked

- 18 -The Economy & Monetary Policy Review
Bank of Jamaica
increase the June and September quarters.
This increase was necessitated by the market’s
adverse reaction to the continued delay in ar-
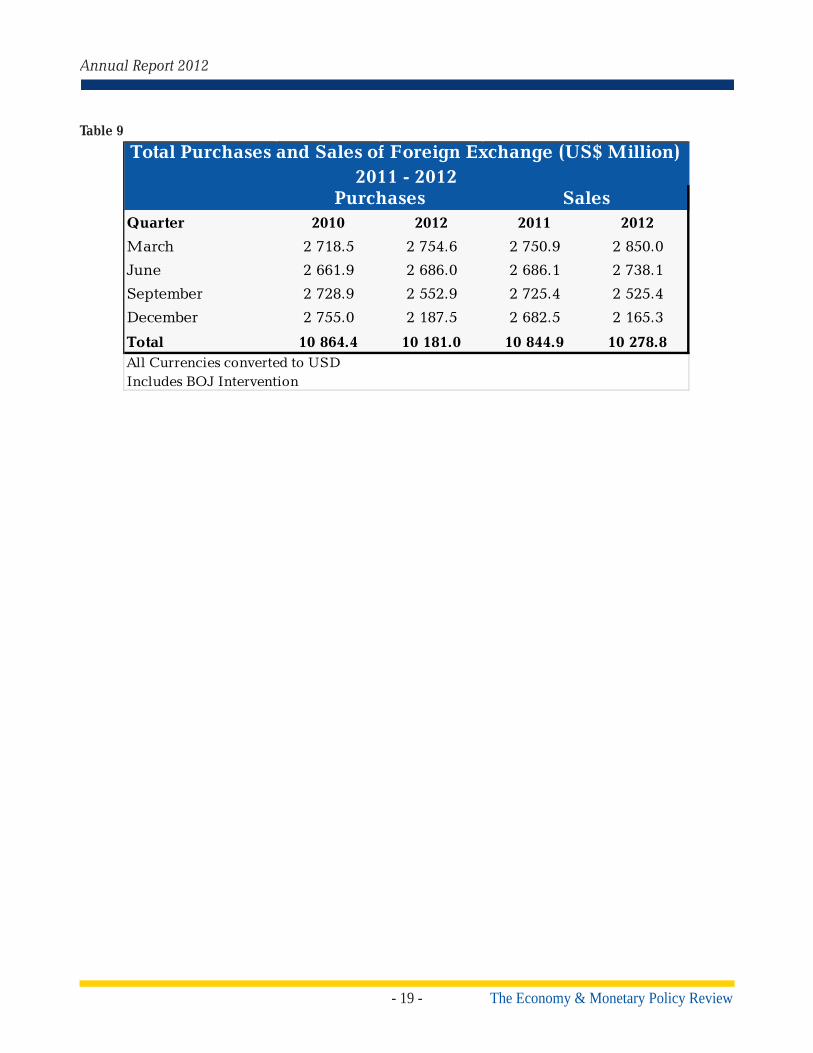
riving at agreement with the IMF. Against this
background, total purchases and sales report-
ed by authorized foreign currency traders de-
clined to US$10 181.0 million and US$10 278.8
million, respectively, during 2012 from US$10
864.4 million and US$10 844.9 million, for
2011 (see Table 9). Concurrently, the share of
inter-dealer trades as a per cent of total trades
declined to 26.8 per cent for 2012 from 29.4 per
cent for 2011.
Chart 2 Bank of Jamaica: Foreign Exchange Market Intervention (Spot Market) 2012
The distribution of market activity between the
main intermediaries i.e. authorized dealers and
cambios, shifted marginally for 2012, although
authorised dealers remained the dominant in-
termediary. In this regard, for 2012, the author-
ized dealers’ market share as a percentage of
total foreign exchange sales declined to 54.3
per cent from 62.6 per cent for 2011. In contrast,
there was an increase in cambios’ market share
to 45.7 per cent from 37.4 per cent in 2011.
- 19 -
Annual Report 2012
The Economy & Monetary Policy Review
Table 9
Quarter 2010 2012 2011 2012
March 2 718.5 2 754.6 2 750.9 2 850.0
June 2 661.9 2 686.0 2 686.1 2 738.1
September 2 728.9 2 552.9 2 725.4 2 525.4
December 2 755.0 2 187.5 2 682.5 2 165.3
Total 10 864.4 10 181.0 10 844.9 10 278.8
Total Purchases and Sales of Foreign Exchange (US$ Million) 2011 - 2012
Purchases Sales
All Currencies converted to USD Includes BOJ Intervention
- 20 -The Economy & Monetary Policy Review
Bank of Jamaica
2.5. Prices
2.5.1. Overview
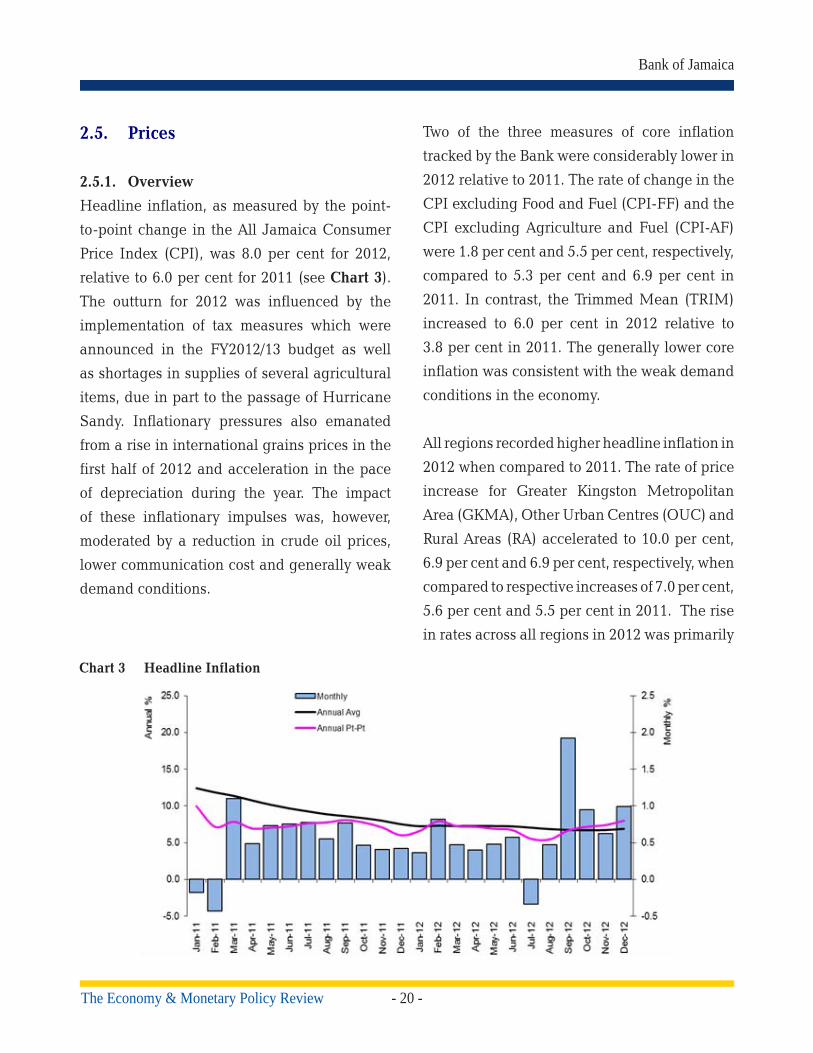
Headline inflation, as measured by the point-
to-point change in the All Jamaica Consumer
Price Index (CPI), was 8.0 per cent for 2012,
relative to 6.0 per cent for 2011 (see Chart 3).
The outturn for 2012 was influenced by the
implementation of tax measures which were
announced in the FY2012/13 budget as well
as shortages in supplies of several agricultural
items, due in part to the passage of Hurricane
Sandy. Inflationary pressures also emanated
from a rise in international grains prices in the
first half of 2012 and acceleration in the pace
of depreciation during the year. The impact
of these inflationary impulses was, however,
moderated by a reduction in crude oil prices,
lower communication cost and generally weak
demand conditions.
Two of the three measures of core inflation
tracked by the Bank were considerably lower in
2012 relative to 2011. The rate of change in the
CPI excluding Food and Fuel (CPI-FF) and the
CPI excluding Agriculture and Fuel (CPI-AF)
were 1.8 per cent and 5.5 per cent, respectively,
compared to 5.3 per cent and 6.9 per cent in
2011. In contrast, the Trimmed Mean (TRIM)
increased to 6.0 per cent in 2012 relative to
3.8 per cent in 2011. The generally lower core
inflation was consistent with the weak demand
conditions in the economy.
All regions recorded higher headline inflation in
2012 when compared to 2011. The rate of price
increase for Greater Kingston Metropolitan
Area (GKMA), Other Urban Centres (OUC) and
Rural Areas (RA) accelerated to 10.0 per cent,
6.9 per cent and 6.9 per cent, respectively, when
compared to respective increases of 7.0 per cent,
5.6 per cent and 5.5 per cent in 2011. The rise
in rates across all regions in 2012 was primarily
Chart 3 Headline Inflation

- 21 -
Annual Report 2012
The Economy & Monetary Policy Review
reflected in Food & Non-Alcoholic Beverages
(FNB), Restaurants & Accommodation Services
Source: STATIN
18.8
8.6
16.6
5.0
10.6
3.8
2.4
30.4
4.3
2.0
4.9
8.0
FNB
ATB
CF
HWEG
FHERM
HLTH
TRAN
COM
R&C
ED
R&A
MIS
11.4
3.7
7.6
6.3
2.3
2.5
1.3
34.8
1.0
16.0
3.9
2.7
%Inflation (2012) GKMA Change (yoy %ppt)
12.1
6.4
10.6
4.9
9.0
2.4
2.1
40.1
6.7
5.1
6.2
6.5
FNB
ATB
CF
HWEG
FHERM
HLTH
TRAN
COM
R&C
ED
R&A
MIS
8.3
0.0
1.0
6.6
2.2
0.9
2.3
43.3
1.6
3.7
2.8
0.7
%Inflation (2012) OUC Change (yoy %ppt)
12.2
4.5
9.0
5.8
6.7
3.0
2.4
46.9
8.2
5.3
5.3
4.3
FNB
ATB
CF
HWEG
FHERM
HLTH
TRAN
COM
R&C
ED
R&A
MIS
7.4
0.3
1.4
8.0
0.1
0.1
1.0
48.9
6.2
3.8
2.2
0.7
%Inflation (2012) RA Change (yoy %ppt)
Blue bars = positive and Red bars = negative
Chart 4 Annual Inflation & YOY Change by Region
(R&A) and Recreation & Culture (R&C) (see
Chart 4 & Appendix A).
- 22 -The Economy & Monetary Policy Review
Bank of Jamaica
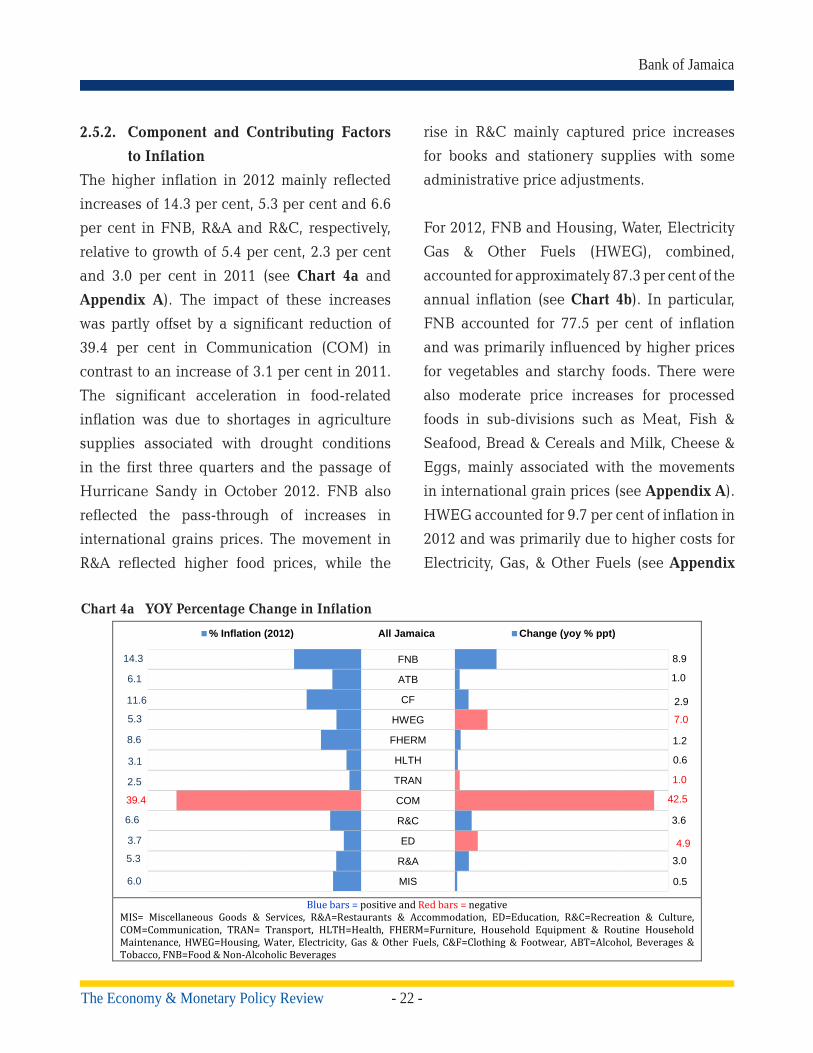
2.5.2. Component and Contributing Factors
to Inflation
The higher inflation in 2012 mainly reflected
increases of 14.3 per cent, 5.3 per cent and 6.6
per cent in FNB, R&A and R&C, respectively,
relative to growth of 5.4 per cent, 2.3 per cent
and 3.0 per cent in 2011 (see Chart 4a and
Appendix A). The impact of these increases
was partly offset by a significant reduction of
39.4 per cent in Communication (COM) in
contrast to an increase of 3.1 per cent in 2011.
The significant acceleration in food-related
inflation was due to shortages in agriculture
supplies associated with drought conditions
in the first three quarters and the passage of
Hurricane Sandy in October 2012. FNB also
reflected the pass-through of increases in
international grains prices. The movement in
R&A reflected higher food prices, while the
rise in R&C mainly captured price increases
for books and stationery supplies with some
administrative price adjustments.
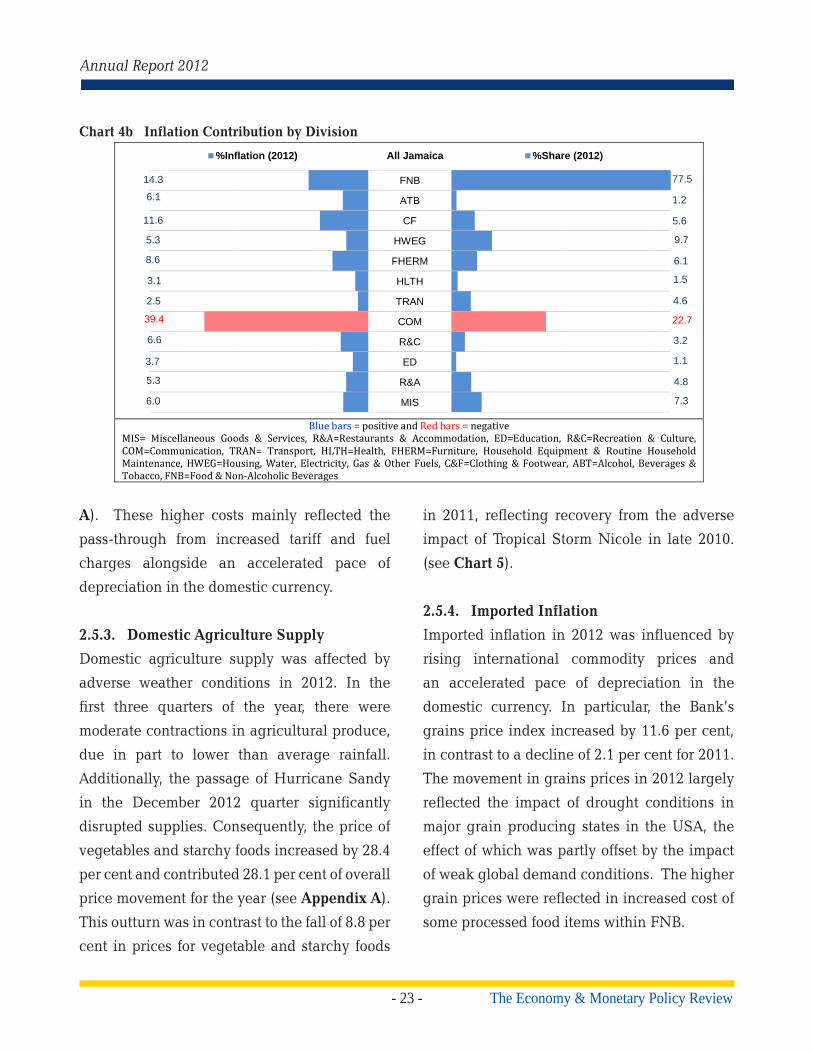
For 2012, FNB and Housing, Water, Electricity
Gas & Other Fuels (HWEG), combined,
accounted for approximately 87.3 per cent of the
annual inflation (see Chart 4b). In particular,
FNB accounted for 77.5 per cent of inflation
and was primarily influenced by higher prices
for vegetables and starchy foods. There were
also moderate price increases for processed
foods in sub-divisions such as Meat, Fish &
Seafood, Bread & Cereals and Milk, Cheese &
Eggs, mainly associated with the movements
in international grain prices (see Appendix A).
HWEG accounted for 9.7 per cent of inflation in
2012 and was primarily due to higher costs for
Electricity, Gas, & Other Fuels (see Appendix
14.3
6.1
11.6
5.3
8.6
3.1
2.5
39.4
6.6
3.7
5.3
6.0
FNB
ATB
CF
HWEG
FHERM
HLTH
TRAN
COM
R&C
ED
R&A
MIS
8.9
1.0
2.9
7.0
1.2
0.6
1.0
42.5
3.6
4.9
3.0
0.5
% Inflation (2012) All Jamaica Change (yoy % ppt)
Blue bars = positive and Red bars = negative
MIS= Miscellaneous Goods & Services, R&A=Restaurants & Accommodation, ED=Education, R&C=Recreation & Culture, COM=Communication, TRAN= Transport, HLTH=Health, FHERM=Furniture, Household Equipment & Routine Household Maintenance, HWEG=Housing, Water, Electricity, Gas & Other Fuels, C&F=Clothing & Footwear, ABT=Alcohol, Beverages & Tobacco, FNB=Food & Non-Alcoholic Beverages
Chart 4a YOY Percentage Change in Inflation
- 23 -
Annual Report 2012
The Economy & Monetary Policy Review
14.3
6.1
11.6
5.3
8.6
3.1
2.5
39.4
6.6
3.7
5.3
6.0
FNB
ATB
CF
HWEG
FHERM
HLTH
TRAN
COM
R&C
ED
R&A
MIS
77.5
1.2
5.6
9.7
6.1
1.5
4.6
22.7
3.2
1.1
4.8
7.3
%Inflation (2012) All Jamaica %Share (2012)
Blue bars = positive and Red bars = negative
MIS= Miscellaneous Goods & Services, R&A=Restaurants & Accommodation, ED=Education, R&C=Recreation & Culture, COM=Communication, TRAN= Transport, HLTH=Health, FHERM=Furniture, Household Equipment & Routine Household Maintenance, HWEG=Housing, Water, Electricity, Gas & Other Fuels, C&F=Clothing & Footwear, ABT=Alcohol, Beverages & Tobacco, FNB=Food & Non-Alcoholic Beverages
Chart 4b Inflation Contribution by Division
A). These higher costs mainly reflected the
pass-through from increased tariff and fuel
charges alongside an accelerated pace of
depreciation in the domestic currency.
2.5.3. Domestic Agriculture Supply
Domestic agriculture supply was affected by
adverse weather conditions in 2012. In the
first three quarters of the year, there were
moderate contractions in agricultural produce,
due in part to lower than average rainfall.
Additionally, the passage of Hurricane Sandy
in the December 2012 quarter significantly
disrupted supplies. Consequently, the price of
vegetables and starchy foods increased by 28.4
per cent and contributed 28.1 per cent of overall
price movement for the year (see Appendix A).
This outturn was in contrast to the fall of 8.8 per
cent in prices for vegetable and starchy foods
in 2011, reflecting recovery from the adverse
impact of Tropical Storm Nicole in late 2010.
(see Chart 5).
2.5.4. Imported Inflation
Imported inflation in 2012 was influenced by
rising international commodity prices and
an accelerated pace of depreciation in the
domestic currency. In particular, the Bank’s
grains price index increased by 11.6 per cent,
in contrast to a decline of 2.1 per cent for 2011.
The movement in grains prices in 2012 largely
reflected the impact of drought conditions in
major grain producing states in the USA, the
effect of which was partly offset by the impact
of weak global demand conditions. The higher
grain prices were reflected in increased cost of
some processed food items within FNB.

- 24 -The Economy & Monetary Policy Review
Bank of Jamaica
In contrast to the movement in grains prices,
there was a decline of 10.5 per cent in the
West Texas Intermediate crude (WTI) oil price,
relative to the increase of 10.5 per cent in 2011
(see Chart 6). Consistent with the decline in
international oil price, there were lower rates of
increase in the cost of fuel and energy related
products. These were reflected in lower rates
of movements in TRAN and HWEG relative to
2011.
The exchange rate between the Jamaica Dollar
and the US Dollar depreciated by 6.9 per cent
for 2012. This compares with depreciation of
0.9 per cent for end-2011. This depreciation
resulted in some pass-through to prices and
was mainly reflected within HWEG and FNB.
The acceleration in the pace of depreciation
during the year was influenced by uncertainties
surrounding negotiations between the GOJ
and the IMF for a new borrowing programme.
2.5.5. Administered and Other Price
Adjustments
During the June 2012 quarter, the tax base
was widened to incorporate a variety of basic
food items that were previously tax-exempt or
zero rated. In addition, there were increased
fees for motor vehicle licences, fitness and
registration. The inflationary impact from these
Chart 5 Average Supplies of Agriculture Produce (2011 - 2012)
2011
Yellow Yam
Irish Potato
Ripe Plantains
Sweet Potato
Dasheen
Carrot
Cabbage
Red Peas
Tomato (Plummie)
Escallion & Thyme
Callaloo
Pumpkin
Lettuce
Star
ches
Vege
tabl
es
Actual Avg. of previous 5-years 2012
52.0
71.8
-15.5
3.1
-4.6
-22.0
-1.7
6.8
9.6
-7.2
-22.0
6.3
-29.2
Actual (%)
Source: RADA

- 25 -
Annual Report 2012
The Economy & Monetary Policy Review
AVG EOP AVG EOP AVG EOPWTI Prices Grain Prices Exchange Rate
2011 95.12 98.58 371.78 355.89 86.07 86.602012 94.21 88.27 380.87 397.115 88.97 92.982011 (yoy%) 19.6 10.5 25.1 -2.1 -1.6 0.92012 (yoy%) -1.0 -10.5 2.4 11.6 3.4 7.4
-10
0
10
20
30
40
50
60
70
80
-50
0
50
100
150
200
250
300
350
4002011
2012
2011 (yoy%)
2012 (yoy%)
Chart 6 Trends in WTI Crude Oil & BOJ Grains Index
Source: Bloomberg & STATIN
tax measures was mainly reflected in FNB and
TRAN. Price increases arising from these tax
measures were highest for dairy products, fish
& seafood and meats, which accounted for
30.0 per cent of the movement in CPI during
the year. Price increases arising from these
tax measures were highest for dairy products,
fish & seafood, and meats which accounted
for 30.0 per cent of the movement in the CPI
during the year. The impact of these impulses
was tempered by a reduction in the GCT rate to
16.5 per cent from 17.5 per cent.
Other price changes also contributed to inflation
pressures throughout 2012. Specifically, he
Incorporated Master Builders Association of
Jamaica (IMAJ) effected an average increase
of 5.0 per cent in wages for artisans in February
2012, which was reflected within HWEG. This
followed an average increase of 10.0 per cent
in 2011. Also, in September 2012, there was
an increase of 11.1 per cent in the National
Minimum Wage, which was reflected in
Furniture, Household Equipment & Routine
Household Maintenance.
2.5.6. Demand and Supply Conditions
Some short-term indicators of domestic
demand reflected mixed results throughout
the year. These indicators include PAYE
receipts and the values of debit & credit card
transactions, imports and non-business loans.
In real terms, PAYE receipts and imports
reflected declines of 3.5 per cent and 3.7 per
cent, respectively, relative to increases of 7.5
per cent and 4.7 per cent in 2011. In contrast,
in real terms, the values of debit and credit
card transactions and non-business loans
increased by 2.9 per cent and 14.8 per cent,
respectively, following growth of 5.2 per cent
and 3.0 per cent for 2011. The mixed outturn
for 2012 indicates overall weak demand in the
domestic economy (see Chart 7).

- 26 -The Economy & Monetary Policy Review
Bank of Jamaica
The Bank estimates that Jamaica’s output gap
widened in 2012 as business activity slowed
amid sluggish demand conditions (see Chart 8).
The resulting excess capacity among industrial
suppliers, combined with weakened domestic
demand had a moderating impact on inflation.
2.5.7. Inflation Expectations
The Bank’s survey of inflation expectations
indicated that the average expected annual
inflation among businesses for 2012 was 8.1
per cent, in line with the actual outturn of
8.0 per cent for the year (see Chart 9). This
expectation was also substantially below the
average of 11.9 per cent that was anticipated
for 2011. The result for 2012 reflected a general
downward adjustment in business expectations
as inflationary pressures subsided within the
low demand environment.
Chart 7 Average Supplies of Agriculture Produce (2010-2011)
Sources: MOF, JETS, STATIN, BOJ
A
15
20
25
30
35
40
45
50
55D
ec-0
7
Apr
-08
Aug
-08
Dec
-08
Apr
-09
Aug
-09
Dec
-09
Apr
-10
Aug
-10
Dec
-10
Apr
-11
Aug
-11
Dec
-11
Apr
-12
Aug
-12
Dec
-12
J$ m
illio
n de
flate
d
Real PAYE
Polynomial Trend
B
80
100
120
140
160
180
200
220
Jun-
09
Sep
-09
Dec
-09
Mar
-10
Jun-
10
Sep
-10
Dec
-10
Mar
-11
Jun-
11
Sep
-11
Dec
-11
Mar
-12
Jun-
12
Sep
-12
Dec
-12
J$m
illio
n
Real DebitCredit Tran
Polynomial Trend
C
0
1
2
3
4
5
6
7
8
Jun-
09
Sep-
09
Dec
-09
Mar
-10
Jun-
10
Sep-
10
Dec
-10
Mar
-11
Jun-
11
Sep-
11
Dec
-11
Mar
-12
Jun-
12
Sep-
12
Dec
-12
US$Billion
Real Import Value
Polynomial Trend
D
450
500
550
600
650
700
Mar
-09
Jun-
09
Sep-
09
Dec
-09
Mar
-10
Jun-
10
Sep-
10
Dec
-10
Mar
-11
Jun-
11
Sep-
11
Dec
-11
Mar
-12
Jun-
12
Sep-
12
Dec
-12
J$million NonBusiness LoansPolynomial Trend
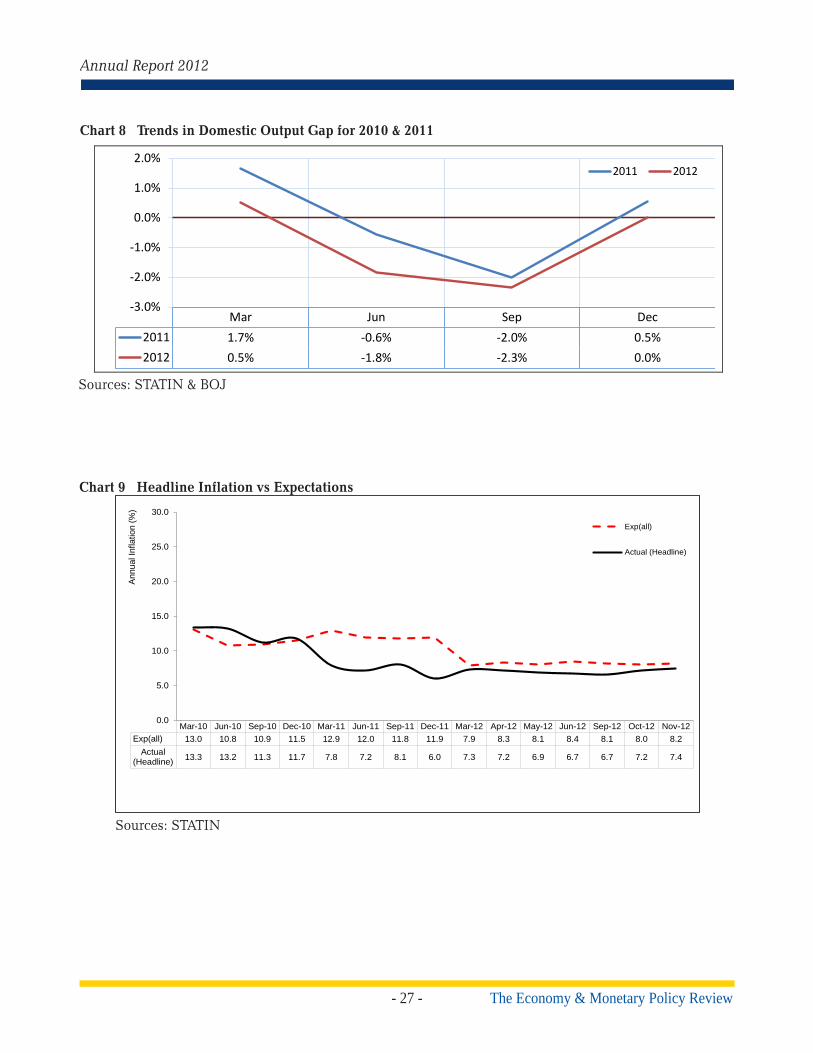
- 27 -
Annual Report 2012
The Economy & Monetary Policy Review
Chart 8 Trends in Domestic Output Gap for 2010 & 2011
Sources: STATIN & BOJ
Mar-10 Jun-10 Sep-10 Dec-10 Mar-11 Jun-11 Sep-11 Dec-11 Mar-12 Apr-12 May-12 Jun-12 Sep-12 Oct-12 Nov-12Exp(all) 13.0 10.8 10.9 11.5 12.9 12.0 11.8 11.9 7.9 8.3 8.1 8.4 8.1 8.0 8.2
Actual(Headline) 13.3 13.2 11.3 11.7 7.8 7.2 8.1 6.0 7.3 7.2 6.9 6.7 6.7 7.2 7.4
0.0
5.0
10.0
15.0
20.0
25.0
30.0
Annu
al In
flatio
n (%
)
Exp(all)
Actual (Headline)
Chart 9 Headline Inflation vs Expectations
Sources: STATIN
Mar Jun Sep Dec2011 1.7% -0.6% -2.0% 0.5%2012 0.5% -1.8% -2.3% 0.0%
-3.0%
-2.0%
-1.0%
0.0%
1.0%
2.0%2011 2012
- 28 -The Economy & Monetary Policy Review
Bank of Jamaica
2.6. Money and Credit
2.6.1. Money Supply
For 2012, growth in broad Jamaica Dollar money
supply (M3J) decelerated to 0.6 per cent from
10.5 per cent in 2011 and was well below the
average growth of 8.7 per cent for the last five
calendar years (see Table 10). This marginal
increase in 2012, occurred in the context of a
contraction in the domestic economy, declining
real incomes and marked deceleration in
remittance inflows to Jamaica.
The increase in M3J during 2012 was mainly
reflected in growth of 0.1 per cent and 3.6 per
cent in local currency deposits and Currency
with the Public, respectively. 1,2 For local
currency deposits, the increase was well below
the expansion of 10.7 per cent in 2011. Within
local currency deposits, demand and time
deposits grew by 5.5 per cent and 9.9 per cent,
respectively. Savings deposits decelerated to
0.8 per cent, the lowest rate since December
2000 and could be reflecting the impact of
declining real incomes as well as a deceleration
in remittance inflows in 2012. The impact of
these expansions was partly offset by a decline
of 6.1 per cent in Other Deposits.3
1 M3J is the measure of broad money which is comprised
of currency in circulation and local currency deposits.
Local currency deposits consist of demand, savings, time
and other deposits denominated in Jamaica Dollar.
2 In real terms, there was a decline of 4.1 per cent in
currency in circulation during the year, relative to an
increase of 2.9 per cent in 2011.
3 The decline in Other Deposits in 2012 reflected the
At end-2012, the money multiplier
corresponding to M3J was 3.66 relative to 3.87
at end-2011. This decrease reflected increases
in both the currency to deposit and the reserve
to deposit ratios. The higher ratios were largely
attributable to the significant deceleration in
the growth of local currency deposits.
For the review year, the measure of money
supply that includes foreign currency
deposits, M3*, grew by 5.4 per cent, relative
to an increase of 7.6 per cent for 2011. This
expansion in M3* reflected growth of 21.6
per cent in foreign currency deposits, which
was in contrast to the decline of 1.0 per cent
for the previous year. Of note, the expansion
in the Jamaica Dollar value of these deposits
was attributable to an increase of 13.4 per cent
in the USD equivalent of the foreign currency
stock as well as the depreciation of 6.9 per cent
in the exchange rate vis-à-vis the US dollar,
compared to 0.9 per cent in 2011. The growth
in foreign currency deposits during 2012 was
largely reflected in demand and time deposits
held by business firms. This growth in foreign
currency deposits was particularly evident in
the December 2012 quarter when the stock of
demand deposits denominated in US dollars
doubled in the context of an acceleration in the
normalization, after significant growth in commercial
bank reserves and retained earnings. In 2011, growth
in local currency deposits was largely reflected in
Other Deposits. Within Other Deposits, commercial
bank reserves and retained earnings grew significantly,
associated with initiatives to contain cost and grow non-
interest income.

- 29 -
Annual Report 2012
The Economy & Monetary Policy Review
Table 10
2011 2012 2011 2012Total Money Supply (M3)* 32 605.2 7.6 5.4
Money Supply (M3J) 33 639.0 10.5 0.6
Money Supply (M2J) 14 787.9 6.4 3.6
Money Supply (M1J) 9 505.1 9.2 4.6 Currency with the public 4 377.1 9.0 3.6
Demand Deposits 5 128.0 9.4 5.5
Quasi Money 5 282.8 4.2 2.8Savings Deposits 4 510.6 4.6 0.8Time Deposits 772.2 2.7 9.9
Other Deposits 18 851.1 20.6 - 6.1
Foreign Currency Deposits -1 033.7 - 1.0 21.6
2011 2011 2012TOTAL 32 605.2 7.6 5.4
Net Foreign Assets 4 217.3 3.9 7.3Bank of Jamaica -21 147.7 - 9.5 2.4Commercial Banks 25 364.9 - 201.3 73.6
Credit to Private Sector 20 728.2 9.5 16.7Local Currency 17 120.0 11.9 24.0Foreign Currency 3 608.2 4.9 1.7
Net Claims on Public Sector -26 605.8 - 11.5 18.5
Net Claims on Financial Institutions 7 955.4 - 22.8 - 0.1
BOJ Open Market Operations/1 30 280.3 23.4 - 51.8
Other Items (Net) -3 970.1 10.7 286.6
51 224.3
-117 482.2/1 A negative flow represents an increase in the stock.
38 739.11 316.7
37 759.6
21.2
40 055.8
22 948.8
Sources of Change in Money SupplyFlows (J$MN) % Change
201225 084.613 506.04 115.59 390.5
8 828.7
5 151.61 880.93 270.7
3 677.1 771.8
2 905.3
-6 692.8
COMPONENTS OF CHANGE IN MONEY SUPPLY
Flows (J$MN) % Change
25 084.62 135.9

- 30 -The Economy & Monetary Policy Review
Bank of Jamaica
pace of depreciation. As a result of the increase
in foreign currency deposits, the ratio of foreign
currency deposits to total deposits at end-2012
was 29.9 per cent, relative to 26.0 per cent at
end-2011 (see Chart 10).
The expansion in M3, partly reflected an
increase of 16.7 per cent in private sector credit
and growth of 18.5 per cent in Net Claims on
the Public Sector. In addition, there was net
unwinding of $51.2 billion or 51.8 per cent of
BOJ open market securities during the year,
relative to the net unwinding of $30.3 billion
or 23.4 per cent during 2011 (see Monetary
Policy Management).
2.6.2. Private Sector Credit
For 2012, the stock of commercial bank credit to
the private sector grew by 16.2 per cent and was
largely denominated in Jamaica Dollar loans
and advances (see Table 11). This expansion
exceeded the increase of 9.5 per cent for 2011
and the average growth of 13.6 per cent for the
previous five years. The acceleration in growth
primarily reflected an expansion in local
currency loans and to a lesser extent, further
investment in corporate securities.
2.6.3. Loans and Advances
Loans and advances, the largest component of
private sector credit, expanded by 15.9 per cent
relative to growth of 9.7 per cent for 2011. This
increase for 2012 reflected expansions in both
business and personal lending (see Table 12).
The stock of commercial bank loans to businesses
increased by 10.7 per cent in 2012, relative to
growth of 5.0 per cent in 2011 (see Table 13).
Growth in Business Lending was reflected in
most sectors, in particular Distribution (31.4
per cent), Manufacturing (55.2 per cent) and
Electricity, Gas & Water (54.0 per cent). The
expansion in Distribution largely represented
syndicated foreign currency loans for debt
Chart 10 Foreign Currency Deposits to Total Deposits - December 2003 to December 2012

- 31 -
Annual Report 2012
The Economy & Monetary Policy Review
Table 11
Table 12
Table 13
Stock Stock Flows Flows % %
2011 2012 2011 2012 2011 2012
Private Sector 241 528.8 279 881.8 21 270.6 38 353.1 9.7 15.9
Business Lending 131 899.9 146 039.2 6 281.9 14 139.3 5.0 10.7
Agriculture & Fishing 5 366.1 6 138.2 846.6 772.1 18.7 14.4
Mining & Quarrying 556.3 693.0 129.9 136.7 30.5 24.6
Manufacturing 7 771.3 12 063.1 - 524.8 4 291.8 - 6.3 55.2
Construction & Land Dev. 21 079.0 21 115.4 - 883.5 36.4 - 4.0 0.2
Transport, Storage & Comm. 11 911.6 11 886.5 2 918.3 - 25.1 32.5 - 0.2
Tourism 31 392.8 26 335.4 239.3 -5 057.4 0.8 - 16.1
Distribution 30 477.3 40 054.7 2 576.2 9 577.4 9.2 31.4
Professional & Other Services 17 098.8 17 793.5 - 228.2 695.4 - 1.3 4.1
Electricity, Gas & Water 5 733.5 8 827.0 1 142.6 3 093.4 24.9 54.0
Entertainment 513.9 1 132.5 65.5 618.6 14.6 >100
Personal & Other Lending 109 628.9 133 842.6 14 988.7 24 213.7 15.8 22.1
Personal 102 192.8 127 342.8 14 311.1 25 150.0 16.3 24.6
Overseas Residents 7 436.1 6 499.9 677.6 - 936.2 10.0 - 12.6
COMMERCIAL BANK DISTRIBUTION OFTOTAL LOANS & ADVANCES TO THE PRIVATE SECTOR (J$MN)
For Year ended 31 December
2011 2012Total Private Sector Credit 20 727.5 38 747.5
% Change 9.5 16.2
Loans and Advances (excluding overseas residents) 20 593.7 37 980.3
Corporate Securities 134.5 767.2
PRIVATE SECTOR CREDITYear ended 31 December
(Flow J$MN)
Stock Stock Flows Flows % %
2011 2012 2011 2011 2011 2012
Private Sector 241 528.8 279 881.8 21 270.6 38 353.1 9.7 15.9
Business Lending 131 899.9 146 039.2 6 281.9 14 139.3 5.0 10.7
Agriculture & Fishing 5 366.1 6 138.2 846.6 772.1 18.7 14.4
Mining & Quarrying 556.3 693.0 129.9 136.7 30.5 24.6
Manufacturing 7 771.3 12 063.1 - 524.8 4 291.8 - 6.3 55.2
Construction & Land Dev. 21 079.0 21 115.4 - 883.5 36.4 - 4.0 0.2
Transport, Storage & Comm. 11 911.6 11 886.5 2 918.3 - 25.1 32.5 - 0.2
Tourism 31 392.8 26 335.4 239.3 -5 057.4 0.8 - 16.1
Distribution 30 477.3 40 054.7 2 576.2 9 577.4 9.2 31.4
Professional & Other Services 17 098.8 17 793.5 - 228.2 695.4 - 1.3 4.1
Electricity, Gas & Water 5 733.5 8 827.0 1 142.6 3 093.4 24.9 54.0
Entertainment 513.9 1 132.5 65.5 618.6 14.6 >100
Personal & Other Lending 109 628.9 133 842.6 14 988.7 24 213.7 15.8 22.1
Personal 102 192.8 127 342.8 14 311.1 25 150.0 16.3 24.6
Overseas Residents 7 436.1 6 499.9 677.6 - 936.2 10.0 - 12.6
COMMERCIAL BANK DISTRIBUTION OFTOTAL LOANS & ADVANCES TO THE PRIVATE SECTOR (J$MN)
For Year Ended 31 December

- 32 -The Economy & Monetary Policy Review
Bank of Jamaica
refinancing and the provision of working
capital. Growth in Manufacturing reflected
new local currency loans for the sugar industry,
building materials and other manufacturers.
New loans to Electricity, Gas & Water were
related primarily to power generation.
In contrast, there was net repayment in Tourism
and Transport, Storage & Communication. The
contraction in lending to Tourism occurred
during the first three quarters of the year and
was consistent with the slower rate of growth
in the sector as well as the acceleration in the
depreciation of the Jamaica Dollar during the
year.
Growth in Personal & Other lending
accelerated to 22.1 per cent in 2012, relative
to an increase of 15.8 per cent in 2011 and
represented the largest expansion since 2008.
Within personal lending, growth in instalment
credit accelerated to $14.5 billion or 40.0 per
cent for 2012 from $6.8 billion or 23.1 per cent.
This was primarily reflected in loans for debt
consolidation and motor car purchases, which
increased by $4.9 billion or 51.7 per cent and
$4.0 billion or 34.2 per cent, respectively. In
2011, there were respective increases of 10.2
per cent and 67.4 per cent in loans for debt
consolidation and motor car purchases. The
expansion in new loans for debt consolidation
for 2012 was associated with accelerated growth
of 15.2 per cent in commercial banks’ credit
card receivables from 4.8 per cent in 2011.
Consumer spending on motor car purchases
remained buoyant, following the reduction
of import duties and the relaxation of some
restrictions in 2011.
Foreign currency loans to the private sector
declined by 9.6 per cent during the year,
following a marginal expansion in 2011 (see
Table 12). This decline was mainly reflected in
Tourism, Construction & Land Development and
Professional & Other Services. Additionally,
there was a marked contraction in the stock
of foreign currency denominated loans to
Overseas Residents. The net repayments in
foreign currency loans to Overseas Residents
occurred primarily during the last quarter of the
year and may have been partially influenced by
the faster pace of depreciation in the Jamaica
Dollar vis-à-vis the US Dollar.
2.6.4. Non-performing loans
Commercial banks’ loan quality reflected an
improvement at end-2012, relative to end-
2011, notwithstanding a marginal deterioration
during the last quarter of 2012 (see Chart 11). In
this regard, the ratio of non-performing loans to
total loans declined to 6.8 per cent at end-2012
from 8.8 per cent at end-2011.4 Similarly, as
a proportion of total private sector loans, non-
performing loans declined to 7.5 per cent at end-
2012 from 9.6 per cent at end-2011. The major
sectors contributing to the improvement in the
quality of private sector loans were Construction
& Land Development, Professional & Other
Services and Entertainment. In addition, the
4 Non-performing loans refers to loans more than 3
months overdue.

- 33 -
Annual Report 2012
The Economy & Monetary Policy Review
Chart 11 Commercial Banks’ Non-Performing Loans 2008 - 2012
quality of personal loans improved marginally
during the calendar year. Of note, there was an
increase in net loan write-offs by commercial
banks for the year. In particular, net loan write-
offs amounted to $3.2 billion in 2012, relative
to $2.3 billion in 2011 and represented 1.2 per
cent and 1.0 per cent, respectively, of average
outstanding private sector loans.
2.6.5. Interest Rates
For 2012, there was an increase in the weighted
average interest rate on commercial banks’
local currency denominated loans. In contrast,
there was a decline in the weighted average
interest rate on foreign currency denominated
loans.
2.6.5.1. Rate on Domestic Currency Loans
The overall weighted average lending rate on
local currency denominated loans increased
by 41 basis points (bps) to 18.44 per cent at
end-2012, in contrast to a decline of 240 bps
in 2011(see Table 14A). The movement in the
rate during 2012 reflected an increase of 33
bps in the weighted average lending rate to
the Private Sector, partially offset by a decline
of 4 bps in the rate to the Public Sector. In
particular, the change in the rate to the Private
Sector reflected an increase of 355 bps in the
average interest rate on personal loans and
could have been associated with increased
demand for loans. This was in contrast to the
previous year, when weighted average interest
rates for all categories of private sector loans
declined.
For the review year, the overall interest rate
spread on local currency denominated loans
increased by 76 bps to 16.34 per cent. This
increase was in contrast to a decline of 190 bps
in 2011 (see Table 14B). The increase in the
overall interest rate spread in 2012 occurred

- 34 -The Economy & Monetary Policy Review
Bank of Jamaica
Table 14A
Table 14B
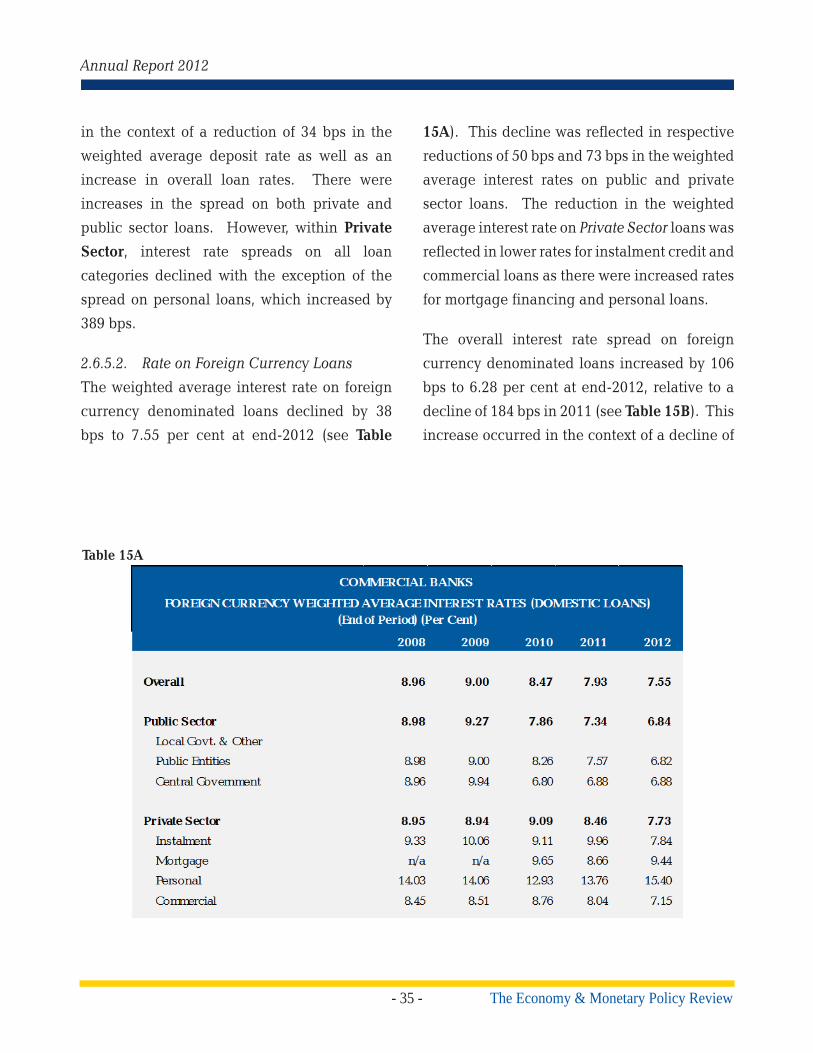
- 35 -
Annual Report 2012
The Economy & Monetary Policy Review
in the context of a reduction of 34 bps in the
weighted average deposit rate as well as an
increase in overall loan rates. There were
increases in the spread on both private and
public sector loans. However, within Private
Sector, interest rate spreads on all loan
categories declined with the exception of the
spread on personal loans, which increased by
389 bps.
2.6.5.2. Rate on Foreign Currency Loans
The weighted average interest rate on foreign
currency denominated loans declined by 38
bps to 7.55 per cent at end-2012 (see Table
15A). This decline was reflected in respective
reductions of 50 bps and 73 bps in the weighted
average interest rates on public and private
sector loans. The reduction in the weighted
average interest rate on Private Sector loans was
reflected in lower rates for instalment credit and
commercial loans as there were increased rates
for mortgage financing and personal loans.
The overall interest rate spread on foreign
currency denominated loans increased by 106
bps to 6.28 per cent at end-2012, relative to a
decline of 184 bps in 2011 (see Table 15B). This
increase occurred in the context of a decline of
Table 15A
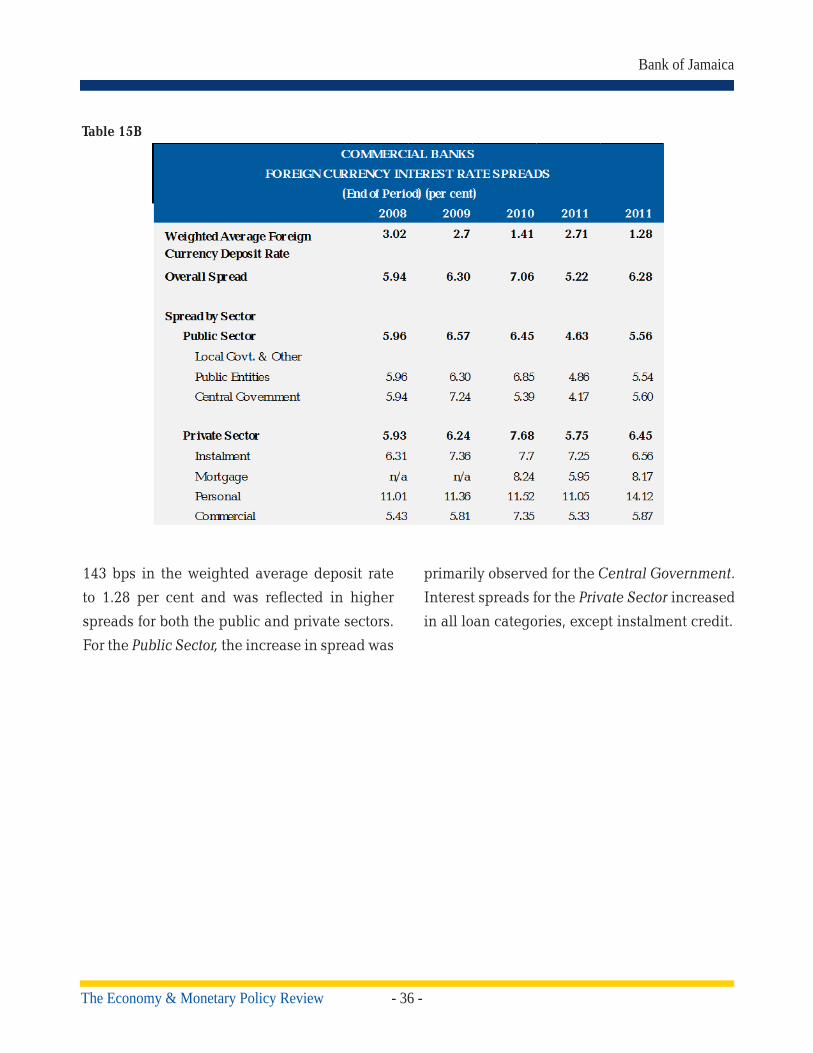
- 36 -The Economy & Monetary Policy Review
Bank of Jamaica
143 bps in the weighted average deposit rate
to 1.28 per cent and was reflected in higher
spreads for both the public and private sectors.
For the Public Sector, the increase in spread was
primarily observed for the Central Government.
Interest spreads for the Private Sector increased
in all loan categories, except instalment credit.
Table 15B
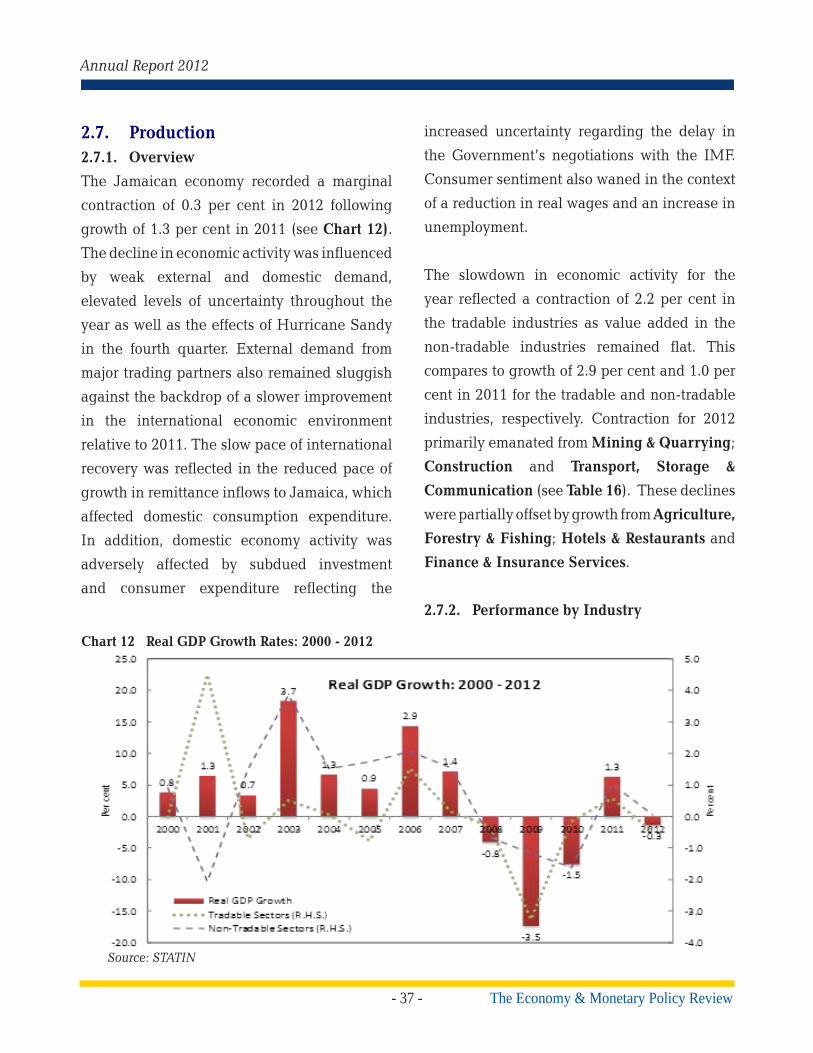
- 37 -
Annual Report 2012
The Economy & Monetary Policy Review
2.7. Production2.7.1. Overview
The Jamaican economy recorded a marginal
contraction of 0.3 per cent in 2012 following
growth of 1.3 per cent in 2011 (see Chart 12).
The decline in economic activity was influenced
by weak external and domestic demand,
elevated levels of uncertainty throughout the
year as well as the effects of Hurricane Sandy
in the fourth quarter. External demand from
major trading partners also remained sluggish
against the backdrop of a slower improvement
in the international economic environment
relative to 2011. The slow pace of international
recovery was reflected in the reduced pace of
growth in remittance inflows to Jamaica, which
affected domestic consumption expenditure.
In addition, domestic economy activity was
adversely affected by subdued investment
and consumer expenditure reflecting the
increased uncertainty regarding the delay in
the Government’s negotiations with the IMF.
Consumer sentiment also waned in the context
of a reduction in real wages and an increase in
unemployment.
The slowdown in economic activity for the
year reflected a contraction of 2.2 per cent in
the tradable industries as value added in the
non-tradable industries remained flat. This
compares to growth of 2.9 per cent and 1.0 per
cent in 2011 for the tradable and non-tradable
industries, respectively. Contraction for 2012
primarily emanated from Mining & Quarrying;
Construction and Transport, Storage &
Communication (see Table 16). These declines
were partially offset by growth from Agriculture,
Forestry & Fishing; Hotels & Restaurants and
Finance & Insurance Services.
2.7.2. Performance by Industry
Chart 12 Real GDP Growth Rates: 2000 - 2012
Source: STATIN

- 38 -The Economy & Monetary Policy Review
Bank of Jamaica
INDUSTRIAL CONTRIBUTION TO GDP GROWTH (%)
Industries 2011 2012
Growth (%)
Contribution Growth (%)
Contribution
1. GOODS 5.0 117.0 -1.2 111.7
Agriculture, Forestry & Fishing 9.8 41.1 3.1 -59.5
Mining & Quarrying 19.4 64.3 -9.1 138.7
Manufacture 1.8 12.6 -0.2 9.0
Construction 0.8 5.4 -3.5 105.8
2. SERVICES -0.1 -5.6 0.0 13.8
Electricity & Water 1.6 4.1 -0.3 4.4
Wholesale & Retail Trade, Repairs & Installation 0.5 7.8 0.4 -27.6
Hotels & Restaurants 2.0 7.4 1.4 -24.0
Transport, Storage & Communication -1.9 -17.3 -1.9 79.3
Financing & Insurance Services -0.5 -3.9 0.9 -35.3
Real Estates, Renting & Business Activities -0.4 -3.6 -0.3 10.0
Producers of Government Services 0.1 1.1 -0.4 19.5
Other Services -0.5 -2.6 0.2 -4.1
3. FINANCIAL INTERMEDIATION SERVICES INDIRECTLY MEASURED
-3.1 -11.4 -1.5 25.5
TOTAL VALUE ADDED 1.3 100.0 -0.3 100.0
Table 16
Real value added for Mining & Quarrying
contracted by 9.1 per cent in 2012 following
growth of 19.4 per cent in 2011. The performance
of the industry was affected by a slower pace
of growth in the global demand for aluminium
as well as a decline in capacity utilization.
Lower capacity utilization in the industry was
attributed to a disruption in production due
to electrical and mechanical difficulties and
the loss of working hours associated with the
passage of Hurricane Sandy. Consequently,
the capacity utilization rate in the bauxite and
alumina industries deteriorated to 91.2 per cent
and 38.3 per cent, respectively, from 99.3 per
cent and 42.8 per cent in 2011. In this context,
total bauxite and alumina production in 2012
declined by 8.8 per cent and 10.3 per cent,
respectively.
Electricity & Water Supply contracted by 0.3
per cent, following a 1.6 per cent expansion in
the previous year. The decline for the year partly
reflected the impact of Hurricane Sandy on the
distribution infrastructure of both the power
and water companies. In addition, a national
effort to conserve on the usage as well as low
economic output curbed electricity generation
during the year. In this regard, electricity
generation and water production contracted

- 39 -
Annual Report 2012
The Economy & Monetary Policy Review
by 0.2 per cent and 0.9 per cent, respectively,
relative to expansions of 0.4 per cent and 6.7
per cent in 2011.
There was a contraction of 3.8 per cent in
Construction for 2012, in contrast to growth of
0.8 per cent in 2011. The decline in the industry
reflected reductions in public and private
sector projects. In particular, the Norman
Manley International Airport Expansion and
the Washington Boulevard Corridor Widening
projects were completed in 2011 while there
was reduced expenditure on the Jamaica
Development Infrastructure Programme in
2012. However, the industry benefitted from
work on the Palisadoes Shoreline and Road
Rehabilitation Works in the second half of the
year. With respect to residential activities,
data from the National Housing Trust (NHT)
indicated a decline of 30.1 per cent in housing
starts compared to an increase of 36.0 per cent
in 2011. This decline was supported by the
contraction in the total value of mortgages
disbursed by the NHT relative to 2011.
However, there was growth of 40.0 per cent
in housing completions following an increase
of 55.3 per cent in 2011. Two indicators of
construction activity, cement sales and the
importation of construction materials, declined
by 3.0 per cent and 10.0 per cent, respectively,
relative to contractions of 2.5 per cent and 2.4
per cent in 2011.
In the context of reduced domestic and
international demand for Jamaican
manufactured products, Manufacture recorded
a contraction of 0.7 per cent in 2012, compared
to an expansion of 1.8 per cent in 2011. The
performance for the year reflected declines of
1.9 per cent and 1.5 per cent in the June and
December quarters as there was marginal
growth for the other quarters. The decline in
the June quarter was attributed to a contraction
in sugar output due to adverse weather
conditions, the closure of the Petrojam Refinery
for maintenance and the absence of ethanol
production relative to the similar period in
2011.
The out-turn for the review year mainly reflected
a contraction in Other Manufacturing, the
impact of which was partially offset by marginal
growth in Food, Beverages & Tobacco. Within
Other Manufacturing there were reductions in
Refined Petroleum Products and Non-Metallic
Mineral Products. The contraction in Non-
Metallic Mineral Products mainly reflected
reduced demand for cement associated with the
downturn in building construction activities.
The decline in the Refined Petroleum Products
reflected lower levels of production for all
commodities with the exception of automotive
diesel oil. The impact of the declines within
these sub-industries were partially countered
by an expansion in Chemical Products, mainly
in ethanol production, particularly in the second
half of the year. Greater output of ethanol
stemmed from the acquisition of processing
contracts from overseas to fulfil higher demand
for dehydration capacity.

- 40 -The Economy & Monetary Policy Review
Bank of Jamaica
2.7.3. Increased production in Food, Beverages
& Tobacco primarily reflected higher
output of non-alcoholic and alcoholic
beverages as well as food excluding
sugar (see Table 17). The growth in
food excluding sugar reflected greater
production of animal feeds and edible
oils. Expansion in production of alcoholic
beverages represented recovery
following low production in 2011 due
to environmental concerns. The growth
in non-alcoholic beverages reflected
increased production of carbonated
beverages. However, the impact of
the expansion in these categories was
partially offset by a decline in sugar
output due to a reduction in the sucrose
content of the sugarcane crop.
Transport, Storage & Communication declined
by 1.6 per cent in 2012 continuing the trend
observed since 2008. The contraction in the
Source: Planning Institute of Jamaica
Table 17
SELECTED MANUFACTURING ITEMS Item 2011 2012 % Change
Production (‘000 kgs)
Poultry Meat 101 165 101 509 0.3
Sugar 143 195 136 645 -4.6
Molasses 63 664 58 870 -7.5
Edible Oil 21 266 21 102 -0.8
Non-Metallic Minerals 766 274 760 316 -0.8
Animal Feeds 402 201 408 139 1.5
Production (‘000 litres)
Non-Alcoholic Beverages 161 490 166 848 3.3
Petroleum Products 1 362 787 1 286 845 -5.6
Alcoholic Beverages 77 710 85 199 9.6
industry’s value-added reflected a decline
in Transport as there was expansion in
Communication. The fall in Transport was
influenced by the slowdown in world trade
which resulted in lower activities at the Island’s
sea ports. This was reflected in a decrease of
9.2 per cent in total domestic cargo movements,
the impact of which was partially offset by
growth of 17.4 per cent in cruise passenger
arrivals. In addition, reduced mining activity
resulted in a fall in rail services. The expansion
in Communication was attributed to growth
in telecommunications activities due to the
increase in the average revenue per user of
mobile customers associated with the reduction
in call rates.
Agriculture, Forestry & Fishing expanded by
2.6 per cent, a marked deceleration relative
to growth of 9.8 per cent in 2011. Growth in
the industry for the review period reflected
expansion in domestic agriculture in all quarters,

- 41 -
Annual Report 2012
The Economy & Monetary Policy Review
with the exception of December, and a decline
in traditional export crops. The performance of
domestic crop production continued to reflect
the impact of various support programmes and
projects to enhance productivity and improve
the industry’s resilience to unfavourable
weather conditions. Notwithstanding these
programmes, there was a deceleration in the
rate of growth in domestic crop production to
3.0 per cent from 18.3 per cent in 2011 (see
Table 18). The slower growth in domestic crop
production was attributed to the passage of
Hurricane Sandy as well as drought conditions
during most months of the year. Given the above,
productivity as measured by output per hectare
was largely unchanged relative to 2011 (see
Chart 13). The growth in domestic agriculture
was observed in all categories of domestic crop
production, with the exception of Other Tubers.
In particular, notable expansions in production
were observed for fruits and yams.
The contraction of 3.1 per cent in Export
Agriculture predominantly reflected lower
production of citrus, sugar and coffee as there
was increased output of cocoa and pimento (see
Table 19). The reduction in coffee exports was
associated with the adverse impact of the berry
bora and leaf rust diseases as well as a fall in
demand from Japan relative to 2011. Citrus
production continued to be adversely affected
by the long-lasting impact of the greening
disease. Cocoa production exanded as a result
of the Government’s initiative to resuscitate the
industry.
An expansion of 1.8 per cent was recorded for
Hotels & Restaurants relative to the increase of
2.0 per cent in 2011. The industry’s performance
reflected growth in Hotels. The growth in Hotels
reflected the impact of the resumption of flights
from Dallas and Fort Lauderdale for the summer
months as well as new airlifts from Cincinnati,
Source: Planning Institute of Jamaica
Table 18

- 42 -The Economy & Monetary Policy Review
Bank of Jamaica
Sources: Sugar Corporation of Jamaica; and BOJ estimates
Table 19
Chart 13
Nashville and Toronto. Further, the expansion
in Hotels was aided by increased visitor arrivals
associated with the Wholesale Tour Operators
and Jamaica Product Exchange conferences.
However, the impact of these factors was
partly offset by the effect of lower airlifts due
to warmer winter conditions in the main source
markets and travel disruptions associated with
the passage of Hurricane Sandy in the March
and December quarters, respectively. The
expansion in Hotels was reflected in growth of
1.8 per cent and 1.9 per cent in total stopover
arrivals and visitor expenditure, respectively,
relative to increases of 1.6 per cent and 8.7
per cent in the prior year. In addition, cruise
passenger arrivals expanded by 17.4 per cent
in 2012, following an increase of 23.8 per cent
in 2011.
Financing & Insurance Services recorded an
expansion of 0.7 per cent in the review year,
in contrast to the average decline of 2.4 per
Crop 2011 2012 Change
Sugar 143.2 136.7 - 4.6
Citrus 8.3 6.0 - 28.1
Cocoa 0.6 0.9 50.2
Coffee 0.9 0.8 - 12.5
Pimento 0.4 0.4 12.8
Sugar cane 1 564.3 1 557.6 - 0.4
SELECTED AGRICULTURAL EXPORTS(‘000 tonnes)
Production (000’ tonnes)
12.0
12.2
12.4
12.6
12.8
13.0
13.2
13.4
13.6
13.8
14.0
2000 2001 2002 2003 2004 2005 2006 2007 2008 2009 2010 2011 2012
Perc
ent
Output per Hectares: 2000 - 2012
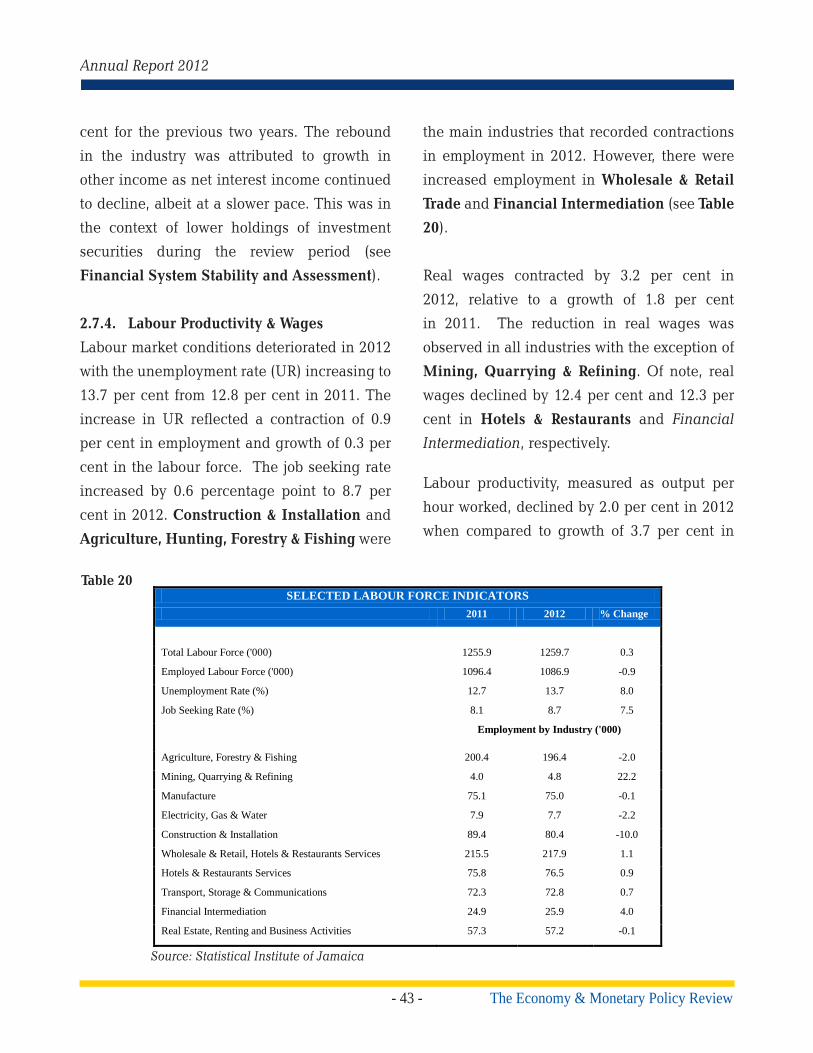
- 43 -
Annual Report 2012
The Economy & Monetary Policy Review
cent for the previous two years. The rebound
in the industry was attributed to growth in
other income as net interest income continued
to decline, albeit at a slower pace. This was in
the context of lower holdings of investment
securities during the review period (see
Financial System Stability and Assessment).
2.7.4. Labour Productivity & Wages
Labour market conditions deteriorated in 2012
with the unemployment rate (UR) increasing to
13.7 per cent from 12.8 per cent in 2011. The
increase in UR reflected a contraction of 0.9
per cent in employment and growth of 0.3 per
cent in the labour force. The job seeking rate
increased by 0.6 percentage point to 8.7 per
cent in 2012. Construction & Installation and
Agriculture, Hunting, Forestry & Fishing were
the main industries that recorded contractions
in employment in 2012. However, there were
increased employment in Wholesale & Retail
Trade and Financial Intermediation (see Table
20).
Real wages contracted by 3.2 per cent in
2012, relative to a growth of 1.8 per cent
in 2011. The reduction in real wages was
observed in all industries with the exception of
Mining, Quarrying & Refining. Of note, real
wages declined by 12.4 per cent and 12.3 per
cent in Hotels & Restaurants and Financial
Intermediation, respectively.
Labour productivity, measured as output per
hour worked, declined by 2.0 per cent in 2012
when compared to growth of 3.7 per cent in
SELECTED LABOUR FORCE INDICATORS 2011 2012 % Change
Total Labour Force ('000) 1255.9 1259.7 0.3
Employed Labour Force ('000) 1096.4 1086.9 -0.9
Unemployment Rate (%) 12.7 13.7 8.0
Job Seeking Rate (%) 8.1 8.7 7.5
Employment by Industry ('000)
Agriculture, Forestry & Fishing 200.4 196.4 -2.0
Mining, Quarrying & Refining 4.0 4.8 22.2
Manufacture 75.1 75.0 -0.1
Electricity, Gas & Water 7.9 7.7 -2.2
Construction & Installation 89.4 80.4 -10.0
Wholesale & Retail, Hotels & Restaurants Services 215.5 217.9 1.1
Hotels & Restaurants Services 75.8 76.5 0.9
Transport, Storage & Communications 72.3 72.8 0.7
Financial Intermediation 24.9 25.9 4.0
Real Estate, Renting and Business Activities 57.3 57.2 -0.1
Source: Statistical Institute of Jamaica
Table 20
- 44 -The Economy & Monetary Policy Review
Bank of Jamaica
the prior year. In contrast, output per worker,
another measure of productivity, improved
by 0.5 per cent in 2012. The improvement in
output per worker was primarily concentrated
in Agriculture, Forestry & Fishing, Electricity,
Gas & Water and Construction & Installation.
Given the above, there were no inflationary
pressures emanating from the labour market
in 2012, as the movement in real wages was
below productivity gains, measured as output
per hour worked.
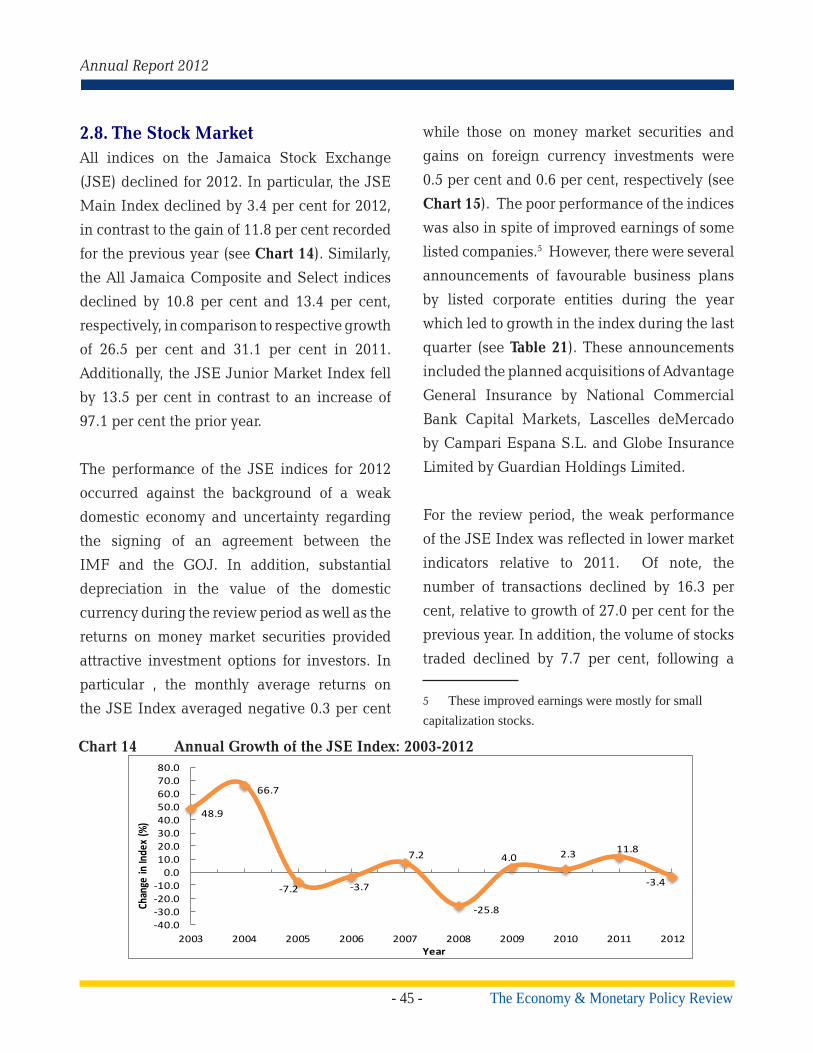
- 45 -
Annual Report 2012
The Economy & Monetary Policy Review
2.8. The Stock MarketAll indices on the Jamaica Stock Exchange
(JSE) declined for 2012. In particular, the JSE
Main Index declined by 3.4 per cent for 2012,
in contrast to the gain of 11.8 per cent recorded
for the previous year (see Chart 14). Similarly,
the All Jamaica Composite and Select indices
declined by 10.8 per cent and 13.4 per cent,
respectively, in comparison to respective growth
of 26.5 per cent and 31.1 per cent in 2011.
Additionally, the JSE Junior Market Index fell
by 13.5 per cent in contrast to an increase of
97.1 per cent the prior year.
The performance of the JSE indices for 2012
occurred against the background of a weak
domestic economy and uncertainty regarding
the signing of an agreement between the
IMF and the GOJ. In addition, substantial
depreciation in the value of the domestic
currency during the review period as well as the
returns on money market securities provided
attractive investment options for investors. In
particular , the monthly average returns on
the JSE Index averaged negative 0.3 per cent
while those on money market securities and
gains on foreign currency investments were
0.5 per cent and 0.6 per cent, respectively (see
Chart 15). The poor performance of the indices
was also in spite of improved earnings of some
listed companies.5 However, there were several
announcements of favourable business plans
by listed corporate entities during the year
which led to growth in the index during the last
quarter (see Table 21). These announcements
included the planned acquisitions of Advantage
General Insurance by National Commercial
Bank Capital Markets, Lascelles deMercado
by Campari Espana S.L. and Globe Insurance
Limited by Guardian Holdings Limited.
For the review period, the weak performance
of the JSE Index was reflected in lower market
indicators relative to 2011. Of note, the
number of transactions declined by 16.3 per
cent, relative to growth of 27.0 per cent for the
previous year. In addition, the volume of stocks
traded declined by 7.7 per cent, following a
5 These improved earnings were mostly for small capitalization stocks.
48.9
66.7
-7.2 -3.7
7.2
-25.8
4.0 2.3 11.8
-3.4
-40.0-30.0-20.0-10.0
0.010.020.030.040.050.060.070.080.0
2003 2004 2005 2006 2007 2008 2009 2010 2011 2012
Chan
ge in
Inde
x (%
)
Year
Chart 14 Annual Growth of the JSE Index: 2003-2012

- 46 -The Economy & Monetary Policy Review
Bank of Jamaica
Chart 15 Average Monthly Returns from Equities, Fixed Income Investments, & US Dollar
Positions: Comparative Indicators 2012
-2.0-1.5-1.0-0.50.00.51.01.52.02.5
Mar-12 Jun-12 Sep-12 Dec-12
Retu
rn (%
)
Equities 30-day Repo USD Position
significant fall of 41.3 per cent for the prior year
(see Table 22). However, the value of stocks
traded increased by 1.1 per cent, relative to
growth of 4.3 per cent in 2011.
The advance-to-decline ratio was 6:24, in
comparison to 28:7 for 2011, underscoring
the weak performance of the JSE Main Index
during the review period. Manufacturing
and Finance accounted for five of the top ten
declining stocks with average price declines of
18.3 per cent and 15.8 per cent, respectively. On
the other hand, Insurance accounted for two of
the top six advancing stocks and recorded an
average price appreciation of 34.5 per cent for
the year (see Table 23 ).
During 2012, the quarterly performances of
the Main JSE, All Jamaica Composite and
JSE Select indices deteriorated in comparison
Table 21
New Listing Other Developments
Mar-12 -a. Sagicor Life repurchased Breezes Runaway Bay and plans to rebrand the entity as the Jewel Runaway Bay Resort.
Jun-12a. C2W Music listed on the JSE Junior Stock Exchange.
a. NCB and NCBCAO approved the acquisition of 96.2 per cent of AGI by NCBCAP.
a. Lascelles de Mercado announced plans for sale of Globe Insurance to Guardian Holdings Limited. b. Italian firm Campari Espana S.L. announced its intentions to purchase all the shares in Lascelles de Mercado.
Dec-12
a. Kingston Live Entertainment (KLE) Group, Paramount Trading Jamaica and Consolidated Bakeries listed on the JSE Junior Stock Exchange.
a. Seprod announced a share buy-back of maximum 10 000 000 SEP shares
STOCK MARKET DEVELOPMENTS IN 2012
Sep-12

- 47 -
Annual Report 2012
The Economy & Monetary Policy Review
Table 24
Table 22
Values J$(MN) Volumes (MN) No. of Transactions
Mar-11 3 262.5 302.7 4 915Jun-11 3 203.4 371.8 5 295Sep-11 3 731.1 397.9 6 440Dec-11 7 904.1 477.7 6 643Total 18 101.1 1 550.1 23 293Mar-12 3 393.3 272.7 5 466Jun-12 7 101.5 439.0 5 686Sep-12 4 811.5 486.9 4 278Dec-12 2 983.7 232.6 4 062Total 18 295.1 1 431.3 19 492Annual Change % 2011 2012Values 50.7 1.1 Volumes 58.9 (7.7) No. of Transactions 14.4 (16.3)
TRADING ACTIVITIES OF THE MAIN JSE: 2011-2012
Table 23
Price( $)
(e.o.p)Price
Change (%)
Insurance
Guardian Holdings Limited 277.0 67.9
Sagicor Life Jamaica 10.1 1.1
Conglomerate
Lascelles de Mercado 390.0 33.3
Finance
Scotia Investments Jamaica 30.5 5.3
Manufacturing
Trinidad Cement 18.3 0.1
Other
Palace Amusement 60.0 20.0
TOP SIX ADVANCING STOCKS IN 2012
Price( $) (e.o.p)
Price Change (%)
ManufacturingCaribbean Cement Company 1.0 - 66.7
Salada Foods 15.5 - 31.2
RetailHardware & Lumber 3.4 - 42.4
Finance
Barita Investments Limited 2.8 - 41.4
Jamaica Money Market Brokers Limited 8.2 - 33.8
Mayberry Investments Limited 2.5 - 23.3
Tourism
Ciboney Group 0.0 - 40.0
Communications
Gleaner Company 1.4 - 36.4
Conglomerate
Jamaica Producers Group 17.8 - 25.9
OtherPulse Investments 1.0 - 59.2
TOP TEN DECLINING STOCKS IN 2012

- 48 -The Economy & Monetary Policy Review
Bank of Jamaica
to the previous year. Notably, the three major
JSE indices recorded average quarterly growth
within a range of negative 6.4 per cent to 3.0
per cent, relative to a range of 1.6 per cent to 8.0
per cent for 2011 (see Chart 16). Similarly, the
JSE Junior Market Index recorded an average
quarterly decline of 3.4 per cent in 2012, in
contrast to growth of 19.4 per cent recorded
in the previous year. Notwithstanding, there
were four new listings on the Junior Market
for 2012, which resulted in a marginal uptick
in the Junior market index for the last quarter.6
6 The four newly listed companies on the Junior Exchange in 2012 were C2W Music Limited, Kingston Live Entertainment (KLE) Group, Paramount Trading
Overall, the performance of the indices was
consistent with the general uncertainty in the
economy.
Limited and Consolidated Bakeries Limited.
Chart 16 Quarterly Growth of JSE Indices
-20.0
-10.0
0.0
10.0
20.0
30.0
40.0
-15.0
-5.0
5.0
15.0
25.0
35.0
45.0
Mar-11 Jun-11 Sep-11 Dec-11 Mar-12 Jun-12 Sep-12 Dec-12 Chan
ge o
n Ju
nior
Mar
ket
Inde
x (%
)
Chan
ge in
Indi
ces
(%)
Main JSE Index All Jamaica Composite JSE Select Junior Market

- 49 -
Annual Report 2012
The Economy & Monetary Policy Review
2.9. Public Finance
2.9.1. Overview
During April–December 2012, public sector
performance was constrained by uncertainty
which contributed to a contraction of economic
output, volatility in the foreign exchange
market and a reversal in the declining trend in
market-determined interest rates in the second
half of the year. The uncertainty was largely
related to the delayed agreement with the
IMF on a medium-term economic programme,
resulting in the postponement of loan and grant
flows from multilateral financial institutions.
The non-receipt of these flows had a negative
impact on project spending, particularly by
public bodies, leading to a build-up in surplus
balances.
Against this background, Central Government
revenues (excluding grants) grew by 4.7 per
cent over the nine-month period, relative to
growth of 6.1 per cent for the corresponding
period in 2011. As a consequence, expenditure
was curtailed as the Central Government
sought to meet its fiscal deficit and primary
surplus targets for FY2012/13. The government
also had difficulty extending the maturity
profile of the debt stock as well as increasing
the proportion of fixed rate (FR) issues, relative
to variable rate (VR) debt, consistent with its
debt strategy.
2.9.2. Central Government Performance
For April - December 2012, Central Government
operations resulted in a fiscal deficit of $47.2
billion or 3.5 per cent of GDP, relative to the
budgeted deficit of $45.4 billion or 3.4 per cent
of GDP (see Tables 25 & Table 26). However,
the outturn compared favourably with a fiscal
deficit of $56.4 billion or 4.3 per cent of GDP for
April-December 2011. The primary surplus for
April - December 2012 was 2.9 per cent of GDP,
$6.7 billion below target but above the primary
surplus for April - December 2011. The current
deficit of $27.0 billion or 2.0 per cent of GDP for
the review period exceeded the target by $4.9
billion. For April - December 2011, the current
deficit was $32.4 billion or 2.5 per cent of GDP
Revenue & Grants for April - December
2012 was $14.5 billion below the budget but
$9.1 billion above the level for the similar
period in 2011. The lower-than-budgeted
revenue for the review period was reflected
in all categories, with the largest deviation of
$11.6 billion or 4.9 per cent reflected in Tax
Revenue. However, in real terms tax revenue
grew by 1.1 per cent. Within Tax Revenue,
major shortfalls were recorded in International
Trade, Income & Profits and Production &
Consumption, reflected primarily in lower GCT,
SCT (imports), PAYE and ‘other companies’
receipts. The impact of these shortfalls was
partly offset by higher than budgeted SCT
(local) receipts. The underperformance of Tax
Revenue partly reflected the weak domestic
economic environment and the prevailing
uncertainty, which affected the effectiveness
of revenue measures implemented during

- 50 -The Economy & Monetary Policy Review
Bank of Jamaica
Table 25
Table 26
Table 32

- 51 -
Annual Report 2012
The Economy & Monetary Policy Review
SUMMARY OF REVENUE MEASURES J$BN Partially Widen GCT Base 4.2 Increase the threshold on electricity to 300kwh (for residential) and increase the GCT to the standard rate of 16.5 per cent 0.43 Imposition of tax on dividends payable to residents 0.30 Introduction of a minimum income tax 0.66 Change in SCT regime on overproof rum 0.75 Modify alcohol regime for tourism 0.53 Increase CET on selected (List C) goods 1.95 Modification of the GCT Regime for Tourism Sector 2.53 Increase Motor Vehicle License, Fitness, License Plates and Registration Fees 0.60 Increase tax rate on winnings - Betting Gaming, Horse Racing and Lottery 0.38 Changes to termination cost for telephone calls 5.25 Modify Asset Tax 1.95 Introduction of Specific SCT of $10.50 as per 0.7 gram of unprocessed tobacco product (bundled tobacco leaves) 0.38 Imposition of SCT on denatured ethanol 0.54 Curtail Discretionary Waivers 1.88
Revenue Gain 22.31 Reduction in Standard Rate of GCT from 17.5 % to 16.5 % -2.40
Amendment of the Corporate Income Tax (CIT) -0.45 Increase Annual General Personal Income Tax (PIT) threshold -0.10
Revenue Forgone -2.95
TOTAL NEW MEASURES 19.36
Table 27
the review period. On the other hand, the
improvement in Tax Revenue, relative to the
corresponding period of 2011, largely reflected
higher ‘other companies’ tax receipts, GCT,
customs duty and telephone call tax and was
partly associated with measures implemented
in 2012 (see Table 27). The shortfall in Grant
receipts for the review period largely reflected
the postponement in EU inflows, given the
delay in arriving at an agreement with the IMF.

- 52 -The Economy & Monetary Policy Review
Bank of Jamaica
The weak performance of GCT was reflected in
the C-Efficiency (GCT excluding arrears) ratio,
which was 42.4 per cent for April - December
2012 relative to the budgeted ratio of 44.0 per
cent. However, the ratio exceeded that for the
corresponding period 2011 by 2.9 percentage
points, indicating improvement in tax
administration efficiency. For April - December
2012, the C-Efficiency (GCT & SCT excluding
arrears) ratio was 60.7 per cent, 5.3 percentage
points above the corresponding period of 2011
but lower than the budgeted ratio of 63.1 per
cent (see Chart 17). 7
Expenditure for April - December 2012 was
$12.8 billion below budget but largely similar
to that of the corresponding period in 2011.
With the exception of wages & salaries, which
marginally exceeded budget, all areas of
expenditure were below budget for the review
period. The lower-than-budgeted Capital
7 The C-Efficiency ratio is the share of value-added
tax (VAT) revenue in consumption.
Expenditure primarily reflected project delays
and funding gaps, partly associated with
the postponement in grants and multilateral
funding. The variance in foreign interest
payments reflected a less than anticipated
depreciation of the Jamaica Dollar vis-à-vis
the US dollar and Euro as well as lower than
budgeted foreign loan receipts.
2.9.3. Financing
During April-December 2012, financing for
the deficit as well as debt amortization of
approximately $68.5 billion, was sourced
mainly from the domestic market. This
financing was, however, significantly below
expectations. Net amortization of external debt
for the review period included the maturity of
a €200.0 million bond in July 2012. Financing
for the review period was raised through the
issue of 17 benchmark investment instruments
(BMI) one of which was auctioned (see Table
28). Of the total instruments issued, 13 were at
variable interest rates (VR) while 4 were fixed
Chart 17
0.0
10.0
20.0
30.0
40.0
50.0
60.0
70.0
06/07 07/08 08/09 09/10 10/11 11/12 12/13
%
Year
C-Efficiency Ratios
C-Efficiency (GCT)
C-Efficiency(GCT/SCT)
Linear ( C-Efficiency(GCT))
Linear ( C-Efficiency(GCT/SCT))
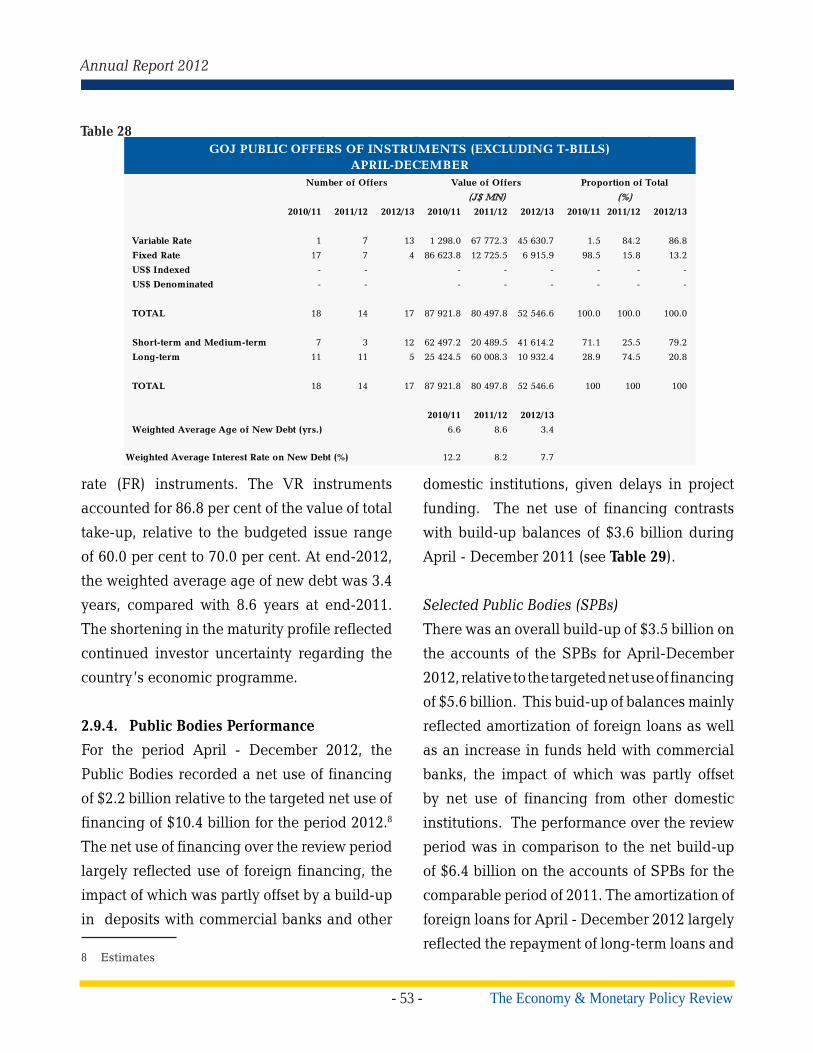
- 53 -
Annual Report 2012
The Economy & Monetary Policy Review
rate (FR) instruments. The VR instruments
accounted for 86.8 per cent of the value of total
take-up, relative to the budgeted issue range
of 60.0 per cent to 70.0 per cent. At end-2012,
the weighted average age of new debt was 3.4
years, compared with 8.6 years at end-2011.
The shortening in the maturity profile reflected
continued investor uncertainty regarding the
country’s economic programme.
2.9.4. Public Bodies Performance
For the period April - December 2012, the
Public Bodies recorded a net use of financing
of $2.2 billion relative to the targeted net use of
financing of $10.4 billion for the period 2012.8
The net use of financing over the review period
largely reflected use of foreign financing, the
impact of which was partly offset by a build-up
in deposits with commercial banks and other
8 Estimates
domestic institutions, given delays in project
funding. The net use of financing contrasts
with build-up balances of $3.6 billion during
April - December 2011 (see Table 29).
Selected Public Bodies (SPBs)
There was an overall build-up of $3.5 billion on
the accounts of the SPBs for April-December
2012, relative to the targeted net use of financing
of $5.6 billion. This buid-up of balances mainly
reflected amortization of foreign loans as well
as an increase in funds held with commercial
banks, the impact of which was partly offset
by net use of financing from other domestic
institutions. The performance over the review
period was in comparison to the net build-up
of $6.4 billion on the accounts of SPBs for the
comparable period of 2011. The amortization of
foreign loans for April - December 2012 largely
reflected the repayment of long-term loans and
Table 28
2010/11 2011/12 2012/13 2010/11 2011/12 2012/13 2010/11 2011/12 2012/13
Variable Rate 1 7 13 1 298.0 67 772.3 45 630.7 1.5 84.2 86.8
Fixed Rate 17 7 4 86 623.8 12 725.5 6 915.9 98.5 15.8 13.2
US$ Indexed - - - - - - - -
US$ Denominated - - - - - - - -
TOTAL 18 14 17 87 921.8 80 497.8 52 546.6 100.0 100.0 100.0
Short-term and Medium-term 7 3 12 62 497.2 20 489.5 41 614.2 71.1 25.5 79.2
Long-term 11 11 5 25 424.5 60 008.3 10 932.4 28.9 74.5 20.8
TOTAL 18 14 17 87 921.8 80 497.8 52 546.6 100 100 100
2010/11 2011/12 2012/13
6.6 8.6 3.4
12.2 8.2 7.7
Weighted Average Age of New Debt (yrs.)
Weighted Average Interest Rate on New Debt (%)
GOJ PUBLIC OFFERS OF INSTRUMENTS (EXCLUDING T-BILLS)APRIL-DECEMBER
Number of Offers Value of Offers Proportion of Total
(J$ MN) (%)

- 54 -The Economy & Monetary Policy Review
Bank of Jamaica
advances by Clarendon Alumina Partners and
Port Authority of Jamaica, the impact of which
was offset by the use of short-term financing by
Petrojam, as the entity had a greater utilization
of spot market purchases of petroleum products
than previously expected (see Table 30).
The variance in use of financing, relative to
budget, largely reflected delays in capital
projects by National Water Commission and
Port Authority, due to shortfalls in funding. In
addition, the build-up in NHT balances was in
a context where the expected allocation of funds
towards the Jamaica Emergency Employment
Programme (JEEP) did not materialize.
Other Public Bodies (OPBs)
The OPBs recorded a net use of financing of
$5.7 billion for April - December 2012, relative
to a target of $4.8 billion and $2.8 billion for
April - December 2011.9 The out-turn for the
review period reflected a net increase in foreign
financing related to the activities of PetroCaribe
9 Estimates
Table 29
Table 30
Q1 Q2 Q3 Q1 - Q3 Q1 - Q3 Variance
5 872.4 -3 338.4 -5 995.6 -3 461.6 5 612.1 -9 073.7
-0.1 - 8.6 8.2 - 0.4
-4 442.5 5 329.3 -3 783.9 -2 897.1
8 179.0 -5 455.2 663.0 3 386.9
2 136.0 -3 203.9 -2 883.0 -3 951.0
ANALYTIC PROFILE OF SELECTED PUBLIC BODIES FINANCING OUT-TURN (J$MN)
Supplementary Budget
Selected Public Bodies
Net use (+) /Net build-up ( -)
BOJ
Comm. Banks
Other Domestic
Foreign
FY 2012/13
Q1 Q2 Q3 Q1 - Q3 Q1 - Q3 Variance
-2 062.7 6 685.7 -2 424.6 2 198.4 10 383.4 -13 472.0
979.5 -1 288.3 600.9 292.0
-7 583.5 8 478.0 -8 829.9 -7 935.5
-1 285.5 -16 449.7 -11 270.1 -29 005.3
5 826.8 15 945.8 17 074.6 38 847.1
ANALYTIC PROFILE OF PUBLIC SECTOR FINANCING OUT-TURN (J$MN)
FY 2012/13Supplementary Budget
Public Bodies
BOJ
Comm. Banks
Other Domestic
Foreign

- 55 -
Annual Report 2012
The Economy & Monetary Policy Review
and the Road Maintenance Fund, the impact
of which was partly offset by a build-up in
balances held with commercial banks and other
domestic institutions.10 Increased deposits in
commercial banks primarily reflected a build-
up in the fixed deposit accounts of PetroCaribe.
Additionally, PetroCaribe, Jamaica Deposit
Insurance Corporation, Jamaica Civil Aviation
Authority and the Tourism Enhancement Fund
increased their deposits with other domestic
institutions during the review period (see Table
31).
2.9.5. Total Debt Stock
At end-2012, Jamaica’s total stock of debt stood
at $1 762.8 billion or 130.4 per cent of GDP,
representing growth of 6.0 per cent relative to
end-March 2012 (see Table 32). The increase
in the debt stock over the nine-month period
represented a faster rate of growth compared
to the similar period in 2011 when total debt
grew by 3.8 per cent. The expansion in the
total debt stock primarily reflected an increase
10 The draw-down from BOJ was mainly due to PetroCaribe
in domestic debt as growth in external debt
was negligible, given postponement of related
loans from multilateral financial institutions.
Hence, at end-2012, the stock of domestic and
external debt was 73.6 per cent and 56.8 per
cent of GDP, respectively.
Domestic Debt
The stock of domestic debt grew by 9.0 per cent
and 12.7 per cent, relative to end-March 2012
and end-2011, respectively. Although the new
debt raised was predominantly from variable
rate instruments, this portion of domestic debt
fell to 44.0 per cent at end- 2012 from 44.2
per cent at end-March 2012 but increased
marginally by 0.6 percentage point, relative
to end-2011. Concurrently, the duration of the
portfolio decreased to 1.55 years at end- 2012,
relative to 1.91 years at end-March 2012 and
1.87 years at end-2011.11 The foreign currency
portion of domestic debt increased to 18.7 per
11 Target as per Medium-Term Debt Management
Strategy for the period FY2012/13 – 2014/15 tabled in
Parliament on 24 May 2012.
Table 31
Q1 Q2 Q3 Q1 - Q3 Q1 - Q3 Variance
-7 935.1 10 024.0 3 571.0 5 659.9 4 771.3 888.6
979.6 -1 279.9 592.6 292.3
-3 141.0 3 148.7 -5 046.1 -5 038.4
-9 464.5 -10 994.5 -11 933.1 -32 392.2
3 690.8 19 149.7 19 957.6 42 798.1
ANALYTIC PROFILE OF OTHER PUBLIC BODIES FINANCING OUT-TURN (J$MN)
FY 2012/13Supplementary Budget
Foreign
Net use (+) /Net build-up ( -)
Other Public Bodies
BOJ
Comm. Banks
Other Domestic
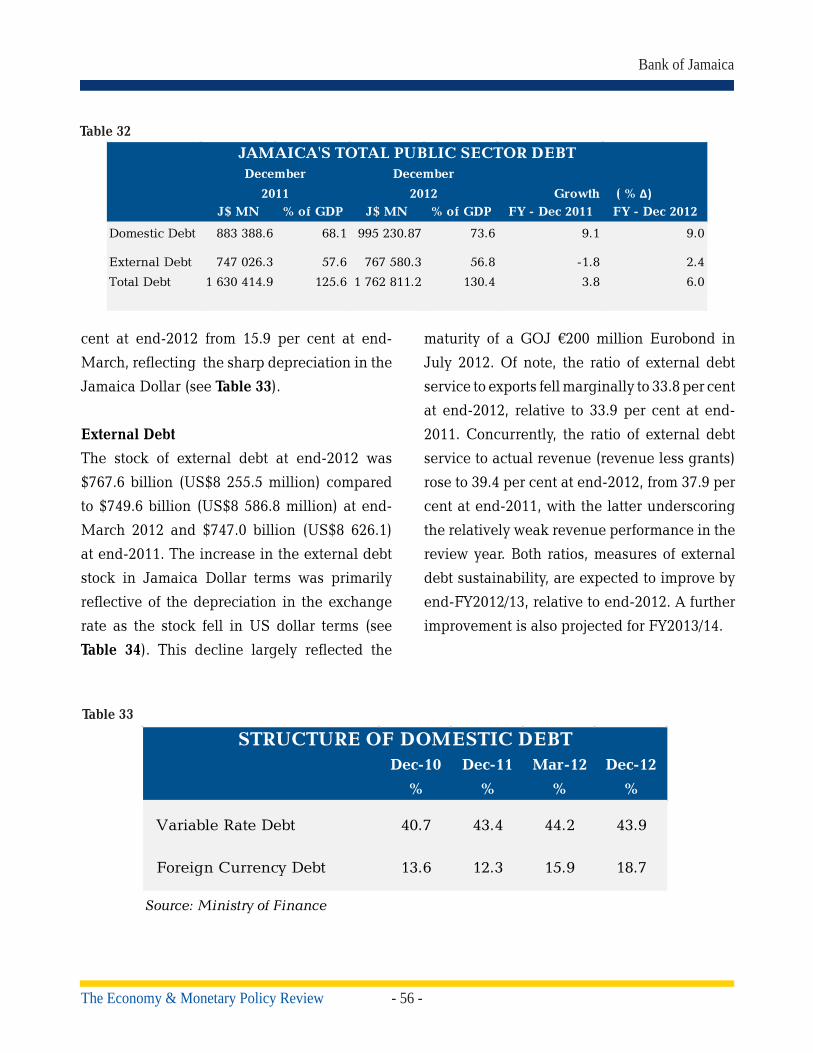
- 56 -The Economy & Monetary Policy Review
Bank of Jamaica
cent at end-2012 from 15.9 per cent at end-
March, reflecting the sharp depreciation in the
Jamaica Dollar (see Table 33).
External Debt
The stock of external debt at end-2012 was
$767.6 billion (US$8 255.5 million) compared
to $749.6 billion (US$8 586.8 million) at end-
March 2012 and $747.0 billion (US$8 626.1)
at end-2011. The increase in the external debt
stock in Jamaica Dollar terms was primarily
reflective of the depreciation in the exchange
rate as the stock fell in US dollar terms (see
Table 34). This decline largely reflected the
maturity of a GOJ €200 million Eurobond in
July 2012. Of note, the ratio of external debt
service to exports fell marginally to 33.8 per cent
at end-2012, relative to 33.9 per cent at end-
2011. Concurrently, the ratio of external debt
service to actual revenue (revenue less grants)
rose to 39.4 per cent at end-2012, from 37.9 per
cent at end-2011, with the latter underscoring
the relatively weak revenue performance in the
review year. Both ratios, measures of external
debt sustainability, are expected to improve by
end-FY2012/13, relative to end-2012. A further
improvement is also projected for FY2013/14.
Table 32
Table 33
J$ MN % of GDP J$ MN % of GDP FY - Dec 2011 FY - Dec 2012
Domestic Debt 883 388.6 68.1 995 230.87 73.6 9.1 9.0
External Debt
Total Debt 1 630 414.9 125.6 1 762 811.2 130.4 3.8 6.0
2.4
JAMAICA'S TOTAL PUBLIC SECTOR DEBTDecember December
Growth ( % Δ)2011 2012
747 026.3 57.6 767 580.3 56.8 -1.8
Dec-10 Dec-11 Mar-12 Dec-12
% % % %
Variable Rate Debt 40.7 43.4 44.2 43.9
Foreign Currency Debt 13.6 12.3 15.9 18.7
STRUCTURE OF DOMESTIC DEBT
Source: Ministry of Finance

- 57 -
Annual Report 2012
The Economy & Monetary Policy Review
Table 34
10-Dec 11-Dec 12-Mar 12-Dec
Central Government 6 287.1 6 376.6 6 334.9 5 985.8
Government Guaranteed 1 302.5 1 399.5 1 402.0 1 317.0
BOJ 800.0 850.0 850.0 850.0
Total 8 389.5 8 626.1 8 586.8 8 255.5
EXTERNAL DEBT BY BORROWER CATEGORYDecember 2010 - December 2012
(US$ MN)
Source: Ministry of Finance

- 58 -The Economy & Monetary Policy Review
Bank of Jamaica
2.10. Monetary Policy & Interest Rates
2.10.1. Overview
The BOJ maintained the interest rate on its 30-
day Certificate of Deposit (CD) and overnight
instrument at 6.25 per cent and 0.25 per cent,
respectively, throughout 2012 (see Chart 18).
Additionally, the domestic cash reserve and
liquid assets requirements were maintained at
12.0 per cent and 26.0 per cent, respectively.
This policy stance occurred despite the
emergence of heightened uncertainty among
the public and excess liquidity in the domestic
financial markets, particularly towards the
end of the year. The uncertainty was mainly
in regard to the timing and content of an
agreement with the IMF. This uncertainty
resulted in an accelerated pace of depreciation
in the exchange rate, relative to the previous
year. Despite this faster pace of depreciation,
the inflation trajectory remained generally
favourable and in line with the BOJ’s projection
for the year.
The increased instability in the foreign
exchange market towards the end of the
year further prompted the Bank to focus on
removing excess Jamaica Dollar liquidity. In
this regard, the Bank introduced three special
variable rate instruments which were offered to
Primary Dealers and commercial banks from
31 October to 05 November 2012. In addition,
the Bank continued to intervene in the foreign
exchange market to smooth supply and
demand conditions. The Bank also continued
its intermediation through the Public Sector
Entities (PSE) facility.
2.10.2. Developments and Challenges
At the start of 2012, there was an optimistic
outlook for inflation. This was in the context
of a relatively stable domestic macroeconomic
environment, despite concerns emanating
from the debt crisis in the Eurozone, the
persistent volatility of oil prices and uncertainty
surrounding the content of a new agreement
between the GOJ and the IMF. However,
6.0
7.0
8.0
9.0
10.0
11.0
Per C
ent
Interest rate on BOJ 30-day Certificate of Deposit
Chart 18
- 59 -
Annual Report 2012
The Economy & Monetary Policy Review
by June, there was expectation of an uptick
in inflation by the market, consequent on
revenue measures outlined in the fiscal budget.
The Bank’s assessment indicated that the
inflationary impact of these measures would be
temporary, given the underlying weak domestic
demand conditions. Against this background,
the Central Bank maintained its policy rate at
6.25 per cent.
During the second half of the year, there
were heightened concerns about the stability
of the macroeconomic environment and the
adequacy of the NIR, given the protracted
negotiations between the Government and the
IMF regarding an agreement on a medium-
term economic programme. These concerns
resulted in significant investor demand for
foreign currency assets which influenced an
acceleration in the pace of depreciation in
the exchange rate. The depreciation in the
exchange rate was facilitated by excess Jamaica
dollar liquidity in the system.
In this context, the Bank sold foreign currency
to reduce the volatility in the foreign exchange
market. The Bank also offered three special
variable rate CDs during the December quarter
with tenors of 49 days, 182 days and 364 days.
The 49-day CD had an offer limit of $6.0 billion,
while there were no offer limits on the other
instruments (see Calendar of Monetary Policy
Developments). Nominal subscriptions to these
instruments amounted to $8 179.0 million. The
30-day CD remained on offer at the rate which
obtained at end-December 2011.
2.10.3. Base Money Management
In the context of these developments, the
monetary base expanded by $5 938.3 million or
6.5 per cent for 2012, relative to an increase of
7.8 per cent for 2011 (see Table 35). Growth
in the monetary base for 2012 largely reflected
net currency issue of $2 037.5 million or 3.3
per cent. In addition, there were increases
of $2 986.2 million and $914.7 million in the
commercial banks’ cash reserve and current
account, respectively. The expansion in the
monetary base emanated from an increase of
$81 039.5 million in the net domestic assets
(NDA) as the NIR declined by $75 101.1 million
(US$840.5million). Within the NDA, there was
net unwinding of $51 224.3 million in BOJ
open market operation (OMO) instruments as
well as net drawdown of $30 389.0 million from
Central Government balances at the BOJ.
During the first quarter of the year, the
monetary base contracted by 8.7 per cent and
reflected the usual currency reflows which
follow the high seasonal demand for currency
in December. This contraction in the monetary
base was largely influenced by net placements
of $12 672.2 million on OMO instruments as
well as a decline of $16 885.4 million (US$189.0
million) in the NIR. The absorption of domestic
liquidity was partially offset by net drawdown
of $20 517.2 million in Central Government
deposits at the BOJ.
Base money expanded marginally by 0.8 per
cent for the June 2012 quarter in the context of

- 60 -The Economy & Monetary Policy Review
Bank of Jamaica
weak domestic demand conditions. The major
liquidity impulse emanated from net unwinding
of $33 223.3 million on OMO instruments. This
unwinding of OMO instruments facilitated the
market’s participation in the Government’s
debt-raising activities as well as financed the
purchase of foreign currency via the Bank’s
trading window. Against this background, there
was a decline of $21 150.0 million (US$236.7
million) in the NIR and net build-up of $14
161.4 million in Central Government balances
at the BOJ.
The monetary base expanded by 1.0 per cent
for the September 2012 quarter, influenced by
an increase of $26 107.7 million in the NDA.
Within the NDA, there was net drawdown in
Central Government balances at the BOJ as
Table 35
2011 2012Total Jan - Mar Apr - Jun Jul - Sep Oct - Dec Total
Net International Reserves (US$) - 205.3 - 189.0 - 236.7 - 282.6 - 132.2 - 840.5
NET INT'L RESERVES (J$) -18 343.6 -16 885.4 -21 150.0 -25 251.2 -11 814.5 75 101.1
Assets -14 184.3 -16 216.1 -22 677.0 -24 058.4 -12 069.8 75 021.3
Liabilities -4 159.2 - 669.2 1 527.0 -1 192.8 255.2 - 79.8
NET DOMESTIC ASSETS 24 960.7 8 871.9 21 790.7 26 107.7 24 269.1 81 039.5
Net Claims on Public Sector -4 833.7 22 304.4 -10 599.7 19 127.1 10 259.8 41 091.5
- Central Government Deposits -9 610.1 20 517.2 14 161.4 17 445.3 6 587.9 30 389.0
- Government Securities 4 522.0 - 297.6 - 103.7 - 753.2 776.8 - 377.6
- Other 254.4 2 084.8 3 665.3 2 435.0 2 895.0 11 080.2
Net Credit to Banks - 323.3 -1 021.0 - 655.0 - 514.4 - 55.7 -2 243.1
Open Market Operations 30 280.3 -12 672.2 33 223.3 7 587.4 23 085.7 51 224.3
Other - 162.7 260.7 - 177.9 - 92.4 -9 020.7 -9 030.3
MONETARY BASE 6 617.1 -8 013.4 640.7 856.5 12 454.6 5 938.3
- Currency Issue 5 936.0 -8 991.6 368.2 - 26.1 10 687.0 2 037.5
- Cash Reserve 1 109.3 1 024.7 333.1 683.5 944.9 2 986.2
- Current Account - 428.1 - 46.6 - 60.6 199.1 822.7 914.7
Memo:
NIR Stock (US$MN) e.o.p 1 966.1 1 777.1 1 540.4 1 257.8 1 125.6 1 125.6
Growth in Monetary Base (%) 7.8 - 8.7 0.8 1.0 14.6 6.5
Inflation (%) 6.0 1.7 1.5 2.1 2.3 8.0
SUMMARY ACCOUNTS OF THE BANK OF JAMAICAFLOWS - J$ MILLION
2012

- 61 -
Annual Report 2012
The Economy & Monetary Policy Review
well as net unwinding of OMO instruments,
which largely financed the market’s purchase
of foreign currency via the Bank’s intervention
window. The sale of foreign currency
contributed to a decline of US$282.6 million
in the NIR, which absorbed $25 251.2 million
from the system.
Excess domestic currency liquidity remained a
challenge for the Bank in the final quarter in the
context of net maturities of OMO instruments
totalling $23 085.7 million, the main source of
liquidity during the December quarter. While
some of the proceeds of the maturing OMO
securities facilitated increased demand for
foreign currency, a significant amount was
used to meet the seasonal increase in demand
for currency over the Christmas holiday
period. Against this background, there was an
injection of $24 269.1 million from the NDA
which was partially offset by a decline of $11
814.5 million (US$132.2 million) in the NIR
for the December quarter. The decline in the
NIR mainly reflected intervention sales in the
foreign exchange market and debt payments on
behalf of the Central Government. Accordingly,
the monetary base expanded by 14.6 per cent
for the quarter.
2.10.4. Interest Rates
The Bank maintained the interest rates on
its 30-day CDs and overnight instrument
at 6.25 per cent and 0.25 per cent,
respectively, throughout 2012. In contrast,
there were mixed movements in the
weighted average yields on GOJ Treasury
Bills for the year (see Table 36 and Chart
19). In particular, there was an overall
decline of 18 basis points (bps) to 6.31
per cent in the weighted average yield on
the GOJ 30-day instrument. On the other
hand, the weighted average yields on the
90-day and 180-day instruments increased
by 146 bps and 72 bps to 7.67 per cent and
7.18 per cent, respectively.
The movements in the market-determined
Treasury Bill yields reflected the uncertainty
in the domestic economy which primarily
stemmed from the Government’s delay in
arriving at an agreement with the IMF on
Jamaica’s medium-term macroeconomic
programme. This uncertainty led to
instability in the financial markets, which
was reflected in reduced private capital
inflows, continued decline in the NIR,
sustained depreciation of the exchange
rate, a general aversion to the Government’s
longer term bonds, investors displaying a
preference for money market instruments
at the very short end of the market and
high levels of Jamaica Dollar liquidity in
the system.

- 62 -The Economy & Monetary Policy Review
Bank of Jamaica
Table 36
Chart 19
30-day WATBY 90-day WATBY 180-day WATBY
January 6.41 6.22 6.53
February 6.36 6.21 6.57
March 6.24 6.27 6.47
April 6.2 6.19 6.44
May 6.25 6.30 6.39
June 6.18 6.26 6.47
July 6.15 6.21 6.52
August 6.19 6.28 6.63
September 6.16 6.36 6.57
October 6.21 6.38 6.69
November 6.81 6.44 6.90
December 6.31 7.67 7.18
WEIGHTED AVERAGE TREASURY YIELDS(per cent) 2012

- 63 -
Annual Report 2012
The Economy & Monetary Policy Review
2.11. Economic Outlook
2.11.1. Overview
Economic conditions in Jamaica are
anticipated to improve in 2013 in the context
of reduced uncertainties, following the signing
of an agreement with the IMF agreement and
continued global growth. In particular, the
economy is expected to record improved foreign
currency inflows which should contribute to the
gradual rebuilding of the NIR. In addition, the
economy is expected to record very moderate
growth, following an estimated contraction
in 2012. However, despite the overall
expected expansion in output, particularly
for the goods-producing sectors, domestic
demand conditions are anticipated to remain
weak, due to significant fiscal consolidation.
Notwithstanding the relatively weak demand
conditions, headline inflation for 2013 is
expected to exceed the inflation rate recorded
in 2012, in the context of higher import prices
and a relatively more depreciated domestic
currency.
2.11.2. International Economy
The global economy is projected to expand
in 2013 at a slightly moderated pace when
compared to the growth recorded in 2012.
In particular, it is expected that the USA will
continue to reflect moderate GDP growth
emanating from the implementation of policies
aimed at economic stimulation which have
already contributed to improved levels of
employment. However, growth in the USA
is expected to be tempered by efforts at fiscal
consolidation. China is expected to experience
an accelerated pace of growth during 2013,
stemming from increased foreign and domestic
investments. However, growth in the Euro Area
is projected to continue to decline as a result
of austerity measures introduced to address the
fiscal crisis. Japan is expected to experience
lower growth in 2013 as a result of reduced
trade with China, a major trading partner, as
well as a weakening in exports to the European
market. In this context, the Bank is projecting
global expansion of 2.7 per cent in 2013, relative
to the 2.8 per cent in 2012.
Crude oil prices, as measured by the West
Texas Intermediate (WTI) Index, are forecast
to increase in the range of 0.0 per cent to 1.0
per cent, relative to the decline of 1.0 per cent
in 2012. This projection reflects an expected
expansion in demand from both China and the
USA. The prices of food-related raw materials
are projected to increase within the range
of 2.5 per cent to 3.5 per cent in 2013, albeit
moderating from the 5.4 per cent and 20.1 per
cent recorded in 2012 and 2011, respectively.
This forecast incorporates expected increases of
5.0 per cent and 2.5 per cent for wheat and corn
prices, respectively, reflecting supply shortages
resulting from adverse weather conditions.
However, price declines of 12.0 per cent and
0.7 per cent are anticipated for soybean and
the benchmark Thai rice, respectively. The fall
in soybean prices should reflect normalization
from historical highs as the lagged effects of

- 64 -The Economy & Monetary Policy Review
Bank of Jamaica
severe drought conditions in the USA during
2012 gradually dissipate.
2.11.3. Domestic Economy
2.11.3.1. Growth
The Jamaican economy is expected to expand
in the range of 0.5 per cent to 1.5 per cent for
2013, in contrast to the contraction for 2012.
All industries, with the exception of Financial
& Insurance Services and Producers of
Government Services, are expected to grow
in 2013. The major contributors to output
growth are expected to be Agriculture,
Forestry & Fishing, Construction and Mining
& Quarrying. Growth in Agriculture, Forestry
& Fishing is expected to reflect the continued
impact of the GOJ Production and Productivity
Programme (PPP) as well as recovery from
the damaging effects of Hurricane Sandy
in October 2012. Construction is expected
to benefit from the commencement of major
infrastructure projects and expansions within
the tourism sector. Mining & Quarrying
should reflect recovery following the negative
effects of Hurricane Sandy as well as increased
capacity utilization following mechanical
difficulties experienced during 2012. In
addition, Manufacturing is projected to grow
in 2013, due in part to planned expansion in
ethanol production during 2013.
2.11.3.2. Inflation
For 2013, domestic inflation, as measured by
the change in the consumer price index (CPI),
could be higher than the outturn for 2012. The
inflation impulses during the year are largely
expected from the impact of the pass-through
of the depreciation in the exchange rate.
Inflationary pressures are also expected from
measures introduced by the Government to
improve fiscal sustainability. The anticipated
increase in crude oil prices is also expected to
adversely affect domestic energy and transport
costs. However, the continuation of weak
domestic demand conditions should temper
potential price increases in 2013.
2.11.3.3. Monetary Policy
Current projections suggest that output growth
and inflation in 2013 should exceed levels
attained in 2012. As the country transitions to
a more growth oriented economy there could
be uncertainties about the impact of these
changes on prices. In that context, the Bank
will continue to manage inflation expectations
to obtain its objectives outlined in the medium-
term macroeconomic programme.

- 65 -
3. Financial System Surveillance and Policy
Jamaica’s financial markets through Rule-
Making. The drafting of detailed instructions
for the Omnibus legislation is expected to be
finalized during 2013, subsequent to feedback
from the consultative process which ends on
04 March 2013.2 (see Box –‘The Proposed
Provisions under the Omnibus Bill).
3.1.1.2 Further Strengthening of the Capital
Adequacy Framework for Licensed
Deposit-Taking Entities
The BOJ continued to ensure that licensed
deposit-taking entities maintain adequate
capital to buffer against potential losses through
stringent capital adequacy requirements. As
such, the minimum risk-based capital adequacy
(RWCA or CAR) requirement remained at 10
per cent, which is two percentage points above
the Basel minimum. Further, the inclusion
since 2004 of a 6.0 per cent leverage ratio in
Jamaica’s capital adequacy framework has
provided an added measure of resilience and is
consistent with elements of the Basel III capital
framework which the Basel Committee is
seeking to introduce by 2019. This combination
of conservatism and watchful prudential
oversight has resulted in adequately capitalized
deposit-taking licensees, which reflected
RWCA ratios between 11.1 per cent and 32.9
per cent as at 31 December 2012.
2 Subsequent to year-end, the consultation period was extended to 31 March 2013.
3.1. Supervision of Deposit-taking
Financial Institutions
3.1.1. Current Priorities in Banking
Supervision
3.1.1.1 Development of the Omnibus Banking
Bill
Development of the ‘Omnibus Banking Bill’
remained the major area of regulatory policy
focus during 2012, culminating in the release
of a Consultation Paper on “Proposals for
Enhancement of the Legislative Framework
for the Deposit-taking Sector” in December
2012. These legislative amendments will serve
to further strengthen the Bank of Jamaica’s
oversight of the deposit-taking financial sector
and achieve greater conformity with the Basel
Core Principles as well as other global best
practice standards.1 Additionally, the Omnibus
Banking Bill through consolidation of the three
deposit-taking statutes - The Banking Act,
The Financial Institutions Act and The Bank
of Jamaica (Building Societies) Regulations –
into a single legislation will eliminate existing
inconsistencies and arbitrage situations. In
addition, the Omnibus Banking Bill will provide
for easier updating of the regulatory framework,
consistent with the pace of innovation in
1 The Basel Core Principles are international best practice standards for Banking Supervision which are established by the Basel Committee on Banking Supervision.

- 66 -Financial System Surveillance and Policy
Bank of Jamaica
and financial holding companies. The Basel Core
Principles require the Supervisory Authority to have the
power to take a range of measures where a bank falls
below the minimum capital ratio, and to intervene at
an early stage to prevent capital from falling below the
minimum.
1.4 Enforceable Code of Conduct
The Omnibus statute will also introduce provisions to
address the establishment of an enforceable Bankers’
Code of Conduct which will outline the responsibilities
of the licensed deposit-taking institutions in relation to
the services and products offered to their customers.
This will therefore involve some elements of consumer
protection.
Oversight of compliance with the Code would be
incorporated into Bank of Jamaica’s regular supervisory
programme (i.e. on-site and off-site assessments) and
would require deposit-taking institutions to provide
information regarding, inter alia, customer complaint
statistics as well as fees and charges for banking
services. Licensed deposit-taking institutions will be
required to comply with the Code as a matter of law,
and Bank of Jamaica would be empowered to impose
administrative sanctions for breaches of, or non-
compliance with the Code.
Under the Omnibus Banking Bill a number of issues are to be addressed:-
1.1. Supervisory AutonomyA major issue arising from the 2005 Financial Sector
Assessment Programme (FSAP), which is being
proposed to be addressed in the Omnibus Banking Bill,
is that of supervisory independence and autonomy of
the BOJ. Jamaica was assessed as “materially non-
compliant” with Principle 1 of the Basel Core Principles,
which addresses this fundamental supervisory issue.
Supervisory independence of the BOJ in accordance
with international standards would result in the transfer
of key statutory powers from the Ministry of Finance
to the BOJ, such as, issue and revocation of licence,
determination on the fitness and propriety of proposed
principals of licensees as well as approval of branch
openings.
1.2 Consolidated Supervisory Framework
The Omnibus legislation will also enhance existing
provisions for regulation and supervision of financial
holding companies and financial conglomerates of
which licensed deposit-taking entities form a part. Such
enhanced provisions will include requirements relating
to capital adequacy and liquidity as well as limitations
on intra-group exposures.
1.3 Strengthing the Corrective & Sanctioning FrameworkThe Omnibus Banking Bill will also introduce a
comprehensive regime to ensure that the Supervisory
Authority has, at its disposal, an adequate range of
supervisory tools to bring about timely corrective
actions on the part of licensed deposit-taking entities
The Proposed Provisions under the Omnibus Banking Bill

- 67 -
Annual Report 2012
Financial System Surveillance and Policy
Notwithstanding the robustness of Jamaica’s
existing capital adequacy framework, the
Bank proposed the implementation of several
enhancements, which will be incorporated in
the Omnibus Banking Bill to further address
the requirements of Basel III. These include:
a. Further increase in the minimum
requirement for RWCA, which will be
implemented on a phased basis;
b. Introduction of an additional capital
requirement for systemically important
financial institutions (SIFIs); and
c. Introduction of an expanded RWCA
ratio (which takes into account retained
earnings) to incorporate risk buffers
that will be linked to, inter alia, general
financial stability risks.
3.1.1.3 Basel Core Principles for
EffectiveBanking Supervision – Self
Assessment
During 2012, the Bank commenced an
assessment of its supervisory framework
against the benchmark supervisory systems
and standards promulgated by the Basel
Committee on Banking Supervision (BCBS).3
This assessment was to ensure that Jamaica’s
supervisory infrastructure is in conformity
3 The Basel Committee on Banking Supervision is the international standard setting body for banking supervisors worldwide. The Committee is represented by central banks and bank regulators from Argentina, Australia, Belgium, Brazil, Canada, China, France, Germany, Hong Kong, India, Indonesia, Italy, Japan, Korea, Luxembourg, Mexico, Netherlands, Russia, Saudi Arabia, Singapore, South Africa, Spain, Sweden, Switzerland, Turkey, USA and the United Kingdom.
with the Core Principles which were revised
in September 2012. The revisions took account
of post-crisis lessons for promoting sound
supervisory systems as well as significant
developments in global financial markets and
the regulatory landscape since the last revision
published in 2006.
Specifically, the Core Principles were updated
to primarily:
a. Reflect greater consistency with new
global best practice standards, such
as the Basel III capital adequacy
framework;
b. Promote enhanced risk management
and corporate governance frameworks
in banking entities;
c. Promote enhanced supervisory
approaches and techniques by
supervisory bodies/agencies;
d. Promote application of a broad financial
system perspective that considers
both the macro- and micro-prudential
elements of effective supervision; and
e. Promote effective crisis management,
recovery and resolution strategies.
In this regard, BCBS has expanded the number
of Core Principles from 25 to 29, to provide
more precise guidance in critical areas such
as the Responsibilities, Objectives & Powers
of the Supervisory Authority; Independence,
Accountability, Resourcing & Legal Protection
for Supervisors; Cooperation & Collaboration;
Disclosure & Transparency; and Financial

- 68 -Financial System Surveillance and Policy
Bank of Jamaica
Reporting & External Audit. In addition, a
new Core Principle on Corporate Governance
was added to give greater emphasis to sound
governance practices within banking entities.
This self-assessment process will continue in
2013 and will inform the further strengthening
of the legislative and supervisory framework
for the licensed deposit-taking sector. This
strengthening will be critical as the Central
Bank prepares for an upcoming Financial
Sector Assessment Program (FSAP), which
will be conducted jointly by the International
Monetary Fund (IMF) and the World Bank.4
3.1.1.4 Development of Framework for Agent
Banking
In furtherance of efforts to achieve greater
financial inclusion and access to financial
services, during 2012 the Central Bank
pursued amendments to Jamaica’s legal and
regulatory framework to allow banks to partner
with non-bank third parties to offer banking
services, as agents. These amendments will
allow banking customers to conduct certain
banking transactions such as cash deposits
and withdrawals within certain size limits,
from third-party locations (including retail
outlets). Such agent activities will also enable
banking customers to perform a range of
other transactions electronically, including
4 Jamaica was previously assessed in 2005, based on the 1997 Core Principles. The results indicated that the country was Compliant/Largely Compliant with 21 of the 25 Core Principles and “Materially Non‐Compliant” with 3. One (1) Core Principle was assessed as “Not Applicable”
funds transfers between accounts and balance
inquiries.
Particular focus was placed on identifying
operational and reputational risks that
would emerge from the introduction of agent
activities. Specifically, the Bank assessed,
among other things, the various factors that
would advise policy determination with respect
to the types of entities that may be permitted to
serve as agents; the specific roles and functions
of, as well as the types of services that may be
performed by agents, the extent of an agent’s
liability and consumer protection measures.
At end-2012, the Central Bank was in the
process of drafting an Agent Banking Guideline
which will articulate deposit-taking institutions’
responsibilities with respect to agent activities
and the proposed programme for the regulation
and supervision of such activities by the
Supervisory Authority. Among other things,
the supervisory programme will treat with the
agent approval process, agent due diligence
(fit and proper testing), verification of customer
identity (Customer Due Diligence and record
keeping), agent exclusivity and interoperability,
internal controls and reporting requirements.
The draft Guideline is proposed to be issued to
the industry for comments in 2013.
3.1.1.5 Draft Bank of Jamaica (Credit Unions
Regulations
Draft regulations, which will prescribe the
principles for a prudential oversight regime,

- 69 -
Annual Report 2012
Financial System Surveillance and Policy
with respect to Credit Unions are still pending
presentation to Parliament by the Minister of
Finance.
3.1.2 Supervisory Cooperation and
Interaction
3.1.2.1 Financial Regulatory Council
The Financial Regulatory Council continued to
meet during 2012 to examine issues affecting
the financial industry as well as issues specific
to corporate groups comprising financial
entities which are supervised respectively by
the Bank of Jamaica and the Financial Services
Commission.5
3.1.2.2 The Caribbean Group of Banking
Supervisors
Bank of Jamaica continued to serve as
Administrator for the Secretariat of the
Caribbean Group of Banking Supervisors
(CGBS) throughout 2012.6 During the year, the
Secretariat coordinated three Administrative
meetings, three Supervisory Colleges and in
5 The Financial Regulatory Council comprises the following members: The Governor of the Bank of Jamaica (Chairman), the CEO, Financial Services Commission (FSC), the CEO, The Jamaica Deposit Insurance Company and The Financial Secretary.6 The CGBS was established in 1983 under the aegis of the Central Bank Governors of member countries of the Caribbean Community (CARICOM), with the specific mandate to co-ordinate the enhancement of bank supervisory practices in the English speaking Caribbean, consistent with internationally accepted standards. The CGBS was later extended to banking supervisors from non-CARICOM Caribbean territories and now comprises membership from sixteen regional jurisdictions, ten of which are currently core members of CARICOM.
conjunction with the Bank of Guyana, the “XXX
Annual Conference” (see Section 3.3).7 Four
training programmes were organized for the
region with international facilitators from the
Federal Reserve System (USA) (2 programmes);
the Financial Stability Institute and the
Caribbean Regional Technical Assistance
Centre. 8,9 The Bank also participated in and
contributed to the discussions of two Technical
Working Groups on the “Development of a
Regional Crisis Management Plan” and “Basel
II/III”, respectively.
3.1.2.3 Information Sharing
During 2012, under powers of a multi-lateral
regional MOU, the Bank engaged in discussions
and exchanged relevant information with
regional jurisdictions with common banking
group presence.10 This included participation
in two joint on-site examinations, one of which
7 A regulatory or supervisory college generally refers to a working group of national banking supervisors that is formed for the collective purpose of enhancing effective consolidated supervision of a cross border banking group on an ongoing basis.8 The Financial Stability Institute was jointly established by the Bank for International Settlements and the Basel Committee on Banking Supervision to assist supervisors around the world in improving and strengthening their financial systems.9 CARTAC is one of eight IMF Regional Technical Assistance Centers (RTACs). These centres were created to help countries strengthen human and institutional capacity to design and implement sound macroeconomic policies that promote growth and reduce poverty.
10 The Bank of Jamaica is one of 14 signatory jurisdictions to a regional Information Sharing Agreement (MOU), to facilitate cross border cooperation between home and host supervisory authorities for regional banking entities.
- 70 -Financial System Surveillance and Policy
Bank of Jamaica
was outside Jamaica. Bank of Jamaica also
participated in regional regulatory colleges
organised by the CGBS and Canada’s Office
of the Superintendent of Financial Institutions
(OSFI) to discuss matters of mutual interest
pertaining to three cross border banking
groups.
3.1.2.4 Association of Banking Supervisors of
the Americas (ASBA)
Bank of Jamaica is a member of the hemispheric
group, the Association of Banking Supervisors
of the Americas.11 During 2012, the Bank
remained an active contributor to the work of
the organisation, being a member of ASBA’s
Technical Committee. The Bank was also an
invited observer at ASBA Board meetings and
participated in a Working Group on Financial
Consumer Protection.
3.1.2.5 Caribbean Financial Action Task Force
(CFATF)
In another area of regional involvement, the
Bank participated in CFATF plenaries and
contributed to the dialogue on enhancing AML/
CFT frameworks of member countries during
2012.12
3.1.2.6 Financial Stability Board
In 2012, the Bank participated in Regional
11 ASBA is a regional grouping of 37 banking supervisory authorities whose membership spans 35 jurisdictions encompassing North, Central and South America and the Caribbean, with one non-regional member, Spain. 12 CFATF is an organization of 29 states of the Caribbean Basin which have agreed to implement common counter measures to address criminal money laundering.
Working Group meetings of the Financial
Stability Board’s Regional Consultative Group
for the Americas on Home-Host Co-operation
and Information Sharing. 13
3.1.3 The Supervised Environment
No new licences were granted under the
administered deposit-taking legislations
during 2012. The total number of licensed
deposit-taking entities operating in Jamaica
therefore remained at thirteen at end-2012
comprising seven commercial banks, four
building societies and two licensees under the
Financial Institutions Act (FIA) (see Table 37
and Table 38).
There were a significant ownership and a
separate corporate rebranding as follows:
i) During the first half of 2012, the Bank
of Jamaica completed its assessment
of Jamaica Money Market Brokers
Limited’s (JMMB) application
(submitted during the last quarter of
2011) to acquire the Capital & Credit
Financial Group, the parent company
of Capital and Credit Merchant Bank
(CCMB), a FIA licensee. In keeping
with the Bank’s recommendation, the
Minister of Finance issued formal
13 The Financial Stability Board (FSB) was established to coordinate at the international level, the work of national financial authorities and international standard setting bodies, and to develop and promote the implementation of effective regulatory, supervisory and other financial sector policies in the interest of financial stability. The FSB Secretariat is hosted by the Bank for International Settlements, in Basel, Switzerland.
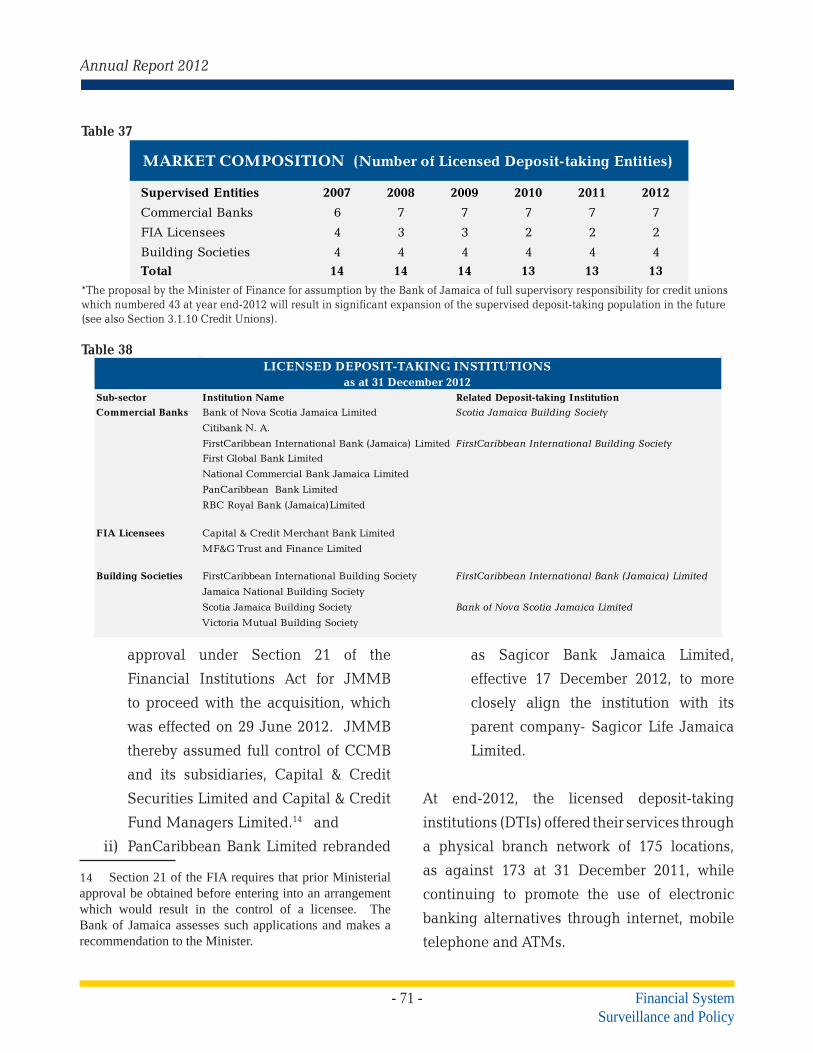
- 71 -
Annual Report 2012
Financial System Surveillance and Policy
approval under Section 21 of the
Financial Institutions Act for JMMB
to proceed with the acquisition, which
was effected on 29 June 2012. JMMB
thereby assumed full control of CCMB
and its subsidiaries, Capital & Credit
Securities Limited and Capital & Credit
Fund Managers Limited.14 and
ii) PanCaribbean Bank Limited rebranded
14 Section 21 of the FIA requires that prior Ministerial approval be obtained before entering into an arrangement which would result in the control of a licensee. The Bank of Jamaica assesses such applications and makes a recommendation to the Minister.
as Sagicor Bank Jamaica Limited,
effective 17 December 2012, to more
closely align the institution with its
parent company- Sagicor Life Jamaica
Limited.
At end-2012, the licensed deposit-taking
institutions (DTIs) offered their services through
a physical branch network of 175 locations,
as against 173 at 31 December 2011, while
continuing to promote the use of electronic
banking alternatives through internet, mobile
telephone and ATMs.
Table 37
*The proposal by the Minister of Finance for assumption by the Bank of Jamaica of full supervisory responsibility for credit unions which numbered 43 at year end-2012 will result in significant expansion of the supervised deposit-taking population in the future (see also Section 3.1.10 Credit Unions).
Supervised Entities 2007 2008 2009 2010 2011 2012
Commercial Banks 6 7 7 7 7 7
FIA Licensees 4 3 3 2 2 2
Building Societies 4 4 4 4 4 4Total 14 14 14 13 13 13
MARKET COMPOSITION (Number of Licensed Deposit-taking Entities)
Table 38
Sub-sector Institution Name Related Deposit-taking InstitutionBank of Nova Scotia Jamaica Limited Scotia Jamaica Building Society
Citibank N. A.
FirstCaribbean International Bank (Jamaica) Limited FirstCaribbean International Building SocietyFirst Global Bank Limited
National Commercial Bank Jamaica Limited
PanCaribbean Bank Limited
RBC Royal Bank (Jamaica)Limited
Capital & Credit Merchant Bank Limited
MF&G Trust and Finance Limited
FirstCaribbean International Building Society FirstCaribbean International Bank (Jamaica) Limited
Jamaica National Building Society
Scotia Jamaica Building Society Bank of Nova Scotia Jamaica Limited
Victoria Mutual Building Society
LICENSED DEPOSIT-TAKING INSTITUTIONSas at 31 December 2012
Commercial Banks
FIA Licensees
Building Societies

- 72 -Financial System Surveillance and Policy
Bank of Jamaica
3.1.4 System Performance
The combined assets base of the three licensed
deposit-taking sub-sectors recorded a higher
growth rate for 2012, as compared to 2011.15
This was largely reflective of expansion in
credit as well as the impact of re-valued
foreign currency portfolios, consequent on the
depreciation in the Jamaica Dollar vis-a-vis the
US dollar for 2012.16 For the year ended 2012,
total assets of the DTIs grew by $61.9 billion
or 7.5 per cent to $882.5 billion, compared to
growth of $37.9 billion or 4.8 per cent for 2011.
The asset base of the commercial banking sub-
sector grew by 7.5 per cent for 2012, relative
to 4.0 per cent for 2011, with the market
share unchanged at 74.8 per cent. Building
societies’ asset base expanded by 8.6 per cent
relative to growth of 10.2 per cent for 2011 and
commanded a marginally higher share of 22.8
per cent of total system assets. Total assets
15 Assets include guarantees/letters of credits and are shown net of provision for losses under International Financial Accounting Standards.16 Bank of Jamaica Weighted Average Selling Rates: December 2010: US$1 to J$85.8613; December 2011: US$1 to J$86.6008; December 2012: US$1 to J$92.9776.
of FIA licensees contracted by 0.6 per cent,
relative to the decline of 12.1 per cent for 2011
and accounted for the lowest market share of
2.4 per cent (see Table 39).
In the commercial banking sub-sector, the two
largest banks accounted for 74.7 per cent of total
assets of the sub-sector at end-2012, relative to
72.7 per cent at end-2011. Three commercial
banks reported smaller asset bases, compared
to the previous year.
Total assets of building societies grew by $15.9
billion or 8.6 per cent for 2012 compared to
growth of $17.1 billion or 10.2 per cent for the
previous year. The asset base of all building
societies, except one, expanded for 2012. The
two largest building societies accounted for
87.2 per cent of the total assets of the sub-sector
relative to 87.0 per cent for 2011. In contrast,
the asset base of FIA licensees contracted by
$134.0 million or 0.6 per cent, a slower rate
than the decline of $2.9 billion or 12.1 per cent
for 2011. The contraction for 2012 reflected
balance sheet restructuring at one licensee.
Table 39
Sub-sector J$BN % J$BN % J$BN %
Commercial Banks 589.9 75.4 613.6 74.8 659.8 74.8
Buildings Societies 168.3 21.5 185.5 22.6 201.4 22.8
FIA licensees 24.4 3.1 21.4 2.6 21.3 2.4System Total 782.6 100.0 820.5 100.0 882.5 100.0
MARKET SHARE (%) OF LICENSED DEPOSIT-TAKING INSTITUTIONS
As at 31 DecemberDec-2010 Dec-2011 Dec-2012

- 73 -
Annual Report 2012
Financial System Surveillance and Policy
3.1.5 Balance Sheet Profile
Loans and Advances continued to represent
the largest concentration of system assets
accounting for 45.1 per cent of total assets,
at end-2012, compared to 43.0 per cent at
end-2011. For the year, loans and advances
increased by $46.7 billion or 12.9 per cent to
total $409.0 billion, following growth of $16.4
billion or 4.8 per cent for 2011. The faster pace
of growth in the loan portfolio was influenced
by stronger demand for domestic currency
credit which increased by $47.8 billion, relative
to $21.2 billion for 2011. In contrast, the foreign
currency denominated loan portfolio contracted
by US$100.0 million for 2012.17 However, the
impact of the decline in the foreign currency
loans on the overall loan portfolio was tempered,
given the depreciation in the exchange rate.
Investments, including repurchase
transactions, remained the second largest
category of system assets in the review year,
albeit accounting for a lower 29.2 per cent of
total assets at end-2012, compared to 31.3 per
cent at end-2011. In spite of this lower share,
investments grew by $0.7 billion or 0.3 per cent,
in contrast to the contraction of $2.1 billion or
0.8 per cent for 2011. Incremental investments
during 2012 were evident in larger holdings
of GOJ and “other” foreign securities which
when combined, rose by $27.2 billion and were
funded from matured BOJ CDs and repurchase
transactions which fell by $20.5 billion and $5.9
17 Reference to US dollar values represent the USD equivalent of all foreign currencies.
billion, respectively.
Cash and Bank balances increased by $8.6
billion or 5.9 per cent, compared to growth of
$15.3 billion or 11.8 per cent for 2011. These
represented 17.4 per cent of total assets at end-
2012, relative to 17.7 per cent at end-2011. The
increase in 2012 was mainly reflected in larger
balances of $10.3 billion with BOJ, which was
partly offset by contraction of $2.6 billion in
balances held at commercial banks in Jamaica
(see Chart 20).
Deposits and borrowings were the primary
sources of funding for growth in assets for 2012,
compared to 2011, when deposits along with
shareholders’ equity were the main drivers of
expansion in system assets. For the review
year, deposits grew by $55.6 billion or 10.5
per cent to $584.1 billion, relative to growth of
$25.1 billion or 5.0 per cent for 2011. Domestic
currency and foreign currency deposits
increased by $21.7 billion and $33.9 billion,
respectively. The faster growth in foreign
currency deposits reflected the impact of the
depreciation of the domestic currency. At end-
2012, foreign currency deposits represented
38.9 per cent of total deposits, compared to 36.6
per cent at end-2011.
In 2012, borrowings including repurchase
transactions increased by $8.9 billion or 8.4 per
cent, in contrast to net repayment of borrowings
amounting to $18.9 billion or 15.1 per cent for

- 74 -Financial System Surveillance and Policy
Bank of Jamaica
2011. Net borrowings were mainly by way of
repurchase agreements which grew by $19.8
billion, the impact of which was partially offset
by repayments of $8.8 billion and $2.0 billion
to overseas and local institutions, respectively.
The total foreign currency denominated assets
for the system grew by US$31.0 million or
0.8 per cent, following growth of US$22.0
million or 0.6 per cent for 2011. Foreign
currency denominated liabilities increased by
US$77.0 million or 2.3 per cent in contrast to a
contraction of US$101.0 million for 2011. The
larger increase in liabilities was reflected in
higher deposit inflows, resulting in a narrowing
of a net long foreign currency exposure for
the system to US$216.3 million, relative to a
net long position of US$286.8 million at end-
2011. Commercial banks and building societies
reported expansions of US$31.0 million and
US$7.0 million, respectively, in foreign currency
denominated assets. In contrast, FIA licensees
reported a decline of US$14.0 million in foreign
currency denominated assets, attributed to the
sale of a portion of the loan portfolio by one
entity to a non deposit-taking affiliate.
3.1.6 Liquidity
The system held lower levels of average
domestic currency liquid assets in relation to
average domestic currency prescribed liabilities
as at end-2012. Specifically, the ratio fell to 26.7
per cent from 30.5 per cent for December 2011
but remained above the statutory requirement
of 26.0 per cent. The system also held reduced
average balances of US dollar liquid assets to
average US dollar prescribed liabilities of 38.7
per cent for December 2012 relative to a ratio of
Chart 20 Profile of System Assets
31 Dec. 2010 31 Dec. 2011 31 Dec. 2012
Other7.1%
Other8.0%
Other8.3%
Cash & Bank16.6%
Cash & Bank17.7%
Cash & Bank17.4%
Loans43.2%
Loans43.0%
Loans45.1%
Investment (Incl. Repos)
33.1%
Investment (Incl. Repos)
31.3%
Investment(incl. Repos)
29.2%

- 75 -
Annual Report 2012
Financial System Surveillance and Policy
39.1 per cent for December 2011, comfortably
above the statutory minimum of 23.0 per cent.
The lower ratios at end-2012 were influenced
by an increase in reservable deposits as well as
reduced holdings of eligible foreign currency
liquid assets. DTIs switched from shorter-
dated foreign currency assets to longer-dated
GOJ foreign currency securities and corporate
bonds during the year. All licensees, including
building societies which continued to qualify for
the lower preferential liquid assets ratio, held
balances in excess of the required minimum
throughout the year.18
The system also maintained the required cash
reserve ratios of 12.0 per cent and 9.0 per cent
for the domestic currency and foreign currency
requirements, respectively. There were
however, a few instances in which the cash
reserve requirements were breached during
the year, arising from delays by some licensees
to properly fund their accounts to maintain the
required monthly cash reserve balances on the
first working day of the month as prescribed by
law. Wherever such shortfalls in cash reserve
balances occurred, applicable penalty charges
were imposed in accordance with the relevant
statutes.
18 Cash reserve and liquid assets requirements are differentially applied to building societies not satisfying a 40.0 per cent prescribed threshold of residential mortgages in relation to savings funds. Building societies that meet the prescribed threshold apply the lower requirements of 1.0 per cent and 5.0 per cent for cash reserve and liquid assets ratios, respectively. Building societies which do not satisfy the prescribed threshold are required to hold the higher requirements which apply to commercial banks and FIA licensees.
3.1.7 Asset Quality
There was significant improvement in the asset
quality of the system for the year. In particular,
the stock of non-performing loans 3 months &
over (NPLs) at end-2012 was $27.9 billion and
represented 6.8 per cent of total loans, relative
to 8.9 per cent at end-2011 and was within the
prudential benchmark of 10.0 per cent (see
Chart 21). During the year, NPLs contracted
by $4.3 billion or 13.2 per cent, in contrast to
an increase of $9.8 billion or 44.0 per cent for
2011 and was evident in commercial banks
and FIA licensees. This contraction was
influenced by customer repayments as well
as write-offs of loans, primarily to the tourism
sector, by commercial banks. The write-offs
accounted for 97.7 per cent of the reduction in
total NPLs. Improvement in the loan quality of
FIA licensees was attributable to the sale of a
portion of one entity’s stock of NPLs to a non-
deposit-taking affiliate.
In 2012, the supervised entities increased
provisions for loan losses by $1.7 billion or
7.0 per cent to $25.9 billion, relative to an
expansion of $8.6 billion or 55.1 per cent for
2011.19 The increase in provisioning coupled
with the reduction in NPLs, resulted in the
system reporting improved coverage of 92.8
per cent of NPLs at end-2012 compared to 75.2
per cent at end-2011.20 Regulatory capital and
19 Provisions for loan losses represent a combination of assessments under International Financial Reporting Standards and incremental amounts required in accordance with the Central Bank’s prudential guidelines. 20 At end-2012, coverage as per prudential guidelines

- 76 -Financial System Surveillance and Policy
Bank of Jamaica
provisions provided a buffer of 422.8 per cent
of the value of NPLs, relative to 352.5 per cent
at end-2011.21
3.1.8 Capital
Total regulatory capital grew by $2.9 billion or
3.3 per cent for 2012 compared to $4.6 billion
or 5.4 per cent for 2011. Incremental regulatory
capital was internally generated for all DTIs
with the exception of one licensee. Despite the
strengthening of regulatory capital, there was
a reduction of $5.5 billion or 4.0 per cent in
shareholder’s equity in contrast to an increase
of $21.2 billion or 18.4 per cent for 2011. The
decline in shareholder’s equity resulted from
dividend payments as well as two instances
represented 2.3 times that which obtains using only IFRS provisions.21 Regulatory Capital for Jamaican licensed deposit-taking institutions was computed on a more conservative basis than that permitted under Basel Standards and does not include retained audited profits unless these have been specifically set aside in a non-distributable reserve.
of reported loan losses which led to increased
loan loss provisioning.
The growth of 7.5 per cent in total assets vis-
à-vis capital growth of 3.3 per cent resulted
in the system recording a lower Primary Ratio
(regulatory capital: total assets) of 10.3 per
cent at end-2012, relative to 10.9 per cent at
end-2011. Concurrently, the Risk-Weighted
Capital Adequacy ratio (CAR) declined to 14.1
per cent from 16.1 per cent at end-2011.22,23
The lower CAR continued to be influenced
by the graduated increase in risk weights on
previously zero weighted GOJ foreign currency
denominated instruments. The final increase to
22 Capital Adequacy Ratio (CAR): Qualifying Capital (Tier 1 & Tier 2 capital items less prescribed deductions) in relation to Risk Weighted Assets and Foreign Exchange Exposure. 23 When capital is adjusted to include retained audited profits consistent with the Basel standards, the Primary and Capital Adequacy ratios would be 12.2 per cent and 16.7 per cent, respectively.
Chart 21 System Annual Change in Loans and NPLs (3 months & over)
-4.8
16.4
46.7
5.9 9.8
-4.3
-10.0
0.0
10.0
20.0
30.0
40.0
50.0
60.0
70.0
80.0
Billi
ons
($)
YearsChange in Loans Change in NPLs
- 77 -
Annual Report 2012
Financial System Surveillance and Policy
100.0 per cent in risk weightings was applied
in June 2012. Notwithstanding this increase, at
year end, all licensees continued to maintain
Primary and Risk-Weighted Capital Adequacy
ratios above the minimum requirements of 6.0
per cent and 10.0 per cent, respectively.
3.1.9 Profitability
Based on unaudited prudential data submitted
by licensees to the Bank, the system recorded
pre-tax profits of $19.9 billion which translated
to a pre-tax profit margin of 20.5 per cent for
2012. This compares with pre-tax profits of
$31.3 billion and pre-tax profit margin of 30.8
per cent for 2011 which included $12.9 billion
in dividend income at one commercial bank.
Given the lower pre-tax profits and expanded
asset base, the Return on Average Assets
(ROAA) fell to 2.3 per cent for 2012 from 3.9
per cent for 2011 (see Appendix B– Annual
Prudential Indicators).24
For the review year, net interest income
increased by $2.2 billion or 4.5 per cent,
reflecting growth of $1.9 billion or 3.1 per
cent in interest income and a reduction of $0.3
billion or 2.2 per cent in interest expenses. The
Net Interest Margin (NIM) was fairly stable
at 7.4 per cent relative to 7.5 per cent in 2011.
Non-interest income declined by $6.9 billion,
largely reflecting a contraction of $8.7 billion
24 The system benefitted from a $12.9 billion in dividend income at one commercial bank in 2011. In the absence of this dividend income, the system would have recorded Net Profit Margin and ROAA of 15.9 per cent and 2.0 per cent, respectively.
or 57.2 per cent in dividend income. Other
Operating Expenses increased by $5.9 billion
or 10.2 per cent, reflecting primarily, increases
of $2.0 billion, $1.8 billion and $1.6 billion in
miscellaneous operating costs, fees and staff
costs, respectively.
3.1.10 Credit Unions
3.1.10.1 Overview of the Credit Union Sector
The Bank continued its monitoring of credit
unions during 2012, pursuant to their
designation as “specified financial institutions”
under Section 2 of the Bank of Jamaica Act, in
July 1999. This allows the Bank to undertake
information gathering, whilst authority and
oversight responsibility for these entities
continue to be vested in the Department of Co-
operatives and Friendly Societies (Registrar),
as statutory oversight agency, and the Jamaica
Co-operative Credit Union League (League)
which currently undertakes a self-regulatory
role for most credit unions.
The draft Bank of Jamaica (Credit Unions)
Regulations remained at the forefront of a
number of meetings and correspondence
between the Bank and the League during
the year. At a meeting convened by the
Honourable Minister of Finance with the Bank
and the League in September 2012, resolution
was arrived at on three of the League’s advised
remaining five issues of concern with regard
to the draft Regulations.25 Efforts directed at
25 In September 2012, agreement was reached with the Minister of Finance on the League’s request for a 24 month time period within which start-up credit unions would be

- 78 -Financial System Surveillance and Policy
Bank of Jamaica
resolving the two remaining issues of concern
will continue to be actively pursued in 2013.26
In anticipation of the licensing regime that
will be implemented on the promulgation of
the requisite Regulations, a fourth round of on-
site examinations of the sector was completed
during 2012, while off-site surveillance
continued, based on the analysis of monthly
and quarterly prudential submissions. In the
absence of the Regulations, the Bank has no
statutory authority or power with which to
enforce any necessary corrective actions.
3.1.10.2 Credit Union Sector Developments
Consequent on the amalgamation of Churches
Co-operative Credit Union Limited and the
GSB Co-operative Credit Union Limited,
effective 01 August 2012, under provisions
contained in Section 53 (1) of the Co-operative
Societies Act, the number of credit unions
in operation contracted to 43 from 44. The
merged entity, First Heritage Co-operative
Credit Union Limited, became the second
largest credit union. At end-2012, the sector
comprised of 10 “Parish” based credit unions,
29 “Employee” based credit unions and 4
‘Other’ credit unions. 27 Of note, the 20 largest allowed to achieve the minimum capital requirement, the treatment of cash reserves and the definition of Unclaimed Funds, hence paving the way for the alignment of the treatment of these such unclaimed moneys with other deposit-taking entities.26 Permissible levels of exposure of credit unions to unsecured credits and the operation of Foreign Currency Accounts by credit unions for own account/proprietary purposes.27 The “Other’ credit unions being: COK Sodality
credit unions represented 86.0 per cent of
assets which amounted to $71.2 billion at end-
2012. Given the relative small asset base of the
remaining credit unions, further consolidation
in the sector is anticipated during 2013.
3.1.10.3 Credit Unions Performance Highlights
Based on unaudited prudential returns
submitted to the Central Bank, the net profit
for the credit union sector contracted to $0.96
billion for 2012 from $1.2 billion in 2011, which
was reflected in a decline in the net profit
margin to 3.5 per cent from 11.3 per cent.
This outturn reflected the impact of the global
financial crisis and subdued economic activity.
Credit unions advised the Bank of efforts being
made to strengthen credit and delinquency
control procedures. In addition, policies were
effected to safeguard against the threat of rising
costs and overheads.28
At end-2012 total membership was 983 501,
an increase of 2.1 per cent or 19 802 relative
to end-2011. Total assets of $71.2 billion at
end-2012 increased by 6.6 per cent or $4.4
billion, compared to growth of 9.9 per cent or
$6.0 billion for 2011. The sector accounted for
7.5 per cent of the total assets of $953.7 billion
of the combined deposit-taking industry at 31
December 2012, compared to 8.0 per cent at
end-2011(see Chart 22).
CCUL, C&WJCCUL, Church of the First Born CCUL and First Heritage CCUL 28 Mandatory write-off policies exist for Past Due Loans in excess of 365 days past due.

- 79 -
Annual Report 2012
Financial System Surveillance and Policy
Chart 22
The expansion in assets was financed primarily
by a growth of 6.4 per cent or $3.3 billion in
membership savings to $54.9 billion, an
increase of $0.3 billion or 3.8 per cent in the
capital base to $8.1 billion and an expansion
in borrowings of 53.3 per cent or $0.4 billion
(see Table 40). For the year, loans grew by $5.5
billion or 13.0 per cent to $47.9 billion relative
to $4.5 billion or 12.5 per cent for 2011. The
major categories of loans were “Mortgages”
and “Unsecured Consumer Lending” which
accounted for 39.0 per cent and 14.0 per cent,
respectively. Most of this growth occurred in
the latter part of 2012.
3.1.11 Credit Reporting
The Bank of Jamaica continued to implement
its operational framework for the discharge
of credit reporting oversight pursuant to its
designation as “Supervising Authority” under
The Credit Reporting Act 2010 (CRA). Principal
activities were:-
3.1.11.1 Review of Licence Applications
During 2012, the Bank completed the review of
four (4) applications for licence under the CRA,
and made recommendations to the Minister of
Finance as required under the Act. Following
those recommendations, the Minister of
Finance issued two licences:
1. Creditinfo Jamaica Limited –issued 07
March 2012
2. CRIF NM Credit Assure Limited –issued
10 April 2012
Both entities were given one year from the
date of their licence to meet certain licence
conditions and commence operations. These
licence conditions included finalising IT
infrastructure and demonstrating the live credit
reporting system to the Bank’s satisfaction;
executing appropriate liability insurance
against potential claims by consumers and other
risks; and concluding contracts with eligible
credit information providers. At year-end, a

- 80 -Financial System Surveillance and Policy
Bank of Jamaica
combined total of 25 eligible credit information
providers had signed contracts with the two
licensed credit bureaus with some having
commenced testing of data submissions.
Further, during 2012, another three applications
were received by the Minister and forwarded
to the Bank for assessment. At year-end,
one application was under review while two
were returned to the applicants due to the
insufficiency of information.
3.1.11.2 Policy Guidance
During the year, Bank of Jamaica developed
formal guidance for stakeholders on the
following aspects of the credit reporting regime:
i. Directions on the Operational
Framework for Managing the
Requirement for Consumer Written
Consent Under Section 11 (3) of The
Credit Reporting Act.
In light of feedback received from
licensed credit bureaus and certain
credit information providers, with
Table 40
Change Change
INDICATORS (%) (%)
Number of Credit Unions (Actual)
43.0 -1.0 2.3 44.0 -2.0 -4.4 46.0
Membership (Actual) 983 501 19 802 2 963 699 -12 086 -1 975 785
Total Assets ($BN) 71.2 4.4 6.6 66.8 6.1 10.0 60.7
Total Loans ($BN) 47.9 5.5 13.0 42.4 4.7 12.5 37.7
PDL (>3months) ($BN) 1.4 0.2 16.7 1.2 -0.4 -25.0 1.6
Capital ($BN) 8.1 0.3 3.8 7.8 1.3 20.0 6.5Borrowings from JCCUL ($BN)
1.1 0.4 53.3 0.7 0.4 133.3 0.3
Total Savings Fund ($BN) 54.9 3.3 6.4 51.6 3.8 7.9 47.8
Share Savings ($BN) 25.4 1.5 6.7 23.8 1.3 5.8 22.5
PDL:Total Loans 2.9 2.8 4.2
Loans:/Savings Ratio 87.2 82.2 78.9Capital: Assets Ratio 11.4 11.7 10.7
Source: Prudential Returns submitted by credit unions to the Bank of Jamaica.
COMPARATIVE KEY CREDIT UNION INDICATORS
December 2010 - December 2012Dec-2010Dec-2012 Change ChangeDec-2011

- 81 -
Annual Report 2012
Financial System Surveillance and Policy
regard to challenges faced in
operationalizing the requirement for
credit bureaus to receive prior written
consumer consent pursuant to Section
11(3) of the CRA, the Bank issued
“Directions” under Section 22 (4) of
the Act on the matter. The Directions
outline minimum requirements relating
to, for example, the information to be
stated on the consumer consent and
required disclosures to the consumer
at the time of obtaining consent.
Importantly, the Directions also permit
for electronic means of managing this
area of operations and allow for credit
information providers to act as agents
of the credit bureau for purposes of
obtaining the consent, given their
natural interface with the consumer.
ii. Form of Notices of Intent to Disclose
Credit Information
Pursuant to Sections 8(10)(a) of the
Act, credit information providers
are required to publish in a daily
newspaper in circulation in Jamaica, a
notice stating their intention to provide
credit information to a credit bureau at
least seven days before commencing
the provision of any credit information.
In this regard, the Bank of Jamaica
developed a Form of the Notice which
was provided to each credit information
provider notified as having signed
a contract for the provision of credit
information with a credit bureau.
iii. Guide to the Assessment of Applications
for Licence
This Guide sets out the Bank’s
expectations with regard to the
information and documentation
required to meet the licence application
criteria as set out in the Credit Reporting
Regulations. The document is posted
on the Bank’s website.
3.1.11.3 Unlicensed Credit Reporting Entities
The CRA restricts the use of the words “credit
bureau” or any other words which could
reasonably be construed as indicating that
a person carries on the business of a credit
bureau [Section 4(7)]; and the disclosure of
credit information about a consumer in return
for monetary payment or other reward or as
part of any business or undertaking, whether
for profit or otherwise [Section 3(1)]. In this
regard, during 2012, the Bank undertook
investigations to identify whether there were
any entities whose existence may or may not
have pre-dated the advent of the CRA, who
were undertaking activities in violation of
the Act. From these investigations, the Bank
identified a number of entities whose business
name would seem to be in violation of the Act
or whose marketing activities or stated nature
of business as registered with the Companies
Office, would point to the undertaking of
credit reporting. While the Bank successfully
made contact with a number of entities to
- 82 -Financial System Surveillance and Policy
Bank of Jamaica
clarify activities or request corrective actions
as relevant, there were instances of mail being
returned undelivered suggesting inactivity
of operations and were generally supported
by dated filings with the Companies Office.
Investigations were on-going at year-end.
3.1.11.4 Public Education
In an effort to sensitise the public and other
stakeholders about the implications of the new
credit reporting regime, the Bank engaged
in a number of public education initiatives
which included a mix of newspaper articles,
media appearances, pamphlet distribution,
presentation at public fora and the organisation
of a conference specifically targeted for credit
information providers. The conference, which
had over 100 participants, was presented jointly
with the International Finance Corporation and
also had regional regulatory participation.29
3.2. Supervision of Cambios and
Remittance Companies
During 2012, the Bank continued to effect
its regulatory function in respect of Cambios
and Remittance Service Providers (RSPs),
in order to ensure adherence to the Bank of
Jamaica Operating Directions (Operating
Directions) and the Anti-Money Laundering
(AML) regulations of the Proceeds of Crime Act
29 International Finance Corporation (IFC), a member of the World Bank Group, is the largest global development institution focuses exclusively on the private sector in developing countries.
(POCA). A key pillar in the supervisory process
was also to ensure that licensees implemented
the necessary strategies to mitigate risks to the
financial system. The regulatory functions were
executed through on-site inspection, supported
by in-house monitoring of the operations of
these entities. Additionally, licensees were
required to comply with reporting requirements
to facilitate the achievement of the Bank’s
objective of providing timely and accurate
information to its stakeholders.
A critical component of the supervision of
Cambios and RSPs continued to be the on-
going assessment of the probity and fitness
of operators (directors, shareholders and
managers) in line with the Bank’s ‘Fit and
Proper’ criteria.30 This assessment process
informs and guides the issuance and renewal
of licences. In this regard, 371 persons were
assessed in 2012.
3.2.1 Cambios
During 2012, six new cambio licences were
issued while four were voluntarily surrendered.
Six new companies entered the cambio market
while three ceased offering cambio services. In
this regard, the total number of cambio locations
increased to 163 at end-2012 from 161 at end-
2011. In addition, the number of companies
which offered cambio services increased to 71
from 68 at end-2011(see Table 41).
30 Shareholders are defined as persons holding 10.0 per cent or more of shares.

- 83 -
Annual Report 2012
Financial System Surveillance and Policy
At the end of the review year, the parishes of
Kingston and St. Andrew continued to account
for the largest concentration of cambio locations
followed by St. James, St. Catherine and St.
Ann (see Chart 23).
Cambios accounted for 45.9 per cent of total
foreign exchange market sales for the review
year, this represented an increase of 8.9
percentage points, relative to 2011.
3.2.2 Remittance Service Providers (RSP)
In 2012, the Bank received one application to
operate as a RSP (Primary Agent).31 However,
processing of this new applicant was not
completed within the year. As a result, the
number of Primary Agents remained at nine,
relative to end-2011. These Primary Agents
31 Primary Agent are companies licensed in Jamaica to offer remittance services for remittance companies domiciled overseas. They are authorised to offer the service in Jamaica through sub-agents.
Chart 23 Geographic Distribution of Cambios at end-December
0
5
10
15
20
25
30
35
%
Parish
2011
2012
Table 41
2011 2012
New Locations Licensed 13 6
Locations Closed 13 4
Number of Locations 161 163
Number of Companies 68 71
STATUS OF CAMBIO LICENCES
as at 31 December
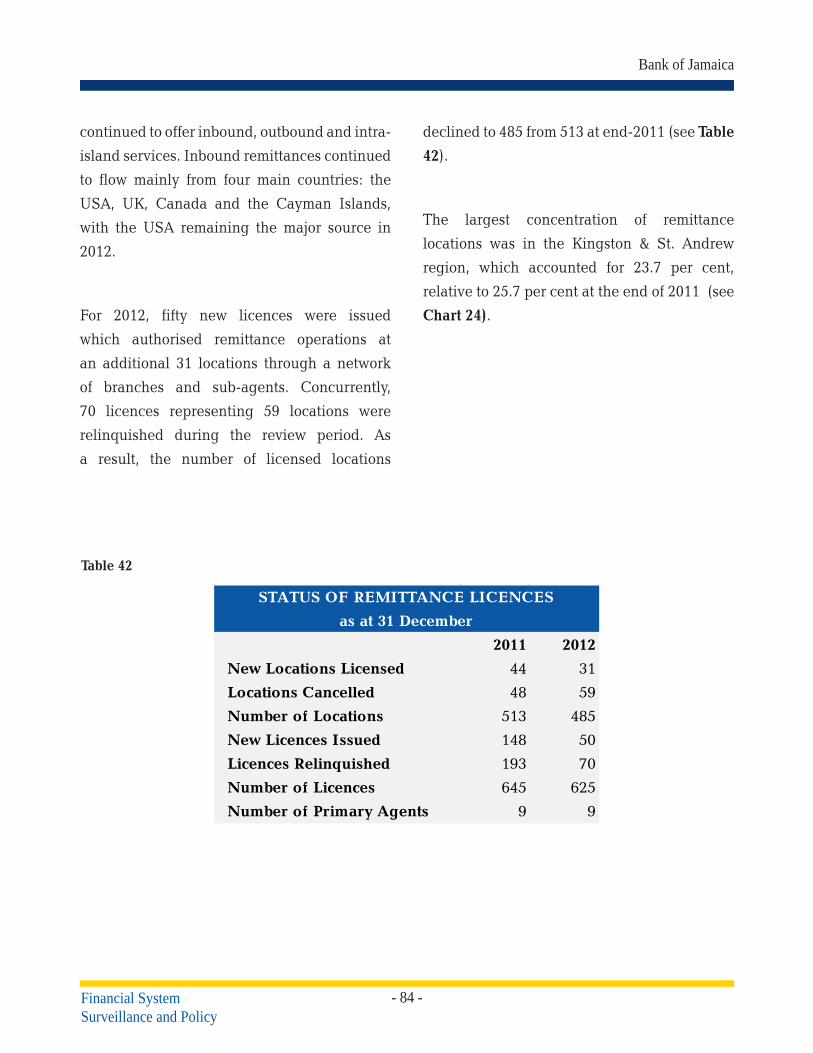
- 84 -Financial System Surveillance and Policy
Bank of Jamaica
continued to offer inbound, outbound and intra-
island services. Inbound remittances continued
to flow mainly from four main countries: the
USA, UK, Canada and the Cayman Islands,
with the USA remaining the major source in
2012.
For 2012, fifty new licences were issued
which authorised remittance operations at
an additional 31 locations through a network
of branches and sub-agents. Concurrently,
70 licences representing 59 locations were
relinquished during the review period. As
a result, the number of licensed locations
declined to 485 from 513 at end-2011 (see Table
42).
The largest concentration of remittance
locations was in the Kingston & St. Andrew
region, which accounted for 23.7 per cent,
relative to 25.7 per cent at the end of 2011 (see
Chart 24).
Table 42
2011 2012
New Locations Licensed 44 31
Locations Cancelled 48 59
Number of Locations 513 485
New Licences Issued 148 50
Licences Relinquished 193 70
Number of Licences 645 625
Number of Primary Agents 9 9
STATUS OF REMITTANCE LICENCES
as at 31 December
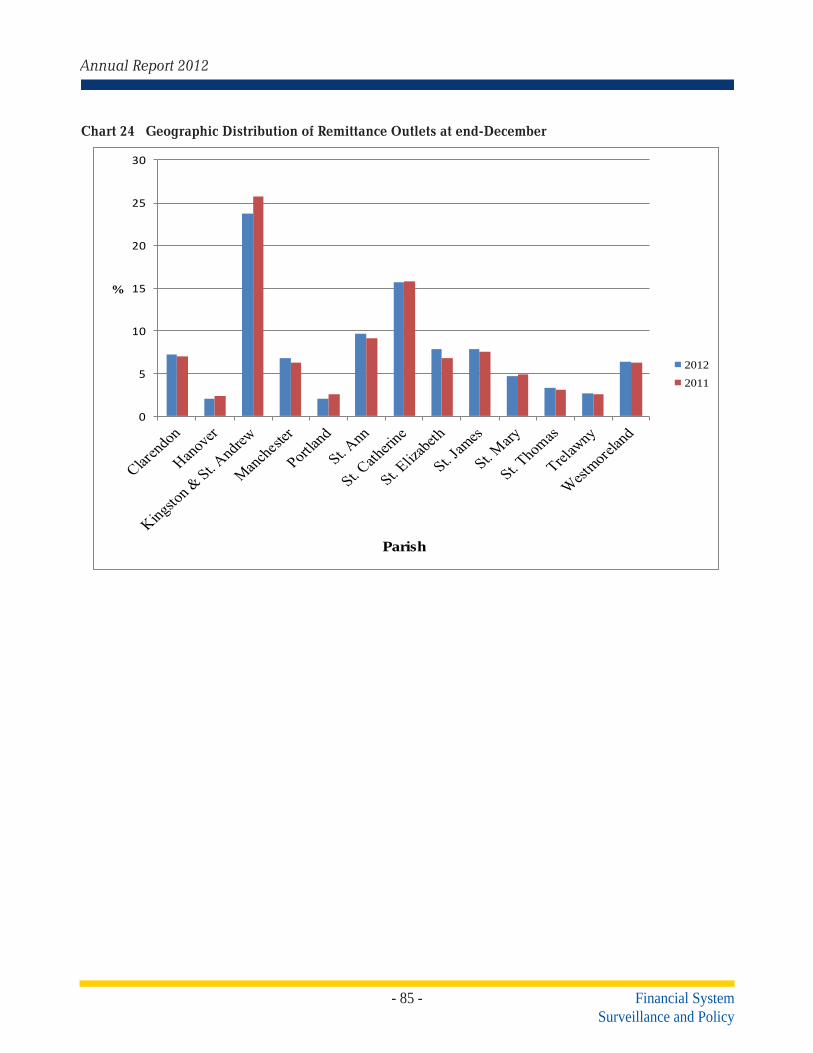
- 85 -
Annual Report 2012
Financial System Surveillance and Policy
Chart 24 Geographic Distribution of Remittance Outlets at end-December
0
5
10
15
20
25
30
%
Parish
2012
2011

- 86 -Financial System Surveillance and Policy
Bank of Jamaica
3.3. Financial System Stability
Assessment of DTIs
3.3.1. Overview
There was minimal risk to the stability of
deposit-taking institutions (DTIs) during 2012,
despite heightened public uncertainty about
an agreement with the IMF on a medium term
macroeconomic programme. DTIs were largely
resilient to macro-prudential stress tests during
2012, due to strong capital positions as well
as improved loan quality.1,2 In particular, the
stress test results revealed that the average
post-shock capital adequacy ratios (CARs) for
the banking system remained above the 10.0
per cent minimum benchmark, in response to
hypothetical market, credit and liquidity shocks
simulated by the Bank.
In relation to credit risk, stress test results
showed that the system was resilient to
hypothetical shocks to non-performing loans
(NPLs). The CARs of most DTIs remained
above the prudential 10.0 per cent benchmark
subsequent to a hypothetical 30.0 per cent
increase in NPLs. However, DTIs were
negatively exposed to hypothetical adverse
shocks to performing loans due to the strong
concentration in the personal loan category.
With respect to market-related shocks, the
1 DTIs include commercial banks, FIA Licensees and building societies.
2 The objective of stress testing is to determine the impact of extreme but plausible shocks to various risk factors such as credit quality, foreign exchange rates, domestic interest rates and liquidity on the capital adequacy ratios of the DTIs.
post-shock CARs for DTIs generally remained
above the 10.0 per cent minimum benchmark
throughout the review year. In particular, the
vulnerability of the banking system to foreign
exchange risk declined relative to 2011. This
occurred against the background of the lower
net open positions of these institutions. In
contrast, DTIs were generally more susceptible
to interest rate stress tests, compared to 2011. Of
note, commercial banks and building societies
showed greater susceptibility to hypothetical
increases in interest rates, relative to the FIA
licensees, due to significant net interest income
losses during the review year. The robustness
of FIA licensees to this stress test occurred in
a context where these institutions experienced
increased levels of capitalisation.
The value of the Bank’s macro-financial index
(MaFI) for DTIs, which comprises 18 key
macroeconomic indicators, improved during
2012.3 This occurred in a context where the
performance of the volatility indicators, growth
in private sector credit and fiscal measures,
improved over the review period. Similarly, the
Bank’s micro-prudential index (MiPI) for DTIs,
comprising 21 key financial ratio indicators
showed favourable results for the review
period.4 In particular, all DTI sub-sectors 3 The macroeconomic indicators are categorized as follows: 12-Month Measures - 12-month growth in CPI, 12-month growth in GDP, 12-month growth in stock market index,12-month growth in private sector credit; Fiscal Measures - central government deficit/GDP, credit to public sector/ GDP, National debt/GDP, external debt /GDP, volatility in inflation; Other Economic Prices - volatility in interest rates, volatility in exchange rates, real lending rate minus real deposit rate, U.S./Jamaica interest rate differential, real T-bill rate, real effective interest rate and BOJ Variables - BOJ credit to banking sector/GDP, M2/net international reserves, money multiplier.
4 The financial ratios are categorized as follows: Balance Sheet

- 87 -
Annual Report 2012
Financial System Surveillance and Policy
recorded better performance in the MiPI due
primarily to improvements in balance sheet
and asset quality indicators.
3.3.2. Credit Risk Stress Tests
Despite weak economic conditions there was
an improvement in the loan quality of DTIs. The
ratio of NPLs to total loans for DTIs decreased to
6.8 per cent at end-2012, relative to 8.9 per cent
at the close of the prior year. Overall, the DTIs
were generally resilient to the contemplated
shocks to NPLs. However, there was a sharper
decline in the CARs for commercial banks and
building societies in response to hypothetical
reductions in performing loans (PLs) relative to
2011.
Structure - Capital/assets, loans/capital, deposits/loans, deposits/total assets, liquid assets/total assets, deposits & repos/assets, public sector loan/assets, financial inst. Loans/loans, investments/assets; Asset Quality - non-performing loans/assets, non-performing loans/total loans, reserve for loan losses/total assets, loan & sec. loss prov./assets; Profitability - implicit deposit rates, employee salaries/assets, non-interest income/assets, interest income/assets, net income/assets and Other Indicators - FX liabilities/FX assets, FX deposits/FX assets, 12-month growth in deposits.
The commercial banks were most vulnerable
to the contemplated 100.0 per cent increase in
NPLs during 2012 (see Chart 25). As a result
of this shock, the CAR for FIA licensees would
fall by 1.1 percentage points to 11.8 per cent
at end-2012. Building societies remained the
most resilient to the same level of shock. Of
note, for the commercial banks, a 10.0 per cent
increase in NPLs would result in the first bank
breaching the 10.0 per cent CAR benchmark,
while an increase of 180.0 per cent was required
for the first building society and the FIA
licensee to breach this prudential minimum.
Commercial banks and building societies were
most vulnerable to a hypothetical 30.0 per cent
deterioration in performing loans. Subsequent
to this shock, the post-shock CARs for the
commercial bank and building societies sectors
would breach the prudential minimum.
Improvement in the DTIs’ loan quality for 2012
was primarily reflected in tourism, construction,
Chart 25 Banking Sector: Impact on CAR of an Increase in NPLs and Reduction in PLs
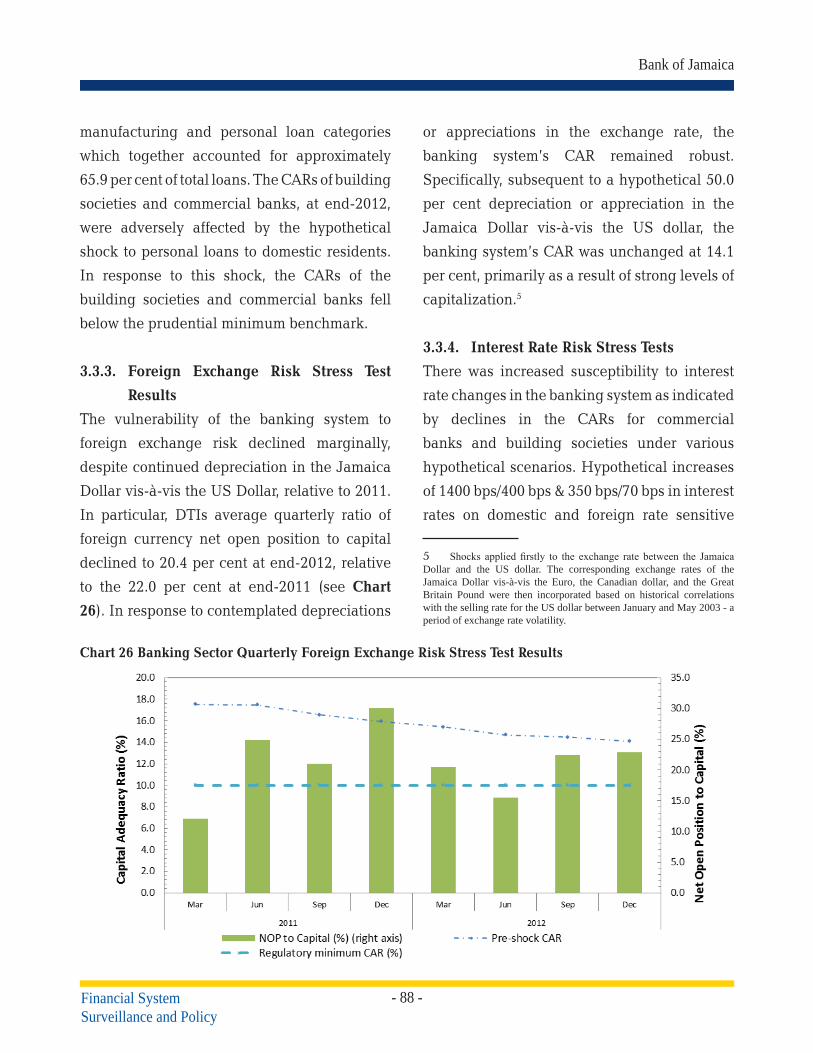
- 88 -Financial System Surveillance and Policy
Bank of Jamaica
manufacturing and personal loan categories
which together accounted for approximately
65.9 per cent of total loans. The CARs of building
societies and commercial banks, at end-2012,
were adversely affected by the hypothetical
shock to personal loans to domestic residents.
In response to this shock, the CARs of the
building societies and commercial banks fell
below the prudential minimum benchmark.
3.3.3. Foreign Exchange Risk Stress Test
Results
The vulnerability of the banking system to
foreign exchange risk declined marginally,
despite continued depreciation in the Jamaica
Dollar vis-à-vis the US Dollar, relative to 2011.
In particular, DTIs average quarterly ratio of
foreign currency net open position to capital
declined to 20.4 per cent at end-2012, relative
to the 22.0 per cent at end-2011 (see Chart
26). In response to contemplated depreciations
or appreciations in the exchange rate, the
banking system’s CAR remained robust.
Specifically, subsequent to a hypothetical 50.0
per cent depreciation or appreciation in the
Jamaica Dollar vis-à-vis the US dollar, the
banking system’s CAR was unchanged at 14.1
per cent, primarily as a result of strong levels of
capitalization.5
3.3.4. Interest Rate Risk Stress Tests
There was increased susceptibility to interest
rate changes in the banking system as indicated
by declines in the CARs for commercial
banks and building societies under various
hypothetical scenarios. Hypothetical increases
of 1400 bps/400 bps & 350 bps/70 bps in interest
rates on domestic and foreign rate sensitive
5 Shocks applied firstly to the exchange rate between the Jamaica Dollar and the US dollar. The corresponding exchange rates of the Jamaica Dollar vis-à-vis the Euro, the Canadian dollar, and the Great Britain Pound were then incorporated based on historical correlations with the selling rate for the US dollar between January and May 2003 - a period of exchange rate volatility.
Chart 26 Banking Sector Quarterly Foreign Exchange Risk Stress Test Results

- 89 -
Annual Report 2012
Financial System Surveillance and Policy
assets and liabilities, resulted in declines of
2.4 percentage points and 1.6 percentage
points in the CARs for commercial banks and
building societies, respectively, during the
year.6 The increased susceptibility of both
commercial banks and building societies to
hypothetical interest rate increases was largely
due to significant net interest income losses.7
In contrast, the FIA licensees were more robust
to hypothetical increases in interest rates, due
primarily to a higher level of capitalization.
The dollar value of a percentage point to capital
base ratio (DVPP to capital) deteriorated to 11.7
per cent at end-2012, relative to 4.7 per cent
6 Interest rate shocks of increases ranging from 1 100 bps to 1 400 bps are applied to domestic and 100 bps to 350 bps are applied to foreign investment holdings for fair value assessment. Similar interest rate increases are applied to domestic and foreign investments for the net interest income impact. Increases of 100 bps to 400 bps are applied to domestic and 15 bps to 70 bps are applied to foreign non-investment component of the net interest income impact.
7 Re-pricing net gap positions are computed for each re-pricing/maturity bucket as the assets minus liabilities. The change in the market value of net re-pricing assets is evaluated by applying the interest rate shock and duration factor to each re-pricing gap position. The impact on capital adequacy is then evaluated.
at end-2011. This adjustment in the DVPP to
capital ratio reflected increased exposure to
interest rate volatility and a worsening in the
system’s ability to absorb interest rate shocks
(see Chart 27).8 Despite this, stress test results
indicated that the banking system’s buffer
capital was sufficient to absorb the impact of
hypothetical shocks.
3.3.5. Liquidity (Funding) Risk Stress Tests
At end-2012, the banking system remained
resilient to a hypothetical sudden withdrawal
of deposits, relative to end-2011, due to strong
liquidity positions. Following a contemplated
40.0 per cent reduction in deposits, the post-
shock CAR for the banking system was
unchanged at 14.1 per cent.9 This result was
similar to end-2011, where the post-shock CAR
8 DVPP is the loss in net interest income generated from 100 bps shocks to the system’s foreign and domestic securities portfolio and reported as a percentage of the system’s capital base.
9 Hypothetical reductions are applied directly to the deposit base of the bank. Assets are assumed to be liquidated, in order of liquidity, so as to satisfy the demand. Haircuts are applied to non-liquid assets to satisfy further declines in deposits. The resulting impact on capital adequacy is then evaluated.
Chart 27 Banking System Quarterly Interest Rate Risk Stress Test Results 9

- 90 -Financial System Surveillance and Policy
Bank of Jamaica
for the banking system was unchanged at 15.9
per cent (see Chart 28). The system remained
resilient in spite of lower liquid assets to total
assets ratio of 22.5 per cent at end-2012,
relative to a ratio of 23.1 per cent at end-2011.
For the review period, the commercial banks,
building societies and FIA licensees maintained
quarterly average liquid asset to deposit ratio of
37.2 per cent, 19.6 per cent and 27.9 per cent,
respectively.
3.3.6. Aggregate Stress Test Results
The aggregate stress tests assessed the
simultaneous impact of increases in interest
rates, currency depreciation, credit quality
deterioration and deposit outflow as well as the
impact of increasing risk weights on foreign
currency-denominated securities on the CAR
for the banking sector. The aggregate stress
test assumptions were:
• Increases in interest rates of 1100 bps
and 100 bps on domestic investment
assets & liabilities and other assets &
liabilities, respectively;
• Increases in interest rates of 100 bps and
10 bps on foreign currency investment
assets & liabilities and other assets &
liabilities, respectively;
• 10.0 per cent depreciation in the JMD/
USD exchange rate;
• 100.0 per cent of past due performing
loans (1 month to under 3 months)
becoming non-performing; and
• 10.0 per cent reduction in deposits.
Over the review period, in response to the
shocks, excluding the risk weights adjustments
on foreign currency GOJ securities, the CARs
of the DTIs declined by an average of 3.6
percentage points per quarter, relative to the
Chart 28 Banking System Quarterly Funding Risk Stress Test Results

- 91 -
Annual Report 2012
Financial System Surveillance and Policy
average decline of 4.2 percentage points for
2011 (see Chart 29).10 The decline in the CARs
of DTIs as a result of these hypothetical shocks
trended downwards throughout the year,
ending the year below the prudential minimum
benchmark (see Table 43).
3.3.7. Early Warning System (EWS) Results11
The macro-financial index (MaFI) improved
by 4 points to 9.0 points at end-2012 and
was well below the 1996-1998 financial crisis
threshold value of 44.0 points (see Chart 30).
10 The original target date of end-March 2012 for the 100.0 per cent risk weights on foreign currency-denominated GOJ securities was revised to end-June 2012. This occurred as a result of a temporary pause at end-June 2011 due to implementation challenges mainly for one of the non-bank financial sectors which resulted in unadjusted risk weights of 50.0 per cent relative to end-March 2011. The phased implementation of risk weights on foreign currency-denominated GOJ securities resumed at end-September 2011.
11 The BOJ Early Warning System (EWS) for financial stability monitors macro- and micro-economic indicators of the banking sector via a non-parametric approach to signal banking sector vulnerability. The signal is based on EWS scores for each indicator, which is computed based on the number of standard deviations of each indicator from its ‘tranquil period’ mean value. The tranquil period refers to an eight quarter period of relative stability that precedes the beginning of a signalling window. The scores range from 0 to 5 with a score of 5 representing the most severe signal. Banking sector vulnerability at a point in time is determined by the trend in the aggregate EWS score (or index) over the previous eight quarters (signalling window).
This favourable performance was reflected in
improvements in volatility indicators, growth
in private sector credit and fiscal measures,
the impact of which was partially offset by
deterioration in the performance of the M2
to net international reserves indicator which
increased to 5 points relative to 3 points at end-
2011.12
Consistent with the improvement in the MaFI,
the micro-prudential indices (MiPIs) for the
commercial banks, FIA licensees and building
societies declined to 29.0 points, 32.0 points and
44.0 points, respectively, from 30.0 points, 44.0
points and 59.0 points recorded at end-2011.
The decrease in the indices for the three sectors
was broadly due to improvements in balance
sheet structure and asset quality indicators.
The outturn of the MiPI for commercial banks
during 2012 primarily reflected improvements
12 The fiscal measures relate specifically to the national debt to GDP and external debt to GDP indicators.
Chart 29 Banking Sector: Impact on CAR after the Aggregate Stress Test Scenarios and Risk Weights on Foreign GOJ Securities

- 92 -Financial System Surveillance and Policy
Bank of Jamaica
in weighted ratios of loans to capital, non-
performing loans to assets, non-performing
loans to total loans and provision for loan
losses to total assets (see Chart 31).13 However,
the impact of these improvements on the MiPI
was partially offset by deterioration in some
profitability indicators, partly reflective of the
continued weakness in the domestic economy.
Specifically, signals from the net income to total
assets and the interest income to asset indicators
13 Indicators included in the micro-prudential indices are weighted by asset size.
continued to deteriorate as interest income on
both loans and investments remained weak.
With respect to the building societies, the
MiPI mainly reflected improvement in the
performance of asset quality indicators
(see Chart 32). In particular, there were
improvements in the weighted ratios of non-
performing loans to total loans and provision
for loan losses to total assets. However, there
was deterioration in balance sheet indicators:
deposits as a share of assets, deposits and repos
Table 43
Chart 30: Macro-Financial Index & Sub-Components: 2011 - 2012
DTIs Quarterly Aggregate Stress Test Results
Mar-11 Jun-11 Sep-11 Dec-11 Mar-12 Jun-12 Sep-12 Dec-12
Original CAR (%) 17.7 17.9 16.3 15.9 15.4 14.7 14.5 14.1
Post-shock CAR (%) 11.9 12.2 14.0 12.8 12.8 11.2 10.5 9.6
Post-shock CAR + risk weights on foreign currency GOJs 11.3 11.6 12.9 12.4 12.6 - - -
Change in CAR (pp.) -5.7 -5.7 -2.4 -3.1 -2.6 -3.5 -4.0 -4.5

- 93 -
Annual Report 2012
Financial System Surveillance and Policy
to total assets, investments to assets and liquid
assets to total assets for the review period. The
improvement in the MiPI for FIA licensees
mainly reflected lower signals for asset quality
and balance sheet indicators (see Chart 33).
Chart 31: Micro-Prudential Index & Sub-Components for Commercial Banks: 2011 - 2012
Chart 32: Micro-Prudential Index & Sub-Components for Building Societies: 2011 - 2012

- 94 -Financial System Surveillance and Policy
Bank of Jamaica
Chart 33: Micro-Prudential Index & Sub-Components for FIA Licensees: 2011 - 2012
- 95 -
Annual Report 2012
Financial System Surveillance and Policy
3.4. Financial Legislation
3.4.1. Financial Legislation Passed in 2012
No new legislation was passed in 2012
3.4.2. Pending Amendments to Financial
Legislation
3.4.2.1. The Bank of Jamaica Act
The first draft Bill to amend the Bank of
Jamaica Act to give the BOJ the institutional
responsibility for stability of Jamaica’s financial
system was circulated to stakeholders for
feedback in 2012. The amendments to the Act
will:
1. Outline the mandate of the Bank
of Jamaica in relation to its role of
maintaining financial system stability;
2. Mandate the establishment of a
Financial System Stability Committee
to coordinate the activities pursuant
to the objective of financial system
stability;
3. Expand the regulatory oversight of the
Bank of Jamaica to financial institutions
whose operations are deemed to be of
systemic importance;
4. Grant the necessary powers to the Bank
of Jamaica to obtain information from
these financial institutions that will
allow for the assessment of risks to the
financial system (including the powers
of inspection; powers to demand
information);
5. Give the Bank of Jamaica the necessary
powers to direct and impose measures
to mitigate and control these risks
(including the extension of liquidity;
and powers to issue Prescriptive Rules,
Standards and Codes pertinent to the
oversight of the stability of the financial
system);
6. Mandate the establishment of a Central
Financial System database; and
7. Mandate the publication of a financial
stability report within three (3) months
after the end of each financial year.
3.4.2.2. The Cooperative Societies
(Amendment) Bill
The Cooperative Societies Amendment Bill is
expected to be presented to Parliament jointly
with the Bank of Jamaica (Credit Union) draft
Regulations. This amendment will, among other
things, bring credit union cooperative societies
under the regulatory ambit of the Minister of
Finance and the Bank of Jamaica. Accordingly,
this Bill includes provisions that will restrict
the deposit-taking activities of cooperative
societies to those cooperative societies, which
operate as credit unions.
3.4.3. Omnibus Banking Bill
During 2012, the Bank of Jamaica continued
the process of reviewing legislation governing
the operations of licensed deposit-taking
- 96 -Financial System Surveillance and Policy
Bank of Jamaica
entities (specifically, the Banking Act, Financial
Institutions Act and the BOJ (Building Societies)
Regulations, with a view to combining these
pieces of legislation into one consolidated
statute (the Omnibus Statute). The licensing
and deposit-taking provisions of the Building
Societies Act will also be transferred from the
Building Societies Act to the Omnibus statute.
This followed the approval by Cabinet of the
recommendations, in August 2010, regarding
the development of Omnibus legislation which
will govern the licensed deposit-taking sector.
The consolidation of legislative obligations
into one statute should remove any existing
inconsistencies in the regulatory regime
contained in the various statutes and ensure a
more synchronized progression of updates to
the laws governing the deposit-taking sector.
This initiative is also intended to implement
enhancements regarding consolidated and
conglomerate supervision that will bring the
regulation of the banking business in line with
the earlier international requirements such
as Basel II as well as with the more recently
issued Revised Basel Core Principle, i.e
Basel III.1 The Bank published the Industry
Consultation Paper on the proposed Omnibus
Bill on its website on 31 December 2012 and
formally invited relevant stakeholders to review
the paper and provide feedback to the Bank
by 04 March, 2013. This paper will inform the
subsequent submission to Cabinet in order to
commence the legislative process.
1 The Basel Core Principles are the global standards for prudential regulation and supervision of banking systems.
3.4.4. Pending Financial Regulations
Clarifying Note: With the exception of
the BOJ (Credit Union) Regulations, if the
proposed Omnibus Banking Bill is finalized
before the pending financial regulations
which are discussed below, then the process of
promulgating these regulations will be replaced
by the promulgation of these regulations under
the Omnibus Statute. The BOJ (Credit Unions)
Regulations, however, remains an independent
legislative initiative that will be finalized
separately from the Omnibus Banking Bill.
3.4.4.1. The Banking (Form of Application
Regulations and The Financial
Institutions (Form of Application)
Regulations
There were no updates regarding The Banking
(Form of Application) Regulations and The
Financial Institutions (Form of Application)
Regulations during 2012. The details regarding
these Regulations were outlined in the 2010
Annual Report (Please refer to the Clarifying
Note above).
3.4.4.2. The Bulding Societies (Licence Fees)
Regulations
These regulations will be revised to bring the
fees payable in line with the applicable fees as
per the 2003 Licence Fees Regulations under
the Banking Act and the Financial Institutions
Act.(Please refer to the Clarifying Note above).
3.4.4.3. The Banking (Qualification of
Auditors) Regulations

- 97 -
Annual Report 2012
Financial System Surveillance and Policy
These regulations will create a framework for
ensuring that auditors, who are proposed as the
statutory auditors of financial institutions, are
independent of the financial institutions being
audited. (Please refer to the Clarifying Note
above.)
3.4.4.4. The Banking (Credit Classification
and Provisioning) Regulations
These regulations will formally impose the
measures that banks are required to take in
assessing credit, taking security and making
provisions for the possibility of default (Please
refer to the Clarifying Note above).
3.4.4.5. The Bank of Jamaica Credit Union
Regulations
These regulations will bring the operations of
credit unions fully under the Bank of Jamaica’s
prudential supervisory regime. These
regulations will therefore, among other things,
cover licensing, capital, reserves, prohibited
business, remedial and intervention processes
and the role of specially authorized credit union
(Please refer to the Clarifying Note above).
3.4.5. Non-Financial Legislation Passed in
2012
In relation to the AML/CFT framework and
the financial system, there were no legislative
amendments in 2012 which impacted the
corresponding obligations of the deposit-taking
industry.
3.4.6. Pending Non-Financial Legislation
3.4.6.1. The Proceeds of Crime Act (POCA)
During 2012, amendments to address
deficiencies identified in relation to the
suspicious transactions reporting obligations
were ongoing. In addition, the POCA was
also being amended to ensure consistency
in definitions of terms with those used in the
Financial Investigations Division Act (i.e. FIU
Act). Amendments were also being made to
outline the powers that competent authorities
designated under the POCA will have in
relation to their role of monitoring compliance
of financial institutions and designated non-
financial businesses and professions (DNFBPs)
with the applicable AML/CFT requirements
under the POCA.
The (Money Laundering Prevention)
Regulations under the POCA were also being
amended to address deficiencies identified
and emerging issues in Jamaica’s anti-money
laundering framework, including the following
matters:-
a) Customer due diligence requirements;
b) Emerging technology and non-face-to-
face business;
c) Customers conducting business through
third parties and introducers; and
d) Record-keeping obligations.
The relevant Cabinet Submission is being
prepared.
- 98 -Financial System Surveillance and Policy
Bank of Jamaica
3.4.6.2. The Terrorism Prevention
(Amendment) Bill
Cabinet approved the request for drafting
instructions to be issued to effect further
amendments to the Terrorism Prevention Act
(FATF) as well as strengthen the confiscation
mechanisms under this Act in order to bring them
more in line with the FATF Recommendations.
The Bill also includes amendments to allow for:
a) Jamaica’s ratification of The
International Convention for the
Suppression of Acts of Nuclear Terrorism
of 04 September 2005;
b) Jamaica’s accession to the 2005
amendment to the Convention on the
Physical Protection of Nuclear Material;
c) The 14 October 2005 amendment to
the Protocol to the Convention for the
Suppression of Unlawful Acts Against
the Safety of Maritime Navigation; and
d) And 14 October 2005 Protocol to the
Convention for the Suppression of
Unlawful Acts Against the Safety of
Fixed Platforms.
The Bill also seeks to effect amendments to
the related Terrorism (Reporting Entities)
Regulations under the TPA to address
deficiencies identified and emerging issues
in Jamaica’s counter terrorism financing
framework, including the following matters:-
a) Customer due diligence requirements;
b) Emerging technology and non-face-to-
face business;
c) Customers conducting business through
third parties and introducers;
d) Record-keeping obligations.
In 2012, the draft Bill was circulated to
stakeholders for comment.
3.4.6.3. The Financial Investigations
Ammendment (FIDA) Bill
In December 2012, the Cabinet approved
the Submission to amend the Financial
Investigations Act (FIDA) to, among other
things, incorporate provisions that expressly
establish the FID’s ability to function with
operational independence and autonomy
and the FID’s ability to cooperate with its
international counterparts.2 These amendments
are critical to the successful completion of the
Financial Investigations Division’s membership
application to Egmont.3
2 Under the new FATF 40 Recommendations – the interpretative note to r 29 (formerly r26) reflects that the FIU must among other things have operational independence, operate free from undue influence or interference and should apply for membership in the Egmont Group.
3 “The Egmont Group is an informal group of financial intelligence units (FIUs) established in 1995. The group was so named for the location of the first meeting at the Egmont-Arenberg Palace in Brussels. The goal of this group is to provide a forum for FIUs to improve support to their respective national anti-money laundering programmes. This support includes expanding and systemizing the exchange of financial intelligence information, improving expertise and capabilities of personnel of such organizations, and fostering better communication among FIUs through application of technology.” Source: Information Paper on FIUs and the Egmont Group – (See the FATF web site at www.fatf-gafi-org or see www1.oecd.org/fatf/ctry-orgpages/org-egmont_.htm)
- 99 -
4. Financial Market Operations
4.1. Open-Market Operations4.1.1. Bank of Jamaica Liquidity Management
Operations
During 2012, the Bank continued to administer
liquidity management operations primarily
through the issuance of 30-day Certificates of
Deposit (CDs). However, during the December
quarter the Bank temporarily added three
special variable rate (VR) instruments to absorb
excess liquidity. The liquidity management
operations in 2012 were conducted in an
environment characterized by uncertainty
surrounding the timing and content of an
agreement with the IMF on Jamaica’s medium-
term macroeconomic programme.
Liquidity management operations focused on
the daily offering of open market securities,
at interest rates (30-day and overnight) which
were in effect since the September 2011
quarter. Furthermore, with heightened market
uncertainties, particularly during the second
half of the year, liquidity management was also
effected through net foreign currency sales.
Nonetheless, there was overall net liquidity
injection from net maturity on CDs, which was
partially offset by absorption via net foreign
currency sales. This occurred in spite of the
Bank’s offer of three variable rate CDs, which
were temporarily added to the existing menu of
open market instruments during the December
2012 quarter. Consequently, for 2012, there was
a net liquidity injection of $27 437.8 million
into the financial system from the Bank’s
operations. This liquidity injection reflected $41
241.2 million through open-market operations
(OMOs), partly offset by the withdrawal of $11
683.5 million and $2 119.9 million from net
foreign currency sales and payments for cash
reserve requirements, respectively (see Table
44).
In general, for 2012, the liquidity emanating
from the Bank’s operations facilitated
investments on new GOJ debt issues. Of note,
there were less frequent coupon payments
on GOJ debt instruments, consequent on
the implementation of the Jamaica Debt
Exchange (JDX) in 2010. In addition, there
were continuous transfers of GOJ balances
from commercial banks to accounts at the
Central Bank as the government implemented
its Central Treasury Management System to
consolidate and centralize its accounts.
The March 2012 quarter was characterized by
generally stable financial market conditions. In
this regard, liquidity management resulted in
the net issue of $24 100.4 million in CDs, which
was financed by the seasonal net reflows of cur-
rency as well as net payments on GOJ debt in-
struments. Additional financing emanated from
the injection of $3 971.3 million from net for-
eign currency purchases by the Bank. In the

- 100 -Financial Market Operations
Bank of Jamaica
context of these activities, for the March 2012
quarter, the re-investment rate on 30-day CDs
amounted to 108.2 per cent relative to 100.5
per cent for the March 2011 quarter and 88.5
per cent for the December 2011 quarter (see
Table 45). Consequent on these operations, the
net absorption from the financial system for the
quarter amounted to $21 157.2 million.
Liquidity management during the June,
September and December quarters was
conducted in a more uncertain macroeconomic
environment, relative to the March quarter.
This uncertainty related to the negotiations
with the IMF on Jamaica’s medium-term
macroeconomic programme. Consequently,
concerns among investors increased as the year
progressed. These concerns were manifested in
Table 44
Table 45
March June September December Total
- Net issues (+)/net mat. (-) on Certificates of Deposit 24 100.4 -33 913.5 -7 760.8 -22 729.1 -40 303.1
- Net Repurchase Issue(-) / net Repurchase Maturity (+)
0.2 1.6 60.1 -1 000.0 - 938.1
Net OMO Absorption (+) / Net OMO Injection (-)
24 100.6 -33 911.9 -7 700.7 -23 729.1 -41 241.2
Net Sale(+) / net Purchase(-) of Foreign Exchange
-3 971.3 2 735.4 14 590.7 -1 671.3 11 683.5
Net increase (+)/net Decrease (-) in Domestic Cash Reserve 1 027.9 332.8 - 170.4 929.6 2 119.9
Overall Absorption (+) / Injection (-)
21 157.2 -30 843.7 6 719.6 -24 470.9 -27 437.8
BANK OF JAMAICA LIQUIDITY MANAGEMENT OPERATIONS - 2012
Data for CDs include principal and net interest payments made during the year.
Year QuarterTake-up (J$Mn)
Take-up Ratio (%)
Maturity (J$mn)
Maturity Ratio (%)
Net Issue(+)/net Maturity(-)
(J$mn)Reinvestment
Rate (%)
March 357 000.7 26.4 355 331.8 25.4 1 668.9 100.5June 375 510.6 27.8 368 813.2 26.4 6 697.4 101.8
September 348 030.8 25.8 367 422.9 26.3 -19 392.1 94.7December 270 431.4 20.0 305 616.5 21.9 -35 185.1 88.5
Total 1350 973.6 1397 184.4 -46 210.9 96.7
March 285 992.0 34.7 264 260.3 30.5 21 731.8 108.2June 223 523.0 27.1 251 812.4 29.1 -28 289.3 88.8
September 183 053.4 22.2 199 247.8 23.0 -16 194.4 91.9December 131 883.4 16.0 150 504.6 17.4 -18 621.2 87.6
Total 824 451.9 865 825.1 -41 373.2 95.2
INVESTMENT PROFILE OF BOJ'S 30-DAY CD (2011-2012)
2012
2011

- 101 -
Annual Report 2012
Financial Market Operations
net unwinding on the 30-day CDs for the June,
September and December quarters, concurrent
with an increase in the average turnover on
the overnight Special Deposit placements. In
this regard, the average turnover on Special
Deposits increased to $12 371.21 million for the
December quarter from $7 138.8 million for the
March 2012 quarter (see Chart 34).
In the context of these developments, there was
an overall net injection of $48 595.0 million for
the last three quarters into the financial system,
largely emanating from net injection of $65
341.7 million through OMOs (see Table 44).
This net injection through OMOs reflected a
reduction in the average re-investment rate on
30-day CDs to approximately 89.4 per cent for
each quarter relative to the March quarter. The
injection through OMOs occurred despite the
offer of three special variable rate CDs which
were aimed at elongating OMO maturities
beyond the 30-day horizon. The VR instruments
comprised of a 49-day CD with a limited offer
of $6 000.0 million and unlimited offers on
the 184-day and 364-day CDs (see Table 46).
These instruments received total nominal
subscriptions of $8 179.0 million during the
offer period. Against this background, there was
a reduction in the outstanding stock of CDs, to
$48 674.5 million from $98 899.8 million as at
end-2011.
The net liquidity injected from OMOs in the
last three quarters was partially offset by the
absorption of $15 654.8 million from the net
sale of foreign currency, in contrast to the
net purchase in the March quarter. This net
sale reflected increased demand for foreign
currency in the context of the heightened
uncertainty. Additional absorption emanated
from the build-up of deposits on GOJ accounts
within the Bank.
4.1.2. Primary Dealer Performance &
Administration
During 2012, the Bank continued to issue
0.00
2,000.00
4,000.00
6,000.00
8,000.00
10,000.00
12,000.00
14,000.00
Mar/11 Jun/11 Sep/11 Dec/11 Mar/12 Jun/12 Sep/12 Dec/12
J$ M
illion
s
Q uarter-ended
Chart 34 Average Daily Turn-over of Overnight Certificate of Deposit

- 102 -Financial Market Operations
Bank of Jamaica
CDs through the JamClear Central Securities
Depository (JamClear®-CSD) to Primary
Dealers (PDs) and commercial banks. PDs
continued to dominate the subscriptions to
CDs in 2012, accounting for 62.6 per cent of
the issues, relative to 56.8 per cent for 2011.
Consequently, the PDs share of the outstanding
stock of CDs increased to 85.4 per cent from
57.6 per cent at end-2011.
While the Primary Dealers’ share of the
outstanding stock of CDs increased for 2012,
there was a net redemption of CDs by these
entities for each of the final three quarters (see
Charts 35 & Chart 36). This net redemption
reflected the preference among investors for
the overnight instrument. Concurrently, there
was a reduction in the PDs’ participation in
GOJ debt offers to 76.3 per cent at end-2012
from 91.3 per cent at end-2011.
The number of designated PDs was unchanged
at 11 for 2012. This reflected the voluntary
withdrawal of one designee owing to the merger
of its operations with those of another entity
and the granting of the PD designation to a new
applicant. These developments occurred in the
September 2012 quarter. A total of 9 persons
were assessed under the Bank’s ‘Enhanced Fit
& Proper’ Criteria. These assessments were
Instrument Name: BOJ 49-Day VR CD BOJ 182-DAY VR CD BOJ 364-Day VR CDSubscription Date: 31 Oct. 2012 31 Oct. 12 - 05 Nov. 12 31 Oct. 12 - 05 Nov. 12Initial Coupon (%) 6.81 7.18 7.38Reset Margin (%) 0.60 0.80 1.00Tenor (Days) 49 182 364Offer Amount (MN) 6 000.0 Unlimited UnlimitedCoupon Frequency: Monthly Quarterly QuarterlyMaturity Date: 19 Dec. 2012 1 May. 2013 30 Oct. 2013
TERM SHEETS:BOJ VARIABLE RATE SPECIAL INSTRUMENTSTable 46
0.0%
10.0%
20.0%
30.0%
40.0%
50.0%
60.0%
70.0%
80.0%
90.0%
2012 2011
March Qtr. June Qtr. September Qtr December Qtr.
Chart 35 Primary Dealer Share of CDs as at end-Quarter

- 103 -
Annual Report 2012
Financial Market Operations
conducted in accordance with the policy for
designating new entities as well as in relation
to the requirements for the annual renewal of
the PD designation.
4.2. International ReservesThe gross foreign assets (GFA) of the Bank
declined by US$839.6 million, to US$1
980.8 million at 31 December 2012, largely
due to Government debt payments and the
Central Bank’s foreign exchange intervention
operations (see Table 47). The decline in the
GFA was reflected in all quarters, with the most
significant reductions occurring in the June
and September quarters (see Table 48).
The net international reserves (NIR) of the BOJ
mirrored the decline in the GFA, recording a
reduction of US$840.5 million to US$1 125.6
million at 31 December 2012 (see Table 48). The
Bank’s foreign liabilities increased to US$855.2
million at 31 December 2012 from US$854.3
million at 31 December 2011. The expansion
reflected an increase in the US dollar value
of the SDR holdings of the Bank to US$832.7
million as at 31 December 2012 from US$831.8
million as at 31 December 2011.
2012 2011March Qtr. $12,911.16 $5,697.31June Qtr. -$12,603.49 $176.17September Qtr -$6,471.47 -$15,870.93December Qtr. -$8,105.60 -$14,482.12
$(20,000.00) $(15,000.00) $(10,000.00)
$(5,000.00) $-
$5,000.00 $10,000.00 $15,000.00
Chart 36 Primary Dealers Net Performance in CDs
Opening Gross Foreign Assets (GFA) 2 820.4
Inflows 2 025.0
Outflows -2 837.1
Adjustment to GFA /1 -27.6
Closing Gross Foreign Assets 1 980.8
/1 - Unrealized gains/losses on foreign currencies and other investments.
BANK OF JAMAICA GROSS FOREIGN ASSETSAs at 31 December 2012
US$MN
Table 47

- 104 -Financial Market Operations
Bank of Jamaica
4.2.1. Foreign Exchange Inflows and
Outflows
4.2.1.1. Inflows
During 2012, foreign exchange inflows totalled
US$2 025.0 million, reflecting a decline of
US$565.3 million when compared to 2011.
The primary sources of inflows were market
purchases and Government loan receipts which
when combined, accounted for approximately
92.0 per cent of total inflows (see Table 49).
Total market purchases for 2012 amounted
to US$1 419.8 million, a decline of US$289.5
million, relative to 2011. These flows accounted
for approximately 70.0 per cent of total inflows
and reflected US$1 203.0 million and US$216.7
million purchased under the Surrender
Arrangements and through the trading room,
respectively. 1
1 Under the surrender arrangement, Authorised Dealers and Cambios agree to sell to the BOJ a maximum of 15.0 per cent and 25.0 per cent, respectively, of their client purchases. Purchases under the Surrender Arrangement include acquisitions under the Centralised Facility for Foreign Exchange for Public Sector Entities.
GOJ foreign currency loan receipts amounted
to US$442.7 million for the year, declining by
US$325.5 million relative to 2011. The reduction
in GOJ loan receipts reflected the non-receipt
of inflows from multilateral agencies as well
as the inability to access financing from the
international capital market. The receipt of
these flows was conditioned on there being
a programme with the IMF. Consequently,
the primary source of GOJ foreign currency
receipts was the issuance of domestic US dollar
bonds, which raised a total of US$354.0 million.
Foreign currency inflows from the bauxite
sector declined to US$19.5 million from
US$22.8 million in 2011. This decline reflected
lower production levy and tax payments to the
Government, largely due to a decline in bauxite
shipments.
During 2012, the Central Bank accepted
foreign currency deposits from local financial
institutions, resulting in inflows of US$95.0
million. No foreign currency deposits were
placed with the Bank in 2011.
2011 2012
Dec. Mar. Jun. Sep. Dec.
NIR 1 966.1 1 777.1 1 540.4 1 257.8 1 125.6 -840.5
Gross Foreign Assets 2 820.4 2 638.9 2 385.1 2 115.9 1 980.8 -839.6
Foreign Liabilities 854.3 861.8 844.7 858.1 855.2 0.9
BANK OF JAMAICANET INTERNATIONAL RESERVES
(End of Period)
Annual Change (US$)
US$MN
Table 48
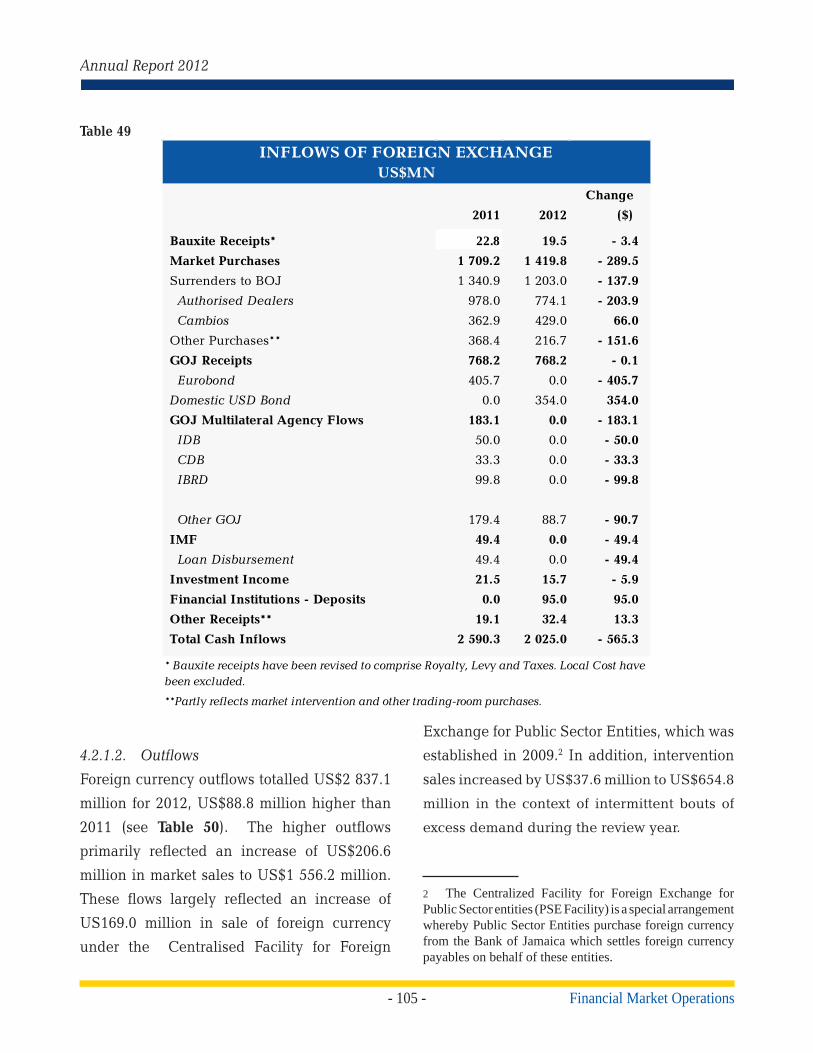
- 105 -
Annual Report 2012
Financial Market Operations
Change
2011 2012 ($)
Bauxite Receipts* 22.8 19.5 - 3.4
Market Purchases 1 709.2 1 419.8 - 289.5
Surrenders to BOJ 1 340.9 1 203.0 - 137.9
Authorised Dealers 978.0 774.1 - 203.9
Cambios 362.9 429.0 66.0
Other Purchases** 368.4 216.7 - 151.6
GOJ Receipts 768.2 768.2 - 0.1
Eurobond 405.7 0.0 - 405.7
Domestic USD Bond 0.0 354.0 354.0
GOJ Multilateral Agency Flows 183.1 0.0 - 183.1
IDB 50.0 0.0 - 50.0
CDB 33.3 0.0 - 33.3
IBRD 99.8 0.0 - 99.8
Other GOJ 179.4 88.7 - 90.7
IMF 49.4 0.0 - 49.4
Loan Disbursement 49.4 0.0 - 49.4
Investment Income 21.5 15.7 - 5.9
Financial Institutions - Deposits 0.0 95.0 95.0
Other Receipts** 19.1 32.4 13.3
Total Cash Inflows 2 590.3 2 025.0 - 565.3
US$MN
* Bauxite receipts have been revised to comprise Royalty, Levy and Taxes. Local Cost have been excluded.
INFLOWS OF FOREIGN EXCHANGE
**Partly reflects market intervention and other trading-room purchases.
Table 49
4.2.1.2. Outflows
Foreign currency outflows totalled US$2 837.1
million for 2012, US$88.8 million higher than
2011 (see Table 50). The higher outflows
primarily reflected an increase of US$206.6
million in market sales to US$1 556.2 million.
These flows largely reflected an increase of
US169.0 million in sale of foreign currency
under the Centralised Facility for Foreign
Exchange for Public Sector Entities, which was
established in 2009.2 In addition, intervention
sales increased by US$37.6 million to US$654.8
million in the context of intermittent bouts of
excess demand during the review year.
2 The Centralized Facility for Foreign Exchange for Public Sector entities (PSE Facility) is a special arrangement whereby Public Sector Entities purchase foreign currency from the Bank of Jamaica which settles foreign currency payables on behalf of these entities.

- 106 -Financial Market Operations
Bank of Jamaica
Foreign currency payments on behalf of the
Government declined to US$1 242.4 million
from US$1 365.5 million during 2011. The
reduction in payments largely reflected lower
amortization payments during 2012 (see Table
49).
4.3. Reserve ManagementAs at 31 December 2012, the gross international
reserves held by the Bank of Jamaica was
US$1 980.8 million compared to US$2 820.4
million as at 31 December 2011. Throughout
the year, the portfolio was managed in
accordance with the Bank’s Foreign Investment
Policy which informed the operating guidelines
employed, the strategies devised and the risk
management arrangements that were observed.
There were no changes to the objectives of the
reserve management function as approved by
the Board of Directors to:
I. Support and maintain confidence in
monetary policy;
II. Provide the capacity to support the
orderly functioning of the foreign
exchange market;
III. Absorb shocks brought on by crisis
in the domestic and international
economies; and
IV. Enhance the confidence of the
international capital markets by
demonstrating that Jamaica can
meet its external obligations.
To realize these objectives, the reserves
continued to be managed with a bias towards
capital preservation and liquidity maintenance,
with income maximization as a secondary
objective.
Table 50
Change
2011 2012 (US$)
GOJ Payments 1 365.5 1 242.4 -123.1
Debt 1279.1 1 129.6 -149.5
Principal 723.9 605.1 -118.7
Interest 555.2 524.5 -30.8
Other Payments 86.4 112.8 26.4
Intervention 617.2 654.8 37.6
Public Sector Facility 732.5 901.4 169.0
Other Payments* 33.1 38.5 5.3
Total Cash Outflows 2 748.3 2 837.1 88.8
OUTFLOWS OF FOREIGN EXCHANGEUS$MN
*- Includes net prudential reserve outflows and Central Bank payments for notes and coins.

- 107 -
Annual Report 2012
Financial Market Operations
4.3.1. Portfolio Distribution
No new class of assets was added to the
portfolio in 2012; consequently its composition
throughout the year was similar to that of 2011
(see Table 51). The portfolio continued to be
dominated by money-market instruments,
as opportunities for investing in the bond
market remained limited. Bond acquisitions
were confined to placements in AAA/AA+
rated securities of governments, agencies of
governments and supranational entities as well
as money market investments in P-2/A-1 and
Aa1/AA+ rated financial institutions.
The continued dominance of placements in
money market instruments was aimed primarily
at mitigating reinvestment risk. In order to
reduce the risk of exchange rate losses the
portfolio was managed with a bias towards US
dollar denominated investments with 75.3 per
cent of the portfolio, excluding the Allocation
of Special Drawing Rights, held in US dollar
denominated securities.
4.3.2. Investment Climate
The investment climate in 2012 was largely
similar to that of 2011 and was characterized by
low interest rates and high credit risk. During
the year, a range of intersecting and disparate
factors influenced the financial markets. The
most significant of these were:
I. The sovereign debt crisis in the
Eurozone, which was manifested in
the slowdown of economic growth
across the region and the need to
bail out banks in the most severely
affected countries;
II. Downgrades of the credit worthiness
of a number of financial institutions
by the rating agencies due to
exposure to credit risk associated
with the Eurozone;
III. Uncertainty surrounding the
outcome of the Presidential election
in the USA, which could have an
impact on the financial markets;
IV. Fears that lawmakers in the USA, by
01 January 2013, would not agree
on a compromise to avoid the “fiscal
Table 51
Asset Classes
US$MN % US$MN %
Money Market Investments 1 780.6 63.1 1 174.1 59.3
Bond Holdings 569.3 20.2 374.7 18.9
External Fund 140.1 5.0 141.1 7.1
Total Funds Invested 2 490 88.3 1 689.9 85.3
Allocation of Special Drawing Rights 330.4 11.7 290.9 14.7TOTAL 2 820.4 100.0 1 980.8 100.0
DISTRIBUTION OF FOREIGN ASSETSas at 31 December
2011 2012

- 108 -Financial Market Operations
Bank of Jamaica
cliff”, which refers to the expiration
of a number of Bush-era tax laws.
This would substantially affect taxes
and budgetary spending, that could
adversely affect that country and
the rest of the world; and
V. The Federal Reserve Bank System
maintaining interest rates at
historically low levels (0%-0.25%)
and indicating that this policy would
be maintained for an additional two
years.
These factors resulted in volatile financial
markets, with the bench-mark 10-year US
Treasury yield reaching a high of 2.39 per cent
in March 2012. However, by end-July the
yield was at a historic low of 1.43 per cent but
increased to 1.78 per cent by the end of the year.
In addition to the challenging financial market
environment, growth in the US economy
remained sluggish although showing signs
of real improvement as the housing market
began to recover, energy production expanded,
credit standards eased and the labour market
improved. Further, the rates of growth of major
economies fell below forecast particularly those
for China, India and Germany.
4.3.3. Investment Strategy
In response to the challenging market
conditions, the Bank maintained a defensive
investment strategy throughout the year.
Emphasis was placed on high quality
money and capital market investments. The
low interest rates, coupled with increased
uncertainty in the markets and credit ratings
downgrades of some of the Bank’s counter-
parties significantly influenced the decision
to retain an overweight position in the short-
term investments with increased placements
at the Bank for International Settlements and
the Federal Reserve Bank of New York. In
this regard, the overall portfolio duration was
shortened, reducing the Bank’s exposure to
interest rate risk.
The earning capacity of the portfolio was also
adversely affected by a limited supply of bonds
and small issue size within the investment grade
dictated by the Bank’s Foreign Investment
Policy. However, the Bank was able to maintain
a similar proportion of the portfolio in fixed rate
instruments, in addition to extending the tenor
on money market placements.
4.3.4. Portfolio Performance
Average income earning assets for the year
was US$2 339.0 million, which was US$661.0
million or 21.2 per cent below budget and 22.0
per cent lower than in 2011 (see Table 52).
Portfolio income of US$16.2 million was US$5.0
million or 23.7 per cent lower than in 2011.
The average yield on the portfolio was 0.69 per
cent per annum in 2012, compared to 0.71 per
cent in 2011, reflecting the continued fall in
Treasury yields across major financial markets,
which affected both capital and money market
investments.

- 109 -
Annual Report 2012
Financial Market Operations
Table 52
Earnings % of Earnings % of
US$MN Earnings US$MN Earnings
Money Market Investments 6.9 32.7 3.4 21.0
Bond Holdings 13.1 61.7 11.0 67.9
External Funds 1.2 5.6 1.8 11.1
Total 21.2 100.0 16.2 100.0
Average Income Earning Assets 3 000.0 2 339.0
Rate of Return (%) 0.71 0.69
FOREIGN INVESTMENT INCOMEFor the Years Ended 31 December 2011 & 2012
2011 2012
Assets


- 111 -
5. Payment System Oversight
is scheduled for completion in 2013.
In accordance with the Bank’s commitment,
the Payment System Oversight Policy and the
JamClear-RTGS Access Policy were published
during 2012. These policies are intended to
inform payment systems stakeholders on the
principles and criteria that inform execution
of the Bank’s oversight function and access
to JamClear-RTGS, a systemically important
payment system.
5.2. Retail Payment Systems
Developments
5.2.1. Electronic Retail Payment Services
In mid-year, the Guidelines for Electronic
Retail Payment Services was published for
stakeholders’ comment prior to implementation.
This was in keeping with the collaborative
approach to payment systems development and
the Bank’s commitment to engage stakeholders
in guiding the process of development and
innovation while promoting safety and
efficiency in the sub-sector.
The Guidelines provide the framework that
will support the implementation of innovative
electronic retail payment services which will
foster and maintain public trust and confidence
in electronic means of payment, while at the
5.1. Background
During 2012, the Bank continued to ensure the
safety, efficiency and security of the National
Payment System (NPS). This included daily
clearing and settlement operations which were
executed in accordance with agreed rules and
operating guidelines. In addition, the Bank
continued to strengthen its oversight capacity
as well as the implementation of phase 2 of the
Payment Systems Reform Programme. Phase 2
initiatives consist of:
• RetailPaymentsSystemReform;
• GovernmentPaymentsReform;and
• ElectronicTradingPlatformforFixed
Income Securities.
The strengthening of the oversight capacity
included the adoption of the revised
international standards for payments and
securities settlement systems, which are now
consolidated and updated to the Principles for
Financial Market Infrastructures (PFMIs). This
consolidation and broadening is to ‘facilitate
the clearing, settlement, and recording of
monetary and other financial transactions that
can strengthen the markets they serve and play
a critical role in fostering financial stability’. The
PFMI standards incorporates the provisions in
the previous standards for securities settlement
and payment systems as well as standards
for Central Counterparties (CCPs) and Trade
Repositories. Full implementation of the PFMIs

- 112 -Payment Systems Oversight
Bank of Jamaica
to be migrated to the JamClear-RTGS from
the ACH during 2012. The decline in large
value payments cleared in the ACH resulted
in a further reduction of the settlement risks.
The review of the remaining settlement risks
indicated that a further reduction in the
value threshold was required and as such,
the threshold was lowered to $3.0 million in
April. This reduction was in accordance with
the phased approach previously agreed with
the commercial banks. The final review of the
value threshold will occur in 2013 when it is
expected that further progress will be made
towards full implementation of the $1.0 million
threshold for payments settled on a deferred
net settlement system through the ACH.
5.2.5. Fixed Income Trading Platform
The project implementation was initiated in
the last quarter of 2012, with the formation
of the Market User Group (MUG) comprised
of representatives from the Jamaica Stock
Exchange, Financial Services Commission
(FSC), the Ministry of Finance, the Jamaica
Securities Dealers Association and the Bank of
Jamaica. At end-2012, a detailed project plan
was tabled and agreed by the MUG.
5.3. Payment Systems Activities
5.3.1. JamClear Systems
In 2012, a number of system modifications was
applied to the JamClear systems (JamClear-
RTGS and JamClear-CSD) to enhance security
and efficiency. No major disruptions and
same time promoting financial inclusion.
Entities wishing to be electronic retail payment
services providers must be authorized by the
Bank and will be required to operate within the
parameters of the Guidelines.
5.2.2. Government Payments
In the September 2012 quarter, the first phase
of the automation of Government payments
was implemented. This focused on establishing
arrangements for the GOJ, through the
Accountant General’s Department, to settle
large value and time critical payments in
JamClear-RTGS. It is anticipated that the
execution of large value Government payments
via JamClear-RTGS will further enhance
system safety and efficiency by eliminating the
systemic risk associated with the use of cheques
to settle these transactions.
5.2.3. New Reports
During 2012, a new reporting regime for Bill
Payment Service Providers was implemented
in light of the increasing market activity.
Providers of payments services were required
to submit information on their respective
payment activities on a monthly basis as of July
2012. The main service providers- Bill Express,
Paymaster, Quik & EZ Pay submitted reports,
as required.
5.2.4. Automated Clearing House (ACH)
Value Threshold
Commercial banks comfortably achieved the
targeted threshold for volumes of transactions

- 113 -
Annual Report 2012
Payment Systems Oversight
operational instability occurred as a result of
these modifications. The changes included
improved notifications and warnings relating
to system security as well as an upgrade of the
gateway facility and processing time to improve
efficiency. During the year, the JamClear
systems maintained the benchmark 99.0 per
cent reliability.
5.3.2. Retail Payment Systems and
Instruments1
There was an increase in the use of electronic
payment methods, when compared with use
of cheques in 2012. This increase resulted
from efforts directed at minimizing risks in the
payment system and engendering consumer
confidence in the use of alternate payment
instruments, while maintaining safety and
efficiency. The impact of the changes in the
ACH value threshold was seen in the increased
settlement of large value and time critical
payments in JamClear-RTGS and a decline
in cheques cleared both in the ACH and the
proprietary systems of the commercial banks.
For the review year, there was a notable
increase in ABM and POS transactions through
the increased usage of debit and credit cards
across the Multilink and commercial bank
proprietary systems.2 The increase in ABM 1 Retail Payment Systems include the Automated Clearing House (ACH), Multilink and commercial banks internal proprietary systems. Retail payment instruments include terminals (ABM & POS), cards, cheques, direct debits and direct credits. 2 The Multilink system reflects activity for domestic debit card payments across the respective participants such as commercial banks, building societies and credit unions at Points-of-Sale and ABMs.
usage indicated a possible preference for cash
usage by consumers. This is an area that will be
targeted in the coming year as the Bank seeks
to ensure the security and safety standards for
the NPS.
5.3.3. Cheque Clearing Activities
For 2012, total cheque volumes in the ACH was
7.9 million valued at $1.1 trillion, representing
declines of 7.1 per cent and 20.0 per cent in
volume and value, respectively, relative to
2011. The average ACH cheque was $139 241
in 2012, relative to $177 267 for 2011. There
were 11.4 million cheques valued at $1.5
trillion processed by the proprietary systems
of commercial banks for 2012, representing
declines of 3.3 per cent and 19.5 per cent in
volumes and value, respectively. The average
value of a proprietary cheque processed
declined to $129 932 from $155 984 for 2011.
5.3.4. Electronic Payment Activities
There were direct debits and credits cleared
through the 37 ACH were 1 410 837 valued at
$91.0 billion and represented an increase of
18.9 per cent in volume and a decline of 40.2
per cent in value. This decline in value was
attributed to the ACH value threshold which
limited large value payments, while promoting
the clearing of small value or true retail
payments. This effectively reduced settlement
risk in the ACH. The highest levels of electronic
payments were reflected in the use of debit and
credit cards through the Multilink system and
the proprietary systems of commercial banks.
- 114 -Payment Systems Oversight
Bank of Jamaica
For 2012, the total completed ABM transactions
processed through Multilink was 10 121 425
valued at $56.2 billion, representing an increase
of 3.0 per cent in volumes but a decline of 1.0
per cent in value, compared to 2011. POS
transactions processed totalled 6 027 247 and
were valued at $28.3 billion, representing
declines of 17.0 per cent and 13.0 per cent in
volume and value, respectively, compared to
2011.
The proprietary reports from the commercial
banks, excluding their Multilink payment
activities, indicated an upward trend in
electronic payments generated by debit and
credit card activities during the reporting
period. Of note, credit card payments are not
processed through the Multilink network.
Over the review year, a total of 35.8 million
ABM transactions valued at $331.6 billion were
processed, relative to 29.6 million valued at
$204.3 billion for 2011. Total POS transactions
processed was 13.5 million valued at $103.6
billion, relative to 10.8 million valued at $81.1
billion for 2011.
There were 14.5 million credit card payments
valued at $135.5 billion for 2012. These figures
represented increases of 26.0 per cent and 20.0
per cent in volumes and value, respectively,
relative to 2011.
5.3.5. Instruments and Channels
Debit and credit cards remained the primary
electronic payment instruments in 2012, with
delivery channels remaining ABM and POS
terminals. For the review period, debit and
credit cards in circulation increased by 11.6
per cent and 6.2 per cent, respectively, relative
to 2011. At end-2012, debit and credit cards
in circulation totalled 2.1 million and 208
774, respectively. The total number of ABM
terminals installed by commercial banks was
424 at end-2012, an increase of 1 relative to
2011. There were 16 565 POS terminals at end-
2012, an increase of 15.5 per cent relative to
2011.
5.3.6. Bill Payment Activities
In accordance with the PCSA, for July to
December 2012, 5 132 429 transactions valued
at $39.5 billion were processed in the payment
system. The bill payment providers that
reported were Paymaster, Bill Express, owned
by Grace Kennedy and Quik & EZ Pay owned
by Prime Trust Financial Services.
5.3.7. Clearing of Selected Foreign Currency
Items
The manual clearing process for foreign
cheques drawn on local banks facilitated by
the Bank during 2012, represented cheques
denominated in US dollars, Canadian dollars,
Great Britain Pounds and Euros. Items cleared
locally totalled the equivalent of US$1.9 billion,
a decline of 14.0 per cent when compared to
2011. Of total foreign currency cheques
cleared, US dollar cheques accounted for 97.0
per cent, similar to 2011.

- 115 -
6. Banking Services
System (CTMS) that settles transactions in
the RTGS, the Bank facilitated the training
of the GOJ’s staff and granted them access
to the JamClear-RTGS in September 2012 to
commence the origination of payments. There
were efficiency gains to the system from this
action, as the Government was the single most
significant initiator of large value transactions.
This training enabled the Government to
create its own files in the system, taking full
responsibility for verifying the accuracy and
timeliness of payments.
During 2012, the Bank lowered the ACH value
threshold from $5.0 million to $3.0 million as
part of its risk mitigation strategy of having all
large value transactions settled in the RTGS.
This allowed for the migration of cheque
transactions with values equal to or greater
than $3.0 million from the ACH to the RTGS for
settlement.
The Bank continued to act as participant in
the ACH by negotiating cheques drawn on
commercial banks as well as sending and
receiving electronic files with cheque data,
direct debits and credits to and from the ACH
Operator. In addition, the Bank continued to
effect the settlement of clearing balances on
the accounts of commercial banks, provided
oversight to ensure the efficient operations
of the clearing system and supervised the
6.1. Banking Services
During 2012, the Bank continued to provide an
array of banking services to its customers.1 In the
provision of these services, the Bank operated
the JamClear Real Time Gross Settlement
(RTGS) system, which is a Systemically
Important Payment System (SIPS) in Jamaica.
Additionally, the Bank continued to provide
operational and administrative support to the
Automated Clearing House (ACH), another
SIPS, owned and operated by the seven
commercial banks.
The JamClear RTGS is specifically designed
to clear large value, time critical payments by
financial market participants on accounts held
at the Bank in real time throughout the business
day. Payments settled in the RTGS are final and
irrevocable. The RTGS is fully integrated with
the JamClear Central Securities Depository
(JCSD), thereby facilitating settlement on a
Delivery versus Payment (DvP) basis of all
Government of Jamaica (GOJ) and Bank of
Jamaica securities traded in the domestic
market.
In the context of the Government’s strategy to
implement a Central Treasury Management
1 The Bank’s customers include the Government, licensed financial institutions, primary dealers, selected brokers of the Jamaica Central Securities Depository (JamClear-CSD) and regional central banks.

- 116 -Banking Services
Bank of Jamaica
manual clearing process in order to facilitate
the processing of items that do not qualify for
the ACH. The Bank also supervised the manual
clearing of foreign currency cheques which
were drawn on domestic banks.
6.2. JamClear-CSD
During 2012, the Bank continued to facilitate
the safe and efficient clearing, settlement and
custody of BOJ and GOJ domestically issued
Fixed Income securities, with the exception of
Treasury Bills, electronically in real-time. As
Registrar, the Bank also continued to deliver
registry services including the registration
of new debt issues, dematerialization and
immobilization of securities, on-going
maintenance of ownership records, distribution
of maturity proceeds and interest payments,
withholding tax certificates and audit
confirmations. The total value of securities
held in JamClear-CSD as at end- 2012 was
$848.4 billion and US$1.069 billion compared
to $863.7 billion and US$917.3 million at end-
2011.
JamClear-CSD also provided a wide variety
of depository services including repurchase
and reverse repurchase transactions, pledges,
primary issues, purchase and sale of securities,
free-of-payments and entitlement proceeds.2
Pledges had the highest utilization over the
review period accounting for 37.6 per cent of
the total volumes traded. Entitlement proceeds
and repurchase agreements accounted for
28.6 per cent and 13.3 per cent, respectively
(see Table 53). During the year, the Bank also
ensured that entitlement proceeds were paid at
the start of the business day in JamClear-CSD.
2 Entitlement proceeds include payment of interest and principal..
Table 53
Transaction TypesVolume
2011% of Vol.
Volume 2012
% of Vol.
Delivery Versus Payment 893.0 0.4 432.0 0.2
Free Of Payment 13 212 6.5 12 945.0 6.8
Initial Placement (Primary Issue)
14 237 7.0 12 119.0 6.3
Entitlement Proceeds 59 420 29.0 54 631.0 28.6
Pledges 78 603 38.4 71 767.0 37.6
Repurchase Agreements 23 729 11.6 25 395.0 13.3
Taxation 14 050 6.9 13 299.0 7.0
Sub-total 204 144 99.8 190 588.0 99.7
Bill Payment 479 0.2 489.0 0.3Total 204 623 100.0 191 077.0 100.0
JAMCLEAR-CSD TRANSACTION TYPES by Volume 2011 – 2012
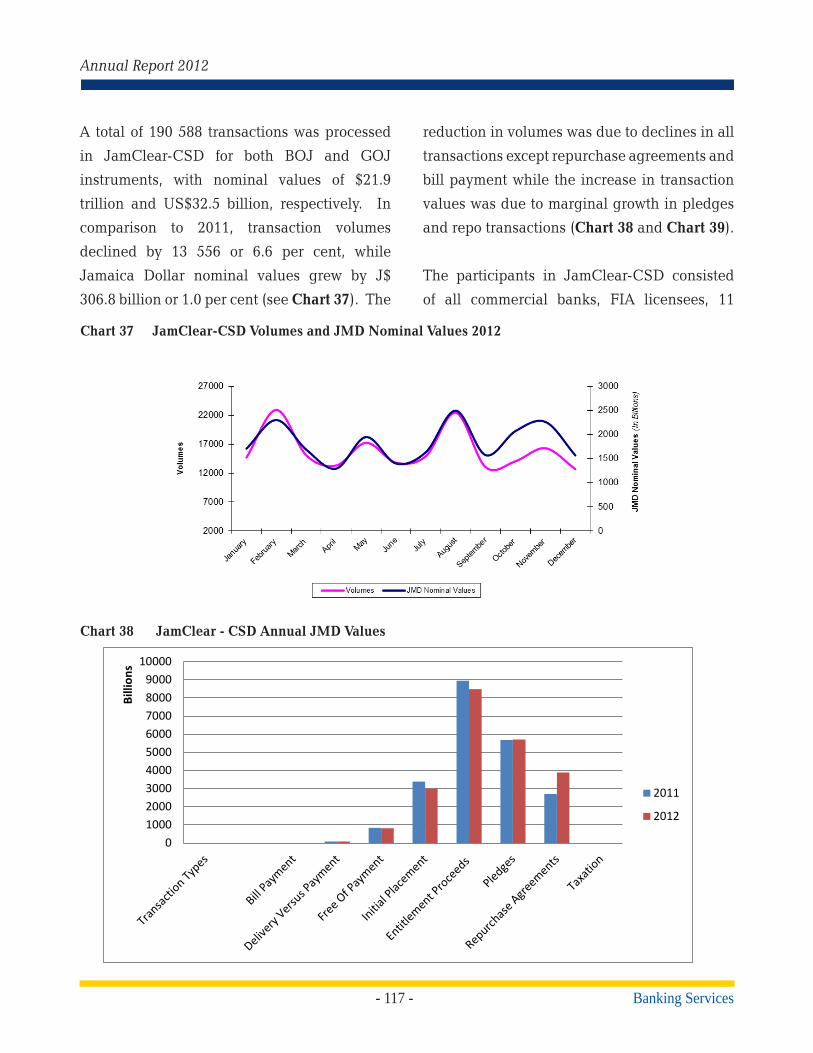
- 117 -
Annual Report 2012
Banking Services
A total of 190 588 transactions was processed
in JamClear-CSD for both BOJ and GOJ
instruments, with nominal values of $21.9
trillion and US$32.5 billion, respectively. In
comparison to 2011, transaction volumes
declined by 13 556 or 6.6 per cent, while
Jamaica Dollar nominal values grew by J$
306.8 billion or 1.0 per cent (see Chart 37). The
reduction in volumes was due to declines in all
transactions except repurchase agreements and
bill payment while the increase in transaction
values was due to marginal growth in pledges
and repo transactions (Chart 38 and Chart 39).
The participants in JamClear-CSD consisted
of all commercial banks, FIA licensees, 11
Chart 38 JamClear - CSD Annual JMD Values
0100020003000400050006000700080009000
10000
Billi
ons
2011
2012
Chart 37 JamClear-CSD Volumes and JMD Nominal Values 2012
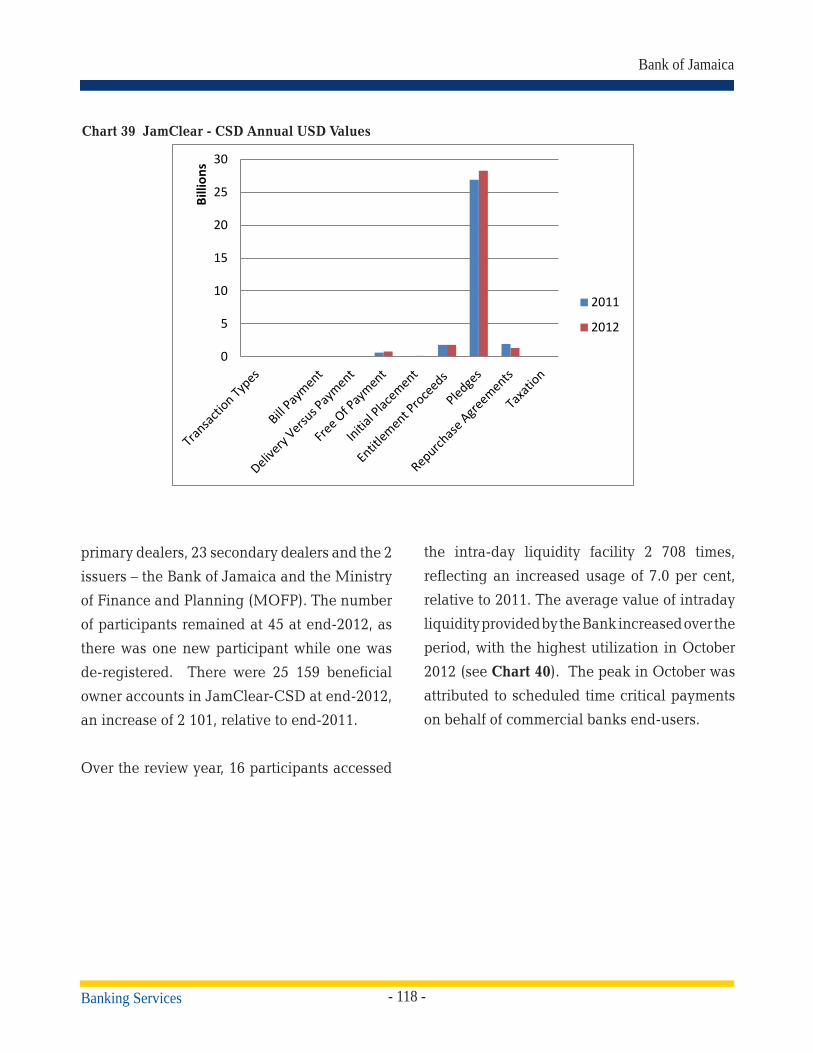
- 118 -Banking Services
Bank of Jamaica
the intra-day liquidity facility 2 708 times,
reflecting an increased usage of 7.0 per cent,
relative to 2011. The average value of intraday
liquidity provided by the Bank increased over the
period, with the highest utilization in October
2012 (see Chart 40). The peak in October was
attributed to scheduled time critical payments
on behalf of commercial banks end-users.
Chart 39 JamClear - CSD Annual USD Values
0
5
10
15
20
25
30
Billi
ons
2011
2012
primary dealers, 23 secondary dealers and the 2
issuers – the Bank of Jamaica and the Ministry
of Finance and Planning (MOFP). The number
of participants remained at 45 at end-2012, as
there was one new participant while one was
de-registered. There were 25 159 beneficial
owner accounts in JamClear-CSD at end-2012,
an increase of 2 101, relative to end-2011.
Over the review year, 16 participants accessed

- 119 -
Annual Report 2012
Banking Services
Chart 40 Comparison of Daily Average Liquidity Utilized - 2011 & 2012
20
25
30
35
40
45
50
40179 40210 40238 40269 40299 40330 40360 40391 40422 40452 40483 40513
Daily
Avg
. Liq
uidi
ty (J
$ Bi
llion
s)
Daily Average Liquidity 2011 Daily Average Liquidity 2012


- 121 -
7. Currency Operations
7.1. Currency in CirculationThe total value of circulatory banknotes
increased by approximately 3.0 per cent to
$62 150.2 billion at end-2012, relative to end-
2011 (see Chart 41). The $1000 note accounted
for 72.0 per cent of the total value of notes in
active circulation at end-2012, relative to 71.0
per cent at end-2011. This was followed by the
$500 note which accounted for 12.6 per cent,
compared to 13.5 per cent for the previous
year. The $5000 note represented 9.3 per cent
of the total value of notes in active circulation
at end-2012, relative to 9.4 per cent for the
previous year. Of the total value of banknotes
in circulation at the end of 2012, 0.3 per cent
consisted of withdrawn notes, i.e., $20, $10, $5,
$2, $1 and $0.50.1
The value of coins in circulation at end-2012
was $3.4 billion, representing an increase of 9.1
per cent relative to the previous year (see Chart
1 Withdrawn notes are a liability of the BOJ and therefore are included in the calculation of currency in circulation.
42). Approximately 40.8 per cent of the total
value of coins in active circulation consisted
of $20, while the $10, $5 and $1 represented
22.6 per cent, 15.3 per cent and 18.3 per cent,
respectively. This compares to 40.0 per cent,
22.0 per cent, 15.2 per cent and 18.3 per cent for
the $20, $10, $5 and $1 coins, respectively, for
2011. Of the total value of coins in circulation,
1.3 per cent or $45.1 million represented
withdrawn coins, i.e. $0.50, $0.20, and $0.05.
7.2. Currency IssueThe total value of banknotes issued for 2012
amounted to $243.4 billion (see Table 54). This
represented an increase of 1.4 per cent when
compared to the previous year. The $1000 note
constituted 75.0 per cent of the total value of
notes issued compared to 74.0 per cent in
the previous year. This note, together with
the $500 note, accounted for 92.9 per cent of
the total value of decimal notes issued for the
review year, relative to 92.5 per cent for 2011.
The $5000 denomination represented 2.5 per
$47.194$49.947
$54.625$60.344 $62.150
$0
$10
$20
$30
$40
$50
$60
$70
2008 2009 2010 2011 2012
BIL
LIO
NS
TOTAL VALUE OF BANKNOTES IN CIRCULATION
DEC.
$2.430$2.592
$2.836$3.107
$3.388
$0.00
$0.50
$1.00
$1.50
$2.00
$2.50
$3.00
$3.50
$4.00
2008 2009 2010 2011 2012
BIL
LIO
NS
TOTAL VALUE OF DECIMAL COINS IN CIRCULATION
Chart 41 Chart 42

- 122 -Currency Operations
Bank of Jamaica
cent, relative to 2.8 per cent for the previous
year. There was a decline of 10.6 per cent in the
quantity of new notes issued for 2012 compared
with a reduction of 4.6 per cent for 2011. This
sharper decline coincided with the introduction
of more durable substrates for the printing of
banknotes.
The total value of coins issued for the review
year amounted to $497.0 million, which was
3.7 per cent above the total value issued for
2011. The $20 coin accounted for 49.9 per
cent of the total value of coins issued for 2012,
relative to 49.6 per cent for 2011. In terms of the
number of pieces of coins issued, the $1 coin
represented 49.2 per cent of the total number
of pieces issued for 2012, compared to 48.7 per
cent for 2011.
7.3. Currency Redemption
Banknotes redeemed during 2012 were valued
at $241.6 billion, 3.1 per cent above the figure
for the previous year.2 The $1000 and $500
2 From 2008 to 2012, the average yearly redemption was $227.8 billion
banknotes accounted for 74.8 per cent and 18.2
per cent, respectively, of the value of banknotes
redeemed for 2012 relative to 73.6 per cent and
19.1 per cent for 2011. Coins redeemed in 2012
were valued at $215.5 million, representing an
increase of 3.5 per cent relative to the figure
for the previous year. The $20 denomination
accounted for 59.3 per cent of the total value
of coins redeemed for 2012, relative to 57.6 per
cent for 2011. The $10 and $5 coins represented
27.3 and 10.6 per cent, respectively, of the total
value of coins redeemed for 2012, compared to
28.3 and 10.0 per cent for 2011.
7.4. Quality of Banknotes For the review year, 385.0 million notes valued
at $236.9 billion were processed, compared to
325.1 million pieces valued at $230.2 billion
for the previous year. Of the total number of
notes processed, 64.6 per cent was classified
as re-issuable notes. The note-sorting machine
deemed 34.4 per cent of the notes processed
as unfit to enter circulation and automatically
shredded these notes. The remaining notes
were rejected by the note sorting machines
% Change
Denomination $BN Share % $BN Share % (value)
$5,000 6.7 2.8 6.0 2.5 -10.2
$1,000 176.9 73.7 182.5 75.0 -3.2
$500 45.1 18.8 43.7 17.9 -3.2
$100 9.7 4.1 9.5 3.9 -1.8
$50 1.6 0.7 1.7 0.7 1.4Total 240.1 100.0 243.4 100.0 1.4
COMPARISON OF NOTES ISSUED (VALUE)(End of Period)
2011 2012
Table 54

- 123 -
Annual Report 2012
Currency Operations
and subsequently shredded off-line. A total of
161 166 025 pieces of notes were destroyed by
shredding.
7.5. Counterfeit DetectionThe total number of counterfeit notes detected
was 3 549 representing a value of $2 509 600 for
2012, compared to 4 280 pieces valued at $3 479
250 for the previous year. The counterfeit notes
detected in 2012 were 0.004 per cent of the total
value of banknotes in circulation at end-2012.
This is equivalent to 24.4 counterfeit notes
per one million genuine notes in circulation,
relative to 29.7 pieces per million at the end-
2011. The Bank identified 44.1 per cent of the
total number of counterfeit notes detected in
2012, relative to 32.4 per cent for 2011.
7.6. Jamaica 50th Anniversary of
Independence Commemorative
Banknotes and CoinsIn observance of the nation’s 50th anniversary
of political independence, the Bank issued a
series of commemorative banknotes in 2012.
This series consisted of the five denominations
in circulation- the $5000, $1000, $500, $100 and
$50 notes, with modifications to their original
design. The faces of the notes were unchanged,
except for the superimposition of the National
Logo for the 50th Anniversary of Independence
over the watermark area of each denomination.
On the reverse of each note, the unique design
for each denomination was replaced with a
common vignette, a photograph of a group of
children from Central Branch Primary School
(circa. 1962), depicting the National Motto
“Out of Many, One People”. These notes were
put into circulation on 23 July 2012.
In order to extend the useful lives of some of
the notes, four denominations were printed
on more durable substrates. The $1000, $500
and $50 notes were printed on pre and post-
print varnished cotton. The $100 was printed
on a composite material known as Hybrid®,
which is a combination of protective polyester
film layered around a cotton fibre core. For
technical reasons, the $5000 substrate could
not be upgraded.
The Bank also issued two commemorative coins,
gold and silver, with both having similar design
features. The obverse side of each coin features
the Jamaica Coat of Arms and the reverse side,
the National Logo for the 50th Anniversary of
Independence celebrations. Each coin has a
face value of $50 and a diameter of 28.4 mm
with milled edges. These coins consist of 22
carat gold and 92.5 per cent silver, respectively.
In addition, the Bank released a limited number
of legacy banknotes sets with six withdrawn
notes, the $0.50, $1, $2, $5, $10 and $20, as a
special commemorative package.
7.7. Numismatic ProgrammeOlympic Gold and Silver Coins
The Bank released gold and silver Olympic
coins in 2012, in honour of the eight athletes
who have won individual Olympic gold medals

since Jamaica began participating in the Olympic
Games in 1948. These coins have a common design
with the Jamaica Coat of Arms on the obverse and the
portrait of the eight individual gold medal winners on
the reverse. Each coin has a face value of $100. The
gold coin contains 22 carat gold while the silver coin
consists of 92.5 per cent silver.
In celebration of the Diamond Jubilee of Queen
Elizabeth II, the Bank in collaboration with the MDM/
World Coin Association, sanctioned the issuing of a
commemorative silver coin. This coin, which was sold
internationally by the World Coin Association, has a
face value of $25 and featured the Jamaica Coat of
Arms on the obverse and the St. Edwards Crown on
the reverse.

- 125 -
8. Administration
8.1 Administration
8.1.1 Overview
During the review year, work continued under
the Bank’s Organisational Development
Programme with the objective of improving
organisational effectiveness and efficiency. In
addition, the Succession Management Policy
was revisited and the training and development
programmes were refocused towards equipping
staff members to be able to function in several
areas of the Bank. Further, programmes to
improve operational efficiency and reliability
of the physical plant and equipment were
implemented as well as phase 3 of the energy
management programme.
8.1.2 Organization Development
The Bank’s 2012 Strategic Objectives
were supported by initiatives under the
Organisational Development Programme aimed
at aligning human resources, work processes
and technology to promote improvement in
efficiency and effectiveness. In this regard,
comprehensive analyses of selected core areas
and critical support functions were undertaken
to ensure appropriate deployment of staff.
Jobs were redefined and new job descriptions
developed in cases where functions had
changed based on new or expanded mandates.
Additionally, a formal Succession Management
Programme and Policy was developed
during the year and approved by the Bank’s
Management for implementation in 2013.
8.1.3 Staffing and Employee Relations
The Bank’s staff complement was 585 at the end
of the review year. This reflected a decrease
of 0.7 per cent relative to end-2011. The
staff complement comprised 503 permanent
employees and 82 fixed term contract staff.
For 2012, the Bank’s staff attrition rate was 6.5
per cent for 2012, compared to 5.7 per cent for
2011. The rate of attrition partly reflected an
increase in the number of retirees to 13 in 2012
from 7 in 2011.
The industrial relations environment within
the Bank remained calm in 2012. During
the year, the Management had discussions
with the Bustamante Industrial Trade Union
(BITU) which represents unionized staff. These
discussions were guided by the Government’s
policy directives relating to public sector wages
and benefits for the contract period 01 April
2012 to 31 March 2014.
8.1.4 Training and Development
The Strategic Plan for 2012 required that the
Training Institute accelerated the process of
identifying the organization’s training needs.
To this end, the Training Institute developed and
implemented targeted training programmes
aimed at the realisation of higher levels of staff

- 126 -Administration
Bank of Jamaica
productivity and efficiency.
In August 2012, the new training programme
was launched under the theme, Vision 2015:
Targeted Training - Creating a New Generation
of Central Bankers. This training will lay the
foundation for a cadre of central bankers who
fully understand the complete mandate and
functions of the central bank, allowing them to
function in several areas.
During the year, members of staff benefitted
from 164 training programmes. This included
37 overseas programmes which were attended
by 53 members of staff. These overseas
programmes were conducted or sponsored
by regional and international organizations
including the Caribbean Regional Technical
Assistance Centre (CARTAC), World Bank,
International Monetary Fund, Centre for
Latin American Monetary Studies (CEMLA),
Caribbean Group of Bank Supervisors (CGBS),
the Federal Reserve Board and other central
banks.
The training programme during the year
was enhanced by collaboration with various
organisations. This included hosting of the
XV Annual Conference of Human Resource
Managers of Central Banks in the Caribbean
Region over the period 05 – 08 September 2012
which was attended by 21 delegates from 8
regional central banks. The Bank also partnered
with the International Finance Corporation
(IFC) and the Canadian International
Development Agency (CIDA) to host the
Caribbean Credit Reporting Conference at the
Jamaica Conference Center on 30 November
2012. In addition, the Bank collaborated with
CEMLA in hosting the first regional Payment
System Workshop for the Caribbean and
Latin America region over the period 05 – 07
December 2012.
During the review year, the Bank continued
its partnership with HEART/NCTVET to train
and certify staff members in selected skills
and competencies. Additionally, the Institute
facilitated 12 e-learning interventions with
176 participants relative to four programmes
with 86 participants in 2011. This increase is
reflective of the new thrust to advance the use
of e-learning as a tool for achieving higher
levels of efficiency in training. In addition,
there was a number of fora on health and
lifestyle, including an annual health seminar
for pensioners convened in December as part of
the Bank’s ongoing health awareness measures
for its pensioners.
8.1.5 Pension Administration
The Bank, as Administrator and Investment
Manager of the pension scheme, fulfilled
the reporting requirements to the Financial
Services Commission (FSC) for the year.
Reports submitted included the annual report
on the pension scheme’s operations for 2011,
responses to surveys and a special questionnaire
designed to assess the Scheme’s preparedness
to implement the requirements of FATCA. A

- 127 -
Annual Report 2012
Administration
comprehensive review of the pension scheme’s
constitutive documents continued in 2012
and it is anticipated that reviews by the Board
of Directors and Trustees will be finalized in
2013 to facilitate completion of the registration
process by the FSC.
There were 1 025 members of the pension
scheme at the end of 2012, a net increase of
11 relative to 2011. Membership comprised 502
active staff members, 255 pensioners and 268
deferred pensioners. For the review year, 28
members attained or were granted pensionable
status including 15 deferred pensioners.
8.1.6 Plant and Physical Infrastructure
During 2012, the Bank intensified efforts to
optimize the performance of the physical
plant and equipment, advance its Energy
Management Programme as well as implement
environmentally friendly initiatives. The key
strategies included:
1) Formation of a new Environment and
Energy Management Committee with
an expanded mandate to include the
‘greening’ of the organization;
2) Development and implementation of
phase 3 of the Energy Management
Programme;
3) Completion of the Glass Fenestration
System project which offers protection
against Category 5 hurricane-force
winds and provides some degree
of insulation against heat and noise
pollution;
4) Commencement of comprehensive
assessments of the physical plant and
equipment and the development of a
time table for modernization; and
5) Commencement of the process of
facilitating an assessment of the Bank’s
carbon footprint to target areas for
improvements.
For the review period the Bank achieved a
reduction of 542 336 kWh or 12 per cent in
energy consumption relative to 2011. This
reduction exceeded the Bank’s projection for
savings between 5 and 10 per cent for the year.
In addition, the decline translated to a saving of
approximately $15.4 million.


- 129 -
9. Governance
9.1. OverviewUnder the Bank of Jamaica Act, the Governor
is the Chief Executive Officer of the Bank as
well as Chairman of the Board of Directors. The
Governor is responsible for the business of the
Bank, and more specifically, the formulation
and implementation of monetary policy,
the supervision and regulation of deposit-
taking entities and other specified financial
institutions, the issuance of currency and
the provision of fiscal agency services to the
Government. In addition, the Governor has
statutory responsibility for the oversight of
Jamaica’s payment, clearing and settlement
systems under the Payment Clearing and
Settlement Act (2010).
9.2. Board CompositionThe Board is comprised of the Governor, the
Senior Deputy Governor and six independent
directors appointed by the Minister of Finance
for three-year renewable terms. The Financial
Secretary is an ex officio member of the Board.
In 2012, there were changes in the composition
of the Board of the Bank due to the resignation
of some of its members and appointments to fill
the vacancies created. Specifically, Dr. Wesley
Hughes vacated the post of Financial Secretary
during the year while Dr. Celia Brown-Blake,
Dr. Nigel Clarke, Mr. Rohan Barnett and Mr.
Mark Myers resigned on account of the change
in political administration. They were replaced
by Mr. Devon Rowe, the new Financial Sec-
retary and ex officio member, Mr. Christopher
Bicknell, Dr. Christine Clarke, Dr. Vincent Law-
rence, Miss Janice Holness and Mr. Dennis
Morrison.
All matters of importance outside the func-
tions of daily management are submitted to the
Board. Additionally, on the recommendation of
the Governor, the Board is responsible for the
appointment of auditors, attorneys, currency
agents and other agents of the Bank as well as
the Bank’s officials.
9.3. Board MeetingsThe Bank's Board is required by law to meet
at least 10 times annually. However, nine
statutory meetings were held in 2012.
9.4. Board Committee Meetings The Board’s three committees - Audit, Budget
and Human Resource Development (HRD)
continued to meet in 2012. These committees
have written terms of reference outlining their
respective responsibilities.
The Audit Committee, chaired by Dr Vincent
Lawrence, has oversight of the internal audit

- 130 -Governance
Bank of Jamaica
function and is also responsible for overseeing
the relationship with the Bank’s external
auditors. In 2012, the Audit Committee held
three meetings, satisfying the minimum
stipulation. The Budget Committee, chaired
by Dr Christine Clarke, oversees the financial
affairs of the Bank, including scrutiny of
the annual budget prior to final approval
by the Board. The committee met once in
2012, satisfying the minimum requirement.
The Human Resource Development (HRD)
Committee, chaired by Mr Dennis Morrison,
meets when necessary. The committee met
once for 2012.
9.5. Compensation of Executive
ManagementThe Bank’s Executive Management comprises
the Governor, the Senior Deputy Governor, and
three Deputy Governors. These officers are
appointed under fixed term contracts by the
Minister of Finance and Planning, as provided
for under the Bank of Jamaica Act. The
Governor and Senior Deputy Governor are also
ex officio members of the Board of Directors and
are also appointed by the Minister of Finance
and Planning for fixed terms.
The compensation of Executive Management
for the year ended 31 December 2012 is
described below.
• Salary Range of Executive
Management
$9 332 821 to $18 023 335
• Allowances - Deputy Governors
$830 856
Members of the Executive Management
team are eligible for benefits available to
other members of staff, inclusive of health
insurance, life insurance and staff loans. With
the exception of the Governor, all the executive
managers are members of the non-contributory
pension scheme sponsored by the Bank. The
Governor is paid a gratuity in lieu of pension
benefits.
The Governor is provided with a residence which
is maintained by the Bank. He is also eligible
for reimbursement of prescribed overseas
medical insurance premium and expenses for
his children’s education. The Governor and
the Deputy Governors are provided with motor
vehicles.
Non-executive Directors are not remunerated
for their services but are paid reimbursable
expenses within the scale of rates approved
by the Ministry of Finance and Planning for
Directors of public bodies. They are not eligible
for staff related benefits.

- 131 -
10. Community Outreach
10.1. Overview
Bank of Jamaica, through its outreach
programme, continues to devote some of
its resources to enhancing the educational,
cultural and social development of not only the
community surrounding its offices at Nethersole
Place, but also the wider Jamaican society. The
Bank remains committed to maintaining and
enhancing its current programmes, while being
open to the possibility of new projects aimed
at adding value to the employee and visitor
experience.
10.2. Support for Education
10.2.1. Schools’ Education Programme
The Schools’ Education Programme affords
students of all ages the opportunity to
interact with BOJ staff members and discuss
several areas of economics. During 2012,
the programme hosted 30 sessions, catering
primarily to students who studied business and
economics at the secondary school level.
10.2.2. Revision Seminars in Economics
The Bank hosted the seminar series in its
auditorium over two days in March 2012.
Each day more than 300 secondary school
students preparing for the Caribbean Advanced
Proficiency Examination (CAPE) were in
attendance.
10.2.3. Essay Competition
In 2012, the Bank hosted its essay competition,
“Essays in Economics” for students of economics
enrolled in secondary schools. There were
18 students who were from 13 schools that
participated in the competition. Chevano Baker
of Manchester High School and Oretha Gabay
of Ardenne High School were joint winners.
10.2.4. St. Michael’s Primary School
The Bank’s involvement with this inner-city
school, located in close proximity to its offices,
continued in 2012. In addition to the on-going
assistance with teaching materials, the Bank
sponsored a very successful summer school,
benefitting approximately 60 students at the
grade five and six levels.
10.2.5. Money Museum
Similar to museums worldwide, the Bank’s
money museum continued to play an important
role in the collection, display and dissemination
of historic and cultural information for the
public’s enlightenment. In 2012, more than
6 600 persons visited the Museum, the highest
number of registered visitors for a year since its
opening in 1999.
10.2.6. G. Arthur Brown Memorial Lecture
This lecture honours the memory of G Arthur
Brown, the first Jamaican Governor of the Bank
of Jamaica. The lecture is part of an educational

- 132 -Public Finance
Bank of Jamaica
endeavour by the Central Bank to stimulate
intellectual thought and discussion by inviting,
on an annual basis, leading thinkers from
around the globe to speak on a wide variety
of economic, social, cultural, historical and
political topics and issues.
A full auditorium listened to the 2nd G. Arthur
Brown Memorial Lecture presented by former
Prime Minister, the Most Hon. P.J. Patterson, on
the topic “Stimulating the Flow of Our Creative
Potential”. In his address, the former Prime
Minister drew on the importance of VISION
2030 to Jamaica, which he said “…speaks to
the need to develop our human creativity as
an economic resource to better compete in
a globally competitive economy”.1 He also
highlighted that “…the whole life and entire
being of George Arthur Brown was devoted
to releasing the capacity and unleashing the
will of the Jamaican people to make this little
country of ours a truly great one.”
10.3. Support for the Visual and Performing
Arts
10.3 1. Lunch Hour Concerts
These concerts continued in 2012. In
celebration of Jamaica’s 50th anniversary of
independence, the performances were selected
to display Jamaican talent over the 50 years.
Concerts were fully supported each month.
10.3 2. Artist Talk – The Artist and His Work
1 Vision 2030 is a long term National Development plan for Jamaica which sets out strategies which would put Jamaica in a position to achieve developed country status by 2030.
During 2012, the Bank featured the life and work
of two artists. In March, Barrington Watson
reflected on aspects of his life and work, in an
event that coincided with an annex exhibition
of the National Gallery’s landmark “Barrington
– A Retrospective”, in the Bank’s foyer. The
annex exhibition featured The Garden Party, a
highlight of the Bank’s corporate art collection.
The second artist was ceramist Phillip
Supersad, who engaged the audience for over
an hour with his story which was interspersed
with drumming and a demonstration of the use
of the potter’s wheel.
10.3.3. Exhibitions
Exhibitions hosted in 2012 featured ceramics
from the Association of Jamaican Potters and
The Mustard Seed Communities. As part of
“Jamaica 50” celebrations, the Bank mounted a
special exhibition on the commemorative notes
which were issued to mark the occasion. These
notes replicated a photograph of a group of
children from Central Branch Primary School
(circa. 1962), depicting the National Motto
“Out of Many, One People”.
10.3.4. University Singers in Concert
The annual concert, “An Evening with the
University Singers”, sponsored each December
by the Bank and held at the UWI Chapel,
continued to be well supported. The 2012
concert featured a special tribute to Mrs
Jacqueline Morgan, a retired Senior Director
at the Bank, who initiated the series.

- 133 -
11. Bank of Jamaica’s Strategic Objectives 2012-2015
11.1. Overview
The medium-term goal of the Bank of Jamaica
is to reduce inflation to single digit, in line
with the average inflation of Jamaica’s
main trading partners, while maintaining a
sound financial sector, in addition to robust
payments and settlement systems. In order
to enhance the Bank’s capacity to meet these
objectives, major institutional reforms are
being contemplated, viz. (i) progressively
put fulfil the requirements for full-fledged
inflation targeting (FFIT) for implementation,
once the issue of fiscal dominance has been
successfully resolved by the medium-term
economic programme; (ii) amendment of the
Bank of Jamaica Act to give the BOJ overall
responsibility for financial system stability;
and (iii) development of the Omnibus Banking
Law, which will further strengthen BOJ’s
capacity to conduct supervision and regulation
of financial conglomerates. In light of these
reforms and the increased accountability that
will accompany such institutional changes, the
Bank has defined seven strategic objectives to
provide a ‘road map’ for its operations for 2013.
These objectives, as set out below, also inform
the performance benchmarks for the Bank.
11.2. Strategic Objectives
The Bank’s objectives for 2013 are to:
1. Enhance the Monetary Policy Framework
to Achieve Inflation Objective by:
i. deepening research and development
and enhancing the monetary analysis
framework and the monetary
transmission;
ii. strengthening the inflation forecast
and policy assessment system
(IFPAS) through operationalization
of the Dynamic Stochastic General
Equilibrium (DSGE) model and
enhanced surveillance;
iii. assessing the adequacy of the Open
Market Operations structure to ensure
its effectiveness in attaining the inflation
objectives; and
iv. developing a comprehensive data
management infrastructure integrated
with the enterprise business intelligence
system (EBIS).
2. Strengthen the Bank’s Institutional
Framework for Maintaining Financial
System Stability by:
i. strengthening the macro-prudential
surveillance and risk management
framework, focussing on macro-financial
forecast model; designing framework &
tools for coordinated “bottom-up” stress

- 134 -Strategic Objectives
Bank of Jamaica
testing and self-assessment of SFIs as
well as making internal preparations for
a Financial Stability Committee;
ii. enhancing the financial and prudential
database;
iii. promoting an appropriately robust
legal and regulatory framework and
maintaining an adequate and effective
supervisory framework, including the
implementation of enhanced framework
for cambio and remittance companies,
licensing and development of enhanced
ladder of enforcement for non-compliant
licensees and full implementation of
the new credit reporting oversight
framework;
iv. fostering the development of stable,
robust and efficient money and foreign
exchange markets to support monetary
and financial stability objectives,
focussing on the development of a
discount window, identifying and
implementing specific enhancements
for foreign exchange markets to broaden
the range of products and improve
market efficiency;
v. promoting the efficiency, integrity,
reliability and safety of the payment
and settlement systems, focussing on
the development of business continuity
plan (BCP) for the RTGS;
vi. strengthening the payment system
oversight towards ensuring the safety
and security of the system;
vii. taking the leading role in co-ordinating
the implementation of the CFATF action
plan leading to the fourth round mutual
evaluation of Jamaica; and
viii. leading the development of the country’s
strategies and policies in preparation
for the implementation of FATCA.
3. Benchmark and Monitor the Financial
Performance of the Bank by:
i. implementing a new suite of
management reports to support decision
strategies for effective management at
the divisional level;
ii. improving efficiency and effectiveness
of the budgeting, budgetary control and
financial reporting processes;
iii. reviewing the reserve management
function to ensure attainment of the
risk minimization, capital preservation
and return maximization imperatives,
including greater use of available funds
management expertise; and
iv. ensuring the efficiency of the currency
operations, including assessing the
performance of the new substrates and
reviewing the currency structure to
determine efficacy.

- 135 -
Annual Report 2012
Strategic Objectives
4. Improve the Effectiveness of the Bank’s
Communication by:
i. reviewing and enhancing the
programme for regular external and
internal communication using new and
existing channels;
ii. emphasising topics and subjects that
relate to the organization’s strategic
direction and objectives, promoting
stakeholder discussions on monetary
policy framework and inflation objective
and introducing public education on
the new credit reporting framework,
pursuant to the scheduled launch of
operations of licensed credit bureaus;
iii. promoting financial literacy;
iv. enhancing market transparency through
timely and accurate information
dissemination to all stakeholders; and
v. ensuring the reinforcement of key
strategic messages.
5. Align the Bank’s Human Resources,
Processes, Technology and Organizational
Structure to Support the Attainment of the
Bank’s Strategic Objectives by:
i. developing and implementing a
succession management programme
to ensure that the Bank is adequately
staffed at all times;
ii. developing and administering targeted
training programmes to address the
current and future skills and competency
requirements of the Bank, consisting of
technical as well as management and
leadership training;
iii. enhancing the Bank’s organization
development programme, ensuring
the optimum organizational structure
with the required alignment of
human resources, work processes and
technology; and
iv. undertaking a strategic compensation
review.
6. Enhance the Capacity and Improve the
Stability and Performance of the Bank’s
ICT Infrastructure by:
i. enhancing the IT security arrangements
for the Bank’s data and information;
ii. strengthening the business continuity
plan (BCP) within the context of the IT
framework;
iii. facilitating the implementation of the
fixed income trading platform; and
iv. developing and implementing a foreign
exchange trading platform.

7. Implement Programmes to Improve the
Operational Efficiency and Reliability of the
Bank’s Physical Plant and Equipment by:
i. delivering agreed capital projects on time and
within budget;
ii. implementing environmental awareness
programmes, including the greening of the
Bank;
iii. enhancing the energy management
programmes; and
iv. initiating plans for the replacement of
elevators over the next 2-3 years.
- 137 -
12. Calendar of Monetary Policy Developments
2012/10/30 To augment its liquidity management operations, the Bank of Jamaica offered
three variable rate instruments from Wednesday, 31 October 2012 to Monday, 05
November 2012:
(a) A 49-day Certificate of Deposit with offer limit of $6.0 billion. This coupon was
re-priced monthly at 0.6 percentage point above the one-month GOJ Treasury
Bill rate existing at the beginning of the next interest period. The initial coupon
for the first 30 days was 6.81 per cent per annum. This offer was extended to
all Primary Dealers and commercial banks, for only one day on Wednesday, 31
October 2012.
(b) A 182-day Certificate of Deposit, with an unlimited offer amount. The instrument
was re-priced quarterly at 0.8 percentage point above the three-month GOJ
Treasury Bill rate existing at the start of each re-pricing period. The initial coupon
for the first three months was 7.18 per cent per annum. This offer was extended
to all Primary Dealers and commercial banks from Wednesday, 31 October 2012
to Monday, 05 November 2012.
(c) A 364-day Certificate of Deposit, with an unlimited offer amount. The instrument
was re-priced quarterly at 1.0 percentage point above the three-month GOJ
Treasury Bill rate existing at the start of each re-pricing period. The initial coupon
for the first three months was 7.38 per cent per annum. This offer was extended
to all Primary Dealers and commercial banks from Wednesday 31 October 2012
to Monday, 05 November 2012.

- i -
Auditors’ Report
INDEPENDENT AUDITORS’ REPORT
TO BANK OF JAMAICA
Report on the Financial Statements
Pursuant to Section 43(1) of the Bank of Jamaica Act, we have audited the financial statements of Bank of Jamaica (“the Bank”), set out on pages 3 to 46, which comprise the statement of financial position as at December 31, 2011, the statements of comprehensive income, changes in capital and reserves and cash flows for the year then ended and notes, comprising a summary of significant accounting policies and other explanatory information.
Management’s Responsibility for the Financial Statements
Management is responsible for the preparation and fair presentation of these financial statements in accordance with International Financial Reporting Standards and for such internal control as management determines is necessary to enable the preparation of financial statements that are free from material misstatement, whether due to fraud or error.
Auditors’ Responsibility
Our responsibility is to express an opinion on these financial statements based on our audit. We conducted our audit in accordance with International Standards on Auditing. Those standards require that we comply with ethical requirements and plan and perform the audit to obtain reasonable assurance as to whether the financial statements are free from material misstatement.
An audit involves performing procedures to obtain audit evidence about the amounts and disclosures in the financial statements. The procedures selected depend on our judgment, including the assessment of the risks of material misstatement of the financial statements, whether due to fraud or error. In making those risk assessments, we consider internal controls relevant to the entity’s preparation and fair presentation of the financial statements in order to design audit procedures that are appropriate in the circumstances, but not for the purpose of expressing an opinion on the effectiveness of the entity’s internal control. An audit also includes evaluating the appropriateness of accounting policies used and the reasonableness of accounting estimates made by management, as well as evaluating the overall presentation of the financial statements.
KPMG Peat MarwickChartered AccountantsP.O. Box 76Kingston Jamaica
The Victoria Mutual Building6 Duke StreetKingston Jamaica
Telephone +1 (876) 922-6640Telefax +1 (876) 922-7198 +1 (876) 922-7198email: [email protected]

- ii -Final Accounts for Year Ended 31 December 2012
Bank of Jamaica

- iii -
Annual Report 2012
Final Accounts for Year Ended 31 December 2012

- iv -Final Accounts for Year Ended 31 December 2012
Bank of Jamaica
INDEPENDENT AUDITORS’ REPORT TO BANK OF JAMAICA
Opinion In our opinion, the financial statements give a true and fair view of the financial position of the Bank of Jamaica as at December 31, 2012, and of its financial performance, changes in capital and reserves and cash flows for the year then ended, in accordance with International Financial Reporting Standards. Chartered Accountants Kingston, Jamaica _________________, 2013
BANK OF JAMAICA Statement of Financial Position December 31, 2012
The accompanying notes form an integral part of the financial statements.
Notes 2012 2011 J$'000 J$'000 ASSETS Foreign assets: Notes and coins 59,342 22,605 Cash and cash equivalents 3 29,784,471 36,142,913 Interest in funds managed by agents 4 13,081,356 12,098,615 Investments 5 114,375,202 167,046,339 International Monetary Fund - Holding of Special Drawing Rights 26,958,840 28,536,152 Bilateral accounts - 23,744
Total foreign assets 184,259,211 243,870,368
Local assets: Notes and coins 127,859 124,726 Loans and advances 6 1,000,000 - Investments 7 92,159,856 92,820,849 International Monetary Fund – Quota subscription 8 4,206,706 4,315,897 Due from Government and Government Agencies 9 16,426,351 18,854,846 Property, plant and equipment 10 3,424,013 3,521,325 Intangible asset 11 30,244 47,398 Employee benefit asset 12 4,712,700 4,290,100 Other 13 4,042,627 6,665,704
Total local assets 126,130,356 130,640,845
Total assets 310,389,567 374,511,213

- v -
Annual Report 2012
Final Accounts for Year Ended 31 December 2012
BANK OF JAMAICA Statement of Financial Position (Continued) December 31, 2012
The accompanying notes form an integral part of the financial statements.
Notes 2012 2011 J$'000 J$'000 LIABILITIES, CAPITAL AND RESERVES Liabilities: Notes and coins in circulation 14 64,692,948 62,675,207 Deposits and other demand liabilities 15 152,687,396 175,279,893 Open market liabilities 16 40,380,461 85,524,755 International Monetary Fund - Allocation of Special Drawing Rights 17 35,362,449 36,280,382 Foreign liabilities 16 19 Employee benefit obligation 12 718,800 641,800 Bilateral accounts 3,000 - Other 18 4,821,875 1,013,104
Total liabilities 298,666,945 361,415,160 Capital and reserves: Share capital 19 4,000 4,000 General reserve fund 20 20,000 20,000 Special stabilisation account 21 847,595 777,130 Other reserves 22 10,851,027 12,294,923
Total capital and reserves 11,722,622 13,096,053
Total liabilities, capital and reserves 310,389,567 374,511,213 The financial statements on pages 3 to 46 were approved for issue by the Board of Directors on March 6, 2013 and signed on its behalf by: Governor Brian Wynter Deputy Governor Livingstone Morrison Financial Controller Herbert Hylton

- vi -Final Accounts for Year Ended 31 December 2012
Bank of Jamaica
BANK OF JAMAICA Statement of Comprehensive Income Year ended December 31, 2012
The accompanying notes form an integral part of the financial statements.
Notes 2012 2011 J$'000 J$'000 Operating income: Interest 23 8,918,503 9,824,467 Foreign exchange gain 24 5,797,505 3,777,670 Other 111,521 126,632
Total operating income 14,827,529 13,728,769 Operating expenses: Interest on deposits & open market liabilities 25 5,322,778 8,808,439
Interest on IMF loan 871,203 1,205,386 Staff costs 26 2,235,510 2,478,880 Currency expenses 1,061,013 1,304,012 Property expenses, including depreciation 837,875 801,748 Other operating expenses 714,661 646,738
Total operating expenses 27 11,043,040 15,245,203
Operating profit/(loss) 3,784,489 ( 1,516,434) Other income/(expenses): Pension, medical and life insurance 12 232,500 164,100 (Loss)/gain on remeasurement of staff loans ( 60,138) 144,540 Gain on disposal of securities designated as available-for-sale 16,414 8,029 Gain on disposal of property, plant and equipment 4,032 2,775
Profit/(loss) for the year before transfer to pension equalisation reserve 3,977,297 ( 1,196,990) Transfer to pension equalisation reserve 22(c) ( 322,200) ( 298,400) Profit/(loss) for the year transferred to general reserve fund 9 3,655,097 ( 1,495,390) Other comprehensive income:
Change in fair value of available-for-sale securities, being total other comprehensive income for the year ( 1,866,496) 2,218,920
Total comprehensive income for the year 1,788,601 723,530

- vii -
Annual Report 2012
Final Accounts for Year Ended 31 December 2012
BANK OF JAMAICA Statement of Changes in Capital and Reserves Year ended December 31, 2012
The accompanying notes form an integral part of the financial statements.
General Special Share reserve stabilisation Other capital fund account reserves Total J$'000 J$'000 J$'000 J$'000 J$'000 (Note 19) (Note 20) (Note 21) (Note 22) Balances at December 31, 2010 4,000 20,000 709,298 9,658,503 10,391,801
Total comprehensive income for the year: Loss for the year - ( 1,495,390) - - ( 1,495,390) Other comprehensive income: Change in fair value of available- for-sale securities - - - 2,218,920 2,218,920
Total comprehensive income - ( 1,495,390) - 2,218,920 723,530
Other changes in reserves: Loss due from consolidated fund (note 9) - 1,495,390 - - 1,495,390 Transfer from coins in circulation - - 67,832 - 67,832 Transfer of surplus on defined benefit pension scheme - - - 417,500 417,500
- 1,495,390 67,832 417,500 1,980,722
Balances at December 31, 2011 4,000 20,000 777,130 12,294,923 13,096,053
Total comprehensive income for the year: Profit for the year - 3,655,097 - - 3,655,097 Other comprehensive income: Change in fair value of available- for-sale securities - - - ( 1,866,496) ( 1,866,496)
Total comprehensive income - 3,655,097 - ( 1,866,496) 1,788,601
Other changes in reserves:
Profit due to consolidated fund (note 9) - ( 3,655,097) - - ( 3,655,097) Transfer from coins in circulation - - 70,465 - 70,465 Transfer of surplus on defined benefit pension scheme - - - 422,600 422,600
- ( 3,655,097) 70,465 422,600 ( 3,162,032)
Balances at December 31, 2012 4,000 20,000 847,595 10,851,027 11,722,622
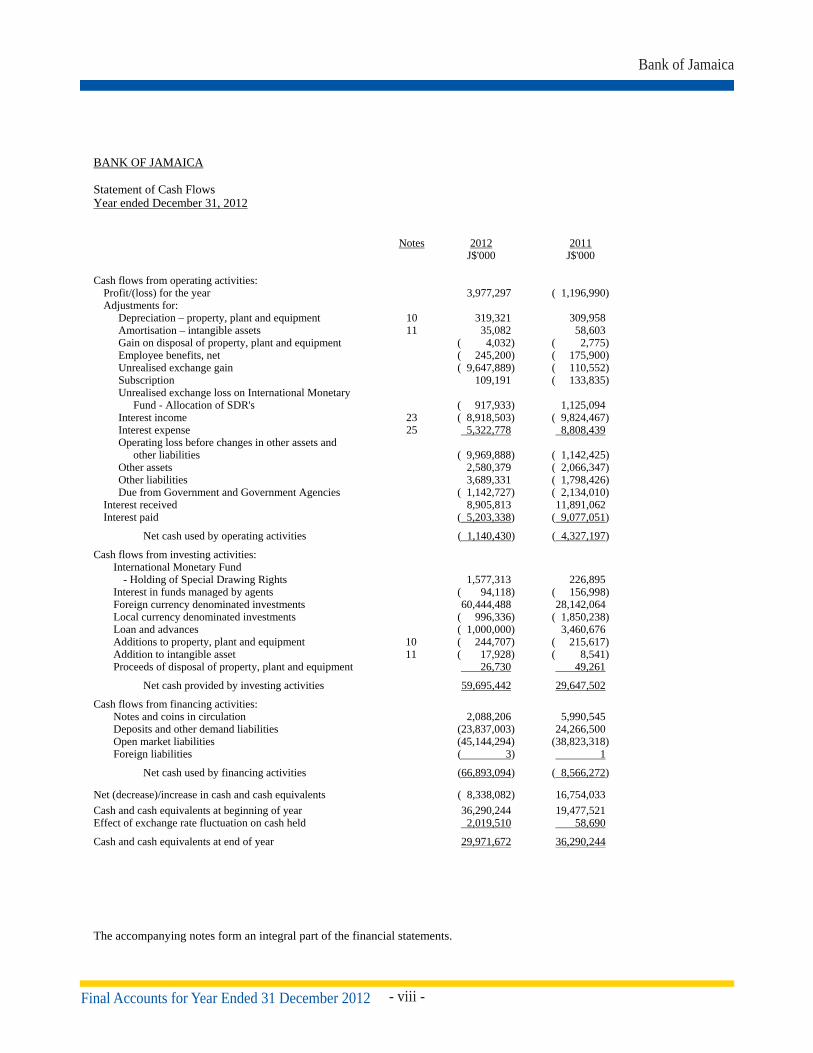
- viii -Final Accounts for Year Ended 31 December 2012
Bank of Jamaica
BANK OF JAMAICA Statement of Cash Flows Year ended December 31, 2012
The accompanying notes form an integral part of the financial statements.
Notes 2012 2011 J$'000 J$'000 Cash flows from operating activities:
Profit/(loss) for the year 3,977,297 ( 1,196,990) Adjustments for:
Depreciation – property, plant and equipment 10 319,321 309,958 Amortisation – intangible assets 11 35,082 58,603 Gain on disposal of property, plant and equipment ( 4,032) ( 2,775) Employee benefits, net ( 245,200) ( 175,900) Unrealised exchange gain ( 9,647,889) ( 110,552) Subscription 109,191 ( 133,835) Unrealised exchange loss on International Monetary
Fund - Allocation of SDR's ( 917,933) 1,125,094 Interest income 23 ( 8,918,503) ( 9,824,467) Interest expense 25 5,322,778 8,808,439 Operating loss before changes in other assets and
other liabilities ( 9,969,888) ( 1,142,425) Other assets 2,580,379 ( 2,066,347) Other liabilities 3,689,331 ( 1,798,426) Due from Government and Government Agencies ( 1,142,727) ( 2,134,010)
Interest received 8,905,813 11,891,062 Interest paid ( 5,203,338) ( 9,077,051)
Net cash used by operating activities ( 1,140,430) ( 4,327,197)
Cash flows from investing activities: International Monetary Fund - Holding of Special Drawing Rights 1,577,313 226,895 Interest in funds managed by agents ( 94,118) ( 156,998) Foreign currency denominated investments 60,444,488 28,142,064 Local currency denominated investments ( 996,336) ( 1,850,238) Loan and advances ( 1,000,000) 3,460,676 Additions to property, plant and equipment 10 ( 244,707) ( 215,617) Addition to intangible asset 11 ( 17,928) ( 8,541) Proceeds of disposal of property, plant and equipment 26,730 49,261
Net cash provided by investing activities 59,695,442 29,647,502
Cash flows from financing activities: Notes and coins in circulation 2,088,206 5,990,545 Deposits and other demand liabilities (23,837,003) 24,266,500 Open market liabilities (45,144,294) (38,823,318) Foreign liabilities ( 3) 1
Net cash used by financing activities (66,893,094) ( 8,566,272)
Net (decrease)/increase in cash and cash equivalents ( 8,338,082) 16,754,033 Cash and cash equivalents at beginning of year 36,290,244 19,477,521 Effect of exchange rate fluctuation on cash held 2,019,510 58,690
Cash and cash equivalents at end of year 29,971,672 36,290,244

- ix -
Annual Report 2012
Final Accounts for Year Ended 31 December 2012
BANK OF JAMAICA Statement of Cash Flows (Continued) Year ended December 31, 2012
The accompanying notes form an integral part of the financial statements.
Notes 2012 2011 J$'000 J$'000 Cash and cash equivalents at December 31 comprise:
Foreign cash and cash equivalents 3 29,784,471 36,142,913 Foreign notes and coins 59,342 22,605 Local notes and coins 127,859 124,726
29,971,672 36,290,244
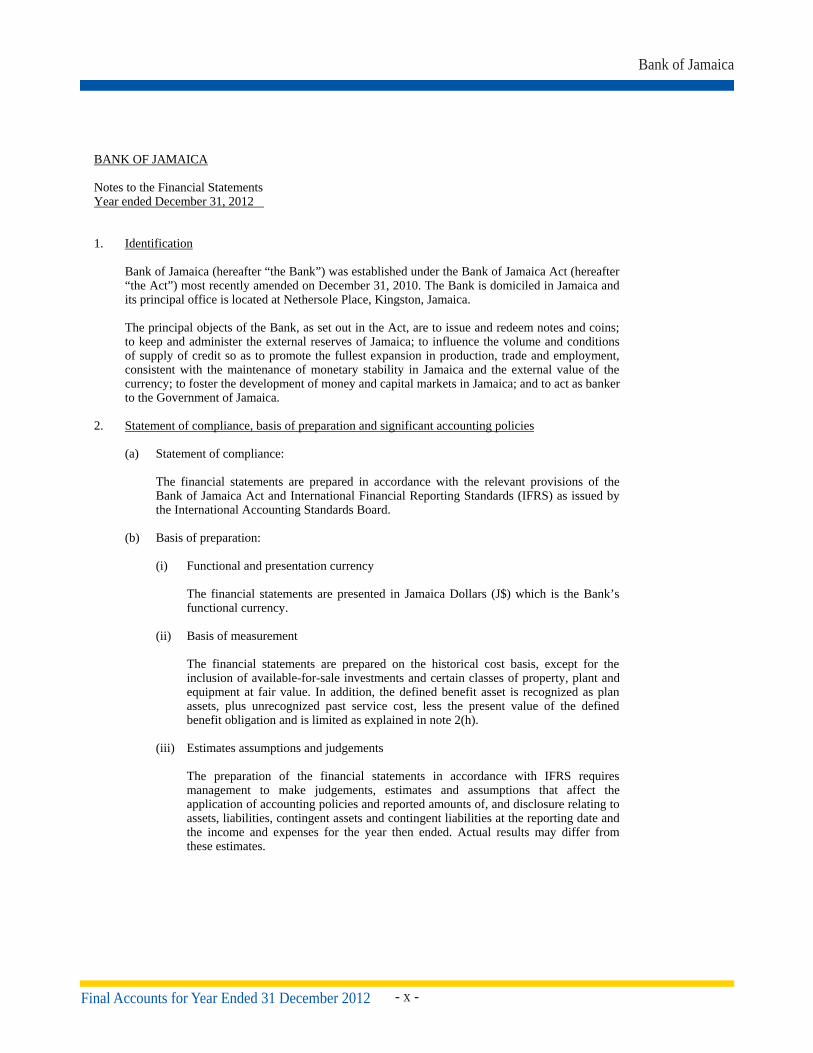
- x -Final Accounts for Year Ended 31 December 2012
Bank of Jamaica
BANK OF JAMAICA Notes to the Financial Statements Year ended December 31, 2012
1. Identification Bank of Jamaica (hereafter “the Bank”) was established under the Bank of Jamaica Act (hereafter
“the Act”) most recently amended on December 31, 2010. The Bank is domiciled in Jamaica and its principal office is located at Nethersole Place, Kingston, Jamaica.
The principal objects of the Bank, as set out in the Act, are to issue and redeem notes and coins;
to keep and administer the external reserves of Jamaica; to influence the volume and conditions of supply of credit so as to promote the fullest expansion in production, trade and employment, consistent with the maintenance of monetary stability in Jamaica and the external value of the currency; to foster the development of money and capital markets in Jamaica; and to act as banker to the Government of Jamaica.
2. Statement of compliance, basis of preparation and significant accounting policies
(a) Statement of compliance:
The financial statements are prepared in accordance with the relevant provisions of the Bank of Jamaica Act and International Financial Reporting Standards (IFRS) as issued by the International Accounting Standards Board.
(b) Basis of preparation: (i) Functional and presentation currency
The financial statements are presented in Jamaica Dollars (J$) which is the Bank’s functional currency.
(ii) Basis of measurement
The financial statements are prepared on the historical cost basis, except for the inclusion of available-for-sale investments and certain classes of property, plant and equipment at fair value. In addition, the defined benefit asset is recognized as plan assets, plus unrecognized past service cost, less the present value of the defined benefit obligation and is limited as explained in note 2(h).
(iii) Estimates assumptions and judgements
The preparation of the financial statements in accordance with IFRS requires management to make judgements, estimates and assumptions that affect the application of accounting policies and reported amounts of, and disclosure relating to assets, liabilities, contingent assets and contingent liabilities at the reporting date and the income and expenses for the year then ended. Actual results may differ from these estimates.

- xi -
Annual Report 2012
Final Accounts for Year Ended 31 December 2012
BANK OF JAMAICA Notes to the Financial Statements (Continued) Year ended December 31, 2012
2. Statement of compliance, basis of preparation and significant accounting policies (continued):
(b) Basis of preparation (continued):
(iii) Estimates assumptions and judgements (continued):
Accounting estimates and judgements made by management in the application of IFRS that have a significant effect on the financial statements and estimates with a significant risk of material adjustment in the next financial year are discussed below: Pension and other post-retirement benefits
The amounts recognised in the statements of financial position and comprehensive income for pension and other post-retirement benefits are determined actuarially using several assumptions. The primary assumptions used in determining the amounts recognised include the expected long-term return on plan assets, the discount rate used to determine the present value of estimated future cash flows required to settle the pension and other post-retirement obligations and the expected rate of increase in medical costs for post-retirement medical benefits.
The expected return on plan assets is assumed after considering the long-term historical returns, asset allocation and future estimates of long-term investment returns. The discount rate is determined based on the estimate of yield on long-term government securities that have maturity dates approximating the terms of the bank’s obligation. In the absence of such instruments in Jamaica, it has been necessary to estimate the rate by extrapolating from the longest-tenor security on the market. The estimate of expected rate of increase in medical costs is determined based on inflationary factors. Any changes in these assumptions will impact the amounts recorded in the financial statements for these obligations.
Fair value of financial instruments
In the absence of quoted market prices, the fair value of a significant proportion of the Bank’s financial instruments was determined using a generally accepted alternative method. The method includes the use of yields on securities with similar risks and tenure at the reporting date. There is however, no single accepted market yield. Consequently, the estimates arrived at may be different from the actual price of the instrument in an arm’s length transaction.
It is reasonably possible, based on existing knowledge, that outcomes within the next financial year that are different from these assumptions could require a material adjustment to the carrying amount reflected in the financial statements.

- xii -Final Accounts for Year Ended 31 December 2012
Bank of Jamaica
BANK OF JAMAICA Notes to the Financial Statements (Continued) Year ended December 31, 2012
2. Statement of compliance, basis of preparation and significant accounting policies (continued):
(c) Foreign currencies:
The rate of exchange of the Jamaica Dollar for the United States dollar is determined by the weighted average rate of trades reported by authorised dealers and cambios and the rate at which the Bank itself buys US dollars. The rates of exchange for other currencies are derived from the US$ rate, thus determined, using rates published by The World Markets Company Plc (WM Reuters).
Monetary assets and liabilities denominated in foreign currencies at the reporting date are
translated at the foreign exchange rates prevailing at that date. Transactions in foreign currencies are translated at the foreign exchange rates ruling at the dates of those transactions.
Gains and losses arising on fluctuations in exchange rates are included in profit or loss.
(d) Financial instruments:
(i) Classification of investments
Management determines the classification of investments at the time of purchase and takes account of the purpose for which the investments were purchased. Investments are classified as loans and receivables and available-for-sale securities.
Loans and receivables are non-derivative financial assets acquired by the Bank with fixed or determinable payments and which are not quoted in an active market. An active market is one where quoted prices are readily and regularly available from an exchange, dealer, broker or other agency and those prices represent actual and regularly occurring market transactions on an arm’s length basis. Loans and receivables are recognised on the day they are acquired by the Bank.
Other financial instruments held by the Bank are classified as available-for-sale. Available-for-sale instruments are recognised on the date the Bank commits to purchase the instruments.
(ii) Measurement
Financial instruments are measured initially at cost, including transaction costs. Subsequent to initial recognition, all available-for-sale investments are measured at fair value, except that any instrument that does not have a quoted market price in an active market and whose fair value cannot be reliably determined, is stated at cost, including transaction costs, less impairment losses. All non-derivative, non-trading financial liabilities and loans and receivables are measured at amortised cost, less impairment losses. Amortised cost is calculated on the effective interest method. Premiums and discounts, including initial transaction costs, are included in the carrying amount of the related instrument and amortised based on the effective interest rate of the instrument.
- xiii -
Annual Report 2012
Final Accounts for Year Ended 31 December 2012
BANK OF JAMAICA Notes to the Financial Statements (Continued) Year ended December 31, 2012
2. Statement of compliance, basis of preparation and significant accounting policies (continued):
(d) Financial instruments (continued):
(ii) Measurement (continued): Based on the above guidelines, the Bank’s investments are classified and measured as follows:
[i] Loans and advances are classified as loans and receivables and are stated at
amortised cost, less provision for impairment losses as appropriate.
[ii] Local currency denominated Government of Jamaica securities which do not have a quoted market price in an active market and whose fair values cannot be reliably determined, and interest-bearing deposits are stated at historical or amortised cost.
[iii] Local currency denominated Government of Jamaica securities with quoted prices in an active market are classified as available-for-sale and measured at fair value.
[iv] US Government bonds are classified as available-for-sale and are measured at
fair value.
[v] Interest in managed funds is classified as available-for-sale and is measured at fair value.
(iii) Fair value measurement principles
The fair value of financial instruments classified as available-for-sale is based on their quoted market price at the reporting date without any deduction for transaction costs. Where a quoted market price is not available, the fair value of the instrument is estimated using discounted cash flow techniques or a generally accepted alternative method. Where discounted cash flow techniques are used, estimated future cash flows are based on management’s best estimates of the amount and timing of such cash flows and the discount rate is a market related rate at the reporting date for an instrument with similar terms and conditions.
(iv) Gains and losses on subsequent measurement
Gains and losses arising from a change in the fair value of available-for-sale assets are recognised directly in other comprehensive income, except for impairment losses and, in the case of monetary items such as debt securities, foreign exchange gains and losses, which are recognized in profit or loss. When the financial assets are sold, collected or otherwise disposed of, the cumulative gain or loss recognised in other comprehensive income is recognised in profit or loss.
(v) Cash and cash equivalents Cash and cash equivalents comprise demand deposit accounts with banks and are
shown at cost.

- xiv -Final Accounts for Year Ended 31 December 2012
Bank of Jamaica
BANK OF JAMAICA Notes to the Financial Statements (Continued) Year ended December 31, 2012
2. Statement of compliance, basis of preparation and significant accounting policies (continued):
(d) Financial instruments (continued):
(vi) Other assets
Other assets are stated at amortised cost, less impairment losses.
(vii) Other liabilities Other liabilities are stated at amortised cost. (viii) Derecognition
A financial asset is derecognised when the Bank loses control over the contractual rights that comprise that asset. This occurs when the rights are realised, expire or are surrendered. A financial liability is derecognised when it is extinguished.
Available-for-sale assets that are sold are derecognised and corresponding receivables from the buyer for the payment are recognised as of the date the Bank commits to sell the assets. Loans and receivables are derecognised on the day they are transferred by the Bank.
(e) Property, plant and equipment:
(i) Owned assets: Items of property, plant and equipment are stated at cost less accumulated
depreciation and impairment losses, except for freehold land and buildings, which are stated at market value.
Cost includes expenditures that are directly attributable to the acquisition of the asset. The cost of self-constructed assets includes the cost of materials and direct labour and any other costs directly attributable to bringing the asset to a working condition for its intended use. The cost of replacing part of an item of property, plant and equipment is recognised in the carrying amount of the item if it is probable that the future economic benefits embodied within the part will flow to the Bank and it can be measured reliably. The costs of the day-to-day servicing of property, plant and equipment are recognised in profit or loss as incurred. The market value of freehold land and building is the estimated amount for which a property could be exchanged on the date of valuation between a willing buyer and a willing seller in an arms’ length transaction.

- xv -
Annual Report 2012
Final Accounts for Year Ended 31 December 2012
BANK OF JAMAICA Notes to the Financial Statements (Continued) Year ended December 31, 2012
2. Statement of compliance, basis of preparation and significant accounting policies (continued):
(e) Property, plant and equipment (continued):
(ii) Depreciation: Property, plant and equipment are depreciated on the straight-line basis at annual
rates estimated to write down the assets to their residual value over their estimated useful lives. Leasehold property is amortised in equal instalments over the shorter of the lease term and the property’s estimated useful life.
Land, works of art and museum coins are not depreciated.
The estimated useful lives are as follows:
Buildings 10 – 20 years Leasehold property Shorter of lease term and useful life Furniture, plant and equipment 10 years Computer equipment 5 years Motor vehicles 5 years
The depreciation methods, useful lives and residual values are reassessed at the reporting date.
(f) Notes and coins in circulation:
The nominal value of numismatic coins sold is included in notes and coins in circulation.
The net proceeds from such sales are included in profit or loss. Notes and coins in circulation is stated after a deduction of 25% of the value of coins in
circulation in accordance with the Bank of Jamaica (Value of Coins in Circulation) Order 1973, as permitted under Section 22 of the Act. The deductions are credited to the special stabilisation account.
(g) Taxation:
Section 46 of the Act, which exempted the Bank from income tax, stamp duties and
transfer tax, was repealed on December 23, 2003; however, the Bank is still exempt from income tax under Section 12(b) of the Income Tax Act. The Bank’s supplies are substantially exempt from general consumption tax (GCT); it incurs GCT at standard rates on taxable supplies acquired.
(h) Employee benefits: Employee benefits comprise all forms of consideration given by the Bank in exchange for
service rendered by employees. These include current or short-term benefits such as salaries, NIS contributions, annual vacation leave, and non-monetary benefits such as medical care and life insurance; post-employment benefits such as pension and medical care; other long-term employee benefits such as termination benefits.

- xvi -Final Accounts for Year Ended 31 December 2012
Bank of Jamaica
BANK OF JAMAICA Notes to the Financial Statements (Continued) Year ended December 31, 2012
2. Statement of compliance, basis of preparation and significant accounting policies (continued):
(h) Employee benefits (continued):
(i) General benefits
Employee benefits that are earned as a result of past or current service are recognised in the following manner: short-term employee benefits are recognised as a liability, net of payments made, and charged as expense. The estimated cost of accumulated vacation leave is recognised annually. Post-employment benefits are accounted for as described below.
(ii) Defined-benefit scheme and other post employment benefits
Employee benefits comprising pensions, and the related post-employment assets and
obligation included in these financial statements, have been actuarially determined by a qualified independent actuary, appointed by management. The appointed actuary’s report outlines the scope of the valuation and gives the actuary’s opinion. The actuarial valuations were conducted in accordance with IAS 19, and the financial statements reflect the Bank’s post-employment benefit asset and obligation as computed by the actuary. In carrying out their audit, the auditors relied on the actuary’s report.
The cost of pension benefits is the cost to the Bank for its administration of, and
contributions to, the pension scheme established to provide retirement benefits (see note 12). The contributions are a percentage of the members’ salaries; the percentage is determined by the scheme’s actuaries using the aggregate actuarial cost method. Administration costs are charged when incurred.
The Bank’s net obligation in respect of the defined benefit pension plan is calculated
by estimating the amount of future benefits that employees have earned in return for their service in the current and prior periods. That value is then discounted to determine the present value, and the fair value of any plan assets is deducted. The discount rate is determined by reference to the yield at the reporting date on long-term government bonds with maturities approximating the term of the Bank’s obligation. The calculation is performed by a qualified actuary, using the projected unit credit method.
When the benefits of the plan are improved, the portion of the increased benefit
relating to past service by employees is recognised as an expense in the statement of income and expenses on a straight-line basis over the average period until the benefits become vested. To the extent that the benefits are vested immediately, the expense is recognised immediately in profit or loss.
To the extent that any cumulative unrecognised actuarial gain or loss exceeds ten
percent of the greater of the present value of the defined benefits obligation and the fair value of plan assets, that portion is recognised in the statement of income and expenses over the expected average remaining working lives of the employees participating in the plan. Otherwise, the actuarial gain or loss is not recognised.
- xvii -
Annual Report 2012
Final Accounts for Year Ended 31 December 2012
BANK OF JAMAICA Notes to the Financial Statements (Continued) Year ended December 31, 2012
2. Statement of compliance, basis of preparation and significant accounting policies (continued):
(h) Employee benefits (continued): (ii) Defined-benefit scheme and post employment benefits (continued): Where the calculation results in a benefit to the Bank, the recognised asset is limited
to the net total of any unrecognised actuarial losses and past service costs and the present value of any future refunds from the plan or reductions in future contributionsto the plan. An economic benefit is available to the Bank if it is realisable during the life of the plan, or on settlement of the plan liabilities.
(i) Statutory transfer of profits and losses: Section 9 of the Act provides for each financial year’s net income to be credited, or net loss
charged, to the General Reserve Fund, and for the balance on the General Reserve Fund in excess of five times the Bank’s authorised share capital to be transferred to the Consolidated Fund. Likewise, any losses not covered by reserves are required by the Act to be funded by Government out of the Consolidated Fund.
(j) Impairment:
The carrying amounts of the Bank’s assets are reviewed at each reporting date to determine whether there is any indication of impairment. If any such indication exists, the asset’s recoverable amount is estimated at each reporting date. An impairment loss is recognised whenever the carrying amount of an asset or its cash-generating unit exceeds its recoverable amount. Impairment losses are recognised in profit or loss.
When a decline in the fair value of an available-for-sale financial asset has been recognised
in other comprehensive income and there is objective evidence that the asset is impaired, the cumulative loss that has been recognised in other comprehensive income is recognised in profit or loss even though the financial asset has not been derecognised. The amount of the cumulative loss that is recognised in profit or loss is the difference between the acquisition cost and current fair value, less any impairment loss on that financial asset previously recognised in profit or loss.
(i) Calculation of recoverable amount
The recoverable amount of the Bank’s investment in loans and receivables and other
receivables is calculated as the present value of expected future cash flows, discounted at the original effective interest rate inherent in the asset. Receivables with a short-term duration are not discounted.
The recoverable amount of other assets is the greater of its value in use and its fair value less cost to sell. In assessing value in use, the estimated future cash flows are discounted to their present value using a pre-tax discount rate that reflects current market assessments of the time value of money and the risks specific to the asset. For an asset that does not generate largely independent cash inflows, the recoverable amount is determined for the cash-generating unit to which the asset belongs.

- xviii -Final Accounts for Year Ended 31 December 2012
Bank of Jamaica
BANK OF JAMAICA Notes to the Financial Statements (Continued) Year ended December 31, 2012
2. Statement of compliance, basis of preparation and significant accounting policies (continued):
(j) Impairment (continued):
(ii) Reversals of impairment
An impairment loss in respect of loans and receivables carried at amortised cost is reversed if the subsequent increase in recoverable amount can be related objectively to an event occurring after the impairment loss was recognised. For all other assets, an impairment loss is reversed if there has been a change in the estimate used to determine the recoverable amount. An impairment loss in respect of an investment in an equity instrument classified as available-for-sale is not reversed through profit or loss. If the fair value of a debt instrument classified as available-for-sale increases and the increase can be objectively related to an event occurring after the impairment loss was recognised in profit or loss, the impairment loss shall be reversed, with the amount of the reversal recognised in profit or loss.
An impairment loss is reversed only to the extent that the asset’s carrying amount does not exceed the carrying amount that would have been determined if no impairment loss had been recognised.
(k) Intangible asset:
Intangible asset represents software and is measured at cost less accumulated depreciation and impairment losses. The asset is depreciated on the straight line basis at an annual rate estimated to write down the asset to its residual value over its estimated useful life of 5 years.
(l) Revenue recognition:
Interest income Interest income is recognised in profit or loss on the accrual basis using the effective interest method. The effective interest rate is the rate that exactly discounts the estimated future cash receipts through the expected life of the financial asset (or, where appropriate, a shorter period) to the carrying amount of the financial asset. The effective interest rate is established on initial recognition of the financial asset and is not revised subsequently. Interest income includes coupons earned on fixed income investments, accretion of discount on treasury bills and other discounted instruments, and amortisation of premium on instruments bought at a premium.
- xix -
Annual Report 2012
Final Accounts for Year Ended 31 December 2012
BANK OF JAMAICA Notes to the Financial Statements (Continued) Year ended December 31, 2012
2. Statement of compliance, basis of preparation and significant accounting policies (continued)
(m) New, revised and amended standards and interpretations:
New, revised and amended standards and interpretations that became effective during the year:
Certain new, revised and amended standards and interpretations came into effect during the financial year. The Bank has adopted those which are relevant to its operations, none of which resulted in any change in accounting policies or material changes to the content or presentation of amounts or disclosures in these financial statements. New, revised and amended standards and interpretations those are not yet effective: At the date of authorisation of these financial statements, certain new, and revised and amended standards and interpretations have been issued which were not effective at the reporting date and which the Bank has not early-adopted. The Bank has assessed them with respect to its operations and has determined that the following are relevant to its financial statements. IFRS 9, Financial Instruments, is effective for annual reporting periods beginning on
or after January 1, 2015 (previously January 1, 2013). The standard retains but simplifies the mixed measurement model and establishes two primary measurement categories for financial assets: amortised cost and fair value. The standard includes guidance on classification and measurement of financial liabilities designated as fair value through profit or loss and incorporates certain existing requirements of IAS 39,Financial Instruments: Recognition and Measurement, on the recognition and de-recognition of financial assets and financial liabilities. The Bank is assessing the impact that the standard will have on its 2015 financial statements.
IFRS 13, Fair Value Measurement, which is effective for annual reporting periods beginning on or after January 1, 2013, defines fair value, establishes a framework for measuring fair value and sets out disclosure requirements for fair value measurements. It explains how to measure fair value and is applicable to assets, liabilities and an entity’s own equity instruments that, under other IFRSs, are required or permitted to be measured at fair value, or when disclosure of fair values is provided. It does not introduce new fair value measurements, nor does it eliminate the practicability exceptions to fair value measurements that currently exist in certain standards. The Bank is assessing the impact that the standard will have on its 2013 financial statements.
IAS 19, Employee Benefits, has been amended, effective for annual reporting periods
beginning on or after January 1, 2013, to require all actuarial gains and losses to be recognised immediately in other comprehensive income. This change will remove the corridor method and eliminate the ability for entities to recognize all changes in the defined benefit obligation and in plan assets in profit or loss. The expected return on plan assets recognized in profit or loss is to be calculated based on the rate used to discount the defined benefit obligation. The amendment also includes changes to the definitions and disclosure requirements in the current standard. The Bank is assessing the impact that the standard will have on its 2013 financial statements.

- xx -Final Accounts for Year Ended 31 December 2012
Bank of Jamaica
BANK OF JAMAICA Notes to the Financial Statements (Continued) Year ended December 31, 2012
2. Statement of compliance, basis of preparation and significant accounting policies (continued)
(m) New, revised and amended standards and interpretations (continued):
New, revised and amended standards and interpretations that are not yet effective (continued):
IAS 1, Presentation of Financial Statements, was amended by the issue of
“Presentation of Financial Statements: Presentation of Items of Other Comprehensive Income”, effective for annual reporting periods beginning on or after July 1, 2012, which requires an entity to present separately the items of other comprehensive income (“OCI”) that may be reclassified to profit or loss in the future from those that would never be reclassified to profit or loss. It does not change the existing option to present the profit or loss and other comprehensive income in two statements but changes the title of the ‘Statement of Comprehensive Income’ to ‘Statement of Profit or Loss and Other Comprehensive Income’. The Bank is assessing the impact that the amendment will have on its 2013 financial statements.
Amendments to IAS 32, Financial Instruments: Presentation, which is effective for annual reporting periods beginning on or after January 1, 2014, clarifies those conditions needed to meet the criteria specified for offsetting financial assets and liabilities. It requires the entity to prove that there is a legally enforceable right to set off the recognised amounts. Conditions such as whether the set off is contingent on a future event and the nature and right of set-off and laws applicable to the relationships between the parties involved should be examined. Additionally, to meet the criteria, an entity should intend to either settle on a net basis or to realise the asset and settle the liability simultaneously. The Bank is assessing the impact that the amendment will have on its 2014 financial statements.
Improvements to IFRS 2009-2011 contains amendments to certain standards and
interpretations and are effective for annual reporting periods beginning on or after January 1, 2013. The main amendments applicable to the Bank are as follows:
IAS 1, Presentation of Financial Statements, has been amended to clarify that
only one comparative period, which is the preceding period, is required for a complete set of financial statements. IAS 1 requires the presentation of an opening statement of financial position when an entity applies an accounting policy retrospectively or makes a retrospective restatement or reclassification. IAS 1 has been amended to clarify that (a) the opening statement of financial position is required only if a change in accounting policy, a retrospective restatement or a reclassification has a material effect upon the information in that statement of financial position; (b) except for the disclosures required under IAS 8, notes related to the opening statement of financial position are no longer required; and (c) the appropriate date for the opening statement of financial position is the beginning of the preceding period, rather than the beginning of the earliest comparative period presented. The Bank is assessing the impact that the standard will have on its 2013 financial statements.
- xxi -
Annual Report 2012
Final Accounts for Year Ended 31 December 2012
BANK OF JAMAICA Notes to the Financial Statements (Continued) Year ended December 31, 2012
2. Statement of compliance, basis of preparation and significant accounting policies (continued)
(m) New, revised and amended standards and interpretations (continued):
New, revised and amended standards and interpretations that are not yet effective (continued):
IAS 16, Property, Plant and Equipment, has been amended to clarify that the definition of ‘property, plant and equipment’ in IAS 16 is now considered in determining whether spare parts, standby-by equipment and servicing equipment should be accounted for under the standard. If these items do not meet the definition, then they are accounted for using IAS 2, Inventories. The Bank is assessing the impact that the standard will have on its 2013 financial statements.
IAS 32, Financial Instruments: Presentation, has been amended to clarify that IAS 12, Income Taxes, applies to the accounting for income taxes relating to distributions to holders of an equity instrument and transaction costs of an equity transaction. The Bank is assessing the impact that the standard will have on its 2013 financial statements.
(n) Related party balances and transactions:
A related party is a person or entity that is related to the Bank.
i) A person or a close member of that person’s family is related to the Bank if that person:
(a) has control or joint control over the Bank;
(b) has significant influence over the Bank; or
(c) is a member of the key management personnel of the Bank
ii) An entity is related to the Bank if any of the following conditions applies:
(a) The entity and the Bank are members of the same group (which means that each parent, subsidiary and fellow subsidiary is related to the others).
(b) The entity is a post-employment benefit plan for the benefit of employees of either the Bank or an entity related to the Bank.
(c) The entity is controlled, or jointly controlled by a person identified in (i) (a).
(d) A person identified in (i) (a) has significant influence over the Bank or is a member of the key management personnel of the Bank.
A related party transaction is a transfer of resources, services or obligations between related parties, regardless of whether a price is charged.
3. Cash and cash equivalents
2012 2011 J$'000 J$'000
Current accounts and money at call with foreign banks 29,051,024 35,504,889 Current accounts with local banks 733,447 638,024
29,784,471 36,142,913

- xxii -Final Accounts for Year Ended 31 December 2012
Bank of Jamaica
BANK OF JAMAICA Notes to the Financial Statements (Continued) Year ended December 31, 2012
4. Interest in funds managed by agents
This represents investments managed by Crown Agents Investment Management Limited (CAIML) on behalf of the Bank. The portfolio consists of investments in government bonds, treasury bills, corporate bonds and cash denominated in United States dollars and other currencies. The portion denominated in other currencies is hedged in United States dollars as required by the agreement in place between the Bank and CAIML.
5. Foreign currency denominated investments 2012 2011 J$'000 J$'000
Available-for-sale securities: US Government securities 34,711,648 47,396,266
Loans and receivables: Short-term deposits with foreign banks 79,663,554 117,923,363 Caribbean Development Bank bond - 1,726,710
79,663,554 119,650,073
114,375,202 167,046,339 6. Loan and advances
The Bank has granted loans and advances to certain financial institutions. These loans were collaterised by securities issued or guaranteed by the Government of Jamaica.
2012 2011 J$'000 J$'000
Denominated in Jamaica dollars 1,000,000 -
As at the reporting date, the fair value of the securities obtained and held by the Bank for the loans and advances granted was $1,330,532. All loans and advances mature within twelve months after the reporting date.
7. Local currency denominated investments 2012 2011 J$'000 J$'000
Available-for-sale securities: Jamaica Government Securities: Treasury bills 38 91 Variable rate benchmark investments 74,017,330 73,710,954 Fixed rate benchmark investments 18,142,488 19,109,804
92,159,856 92,820,849

- xxiii -
Annual Report 2012
Final Accounts for Year Ended 31 December 2012
BANK OF JAMAICA Notes to the Financial Statements (Continued) Year ended December 31, 2012
8. International Monetary Fund – Quota Subscription
This represents the portion of Jamaica's fee for membership of the International Monetary Fund (IMF), based on its quota, which was paid by the Bank (the other portion having been subscribed by the Government of Jamaica).
Quotas are reviewed every five years, when adjustments may be considered.
2012 2011 SDR'000 J$'000 J$'000 Amount subscribed (net of reserve tranche of J$Nil): At beginning of year 31,125 4,315,897 4,182,062
Effect of exchange rate fluctuation - ( 109,191) 133,835
At end of year 31,125 4,206,706 4,315,897
9. Due from Government and Government Agencies
2012 Movements during the year Dec. 31, Advances/ (Settlement)/ Dec. 31, 2011 losses profit 2012 J$'000 J$'000 J$'000 J$'000
Withholding tax refund due 2,134,009 1,142,727 - 3,276,736 Accrued interest on Government securities 3,353,876 3,437,751 (3,353,876) 3,437,751 Net loss receivable
from Consolidated Fund 13,366,961 - (3,655,097) 9,711,864
18,854,846 4,580,478 (7,008,973) 16,426,351
2011 Movements during the year Dec. 31, Advances/ (Settlement)/ Dec. 31, 2010 losses profit 2011 J$'000 J$'000 J$'000 J$'000
Withholding tax refund due 1,339,767 794,242 - 2,134,009
Accrued interest on Government securities 5,350,558 3,353,876 (5,350,558) 3,353,876 Net loss receivable from Consolidated Fund 11,871,571 1,495,390 - 13,366,961
18,561,896 5,643,508 (5,350,558) 18,854,846
(a) By virtue of Section 36 of the Act, the Bank is empowered to make advances to the government up to thirty percent of the estimated revenue of Jamaica for the financial year of the Government. Such advances are to be repaid within three months of the end of the financial year in which the advances were made. Where advances are not duly paid the Bank is prohibited from granting further advances in any subsequent financial year until the outstanding advances are repaid.

- xxiv -Final Accounts for Year Ended 31 December 2012
Bank of Jamaica
BANK OF JAMAICA Notes to the Financial Statements (Continued) Year ended December 31, 2012
9. Due from Government and Government Agencies (continued)
(a) (Continued) During 2012, the Bank extended credit to the Government by way of temporary advances. The amount advanced was $7.5 billion which was repaid during the year. No advances were made to the Government during 2011.
(b) The Government is required by the Act to pay to the Bank, out of the Consolidated Fund,
amounts to cover losses incurred by the Bank. Section 9 (3) of the Act provides that if in the opinion of the Minister of Finance payment to clear the losses cannot be made from the Consolidated Fund, such losses may be cleared by the issue of securities to the Bank chargeable to the Consolidated Fund. At the reporting date, losses as at 2012 of $9,711.84 million (2011: 13,366.96 million) remained unsettled.
10. Property, plant and equipment Freehold Furniture, land and Leasehold plant and Motor Work-in- buildings property equipment vehicles progress Total J$'000 J$'000 J$'000 J$'000 J$'000 J$'000 Cost or valuation:
December 31, 2010 2,414,437 10,960 1,441,685 389,357 8,485 4,264,924
Additions 17,725 4,861 62,198 97,893 32,940 215,617 Transfer from investment property 515,507 - - - - 515,507 Other transfers 8,485 - - - ( 8,485) - Disposals/write-offs - - ( 2,503) (112,798) - ( 115,301)
December 31, 2011 2,956,154 15,821 1,501,380 374,452 32,940 4,880,747
Additions 73,930 19,277 81,409 70,091 - 244,707 Transfers 23,719 9,221 - - (32,940) - Disposals/write-offs ( 87) - ( 3,265) ( 62,244) - ( 65,596)
December 31, 2012 3,053,716 44,319 1,579,524 382,299 - 5,059,858
At cost 120,255 44,319 1,579,524 382,299 - 2,216,397 At valuation 2,843,461 - - - - 2,843,461
3,053,716 44,319 1,579,524 382,299 - 5,059,858 Depreciation: December 31, 2010 118,052 4,507 884,061 111,658 - 1,118,278 Charge for the year 120,538 1,575 113,117 74,728 - 309,958 Eliminated on disposals - - - ( 68,814) - ( 68,814)
December 31, 2011 238,590 6,082 997,178 117,572 - 1,359,422 Charge for the year 125,521 4,433 113,534 75,833 - 319,321 Eliminated on disposals - - ( 3,300) ( 39,598) - ( 42,898)
December 31, 2012 364,111 10,515 1,107,412 153,807 - 1,635,845
Net book values: December 31, 2012 2,689,605 33,804 472,112 228,492 - 3,424,013
December 31, 2011 2,717,564 9,739 504,202 256,880 32,940 3,521,325
December 31, 2010 2,296,385 6,453 557,624 277,699 8,485 3,146,646

- xxv -
Annual Report 2012
Final Accounts for Year Ended 31 December 2012
BANK OF JAMAICA Notes to the Financial Statements (Continued) Year ended December 31, 2012
10. Property, plant and equipment (continued)
The Bank’s land and buildings were revalued in January 2010 by The C. D. Alexander Company Realty Limited, Real Estate Broker, Appraiser and Auctioneer on the open-market, existing-use basis. The surplus arising on revaluation, inclusive of depreciation no longer required, is included in property revaluation reserve [note 22(b)].
Management is of the opinion that there was no significant change in the value of land and building
between the valuation date and the year end. 11. Intangible asset Computer Work-in software progress Total J$’000 J$’000 J$’000 Cost or valuation: December 31, 2010 420,370 4,615 424,985 Additions 8,541 - 8,541
December 31, 2011 428,911 4,615 433,526 Additions 17,928 - 17,928 Transfers 4,615 ( 4,615) -
December 31, 2012 451,454 - 451,454 Amortisation: December 31, 2010 327,525 - 327,525
Charge for the year 58,603 - 58,603
December 31, 2011 386,128 - 386,128 Charge for the year 35,082 - 35,082
December 31, 2012 421,210 - 421,210 Net book values: December 31, 2012 30,244 - 30,244
December 31, 2011 42,783 4,615 47,398
December 31, 2010 92,845 4,615 97,460
12. Employee benefits
The Bank operates non-contributory defined benefit pension, medical, and life insurance schemes for all its permanent eligible employees and funds supplemental retirement benefits. Benefits under the pension scheme are computed by reference to final salary. The assets of the scheme, which are held separately from those of the Bank, are under the control of a board of trustees, with day-to-day management by employees of the Bank.
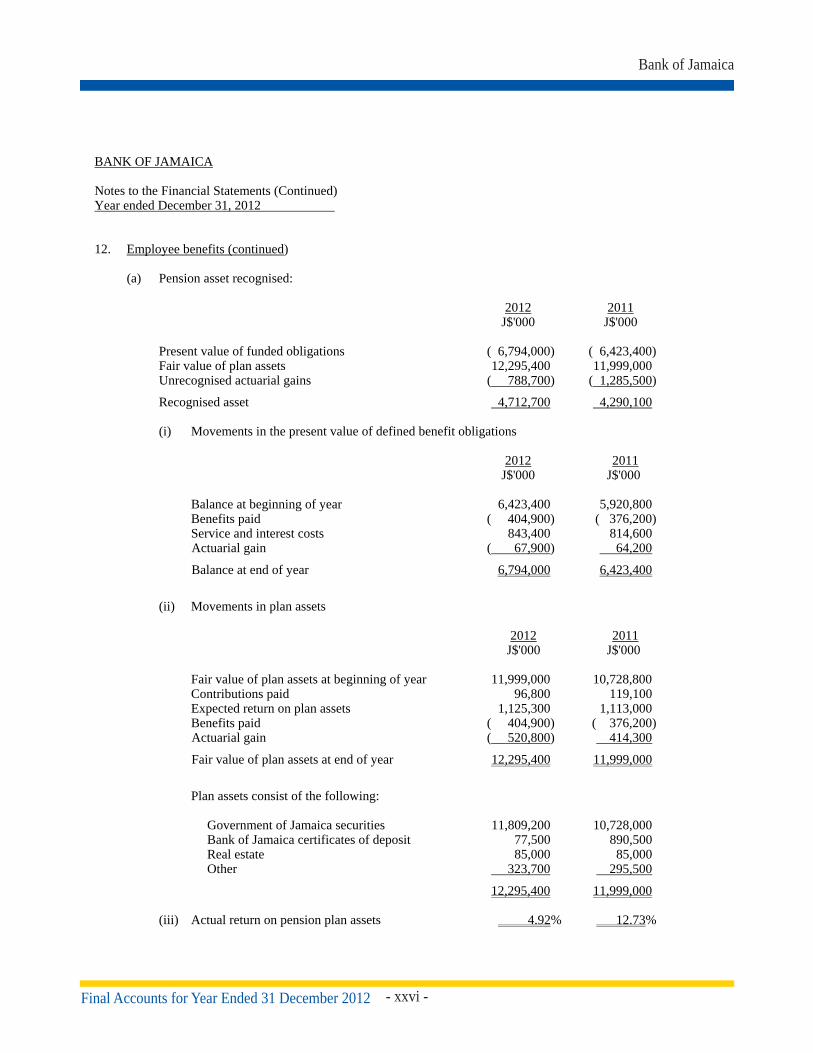
- xxvi -Final Accounts for Year Ended 31 December 2012
Bank of Jamaica
BANK OF JAMAICA Notes to the Financial Statements (Continued) Year ended December 31, 2012
12. Employee benefits (continued)
(a) Pension asset recognised:
2012 2011 J$'000 J$'000
Present value of funded obligations ( 6,794,000) ( 6,423,400) Fair value of plan assets 12,295,400 11,999,000 Unrecognised actuarial gains ( 788,700) ( 1,285,500)
Recognised asset 4,712,700 4,290,100
(i) Movements in the present value of defined benefit obligations
2012 2011 J$'000 J$'000
Balance at beginning of year 6,423,400 5,920,800 Benefits paid ( 404,900) ( 376,200) Service and interest costs 843,400 814,600 Actuarial gain ( 67,900) 64,200
Balance at end of year 6,794,000 6,423,400
(ii) Movements in plan assets
2012 2011 J$'000 J$'000
Fair value of plan assets at beginning of year 11,999,000 10,728,800 Contributions paid 96,800 119,100 Expected return on plan assets 1,125,300 1,113,000 Benefits paid ( 404,900) ( 376,200) Actuarial gain ( 520,800) 414,300
Fair value of plan assets at end of year 12,295,400 11,999,000
Plan assets consist of the following:
Government of Jamaica securities 11,809,200 10,728,000 Bank of Jamaica certificates of deposit 77,500 890,500 Real estate 85,000 85,000 Other 323,700 295,500
12,295,400 11,999,000
(iii) Actual return on pension plan assets 4.92% 12.73%

- xxvii -
Annual Report 2012
Final Accounts for Year Ended 31 December 2012
BANK OF JAMAICA Notes to the Financial Statements (Continued) Year ended December 31, 2012
12. Employee benefits (continued): (a) Pension asset recognised (continued):
(iv) Credit recognised in profit or loss
2012 2011 J$'000 J$'000
Current service costs 164,300 165,800 Interest on obligations 642,300 648,800 Expected return on plan assets (1,125,300) (1,113,000) Net actuarial gain recognised ( 3,500) -
( 322,200) ( 298,400)
(v) Principal actuarial assumptions at the reporting date (expressed as weighted averages)
2011 2010 % %
Discount rate 10.5 10.0 Expected return on plan assets 9.0 9.5 Future salary increases 7 6.0
The overall expected long-term rate of return on assets is 9.0% (2010: 9.5%). The expected long-term rate of return is based on an assumed inflation rate of 7% (2010: 6%).
(vi) Historical information
Defined benefit pension plan
2012 2011 2010 2009 2008 J$'000 J$'000 J$'000 J$'000 J$'000
Present value of the defined benefit obligation ( 6,794,000) ( 6,423,400) ( 5,920,800) (4,456,300) (4,169,700)
Fair value of plan assets 12,295,400 11,999,000 10,728,800 8,976,200 7,748,000 Surplus in plan 5,501,400 5,576,000 4,808,000 4,519,900 3,578,300 Experience adjustments arising
on plan liabilities 205,300 ( 85,700) 391,000 321,000 ( 345,500) Experience adjustments arising
on plan assets ( 520,800) 414,300 511,000 155,800 197,500
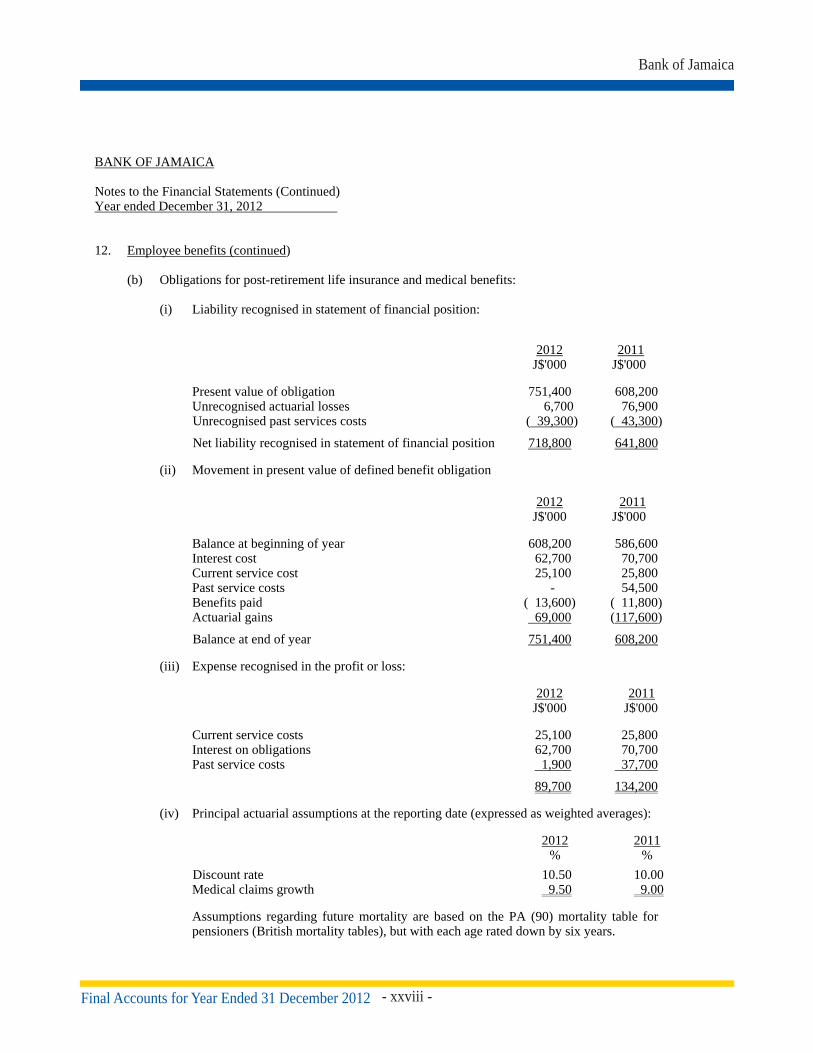
- xxviii -Final Accounts for Year Ended 31 December 2012
Bank of Jamaica
BANK OF JAMAICA Notes to the Financial Statements (Continued) Year ended December 31, 2012
12. Employee benefits (continued)
(b) Obligations for post-retirement life insurance and medical benefits:
(i) Liability recognised in statement of financial position:
2012 2011 J$'000 J$'000
Present value of obligation 751,400 608,200 Unrecognised actuarial losses 6,700 76,900 Unrecognised past services costs ( 39,300) ( 43,300)
Net liability recognised in statement of financial position 718,800 641,800
(ii) Movement in present value of defined benefit obligation
2012 2011 J$'000 J$'000
Balance at beginning of year 608,200 586,600 Interest cost 62,700 70,700 Current service cost 25,100 25,800 Past service costs - 54,500 Benefits paid ( 13,600) ( 11,800) Actuarial gains 69,000 (117,600)
Balance at end of year 751,400 608,200
(iii) Expense recognised in the profit or loss: 2012 2011 J$'000 J$'000
Current service costs 25,100 25,800 Interest on obligations 62,700 70,700 Past service costs 1,900 37,700
89,700 134,200
(iv) Principal actuarial assumptions at the reporting date (expressed as weighted averages):
2012 2011 % %
Discount rate 10.50 10.00 Medical claims growth 9.50 9.00
Assumptions regarding future mortality are based on the PA (90) mortality table for pensioners (British mortality tables), but with each age rated down by six years.

- xxix -
Annual Report 2012
Final Accounts for Year Ended 31 December 2012
BANK OF JAMAICA Notes to the Financial Statements (Continued) Year ended December 31, 2012
12. Employee benefits (continued)
(b) Obligations for post-retirement life insurance and medical benefits (continued):
(v) Historical information
Post-employment medical benefits 2012 2011 2010 2009 2008
J$'000 J$'000 J$'000 J$'000 J$'000
Present value of obligations 751,400 608,200 586,600 550,700 1,964,800 Experience adjustments arising
on plan liabilities ( 69,800) 117,700 ( 72,800) (152,400) ( 59,400)
(c) Assumed trend in health care cost has a significant effect on the amounts recognised in profit or loss. A one percentage point change in assumed health care cost trend rates would have the following effects:
One One percentage percentage point increase point decrease J$'000 J$'000
Effect on the aggregate service and interest cost 21,700 ( 16,200) Effect on the defined benefit obligation 155,000 (119,600)
(d) The estimated pension contributions expected to be paid into the plan during the next
financial year is J$103,000,000 (2011: J$136,900,000). 13. Other assets 2012 2011 J$'000 J$'000 Items in process of collection 979 2,729 Overdrafts - 1,088 Staff loans 1,891,723 1,745,383 Ex-staff loans 37,818 33,697 Stock of unissued notes and coins 2,354,966 1,755,072 SDR equalisation [note 15(c)] - 3,151,503 Accrued interest receivable other than on GOJ securities 207,226 278,412 Other 212,773 304,066
4,705,485 7,271,950 Less:
Re-measurement of staff loans ( 651,253) ( 594,641) Provision for loan loss on ex-staff loans ( 11,605) ( 11,605)
4,042,627 6,665,704

- xxx -Final Accounts for Year Ended 31 December 2012
Bank of Jamaica
BANK OF JAMAICA Notes to the Financial Statements (Continued) Year ended December 31, 2012
14. Notes and coins in circulation 2012 2011 J$'000 J$'000 Notes 62,150,162 60,343,817 Coins 2,542,786 2,331,390 64,692,948 62,675,207 Section 21 of the Act requires the Bank to hold specified assets of an amount in value sufficient
to cover the value of the total amount of notes and coins in circulation as defined in that section. The assets held shall include, inter alia, (a) gold; (b) "hard currency" cash, bank balances or securities issued by a foreign government or international financial institution of which Jamaica is a member; or (c) Special Drawing Rights. Specified assets held by the Bank, as at December 31, 2012, were 3.88 (2011: 4.49) times the value of notes and coins in circulation at that date.
Coins in circulation are shown net of a reserve of 25% of the gross amount of coins in circulation (note 21).
15. Deposits and other demand liabilities 2012 2011 J$'000 J$'000
Government and Government agencies 8,902,218 39,604,185 Commercial banks and specified financial institutions 68,385,891 58,371,407
International Monetary Fund 73,318,622 75,222,624 Others 2,080,665 2,081,677
152,687,396 175,279,893 Jamaica dollar equivalent of foreign currency deposits 101,395,792 119,781,738 Jamaica dollar deposits 51,291,604 55,498,155
152,687,396 175,279,893
(a) Deposit and other demand liabilities include the reserve deposits prescribed by Section 28 of the Bank of Jamaica Act, Section 14 of the Banking Act, Section 14 of the Financial Institutions Act and Section 31 of the Building Societies Regulations. Reserve deposits at the reporting date were $50,131.14 million (2011: $44,756.55 million).
(b) Under Section 28A of the Bank of Jamaica Act, commercial banks and specified financial institutions may be required to make special deposits with the Bank of Jamaica in the form of cash or specified securities. There were no special deposits at the reporting date.
(c) IMF deposits of J$73,318.62 million (2011: J$75,222.62 million) include J$73,226.21 million (2011:J$75,127.81million) representing the SDR541.80 million of drawdowns under the 2010 Standby Agreement between the IMF and the Government of Jamaica converted to Jamaica dollar at the exchange rate of SDR0.00739899:J$1.00 (SDR0.00721171) the rate obtaining at April 30, 2012 (April 30, 2011). At the reporting date, the rate of exchange was SDR0.00701470844:J$1.00 (2011:SDR0.0075277031: J$1.00) which increased the required deposit to J$77,342.31 million (2011: J$72,078.05 million). This led to revaluation loss of J$4,016.40 million (2011: gain of J$3,151.50 million) (notes 13 and 18).
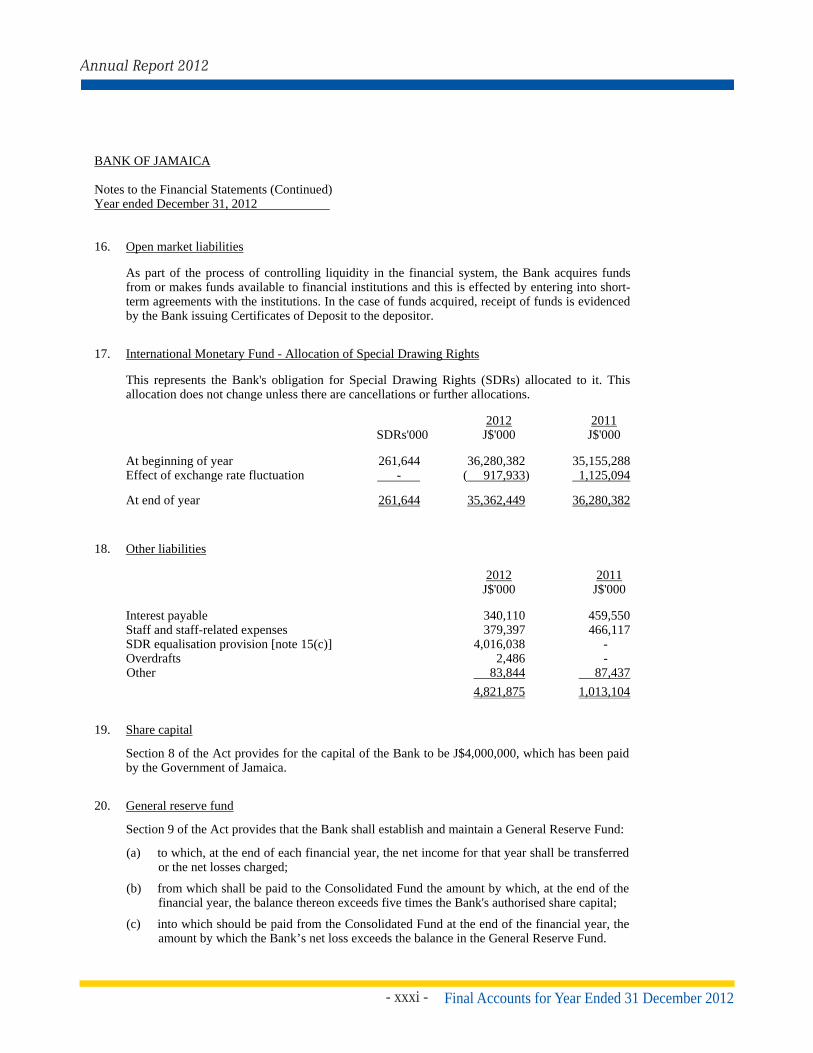
- xxxi -
Annual Report 2012
Final Accounts for Year Ended 31 December 2012
BANK OF JAMAICA Notes to the Financial Statements (Continued) Year ended December 31, 2012
16. Open market liabilities As part of the process of controlling liquidity in the financial system, the Bank acquires funds
from or makes funds available to financial institutions and this is effected by entering into short-term agreements with the institutions. In the case of funds acquired, receipt of funds is evidenced by the Bank issuing Certificates of Deposit to the depositor.
17. International Monetary Fund - Allocation of Special Drawing Rights This represents the Bank's obligation for Special Drawing Rights (SDRs) allocated to it. This
allocation does not change unless there are cancellations or further allocations. 2012 2011 SDRs'000 J$'000 J$'000 At beginning of year 261,644 36,280,382 35,155,288 Effect of exchange rate fluctuation - ( 917,933) 1,125,094
At end of year 261,644 35,362,449 36,280,382
18. Other liabilities 2012 2011 J$'000 J$'000 Interest payable 340,110 459,550 Staff and staff-related expenses 379,397 466,117 SDR equalisation provision [note 15(c)] 4,016,038 - Overdrafts 2,486 -
Other 83,844 87,437 4,821,875 1,013,104 19. Share capital
Section 8 of the Act provides for the capital of the Bank to be J$4,000,000, which has been paid by the Government of Jamaica.
20. General reserve fund Section 9 of the Act provides that the Bank shall establish and maintain a General Reserve Fund:
(a) to which, at the end of each financial year, the net income for that year shall be transferred
or the net losses charged;
(b) from which shall be paid to the Consolidated Fund the amount by which, at the end of the financial year, the balance thereon exceeds five times the Bank's authorised share capital;
(c) into which should be paid from the Consolidated Fund at the end of the financial year, the amount by which the Bank’s net loss exceeds the balance in the General Reserve Fund.
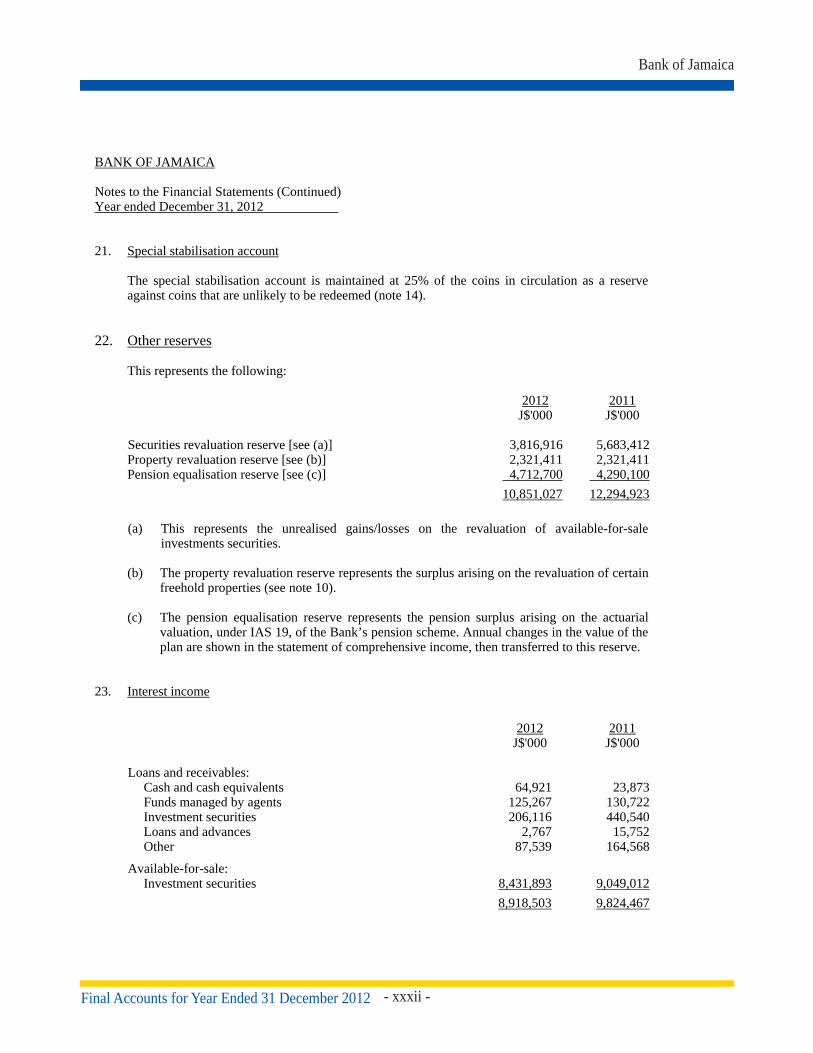
- xxxii -Final Accounts for Year Ended 31 December 2012
Bank of Jamaica
BANK OF JAMAICA Notes to the Financial Statements (Continued) Year ended December 31, 2012
21. Special stabilisation account
The special stabilisation account is maintained at 25% of the coins in circulation as a reserve against coins that are unlikely to be redeemed (note 14).
22. Other reserves This represents the following: 2012 2011 J$'000 J$'000 Securities revaluation reserve [see (a)] 3,816,916 5,683,412 Property revaluation reserve [see (b)] 2,321,411 2,321,411 Pension equalisation reserve [see (c)] 4,712,700 4,290,100 10,851,027 12,294,923 (a) This represents the unrealised gains/losses on the revaluation of available-for-sale
investments securities. (b) The property revaluation reserve represents the surplus arising on the revaluation of certain
freehold properties (see note 10). (c) The pension equalisation reserve represents the pension surplus arising on the actuarial
valuation, under IAS 19, of the Bank’s pension scheme. Annual changes in the value of the plan are shown in the statement of comprehensive income, then transferred to this reserve.
23. Interest income
2012 2011 J$'000 J$'000
Loans and receivables: Cash and cash equivalents 64,921 23,873 Funds managed by agents 125,267 130,722 Investment securities 206,116 440,540 Loans and advances 2,767 15,752 Other 87,539 164,568
Available-for-sale: Investment securities 8,431,893 9,049,012
8,918,503 9,824,467

- xxxiii -
Annual Report 2012
Final Accounts for Year Ended 31 December 2012
BANK OF JAMAICA Notes to the Financial Statements (Continued) Year ended December 31, 2012
24. Foreign exchange gain, net 2012 2011
J$'000 J$'000 Net unrealised gain on translation of foreign currency assets and liabilities and realised gain on settlement of foreign assets and foreign liabilities 5,417,943 3,593,000
Exchange gain on purchases and sales of foreign currencies 379,562 184,670 5,797,505 3,777,670 25. Interest expense
2012 2011 J$'000 J$'000
Certificates of deposit 4,616,797 7,892,406 Government and Government agencies (note 28) 610,790 834,059 Commercial banks and specified financial institutions 94,377 80,106 Other 814 1,868
5,322,778 8,808,439 26. Staff numbers and costs
The number of employees at the end of the year was 508 (2011: 519) full-time and 78 (2011: 86) contract. The related costs for these employees were as follows:
2012 2011 J$'000 J$'000
Salaries and wages 1,902,596 2,178,116 Statutory payroll contributions 118,267 125,788 Uniforms 29,015 20,847 Other staff costs 140,539 120,750 Staff development 45,093 33,379
2,235,510 2,478,880 27. Operating expenses Operating expenses include the following charges:
2012 2011 J$'000 J$'000 Depreciation (note 10) 319,321 309,958 Amortisation (note 11) 35,082 58,603 Auditors' remuneration 10,600 9,900 Payments for redundancies - 48,899

- xxxiv -Final Accounts for Year Ended 31 December 2012
Bank of Jamaica
BANK OF JAMAICA Notes to the Financial Statements (Continued) Year ended December 31, 2012
28. Related party balances The Bank has a related party relationship with its Board of Directors, the members of the
Executive management, the Bank of Jamaica pension scheme and the Government of Jamaica and its agencies (see notes 9 and 15). Membership of the executive management consists of twelve (12) persons.
The statement of financial position includes balances, arising in the ordinary course of business,
with related parties, as follows: 2012 2011 J$'000 J$'000 Loans: Executive management (included in staff loans note 13) 83,290 83,578 Open market liabilities:
Pension fund 77,500 890,500 The interest rates applicable on loans to executive management range from 3% - 5%. In addition,
a deemed taxable income is computed on the interest saved by virtue of the concessionary interest rate. No non-executive director receives emoluments or is in receipt of a loan from the Bank.
The statement of comprehensive income includes income earned from/expenses incurred in
transactions with related parties, in the ordinary course of business, as follows: 2012 2011 J$'000 J$'000
Interest expense: Government and Government agencies (note 25) 610,790 834,059
Pension scheme 30,444 62,950 Executive management 3,106 4,648
Interest income: Executive management 2,598 2,535
Pension contribution: Pension scheme 101,173 156,816
Executive management compensation is as follows: 2012 2011 J$'000 J$'000 Emoluments included in staff costs (note 26) 161,327 226,196

- xxxv -
Annual Report 2012
Final Accounts for Year Ended 31 December 2012
BANK OF JAMAICA Notes to the Financial Statements (Continued) Year ended December 31, 2012
29. Commitments At the reporting date the Bank had:
(a) Capital commitments as follows:
2012 2011 J$'000 J$'000 Authorised and contracted 19,783 514,549
Authorised but not contracted 9,917 22,661
29,700 537,210
(b) Operating lease commitments, payable as follows:
2012 2011 J$'000 J$'000 Within one year 9,621 9,641 30. Contingent liabilities
At December 31, 2012 and 2011, the Bank was a defendant in various relatively minor suits claiming damages. The Bank is of the view that the claims are generally without merit and will not result in any significant losses to the Bank. There are no lawsuits pending with the Bank as plaintiff as at December 31, 2012 and December 31, 2011.
31. Fair value of financial instruments
Fair value is the arm’s length consideration for which an asset could be exchanged or a liability settled, between knowledgeable, willing parties, who are under no compulsion to act and is best evidenced by a quoted market price, if one exists. Determination of fair value: The financial instruments held at the reporting date are: cash and cash equivalents, interest in funds managed by agents, loans and advances, foreign and local currency denominated investments, International Monetary Fund – Holding of Special Drawing Rights, due from Government and Government Agencies, other assets, deposits and other demand liabilities, open market liabilities, International Monetary Fund – Allocation of Special Drawing Rights, foreign liabilities and other liabilities. The fair value of foreign and local currency denominated investments is assumed to be equal to the estimated market values as provided in notes 5 and 7, respectively. These values are obtained on the basis outlined in note 2(d)(iii). The ranges of interest rates used to discount estimated cash flows, where applicable, are based on the yield curves from the Bank and Bloomberg at the reporting date and were as follows:

- xxxvi -Final Accounts for Year Ended 31 December 2012
Bank of Jamaica
BANK OF JAMAICA Notes to the Financial Statements (Continued) Year ended December 31, 2012
31. Fair value of financial instruments (continued)
2012 2011 % % Foreign currency denominated investment:
US$ bonds 0.16 – 4.87 0.78 – 5.25 Local Government of Jamaica securities:
Treasury bills 6.97 6.57 – 6.58 Variable rate benchmark investments 7.31 – 8.40 7.25 – 7.59 Fixed rate benchmark investments 12.25 – 12.875 12.00 – 13.250
The fair value of certain short-term financial instruments was determined to approximate their carrying value. No fair value has been estimated on the amount due from Government and Government Agencies, as there is no practical means of estimating its fair value.
Fair value hierarchy
The table below analyses financial instruments carried at fair value, by valuation method. The different levels have been defined as follows:
Level 1: quoted prices (unadjusted) in active markets for identical assets or liabilities
Level 2: inputs other than quoted prices included within Level 1 that are observable for the asset or liability, either directly (i.e., as prices) or indirectly (i.e., derived from prices)
Level 3: inputs for the asset or liability that are not based on observable market data (unobservable inputs).
December 31, 2012 Level 1 Level 2 Level 3 Total J$'000 J$'000 J$'000 J$'000
Available-for-sale financial assets 34,711,648 92,159,856 - 126,871,504
December 31, 2011 Level 1 Level 2 Level 3 Total J$'000 J$'000 J$'000 J$'000
Available-for-sale financial assets 47,396,266 92,820,849 - 140,217,115

- xxxvii -
Annual Report 2012
Final Accounts for Year Ended 31 December 2012
BANK OF JAMAICA Notes to the Financial Statements (Continued) Year ended December 31, 2012
32. Financial risk management
(a) Introduction and overview
The Bank has exposure to the following risks from its use of financial instruments: credit risk liquidity risk market risks
The Board of Directors has overall responsibility for the establishment and oversight of the Bank’s risk management framework. The Bank has established an Investment Committee which is responsible for providing oversight on the conversion of investment strategy into performance, portfolio construction and risk modelling. There is also a Credit Committee which is responsible for evaluating and approving applications for staff loans. Both committees report to the Committee of Administration, which reports on a regular basis to the Board of Directors.
The Bank’s Audit Committee is responsible for monitoring compliance with the Bank’s risk management policies and procedures and for reviewing the adequacy of the risk management framework in relation to the risks faced by the Bank. The Audit Committee is assisted in these functions by the Internal Audit Department. This department undertakes both regular and ad hoc reviews of risk management controls and procedures, the results of which are reported to the Board of Directors and the Audit Committee.
(b) Credit risk
Credit risk is the risk of loss arising from a counter-party to a financial contract failing to discharge its obligations. This risk arises primarily from the Bank’s foreign and local currency investment securities, loans and advances, cash and cash equivalents, interest in funds managed by agents and other assets.
(i) Management of credit risk on classes of financial assets exposed to that risk:
Foreign currency investments and interest in funds managed by agents
Credit risk in the foreign currency investment portfolio is managed by restricting the holdings of investments substantially to US Government securities, other highly rated sovereign securities, Jamaica Government US$ debentures and placements in highly rated supranational institutions. The Bank uses the credit rating ascribed by Moody’s Investor Services and Standard & Poor Corporation as its main criterion for assessing the creditworthiness of financial institutions and sovereigns. The Bank’s foreign investments are restricted to money market placements with financial institutions with minimum short-term credit ratings of A-1/P-2 and with minimum long-term ratings of Aa1/AA+. Additionally, capital market issues must have a minimum credit rating of Aa1/AA+. In order to reduce consolidated credit risk exposure, the Bank has investment limits in place. The Bank’s foreign investment portfolio consists of short-, medium- and long-term investments each of which have stipulated percentage limits (upper and lower) of the portfolio at market value.

- xxxviii -Final Accounts for Year Ended 31 December 2012
Bank of Jamaica
BANK OF JAMAICA Notes to the Financial Statements (Continued) Year ended December 31, 2012
32. Financial risk management (continued)
(b) Credit risk (continued)
(i) Management of credit risk on classes of financial assets exposed to that risk (cont’d): Local investment securities
Credit risk for local securities is managed by investing only in Government of Jamaica securities. Management does not expect this counterparty to fail to meet its obligations.
Loans and advances
Credit risk is managed by requiring institutions to deposit with the Bank of Jamaica or its agents designated securities sufficient to collateralise loans and advances. The collateral value of securities accepted is limited to a defined percentage of market value.
Cash and cash equivalents
Cash and cash equivalents are held in financial institutions which management regards as strong and there is no significant concentration. The strength of these financial institutions is constantly reviewed by the Investment Committee.
Other assets
Other credit exposures consist mainly of staff loans for housing and motor vehicles. There is a documented credit policy in place which guides the Bank’s credit process for staff loans. The policy includes established procedures for the authorisation of credit. Staff loans are limited to a percentage of the value of the assets being purchased. Mortgages and liens are obtained for staff housing and motor vehicle loans, respectively, which must also be insured.
(ii) Impaired loans and securities
Impaired loans and securities are loans and securities for which the Bank determines that it is probable that it will be unable to collect all principal and interest due according to the contractual terms of the loan or securities agreements.
(iii) Past due but not impaired loans and securities
These are loans and securities where contractual interest or principal payments are past due but the Bank believes that impairment is not appropriate on the basis of the level of security available or the stage of collection of amounts owed to the Bank.

- xxxix -
Annual Report 2012
Final Accounts for Year Ended 31 December 2012
BANK OF JAMAICA Notes to the Financial Statements (Continued) Year ended December 31, 2012
32. Financial risk management (continued)
(b) Credit risk (continued)
(iv) Loans with renegotiated terms
Loans with renegotiated terms are loans that have been restructured due to deterioration in the borrower’s financial position and where the Bank has made concessions that it would not otherwise consider. Once the loan is restructured, it remains in this category independent of satisfactory performance after restructuring. The Bank had no such loans as at December 31, 2012 and 2011.
(v) Allowances for impairment
The Bank established an allowance for impairment losses that represents its estimate of incurred losses in its loan portfolio. The allowance is the aggregate of the estimated losses on individual exposures.
(vi) Write-off policy
The Bank writes off a loan or security balance (and any related allowances for impairment losses) when the Bank determines that the loans or securities are uncollectible. This determination is usually made after considering information such as changes in the borrower’s financial position, or that proceeds from collateral will not be sufficient to pay back the entire exposure.
(vii) Exposure to credit risk
Current credit exposure is the amount of loss that the Bank would suffer if every counterparty to which the Bank was exposed were to default at once; this is represented substantially by the carrying amount of financial assets shown on the statement of financial position. Exposures to credit risk attached to financial assets are monitored through credit rating and lending limits, which are regularly reviewed. In addition, securities issued or guaranteed by the Government of Jamaica are required to collateralise advances to financial institutions. There has been no change to the nature of the Bank’s exposure to credit risk or the manner in which it manages and measures the risk.

- xl -Final Accounts for Year Ended 31 December 2012
Bank of Jamaica
BANK OF JAMAICA Notes to the Financial Statements (Continued) Year ended December 31, 2012
32. Financial risk management (continued)
(b) Credit risk (continued)
(vii) Exposure to credit risk (continued)
The Bank’s significant concentrations of credit exposure by geographical region (based on the region of ownership of the entity that issued the security or holds the cash or cash equivalents) are as follows:
2012 2011 J$'000 J$'000
Caribbean 94,376,499 99,837,241 North America 118,850,864 139,803,129 Europe 68,759,794 105,315,654 Other 266,936 932,710
Total financial assets 282,254,093 345,888,734
(c) Liquidity risk
Liquidity risk is the risk that the Bank will not be able to meet its financial liabilities as they fall due. Prudent liquidity management implies maintaining sufficient cash and marketable securities, and ensuring the availability of funding through an adequate amount of committed standby credit facilities to meet commitments.
The Bank’s exposure to liquidity risk to meet foreign liabilities, as an institution, is limited due to the minimal amount owed to overseas creditors/lenders. Management of liquidity risk relates primarily to the availability of liquid foreign resources to sell to the Government of Jamaica and its agencies to repay their suppliers and lenders. The Bank manages this risk through a combination of:
Budgetary procedures to identify the timing of Government foreign payments. Scheduling the maturity of foreign deposits to coincide with the demands of
Government and its Agencies. Maintaining a portion of its foreign assets in cash or near cash as precautionary funds
to meet unforeseen demands.
The Bank, like all central banks, has no real liquidity risk in relation to its domestic financial obligations.
The Bank is not subject to any imposed liquidity limit.
The following table presents the undiscounted contractual maturities of financial liabilities:
2012 Within 1 1 to 3 3 to 12 1 to 5 Month months months years Total
J$'000 J$'000 J$'000 J$'000 J$'000
Deposits and other demand liabilities 152,687,396 - - - 152,687,396 Open market liabilities 36,763,974 - 3,616,487 - 40,380,461 Foreign liabilities 16 - - - 16 Other 4,821,875 - - - 4,821,875 Commitments 1,425 968 36,928 - 39,321
194,274,686 968 3,653,415 - 197,929,069

- xli -
Annual Report 2012
Final Accounts for Year Ended 31 December 2012
BANK OF JAMAICA Notes to the Financial Statements (Continued) Year ended December 31, 2012
32. Financial risk management (continued)
(c) Liquidity risk (continued)
2011 Within 1 1 to 3 3 to 12 1 to 5 Month months months years Total
Deposits and other demand liabilities 175,279,893 - - - 175,279,893 Open market liabilities 78,137,201 120,000 7,267,554 - 85,524,755 Foreign liabilities 19 - - - 19 Other 1,013,104 - - - 1,013,104 Commitments 821 16,992 529,038 - 546,851
254,431,038 136,992 7,796,592 - 262,364,622 (d) Market risk
Market risk is the risk that changes in market prices, such as foreign exchange rates and interest rates, will affect the Bank’s income or the value of its holdings of financial instruments. The objective of market risk management is to manage and control market risk exposures within acceptable parameters, while optimising the return on risk. Market risk exposures are measured using sensitivity analysis. There has been no change to the Bank’s exposure to market risks or the manner in which it manages and measures the risk. (i) Currency risk
Currency risk is the risk that the market value of, or the cash flows from, financial instruments will vary because of exchange rate fluctuations. The Bank is exposed to foreign currency risk due to fluctuations in exchange rates on transactions and balances that are denominated in currencies other than the Jamaica dollar. At the reporting date, the Bank’s net exposure to foreign exchange rate fluctuations, in Jamaica dollar equivalent, was as follows, based on currencies in which reported amounts are denominated:
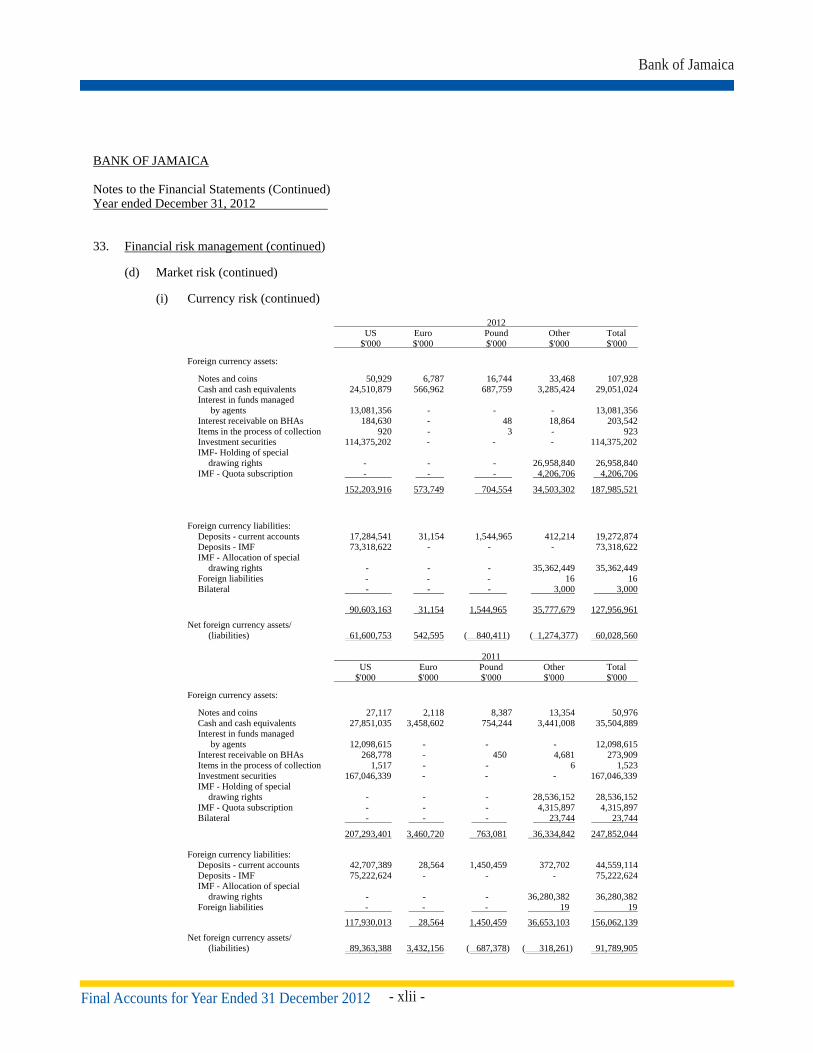
- xlii -Final Accounts for Year Ended 31 December 2012
Bank of Jamaica
INDEPENDENT AUDITORS’ REPORT
TO BANK OF JAMAICA
BANK OF JAMAICA Notes to the Financial Statements (Continued) Year ended December 31, 2012
33. Financial risk management (continued) (d) Market risk (continued)
(i) Currency risk (continued)
2012 US Euro Pound Other Total $'000 $'000 $'000 $'000 $'000
Foreign currency assets:
Notes and coins 50,929 6,787 16,744 33,468 107,928 Cash and cash equivalents 24,510,879 566,962 687,759 3,285,424 29,051,024 Interest in funds managed by agents 13,081,356 - - - 13,081,356
Interest receivable on BHAs 184,630 - 48 18,864 203,542 Items in the process of collection 920 - 3 - 923 Investment securities 114,375,202 - - - 114,375,202
IMF- Holding of special drawing rights - - - 26,958,840 26,958,840
IMF - Quota subscription - - - 4,206,706 4,206,706
152,203,916 573,749 704,554 34,503,302 187,985,521
Foreign currency liabilities: Deposits - current accounts 17,284,541 31,154 1,544,965 412,214 19,272,874 Deposits - IMF 73,318,622 - - - 73,318,622 IMF - Allocation of special
drawing rights - - - 35,362,449 35,362,449 Foreign liabilities - - - 16 16
Bilateral - - - 3,000 3,000
90,603,163 31,154 1,544,965 35,777,679 127,956,961 Net foreign currency assets/
(liabilities) 61,600,753 542,595 ( 840,411) ( 1,274,377) 60,028,560
2011 US Euro Pound Other Total $'000 $'000 $'000 $'000 $'000
Foreign currency assets:
Notes and coins 27,117 2,118 8,387 13,354 50,976 Cash and cash equivalents 27,851,035 3,458,602 754,244 3,441,008 35,504,889 Interest in funds managed by agents 12,098,615 - - - 12,098,615
Interest receivable on BHAs 268,778 - 450 4,681 273,909 Items in the process of collection 1,517 - - 6 1,523 Investment securities 167,046,339 - - - 167,046,339 IMF - Holding of special
drawing rights - - - 28,536,152 28,536,152 IMF - Quota subscription - - - 4,315,897 4,315,897 Bilateral - - - 23,744 23,744
207,293,401 3,460,720 763,081 36,334,842 247,852,044
Foreign currency liabilities: Deposits - current accounts 42,707,389 28,564 1,450,459 372,702 44,559,114 Deposits - IMF 75,222,624 - - - 75,222,624 IMF - Allocation of special
drawing rights - - - 36,280,382 36,280,382 Foreign liabilities - - - 19 19
117,930,013 28,564 1,450,459 36,653,103 156,062,139 Net foreign currency assets/
(liabilities) 89,363,388 3,432,156 ( 687,378) ( 318,261) 91,789,905

- xliii -
Annual Report 2012
Final Accounts for Year Ended 31 December 2012
BANK OF JAMAICA Notes to the Financial Statements (Continued) Year ended December 31, 2012
33. Financial risk management (continued)
(d) Market risk (continued) (i) Currency risk (continued) Exchange rates at December 31:
2012 2011
US$1 to J$ 92.68 86.34 UK£1 to J$ 150.65 134.17 CDN$1 to J$ 93.08 84.79 Є to J$ 122.18 112.08
At March 6, 2013, the date of approval of these financial statements, the exchange rates were US$1 to J$96.59, UK£1 to J$146.18, CDN$1 to J$94.09 and Є 1 to J$126.62.
Sensitivity analysis A 10% percent (2011: 0.5 percent) devaluation of the Jamaica Dollar against currencies which expose the Bank to risk at December 31 would have increased profit by $6,002,539 (2011: $458,950) while a 1% (2011: 0.5 percent) revaluation would have decreased profit by $600,254. The analysis assumes that all other variables, in particular, interest rates, remain constant. The analysis has been performed on the same basis as for 2011.
(ii) Interest rate risk:
Interest rate risk is the risk of loss from fluctuations in the future cash flows or fair values of financial instrument because of a change in market interest rates. It arises when there is a mismatch between interest-earning assets and interest-bearing liabilities which are subject to interest rate adjustments within a specified period. It can be reflected as a loss of future net interest income and/or a loss of current market values. The Bank manages this risk by monitoring interest rates daily and ensuring that, even though there is no formally predetermined gap limits, to the extent practicable, the maturity profile of its financial assets is, at least, matched by that of its financial liabilities. The following table summarises the carrying amounts of financial assets and liabilities to arrive at the Bank’s interest rate gap based on the earlier of contractual repricing and maturity dates.

- xliv -Final Accounts for Year Ended 31 December 2012
Bank of Jamaica
BANK OF JAMAICA Notes to the Financial Statements (Continued) Year ended December 31, 2012
33. Financial risk management (continued) (d) Market risk (continued)
(ii) Interest rate risk (continued): 2012 Weighted Within Three to Over Payable Non-rate average 3 months 12 months 12 months after notice sensitive Total interest J$'000 J$'000 J$'000 J$'000 J$'000 J$'000 % AssetsNotes and coins - - - - 187,201 187,201 - Cash and cash equivalents - - - - 29,784,471 29,784,471 - Interest in funds managed by agents - - - 13,081,356 - 13,081,356 0.97 Foreign currency denominated investments 1,865,207 2,628,872 109,881,123 - - 114,375,202 0.62 Loans and advances 1,000,000 - - - - 1,000,000 7.0 International Monetary Fund - Holding of Special Drawing Rights - - - - 26,958,840 26,958,840 - Local currency denominated investments 691,970 307,048 91,160,838 - - 92,159,856 8.91 International Monetary Fund – Quota Subscription - - - - 4,206,706 4,206,706 - Due from Government and Government Agencies - - - - 16,426,351 16, 426,351 - Other assets - - - - 4,042,627 4,042,627 -
Total financial assets 3,557,177 2,935,920 201,041,961 13,081,356 81,606,196 302,222,610 - Liabilities Notes and coins in circulation - - - - 64,692,948 64,692,948 - Deposits and other demand liabilities: Jamaica dollar equivalent of foreign currency deposits 84,456,678 - - 16,939,114 - 101,395,792 0.21 Jamaica dollar deposits 17,613,770 - - 33,677,834 - 51,291,604 0.72 Open market liabilities 36,763,974 3,616,487 - - - 40,380,461 6.3 International Monetary Fund – Allocation of Special Drawing Rights - - - - 35,362,449 35,362,449 - Foreign liabilities - - - - 16 16 - Bilateral accounts - - - - 3,000 3,000 - Other liabilities - - - - 4,821,875 4,821,875 -
Total financial liabilities 138,834,422 3,616,487 - 50,616,948 104,880,288 297,948,145 - Total interest rate sensitivity gap (135,277,245) ( 680,567) 201,041,961 (37,535,592) (23,274,092) 4,274,465 -
Cumulative gap (135,277,245) (135,957,812) 65,084,149 27,548,557 4,274,465 - -
BANK OF JAMAICA Notes to the Financial Statements (Continued) Year ended December 31, 2012
33. Financial risk management (continued)
(d) Market risk (continued)
(ii) Interest rate risk (continued): 2011 Weighted Within Three to Over Payable Non-rate average 3 months 12 months 12 months after notice sensitive Total interest J$'000 J$'000 J$'000 J$'000 J$'000 J$'000 % AssetsNotes and coins - - - - 147,331 147,331 - Cash and cash equivalents - - - - 36,142,913 36,142,913 - Interest in funds managed by agents - - - 12,098,615 - 12,098,615 1.54 Foreign currency denominated investments 117,923,363 - 49,122,976 - - 167,046,339 0.88 International Monetary Fund - Holding of Special Drawing Rights - - - - 28,536,152 28,536,152 - Local currency denominated investments - 91 92,820,758 - - 92,820,849 8.38 International Monetary Fund – Quota Subscription - - - - 4,315,897 4,315,897 - Due from Government and Government Agencies - - - - 18,854,846 18,854,846 - Bilateral accounts - - - - 23,744 23,744 - Other assets - - - - 6,665,704 6,665,704 -
Total financial assets 117,923,363 91 141,943,734 12,098,615 94,686,587 366,652,390 - Liabilities Notes and coins in circulation - - - - 62,675,207 62,675,207 - Deposits and other demand liabilities: Jamaica dollar equivalent of foreign currency deposits 29,884,487 - - 14,674,627 - 44,559,114 0.01 Jamaica dollar deposits 100,236,634 - - 30,484,145 - 130,720,779 0.25 Open market liabilities 78,137,201 7,387,554 - - - 85,524,755 5.36 International Monetary Fund –
Allocation of Special Drawing Rights - - - - 36,280,382 36,280,382 -
Foreign liabilities - - - - 19 19 - Other liabilities - - - - 1,013,104 1,013,104 -
Total financial liabilities 208,258,322 7,387,554 - 45,158,772 99,968,712 360,773,360 Total interest rate sensitivity gap ( 90,334,959) ( 7,387,463) 141,943,734 (33,060,157) (5,282,125) 5,879,030
Cumulative gap ( 90,334,959) (97,722,422) 44,221,312 11,161,155 5,879,030 -
Sensitivity analysis An increase of 300 (2011: 100bps) and a decrease of 100 (2011:100bps) basis points in interest rates for Jamaica dollar financial instruments and a change of 20 (2011: 20) basis points for United States dollar financial instruments would have increased or decreased profit and reserve by the amounts shown below. The analysis assumes that all other variables, in particular, foreign currency rates, remain constant. The analysis has been performed on the same basis as for 2011.

- xlv -
Annual Report 2012
Final Accounts for Year Ended 31 December 2012
BANK OF JAMAICA Notes to the Financial Statements (Continued) Year ended December 31, 2012
33. Financial risk management (continued)
(d) Market risk (continued)
(ii) Interest rate risk (continued):
Sensitivity analysis
Increase Decrease
Effect on Effect on Effect on Effect profit/loss reserves profit/loss on reserves
J$'000 J$'000 J$'000 J$'000 December 31, 2012
Fixed rate financial instruments - (6,566,569) - 6,605,046 Variable rate financial instruments 2,214,730 ( 362,250) (738,243) 32,057
2,214,730 (6,928,819) (738,243) 6,637,103
December 31, 2011 Fixed rate financial instruments - (5,114,797) - 7,712,088 Variable rate financial instruments 735,175 99,464 (735,175) 97,750
735,175 (5,015,333) 735,175 7,809,838
(e) Capital management
The Bank’s capital consists of ordinary share capital, general reserve fund, stabilisation reserve fund, securities revaluation reserve, property revaluation reserve and pension equalisation reserve. The share capital of the Bank may be increased by resolution of the Board of Directors. This resolution has to be approved by the House of Representatives. The Bank’s net profit is transferred to the general reserve fund. Whenever the credit in the reserve fund exceeds five times the authorised share capital such excess profit is paid to the Consolidated Fund. The Bank has been complying with this requirement. There were no changes in the Bank’s approach to capital management during the year.
34. Subsequent event
In February 2013 the Bank voluntarily participated in the National Debt Exchange Offer (the Offer) in respect of certain domestic debt instruments issued by the Government of Jamaica. The Offer involved the exchange of domestic debt instruments (Old Notes) for new debt instruments (New Notes) having lower interest rates and longer maturities, including the introduction of new Fixed Rate Accreting Notes (FRANs) which were designed primarily for state-owned entities. The exchange was effected on 21 February 2013 when, the New Notes were issued and accrued interest on the Old Notes paid to note holders net of applicable withholding tax.

- xlvi -Final Accounts for Year Ended 31 December 2012
Bank of Jamaica
BANK OF JAMAICA Notes to the Financial Statements (Continued) Year ended December 31, 2012
34. Subsequent event (continued)
The Bank’s acceptance of the Offer will impact on the amount and timing of future cash flows from investment in Government of Jamaica securities. The Bank’s holding of Government of Jamaica securities as at December 31, 2012 subject to the offer was $92,159.82 million which includes fair value gains of $3,331.70 million which are reflected in Securities Revaluation Reserve (note 22). The Bank’s participation in the offer involved the exchange of the portfolio of Old Notes for New Fixed Rate Accreting Notes (FRANs). The Notes were issued with J$80 of initial principal value for every J$100 of principal value of Old Notes held and will mature in 2028. Interest is payable at a fixed rate of 10% p.a. on the accreted principal value as shown below:
Accretion Rate Nominal Value % for Interest Computation
22 February 2013 80 15 August 2015 to 15 August 2020 1% p.a. 81-85 15 August 2020 to 15 August 2026 2% p.a. 86-97 15 August 2026 to 15 August 2027 3% p.a. 100
The impact of the Bank’s participation in the NDX is expected to be as follows:
(a) The Bank’s portfolio of securities earned a weighted average coupon rate of 9.4% in
2012. The New Notes (FRANs) will initially earn interest at an effective rate of 8% per annum.
(b) All New Notes will mature in 2028 but may be redeemed by the Government at any time after August 15, 2020.
(c) There is expected to be a difference between the carrying value of the Old Notes and the
fair value of the New Notes (FRANs) at acquisition which is estimated at $23,081.43 million.
The profile of liquidity, credit and market risks of the Bank’s domestic investment portfolio presented in note 32 are based on the conditions existing at December 31, 2012. The profile will change with the Bank’s participation in the National Debt Exchange.

- xlvii -
Annual Report 2012
Appendicies
A APPENDIX
Inflation Outturn
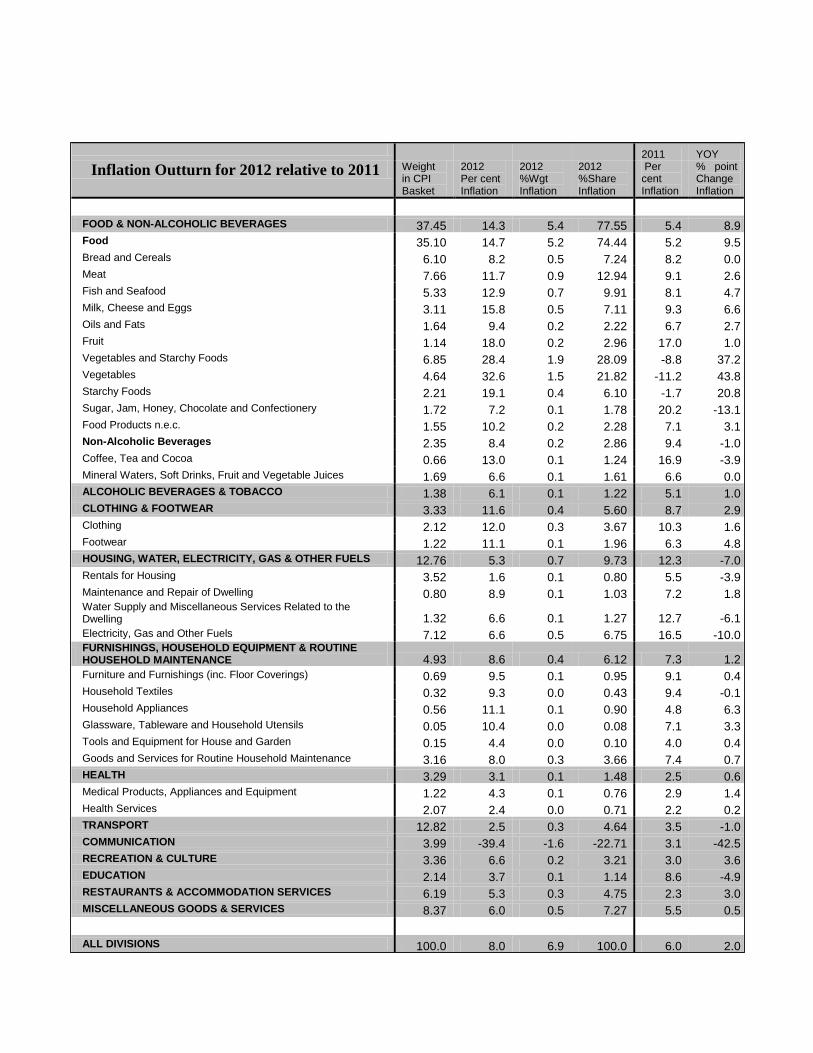
Weight in CPI Basket
2012 Per cent Inflation
2012 %Wgt Inflation
2012 %Share Inflation
2011 YOY Inflation Outturn for 2012 relative to 2011 Per
cent Inflation
% point Change Inflation
01 FOOD & NON-ALCOHOLIC BEVERAGES 37.45 14.3 5.4 77.55 5.4 8.9 01.1 Food 35.10 14.7 5.2 74.44 5.2 9.5 Bread and Cereals 6.10 8.2 0.5 7.24 8.2 0.0 Meat 7.66 11.7 0.9 12.94 9.1 2.6 Fish and Seafood 5.33 12.9 0.7 9.91 8.1 4.7 Milk, Cheese and Eggs 3.11 15.8 0.5 7.11 9.3 6.6 Oils and Fats 1.64 9.4 0.2 2.22 6.7 2.7 Fruit 1.14 18.0 0.2 2.96 17.0 1.0 Vegetables and Starchy Foods 6.85 28.4 1.9 28.09 -8.8 37.2 Vegetables 4.64 32.6 1.5 21.82 -11.2 43.8 Starchy Foods 2.21 19.1 0.4 6.10 -1.7 20.8 Sugar, Jam, Honey, Chocolate and Confectionery 1.72 7.2 0.1 1.78 20.2 -13.1 Food Products n.e.c. 1.55 10.2 0.2 2.28 7.1 3.1 01.2 Non-Alcoholic Beverages 2.35 8.4 0.2 2.86 9.4 -1.0 Coffee, Tea and Cocoa 0.66 13.0 0.1 1.24 16.9 -3.9 Mineral Waters, Soft Drinks, Fruit and Vegetable Juices 1.69 6.6 0.1 1.61 6.6 0.0 02 ALCOHOLIC BEVERAGES & TOBACCO 1.38 6.1 0.1 1.22 5.1 1.0 03 CLOTHING & FOOTWEAR 3.33 11.6 0.4 5.60 8.7 2.9 03.1 Clothing 2.12 12.0 0.3 3.67 10.3 1.6 03.2 Footwear 1.22 11.1 0.1 1.96 6.3 4.8 04 HOUSING, WATER, ELECTRICITY, GAS & OTHER FUELS 12.76 5.3 0.7 9.73 12.3 -7.0 04.1 Rentals for Housing 3.52 1.6 0.1 0.80 5.5 -3.9 04.3 Maintenance and Repair of Dwelling 0.80 8.9 0.1 1.03 7.2 1.8 04.4 Water Supply and Miscellaneous Services Related to the
Dwelling 1.32 6.6 0.1 1.27 12.7 -6.1 04.5 Electricity, Gas and Other Fuels 7.12 6.6 0.5 6.75 16.5 -10.0 05 FURNISHINGS, HOUSEHOLD EQUIPMENT & ROUTINE
HOUSEHOLD MAINTENANCE 4.93 8.6 0.4 6.12 7.3 1.2 05.1 Furniture and Furnishings (inc. Floor Coverings) 0.69 9.5 0.1 0.95 9.1 0.4 05.2 Household Textiles 0.32 9.3 0.0 0.43 9.4 -0.1 05.3 Household Appliances 0.56 11.1 0.1 0.90 4.8 6.3 05.4 Glassware, Tableware and Household Utensils 0.05 10.4 0.0 0.08 7.1 3.3 05.5 Tools and Equipment for House and Garden 0.15 4.4 0.0 0.10 4.0 0.4 05.6 Goods and Services for Routine Household Maintenance 3.16 8.0 0.3 3.66 7.4 0.7 06 HEALTH 3.29 3.1 0.1 1.48 2.5 0.6 06.1 Medical Products, Appliances and Equipment 1.22 4.3 0.1 0.76 2.9 1.4 06.2 Health Services 2.07 2.4 0.0 0.71 2.2 0.2 07 TRANSPORT 12.82 2.5 0.3 4.64 3.5 -1.0 08 COMMUNICATION 3.99 -39.4 -1.6 -22.71 3.1 -42.5 09 RECREATION & CULTURE 3.36 6.6 0.2 3.21 3.0 3.6 10 EDUCATION 2.14 3.7 0.1 1.14 8.6 -4.9 11 RESTAURANTS & ACCOMMODATION SERVICES 6.19 5.3 0.3 4.75 2.3 3.0 12 MISCELLANEOUS GOODS & SERVICES 8.37 6.0 0.5 7.27 5.5 0.5
ALL DIVISIONS 100.0 8.0 6.9 100.0 6.0 2.0


- li -
Annual Report 2012
Appendicies
B APPENDIX
Annual Prudential Indicators of Commercial Banks

TABLE 6.6
Dec-10 Dec-11 Dec-12 Dec-10 Dec-11 Dec-12 Dec-10 Dec-11 Dec-12 Dec-10 Dec-11 Dec-12
J$MN1Total Assets (incl. contingent accounts) 589,909 613,637 659,786 24,393 21,449 21,315 168,338 185,472 201,368 782,640 820,558 882,4692Total Assets (excl. contingent accounts) 579,659 600,935 647,022 24,210 21,290 21,301 168,338 185,472 201,368 772,207 807,697 869,691Cash & Bank Balances 107,335 125,834 132,707 1,437 1,137 1,477 21,069 18,212 19,597 129,841 145,183 153,781Investments [incl. Securities Purch.] (net of prov.) 190,448 177,442 171,846 14,491 12,609 13,470 53,797 66,555 72,027 258,736 256,606 257,343Total Loans (gross) 251,341 266,043 307,478 7,186 6,885 5,625 87,305 89,340 95,879 345,832 362,268 408,982Total Loans (net of IFRS prov.) a 245,072 258,573 298,056 6,822 6,549 5,334 85,912 87,912 94,438 337,806 353,034 397,828Total Deposits 379,094 400,122 444,795 8,361 6,556 7,852 115,891 121,783 131,438 503,346 528,461 584,085Borrowings (incl. repos) 92,034 72,383 80,336 10,727 9,555 8,364 22,562 24,519 26,648 125,323 106,457 115,348Non-Performing Loans [NPL] (3 mths & >) 13,475 23,287 20,963 2,866 3,171 974 6,024 5,744 6,002 22,365 32,202 27,939Provision for Loan Losses 11,369 18,302 20,911 1,256 2,332 1,040 2,997 3,597 3,975 15,622 24,231 25,9263 Capital Base 60,455 63,835 65,108 3,608 2,667 3,823 20,625 22,789 23,276 84,688 89,291 92,207Contingent Accts [Accept., LC's & Guarantees] 10,250 12,702 12,764 183 159 14 0 0 0 10,433 12,861 12,778Funds Under Management 297 308 320 0 0 0 0 0 0 297 308 320Repos on behalf of or for on-trading to clients n/a n/a n/a n/a n/a n/a n/a n/a n/a n/a n/a n/a
%Rate of Asset 1 Growth 1.2% 4.0% 7.5% -27.1% -12.1% -0.6% 5.6% 10.2% 8.6% 0.9% 4.8% 7.5%Rate of Deposit Growth 6.2% 5.5% 11.2% -35.8% -21.6% 19.8% 5.3% 5.1% 7.9% 4.8% 5.0% 10.5%Rate of Loans Growth (gross) -2.0% 5.8% 15.6% -25.8% -4.2% -18.3% 3.2% 2.3% 7.3% -1.4% 4.8% 12.9%Rate of Capital Base Growth 2.8% 5.6% 2.0% -22.4% -26.1% 43.3% 20.5% 10.5% 2.1% 5.1% 5.4% 3.3%Rate of NPL (3 Mths &>) Growth 24.8% 72.8% -10.0% 254.7% 10.6% -69.3% 24.7% -4.6% 4.5% 36.1% 44.0% -13.2%
Investments :Total Assets 1 32.3% 28.9% 26.0% 59.4% 58.8% 63.2% 32.0% 35.9% 35.8% 33.1% 31.3% 29.2%Loans (net of prov.):Total Assets 1 41.5% 42.1% 45.2% 28.0% 30.5% 25.0% 51.0% 47.4% 46.9% 43.2% 43.0% 45.1%Fixed Assets:Total Assets 1 1.9% 2.1% 2.2% 0.7% 0.5% 0.4% 1.6% 1.6% 1.7% 1.8% 1.9% 2.1%Loans (gross) : Deposits 66.3% 66.5% 69.1% 85.9% 105.0% 71.6% 75.3% 73.4% 72.9% 68.7% 68.6% 70.0%
LiquidityAverage Domestic Currency Cash Reserve: Average Prescribed Liabilities 4 12.0% 12.0% 12.0% 12.0% 12.0% 12.0% 1.0% 1.0% 1.0% 9.1% 9.1% 9.2%Average Domestic Currency Liquid Assets: Average Domestic Prescribed Liabilities 4 43.7% 37.7% 31.4% 28.1% 33.8% 32.8% 16.2% 10.7% 13.1% 36.2% 30.5% 26.7%
Asset QualityProv. For Loan Losses:Total Loans (gross) 4.5% 6.9% 6.8% 17.5% 33.9% 18.5% 3.4% 4.0% 4.1% 4.5% 6.7% 6.3%Prov. For Loan Losses: NPL (3 Mths &>) 84.4% 78.6% 99.8% 43.8% 73.5% 106.8% 49.8% 62.6% 66.2% 69.9% 75.2% 92.8%NPL (3 Mths &>):Total Loans (gross) 5.4% 8.8% 6.8% 39.9% 46.1% 17.3% 6.9% 6.4% 6.3% 6.5% 8.9% 6.8%NPL (3 Mths &>): (Total Assets 1
+ Provision for loan losses) 2.3% 3.7% 3.1% 11.5% 14.5% 4.5% 3.5% 3.1% 3.0% 2.8% 3.9% 3.1%
Capital AdequacyDeposits + Borrowings: Capital (:1) 7.8 7.4 8.1 5.4 6.1 4.3 6.8 6.5 6.8 7.5 7.1 7.6Capital Base:Total Assets 1 10.2% 10.4% 9.9% 14.8% 12.4% 17.9% 12.3% 12.3% 11.6% 10.8% 10.9% 10.4%5 Capital Adequacy Ratio [CAR] 17.2% 15.0% 12.8% 16.9% 12.3% 17.8% 22.1% 20.6% 18.2% 18.2% 16.1% 14.1%NPL (3 mths &>):Capital Base+Prov for loan losses 18.8% 28.4% 24.4% 58.9% 63.4% 20.0% 25.5% 21.8% 22.0% 22.3% 28.4% 23.7%
Profitability6 Pre - tax Profit Margin (for the Calendar Quarter) 17.6% 52.3% 12.0% 18.7% 0.7% -13.5% 28.1% 25.2% 25.7% 19.6% 48.4% 14.1%Pre - tax Profit Margin (for the Calendar Year) 22.5% 32.6% 20.8% 13.5% 5.1% -2.9% 16.4% 24.5% 22.0% 21.1% 30.8% 20.5%Return on Average Assets (for the Calendar Quarter) 0.5% 2.5% 0.4% 0.5% 0.0% -0.3% 0.7% 0.5% 0.6% 0.6% 2.0% 0.4%Return on Average Assets (for the Calendar Year) 2.8% 4.5% 2.5% 1.5% 0.4% -0.2% 1.7% 2.3% 1.9% 2.5% 3.9% 2.3%7 Income Assets/Expense Liabilities 104.3% 105.1% 102.1% 99.2% 102.1% 114.5% 109.5% 111.9% 110.5% 105.3% 106.6% 104.3%
FIA LICENSEES
31-Dec-12
ANNUAL PRUDENTIAL INDICATORS OF COMMERCIAL BANKS, LICENSEES UNDER THE FINANCIAL INSTITUTIONS ACT (FIA) AND BUILDING SOCIETIES
COMMERCIAL BANKSSystem Total (aggregation of all 3
sectors)BUILDING SOCIETIES

31-Dec-12
ANNUAL PRUDENTIAL INDICATORS OF COMMERCIAL BANKS, LICENSEES UNDER THE FINANCIAL INSTITUTIONS ACT (FIA) AND BUILDING SOCIETIES
n.a. data not availablen/a not applicable
- Based on unaudited data submitted to BOJ by supervised institutions up to 05 February 2013. Prior years indicators may have revisions arising from amendments.
a Effective January 2004, the Bank of Jamaica revised its reporting requirements in line with International Financial Reporting Standards (IFRS) and in this regard the following change was effected: The composition of "Provision for Loan Losses" has been segregated into two (2) distinct components being: i) provision for losses computed in accordance with IFRS; and ii) any incremental provisioning necessary under prudential loss provisioning requirements (treated as an appropriation from net profits). Consequently, "Total Loans (net of prov.)" represents gross loans net of IFRS loan loss provisions per (i) above
1 Total Assets and Liabilities reflected net of IFRS Provision for Losses and include Contingent Accounts (Customer Liabilities for Acceptances, Guarantees and Letters of Credit).In keeping with IFRS, Total Assets and Liabilities were redefined to include Contingent Accounts.
2 Total Assets net of IFRS Provision for Losses and Contingent Accounts (Customer Liabilities for Acceptances, Guarantees and Letters of Credit). 3 Capital Base - Banks & FIA Licensees: (Ordinary Shares+ Qualifying Preference Shares+ Reserve Fund + Retained Earnings Reserve Fund + Share Premium) less impairment by net losses of individual institution. - Building Societies: (Permanent Capital Fund + Deferred Shares + Capital Shares + Reserve Fund + Retained Earnings Reserve Fund ) less impairment by net losses of individual society.4 Prescribed Liabilities include:
5 Capital Adequacy Ratio (CAR): Qualifying Capital (Tier 1 + Tier 2 capital items less prescribed deductions) in relation to Risk Weighted Assets and Foreign Exchange Exposure.6 Pre-tax Profits includes extraordinary income/expenditure and adjustments for prior period. Return on Average Assets is computed using pre-tax profits as well as assets before provision for losses (in accordance with IFRS) and including contingent accounts (Acceptances, Guarantees and Letters of Credit).7 Income Assets comprise FC Cash Reserves, Placements, Investments, Repo Assets and Loans less Non-Performing Loans (3 months & over). Expense Liabilities comprise Deposits and Borrowings including Repo Liabilities (from BOJ, Banks, OFI etc).
COMMERCIAL BANKSDec-10 Dec-11 Dec-12 Dec-10 Dec-11 Dec-12 Dec-10 Dec-11 Dec-12
Required Cash Reserve ratio 12.0% 12.0% 12.0% 12.0% 12.0% 12.0% 1% / 12% 1% /12% 1% / 12% Required Liquid Assets ratio (incl Cash Reserve) 26.0% 26.0% 26.0% 26.0% 26.0% 26.0% 5% / 26% 5% /26% 5% / 26%
** The requirements are differentially applied to societies not meeting the prescribed threshold of residential mortgage lending in relation to savings funds. Societies that meet the prescribed 'qualifying assets' threshold attract the lower reserve requirements indicated above. Societies which do not, are requested to meet the requirements which apply to commercial banks and FIA Licensees.
Financial Institutions Supervisory DivisionBank of Jamaica
(i) deposit liabilities, (ii) reservable borrowings and interest accrued and payable on (i) & (ii).
FIA LICENSEES BUILDING SOCIETIES**

1
BANK OF JAMAICA Nethersole Place
P.O. Box 621 Kingston, Jamaica
Telephone: 876 922 0750 Internet: www.boj.org.jm